



Form 8-K HEALTHSOUTH CORP For: Feb 23
 Tweet
Tweet Share
Share E-mail
UNITED STATES
SECURITIES AND EXCHANGE COMMISSION
WASHINGTON, D.C. 20549
FORM 8-K
CURRENT REPORT
Pursuant To Section 13 or 15(d) of the Securities Exchange Act of 1934
Date of Report (date of earliest event reported): February 23, 2016
HealthSouth Corporation
(Exact name of Registrant as specified in its Charter)
Delaware
(State or Other Jurisdiction of Incorporation)
001-10315 | 63-0860407 |
(Commission File Number) | (IRS Employer Identification No.) |
3660 Grandview Parkway, Suite 200, Birmingham, Alabama 35243
(Address of Principal Executive Offices, Including Zip Code)
(205) 967-7116
(Registrant’s Telephone Number, Including Area Code)
Check the appropriate box below if the Form 8-K filing is intended to simultaneously satisfy the filing obligation of the registrant under any of the following provisions:
¨ | Written communication pursuant to Rule 425 under the Securities Act (17 CFR 230.425) |
¨ | Soliciting material pursuant to Rule 14a-12 under the Exchange Act (17 CFR 240.14a-12) |
¨ | Pre-commencement communications pursuant to Rule 14d-2(b) under the Exchange Act (17 CFR 240.14d-2(b)) |
¨ | Pre-commencement communications pursuant to Rule 13e-4(c) under the Exchange Act (17 CFR 240.13e-4(c)) |
ITEM 2.02. Results of Operations and Financial Condition.
The information contained herein is being furnished pursuant to Item 2.02 of Form 8‑K, “Results of Operations and Financial Condition,” and Item 7.01 of Form 8-K, “Regulation FD Disclosure.” This information shall not be deemed “filed” for purposes of Section 18 of the Securities Exchange Act of 1934, as amended (the “Exchange Act”), or incorporated by reference in any filing under the Securities Act of 1933, as amended, (the “Securities Act”) or the Exchange Act, except as shall be expressly set forth by specific reference in such a filing.
On February 23, 2016, HealthSouth Corporation (the “Company”) issued a press release reporting the financial results of the Company for the three months and year ended December 31, 2015. A copy of the press release is attached to this report as Exhibit 99.1 and incorporated herein by reference.
ITEM 7.01. Regulation FD Disclosure.
See Item 2.02, “Results of Operations and Financial Condition,” above.
In addition, a copy of the supplemental slides which will be discussed during the Company’s earnings call at 9:00 a.m. Eastern Time on Wednesday, February 24, 2016 is attached to this report as Exhibit 99.2 and incorporated herein by reference. This information shall not be deemed “filed” for purposes of Section 18 of the Exchange Act, or incorporated by reference in any filing under the Securities Act or the Exchange Act, except as shall be expressly set forth by specific reference in such a filing.
Note Regarding Presentation of Non-GAAP Financial Measures
The financial data contained in the press release and supplemental slides include non-GAAP financial measures, including the Company’s adjusted earnings per share, leverage ratio, Adjusted EBITDA, and adjusted free cash flow.
The Company is providing adjusted earnings per share from continuing operations attributable to HealthSouth (“adjusted earnings per share”). The Company believes the presentation of adjusted earnings per share provides useful additional information to investors because it provides better comparability of ongoing operating performance to prior periods given that it excludes the impact of government, class action, and related settlements, professional fees—accounting, tax, and legal, gains or losses related to hedging instruments, loss on early extinguishment of debt, adjustments to its income tax provision (such as valuation allowance adjustments and settlements of income tax claims), items related to corporate and facility restructurings, and certain other items. It is reasonable to expect that one or more of these excluded items will occur in future periods, but the amounts recognized can vary significantly from period to period and may not directly relate to the Company’s ongoing operations. Accordingly, they can complicate comparisons of the Company’s results of operations across periods and comparisons of the Company’s results to those of other healthcare companies. Adjusted earnings per share should not be considered as a measure of financial performance under generally accepted accounting principles in the United States as the items excluded from it are significant components in understanding and assessing financial performance. Because adjusted earnings per share is not a measurement determined in accordance with generally accepted accounting principles in the United States of America (“GAAP”) and is thus susceptible to varying calculations, it may not be comparable as presented to other similarly titled measures of other companies. The Company reconciles adjusted earnings per share to earnings per share in the press release attached as Exhibit 99.1 and the supplemental slides attached as Exhibit 99.2.
The leverage ratio referenced therein is defined as the ratio of consolidated total debt to Adjusted EBITDA for the trailing four quarters. The Company believes its leverage ratio and Adjusted EBITDA are measures of its ability to service its debt and its ability to make capital expenditures. Additionally, the leverage ratio is a standard measurement used by investors to gauge the creditworthiness of an institution. The Company’s credit agreement also includes a maximum leverage ratio financial covenant which allows the Company to deduct up to $75 million of cash on hand from consolidated total debt. The Company reconciles Adjusted EBITDA to net income in the press release attached as Exhibit 99.1 and the supplemental slides attached as Exhibit 99.2 and to net cash provided by operating activities in the supplemental slides attached as Exhibit 99.2 and below.
The Company uses Adjusted EBITDA on a consolidated basis as a liquidity measure. The Company believes this financial measure on a consolidated basis is important in analyzing its liquidity because it is the key component of certain material covenants contained within the Company’s credit agreement, which is discussed in more detail in Item 7, Management’s Discussion and Analysis of Financial Condition and Results of Operations, “Liquidity and Capital Resources,” and Note 8, Long-term Debt, to the consolidated financial statements included in its Annual Report on Form 10‑K for the year ended December 31, 2015 (the “2015 Form 10‑K”), when filed. These covenants are material terms of the credit agreement. Noncompliance with these financial covenants under the credit agreement—its interest coverage ratio and its leverage ratio—could result in the Company’s lenders requiring the Company to immediately repay all amounts borrowed. If the Company
anticipated a potential covenant violation, it would seek relief from its lenders, which would have some cost to the Company, and such relief might not be on terms favorable to those in the Company’s existing credit agreement. In addition, if the Company cannot satisfy these financial covenants, it would be prohibited under the credit agreement from engaging in certain activities, such as incurring additional indebtedness, paying common stock dividends, making certain payments, and acquiring and disposing of assets. Consequently, Adjusted EBITDA is critical to the Company’s assessment of its liquidity.
In general terms, the credit agreement definition of Adjusted EBITDA, referred to as “Adjusted Consolidated EBITDA” there, allows the Company to add back to consolidated net income interest expense, income taxes, and depreciation and amortization and then add back to consolidated net income (1) all unusual or nonrecurring items reducing consolidated net income (of which only up to $10 million in a year may be cash expenditures), (2) any losses from discontinued operations and closed locations, (3) costs and expenses, including legal fees and expert witness fees, incurred with respect to litigation associated with stockholder derivative litigation, and (4) share-based compensation expense. The Company also subtracts from consolidated net income all unusual or nonrecurring items to the extent they increase consolidated net income.
Under the credit agreement, the Adjusted EBITDA calculation does not include net income attributable to noncontrolling interests and includes (1) gain or loss on disposal of assets, (2) professional fees unrelated to the stockholder derivative litigation, (3) unusual or nonrecurring cash expenditures in excess of $10 million, and (4) pro forma adjustments resulting from debt transactions and development activities. These items may not be indicative of the Company’s ongoing performance, so the Adjusted EBITDA calculation presented here includes adjustments for them.
Adjusted EBITDA is not a measure of financial performance under GAAP, and the items excluded from Adjusted EBITDA are significant components in understanding and assessing financial performance. Therefore, Adjusted EBITDA should not be considered a substitute for net income or cash flows from operating, investing, or financing activities. Because Adjusted EBITDA is not a measurement determined in accordance with GAAP and is thus susceptible to varying calculations, Adjusted EBITDA, as presented, may not be comparable to other similarly titled measures of other companies. Revenues and expenses are measured in accordance with the policies and procedures described in Note 1, Summary of Significant Accounting Policies, to the consolidated financial statements accompanying the 2015 Form 10‑K.
The Company also uses adjusted free cash flow as an analytical indicator to assess its performance. Management believes the presentation of adjusted free cash flow provides investors an efficient means by which they can evaluate the Company’s capacity to reduce debt, pursue development activities, and return capital to its common stockholders. The calculation of adjusted free cash flow and a reconciliation of net cash provided by operating activities to adjusted free cash flow is included in the press release attached as Exhibit 99.1 and the supplemental slides attached as Exhibit 99.2. This measure is not a defined measure of financial performance under GAAP and should not be considered as an alternative to net cash provided by operating activities. The Company’s definition of adjusted free cash flow is limited and does not represent residual cash flows available for discretionary spending. Because this measure is not determined in accordance with GAAP and is susceptible to varying calculations, it may not be comparable to other similarly titled measures presented by other companies. See the consolidated statements of cash flows included in the 2015 Form 10-K, when filed, and in the press release attached as Exhibit 99.1 for the GAAP measures of cash flows from operating, investing, and financing activities.
Reconciliation of Net Cash Provided by Operating Activities to Adjusted EBITDA
For the Three Months Ended | For the Year Ended | ||||||||||||||
December 31, | December 31, | ||||||||||||||
2015 | 2014 | 2015 | 2014 | ||||||||||||
(In Millions) | |||||||||||||||
Net cash provided by operating activities | $ | 116.6 | $ | 70.2 | $ | 484.8 | $ | 444.9 | |||||||
Provision for doubtful accounts | (14.0 | ) | (6.6 | ) | (47.2 | ) | (31.6 | ) | |||||||
Professional fees—accounting, tax, and legal | 0.3 | 1.7 | 3.0 | 9.3 | |||||||||||
Interest expense and amortization of debt discounts and fees | 44.6 | 25.7 | 142.9 | 109.2 | |||||||||||
Equity in net income of nonconsolidated affiliates | 2.4 | 1.9 | 8.7 | 10.7 | |||||||||||
Net income attributable to noncontrolling interests in continuing operations | (18.8 | ) | (15.4 | ) | (69.7 | ) | (59.7 | ) | |||||||
Amortization of debt-related items | (3.4 | ) | (3.2 | ) | (14.3 | ) | (12.7 | ) | |||||||
Distributions from nonconsolidated affiliates | (3.2 | ) | (3.2 | ) | (7.7 | ) | (12.6 | ) | |||||||
Current portion of income tax expense | 4.4 | 3.5 | 14.8 | 13.3 | |||||||||||
Change in assets and liabilities | 53.6 | 46.4 | 147.1 | 90.1 | |||||||||||
Net premium paid on bond issuance/redemption | 1.9 | 10.6 | 3.9 | 4.3 | |||||||||||
Cash (provided by) used in operating activities of discontinued operations | (0.1 | ) | 0.2 | 0.7 | 1.2 | ||||||||||
Reliant/CareSouth transaction costs | 6.7 | — | 12.3 | — | |||||||||||
Encompass transaction costs | — | 9.3 | — | 9.3 | |||||||||||
Other | 0.5 | (0.3 | ) | 3.2 | 1.9 | ||||||||||
Adjusted EBITDA | $ | 191.5 | $ | 140.8 | $ | 682.5 | $ | 577.6 | |||||||
Reconciliation of Segment Adjusted EBITDA to Income from Continuing Operations Before Income Tax Expense
For the Three Months Ended | For the Year Ended | ||||||||||||||
December 31, | December 31, | ||||||||||||||
2015 | 2014 | 2015 | 2014 | ||||||||||||
(In Millions) | |||||||||||||||
Total segment Adjusted EBITDA | $ | 216.4 | $ | 163.3 | $ | 774.1 | $ | 669.2 | |||||||
General and administrative expenses | (36.0 | ) | (36.4 | ) | (133.3 | ) | (124.8 | ) | |||||||
Depreciation and amortization | (41.4 | ) | (27.5 | ) | (139.7 | ) | (107.7 | ) | |||||||
Loss on disposal or impairment of assets | (2.4 | ) | (1.0 | ) | (2.6 | ) | (6.7 | ) | |||||||
Government, class action, and related settlements | 0.5 | 0.9 | (7.5 | ) | 1.7 | ||||||||||
Professional fees - accounting, tax, and legal | (0.3 | ) | (1.7 | ) | (3.0 | ) | (9.3 | ) | |||||||
Loss on early extinguishment of debt | (2.4 | ) | (13.2 | ) | (22.4 | ) | (13.2 | ) | |||||||
Interest expense and amortization of debt discounts and fees | (44.6 | ) | (25.7 | ) | (142.9 | ) | (109.2 | ) | |||||||
Gain on consolidation of former equity method hospital | — | — | — | 27.2 | |||||||||||
Net income attributable to noncontrolling interests | 18.8 | 15.4 | 69.7 | 59.7 | |||||||||||
Gain related to SCA equity interests | — | — | 3.2 | — | |||||||||||
Income from continuing operations before income tax expense | $ | 108.6 | $ | 74.1 | $ | 395.6 | $ | 386.9 | |||||||
Forward-Looking Statements
The information contained in the press release and supplemental slides includes certain estimates, projections, and other forward-looking information that involve known and unknown risks and relate to, among other things, future events, the Company’s business strategy, financial plans, dividend strategies or payments, effective income tax rates, plans to repurchase its debt or equity securities, future financial performance, projected business results or model, ability to return value to its shareholders, projected capital expenditures, leverage ratio, acquisition opportunities, and the impact of future legislation or regulation. In some cases, you can identify forward-looking statements by terminology such as “may,” “will,” “should,” “expects,” “plans,” “anticipates,” “believes,” “estimates,” “predicts,” “targets,” “potential,” or “continue” or the negative of these terms or other comparable terminology. These estimates, projections, and other forward-looking information are based on assumptions the Company believes, as of the date hereof, are reasonable. Inevitably, there will be differences between such estimates and actual results, and those differences may be material.
There can be no assurance that any estimates, projections, or forward-looking information will be realized.
All such estimates, projections, and forward-looking information speak only as of the date hereof. The Company undertakes no duty to publicly update or revise the information contained herein.
You are cautioned not to place undue reliance on the estimates, projections, and other forward-looking information in the press release and supplemental slides as they are based on current expectations and general assumptions and are subject to various risks, uncertainties, and other factors, including those set forth in the press release and 2015 Form 10-K, when filed, and in other documents the Company previously filed with the SEC, many of which are beyond the Company’s control. These factors may cause actual results to differ materially from the views, beliefs, and estimates expressed herein.
ITEM 9.01. Financial Statements and Exhibits.
(d) Exhibits.
Exhibit Number | Description | |
99.1 | Press release of HealthSouth Corporation, dated February 23, 2016. | |
99.2 | Supplemental slides provided in connection with the fourth quarter 2015 earnings call of HealthSouth Corporation. | |
SIGNATURES
Pursuant to the requirements of the Securities Exchange Act of 1934, the Registrant has duly caused this Report to be signed on its behalf by the undersigned hereunto duly authorized.
HEALTHSOUTH CORPORATION
By: | /S/ DOUGLAS E. COLTHARP | |
Name: | Douglas E. Coltharp | |
Title: | Executive Vice President and Chief Financial Officer | |
Dated: February 23, 2016
Exhibit 99.1

Media Contact | February 23, 2016 |
Casey Lassiter, 205-410-2777 | For Immediate Release |
Investor Relations Contact | |
Crissy Carlisle, 205-970-5860 | |
HealthSouth Reports Results for Fourth Quarter and Full Year 2015
Strong Revenue and Volume Growth in Both Segments
Strong Free Cash Flow Generation
BIRMINGHAM, Ala. - HealthSouth Corporation (NYSE: HLS), one of the nation's largest providers of post-acute healthcare services, offering both facility-based and home-based post-acute services, today reported its results of operations for the fourth quarter and year ended December 31, 2015.
“The fourth quarter was a solid conclusion to 2015 that established a firm foundation for continued growth in 2016 and beyond,” said Jay Grinney, HealthSouth President and Chief Executive Officer. “We were very pleased with the strong organic growth in both segments and the contributions from the rehabilitation hospitals acquired from Reliant Hospital Partners and the home health and hospice agencies acquired from CareSouth Health System in the fourth quarter. Most importantly, we generated $83 million of adjusted free cash flow in the quarter, which brought full-year adjusted free cash flow to $389 million, a 25% increase over full-year 2014.”
Fourth Quarter Results
Consolidated Results
• | The Company's consolidated net operating revenues increased by $265.9 million, or 43.3%, in the fourth quarter of 2015 compared to the fourth quarter of 2014. This increase primarily resulted from strong volume growth in both of the Company's operating segments and included the effect of the Company's acquisitions of Encompass Home Health and Hospice (“Encompass”) on December 31, 2014, Reliant Hospital Partners, LLC and affiliated entities (“Reliant”) on October 1, 2015, and CareSouth Health System, Inc. (“CareSouth”) on November 2, 2015. |
• | Income from continuing operations attributable to HealthSouth per diluted share (see attached supplemental information) for the fourth quarter of 2015 was $0.48 per diluted share compared to $0.41 per diluted share for the same quarter of 2014. |
• | Cash flows provided by operating activities were $116.6 million for the fourth quarter of 2015 compared to $70.2 million for the fourth quarter of 2014. This increase primarily resulted from revenue growth. Cash flows provided by operating activities for the fourth quarter of 2015 were also impacted by higher cash interest expense due to the debt used to fund the acquisitions of Encompass, Reliant, and CareSouth. |
• | Adjusted EBITDA (see attached supplemental information) for the fourth quarter of 2015 was $191.5 million compared to $140.8 million for the fourth quarter of 2014, an increase of 36.0%. |
• | Adjusted free cash flow (see attached supplemental information) for the fourth quarter of 2015 was $83.0 million compared to $45.4 million for the fourth quarter of 2014, an increase of 82.8%, primarily due to the Company's growth in Adjusted EBITDA. Adjusted free cash flow in the fourth quarter of 2015 included increased cash interest expense related to acquisitions. |
1 | ||
Inpatient Rehabilitation Segment Results
• | Net operating revenues for the inpatient rehabilitation segment were $725.9 million for the fourth quarter of 2015 compared to $605.8 million for the fourth quarter of 2014, an increase of 19.8%. This increase was attributable to an 18.6% increase in patient discharges and a 1.1% increase in net patient revenue per discharge. Discharge growth included a 3.0% increase in same-store discharges. Discharge growth from new stores resulted from three de novo hospitals that opened in the fourth quarter of 2014 (Altamonte Springs, Florida; Newnan, Georgia; and Middletown, Delaware) and one de novo hospital that opened in December 2015 (Franklin, Tennessee), the Company's acquisitions of Reliant (October 2015), Quillen Rehabilitation Hospital in Johnson City, Tennessee (November 2014) and Cardinal Hill Rehabilitation Hospital in Lexington, Kentucky (May 2015), and the Company's joint venture with Memorial Health in Savannah, Georgia (April 2015). |
• | Adjusted EBITDA (see attached supplemental information) from the inpatient rehabilitation segment for the fourth quarter of 2015 was $189.9 million compared to $162.2 million for the fourth quarter of 2014, an increase of 17.1%. Adjusted EBITDA for the inpatient rehabilitation segment for the fourth quarter of 2015 was impacted by continued year-over-year increases in group medical and bad debt expenses. |
Home Health and Hospice Segment Results
The Company's home health and hospice segment reported $153.4 million of net operating revenues and $26.5 million of Adjusted EBITDA for the fourth quarter of 2015. The results of operations for the home health and hospice segment in 2014 included only HealthSouth's legacy hospital-based home health agencies. The increase in net operating revenues and Adjusted EBITDA (see attached supplemental information) for the Company's home health and hospice segment in 2015 resulted from its acquisition of Encompass on December 31, 2014, as well as the acquisition of CareSouth on November 2, 2015.
Within Encompass, revenue and volume growth were driven both by locations Encompass owned prior to 2014 and those Encompass acquired during 2014. In the fourth quarter of 2015, for those locations Encompass owned prior to 2014, admissions increased 18.6% and episodes increased 15.2%, all as compared to the fourth quarter of 2014. This growth included volumes resulting from Encompass' integration of HealthSouth's legacy home health agencies that were relocated or merged into existing Encompass locations (i.e., market consolidations).
Capital Structure Transactions
Repurchases of Common Stock
During the fourth quarter of 2015, the Company repurchased 1,360,974 shares of its common stock for approximately $47 million in the open market. As of December 31, 2015, the Company had a remaining repurchase authorization of approximately $160 million.
Redemption of Senior Notes
In September 2015, the Company's 7.75% Senior Notes due 2022 (the “2022 Notes”) became fully callable.
In November 2015, the Company redeemed $50 million of the outstanding principal amount of the 2022 Notes. Pursuant to the terms of these notes, this optional redemption was made at a price of 103.875%, which resulted in a total cash outlay of approximately $52 million. The redemption was funded using a draw under the Company's revolving credit facility. As a result of this redemption, the Company recorded a $2.4 million loss on early extinguishment of debt in the fourth quarter of 2015.
In February 2016, the Company gave notice of its intent to redeem an additional $50 million of the outstanding principal amount of the 2022 Notes. This optional redemption also will be made at a price of 103.875%. The Company plans to use cash on hand and capacity under its revolving credit facility to fund the redemption, which is expected to close in March 2016. As a result of this redemption, the Company expects to record an approximate $2 million loss on early extinguishment of debt in the first quarter of 2016.
The above redemptions are expected to result in cash interest savings of approximately $4 million in 2016. After the March 2016 redemption, the Company will have approximately $126 million of the 2022 Notes outstanding.
2 | ||
Full-Year Consolidated Results
• | The Company's consolidated net operating revenues increased by $757.0 million, or 31.5%, in 2015 compared to 2014. This increase primarily resulted from strong volume growth in both of the Company's operating segments and included the effect of the Company's acquisitions of Encompass, Reliant, and CareSouth. |
• | Income from continuing operations attributable to HealthSouth per diluted share (see attached supplemental information) for 2015 was $1.92 per diluted share compared to $2.24 per diluted share for 2014. |
• | Cash flows provided by operating activities were $484.8 million for 2015 compared to $444.9 million for 2014. This increase primarily resulted from revenue growth. Cash flows provided by operating activities in 2015 were also impacted by increased cash interest expense and higher working capital, as discussed below. |
• | Adjusted EBITDA (see attached supplemental information) for 2015 was $682.5 million compared to $577.6 million for 2014, an increase of 18.2%. |
• | Adjusted free cash flow (see attached supplemental information) for 2015 was $389.0 million compared to $311.3 million for 2014, an increase of 25.0%, primarily due to the Company's growth in Adjusted EBITDA. Adjusted free cash flow for 2015 also included higher cash interest expense due to acquisitions and higher working capital mainly attributable to growth in accounts receivable due to additional claims denials and continued delays at the administrative law judge hearing level. |
“Our 2015 results provide further evidence of the strength and consistency of our free cash flow generation,” said Doug Coltharp, Executive Vice President and Chief Financial Officer of HealthSouth. “Our priorities for free cash flow allocation in 2016 are to pursue core growth opportunities in both segments, selectively prepay debt, and continue to fund shareholder distributions. The magnitude of our free cash flow facilitates deployment across all of these alternatives.”
2016 Guidance
In a Current Report on Form 8-K dated January 11, 2016, the Company provided its initial guidance ranges for 2016. The Company is confirming the following net operating revenues and Adjusted EBITDA guidance ranges for 2016 and updating its 2016 guidance range for adjusted earnings per share:
Net Operating Revenues: $3,550 million to $3,650 million
Adjusted EBITDA: $765 million to $785 million
Adjusted Earnings per Share: $2.32 to $2.44 per diluted share
The Company is transitioning from providing guidance on earnings per share, a measure in accordance with generally accepted accounting principles in the United States of America (“GAAP”), to adjusted earnings per share, a non-GAAP measure. A calculation of adjusted earnings per share for the fourth quarters and years ended December 31, 2015 and 2014 is included in the supplemental data attached to this release.
The Company's adjusted earnings per share guidance was increased from a range of $2.28 to $2.40 (provided on January 11, 2016) to the above range of $2.32 to $2.44 primarily based on the Company's updated depreciation and amortization expense estimates resulting from purchase accounting adjustments related to the acquisitions of Reliant and CareSouth. Adjusted earnings per share guidance assumes an effective income tax rate of approximately 41% (using pre-tax income from continuing operations attributable to HealthSouth) and a diluted share count of approximately 101 million shares.
For additional considerations regarding the Company's 2016 guidance ranges, see the supplemental slides posted on the Company's website at http://investor.healthsouth.com.
Earnings Conference Call and Webcast
The Company will host an investor conference call at 9:00 a.m. Eastern Time on Wednesday, February 24, 2016 to discuss its results for the fourth quarter of 2015. For reference during the call, the Company will post certain supplemental slides at http:// investor.healthsouth.com. The conference call may be accessed by dialing 877 587-6761 and giving the pass code 26663099. International callers should dial 706 679-1635 and give the same pass code. Please call approximately ten minutes before the start of the call to ensure you are connected. The conference call will also be webcast live and will be available at
3 | ||
http://investor.healthsouth.com by clicking on an available link. An on-line replay of the conference call will be available after the live broadcast at http://investor.healthsouth.com.
About HealthSouth
HealthSouth is one of the nation's largest providers of post-acute healthcare services, offering both facility-based and home-based post-acute services in 34 states and Puerto Rico through its network of inpatient rehabilitation hospitals, home health agencies, and hospice agencies. HealthSouth can be found on the Web at www.healthsouth.com.
Other Information
The information in this press release is summarized and should be read in conjunction with the Company's Annual Report on Form 10-K for the year ended December 31, 2015 (the “2015 Form 10-K”), when filed, as well as the Company's Current Report on Form 8-K filed on February 23, 2016. In addition, the Company will post supplemental slides today on its website at http://investor.healthsouth.com for reference during its February 24, 2016 earnings call.
When filed, the 2015 Form 10-K can be found on the Company's website at http://investor.healthsouth.com and the SEC's website at www.sec.gov.
4 | ||
HealthSouth Corporation and Subsidiaries
Consolidated Statements of Operations
(Unaudited)
For the Three Months Ended December 31, | For the Year Ended December 31, | ||||||||||||||
2015 | 2014 | 2015 | 2014 | ||||||||||||
(In Millions) | |||||||||||||||
Net operating revenues | $ | 879.3 | $ | 613.4 | $ | 3,162.9 | $ | 2,405.9 | |||||||
Less: Provision for doubtful accounts | (14.0 | ) | (6.6 | ) | (47.2 | ) | (31.6 | ) | |||||||
Net operating revenues less provision for doubtful accounts | 865.3 | 606.8 | 3,115.7 | 2,374.3 | |||||||||||
Operating expenses: | |||||||||||||||
Salaries and benefits | 466.8 | 300.3 | 1,670.8 | 1,161.7 | |||||||||||
Other operating expenses | 118.0 | 91.4 | 432.1 | 351.6 | |||||||||||
Occupancy costs | 16.8 | 10.5 | 53.9 | 41.6 | |||||||||||
Supplies | 34.6 | 29.9 | 128.7 | 111.9 | |||||||||||
General and administrative expenses | 36.0 | 36.4 | 133.3 | 124.8 | |||||||||||
Depreciation and amortization | 41.4 | 27.5 | 139.7 | 107.7 | |||||||||||
Government, class action, and related settlements | (0.5 | ) | (0.9 | ) | 7.5 | (1.7 | ) | ||||||||
Professional fees—accounting, tax, and legal | 0.3 | 1.7 | 3.0 | 9.3 | |||||||||||
Total operating expenses | 713.4 | 496.8 | 2,569.0 | 1,906.9 | |||||||||||
Loss on early extinguishment of debt | 2.4 | 13.2 | 22.4 | 13.2 | |||||||||||
Interest expense and amortization of debt discounts and fees | 44.6 | 25.7 | 142.9 | 109.2 | |||||||||||
Other income | (1.3 | ) | (1.1 | ) | (5.5 | ) | (31.2 | ) | |||||||
Equity in net income of nonconsolidated affiliates | (2.4 | ) | (1.9 | ) | (8.7 | ) | (10.7 | ) | |||||||
Income from continuing operations before income tax expense | 108.6 | 74.1 | 395.6 | 386.9 | |||||||||||
Provision for income tax expense | 43.5 | 19.3 | 141.9 | 110.7 | |||||||||||
Income from continuing operations | 65.1 | 54.8 | 253.7 | 276.2 | |||||||||||
Income (loss) from discontinued operations, net of tax | 0.7 | 2.7 | (0.9 | ) | 5.5 | ||||||||||
Net income | 65.8 | 57.5 | 252.8 | 281.7 | |||||||||||
Less: Net income attributable to noncontrolling interests | (18.8 | ) | (15.4 | ) | (69.7 | ) | (59.7 | ) | |||||||
Net income attributable to HealthSouth | 47.0 | 42.1 | 183.1 | 222.0 | |||||||||||
Less: Convertible perpetual preferred stock dividends | — | (1.6 | ) | (1.6 | ) | (6.3 | ) | ||||||||
Net income attributable to HealthSouth common shareholders | $ | 47.0 | $ | 40.5 | $ | 181.5 | $ | 215.7 | |||||||
(Continued) | 5 | |
HealthSouth Corporation and Subsidiaries
Consolidated Statements of Operations (Continued)
(Unaudited)
For the Three Months Ended December 31, | For the Year Ended December 31, | ||||||||||||||
2015 | 2014 | 2015 | 2014 | ||||||||||||
(In Millions, Except per Share Data) | |||||||||||||||
Weighted average common shares outstanding: | |||||||||||||||
Basic | 90.1 | 86.6 | 89.4 | 86.8 | |||||||||||
Diluted | 100.6 | 100.8 | 101.0 | 100.7 | |||||||||||
Basic earnings (loss) per share attributable to HealthSouth common shareholders: | |||||||||||||||
Continuing operations | $ | 0.51 | $ | 0.43 | $ | 2.03 | $ | 2.40 | |||||||
Discontinued operations | 0.01 | 0.03 | (0.01 | ) | 0.06 | ||||||||||
Net income | $ | 0.52 | $ | 0.46 | $ | 2.02 | $ | 2.46 | |||||||
Diluted earnings (loss) per share attributable to HealthSouth common shareholders: | |||||||||||||||
Continuing operations | $ | 0.48 | $ | 0.41 | $ | 1.92 | $ | 2.24 | |||||||
Discontinued operations | 0.01 | 0.03 | (0.01 | ) | 0.05 | ||||||||||
Net income | $ | 0.49 | $ | 0.44 | $ | 1.91 | $ | 2.29 | |||||||
Cash dividends per common share | $ | 0.23 | $ | 0.21 | $ | 0.88 | $ | 0.78 | |||||||
Amounts attributable to HealthSouth: | |||||||||||||||
Income from continuing operations | $ | 46.3 | $ | 39.4 | $ | 184.0 | $ | 216.5 | |||||||
Income (loss) from discontinued operations, net of tax | 0.7 | 2.7 | (0.9 | ) | 5.5 | ||||||||||
Net income attributable to HealthSouth | $ | 47.0 | $ | 42.1 | $ | 183.1 | $ | 222.0 | |||||||
6 | ||
HealthSouth Corporation and Subsidiaries
Consolidated Balance Sheets
(Unaudited)
As of December 31, | |||||||
2015 | 2014 | ||||||
(In Millions) | |||||||
Assets | |||||||
Current assets: | |||||||
Cash and cash equivalents | $ | 61.6 | $ | 66.7 | |||
Restricted cash | 45.9 | 45.6 | |||||
Accounts receivable, net of allowance for doubtful accounts of $39.3 in 2015; $22.2 in 2014 | 410.5 | 323.2 | |||||
Deferred income tax assets | — | 188.4 | |||||
Prepaid expenses and other current assets | 80.7 | 62.7 | |||||
Total current assets | 598.7 | 686.6 | |||||
Property and equipment, net | 1,310.1 | 1,019.7 | |||||
Goodwill | 1,890.1 | 1,084.0 | |||||
Intangible assets, net | 419.4 | 306.1 | |||||
Deferred income tax assets | 190.8 | 129.4 | |||||
Other long-term assets | 197.0 | 162.5 | |||||
Total assets | $ | 4,606.1 | $ | 3,388.3 | |||
Liabilities and Shareholders’ Equity | |||||||
Current liabilities: | |||||||
Current portion of long-term debt | $ | 36.8 | $ | 20.8 | |||
Accounts payable | 61.6 | 53.4 | |||||
Accrued payroll | 126.2 | 123.3 | |||||
Accrued interest payable | 29.7 | 21.2 | |||||
Other current liabilities | 172.1 | 145.6 | |||||
Total current liabilities | 426.4 | 364.3 | |||||
Long-term debt, net of current portion | 3,134.7 | 2,090.4 | |||||
Self-insured risks | 101.6 | 98.7 | |||||
Other long-term liabilities | 43.0 | 37.5 | |||||
3,705.7 | 2,590.9 | ||||||
Commitments and contingencies | |||||||
Convertible perpetual preferred stock | — | 93.2 | |||||
Redeemable noncontrolling interests | 121.1 | 84.7 | |||||
Shareholders’ equity: | |||||||
HealthSouth shareholders’ equity | 611.4 | 473.2 | |||||
Noncontrolling interests | 167.9 | 146.3 | |||||
Total shareholders' equity | 779.3 | 619.5 | |||||
Total liabilities and shareholders’ equity | $ | 4,606.1 | $ | 3,388.3 | |||
7 | ||
HealthSouth Corporation and Subsidiaries
Consolidated Statements of Cash Flows
(Unaudited)
For the Year Ended December 31, | |||||||
2015 | 2014 | ||||||
(In Millions) | |||||||
Cash flows from operating activities: | |||||||
Net income | $ | 252.8 | $ | 281.7 | |||
Loss (income) from discontinued operations, net of tax | 0.9 | (5.5 | ) | ||||
Adjustments to reconcile net income to net cash provided by operating activities — | |||||||
Provision for doubtful accounts | 47.2 | 31.6 | |||||
Provision for government, class action, and related settlements | 7.5 | (1.7 | ) | ||||
Depreciation and amortization | 139.7 | 107.7 | |||||
Amortization of debt-related items | 14.3 | 12.7 | |||||
Loss on early extinguishment of debt | 22.4 | 13.2 | |||||
Equity in net income of nonconsolidated affiliates | (8.7 | ) | (10.7 | ) | |||
Distributions from nonconsolidated affiliates | 7.7 | 12.6 | |||||
Stock-based compensation | 26.2 | 23.9 | |||||
Deferred tax expense | 127.1 | 97.4 | |||||
Gain on consolidation of Fairlawn | — | (27.2 | ) | ||||
Other | (0.6 | ) | 4.8 | ||||
(Increase) decrease in assets, net of acquisitions— | |||||||
Accounts receivable | (134.1 | ) | (91.6 | ) | |||
Prepaid expenses and other assets | (9.6 | ) | 6.5 | ||||
Increase (decrease) in liabilities, net of acquisitions— | |||||||
Accounts payable | 0.9 | 5.4 | |||||
Other liabilities | (4.3 | ) | (10.4 | ) | |||
Premium received on bond issuance | 9.8 | 6.3 | |||||
Premium paid on redemption of bonds | (13.7 | ) | (10.6 | ) | |||
Net cash used in operating activities of discontinued operations | (0.7 | ) | (1.2 | ) | |||
Total adjustments | 231.1 | 168.7 | |||||
Net cash provided by operating activities | 484.8 | 444.9 | |||||
(Continued) | 8 | |
HealthSouth Corporation and Subsidiaries
Consolidated Statements of Cash Flows (Continued)
(Unaudited)
For the Year Ended December 31, | |||||||
2015 | 2014 | ||||||
(In Millions) | |||||||
Cash flows from investing activities: | |||||||
Acquisition of businesses, net of cash acquired | (985.1 | ) | (694.8 | ) | |||
Purchases of property and equipment | (128.4 | ) | (170.9 | ) | |||
Capitalized software costs | (28.1 | ) | (17.0 | ) | |||
Proceeds from sale of restricted investments | 0.2 | 0.3 | |||||
Proceeds from sale of marketable securities | 12.8 | — | |||||
Purchases of restricted investments | (7.1 | ) | (3.5 | ) | |||
Net change in restricted cash | 2.7 | 6.8 | |||||
Other | 2.7 | 2.2 | |||||
Net cash provided by investing activities of discontinued operations | 0.5 | — | |||||
Net cash used in investing activities | (1,129.8 | ) | (876.9 | ) | |||
Cash flows from financing activities: | |||||||
Principal borrowings on term loan facilities | 250.0 | 450.0 | |||||
Proceeds from bond issuance | 1,400.0 | 175.0 | |||||
Principal payments on debt, including pre-payments | (597.4 | ) | (302.6 | ) | |||
Borrowings on revolving credit facility | 540.0 | 440.0 | |||||
Payments on revolving credit facility | (735.0 | ) | (160.0 | ) | |||
Principal payments under capital lease obligations | (11.0 | ) | (6.1 | ) | |||
Debt amendment and issuance costs | (31.9 | ) | (6.5 | ) | |||
Repurchase of common stock, including fees and expenses | (45.3 | ) | (43.1 | ) | |||
Dividends paid on common stock | (77.2 | ) | (65.8 | ) | |||
Dividends paid on convertible perpetual preferred stock | (3.1 | ) | (6.3 | ) | |||
Distributions paid to noncontrolling interests of consolidated affiliates | (54.4 | ) | (54.1 | ) | |||
Proceeds from exercising stock warrants | — | 6.3 | |||||
Other | 5.2 | 7.4 | |||||
Net cash provided by financing activities | 639.9 | 434.2 | |||||
(Decrease) increase in cash and cash equivalents | (5.1 | ) | 2.2 | ||||
Cash and cash equivalents at beginning of year | 66.7 | 64.5 | |||||
Cash and cash equivalents at end of year | $ | 61.6 | $ | 66.7 | |||
9 | ||
HealthSouth Corporation and Subsidiaries
Supplemental Information
Earnings Per Share
QTD | ||||||||
Q4 2015 | Q4 2014 | |||||||
(In Millions, Except Per Share Data) | ||||||||
Adjusted EBITDA | $ | 191.5 | $ | 140.8 | ||||
Interest expense and amortization of debt discounts and fees | (44.6 | ) | (25.7 | ) | ||||
Depreciation and amortization | (41.4 | ) | (27.5 | ) | ||||
Stock-based compensation expense | (4.4 | ) | (4.6 | ) | ||||
Noncash loss on disposal of assets | (2.4 | ) | (1.0 | ) | ||||
98.7 | 82.0 | |||||||
Certain nonrecurring expenses: | ||||||||
Government, class action, and related settlements | 0.5 | 0.9 | ||||||
Professional fees—accounting, tax, and legal | (0.3 | ) | (1.7 | ) | ||||
Loss on early extinguishment of debt | (2.4 | ) | (13.2 | ) | ||||
Transaction costs | (6.7 | ) | (9.3 | ) | ||||
Pre-tax income | 89.8 | 58.7 | ||||||
Income tax expense (1) | (43.5 | ) | (2) | (19.3 | ) | (3) | ||
Income from continuing operations (4) | $ | 46.3 | $ | 39.4 | ||||
Basic shares | 90.1 | 86.6 | ||||||
Diluted shares | 100.6 | 100.8 | ||||||
Basic earnings per share (4) | $ | 0.51 | $ | 0.43 | ||||
Diluted earnings per share (4) | $ | 0.48 | $ | 0.41 | ||||
(1) | Current income tax expense for the three months ended December 31, 2015 and 2014 was $4.4 million and $3.5 million, respectively. |
(2) | The Company's effective income tax rate was higher than the statutory rate due to an increase in the Company's valuation allowance related to certain state net operating losses. |
(3) | The Company's effective income tax rate was reduced as a result of the nontaxable gain related to its acquisition of an additional 30% equity interest in Fairlawn. |
(4) | Income from continuing operations attributable to HealthSouth |
10 | ||
HealthSouth Corporation and Subsidiaries
Supplemental Information
Earnings Per Share
YTD | ||||||||
2015 | 2014 | |||||||
(In Millions, Except Per Share Data) | ||||||||
Adjusted EBITDA | $ | 682.5 | $ | 577.6 | ||||
Interest expense and amortization of debt discounts and fees | (142.9 | ) | (109.2 | ) | ||||
Depreciation and amortization | (139.7 | ) | (107.7 | ) | ||||
Stock-based compensation expense | (26.2 | ) | (23.9 | ) | ||||
Noncash loss on disposal of assets or impairment of assets | (2.6 | ) | (6.7 | ) | ||||
371.1 | 330.1 | |||||||
Certain nonrecurring expenses: | ||||||||
Government, class action, and related settlements | (7.5 | ) | 1.7 | |||||
Professional fees—accounting, tax, and legal | (3.0 | ) | (9.3 | ) | ||||
Loss on early extinguishment of debt | (22.4 | ) | (13.2 | ) | ||||
Gain on consolidation of Fairlawn Rehabilitation Hospital | — | 27.2 | ||||||
Transaction costs | (12.3 | ) | (9.3 | ) | ||||
Pre-tax income | 325.9 | 327.2 | ||||||
Income tax expense (1) | (141.9 | ) | (2) | (110.7 | ) | (3) | ||
Income from continuing operations (4) | $ | 184.0 | $ | 216.5 | ||||
Basic shares | 89.4 | 86.8 | ||||||
Diluted shares | 101.0 | 100.7 | ||||||
Basic earnings per share (4) | $ | 2.03 | $ | 2.40 | ||||
Diluted earnings per share (4) | $ | 1.92 | $ | 2.24 | ||||
(1) | Current income tax expense for the year ended December 31, 2015 and 2014 was $14.8 million and $13.3 million, respectively. |
(2) | The Company's effective income tax rate was higher than the statutory rate due to an increase in the Company's valuation allowance related to certain state net operating losses. |
(3) | The Company's effective income tax rate was reduced as a result of the nontaxable gain related to its acquisition of an additional 30% equity interest in Fairlawn. |
(4) | Income from continuing operations attributable to HealthSouth |
11 | ||
HealthSouth Corporation and Subsidiaries
Supplemental Information
Adjusted Earnings Per Share
Q4 | Full Year | ||||||||||||||
2015 | 2014 | 2015 | 2014 | ||||||||||||
Earnings per share, as reported | $ | 0.48 | $ | 0.41 | $ | 1.92 | $ | 2.24 | |||||||
Adjustments, net of tax: | |||||||||||||||
Government, class action, and related settlements | — | (0.01 | ) | 0.04 | (0.01 | ) | |||||||||
Professional fees — accounting, tax, and legal | — | 0.01 | 0.02 | 0.06 | |||||||||||
Income tax valuation allowance and other tax adjustments | 0.05 | (0.10 | ) | 0.05 | (0.07 | ) | |||||||||
Gain on consolidation of Fairlawn Rehabilitation Hospital | — | — | — | (0.30 | ) | ||||||||||
Transaction costs | 0.05 | 0.07 | 0.08 | 0.07 | |||||||||||
Loss on early extinguishment of debt | 0.01 | 0.08 | 0.13 | 0.08 | |||||||||||
Adjusted earnings per share* | $ | 0.59 | $ | 0.47 | $ | 2.24 | $ | 2.06 | |||||||
* Adjusted EPS may not sum due to rounding.
12 | ||
HealthSouth Corporation and Subsidiaries
Supplemental Information
Adjusted Earnings Per Share
For the Three Months Ended December 31, 2015 | |||||||||||||||||||||||||||
Adjustments | |||||||||||||||||||||||||||
As Reported | Gov’t, Class Action, & Related Settlements | Pro. Fees - Acct., Tax, & Legal | Income Tax Valuation Allowance & Other Adj. | Transaction Costs | Loss on Early Exting. of Debt | As Adjusted | |||||||||||||||||||||
(In Millions, Except Per Share Amounts) | |||||||||||||||||||||||||||
Adjusted EBITDA* | $ | 191.5 | $ | — | $ | — | $ | — | $ | — | $ | — | $ | 191.5 | |||||||||||||
Depreciation and amortization | (41.4 | ) | — | — | — | — | — | (41.4 | ) | ||||||||||||||||||
Government, class action, and related settlements | 0.5 | (0.5 | ) | — | — | — | — | — | |||||||||||||||||||
Professional fees - accounting, tax, and legal | (0.3 | ) | — | 0.3 | — | — | — | — | |||||||||||||||||||
Loss on early extinguishment of debt | (2.4 | ) | — | — | — | — | 2.4 | — | |||||||||||||||||||
Interest expense and amortization of debt discounts and fees | (44.6 | ) | — | — | — | — | — | (44.6 | ) | ||||||||||||||||||
Stock-based compensation | (4.4 | ) | — | — | — | — | — | (4.4 | ) | ||||||||||||||||||
Loss on disposal or impairment of assets | (2.4 | ) | — | — | — | — | — | (2.4 | ) | ||||||||||||||||||
Reliant/CareSouth transaction costs | (6.7 | ) | — | — | — | 6.7 | — | — | |||||||||||||||||||
Income from continuing operations before income tax expense | 89.8 | (0.5 | ) | 0.3 | — | 6.7 | 2.4 | 98.7 | |||||||||||||||||||
Provision for income tax expense | (43.5 | ) | 0.2 | (0.1 | ) | 4.7 | (2.1 | ) | (1.0 | ) | (41.8 | ) | |||||||||||||||
Income from continuing operations attributable to HealthSouth | $ | 46.3 | $ | (0.3 | ) | $ | 0.2 | $ | 4.7 | $ | 4.6 | $ | 1.4 | $ | 56.9 | ||||||||||||
Add: Interest on convertible debt, net of tax | 2.4 | 2.4 | |||||||||||||||||||||||||
Numerator for diluted earnings per share | $ | 48.7 | $ | 59.3 | |||||||||||||||||||||||
Diluted earnings per share from continuing operations** | $ | 0.48 | $ | — | $ | — | $ | 0.05 | $ | 0.05 | $ | 0.01 | $ | 0.59 | |||||||||||||
Diluted shares used in calculation | 100.6 | ||||||||||||||||||||||||||
*Reconciliation to GAAP provided on page 17
** Adjusted EPS may not sum across due to rounding.
13 | ||
HealthSouth Corporation and Subsidiaries
Supplemental Information
Adjusted Earnings Per Share
For the Three Months Ended December 31, 2014 | |||||||||||||||||||||||||||
Adjustments | |||||||||||||||||||||||||||
As Reported | Gov’t, Class Action, & Related Settlements | Pro. Fees - Acct., Tax, & Legal | Income Tax Valuation & Other Adj. | Transaction Costs | Loss on Early Exting. of Debt | As Adjusted | |||||||||||||||||||||
(In Millions, Except Per Share Amounts) | |||||||||||||||||||||||||||
Adjusted EBITDA* | $ | 140.8 | $ | — | $ | — | $ | — | $ | — | $ | — | $ | 140.8 | |||||||||||||
Depreciation and amortization | (27.5 | ) | — | — | — | — | — | (27.5 | ) | ||||||||||||||||||
Government, class action, and related settlements | 0.9 | (0.9 | ) | — | — | — | — | — | |||||||||||||||||||
Professional fees - accounting, tax, and legal | (1.7 | ) | — | 1.7 | — | — | — | — | |||||||||||||||||||
Loss on early extinguishment of debt | (13.2 | ) | — | — | — | — | 13.2 | — | |||||||||||||||||||
Interest expense and amortization of debt discounts and fees | (25.7 | ) | — | — | — | — | — | (25.7 | ) | ||||||||||||||||||
Stock-based compensation | (4.6 | ) | — | — | — | — | — | (4.6 | ) | ||||||||||||||||||
Loss on disposal or impairment of assets | (1.0 | ) | — | — | — | — | — | (1.0 | ) | ||||||||||||||||||
Encompass transaction costs | (9.3 | ) | — | — | — | 9.3 | — | — | |||||||||||||||||||
Income from continuing operations before income tax expense | 58.7 | (0.9 | ) | 1.7 | — | 9.3 | 13.2 | 82.0 | |||||||||||||||||||
Provision for income tax expense | (19.3 | ) | 0.4 | (0.7 | ) | (9.7 | ) | (2.5 | ) | (5.3 | ) | (37.1 | ) | ||||||||||||||
Income from continuing operations attributable to HealthSouth | $ | 39.4 | $ | (0.5 | ) | $ | 1.0 | $ | (9.7 | ) | $ | 6.8 | $ | 7.9 | $ | 44.9 | |||||||||||
Add: Interest on convertible debt, net of tax | 2.2 | 2.2 | |||||||||||||||||||||||||
Numerator for diluted earnings per share | $ | 41.6 | $ | 47.1 | |||||||||||||||||||||||
Diluted earnings per share from continuing operations** | $ | 0.41 | $ | (0.01 | ) | $ | 0.01 | $ | (0.10 | ) | $ | 0.07 | $ | 0.08 | $ | 0.47 | |||||||||||
Diluted shares used in calculation | 100.8 | ||||||||||||||||||||||||||
*Reconciliation to GAAP provided on page 17
** Adjusted EPS may not sum across due to rounding.
14 | ||
HealthSouth Corporation and Subsidiaries
Supplemental Information
Adjusted Earnings Per Share
For the Year Ended December 31, 2015 | |||||||||||||||||||||||||||
Adjustments | |||||||||||||||||||||||||||
As Reported | Gov’t, Class Action, & Related Settlements | Pro. Fees - Acct., Tax, & Legal | Income Tax Valuation Allowance & Other Adj. | Transaction Costs | Loss on Early Exting. of Debt | As Adjusted | |||||||||||||||||||||
(In Millions, Except Per Share Amounts) | |||||||||||||||||||||||||||
Adjusted EBITDA* | $ | 682.5 | $ | — | $ | — | $ | — | $ | — | $ | — | $ | 682.5 | |||||||||||||
Depreciation and amortization | (139.7 | ) | — | — | — | — | — | (139.7 | ) | ||||||||||||||||||
Government, class action, and related settlements | (7.5 | ) | 7.5 | — | — | — | — | — | |||||||||||||||||||
Professional fees - accounting, tax, and legal | (3.0 | ) | — | 3.0 | — | — | — | — | |||||||||||||||||||
Loss on early extinguishment of debt | (22.4 | ) | — | — | — | — | 22.4 | — | |||||||||||||||||||
Interest expense and amortization of debt discounts and fees | (142.9 | ) | — | — | — | — | — | (142.9 | ) | ||||||||||||||||||
Stock-based compensation | (26.2 | ) | — | — | — | — | — | (26.2 | ) | ||||||||||||||||||
Loss on disposal or impairment of assets | (2.6 | ) | — | — | — | — | — | (2.6 | ) | ||||||||||||||||||
Reliant/CareSouth transaction costs | (12.3 | ) | — | — | — | 12.3 | — | — | |||||||||||||||||||
Income from continuing operations before income tax expense | 325.9 | 7.5 | 3.0 | — | 12.3 | 22.4 | 371.1 | ||||||||||||||||||||
Provision for income tax expense | (141.9 | ) | (3.0 | ) | (1.2 | ) | 4.7 | (4.1 | ) | (9.0 | ) | (154.5 | ) | ||||||||||||||
Income from continuing operations attributable to HealthSouth | $ | 184.0 | $ | 4.5 | $ | 1.8 | $ | 4.7 | $ | 8.2 | $ | 13.4 | $ | 216.6 | |||||||||||||
Add: Interest on convertible debt, net of tax | 9.4 | 9.4 | |||||||||||||||||||||||||
Numerator for diluted earnings per share | $ | 193.4 | $ | 226.0 | |||||||||||||||||||||||
Diluted earnings per share from continuing operations** | $ | 1.92 | $ | 0.04 | $ | 0.02 | $ | 0.05 | $ | 0.08 | $ | 0.13 | $ | 2.24 | |||||||||||||
Diluted shares used in calculation | 101.0 | ||||||||||||||||||||||||||
*Reconciliation to GAAP provided on page 17
** Adjusted EPS may not sum across due to rounding.
15 | ||
HealthSouth Corporation and Subsidiaries
Supplemental Information
Adjusted Earnings Per Share
For the Year Ended December 31, 2014 | |||||||||||||||||||||||||||||||
Adjustments | |||||||||||||||||||||||||||||||
As Reported | Gov't, Class Action, and Related Settlements | Pro. Fees - Acct, Tax, and Legal | Transaction Costs | Gain on Consolidation of Fairlawn Rehabilitation Hospital | Loss on Early Exting. of Debt | Income Tax Valuation Adjustment | As Adjusted | ||||||||||||||||||||||||
(In Millions, Except Per Share Amounts) | |||||||||||||||||||||||||||||||
Adjusted EBITDA* | $ | 577.6 | $ | — | $ | — | $ | — | $ | — | $ | — | $ | — | $ | 577.6 | |||||||||||||||
Depreciation and amortization | (107.7 | ) | — | — | — | — | — | — | (107.7 | ) | |||||||||||||||||||||
Government, class action, and related settlements | 1.7 | (1.7 | ) | — | — | — | — | — | — | ||||||||||||||||||||||
Professional fees - accounting, tax, and legal | (9.3 | ) | — | 9.3 | — | — | — | — | — | ||||||||||||||||||||||
Loss on early extinguishment of debt | (13.2 | ) | — | — | — | — | 13.2 | — | — | ||||||||||||||||||||||
Interest expense and amortization of debt discounts and fees | (109.2 | ) | — | — | — | — | — | — | (109.2 | ) | |||||||||||||||||||||
Stock-based compensation | (23.9 | ) | — | — | — | — | — | — | (23.9 | ) | |||||||||||||||||||||
Loss on disposal or impairment of assets | (6.7 | ) | — | — | — | — | — | — | (6.7 | ) | |||||||||||||||||||||
Gain on consolidation of Fairlawn Rehabilitation Hospital | 27.2 | — | — | — | (27.2 | ) | — | — | — | ||||||||||||||||||||||
Encompass transaction costs | (9.3 | ) | — | — | 9.3 | — | — | — | — | ||||||||||||||||||||||
Income from continuing operations before income tax expense | 327.2 | (1.7 | ) | 9.3 | 9.3 | (27.2 | ) | 13.2 | — | 330.1 | |||||||||||||||||||||
Provision for income tax expense | (110.7 | ) | 0.7 | (3.7 | ) | (2.5 | ) | (3.0 | ) | (5.3 | ) | (7.4 | ) | (131.9 | ) | ||||||||||||||||
Income from continuing operations attributable to HealthSouth | $ | 216.5 | $ | (1.0 | ) | $ | 5.6 | $ | 6.8 | $ | (30.2 | ) | $ | 7.9 | $ | (7.4 | ) | $ | 198.2 | ||||||||||||
Add: Interest on convertible debt, net of tax | 9.0 | 9.0 | |||||||||||||||||||||||||||||
Numerator for diluted earnings per share | $ | 225.5 | $ | 207.2 | |||||||||||||||||||||||||||
Diluted earnings per share from continuing operations** | $ | 2.24 | $ | (0.01 | ) | $ | 0.06 | $ | 0.07 | $ | (0.30 | ) | $ | 0.08 | $ | (0.07 | ) | $ | 2.06 | ||||||||||||
Diluted shares used in calculation | 100.7 | ||||||||||||||||||||||||||||||
*Reconciliation to GAAP provided on page 17
** Adjusted EPS may not sum across due to rounding.
16 | ||
HealthSouth Corporation and Subsidiaries
Supplemental Information
Reconciliation of Net Income to Adjusted EBITDA
For the Three Months Ended December 31, | For the Year Ended December 31, | |||||||||||||||
2015 | 2014 | 2015 | 2014 | |||||||||||||
(In Millions) | ||||||||||||||||
Net income | $ | 65.8 | $ | 57.5 | $ | 252.8 | $ | 281.7 | ||||||||
(Income) loss from discontinued operations, net of tax, attributable to HealthSouth | (0.7 | ) | (2.7 | ) | 0.9 | (5.5 | ) | |||||||||
Provision for income tax expense | 43.5 | 19.3 | 141.9 | 110.7 | ||||||||||||
Interest expense and amortization of debt discounts and fees | 44.6 | 25.7 | 142.9 | 109.2 | ||||||||||||
Loss on early extinguishment of debt | 2.4 | 13.2 | 22.4 | 13.2 | ||||||||||||
Professional fees—accounting, tax, and legal | 0.3 | 1.7 | 3.0 | 9.3 | ||||||||||||
Government, class action, and related settlements | (0.5 | ) | (0.9 | ) | 7.5 | (1.7 | ) | |||||||||
Net noncash loss on disposal or impairment of assets | 2.4 | 1.0 | 2.6 | 6.7 | ||||||||||||
Depreciation and amortization | 41.4 | 27.5 | 139.7 | 107.7 | ||||||||||||
Stock-based compensation expense | 4.4 | 4.6 | 26.2 | 23.9 | ||||||||||||
Net income attributable to noncontrolling interests | (18.8 | ) | (15.4 | ) | (69.7 | ) | (59.7 | ) | ||||||||
Gain on consolidation of Fairlawn Rehabilitation Hospital | — | — | — | (27.2 | ) | |||||||||||
Reliant and CareSouth transaction costs | 6.7 | — | 12.3 | — | ||||||||||||
Encompass transaction costs | — | 9.3 | — | 9.3 | ||||||||||||
Adjusted EBITDA | $ | 191.5 | $ | 140.8 | $ | 682.5 | $ | 577.6 | ||||||||
17 | ||
HealthSouth Corporation and Subsidiaries
Supplemental Information
Reconciliation of Net Cash Provided by Operating Activities to Adjusted Free Cash Flow
For the Three Months Ended | For the Year Ended | ||||||||||||||
December 31, | December 31, | ||||||||||||||
2015 | 2014 | 2015 | 2014 | ||||||||||||
(In Millions) | |||||||||||||||
Net cash provided by operating activities | $ | 116.6 | $ | 70.2 | $ | 484.8 | $ | 444.9 | |||||||
Impact of discontinued operations | (0.1 | ) | 0.2 | 0.7 | 1.2 | ||||||||||
Net cash provided by operating activities of continuing operations | 116.5 | 70.4 | 485.5 | 446.1 | |||||||||||
Capital expenditures for maintenance | (27.1 | ) | (26.1 | ) | (83.1 | ) | (92.0 | ) | |||||||
Dividends paid on convertible perpetual preferred stock | — | (1.6 | ) | (3.1 | ) | (6.3 | ) | ||||||||
Distributions paid to noncontrolling interests of consolidated affiliates | (14.8 | ) | (14.5 | ) | (54.4 | ) | (54.1 | ) | |||||||
Nonrecurring items: | |||||||||||||||
Premium received on bond issuance | — | — | (9.7 | ) | (6.3 | ) | |||||||||
Premium paid on redemption of bonds | 1.9 | 10.6 | 13.7 | 10.6 | |||||||||||
Encompass transaction costs and related assumed liabilities | — | 2.0 | 17.9 | 2.0 | |||||||||||
Reliant/CareSouth transaction costs | 6.5 | — | 10.4 | — | |||||||||||
Cash paid for: | |||||||||||||||
Professional fees—accounting, tax, and legal | 0.3 | 1.3 | 4.1 | 8.6 | |||||||||||
Government, class action, and related settlements | (0.3 | ) | 3.3 | 7.7 | 2.7 | ||||||||||
Adjusted free cash flow | $ | 83.0 | $ | 45.4 | $ | 389.0 | $ | 311.3 | |||||||
For the three months ended December 31, 2015, net cash used in investing activities was $950.4 million and resulted primarily from the acquisitions of Reliant and CareSouth. Net cash provided by financing activities during the three months ended December 31, 2015 was $93.8 million and resulted primarily from funding of the acquisitions of Reliant and CareSouth.
For the three months ended December 31, 2014, net cash used in investing activities was $713.6 million and resulted primarily from the acquisition of Encompass. Net cash provided by financing activities during the three months ended December 31, 2014 was $438.8 million and resulted primarily from draws under the revolving and expanded term loan facilities of the Company's credit agreement to fund the acquisition of Encompass offset by the redemption of the Company's existing 7.25% Senior Notes due 2018.
For the year ended December 31, 2015, net cash used in investing activities was $1,129.8 million and resulted primarily from the acquisitions of Reliant and CareSouth. Net cash provided by financing activities during the year ended December 31, 2015 was $639.9 million and resulted primarily from net debt issuances associated with the funding of the Reliant acquisition.
For the year ended December 31, 2014, net cash used in investing activities was $876.9 million and resulted primarily from the acquisition of Encompass. Net cash provided by financing activities during the year ended December 31, 2014 was $434.2 million and resulted primarily from draws under the revolving and expanded term loan facilities of the Company's credit agreement to fund the acquisition of Encompass offset by the redemption of the Company's existing 7.25% Senior Notes due 2018.
18 | ||
HealthSouth Corporation and Subsidiaries
Forward-Looking Statements
Statements contained in this press release which are not historical facts, such as those relating to the financial guidance, are forward-looking statements. In addition, HealthSouth, through its senior management, may from time to time make forward-looking public statements concerning the matters described herein. All such estimates, projections, and forward-looking information speak only as of the date hereof, and HealthSouth undertakes no duty to publicly update or revise such forward-looking information, whether as a result of new information, future events, or otherwise. Such forward-looking statements are necessarily estimates based upon current information, involve a number of risks and uncertainties, and relate to, among other things, future events, HealthSouth’s plan to repurchase its debt or equity securities, dividend strategies or payments, effective income tax rates, HealthSouth’s business strategy, its financial plans, its future financial performance, its projected business results or model, its ability to return value to shareholders, its projected capital expenditures, its leverage ratio, its acquisition opportunities, and the impact of future legislation or regulation. Actual events or results may differ materially from those anticipated in these forward-looking statements as a result of a variety of factors. While it is impossible to identify all such factors, factors which could cause actual events or results to differ materially from those estimated by HealthSouth include, but are not limited to, the price of HealthSouth’s common or preferred stock as it affects the Company’s willingness and ability to repurchase shares and the financial and accounting effects of any repurchases; any adverse outcome of various lawsuits, claims, and legal or regulatory proceedings involving HealthSouth, including its pending DOJ and HHS‑OIG investigations and any matters related to yet undiscovered issues, if any, at Encompass, Reliant, or CareSouth; any adverse effects on HealthSouth’s stock price resulting from the integration of Encompass, Reliant, or CareSouth; potential disruptions, breaches, or other incidents affecting the proper operation, availability, or security of HealthSouth’s information systems, including unauthorized access to or theft of patient or other sensitive information as well as unforeseen issues, if any, related to integration of Encompass’ systems; the ability to successfully integrate Encompass, Reliant, or CareSouth, including realization of anticipated tax benefits, revenues, and cost savings, minimizing the negative impact on margins arising from the changes in staffing and other operating practices, and avoidance of unforeseen exposure to liabilities; significant changes in HealthSouth’s management team; HealthSouth’s ability to successfully complete and integrate de novo developments, acquisitions, investments, and joint ventures consistent with its growth strategy; changes, delays in (including in connection with resolution of Medicare payment reviews or appeals), or suspension of reimbursement for HealthSouth’s services by governmental or private payors; changes in the regulation of the healthcare industry at either or both of the federal and state levels, including as part of national healthcare reform and deficit reduction; competitive pressures in the healthcare industry and HealthSouth’s response thereto; HealthSouth’s ability to obtain and retain favorable arrangements with third-party payors; HealthSouth’s ability to control costs, particularly labor and employee benefit costs, including group medical expenses; adverse effects resulting from coverage determinations made by Medicare Administrative Contractors regarding its Medicare reimbursement claims and lengthening delays in HealthSouth's ability to recover improperly denied claims through the administrative appeals process on a timely basis; HealthSouth's ability to adapt to changes in the healthcare delivery system, including involvement in coordinated care initiatives or programs that may arise with its referral sources; HealthSouth's ability to attract and retain nurses, therapists, and other healthcare professionals in a highly competitive environment with often severe staffing shortages and the impact on HealthSouth’s labor expenses from potential union activity and staffing shortages; general conditions in the economy and capital markets, including any crisis resulting from uncertainty in the sovereign debt market; the increase in the costs of defending and insuring against alleged professional liability claims and HealthSouth’s ability to predict the estimated costs related to such claims; and other factors which may be identified from time to time in HealthSouth’s SEC filings and other public announcements, including HealthSouth's Form 10‑K for the year ended December 31, 2015, when filed.
19 | ||
Fourth Quarter 2015 Earnings Call February 24, 2016 Supplemental Slides

2 The information contained in this presentation includes certain estimates, projections and other forward-looking information that reflect our current outlook, views and plans with respect to future events, including legislative and regulatory developments, strategy, capital expenditures, development activities, dividend strategies, repurchases of securities, effective tax rates, financial performance, and business model. These estimates, projections and other forward-looking information are based on assumptions HealthSouth believes, as of the date hereof, are reasonable. Inevitably, there will be differences between such estimates and actual events or results, and those differences may be material. There can be no assurance any estimates, projections or forward-looking information will be realized. All such estimates, projections and forward-looking information speak only as of the date hereof. HealthSouth undertakes no duty to publicly update or revise the information contained herein. You are cautioned not to place undue reliance on the estimates, projections and other forward-looking information in this presentation as they are based on current expectations and general assumptions and are subject to various risks, uncertainties and other factors, including those set forth in the Form 10-K for the year ended December 31, 2015, when filed, and in other documents we previously filed with the SEC, many of which are beyond our control, that may cause actual events or results to differ materially from the views, beliefs and estimates expressed herein. Note Regarding Presentation of Non-GAAP Financial Measures The following presentation includes certain “non-GAAP financial measures” as defined in Regulation G under the Securities Exchange Act of 1934. Schedules are attached that reconcile the non-GAAP financial measures included in the following presentation to the most directly comparable financial measures calculated and presented in accordance with Generally Accepted Accounting Principles in the United States. Our Form 8-K, dated February 23, 2016, to which the following supplemental slides are attached as Exhibit 99.2, provides further explanation and disclosure regarding our use of non-GAAP financial measures and should be read in conjunction with these supplemental slides. Forward-Looking Statements

3 Table of Contents Q4 2015 Summary................................................................................................................................................. 4-5 Inpatient Rehabilitation Segment........................................................................................................................... 6-7 Home Health & Hospice Segment ........................................................................................................................ 8-9 Earnings per Share................................................................................................................................................ 10-11 Adjusted Free Cash Flow ...................................................................................................................................... 12 2016 Guidance ...................................................................................................................................................... 13-14 Appendix................................................................................................................................................................ 15 Map of Locations.................................................................................................................................................... 16 Expansion Activity ................................................................................................................................................. 17 Adjusted Free Cash Flow and Tax Assumptions.................................................................................................... 18 Free Cash Flow Priorities ...................................................................................................................................... 19 Debt Schedule and Maturity Profile ...................................................................................................................... 20-21 New-Store/Same-Store IRF Growth ..................................................................................................................... 22 Payment Sources (Percent of Revenues) ............................................................................................................. 23 Inpatient Rehabilitation Operational and Labor Metrics ........................................................................................ 24 Home Health & Hospice Operational Metrics ....................................................................................................... 25 Share Information.................................................................................................................................................. 26 History Recast by Segment................................................................................................................................... 27-28 Reconciliations to GAAP ....................................................................................................................................... 29-37 End Notes ............................................................................................................................................................. 38-40
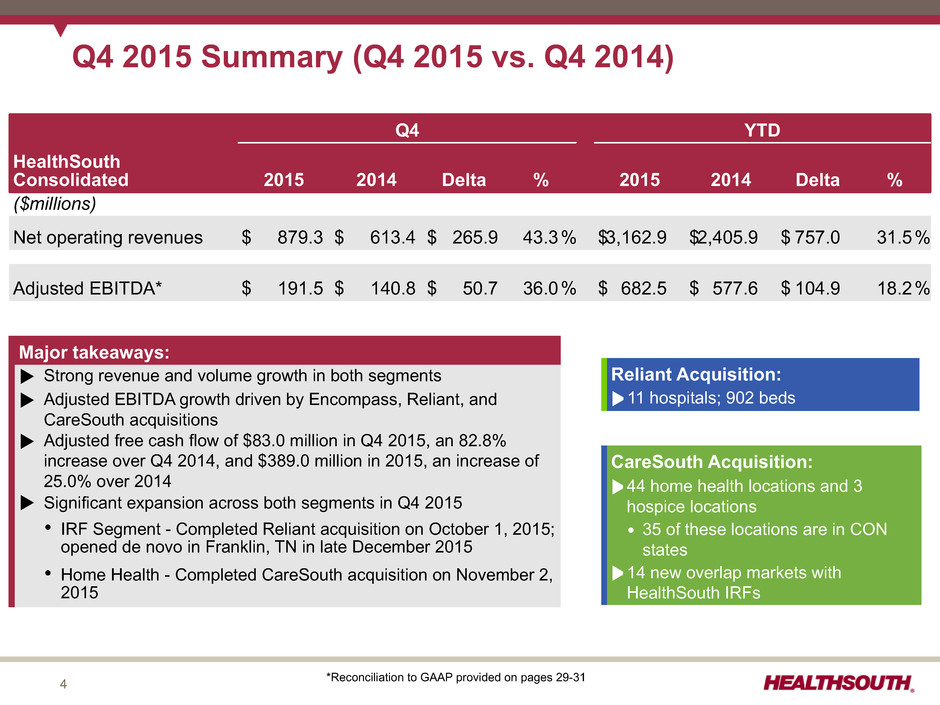
4 Q4 2015 Summary (Q4 2015 vs. Q4 2014) Q4 YTD HealthSouth Consolidated 2015 2014 Delta % 2015 2014 Delta % ($millions) Net operating revenues $ 879.3 $ 613.4 $ 265.9 43.3% $3,162.9 $2,405.9 $ 757.0 31.5% Adjusted EBITDA* $ 191.5 $ 140.8 $ 50.7 36.0% $ 682.5 $ 577.6 $ 104.9 18.2% Major takeaways: u Strong revenue and volume growth in both segments u Adjusted EBITDA growth driven by Encompass, Reliant, and CareSouth acquisitions u Adjusted free cash flow of $83.0 million in Q4 2015, an 82.8% increase over Q4 2014, and $389.0 million in 2015, an increase of 25.0% over 2014 u Significant expansion across both segments in Q4 2015 Ÿ IRF Segment - Completed Reliant acquisition on October 1, 2015; opened de novo in Franklin, TN in late December 2015 Ÿ Home Health - Completed CareSouth acquisition on November 2, 2015 *Reconciliation to GAAP provided on pages 29-31 Reliant Acquisition: u11 hospitals; 902 beds CareSouth Acquisition: u44 home health locations and 3 hospice locations Ÿ 35 of these locations are in CON states u14 new overlap markets with HealthSouth IRFs

5 Q4 2015 Summary (cont.) u Balance sheet Ÿ Redeemed $50 million of 7.75% Senior Notes due 2022 in November 2015 Ÿ Issued notice of intent to redeem an additional $50 million of 7.75% Senior Notes due 2022 in February 2016; expect to complete redemption in March 2016 u Diluted earnings per share of $0.48 in Q4 2015 ($0.41 in Q4 2014) - See table on page 10. u Adjusted diluted earnings per share(1) were $0.59 in Q4 2015 ($0.47 in Q4 2014) - See table on page 11. Ÿ Adjusted EPS excludes the impact of certain tax adjustments, transaction costs, and loss on early extinguishment of debt u Shareholder distributions Ÿ Paid quarterly cash dividend of $0.23 per share on October 15, 2015 Ÿ Declared a $0.23 per share quarterly cash dividend paid on January 15, 2016 Ÿ Repurchased 1,360,974 shares of common stock for ~$47 million in open market transactions Refer to pages 38-40 for end notes.

6 Inpatient Rehabilitation Segment - Revenue Q4 Q4 Favorable/ ($millions) 2015 2014 (Unfavorable) Net operating revenues: Inpatient $ 696.8 $ 580.9 20.0% Outpatient and other 29.1 24.9 16.9% Total segment revenue $ 725.9 $ 605.8 19.8% (Actual Amounts) Discharges 40,891 34,465 18.6% New-store discharge growth 15.6% Same-store discharge growth 3.0% Net patient revenue / discharge $ 17,040 $ 16,855 1.1% u Revenue growth was driven by the Reliant acquisition and strong discharge volume growth across all payors. u New-store discharge growth was driven by the addition of four new hospitals in Q4 2014, the additions of Savannah (April) and Cardinal Hill (May) in 2015, the acquisition of Reliant on October 1, 2015, and the opening of Franklin, TN in December 2015.

7 Inpatient Rehabilitation Segment - Adjusted EBITDA* Q4 % of Revenue Q4 % of Revenue($millions) 2015 2014 Net operating revenues $ 725.9 $ 605.8 Less: Provision for doubtful accounts (13.3) 1.8% (6.5) 1.1% Net operating revenues less provision for doubtful accounts 712.6 599.3 Operating expenses: Salaries and benefits (359.8) 49.6% (294.9) 48.7% Other operating expenses(a) (103.2) 14.2% (89.7) 14.8% Supplies (32.3) 4.4% (29.8) 4.9% Occupancy costs (14.5) 2.0% (10.4) 1.7% (150.0) 20.7% (129.9) 21.4% Other income 1.3 1.1 Equity in nonconsolidated affiliates 2.3 1.9 Noncontrolling interests (16.5) (15.3) Segment Adjusted EBITDA $ 189.9 $ 162.2 Percent change 17.1% In arriving at Adjusted EBITDA, the following were excluded: (a) Loss on disposal or impairment of assets $ 2.5 $ 1.0 Segment Adjusted EBITDA* for the quarter of $189.9 million - Higher bad debt expense attributable to continued claims denials and adjudication delays - Approx. $1.3 million of incremental investments in the Company’s operating platform * Reconciliation to GAAP provided on page 32 - Salaries and benefits as a percent of revenue increased due to an approx. $4.5 million increase to group medical insurance reserves (Q4 2014 included approx. $1 million of favorable group medical adjustments)

8 Home Health and Hospice Segment - Revenue Q4 Q4 ($millions) 2015 2014 Net operating revenues: Home health revenue $ 144.4 $ 7.6 Hospice revenue 9.0 — Total segment revenue $ 153.4 $ 7.6 (Actual Amounts) Admissions 22,892 1,893 Episodes 42,697 2,092 Revenue per episode $ 3,005 $ 3,512 u Q4 2015 includes Encompass Home Health and Hospice, which was purchased on December 31, 2014, and HealthSouth’s legacy home health agencies; also includes CareSouth effective November 2, 2015 u Q4 2014 includes only HealthSouth’s legacy home health agencies. u Admissions and episodes were up significantly both in agencies Encompass owned prior to 2014 and those Encompass acquired in 2014 (see page 25). Ÿ In Q4 2015, for locations Encompass owned prior to 2014, admissions increased 18.6% and episodes increased 15.2%, both as compared to Q4 2014.* Historical information for Encompass Home Health and Hospice and HealthSouth’s legacy home health agencies can be found on page 25. * Includes volumes resulting from Encompass’ integration of HealthSouth legacy home health agencies that were relocated or merged into existing Encompass locations (i.e., market consolidations). Encompass is now the 4th largest provider of Medicare-certified skilled home health services.

9 Q4 % of Revenue Q4 % of Revenue($millions) 2015 2014 Net operating revenues $ 153.4 $ 7.6 Less: Provision for doubtful accounts (0.7) 0.5% (0.1) 1.3% Net operating revenues less provision for doubtful accounts 152.7 7.5 Operating expenses: Cost of services (73.0) 47.6% (4.5) 59.2% Support and overhead costs (51.0) 33.2% (1.8) 23.7% (124.0) 80.8% (6.3) 82.9% Equity in net income of nonconsolidated affiliates 0.1 — Noncontrolling interests (2.3) (0.1) Segment Adjusted EBITDA $ 26.5 $ 1.1 Home Health and Hospice Segment - Adjusted EBITDA* Segment Adjusted EBITDA* for Q4 2015 of $26.5 million benefited from the acquisitions of Encompass and CareSouth. Q4 2014 Adjusted EBITDA* represents HealthSouth’s legacy home health agencies. New home health and hospice locations: Ÿ Acquired CareSouth on November 2, 2015 * Reconciliation to GAAP provided on pages 29-31 * Reconciliation to GAAP provided on page 32
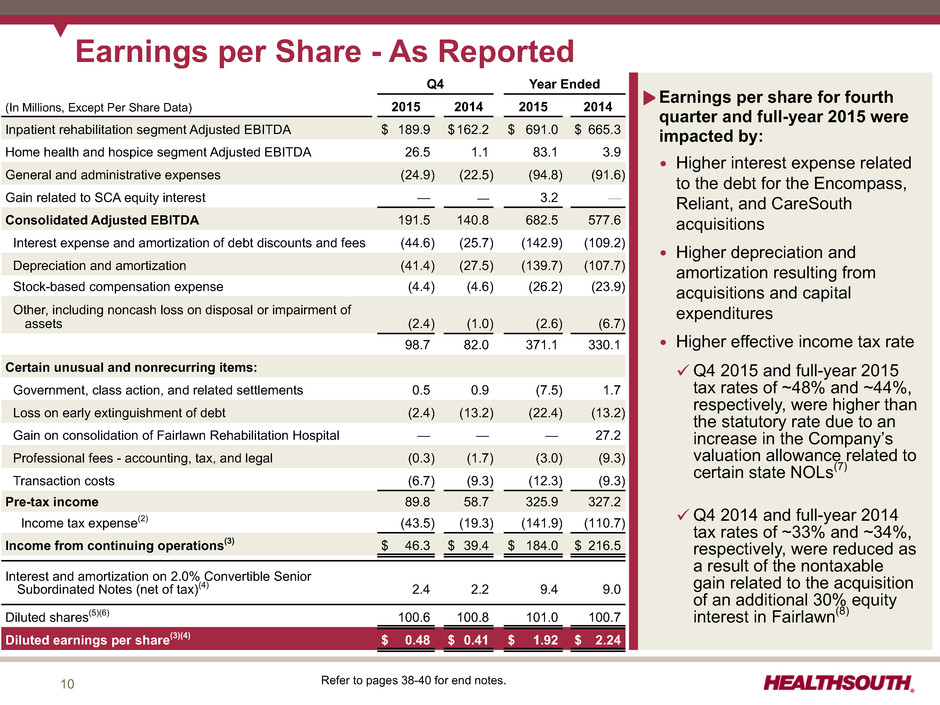
10 Earnings per Share - As Reported Q4 Year Ended (In Millions, Except Per Share Data) 2015 2014 2015 2014 Inpatient rehabilitation segment Adjusted EBITDA $ 189.9 $162.2 $ 691.0 $ 665.3 Home health and hospice segment Adjusted EBITDA 26.5 1.1 83.1 3.9 General and administrative expenses (24.9) (22.5) (94.8) (91.6) Gain related to SCA equity interest — — 3.2 — Consolidated Adjusted EBITDA 191.5 140.8 682.5 577.6 Interest expense and amortization of debt discounts and fees (44.6) (25.7) (142.9) (109.2) Depreciation and amortization (41.4) (27.5) (139.7) (107.7) Stock-based compensation expense (4.4) (4.6) (26.2) (23.9) Other, including noncash loss on disposal or impairment of assets (2.4) (1.0) (2.6) (6.7) 98.7 82.0 371.1 330.1 Certain unusual and nonrecurring items: Government, class action, and related settlements 0.5 0.9 (7.5) 1.7 Loss on early extinguishment of debt (2.4) (13.2) (22.4) (13.2) Gain on consolidation of Fairlawn Rehabilitation Hospital — — — 27.2 Professional fees - accounting, tax, and legal (0.3) (1.7) (3.0) (9.3) Transaction costs (6.7) (9.3) (12.3) (9.3) Pre-tax income 89.8 58.7 325.9 327.2 Income tax expense(2) (43.5) (19.3) (141.9) (110.7) Income from continuing operations(3) $ 46.3 $ 39.4 $ 184.0 $ 216.5 Interest and amortization on 2.0% Convertible Senior Subordinated Notes (net of tax)(4) 2.4 2.2 9.4 9.0 Diluted shares(5)(6) 100.6 100.8 101.0 100.7 Diluted earnings per share(3)(4) $ 0.48 $ 0.41 $ 1.92 $ 2.24 uEarnings per share for fourth quarter and full-year 2015 were impacted by: Ÿ Higher interest expense related to the debt for the Encompass, Reliant, and CareSouth acquisitions Ÿ Higher depreciation and amortization resulting from acquisitions and capital expenditures Ÿ Higher effective income tax rate ü Q4 2015 and full-year 2015 tax rates of ~48% and ~44%, respectively, were higher than the statutory rate due to an increase in the Company’s valuation allowance related to certain state NOLs(7) ü Q4 2014 and full-year 2014 tax rates of ~33% and ~34%, respectively, were reduced as a result of the nontaxable gain related to the acquisition of an additional 30% equity interest in Fairlawn(8) Refer to pages 38-40 for end notes.
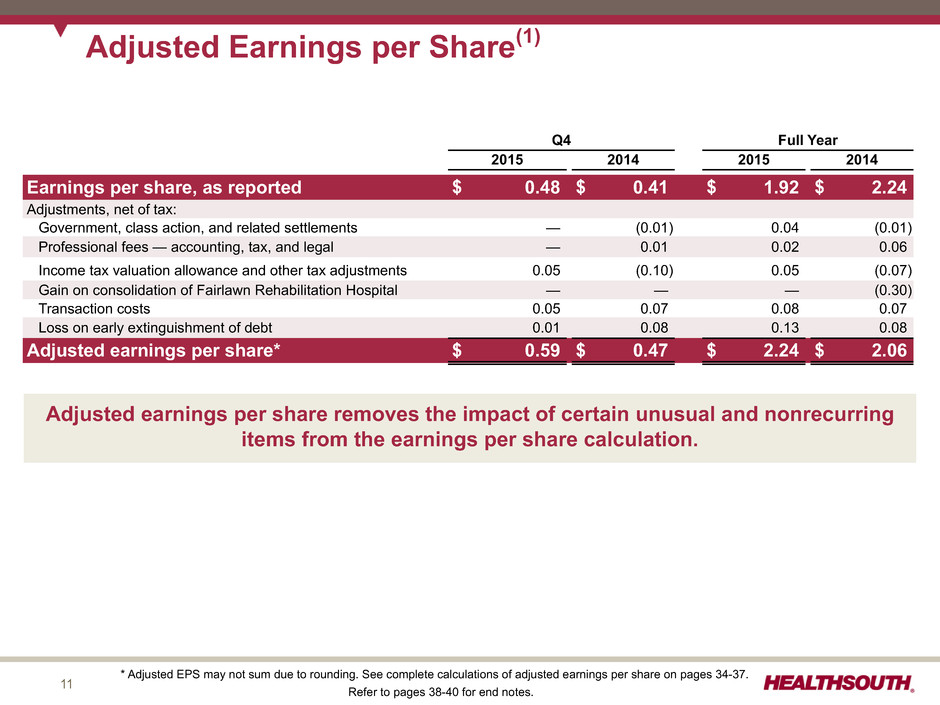
11 Q4 Full Year 2015 2014 2015 2014 Earnings per share, as reported $ 0.48 $ 0.41 $ 1.92 $ 2.24 Adjustments, net of tax: Government, class action, and related settlements — (0.01) 0.04 (0.01) Professional fees — accounting, tax, and legal — 0.01 0.02 0.06 Income tax valuation allowance and other tax adjustments 0.05 (0.10) 0.05 (0.07) Gain on consolidation of Fairlawn Rehabilitation Hospital — — — (0.30) Transaction costs 0.05 0.07 0.08 0.07 Loss on early extinguishment of debt 0.01 0.08 0.13 0.08 Adjusted earnings per share* $ 0.59 $ 0.47 $ 2.24 $ 2.06 Adjusted Earnings per Share(1) * Adjusted EPS may not sum due to rounding. See complete calculations of adjusted earnings per share on pages 34-37. Refer to pages 38-40 for end notes. Adjusted earnings per share removes the impact of certain unusual and nonrecurring items from the earnings per share calculation.

12 Adjusted Free Cash Flow 12 Mos. 2014 Adjusted EBITDA Cash Interest Expense Cash Tax Payments, Net of Refunds Working Capital and Other Maintenance Capital Expenditures Preferred Dividends Adjusted Free Cash Flow 12 Mos. 2015 $311.3 $104.9 ($32.1) $7.0 ($14.2) $8.9 $3.2 $389.0 2015 Adjusted Free Cash Flow*(9) * Reconciliation to GAAP provided on page 33 Refer to pages 38-40 for end notes. u Adjusted free cash flow grew 25.0% primarily as a result of increased Adjusted EBITDA. u Cash interest expense increased due to the debt associated with the Encompass, Reliant, and CareSouth acquisitions. u The increase in working capital was mainly attributable to growth in accounts receivable due to additional claims denials and continued delays at the administrative law judge hearing level.

13 $682.5 million $2.24 Adjusted EBITDA Adjusted Earnings per Share from Continuing Operations Attributable to HealthSouth(1) Guidance $3,162.9 million Net Operating Revenues 2015 2016 Net Operating Revenues $3,550 million to $3,650 million Adjusted EBITDA $765 million to $785 million Adjusted Earnings per Share from Continuing Operations Attributable to HealthSouth(1) $2.32 to $2.44 12% to 15% Projected Year-Over- Year Growth 12% to 15% 3% to 9% Earnings per share guidance assumes a diluted share count of ~101 million shares and an approximate 41% tax rate. Refer to pages 38-40 for end notes. Represents a $0.04 per share increase from initial guidance presented on January 11, 2016 due primarily to updated depreciation and amortization expense estimates resulting from purchase accounting adjustments related to the acquisitions of Reliant and CareSouth
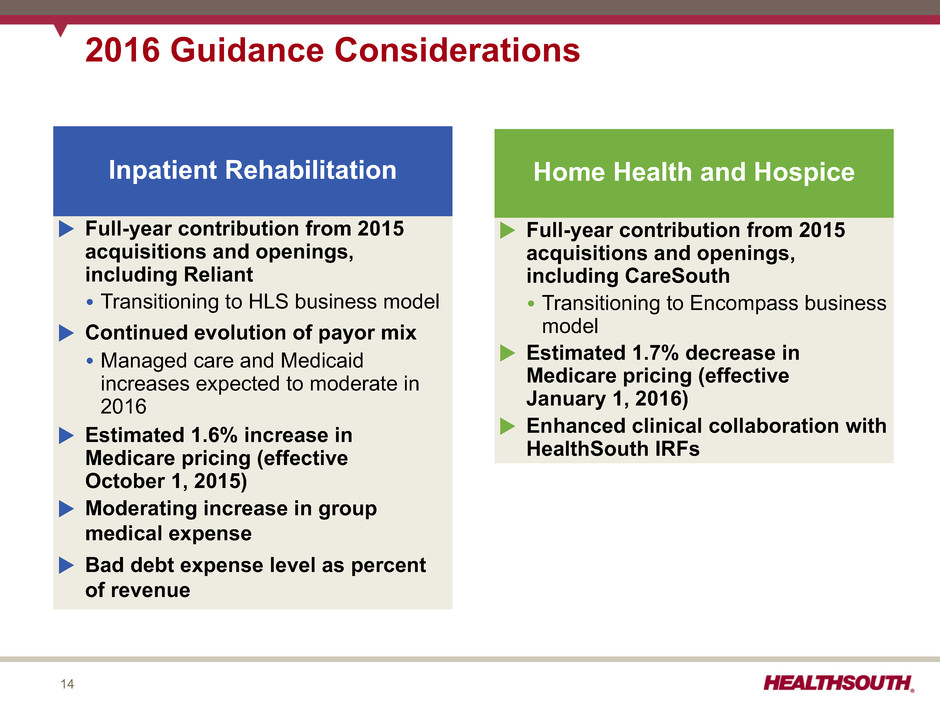
14 Inpatient Rehabilitation u Full-year contribution from 2015 acquisitions and openings, including Reliant Ÿ Transitioning to HLS business model u Continued evolution of payor mix Ÿ Managed care and Medicaid increases expected to moderate in 2016 u Estimated 1.6% increase in Medicare pricing (effective October 1, 2015) u Moderating increase in group medical expense u Bad debt expense level as percent of revenue 2016 Guidance Considerations Home Health and Hospice u Full-year contribution from 2015 acquisitions and openings, including CareSouth Ÿ Transitioning to Encompass business model u Estimated 1.7% decrease in Medicare pricing (effective January 1, 2016) u Enhanced clinical collaboration with HealthSouth IRFs

Appendix
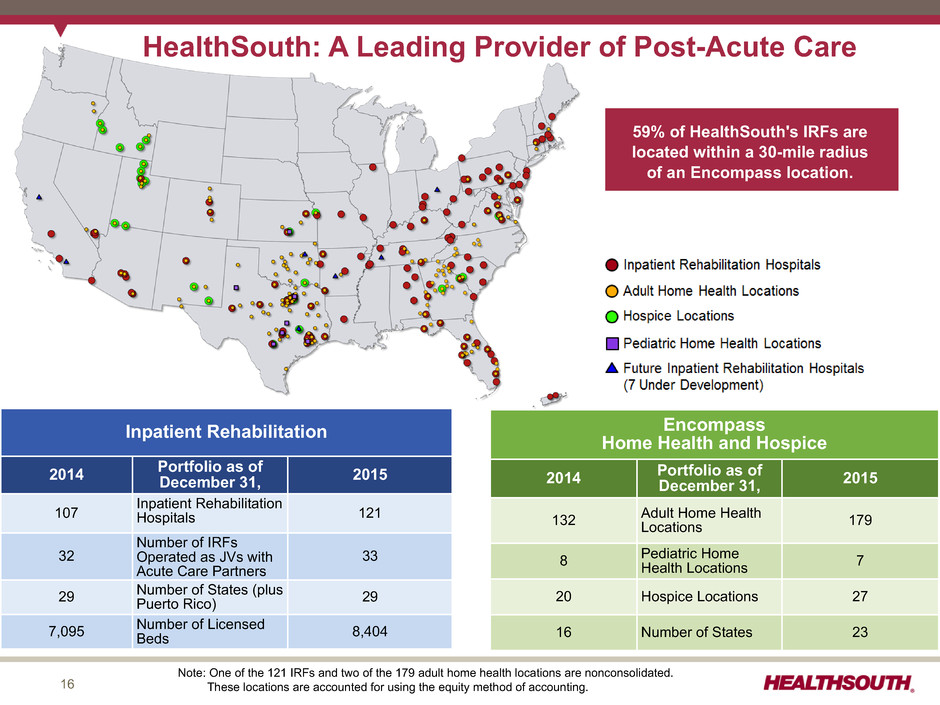
16 HealthSouth: A Leading Provider of Post-Acute Care 59% of HealthSouth's IRFs are located within a 30-mile radius of an Encompass location. Note: One of the 121 IRFs and two of the 179 adult home health locations are nonconsolidated. These locations are accounted for using the equity method of accounting. Inpatient Rehabilitation 2014 Portfolio as ofDecember 31, 2015 107 Inpatient RehabilitationHospitals 121 32 Number of IRFs Operated as JVs with Acute Care Partners 33 29 Number of States (plusPuerto Rico) 29 7,095 Number of LicensedBeds 8,404 Encompass Home Health and Hospice 2014 Portfolio as ofDecember 31, 2015 132 Adult Home HealthLocations 179 8 Pediatric HomeHealth Locations 7 20 Hospice Locations 27 16 Number of States 23

17 Expansion Activity Inpatient Rehabilitation Facilities # of New Beds 2015 2016 2017 Acquisitions: Reliant 902 – – Cardinal Hill 232 – – De Novo: Franklin, TN 40 – – Modesto, CA – 50 – Joint Ventures: Savannah, GA 50 – – Hot Springs, AR — 40 – Broken Arrow, OK — — 40 Bryan, TX — 49 — Westerfield, OH – – 60 Jackson, TN – – 48 Bed Expansions, net* 85 110 100 1,309 249 248 18% Increase over 2014 Home Health and Hospice # of locations December 31, 2014 160 Acquisitions 59 De Novo 7 Merged / Closed Locations (13) December 31, 2015 213 33% Increase over 2014 * Net bed expansions in 2016 and 2017 may change due to the timing of certain regulatory approvals and/or construction delays.
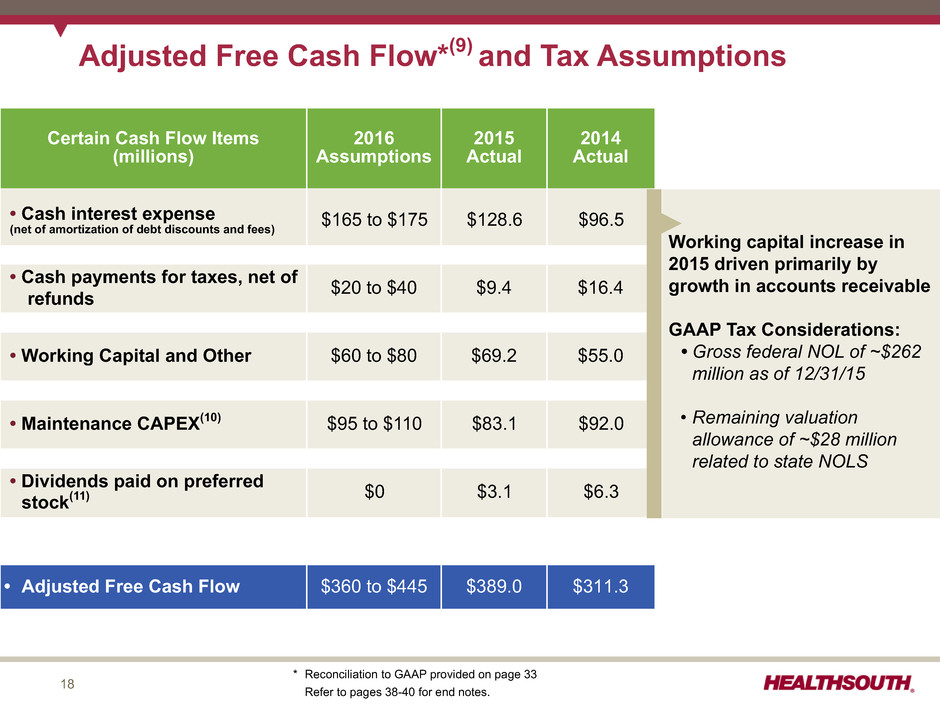
18 Adjusted Free Cash Flow*(9) and Tax Assumptions Certain Cash Flow Items (millions) 2016 Assumptions 2015 Actual 2014 Actual • Cash interest expense (net of amortization of debt discounts and fees) $165 to $175 $128.6 $96.5 • Cash payments for taxes, net of refunds $20 to $40 $9.4 $16.4 • Working Capital and Other $60 to $80 $69.2 $55.0 • Maintenance CAPEX(10) $95 to $110 $83.1 $92.0 • Dividends paid on preferred stock(11) $0 $3.1 $6.3 • Adjusted Free Cash Flow $360 to $445 $389.0 $311.3 Working capital increase in 2015 driven primarily by growth in accounts receivable GAAP Tax Considerations: • Gross federal NOL of ~$262 million as of 12/31/15 • Remaining valuation allowance of ~$28 million related to state NOLS * Reconciliation to GAAP provided on page 33 Refer to pages 38-40 for end notes.
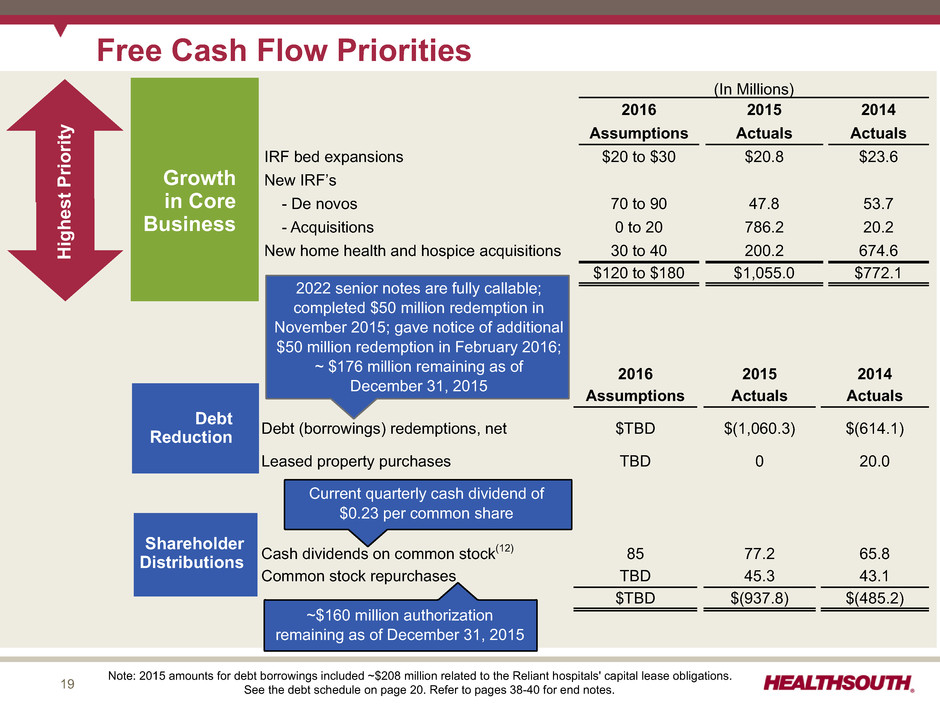
19 Free Cash Flow Priorities (In Millions) 2016 2015 2014 Assumptions Actuals Actuals IRF bed expansions $20 to $30 $20.8 $23.6 New IRF’s - De novos 70 to 90 47.8 53.7 - Acquisitions 0 to 20 786.2 20.2 New home health and hospice acquisitions 30 to 40 200.2 674.6 $120 to $180 $1,055.0 $772.1 2016 2015 2014 Assumptions Actuals Actuals Debt (borrowings) redemptions, net $TBD $(1,060.3) $(614.1) Leased property purchases TBD 0 20.0 Cash dividends on common stock(12) 85 77.2 65.8 Common stock repurchases TBD 45.3 43.1 $TBD $(937.8) $(485.2) Shareholder Distributions Growth in Core Business Debt Reduction Highest Priorit y 2022 senior notes are fully callable; completed $50 million redemption in November 2015; gave notice of additional $50 million redemption in February 2016; ~ $176 million remaining as of December 31, 2015 Current quarterly cash dividend of $0.23 per common share ~$160 million authorization remaining as of December 31, 2015 Note: 2015 amounts for debt borrowings included ~$208 million related to the Reliant hospitals' capital lease obligations. See the debt schedule on page 20. Refer to pages 38-40 for end notes.
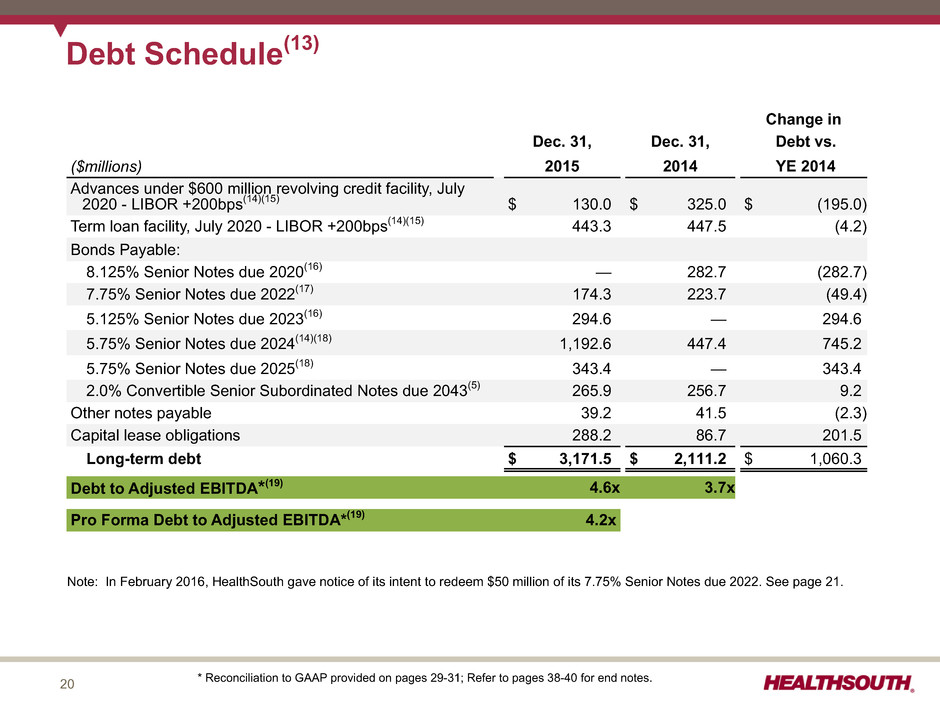
20 Debt Schedule(13) Change in Dec. 31, Dec. 31, Debt vs. ($millions) 2015 2014 YE 2014 Advances under $600 million revolving credit facility, July 2020 - LIBOR +200bps(14)(15) $ 130.0 $ 325.0 $ (195.0) Term loan facility, July 2020 - LIBOR +200bps(14)(15) 443.3 447.5 (4.2) Bonds Payable: 8.125% Senior Notes due 2020(16) — 282.7 (282.7) 7.75% Senior Notes due 2022(17) 174.3 223.7 (49.4) 5.125% Senior Notes due 2023(16) 294.6 — 294.6 5.75% Senior Notes due 2024(14)(18) 1,192.6 447.4 745.2 5.75% Senior Notes due 2025(18) 343.4 — 343.4 2.0% Convertible Senior Subordinated Notes due 2043(5) 265.9 256.7 9.2 Other notes payable 39.2 41.5 (2.3) Capital lease obligations 288.2 86.7 201.5 Long-term debt $ 3,171.5 $ 2,111.2 $ 1,060.3 Debt to Adjusted EBITDA*(19) 4.6x 3.7x Pro Forma Debt to Adjusted EBITDA*(19) 4.2x * Reconciliation to GAAP provided on pages 29-31; Refer to pages 38-40 for end notes. Note: In February 2016, HealthSouth gave notice of its intent to redeem $50 million of its 7.75% Senior Notes due 2022. See page 21.
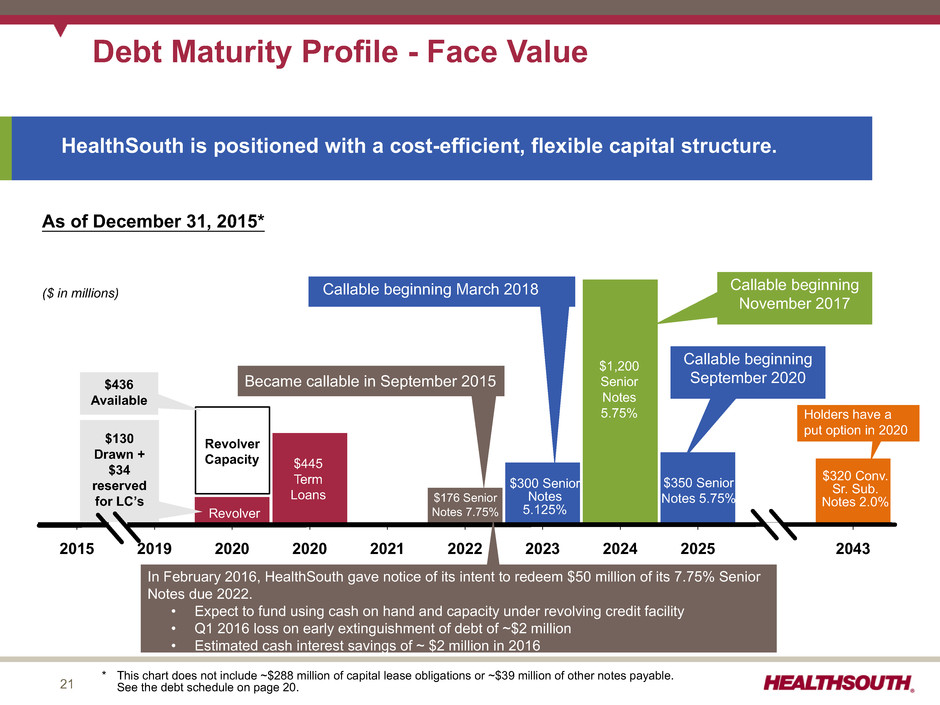
21 2015 2019 2020 2020 2021 2022 2023 2024 2025 2043 $350 Senior Notes 5.75% $1,200 Senior Notes 5.75% $320 Conv. Sr. Sub. Notes 2.0% $300 Senior Notes 5.125% $130 Drawn + $34 reserved for LC’s Holders have a put option in 2020 As of December 31, 2015* Debt Maturity Profile - Face Value ($ in millions) $436 Available $176 Senior Notes 7.75% Callable beginning November 2017 HealthSouth is positioned with a cost-efficient, flexible capital structure. Callable beginning March 2018 Revolver Revolver Capacity $445 Term Loans Became callable in September 2015 Callable beginning September 2020 * This chart does not include ~$288 million of capital lease obligations or ~$39 million of other notes payable. See the debt schedule on page 20. In February 2016, HealthSouth gave notice of its intent to redeem $50 million of its 7.75% Senior Notes due 2022. • Expect to fund using cash on hand and capacity under revolving credit facility • Q1 2016 loss on early extinguishment of debt of ~$2 million • Estimated cash interest savings of ~ $2 million in 2016

22 25.0 20.0 15.0 10.0 5.0 0.0 Q1 2012 Q2 2012 Q3 2012 Q4 2012 Q1 2013 Q2 2013 Q3 2013 Q4 2013 Q1 2014 Q2 2014 Q3 2014 Q4 2014 Q1 2015 Q2 2015 Q3 2015 Q4 2015 New-Store/Same-Store IRF Growth Q1 2012 Q2 2012 Q3 2012 Q4 2012 Q1 2013 Q2 2013 Q3 2013 Q4 2013 Q1 201 Q2 201 Q3 201 Q4 201 Q1 2015 Q2 2015 Q3 201 Q4 201 Fairlawn(8) 0.6% 1.9% 1.9% 2.0% 1.1% St. Vincent’s(20) 1.3% 1.2% 1.2% 1.3% New Store 1.0% 1.1% 1.2% 1.2% 0.7% 1.7% 2.5% 2.5% 2.0% 1.0% —% 0.6% 1.8% 4.4% 5.7% 15.6% Same Store 5.0% 1.9% 1.7% 3.0% 2.2% 3.3% 3.2% 1.3% 0.4% 1.4% 1.9% 2.2% 2.9% 2.8% 3.9% 3.0% Total by Qtr. 6.0% 3.0% 4.2% 5.4% 4.1% 6.3% 5.7% 3.8% 2.4% 3.0% 3.8% 4.7% 6.7% 8.3% 9.6% 18.6% Total by Year 4.6% 5.0% 3.5% 10.9% Same-Store Year(21) 2.9% 2.5% 1.3% 3.2% Same-Store Year UDS(22) —% (0.7)% (0.2)% 1.3% Altamonte Springs, FL (50 beds) Johnson City, TN (26 beds) Newnan, GA (50 beds) Middletown, DE (34 beds) Ocala, FL (40 beds) Augusta, GA (58 beds) Littleton, CO (40 beds) Stuart, FL (34 beds) Refer to page 38-40 for end notes. Reliant (857 beds) Franklin, TN (40 beds) Lexington, KY (158 beds) Savannah, GA (50 beds)
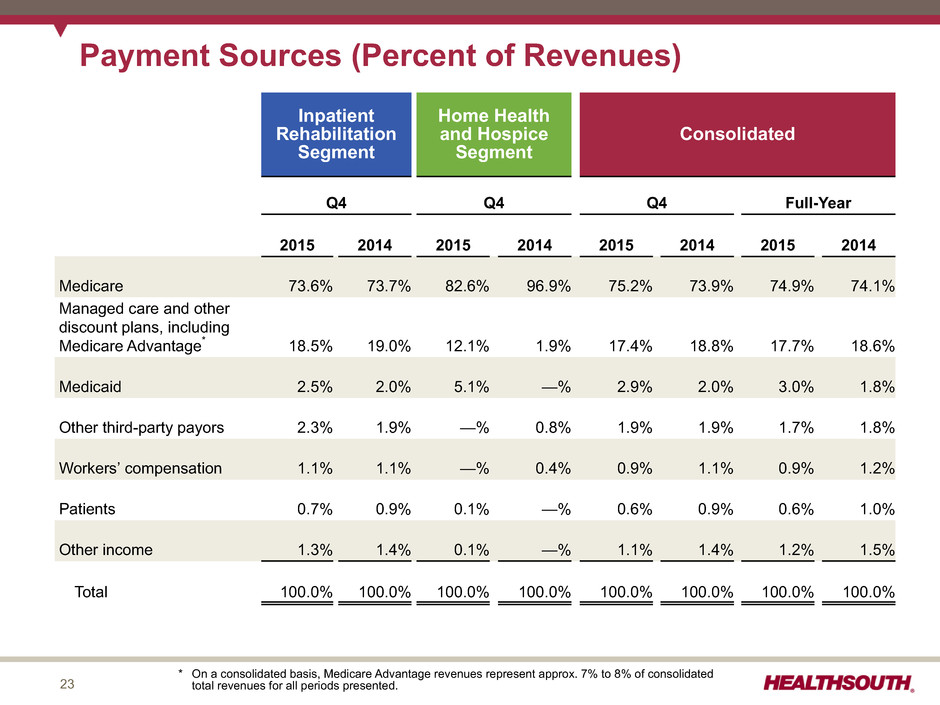
23 Payment Sources (Percent of Revenues) Inpatient Rehabilitation Segment Home Health and Hospice Segment Consolidated Q4 Q4 Q4 Full-Year 2015 2014 2015 2014 2015 2014 2015 2014 Medicare 73.6% 73.7% 82.6% 96.9% 75.2% 73.9% 74.9% 74.1% Managed care and other discount plans, including Medicare Advantage* 18.5% 19.0% 12.1% 1.9% 17.4% 18.8% 17.7% 18.6% Medicaid 2.5% 2.0% 5.1% —% 2.9% 2.0% 3.0% 1.8% Other third-party payors 2.3% 1.9% —% 0.8% 1.9% 1.9% 1.7% 1.8% Workers’ compensation 1.1% 1.1% —% 0.4% 0.9% 1.1% 0.9% 1.2% Patients 0.7% 0.9% 0.1% —% 0.6% 0.9% 0.6% 1.0% Other income 1.3% 1.4% 0.1% —% 1.1% 1.4% 1.2% 1.5% Total 100.0% 100.0% 100.0% 100.0% 100.0% 100.0% 100.0% 100.0% * On a consolidated basis, Medicare Advantage revenues represent approx. 7% to 8% of consolidated total revenues for all periods presented.
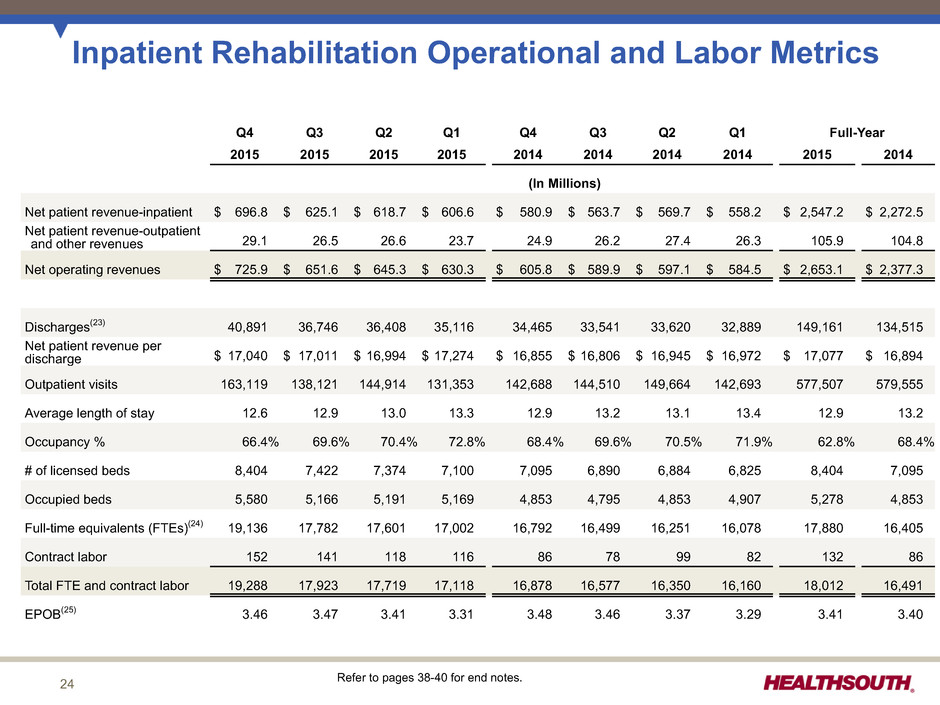
24 Inpatient Rehabilitation Operational and Labor Metrics Q4 Q3 Q2 Q1 Q4 Q3 Q2 Q1 Full-Year 2015 2015 2015 2015 2014 2014 2014 2014 2015 2014 (In Millions) Net patient revenue-inpatient $ 696.8 $ 625.1 $ 618.7 $ 606.6 $ 580.9 $ 563.7 $ 569.7 $ 558.2 $ 2,547.2 $ 2,272.5 Net patient revenue-outpatient and other revenues 29.1 26.5 26.6 23.7 24.9 26.2 27.4 26.3 105.9 104.8 Net operating revenues $ 725.9 $ 651.6 $ 645.3 $ 630.3 $ 605.8 $ 589.9 $ 597.1 $ 584.5 $ 2,653.1 $ 2,377.3 Discharges(23) 40,891 36,746 36,408 35,116 34,465 33,541 33,620 32,889 149,161 134,515 Net patient revenue per discharge $ 17,040 $ 17,011 $ 16,994 $ 17,274 $ 16,855 $ 16,806 $ 16,945 $ 16,972 $ 17,077 $ 16,894 Outpatient visits 163,119 138,121 144,914 131,353 142,688 144,510 149,664 142,693 577,507 579,555 Average length of stay 12.6 12.9 13.0 13.3 12.9 13.2 13.1 13.4 12.9 13.2 Occupancy % 66.4% 69.6% 70.4% 72.8% 68.4% 69.6% 70.5% 71.9% 62.8% 68.4% # of licensed beds 8,404 7,422 7,374 7,100 7,095 6,890 6,884 6,825 8,404 7,095 Occupied beds 5,580 5,166 5,191 5,169 4,853 4,795 4,853 4,907 5,278 4,853 Full-time equivalents (FTEs)(24) 19,136 17,782 17,601 17,002 16,792 16,499 16,251 16,078 17,880 16,405 Contract labor 152 141 118 116 86 78 99 82 132 86 Total FTE and contract labor 19,288 17,923 17,719 17,118 16,878 16,577 16,350 16,160 18,012 16,491 EPOB(25) 3.46 3.47 3.41 3.31 3.48 3.46 3.37 3.29 3.41 3.40 Refer to pages 38-40 for end notes.

25 Home Health and Hospice Operational Metrics Home Health and Hospice Segment Encompass Home Health and Hospice HealthSouth’s 25 Legacy Home HealthAgencies Q4 Q3 Q2 Q1 Full-Year Q4 Q3 Q2 Q1 Full- Year Q4 Q3 Q2 Q1 Full- Year 2015 2015 2015 2015 2015 2014 2014 2014 2014 2014 2014 2014 2014 2014 2014 (In Millions) Net home health revenue $ 144.4 $ 118.3 $ 111.5 $ 103.9 $ 478.1 $ 95.2 $ 89.5 $ 85.1 $ 77.6 $ 347.4 $ 7.6 $ 7.0 $ 7.3 $ 6.7 $ 28.6 Net hospice and other revenue 9.0 8.7 7.6 6.4 31.7 6.1 5.6 5.2 4.6 21.5 — — — — — Net operating revenues $ 153.4 $ 127.0 $ 119.1 $ 110.3 $ 509.8 $ 101.3 $ 95.1 $ 90.3 $ 82.2 $ 368.9 $ 7.6 $ 7.0 $ 7.3 $ 6.7 $ 28.6 Home Health: (Actual Amounts) Admissions(26) 22,892 18,076 16,862 16,499 74,329 13,125 12,505 11,870 11,532 49,032 1,893 1,839 1,913 1,900 7,545 Recertifications 18,909 16,542 15,103 14,485 65,039 14,256 13,479 12,461 11,365 51,561 304 247 242 237 1,030 Episodes 42,697 33,542 31,817 29,512 137,568 27,449 25,673 23,966 21,826 98,914 2,092 2,012 2,097 2,035 8,236 Average revenue per episode $ 3,005 $ 3,123 $ 3,082 $ 3,102 $ 3,072 $ 3,034 $ 3,020 $ 3,080 $ 3,066 $ 3,049 $ 3,512 $ 3,373 $ 3,387 $ 3,178 $ 3,364 Episodic visits per episode 18.2 19.6 19.4 19.6 19.1 19.3 19.6 20.1 20.4 19.8 19.2 18.8 18.4 18.7 18.8 Total visits 862,224 721,055 675,095 630,999 2,889,373 578,158 547,862 523,751 481,956 2,131,727 41,379 38,940 39,876 39,477 159,672 Cost per visit $ 73 $ 72 $ 71 $ 71 $ 72 $ 69 $ 67 $ 64 $ 65 $ 67 $ 110 $ 105 $ 106 $ 108 $ 108 Hospice: Admissions(27) 614 620 594 624 2,452 502 416 403 374 1,695 N/A N/A N/A N/A N/A Patient days 59,100 55,627 49,272 40,898 204,898 37,353 36,973 34,336 32,773 141,435 N/A N/A N/A N/A N/A Revenue per day $ 155 $ 156 $ 154 $ 156 $ 155 $ 162 $ 153 $ 151 $ 142 $ 152 N/A N/A N/A N/A N/A Refer to pages 38-40 for end notes.
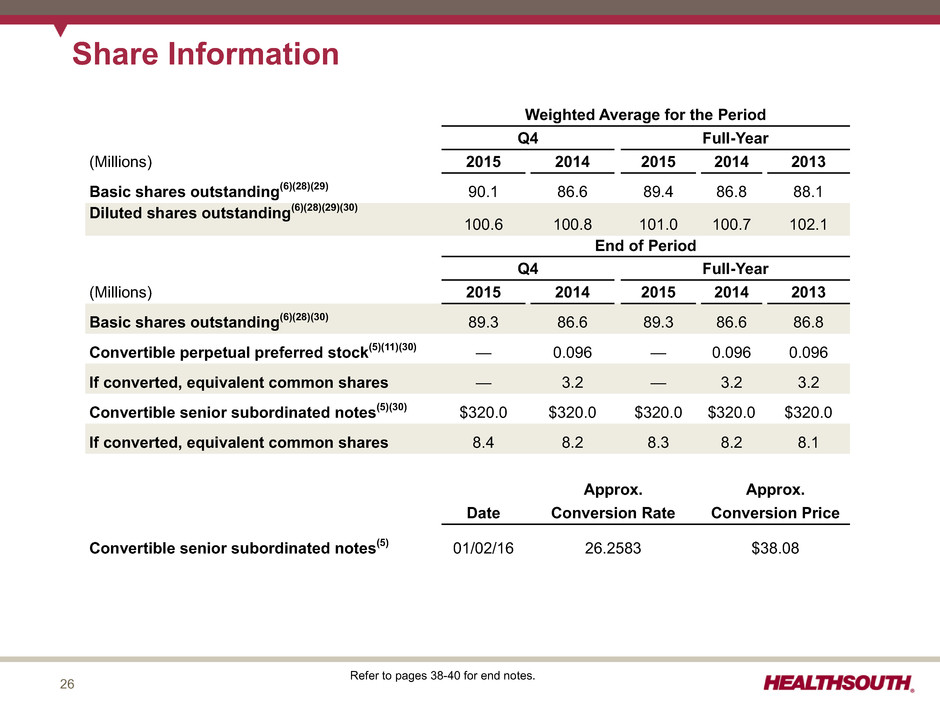
26 Share Information Weighted Average for the Period Q4 Full-Year (Millions) 2015 2014 2015 2014 2013 Basic shares outstanding(6)(28)(29) 90.1 86.6 89.4 86.8 88.1 Diluted shares outstanding(6)(28)(29)(30) 100.6 100.8 101.0 100.7 102.1 End of Period Q4 Full-Year (Millions) 2015 2014 2015 2014 2013 Basic shares outstanding(6)(28)(30) 89.3 86.6 89.3 86.6 86.8 Convertible perpetual preferred stock(5)(11)(30) — 0.096 — 0.096 0.096 If converted, equivalent common shares — 3.2 — 3.2 3.2 Convertible senior subordinated notes(5)(30) $320.0 $320.0 $320.0 $320.0 $320.0 If converted, equivalent common shares 8.4 8.2 8.3 8.2 8.1 Approx. Approx. Date Conversion Rate Conversion Price Convertible senior subordinated notes(5) 01/02/16 26.2583 $38.08 Refer to pages 38-40 for end notes.

27 History Recast by Segment Three Months Ended December 31, 2015 Three Months Ended December 31, 2014 Inpatient Rehabili- tation Home Health and Hospice Reclass- ifications HealthSouth Consolidated Inpatient Rehabili- tation Home Health and Hospice Reclass- ifications HealthSouth Consolidated Net operating revenues $ 725.9 $ 153.4 $ — $ 879.3 $ 605.8 $ 7.6 $ — $ 613.4 Less: Provision for doubtful accounts (13.3) (0.7) — (14.0) (6.5) (0.1) — (6.6) 712.6 152.7 — 865.3 599.3 7.5 — 606.8 Operating Expenses: Inpatient Rehabilitation: Salaries and benefits (359.8) — (107.0) (466.8) (294.9) — (5.4) (300.3) Other operating expenses(a) (103.2) — (12.4) (115.6) (89.7) — (0.7) (90.4) Supplies (32.3) — (2.3) (34.6) (29.8) — (0.1) (29.9) Occupancy (14.5) — (2.3) (16.8) (10.4) — (0.1) (10.5) Home Health and Hospice: Cost of services sold (excluding depreciation and amortization) — (73.0) 73.0 — — (4.5) 4.5 — Support and overhead costs — (51.0) 51.0 — — (1.8) 1.8 — (509.8) (124.0) — (633.8) (424.8) (6.3) — (431.1) Other income 1.3 — — 1.3 1.1 — — 1.1 Equity in net income of nonconsolidated affiliates 2.3 0.1 — 2.4 1.9 — — 1.9 Noncontrolling interest (16.5) (2.3) — (18.8) (15.3) (0.1) — (15.4) Segment Adjusted EBITDA $ 189.9 $ 26.5 $ — 216.4 $ 162.2 $ 1.1 $ — 163.3 General and administrative expenses(b)(c) (24.9) (22.5) Gain related to SCA equity interest — — Adjusted EBITDA $ 191.5 $ 140.8 Reconciliation to GAAP provided on pages 29-32 In arriving at Adjusted EBITDA, the following were excluded: (a) Loss (gain) on disposal or impairment of assets $ 2.5 $ (0.1) $ — $ 2.4 $ 1.0 $ — $ — $ 1.0 (b) Transaction costs — — — 6.7 — — — 9.3 (c) Stock-based compensation expense — — — 4.4 — — — 4.6
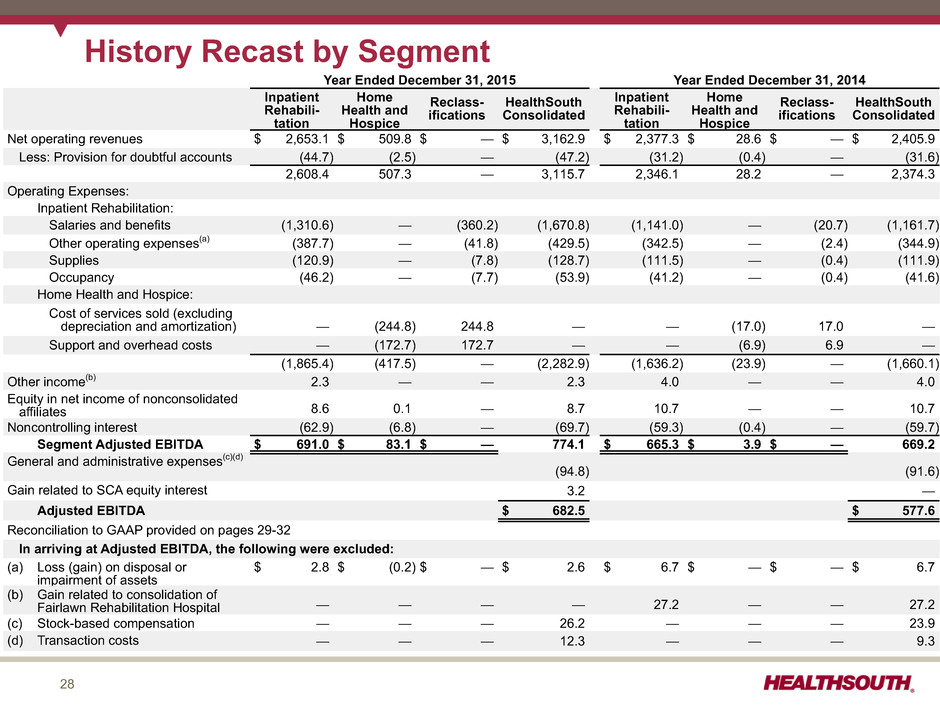
28 History Recast by Segment Year Ended December 31, 2015 Year Ended December 31, 2014 Inpatient Rehabili- tation Home Health and Hospice Reclass- ifications HealthSouth Consolidated Inpatient Rehabili- tation Home Health and Hospice Reclass- ifications HealthSouth Consolidated Net operating revenues $ 2,653.1 $ 509.8 $ — $ 3,162.9 $ 2,377.3 $ 28.6 $ — $ 2,405.9 Less: Provision for doubtful accounts (44.7) (2.5) — (47.2) (31.2) (0.4) — (31.6) 2,608.4 507.3 — 3,115.7 2,346.1 28.2 — 2,374.3 Operating Expenses: Inpatient Rehabilitation: Salaries and benefits (1,310.6) — (360.2) (1,670.8) (1,141.0) — (20.7) (1,161.7) Other operating expenses(a) (387.7) — (41.8) (429.5) (342.5) — (2.4) (344.9) Supplies (120.9) — (7.8) (128.7) (111.5) — (0.4) (111.9) Occupancy (46.2) — (7.7) (53.9) (41.2) — (0.4) (41.6) Home Health and Hospice: Cost of services sold (excluding depreciation and amortization) — (244.8) 244.8 — — (17.0) 17.0 — Support and overhead costs — (172.7) 172.7 — — (6.9) 6.9 — (1,865.4) (417.5) — (2,282.9) (1,636.2) (23.9) — (1,660.1) Other income(b) 2.3 — — 2.3 4.0 — — 4.0 Equity in net income of nonconsolidated affiliates 8.6 0.1 — 8.7 10.7 — — 10.7 Noncontrolling interest (62.9) (6.8) — (69.7) (59.3) (0.4) — (59.7) Segment Adjusted EBITDA $ 691.0 $ 83.1 $ — 774.1 $ 665.3 $ 3.9 $ — 669.2 General and administrative expenses(c)(d) (94.8) (91.6) Gain related to SCA equity interest 3.2 — Adjusted EBITDA $ 682.5 $ 577.6 Reconciliation to GAAP provided on pages 29-32 In arriving at Adjusted EBITDA, the following were excluded: (a) Loss (gain) on disposal or impairment of assets $ 2.8 $ (0.2) $ — $ 2.6 $ 6.7 $ — $ — $ 6.7 (b) Gain related to consolidation of Fairlawn Rehabilitation Hospital — — — — 27.2 — — 27.2 (c) Stock-based compensation — — — 26.2 — — — 23.9 (d) Transaction costs — — — 12.3 — — — 9.3
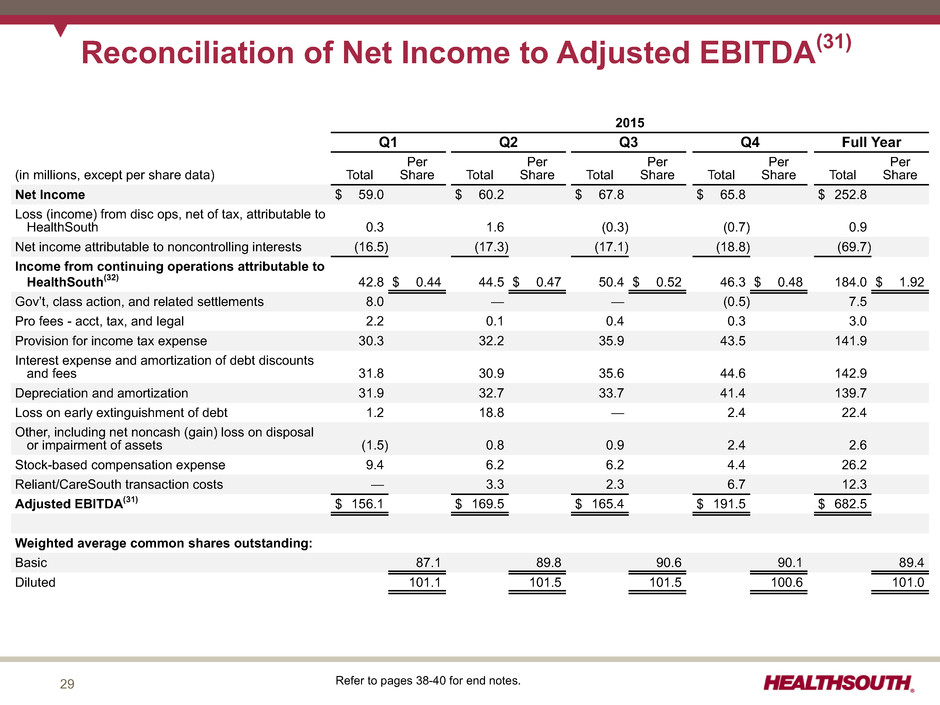
29 Reconciliation of Net Income to Adjusted EBITDA(31) 2015 Q1 Q2 Q3 Q4 Full Year (in millions, except per share data) Total Per Share Total Per Share Total Per Share Total Per Share Total Per Share Net Income $ 59.0 $ 60.2 $ 67.8 $ 65.8 $ 252.8 Loss (income) from disc ops, net of tax, attributable to HealthSouth 0.3 1.6 (0.3) (0.7) 0.9 Net income attributable to noncontrolling interests (16.5) (17.3) (17.1) (18.8) (69.7) Income from continuing operations attributable to HealthSouth(32) 42.8 $ 0.44 44.5 $ 0.47 50.4 $ 0.52 46.3 $ 0.48 184.0 $ 1.92 Gov’t, class action, and related settlements 8.0 — — (0.5) 7.5 Pro fees - acct, tax, and legal 2.2 0.1 0.4 0.3 3.0 Provision for income tax expense 30.3 32.2 35.9 43.5 141.9 Interest expense and amortization of debt discounts and fees 31.8 30.9 35.6 44.6 142.9 Depreciation and amortization 31.9 32.7 33.7 41.4 139.7 Loss on early extinguishment of debt 1.2 18.8 — 2.4 22.4 Other, including net noncash (gain) loss on disposal or impairment of assets (1.5) 0.8 0.9 2.4 2.6 Stock-based compensation expense 9.4 6.2 6.2 4.4 26.2 Reliant/CareSouth transaction costs — 3.3 2.3 6.7 12.3 Adjusted EBITDA(31) $ 156.1 $ 169.5 $ 165.4 $ 191.5 $ 682.5 Weighted average common shares outstanding: Basic 87.1 89.8 90.6 90.1 89.4 Diluted 101.1 101.5 101.5 100.6 101.0 Refer to pages 38-40 for end notes.
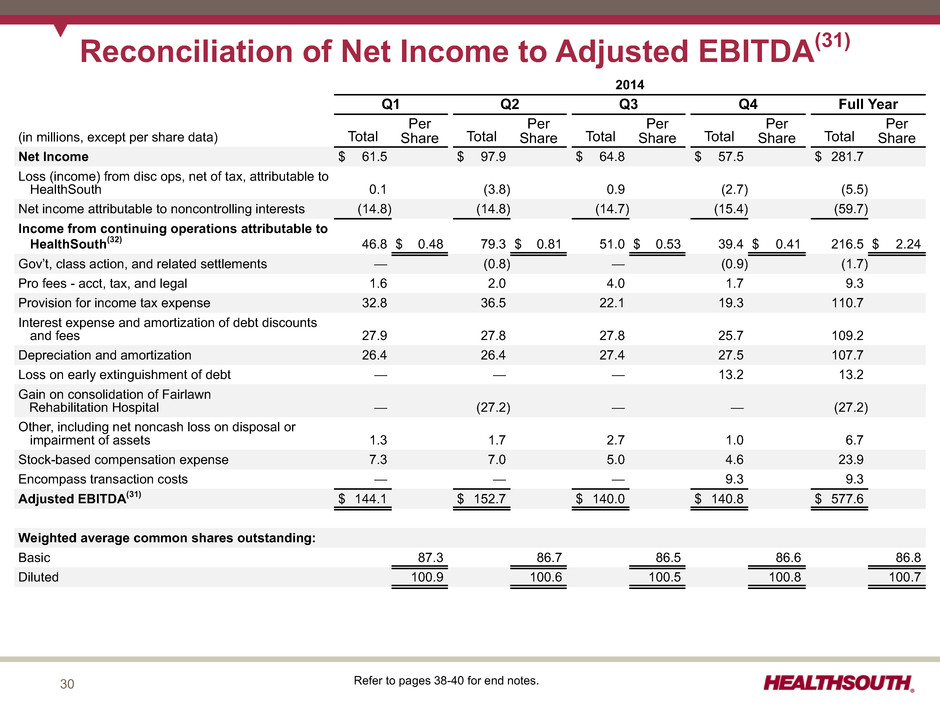
30 Reconciliation of Net Income to Adjusted EBITDA(31) 2014 Q1 Q2 Q3 Q4 Full Year (in millions, except per share data) Total Per Share Total Per Share Total Per Share Total Per Share Total Per Share Net Income $ 61.5 $ 97.9 $ 64.8 $ 57.5 $ 281.7 Loss (income) from disc ops, net of tax, attributable to HealthSouth 0.1 (3.8) 0.9 (2.7) (5.5) Net income attributable to noncontrolling interests (14.8) (14.8) (14.7) (15.4) (59.7) Income from continuing operations attributable to HealthSouth(32) 46.8 $ 0.48 79.3 $ 0.81 51.0 $ 0.53 39.4 $ 0.41 216.5 $ 2.24 Gov’t, class action, and related settlements — (0.8) — (0.9) (1.7) Pro fees - acct, tax, and legal 1.6 2.0 4.0 1.7 9.3 Provision for income tax expense 32.8 36.5 22.1 19.3 110.7 Interest expense and amortization of debt discounts and fees 27.9 27.8 27.8 25.7 109.2 Depreciation and amortization 26.4 26.4 27.4 27.5 107.7 Loss on early extinguishment of debt — — — 13.2 13.2 Gain on consolidation of Fairlawn Rehabilitation Hospital — (27.2) — — (27.2) Other, including net noncash loss on disposal or impairment of assets 1.3 1.7 2.7 1.0 6.7 Stock-based compensation expense 7.3 7.0 5.0 4.6 23.9 Encompass transaction costs — — — 9.3 9.3 Adjusted EBITDA(31) $ 144.1 $ 152.7 $ 140.0 $ 140.8 $ 577.6 Weighted average common shares outstanding: Basic 87.3 86.7 86.5 86.6 86.8 Diluted 100.9 100.6 100.5 100.8 100.7 Refer to pages 38-40 for end notes.
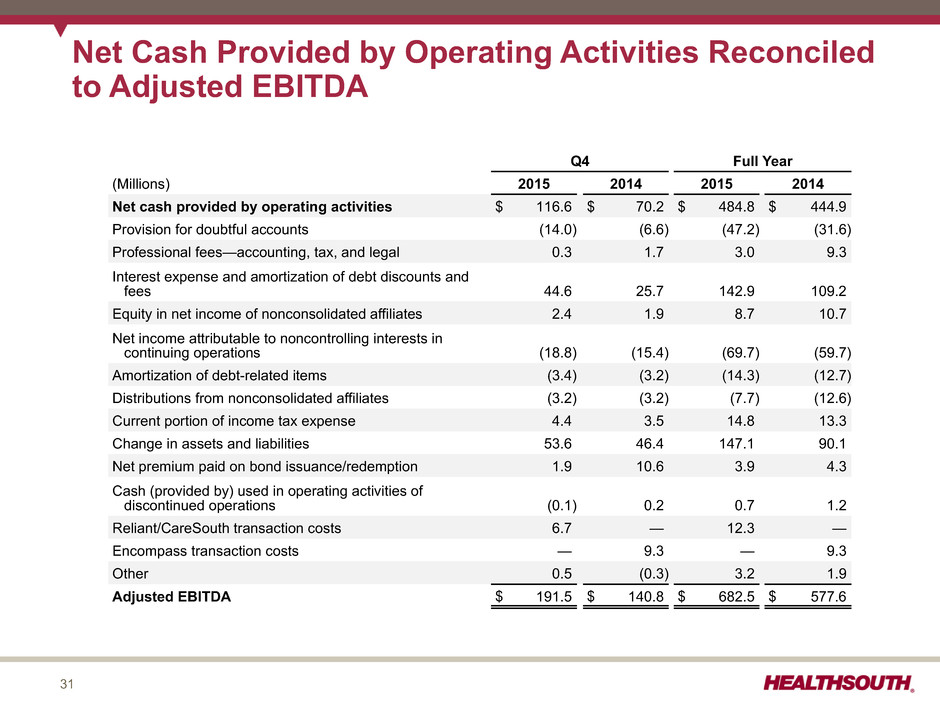
31 Net Cash Provided by Operating Activities Reconciled to Adjusted EBITDA Q4 Full Year (Millions) 2015 2014 2015 2014 Net cash provided by operating activities $ 116.6 $ 70.2 $ 484.8 $ 444.9 Provision for doubtful accounts (14.0) (6.6) (47.2) (31.6) Professional fees—accounting, tax, and legal 0.3 1.7 3.0 9.3 Interest expense and amortization of debt discounts and fees 44.6 25.7 142.9 109.2 Equity in net income of nonconsolidated affiliates 2.4 1.9 8.7 10.7 Net income attributable to noncontrolling interests in continuing operations (18.8) (15.4) (69.7) (59.7) Amortization of debt-related items (3.4) (3.2) (14.3) (12.7) Distributions from nonconsolidated affiliates (3.2) (3.2) (7.7) (12.6) Current portion of income tax expense 4.4 3.5 14.8 13.3 Change in assets and liabilities 53.6 46.4 147.1 90.1 Net premium paid on bond issuance/redemption 1.9 10.6 3.9 4.3 Cash (provided by) used in operating activities of discontinued operations (0.1) 0.2 0.7 1.2 Reliant/CareSouth transaction costs 6.7 — 12.3 — Encompass transaction costs — 9.3 — 9.3 Other 0.5 (0.3) 3.2 1.9 Adjusted EBITDA $ 191.5 $ 140.8 $ 682.5 $ 577.6
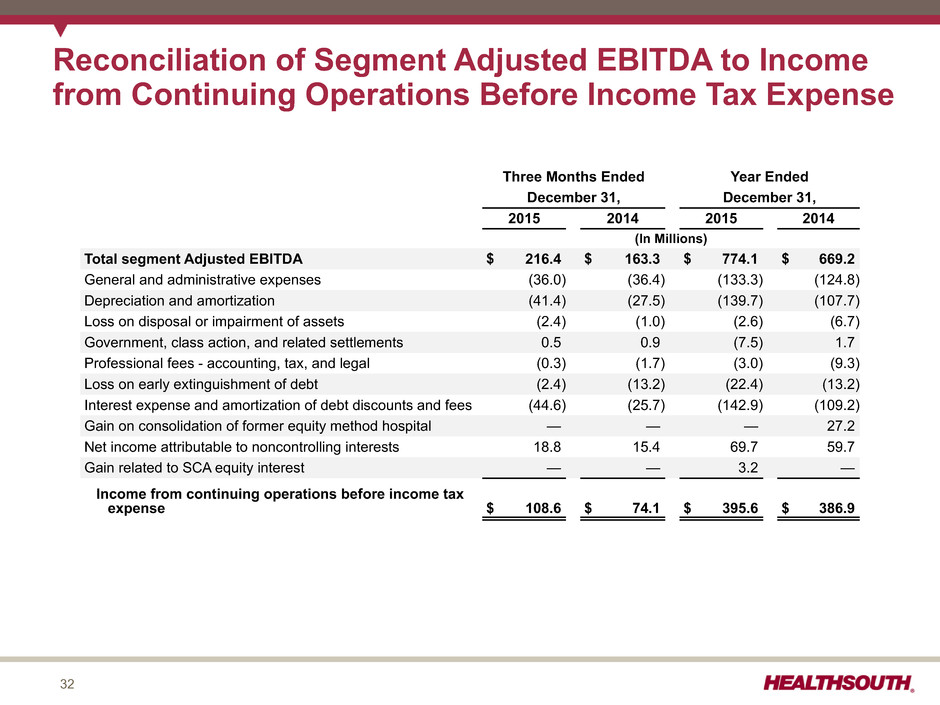
32 Reconciliation of Segment Adjusted EBITDA to Income from Continuing Operations Before Income Tax Expense Three Months Ended Year Ended December 31, December 31, 2015 2014 2015 2014 (In Millions) Total segment Adjusted EBITDA $ 216.4 $ 163.3 $ 774.1 $ 669.2 General and administrative expenses (36.0) (36.4) (133.3) (124.8) Depreciation and amortization (41.4) (27.5) (139.7) (107.7) Loss on disposal or impairment of assets (2.4) (1.0) (2.6) (6.7) Government, class action, and related settlements 0.5 0.9 (7.5) 1.7 Professional fees - accounting, tax, and legal (0.3) (1.7) (3.0) (9.3) Loss on early extinguishment of debt (2.4) (13.2) (22.4) (13.2) Interest expense and amortization of debt discounts and fees (44.6) (25.7) (142.9) (109.2) Gain on consolidation of former equity method hospital — — — 27.2 Net income attributable to noncontrolling interests 18.8 15.4 69.7 59.7 Gain related to SCA equity interest — — 3.2 — Income from continuing operations before income tax expense $ 108.6 $ 74.1 $ 395.6 $ 386.9
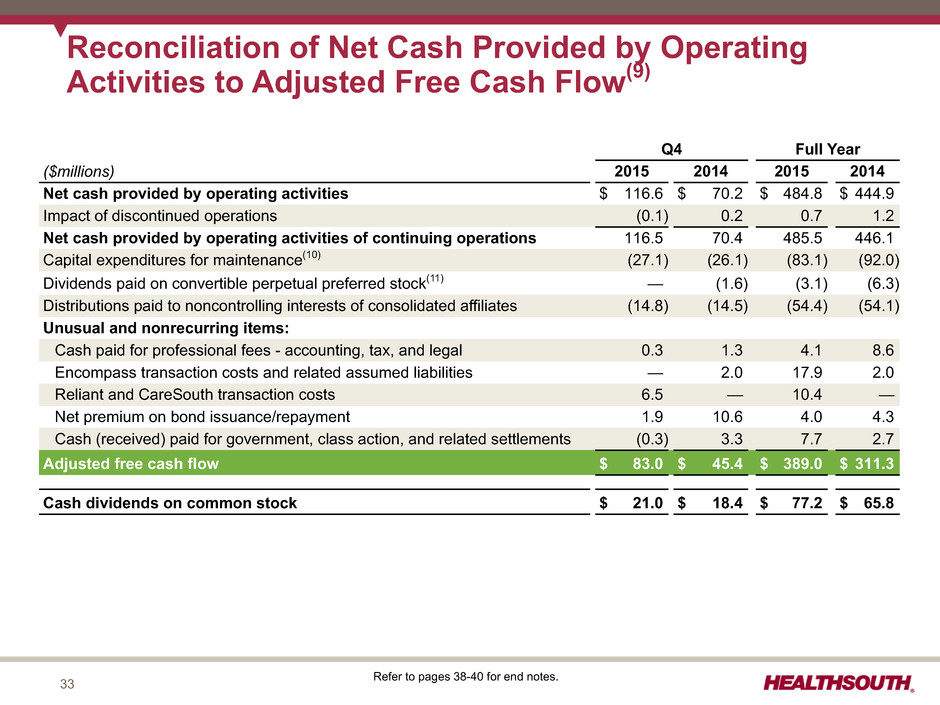
33 Reconciliation of Net Cash Provided by Operating Activities to Adjusted Free Cash Flow(9) Q4 Full Year ($millions) 2015 2014 2015 2014 Net cash provided by operating activities $ 116.6 $ 70.2 $ 484.8 $ 444.9 Impact of discontinued operations (0.1) 0.2 0.7 1.2 Net cash provided by operating activities of continuing operations 116.5 70.4 485.5 446.1 Capital expenditures for maintenance(10) (27.1) (26.1) (83.1) (92.0) Dividends paid on convertible perpetual preferred stock(11) — (1.6) (3.1) (6.3) Distributions paid to noncontrolling interests of consolidated affiliates (14.8) (14.5) (54.4) (54.1) Unusual and nonrecurring items: Cash paid for professional fees - accounting, tax, and legal 0.3 1.3 4.1 8.6 Encompass transaction costs and related assumed liabilities — 2.0 17.9 2.0 Reliant and CareSouth transaction costs 6.5 — 10.4 — Net premium on bond issuance/repayment 1.9 10.6 4.0 4.3 Cash (received) paid for government, class action, and related settlements (0.3) 3.3 7.7 2.7 Adjusted free cash flow $ 83.0 $ 45.4 $ 389.0 $ 311.3 Cash dividends on common stock $ 21.0 $ 18.4 $ 77.2 $ 65.8 Refer to pages 38-40 for end notes.
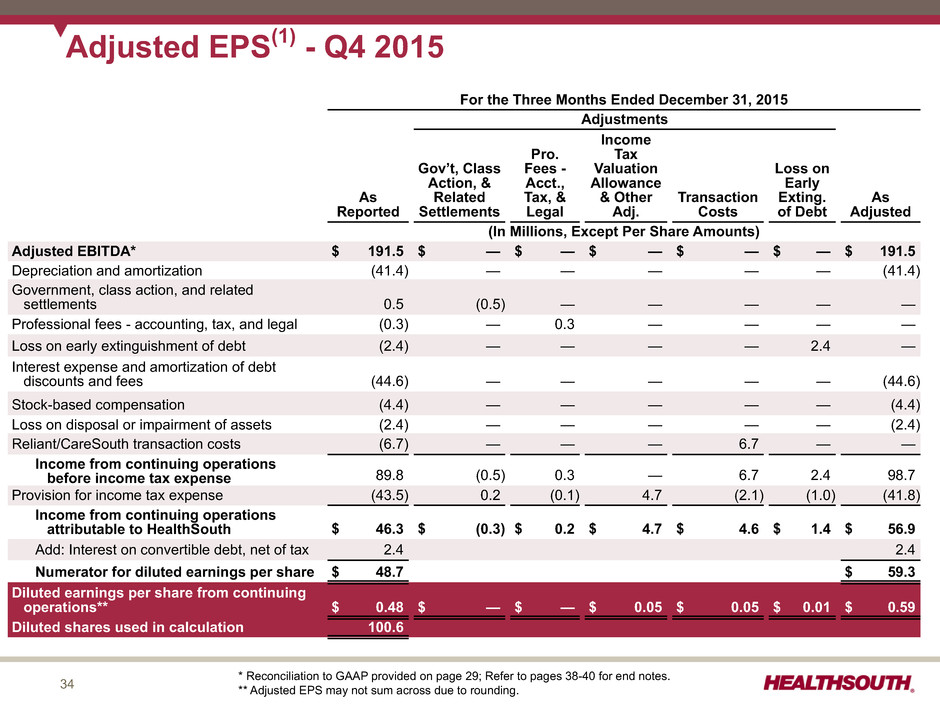
34 For the Three Months Ended December 31, 2015 Adjustments As Reported Gov’t, Class Action, & Related Settlements Pro. Fees - Acct., Tax, & Legal Income Tax Valuation Allowance & Other Adj. Transaction Costs Loss on Early Exting. of Debt As Adjusted (In Millions, Except Per Share Amounts) Adjusted EBITDA* $ 191.5 $ — $ — $ — $ — $ — $ 191.5 Depreciation and amortization (41.4) — — — — — (41.4) Government, class action, and related settlements 0.5 (0.5) — — — — — Professional fees - accounting, tax, and legal (0.3) — 0.3 — — — — Loss on early extinguishment of debt (2.4) — — — — 2.4 — Interest expense and amortization of debt discounts and fees (44.6) — — — — — (44.6) Stock-based compensation (4.4) — — — — — (4.4) Loss on disposal or impairment of assets (2.4) — — — — — (2.4) Reliant/CareSouth transaction costs (6.7) — — — 6.7 — — Income from continuing operations before income tax expense 89.8 (0.5) 0.3 — 6.7 2.4 98.7 Provision for income tax expense (43.5) 0.2 (0.1) 4.7 (2.1) (1.0) (41.8) Income from continuing operations attributable to HealthSouth $ 46.3 $ (0.3) $ 0.2 $ 4.7 $ 4.6 $ 1.4 $ 56.9 Add: Interest on convertible debt, net of tax 2.4 2.4 Numerator for diluted earnings per share $ 48.7 $ 59.3 Diluted earnings per share from continuing operations** $ 0.48 $ — $ — $ 0.05 $ 0.05 $ 0.01 $ 0.59 Diluted shares used in calculation 100.6 Adjusted EPS(1) - Q4 2015 * Reconciliation to GAAP provided on page 29; Refer to pages 38-40 for end notes. ** Adjusted EPS may not sum across due to rounding.
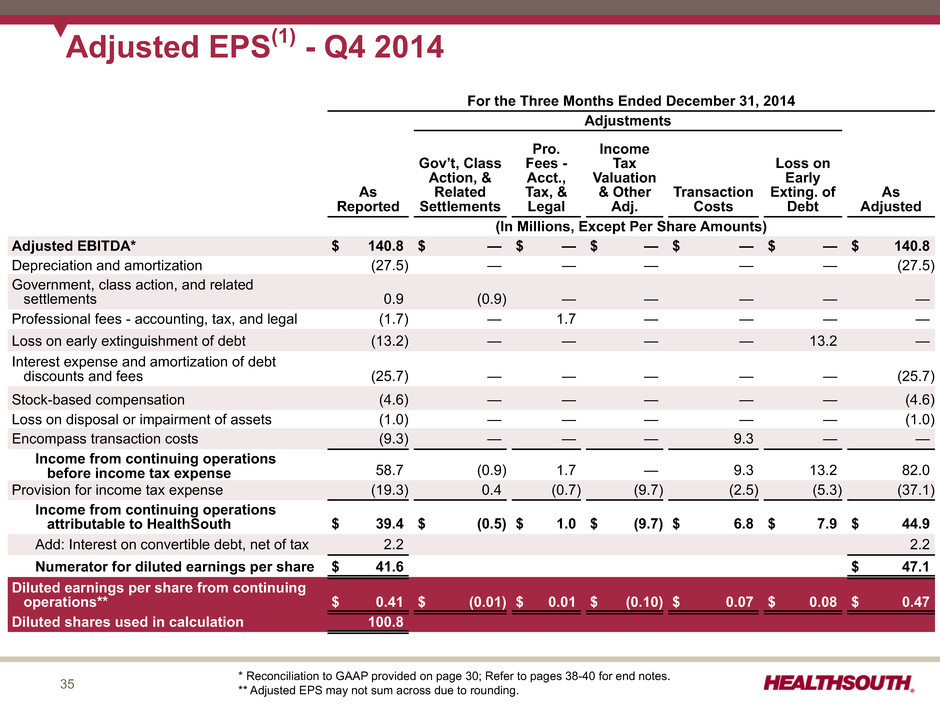
35 For the Three Months Ended December 31, 2014 Adjustments As Reported Gov’t, Class Action, & Related Settlements Pro. Fees - Acct., Tax, & Legal Income Tax Valuation & Other Adj. Transaction Costs Loss on Early Exting. of Debt As Adjusted (In Millions, Except Per Share Amounts) Adjusted EBITDA* $ 140.8 $ — $ — $ — $ — $ — $ 140.8 Depreciation and amortization (27.5) — — — — — (27.5) Government, class action, and related settlements 0.9 (0.9) — — — — — Professional fees - accounting, tax, and legal (1.7) — 1.7 — — — — Loss on early extinguishment of debt (13.2) — — — — 13.2 — Interest expense and amortization of debt discounts and fees (25.7) — — — — — (25.7) Stock-based compensation (4.6) — — — — — (4.6) Loss on disposal or impairment of assets (1.0) — — — — — (1.0) Encompass transaction costs (9.3) — — — 9.3 — — Income from continuing operations before income tax expense 58.7 (0.9) 1.7 — 9.3 13.2 82.0 Provision for income tax expense (19.3) 0.4 (0.7) (9.7) (2.5) (5.3) (37.1) Income from continuing operations attributable to HealthSouth $ 39.4 $ (0.5) $ 1.0 $ (9.7) $ 6.8 $ 7.9 $ 44.9 Add: Interest on convertible debt, net of tax 2.2 2.2 Numerator for diluted earnings per share $ 41.6 $ 47.1 Diluted earnings per share from continuing operations** $ 0.41 $ (0.01) $ 0.01 $ (0.10) $ 0.07 $ 0.08 $ 0.47 Diluted shares used in calculation 100.8 Adjusted EPS(1) - Q4 2014 * Reconciliation to GAAP provided on page 30; Refer to pages 38-40 for end notes. ** Adjusted EPS may not sum across due to rounding.
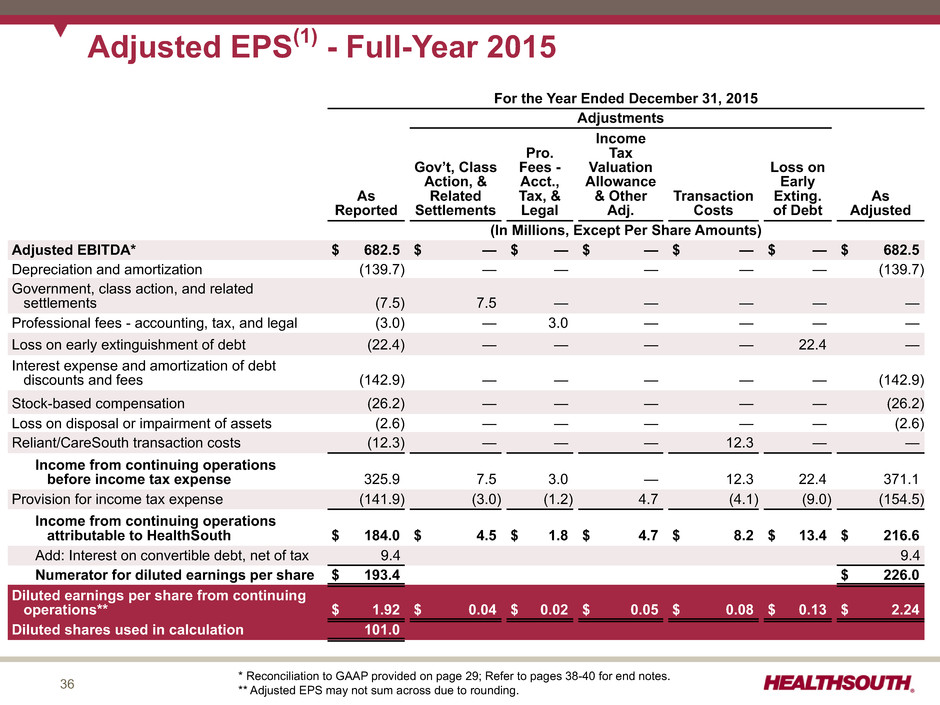
36 For the Year Ended December 31, 2015 Adjustments As Reported Gov’t, Class Action, & Related Settlements Pro. Fees - Acct., Tax, & Legal Income Tax Valuation Allowance & Other Adj. Transaction Costs Loss on Early Exting. of Debt As Adjusted (In Millions, Except Per Share Amounts) Adjusted EBITDA* $ 682.5 $ — $ — $ — $ — $ — $ 682.5 Depreciation and amortization (139.7) — — — — — (139.7) Government, class action, and related settlements (7.5) 7.5 — — — — — Professional fees - accounting, tax, and legal (3.0) — 3.0 — — — — Loss on early extinguishment of debt (22.4) — — — — 22.4 — Interest expense and amortization of debt discounts and fees (142.9) — — — — — (142.9) Stock-based compensation (26.2) — — — — — (26.2) Loss on disposal or impairment of assets (2.6) — — — — — (2.6) Reliant/CareSouth transaction costs (12.3) — — — 12.3 — — Income from continuing operations before income tax expense 325.9 7.5 3.0 — 12.3 22.4 371.1 Provision for income tax expense (141.9) (3.0) (1.2) 4.7 (4.1) (9.0) (154.5) Income from continuing operations attributable to HealthSouth $ 184.0 $ 4.5 $ 1.8 $ 4.7 $ 8.2 $ 13.4 $ 216.6 Add: Interest on convertible debt, net of tax 9.4 9.4 Numerator for diluted earnings per share $ 193.4 $ 226.0 Diluted earnings per share from continuing operations** $ 1.92 $ 0.04 $ 0.02 $ 0.05 $ 0.08 $ 0.13 $ 2.24 Diluted shares used in calculation 101.0 Adjusted EPS(1) - Full-Year 2015 * Reconciliation to GAAP provided on page 29; Refer to pages 38-40 for end notes. ** Adjusted EPS may not sum across due to rounding.
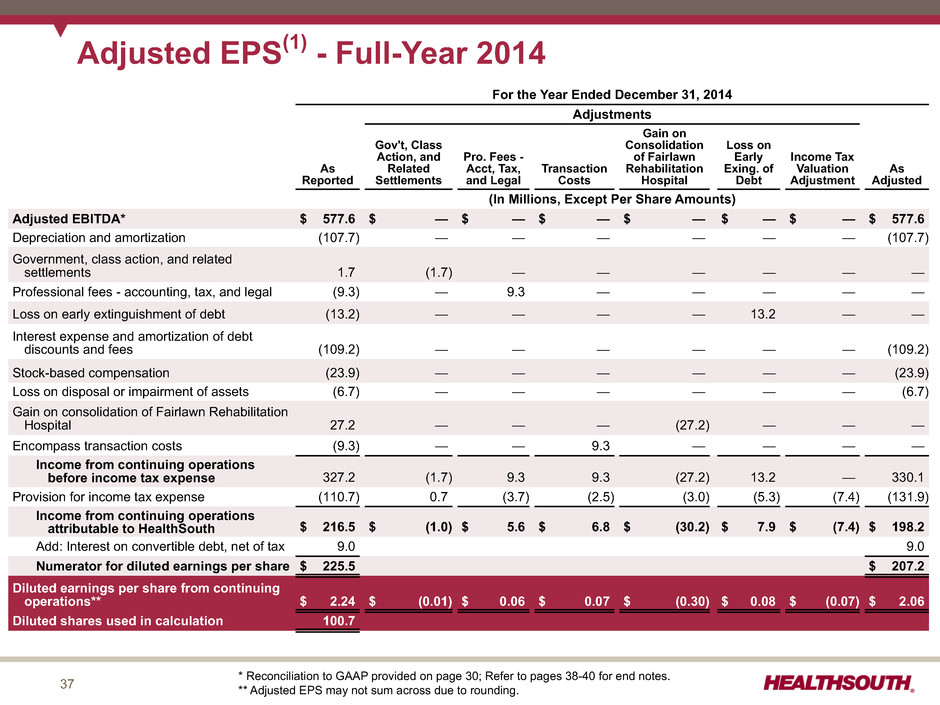
37 For the Year Ended December 31, 2014 Adjustments As Reported Gov't, Class Action, and Related Settlements Pro. Fees - Acct, Tax, and Legal Transaction Costs Gain on Consolidation of Fairlawn Rehabilitation Hospital Loss on Early Exing. of Debt Income Tax Valuation Adjustment As Adjusted (In Millions, Except Per Share Amounts) Adjusted EBITDA* $ 577.6 $ — $ — $ — $ — $ — $ — $ 577.6 Depreciation and amortization (107.7) — — — — — — (107.7) Government, class action, and related settlements 1.7 (1.7) — — — — — — Professional fees - accounting, tax, and legal (9.3) — 9.3 — — — — — Loss on early extinguishment of debt (13.2) — — — — 13.2 — — Interest expense and amortization of debt discounts and fees (109.2) — — — — — — (109.2) Stock-based compensation (23.9) — — — — — — (23.9) Loss on disposal or impairment of assets (6.7) — — — — — — (6.7) Gain on consolidation of Fairlawn Rehabilitation Hospital 27.2 — — — (27.2) — — — Encompass transaction costs (9.3) — — 9.3 — — — — Income from continuing operations before income tax expense 327.2 (1.7) 9.3 9.3 (27.2) 13.2 — 330.1 Provision for income tax expense (110.7) 0.7 (3.7) (2.5) (3.0) (5.3) (7.4) (131.9) Income from continuing operations attributable to HealthSouth $ 216.5 $ (1.0) $ 5.6 $ 6.8 $ (30.2) $ 7.9 $ (7.4) $ 198.2 Add: Interest on convertible debt, net of tax 9.0 9.0 Numerator for diluted earnings per share $ 225.5 $ 207.2 Diluted earnings per share from continuing operations** $ 2.24 $ (0.01) $ 0.06 $ 0.07 $ (0.30) $ 0.08 $ (0.07) $ 2.06 Diluted shares used in calculation 100.7 Adjusted EPS(1) - Full-Year 2014 * Reconciliation to GAAP provided on page 30; Refer to pages 38-40 for end notes. ** Adjusted EPS may not sum across due to rounding.

38 End Notes (1) HealthSouth is providing adjusted earnings per share from continuing operations attributable to HealthSouth (“adjusted earnings per share”), which is a non-GAAP measure. The Company believes the presentation of adjusted earnings per share provides useful additional information to investors because it provides better comparability of ongoing performance to prior periods given that it excludes the impact of government, class action, and related settlements, professional fees - accounting, tax, and legal, gains or losses related to hedging instruments, loss on early extinguishment of debt, adjustments to its income tax provision (such as valuation allowance adjustments and settlements of income tax claims), items related to corporate and facility restructurings, and certain other items. It is reasonable to expect that one or more of these excluded items will occur in future periods, but the amounts recognized can vary significantly from period to period and may not directly relate to the Company's ongoing operations. Accordingly, they can complicate comparisons of the Company's results of operations across periods and comparisons of the Company's results to those of other healthcare companies. Adjusted earnings per share should not be considered as a measure of financial performance under generally accepted accounting principles in the United States as the items excluded from it are significant components in understanding and assessing financial performance. Because adjusted earnings per share is not a measurement determined in accordance with GAAP and is thus susceptible to varying calculations, it may not be comparable as presented to other similarly titled measures of other companies. (2) Current income tax expense was $4.4 million and $3.5 million for Q4 2015 and Q4 2014, respectively, and $14.8 million and $13.3 million for full-year 2015 and full-year 2014, respectively. (3) Earnings per share are determined using income from continuing operations attributable to HealthSouth. (4) The interest and amortization related to the convertible senior subordinated notes must be added to income from continuing operations when calculating diluted earnings per share. (5) The difference between the basic and diluted shares outstanding is primarily related to the convertible senior subordinated notes (convertible into 8.2 million common shares) and convertible perpetual preferred stock (converted into 3.3 million common shares on April 23, 2015). a. On November 18, 2013, the Company closed separate, privately negotiated exchanges in which it issued $320 million of 2.0% Convertible Senior Subordinated Notes due 2043 in exchange for 257,110 shares of the Company’s 6.5% Series A Convertible Perpetual Preferred Stock. The Company recorded approx. $249 million as debt and approx. $71 million as equity. The convertible notes are convertible, at the option of the holders, at any time on or prior to the close of business on the business day immediately preceding December 1, 2043 into shares of the Company’s common stock at a conversion rate of approx. 26.2583 shares per $1,000 in principal amount, which is equal to a conversion price of approximately $38.08 per share, subject to customary antidilution adjustments. The Company has the right to redeem the convertible notes before December 1, 2018 if the volume weighted average price of the Company’s common stock is at least 120% ($45.70) of the conversion price of the convertible notes for a specified period. On or after December 1, 2018, the Company may, at its option, redeem all or any part of the convertible notes. In either case, the redemption price will be equal to 100% of the principal amount of the convertible notes to be redeemed, plus accrued and unpaid interest. b. There were 96,245 shares of preferred stock outstanding after the exchange transaction. On April 22, 2015, the Company delivered notice of the exercise of its rights to force conversion of all outstanding shares of the perpetual preferred stock (par value of $0.10 per share and liquidation preference of $1,000 per share) pursuant to the underlying certificate of designations. The effective date of the conversion was April 23, 2015. On that date, each share of preferred stock automatically converted into 33.9905 shares of common stock (par value of $0.01 per share). The Company completed the forced conversion by issuing and delivering in the aggregate 3,271,415 shares of common stock to the registered holders of the 96,245 shares of the preferred stock outstanding and paying cash in lieu of fractional shares due to those holders. (6) The agreement to settle the Company’s class action securities litigation received final court approval in January 2007. These shares of common stock and warrants were issued on September 30, 2009. The 5.0 million of common shares are included in the outstanding shares. The warrants to purchase approx. 8.2 million shares of common stock at a strike price of $41.40 (expire January 17, 2017) were not included in the diluted share count before 2015 since the strike price has historically been above the market price. In Q4 2015 and full-year 2015, the Company included zero (due to antidilution based on the stock price) and 80,814 shares, respectively, in the diluted share count using the treasury stock method.
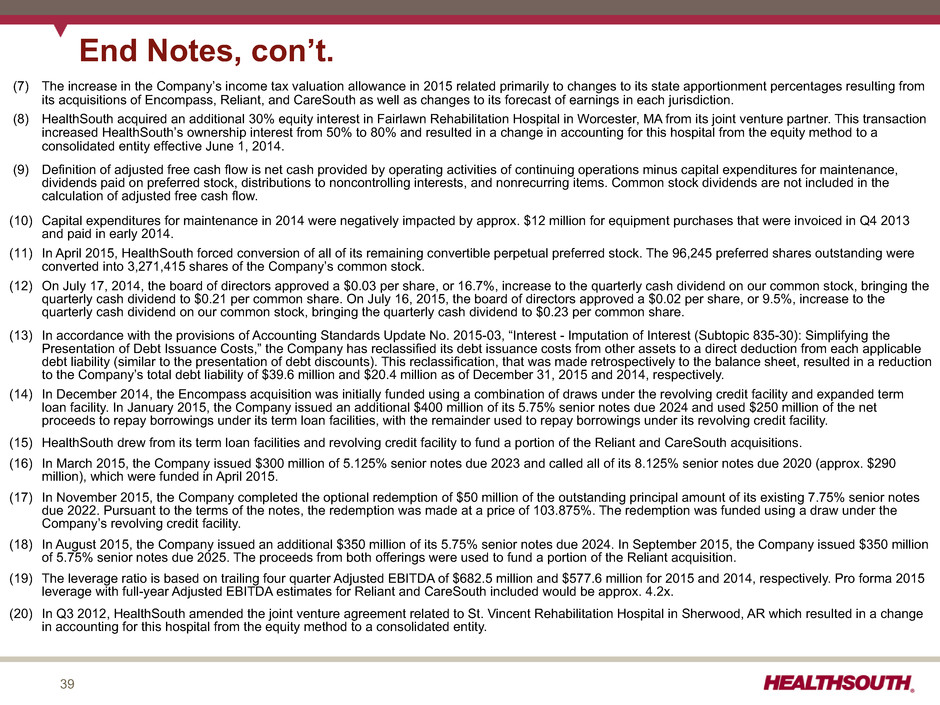
39 (7) The increase in the Company’s income tax valuation allowance in 2015 related primarily to changes to its state apportionment percentages resulting from its acquisitions of Encompass, Reliant, and CareSouth as well as changes to its forecast of earnings in each jurisdiction. (8) HealthSouth acquired an additional 30% equity interest in Fairlawn Rehabilitation Hospital in Worcester, MA from its joint venture partner. This transaction increased HealthSouth’s ownership interest from 50% to 80% and resulted in a change in accounting for this hospital from the equity method to a consolidated entity effective June 1, 2014. (9) Definition of adjusted free cash flow is net cash provided by operating activities of continuing operations minus capital expenditures for maintenance, dividends paid on preferred stock, distributions to noncontrolling interests, and nonrecurring items. Common stock dividends are not included in the calculation of adjusted free cash flow. (10) Capital expenditures for maintenance in 2014 were negatively impacted by approx. $12 million for equipment purchases that were invoiced in Q4 2013 and paid in early 2014. (11) In April 2015, HealthSouth forced conversion of all of its remaining convertible perpetual preferred stock. The 96,245 preferred shares outstanding were converted into 3,271,415 shares of the Company’s common stock. (12) On July 17, 2014, the board of directors approved a $0.03 per share, or 16.7%, increase to the quarterly cash dividend on our common stock, bringing the quarterly cash dividend to $0.21 per common share. On July 16, 2015, the board of directors approved a $0.02 per share, or 9.5%, increase to the quarterly cash dividend on our common stock, bringing the quarterly cash dividend to $0.23 per common share. (13) In accordance with the provisions of Accounting Standards Update No. 2015-03, “Interest - Imputation of Interest (Subtopic 835-30): Simplifying the Presentation of Debt Issuance Costs,” the Company has reclassified its debt issuance costs from other assets to a direct deduction from each applicable debt liability (similar to the presentation of debt discounts). This reclassification, that was made retrospectively to the balance sheet, resulted in a reduction to the Company’s total debt liability of $39.6 million and $20.4 million as of December 31, 2015 and 2014, respectively. (14) In December 2014, the Encompass acquisition was initially funded using a combination of draws under the revolving credit facility and expanded term loan facility. In January 2015, the Company issued an additional $400 million of its 5.75% senior notes due 2024 and used $250 million of the net proceeds to repay borrowings under its term loan facilities, with the remainder used to repay borrowings under its revolving credit facility. (15) HealthSouth drew from its term loan facilities and revolving credit facility to fund a portion of the Reliant and CareSouth acquisitions. (16) In March 2015, the Company issued $300 million of 5.125% senior notes due 2023 and called all of its 8.125% senior notes due 2020 (approx. $290 million), which were funded in April 2015. (17) In November 2015, the Company completed the optional redemption of $50 million of the outstanding principal amount of its existing 7.75% senior notes due 2022. Pursuant to the terms of the notes, the redemption was made at a price of 103.875%. The redemption was funded using a draw under the Company’s revolving credit facility. (18) In August 2015, the Company issued an additional $350 million of its 5.75% senior notes due 2024. In September 2015, the Company issued $350 million of 5.75% senior notes due 2025. The proceeds from both offerings were used to fund a portion of the Reliant acquisition. (19) The leverage ratio is based on trailing four quarter Adjusted EBITDA of $682.5 million and $577.6 million for 2015 and 2014, respectively. Pro forma 2015 leverage with full-year Adjusted EBITDA estimates for Reliant and CareSouth included would be approx. 4.2x. (20) In Q3 2012, HealthSouth amended the joint venture agreement related to St. Vincent Rehabilitation Hospital in Sherwood, AR which resulted in a change in accounting for this hospital from the equity method to a consolidated entity. End Notes, con’t.
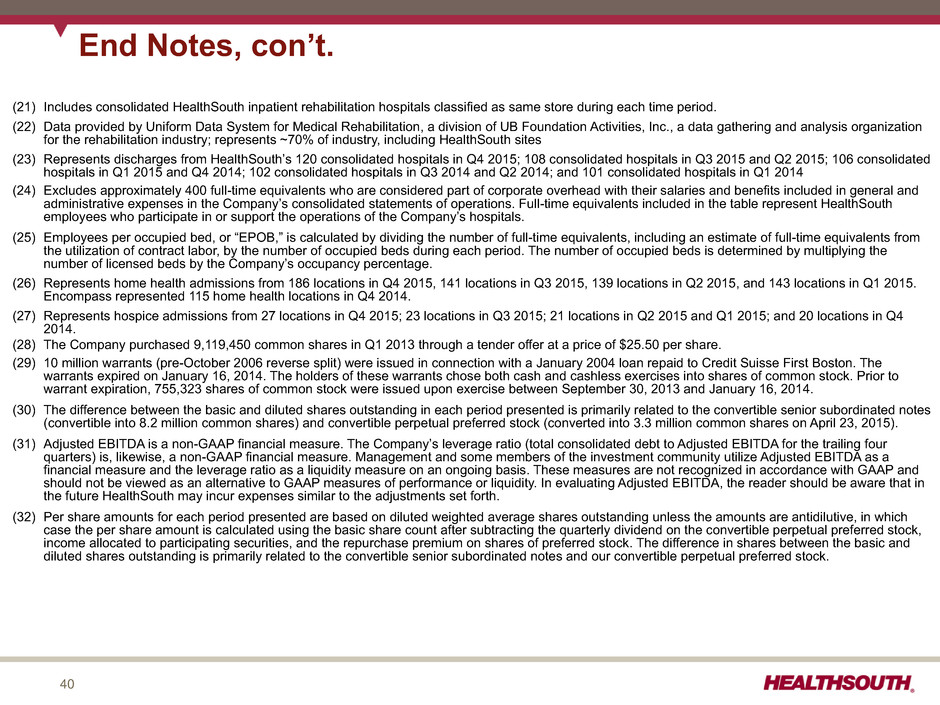
40 End Notes, con’t. (21) Includes consolidated HealthSouth inpatient rehabilitation hospitals classified as same store during each time period. (22) Data provided by Uniform Data System for Medical Rehabilitation, a division of UB Foundation Activities, Inc., a data gathering and analysis organization for the rehabilitation industry; represents ~70% of industry, including HealthSouth sites (23) Represents discharges from HealthSouth’s 120 consolidated hospitals in Q4 2015; 108 consolidated hospitals in Q3 2015 and Q2 2015; 106 consolidated hospitals in Q1 2015 and Q4 2014; 102 consolidated hospitals in Q3 2014 and Q2 2014; and 101 consolidated hospitals in Q1 2014 (24) Excludes approximately 400 full-time equivalents who are considered part of corporate overhead with their salaries and benefits included in general and administrative expenses in the Company’s consolidated statements of operations. Full-time equivalents included in the table represent HealthSouth employees who participate in or support the operations of the Company’s hospitals. (25) Employees per occupied bed, or “EPOB,” is calculated by dividing the number of full-time equivalents, including an estimate of full-time equivalents from the utilization of contract labor, by the number of occupied beds during each period. The number of occupied beds is determined by multiplying the number of licensed beds by the Company’s occupancy percentage. (26) Represents home health admissions from 186 locations in Q4 2015, 141 locations in Q3 2015, 139 locations in Q2 2015, and 143 locations in Q1 2015. Encompass represented 115 home health locations in Q4 2014. (27) Represents hospice admissions from 27 locations in Q4 2015; 23 locations in Q3 2015; 21 locations in Q2 2015 and Q1 2015; and 20 locations in Q4 2014. (28) The Company purchased 9,119,450 common shares in Q1 2013 through a tender offer at a price of $25.50 per share. (29) 10 million warrants (pre-October 2006 reverse split) were issued in connection with a January 2004 loan repaid to Credit Suisse First Boston. The warrants expired on January 16, 2014. The holders of these warrants chose both cash and cashless exercises into shares of common stock. Prior to warrant expiration, 755,323 shares of common stock were issued upon exercise between September 30, 2013 and January 16, 2014. (30) The difference between the basic and diluted shares outstanding in each period presented is primarily related to the convertible senior subordinated notes (convertible into 8.2 million common shares) and convertible perpetual preferred stock (converted into 3.3 million common shares on April 23, 2015). (31) Adjusted EBITDA is a non-GAAP financial measure. The Company’s leverage ratio (total consolidated debt to Adjusted EBITDA for the trailing four quarters) is, likewise, a non-GAAP financial measure. Management and some members of the investment community utilize Adjusted EBITDA as a financial measure and the leverage ratio as a liquidity measure on an ongoing basis. These measures are not recognized in accordance with GAAP and should not be viewed as an alternative to GAAP measures of performance or liquidity. In evaluating Adjusted EBITDA, the reader should be aware that in the future HealthSouth may incur expenses similar to the adjustments set forth. (32) Per share amounts for each period presented are based on diluted weighted average shares outstanding unless the amounts are antidilutive, in which case the per share amount is calculated using the basic share count after subtracting the quarterly dividend on the convertible perpetual preferred stock, income allocated to participating securities, and the repurchase premium on shares of preferred stock. The difference in shares between the basic and diluted shares outstanding is primarily related to the convertible senior subordinated notes and our convertible perpetual preferred stock.
Serious News for Serious Traders! Try StreetInsider.com Premium Free!
You May Also Be Interested In
- Aether Catalyst Solutions, Inc. Announces Appointment to Board of Directors
- China Has Become Colombia's Reliable Partner in Times of Uncertainty
- Gold Roth IRA: How It Works, Rules, Taxes, Fees, and What Investors Should Know in 2026 (Guide Released)
Create E-mail Alert Related Categories
SEC FilingsSign up for StreetInsider Free!
Receive full access to all new and archived articles, unlimited portfolio tracking, e-mail alerts, custom newswires and RSS feeds - and more!
