



Form 8-K HEALTHCARE TRUST OF AMER For: Jul 29
 Tweet
Tweet Share
Share E-mail
UNITED STATES
SECURITIES AND EXCHANGE COMMISSION
Washington, D.C. 20549
FORM 8-K
CURRENT REPORT
Pursuant to Section 13 or 15(d) of the
Securities Exchange Act of 1934
Date of Report (Date of earliest event reported): July 29, 2015 (July 29, 2015)
HEALTHCARE TRUST OF AMERICA, INC.
HEALTHCARE TRUST OF AMERICA HOLDINGS, LP
(Exact name of registrant as specified in its charter)
Maryland | 001-35568 | 20-4738467 | ||
Delaware | 333-190916 | 20-4738347 | ||
(State or other jurisdiction of incorporation) | (Commission File Number) | (I.R.S. Employer Identification No.) | ||
16435 N. Scottsdale Road, Suite 320 | ||||
Scottsdale, Arizona | 85254 | |||
(Address of principal executive offices) | (Zip Code) | |||
(480) 998-3478
(Registrant’s telephone number, including area code)
Not Applicable
(Former name or former address, if changed since last report)
Check the appropriate box below if the Form 8-K filing is intended to simultaneously satisfy the filing obligation of the registrant under any of the following provisions:
o | Written communications pursuant to Rule 425 under the Securities Act (17 CFR 230.425) |
o | Soliciting material pursuant to Rule 14a-12 under the Exchange Act (17 CFR 240.14a-12) |
o | Pre-commencement communications pursuant to Rule 14d-2(b) under the Exchange Act (17 CFR 240.14d-2(b)) |
o | Pre-commencement communications pursuant to Rule 13e-4(c) under the Exchange Act (17 CFR 240.13e-4(c)) |
Item 2.02 | Results of Operations and Financial Condition. |
On July 29, 2015, Healthcare Trust of America, Inc. (NYSE: HTA) ( “HTA”) issued a press release announcing its financial results for the quarter ended June 30, 2015. HTA also commenced distributing its Supplemental Information for the quarter ended June 30, 2015. The press release and Supplemental Information are attached as Exhibit 99.1 and Exhibit 99.2, respectively, and are incorporated herein by reference. The press release and Supplemental Information are also available on HTA’s website, free of charge, at www.htareit.com.
The information included in this Current Report on Form 8-K, including Exhibit 99.1 and Exhibit 99.2, is deemed “furnished” and not filed under the Securities Exchange Act of 1934, as amended (the “Exchange Act”), and shall not be incorporated by reference into any registration statement or other document filed under the Securities Act of 1933, as amended, or the Exchange Act, except as shall be expressly set forth by specific reference in such filing.
Item 9.01 | Financial Statements and Exhibits. |
(d) Exhibits.
99.1 | Press Release dated July 29, 2015. |
99.2 | Supplemental Information for the quarter ended June 30, 2015. |
SIGNATURES
Pursuant to the requirements of the Securities Exchange Act of 1934, the registrants have duly caused this report to be signed on their behalf by the undersigned hereunto duly authorized.
Healthcare Trust of America, Inc. | |||
Date: July 29, 2015 | By: | /s/ Scott D. Peters | |
Name: Scott D. Peters | |||
Title: Chief Executive Officer, President and Chairman | |||
Healthcare Trust of America Holdings, LP | |||
By: | Healthcare Trust of America, Inc., | ||
its General Partner | |||
Date: July 29, 2015 | By: | /s/ Scott D. Peters | |
Name: Scott D. Peters | |||
Title: Chief Executive Officer, President and Chairman | |||
Exhibit 99.1
 | PRESS RELEASE | |
Financial Contact: | ||
Robert A. Milligan | ||
Chief Financial Officer | ||
480.998.3478 | ||
HEALTHCARE TRUST OF AMERICA, INC. REPORTS 6% INCREASE IN NORMALIZED FFO PER SHARE
11th Consecutive Quarter of 3.0% or More of Same-Property Cash NOI Growth
$190 Million in Second Quarter Investments
Scottsdale, Arizona (July 29, 2015) - Healthcare Trust of America, Inc. (NYSE: HTA) (“HTA”) announced results for the quarter ended June 30, 2015.
Second Quarter 2015 Highlights
Operating
• | Normalized FFO: Increased 11.5% to $48.5 million, compared to Q2 2014. |
• | Normalized FFO Per Share: $0.38 per diluted share, an increase of $0.02 per diluted share, or 6%, compared to Q2 2014. |
• | Normalized FAD: $0.35 per diluted share, or $44.4 million, an increase of $0.02 per diluted share, or 6%, compared to Q2 2014. |
• | Same-Property Cash NOI: Increased $1.7 million, or 3.0%, to $58.0 million, compared to Q2 2014. Same-Property rental revenue increased $1.3 million, or 2.1%, to $65.9 million, compared to Q2 2014. |
Portfolio
• | Acquisitions: During the quarter, HTA acquired $190.2 million of medical office buildings (99% leased and approximately 457,000 square feet of GLA), increasing the total year-to-date investments to $225.5 million. These buildings are located in our key markets of Boston, Charleston, Indianapolis and Raleigh. |
• | Dispositions: In July 2015, HTA completed dispositions of five medical office buildings for an aggregate gross sales price of $34.9 million (approximately 186,000 square feet of GLA). |
• | Leasing: During the quarter, HTA entered into new and renewal leases on approximately 291,000 square feet of GLA, or 1.9% of its portfolio. Tenant retention for the Same-Property portfolio was 85% by GLA for the quarter. |
• | Leased Rate: At the end of the quarter, the leased rate by GLA was 91.7%, an increase from 91.5% as of Q2 2014. |
Balance Sheet and Liquidity
• | Balance Sheet: At the end of the quarter, HTA had total liquidity of $631.1 million, including $614.5 million of availability on its unsecured revolving credit facility and $16.6 million of cash and cash equivalents. The leverage ratio of debt to capitalization was 35.0%. |
• | Equity Raise: In July 2015, HTA raised $45.0 million from the sale of shares of common stock at an average price of $25.00 per share. |
Financial Results
Rental Income
Rental income increased 11.6% to $99.2 million for the three months ended June 30, 2015, compared to $88.9 million for the three months ended June 30, 2014. The increase in rental income was primarily driven by $453.5 million of acquisitions since June 30, 2014, together with Same-Property growth.
FFO
Funds from Operations (“FFO”) was $0.38 per diluted share, or $48.7 million, for the three months ended June 30, 2015, compared to $0.30 per diluted share, or $36.5 million, for the three months ended June 30, 2014.
Normalized FFO
Normalized Funds from Operations (“Normalized FFO”) was $0.38 per diluted share, or $48.5 million, for the three months ended June 30, 2015, compared to $0.36 per diluted share, or $43.5 million, for the three months ended June 30, 2014.
Normalized FAD
Normalized Funds Available for Distribution (“Normalized FAD”) was $0.35 per diluted share, or $44.4 million, for the three months ended June 30, 2015, compared to $0.33 per diluted share, or $39.3 million, for the three months ended June 30, 2014.
NOI
Net Operating Income (“NOI”) was $70.1 million for the three months ended June 30, 2015, compared to $62.6 million for the three months ended June 30, 2014.
Same-Property Cash NOI
Same-Property Cash NOI increased $1.7 million, or 3.0%, to $58.0 million for the three months ended June 30, 2015, compared to $56.3 million for the three months ended June 30, 2014. Same-Property rental revenue increased $1.3 million, or 2.1%, to $65.9 million, for the three months ended June 30, 2015, compared to the three months ended June 30, 2014.
General and Administrative Expenses
General and administrative expenses were $6.2 million for the three months ended June 30, 2015, compared to $5.9 million for the three months ended June 30, 2014.
Interest Expense and Change in Fair Value of Derivative Financial Instruments
The total interest expense and change in fair value of derivative financial instruments for the three months ended June 30, 2015, was $13.7 million, which included $15.0 million of interest expense related to debt and interest rate swaps, and a net gain of $1.3 million on the change in the fair value of HTA’s derivative financial instruments.
HTA ended the quarter with a weighted average borrowing cost of 3.25% per annum, inclusive of interest rate swaps. The weighted average remaining term of the debt portfolio (including extension options) was 5.2 years.
Net Income
Net income for the three months ended June 30, 2015, was $9.5 million, compared to $2.9 million for the three months ended June 30, 2014.
Balance Sheet
As of June 30, 2015, HTA had total assets of $3.2 billion, cash and cash equivalents of $16.6 million, and $614.5 million available on its unsecured revolving credit facility (includes the impact of $5.5 million of outstanding letters of credit). The leverage ratio of debt to capitalization was 35.0%.
Leased Rate, Occupancy Rate and Tenant Retention
The leased rate (includes leases which have been executed, but which have not yet commenced) was 91.7% by gross leasable area (“GLA”), an increase from 91.5% as of Q2 2014. The occupancy rate of HTA’s portfolio was 91.1% by GLA, an increase from 90.9% as of Q2 2014. Tenant retention for the Same-Property portfolio was 85% by GLA for the quarter.
Credit Rated Tenants
Investment grade rated tenants as a percent of annualized base rent was 44% as of June 30, 2015. Additionally, 60% of HTA’s annualized base rent as of June 30, 2015 is derived from tenants that have (or whose parent companies have) a credit rating from a nationally recognized rating agency.
In-House Property Management and Leasing Platform
As of June 30, 2015, HTA’s in-house property management and leasing platform operated over 14.5 million square feet of GLA, or 94%, of HTA’s total portfolio.
About Healthcare Trust of America, Inc.
Healthcare Trust of America, Inc. (NYSE: HTA) is a publicly traded real estate investment trust that acquires, owns and operates medical office buildings. Over the last ten years since its formation in 2006, the company has invested $3.6 billion in medical office buildings comprising 15.4 million square feet across 28 states. HTA has a consistent track record of generating shareholder returns and listed on the New York Stock Exchange in June of 2012.
HTA invests in key markets with above average growth and healthcare infrastructure that is capable of servicing long-term patient demand. Within each key market, HTA focuses on acquiring medical office buildings on health system campuses, in community-core locations, or around university medical centers. The portfolio consists of medical office buildings that are core-critical, a key part of the integrated delivery of healthcare, and that continue to complement the company’s institutional asset management and leasing platform. HTA’s business strategy is underlined by establishing critical mass within key markets which allows the asset management and in-house leasing platform to drive earnings growth, uncover synergies and maximize expense efficiencies, and build lasting tenant relationships which leads to retention, rent growth and long-term value creation across the portfolio.
More information about HTA can be found on the company’s website at www.htareit.com.
Forward-Looking Language
This press release contains certain forward-looking statements with respect to HTA. Forward-looking statements are statements that are not descriptions of historical facts and include statements regarding management’s intentions, beliefs, expectations, plans or predictions of the future, within the meaning of Section 27A of the Securities Act of 1933, as amended, and Section 21E of the Securities Exchange Act of 1934, as amended. Because such statements include risks, uncertainties and contingencies, actual results may differ materially and in adverse ways from those expressed or implied by such forward-looking statements. These risks, uncertainties and contingencies include, without limitation, the following: changes in economic conditions generally and the real estate market specifically; legislative and regulatory changes, including changes to laws governing the taxation of REITs and changes to laws governing the healthcare industry; the availability of capital; changes in interest rates; competition in the real estate industry; the supply and demand for operating properties in our proposed market areas; changes in accounting principles generally accepted in the United States of America; policies and guidelines applicable to REITs; the availability of properties to acquire; and the availability of financing. Additional information concerning us and our business, including additional factors that could materially and adversely affect our financial results, include, without limitation, the risks described under Part I, Item 1A - Risk Factors, in our Annual Report on Form 10-K and in our other filings with the SEC.
Second Quarter Conference Call
HTA will host a conference call and webcast on Wednesday, July 29, 2015 at 1:00 p.m. Eastern Time (10:00 a.m. Pacific Time) to review its financial performance and operating results for the quarter ended June 30, 2015.
Conference Call and Webcast Details:
Domestic Dial-In Number: (877) 507-6265
International Dial-In Number: (412) 902-6633
Webcast: www.htareit.com under the Investor Relations tab
Replay Conference Call Details:
Domestic Dial-In Number: (877) 344-7529
International Dial-In Number: (412) 317-0088
Conference ID: 10068388
Available July 29, 2015 (one hour after the end of the conference call) to August 29, 2015 at 12:00 a.m. Eastern Time
Supplemental Information
Supplemental financial data are available on the company’s website at www.htareit.com.
HEALTHCARE TRUST OF AMERICA, INC.
CONDENSED CONSOLIDATED BALANCE SHEETS
(In thousands, except share data)
(Unaudited)
June 30, 2015 | December 31, 2014 | |||||||
ASSETS | ||||||||
Real estate investments: | ||||||||
Land | $ | 298,995 | $ | 287,755 | ||||
Building and improvements | 2,872,709 | 2,665,777 | ||||||
Lease intangibles | 435,218 | 419,288 | ||||||
3,606,922 | 3,372,820 | |||||||
Accumulated depreciation and amortization | (617,105 | ) | (549,976 | ) | ||||
Real estate investments, net | 2,989,817 | 2,822,844 | ||||||
Cash and cash equivalents | 16,577 | 10,413 | ||||||
Restricted cash and escrow deposits | 16,249 | 20,799 | ||||||
Receivables and other assets, net | 148,343 | 144,106 | ||||||
Other intangibles, net | 47,126 | 43,488 | ||||||
Total assets | $ | 3,218,112 | $ | 3,041,650 | ||||
LIABILITIES AND EQUITY | ||||||||
Liabilities: | ||||||||
Debt | $ | 1,639,001 | $ | 1,412,461 | ||||
Accounts payable and accrued liabilities | 85,003 | 101,042 | ||||||
Derivative financial instruments - interest rate swaps | 2,721 | 2,888 | ||||||
Security deposits, prepaid rent and other liabilities | 43,176 | 32,687 | ||||||
Intangible liabilities, net | 23,585 | 12,425 | ||||||
Total liabilities | 1,793,486 | 1,561,503 | ||||||
Commitments and contingencies | ||||||||
Redeemable noncontrolling interests | 3,744 | 3,726 | ||||||
Equity: | ||||||||
Preferred stock, $0.01 par value; 200,000,000 shares authorized; none issued and outstanding | — | — | ||||||
Class A common stock, $0.01 par value; 1,000,000,000 shares authorized; 125,194,108 and 125,087,268 shares issued and outstanding as of June 30, 2015 and December 31, 2014, respectively | 1,252 | 1,251 | ||||||
Additional paid-in capital | 2,283,737 | 2,281,932 | ||||||
Cumulative dividends in excess of earnings | (892,543 | ) | (836,044 | ) | ||||
Total stockholders’ equity | 1,392,446 | 1,447,139 | ||||||
Noncontrolling interests | 28,436 | 29,282 | ||||||
Total equity | 1,420,882 | 1,476,421 | ||||||
Total liabilities and equity | $ | 3,218,112 | $ | 3,041,650 | ||||
HEALTHCARE TRUST OF AMERICA, INC.
CONDENSED CONSOLIDATED STATEMENTS OF OPERATIONS
(In thousands, except per share data)
(Unaudited)
Three Months Ended June 30, | Six Months Ended June 30, | ||||||||||||||
2015 | 2014 | 2015 | 2014 | ||||||||||||
Revenues: | |||||||||||||||
Rental income | $ | 99,243 | $ | 88,946 | $ | 197,695 | $ | 179,398 | |||||||
Interest and other operating income | 68 | 725 | 136 | 1,577 | |||||||||||
Total revenues | 99,311 | 89,671 | 197,831 | 180,975 | |||||||||||
Expenses: | |||||||||||||||
Rental | 29,237 | 27,064 | 59,934 | 56,653 | |||||||||||
General and administrative | 6,224 | 5,903 | 12,799 | 12,202 | |||||||||||
Acquisition-related | 1,101 | 4,869 | 2,458 | 5,845 | |||||||||||
Depreciation and amortization | 38,066 | 33,602 | 74,661 | 68,544 | |||||||||||
Impairment | 1,655 | — | 1,655 | — | |||||||||||
Total expenses | 76,283 | 71,438 | 151,507 | 143,244 | |||||||||||
Income before other income (expense) | 23,028 | 18,233 | 46,324 | 37,731 | |||||||||||
Interest expense: | |||||||||||||||
Interest related to derivative financial instruments | (820 | ) | (1,370 | ) | (1,375 | ) | (2,715 | ) | |||||||
Net gain (loss) on change in fair value of derivative financial instruments | 1,314 | (2,580 | ) | (696 | ) | (3,421 | ) | ||||||||
Total interest related to derivative financial instruments, including net change in fair value of derivative financial instruments | 494 | (3,950 | ) | (2,071 | ) | (6,136 | ) | ||||||||
Interest related to debt | (14,159 | ) | (11,779 | ) | (27,963 | ) | (23,683 | ) | |||||||
Gain on extinguishment of debt | 121 | 365 | 121 | 365 | |||||||||||
Other income | 4 | 14 | 19 | 40 | |||||||||||
Net income | $ | 9,488 | $ | 2,883 | $ | 16,430 | $ | 8,317 | |||||||
Net income attributable to noncontrolling interests | (196 | ) | (28 | ) | (334 | ) | (170 | ) | |||||||
Net income attributable to common stockholders | $ | 9,292 | $ | 2,855 | $ | 16,096 | $ | 8,147 | |||||||
Earnings per common share - basic: (1) | |||||||||||||||
Net income attributable to common stockholders | $ | 0.07 | $ | 0.02 | $ | 0.13 | $ | 0.07 | |||||||
Earnings per common share - diluted: (1) | |||||||||||||||
Net income attributable to common stockholders | $ | 0.07 | $ | 0.02 | $ | 0.13 | $ | 0.07 | |||||||
Weighted average number of common shares outstanding: (1) | |||||||||||||||
Basic | 125,194 | 119,012 | 125,184 | 118,829 | |||||||||||
Diluted | 127,124 | 120,275 | 127,114 | 120,094 | |||||||||||
(1) For the three and six months ended June 30, 2014, amounts have been adjusted retroactively to reflect a 1-for-2 reverse stock split effected December 15, 2014. | |||||||||||||||
HEALTHCARE TRUST OF AMERICA, INC.
NOI, CASH NOI AND SAME-PROPERTY CASH NOI
(In thousands)
Three Months Ended June 30, | |||||||
2015 | 2014 | ||||||
Net income | $ | 9,488 | $ | 2,883 | |||
General and administrative expenses | 6,224 | 5,903 | |||||
Acquisition-related expenses | 1,101 | 4,869 | |||||
Depreciation and amortization expense | 38,066 | 33,602 | |||||
Impairment | 1,655 | — | |||||
Interest expense and net change in fair value of derivative financial instruments | 13,665 | 15,729 | |||||
Gain on extinguishment of debt | (121 | ) | (365 | ) | |||
Other income | (4 | ) | (14 | ) | |||
NOI | $ | 70,074 | $ | 62,607 | |||
NOI percentage growth | 11.9 | % | |||||
NOI | $ | 70,074 | $ | 62,607 | |||
Straight-line rent adjustments, net | (2,066 | ) | (1,553 | ) | |||
Amortization of below and above market leases/leasehold interests, net | 572 | 607 | |||||
Cash NOI | $ | 68,580 | $ | 61,661 | |||
Notes receivable interest income | — | (564 | ) | ||||
Non Same-Property Cash NOI | (10,599 | ) | (4,792 | ) | |||
Same-Property Cash NOI (1) | $ | 57,981 | $ | 56,305 | |||
Same-Property Cash NOI percentage growth | 3.0 | % | |||||
(1) Same-Property includes 268 buildings for the three months ended June 30, 2015 and 2014. | |||||||
NOI is a non-GAAP financial measure that is defined as net income or loss (computed in accordance with GAAP) before: (i) general and administrative expenses; (ii) acquisition-related expenses; (iii) depreciation and amortization expense; (iv) impairment; (v) interest expense and net change in fair value of derivative financial instruments; (vi) gain or loss on extinguishment of debt; and (vii) other income or expense. HTA believes that NOI provides an accurate measure of the operating performance of its operating assets because NOI excludes certain items that are not associated with the management of the properties. Additionally, HTA believes that NOI is a widely accepted measure of comparative operating performance of real estate investment trusts (“REITs”). However, HTA’s use of the term NOI may not be comparable to that of other REITs as they may have different methodologies for computing this amount. NOI should not be considered as an alternative to net income or loss (computed in accordance with GAAP) as an indicator of our financial performance. NOI should be reviewed in connection with other GAAP measurements.
Cash NOI is a non-GAAP financial measure which excludes from NOI: (i) straight-line rent adjustments, net; (ii) amortization of below and above market leases/leasehold interests, net; and (iii) lease termination fees. HTA believes that Cash NOI provides another measurement of the operating performance of its operating assets. Additionally, HTA believes that Cash NOI is a widely accepted measure of comparative operating performance of REITs. However, HTA’s use of the term Cash NOI may not be comparable to that of other REITs as they may have different methodologies for computing this amount. Cash NOI should not be considered as an alternative to net income or loss (computed in accordance with GAAP) as an indicator of our financial performance. Cash NOI should be reviewed in connection with other GAAP measurements.
To facilitate the comparison of Cash NOI between periods, HTA calculates comparable amounts for a subset of its owned properties referred to as “Same-Property.” Same-Property Cash NOI excludes properties which have not been owned and operated by HTA during the entire span of all periods presented or are intended to be sold in the near term, notes receivable interest income and certain non-routine items. Same-Property Cash NOI should not be considered as an alternative to net income or loss (computed in accordance with GAAP) as an indicator of our financial performance. Same-Property Cash NOI should be reviewed in connection with other GAAP measurements.
HEALTHCARE TRUST OF AMERICA, INC.
FFO, NORMALIZED FFO AND NORMALIZED FAD
(In thousands, except per share data)
Three Months Ended June 30, | Six Months Ended June 30, | ||||||||||||||
2015 | 2014 | 2015 | 2014 | ||||||||||||
Net income attributable to common stockholders | $ | 9,292 | $ | 2,855 | $ | 16,096 | $ | 8,147 | |||||||
Depreciation and amortization expense | 37,752 | 33,602 | 74,032 | 68,544 | |||||||||||
Impairment | 1,655 | — | 1,655 | — | |||||||||||
FFO attributable to common stockholders | $ | 48,699 | $ | 36,457 | $ | 91,783 | $ | 76,691 | |||||||
Acquisition-related expenses | 1,101 | 4,869 | 2,458 | 5,845 | |||||||||||
Net (gain) loss on change in fair value of derivative financial instruments | (1,314 | ) | 2,580 | 696 | 3,421 | ||||||||||
Gain on extinguishment of debt | (121 | ) | (365 | ) | (121 | ) | (365 | ) | |||||||
Noncontrolling income (loss) from partnership units included in diluted shares | 172 | (12 | ) | 277 | 92 | ||||||||||
Other normalizing items | — | — | 89 | 209 | |||||||||||
Normalized FFO attributable to common stockholders | $ | 48,537 | $ | 43,529 | $ | 95,182 | $ | 85,893 | |||||||
Other income | (4 | ) | (14 | ) | (19 | ) | (40 | ) | |||||||
Non-cash compensation expense | 1,190 | 866 | 3,104 | 2,254 | |||||||||||
Straight-line rent adjustments, net | (2,066 | ) | (1,553 | ) | (4,085 | ) | (3,653 | ) | |||||||
Amortization of below and above market leases/leasehold interests, net | 572 | 607 | 1,152 | 1,275 | |||||||||||
Deferred revenue - tenant improvement related | (140 | ) | (139 | ) | (269 | ) | (272 | ) | |||||||
Amortization of deferred financing costs and debt discount/premium | 804 | 553 | 1,743 | 1,114 | |||||||||||
Recurring capital expenditures, tenant improvements and leasing commissions | (4,447 | ) | (4,564 | ) | (8,056 | ) | (8,559 | ) | |||||||
Normalized FAD attributable to common stockholders | $ | 44,446 | $ | 39,285 | $ | 88,752 | $ | 78,012 | |||||||
Net income attributable to common stockholders per diluted share (1) | $ | 0.07 | $ | 0.02 | $ | 0.13 | $ | 0.07 | |||||||
FFO adjustments per diluted share, net (1) | 0.31 | 0.28 | 0.59 | 0.57 | |||||||||||
FFO attributable to common stockholders per diluted share (1) | $ | 0.38 | $ | 0.30 | $ | 0.72 | $ | 0.64 | |||||||
Normalized FFO adjustments per diluted share, net (1) | 0.00 | 0.06 | 0.03 | 0.08 | |||||||||||
Normalized FFO attributable to common stockholders per diluted share (1) | $ | 0.38 | $ | 0.36 | $ | 0.75 | $ | 0.72 | |||||||
Normalized FAD adjustments per diluted share, net (1) | (0.03 | ) | (0.03 | ) | (0.05 | ) | (0.07 | ) | |||||||
Normalized FAD attributable to common stockholders per diluted share (1) | $ | 0.35 | $ | 0.33 | $ | 0.70 | $ | 0.65 | |||||||
Weighted average number of diluted common shares outstanding (1) | 127,124 | 120,275 | 127,114 | 120,094 | |||||||||||
(1) For the three and six months ended June 30, 2014, amounts have been adjusted retroactively to reflect a 1-for-2 reverse stock split effected December 15, 2014. | |||||||||||||||
HTA computes FFO in accordance with the current standards established by the National Association of Real Estate Investment Trusts (“NAREIT”). NAREIT defines FFO, as net income or loss attributable to common stockholders (computed in accordance with GAAP), excluding gains or losses from the sales of real estate property and impairment write-downs of depreciable assets, plus real estate depreciation and amortization, and after adjustments for unconsolidated partnerships and joint ventures. HTA presents this non-GAAP financial measure because it considers it an important supplemental measure of its operating performance and believes it is frequently used by securities analysts, investors and other interested parties in the evaluation of REITs. Historical cost accounting assumes that the value of real estate assets diminishes ratably over time. Since real asset values have historically risen or fallen based on market conditions, many industry investors have considered presentation of operating results for real estate companies that use historical cost accounting to be insufficient by themselves. Because FFO excludes depreciation and amortization unique to real estate, among other items, it provides a perspective not immediately apparent from net income or loss attributable to common stockholders.
HTA’s methodology for calculating FFO may be different from methods utilized by other REITs and, accordingly, may not be comparable to such other REITs. FFO should not be considered as an alternative to net income or loss attributable to common stockholders (computed in accordance with GAAP) as an indicator of our financial performance, nor is it indicative of cash available to fund cash needs. FFO should be reviewed in connection with other GAAP measurements.
HTA computes Normalized FFO, which excludes from FFO: (i) acquisition-related expenses; (ii) net gain or loss on change in fair value of derivative financial instruments; (iii) gain or loss on extinguishment of debt; (iv) noncontrolling income or loss from partnership units included in diluted shares; and (v) other normalizing items. HTA presents this non-GAAP financial measure because it allows for the comparison of our operating performance to other REITs and between periods on a consistent basis. HTA’s methodology for calculating Normalized FFO may be different from the methods utilized by other REITs and, accordingly, may not be comparable to other REITs. Normalized FFO should not be considered as an alternative to net income or loss attributable to common stockholders (computed in accordance with GAAP) as an indicator of our financial performance, nor is it indicative of cash available to fund cash needs. Normalized FFO should be reviewed in connection with other GAAP measurements.
HTA also computes Normalized FAD, which excludes from Normalized FFO: (i) other income or expense; (ii) non-cash compensation expense; (iii) straight-line rent adjustments, net; (iv) amortization of below and above market leases/leasehold interests, net; (v) deferred revenue - tenant improvement related; (vi) amortization of deferred financing costs and debt premium/discount; and (vii) recurring capital expenditures, tenant improvements and leasing commissions. HTA believes this non-GAAP financial measure provides a meaningful supplemental measure of our operating performance. Normalized FAD should not be considered as an alternative to net income or loss attributable to common stockholders (computed in accordance with GAAP) as an indicator of our financial performance, nor is it indicative of cash available to fund all of cash needs. Normalized FAD should be reviewed in connection with other GAAP measurements.
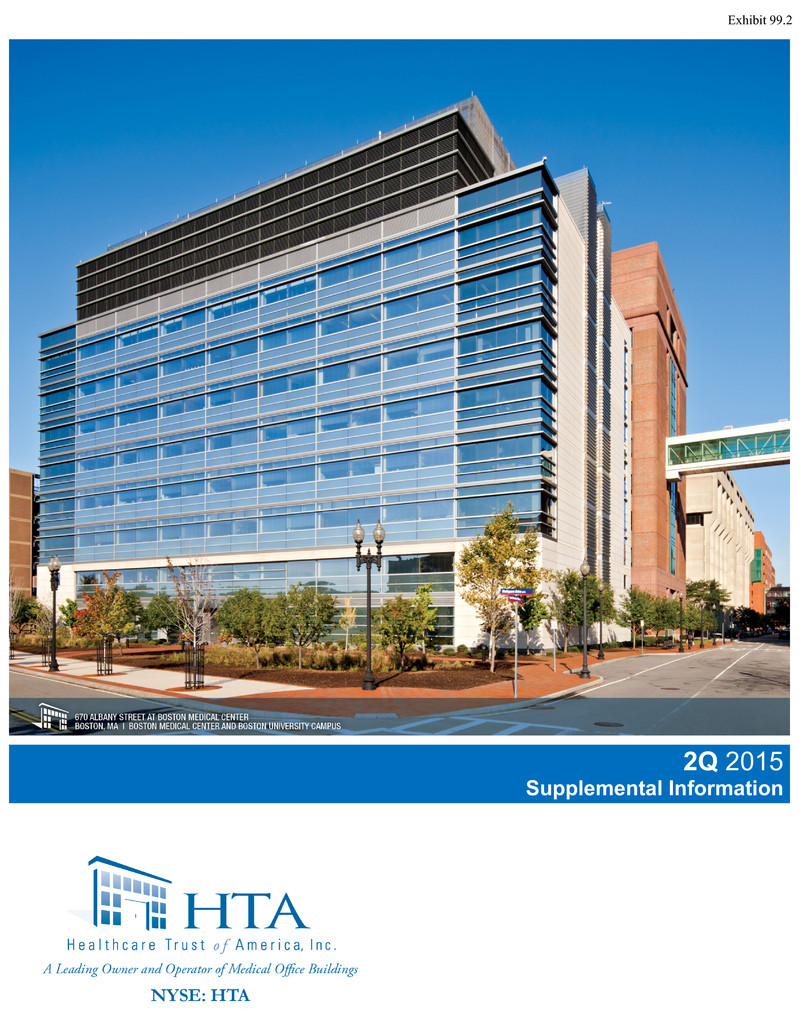
99.1 2Q 2015 Supplemental Information Exhibit 99.2
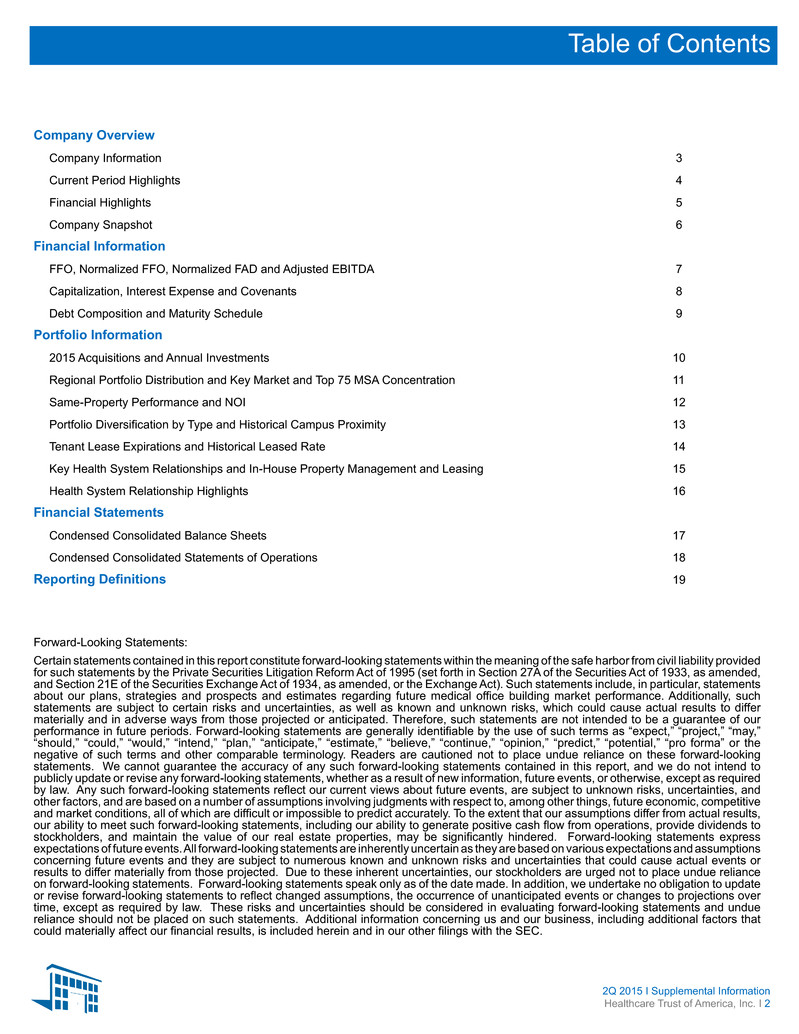
Company Overview Company Information 3 Current Period Highlights 4 Financial Highlights 5 Company Snapshot 6 Financial Information FFO, Normalized FFO, Normalized FAD and Adjusted EBITDA 7 Capitalization, Interest Expense and Covenants 8 Debt Composition and Maturity Schedule 9 Portfolio Information 2015 Acquisitions and Annual Investments 10 Regional Portfolio Distribution and Key Market and Top 75 MSA Concentration 11 Same-Property Performance and NOI 12 Portfolio Diversification by Type and Historical Campus Proximity 13 Tenant Lease Expirations and Historical Leased Rate 14 Key Health System Relationships and In-House Property Management and Leasing 15 Health System Relationship Highlights 16 Financial Statements Condensed Consolidated Balance Sheets 17 Condensed Consolidated Statements of Operations 18 Reporting Definitions 19 Forward-Looking Statements: Certain statements contained in this report constitute forward-looking statements within the meaning of the safe harbor from civil liability provided for such statements by the Private Securities Litigation Reform Act of 1995 (set forth in Section 27A of the Securities Act of 1933, as amended, and Section 21E of the Securities Exchange Act of 1934, as amended, or the Exchange Act). Such statements include, in particular, statements about our plans, strategies and prospects and estimates regarding future medical office building market performance. Additionally, such statements are subject to certain risks and uncertainties, as well as known and unknown risks, which could cause actual results to differ materially and in adverse ways from those projected or anticipated. Therefore, such statements are not intended to be a guarantee of our performance in future periods. Forward-looking statements are generally identifiable by the use of such terms as “expect,” “project,” “may,” “should,” “could,” “would,” “intend,” “plan,” “anticipate,” “estimate,” “believe,” “continue,” “opinion,” “predict,” “potential,” “pro forma” or the negative of such terms and other comparable terminology. Readers are cautioned not to place undue reliance on these forward-looking statements. We cannot guarantee the accuracy of any such forward-looking statements contained in this report, and we do not intend to publicly update or revise any forward-looking statements, whether as a result of new information, future events, or otherwise, except as required by law. Any such forward-looking statements reflect our current views about future events, are subject to unknown risks, uncertainties, and other factors, and are based on a number of assumptions involving judgments with respect to, among other things, future economic, competitive and market conditions, all of which are difficult or impossible to predict accurately. To the extent that our assumptions differ from actual results, our ability to meet such forward-looking statements, including our ability to generate positive cash flow from operations, provide dividends to stockholders, and maintain the value of our real estate properties, may be significantly hindered. Forward-looking statements express expectations of future events. All forward-looking statements are inherently uncertain as they are based on various expectations and assumptions concerning future events and they are subject to numerous known and unknown risks and uncertainties that could cause actual events or results to differ materially from those projected. Due to these inherent uncertainties, our stockholders are urged not to place undue reliance on forward-looking statements. Forward-looking statements speak only as of the date made. In addition, we undertake no obligation to update or revise forward-looking statements to reflect changed assumptions, the occurrence of unanticipated events or changes to projections over time, except as required by law. These risks and uncertainties should be considered in evaluating forward-looking statements and undue reliance should not be placed on such statements. Additional information concerning us and our business, including additional factors that could materially affect our financial results, is included herein and in our other filings with the SEC. Table of Contents 2Q 2015 I Supplemental Information Healthcare Trust of America, Inc. I 2
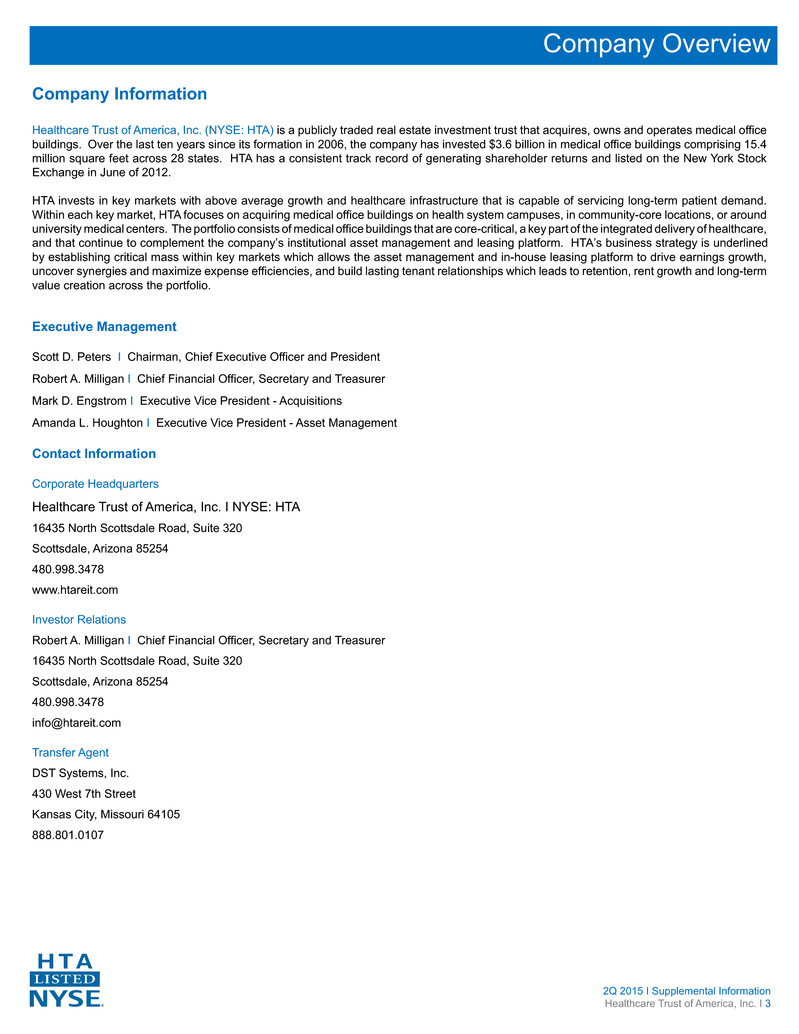
Company Information Healthcare Trust of America, Inc. (NYSE: HTA) is a publicly traded real estate investment trust that acquires, owns and operates medical office buildings. Over the last ten years since its formation in 2006, the company has invested $3.6 billion in medical office buildings comprising 15.4 million square feet across 28 states. HTA has a consistent track record of generating shareholder returns and listed on the New York Stock Exchange in June of 2012. HTA invests in key markets with above average growth and healthcare infrastructure that is capable of servicing long-term patient demand. Within each key market, HTA focuses on acquiring medical office buildings on health system campuses, in community-core locations, or around university medical centers. The portfolio consists of medical office buildings that are core-critical, a key part of the integrated delivery of healthcare, and that continue to complement the company’s institutional asset management and leasing platform. HTA’s business strategy is underlined by establishing critical mass within key markets which allows the asset management and in-house leasing platform to drive earnings growth, uncover synergies and maximize expense efficiencies, and build lasting tenant relationships which leads to retention, rent growth and long-term value creation across the portfolio. Company Overview Executive Management Scott D. Peters I Chairman, Chief Executive Officer and President Robert A. Milligan I Chief Financial Officer, Secretary and Treasurer Mark D. Engstrom I Executive Vice President - Acquisitions Amanda L. Houghton I Executive Vice President - Asset Management Contact Information Corporate Headquarters Healthcare Trust of America, Inc. I NYSE: HTA 16435 North Scottsdale Road, Suite 320 Scottsdale, Arizona 85254 480.998.3478 www.htareit.com Investor Relations Robert A. Milligan I Chief Financial Officer, Secretary and Treasurer 16435 North Scottsdale Road, Suite 320 Scottsdale, Arizona 85254 480.998.3478 [email protected] Transfer Agent DST Systems, Inc. 430 West 7th Street Kansas City, Missouri 64105 888.801.0107 2Q 2015 I Supplemental Information Healthcare Trust of America, Inc. I 3
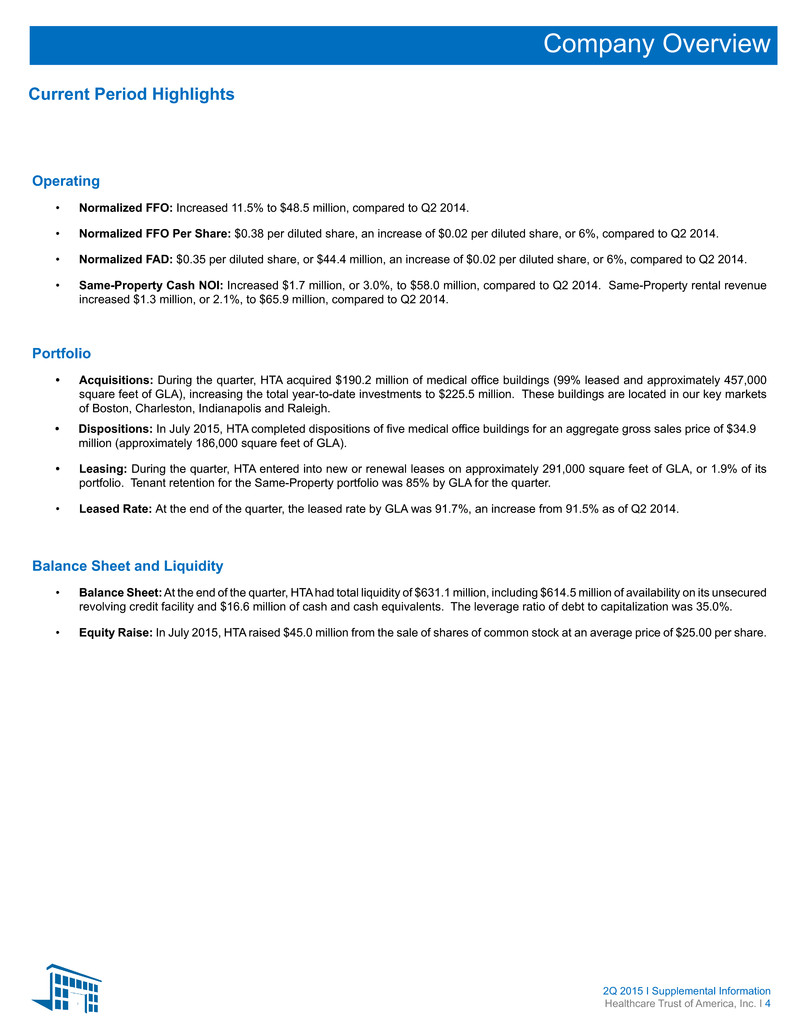
Operating • Normalized FFO: Increased 11.5% to $48.5 million, compared to Q2 2014. • Normalized FFO Per Share: $0.38 per diluted share, an increase of $0.02 per diluted share, or 6%, compared to Q2 2014. • Normalized FAD: $0.35 per diluted share, or $44.4 million, an increase of $0.02 per diluted share, or 6%, compared to Q2 2014. • Same-Property Cash NOI: Increased $1.7 million, or 3.0%, to $58.0 million, compared to Q2 2014. Same-Property rental revenue increased $1.3 million, or 2.1%, to $65.9 million, compared to Q2 2014. Portfolio • Acquisitions: During the quarter, HTA acquired $190.2 million of medical office buildings (99% leased and approximately 457,000 square feet of GLA), increasing the total year-to-date investments to $225.5 million. These buildings are located in our key markets of Boston, Charleston, Indianapolis and Raleigh. • Dispositions: In July 2015, HTA completed dispositions of five medical office buildings for an aggregate gross sales price of $34.9 million (approximately 186,000 square feet of GLA). • Leasing: During the quarter, HTA entered into new or renewal leases on approximately 291,000 square feet of GLA, or 1.9% of its portfolio. Tenant retention for the Same-Property portfolio was 85% by GLA for the quarter. • Leased Rate: At the end of the quarter, the leased rate by GLA was 91.7%, an increase from 91.5% as of Q2 2014. Balance Sheet and Liquidity • Balance Sheet: At the end of the quarter, HTA had total liquidity of $631.1 million, including $614.5 million of availability on its unsecured revolving credit facility and $16.6 million of cash and cash equivalents. The leverage ratio of debt to capitalization was 35.0%. • Equity Raise: In July 2015, HTA raised $45.0 million from the sale of shares of common stock at an average price of $25.00 per share. Company Overview Current Period Highlights 2Q 2015 I Supplemental Information Healthcare Trust of America, Inc. I 4
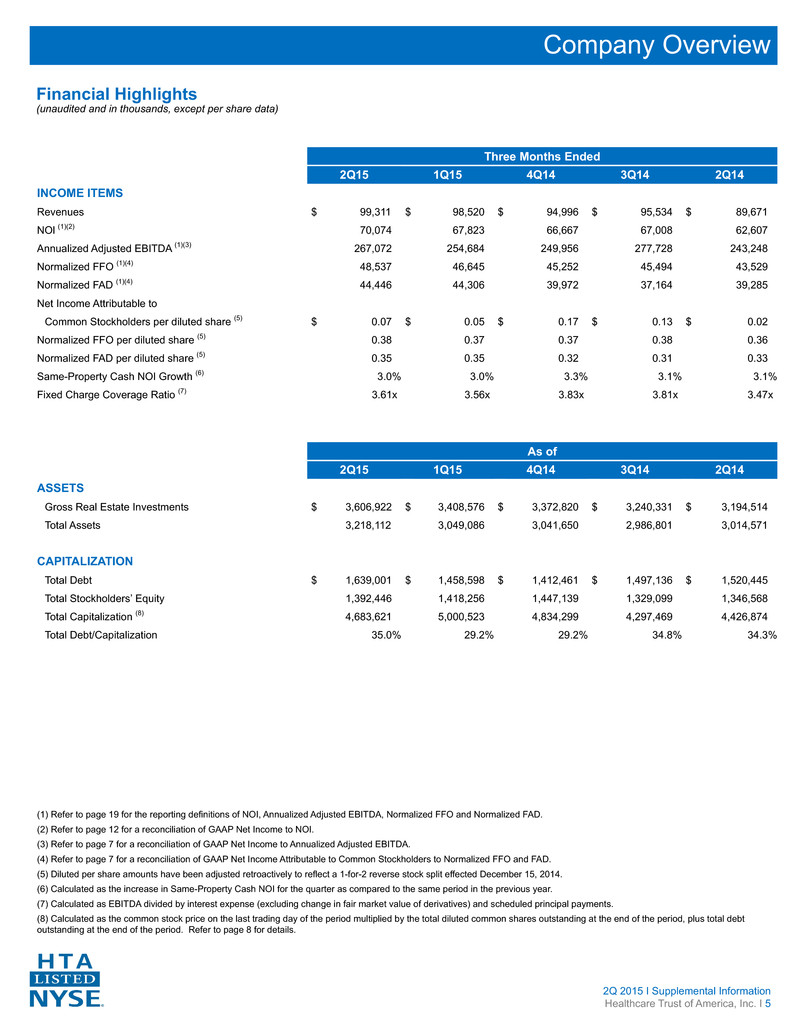
(1) Refer to page 19 for the reporting definitions of NOI, Annualized Adjusted EBITDA, Normalized FFO and Normalized FAD. (2) Refer to page 12 for a reconciliation of GAAP Net Income to NOI. (3) Refer to page 7 for a reconciliation of GAAP Net Income to Annualized Adjusted EBITDA. (4) Refer to page 7 for a reconciliation of GAAP Net Income Attributable to Common Stockholders to Normalized FFO and FAD. (5) Diluted per share amounts have been adjusted retroactively to reflect a 1-for-2 reverse stock split effected December 15, 2014. (6) Calculated as the increase in Same-Property Cash NOI for the quarter as compared to the same period in the previous year. (7) Calculated as EBITDA divided by interest expense (excluding change in fair market value of derivatives) and scheduled principal payments. (8) Calculated as the common stock price on the last trading day of the period multiplied by the total diluted common shares outstanding at the end of the period, plus total debt outstanding at the end of the period. Refer to page 8 for details. Financial Highlights (unaudited and in thousands, except per share data) Three Months Ended 2Q15 1Q15 4Q14 3Q14 2Q14 INCOME ITEMS Revenues $ 99,311 $ 98,520 $ 94,996 $ 95,534 $ 89,671 NOl (1)(2) 70,074 67,823 66,667 67,008 62,607 Annualized Adjusted EBITDA (1)(3) 267,072 254,684 249,956 277,728 243,248 Normalized FFO (1)(4) 48,537 46,645 45,252 45,494 43,529 Normalized FAD (1)(4) 44,446 44,306 39,972 37,164 39,285 Net Income Attributable to Common Stockholders per diluted share (5) $ 0.07 $ 0.05 $ 0.17 $ 0.13 $ 0.02 Normalized FFO per diluted share (5) 0.38 0.37 0.37 0.38 0.36 Normalized FAD per diluted share (5) 0.35 0.35 0.32 0.31 0.33 Same-Property Cash NOI Growth (6) 3.0% 3.0% 3.3% 3.1% 3.1% Fixed Charge Coverage Ratio (7) 3.61x 3.56x 3.83x 3.81x 3.47x As of 2Q15 1Q15 4Q14 3Q14 2Q14 ASSETS Gross Real Estate Investments $ 3,606,922 $ 3,408,576 $ 3,372,820 $ 3,240,331 $ 3,194,514 Total Assets 3,218,112 3,049,086 3,041,650 2,986,801 3,014,571 CAPITALIZATION Total Debt $ 1,639,001 $ 1,458,598 $ 1,412,461 $ 1,497,136 $ 1,520,445 Total Stockholders’ Equity 1,392,446 1,418,256 1,447,139 1,329,099 1,346,568 Total Capitalization (8) 4,683,621 5,000,523 4,834,299 4,297,469 4,426,874 Total Debt/Capitalization 35.0% 29.2% 29.2% 34.8% 34.3% Company Overview 2Q 2015 I Supplemental Information Healthcare Trust of America, Inc. I 5
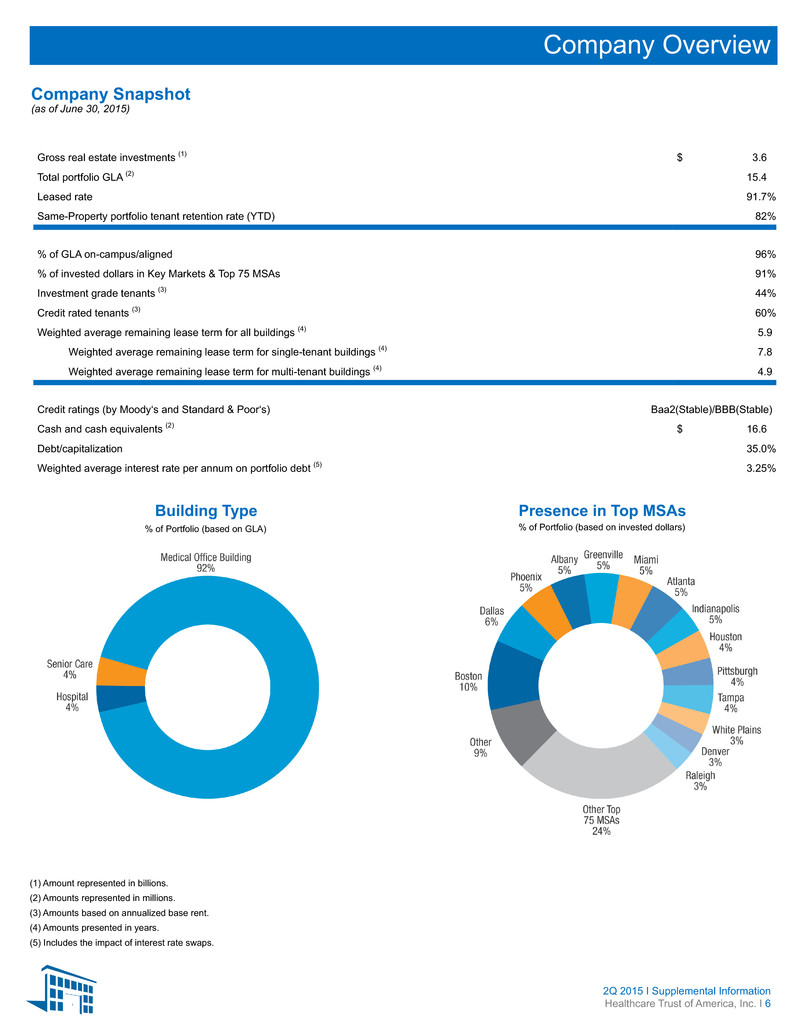
Gross real estate investments (1) $ 3.6 Total portfolio GLA (2) 15.4 Leased rate 91.7% Same-Property portfolio tenant retention rate (YTD) 82% % of GLA on-campus/aligned 96% % of invested dollars in Key Markets & Top 75 MSAs 91% Investment grade tenants (3) 44% Credit rated tenants (3) 60% Weighted average remaining lease term for all buildings (4) 5.9 Weighted average remaining lease term for single-tenant buildings (4) 7.8 Weighted average remaining lease term for multi-tenant buildings (4) 4.9 Credit ratings (by Moody‘s and Standard & Poor‘s) Baa2(Stable)/BBB(Stable) Cash and cash equivalents (2) $ 16.6 Debt/capitalization 35.0% Weighted average interest rate per annum on portfolio debt (5) 3.25% Building Type Presence in Top MSAs Company Snapshot (as of June 30, 2015) Company Overview 2Q 2015 I Supplemental Information Healthcare Trust of America, Inc. I 6 (1) Amount represented in billions. (2) Amounts represented in millions. (3) Amounts based on annualized base rent. (4) Amounts presented in years. (5) Includes the impact of interest rate swaps. % of Portfolio (based on GLA) % of Portfolio (based on invested dollars)
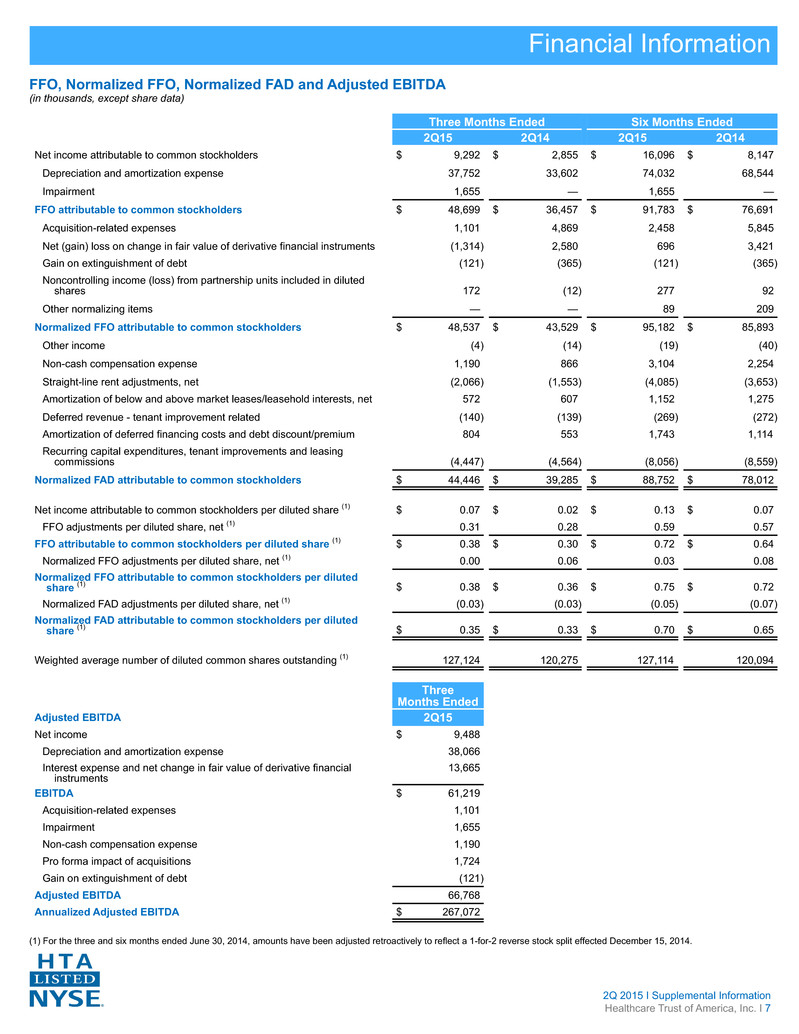
Three Months Ended Six Months Ended 2Q15 2Q14 2Q15 2Q14 Net income attributable to common stockholders $ 9,292 $ 2,855 $ 16,096 $ 8,147 Depreciation and amortization expense 37,752 33,602 74,032 68,544 Impairment 1,655 — 1,655 — FFO attributable to common stockholders $ 48,699 $ 36,457 $ 91,783 $ 76,691 Acquisition-related expenses 1,101 4,869 2,458 5,845 Net (gain) loss on change in fair value of derivative financial instruments (1,314) 2,580 696 3,421 Gain on extinguishment of debt (121) (365) (121) (365) Noncontrolling income (loss) from partnership units included in diluted shares 172 (12) 277 92 Other normalizing items — — 89 209 Normalized FFO attributable to common stockholders $ 48,537 $ 43,529 $ 95,182 $ 85,893 Other income (4) (14) (19) (40) Non-cash compensation expense 1,190 866 3,104 2,254 Straight-line rent adjustments, net (2,066) (1,553) (4,085) (3,653) Amortization of below and above market leases/leasehold interests, net 572 607 1,152 1,275 Deferred revenue - tenant improvement related (140) (139) (269) (272) Amortization of deferred financing costs and debt discount/premium 804 553 1,743 1,114 Recurring capital expenditures, tenant improvements and leasing commissions (4,447) (4,564) (8,056) (8,559) Normalized FAD attributable to common stockholders $ 44,446 $ 39,285 $ 88,752 $ 78,012 Net income attributable to common stockholders per diluted share (1) $ 0.07 $ 0.02 $ 0.13 $ 0.07 FFO adjustments per diluted share, net (1) 0.31 0.28 0.59 0.57 FFO attributable to common stockholders per diluted share (1) $ 0.38 $ 0.30 $ 0.72 $ 0.64 Normalized FFO adjustments per diluted share, net (1) 0.00 0.06 0.03 0.08 Normalized FFO attributable to common stockholders per diluted share (1) $ 0.38 $ 0.36 $ 0.75 $ 0.72 Normalized FAD adjustments per diluted share, net (1) (0.03) (0.03) (0.05) (0.07) Normalized FAD attributable to common stockholders per diluted share (1) $ 0.35 $ 0.33 $ 0.70 $ 0.65 Weighted average number of diluted common shares outstanding (1) 127,124 120,275 127,114 120,094 Three Months Ended Adjusted EBITDA 2Q15 Net income $ 9,488 Depreciation and amortization expense 38,066 Interest expense and net change in fair value of derivative financial instruments 13,665 EBITDA $ 61,219 Acquisition-related expenses 1,101 Impairment 1,655 Non-cash compensation expense 1,190 Pro forma impact of acquisitions 1,724 Gain on extinguishment of debt (121) Adjusted EBITDA 66,768 Annualized Adjusted EBITDA $ 267,072 FFO, Normalized FFO, Normalized FAD and Adjusted EBITDA (in thousands, except share data) Financial Information 2Q 2015 I Supplemental Information Healthcare Trust of America, Inc. I 7 (1) For the three and six months ended June 30, 2014, amounts have been adjusted retroactively to reflect a 1-for-2 reverse stock split effected December 15, 2014.
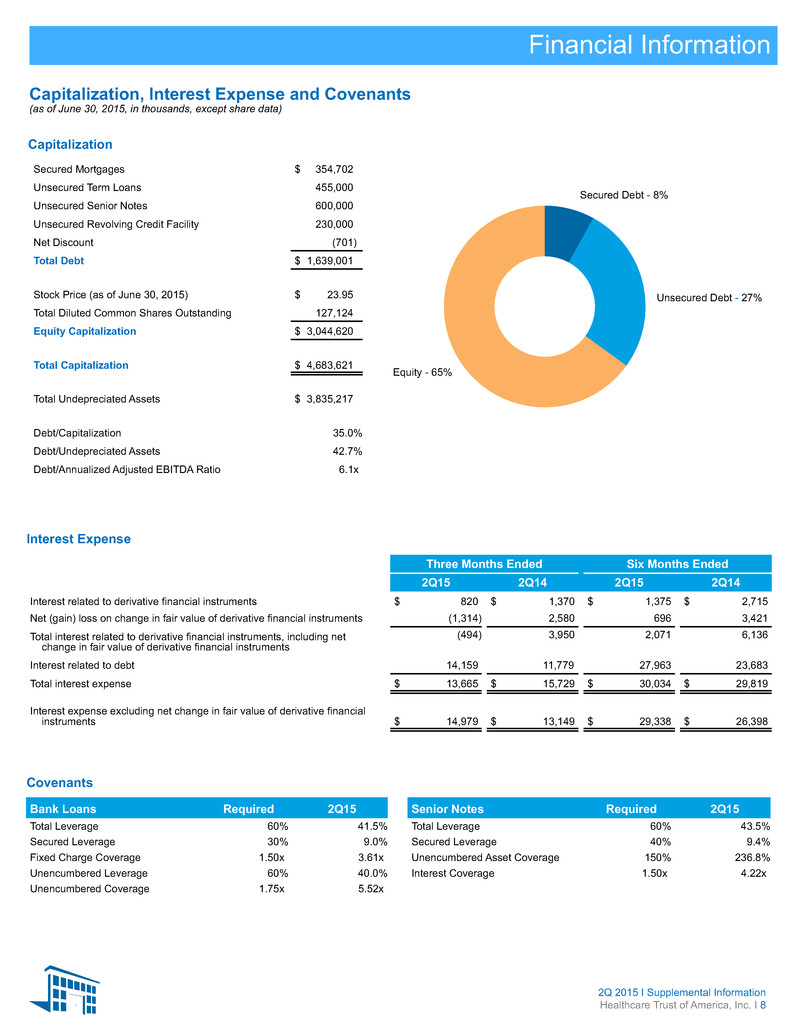
Capitalization Secured Mortgages $ 354,702 Unsecured Term Loans 455,000 Unsecured Senior Notes 600,000 Unsecured Revolving Credit Facility 230,000 Net Discount (701) Total Debt $ 1,639,001 Stock Price (as of June 30, 2015) $ 23.95 Total Diluted Common Shares Outstanding 127,124 Equity Capitalization $ 3,044,620 Total Capitalization $ 4,683,621 Total Undepreciated Assets $ 3,835,217 Debt/Capitalization 35.0% Debt/Undepreciated Assets 42.7% Debt/Annualized Adjusted EBITDA Ratio 6.1x Equity - 65% Secured Debt - 8% Unsecured Debt - 27% Financial Information Capitalization, Interest Expense and Covenants (as of June 30, 2015, in thousands, except share data) 2Q 2015 I Supplemental Information Healthcare Trust of America, Inc. I 8 Interest Expense Covenants Three Months Ended Six Months Ended 2Q15 2Q14 2Q15 2Q14 Interest related to derivative financial instruments $ 820 $ 1,370 $ 1,375 $ 2,715 Net (gain) loss on change in fair value of derivative financial instruments (1,314) 2,580 696 3,421 Total interest related to derivative financial instruments, including net change in fair value of derivative financial instruments (494) 3,950 2,071 6,136 Interest related to debt 14,159 11,779 27,963 23,683 Total interest expense $ 13,665 $ 15,729 $ 30,034 $ 29,819 Interest expense excluding net change in fair value of derivative financial instruments $ 14,979 $ 13,149 $ 29,338 $ 26,398 Bank Loans Required 2Q15 Total Leverage 60% 41.5% Secured Leverage 30% 9.0% Fixed Charge Coverage 1.50x 3.61x Unencumbered Leverage 60% 40.0% Unencumbered Coverage 1.75x 5.52x Senior Notes Required 2Q15 Total Leverage 60% 43.5% Secured Leverage 40% 9.4% Unencumbered Asset Coverage 150% 236.8% Interest Coverage 1.50x 4.22x
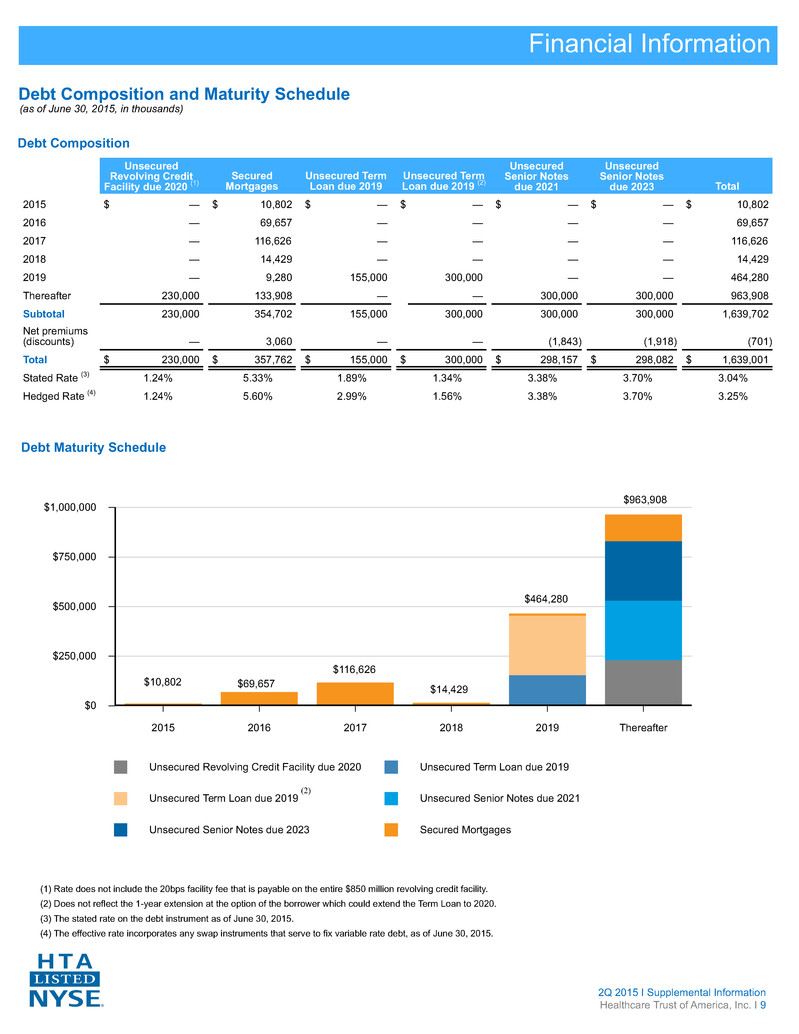
Financial Information Debt Composition and Maturity Schedule (as of June 30, 2015, in thousands) 2Q 2015 I Supplemental Information Healthcare Trust of America, Inc. I 9 Unsecured Revolving Credit Facility due 2020 (1) Secured Mortgages Unsecured Term Loan due 2019 Unsecured Term Loan due 2019 (2) Unsecured Senior Notes due 2021 Unsecured Senior Notes due 2023 Total 2015 $ — $ 10,802 $ — $ — $ — $ — $ 10,802 2016 — 69,657 — — — — 69,657 2017 — 116,626 — — — — 116,626 2018 — 14,429 — — — — 14,429 2019 — 9,280 155,000 300,000 — — 464,280 Thereafter 230,000 133,908 — — 300,000 300,000 963,908 Subtotal 230,000 354,702 155,000 300,000 300,000 300,000 1,639,702 Net premiums (discounts) — 3,060 — — (1,843) (1,918) (701) Total $ 230,000 $ 357,762 $ 155,000 $ 300,000 $ 298,157 $ 298,082 $ 1,639,001 Stated Rate (3) 1.24% 5.33% 1.89% 1.34% 3.38% 3.70% 3.04% Hedged Rate (4) 1.24% 5.60% 2.99% 1.56% 3.38% 3.70% 3.25% Debt Composition (1) Rate does not include the 20bps facility fee that is payable on the entire $850 million revolving credit facility. (2) Does not reflect the 1-year extension at the option of the borrower which could extend the Term Loan to 2020. (3) The stated rate on the debt instrument as of June 30, 2015. (4) The effective rate incorporates any swap instruments that serve to fix variable rate debt, as of June 30, 2015. Debt Maturity Schedule Unsecured Revolving Credit Facility due 2020 Unsecured Term Loan due 2019 Unsecured Term Loan due 2019 Unsecured Senior Notes due 2021 Unsecured Senior Notes due 2023 Secured Mortgages $1,000,000 $750,000 $500,000 $250,000 $0 2015 2016 2017 2018 2019 Thereafter $10,802 $69,657 $116,626 $14,429 $464,280 $963,908 (2)
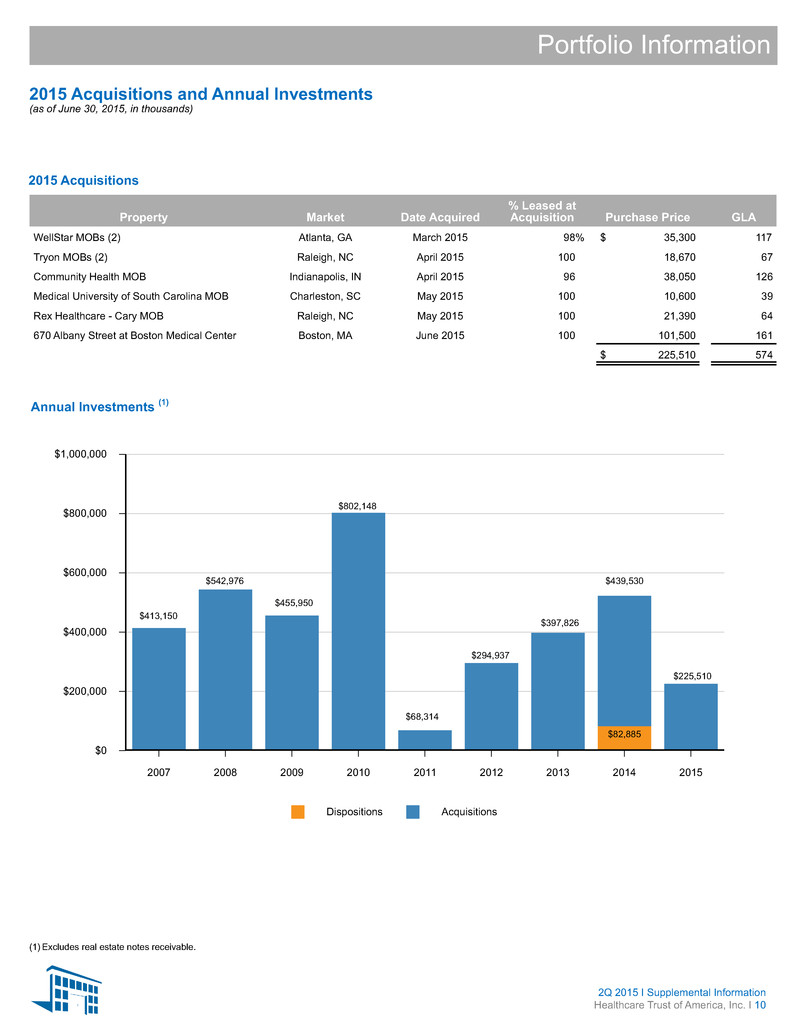
Property Market Date Acquired % Leased at Acquisition Purchase Price GLA WellStar MOBs (2) Atlanta, GA March 2015 98% $ 35,300 117 Tryon MOBs (2) Raleigh, NC April 2015 100 18,670 67 Community Health MOB Indianapolis, IN April 2015 96 38,050 126 Medical University of South Carolina MOB Charleston, SC May 2015 100 10,600 39 Rex Healthcare - Cary MOB Raleigh, NC May 2015 100 21,390 64 670 Albany Street at Boston Medical Center Boston, MA June 2015 100 101,500 161 $ 225,510 574 Portfolio Information 2015 Acquisitions and Annual Investments (as of June 30, 2015, in thousands) 2015 Acquisitions Annual Investments (1) 2Q 2015 I Supplemental Information Healthcare Trust of America, Inc. I 10 Dispositions Acquisitions $1,000,000 $800,000 $600,000 $400,000 $200,000 $0 2007 2008 2009 2010 2011 2012 2013 2014 2015 $82,885 $413,150 $542,976 $455,950 $802,148 $68,314 $294,937 $397,826 $439,530 (1) Excludes real estate notes receivable. $225,510
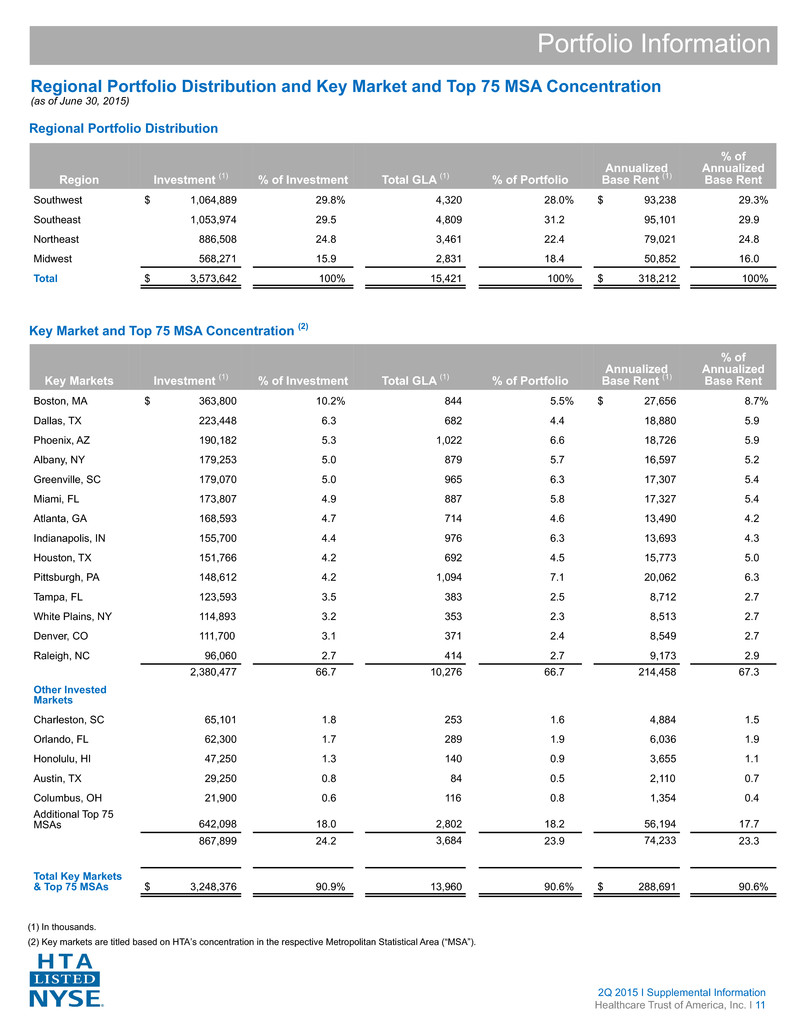
Region Investment (1) % of Investment Total GLA (1) % of Portfolio Annualized Base Rent (1) % of Annualized Base Rent Southwest $ 1,064,889 29.8% 4,320 28.0% $ 93,238 29.3% Southeast 1,053,974 29.5 4,809 31.2 95,101 29.9 Northeast 886,508 24.8 3,461 22.4 79,021 24.8 Midwest 568,271 15.9 2,831 18.4 50,852 16.0 Total $ 3,573,642 100% 15,421 100% $ 318,212 100% Key Markets Investment (1) % of Investment Total GLA (1) % of Portfolio Annualized Base Rent (1) % of Annualized Base Rent Boston, MA $ 363,800 10.2% 844 5.5% $ 27,656 8.7% Dallas, TX 223,448 6.3 682 4.4 18,880 5.9 Phoenix, AZ 190,182 5.3 1,022 6.6 18,726 5.9 Albany, NY 179,253 5.0 879 5.7 16,597 5.2 Greenville, SC 179,070 5.0 965 6.3 17,307 5.4 Miami, FL 173,807 4.9 887 5.8 17,327 5.4 Atlanta, GA 168,593 4.7 714 4.6 13,490 4.2 Indianapolis, IN 155,700 4.4 976 6.3 13,693 4.3 Houston, TX 151,766 4.2 692 4.5 15,773 5.0 Pittsburgh, PA 148,612 4.2 1,094 7.1 20,062 6.3 Tampa, FL 123,593 3.5 383 2.5 8,712 2.7 White Plains, NY 114,893 3.2 353 2.3 8,513 2.7 Denver, CO 111,700 3.1 371 2.4 8,549 2.7 Raleigh, NC 96,060 2.7 414 2.7 9,173 2.9 2,380,477 66.7 10,276 66.7 214,458 67.3 Other Invested Markets Charleston, SC 65,101 1.8 253 1.6 4,884 1.5 Orlando, FL 62,300 1.7 289 1.9 6,036 1.9 Honolulu, HI 47,250 1.3 140 0.9 3,655 1.1 Austin, TX 29,250 0.8 84 0.5 2,110 0.7 Columbus, OH 21,900 0.6 116 0.8 1,354 0.4 Additional Top 75 MSAs 642,098 18.0 2,802 18.2 56,194 17.7 867,899 24.2 3,684 23.9 74,233 23.3 Total Key Markets & Top 75 MSAs $ 3,248,376 90.9% 13,960 90.6% $ 288,691 90.6% Portfolio Information Regional Portfolio Distribution and Key Market and Top 75 MSA Concentration (as of June 30, 2015) Regional Portfolio Distribution Key Market and Top 75 MSA Concentration (2) (1) In thousands. (2) Key markets are titled based on HTA’s concentration in the respective Metropolitan Statistical Area (“MSA”). 2Q 2015 I Supplemental Information Healthcare Trust of America, Inc. I 11
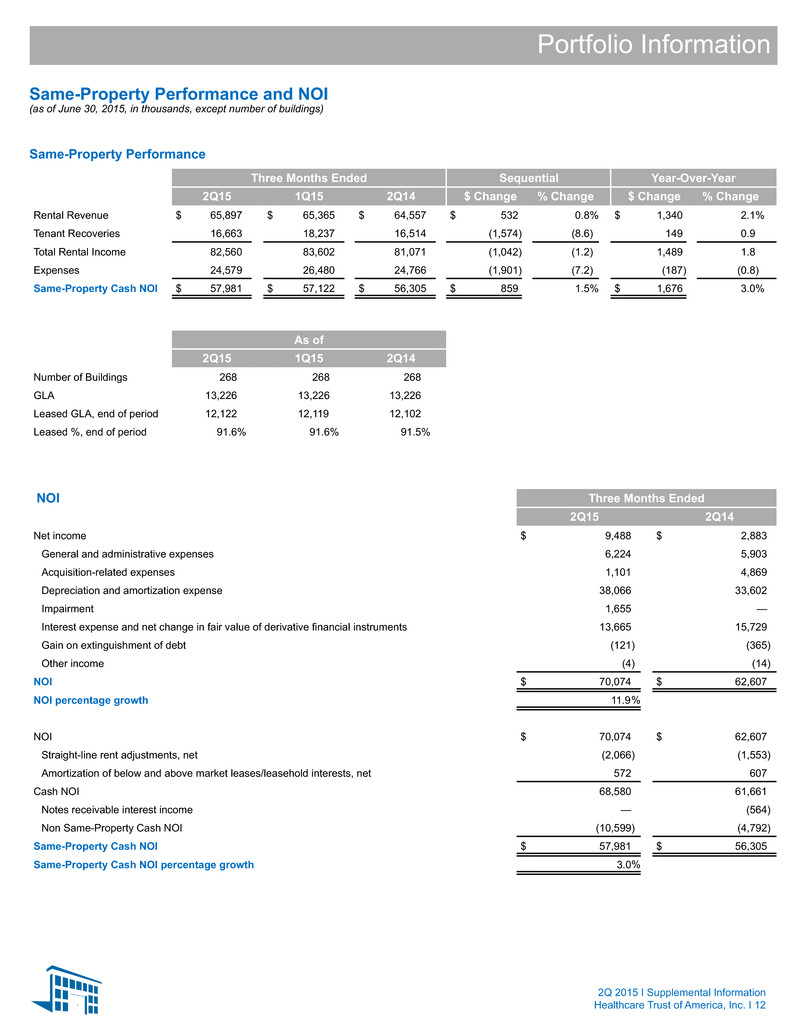
Three Months Ended Sequential Year-Over-Year 2Q15 1Q15 2Q14 $ Change % Change $ Change % Change Rental Revenue $ 65,897 $ 65,365 $ 64,557 $ 532 0.8% $ 1,340 2.1% Tenant Recoveries 16,663 18,237 16,514 (1,574) (8.6) 149 0.9 Total Rental Income 82,560 83,602 81,071 (1,042) (1.2) 1,489 1.8 Expenses 24,579 26,480 24,766 (1,901) (7.2) (187) (0.8) Same-Property Cash NOI $ 57,981 $ 57,122 $ 56,305 $ 859 1.5% $ 1,676 3.0% As of 2Q15 1Q15 2Q14 Number of Buildings 268 268 268 GLA 13,226 13,226 13,226 Leased GLA, end of period 12,122 12,119 12,102 Leased %, end of period 91.6% 91.6% 91.5% NOI Three Months Ended 2Q15 2Q14 Net income $ 9,488 $ 2,883 General and administrative expenses 6,224 5,903 Acquisition-related expenses 1,101 4,869 Depreciation and amortization expense 38,066 33,602 Impairment 1,655 — Interest expense and net change in fair value of derivative financial instruments 13,665 15,729 Gain on extinguishment of debt (121) (365) Other income (4) (14) NOI $ 70,074 $ 62,607 NOI percentage growth 11.9% NOI $ 70,074 $ 62,607 Straight-line rent adjustments, net (2,066) (1,553) Amortization of below and above market leases/leasehold interests, net 572 607 Cash NOI 68,580 61,661 Notes receivable interest income — (564) Non Same-Property Cash NOI (10,599) (4,792) Same-Property Cash NOI $ 57,981 $ 56,305 Same-Property Cash NOI percentage growth 3.0% 2Q 2015 I Supplemental Information Healthcare Trust of America, Inc. I 12 Portfolio Information Same-Property Performance and NOI (as of June 30, 2015, in thousands, except number of buildings) Same-Property Performance
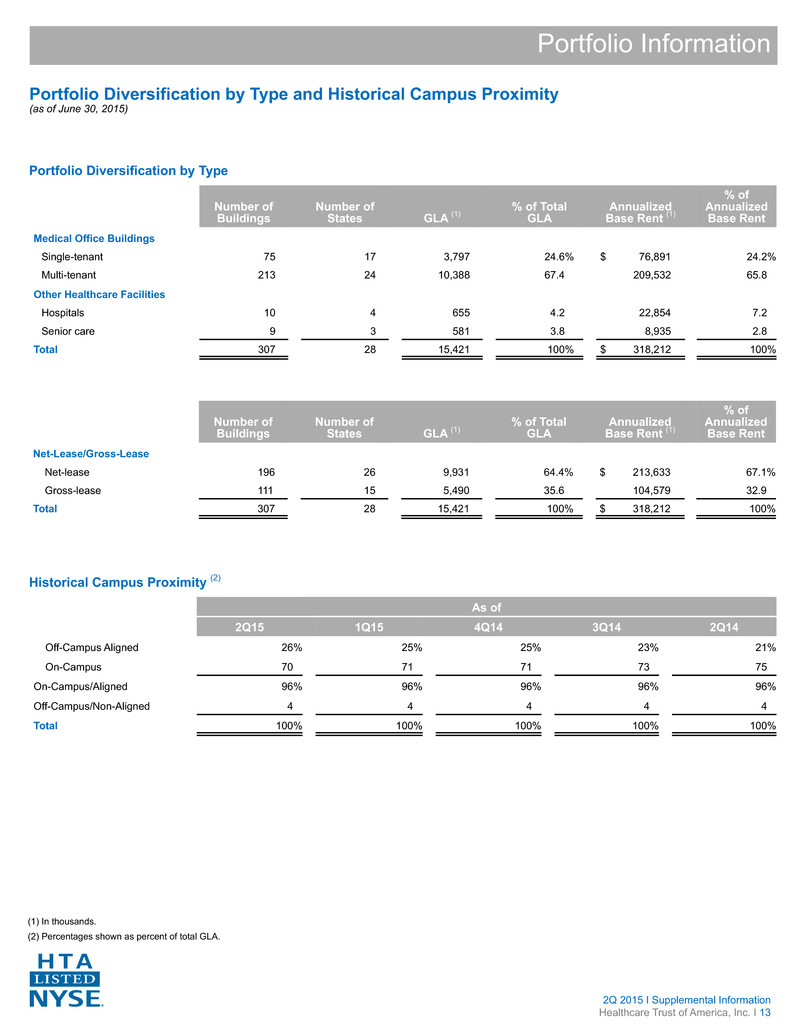
As of 2Q15 1Q15 4Q14 3Q14 2Q14 Off-Campus Aligned 26% 25% 25% 23% 21% On-Campus 70 71 71 73 75 On-Campus/Aligned 96% 96% 96% 96% 96% Off-Campus/Non-Aligned 4 4 4 4 4 Total 100% 100% 100% 100% 100% Number of Buildings Number of States GLA (1) % of Total GLA Annualized Base Rent (1) % of Annualized Base Rent Medical Office Buildings Single-tenant 75 17 3,797 24.6% $ 76,891 24.2% Multi-tenant 213 24 10,388 67.4 209,532 65.8 Other Healthcare Facilities Hospitals 10 4 655 4.2 22,854 7.2 Senior care 9 3 581 3.8 8,935 2.8 Total 307 28 15,421 100% $ 318,212 100% Number of Buildings Number of States GLA (1) % of Total GLA Annualized Base Rent (1) % of Annualized Base Rent Net-Lease/Gross-Lease Net-lease 196 26 9,931 64.4% $ 213,633 67.1% Gross-lease 111 15 5,490 35.6 104,579 32.9 Total 307 28 15,421 100% $ 318,212 100% 2Q 2015 I Supplemental Information Healthcare Trust of America, Inc. I 13 (1) In thousands. (2) Percentages shown as percent of total GLA. Portfolio Information Portfolio Diversification by Type and Historical Campus Proximity (as of June 30, 2015) Portfolio Diversification by Type Historical Campus Proximity (2)
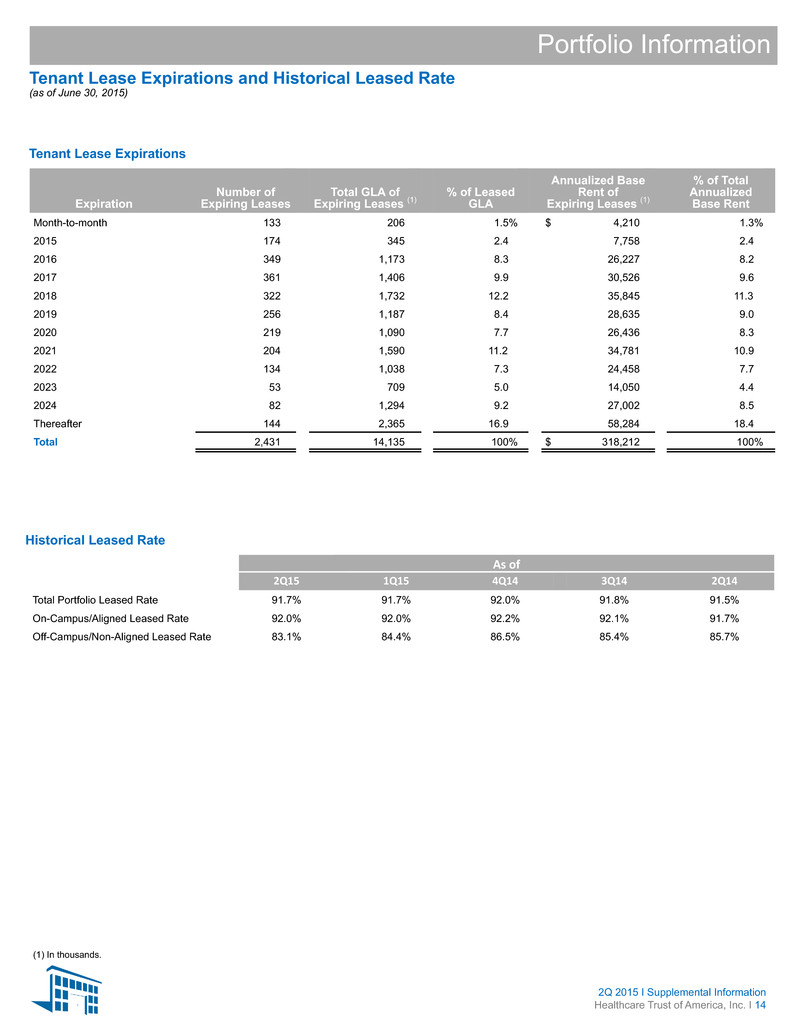
As of 2Q15 1Q15 4Q14 3Q14 2Q14 Total Portfolio Leased Rate 91.7% 91.7% 92.0% 91.8% 91.5% On-Campus/Aligned Leased Rate 92.0% 92.0% 92.2% 92.1% 91.7% Off-Campus/Non-Aligned Leased Rate 83.1% 84.4% 86.5% 85.4% 85.7% Expiration Number of Expiring Leases Total GLA of Expiring Leases (1) % of Leased GLA Annualized Base Rent of Expiring Leases (1) % of Total Annualized Base Rent Month-to-month 133 206 1.5% $ 4,210 1.3% 2015 174 345 2.4 7,758 2.4 2016 349 1,173 8.3 26,227 8.2 2017 361 1,406 9.9 30,526 9.6 2018 322 1,732 12.2 35,845 11.3 2019 256 1,187 8.4 28,635 9.0 2020 219 1,090 7.7 26,436 8.3 2021 204 1,590 11.2 34,781 10.9 2022 134 1,038 7.3 24,458 7.7 2023 53 709 5.0 14,050 4.4 2024 82 1,294 9.2 27,002 8.5 Thereafter 144 2,365 16.9 58,284 18.4 Total 2,431 14,135 100% $ 318,212 100% 2Q 2015 I Supplemental Information Healthcare Trust of America, Inc. I 14 (1) In thousands. Portfolio Information Tenant Lease Expirations and Historical Leased Rate (as of June 30, 2015) Tenant Lease Expirations Historical Leased Rate
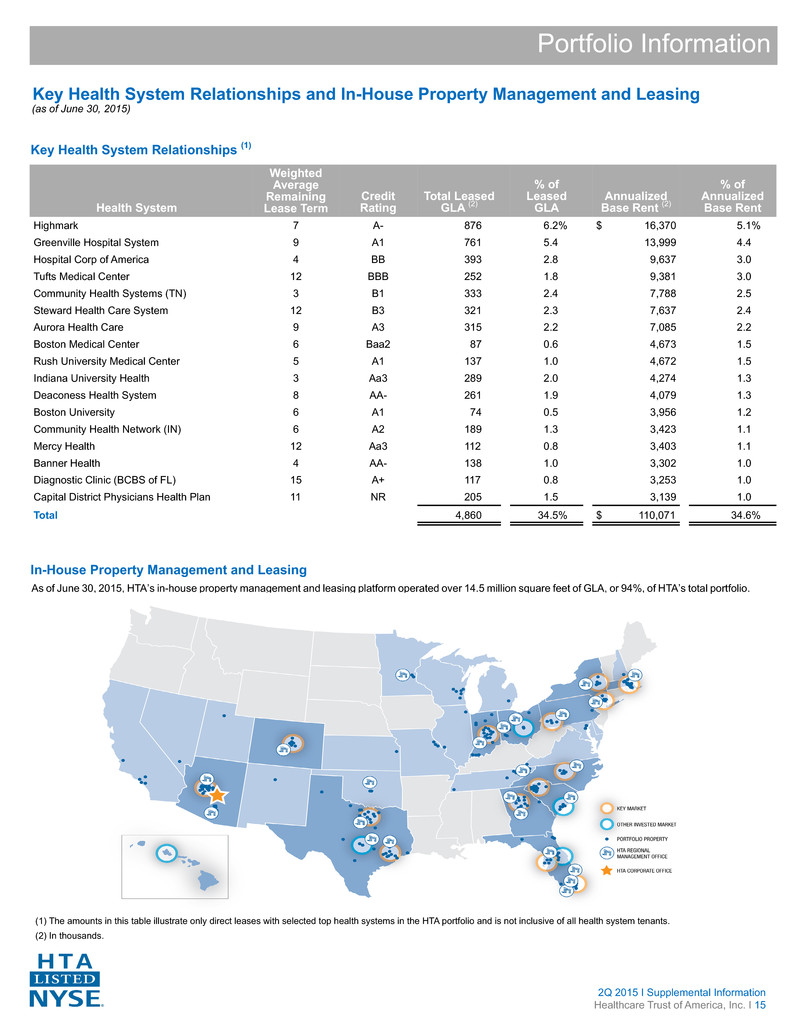
Health System Weighted Average Remaining Lease Term Credit Rating Total Leased GLA (2) % of Leased GLA Annualized Base Rent (2) % of Annualized Base Rent Highmark 7 A- 876 6.2% $ 16,370 5.1% Greenville Hospital System 9 A1 761 5.4 13,999 4.4 Hospital Corp of America 4 BB 393 2.8 9,637 3.0 Tufts Medical Center 12 BBB 252 1.8 9,381 3.0 Community Health Systems (TN) 3 B1 333 2.4 7,788 2.5 Steward Health Care System 12 B3 321 2.3 7,637 2.4 Aurora Health Care 9 A3 315 2.2 7,085 2.2 Boston Medical Center 6 Baa2 87 0.6 4,673 1.5 Rush University Medical Center 5 A1 137 1.0 4,672 1.5 Indiana University Health 3 Aa3 289 2.0 4,274 1.3 Deaconess Health System 8 AA- 261 1.9 4,079 1.3 Boston University 6 A1 74 0.5 3,956 1.2 Community Health Network (IN) 6 A2 189 1.3 3,423 1.1 Mercy Health 12 Aa3 112 0.8 3,403 1.1 Banner Health 4 AA- 138 1.0 3,302 1.0 Diagnostic Clinic (BCBS of FL) 15 A+ 117 0.8 3,253 1.0 Capital District Physicians Health Plan 11 NR 205 1.5 3,139 1.0 Total 4,860 34.5% $ 110,071 34.6% As of June 30, 2015, HTA’s in-house property management and leasing platform operated over 14.5 million square feet of GLA, or 94%, of HTA’s total portfolio. Portfolio Information Key Health System Relationships and In-House Property Management and Leasing (as of June 30, 2015) Key Health System Relationships (1) In-House Property Management and Leasing (1) The amounts in this table illustrate only direct leases with selected top health systems in the HTA portfolio and is not inclusive of all health system tenants. (2) In thousands. 2Q 2015 I Supplemental Information Healthcare Trust of America, Inc. I 15
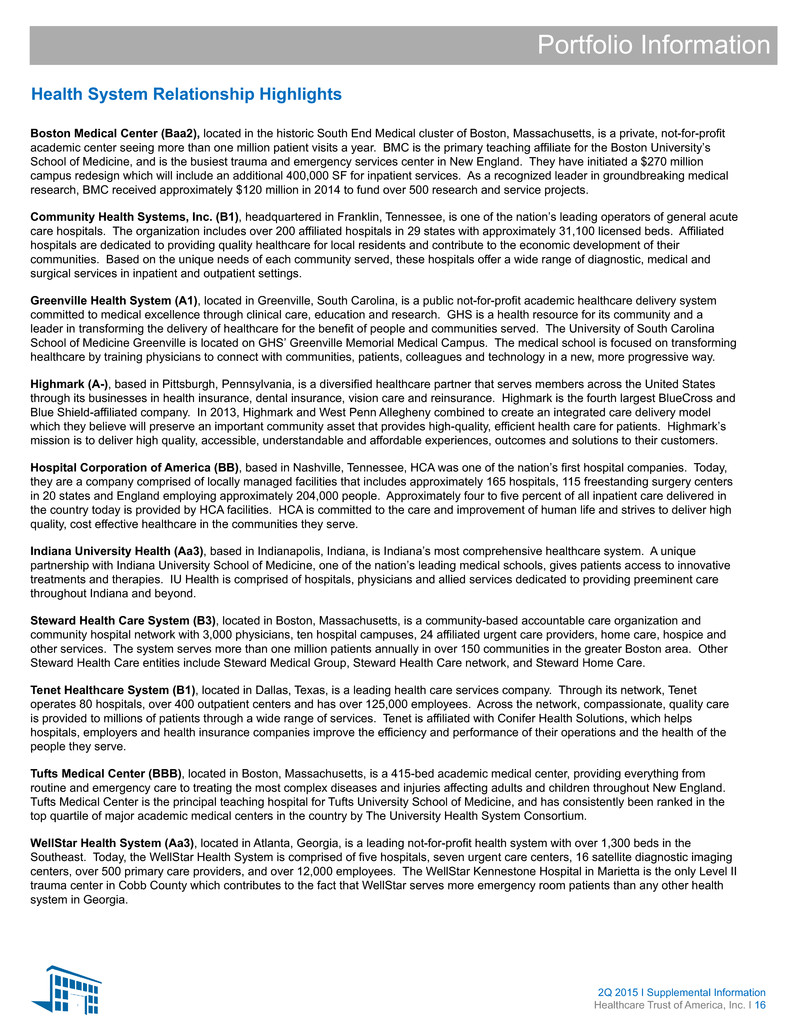
Boston Medical Center (Baa2), located in the historic South End Medical cluster of Boston, Massachusetts, is a private, not-for-profit academic center seeing more than one million patient visits a year. BMC is the primary teaching affiliate for the Boston University’s School of Medicine, and is the busiest trauma and emergency services center in New England. They have initiated a $270 million campus redesign which will include an additional 400,000 SF for inpatient services. As a recognized leader in groundbreaking medical research, BMC received approximately $120 million in 2014 to fund over 500 research and service projects. Community Health Systems, Inc. (B1), headquartered in Franklin, Tennessee, is one of the nation’s leading operators of general acute care hospitals. The organization includes over 200 affiliated hospitals in 29 states with approximately 31,100 licensed beds. Affiliated hospitals are dedicated to providing quality healthcare for local residents and contribute to the economic development of their communities. Based on the unique needs of each community served, these hospitals offer a wide range of diagnostic, medical and surgical services in inpatient and outpatient settings. Greenville Health System (A1), located in Greenville, South Carolina, is a public not-for-profit academic healthcare delivery system committed to medical excellence through clinical care, education and research. GHS is a health resource for its community and a leader in transforming the delivery of healthcare for the benefit of people and communities served. The University of South Carolina School of Medicine Greenville is located on GHS’ Greenville Memorial Medical Campus. The medical school is focused on transforming healthcare by training physicians to connect with communities, patients, colleagues and technology in a new, more progressive way. Highmark (A-), based in Pittsburgh, Pennsylvania, is a diversified healthcare partner that serves members across the United States through its businesses in health insurance, dental insurance, vision care and reinsurance. Highmark is the fourth largest BlueCross and Blue Shield-affiliated company. In 2013, Highmark and West Penn Allegheny combined to create an integrated care delivery model which they believe will preserve an important community asset that provides high-quality, efficient health care for patients. Highmark’s mission is to deliver high quality, accessible, understandable and affordable experiences, outcomes and solutions to their customers. Hospital Corporation of America (BB), based in Nashville, Tennessee, HCA was one of the nation’s first hospital companies. Today, they are a company comprised of locally managed facilities that includes approximately 165 hospitals, 115 freestanding surgery centers in 20 states and England employing approximately 204,000 people. Approximately four to five percent of all inpatient care delivered in the country today is provided by HCA facilities. HCA is committed to the care and improvement of human life and strives to deliver high quality, cost effective healthcare in the communities they serve. Indiana University Health (Aa3), based in Indianapolis, Indiana, is Indiana’s most comprehensive healthcare system. A unique partnership with Indiana University School of Medicine, one of the nation’s leading medical schools, gives patients access to innovative treatments and therapies. IU Health is comprised of hospitals, physicians and allied services dedicated to providing preeminent care throughout Indiana and beyond. Steward Health Care System (B3), located in Boston, Massachusetts, is a community-based accountable care organization and community hospital network with 3,000 physicians, ten hospital campuses, 24 affiliated urgent care providers, home care, hospice and other services. The system serves more than one million patients annually in over 150 communities in the greater Boston area. Other Steward Health Care entities include Steward Medical Group, Steward Health Care network, and Steward Home Care. Tenet Healthcare System (B1), located in Dallas, Texas, is a leading health care services company. Through its network, Tenet operates 80 hospitals, over 400 outpatient centers and has over 125,000 employees. Across the network, compassionate, quality care is provided to millions of patients through a wide range of services. Tenet is affiliated with Conifer Health Solutions, which helps hospitals, employers and health insurance companies improve the efficiency and performance of their operations and the health of the people they serve. Tufts Medical Center (BBB), located in Boston, Massachusetts, is a 415-bed academic medical center, providing everything from routine and emergency care to treating the most complex diseases and injuries affecting adults and children throughout New England. Tufts Medical Center is the principal teaching hospital for Tufts University School of Medicine, and has consistently been ranked in the top quartile of major academic medical centers in the country by The University Health System Consortium. WellStar Health System (Aa3), located in Atlanta, Georgia, is a leading not-for-profit health system with over 1,300 beds in the Southeast. Today, the WellStar Health System is comprised of five hospitals, seven urgent care centers, 16 satellite diagnostic imaging centers, over 500 primary care providers, and over 12,000 employees. The WellStar Kennestone Hospital in Marietta is the only Level II trauma center in Cobb County which contributes to the fact that WellStar serves more emergency room patients than any other health system in Georgia. Portfolio Information Health System Relationship Highlights 2Q 2015 I Supplemental Information Healthcare Trust of America, Inc. I 16
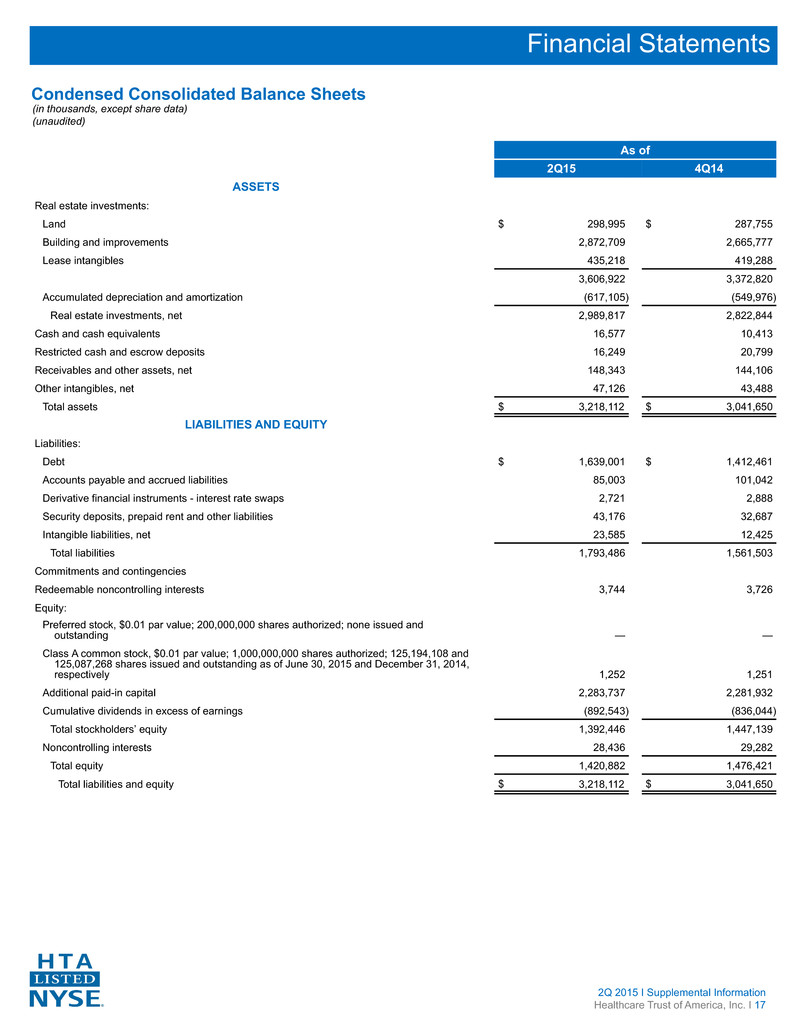
As of 2Q15 4Q14 ASSETS Real estate investments: Land $ 298,995 $ 287,755 Building and improvements 2,872,709 2,665,777 Lease intangibles 435,218 419,288 3,606,922 3,372,820 Accumulated depreciation and amortization (617,105) (549,976) Real estate investments, net 2,989,817 2,822,844 Cash and cash equivalents 16,577 10,413 Restricted cash and escrow deposits 16,249 20,799 Receivables and other assets, net 148,343 144,106 Other intangibles, net 47,126 43,488 Total assets $ 3,218,112 $ 3,041,650 LIABILITIES AND EQUITY Liabilities: Debt $ 1,639,001 $ 1,412,461 Accounts payable and accrued liabilities 85,003 101,042 Derivative financial instruments - interest rate swaps 2,721 2,888 Security deposits, prepaid rent and other liabilities 43,176 32,687 Intangible liabilities, net 23,585 12,425 Total liabilities 1,793,486 1,561,503 Commitments and contingencies Redeemable noncontrolling interests 3,744 3,726 Equity: Preferred stock, $0.01 par value; 200,000,000 shares authorized; none issued and outstanding — — Class A common stock, $0.01 par value; 1,000,000,000 shares authorized; 125,194,108 and 125,087,268 shares issued and outstanding as of June 30, 2015 and December 31, 2014, respectively 1,252 1,251 Additional paid-in capital 2,283,737 2,281,932 Cumulative dividends in excess of earnings (892,543) (836,044) Total stockholders’ equity 1,392,446 1,447,139 Noncontrolling interests 28,436 29,282 Total equity 1,420,882 1,476,421 Total liabilities and equity $ 3,218,112 $ 3,041,650 Financial Statements Condensed Consolidated Balance Sheets (in thousands, except share data) (unaudited) 2Q 2015 I Supplemental Information Healthcare Trust of America, Inc. I 17
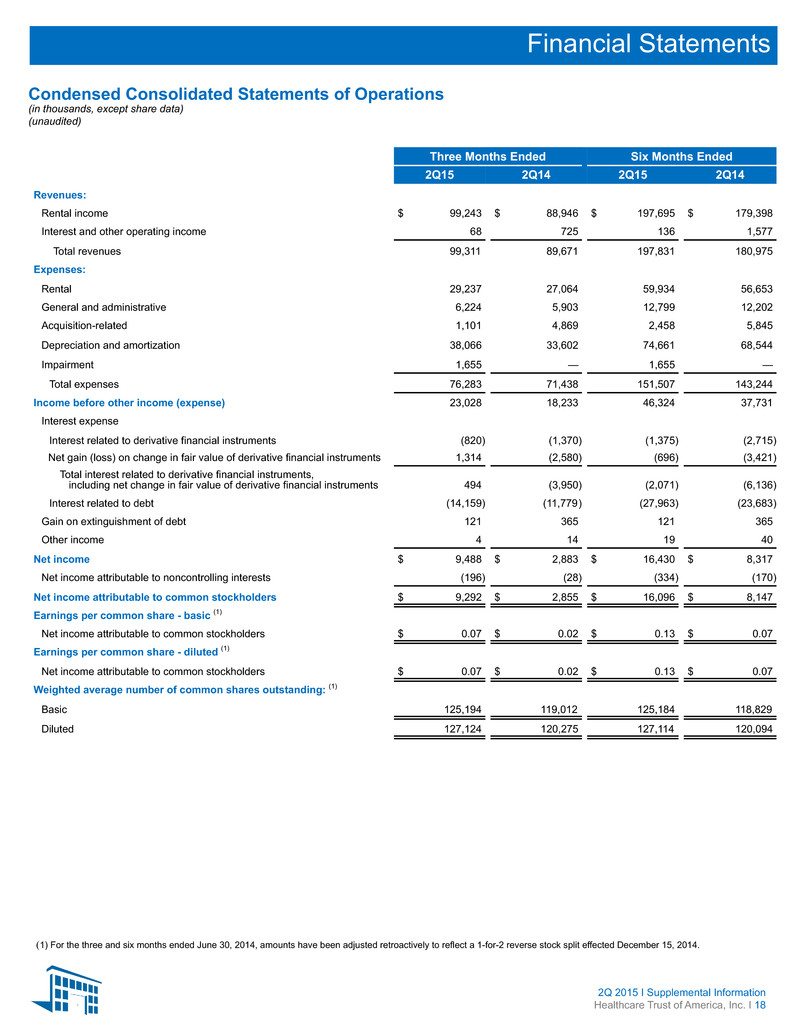
Three Months Ended Six Months Ended 2Q15 2Q14 2Q15 2Q14 Revenues: Rental income $ 99,243 $ 88,946 $ 197,695 $ 179,398 Interest and other operating income 68 725 136 1,577 Total revenues 99,311 89,671 197,831 180,975 Expenses: Rental 29,237 27,064 59,934 56,653 General and administrative 6,224 5,903 12,799 12,202 Acquisition-related 1,101 4,869 2,458 5,845 Depreciation and amortization 38,066 33,602 74,661 68,544 Impairment 1,655 — 1,655 — Total expenses 76,283 71,438 151,507 143,244 Income before other income (expense) 23,028 18,233 46,324 37,731 Interest expense Interest related to derivative financial instruments (820) (1,370) (1,375) (2,715) Net gain (loss) on change in fair value of derivative financial instruments 1,314 (2,580) (696) (3,421) Total interest related to derivative financial instruments, including net change in fair value of derivative financial instruments 494 (3,950) (2,071) (6,136) Interest related to debt (14,159) (11,779) (27,963) (23,683) Gain on extinguishment of debt 121 365 121 365 Other income 4 14 19 40 Net income $ 9,488 $ 2,883 $ 16,430 $ 8,317 Net income attributable to noncontrolling interests (196) (28) (334) (170) Net income attributable to common stockholders $ 9,292 $ 2,855 $ 16,096 $ 8,147 Earnings per common share - basic (1) Net income attributable to common stockholders $ 0.07 $ 0.02 $ 0.13 $ 0.07 Earnings per common share - diluted (1) Net income attributable to common stockholders $ 0.07 $ 0.02 $ 0.13 $ 0.07 Weighted average number of common shares outstanding: (1) Basic 125,194 119,012 125,184 118,829 Diluted 127,124 120,275 127,114 120,094 2Q 2015 I Supplemental Information Healthcare Trust of America, Inc. I 18 Financial Statements Condensed Consolidated Statements of Operations (in thousands, except share data) (unaudited) (1) For the three and six months ended June 30, 2014, amounts have been adjusted retroactively to reflect a 1-for-2 reverse stock split effected December 15, 2014.
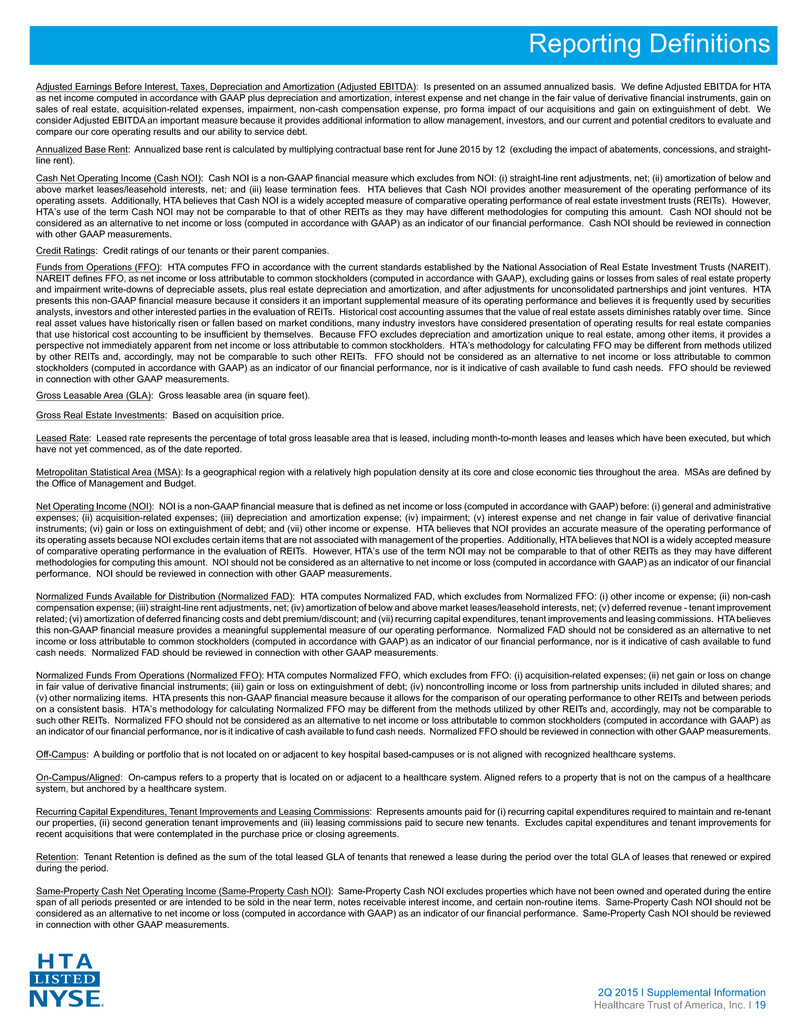
2Q 2015 I Supplemental Information Healthcare Trust of America, Inc. I 19 Reporting Definitions Adjusted Earnings Before Interest, Taxes, Depreciation and Amortization (Adjusted EBITDA): Is presented on an assumed annualized basis. We define Adjusted EBITDA for HTA as net income computed in accordance with GAAP plus depreciation and amortization, interest expense and net change in the fair value of derivative financial instruments, gain on sales of real estate, acquisition-related expenses, impairment, non-cash compensation expense, pro forma impact of our acquisitions and gain on extinguishment of debt. We consider Adjusted EBITDA an important measure because it provides additional information to allow management, investors, and our current and potential creditors to evaluate and compare our core operating results and our ability to service debt. Annualized Base Rent: Annualized base rent is calculated by multiplying contractual base rent for June 2015 by 12 (excluding the impact of abatements, concessions, and straight- line rent). Cash Net Operating Income (Cash NOI): Cash NOI is a non-GAAP financial measure which excludes from NOI: (i) straight-line rent adjustments, net; (ii) amortization of below and above market leases/leasehold interests, net; and (iii) lease termination fees. HTA believes that Cash NOI provides another measurement of the operating performance of its operating assets. Additionally, HTA believes that Cash NOI is a widely accepted measure of comparative operating performance of real estate investment trusts (REITs). However, HTA’s use of the term Cash NOI may not be comparable to that of other REITs as they may have different methodologies for computing this amount. Cash NOI should not be considered as an alternative to net income or loss (computed in accordance with GAAP) as an indicator of our financial performance. Cash NOI should be reviewed in connection with other GAAP measurements. Credit Ratings: Credit ratings of our tenants or their parent companies. Funds from Operations (FFO): HTA computes FFO in accordance with the current standards established by the National Association of Real Estate Investment Trusts (NAREIT). NAREIT defines FFO, as net income or loss attributable to common stockholders (computed in accordance with GAAP), excluding gains or losses from sales of real estate property and impairment write-downs of depreciable assets, plus real estate depreciation and amortization, and after adjustments for unconsolidated partnerships and joint ventures. HTA presents this non-GAAP financial measure because it considers it an important supplemental measure of its operating performance and believes it is frequently used by securities analysts, investors and other interested parties in the evaluation of REITs. Historical cost accounting assumes that the value of real estate assets diminishes ratably over time. Since real asset values have historically risen or fallen based on market conditions, many industry investors have considered presentation of operating results for real estate companies that use historical cost accounting to be insufficient by themselves. Because FFO excludes depreciation and amortization unique to real estate, among other items, it provides a perspective not immediately apparent from net income or loss attributable to common stockholders. HTA’s methodology for calculating FFO may be different from methods utilized by other REITs and, accordingly, may not be comparable to such other REITs. FFO should not be considered as an alternative to net income or loss attributable to common stockholders (computed in accordance with GAAP) as an indicator of our financial performance, nor is it indicative of cash available to fund cash needs. FFO should be reviewed in connection with other GAAP measurements. Gross Leasable Area (GLA): Gross leasable area (in square feet). Gross Real Estate Investments: Based on acquisition price. Leased Rate: Leased rate represents the percentage of total gross leasable area that is leased, including month-to-month leases and leases which have been executed, but which have not yet commenced, as of the date reported. Metropolitan Statistical Area (MSA): Is a geographical region with a relatively high population density at its core and close economic ties throughout the area. MSAs are defined by the Office of Management and Budget. Net Operating Income (NOI): NOI is a non-GAAP financial measure that is defined as net income or loss (computed in accordance with GAAP) before: (i) general and administrative expenses; (ii) acquisition-related expenses; (iii) depreciation and amortization expense; (iv) impairment; (v) interest expense and net change in fair value of derivative financial instruments; (vi) gain or loss on extinguishment of debt; and (vii) other income or expense. HTA believes that NOI provides an accurate measure of the operating performance of its operating assets because NOI excludes certain items that are not associated with management of the properties. Additionally, HTA believes that NOI is a widely accepted measure of comparative operating performance in the evaluation of REITs. However, HTA’s use of the term NOI may not be comparable to that of other REITs as they may have different methodologies for computing this amount. NOI should not be considered as an alternative to net income or loss (computed in accordance with GAAP) as an indicator of our financial performance. NOI should be reviewed in connection with other GAAP measurements. Normalized Funds Available for Distribution (Normalized FAD): HTA computes Normalized FAD, which excludes from Normalized FFO: (i) other income or expense; (ii) non-cash compensation expense; (iii) straight-line rent adjustments, net; (iv) amortization of below and above market leases/leasehold interests, net; (v) deferred revenue - tenant improvement related; (vi) amortization of deferred financing costs and debt premium/discount; and (vii) recurring capital expenditures, tenant improvements and leasing commissions. HTA believes this non-GAAP financial measure provides a meaningful supplemental measure of our operating performance. Normalized FAD should not be considered as an alternative to net income or loss attributable to common stockholders (computed in accordance with GAAP) as an indicator of our financial performance, nor is it indicative of cash available to fund cash needs. Normalized FAD should be reviewed in connection with other GAAP measurements. Normalized Funds From Operations (Normalized FFO): HTA computes Normalized FFO, which excludes from FFO: (i) acquisition-related expenses; (ii) net gain or loss on change in fair value of derivative financial instruments; (iii) gain or loss on extinguishment of debt; (iv) noncontrolling income or loss from partnership units included in diluted shares; and (v) other normalizing items. HTA presents this non-GAAP financial measure because it allows for the comparison of our operating performance to other REITs and between periods on a consistent basis. HTA’s methodology for calculating Normalized FFO may be different from the methods utilized by other REITs and, accordingly, may not be comparable to such other REITs. Normalized FFO should not be considered as an alternative to net income or loss attributable to common stockholders (computed in accordance with GAAP) as an indicator of our financial performance, nor is it indicative of cash available to fund cash needs. Normalized FFO should be reviewed in connection with other GAAP measurements. Off-Campus: A building or portfolio that is not located on or adjacent to key hospital based-campuses or is not aligned with recognized healthcare systems. On-Campus/Aligned: On-campus refers to a property that is located on or adjacent to a healthcare system. Aligned refers to a property that is not on the campus of a healthcare system, but anchored by a healthcare system. Recurring Capital Expenditures, Tenant Improvements and Leasing Commissions: Represents amounts paid for (i) recurring capital expenditures required to maintain and re-tenant our properties, (ii) second generation tenant improvements and (iii) leasing commissions paid to secure new tenants. Excludes capital expenditures and tenant improvements for recent acquisitions that were contemplated in the purchase price or closing agreements. Retention: Tenant Retention is defined as the sum of the total leased GLA of tenants that renewed a lease during the period over the total GLA of leases that renewed or expired during the period. Same-Property Cash Net Operating Income (Same-Property Cash NOI): Same-Property Cash NOI excludes properties which have not been owned and operated during the entire span of all periods presented or are intended to be sold in the near term, notes receivable interest income, and certain non-routine items. Same-Property Cash NOI should not be considered as an alternative to net income or loss (computed in accordance with GAAP) as an indicator of our financial performance. Same-Property Cash NOI should be reviewed in connection with other GAAP measurements.

Serious News for Serious Traders! Try StreetInsider.com Premium Free!
You May Also Be Interested In
- The Wealth Company Launches Gift City Fund to Give NRIs a Single, Dollar-Denominated Route into India's Mutual Fund Market
- Argument Introduces Structured AI Conflict Resolution App for Everyday Disputes
- NCLA to State Court: End WA Dept. of Fish and Wildlife’s Illegal 24-Hour Surveillance of Crab Boats
Create E-mail Alert Related Categories
SEC FilingsSign up for StreetInsider Free!
Receive full access to all new and archived articles, unlimited portfolio tracking, e-mail alerts, custom newswires and RSS feeds - and more!
