



Form 8-K HARDINGE INC For: Feb 11
 Tweet
Tweet Share
Share E-mail
UNITED STATES
SECURITIES AND EXCHANGE COMMISSION
Washington, D.C. 20549
FORM 8-K
CURRENT REPORT
PURSUANT TO SECTION 13 OR 15(d)
OF THE SECURITIES EXCHANGE ACT OF 1934
Date of Report (Date of earliest event reported): February 11, 2016

Hardinge Inc.
(Exact name of registrant as specified in its charter)
New York | 000-15760 | 16-0470200 | ||
(State or other jurisdiction of incorporation) | (Commission File Number) | (I.R.S. Employer Identification Number) | ||
One Hardinge Drive Elmira, NY | 14902 | |||
(Address of principal executive offices) | (Zip Code) | |||
(607) 734-2281
(Registrant’s telephone number, including area code)
Not Applicable
(Former name, former address and former fiscal year, if changed since last report)
Check the appropriate box below if the Form 8-K filing is intended to simultaneously satisfy the filing obligation of the registrant under any of the following provisions:
o Written communication pursuant to Rule 425 under the Securities Act (17 CFR 230.425)
o Soliciting material to Rule 14a-12 under the Exchange Act (17 CFR 240.14a-12)
o Pre-commencement communications pursuant to Rule 14d-2(b) under the Exchange Act (17 CFR 240.14d-2(b))
o Pre-commencement communications pursuant to Rule 13e-4(c) under the Exchange Act (17 CFR 240.13e-4(c))
Item 2.02 Results of Operations and Financial Condition.
On February 11, 2016, Hardinge Inc. ("the "Company" or "Hardinge") issued a press release announcing the Company’s fourth quarter and full year 2015 financial results. Copies of the press release and the presentation slides used in connection with the Company’s earnings conference call and webcast on 2015 are respectively included as Exhibit 99.1 and Exhibit 99.2 to this Current Report on Form 8-K. On February 9, 2016, the Board of Directors of the Company declared a cash dividend of $0.02 per share on the Company’s common stock. The dividend is payable on March 10, 2016 to stockholders of record as of March 1, 2016.
Item 9.01 Financial Statements and Exhibits.
(d) Exhibits.
EXHIBIT NUMBER | DESCRIPTION | |
99.1 | Press release issued by Registrant on February 11, 2016 announcing fourth quarter and full year 2015 results. | |
99.2 | Presentation slides used by Registrant in connection with its February 11, 2016 earnings conference call and webcast. | |
SIGNATURES
Pursuant to the requirements of the Securities Exchange Act of 1934, the registrant has duly caused this report to be signed on its behalf by the undersigned hereunto duly authorized.
Hardinge Inc. | |||
(Registrant) | |||
Date | February 11, 2016 | ||
/s/ Douglas J. Malone | |||
Douglas J. Malone Vice President and Chief Financial Officer | |||
Exhibit 99.1
 | NEWS RELEASE |
Hardinge Inc. One Hardinge Drive, Elmira, N.Y. 14902
For more information contact: | |
Company: | Investor Relations: |
Douglas J. Malone Chief Financial Officer Phone: (607) 378-4140 | Deborah K. Pawlowski, Kei Advisors LLC Phone: (716) 843-3908 Email: [email protected] |
Hardinge Reports Fourth Quarter and Full Year 2015 Results
ELMIRA, N.Y., February 11, 2016 - Hardinge Inc. (NASDAQ: HDNG), a leading international provider of advanced metal-cutting solutions and accessories, reported financial results for its fourth quarter and year ended December 31, 2015.
Net sales (“sales”) for 2015 increased 1% to $315.2 million, compared with $311.6 million in 2014. Adjusting for $11.4 million of unfavorable foreign currency translation, 2015 sales increased 5% over the prior year. Fourth quarter sales of $87.0 million decreased $6.0 million, or 7%, from the prior-year period. Adjusting for unfavorable foreign currency translation of $2.6 million, fourth quarter sales were down 4%.
Non-GAAP(1) adjusted net income for 2015 more than doubled to $6.9 million, or $0.54 per diluted share, compared with adjusted net income of $2.8 million, or $0.22 per diluted share, in 2014. Net income in 2015 of $2.6 million, or $0.20 per diluted share, improved $4.7 million over the prior year net loss of $2.1 million, or $0.17 loss per diluted share. Fourth quarter non-GAAP adjusted net income increased 26%, or $1.2 million, to $5.9 million, or $0.45 per diluted share, over adjusted net income of $4.7 million, or $0.36 per diluted share, in the prior year’s fourth quarter. Net income for the quarter was $2.8 million, or $0.21 per diluted share, compared with $4.5 million, or $0.35 per diluted share, in the prior-year period.
Richard L. Simons, President and Chief Executive Officer, commented, "Our results for 2015 demonstrate Hardinge’s ability to generate cash and deliver growth in a globally challenged economy through continuous product innovation grounded in a deep understanding of what our customers value. These efforts more than offset the impact on sales of the strengthened U.S. dollar and the general weakness in North America. Importantly, we finished the year by delivering impressive fourth quarter gross profit margin in the low thirties, validating that our business can produce this level of margin, given our focus on cost controls and initiatives to drive a more favorable product mix.”
___________________
(1)Management believes that the use of non-GAAP measures helps in the understanding of the Company's operating performance. See pages 9 and 10 of this release for the reconciliation tables between reported amounts and non-GAAP measures discussed in this document.
-MORE-
Hardinge Reports Fourth Quarter 2015 Results
February 11, 2016
Page 2 of 10
He also noted that “As we look into 2016, our visibility is masked by the uncertainty in both the North American and Asian machine tool markets given weak industrial economies. We are, however, energized by the quote activity in Europe as that market recovers from its recession. While the lack of visibility makes it difficult to forecast 2016 sales at this point, we remain focused on continuing to build a more profitable company as we complete our current restructuring initiatives.”
2015-2016 Hardinge Restructuring Program (pre-tax, in millions) | |||
Estimated Total Restructuring Charges | Charges To-date | Estimated Annualized Savings | Q4 and YTD 2015 Savings |
$4.5 | $3.6 | $4.5 | $0.3 |
Mr. Simons added, "We have made solid progress with our restructuring program and began to see early benefits of these efforts in the fourth quarter." The previously announced restructuring program, which was initiated in the second half of 2015, is progressing according to plan and expected to be completed by the end of the second quarter of 2016.
Fourth Quarter Review
Quarterly Sales by Region ($ in thousands) | |||||||||
Quarter Ended | |||||||||
December 31, 2015 | December 31, 2014 | September 30, 2015 | |||||||
Sales to Customers in | $ | % of Total | $ | Year-over-Year % Change | $ | Sequential % Change | |||
North America | 28,431 | 33% | 28,636 | (1)% | 24,661 | 15% | |||
Europe | 30,716 | 35% | 31,102 | (1)% | 21,569 | 42% | |||
Asia | 27,813 | 32% | 33,270 | (16)% | 30,575 | (9)% | |||
Total | 86,960 | 93,008 | (7)% | 76,805 | 13% | ||||
____________________
Note: Fluctuations in Hardinge’s consolidated sales and orders among geographic locations and industries can vary from quarter to quarter based on the timing and magnitude of orders and projects. Hardinge does not believe that such quarter-to-quarter fluctuations are necessarily indicative of larger business trends. Rather, the Company believes that such business trends can be discerned from the Company’s performance during a longer period of time, such as a trailing twelve-month period.
Fourth quarter sales to the North America market declined modestly from the prior-year period as new product introductions in North America compensated for the impact of a weakened industrial economy. Higher sales volume to Europe helped to offset unfavorable foreign exchange translation of $1.6 million resulting in a moderate $0.4 million decline in sales from the prior-year period. After adjusting for foreign currency impacts, fourth quarter sales to Europe increased 4%. Fourth quarter sales to Asia were impacted by timing of shipments to the region and the decline in China’s economy, as well as $1.0 million in unfavorable foreign currency translation.
Gross profit of $26.9 million in the fourth quarter was unchanged from the prior-year period, on lower sales. Gross margin as a percentage of sales increased 1.9 points to 31.0%, compared with 29.1% in the fourth quarter of 2014. The measurable expansion in gross margin was the result of a higher volume of grinding machines, a richer configuration mix of grinding products and the 0.3 point benefit from the early effects of restructuring activities.
-MORE-
Hardinge Reports Fourth Quarter 2015 Results
February 11, 2016
Page 3 of 10
Selling, general and administrative (“SG&A”) expense was down by $1.0 million from the prior-year period, to $20.7 million. The quarter included $0.4 million of professional fees associated with the Company's previously announced strategic review process while foreign currency translation resulted in a favorable $1.1 million impact in the quarter. SG&A as a percentage of sales was 23.8% compared with 23.3% in the prior-year period.
Non-GAAP adjusted operating income in the fourth quarter increased 21% to $6.3 million, or 7.2% of sales, from $5.2 million, or 5.6% of sales, in the prior-year period. Product mix, increased production efficiencies and cost control were the primary drivers of increased adjusted operating income despite lower sales. Operating income was $3.2 million, or 3.7% of sales, compared with $5.1 million, or 5.5% of sales, in the prior-year period.
Full Year 2015 Review
Sales by Region ($ in thousands) | ||||||
Twelve months ended | ||||||
December 31, 2015 | December 31, 2014 | |||||
Sales to Customers in | $ | % of Total | $ | Year-over-Year % Change | ||
North America | 108,470 | 34% | 100,894 | 8% | ||
Europe | 97,269 | 31% | 103,063 | (6)% | ||
Asia | 109,510 | 35% | 107,676 | 2% | ||
Total | 315,249 | 311,633 | 1% | |||
Sales of $315.2 million in 2015 were up 1% from 2014 sales of $311.6 million. Sales increased 4.8% excluding $11.4 million for unfavorable foreign currency translation. Sales to the North America market increased over the prior-year period as a result of new product launches and improved demand for grinding machines. Increased sales to Asia were driven by ongoing demand for Hardinge’s high precision machines, partially offset by the $2.1 million impact of unfavorable foreign currency translation. Sales to Europe were down $5.8 million due to $9.3 million unfavorable foreign exchange translation. Excluding the currency impact, sales to Europe increased $3.5 million, or 3% primarily driven by higher demand for grinding machines.
Gross profit of $90.4 million in 2015 increased $3.5 million compared with gross profit of $86.9 million in 2014. Gross profit was favorably impacted by higher volumes of machine production, particularly at the Company’s Swiss grinding facilities, as well as improved product mix. This was partially offset by $0.8 million for the integration of the Voumard product line, which was acquired in September 2014, and a first quarter inventory valuation adjustment of approximately $0.7 million. Gross margin as a percent of sales improved 0.8 points to 28.7% when compared with gross margin of 27.9% in 2014.
SG&A expense increased $0.2 million to $81.3 million compared with the prior year. The increase included $0.8 million for investments to grow the Voumard product line and $0.4 million for the expansion of the Company’s Forkardt businesses in China and India, as well as $0.8 million of professional fees associated with the Company's previously announced strategic review process. These increases were offset by $3.8 million of favorable foreign currency translation when compared with the prior-year period.
Non-GAAP adjusted operating income for 2015, which excludes restructuring charges of $3.6 million and $0.8 million of professional fees, was $9.3 million, an 83% increase from $5.1 million in the prior year. Included in 2015 adjusted operating income were $1.5 million of expenses for investments in the Voumard product line. As a percent of sales, adjusted operating income margin was 2.9%, a 1.2 point improvement year-over-year. Operating income was $4.9 million, or 1.6% of sales, compared with an operating loss of $0.4 million, in the prior-year period.
-MORE-
Hardinge Reports Fourth Quarter 2015 Results
February 11, 2016
Page 4 of 10
Strong Cash Generation
Cash generated by operating activities in the fourth quarter of 2015 improved measurably to $17.7 million from $4.0 million in the prior-year period. For the full year, cash from operations increased to $26.7 million in 2015 from $3.2 million in 2014. Cash and cash equivalents at December 31, 2015 more than doubled over the prior year to $32.8 million. Total debt was $11.8 million, at the end of the year and had been reduced by $4.5 million from December 31, 2014 and $1.4 million from September 30, 2015.
Orders by Region ($ in thousands) | |||||||||
Quarter Ended | |||||||||
December 31, 2015 | December 31, 2014 | September 30, 2015 | |||||||
Orders from Customers in | $ | % of Total | $ | Year-over-Year % Change | $ | Sequential % Change | |||
North America | 24,305 | 33% | 31,467 | (23)% | 20,105 | 21% | |||
Europe | 20,610 | 28% | 31,302 | (34)% | 23,234 | (11)% | |||
Asia | 29,133 | 39% | 31,582 | (8)% | 28,612 | 2% | |||
Total | 74,048 | 94,351 | (22)% | 71,951 | 3% | ||||
Twelve months ended | ||||||
December 31, 2015 | December 31, 2014 | |||||
Orders from Customers in | $ | % of Total | $ | Year-over-Year % Change | ||
North America | 98,809 | 31% | 105,152 | (6)% | ||
Europe | 97,223 | 31% | 109,122 | (11)% | ||
Asia | 120,045 | 38% | 116,416 | 3% | ||
Total | 316,077 | 330,690 | (4)% | |||
Fourth quarter orders of $74.0 million declined from the prior-year period. The prior-year period had unusually high order levels across all regions, particularly North America. Additionally, fourth quarter orders were impacted by $2.6 million of unfavorable foreign exchange translation.
Orders for 2015 of $316.1 million were down 4% when compared with 2014. Excluding $11.9 million for unfavorable foreign currency translation, 2015 orders decreased 1% over the prior year. The Company’s order backlog at December 31, 2015 was $101.8 million compared with $105.3 million at the end of 2014.
.
-MORE-
Hardinge Reports Fourth Quarter 2015 Results
February 11, 2016
Page 5 of 10
Webcast and Conference Call
Hardinge will host a conference call and webcast today at 11:00 a.m. ET. During the conference call and webcast, Richard L. Simons, President and CEO, and Douglas J. Malone, Vice President and CFO, will review the financial and operating results for the quarter, as well as the Company’s outlook. A question and answer session will follow the formal discussion. Their review will be accompanied by a slide presentation which will be available on Hardinge’s website at ir.hardinge.com/events.cfm.
The conference call can be accessed by calling (315) 625-6888. The listen-only audio webcast can be monitored at ir.hardinge.com/events.cfm.
A telephonic replay will be available from 2:00 p.m. ET the day of the call through Thursday, February 18, 2016. To listen to the archived call, dial (404) 537-3406 and enter conference ID #27663940. Alternatively, the archive can be heard on the Company’s website at ir.hardinge.com/events.cfm. A transcript will also be posted to the website, once available.
About Hardinge
Hardinge is a leading global designer and manufacturer of high precision, computer-controlled machine tool solutions developed for critical, hard-to-machine metal parts and of technologically advanced workholding accessories. The Company’s strategy is to leverage its global brand strength to further penetrate global market opportunities where customers will benefit from the technologically advanced, high quality, reliable products Hardinge produces. With approximately two-thirds of its sales outside of North America, Hardinge serves the worldwide metal working market. Hardinge’s machine tool and accessory solutions can also be found in a broad base of industries to include aerospace, agricultural, automotive, construction, consumer products, defense, energy, medical, technology and transportation.
Hardinge applies its engineering design and manufacturing expertise in high performance machining centers, high-end cylindrical and jig grinding machines, SUPER-PRECISION® and precision CNC lathes and technologically advanced workholding accessories. Hardinge has manufacturing operations in China, France, Germany, India, Switzerland, Taiwan, the United Kingdom and the United States.
The Company regularly posts information on its website: http://www.hardinge.com.
Safe Harbor Statement
This news release contains forward-looking statements (within the meaning of Section 27A of the Securities Act of 1933, as amended, and Section 21E of the Securities Exchange Act of 1934, as amended). Such statements are based on management's current expectations that involve risks and uncertainties. Any statements that are not statements of historical fact or that are about future events may be deemed to be forward-looking statements. For example, words such as "may," "will," "should," "estimates," "predicts," "potential," "continue," "strategy," "believes," "anticipates," "plans," "expects," "intends," and similar expressions are intended to identify forward-looking statements. The Company's actual results or outcomes and the timing of certain events may differ significantly from those discussed in any forward-looking statements. The Company undertakes no obligation to publicly update any forward-looking statement, whether as a result of new information, future events, or otherwise.
FINANCIAL TABLES FOLLOW.
-MORE-
Hardinge Reports Fourth Quarter 2015 Results
February 11, 2016
Page 6 of 10
HARDINGE INC. AND SUBSIDIARIES
Consolidated Statements of Operations
(in thousands, except per share data)
Three Months Ended December 31, | Year Ended December 31, | ||||||||||||||
2015 | 2014 | 2015 | 2014 | ||||||||||||
(unaudited) | |||||||||||||||
Sales | $ | 86,960 | $ | 93,008 | $ | 315,249 | $ | 311,633 | |||||||
Cost of sales | 60,033 | 65,988 | 224,851 | 224,755 | |||||||||||
Gross profit | 26,927 | 27,020 | 90,398 | 86,878 | |||||||||||
Gross profit margin | 31.0 | % | 29.1 | % | 28.7 | % | 27.9 | % | |||||||
Selling, general and administrative expenses | 20,675 | 21,669 | 81,271 | 81,045 | |||||||||||
Restructuring charges | 2,681 | — | 3,558 | — | |||||||||||
Impairment charges | — | — | — | 5,766 | |||||||||||
Other expense, net | 356 | 265 | 632 | 514 | |||||||||||
Income (loss) from operations | 3,215 | 5,086 | 4,937 | (447 | ) | ||||||||||
Operating margin | 3.7 | % | 5.5 | % | 1.6 | % | (0.1 | )% | |||||||
Interest expense | 183 | 168 | 655 | 737 | |||||||||||
Interest income | (76 | ) | (12 | ) | (156 | ) | (59 | ) | |||||||
Income (loss) from continuing operations before income taxes | 3,108 | 4,930 | 4,438 | (1,125 | ) | ||||||||||
Income taxes | 349 | 388 | 1,828 | 1,233 | |||||||||||
Net income (loss) from continuing operations | 2,759 | 4,542 | 2,610 | (2,358 | ) | ||||||||||
Gain from disposal of discontinued operation, net of tax | — | — | — | 218 | |||||||||||
Net income (loss) | $ | 2,759 | $ | 4,542 | $ | 2,610 | $ | (2,140 | ) | ||||||
Per share data: | |||||||||||||||
Basic earnings (loss) per share: | |||||||||||||||
Continuing operations | $ | 0.22 | $ | 0.36 | $ | 0.20 | $ | (0.19 | ) | ||||||
Disposal of discontinued operation | — | — | — | 0.02 | |||||||||||
Basic earnings (loss) per share | $ | 0.22 | $ | 0.36 | $ | 0.20 | $ | (0.17 | ) | ||||||
Diluted earnings (loss) per share: | |||||||||||||||
Continuing operations | $ | 0.21 | $ | 0.35 | $ | 0.20 | $ | (0.19 | ) | ||||||
Disposal of discontinued operation | — | — | — | 0.02 | |||||||||||
Diluted earnings (loss) per share | $ | 0.21 | $ | 0.35 | $ | 0.20 | $ | (0.17 | ) | ||||||
Cash dividends declared per share: | $ | 0.02 | $ | 0.02 | $ | 0.08 | $ | 0.08 | |||||||
Weighted avg. shares outstanding: Basic | 12,793 | 12,716 | 12,776 | 12,661 | |||||||||||
Weighted avg. shares outstanding: Diluted | 12,886 | 12,832 | 12,872 | 12,661 | |||||||||||
-MORE-
Hardinge Reports Fourth Quarter 2015 Results
February 11, 2016
Page 7 of 10
HARDINGE INC. AND SUBSIDIARIES
Consolidated Balance Sheets
(in thousands, except share and per share data)
December 31, 2015 | December 31, 2014 | ||||||
Assets | |||||||
Cash and cash equivalents | $ | 32,774 | $ | 16,293 | |||
Restricted cash | 2,192 | 3,151 | |||||
Accounts receivable, net | 56,945 | 62,877 | |||||
Inventories, net | 110,232 | 111,821 | |||||
Other current assets | 9,385 | 10,545 | |||||
Total current assets | 211,528 | 204,687 | |||||
Property, plant and equipment, net | 62,025 | 65,874 | |||||
Goodwill | 6,620 | 6,698 | |||||
Other intangible assets, net | 28,018 | 30,217 | |||||
Other non-current assets | 3,109 | 3,844 | |||||
Total non-current assets | 99,772 | 106,633 | |||||
Total assets | $ | 311,300 | $ | 311,320 | |||
Liabilities and shareholders’ equity | |||||||
Accounts payable | $ | 24,696 | $ | 25,592 | |||
Accrued expenses | 27,964 | 25,071 | |||||
Customer deposits | 19,845 | 12,736 | |||||
Accrued income taxes | 1,919 | 646 | |||||
Deferred income taxes | 2,164 | 2,332 | |||||
Current portion of long-term debt | 5,692 | 3,972 | |||||
Total current liabilities | 82,280 | 70,349 | |||||
Long-term debt | 6,079 | 12,253 | |||||
Pension and postretirement liabilities | 57,322 | 53,119 | |||||
Deferred income taxes | 1,121 | 2,516 | |||||
Other liabilities | 3,393 | 3,487 | |||||
Total non-current liabilities | 67,915 | 71,375 | |||||
Commitments and contingencies | |||||||
Common stock ($0.01 par value, 20,000,000 authorized; 12,856,716 issued and 12,838,227 outstanding as of December 31, 2015, and 12,825,468 issued and 12,821,768 outstanding as of December 31, 2014) | 128 | 128 | |||||
Additional paid-in capital | 120,524 | 120,538 | |||||
Retained earnings | 89,368 | 87,777 | |||||
Treasury shares (at cost, 18,489 as of December 31, 2015, and 3,700 as of December 31, 2014) | (202 | ) | (46 | ) | |||
Accumulated other comprehensive loss | (48,713 | ) | (38,801 | ) | |||
Total shareholders’ equity | 161,105 | 169,596 | |||||
Total liabilities and shareholders’ equity | $ | 311,300 | $ | 311,320 | |||
-MORE-
Hardinge Reports Fourth Quarter 2015 Results
February 11, 2016
Page 8 of 10
HARDINGE INC. AND SUBSIDIARIES
Consolidated Statements of Cash Flows
(in thousands)
Year Ended | |||||||
December 31, 2015 | December 31, 2014 | ||||||
Operating activities | |||||||
Net income (loss) | $ | 2,610 | $ | (2,140 | ) | ||
Adjustments to reconcile net income (loss) to net cash provided by operating activities: | |||||||
Impairment charge | — | 5,766 | |||||
Depreciation and amortization | 8,509 | 9,847 | |||||
Debt issuance costs amortization | 38 | 42 | |||||
Deferred income taxes | (768 | ) | 446 | ||||
Gain on sale of assets | (26 | ) | (82 | ) | |||
Gain on sale of business | — | (218 | ) | ||||
Gain on purchase of business | — | (462 | ) | ||||
Unrealized foreign currency transaction loss | 404 | 350 | |||||
Changes in operating assets and liabilities, net of businesses acquired: | |||||||
Accounts receivable | 3,942 | (7,860 | ) | ||||
Restricted cash | 827 | 973 | |||||
Inventories | (1,442 | ) | (1,303 | ) | |||
Other assets | 1,245 | 682 | |||||
Accounts payable | 450 | 2,211 | |||||
Customer deposits | 7,762 | (1,783 | ) | ||||
Accrued expenses | 3,250 | (3,281 | ) | ||||
Accrued pension and postretirement liabilities | (74 | ) | (9 | ) | |||
Net cash provided by operating activities | 26,727 | 3,179 | |||||
Investing activities | |||||||
Acquisition of businesses, net of cash acquired | — | (5,683 | ) | ||||
Capital expenditures | (4,210 | ) | (3,186 | ) | |||
Proceeds from disposal of business | — | 218 | |||||
Proceeds from sales of assets | 69 | 151 | |||||
Net cash used in investing activities | (4,141 | ) | (8,500 | ) | |||
Financing activities | |||||||
Payment of contingent consideration | — | (7,500 | ) | ||||
Proceeds from short-term notes payable to bank | 32,502 | 21,143 | |||||
Repayments of short-term notes payable to bank | (32,502 | ) | (21,143 | ) | |||
Repayments of long-term debt | (4,464 | ) | (9,296 | ) | |||
Dividends paid | (1,037 | ) | (1,012 | ) | |||
Purchases of treasury stock | (201 | ) | — | ||||
Net proceeds from sales of common stock | — | 5,678 | |||||
Net cash used in financing activities | (5,702 | ) | (12,130 | ) | |||
Effect of exchange rate changes on cash | (403 | ) | (978 | ) | |||
Net increase (decrease) in cash | 16,481 | (18,429 | ) | ||||
Cash and cash equivalents at beginning of period | 16,293 | 34,722 | |||||
Cash and cash equivalents at end of period | $ | 32,774 | $ | 16,293 | |||
-MORE-
Hardinge Reports Fourth Quarter 2015 Results
February 11, 2016
Page 9 of 10
Hardinge believes that providing non-GAAP financial measures such as adjusted operating income, adjusted net income, and adjusted earnings per diluted share is important for investors and other readers of Hardinge's financial statements, as they are used as an analytical indicator by Hardinge management to better understand its operating performance.
HARDINGE INC. AND SUBSIDIARIES
Reconciliation of GAAP Operating Income (Loss) to Non-GAAP Operating Income (Loss)
(in thousands)
Three Months Ended December 31, 2015 | Three Months Ended December 31, 2014 | ||||||||||||
Amount | % of Sales | Amount | % of Sales | ||||||||||
Operating income as reported | $ | 3,215 | 3.7 | % | $ | 5,086 | 5.5 | % | |||||
Adjustments to reported operating income: | |||||||||||||
Acquisition-related expenses | — | — | 121 | 0.1 | |||||||||
Restructuring charges | 2,681 | 3.1 | — | — | |||||||||
Professional fees for strategic review process | 414 | 0.4 | — | — | |||||||||
Non-GAAP operating income as adjusted | $ | 6,310 | 7.2 | % | $ | 5,207 | 5.6 | % | |||||
Year Ended December 31, 2015 | Year Ended December 31, 2014 | ||||||||||||
Amount | % of Sales | Amount | % of Sales | ||||||||||
Operating income (loss) as reported | $ | 4,937 | 1.6 | % | $ | (447 | ) | (0.1 | )% | ||||
Adjustments to reported operating income (loss): | |||||||||||||
Impairment charge | — | — | 5,766 | 1.9 | |||||||||
Gain on purchase of business | — | — | (462 | ) | (0.1 | ) | |||||||
Acquisition-related inventory step-up charge | — | — | 86 | — | |||||||||
Acquisition-related expenses | — | — | 121 | — | |||||||||
Restructuring charges | 3,558 | 1.1 | — | — | |||||||||
Professional fees for strategic review process | 756 | 0.2 | — | — | |||||||||
Non-GAAP operating income as adjusted | $ | 9,251 | 2.9 | % | $ | 5,064 | 1.7 | % | |||||
-MORE-
Hardinge Reports Fourth Quarter 2015 Results
February 11, 2016
Page 10 of 10
HARDINGE INC. AND SUBSIDIARIES
Reconciliation of GAAP Net (Loss) Income to Non-GAAP Net Income
(in thousands, except per share data)
Three Months Ended December 31, 2015 | Three Months Ended December 31, 2014 | ||||||||||||||
Amount | EPS | Amount | EPS | ||||||||||||
Net income as reported | $ | 2,759 | $ | 0.21 | $ | 4,542 | $ | 0.35 | |||||||
Adjustments to reported net loss, net of taxes: | |||||||||||||||
Acquisition-related expenses | — | — | 121 | 0.01 | |||||||||||
Restructuring charges | 2,681 | 0.21 | — | — | |||||||||||
Professional fees for strategic review process | 414 | 0.03 | — | — | |||||||||||
Non-GAAP net income as adjusted | $ | 5,854 | $ | 0.45 | $ | 4,663 | $ | 0.36 | |||||||
Year Ended December 31, 2015 | Year Ended December 31, 2014 | ||||||||||||||
Amount | EPS | Amount | EPS | ||||||||||||
Net income (loss) as reported | $ | 2,610 | $ | 0.20 | $ | (2,140 | ) | $ | (0.17 | ) | |||||
Adjustments to reported net income (loss), net of taxes: | |||||||||||||||
Impairment charge | — | — | 5,437 | 0.43 | |||||||||||
Gain on purchase of business | — | — | (462 | ) | (0.04 | ) | |||||||||
Gain from disposal of discontinued operation, net of tax | — | — | (218 | ) | (0.02 | ) | |||||||||
Acquisition-related inventory step-up charge | — | — | 86 | 0.01 | |||||||||||
Acquisition-related expenses | — | — | 121 | 0.01 | |||||||||||
Restructuring charges | 3,558 | 0.28 | — | — | |||||||||||
Professional fees for strategic review process | 756 | 0.06 | — | — | |||||||||||
Non-GAAP net income as adjusted | $ | 6,924 | $ | 0.54 | $ | 2,824 | $ | 0.22 | |||||||
-END-

Fourth Quarter 2015 Financial Results Conference Call February 11, 2016 NASDAQ: HDNG www.hardinge.com Douglas J. Malone Vice President and Chief Financial Officer Richard L. Simons President and Chief Executive Officer
© 2016 Hardinge Inc. www.hardinge.com 2 Safe Harbor Statement This presentation may contain forward-looking statements (within the meaning of Section 27A of the Securities Act of 1933, as amended and Section 21E of the Securities Exchange Act of 1934, as amended). Any such statements are based upon management’s current expectations that involve risks and uncertainties. Any statements that are not statements of historical fact or that are about future events may be deemed to be forward-looking statements. For example, words such as “may”, “will”, “should”, “estimates”, “predicts”, “potential”, “continue”, “strategy”, “believes”, “anticipates”, “plans”, “expects”, “intends” and similar expressions are intended to identify forward-looking statements. The Company’s actual results or outcomes and the timing of certain events may differ significantly from those discussed in any forward-looking statements. The following factors are among those that could cause actual results to differ materially from the forward-looking statements, which involve risks and uncertainties, and that should be considered in evaluating any such statement: fluctuations in the machine tool business cycles, changes in general economic conditions in the U.S. or internationally, the mix of products sold and the profit margins thereon, the relative success of the Company’s entry into new product and geographic markets, the Company’s ability to manage its operating costs, actions taken by customers such as order cancellations or reduced bookings by customers or distributors, competitor’s actions such as price discounting or new product introductions, governmental regulations and environmental matters, changes in the availability of cost of materials and supplies, the implementation of new technologies and currency fluctuations. The Company undertakes no obligation to publicly update any forward-looking statement, whether as a result of new information, future events, or otherwise.
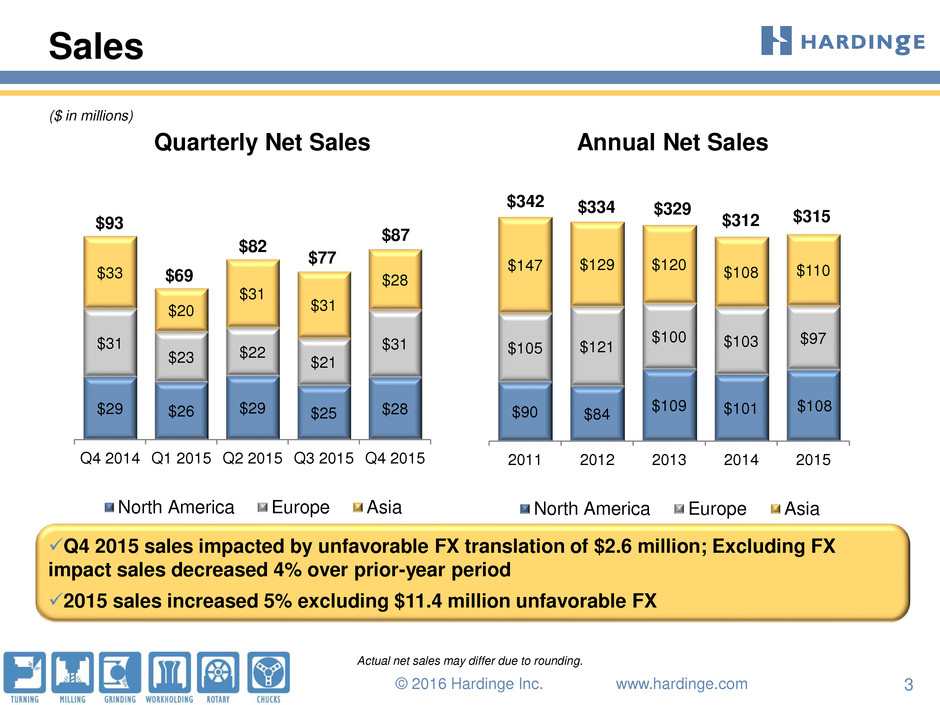
© 2016 Hardinge Inc. www.hardinge.com 3 Sales ($ in millions) $90 $84 $109 $101 $108 $105 $121 $100 $103 $97 $147 $129 $120 $108 $110 2011 2012 2013 2014 2015 North America Europe Asia $329 $342 $334 $29 $26 $29 $25 $28 $31 $23 $22 $21 $31 $33 $20 $31 $31 $28 Q4 2014 Q1 2015 Q2 2015 Q3 2015 Q4 2015 North America Europe Asia $69 $82 Quarterly Net Sales Annual Net Sales Q4 2015 sales impacted by unfavorable FX translation of $2.6 million; Excluding FX impact sales decreased 4% over prior-year period 2015 sales increased 5% excluding $11.4 million unfavorable FX Actual net sales may differ due to rounding. $312 $93 $77 $87 $315
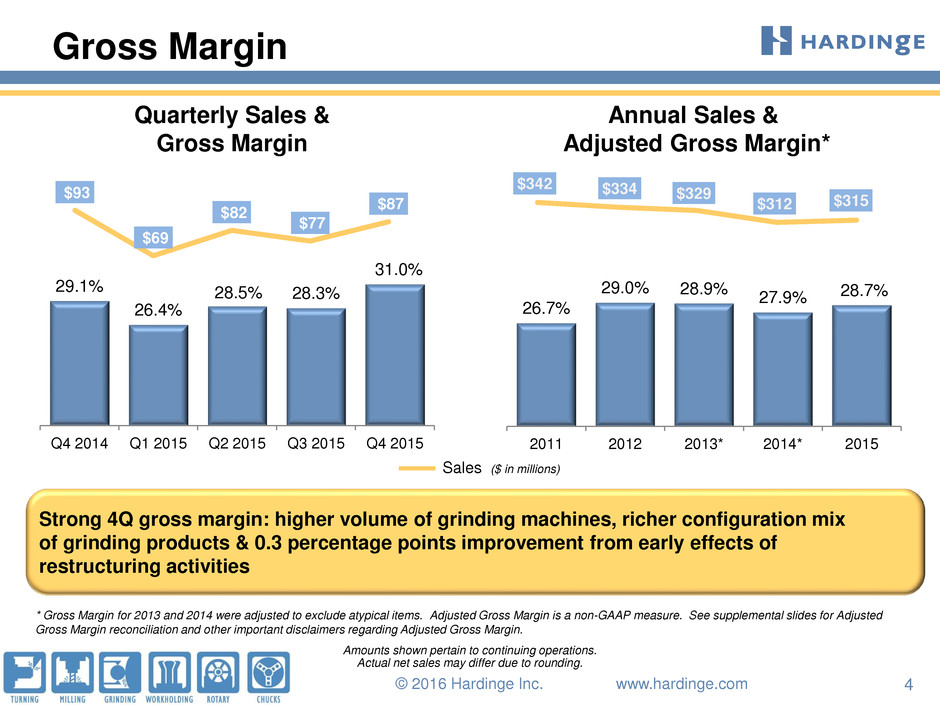
© 2016 Hardinge Inc. www.hardinge.com 4 $342 $334 $329 $312 $315 26.7% 29.0% 28.9% 27.9% 28.7% 2011 2012 2013* 2014* 2015 29.1% 26.4% 28.5% 28.3% 31.0% Q4 2014 Q1 2015 Q2 2015 Q3 2015 Q4 2015 Gross Margin Quarterly Sales & Gross Margin Annual Sales & Adjusted Gross Margin* Strong 4Q gross margin: higher volume of grinding machines, richer configuration mix of grinding products & 0.3 percentage points improvement from early effects of restructuring activities Sales ($ in millions) * Gross Margin for 2013 and 2014 were adjusted to exclude atypical items. Adjusted Gross Margin is a non-GAAP measure. See supplemental slides for Adjusted Gross Margin reconciliation and other important disclaimers regarding Adjusted Gross Margin. Amounts shown pertain to continuing operations. Actual net sales may differ due to rounding. $93 $69 $82 $77 $87
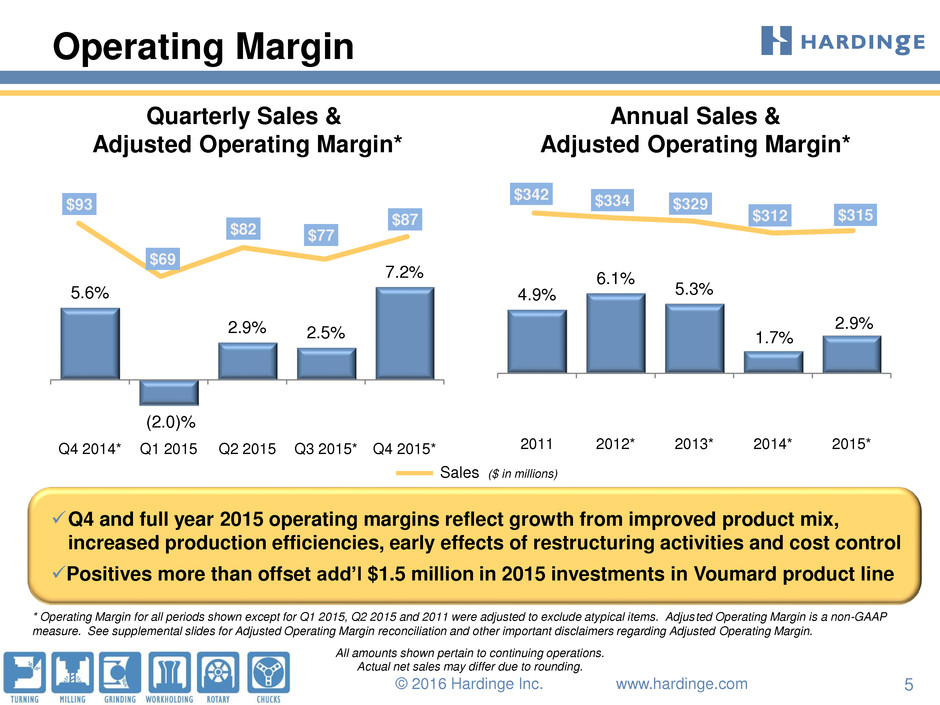
© 2016 Hardinge Inc. www.hardinge.com 5 $342 $334 $329 $312 $315 4.9% 6.1% 5.3% 1.7% 2.9% 2011 2012* 2013* 2014* 2015* $93 $69 $82 $77 $87 5.6% (2.0)% 2.9% 2.5% 7.2% Q4 2014* Q1 2015 Q2 2015 Q3 2015* Q4 2015* Operating Margin Quarterly Sales & Adjusted Operating Margin* Annual Sales & Adjusted Operating Margin* Sales ($ in millions) * Operating Margin for all periods shown except for Q1 2015, Q2 2015 and 2011 were adjusted to exclude atypical items. Adjusted Operating Margin is a non-GAAP measure. See supplemental slides for Adjusted Operating Margin reconciliation and other important disclaimers regarding Adjusted Operating Margin. Actual net sales may differ due to rounding. Q4 and full year 2015 operating margins reflect growth from improved product mix, increased production efficiencies, early effects of restructuring activities and cost control Positives more than offset add’l $1.5 million in 2015 investments in Voumard product line All amounts shown pertain to continuing operations.
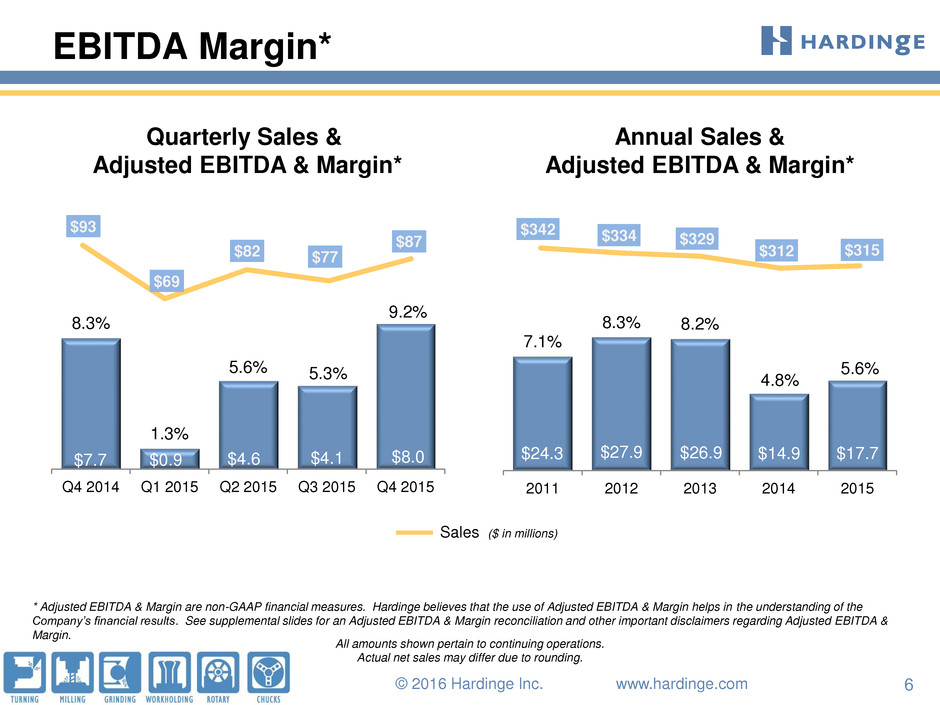
© 2016 Hardinge Inc. www.hardinge.com 6 $342 $334 $329 $312 $315 $93 $69 $82 $77 $87 7.1% 8.3% 8.2% 4.8% 5.6% 2011 2012 2013 2014 2015 8.3% 1.3% 5.6% 5.3% 9.2% Q4 2014 Q1 2015 Q2 2015 Q3 2015 Q4 2015 EBITDA Margin* Quarterly Sales & Adjusted EBITDA & Margin* Annual Sales & Adjusted EBITDA & Margin* Sales ($ in millions) * Adjusted EBITDA & Margin are non-GAAP financial measures. Hardinge believes that the use of Adjusted EBITDA & Margin helps in the understanding of the Company’s financial results. See supplemental slides for an Adjusted EBITDA & Margin reconciliation and other important disclaimers regarding Adjusted EBITDA & Margin. Actual net sales may differ due to rounding. All amounts shown pertain to continuing operations. $7.7 $0.9 $4.6 $4.1 $24.3 $26.9 $14.9 $27.9 $17.7 $8.0
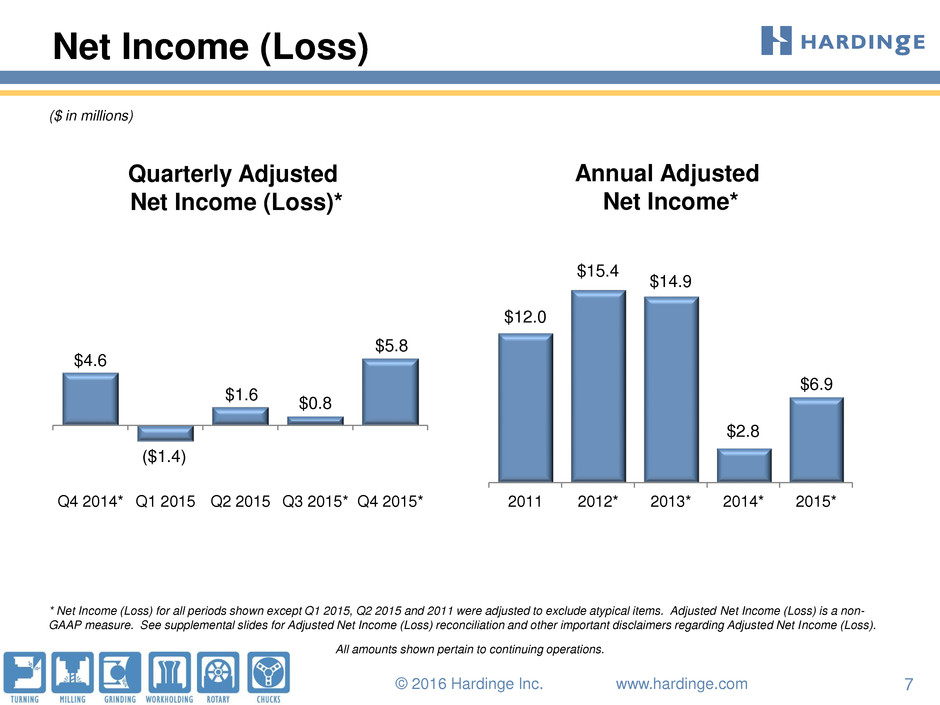
© 2016 Hardinge Inc. www.hardinge.com 7 $4.6 ($1.4) $1.6 $0.8 $5.8 Q4 2014* Q1 2015 Q2 2015 Q3 2015* Q4 2015* Quarterly Adjusted Net Income (Loss)* $12.0 $15.4 $14.9 $2.8 $6.9 2011 2012* 2013* 2014* 2015* Annual Adjusted Net Income* Net Income (Loss) ($ in millions) * Net Income (Loss) for all periods shown except Q1 2015, Q2 2015 and 2011 were adjusted to exclude atypical items. Adjusted Net Income (Loss) is a non- GAAP measure. See supplemental slides for Adjusted Net Income (Loss) reconciliation and other important disclaimers regarding Adjusted Net Income (Loss). All amounts shown pertain to continuing operations.
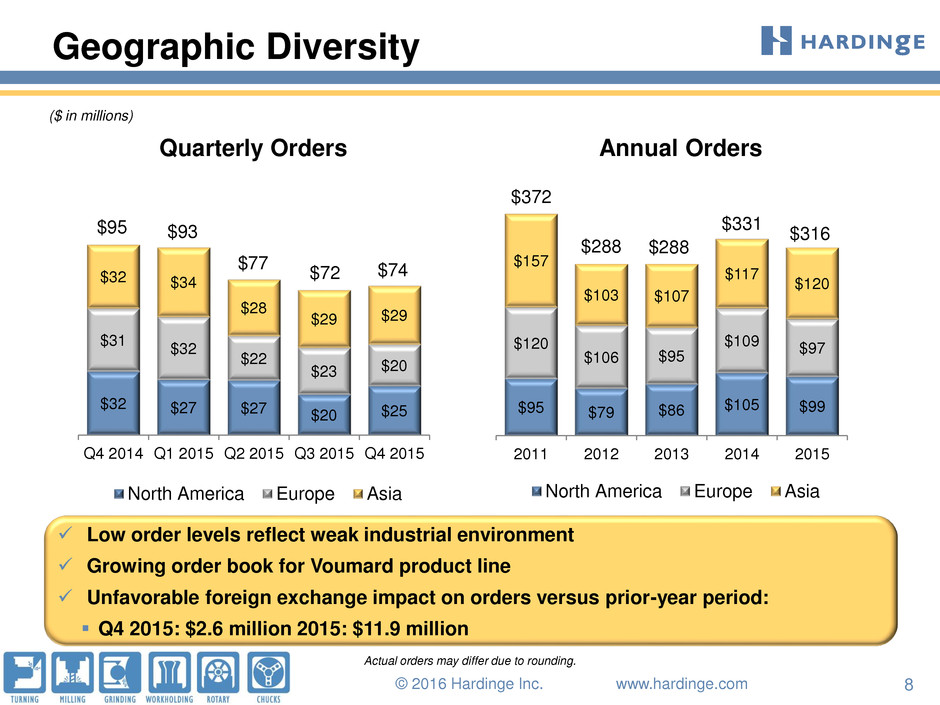
© 2016 Hardinge Inc. www.hardinge.com 8 ($ in millions) Annual Orders $95 $79 $86 $105 $99 $120 $106 $95 $109 $97 $157 $103 $107 $117 $120 2011 2012 2013 2014 2015 North America Europe Asia $331 $288 $372 $288 Quarterly Orders $32 $27 $27 $20 $25 $31 $32 $22 $23 $20 $32 $34 $28 $29 $29 Q4 2014 Q1 2015 Q2 2015 Q3 2015 Q4 2015 North America Europe Asia $95 $93 $74 Low order levels reflect weak industrial environment Growing order book for Voumard product line Unfavorable foreign exchange impact on orders versus prior-year period: Q4 2015: $2.6 million 2015: $11.9 million Actual orders may differ due to rounding. $77 $316 $72 Geographic Diversity

© 2016 Hardinge Inc. www.hardinge.com 9 ($ in millions) Backlog Lead times vary by product line Grinding: six to nine months Milling and turning: two to six months Workholding parts and accessories: Standard - next day, Specials – four to eight weeks $47 $56 $59 $60 $46 $48 $61 $55 $45 $48 $10 $11 $11 $11 $8 12/31/2014 3/31/2015 6/30/2015 9/30/2015 12/31/2015 Grinding Milling & Turning Workholding Parts & Accessories $128 $116 $102 $105 $125 Backlog by Product Line
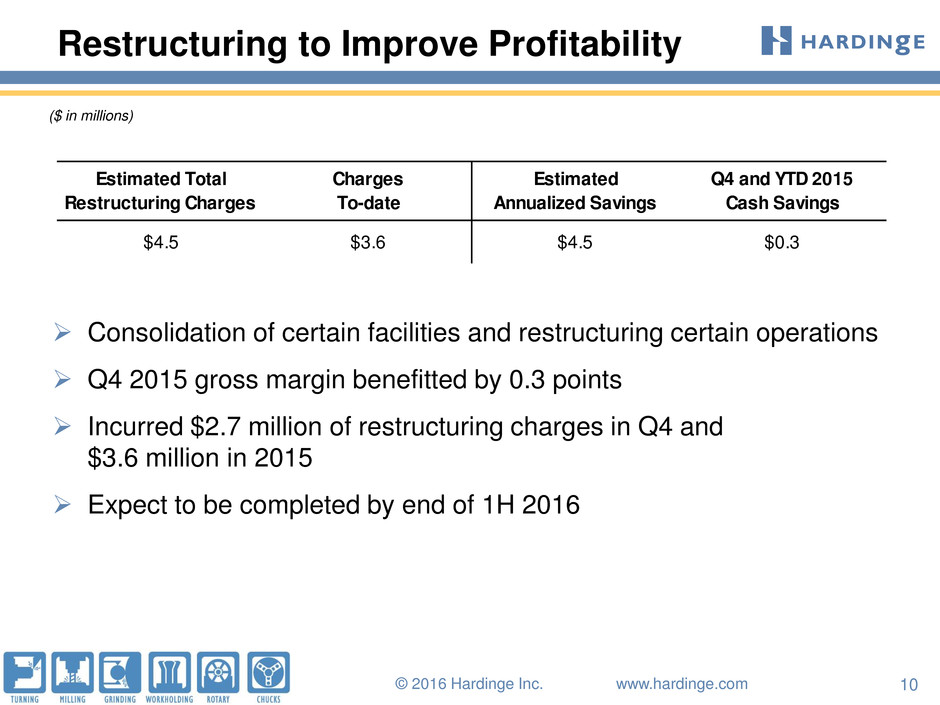
© 2016 Hardinge Inc. www.hardinge.com 10 Restructuring to Improve Profitability Consolidation of certain facilities and restructuring certain operations Q4 2015 gross margin benefitted by 0.3 points Incurred $2.7 million of restructuring charges in Q4 and $3.6 million in 2015 Expect to be completed by end of 1H 2016 ($ in millions) Estimated Total Restructuring Charges Charges To-date Estimated Annualized Savings Q4 and YTD 2015 C sh Savings $4.5 $3.6 $4.5 $0.3

© 2016 Hardinge Inc. www.hardinge.com 11 Source: Oxford Economics Autumn 2015 Global Machine Tool Outlook Report Emerging Economies Drive Demand $0 $10 $20 $30 $40 $50 $60 $70 $80 $90 $100 $110 2009 2010 2011 2012 2013 2014 2015 2016 2017 2018 2019 Americas Europe Asia World M ac h in e T o ol C o n s u m p ti o n (i n U S $ b ill io n s ) Drivers of Machine Tool Consumption: Older machines – technologically obsolete Skilled machinists – shrinking supply Emerging economies – growing middle class Global competitiveness – advancing productivity 2015-2019 Forecast CAGR World ~4% Asia ~4% Europe ~4% Americas ~3% Oxford Economics Machine Tool Forecast $80 billion industry
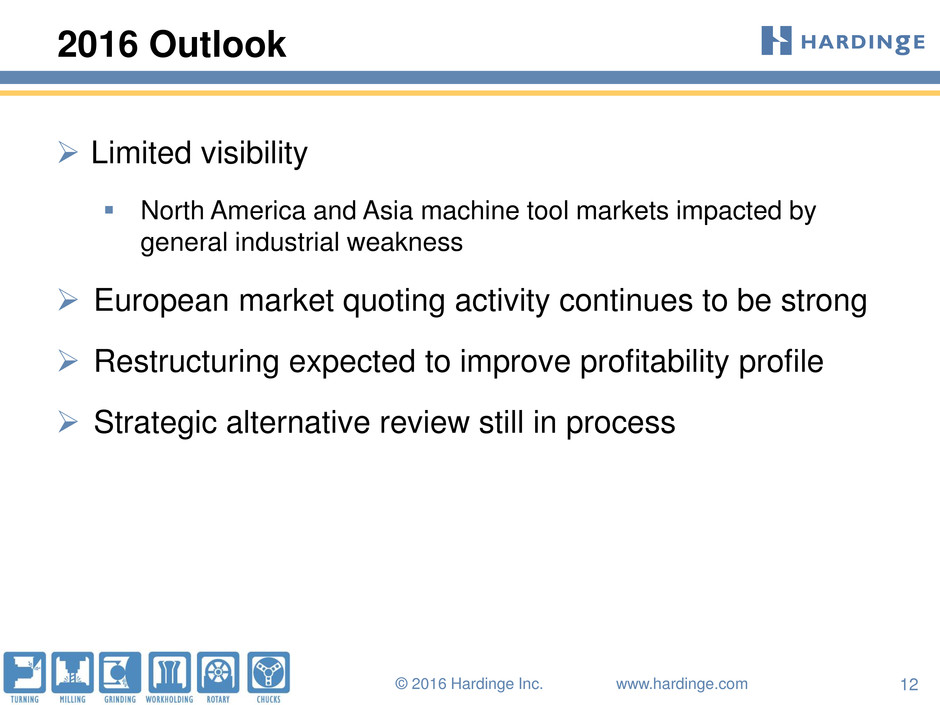
© 2016 Hardinge Inc. www.hardinge.com 12 2016 Outlook Limited visibility North America and Asia machine tool markets impacted by general industrial weakness European market quoting activity continues to be strong Restructuring expected to improve profitability profile Strategic alternative review still in process
NASDAQ: HDNG www.hardinge.com Fourth Quarter 2015 Financial Results Conference Call February 11, 2016

NASDAQ: HDNG SUPPLEMENTAL INFORMATION www.hardinge.com
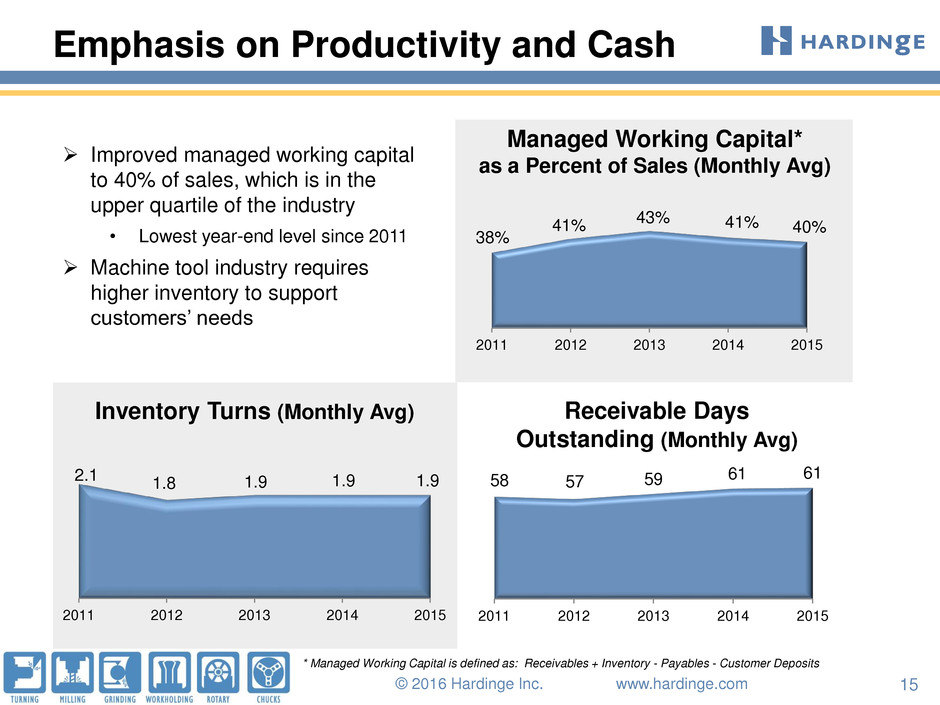
© 2016 Hardinge Inc. www.hardinge.com 15 58 57 59 61 61 2011 2012 2013 2014 2015 Emphasis on Productivity and Cash Inventory Turns (Monthly Avg) Receivable Days Outstanding (Monthly Avg) * Managed Working Capital is defined as: Receivables + Inventory - Payables - Customer Deposits Improved managed working capital to 40% of sales, which is in the upper quartile of the industry • Lowest year-end level since 2011 Machine tool industry requires higher inventory to support customers’ needs 38% 41% 43% 41% 40% 2011 2012 2013 2014 2015 2.1 1.8 1.9 1.9 1.9 2011 2012 2013 2014 2015 Managed Working Capital* as a Percent of Sales (Monthly Avg)
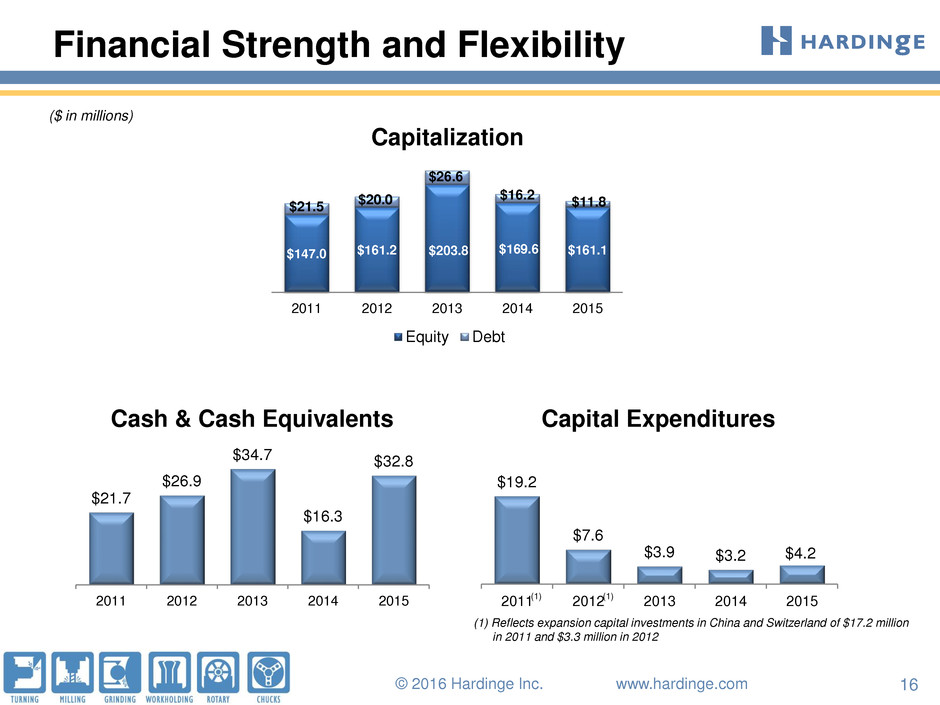
© 2016 Hardinge Inc. www.hardinge.com 16 $147.0 $161.2 $203.8 $169.6 $161.1 $21.5 $20.0 $26.6 $16.2 $11.8 2011 2012 2013 2014 2015 Equity Debt $21.7 $26.9 $34.7 $16.3 $32.8 2011 2012 2013 2014 2015 Financial Strength and Flexibility Capitalization ($ in millions) $19.2 $7.6 $3.9 $3.2 $4.2 2011 2012 2013 2014 2015 (1) Reflects expansion capital investments in China and Switzerland of $17.2 million in 2011 and $3.3 million in 2012 Cash & Cash Equivalents Capital Expenditures (1) (1)
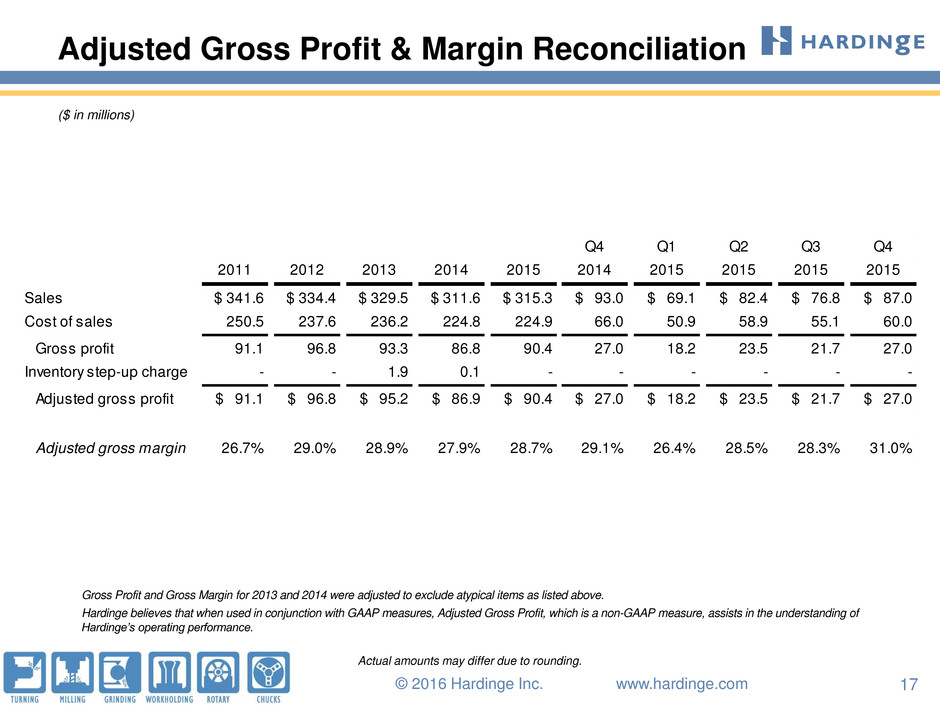
© 2016 Hardinge Inc. www.hardinge.com 17 Adjusted Gross Profit & Margin Reconciliation ($ in millions) Gross Profit and Gross Margin for 2013 and 2014 were adjusted to exclude atypical items as listed above. Hardinge believes that when used in conjunction with GAAP measures, Adjusted Gross Profit, which is a non-GAAP measure, assists in the understanding of Hardinge’s operating performance. Actual amounts may differ due to rounding. Q4 Q1 Q2 Q3 Q4 2011 2012 2013 2014 2015 2014 2015 2015 2015 2015 Sales $ 341.6 $ 334.4 $ 329.5 $ 311.6 $ 315.3 $ 93.0 $ 69.1 $ 82.4 $ 76.8 $ 87.0 Cost of sales 250.5 237.6 236.2 224.8 224.9 66.0 50.9 58.9 55.1 60.0 Gross profit 91.1 96.8 93.3 86.8 90.4 27.0 18.2 23.5 21.7 27.0 Inventory step-up charge - - 1.9 0.1 - - - - - - Adjusted gross profit $ 91.1 $ 96.8 $ 95.2 $ 86.9 $ 90.4 $ 27.0 $ 18.2 $ 23.5 $ 21.7 $ 27.0 Adjusted gross margin 26.7% 29.0% 28.9% 27.9% 28.7% 29.1% 26.4% 28.5% 28.3% 31.0%
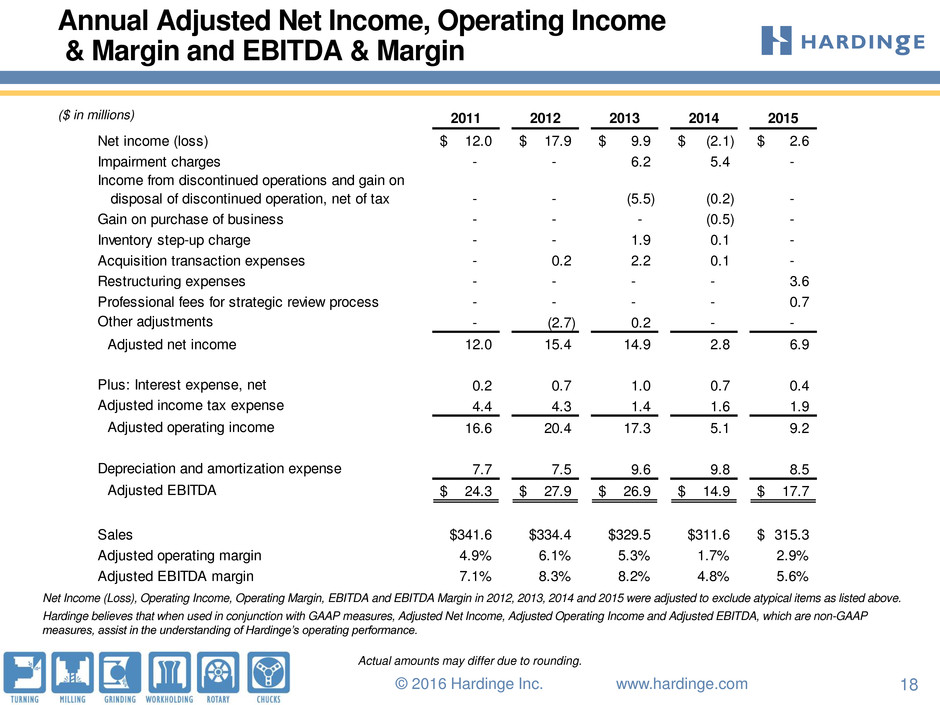
© 2016 Hardinge Inc. www.hardinge.com 18 2011 2012 2013 2014 2015 Net income (loss) 12.0$ 17.9$ 9.9$ (2.1)$ 2.6$ Impairment charges - - 6.2 5.4 - Income from discontinued operations and gain on disposal of discontinued operation, net of tax - - (5.5) (0.2) - Gain on purchase of business - - - (0.5) - Inventory step-up charge - - 1.9 0.1 - Acquisition transaction expenses - 0.2 2.2 0.1 - Restructuring expenses - - - - 3.6 Professional fees for strategic review process - - - - 0.7 Other adjustments - (2.7) 0.2 - - Adjusted net income 12.0 15.4 14.9 2.8 6.9 Plus: Interest expense, net 0.2 0.7 1.0 0.7 0.4 Adjusted income tax expense 4.4 4.3 1.4 1.6 1.9 Adjusted operating income 16.6 20.4 17.3 5.1 9.2 Depreciation and amortization expense 7.7 7.5 9.6 9.8 8.5 Adjusted EBITDA 24.3$ 27.9$ 26.9$ 14.9$ 17.7$ Sales $341.6 $334.4 $329.5 $311.6 315.3$ Adjusted operating margin 4.9% 6.1% 5.3% 1.7% 2.9% Adjusted EBITDA margin 7.1% 8.3% 8.2% 4.8% 5.6% Annual Adjusted Net Income, Operating Income & Margin and EBITDA & Margin Net Income (Loss), Operating Income, Operating Margin, EBITDA and EBITDA Margin in 2012, 2013, 2014 and 2015 were adjusted to exclude atypical items as listed above. Hardinge believes that when used in conjunction with GAAP measures, Adjusted Net Income, Adjusted Operating Income and Adjusted EBITDA, which are non-GAAP measures, assist in the understanding of Hardinge’s operating performance. Actual amounts may differ due to rounding. ($ in millions)
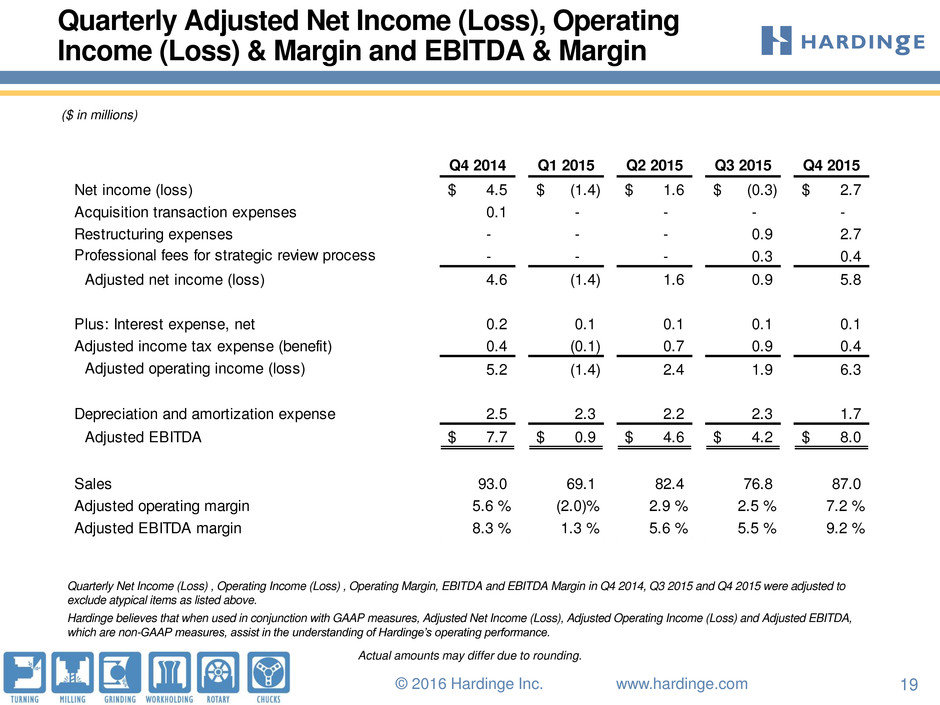
© 2016 Hardinge Inc. www.hardinge.com 19 Quarterly Adjusted Net Income (Loss), Operating Income (Loss) & Margin and EBITDA & Margin ($ in millions) Quarterly Net Income (Loss) , Operating Income (Loss) , Operating Margin, EBITDA and EBITDA Margin in Q4 2014, Q3 2015 and Q4 2015 were adjusted to exclude atypical items as listed above. Hardinge believes that when used in conjunction with GAAP measures, Adjusted Net Income (Loss), Adjusted Operating Income (Loss) and Adjusted EBITDA, which are non-GAAP measures, assist in the understanding of Hardinge’s operating performance. Actual amounts may differ due to rounding. Q4 2014 Q1 2015 Q2 2015 Q3 2015 Q4 2015 Net income (loss) 4.5$ (1.4)$ 1.6$ (0.3)$ 2.7$ Acquisition transaction expenses 0.1 - - - - Restructuring expenses - - - 0.9 2.7 Professional fees for strategic review process - - - 0.3 0.4 Adjusted net income (loss) 4.6 (1.4) 1.6 0.9 5.8 Plus: Interest expense, net 0.2 0.1 0.1 0.1 0.1 Adjusted income tax expense (benefit) 0.4 (0.1) 0.7 0.9 0.4 Adjusted operating income (loss) 5.2 (1.4) 2.4 1.9 6.3 Depreciation and amortization expense 2.5 2.3 2.2 2.3 1.7 Adjusted EBITDA 7.7$ 0.9$ 4.6$ 4.2$ 8.0$ Sales 93.0 69.1 82.4 76.8 87.0 Adjusted operating margin 5.6 % (2.0)% 2.9 % 2.5 % 7.2 % Adjusted EBITDA margin 8.3 % 1.3 % 5.6 % 5.5 % 9.2 %

© 2016 Hardinge Inc. www.hardinge.com 20 3/31/2014 6/30/2014 9/30/2014 12/31/2014 3/31/2015 6/30/2015 9/30/2015 12/31/2015 Sales 70.9$ 78.9$ 68.9$ 93.0$ 69.1$ 82.4$ 76.8$ 87.0$ Cost of sales 51.7 56.9 50.2 66.0 50.9 58.9 55.1 60.0 Gross profit 19.2 22.0 18.7 27.0 18.2 23.5 21.7 27.0 Gross profit margin 27.1% 27.9% 27.1% 29.1% 26.4% 28.5% 28.3% 31.0% Selling, general and administrative expenses 19.1 20.1 20.1 21.7 19.6 21.1 19.9 20.7 Restructuring charges - - - - - - 0.9 2.7 Impairment charges - - 5.8 - - - - - Other expense (income) 0.4 0.3 (0.3) 0.2 - - 0.2 0.4 (Loss) income from operations (0.3) 1.6 (6.9) 5.1 (1.4) 2.4 0.7 3.2 Operating margin (0.4)% 2.1 % (10.0)% 5.5 % (2.0)% 2.9 % 1.0 % 3.7 % Interest expense, net 0.2 0.1 0.2 0.2 0.1 0.1 0.1 0.1 (Loss) income from continuing operations before income taxes (0.5) 1.5 (7.1) 4.9 (1.5) 2.3 0.6 3.1 Income tax expense (benefit) 0.2 0.2 0.5 0.4 (0.1) 0.7 0.9 0.4 (Loss) income from continuing operations (0.7)$ 1.3$ (7.6)$ 4.5$ (1.4)$ 1.6$ (0.3)$ 2.7$ Income from discontinued operations, and gain from disposal of discontinued operation, net of tax 0.2 - - - - - - - Net (loss) income (0.5)$ 1.3$ (7.6)$ 4.5$ (1.4)$ 1.6$ (0.3)$ 2.7$ Basic (loss) earnings per share Continuing operations (0.05)$ 0.11$ (0.60)$ 0.36$ (0.11)$ 0.12$ (0.03)$ 0.22$ Discontinued operations 0.01 - - - - - - - (Loss) earnings per share (0.04)$ 0.11$ (0.60)$ 0.36$ (0.11)$ 0.12$ (0.03)$ 0.22$ Diluted (loss) earnings per share Continuing operations (0.05)$ 0.11$ (0.60)$ 0.35$ (0.11)$ 0.12$ (0.03)$ 0.21$ Discontinued operations 0.01 - - - - - - - (Loss) earnings per share (0.04)$ 0.11$ (0.60)$ 0.35$ (0.11)$ 0.12$ (0.03)$ 0.21$ Cash dividends declared per share 0.02$ 0.02$ 0.02$ 0.02$ 0.02$ 0.02$ 0.02$ 0.02$ Weighted avg. shares outstanding: Basic 12.5 12.7 12.7 12.7 12.7 12.8 12.8 12.8 Weighted avg. shares outstanding: Diluted 12.5 12.8 12.7 12.8 12.7 12.9 12.8 12.9 Quarterly Financial Appendix Actual amounts may differ due to rounding. (in millions, except per share data)
Serious News for Serious Traders! Try StreetInsider.com Premium Free!
You May Also Be Interested In
- Solana Price Prediction: $150 Recovery Meets AlphaPepe and the Search for More Than Another Blue-Chip Bounce
- Jostens Announces New Partnership with James Madison University
- Next Crypto To Explode Beyond VELVET: Could AlphaPepe Turn Everyday AI Trading Into Demand for ALPE?
Create E-mail Alert Related Categories
SEC FilingsSign up for StreetInsider Free!
Receive full access to all new and archived articles, unlimited portfolio tracking, e-mail alerts, custom newswires and RSS feeds - and more!
