



Form 8-K GAIN Capital Holdings, For: Feb 26
 Tweet
Tweet Share
Share E-mail
 UNITED STATES
SECURITIES AND EXCHANGE COMMISSION
WASHINGTON, D.C. 20549
FORM 8-K
CURRENT REPORT
PURSUANT TO SECTION 13 OR 15(d) OF THE
SECURITIES EXCHANGE ACT OF 1934
February 26, 2015
Date of Report (Date of earliest event reported)
GAIN CAPITAL HOLDINGS, INC.
(Exact name of registrant as specified in its charter)
Delaware | 001-35008 | 20-4568600 | ||
(State of Incorporation) | (Commission File No.) | (IRS Employer Identification No.) | ||
Bedminster One
135 Route 202/206
Bedminster, New Jersey 07921
(Address of Principal Executive Offices)
(908) 731-0700
(Registrant’s Telephone Number, Including Area Code)
Check the appropriate box below if the Form 8-K filing is intended to simultaneously satisfy the filing obligation of the registrant under any of the following provisions (see General Instruction A.2. below):
o | Written communications pursuant to Rule 425 under the Securities Act (17 CFR 230.425) |
o | Soliciting material pursuant to Rule 14a-12 under the Exchange Act (17 CFR 240.14a-12) |
o | Pre-commencement communications pursuant to Rule 14d-2(b) under the Exchange Act (17 CFR 240.14d-2(b)) |
o | Pre-commencement communications pursuant to Rule 13e-4(c) under the Exchange Act (17 CFR 240.13e-4(c)) |
Item 2.02 Results of Operations and Financial Condition.
On February 26, 2015, GAIN Capital Holdings, Inc., a Delaware corporation (the “Company”), issued a press release to report the Company’s financial results for the fourth quarter and full year ended December 31, 2014. The full text of the press release is attached to this current report on Form 8-K as Exhibit 99.1.*
Item 7.01 Regulation FD Disclosure.
On February 26, 2015, beginning at 8:00 a.m., eastern time, the Company will host a conference call concerning the Company’s financial results for the fourth quarter and fiscal year ended December 31, 2014. In connection with this conference call, the Company has made available for review on its website (ir.gaincapital.com) a copy of its corporate presentation. A copy of the corporate presentation is also attached hereto as Exhibit 99.2.*
Item 8.01 Other Events.
On February 26, 2015, the Company announced that its Board of Directors has declared a dividend of $0.05 per share of the Company’s common stock. The dividend will be paid on March 23, 2015 to shareholders of record at the close of business on March 13, 2015.
Item 9.01. Financial Statements and Exhibits
Exhibit No. | Description | |
99.1 | Press Release of GAIN Capital Holdings, Inc., dated February 26, 2015, reporting its financial results. | |
99.2 | Corporate Presentation | |
* | The information furnished in Items 2.02, 7.01 and 9.01 of this Current Report on Form 8-K, including Exhibits 99.1 and 99.2, shall not be deemed “filed” for purposes of Section 18 of the Securities Exchange Act of 1934 (the “Exchange Act”), or otherwise subject to the liabilities of that section, nor shall it be deemed incorporated by reference in any filing under the Securities Act of 1933 or the Exchange Act, except as expressly set forth by specific reference in such a filing. |
SIGNATURES
Pursuant to the requirements of the Securities Exchange Act of 1934, the registrant has duly caused this report to be signed on its behalf by the undersigned hereunto duly authorized.
Dated: February 26, 2015
GAIN CAPITAL HOLDINGS, INC. | ||
By: | /s/ Jason Emerson | |
Name: | Jason Emerson | |
Title: | Chief Financial Officer | |
Exhibit Index
Exhibit No. | Description | |
99.1 | Press Release of GAIN Capital Holdings, Inc., dated February 26, 2015, reporting its financial results. | |
99.2 | Corporate Presentation | |
GAIN Capital Reports Record Fourth Quarter and Full Year Results
Fourth Quarter 2014
-Record net revenue of $114.7 million, up 37%
-Net income of $17.6 million, up 309%
-Earnings per diluted share of $0.41, up 273%
-Adjusted EBITDA of $35.9 million, up 164%
-Retail OTC trading volume of $730.6 billion, up 42%
Full Year 2014
-Net revenue of $369.5 million, up 38%
-Adjusted EBITDA of $74.6 million, up 23%
-Retail OTC trading volume of $2.4 trillion, up 35%
-Institutional trading volume of $5.1 trillion, up 29%
BEDMINSTER, N.J., February 26, 2015 /PRNewswire/ -- GAIN Capital Holdings, Inc. ("GAIN") (NYSE: GCAP), a leading global provider of online trading services, announced financial results for the fourth quarter and full year 2014.
“We ended 2014 with an exceptionally strong quarter, as we capitalized on improved market conditions to increase customer engagement across our businesses, boost trading volumes and attract new customers. Retail OTC trading volume and revenue both grew by more than 35%, and we ended the year with record funded accounts. Our focus on growing our commission-based businesses also continues to deliver results, with commission-based revenue up by 30% from a year ago,” said Glenn Stevens, CEO of GAIN Capital. “This positive growth, combined with our disciplined management of fixed operating expenses allowed us to deliver record quarterly revenue and net income of $114.7 million and $17.6 million, respectively,” continued Mr. Stevens.
“Throughout 2014, we continued to execute on our strategy of growing our business both organically and through M&A and diversifying our revenues across products, customer types and geographies. We delivered record net revenue of $369.5 million, which was up 38% for the year; I am especially proud that due to their continued successful development, our commission-based businesses comprised 34% of our annual net revenue, up from 23% in 2013 and 14% in 2012,” Mr. Stevens continued. “On the M&A side, in October we announced the acquisition of London-based City Index, our second large-scale acquisition in two years, following our successful acquisition and integration of GFT. City Index will continue the process of diversifying our retail OTC volume, giving us further exposure to non-fx asset classes such as equity, energy and precious metals via CFDs. These transactions demonstrate our position as an industry consolidator and our expertise in realizing substantial operating expense synergies, while also providing a platform to continue to grow and diversify our businesses,” Mr. Stevens added.
“We enter 2015 with solid momentum, with robust client engagement and trading volumes continuing in the initial weeks of the first quarter,” Mr. Stevens continued. “As a result of our strong risk management capabilities, we successfully navigated the Swiss franc event on January 15, 2015 and since then we’ve seen a strong increase in new accounts, up significantly in January versus our monthly average in the fourth quarter. With strong momentum in organic growth coupled with our acquisition of City Index, which we expect to close in early Q2, we believe we are well-positioned to deliver growth and value for our stakeholders in 2015 and beyond,” Mr. Stevens concluded.
Fourth Quarter Highlights
(Comparisons below are referenced to the three months ending December 31, 2013)
• | Net revenue of $114.7 million, up 37% |
• | Net income of $17.6 million, up 309% |
• | Earnings per diluted share of $0.41, up 273% |
• | Adjusted EBITDA* of $35.9 million, up 164% |
• | Retail OTC trading volume of $730.6 billion, up 42% |
• | Institutional trading volume of $1.2 trillion, up 11% |
• | Average Daily Futures Contracts of 30,446, up 41% |
Full Year Highlights
(Comparisons below are referenced to the twelve months ending December 31, 2013)
• | Net revenue of $369.5 million, up 38% |
• | Net income of $31.6 million, up slightly from 2013 |
• | Earnings per diluted share of $0.71, down 10% |
• | Adjusted EBITDA* of $74.6 million, up 23% |
• | Retail OTC trading volume of $2.4 trillion, up 35% |
• | Institutional trading volume of $5.1 trillion, up 29% |
• | Average Daily Futures Contracts of 27,131, up 31% |
(*See below for reconciliation of non-GAAP financial measures)
Retail OTC Business
In the fourth quarter of 2014, GAIN’s retail OTC trading business generated revenue of $85.1 million, up 39% from $61.4 million in the fourth quarter of 2013. Retail OTC trading volume was $730.6 billion, up 42% from $513.0 billion in the fourth quarter of 2013.
Full year retail OTC revenue was $236.7 million, up 15% from $205.1 million in 2013. Total retail trading volume was $2.4 trillion, up 35% from $1.8 trillion in 2013.
Institutional Businesses
In the fourth quarter of 2014, GAIN’s institutional business, which includes the GTX platform and the Sales Trader business, generated total revenue of $19.8 million, compared with $17.7 million in the fourth quarter of 2013. Total institutional trading volume was $1.2 trillion, compared with $1.1 trillion in the fourth quarter of 2013.
In 2014, GAIN’s institutional businesses generated total revenue of $89.2 million, compared with $38.6 million in 2013. Total institutional trading volume was $5.1 trillion, compared with $4.0 trillion in 2013.
Futures
The exchange-traded futures business generated revenue of $7.3 million in the fourth quarter of 2014, compared with $5.3 million in the fourth quarter of 2013. Average daily futures contracts reached 30,446, up 41% from 21,575 in the fourth quarter of 2013.
In 2014, the exchange-traded futures business generated total revenue of $32.7 million, compared with $22.1 million in 2013. Average daily futures contracts were 27,131 for 2014, compared with 20,717 in 2013.
City Index
A special meeting of stockholders has been convened for March 12, 2015 to approve our acquisition of City Index and certain other matters. Assuming the transaction is approved by stockholders and other required approvals are obtained, we expect to close the acquisition in early Q2 and reiterate our previously disclosed synergy target of $45 - $55 million in the two years following the closing.
City Index’s preliminary results for the fourth quarter of 2014, under U.K. GAAP, include net revenue of $43.3 million, up 22% from $35.4 million in the fourth quarter of 2013 and Adjusted EBITDA of $12.7 million, up 74% from $7.3 million in the fourth quarter of 2013. Trading volume was $270.9 billion, up 27% from $213.0 billion in the fourth quarter of 2013.
Dividend
GAIN’s Board of Directors declared a quarterly cash dividend of $0.05 per share of the Company’s common stock. The dividend is payable on March 23, 2015 to shareholders of record as of the close of business on March 13, 2015.
Conference Call
GAIN will host a conference call Thursday, February 26, 2015 at 8.00 a.m. ET. Participants may access the live call by dialing + 1-866-652-5200 (U.S. domestic), or + 1-412-317-6060 (international).
A live audio webcast of the call and a copy of the accompanying presentation will also be available on the Investor Relations section of the GAIN website (http://ir.gaincapital.com). A PDF copy of the earnings presentation will also be available on the Investor Relations website.
An audio replay will be made available for one month starting approximately two hours after the call by dialing +1-877-344-7529 in the U.S. or +1-412-317-0088 from abroad, and entering passcode 10060327#
About GAIN
GAIN Capital Holdings, Inc. (NYSE: GCAP) provides innovative trading technology and execution services to retail and institutional investors worldwide, with multiple access points to OTC markets and global exchanges across a wide range of asset classes, including foreign exchange, commodities, and global equities. GAIN Capital is headquartered in Bedminster, New Jersey, with a global presence across North America, Europe and the Asia Pacific regions. For further company information, visit www.gaincapital.com
Investor Relations Contact
Hugh Collins and Lynn Morgen
MBS Value Partners
+1 212.750.5800
Media Contact
Chris Mittendorf, Edelman for GAIN Capital
+1 212.704.8134
Condensed Consolidated Statements of Operations
In millions except share data
(unaudited)
Three Months Ended | Twelve Months Ended | ||||||||||||||
December 31, | December 31, | ||||||||||||||
2014 | 2013 | 2014 | 2013 | ||||||||||||
REVENUE: | |||||||||||||||
Trading revenue | $ | 85.1 | $ | 61.4 | $ | 236.7 | $ | 205.1 | |||||||
Commission revenue | 29.9 | 23.0 | 127.1 | 60.8 | |||||||||||
Other revenue | (0.3 | ) | (0.6 | ) | 4.9 | 1.1 | |||||||||
Total non-interest revenue | 114.7 | 83.8 | 368.7 | 267.0 | |||||||||||
Interest revenue | 0.3 | 0.2 | 1.4 | 0.8 | |||||||||||
Interest expense | 0.3 | 0.1 | 0.6 | 0.2 | |||||||||||
Total net interest revenue | — | 0.1 | 0.8 | 0.6 | |||||||||||
Net revenue | 114.7 | 83.9 | 369.5 | 267.6 | |||||||||||
EXPENSES: | |||||||||||||||
Employee compensation and benefits | 28.0 | 23.8 | 99.5 | 74.2 | |||||||||||
Selling and marketing | 4.1 | 6.4 | 20.2 | 22.3 | |||||||||||
Referral fees | 25.2 | 18.9 | 91.1 | 52.5 | |||||||||||
Trading expenses | 6.2 | 6.0 | 26.3 | 18.1 | |||||||||||
General & Administrative | 10.3 | 10.1 | 38.5 | 26.9 | |||||||||||
Depreciation and amortization | 1.4 | 2.6 | 7.1 | 7.8 | |||||||||||
Purchased intangible amortization | 3.3 | 1.2 | 8.1 | 2.9 | |||||||||||
Communication and technology | 4.0 | 4.8 | 15.6 | 11.3 | |||||||||||
Bad debt provision | 1.0 | 0.3 | 3.7 | 1.5 | |||||||||||
Acquisition expense | 2.0 | 0.3 | 3.5 | 1.8 | |||||||||||
Restructuring | 0.2 | 1.2 | 1.2 | 1.6 | |||||||||||
Integration | 0.8 | 1.9 | 2.5 | 1.9 | |||||||||||
Impairment on investment | 0.1 | 0.5 | 0.1 | 0.5 | |||||||||||
Total operating expense | 86.6 | 78.0 | 317.4 | 223.3 | |||||||||||
Operating income | 28.1 | 5.9 | 52.1 | 44.3 | |||||||||||
Interest on long-term borrowings | 1.7 | 0.9 | 6.1 | 1.2 | |||||||||||
Gain on extinguishment of debt | — | 2.0 | — | 2.0 | |||||||||||
Income before tax expense | 26.4 | 7.0 | 46.0 | 45.1 | |||||||||||
Income tax expense | 8.4 | 2.7 | 13.0 | 13.8 | |||||||||||
Net income | $ | 18.0 | $ | 4.3 | $ | 33.0 | $ | 31.3 | |||||||
Net income attributable to non-controlling interest | $ | 0.4 | $ | — | $ | 1.4 | $ | — | |||||||
Net income applicable to Gain Capital Holdings Inc. | $ | 17.6 | $ | 4.3 | $ | 31.6 | $ | 31.3 | |||||||
Earnings per common share(1) | |||||||||||||||
Basic | $ | 0.43 | $ | 0.11 | $ | 0.76 | $ | 0.85 | |||||||
Diluted | $ | 0.41 | $ | 0.11 | $ | 0.71 | $ | 0.79 | |||||||
Weighted averages common shares outstanding used | |||||||||||||||
in computing earnings per common share: | |||||||||||||||
Basic | 41,506,205 | 39,492,413 | 40,561,644 | 36,551,246 | |||||||||||
Diluted | 43,684,324 | 42,646,162 | 43,214,895 | 39,632,878 | |||||||||||
(1) Adjusted for the effect of the GAA/TT put option
Condensed Consolidated Balance Sheet
In millions
(unaudited)
December 31, | December 31, | ||||||
2014 | 2013 | ||||||
ASSETS: | |||||||
Cash and cash equivalents | $ | 139.4 | $ | 39.9 | |||
Cash and securities held for customers | 759.6 | 739.3 | |||||
Short term investments | 0.2 | 0.8 | |||||
Receivables from banks and brokers | 134.9 | 227.6 | |||||
Property and equipment - net of accumulated depreciation | 18.8 | 17.1 | |||||
Prepaid assets | 2.5 | 8.8 | |||||
Goodwill | 34.9 | 15.7 | |||||
Intangible assets, net | 60.8 | 34.8 | |||||
Other assets | 35.1 | 28.6 | |||||
Total assets | $ | 1,186.2 | $ | 1,112.6 | |||
LIABILITIES AND SHAREHOLDERS' EQUITY: | |||||||
Payables to customers, brokers, dealers, FCM's and other regulated entities | $ | 759.6 | $ | 739.3 | |||
Accrued compensation & benefits | 16.9 | 13.0 | |||||
Accrued expenses and other liabilities | 64.7 | 56.7 | |||||
Income tax payable | 1.2 | 3.8 | |||||
Note payable | 68.4 | 65.4 | |||||
Total liabilities | $ | 910.8 | $ | 878.2 | |||
Non-controlling interest | 10.2 | — | |||||
Shareholders' Equity | 265.2 | 234.4 | |||||
Total liabilities and shareholders' equity | $ | 1,186.2 | $ | 1,112.6 | |||
Reconciliation of GAAP Net Income to Adjusted EBITDA
Adjusted EBITDA is a non-GAAP financial measure that represents our earnings before interest, taxes, depreciation and amortization, restructuring, acquisition and integration-related expenses, impairment on investment and gain on extinguishment of debt. This non-GAAP financial measure has certain limitations, including that it does not have a standardized meaning and, therefore, our definition may be different from similar non-GAAP financial measures used by other companies and/or analysts. Thus, it may be more difficult to compare our financial performance to that of other companies. We believe our reporting of adjusted EBITDA assists investors in evaluating our operating performance. However, because adjusted EBITDA is not a measure of financial performance calculated in accordance with GAAP, such measure should be considered in addition to, but not as a substitute for, other measures of our financial performance reported in accordance with GAAP, such as net income.
Reconciliation of GAAP Net Income to Adjusted EBITDA
In millions
(unaudited)
Three Months Ended | Twelve Months Ended | ||||||||||||||
December 31, | December 31, | ||||||||||||||
2014 | 2013 | 2014 | 2013 | ||||||||||||
Net revenue | $ | 114.7 | $ | 83.9 | $ | 369.5 | $ | 267.6 | |||||||
Net income applicable to Gain Capital Holdings Inc. | 17.6 | 4.3 | 31.6 | 31.3 | |||||||||||
Net income | $ | 17.6 | $ | 4.3 | $ | 31.6 | $ | 31.3 | |||||||
Depreciation and amortization | 1.4 | 2.6 | 7.1 | 7.8 | |||||||||||
Purchased intangible amortization | 3.3 | 1.2 | 8.1 | 2.9 | |||||||||||
Interest expense | 1.7 | 0.9 | 6.1 | 1.2 | |||||||||||
Income tax expense | 8.4 | 2.7 | 13.0 | 13.8 | |||||||||||
Acquisition expense | 2.0 | 0.3 | 3.5 | 1.8 | |||||||||||
Restructuring | 0.2 | 1.2 | 1.2 | 1.6 | |||||||||||
Integration | 0.8 | 1.9 | 2.5 | 1.9 | |||||||||||
Net income attributable to non-controlling interest | 0.4 | — | 1.4 | — | |||||||||||
Other non-recurring items | 0.1 | (1.5 | ) | 0.1 | (1.5 | ) | |||||||||
Adjusted EBITDA | 35.9 | 13.6 | 74.6 | 60.8 | |||||||||||
Reconciliation of City Index U.K. GAAP Net Income to Adjusted EBITDA
In millions
(unaudited)
Three Months Ended | |||||||
December 31, | |||||||
2014 | 2013 | ||||||
Net revenue | $ | 43.3 | $ | 35.4 | |||
Net income | $ | 4.4 | $ | (0.7 | ) | ||
Depreciation and amortization | 4.2 | 7.1 | |||||
One-time expenses | 4.1 | 1.1 | |||||
Adjusted EBITDA | 12.7 | 7.5 | |||||
Forward-Looking Statements:
The forward-looking statements contained herein include, without limitation, statements relating to GAIN Capital’s and/or City Index (Holdings) Limited (“City Index”) expectations regarding the opportunities and strengths of the combined company created by the proposed business combination, anticipated cost and revenue synergies, the strategic rationale for the proposed business combination, including expectations regarding product offerings, growth opportunities, value creation, and financial strength, and the timing of the closing. All forward looking statements are based upon current expectations and beliefs and various assumptions. There can be no assurance that GAIN Capital or City Index will realize these expectations or that these beliefs will prove correct. In addition, a variety of important factors could cause results to differ materially from such statements. These factors are noted throughout GAIN Capital’s annual report on Form 10-K, as filed with the Securities and Exchange Commission on March 17, 2014, and include, but are not limited to, the actions of both current and potential new competitors, fluctuations in market trading volumes, financial market volatility, evolving industry regulations, including changes in regulation of the futures companies, errors or malfunctions in GAIN Capital’s systems or technology, rapid changes in technology, effects of inflation, customer trading patterns, the success of our products and service offerings, our ability to continue to innovate and meet the demands of our customers for new or enhanced products, our ability to successfully integrate assets and companies we have acquired, our ability to effectively compete in the futures industry, changes in tax policy or accounting rules, fluctuations in foreign exchange rates and commodity prices, adverse changes or volatility in interest rates, as well as general economic, business, credit and financial market conditions, internationally or nationally, and our ability to continue paying a quarterly dividend in light of future financial performance and financing needs. The forward-looking statements included herein represent GAIN Capital’s views as of the date of this release. GAIN Capital undertakes no obligation to revise or update publicly any forward-looking statement for any reason unless required by law.
Non-GAAP Financial Measures
This release contains various non-GAAP financial measures, including Adjusted EBITDA, Adjusted Net Income, Adjusted EPS and Cash EPS. These non-GAAP financial measures have certain limitations, including that they do not have a standardized meaning and, therefore, our definitions may be different from similar non-GAAP financial measures used by other companies and/or analysts. Thus, it may be more difficult to compare our financial performance to that of other companies. We believe our reporting of these non-GAAP financial measures assist investors in evaluating our historical and expected operating performance. However, because these are not measures of financial performance calculated in accordance with GAAP, such measures should be considered in addition to, but not as a substitute for, other measures of our financial performance reported in accordance with GAAP, such as net income.
Fourth Quarter and Full Year Financial and Operating Results February 26, 2015
Safe Harbor Statement 2 Forward Looking Statements The forward-looking statements contained herein include, without limitation, statements relating to GAIN Capital’s and/or City Index (Holdings) Limited (“City Index”) expectations regarding the opportunities and strengths of the combined company created by the proposed business combination, anticipated cost and revenue synergies, the strategic rationale for the proposed business combination, including expectations regarding product offerings, growth opportunities, value creation, and financial strength, and the timing of the closing. All forward looking statements are based upon current expectations and beliefs and various assumptions. There can be no assurance that GAIN Capital or City Index will realize these expectations or that these beliefs will prove correct. In addition, a variety of important factors could cause results to differ materially from such statements. These factors are noted throughout GAIN Capital’s annual report on Form 10- K, as filed with the Securities and Exchange Commission on March 17, 2014, and include, but are not limited to, the actions of both current and potential new competitors, fluctuations in market trading volumes, financial market volatility, evolving industry regulations, including changes in regulation of the futures companies, errors or malfunctions in GAIN Capital’s systems or technology, rapid changes in technology, effects of inflation, customer trading patterns, the success of our products and service offerings, our ability to continue to innovate and meet the demands of our customers for new or enhanced products, our ability to successfully integrate assets and companies we have acquired, our ability to effectively compete in the futures industry, changes in tax policy or accounting rules, fluctuations in foreign exchange rates and commodity prices, adverse changes or volatility in interest rates, as well as general economic, business, credit and financial market conditions, internationally or nationally, and our ability to continue paying a quarterly dividend in light of future financial performance and financing needs. The forward-looking statements included herein represent GAIN Capital’s views as of the date of this release. GAIN Capital undertakes no obligation to revise or update publicly any forward-looking statement for any reason unless required by law. Non-GAAP Financial Measures This presentation contains various non-GAAP financial measures, including Adjusted EBITDA, Adjusted Net Income, Adjusted EPS and Cash EPS. These non-GAAP financial measures have certain limitations, including that they do not have a standardized meaning and, therefore, our definitions may be different from similar non-GAAP financial measures used by other companies and/or analysts. Thus, it may be more difficult to compare our financial performance to that of other companies. We believe our reporting of these non-GAAP financial measures assist investors in evaluating our historical and expected operating performance. However, because these are not measures of financial performance calculated in accordance with GAAP, such measures should be considered in addition to, but not as a substitute for, other measures of our financial performance reported in accordance with GAAP, such as net income.
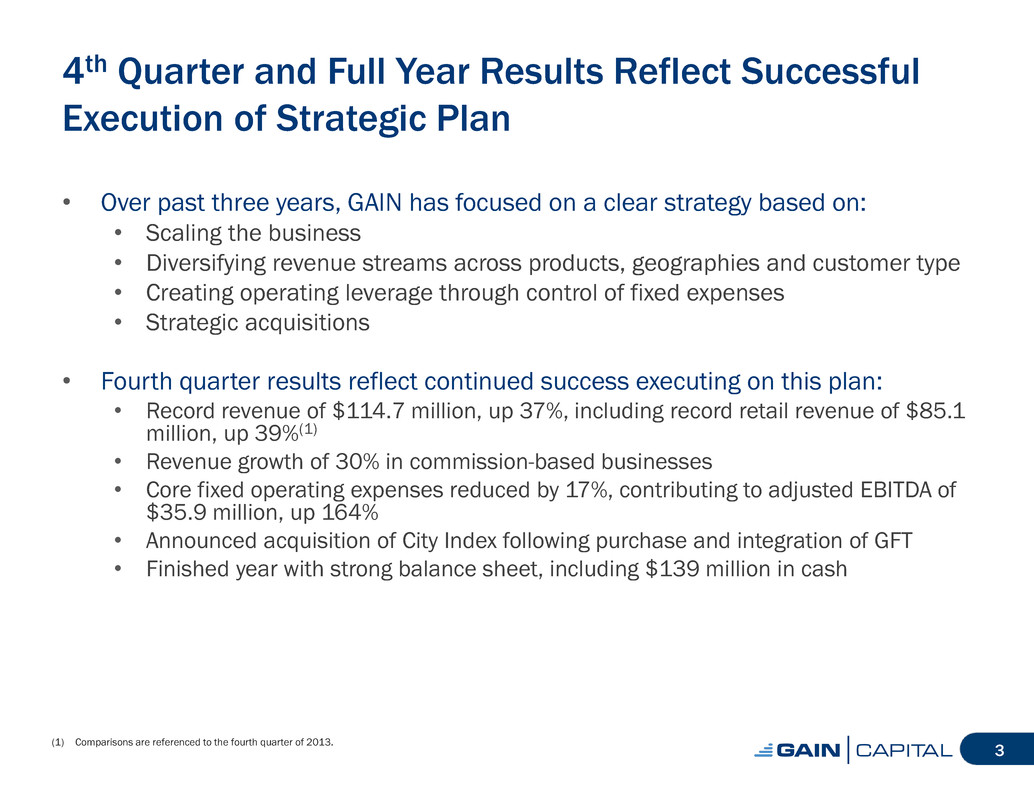
4th Quarter and Full Year Results Reflect Successful Execution of Strategic Plan • Over past three years, GAIN has focused on a clear strategy based on: • Scaling the business • Diversifying revenue streams across products, geographies and customer type • Creating operating leverage through control of fixed expenses • Strategic acquisitions • Fourth quarter results reflect continued success executing on this plan: • Record revenue of $114.7 million, up 37%, including record retail revenue of $85.1 million, up 39%(1) • Revenue growth of 30% in commission-based businesses • Core fixed operating expenses reduced by 17%, contributing to adjusted EBITDA of $35.9 million, up 164% • Announced acquisition of City Index following purchase and integration of GFT • Finished year with strong balance sheet, including $139 million in cash 3 (1) Comparisons are referenced to the fourth quarter of 2013.
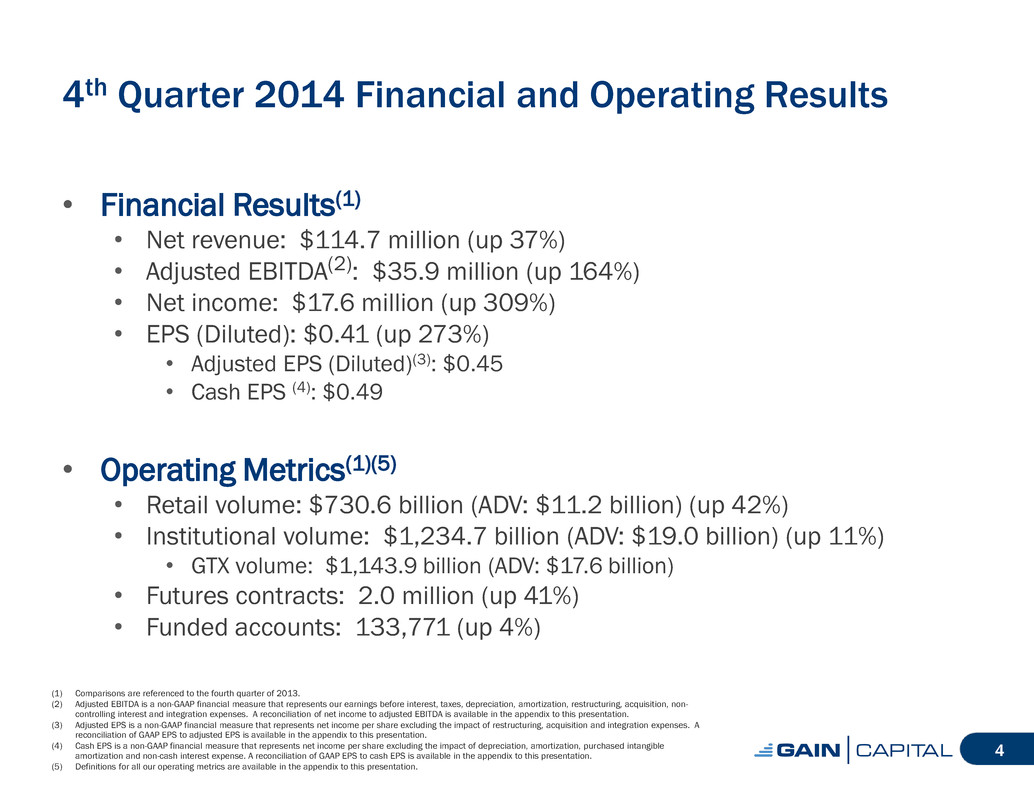
4th Quarter 2014 Financial and Operating Results • Financial Results(1) • Net revenue: $114.7 million (up 37%) • Adjusted EBITDA(2): $35.9 million (up 164%) • Net income: $17.6 million (up 309%) • EPS (Diluted): $0.41 (up 273%) • Adjusted EPS (Diluted)(3): $0.45 • Cash EPS (4): $0.49 • Operating Metrics(1)(5) • Retail volume: $730.6 billion (ADV: $11.2 billion) (up 42%) • Institutional volume: $1,234.7 billion (ADV: $19.0 billion) (up 11%) • GTX volume: $1,143.9 billion (ADV: $17.6 billion) • Futures contracts: 2.0 million (up 41%) • Funded accounts: 133,771 (up 4%) 4 (1) Comparisons are referenced to the fourth quarter of 2013. (2) Adjusted EBITDA is a non-GAAP financial measure that represents our earnings before interest, taxes, depreciation, amortization, restructuring, acquisition, non- controlling interest and integration expenses. A reconciliation of net income to adjusted EBITDA is available in the appendix to this presentation. (3) Adjusted EPS is a non-GAAP financial measure that represents net income per share excluding the impact of restructuring, acquisition and integration expenses. A reconciliation of GAAP EPS to adjusted EPS is available in the appendix to this presentation. (4) Cash EPS is a non-GAAP financial measure that represents net income per share excluding the impact of depreciation, amortization, purchased intangible amortization and non-cash interest expense. A reconciliation of GAAP EPS to cash EPS is available in the appendix to this presentation. (5) Definitions for all our operating metrics are available in the appendix to this presentation.
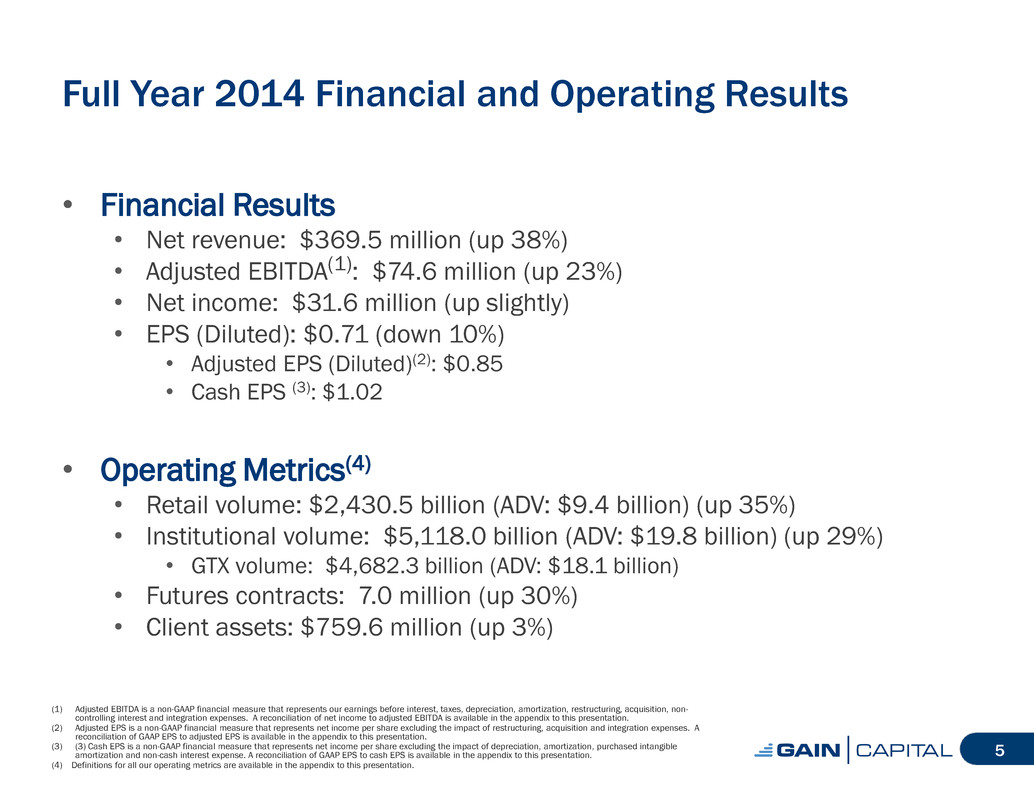
Full Year 2014 Financial and Operating Results • Financial Results • Net revenue: $369.5 million (up 38%) • Adjusted EBITDA(1): $74.6 million (up 23%) • Net income: $31.6 million (up slightly) • EPS (Diluted): $0.71 (down 10%) • Adjusted EPS (Diluted)(2): $0.85 • Cash EPS (3): $1.02 • Operating Metrics(4) • Retail volume: $2,430.5 billion (ADV: $9.4 billion) (up 35%) • Institutional volume: $5,118.0 billion (ADV: $19.8 billion) (up 29%) • GTX volume: $4,682.3 billion (ADV: $18.1 billion) • Futures contracts: 7.0 million (up 30%) • Client assets: $759.6 million (up 3%) 5 (1) Adjusted EBITDA is a non-GAAP financial measure that represents our earnings before interest, taxes, depreciation, amortization, restructuring, acquisition, non- controlling interest and integration expenses. A reconciliation of net income to adjusted EBITDA is available in the appendix to this presentation. (2) Adjusted EPS is a non-GAAP financial measure that represents net income per share excluding the impact of restructuring, acquisition and integration expenses. A reconciliation of GAAP EPS to adjusted EPS is available in the appendix to this presentation. (3) (3) Cash EPS is a non-GAAP financial measure that represents net income per share excluding the impact of depreciation, amortization, purchased intangible amortization and non-cash interest expense. A reconciliation of GAAP EPS to cash EPS is available in the appendix to this presentation. (4) Definitions for all our operating metrics are available in the appendix to this presentation.
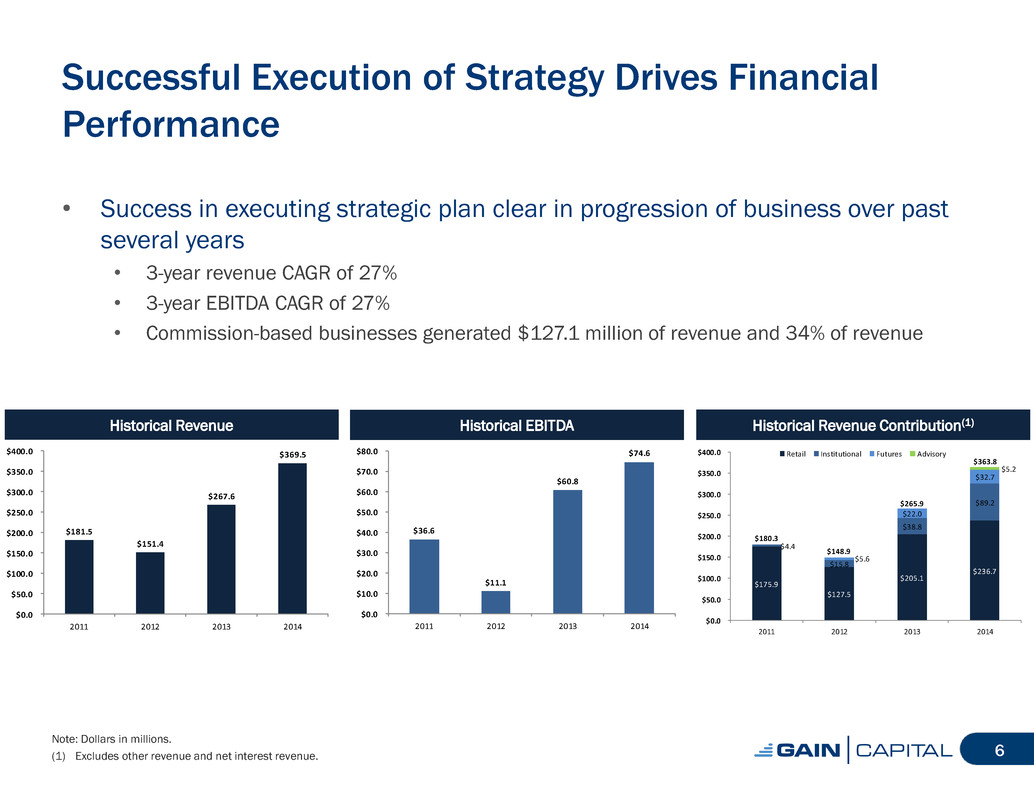
Successful Execution of Strategy Drives Financial Performance • Success in executing strategic plan clear in progression of business over past several years • 3-year revenue CAGR of 27% • 3-year EBITDA CAGR of 27% • Commission-based businesses generated $127.1 million of revenue and 34% of revenue Note: Dollars in millions. (1) Excludes other revenue and net interest revenue. 6 Historical Revenue Historical EBITDA Historical Revenue Contribution(1) $181.5 $151.4 $267.6 $369.5 $0.0 $50.0 $100.0 $150.0 $200.0 $250.0 $300.0 $350.0 $400.0 2011 2012 2013 2014 $36.6 $11.1 $60.8 $74.6 $0.0 $10.0 $20.0 $30.0 $40.0 $50.0 $60.0 $70.0 $80.0 2011 2012 2013 2014 $175.9 $127.5 $205.1 $236.7 $4.4 $15.8 $38.8 $89.2 $5.6 $22.0 $32.7 $5.2 $180.3 $148.9 $265.9 $363.8 $0.0 $50.0 $100.0 $150.0 $200.0 $250.0 $300.0 $350.0 $400.0 2011 2012 2013 2014 Retail Institutional Futures Advisory
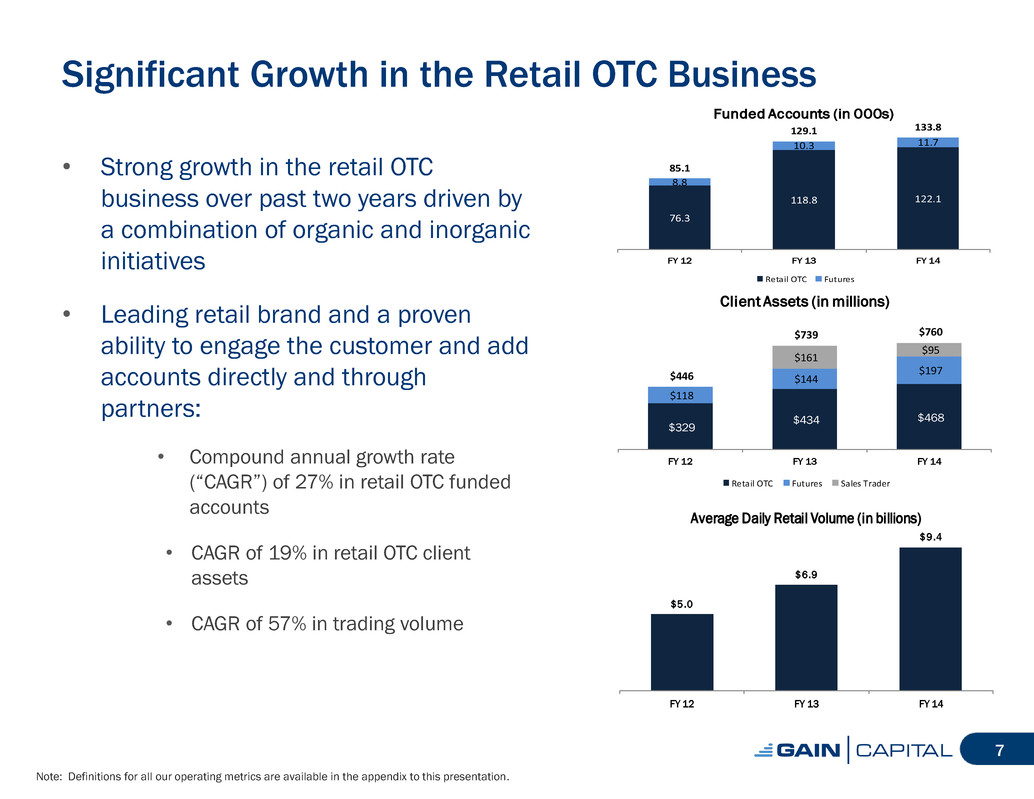
Significant Growth in the Retail OTC Business Note: Definitions for all our operating metrics are available in the appendix to this presentation. 7 • Strong growth in the retail OTC business over past two years driven by a combination of organic and inorganic initiatives • Leading retail brand and a proven ability to engage the customer and add accounts directly and through partners: • Compound annual growth rate (“CAGR”) of 27% in retail OTC funded accounts • CAGR of 19% in retail OTC client assets • CAGR of 57% in trading volume 76.3 118.8 122.1 8.8 10.3 11.7 85.1 129.1 133.8 FY 12 FY 13 FY 14 Funded Accounts (in 000s) Retail OTC Futures $5.0 $6.9 $9.4 FY 12 FY 13 FY 14 Average Daily Retail Volume (in billions) $329 $434 $468 $1 8 $144 $197 $161 $95 $446 $739 $760 FY 12 FY 13 FY 14 Client Assets (in millions) Retail OTC Futures Sales Trader
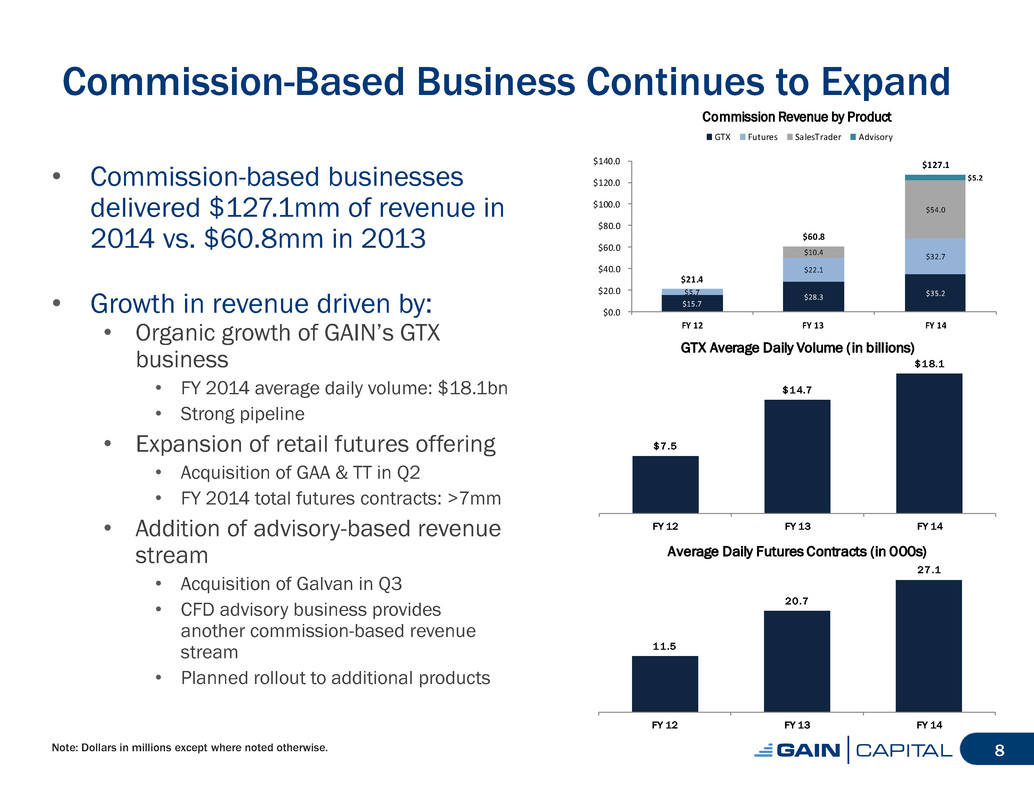
Commission-Based Business Continues to Expand • Commission-based businesses delivered $127.1mm of revenue in 2014 vs. $60.8mm in 2013 • Growth in revenue driven by: • Organic growth of GAIN’s GTX business • FY 2014 average daily volume: $18.1bn • Strong pipeline • Expansion of retail futures offering • Acquisition of GAA & TT in Q2 • FY 2014 total futures contracts: >7mm • Addition of advisory-based revenue stream • Acquisition of Galvan in Q3 • CFD advisory business provides another commission-based revenue stream • Planned rollout to additional products 8 $15.7 $28.3 $35.2 $5.7 $22.1 $32.7 $10.4 $54.0 $5.2 $21.4 $60.8 $127.1 $0.0 $20.0 $40.0 $60.0 $80.0 $100.0 $120.0 $140.0 FY 12 FY 13 FY 14 Commission Revenue by Product GTX Futures SalesTrader Advisory $7.5 $14.7 $18.1 FY 12 FY 13 FY 14 GTX Average Daily Volume (in billions) 11.5 20.7 27.1 FY 12 FY 13 FY 14 Average Daily Futures Contracts (in 000s) Note: Dollars in millions except where noted otherwise.
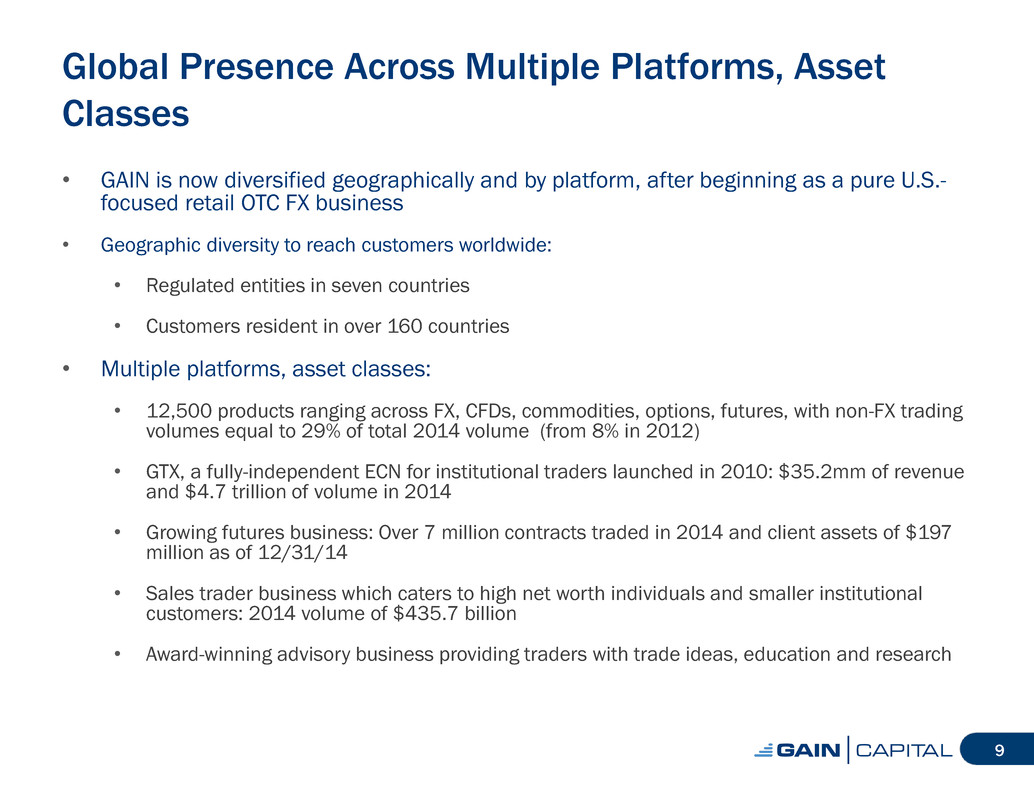
Global Presence Across Multiple Platforms, Asset Classes • GAIN is now diversified geographically and by platform, after beginning as a pure U.S.- focused retail OTC FX business • Geographic diversity to reach customers worldwide: • Regulated entities in seven countries • Customers resident in over 160 countries • Multiple platforms, asset classes: • 12,500 products ranging across FX, CFDs, commodities, options, futures, with non-FX trading volumes equal to 29% of total 2014 volume (from 8% in 2012) • GTX, a fully-independent ECN for institutional traders launched in 2010: $35.2mm of revenue and $4.7 trillion of volume in 2014 • Growing futures business: Over 7 million contracts traded in 2014 and client assets of $197 million as of 12/31/14 • Sales trader business which caters to high net worth individuals and smaller institutional customers: 2014 volume of $435.7 billion • Award-winning advisory business providing traders with trade ideas, education and research 9
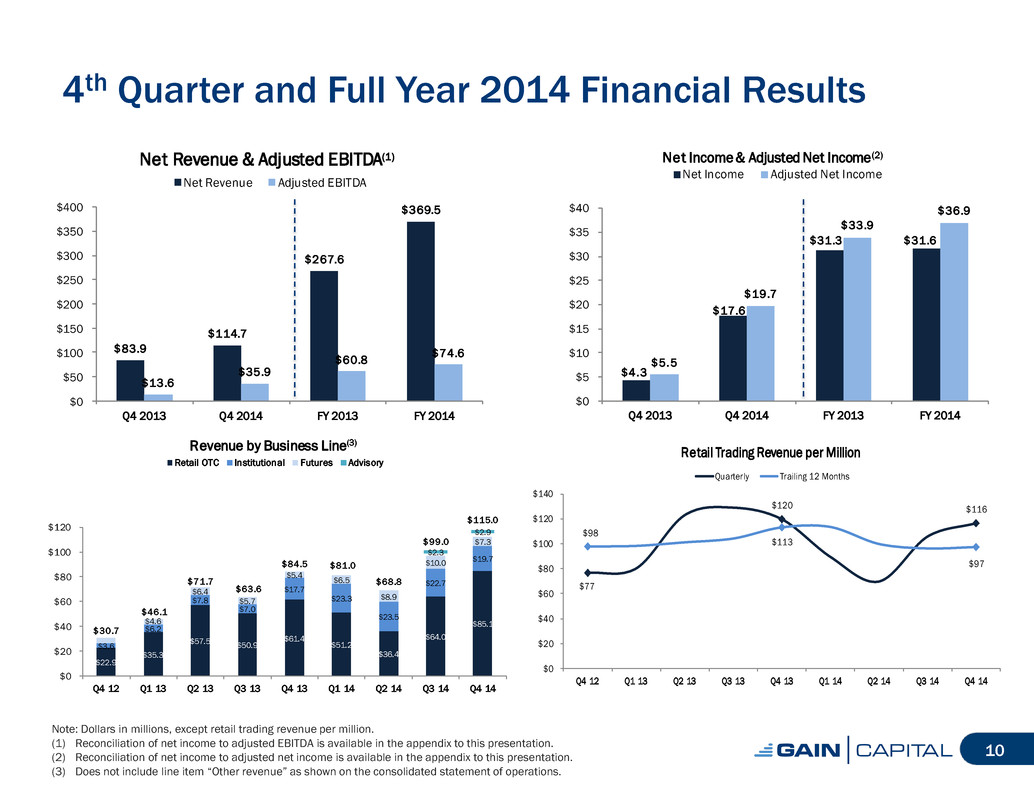
$83.9 $114.7 $267.6 $369.5 $13.6 $35.9 $60.8 $74.6 $0 $50 $100 $150 $200 $250 $300 $350 $400 Q4 2013 Q4 2014 FY 2013 FY 2014 Net Revenue & Adjusted EBITDA(1) Net Revenue Adjusted EBITDA 4th Quarter and Full Year 2014 Financial Results Note: Dollars in millions, except retail trading revenue per million. (1) Reconciliation of net income to adjusted EBITDA is available in the appendix to this presentation. (2) Reconciliation of net income to adjusted net income is available in the appendix to this presentation. (3) Does not include line item “Other revenue” as shown on the consolidated statement of operations. 10 $4.3 $17.6 $31.3 $31.6 $5.5 $19.7 $33.9 $36.9 $0 $5 $10 $15 $20 $25 $30 $35 $40 Q4 2013 Q4 2014 FY 2013 FY 2014 Net Income & Adjusted Net Income(2) Net Income Adjusted Net Income $22.9 $35.3 $57.5 $50.9 $61.4 $51.2 $36.4 $64.0 $85.1 $3.6 $6.2 $7.8 $7.0 $17.7 $23.3 $23.5 $22.7 $19.7 $4.6 $6.4 $5.7 $5.4 $6.5 $8.9 $10.0 $7.3 $30.7 $46.1 $71.7 $63.6 $84.5 $81.0 $68.8 $99.0 $115.0 $2.3 $2.9 $0 $20 $40 $60 $80 $100 $120 Q4 12 Q1 13 Q2 13 Q3 13 Q4 13 Q1 14 Q2 14 Q3 14 Q4 14 Revenue by Business Line(3) Retail OTC Institutional Futures Advisory $77 $120 $116 $98 $113 $97 $0 $20 $40 $60 $80 $100 $120 $140 Q4 12 Q1 13 Q2 13 Q3 13 Q4 13 Q 14 Q2 14 Q3 14 Q4 14 Retail Trading Revenue per Million Quarterly Trailing 12 Months
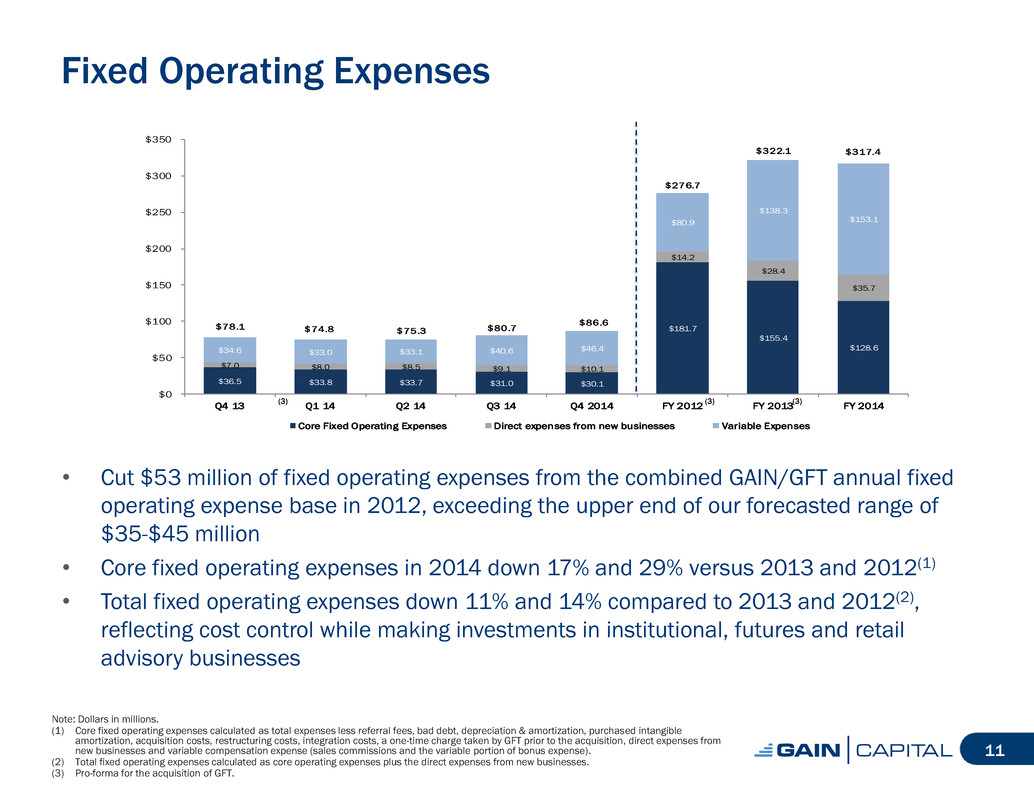
Fixed Operating Expenses Note: Dollars in millions. (1) Core fixed operating expenses calculated as total expenses less referral fees, bad debt, depreciation & amortization, purchased intangible amortization, acquisition costs, restructuring costs, integration costs, a one-time charge taken by GFT prior to the acquisition, direct expenses from new businesses and variable compensation expense (sales commissions and the variable portion of bonus expense). (2) Total fixed operating expenses calculated as core operating expenses plus the direct expenses from new businesses. (3) Pro-forma for the acquisition of GFT. 11 $36.5 $33.8 $33.7 $31.0 $30.1 $181.7 $155.4 $128.6 $7.0 $8.0 $8.5 $9.1 $10.1 $14.2 $28.4 $35.7 $34.6 $33.0 $33.1 $40.6 $46.4 $80.9 $138.3 $153.1 $78.1 $74.8 $75.3 $80.7 $86.6 $276.7 $322.1 $317.4 $0 $50 $100 $150 $200 $250 $300 $350 Q4 13 Q1 14 Q2 14 Q3 14 Q4 2014 FY 2012 FY 2013 FY 2014 Core Fixed Operating Expenses Direct expenses from new businesses Variable Expenses • Cut $53 million of fixed operating expenses from the combined GAIN/GFT annual fixed operating expense base in 2012, exceeding the upper end of our forecasted range of $35-$45 million • Core fixed operating expenses in 2014 down 17% and 29% versus 2013 and 2012(1) • Total fixed operating expenses down 11% and 14% compared to 2013 and 2012(2), reflecting cost control while making investments in institutional, futures and retail advisory businesses (3) (3) (3)
Return of Capital • Return of capital to shareholders • $0.05 per share quarterly dividend approved • Record date: March 13, 2015 • Payment date: March 23, 2015 • Share repurchase • Program remains in place and will continue to be opportunistic 12
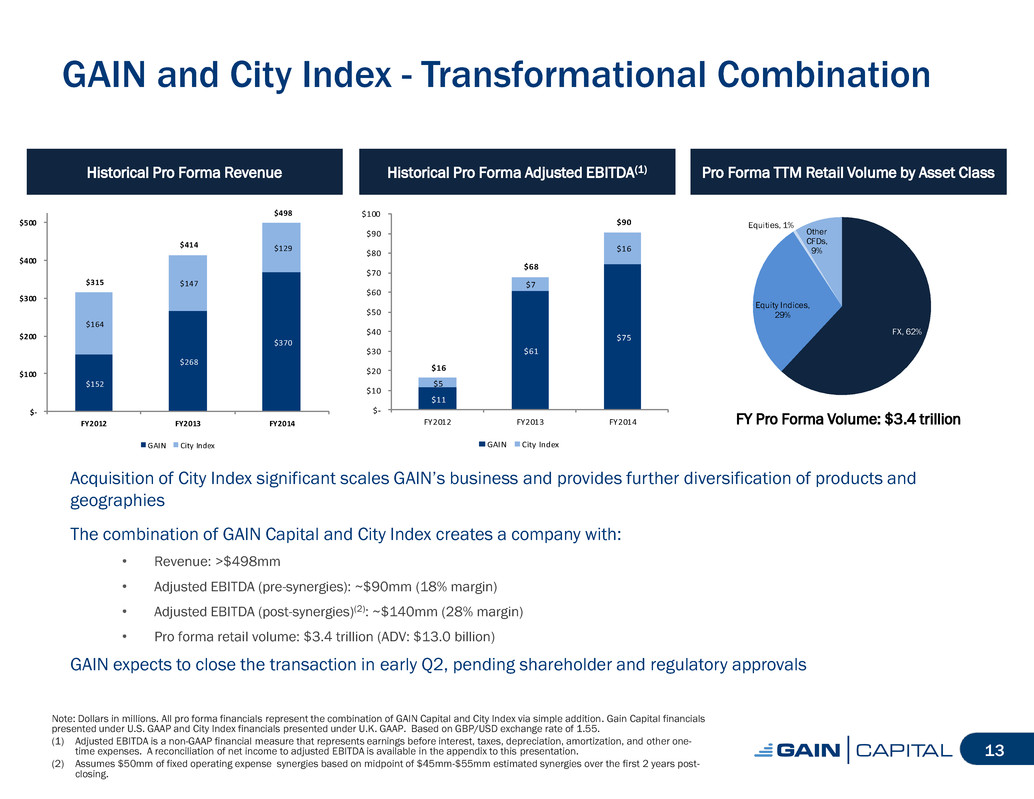
GAIN and City Index - Transformational Combination Acquisition of City Index significant scales GAIN’s business and provides further diversification of products and geographies The combination of GAIN Capital and City Index creates a company with: • Revenue: >$498mm • Adjusted EBITDA (pre-synergies): ~$90mm (18% margin) • Adjusted EBITDA (post-synergies)(2): ~$140mm (28% margin) • Pro forma retail volume: $3.4 trillion (ADV: $13.0 billion) GAIN expects to close the transaction in early Q2, pending shareholder and regulatory approvals Note: Dollars in millions. All pro forma financials represent the combination of GAIN Capital and City Index via simple addition. Gain Capital financials presented under U.S. GAAP and City Index financials presented under U.K. GAAP. Based on GBP/USD exchange rate of 1.55. (1) Adjusted EBITDA is a non-GAAP financial measure that represents earnings before interest, taxes, depreciation, amortization, and other one- time expenses. A reconciliation of net income to adjusted EBITDA is available in the appendix to this presentation. (2) Assumes $50mm of fixed operating expense synergies based on midpoint of $45mm-$55mm estimated synergies over the first 2 years post- closing. 13 Historical Pro Forma Revenue Historical Pro Forma Adjusted EBITDA(1) Pro Forma TTM Retail Volume by Asset Class FY Pro Forma Volume: $3.4 trillion $152 $268 $370 $164 $147 $129 $315 $414 $498 $- $100 $200 $300 $400 $500 FY2012 FY2013 FY2014 GAIN City Index $11 $61 $75 $5 $7 $16 $16 $68 $90 $- $10 $20 $30 $40 $50 $60 $70 $80 $90 $100 FY2012 FY2013 FY2014 GAIN City Index FX, 62% Equity Indices, 29% Equities, 1% Other CFDs, 9%
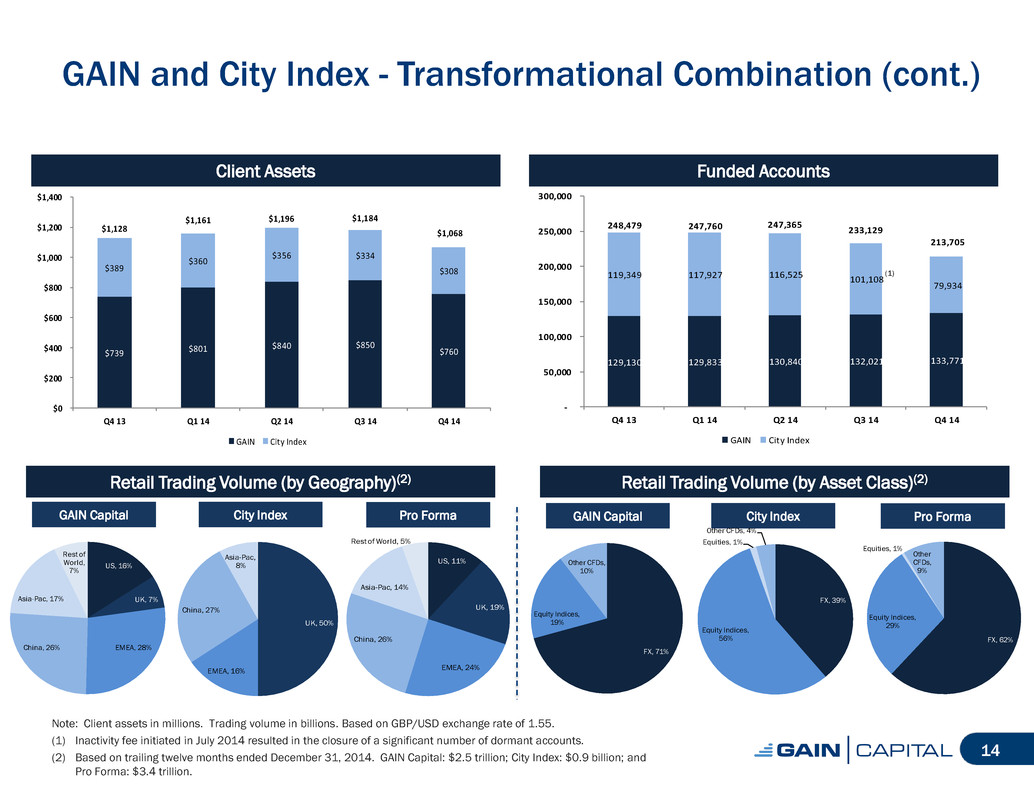
Note: Client assets in millions. Trading volume in billions. Based on GBP/USD exchange rate of 1.55. (1) Inactivity fee initiated in July 2014 resulted in the closure of a significant number of dormant accounts. (2) Based on trailing twelve months ended December 31, 2014. GAIN Capital: $2.5 trillion; City Index: $0.9 billion; and Pro Forma: $3.4 trillion. 14 Client Assets Funded Accounts Retail Trading Volume (by Geography)(2) GAIN Capital City Index Pro Forma Retail Trading Volume (by Asset Class)(2) GAIN Capital City Index Pro Forma $739 $801 $840 $850 $760 $389 $360 $356 $334 $308 $1,128 $1,161 $1,196 $1,184 $1,068 $0 $200 $400 $600 $800 $1,000 $1,200 $1,400 Q4 13 Q1 14 Q2 14 Q3 14 Q4 14 GAIN City Index 129,130 129,833 130,840 132,021 133,771 119,349 117,927 116,525 101,108 79,934 248,479 247,760 247,365 233,129 213,705 - 50,000 100,000 150,000 200,000 250,000 300,000 Q4 13 Q1 14 Q2 14 Q3 14 Q4 14 GAIN City Index US, 16% UK, 7% EMEA, 28%Chin , 26% Asia-Pac, 17% Rest of World, 7% UK, 50% EMEA, 16% China, 27% Asia-Pac, 8% US, 11% UK, 19% EMEA, 24% China, 26% Asia-Pac, 14% Rest of World, 5% FX, 71% Equity Indices, 19% Other CFDs, 10% FX, 39% Equity Indices, 56% Equities, 1% Other CFDs, 4% FX, 62% Equity Indices, 29% Equities, 1% Other CFDs, 9% GAIN and City Index - Transformational Combination (cont.) (1)
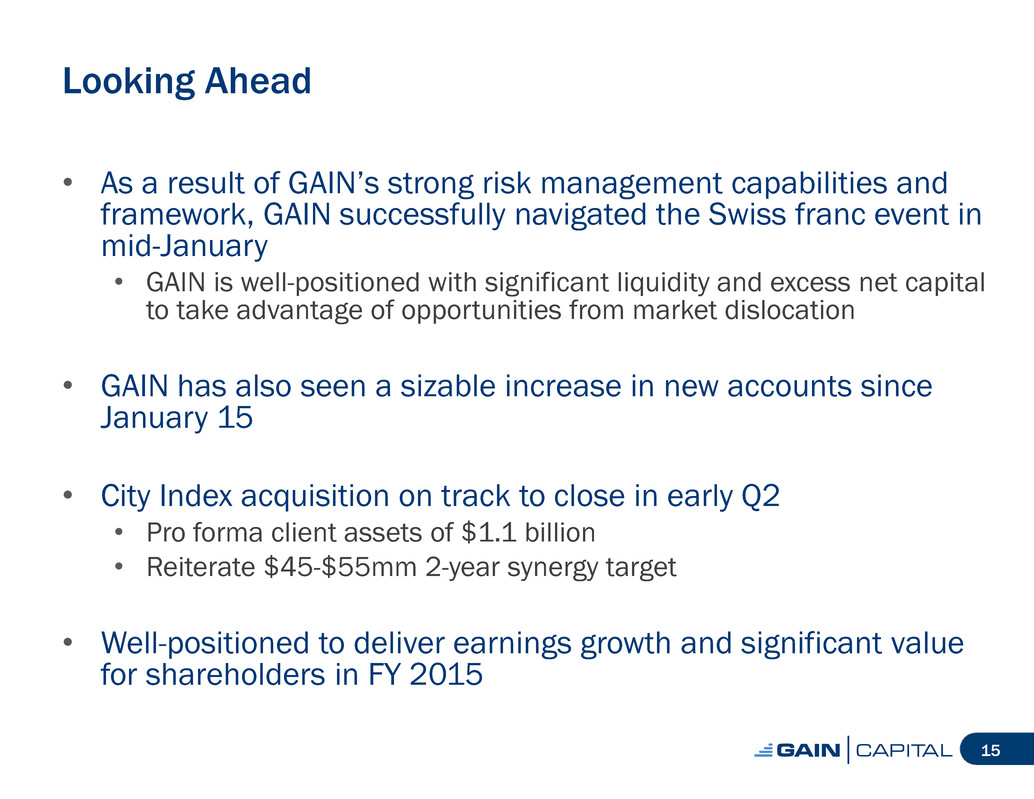
15 Looking Ahead • As a result of GAIN’s strong risk management capabilities and framework, GAIN successfully navigated the Swiss franc event in mid-January • GAIN is well-positioned with significant liquidity and excess net capital to take advantage of opportunities from market dislocation • GAIN has also seen a sizable increase in new accounts since January 15 • City Index acquisition on track to close in early Q2 • Pro forma client assets of $1.1 billion • Reiterate $45-$55mm 2-year synergy target • Well-positioned to deliver earnings growth and significant value for shareholders in FY 2015
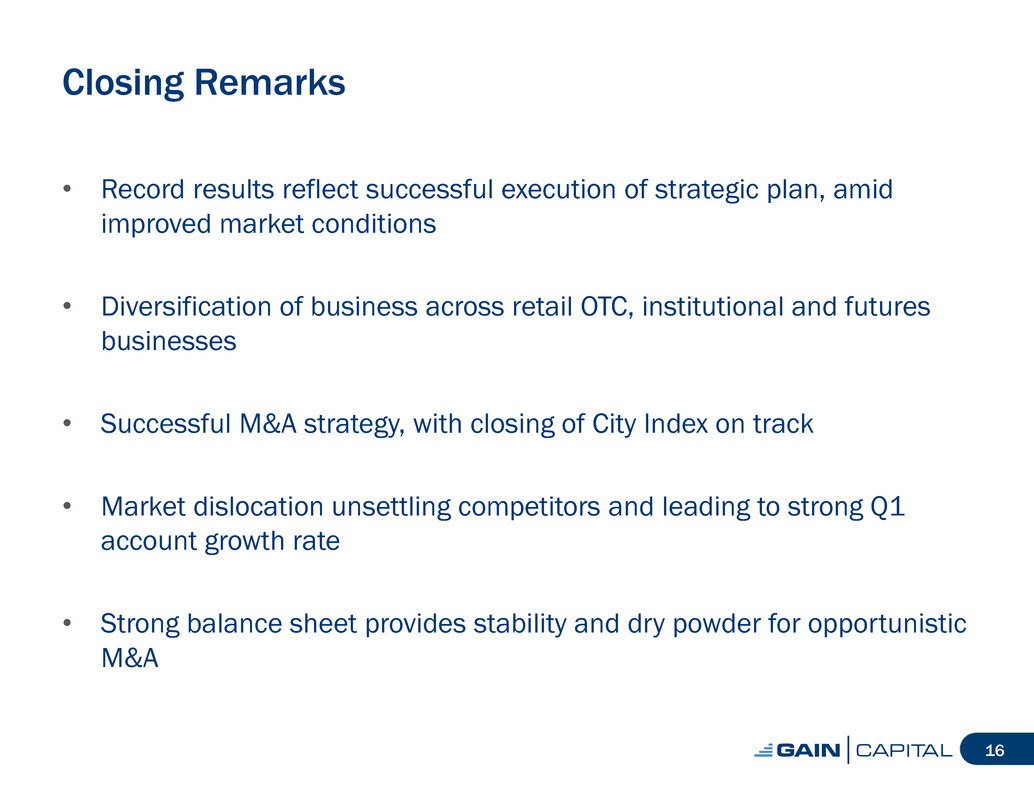
Closing Remarks • Record results reflect successful execution of strategic plan, amid improved market conditions • Diversification of business across retail OTC, institutional and futures businesses • Successful M&A strategy, with closing of City Index on track • Market dislocation unsettling competitors and leading to strong Q1 account growth rate • Strong balance sheet provides stability and dry powder for opportunistic M&A 16
17 Appendix
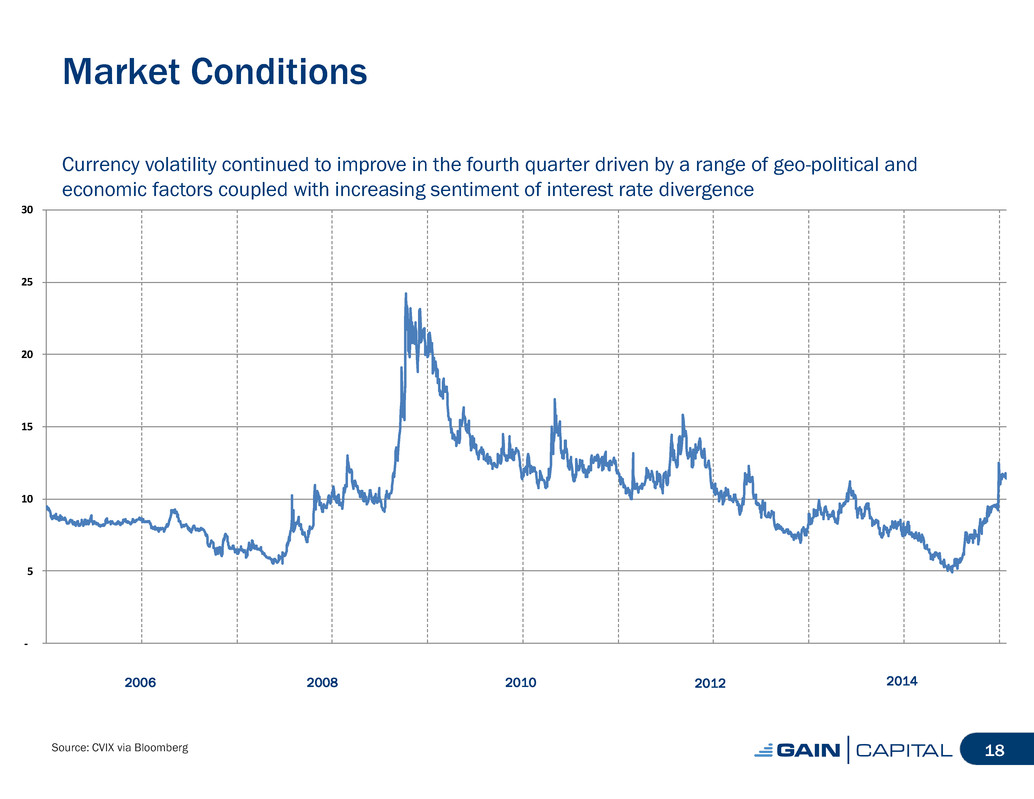
Market Conditions Currency volatility continued to improve in the fourth quarter driven by a range of geo-political and economic factors coupled with increasing sentiment of interest rate divergence Source: CVIX via Bloomberg 18 2006 2010 2012 - 5 10 15 20 25 30 2008 2014
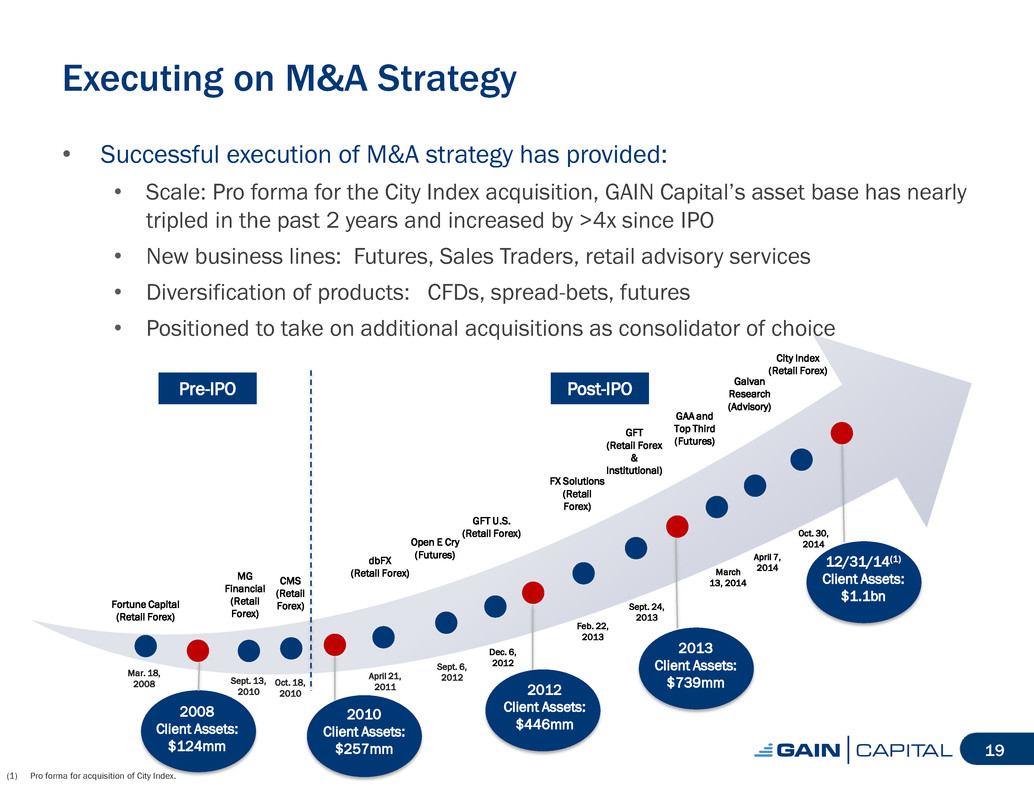
Executing on M&A Strategy 19 • Successful execution of M&A strategy has provided: • Scale: Pro forma for the City Index acquisition, GAIN Capital’s asset base has nearly tripled in the past 2 years and increased by >4x since IPO • New business lines: Futures, Sales Traders, retail advisory services • Diversification of products: CFDs, spread-bets, futures • Positioned to take on additional acquisitions as consolidator of choice 2008 Client Assets: $124mm 2010 Client Assets: $257mm 2012 Client Assets: $446mm 12/31/14(1) Client Assets: $1.1bn 2013 Client Assets: $739mm Fortune Capital (Retail Forex) MG Financial (Retail Forex) CMS (Retail Forex) dbFX (Retail Forex) Open E Cry (Futures) GFT U.S. (Retail Forex) FX Solutions (Retail Forex) GFT (Retail Forex & Institutional) GAA and Top Third (Futures) Galvan Research (Advisory) City Index (Retail Forex) Post-IPO Pre-IPO Mar. 18, 2008 Sept. 13, 2010 Oct. 18, 2010 Feb. 22, 2013 Dec. 6, 2012 Sept. 6, 2012 April 21, 2011 Sept. 24, 2013 March 13, 2014 April 7, 2014 Oct. 30, 2014 (1) Pro forma for acquisition of City Index.
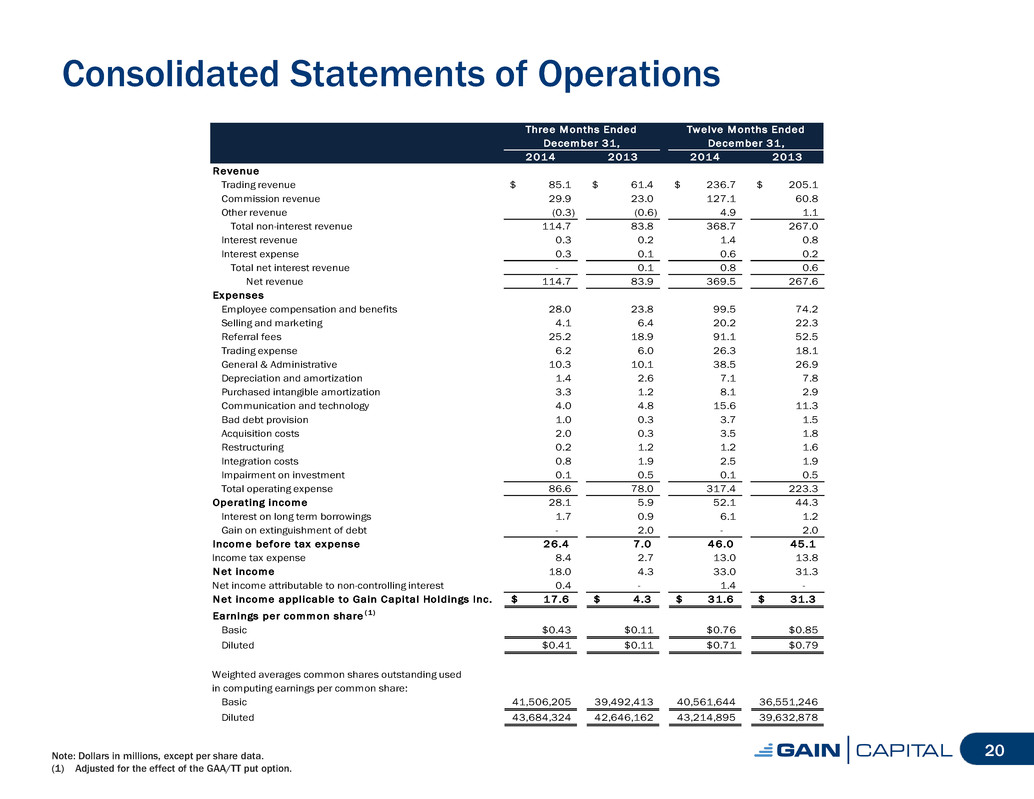
Consolidated Statements of Operations 20 Three Months Ended Twelve Months Ended December 31, December 31, 2014 2013 2014 2013 Revenue Trading revenue 85.1$ 61.4$ 236.7$ 205.1$ Commission revenue 29.9 23.0 127.1 60.8 Other revenue (0.3) (0.6) 4.9 1.1 Total non-interest revenue 114.7 83.8 368.7 267.0 Interest revenue 0.3 0.2 1.4 0.8 Interest expense 0.3 0.1 0.6 0.2 Total net interest revenue - 0.1 0.8 0.6 Net revenue 114.7 83.9 369.5 267.6 Expenses Employee compensation and benefits 28.0 23.8 99.5 74.2 Selling and marketing 4.1 6.4 20.2 22.3 Referral fees 25.2 18.9 91.1 52.5 Trading expense 6.2 6.0 26.3 18.1 General & Administrative 10.3 10.1 38.5 26.9 Depreciation and amortization 1.4 2.6 7.1 7.8 Purchased intangible amortization 3.3 1.2 8.1 2.9 Communication and technology 4.0 4.8 15.6 11.3 Bad debt provision 1.0 0.3 3.7 1.5 Acquisition costs 2.0 0.3 3.5 1.8 Restructuring 0.2 1.2 1.2 1.6 Integration costs 0.8 1.9 2.5 1.9 Impairment on investment 0.1 0.5 0.1 0.5 Total operating expense 86.6 78.0 317.4 223.3 Operating income 28.1 5.9 52.1 44.3 Interest on long term borrowings 1.7 0.9 6.1 1.2 Gain on extinguishment of debt - 2.0 - 2.0 Income before tax expense 26.4 7 .0 46.0 45.1 Income tax expense 8.4 2.7 13.0 13.8 Net income 18.0 4.3 33.0 31.3 Net income attributable to non-controlling interest 0.4 - 1.4 - Net income applicable to Gain Capital Holdings Inc. 17.6$ 4 .3$ 31.6$ 31.3$ Earnings per common share ( 1) Basic $0.43 $0.11 $0.76 $0.85 Diluted $0.41 $0.11 $0.71 $0.79 Weighted averages common shares outstanding used in computing earnings per common share: Basic 41,506,205 39,492,413 40,561,644 36,551,246 Diluted 43,684,324 42,646,162 43,214,895 39,632,878 Note: Dollars in millions, except per share data. (1) Adjusted for the effect of the GAA/TT put option.
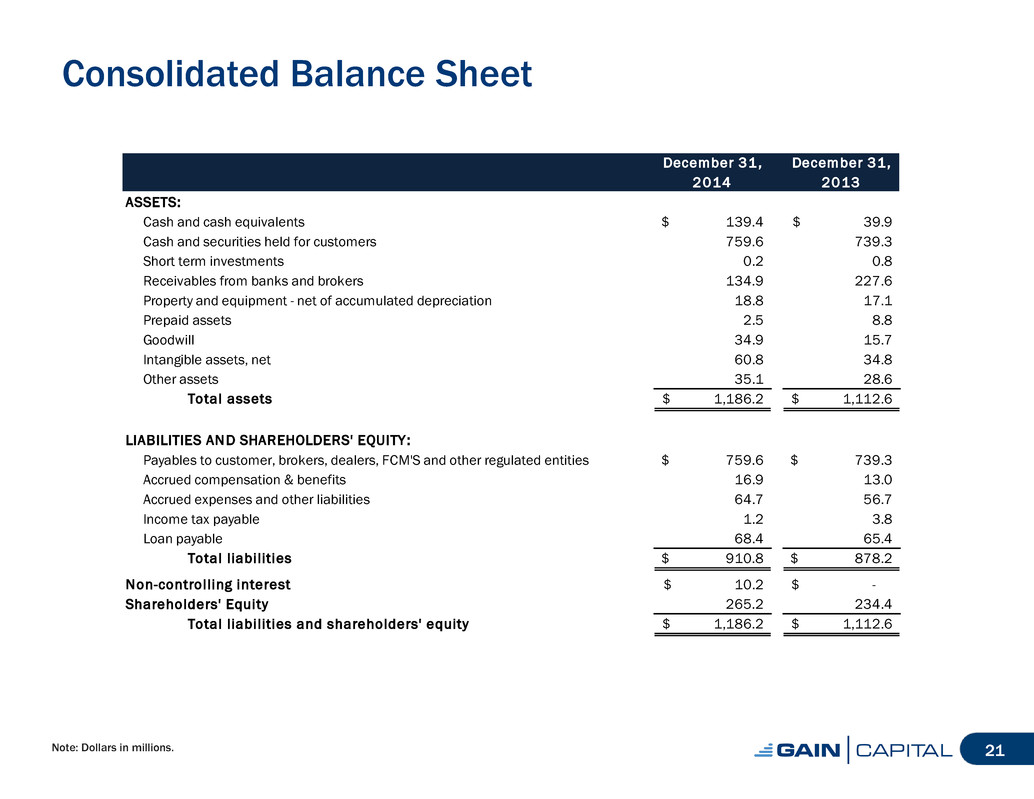
Consolidated Balance Sheet Note: Dollars in millions. 21 December 31, December 31, 2014 2013 ASSETS: Cash and cash equivalents 139.4$ 39.9$ Cash and securities held for customers 759.6 739.3 Short term investments 0.2 0.8 Receivables from banks and brokers 134.9 227.6 Property and equipment - net of accumulated depreciation 18.8 17.1 Prepaid assets 2.5 8.8 Goodwill 34.9 15.7 Intangible assets, net 60.8 34.8 Other assets 35.1 28.6 Total assets 1,186.2$ 1,112.6$ LIABILITIES AND SHAREHOLDERS' EQUITY: Payables to customer, brokers, dealers, FCM'S and other regulated entities 759.6$ 739.3$ Accrued compensation & benefits 16.9 13.0 Accrued expenses and other liabilities 64.7 56.7 Income tax payable 1.2 3.8 Loan payable 68.4 65.4 Total l iabilities 910.8$ 878.2$ Non-controlling interest 10.2$ -$ Shareholders' Equity 265.2 234.4 Total l iabilities and shareholders' equity 1,186.2$ 1,112.6$
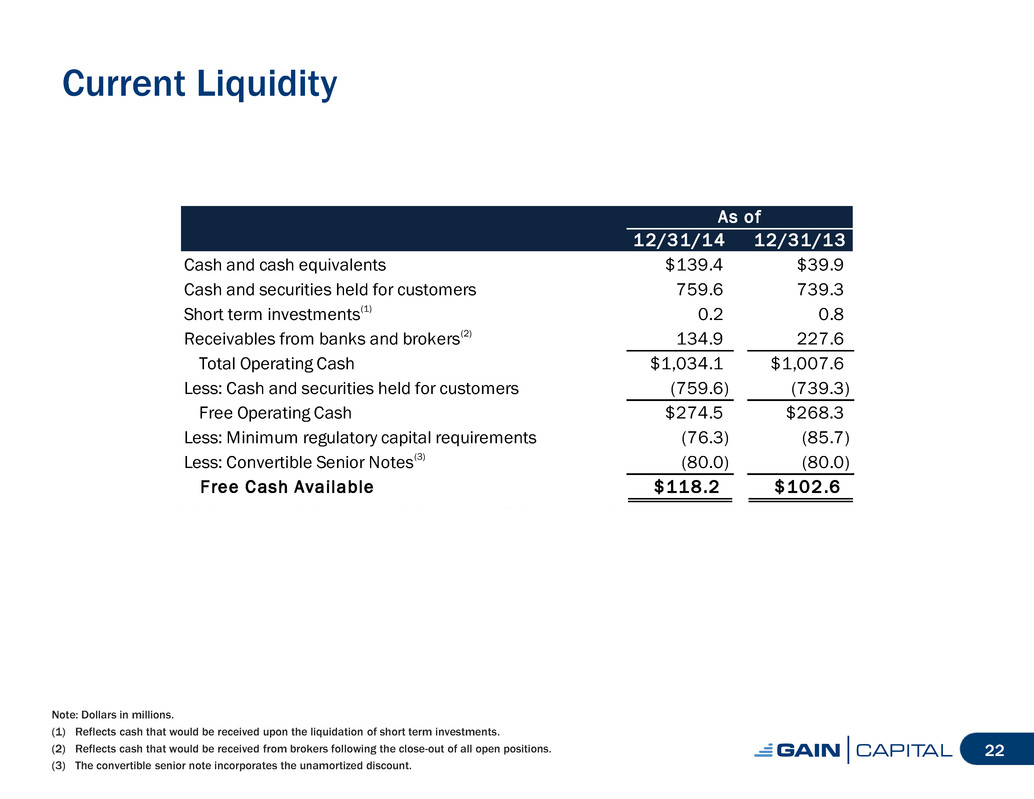
Current Liquidity Note: Dollars in millions. (1) Reflects cash that would be received upon the liquidation of short term investments. (2) Reflects cash that would be received from brokers following the close-out of all open positions. (3) The convertible senior note incorporates the unamortized discount. 22 As of 12/31/14 12/31/13 Cash and cash equivalents $139.4 $39.9 Cash and securities held for customers 759.6 739.3 Short term investments(1) 0.2 0.8 Receivables from banks and brokers(2) 134.9 227.6 Total Operating Cash $1,034.1 $1,007.6 Less: Cash and securities held for customers (759.6) (739.3) Free Operating Cash $274.5 $268.3 Less: Minimum regulatory capital requirements (76.3) (85.7) Less: Convertible Senior Notes(3) (80.0) (80.0) Free Cash Available $118.2 $102.6
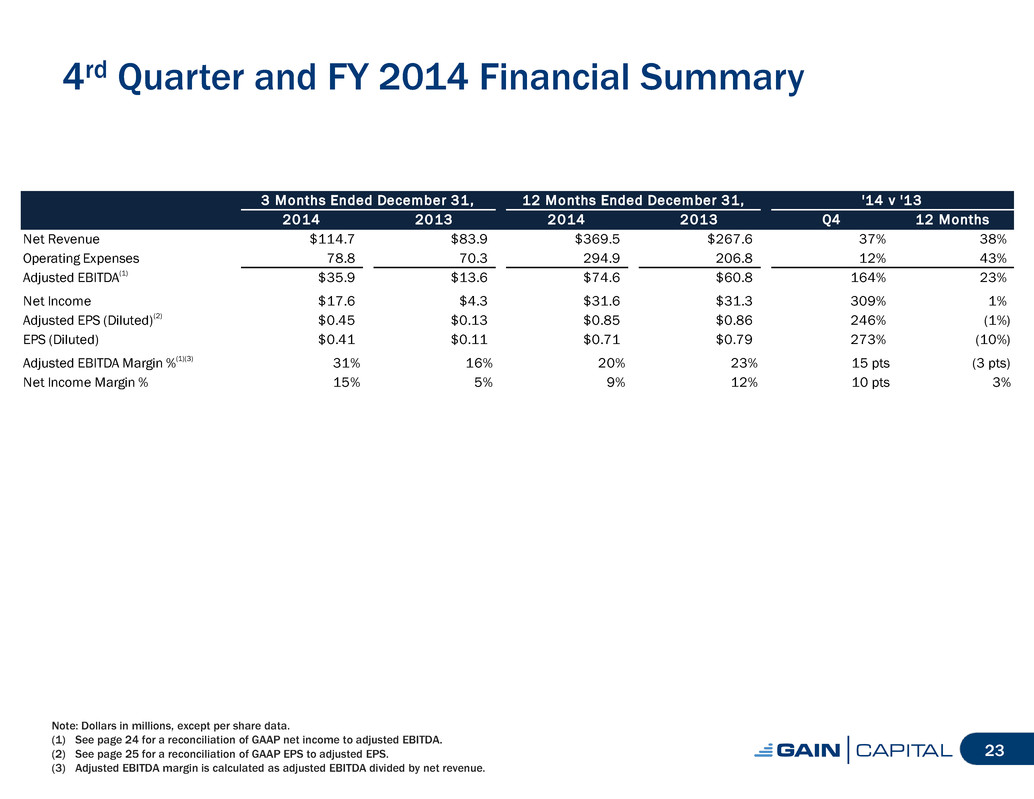
4rd Quarter and FY 2014 Financial Summary Note: Dollars in millions, except per share data. (1) See page 24 for a reconciliation of GAAP net income to adjusted EBITDA. (2) See page 25 for a reconciliation of GAAP EPS to adjusted EPS. (3) Adjusted EBITDA margin is calculated as adjusted EBITDA divided by net revenue. 23 3 Months Ended December 31, 12 Months Ended December 31, '14 v '13 2014 2013 2014 2013 Q4 12 Months Net Revenue $114.7 $83.9 $369.5 $267.6 37% 38% Operating Expenses 78.8 70.3 294.9 206.8 12% 43% Adjusted EBITDA(1) $35.9 $13.6 $74.6 $60.8 164% 23% Net Income $17.6 $4.3 $31.6 $31.3 309% 1% Adjusted EPS (Diluted)(2) $0.45 $0.13 $0.85 $0.86 246% (1%) EPS (Diluted) $0.41 $0.11 $0.71 $0.79 273% (10%) Adjusted EBITDA Margin %(1)(3) 31% 16% 20% 23% 15 pts (3 pts) Net Income Margin % 15% 5% 9% 12% 10 pts 3%
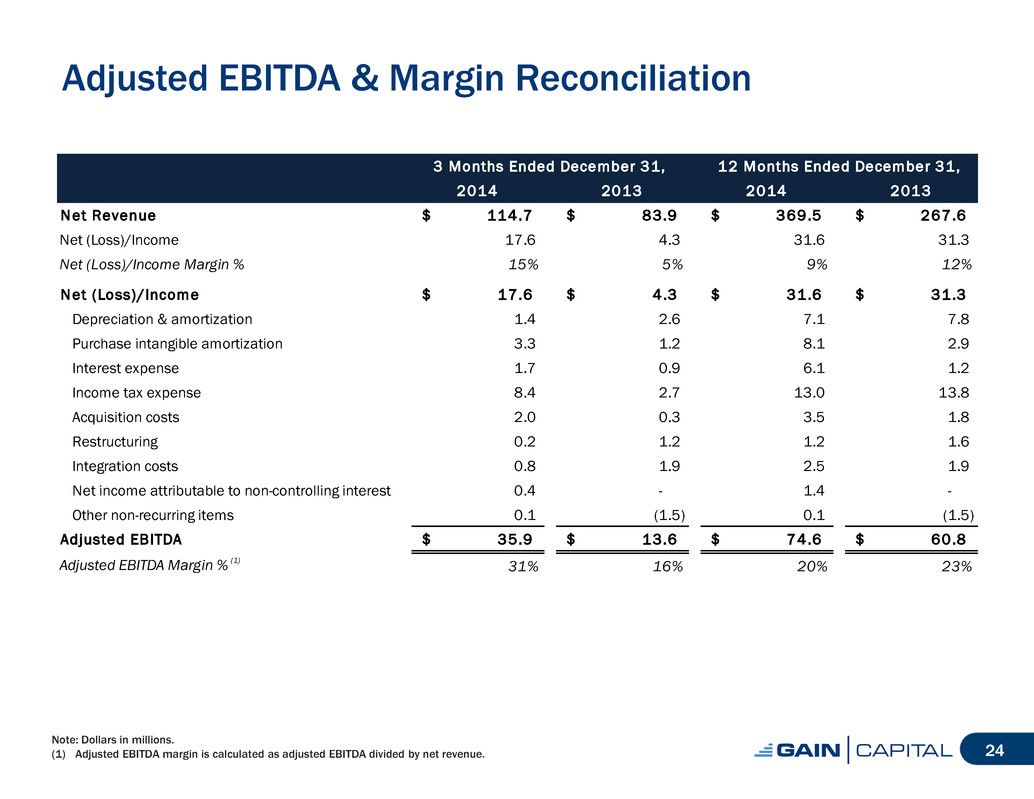
Adjusted EBITDA & Margin Reconciliation Note: Dollars in millions. (1) Adjusted EBITDA margin is calculated as adjusted EBITDA divided by net revenue. 24 3 Months Ended December 31, 12 Months Ended December 31, 2014 2013 2014 2013 Net Revenue 114.7$ 83.9$ 369.5$ 267.6$ Net (Loss)/Income 17.6 4.3 31.6 31.3 Net (Loss)/Income Margin % 15% 5% 9% 12% Net (Loss)/Income 17.6$ 4 .3$ 31.6$ 31.3$ Depreciation & amortization 1.4 2.6 7.1 7.8 Purchase intangible amortization 3.3 1.2 8.1 2.9 Interest expense 1.7 0.9 6.1 1.2 Income tax expense 8.4 2.7 13.0 13.8 Acquisition costs 2.0 0.3 3.5 1.8 Restructuring 0.2 1.2 1.2 1.6 Integration costs 0.8 1.9 2.5 1.9 Net income attributable to non-controlling interest 0.4 - 1.4 - Other non-recurring items 0.1 (1.5) 0.1 (1.5) Adjusted EBITDA 35.9$ 13.6$ 74.6$ 60.8$ Adjusted EBITDA Margin % (1) 31% 16% 20% 23%
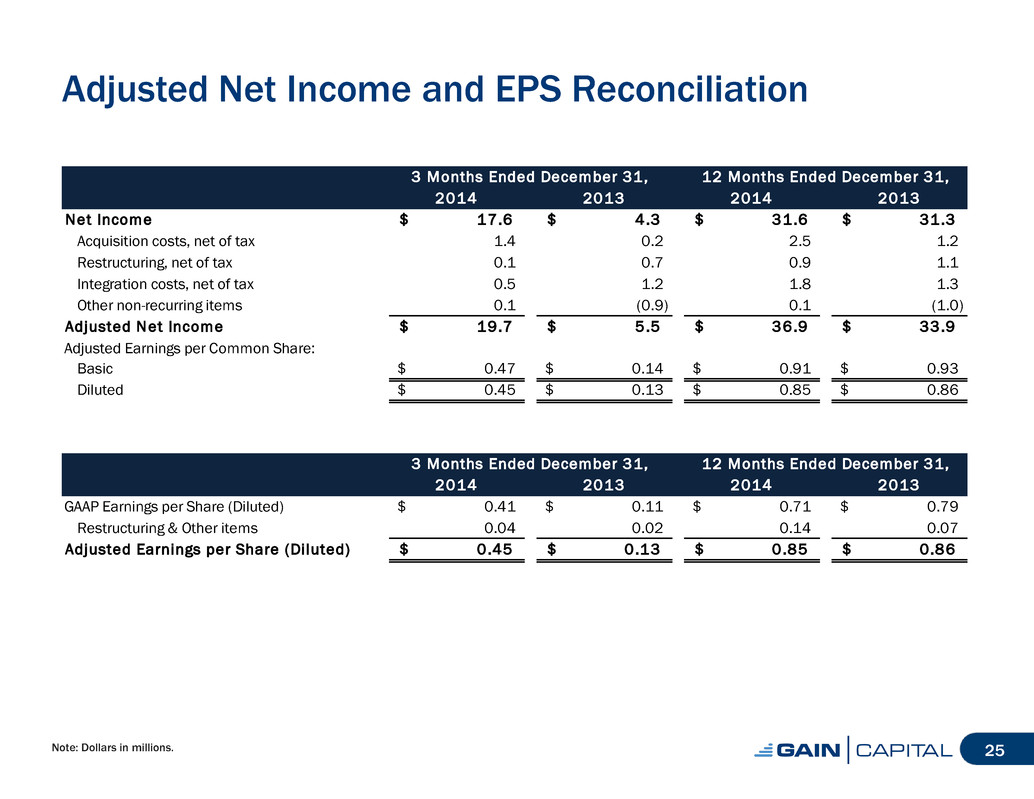
Adjusted Net Income and EPS Reconciliation Note: Dollars in millions. 25 3 Months Ended December 31, 12 Months Ended December 31, 2014 2013 2014 2013 Net Income 17.6$ 4 .3$ 31.6$ 31.3$ Acquisition costs, net of tax 1.4 0.2 2.5 1.2 Restructuring, net of tax 0.1 0.7 0.9 1.1 Integration costs, net of tax 0.5 1.2 1.8 1.3 Other non-recurring items 0.1 (0.9) 0.1 (1.0) Adjusted Net Income 19.7$ 5 .5$ 36.9$ 33.9$ Adjusted Earnings per Common Share: Basic 0.47$ 0.14$ 0.91$ 0.93$ Diluted 0.45$ 0.13$ 0.85$ 0.86$ 3 Months Ended December 31, 12 Months Ended December 31, 2014 2013 2014 2013 GAAP Earnings per Share (Diluted) 0.41$ 0.11$ 0.71$ 0.79$ Restructuring & Ot er items .04 .02 .14 .07 Adjusted Earnings per Share (Diluted) 0.45$ 0.13$ 0.85$ 0.86$
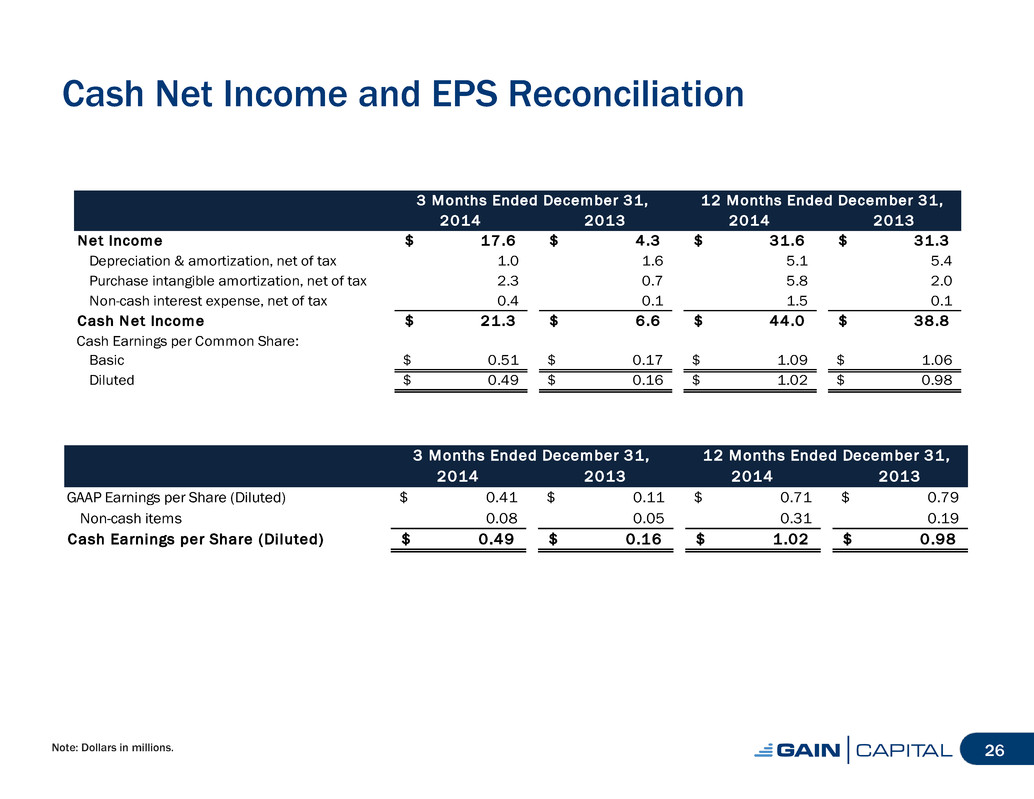
Cash Net Income and EPS Reconciliation Note: Dollars in millions. 26 3 Months Ended December 31, 12 Months Ended December 31, 2014 2013 2014 2013 Net Income 17.6$ 4 .3$ 31.6$ 31.3$ Depreciation & amortization, net of tax 1.0 1.6 5.1 5.4 Purchase intangible amortization, net of tax 2.3 0.7 5.8 2.0 Non-cash interest expense, net of tax 0.4 0.1 1.5 0.1 Cash Net Income 21.3$ 6 .6$ 44.0$ 38.8$ Cash Earnings per Common Share: Basic 0.51$ 0.17$ 1.09$ 1.06$ Diluted 0.49$ 0.16$ 1.02$ 0.98$ 3 Months Ended December 31, 12 Months Ended December 31, 2014 2013 2014 2013 GAAP Earnings per Share (Diluted) 0.41$ 0.11$ 0.71$ 0.79$ Non-cash items .08 .05 .3 .1 Cash E rnings per Share (Diluted) 0.49$ 0.16$ 1.02$ 0.98$
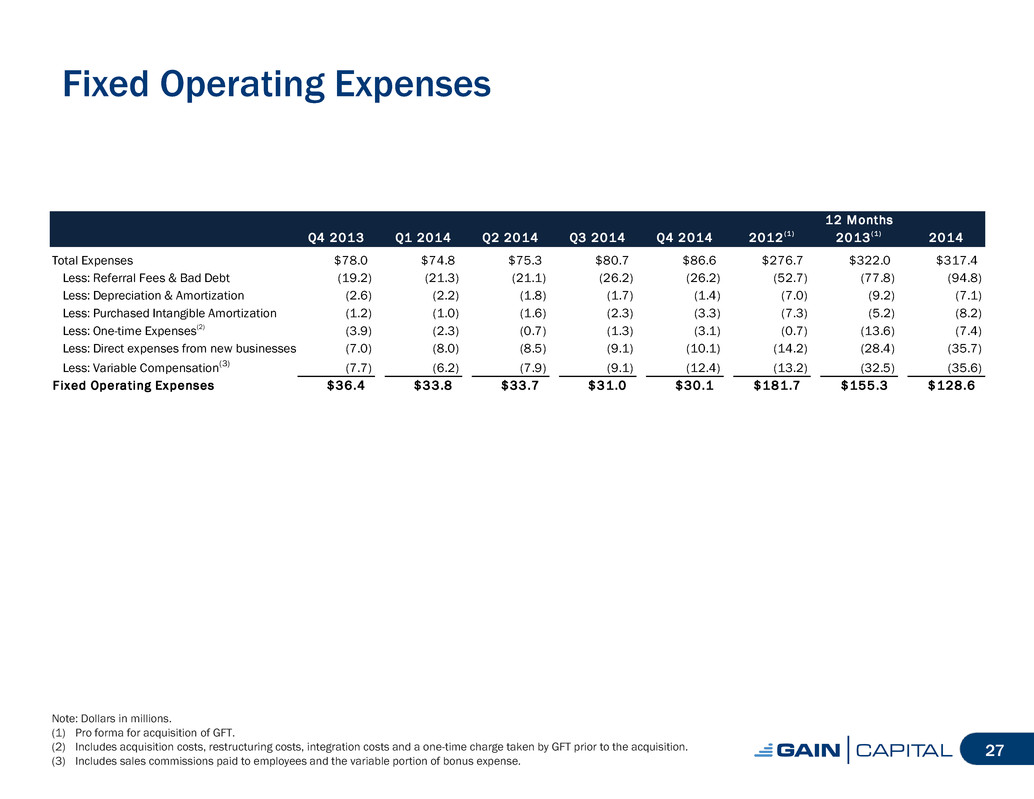
Fixed Operating Expenses Note: Dollars in millions. (1) Pro forma for acquisition of GFT. (2) Includes acquisition costs, restructuring costs, integration costs and a one-time charge taken by GFT prior to the acquisition. (3) Includes sales commissions paid to employees and the variable portion of bonus expense. 27 Q4 2013 Q1 2014 Q2 2014 Q3 2014 Q4 2014 2012 ( 1 ) 2013 ( 1 ) 2014 Total Expenses $78.0 $74.8 $75.3 $80.7 $86.6 $276.7 $322.0 $317.4 Less: Referral Fees & Bad Debt (19.2) (21.3) (21.1) (26.2) (26.2) (52.7) (77.8) (94.8) Less: Depreciation & Amortization (2.6) (2.2) (1.8) (1.7) (1.4) (7.0) (9.2) (7.1) Less: Purchased Intangible Amortization (1.2) (1.0) (1.6) (2.3) (3.3) (7.3) (5.2) (8.2) Less: One-time Expenses(2) (3.9) (2.3) (0.7) (1.3) (3.1) (0.7) (13.6) (7.4) Less: Direct expenses from new businesses (7.0) (8.0) (8.5) (9.1) (10.1) (14.2) (28.4) (35.7) Less: Variable Compensation(3) (7.7) (6.2) (7.9) (9.1) (12.4) (13.2) (32.5) (35.6) F ixed Operating Expenses $36.4 $33.8 $33.7 $31.0 $30.1 $181.7 $155.3 $128.6 12 Months
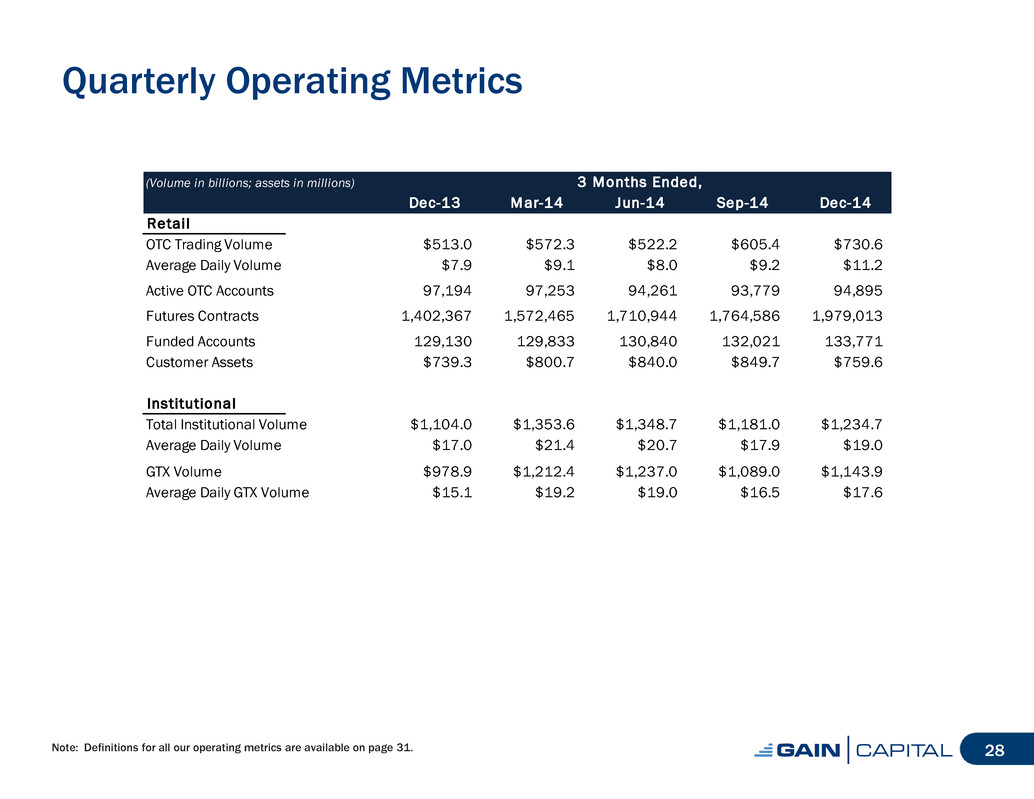
Quarterly Operating Metrics Note: Definitions for all our operating metrics are available on page 31. 28 (Volume in billions; assets in millions) Dec-13 Mar-14 Jun-14 Sep-14 Dec-14 Retail OTC Trading Volume $513.0 $572.3 $522.2 $605.4 $730.6 Average Daily Volume $7.9 $9.1 $8.0 $9.2 $11.2 Active OTC Accounts 97,194 97,253 94,261 93,779 94,895 Futures Contracts 1,402,367 1,572,465 1,710,944 1,764,586 1,979,013 Funded Accounts 129,130 129,833 130,840 132,021 133,771 Customer Assets $739.3 $800.7 $840.0 $849.7 $759.6 Institutional Total Institutional Volume $1,104.0 $1,353.6 $1,348.7 $1,181.0 $1,234.7 Average Daily Volume $17.0 $21.4 $20.7 $17.9 $19.0 GTX Volume $978.9 $1,212.4 $1,237.0 $1,089.0 $1,143.9 Average Daily GTX Volume $15.1 $19.2 $19.0 $16.5 $17.6 3 Months Ended,
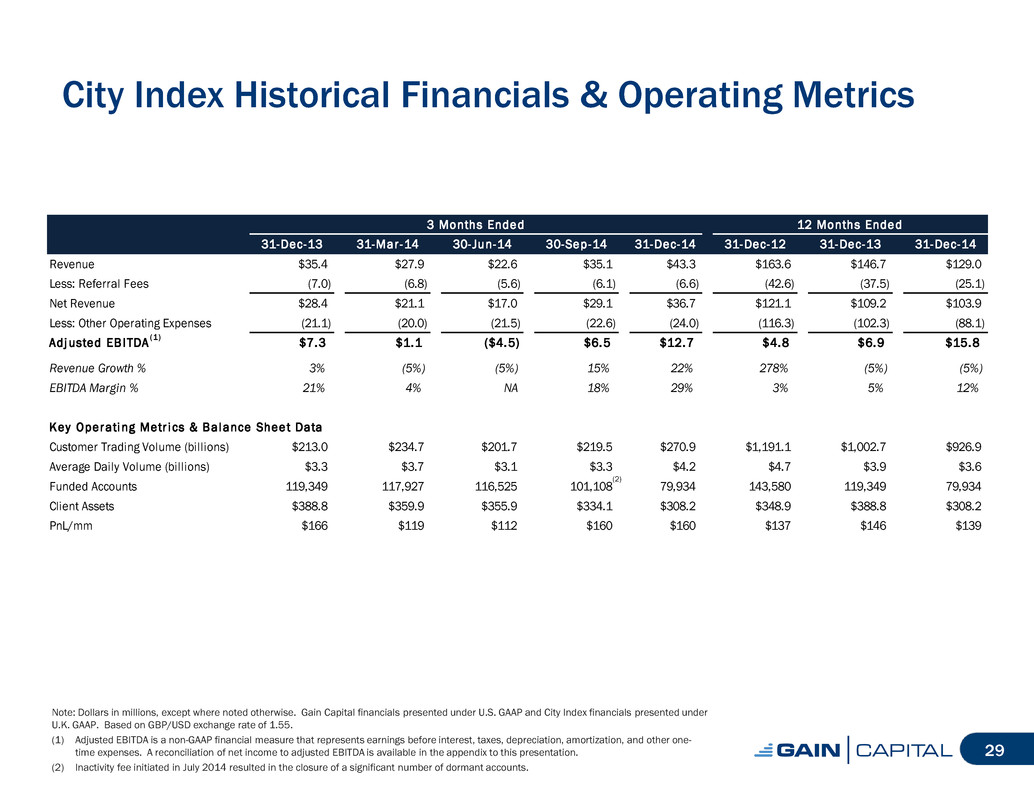
City Index Historical Financials & Operating Metrics Note: Dollars in millions, except where noted otherwise. Gain Capital financials presented under U.S. GAAP and City Index financials presented under U.K. GAAP. Based on GBP/USD exchange rate of 1.55. (1) Adjusted EBITDA is a non-GAAP financial measure that represents earnings before interest, taxes, depreciation, amortization, and other one- time expenses. A reconciliation of net income to adjusted EBITDA is available in the appendix to this presentation. (2) Inactivity fee initiated in July 2014 resulted in the closure of a significant number of dormant accounts. 29 3 Months Ended 12 Months Ended 31-Dec-13 31-Mar -14 30-Jun-14 30-Sep-14 31-Dec-14 31-Dec-12 31-Dec-13 31-Dec-14 Revenue $35.4 $27.9 $22.6 $35.1 $43.3 $163.6 $146.7 $129.0 Less: Referral Fees (7.0) (6.8) (5.6) (6.1) (6.6) (42.6) (37.5) (25.1) Net Revenue $28.4 $21.1 $17.0 $29.1 $36.7 $121.1 $109.2 $103.9 Less: Other Operating Expenses (21.1) (20.0) (21.5) (22.6) (24.0) (116.3) (102.3) (88.1) Adj usted EB ITDA ( 1 ) $7.3 $1.1 ($4.5) $6.5 $12.7 $4.8 $6.9 $15.8 Revenue Growth % 3% (5%) (5%) 15% 22% 278% (5%) (5%) EBITDA Margin % 21% 4% NA 18% 29% 3% 5% 12% Key Operati ng Metr i cs & Bal ance Sheet Data Customer Trading Volume (billions) $213.0 $234.7 $201.7 $219.5 $270.9 $1,191.1 $1,002.7 $926.9 Average Daily Volume (billions) $3.3 $3.7 $3.1 $3.3 $4.2 $4.7 $3.9 $3.6 Funded Accounts 119,349 117,927 116,525 101,108 79,934 143,580 119,349 79,934 Client Assets $388.8 $359.9 $355.9 $334.1 $308.2 $348.9 $388.8 $308.2 PnL/mm $166 $119 $112 $160 $160 $137 $146 $139 (2)
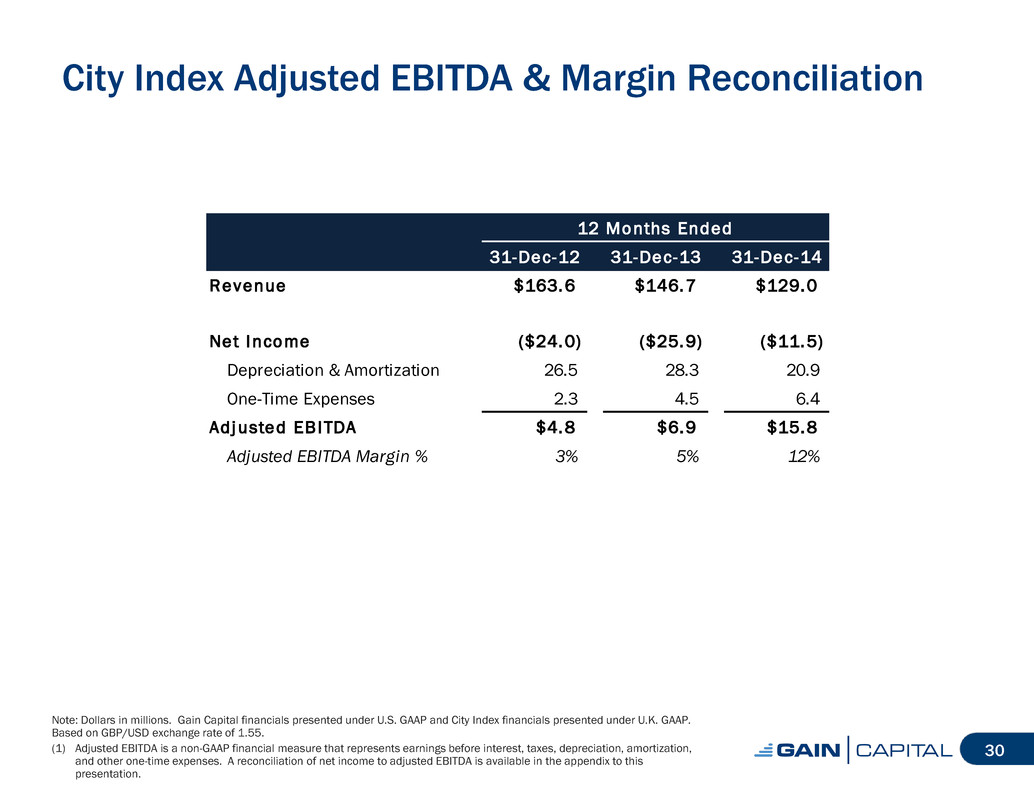
City Index Adjusted EBITDA & Margin Reconciliation 30 12 Months Ended 31-Dec-12 31-Dec-13 31-Dec-14 Revenue $163.6 $146.7 $129.0 Net Income ($24.0) ($25.9) ($11.5) Depreciation & Amortization 26.5 28.3 20.9 One-Time Expenses 2.3 4.5 6.4 Adj usted EB ITDA $4.8 $6.9 $15.8 Adjusted EBITDA Margin % 3% 5% 12% Note: Dollars in millions. Gain Capital financials presented under U.S. GAAP and City Index financials presented under U.K. GAAP. Based on GBP/USD exchange rate of 1.55. (1) Adjusted EBITDA is a non-GAAP financial measure that represents earnings before interest, taxes, depreciation, amortization, and other one-time expenses. A reconciliation of net income to adjusted EBITDA is available in the appendix to this presentation.
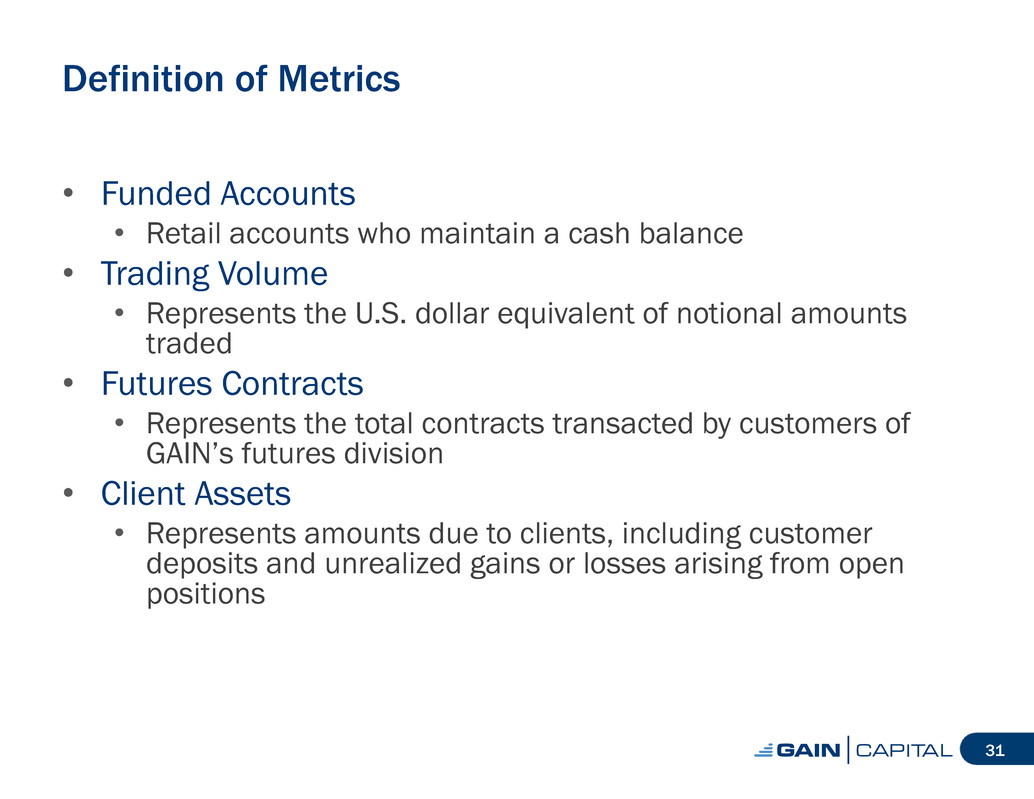
Definition of Metrics • Funded Accounts • Retail accounts who maintain a cash balance • Trading Volume • Represents the U.S. dollar equivalent of notional amounts traded • Futures Contracts • Represents the total contracts transacted by customers of GAIN’s futures division • Client Assets • Represents amounts due to clients, including customer deposits and unrealized gains or losses arising from open positions 31
Fourth Quarter and Full Year Financial and Operating Results February 26, 2015
Serious News for Serious Traders! Try StreetInsider.com Premium Free!
You May Also Be Interested In
- Danny Thomas Celebrity-Am Brings Stars Together to Support St. Jude Children’s Research Hospital
- MissionIRNewsBreaks – Datavault AI Inc. (NASDAQ: DVLT) to Acquire CyberCatch for $94.5 Million in All-Cash Transaction
- Moog Celebrates 75 Years of Innovation with New Advanced Integrated Manufacturing Facility, Workforce Investment and STEM Scholarship Initiative
Create E-mail Alert Related Categories
SEC FilingsSign up for StreetInsider Free!
Receive full access to all new and archived articles, unlimited portfolio tracking, e-mail alerts, custom newswires and RSS feeds - and more!
