



Form 8-K Franklin Financial Netwo For: Oct 28
 Tweet
Tweet Share
Share E-mail
UNITED STATES
SECURITIES AND EXCHANGE COMMISSION
Washington, D.C. 20549
FORM 8-K
CURRENT REPORT
Pursuant to Section 13 or 15(d) of the Securities Exchange Act of 1934
Date of Report (Date of earliest event reported): October 28, 2015
FRANKLIN FINANCIAL NETWORK, INC.
(Exact name of registrant as specified in charter)
| Tennessee | 001-36895 | 20-8839445 | ||
| (State or other jurisdiction of incorporation) |
(Commission File Number) |
(IRS Employer Identification No.) |
722 Columbia Avenue, Franklin, Tennessee 37064
(Address of Principal Executive Offices)
615-236-2265
(Registrant’s Telephone Number, Including Area Code)
(Former Name or Former Address, If Changed Since Last Report)
Check the appropriate box below if the Form 8-K filing is intended to simultaneously satisfy the filing obligation of the registrant under any of the following provisions:
| ¨ | Written communications pursuant to Rule 425 under the Securities Act (17 CFR 230.425) |
| ¨ | Soliciting material pursuant to Rule 14a-12 under the Exchange Act (17 CFR 240.14a-12) |
| ¨ | Pre-commencement communications pursuant to Rule 14d-2(b) under the Exchange Act (17 CFR 240.14d-2(b)) |
| ¨ | Pre-commencement communications pursuant to Rule 13e-4(c) under the Exchange Act (17 CFR 240.13e-4(c)) |
| Item 7.01. | Regulation FD Disclosure. |
On October 28, 2015, Franklin Financial Network, Inc. (the “Company”) will make a presentation to its investors concerning the Company’s consolidated financial results for the third quarter of 2015 (the “Presentation”). A copy of the Presentation is attached hereto as Exhibit 99.1 and is incorporated herein by reference.
Pursuant to the rules and regulations of the Securities and Exchange Commission, the information in this Item 7.01 disclosure, including Exhibit 99.1 and the information set forth therein, is deemed to have been furnished and shall not be deemed to be “filed” under the Securities Exchange Act of 1934.
| Item 9.01. | Financial Statements and Exhibits. |
(d) Exhibits.
| Exhibit |
Description | |
| 99.1 | Presentation for Third Quarter Investor Conference Call | |
SIGNATURE
Pursuant to the requirements of the Securities Exchange Act of 1934, the registrant has duly caused this report to be signed on its behalf by the undersigned hereunto duly authorized.
Date: October 28, 2015
| FRANKLIN FINANCIAL NETWORK, INC. | ||
| By: | /s/ Sally P. Kimble | |
| Sally P. Kimble | ||
| Executive Vice President, Chief Financial Officer and Chief Administrative Officer | ||
EXHIBIT INDEX
| Exhibit |
Description | |
| 99.1 | Presentation for Third Quarter Investor Conference Call | |
 Franklin
Financial Network, Inc. (NYSE: FSB)
Third Quarter 2015 Investor Call October 28, 2015 Exhibit 99.1 |
 Forward-Looking Statements
Except for the historical information contained herein, this presentation contains
forward-looking statements within the meaning of Section 27A of the
Securities Act of 1933, as amended, and Section 21E of the Securities
Exchange Act of 1934, as amended. The forward-looking statements include, among
other things, statements regarding intent, belief or expectations of the
Company and can be identified by the use of words such as "may,"
"will," "should," "would," "assume," "outlook,"
"seek," "plan," "believe," "expect," "anticipate," "intend," "estimate," "forecast," and other comparable terms. The Company intends that all such statements be subject to the “safe
harbor” provisions of those Acts. Because forward-looking statements involve
risks and uncertainties, actual results may differ materially from those
expressed or implied. Investors are cautioned not to place undue reliance
on these forward-looking statements and are advised to carefully review the
discussion of forward-looking statements and risk factors in
documents the Company files with the Securities and Exchange Commission. The Company undertakes no obligation to publicly update or revise any forward-looking statements, whether as a
result of new information, future events or otherwise.
2 |
 Franklin
Financial Network Trading Symbol: FSB (NYSE)
Primary Subsidiary: Franklin Synergy Bank
- Bank opened in November 2007 - Located 15 miles south of Nashville - Headquarter county, Williamson, TN, among wealthiest in nation Recent News - September 30, 2015: Surpassed $2 billion total assets milestone - April 27, 2015: FSB added Nashville-based Healthcare Banking team - March 31, 2015: FSB completed IPO, raising $55 million in capital - July 1, 2014: FSB acquired MidSouth Bank in Murfreesboro, Tennessee 3 |
 3Q 2015
Financial Highlights Earnings
- Net income: record earnings for 3Q15 - Earnings per share: increased in 3Q15 - Most profitable quarter in the history of the Company Growth - Continued robust loan growth: 52.8% (3Q 2015 vs. 3Q 2014) Asset Quality - Excellent and continuing to improve 4 |
 5 |
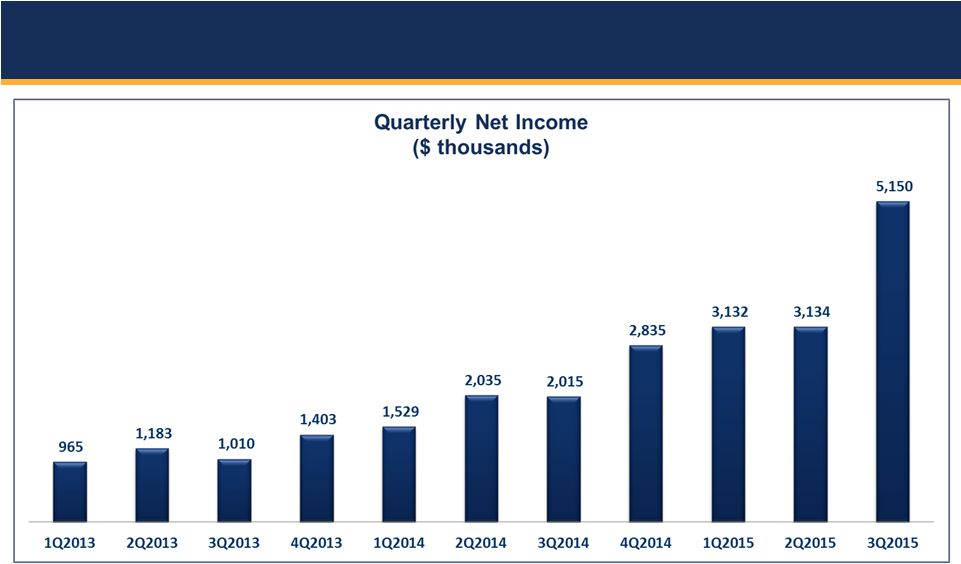 FSB
Earnings 6 |
 FSB Net
Income – Quarterly and Year-to-Date
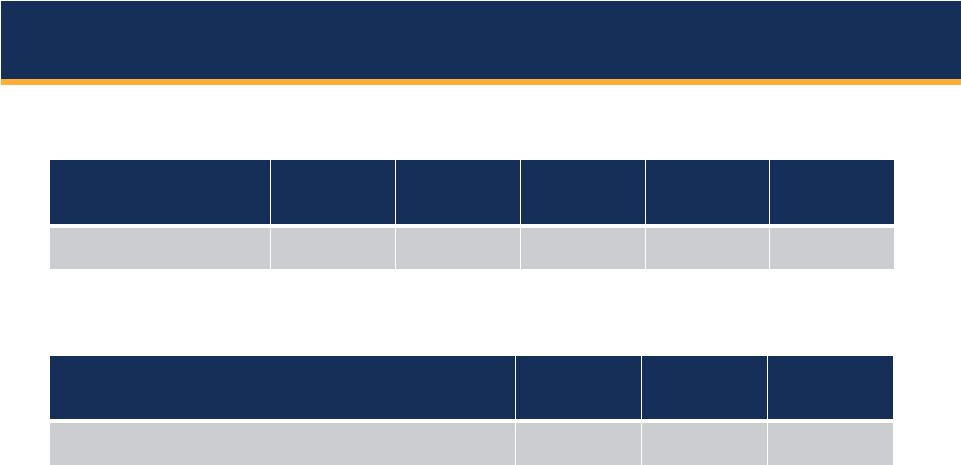
Quarterly 3Q 2015 2Q 2015 % Growth 3Q 2014 % Growth Net Income $5,150 $3,134 64.3% $2,015 155.6% Year-to-Date 3Q 2015 3Q 2014 % Growth Net Income $11,416 $5,579 104.6% 7 |
 FSB
Earnings 8 |
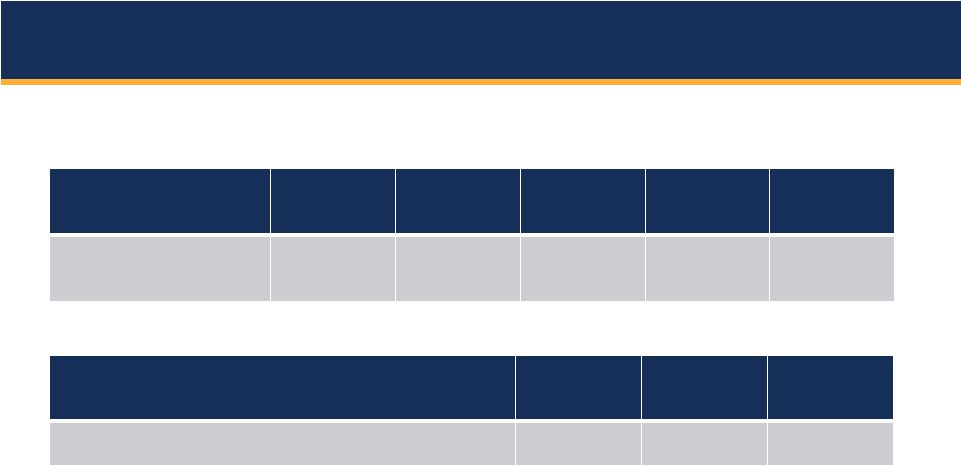 Quarterly 3Q 2015 2Q 2015 % Growth 3Q 2014 % Growth Earnings Per Share $0.49 $0.30 63.3% $0.26 88.5% Year-to-Date 3Q 2015 3Q 2014 % Growth Earnings Per Share $1.17 $0.94 24.5% 9 |
 Items
Significantly Impacting 3Q 2015 Net Income One-time item: full payoff
received on purchased credit-impaired loan relationship ($1.2
million, pre-tax) Continued maturation of bank: interest-adjusted
revenues significantly outpacing growth of operating
expenses Investment in Nashville-based healthcare banking team
rewarding: loan growth of $64.2 million in third quarter
2015 Leverage of new capital completed by purchasing investment securities
during 2Q 2015 and 3Q 2015
10 |
 FSB
Profitability 11 |
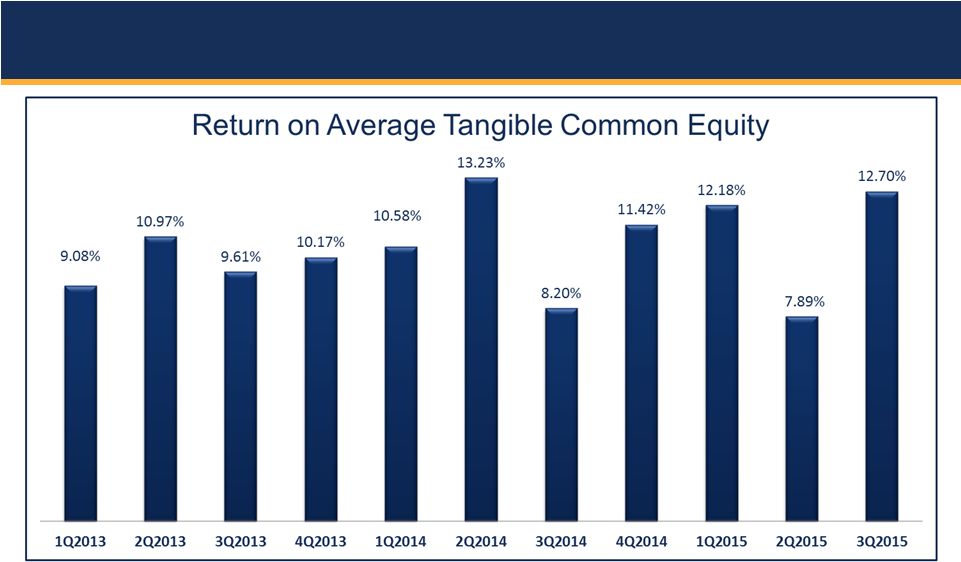 FSB
Profitability 12 |
 FSB
Value 13 |
 14 |
 FSB Loan
Growth 15 |
 Loan
Growth Rates (End of Period Loans) 3Q
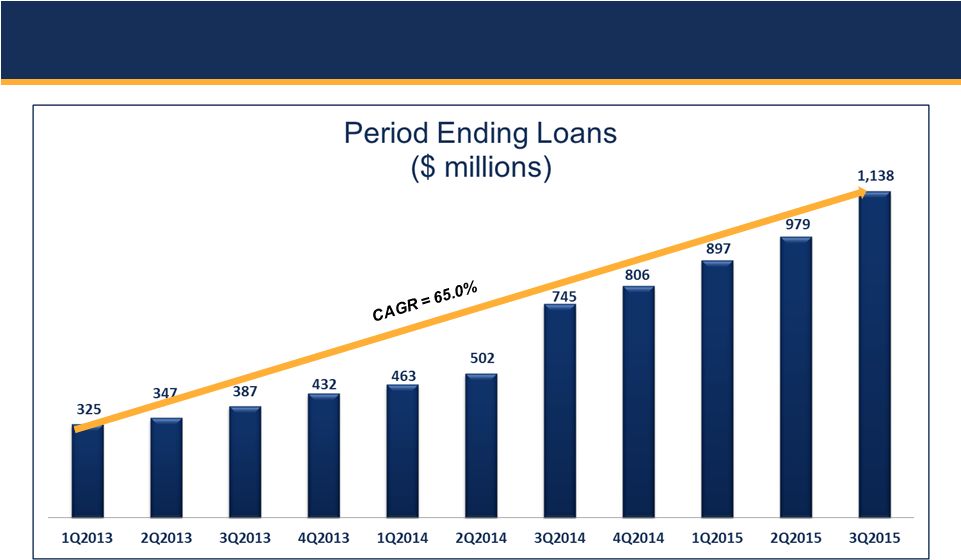
2015 vs. 3Q 2014 $393.6 million, or 52.8%
3Q 2015 vs. 4Q 2014 $332.8 million, or 55.2% (annualized) 3Q 2015 vs. 2Q 2015 $159.5 million, or 64.6% (annualized) 16 |
 Loan
Growth Emphasis All major categories of loans contributing to loan
growth Business loans grew 215.5% (vs. 3Q2014)
Healthcare unit grew $64.2 million during 3Q2015
Real estate loans (excluding loans held for sale) grew 39.7% (vs.
3Q2014) Local residential construction continues strong Investor real estate opportunities continue 17 |
 FSB
Deposit Growth 18 |
 3Q
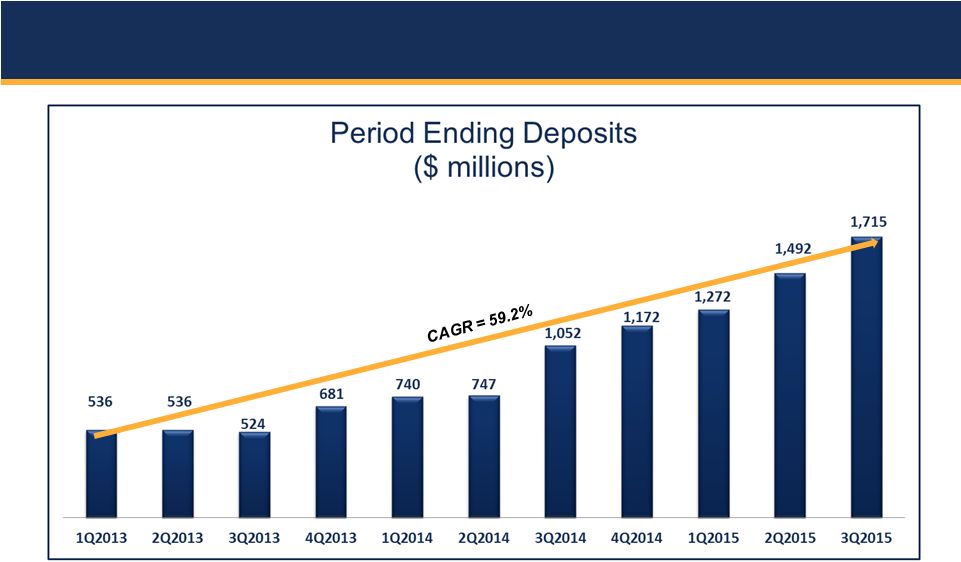
2015 vs. 3Q 2014 $663 million, or 63.1%
3Q 2015 vs. 4Q 2014 $542 million, or 61.9% (annualized) 3Q 2015 vs. 2Q 2015 $223 million, or 59.2% (annualized) 19 |
 FSB
Investment Portfolio Growth 20 |
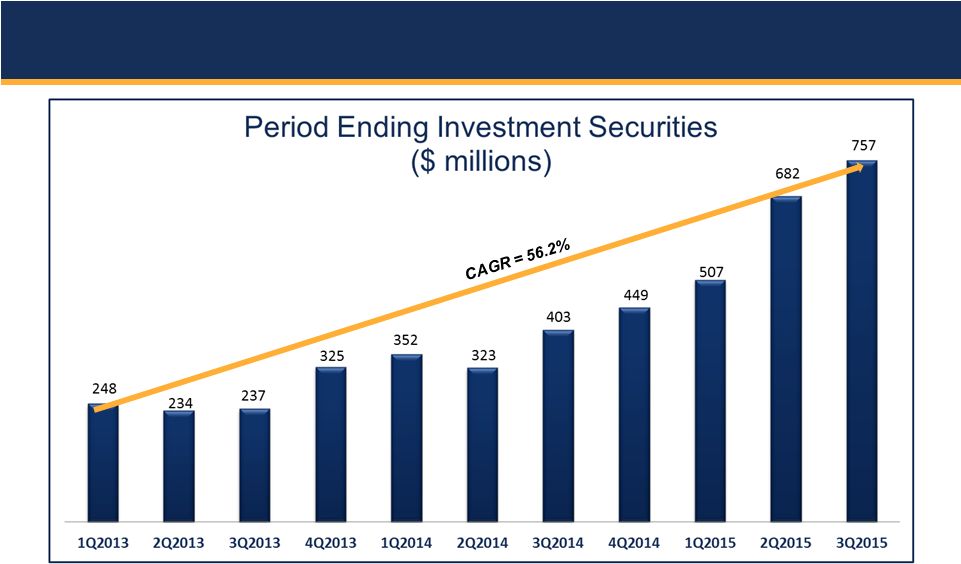
 Investment Portfolio Growth
Elevated growth in 2Q 2015 and 3Q 2015 reflects Bank’s capital
leverage program 21 |
 22 |
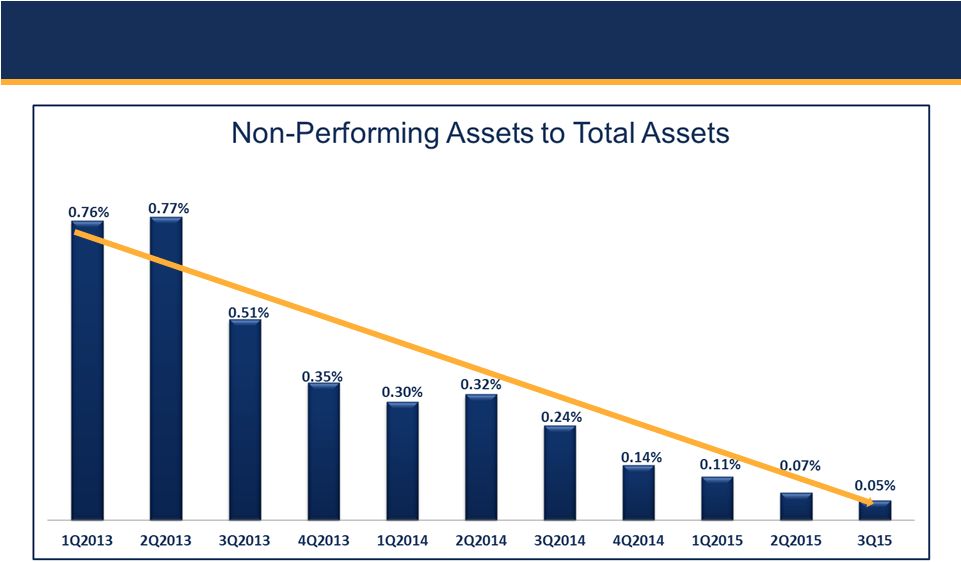 FSB Asset
Quality 23 |
 FSB Asset
Quality 24
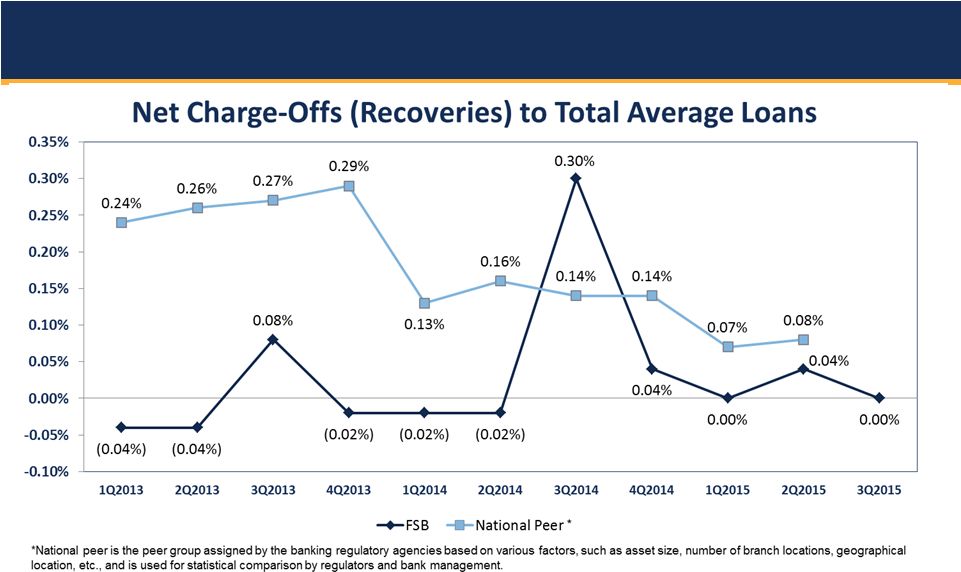
*National peer is the peer group assigned by the banking regulatory agencies based on
various factors, such as asset size, number of branch locations, geographical location, etc., and is used for statistical comparison by regulators and bank management.
† Texas Ratio = Nonperforming Assets / (Total Equity Capital + Allowance for Loan and Lease Losses)
* † |
 FSB Asset
Quality 25 |
 26 |
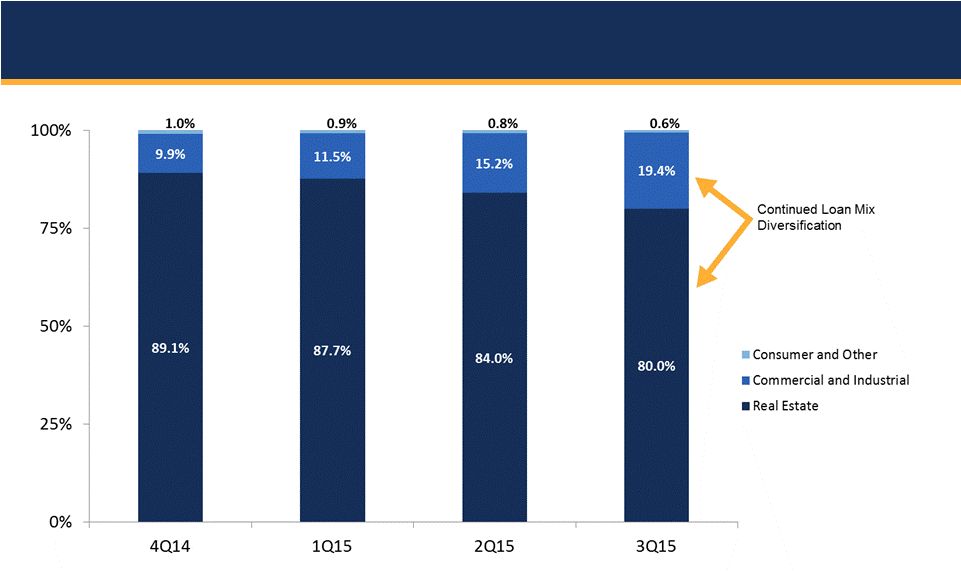 FSB Loan
Concentration (excludes Loans Held For Sale) 27 |
 FSB Real
Estate Loan Segments 28 |
 29 |
 FSB
Initial Development Plan Phase 1: Build foundation of a strong,
viable, local community bank in the Williamson County market,
focused on organic growth Phase 2: Create a liquidity event
(to reward shareholders) and create a currency (to use for banker
incentives and business acquisitions)
• Initial Public Offering – March 2015 • Listing on New York Stock Exchange Phase 3: Expand FSB markets through (1) geographic expansion and/or (2) product line expansion • Acquisition of MidSouth Bank – July 2014 • Healthcare team added 2Q 2015 30 |
 Keys to
Enhancing Continued Profitability Improve interest margins
31 |
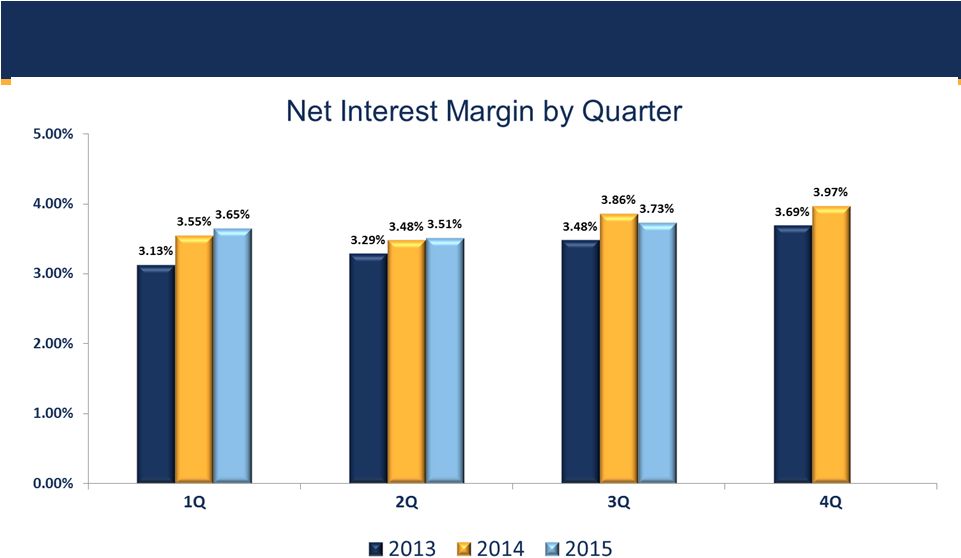 FSB
Margin Analysis 32 |
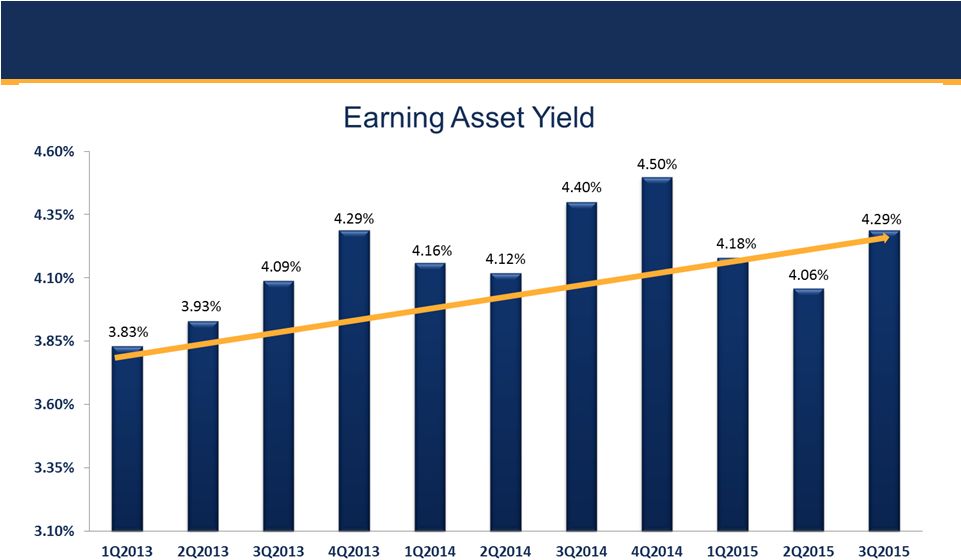 FSB
Margin Analysis 33 |
 FSB
Margin Analysis 34 |
 Keys to
Enhancing Continued Profitability Improve interest margins
Improve efficiency ratio
35 |
 FSB
Efficiency Ratio * Excludes $1.2 million in loan income from payoff of
purchased credit-impaired loan. Actual ratio for 3Q2015 was 52.9%.
36 |
 Keys to
Enhancing Continued Profitability Improve interest margins
Improve efficiency ratio
Optimize non-interest income
37 |
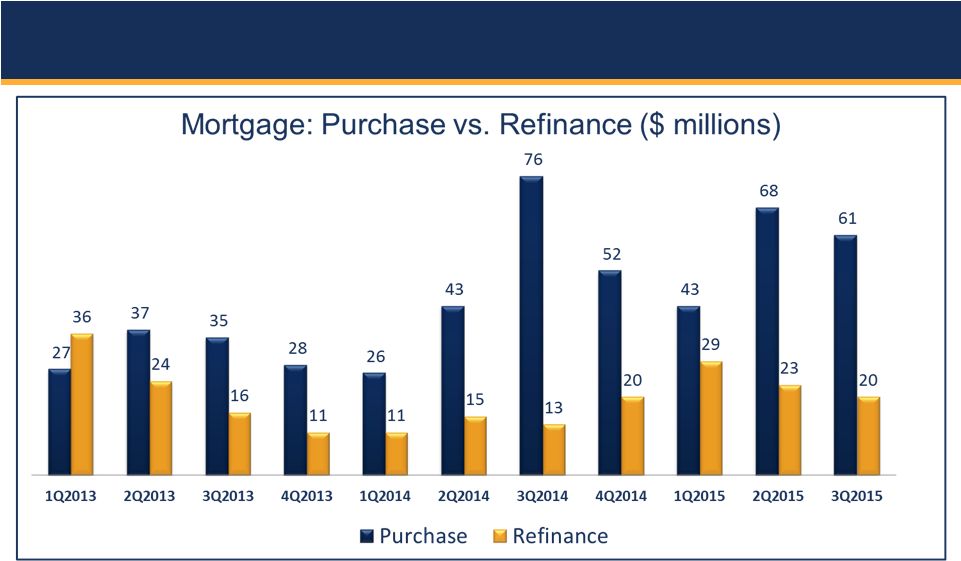
 FSB
Mortgage Production Trends 38 |
 39 |
 Key
Elements of FSB Performance Growth
Real Estate Lending Asset Quality Proven, Successful Banking Model 40 |
Serious News for Serious Traders! Try StreetInsider.com Premium Free!
You May Also Be Interested In
- CI Global Asset Management Announces August 2026 Distributions for Certain CI ETFs
- LeonaBio Reports Second Quarter 2026 Financial Results and Provides Business Update
- Cohen & Steers Announces Changes to Realty Indexes
Create E-mail Alert Related Categories
SEC FilingsSign up for StreetInsider Free!
Receive full access to all new and archived articles, unlimited portfolio tracking, e-mail alerts, custom newswires and RSS feeds - and more!
