



Form 8-K FXCM Inc. For: May 06
 Tweet
Tweet Share
Share E-mail
UNITED STATES
SECURITIES AND EXCHANGE COMMISSION
WASHINGTON, D.C. 20549
FORM 8-K
CURRENT REPORT
Pursuant to Section 13 or 15(d) of the
Securities Exchange Act of 1934
Date of Report (Date of Earliest Event Reported): May 6, 2016
FXCM Inc.
(Exact Name of Registrant as Specified in its Charter)
| Delaware | 001-34986 | 27-3268672 | ||
| (State or Other Jurisdiction of | (Commission File Number) | (IRS Employer | ||
| Incorporation) | Identification No.) |
55 Water Street, FL 50 New York, NY, 10041
(Address of Principal Executive Offices) (Zip Code)
(646) 432-2986
(Registrant’s Telephone Number, Including Area Code)
Not Applicable
(Former Name or Former Address, if Changed Since Last Report)
Check the appropriate box below if the Form 8-K filing is intended to simultaneously satisfy the filing obligation of the registrant under any of the following provisions:
| o | Written communications pursuant to Rule 425 under the Securities Act (17 CFR 230.425) |
| o | Soliciting material pursuant to Rule 14a-12 under the Exchange Act (17 CFR 240.14a-12) |
| o | Pre-commencement communications pursuant to Rule 14d-2(b) under the Exchange Act (17 CFR 240.14d-2(b)) |
| o | Pre-commencement communications pursuant to Rule 13e-4(c) under the Exchange Act (17 CFR 240.13e-4(c)) |
Item 2.02 Results of Operations and Financial Condition
On May 6, 2016 FXCM Inc. (“the Company”) issued a press release announcing financial results for its first quarter ended March 31, 2016. The Company also released its monthly business metrics for April 2016. A copy of this press release is furnished as Exhibit 99.1 and a copy of the earnings presentation for the quarter ended March 31, 2016 is furnished as Exhibit 99.2, each to this Form 8-K and each is hereby incorporated by reference in this Item 2.02.
The information in this Current Report on Form 8-K and the Exhibit attached hereto is furnished pursuant to the rules and regulations of the Securities and Exchange Commission and shall not be deemed “filed” for purposes of Section 18 of the Securities Exchange Act of 1934 (the “Exchange Act”) or otherwise subject to the liabilities of that section, nor shall it be deemed incorporated by reference in any filing under the Securities Act of 1933 or the Exchange Act, except as expressly set forth by specific reference in such a filing.
Item 7.01 Regulation FD Disclosure
The information set forth under Item 2.02, “Results of Operations and Financial Condition”, is incorporated herein by reference.
Item 9.01. Financial Statements and Exhibits.
| (a) | Financial statements of businesses acquired: None |
| (b) | Pro forma financial information: None |
| (c) | Shell company transactions: None |
| (d) | Exhibits: |
| · Press release, dated May 6, 2016 issued by FXCM Inc. | |
| · Earnings Presentation for the quarter ended March 31, 2016 |
| Exhibit No. | Exhibit Description | |
| 99.1** | Press Release dated May 6, 2016 | |
| 99.2** | Earnings Presentation for the quarter ended March 31, 2016 |
** Furnished herewith.
SIGNATURE
Pursuant to the requirements of the Securities Exchange Act of 1934, the registrant has duly caused this report to be signed on its behalf by the undersigned hereunto duly authorized.
| FXCM INC. | |||
| By: | /s/ David S. Sassoon | ||
| Name: | David S. Sassoon | ||
| Title: | General Counsel | ||
Date: May 6, 2016
Exhibit Index
| Exhibit No. | Description | |
| 99.1 | Press Release dated as of May 6, 2016 | |
| 99.2 | Earnings Presentation for the quarter ended March 31, 2016 |
Exhibit 99.1

FXCM Inc. Announces First Quarter 2016 Results
Releases April 2016 Customer Trading Metrics
First Quarter 2016 Highlights:
| · | U.S. GAAP net revenues from continuing operations of $71.5 million |
| · | U.S. GAAP net income attributable to FXCM Inc. from continuing operations of $61.3 million or $10.94 per fully diluted share, including a $110.8 million gain on derivative liability |
| · | U.S. GAAP net revenues from discontinued operations of $6.5 million |
| · | U.S. GAAP net loss attributable to FXCM Inc. from discontinued operations of $11.5 million or $2.06 per fully diluted share |
| · | Adjusted EBITDA from continuing and discontinued operations of $10.3 million |
| · | Strong combined operating cash position of $235.7 million and regulatory surplus of $107.2 million at March 31, 2016 |
April 2016 Customer Trading Metrics from Continuing Operations(2) Highlights:
| · | Retail customer trading volume(3) of $287 billion in April 2016, 1% lower than March 2016 and 6% lower than April 2015. |
| · | Institutional customer trading volume(3) of $75 billion in April 2016, 10% lower than March 2016 and 83% higher than April 2015. |
Presentation slides for the quarter are available at http://ir.fxcm.com/.
NEW YORK – May 6, 2016 – FXCM Inc. (NYSE: FXCM), a leading online provider of foreign exchange, or FX, trading and related services, today announced for the quarter ended March 31, 2016, U.S. GAAP trading revenue from continuing operations of $69.7 million, compared to $69.2 million for the quarter ended March 31, 2015. U.S. GAAP net income attributable to FXCM Inc. from continuing operations was $61.3 million for the quarter ended March 31, 2016, or $10.94 per fully diluted share, compared to U.S. GAAP net loss attributable to FXCM Inc. from continuing operations of $393.3 million, or $83.45(1) per fully diluted share, for the quarter ended March 31, 2015.
Results from operations for the quarter ended March 31, 2016 included a gain on derivative liability of $110.8 million. The gain is a non-cash item relating to the decrease in value of the Leucadia Letter Agreement. The Letter Agreement is a component of the financing package provided by Leucadia National Corp. (“Leucadia”). On January 15, 2015, FXCM’s customers suffered negative equity balances due to the unprecedented move in the Swiss Franc after the Swiss National Bank (“SNB”) discontinued its peg of the Swiss Franc to the Euro. On January 16, 2015, FXCM entered into a financing agreement with Leucadia that permitted FXCM’s regulated subsidiaries to meet their regulatory capital requirements and continue normal operations after significant losses were incurred resulting from the events of January 15, 2015.
U.S. GAAP trading revenue from discontinued operations for the quarter ended March 31, 2016 was $6.3 million, compared to $26.3 million for the quarter ended March 31, 2015. U.S. GAAP net loss attributable to FXCM Inc. from discontinued operations was $11.5 million for the quarter ended March 31, 2016, or $2.06 per fully diluted share compared to U.S. GAAP net loss attributable to FXCM Inc. from discontinued operations of $33.5 million, or $7.11(1) per fully diluted share, for the quarter ended March 31, 2015.
Adjusted EBITDA from continuing and discontinued operations for the quarter ended March 31, 2016 was $10.3 million, compared to $14.5 million for the quarter ended March 31, 2015.
Adjusted EBITDA from continuing operations was $9.3 million for the quarter ended March 31, 2016 compared to $3.4 million for the quarter ended March 31, 2015.
Adjusted EBITDA is a Non-GAAP financial measure. This measure does not represent and should not be considered as a substitute for net income, net income attributable to FXCM Inc. or net income per Class A share or as a substitute for cash flow from operating activities, each as determined in accordance with U.S. GAAP, and our calculations of these measures may not be comparable to similarly entitled measures reported by other companies. See “Non-GAAP Financial Measures” beginning on A-3 of this release for additional information regarding these Non-GAAP financial measures and for reconciliations of such measures to the most directly comparable measures calculated in accordance with U.S. GAAP.
FXCM Inc. today announced certain key customer trading metrics for April 2016. Monthly activities included:
April 2016 Customer Trading Metrics from Continuing Operations (2)
Retail Customer Trading Metrics
| · | Retail customer trading volume(3) of $287 billion in April 2016, 1% lower than March 2016 and 6% lower than April 2015. |
| · | Average retail customer trading volume(3) per day of $13.7 billion in April 2016, 8% higher than March 2016 and 1% lower than April 2015. |
| · | An average of 584,753 retail client trades per day in April 2016, 4% higher than March 2016 and 15% higher than April 2015. |
| · | Active accounts(4) of 176,812 as of April 30, 2016, an increase of 1,076, or 1%, from March 31, 2016, and an increase of 3,780, or 2%, from April 30, 2015. |
| · | Tradeable accounts(5) of 169,168 as of April 30, 2016, an increase of 1,804, or 1%, from March 31, 2016, and a decrease of 19,053, or 10%, from April 30, 2015. |
Institutional Customer Trading Metrics
| · | Institutional customer trading volume(3) of $75 billion in April 2016, 10% lower than March 2016 and 83% higher than April 2015. |
| · | Average institutional trading volume(3) per day of $3.5 billion in April 2016, 3% lower than March 2016 and 84% higher than April 2015. |
| · | An average of 53,743 institutional client trades per day in April 2016, 2% higher than March 2016 and 383% higher than April 2015. |
More information, including historical results for each of the above metrics, can be found on the investor relations page of FXCM's corporate website www.fxcm.com.
This operating data is preliminary and subject to revision and should not be taken as an indication of the financial performance of FXCM Inc. FXCM undertakes no obligation to publicly update or review previously reported operating data. Any updates to previously reported operating data will be reflected in the historical operating data that can be found on the Investor Relations page of the Company’s corporate website www.fxcm.com.
(1) Earnings per share have been adjusted to reflect the impact of the one-for-ten reverse stock split of the Corporation’s issued and outstanding Class A common stock that became effective on October 1, 2015.
(2) Customer Trading Metrics from Continuing Operations excludes discontinued operations of FXCM Japan and FXCM Hong Kong.
(3) Volume that FXCM customers traded in period is translated into US dollars.
(4) An Active Account represents an account that has traded at least once in the previous twelve months.
(5) A Tradeable Account is an account with sufficient funds to place a trade in accordance with FXCM trading policies.
Selected Customer Trading Metrics from
Continuing Operations
| Three Months Ended March 31, | ||||||||||||
| 2016 | 2015 | % Change | ||||||||||
| Total retail trading volume ($ in billions) | $ | 931 | $ | 934 | 0 | % | ||||||
| Total active accounts | 175,736 | 170,907 | 3 | % | ||||||||
| Trading days in period | 64 | 63 | 2 | % | ||||||||
| Daily average trades | 632,571 | 521,564 | 21 | % | ||||||||
| Daily average trades per active account | 3.6 | 3.1 | 18 | % | ||||||||
| Retail trading revenue per million traded | $ | 72 | $ | 67 | 8 | % | ||||||
| Total customer equity ($ in millions) | $ | 633.2 | $ | 666.8 | -5 | % | ||||||
Disclosure Regarding Forward-Looking Statements
In addition to historical information, this earnings release may contain "forward-looking statements" within the meaning of Section 27A of the Securities Act of 1933, Section 21E of the Securities Exchange Act of 1934 and/or the Private Securities Litigation Reform Act of 1995, which reflect FXCM's current views with respect to, among other things, its operations and financial performance in the future. These forward-looking statements are not historical facts and are based on current expectations, estimates and projections about FXCM's industry, management's beliefs and certain assumptions made by management, many of which, by their nature, are inherently uncertain and beyond our control. Accordingly, readers are cautioned that any such forward-looking statements are not guarantees of future performance and are subject to certain risks, uncertainties and assumptions that are difficult to predict including, without limitation, risks associated with the events that took place in the currency markets on January 15, 2015 and their impact on FXCM's capital structure, risks associated with FXCM's ability to recover all or a portion of any capital losses, risks relating to the ability of FXCM to satisfy the terms and conditions of or make payments pursuant to the terms of the credit agreement and the letter agreement with Leucadia, risks related to FXCM's dependence on FX market makers, market conditions, risks associated with the outcome of any potential litigation or regulatory inquiries to which FXCM may become subject as a result of the cybersecurity incident that was reported in a press release on October 1, 2015, risks associated with potential reputational damage to FXCM resulting from this cybersecurity incident, and the extent of remediation costs and other additional expenses that may be incurred by FXCM as a result of this security incident, and those other risks described under "Risk Factors" in FXCM Inc.'s Annual Report on Form 10-K, FXCM Inc.’s latest Quarterly Report on Form 10-Q, and other reports or documents FXCM files with, or furnishes to, the SEC from time to time, which are accessible on the SEC website at sec.gov. This information should also be read in conjunction with FXCM's Consolidated Financial Statements and the Notes thereto contained in FXCM's Annual Report on Form 10-K, FXCM Inc.’s latest Quarterly Report on Form 10-Q, and in other reports or documents FXCM files with, or furnishes to, the SEC from time to time, which are accessible on the SEC website at sec.gov.
These factors should not be construed as exhaustive and should be read in conjunction with the other cautionary statements that are included in this release and in our SEC filings. FXCM Inc. undertakes no obligation to publicly update or review any forward-looking statement, whether as a result of new information, future developments or otherwise, except as required by law.
Visit www.fxcm.com and follow us on Twitter @FXCM, Facebook FXCM, Google+ FXCM or YouTube FXCM.
About FXCM Inc.
FXCM Inc. (NYSE: FXCM) is a leading provider of online foreign exchange (FX) trading, CFD trading, spread betting and related services. Our mission is to provide global traders with access to the world’s largest and most liquid market by offering innovative trading tools, hiring excellent trading educators, meeting strict financial standards and striving for the best online trading experience in the market.
Clients have the advantage of mobile trading, one-click order execution and trading from real-time charts. In addition, FXCM offers educational courses on FX trading and provides free news and market research through DailyFX.com.
Trading foreign exchange and CFDs on margin carries a high level of risk, which may result in losses that could exceed your deposits, therefore may not be suitable for all investors. Read full disclaimer.
Contacts
Jaclyn Klein, 646-432-2463
Vice-President, Corporate Communications and Investor Relations
[email protected]
ANNEX I
| Schedule | Page Number | |
| U.S. GAAP Results | ||
| Unaudited U.S. GAAP Condensed Consolidated Statements of Operations for the Three Months Ended March 31, 2016 and 2015 | A-1 | |
| Unaudited U.S. GAAP Condensed Consolidated Statements of Financial Condition As of March 31, 2016 and December 31, 2015 | A-2 | |
| Non-GAAP Financial Measures | A-3 | |
| Reconciliation of U.S. GAAP Reported to Adjusted EBITDA | A-4 | |
| Schedule of Cash and Cash Equivalents and Amounts Due to/from Brokers | A-5 |
FXCM Inc.
Condensed Consolidated Statements of Operations
(In thousands, except per share amounts)
(Unaudited)
| Three Months Ended March 31, | ||||||||
| 2016 | 2015 | |||||||
| Revenues | ||||||||
| Trading revenue | $ | 69,747 | $ | 69,214 | ||||
| Interest income | 528 | 322 | ||||||
| Brokerage interest expense | (198 | ) | (204 | ) | ||||
| Net interest revenue | 330 | 118 | ||||||
| Other income | 1,438 | 145,858 | ||||||
| Total net revenues | 71,515 | 215,190 | ||||||
| Operating Expenses | ||||||||
| Compensation and benefits | 24,826 | 25,039 | ||||||
| Referring broker fees | 10,646 | 16,069 | ||||||
| Advertising and marketing | 5,468 | 2,817 | ||||||
| Communication and technology | 7,605 | 9,517 | ||||||
| Trading costs, prime brokerage and clearing fees | 888 | 1,140 | ||||||
| General and administrative | 14,101 | 13,655 | ||||||
| Bad debt expense | - | 256,915 | ||||||
| Depreciation and amortization | 7,244 | 7,020 | ||||||
| Goodwill impairment loss | - | 9,513 | ||||||
| Total operating expenses | 70,778 | 341,685 | ||||||
| Operating income (loss) | 737 | (126,495 | ) | |||||
| Other expense | ||||||||
| Gain (loss) on derivative liability — Letter Agreement | 110,831 | (292,429 | ) | |||||
| Loss on equity method investments, net | 189 | 151 | ||||||
| Interest on borrowings | 20,553 | 30,559 | ||||||
| Income (loss) from continuing operations before income taxes | 90,826 | (449,634 | ) | |||||
| Income tax provision | 582 | 179,762 | ||||||
| Income (loss) from continuing operations | 90,244 | (629,396 | ) | |||||
| Loss from discontinued operations, net of tax | (31,068 | ) | (98,598 | ) | ||||
| Net income (loss) | 59,176 | (727,994 | ) | |||||
| Net income (loss) attributable to non-controlling interest in FXCM Holdings, LLC | 23,452 | (257,375 | ) | |||||
| Net loss attributable to other non-controlling interests | (14,011 | ) | (43,802 | ) | ||||
| Net income (loss) attributable to FXCM Inc. | $ | 49,735 | $ | (426,817 | ) | |||
| Income (loss) from continuing operations attributable to FXCM Inc. | $ | 61,270 | $ | (393,325 | ) | |||
| Loss from discontinued operations attributable to FXCM Inc. | (11,535 | ) | (33,492 | ) | ||||
| Net income (loss) attributable to FXCM Inc. | $ | 49,735 | $ | (426,817 | ) | |||
| Weighted average shares of Class A common stock outstanding - Basic and Diluted(1) | 5,603 | 4,713 | ||||||
| Net income (loss) per share attributable to stockholders of Class A common stock of FXCM Inc. - Basic and Diluted(1) | ||||||||
| Continuing operations | $ | 10.94 | $ | (83.45 | ) | |||
| Discontinued operations | (2.06 | ) | (7.11 | ) | ||||
| Net income (loss) income attributable to FXCM Inc. | $ | 8.88 | $ | (90.56 | ) | |||
(1) Prior period is adjusted to reflect the impact of the one-for-ten reverse stock split that became effective on October 1, 2015.
| A-1 |
FXCM Inc.
Condensed Consolidated Statements of Financial Condition
As of March 31, 2016 and December 31, 2015
(Amounts in thousands except share data)
(Unaudited)
| March 31, 2016 | December 31, 2015 | |||||||
| Assets | ||||||||
| Current assets | ||||||||
| Cash and cash equivalents | $ | 208,093 | $ | 203,854 | ||||
| Cash and cash equivalents, held for customers | 633,151 | 685,043 | ||||||
| Due from brokers | 280 | 3,781 | ||||||
| Accounts receivable, net | 1,406 | 1,636 | ||||||
| Tax receivable | 62 | 1,766 | ||||||
| Current assets held for sale | 200,971 | 233,937 | ||||||
| Total current assets | 1,043,963 | 1,130,017 | ||||||
| Deferred tax asset | 14 | 14 | ||||||
| Office, communication and computer equipment, net | 36,125 | 35,891 | ||||||
| Goodwill | 27,364 | 28,080 | ||||||
| Other intangible assets, net | 11,819 | 13,782 | ||||||
| Notes receivable | 7,881 | 7,881 | ||||||
| Other assets | 10,753 | 11,421 | ||||||
| Total assets | $ | 1,137,919 | $ | 1,227,086 | ||||
| Liabilities and Stockholders' Deficit | ||||||||
| Current liabilities | ||||||||
| Customer account liabilities | $ | 633,151 | $ | 685,043 | ||||
| Accounts payable and accrued expenses | 37,441 | 38,298 | ||||||
| Due to brokers | 5,523 | 1,073 | ||||||
| Due to related parties pursuant to tax receivable agreement | - | 145 | ||||||
| Current liabilities held for sale | 15,045 | 14,510 | ||||||
| Total current liabilities | 691,160 | 739,069 | ||||||
| Deferred tax liability | 505 | 719 | ||||||
| Senior convertible notes | 156,021 | 154,255 | ||||||
| Credit agreement | 157,636 | 147,262 | ||||||
| Derivative liability — Letter Agreement | 337,627 | 448,458 | ||||||
| Other liabilities | 15,121 | 16,044 | ||||||
| Total liabilities | 1,358,070 | 1,505,807 | ||||||
| Commitments and Contingencies | ||||||||
| Stockholders’ Deficit | ||||||||
| Class A common stock, par value $0.01 per share; 3,000,000,000 shares authorized, 5,602,534 shares issued and outstanding as of March 31, 2016 and December 31, 2015 | 56 | 56 | ||||||
| Class B common stock, par value $0.01 per share; 1,000,000 shares authorized, 25 shares issued and outstanding as of March 31, 2016 and December 31, 2015 | 1 | 1 | ||||||
| Additional paid-in capital | 267,741 | 267,369 | ||||||
| Accumulated deficit | (481,815 | ) | (531,550 | ) | ||||
| Accumulated other comprehensive income | 960 | 1,004 | ||||||
| Total stockholders’ deficit, FXCM Inc. | (213,057 | ) | (263,120 | ) | ||||
| Non-controlling interests | (7,094 | ) | (15,601 | ) | ||||
| Total stockholders’ deficit | (220,151 | ) | (278,721 | ) | ||||
| Total liabilities and stockholders’ deficit | $ | 1,137,919 | $ | 1,227,086 | ||||
| A-2 |
Non-GAAP Financial Measures
We use Non-GAAP financial measures to evaluate our operating performance, as well as the performance of individual employees. Management believes that the Non-GAAP measures when presented in conjunction with comparable U.S. GAAP measures are useful to investors to compare FXCM's results across several periods and facilitate an understanding of FXCM's operating results. These measures do not represent and should not be considered as a substitute for, or superior to, net income, net income attributable to FXCM Inc. or net income per Class A share or as a substitute for, or superior to, cash flow from operating activities, each as determined in accordance with U.S. GAAP, and our calculations of these measures may not be comparable to similarly entitled measures reported by other companies.
| 1. | Compensation Expense / Lucid Minority Interest. Our reported U.S. GAAP results reflect the portion of the 49.9% of Lucid earnings allocated among the non-controlling members of Lucid based on services provided as a component of compensation expense under Allocation of income to Lucid members for services provided. Adjustments have been made to eliminate this allocation of Lucid's earnings attributable to non-controlling members. The Company's management believes that this adjustment provides a more meaningful view of the Company's operating expenses and the Company's economic arrangement with Lucid's non-controlling members. This adjustment has no impact on net income as reported by the Company. |
| 2. | Regulatory and Legal Costs. Adjustments have been made to eliminate certain costs or recoveries (including client reimbursements, professional fees and settlements from lawsuits) associated with ongoing discussions and settling certain regulatory and legal matters. Given the nature of these expenses, they are not viewed by management as expenses incurred in the ordinary course of business and management believes it is useful to provide the effects of eliminating these expenses. |
| 3. | SNB Costs. Adjustments have been made to eliminate certain costs/income (including the net losses associated with client debit balances, costs related to the implementation of a Stockholder Rights Plan, legal costs and adjustments to the Company’s tax receivable agreement contingent liability) associated with the January 15, 2015 SNB event. Given the nature of these expenses, they are not viewed by management as expenses incurred in the ordinary course of business and management believes it is useful to provide the effects of eliminating these expenses. |
| 4. | Cybersecurity Incident: Adjustments have been made to eliminate certain costs related to investigative and other professional services, costs of communications with customers and remediation activities associated with the incident. Given the nature of these expenses, management believes it is useful to provide the effects of eliminating these expenses. |
| 5. | Gain on Disposition of Equity Method Investment: An adjustment has been made to eliminate a gain related to the disposition of an equity method investment, given the nature of the gain, it is not viewed by management as activity in the ordinary course of business and management believes it is useful to provide the effect of eliminating this item. |
| A-3 |
| (Unaudited) | Reconciliation of U.S. GAAP Reported to Non-GAAP Adjusted Measures(1) | |||||||||||||||||||||||
| Three Months Ended March 31, | ||||||||||||||||||||||||
| 2016 | 2015 | |||||||||||||||||||||||
| Continuing Ops | Disc Ops | Combined | Continuing Ops | Disc Ops | Combined | |||||||||||||||||||
| Net income (loss) | $ | 90,244 | $ | (31,068 | ) | $ | 59,176 | $ | (629,396 | ) | $ | (98,598 | ) | $ | (727,994 | ) | ||||||||
| EBITDA and Other Adjustments | ||||||||||||||||||||||||
| Depreciation and amortization | 7,244 | - | 7,244 | 7,020 | 12,359 | 19,379 | ||||||||||||||||||
| Interest on borrowings | 20,553 | - | 20,553 | 30,559 | - | 30,559 | ||||||||||||||||||
| (Gain) loss on derivative liability - Letter Agreement | (110,831 | ) | - | (110,831 | ) | 292,429 | - | 292,429 | ||||||||||||||||
| Goodwill and held for sale impairment | - | 31,511 | 31,511 | 9,513 | 81,364 | 90,877 | ||||||||||||||||||
| Income tax provision | 582 | - | 582 | 179,762 | 4,900 | 184,662 | ||||||||||||||||||
| EBITDA and Other Adjustments | 7,792 | 443 | 8,235 | (110,113 | ) | 25 | (110,088 | ) | ||||||||||||||||
| Adjustments | ||||||||||||||||||||||||
| Net Revenues(2) | 44 | - | 44 | (145,224 | ) | - | (145,224 | ) | ||||||||||||||||
| Allocation of net income to Lucid members for services provided(3) | - | 1,201 | 1,201 | - | 2,686 | 2,686 | ||||||||||||||||||
| General and administrative(4) | 1,486 | - | 1,486 | 1,837 | - | 1,837 | ||||||||||||||||||
| Bad debt expense(5) | - | - | - | 256,915 | 8,408 | 265,323 | ||||||||||||||||||
| Gain on disposition of equity method investment(6) | - | (679 | ) | (679 | ) | - | - | - | ||||||||||||||||
| Adjusted EBITDA | $ | 9,322 | $ | 965 | $ | 10,287 | $ | 3,415 | $ | 11,119 | $ | 14,534 | ||||||||||||
(1) The presentation includes Non-GAAP financial measures. These Non-GAAP financial measures are not prepared under any comprehensive set of accounting rules or principles, and do not reflect all of the amounts associated with the Company's results of operations as determined in accordance with U.S. GAAP.
(2) Represents a $0.1 million charge in Q1 2016 for tax receivable agreement payments and the elimination of a $145.2 million noncash benefit in Q1 2015 attributable to the reduction of our tax receivable agreement contingent liability to zero.
(3) Represents the elimination of the 49.9% of Lucid’s earnings allocated among the non-controlling interests recorded as compensation for U.S. GAAP purposes included in discontinued operations.
(4) Represents $1.5 million of legal and other professional fees in Q1 2016, including legal fees resulting from the January 15, 2015 SNB event, fees related to the Leucadia debt restructuring and other professional fees related to the Stockholders Rights Plan and $1.8 million of legal and other professional fees in Q1 2015, including legal fees resulting from the SNB event and professional fees related to the Stockholders Rights Plan.
(5) Represents the net bad debt expense related to client debit balances associated with the January 15, 2015 SNB event.
(6) Represents the gain on the disposition of an equity method investment related to V3 of $0.7M.
| A-4 |
Schedule of Cash and Cash Equivalents and Due to/from Brokers
| (Unaudited) | March 31, 2016 | December 31, 2015 | ||||||||||||||||||||||
| Continuing Ops | Disc Ops | Combined | Continuing Ops | Disc Ops | Combined | |||||||||||||||||||
| Cash & Cash Equivalents | $ | 208,093 | $ | 10,788 | $ | 218,881 | $ | 203,854 | $ | 10,786 | $ | 214,640 | ||||||||||||
| Due From Brokers | 280 | 22,038 | 22,318 | 3,781 | 22,234 | 26,015 | ||||||||||||||||||
| Due to Brokers | (5,523 | ) | (25 | ) | (5,548 | ) | (1,073 | ) | - | (1,073 | ) | |||||||||||||
| Operating Cash | $ | 202,850 | $ | 32,801 | $ | 235,651 | $ | 206,562 | $ | 33,020 | $ | 239,582 | ||||||||||||
| A-5 |
Exhibit 99.2

1 First Quarter 2016 Financial and Operating Results April 2016 Customer Trading Metrics May 6, 2016

2 This presentation may contain "forward - looking statements" within the meaning of Section 27 A of the Securities Act of 1933 , Section 21 E of the Securities Exchange Act of 1934 and/or the Private Securities Litigation Reform Act of 1995 , which reflect FXCM's current views with respect to, among other things, its operations and financial performance in the future . These forward - looking statements are not historical facts and are based on current expectations, estimates and projections about FXCM's industry, management's beliefs and certain assumptions made by management, many of which, by their nature, are inherently uncertain and beyond our control . Accordingly, readers are cautioned that any such forward - looking statements are not guarantees of future performance and are subject to certain risks, uncertainties and assumptions that are difficult to predict including, without limitation, risks associated with the events that took place in the currency markets on January 15 , 2015 and their impact on FXCM's capital structure, risks associated with FXCM's ability to recover all or a portion of any capital losses, risks relating to the ability of FXCM to satisfy the terms and conditions of or make payments pursuant to the terms of the credit agreement and letter agreement with Leucadia, risks related to FXCM's dependence on FX market makers, market conditions, risks associated with the outcome of any potential litigation or regulatory inquiries to which FXCM may become subject as a result of the cybersecurity incident that was reported in a press release on October 1 , 2015 , risks associated with potential reputational damage to FXCM resulting from this cybersecurity incident, and the extent of remediation costs and other additional expenses that may be incurred by FXCM as a result of this security incident, and those other risks described under "Risk Factors" in FXCM Inc . 's Annual Report on Form 10 - K, FXCM Inc . ’s latest Quarterly Report on Form 10 - Q, and other reports or documents FXCM files with, or furnishes to, the SEC from time to time, which are accessible on the SEC website at sec . gov . This information should also be read in conjunction with FXCM's Consolidated Financial Statements and the Notes thereto contained in FXCM's Annual Report on Form 10 - K, FXCM Inc . ’s latest Quarterly Report on Form 10 - Q and in other reports or documents the FXCM files with, or furnishes to, the SEC from time to time, which are accessible on the SEC website at sec . gov . FXCM undertakes no obligation to publicly update or review any forward - looking statement, whether as a result of new information, future developments or otherwise . Non - GAAP Financial Measures : This presentation presents certain non - GAAP financial measures . These measures should not be considered in isolation from, or as a substitute for, measures prepared in accordance with generally accepted accounting principles . See the appendix to this presentation for reconciliations of these non - GAAP financial measures to the most comparable measures calculated and presented in accordance with GAAP . Safe Harbor

3 A Message From Management Operational: Our success is evident in a number of year over year metrics. Customer loyalty and brand strength remain strong. We continue to onboard new smaller clients to our dealing desk offering which has grown to 19% of retail volume as of March 31, 2016. Our enhanced CFD offering launched in October 2015 has been gaining traction throughout Q1 2016. Both initiatives have helped raise our retail trading revenue per million traded by 7.5% over the previous quarter to $72/million. The firm believes these initiatives, as well as the data products and enhanced technology that we are working on, will continue to satisfy a diverse group of customers both large and small, novice and sophisticated . We believe 2016 will be a growth year for FXCM. The firm’s 150 person technology staff, many of its financial resources and sales efforts are focusing purely on the retail client. FXCM will be introducing innovations during 2016 which include more data, faster connectivity and other enhancements to ensure FXCM continues to be one of the foremost retail FX franchises for years to come. Our value proposition to the customer remains strong and we continue to invest in innovating the retail offering and improving our core services. We aim to be the primary provider for diverse market segments and believe that with our exceptional execution, multiple platform offerings, data and connectivity solutions we have a unique value proposition for the retail client base. With an improved environment for retail FX trading along with the clarity and stability that the renegotiated agreements with Leucadia will bring FXCM, we have the potential to grow metrics to levels well above those we achieved prior to January 15 th 2015. As we mentioned last quarter, Leucadia and FXCM announced they have entered into a memorandum of understanding (the “MOU”) to amend the terms of their Amended and Restated Credit Agreement (the “Credit Agreement”), and their Amended and Restated Letter Agreement (the “Letter Agreement”), each dated January 24, 2015. The nonbinding MOU remains subject to the execution of definitive agreements and Board and regulatory approvals . Leucadia and FXCM expect to complete the amendments by June 2016.

4 A Message From Management Continued Financial: While we were pleased with the performance of continuing operations, discontinued operations did not perform as well, but we are optimistic about the changes we are making to drive their future growth. Highlights for Q1 2016 include: A 173% increase in Adjusted EBITDA year over year from $3.4 million in Q1 2015 to $9.3 million in Q1 2016 from continuing operations. Adjusted revenues from continuing operations were $ 71.6 million, an increase from $70.0 million in Q1 2015 and up from $ 67.1 million from the prior quarter. Our net income from continuing ops attributable to FXCM was $61.3 million, or $10.94 a share. Please note that this includes a $ 110.8 million non - cash gain on the derivative liability due to the Leucadia Letter Agreement. Our cash position remains stable and is very similar to where it was at year - end, with combined continuing and discontinued operations cash of $235.7 million and a regulatory surplus of $ 107 million. Based on the current market environment, the key metrics on our retail FX business are healthy. Total active accounts increased 3% year over year, daily average trades increased 21% and total customer equity as of March 31, 2016 was $633.2 million. The firm is maintaining its cost control efforts by continuing to reduce our key operating expenses while maintaining them at a level that will assist in enhancing our future earnings growth.

5 Q1 2016 Highlights Financial • Net revenues from continuing operations of $71.5 million • Net Income from continuing operations attributable to FXCM Inc. of $61.3 million or $10.94/share — Includes a non - cash item: $110.8 million non - cash gain on derivative liability (Leucadia Letter Agreement) • Adjusted EBITDA (continuing and discontinued ops) of $10.3 million • $9.3 million of Adjusted EBTIDA coming from continuing operations Operating (continuing operations only) • Retail trading revenue per million traded of $72/MM up 7.5% vs. $67/MM in Q4/15. • Retail volume of $931 billion for Q1/16 relatively consistent with Q1/15 • Dealing Desk (“DD”) initiative for smaller clients reached 19% of retail volume in Q1 2016 vs. 16% in Q4 2015 • Tradable accounts increased by 5,732 or 3.5% to 167,364 since 12/31/15

6 Q1 2016 Highlights • $203 million in operating cash in our continuing operations vs. $207 million at 12/31/15 • Together with discontinued operations, FXCM had $236 million in operating cash at 3/31/16 • FXCM’s regulatory capital position • Minimum regulatory capital requirements in continuing ops (US, UK & Australia) and discontinued ops of $60 million and regulatory capital of $167 million , a surplus of $107 million Continuing Ops Disc Ops Combined Continuing Ops Disc Ops Combined Cash & Cash Equivalents $ 208,093 $ 10,788 $ 218,881 $ 203,854 $ 10,786 $ 214,640 Due From Brokers 280 22,038 22,318 3,781 22,234 26,015 Due to Brokers (5,523) (25) (5,548) (1,073) - (1,073) Operating Cash $ 202,850 $ 32,801 $ 235,651 $ 206,562 $ 33,020 $ 239,582 March 31, 2016 December 31, 2015

7 Retail FX (1) 14.8 15.4 14.7 14.7 14.5 8 9 10 11 12 13 14 15 16 Q1 2015 Q2 2015 Q3 2015 Q4 2015 Q1 2016 Retail ADV ($’s Billions) $67 $54 $56 $67 $72 $25 $35 $45 $55 $65 $75 $85 $95 Q1 2015 Q2 2015 Q3 2015 Q4 2015 Q1 2016 Retail $ / Million 521.6 531.6 563.1 501.0 632.6 200 300 400 500 600 700 Q1 2015 Q2 2015 Q3 2015 Q4 2015 Q1 2016 Daily Average Revenue Trades (DARTs, 000’s) 281 326 328 301 308 369 344 321 392 362 187 235 220 167 167 98 96 103 96 94 0 200 400 600 800 1000 1200 Q1 2015 Q2 2015 Q3 2015 Q4 2015 Q1 2016 Volume by Region ($’s Billions) Asia EMEA US ROW (1) Retail FX data excludes discontinued operations of FXCM Japan and FXCM Hong Kong.

8 Financial Summary Three Months Ended March 31, 2016 and 2015 (unaudited ) ($’s in Thousands) Continuing Ops Adjust. Adj Continuing Ops Disc Ops Adjust. Adjusted Combined Continuing Ops Adjust. Adj Continuing Ops Disc Ops Adjust. Adjusted Combined Change in Adjusted Combined Trading Revenue (1) $ 69,747 $ - $ 69,747 $ 6,336 $ - $ 76,083 $ 69,214 $ - $ 69,214 $ 26,282 $ - $ 95,496 $ (19,413) Interest 330 - 330 129 - 459 118 - 118 152 - 270 189 Other (2) 1,438 44 1,482 - - 1,482 145,858 (145,224) 634 2,395 - 3,029 (1,547) Adjusted Total Revenues 71,515 44 71,559 6,465 - 78,024 215,190 (145,224) 69,966 28,829 - 98,795 (20,771) - Compensation and benefits 24,826 - 24,826 41 - 24,867 25,039 - 25,039 7,035 - 32,074 (7,207) Referring broker fees 10,646 - 10,646 - - 10,646 16,069 - 16,069 208 - 16,277 (5,631) Advertising and marketing 5,468 - 5,468 - - 5,468 2,817 - 2,817 512 - 3,329 2,139 Communication and technology 7,605 - 7,605 1,497 - 9,102 9,517 - 9,517 2,287 - 11,804 (2,702) Trading costs 888 - 888 3,610 - 4,498 1,140 - 1,140 5,748 - 6,888 (2,390) General and administrative (3) 14,101 (1,486) 12,615 505 - 13,120 13,655 (1,837) 11,818 1,995 - 13,813 (693) Bad debt expense (4) - - - - - - 256,915 (256,915) - 8,408 (8,408) - - Adjusted Operating Expenses 63,534 (1,486) 62,048 5,653 - 67,701 325,152 (258,752) 66,400 26,193 (8,408) 84,185 (16,484) (Loss) gain on equity method investments, net (5) (189) - (189) 832 (679) (36) (151) - (151) 75 - (76) 40 Adjusted EBITDA $ 7,792 $ 1,530 $ 9,322 $ 1,644 $ (679) $ 10,287 $(110,113) $ 113,528 $ 3,415 $ 2,711 $ 8,408 $ 14,534 $ (4,247) Three Months Ended March 31, 2016 Three Months Ended March 31, 2015 Footnotes: (1) Included in Q1 2016 continuing ops is $67.4 million from Retail and $2.3 million from FXCM Pro. Included in Q1 2016 discontinued ops is $6.4 million from Lucid and $(0.1) million from V3. Included in Q1 2015 continuing ops is $62.8 million from Retail and $6.4 million from FXCM Pro. Included in Q1 2015 discontinued ops is $3.0 million from Retail, $13.4 million from Lucid, $7.9 million from V3 and $2.0 million from Faros. (2) Represents a $0.1 million charge in Q1 2016 for tax receivable agreement payments, and the elimination of a $145.2 million noncash benefit in Q1 2015 attributable to the reduction of our tax receivable agreement contingent liability to zero. (3) Represents $1.5 million of legal and other professional fees in Q1 2016, including legal fees resulting from the January 15, 2015 SNB event, fees related to the Leucadia debt restructuring and other professional fees related to the Stockholders Rights Plan and $1.8 million of legal and other professional fees in Q1 2015, including legal fees resulting from the SNB event and professional fees related to the Stockholders Rights Plan. (4) Represents the net bad debt expense related to client debit balances associated with the January 15, 2015 SNB event. (5) Represents the gain on the disposition of an equity method investment related to V3 of $0.7M.

9 Sequential Operating Expenses (1) Three Months Ended March 31, 2015 – March 31, 2016 ( unaudited) ($’s in Thousands) (1) These figures are based on Non - GAAP financial results. Please see reconciliations of these measures to the most directly compar able GAAP measures in the previous slide for Three Months Ended March 31, 2016 and Three Months Ended March 31, 2015 and in the appendix to this presentation for Three Months Ended December 31, 2015, Three Months Ended September 30, 2015 and Three Months Ended June 30, 2015. March 31, 2016 December 31, 2015September 30, 2015 June 30, 2015 March 31, 2015 Adj Continuing Ops Adj Continuing Ops Adj Continuing Ops Adj Continuing Ops Adj Continuing Ops Compensation and benefits 24,826$ 20,969$ 23,948$ 23,457$ 25,039$ Referring broker fees 10,646 11,125 13,032 14,601 16,069 Advertising and marketing 5,468 4,516 4,116 3,483 2,817 Communication and technology 7,605 7,473 7,312 9,243 9,517 Trading costs 888 1,005 847 960 1,140 General and administrative 12,615 11,889 11,555 11,520 11,818 Total Operating Expenses 62,048$ 56,977$ 60,810$ 63,264$ 66,400$ Three Months Ended

10 Balance Sheet As of March 31, 2016 and December 31, 2015 ( unaudited, condensed) ($’s in Thousands) March 31, 2016 December 31, 2015 March 31, 2016 December 31, 2015 Assets Liabilities and Stockholders' Deficit Current assets Current liabilities Cash and cash equivalents 208,093$ 203,854$ Customer account liabilities 633,151$ 685,043$ Cash and cash equivalents, held for customers 633,151 685,043 Accounts payable and accrued expenses 37,441 38,298 Due from brokers 280 3,781 Due to brokers 5,523 1,073 Accounts receivable, net 1,406 1,636 Due to related parties pursuant to tax receivable agreement - 145 Other current assets 62 1,766 Current liabilities held for sale 15,045 14,510 Current assets held for sale 200,971 233,937 Total current liabilities 691,160 739,069 Total current assets 1,043,963 1,130,017 Deferred tax liability 505 719 Deferred tax assets 14 14 Senior convertible notes 156,021 154,255 Office, communication and computer equipment, net 36,125 35,891 Credit agreement 157,636 147,262 Goodwill 27,364 28,080 Derivative liability — Letter Agreement 337,627 448,458 Other intangible assets, net 11,819 13,782 Other liabilities 15,121 16,044 Notes receivable 7,881 7,881 Total liabilities 1,358,070 1,505,807 Other assets 10,753 11,421 Stockholders’ Deficit Total assets 1,137,919$ 1,227,086$ Total stockholders’ deficit (220,151) (278,721) Total liabilities and stockholders’ deficit 1,137,919$ 1,227,086$

11 Update – Leucadia Debt / Non - Core Asset Sales ■ Have repaid $117 million of principal due to Leucadia with $193 million outstanding ■ While remaining non - core assets are being actively marketed, we believe greater value can be realized through additional time to complete asset sales Entity FXCM Ownership Notes FXCM Japan 100% Sold for $62M FXCM Hong Kong 100% Sold for $38M FXCM Securities (UK) 100% Sold for $2M FastMatch 35% Institutional JV with Credit Suisse; in process Lucid 50.1% Leading non - bank FX market maker in UK; in process V3 Markets 50.1% Chicago based multi - asset HF proprietary trader; in process

12 180 178 172 176 176 177 160 165 170 175 180 185 Nov-15 Dec-15 Jan-16 Feb-16 Mar-16 Apr-16 Retail Active Accounts $14.2 $14.7 $16.5 $14.7 $12.7 $13.7 $8.0 $10.0 $12.0 $14.0 $16.0 $18.0 Nov-15 Dec-15 Jan-16 Feb-16 Mar-16 Apr-16 Retail ADV US Billions $41 $36 $36 $53 $83 $75 $- $15 $30 $45 $60 $75 $90 Nov-15 Dec-15 Jan-16 Feb-16 Mar-16 Apr-16 Institutional Monthly Trading Volume US Billions $2.0 $1.6 $1.8 $2.5 $3.6 $3.5 $- $0.5 $1.0 $1.5 $2.0 $2.5 $3.0 $3.5 $4.0 Nov-15 Dec-15 Jan-16 Feb-16 Mar-16 Apr-16 Institutional ADV US Billions April 2016 Customer Trading Metrics from Continuing Operations . Thousands 488 501 690 654 563 585 200 400 600 800 Nov-15 Dec-15 Jan-16 Feb-16 Mar-16 Apr-16 Retail DARTs Thousands More information, including historical results for each of the above metrics, can be found on the investor relations page of FXCM's corporate website here: Customer Trading Metrics $298 $323 $331 $309 $291 $287 $200 $250 $300 $350 Nov-15 Dec-15 Jan-16 Feb-16 Mar-16 Apr-16 Retail Monthly Trading Volume US Billions

13 Summary • With initiatives set forth in 2015 and 2016, we have experienced an increase in Revenue per Million and accelerated growth in tradeable accounts in Q1 2016 • FXCM is committed to selling the remaining non - core assets, but we believe greater value can be realized with additional time to complete asset sales • Leucadia has demonstrated its commitment to FXCM to provide greater financial flexibility on the credit agreement, enhance future growth by taking a direct stake in the operations and provide additional marketing strength for FXCM going forward • We continue to work on technology projects to enhance our overall product offering and client base

14 Appendix

15 * See footnotes following Reconciliation of GAAP Reported to Non - GAAP Adjusted Financial Measures* 3 Months Ended March 31, 2016 and 2015 ( 000’s, unaudited) ($’s in Thousands) Continuing Ops Disc Ops Combined Continuing Ops Disc Ops Combined Net income (loss) 90,244$ (31,068)$ 59,176$ (629,396)$ (98,598)$ (727,994)$ EBITDA and Other Adjustments Depreciation and amortization 7,244 - 7,244 7,020 12,359 19,379 Interest on borrowings 20,553 - 20,553 30,559 - 30,559 (Gain) loss on derivative liability - Letter Agreement (110,831) - (110,831) 292,429 - 292,429 Goodwill and held for sale impairment - 31,511 31,511 9,513 81,364 90,877 Income tax provision 582 - 582 179,762 4,900 184,662 EBITDA and Other Adjustments 7,792 443 8,235 (110,113) 25 (110,088) Adjustments Net Revenues (2) 44 - 44 (145,224) - (145,224) Allocation of net income to Lucid members for services provided (3) - 1,201 1,201 - 2,686 2,686 General and administrative (4) 1,486 - 1,486 1,837 - 1,837 Bad debt expense (5) - - - 256,915 8,408 265,323 Gain on disposition of equity method investment (6) - (679) (679) - - - Adjusted EBITDA 9,322$ 965$ 10,287$ 3,415$ 11,119$ 14,534$ Reconciliation of U.S. GAAP Reported to Non-GAAP Adjusted Measures (1) Three Months Ended March 31, 2016 2015
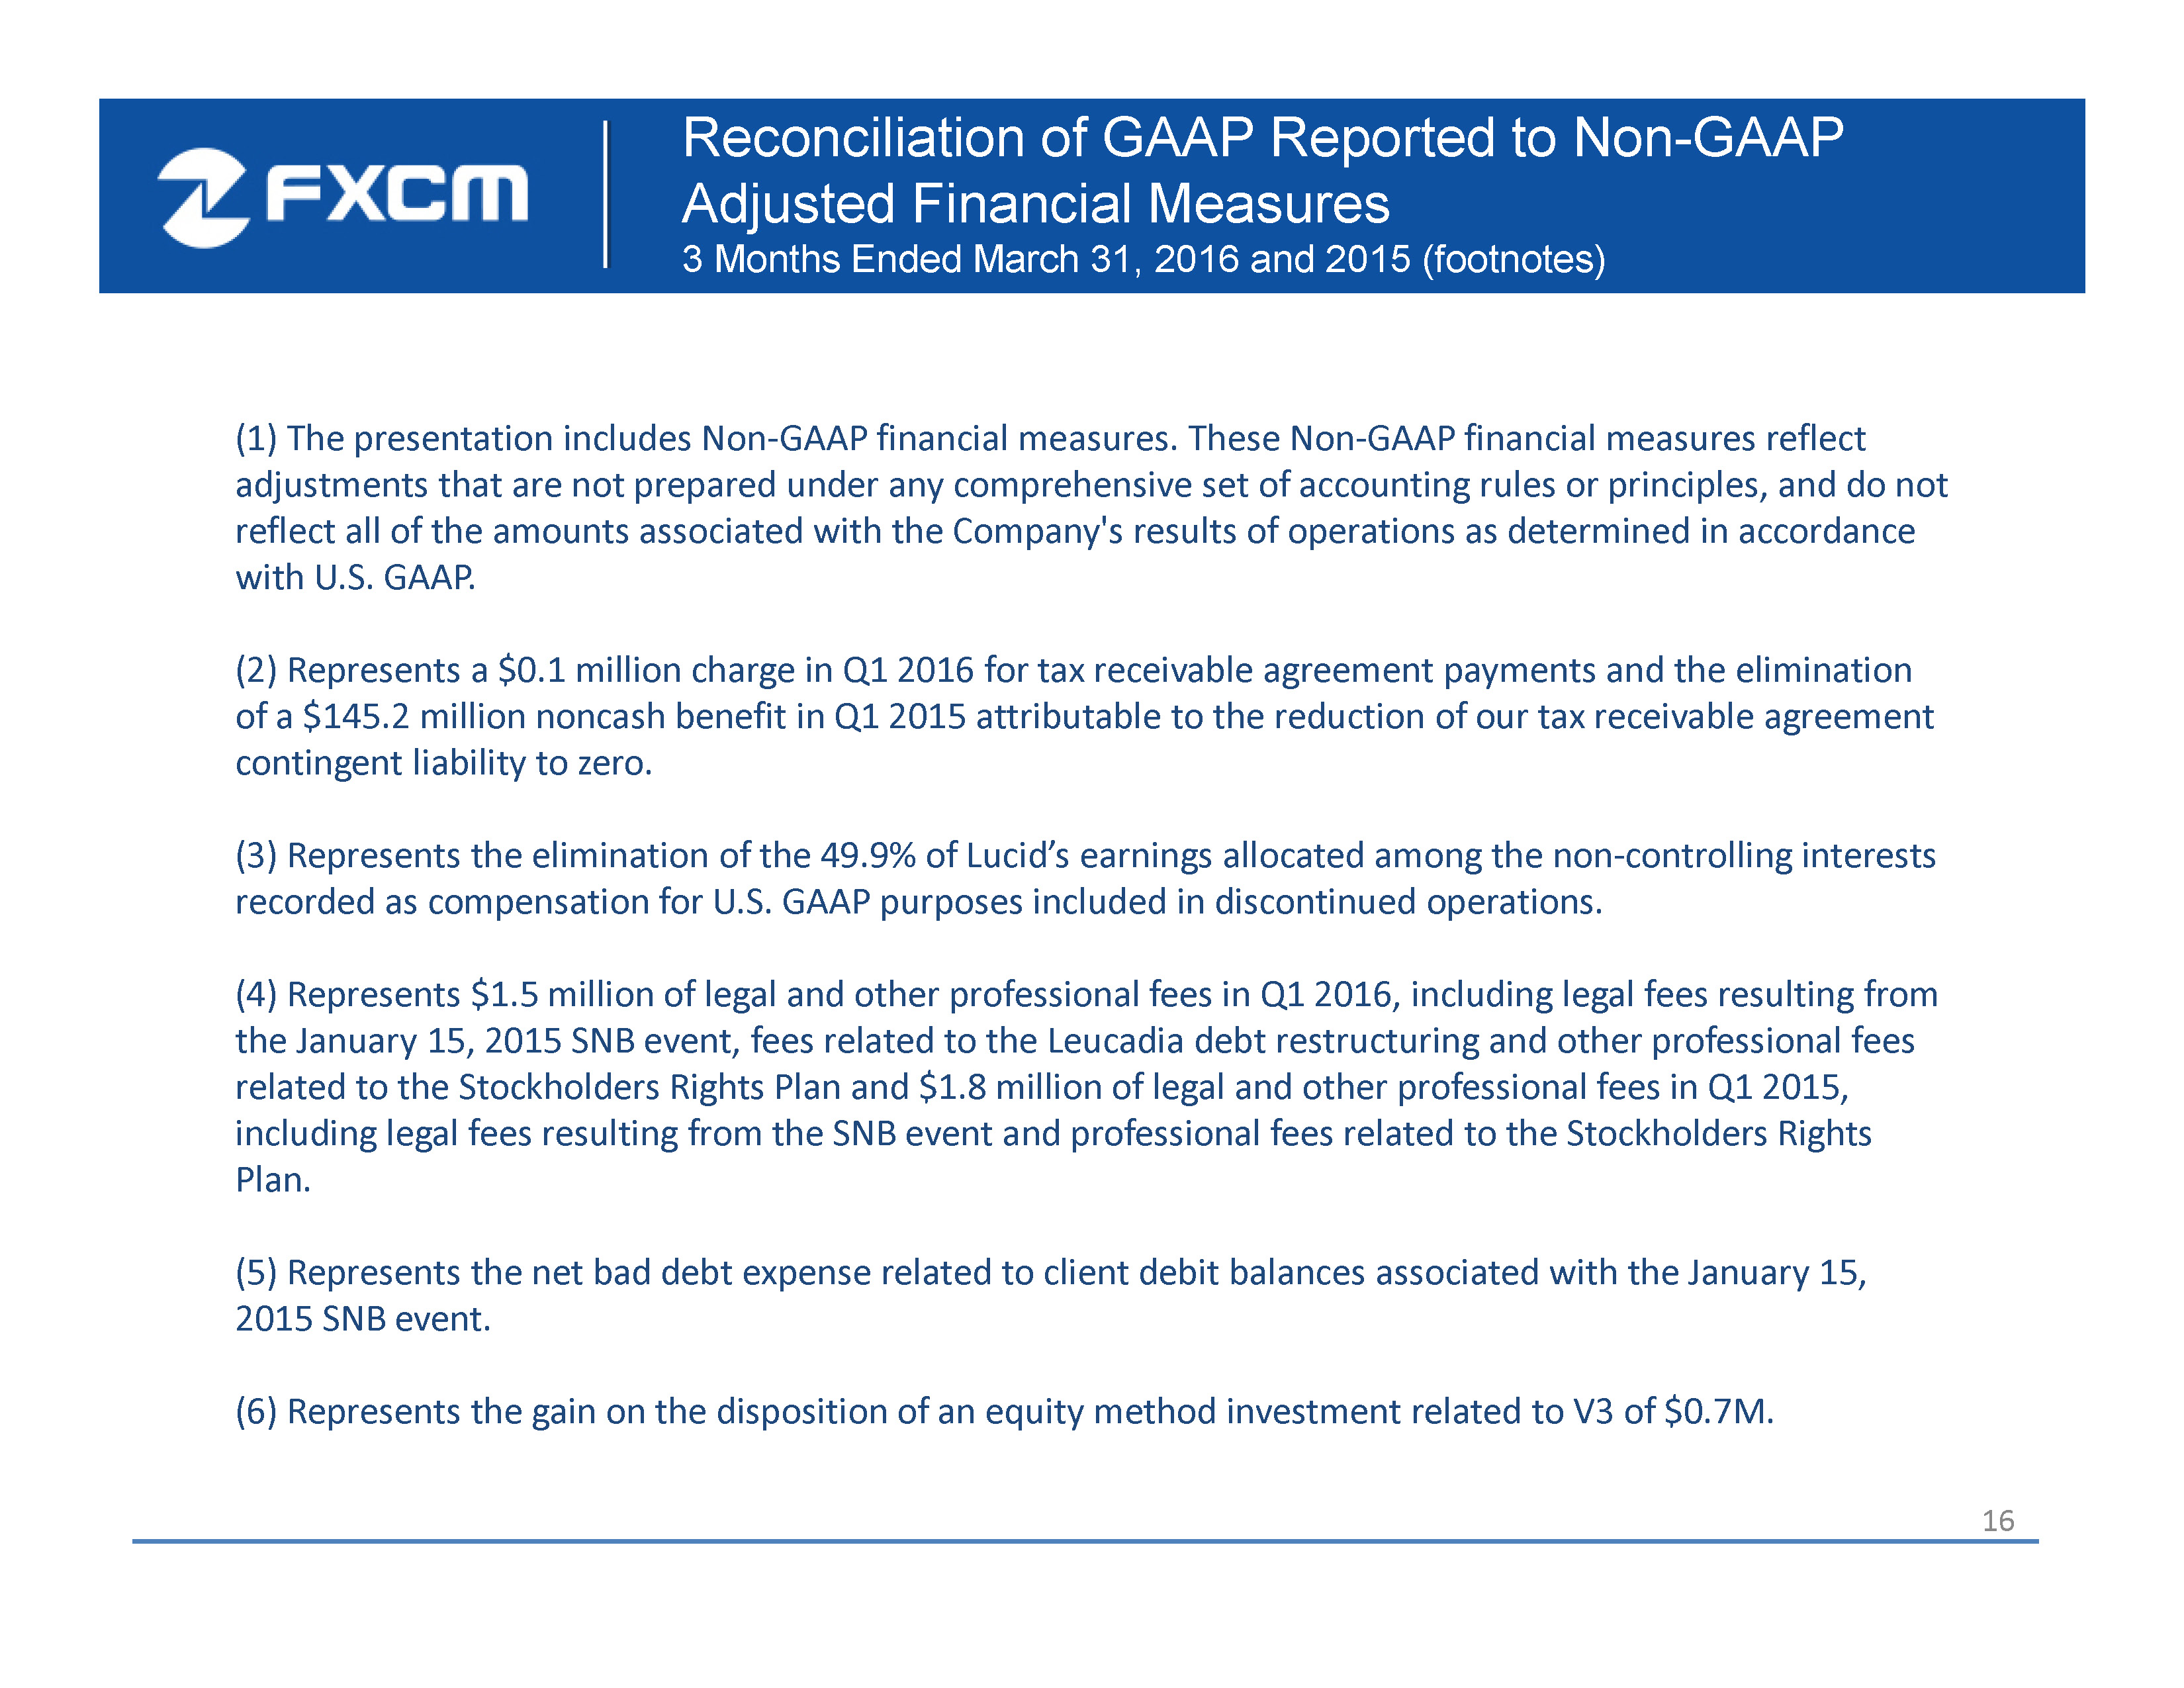
16 Reconciliation of GAAP Reported to Non - GAAP Adjusted Financial Measures 3 Months Ended March 31, 2016 and 2015 (footnotes ) (1) The presentation includes Non - GAAP financial measures. These Non - GAAP financial measures reflect adjustments that are not prepared under any comprehensive set of accounting rules or principles, and do not reflect all of the amounts associated with the Company's results of operations as determined in accordance with U.S. GAAP. (2) Represents a $0.1 million charge in Q1 2016 for tax receivable agreement payments and the elimination of a $145.2 million noncash benefit in Q1 2015 attributable to the reduction of our tax receivable agreement contingent liability to zero. (3) Represents the elimination of the 49.9% of Lucid’s earnings allocated among the non - controlling interests recorded as compensation for U.S. GAAP purposes included in discontinued operations. (4) Represents $1.5 million of legal and other professional fees in Q1 2016, including legal fees resulting from the January 15, 2015 SNB event, fees related to the Leucadia debt restructuring and other professional fees related to the Stockholders Rights Plan and $1.8 million of legal and other professional fees in Q1 2015, including legal fees resulting from the SNB event and professional fees related to the Stockholders Rights Plan. (5 ) Represents the net bad debt expense related to client debit balances associated with the January 15, 2015 SNB event. (6) Represents the gain on the disposition of an equity method investment related to V3 of $0.7M .

17 Financial Summary Three Months Ended December 31, 2015 and 2014 (unaudited ) ($’s in Thousands) Continuing Ops Adjust. Adj Continuing Ops Disc Ops Adjust. Adjusted Combined Continuing Ops Adjust. Adj Continuing Ops Disc Ops Adjust. Adjusted Combined Change in Adjusted Combined Trading Revenue (1) $ 65,370 $ - $ 65,370 $ 11,346 $ - $ 76,716 $ 93,485 $ - $ 93,485 $31,173 $ - $ 124,658 $ (47,942) Interest 366 - 366 25 - 391 297 - 297 80 - 377 14 Other (2) 1,258 145 1,403 898 - 2,301 7,964 (7,103) 861 1,676 - 2,537 (236) Adjusted Total Revenues 66,994 145 67,139 12,269 - 79,408 101,746 (7,103) 94,643 32,929 - 127,572 (48,164) Compensation and benefits (3) 20,969 - 20,969 3,176 - 24,145 19,081 (1,512) 17,569 6,352 - 23,921 224 Referring broker fees 11,125 - 11,125 - - 11,125 24,110 - 24,110 125 - 24,235 (13,110) Advertising and marketing 4,516 - 4,516 - - 4,516 3,328 - 3,328 686 - 4,014 502 Communication and technology 7,473 - 7,473 1,720 - 9,193 8,605 - 8,605 2,107 - 10,712 (1,519) Trading costs 1,005 - 1,005 3,662 - 4,667 2,567 - 2,567 7,004 - 9,571 (4,904) General and administrative (4) 19,202 (7,313) 11,889 2,099 (1,453) 12,535 12,087 - 12,087 1,823 - 13,910 (1,375) Bad debt expense (5) (353) 353 - - - - - - - - - - - Adjusted Operating Expenses 63,937 (6,960) 56,977 10,657 (1,453) 66,181 69,778 (1,512) 68,266 18,097 - 86,363 (20,182) (Loss) gain on equity method investments, net (168) - (168) (446) - (614) (116) - (116) (282) - (398) (216) Adjusted EBITDA $ 2,889 $ 7,105 $ 9,994 $ 1,166 $1,453 $ 12,613 $ 31,852 $(5,591) $ 26,261 $14,550 $ - $ 40,811 $ (28,198) Three Months Ended December 31, 2015 Three Months Ended December 31, 2014 Footnotes: (1) Included in Q4 2015 continuing ops is $63.7 million from Retail and $1.6 million from FXCM Pro. Included in Q4 2015 discontinued ops is $4.7 million from Lucid and $6.6 million from V3. Included in Q4 2014 continuing ops is $83.9 million from Retail and $9.5 million from FXCM Pro. Included in Q4 2014 discontinued ops is $9.9 million from Retail, $13.1 million from Lucid, $6.2 million from V3 and $2.0 million from Faros. (2) Represents the $0.1 million charge in Q4 2015 and the elimination of a $7.1 million benefit in Q4 2014 attributable to the remeasurement of our tax receivable agreement liability to reflect a revised effective tax rate. (3) Represents the elimination of stock-based compensation associated with the IPO of $1.5 million in Q4 2014. (4) Represents the elimination of a $6.8 million reserve recorded against an uncollected broker receivable, $0.8 million of legal fees resulting from the January 15, 2015 SNB event and other professional fees, $0.5 million of costs related to the cyber incident and a recovery of $0.8 million related to a settlement related to a settlement of a lawsuit, all recorded in continuing operations for Q4 2015, and a $1.5 million reserve for restitution related to pre-August 2010 trade execution practices recorded in discontinued operations in Q4 2015. (5) Represents a recovery against the net bad debt expense related to client debit balances associated with the January 15, 2015 SNB event.

18 Financial Summary Three Months Ended September 30, 2015 and 2014 (unaudited ) ($’s in Thousands) Continuing Ops Adjust. Adj Continuing Ops Disc Ops Adjust. Adjusted Combined Continuing Ops Adjust. Adj Continuing Ops Disc Ops Adjust. Adjusted Combined Change in Adjusted Combined Trading Revenue (1) $ 56,247 $ - $ 56,247 $ 13,386 $ - $ 69,633 $ 88,696 $ - $ 88,696 $23,547 $ - $ 112,243 $ (42,610) Interest 282 - 282 - - 282 345 - 345 93 - 438 (156) Other (2) 3,053 - 3,053 1,430 - 4,483 2,344 (360) 1,984 1,122 - 3,106 1,377 Adjusted Total Revenues 59,582 - 59,582 14,816 - 74,398 91,385 (360) 91,025 24,762 - 115,787 (41,389) Compensation and benefits (3) 23,948 - 23,948 731 - 24,679 23,317 (2,232) 21,085 4,255 - 25,340 (661) Referring broker fees 13,032 - 13,032 - - 13,032 20,735 - 20,735 263 - 20,998 (7,966) Advertising and marketing 4,116 - 4,116 15 - 4,131 4,067 - 4,067 1,004 - 5,071 (940) Communication and technology 7,312 - 7,312 2,061 - 9,373 10,451 - 10,451 2,983 - 13,434 (4,061) Trading costs 847 - 847 4,178 - 5,025 2,394 - 2,394 5,627 - 8,021 (2,996) General and administrative (4) 12,861 (1,306) 11,555 978 - 12,533 14,872 (3,116) 11,756 2,347 - 14,103 (1,570) Adjusted Operating Expenses 62,116 (1,306) 60,810 7,963 - 68,773 75,836 (5,348) 70,488 16,479 - 86,967 (18,194) (Loss) gain on equity method investments, net (111) - (111) (320) - (431) (137) - (137) (239) - (376) (55) Adjusted EBITDA $ (2,645) $ 1,306 $ (1,339) $ 6,533 $ - $ 5,194 $ 15,412 $4,988 $ 20,400 $ 8,044 $ - $ 28,444 $ (23,250) Three Months Ended September 30, 2015 Three Months Ended September 30, 2014 Footnotes: (1) Included in Q3 2015 continuing ops is $54.2 million from Retail and $2.1 million from FXCM Pro. Included in Q3 2015 discontinued ops is $1.1 million from Retail, $10.4 million from Lucid and $1.9 million from V3. Included in Q3 2014 continuing ops is $81.3 million from Retail and $7.4 million from FXCM Pro. Included in Q3 2014 discontinued ops is $6.7 million from Retail, $11.0 million from Lucid, $5.4 million from V3 and $0.5 million from Faros. (2) Represents the elimination of a $0.4 million benefit in Q3 2014 attributable to the remeasurement of our tax receivable agreement liability to reflect a revised effective tax rate. (3) Represents the elimination of stock-based compensation associated with the IPO of $2.2 million in Q3 2014. (4) Represents regulatory and professional fees of $1.3 million in Q3 2015 including $0.2 million of costs related to the cyber security incident, the net expense relating to pre-August 2010 trade execution practices and other regulatory fees and fines of $0.8 million in Q3 2014 and the $2.3 million charge related to a put option payment for Online Courses in Q3 2014.

19 Financial Summary Three Months Ended June 30, 2015 and 2014 ( unaudited) ($’s in Thousands) Continuing Ops Adjust. Adj Continuing Ops Disc Ops Adjust. Adjusted Combined Continuing Ops Adjust. Adj Continuing Ops Disc Ops Adjust. Adjusted Combined Change in Adjusted Combined Trading Revenue (1) $ 59,211 $ - $ 59,211 $ 20,486 $ - $ 79,697 $ 74,427 $ - $ 74,427 $21,096 $ - $ 95,523 $ (15,826) Interest 243 - 243 (5) - 238 381 - 381 148 - 529 (291) Other 1,058 - 1,058 977 - 2,035 279 - 279 1,596 - 1,875 160 Adjusted Total Revenues 60,512 - 60,512 21,458 - 81,970 75,087 - 75,087 22,840 - 97,927 (15,957) - Compensation and benefits (2) 23,457 - 23,457 3,766 - 27,223 24,371 (2,232) 22,139 4,450 - 26,589 634 Referring broker fees 14,601 - 14,601 - - 14,601 16,111 - 16,111 383 - 16,494 (1,893) Advertising and marketing 3,483 - 3,483 209 - 3,692 6,198 - 6,198 886 - 7,084 (3,392) Communication and technology 9,243 - 9,243 2,180 - 11,423 8,662 - 8,662 3,370 - 12,032 (609) Trading costs 960 - 960 4,790 - 5,750 1,855 - 1,855 6,175 - 8,030 (2,280) General and administrative (3) 12,718 (1,198) 11,520 1,242 - 12,762 13,340 (1,544) 11,796 2,271 - 14,067 (1,305) Bad debt expense (4) 388 (388) - - - - - - - - - - - Adjusted Operating Expenses 64,850 (1,586) 63,264 12,187 - 75,451 70,537 (3,776) 66,761 17,535 - 84,296 (8,845) (Loss) gain on equity method investments, net (37) - (37) (576) - (613) (81) - (81) (143) - (224) (389) Adjusted EBITDA $ (4,375) $ 1,586 $ (2,789) $ 8,695 $ - $ 5,906 $ 4,469 $3,776 $ 8,245 $ 5,162 $ - $ 13,407 $ (7,501) Three Months Ended June 30, 2015 Three Months Ended June 30, 2014 Footnotes: (1) Included in Q2 2015 continuing ops is $54.3 million from Retail and $4.9 million from FXCM Pro. Included in Q2 2015 discontinued ops is $2.5 million from Retail, $9.5 million from Lucid, $8.2 million from V3 and $0.3 million from Faros. Included in Q2 2014 continuing ops is $69.0 million from Retail and $5.4 million from FXCM Pro. Included in Q2 2014 discontinued ops is $4.7 million from Retail, $11.8 million from Lucid, $4.4 million from V3 and $0.2 million from Faros. (2) Represents the elimination of stock-based compensation associated with the IPO of $2.2 million in Q2 2014. (3) Represents legal fees resulting from the January 15, 2015 SNB event of $1.2 million in Q2 2015, the net expense relating to pre-August 2010 trade execution practices and other regulatory fees and fines of $0.2 million in Q2 2014 and the $1.3 million charge related to a put option payment for Online Courses in Q2 2014. (4) Represents the net bad debt expense related to client debit balances associated with the January 15, 2015 SNB event.
Serious News for Serious Traders! Try StreetInsider.com Premium Free!
You May Also Be Interested In
- Discover New Africa, Explore New Opportunities Phoenix Global Development Forum for Enterprises Held in Tanzania
- EGE Exchange Highlights AI Operations Software as Data Centers Grow Denser and Harder to Manage
- Ethereum Price Prediction: ETH Faces $2,800 Resistance as AlphaPepe Builds a $2.87M Presale Around AI Trading
Create E-mail Alert Related Categories
SEC FilingsSign up for StreetInsider Free!
Receive full access to all new and archived articles, unlimited portfolio tracking, e-mail alerts, custom newswires and RSS feeds - and more!
