

Form 8-K FLUSHING FINANCIAL CORP For: Aug 03
 Tweet
Tweet Share
ShareExhibit 99.1
| “Small Enough To Know You. Large Enough To Help You.” KBW Community Bank Investor Conference August 4, 2021 “Small Enough To Know You. Large Enough To Help You.” |

| Safe Harbor Statement “Safe Harbor” Statement under the Private Securities Litigation Reform Act of 1995: Statements in this Presentation relating to plans, strategies, economic performance and trends, projections of results of specific activities or investments and other statements that are not descriptions of historical facts may be forward- looking statements within the meaning of the Private Securities Litigation Reform Act of 1995, Section 27A of the Securities Act of 1933 and Section 21E of the Securities Exchange Act of 1934. Forward-looking information is inherently subject to risks and uncertainties, and actual results could differ materially from those currently anticipated due to a number of factors, which include, but are not limited to, risk factors discussed in the Company’s Annual Report on Form 10-K for the fiscal year ended December 31, 2020 and in other documents filed by the Company with the Securities and Exchange Commission from time to time. Forward- looking statements may be identified by terms such as “may”, “will”, “should”, “could”, “expects”, “plans”, “intends”, “anticipates”, “believes”, “estimates”, “predicts”, “forecasts”, “goals”, “potential” or “continue” or similar terms or the negative of these terms. Although we believe that the expectations reflected in the forward- looking statements are reasonable, we cannot guarantee future results, levels of activity, performance or achievements. The Company has no obligation to update these forward-looking statements. 2 |
| Key Messages Conservative Underwriting with History of Solid Value Creation 3 ► Leading Community Bank in the Greater NYC Area ► Well Diversified Loan Portfolio ► History of Sound Credit Quality since IPO in 1995 ► Asian Banking Niche ► 1MM Increase in Share Repurchase Authorization |

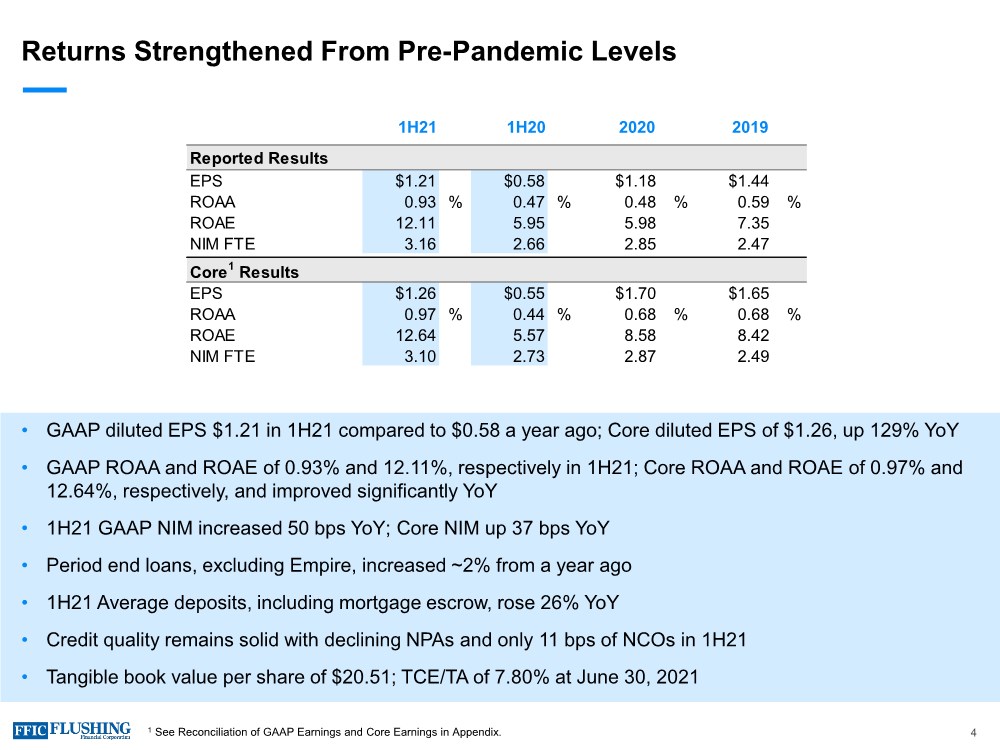
| Returns Strengthened From Pre-Pandemic Levels • GAAP diluted EPS $1.21 in 1H21 compared to $0.58 a year ago; Core diluted EPS of $1.26, up 129% YoY • GAAP ROAA and ROAE of 0.93% and 12.11%, respectively in 1H21; Core ROAA and ROAE of 0.97% and 12.64%, respectively, and improved significantly YoY • 1H21 GAAP NIM increased 50 bps YoY; Core NIM up 37 bps YoY • Period end loans, excluding Empire, increased ~2% from a year ago • 1H21 Average deposits, including mortgage escrow, rose 26% YoY • Credit quality remains solid with declining NPAs and only 11 bps of NCOs in 1H21 • Tangible book value per share of $20.51; TCE/TA of 7.80% at June 30, 2021 4 Reported Results EPS $1.21 $0.58 $1.18 $1.44 ROAA 0.93 % 0.47 % 0.48 % 0.59 % ROAE 12.11 5.95 5.98 7.35 NIM FTE 3.16 2.66 2.85 2.47 Core1 Results EPS $1.26 $0.55 $1.70 $1.65 ROAA 0.97 % 0.44 % 0.68 % 0.68 % ROAE 12.64 5.57 8.58 8.42 NIM FTE 3.10 2.73 2.87 2.49 1H20 1H21 2020 2019 1 See Reconciliation of GAAP Earnings and Core Earnings in Appendix. |
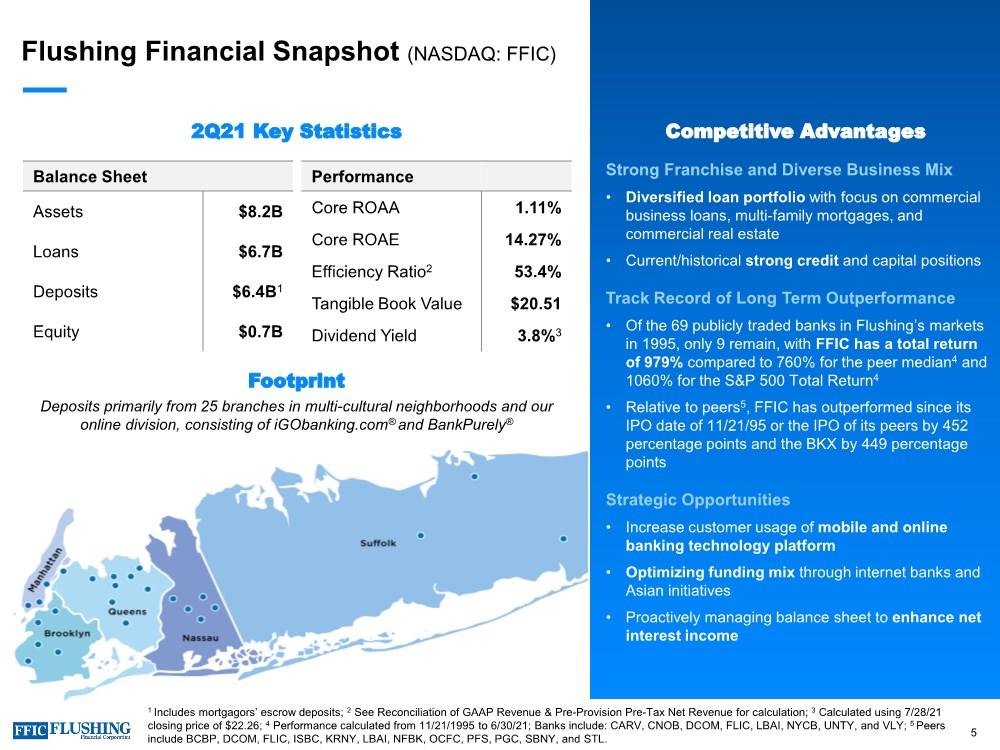
| Flushing Financial Snapshot (NASDAQ: FFIC) Competitive Advantages Balance Sheet Assets $8.2B Loans $6.7B Deposits $6.4B1 Equity $0.7B Performance Core ROAA 1.11% Core ROAE 14.27% Efficiency Ratio2 53.4% Tangible Book Value $20.51 Dividend Yield 3.8%3 2Q21 Key Statistics Footprint Deposits primarily from 25 branches in multi-cultural neighborhoods and our online division, consisting of iGObanking.com® and BankPurely® 5 Strong Franchise and Diverse Business Mix • Diversified loan portfolio with focus on commercial business loans, multi-family mortgages, and commercial real estate • Current/historical strong credit and capital positions Track Record of Long Term Outperformance • Of the 69 publicly traded banks in Flushing’s markets in 1995, only 9 remain, with FFIC has a total return of 979% compared to 760% for the peer median4 and 1060% for the S&P 500 Total Return4 • Relative to peers5, FFIC has outperformed since its IPO date of 11/21/95 or the IPO of its peers by 452 percentage points and the BKX by 449 percentage points Strategic Opportunities • Increase customer usage of mobile and online banking technology platform • Optimizing funding mix through internet banks and Asian initiatives • Proactively managing balance sheet to enhance net interest income 1 Includes mortgagors’ escrow deposits; 2 See Reconciliation of GAAP Revenue & Pre-Provision Pre-Tax Net Revenue for calculation; 3 Calculated using 7/28/21 closing price of $22.26; 4 Performance calculated from 11/21/1995 to 6/30/21; Banks include: CARV, CNOB, DCOM, FLIC, LBAI, NYCB, UNTY, and VLY; 5 Peers include BCBP, DCOM, FLIC, ISBC, KRNY, LBAI, NFBK, OCFC, PFS, PGC, SBNY, and STL. |
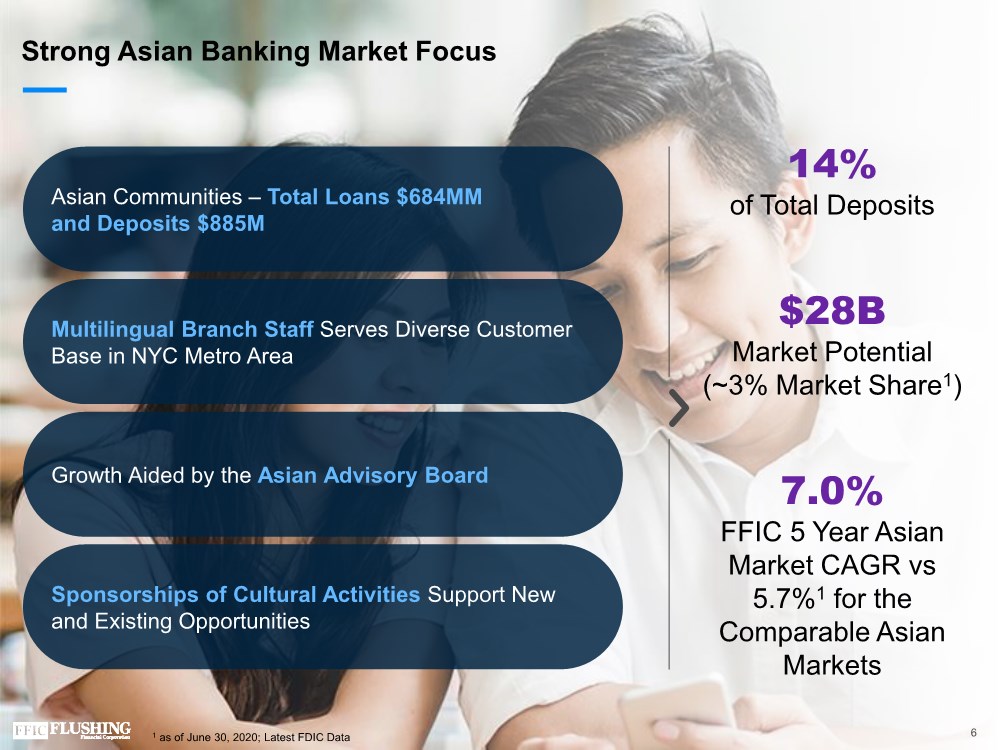
| 14% of Total Deposits $28B Market Potential (~3% Market Share1) 7.0% FFIC 5 Year Asian Market CAGR vs 5.7%1 for the Comparable Asian Markets Asian Communities – Total Loans $684MM and Deposits $885M Multilingual Branch Staff Serves Diverse Customer Base in NYC Metro Area Growth Aided by the Asian Advisory Board Sponsorships of Cultural Activities Support New and Existing Opportunities Strong Asian Banking Market Focus 6 1 as of June 30, 2020; Latest FDIC Data |
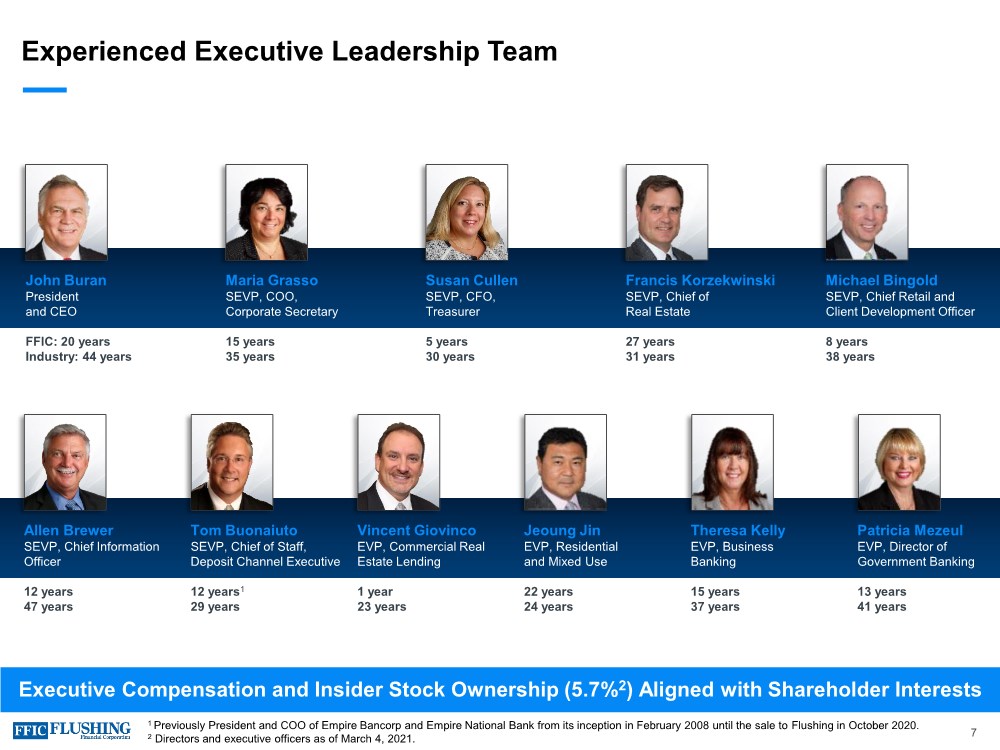
| Experienced Executive Leadership Team Executive Compensation and Insider Stock Ownership (5.7%2) Aligned with Shareholder Interests John Buran President and CEO Maria Grasso SEVP, COO, Corporate Secretary Susan Cullen SEVP, CFO, Treasurer Francis Korzekwinski SEVP, Chief of Real Estate Michael Bingold SEVP, Chief Retail and Client Development Officer FFIC: 20 years Industry: 44 years 15 years 35 years 5 years 30 years 27 years 31 years 8 years 38 years Allen Brewer SEVP, Chief Information Officer Tom Buonaiuto SEVP, Chief of Staff, Deposit Channel Executive Vincent Giovinco EVP, Commercial Real Estate Lending Jeoung Jin EVP, Residential and Mixed Use Theresa Kelly EVP, Business Banking Patricia Mezeul EVP, Director of Government Banking 12 years 47 years 12 years1 29 years 1 year 23 years 22 years 24 years 15 years 37 years 13 years 41 years 1 Previously President and COO of Empire Bancorp and Empire National Bank from its inception in February 2008 until the sale to Flushing in October 2020. 2 Directors and executive officers as of March 4, 2021. 7 |
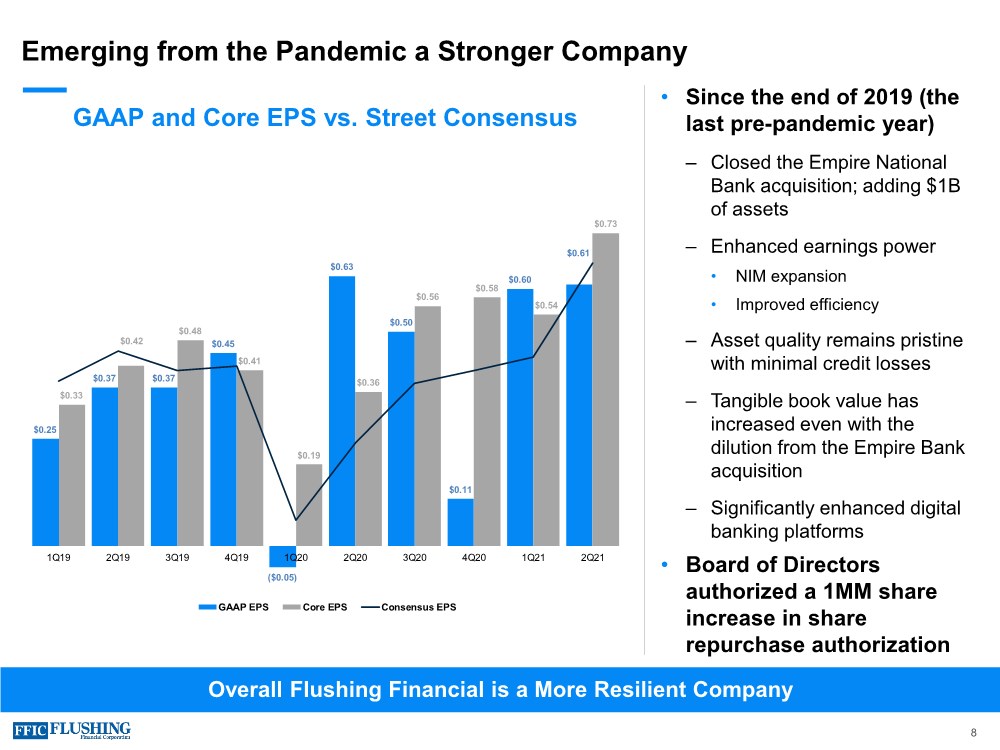
| Emerging from the Pandemic a Stronger Company 8 GAAP and Core EPS vs. Street Consensus $0.25 $0.37 $0.37 $0.45 ($0.05) $0.63 $0.50 $0.11 $0.60 $0.61 $0.33 $0.42 $0.48 $0.41 $0.19 $0.36 $0.56 $0.58 $0.54 $0.73 ( $0. 10) $0.00 $0.10 $0.20 $0.30 $0.40 $0.50 $0.60 $0.70 1Q19 2Q19 3Q19 4Q19 1Q20 2Q20 3Q20 4Q20 1Q21 2Q21 GAAP EPS Core EPS Consensus EPS • Since the end of 2019 (the last pre-pandemic year) ‒ Closed the Empire National Bank acquisition; adding $1B of assets ‒ Enhanced earnings power • NIM expansion • Improved efficiency ‒ Asset quality remains pristine with minimal credit losses ‒ Tangible book value has increased even with the dilution from the Empire Bank acquisition ‒ Significantly enhanced digital banking platforms • Board of Directors authorized a 1MM share increase in share repurchase authorization Overall Flushing Financial is a More Resilient Company |
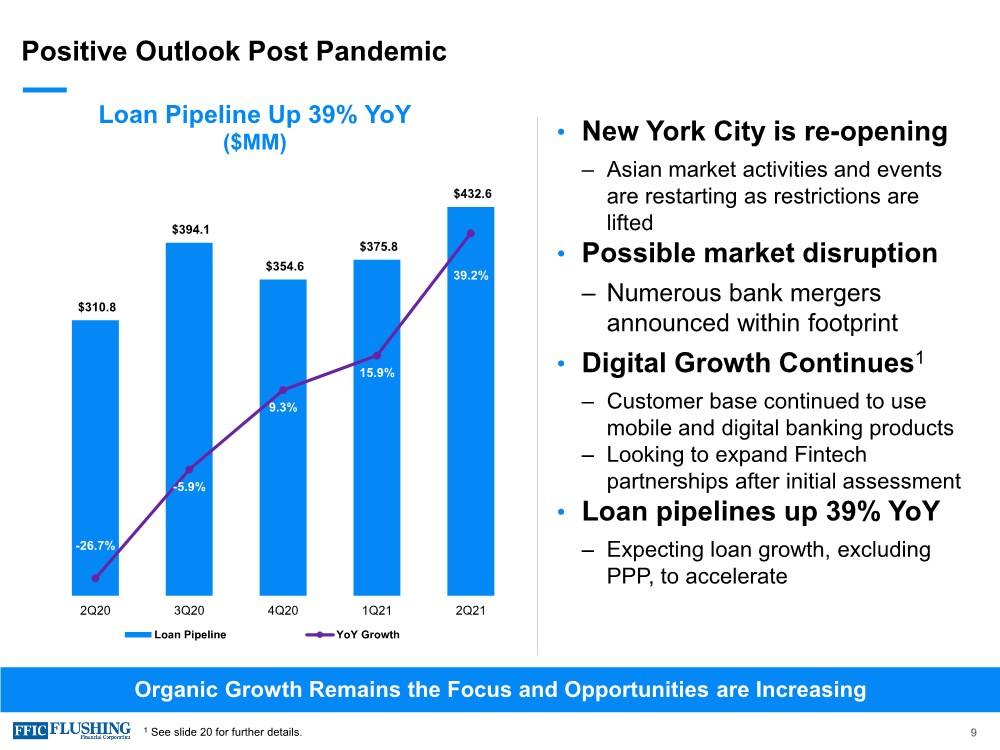
| Positive Outlook Post Pandemic 9 Loan Pipeline Up 39% YoY ($MM) • New York City is re-opening ‒ Asian market activities and events are restarting as restrictions are lifted • Possible market disruption ‒ Numerous bank mergers announced within footprint • Digital Growth Continues1 ‒ Customer base continued to use mobile and digital banking products ‒ Looking to expand Fintech partnerships after initial assessment • Loan pipelines up 39% YoY ‒ Expecting loan growth, excluding PPP, to accelerate Organic Growth Remains the Focus and Opportunities are Increasing $310.8 $394.1 $354.6 $375.8 $432.6 -26.7% -5.9% 9.3% 15.9% 39.2% -30.0% -20.0% -10.0% 0.0% 10.0% 20.0% 30.0% 40.0% 50.0% $15.0 $65.0 $115.0 $165.0 $215.0 $265.0 $315.0 $365.0 $415.0 $465.0 2Q20 3Q20 4Q20 1Q21 2Q21 Loan Pipeline YoY Growth 1 See slide 20 for further details. |
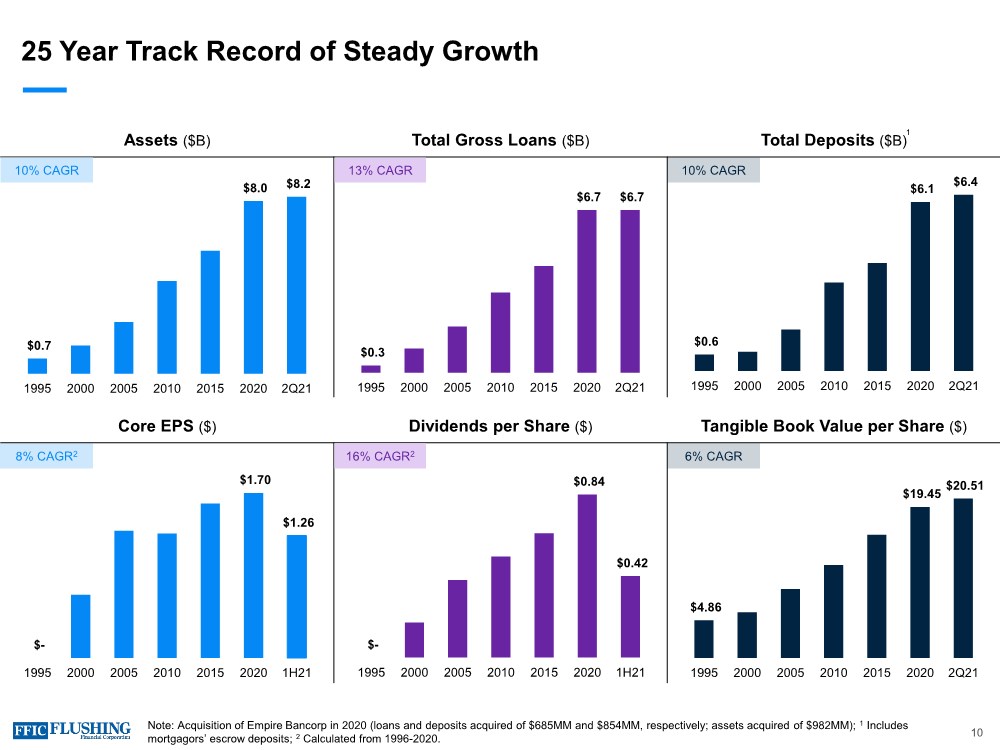
| Core EPS ($) Dividends per Share ($) Tangible Book Value per Share ($) Assets ($B) Total Gross Loans ($B) Total Deposits ($B) $- $0.84 $0.42 1995 2000 2005 2010 2015 2020 1H21 $- $1.70 $1.26 1995 2000 2005 2010 2015 2020 1H21 $0.6 $6.1 $6.4 1995 2000 2005 2010 2015 2020 2Q21 $0.3 $6.7 $6.7 1995 2000 2005 2010 2015 2020 2Q21 $0.7 $8.0 $8.2 1995 2000 2005 2010 2015 2020 2Q21 10% CAGR 10% CAGR 25 Year Track Record of Steady Growth 1 13% CAGR 8% CAGR2 16% CAGR2 $4.86 $19.45 $20.51 1995 2000 2005 2010 2015 2020 2Q21 6% CAGR 10 Note: Acquisition of Empire Bancorp in 2020 (loans and deposits acquired of $685MM and $854MM, respectively; assets acquired of $982MM); 1 Includes mortgagors’ escrow deposits; 2 Calculated from 1996-2020. |
| Strategic Objectives ENSURE appropriate risk- adjusted returns for loans while optimizing cost of funds MAINTAIN strong historical loan growth ENHANCE core earnings power by improving scalability and efficiency MANAGE asset quality with consistently disciplined underwriting 1 2 3 4 11 |

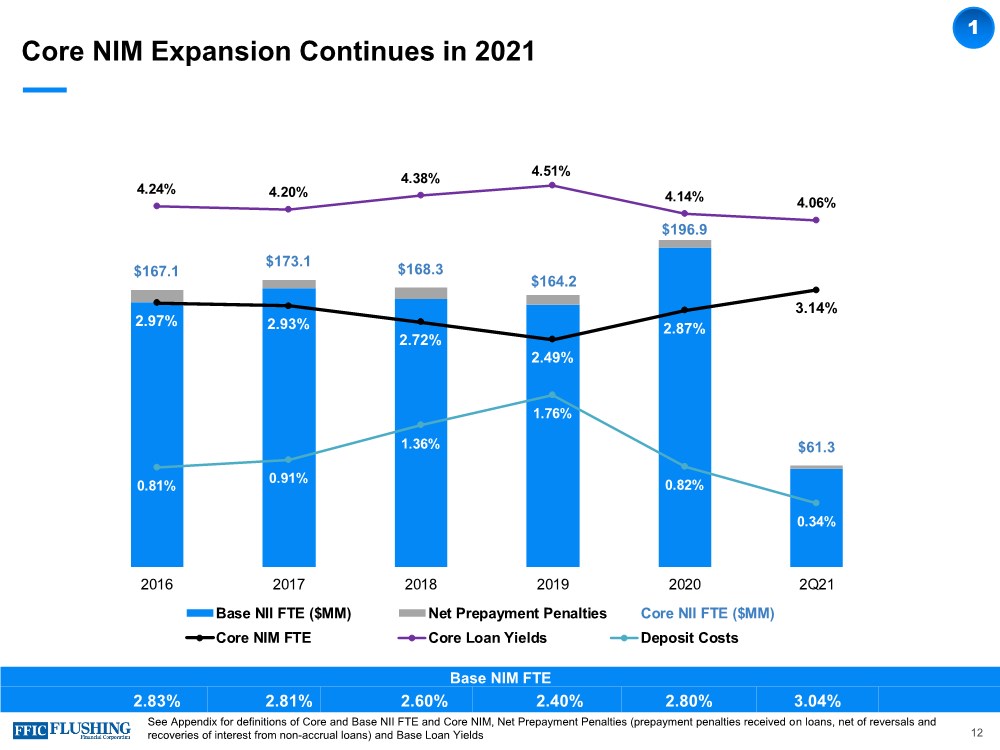
| Core NIM Expansion Continues in 2021 12 1 See Appendix for definitions of Core and Base NII FTE and Core NIM, Net Prepayment Penalties (prepayment penalties received on loans, net of reversals and recoveries of interest from non-accrual loans) and Base Loan Yields $167.1 $173.1 $168.3 $164.2 $196.9 $61.3 2.97% 2.93% 2.72% 2.49% 2.87% 3.14% 4.24% 4.20% 4.38% 4.51% 4.14% 4.06% 0.81% 0.91% 1.36% 1.76% 0.82% 0.34% -0.50% 0.50% 1.50% 2.50% 3.50% 4.50% 5.50% $0.0 $50.0 $100.0 $150.0 $200.0 $250.0 2016 2017 2018 2019 2020 2Q21 Base NII FTE ($MM) Net Prepayment Penalties Core NII FTE ($MM) Core NIM FTE Core Loan Yields Deposit Costs Base NIM FTE 2.83% 2.81% 2.60% 2.40% 2.80% 3.04% |
| Forward Starting Swaps Help Protect NIM from Rising Short-Term Rates • NIM stability as assets reprice slower than liabilities • Our balance sheet naturally improves over the next two years without any actions and we can take, or have already taken, the following actions ‒ $592MM of effective swaps at 1.95% that pull down the NIM; the majority mature by the end of 2023 ‒ $405MM of forward starting swaps at 0.77% that largely replace the current effective swaps ‒ On average the forward starting swaps begin in early 4Q22, which is ahead of the Fed’s timing on rate increases in 2023 ‒ Extending the duration of liabilities to better match our assets; we will take further actions opportunistically ‒ Continue to grow C&I portfolio and use back-to-back loan swap program to add shorter duration loans 13 1 |
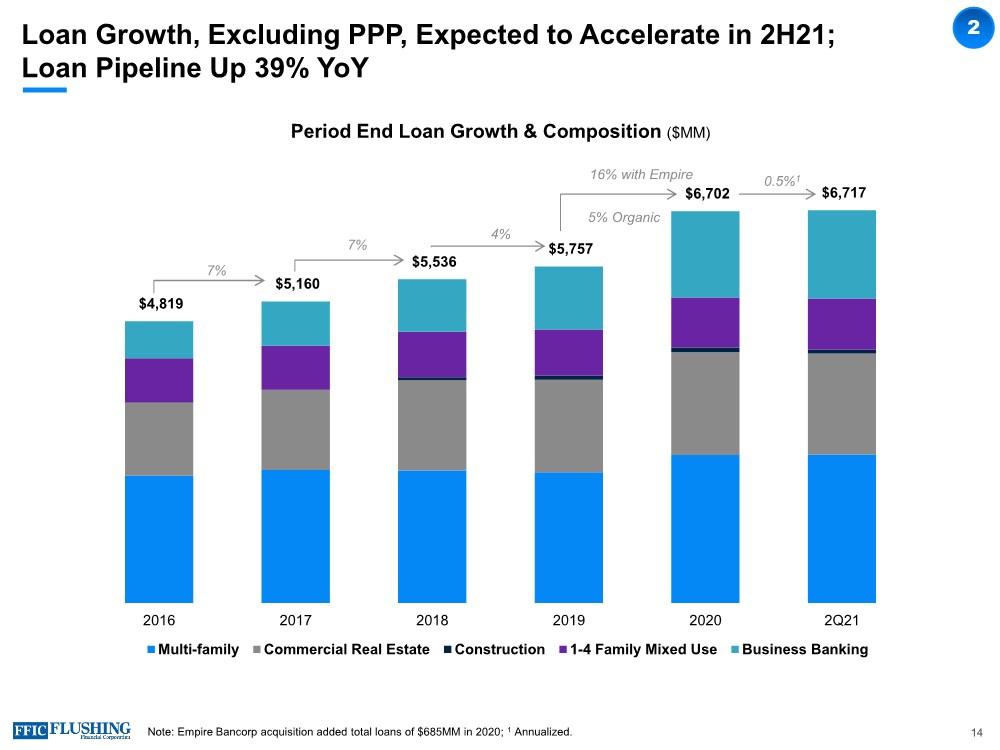
| Loan Growth, Excluding PPP, Expected to Accelerate in 2H21; Loan Pipeline Up 39% YoY 2 $4,819 $5,160 $5,536 $5,757 $6,702 $6,717 $- $1,000 $2,000 $3,000 $4,000 $5,000 $6,000 $7,000 $8,000 $- $1,000 $2,000 $3,000 $4,000 $5,000 $6,000 $7,000 $8,000 2016 2017 2018 2019 2020 2Q21 Multi-family Commercial Real Estate Construction 1-4 Family Mixed Use Business Banking 5% Organic 0.5%1 Period End Loan Growth & Composition ($MM) 7% 7% 4% 16% with Empire 14 Note: Empire Bancorp acquisition added total loans of $685MM in 2020; 1 Annualized. |
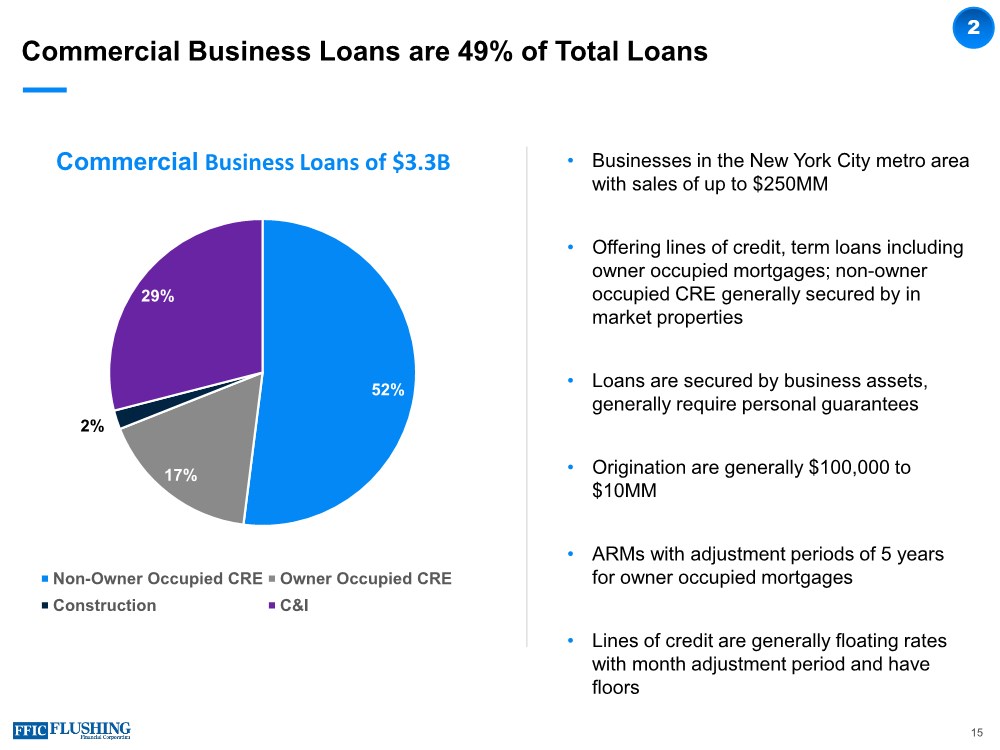
| Commercial Business Loans are 49% of Total Loans • Businesses in the New York City metro area with sales of up to $250MM • Offering lines of credit, term loans including owner occupied mortgages; non-owner occupied CRE generally secured by in market properties • Loans are secured by business assets, generally require personal guarantees • Origination are generally $100,000 to $10MM • ARMs with adjustment periods of 5 years for owner occupied mortgages • Lines of credit are generally floating rates with month adjustment period and have floors 15 52% 17% 2% 29% Non-Owner Occupied CRE Owner Occupied CRE Construction C&I Commercial Business Loans of $3.3B 2 |
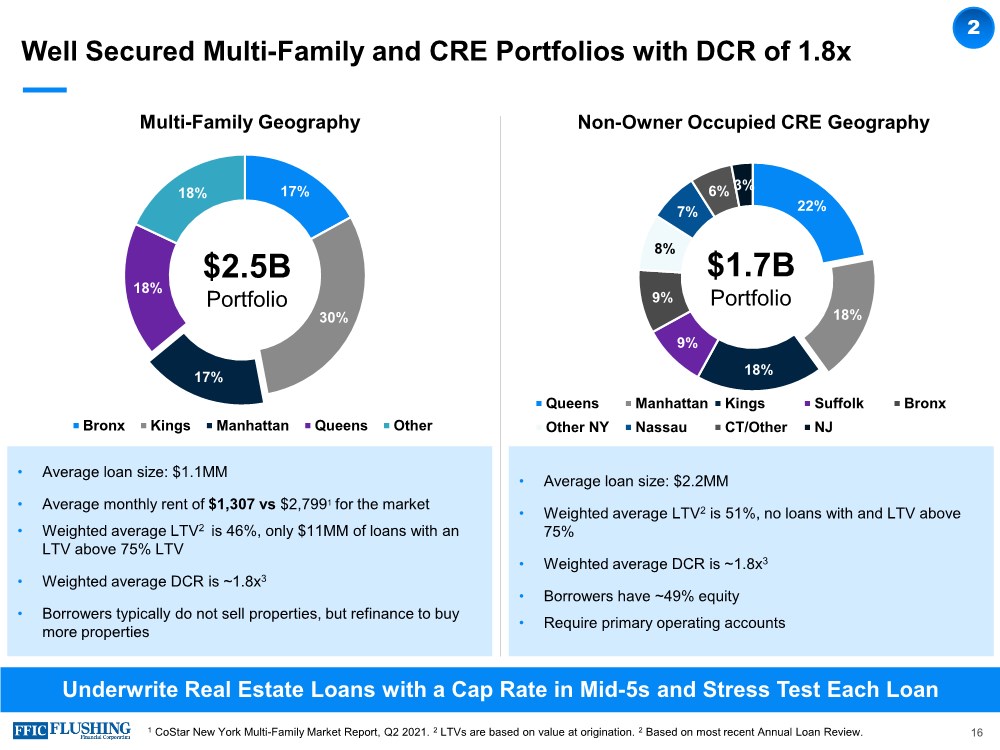
| Well Secured Multi-Family and CRE Portfolios with DCR of 1.8x 16 Underwrite Real Estate Loans with a Cap Rate in Mid-5s and Stress Test Each Loan Multi-Family Geography 17% 30% 17% 18% 18% Bronx Kings Manhattan Queens Other $2.5B Portfolio • Average loan size: $1.1MM • Average monthly rent of $1,307 vs $2,7991 for the market • Weighted average LTV2 is 46%, only $11MM of loans with an LTV above 75% LTV • Weighted average DCR is ~1.8x3 • Borrowers typically do not sell properties, but refinance to buy more properties • Average loan size: $2.2MM • Weighted average LTV2 is 51%, no loans with and LTV above 75% • Weighted average DCR is ~1.8x3 • Borrowers have ~49% equity • Require primary operating accounts Non-Owner Occupied CRE Geography 22% 18% 18% 9% 9% 8% 7% 6% 3% Queens Manhattan Kings Suffolk Bronx Other NY Nassau CT/Other NJ $1.7B Portfolio 1 CoStar New York Multi-Family Market Report, Q2 2021. 2 LTVs are based on value at origination. 2 Based on most recent Annual Loan Review. 2 |
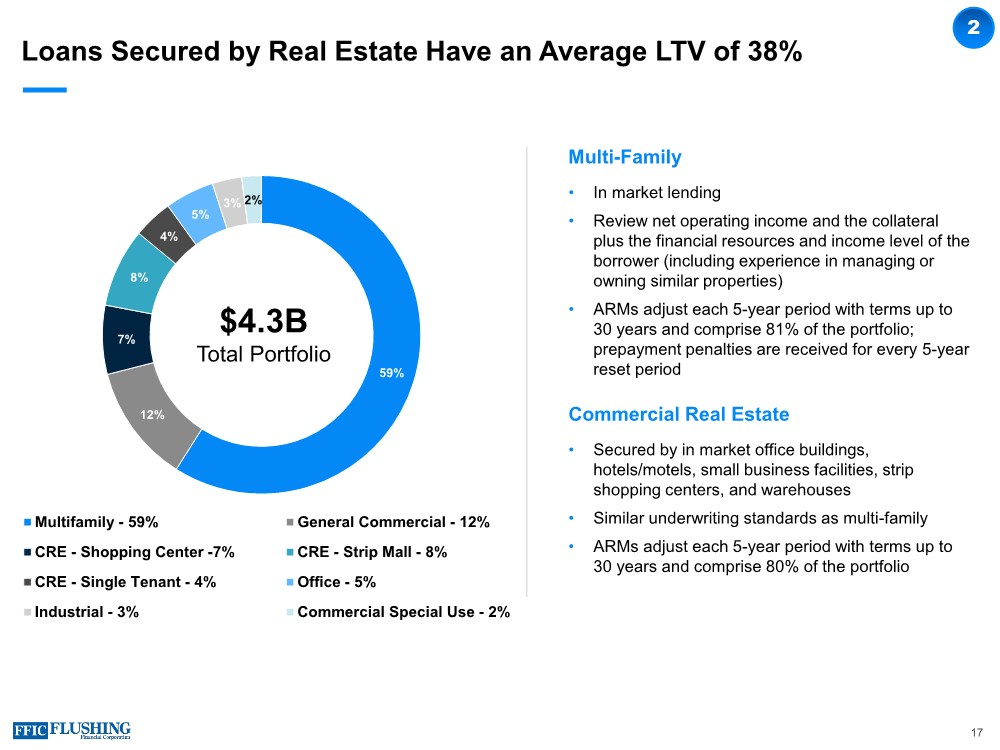
| Loans Secured by Real Estate Have an Average LTV of 38% Multi-Family • In market lending • Review net operating income and the collateral plus the financial resources and income level of the borrower (including experience in managing or owning similar properties) • ARMs adjust each 5-year period with terms up to 30 years and comprise 81% of the portfolio; prepayment penalties are received for every 5-year reset period Commercial Real Estate • Secured by in market office buildings, hotels/motels, small business facilities, strip shopping centers, and warehouses • Similar underwriting standards as multi-family • ARMs adjust each 5-year period with terms up to 30 years and comprise 80% of the portfolio 59% 12% 7% 8% 4% 5% 3% 2% Multifamily - 59% General Commercial - 12% CRE - Shopping Center -7% CRE - Strip Mall - 8% CRE - Single Tenant - 4% Office - 5% Industrial - 3% Commercial Special Use - 2% $4.3B Total Portfolio 17 2 |
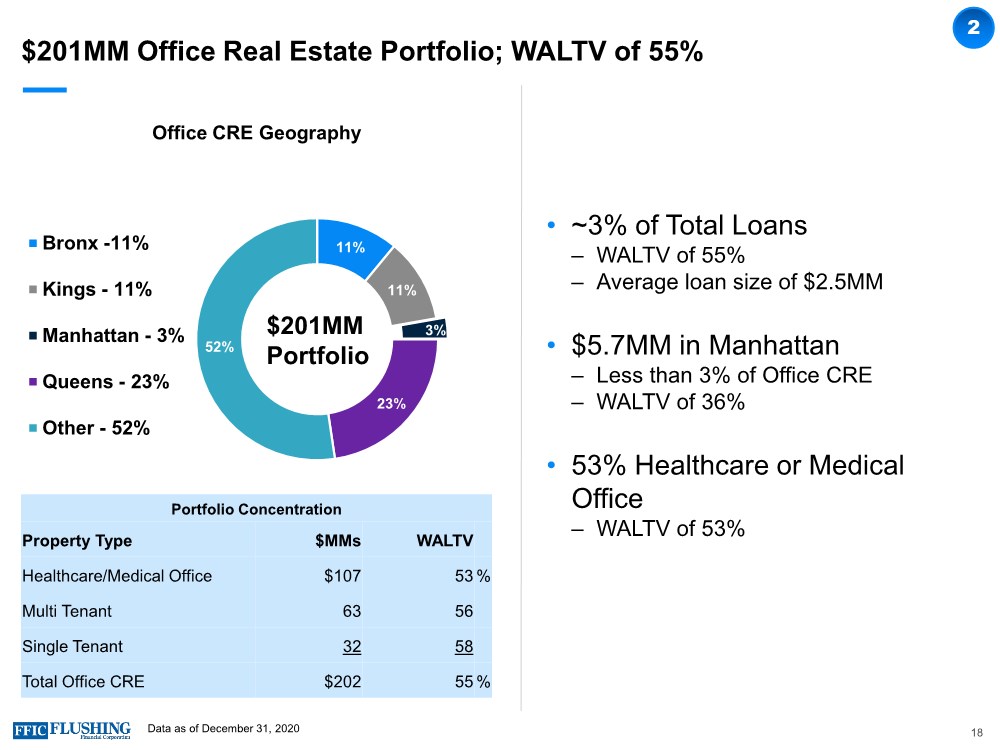
| $201MM Office Real Estate Portfolio; WALTV of 55% 18 • ~3% of Total Loans ‒ WALTV of 55% ‒ Average loan size of $2.5MM • $5.7MM in Manhattan ‒ Less than 3% of Office CRE ‒ WALTV of 36% • 53% Healthcare or Medical Office ‒ WALTV of 53% Office CRE Geography Portfolio Concentration Property Type $MMs WALTV Healthcare/Medical Office $107 53 % Multi Tenant 63 56 Single Tenant 32 58 Total Office CRE $202 55 % Data as of December 31, 2020 11% 11% 3% 23% 52% Bronx -11% Kings - 11% Manhattan - 3% Queens - 23% Other - 52% $201MM Portfolio 2 |
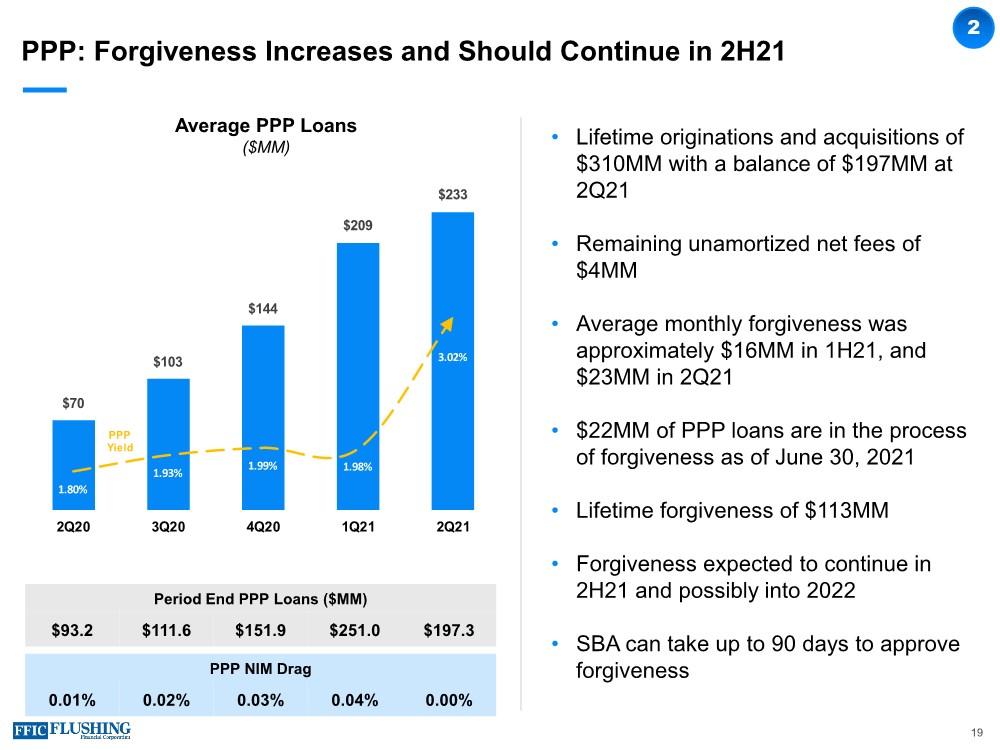
| $70 $103 $144 $209 $233 1.80% 1.93% 1.99% 1.98% 3.02% 0 50 100 150 200 250 2Q20 3Q20 4Q20 1Q21 2Q21 PPP Yield PPP: Forgiveness Increases and Should Continue in 2H21 19 2 Period End PPP Loans ($MM) $93.2 $111.6 $151.9 $251.0 $197.3 • Lifetime originations and acquisitions of $310MM with a balance of $197MM at 2Q21 • Remaining unamortized net fees of $4MM • Average monthly forgiveness was approximately $16MM in 1H21, and $23MM in 2Q21 • $22MM of PPP loans are in the process of forgiveness as of June 30, 2021 • Lifetime forgiveness of $113MM • Forgiveness expected to continue in 2H21 and possibly into 2022 • SBA can take up to 90 days to approve forgiveness Average PPP Loans ($MM) PPP NIM Drag 0.01% 0.02% 0.03% 0.04% 0.00% |
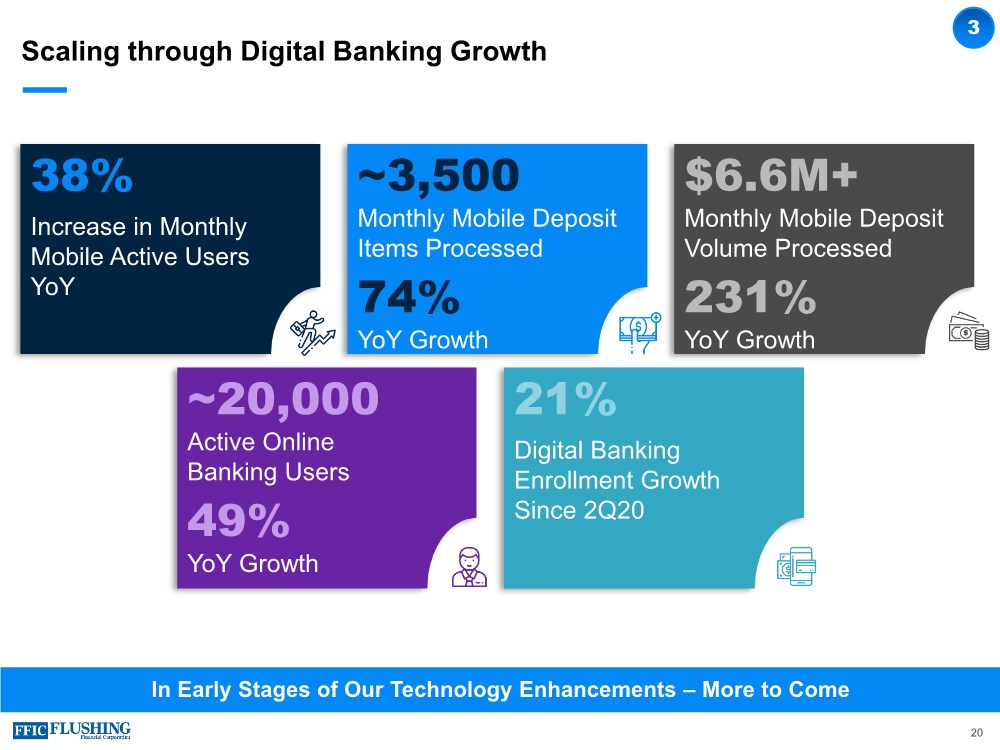
| In Early Stages of Our Technology Enhancements – More to Come 38% Increase in Monthly Mobile Active Users YoY ~3,500 Monthly Mobile Deposit Items Processed 74% YoY Growth $6.6M+ Monthly Mobile Deposit Volume Processed 231% YoY Growth 21% Digital Banking Enrollment Growth Since 2Q20 ~20,000 Active Online Banking Users 49% YoY Growth Scaling through Digital Banking Growth 20 3 |
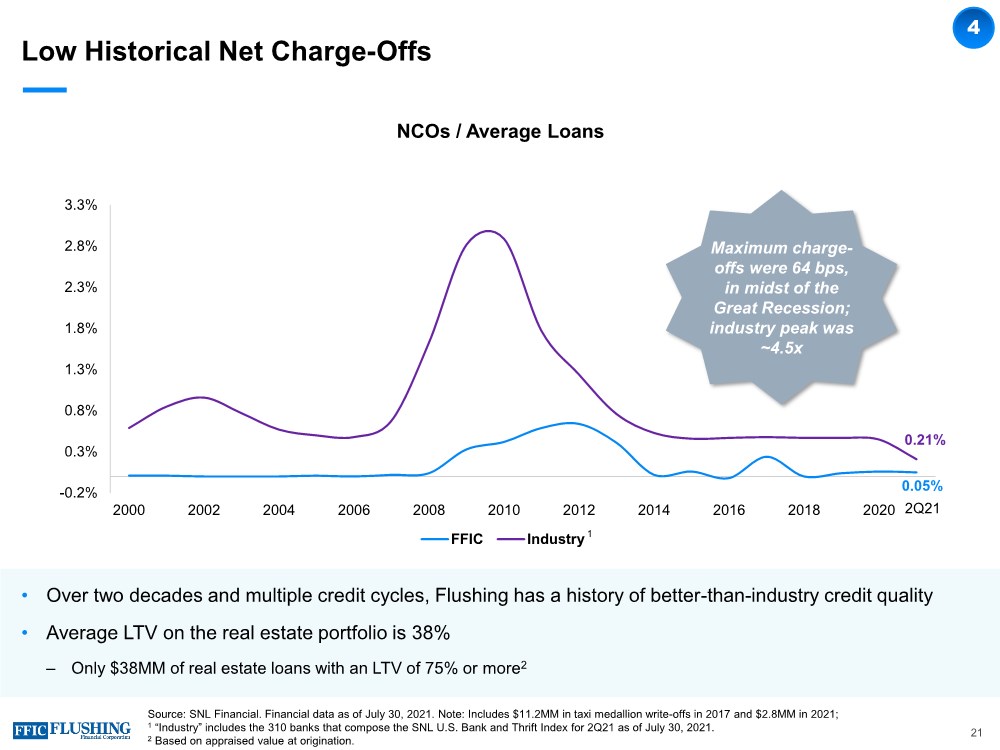
| Low Historical Net Charge-Offs • Over two decades and multiple credit cycles, Flushing has a history of better-than-industry credit quality • Average LTV on the real estate portfolio is 38% ‒ Only $38MM of real estate loans with an LTV of 75% or more2 Source: SNL Financial. Financial data as of July 30, 2021. Note: Includes $11.2MM in taxi medallion write-offs in 2017 and $2.8MM in 2021; 1 “Industry” includes the 310 banks that compose the SNL U.S. Bank and Thrift Index for 2Q21 as of July 30, 2021. 2 Based on appraised value at origination. NCOs / Average Loans 0.05% 0.21% -0.2% 0.3% 0.8% 1.3% 1.8% 2.3% 2.8% 3.3% 2000 2002 2004 2006 2008 2010 2012 2014 2016 2018 2020 FFIC Industry Maximum charge- offs were 64 bps, in midst of the Great Recession; industry peak was ~4.5x 2Q21 1 4 21 |
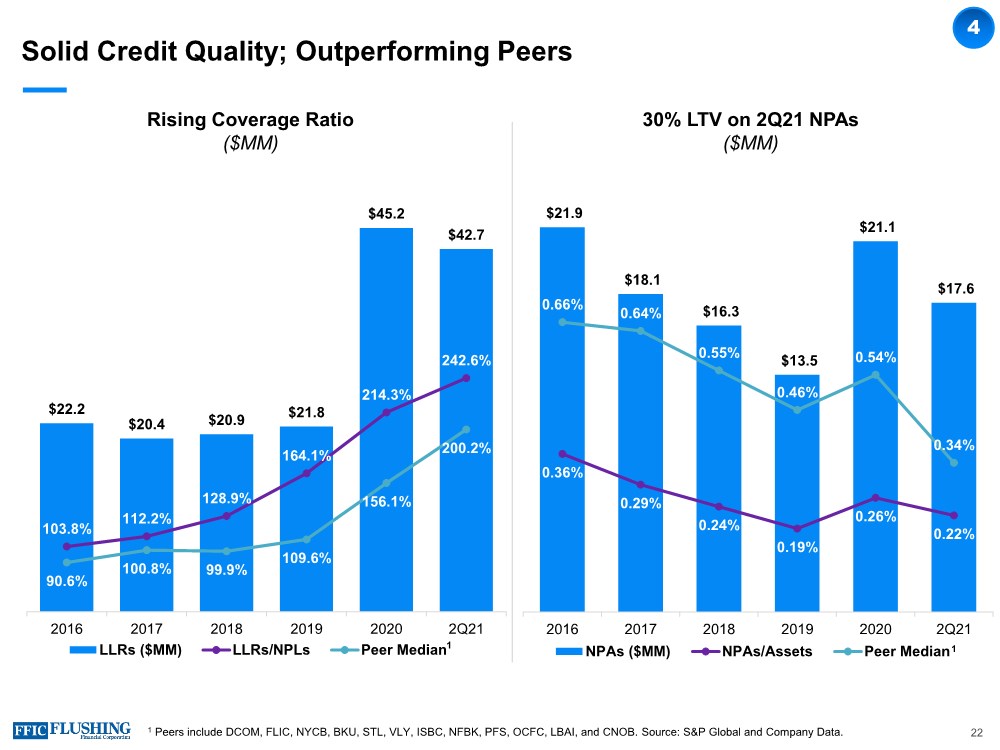
| Solid Credit Quality; Outperforming Peers Rising Coverage Ratio ($MM) 30% LTV on 2Q21 NPAs ($MM) $21.9 $18.1 $16.3 $13.5 $21.1 $17.6 0.36% 0.29% 0.24% 0.19% 0.26% 0.22% 0.66% 0.64% 0.55% 0.46% 0.54% 0.34% 0.00% 0.20% 0.40% 0.60% 0.80% 1.00% 2016 2017 2018 2019 2020 2Q21 $- $5.0 $10.0 $15.0 $20.0 $25.0 NPAs ($MM) NPAs/Assets Peer Median1 4 22 1 Peers include DCOM, FLIC, NYCB, BKU, STL, VLY, ISBC, NFBK, PFS, OCFC, LBAI, and CNOB. Source: S&P Global and Company Data. $22.2 $20.4 $20.9 $21.8 $45.2 $42.7 103.8% 112.2% 128.9% 164.1% 214.3% 242.6% 90.6% 100.8% 99.9% 109.6% 156.1% 200.2% 50.0% 100.0% 150.0% 200.0% 250.0% 300.0% 350.0% 400.0% 2016 2017 2018 2019 2020 2Q21 0 5 10 15 20 25 30 35 40 45 50 LLRs ($MM) LLRs/NPLs Peer Median1 |
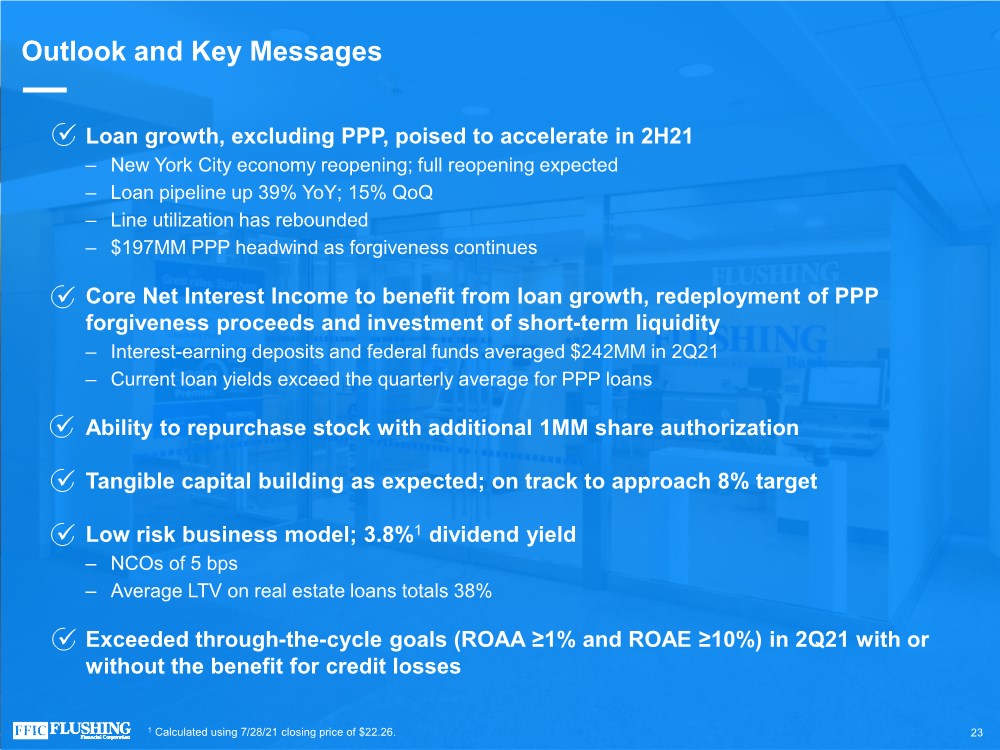
| Outlook and Key Messages Loan growth, excluding PPP, poised to accelerate in 2H21 ‒ New York City economy reopening; full reopening expected ‒ Loan pipeline up 39% YoY; 15% QoQ ‒ Line utilization has rebounded ‒ $197MM PPP headwind as forgiveness continues Core Net Interest Income to benefit from loan growth, redeployment of PPP forgiveness proceeds and investment of short-term liquidity ‒ Interest-earning deposits and federal funds averaged $242MM in 2Q21 ‒ Current loan yields exceed the quarterly average for PPP loans • Ability to repurchase stock with additional 1MM share authorization • Tangible capital building as expected; on track to approach 8% target Low risk business model; 3.8%1 dividend yield ‒ NCOs of 5 bps ‒ Average LTV on real estate loans totals 38% Exceeded through-the-cycle goals (ROAA ≥1% and ROAE ≥10%) in 2Q21 with or without the benefit for credit losses 23 1 Calculated using 7/28/21 closing price of $22.26. |
| Appendix |

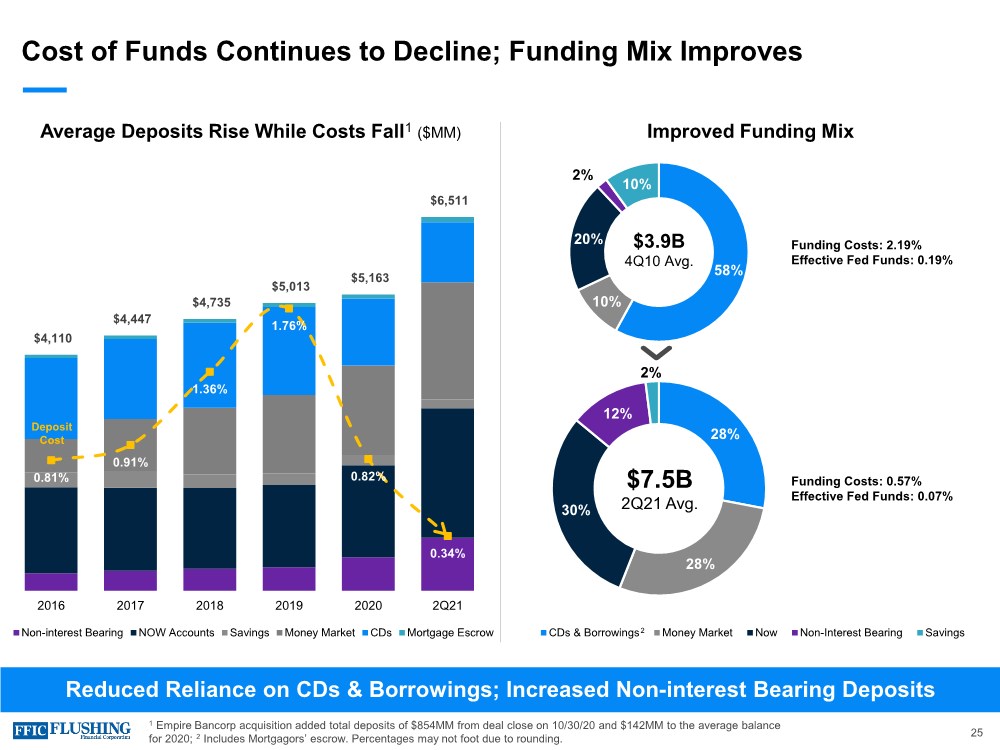
| Cost of Funds Continues to Decline; Funding Mix Improves Reduced Reliance on CDs & Borrowings; Increased Non-interest Bearing Deposits Average Deposits Rise While Costs Fall1 ($MM) Improved Funding Mix $4,110 $4,447 $4,735 $5,013 $5,163 $6,511 0.81% 0.91% 1.36% 1.76% 0.82% 0.34% - 1,000 2,000 3,000 4,000 5,000 6,000 7,000 2016 2017 2018 2019 2020 2Q21 Non-interest Bearing NOW Accounts Savings Money Market CDs Mortgage Escrow Deposit Cost 1 Empire Bancorp acquisition added total deposits of $854MM from deal close on 10/30/20 and $142MM to the average balance for 2020; 2 Includes Mortgagors’ escrow. Percentages may not foot due to rounding. 58% 10% 20% 2% 10% 28% 28% 30% 12% 2% Funding Costs: 2.19% Effective Fed Funds: 0.19% Funding Costs: 0.57% Effective Fed Funds: 0.07% $3.9B 4Q10 Avg. $7.5B 2Q21 Avg. CDs & Borrowings Money Market Now Non-Interest Bearing Savings 2 25 |
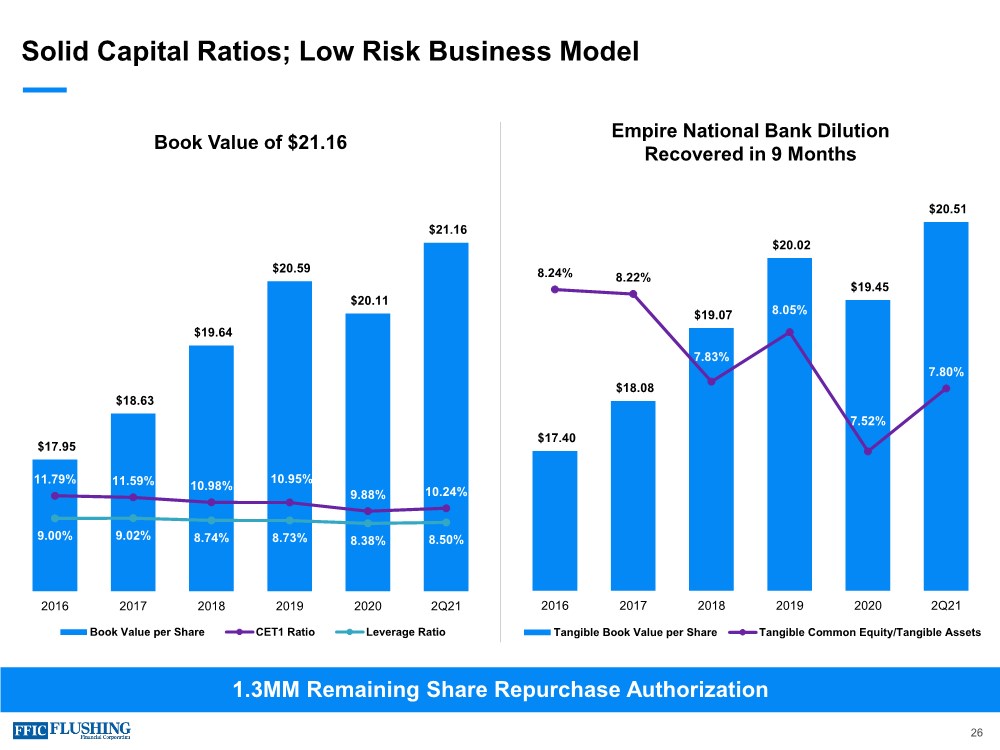
| Solid Capital Ratios; Low Risk Business Model 1.3MM Remaining Share Repurchase Authorization Book Value of $21.16 Empire National Bank Dilution Recovered in 9 Months $17.40 $18.08 $19.07 $20.02 $19.45 $20.51 8.24% 8.22% 7.83% 8.05% 7.52% 7.80% 6.90% 7.10% 7.30% 7.50% 7.70% 7.90% 8.10% 8.30% 8.50% 8.70% $15.50 $16.00 $16.50 $17.00 $17.50 $18.00 $18.50 $19.00 $19.50 $20.00 $20.50 $21.00 2016 2017 2018 2019 2020 2Q21 Tangible Book Value per Share Tangible Common Equity/Tangible Assets $17.95 $18.63 $19.64 $20.59 $20.11 $21.16 11.79% 11.59% 10.98% 10.95% 9.88% 10.24% 9.00% 9.02% 8.74% 8.73% 8.38% 8.50% 0.00% 5.00% 10.00% 15.00% 20.00% 25.00% 30.00% 35.00% 40.00% 45.00% 50.00% $16.00 $17.00 $18.00 $19.00 $20.00 $21.00 $22.00 2016 2017 2018 2019 2020 2Q21 Book Value per Share CET1 Ratio Leverage Ratio 26 |
| Reconciliation of GAAP Earnings and Core Earnings Non-cash Fair Value Adjustments to GAAP Earnings The variance in GAAP and core earnings is partly driven by the impact of non-cash net gains and losses from fair value adjustments. These fair value adjustments relate primarily to swaps designated to protect against rising rates and borrowing carried at fair value under the fair value option. As the swaps get closer to maturity, the volatility in fair value adjustments will dissipate. In a declining interest rate environment, the movement in the curve exaggerates our mark-to-market loss position. In a rising interest rate environment or a steepening of the yield curve, the loss position would experience an improvement. Core Net Income, Core Diluted EPS, Core ROAE, Core ROAA, Core Net Interest Income FTE, Core Net Interest Margin FTE, Base Net Interest Income FTE, Base Net Interest Margin FTE, Core Interest Income and Yield on Total Loans, Base Interest Income and Yield on Total Loans, Core Non-interest Income, Core Non- interest Expense and Tangible Book Value per common share are each non-GAAP measures used in this presentation.A reconciliation to the most directly comparable GAAP financial measures appears below in tabular form. The Company believes that these measures are useful for both investors and management to understand the effects of certain interest and non-interest items and provide an alternative view of the Company's performance over time and in comparison to the Company's competitors. These measures should not be viewed as a substitute for net income. The Company believes that tangible book value per common share is useful for both investors and management as these are measures commonly used by financial institutions, regulators and investors to measure the capital adequacy of financial institutions. The Company believes these measures facilitate comparison of the quality and composition of the Company's capital over time and in comparison to its competitors. These measures should not be viewed as a substitute for total shareholders' equity. These non-GAAP measures have inherent limitations, are not required to be uniformly applied and are not audited. They should not be considered in isolation or as a substitute for analysis of results reported under GAAP. These non-GAAP measures may not be comparable to similarly titled measures reported by other companies. 27 |
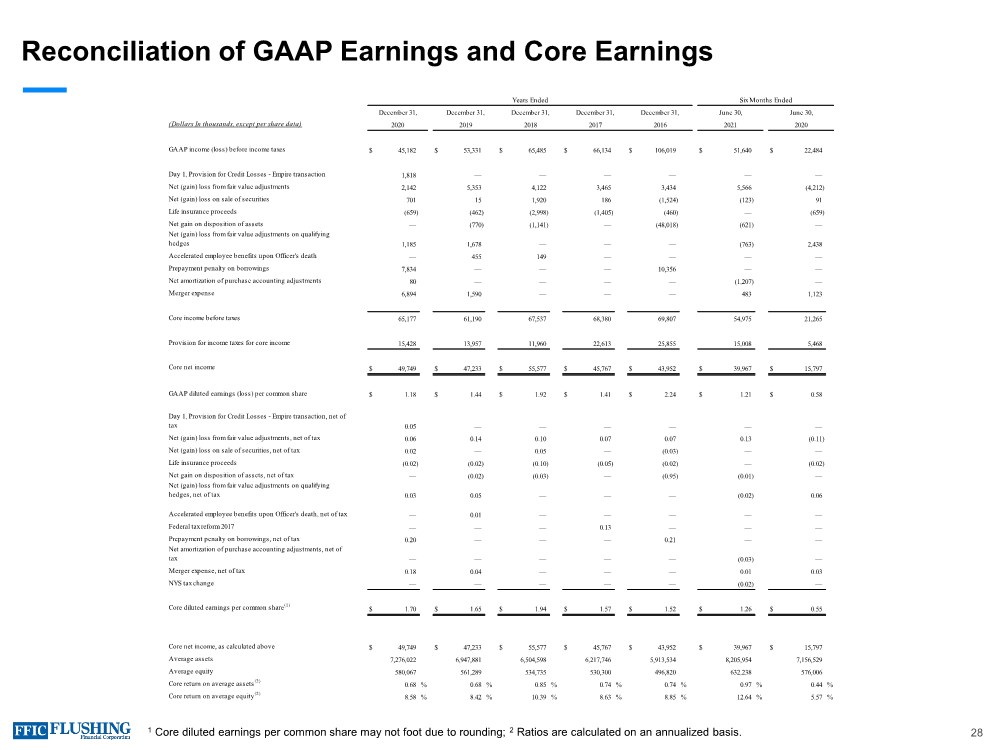
| Reconciliation of GAAP Earnings and Core Earnings 28 (Dollars In thousands, except per share data) GAAP income (loss) before income taxes $ 45,182 $ 53,331 $ 65,485 $ 66,134 $ 106,019 $ 51,640 $ 22,484 Day 1, Provision for Credit Losses - Empire transaction 1,818 — — — — — — Net (gain) loss from fair value adjustments 2,142 5,353 4,122 3,465 3,434 5,566 (4,212) Net (gain) loss on sale of securities 701 15 1,920 186 (1,524) (123) 91 Life insurance proceeds (659) (462) (2,998) (1,405) (460) — (659) Net gain on disposition of assets — (770) (1,141) — (48,018) (621) — Net (gain) loss from fair value adjustments on qualifying hedges 1,185 1,678 — — — (763) 2,438 Accelerated employee benefits upon Officer's death — 455 149 — — — — Prepayment penalty on borrowings 7,834 — — — 10,356 — — Net amortization of purchase accounting adjustments 80 — — — — (1,207) — Merger expense 6,894 1,590 — — — 483 1,123 Core income before taxes 65,177 61,190 67,537 68,380 69,807 54,975 21,265 Provision for income taxes for core income 15,428 13,957 11,960 22,613 25,855 15,008 5,468 Core net income $ 49,749 $ 47,233 $ 55,577 $ 45,767 $ 43,952 $ 39,967 $ 15,797 GAAP diluted earnings (loss) per common share $ 1.18 $ 1.44 $ 1.92 $ 1.41 $ 2.24 $ 1.21 $ 0.58 Day 1, Provision for Credit Losses - Empire transaction, net of tax 0.05 — — — — — — Net (gain) loss from fair value adjustments, net of tax 0.06 0.14 0.10 0.07 0.07 0.13 (0.11) Net (gain) loss on sale of securities, net of tax 0.02 — 0.05 — (0.03) — — Life insurance proceeds (0.02) (0.02) (0.10) (0.05) (0.02) — (0.02) Net gain on disposition of assets, net of tax — (0.02) (0.03) — (0.95) (0.01) — Net (gain) loss from fair value adjustments on qualifying hedges, net of tax 0.03 0.05 — — — (0.02) 0.06 Accelerated employee benefits upon Officer's death, net of tax — 0.01 — — — — — Federal tax reform 2017 — — — 0.13 — — — Prepayment penalty on borrowings, net of tax 0.20 — — — 0.21 — — Net amortization of purchase accounting adjustments, net of tax — — — — — (0.03) — Merger expense, net of tax 0.18 0.04 — — — 0.01 0.03 NYS tax change — — — — — (0.02) — Core diluted earnings per common share(1) $ 1.70 $ 1.65 $ 1.94 $ 1.57 $ 1.52 $ 1.26 $ 0.55 Core net income, as calculated above $ 49,749 $ 47,233 $ 55,577 $ 45,767 $ 43,952 $ 39,967 $ 15,797 Average assets 7,276,022 6,947,881 6,504,598 6,217,746 5,913,534 8,205,954 7,156,529 Average equity 580,067 561,289 534,735 530,300 496,820 632,238 576,006 Core return on average assets(2) 0.68 % 0.68 % 0.85 % 0.74 % 0.74 % 0.97 % 0.44 % Core return on average equity(2) 8.58 % 8.42 % 10.39 % 8.63 % 8.85 % 12.64 % 5.57 % December 31, 2017 Years Ended December 31, 2020 December 31, 2019 December 31, 2018 2016 June 30, 2021 June 30, 2020 December 31, Six Months Ended 1 Core diluted earnings per common share may not foot due to rounding; 2 Ratios are calculated on an annualized basis. |
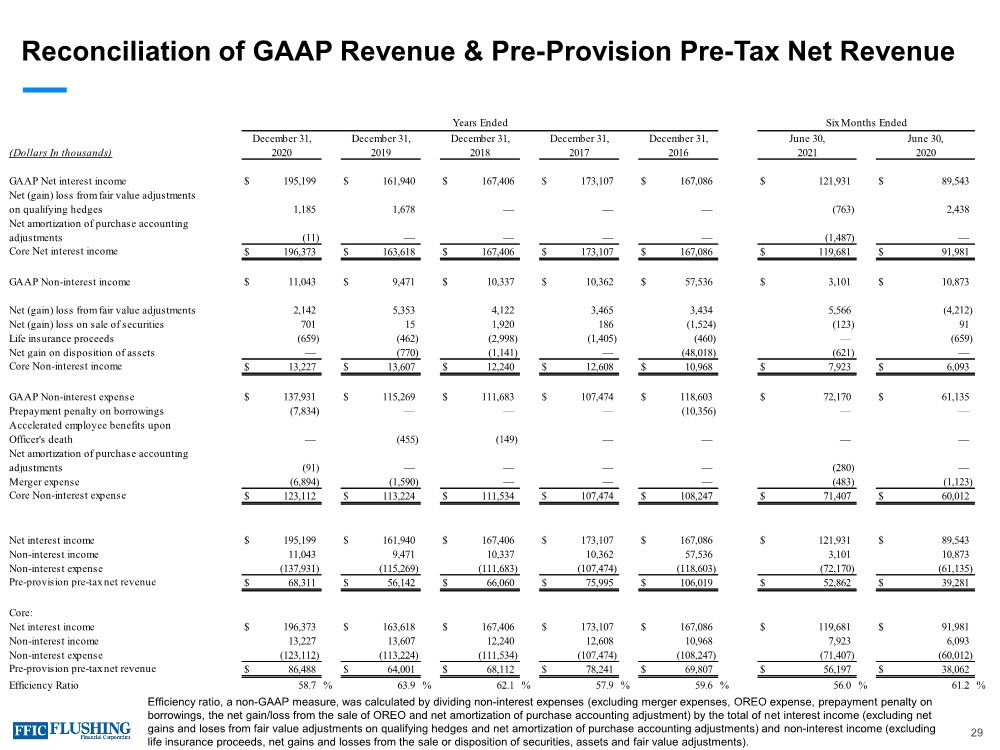
| Reconciliation of GAAP Revenue & Pre-Provision Pre-Tax Net Revenue 29 (Dollars In thousands) GAAP Net interest income $ 195,199 $ 161,940 $ 167,406 $ 173,107 $ 167,086 $ 121,931 $ 89,543 Net (gain) loss from fair value adjustments on qualifying hedges 1,185 1,678 — — — (763) 2,438 Net amortization of purchase accounting adjustments (11) — — — — (1,487) — Core Net interest income $ 196,373 $ 163,618 $ 167,406 $ 173,107 $ 167,086 $ 119,681 $ 91,981 GAAP Non-interest income $ 11,043 $ 9,471 $ 10,337 $ 10,362 $ 57,536 $ 3,101 $ 10,873 Net (gain) loss from fair value adjustments 2,142 5,353 4,122 3,465 3,434 5,566 (4,212) Net (gain) loss on sale of securities 701 15 1,920 186 (1,524) (123) 91 Life insurance proceeds (659) (462) (2,998) (1,405) (460) — (659) Net gain on disposition of assets — (770) (1,141) — (48,018) (621) — Core Non-interest income $ 13,227 $ 13,607 $ 12,240 $ 12,608 $ 10,968 $ 7,923 $ 6,093 GAAP Non-interest expense $ 137,931 $ 115,269 $ 111,683 $ 107,474 $ 118,603 $ 72,170 $ 61,135 Prepayment penalty on borrowings (7,834) — — — (10,356) — — Accelerated employee benefits upon Officer's death — (455) (149) — — — — Net amortization of purchase accounting adjustments (91) — — — — (280) — Merger expense (6,894) (1,590) — — — (483) (1,123) Core Non-interest expense $ 123,112 $ 113,224 $ 111,534 $ 107,474 $ 108,247 $ 71,407 $ 60,012 Net interest income $ 195,199 $ 161,940 $ 167,406 $ 173,107 $ 167,086 $ 121,931 $ 89,543 Non-interest income 11,043 9,471 10,337 10,362 57,536 3,101 10,873 Non-interest expense (137,931) (115,269) (111,683) (107,474) (118,603) (72,170) (61,135) Pre-provision pre-tax net revenue $ 68,311 $ 56,142 $ 66,060 $ 75,995 $ 106,019 $ 52,862 $ 39,281 Core: Net interest income $ 196,373 $ 163,618 $ 167,406 $ 173,107 $ 167,086 $ 119,681 $ 91,981 Non-interest income 13,227 13,607 12,240 12,608 10,968 7,923 6,093 Non-interest expense (123,112) (113,224) (111,534) (107,474) (108,247) (71,407) (60,012) Pre-provision pre-tax net revenue $ 86,488 $ 64,001 $ 68,112 $ 78,241 $ 69,807 $ 56,197 $ 38,062 Efficiency Ratio 58.7 % 63.9 % 62.1 % 57.9 % 59.6 % 56.0 % 61.2 % June 30, 2020 June 30, 2021 Six Months Ended December 31, 2017 Years Ended December 31, 2020 December 31, 2019 December 31, 2018 December 31, 2016 Efficiency ratio, a non-GAAP measure, was calculated by dividing non-interest expenses (excluding merger expenses, OREO expense, prepayment penalty on borrowings, the net gain/loss from the sale of OREO and net amortization of purchase accounting adjustment) by the total of net interest income (excluding net gains and loses from fair value adjustments on qualifying hedges and net amortization of purchase accounting adjustments) and non-interest income (excluding life insurance proceeds, net gains and losses from the sale or disposition of securities, assets and fair value adjustments). |
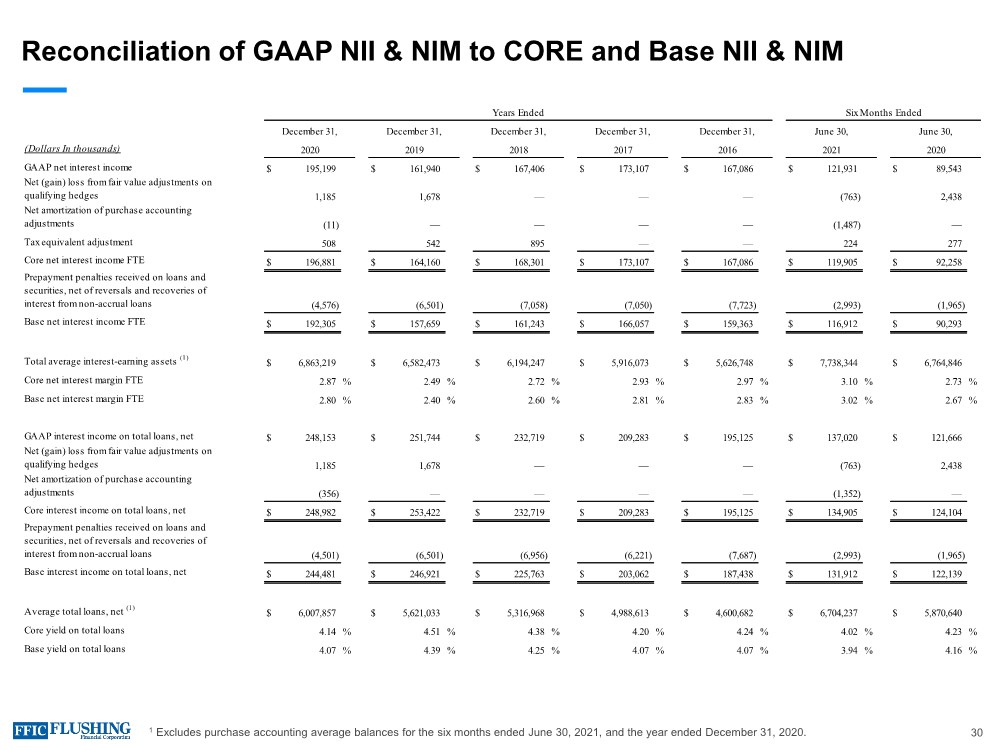
| Reconciliation of GAAP NII & NIM to CORE and Base NII & NIM 1 Excludes purchase accounting average balances for the six months ended June 30, 2021, and the year ended December 31, 2020. 30 (Dollars In thousands) GAAP net interest income $ 195,199 $ 161,940 $ 167,406 $ 173,107 $ 167,086 $ 121,931 $ 89,543 Net (gain) loss from fair value adjustments on qualifying hedges 1,185 1,678 — — — (763) 2,438 Net amortization of purchase accounting adjustments (11) — — — — (1,487) — Tax equivalent adjustment 508 542 895 — — 224 277 Core net interest income FTE $ 196,881 $ 164,160 $ 168,301 $ 173,107 $ 167,086 $ 119,905 $ 92,258 Prepayment penalties received on loans and securities, net of reversals and recoveries of interest from non-accrual loans (4,576) (6,501) (7,058) (7,050) (7,723) (2,993) (1,965) Base net interest income FTE $ 192,305 $ 157,659 $ 161,243 $ 166,057 $ 159,363 $ 116,912 $ 90,293 Total average interest-earning assets (1) $ 6,863,219 $ 6,582,473 $ 6,194,247 $ 5,916,073 $ 5,626,748 $ 7,738,344 $ 6,764,846 Core net interest margin FTE 2.87 % 2.49 % 2.72 % 2.93 % 2.97 % 3.10 % 2.73 % Base net interest margin FTE 2.80 % 2.40 % 2.60 % 2.81 % 2.83 % 3.02 % 2.67 % GAAP interest income on total loans, net $ 248,153 $ 251,744 $ 232,719 $ 209,283 $ 195,125 $ 137,020 $ 121,666 Net (gain) loss from fair value adjustments on qualifying hedges 1,185 1,678 — — — (763) 2,438 Net amortization of purchase accounting adjustments (356) — — — — (1,352) — Core interest income on total loans, net $ 248,982 $ 253,422 $ 232,719 $ 209,283 $ 195,125 $ 134,905 $ 124,104 Prepayment penalties received on loans and securities, net of reversals and recoveries of interest from non-accrual loans (4,501) (6,501) (6,956) (6,221) (7,687) (2,993) (1,965) Base interest income on total loans, net $ 244,481 $ 246,921 $ 225,763 $ 203,062 $ 187,438 $ 131,912 $ 122,139 Average total loans, net (1) $ 6,007,857 $ 5,621,033 $ 5,316,968 $ 4,988,613 $ 4,600,682 $ 6,704,237 $ 5,870,640 Core yield on total loans 4.14 % 4.51 % 4.38 % 4.20 % 4.24 % 4.02 % 4.23 % Base yield on total loans 4.07 % 4.39 % 4.25 % 4.07 % 4.07 % 3.94 % 4.16 % December 31, 2017 Years Ended December 31, 2020 December 31, 2019 December 31, 2018 June 30, 2020 Six Months Ended 2016 June 30, 2021 December 31, |
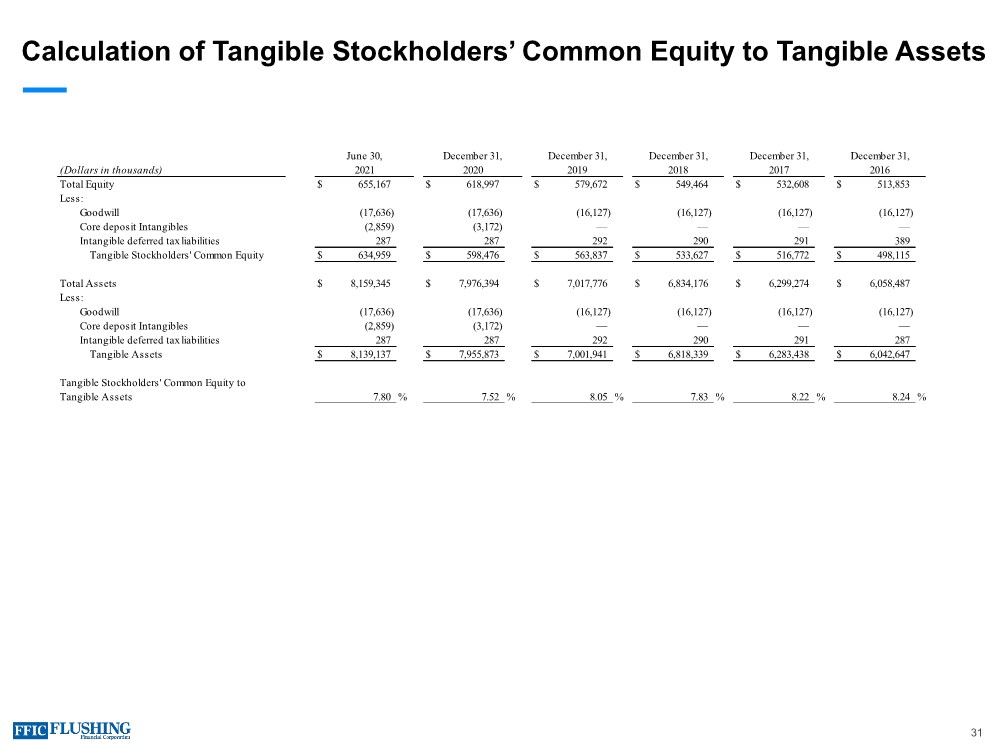
| Calculation of Tangible Stockholders’ Common Equity to Tangible Assets 31 (Dollars in thousands) Total Equity $ 655,167 $ 618,997 $ 579,672 $ 549,464 $ 532,608 $ 513,853 Less: Goodwill (17,636) (17,636) (16,127) (16,127) (16,127) (16,127) Core deposit Intangibles (2,859) (3,172) — — — — Intangible deferred tax liabilities 287 287 292 290 291 389 Tangible Stockholders' Common Equity $ 634,959 $ 598,476 $ 563,837 $ 533,627 $ 516,772 $ 498,115 Total Assets $ 8,159,345 $ 7,976,394 $ 7,017,776 $ 6,834,176 $ 6,299,274 $ 6,058,487 Less: Goodwill (17,636) (17,636) (16,127) (16,127) (16,127) (16,127) Core deposit Intangibles (2,859) (3,172) — — — — Intangible deferred tax liabilities 287 287 292 290 291 287 Tangible Assets $ 8,139,137 $ 7,955,873 $ 7,001,941 $ 6,818,339 $ 6,283,438 $ 6,042,647 Tangible Stockholders' Common Equity to Tangible Assets 7.80 % 7.52 % 8.05 % 7.83 % 8.22 % 8.24 % June 30, 2021 December 31, December 31, December 31, December 31, December 31, 2016 2017 2018 2019 2020 |
| Contact Details Susan K. Cullen SEVP, CFO & Treasurer Phone: (718) 961-5400 Email: [email protected] Al Savastano, CFA Director of Investor Relations Phone: (516) 820-1146 Email: [email protected] 32 |

|

Serious News for Serious Traders! Try StreetInsider.com Premium Free!
You May Also Be Interested In
- Flushing Financial (FFIC) Misses Q1 EPS by 2c
- Orange: Combined Ordinary and Extraordinary Shareholders’ Meeting of 22 May 2024 Availability of documents
- Proposals to the Annual General Meeting of Municipality Finance Plc
Create E-mail Alert Related Categories
SEC FilingsSign up for StreetInsider Free!
Receive full access to all new and archived articles, unlimited portfolio tracking, e-mail alerts, custom newswires and RSS feeds - and more!
