



Form 8-K ESTERLINE TECHNOLOGIES For: Feb 04
 Tweet
Tweet Share
Share E-mail
UNITED STATES
SECURITIES AND EXCHANGE COMMISSION
Washington, D.C. 20549
FORM 8-K
CURRENT REPORT
Pursuant to Section 13 or 15(d)
of the Securities Exchange Act of 1934
February 4, 2016
Date of Report (Date of earliest event reported)
ESTERLINE TECHNOLOGIES CORPORATION
(Exact Name of Registrant as Specified in Charter)
| Delaware | 001-06357 | 13-2595091 | ||
| (State or Other Jurisdiction of Incorporation) |
(Commission File No.) |
(IRS Employer Identification No.) | ||
| 500-108th Avenue NE, Bellevue, Washington | 98004 | |||
| (Address of principal executive offices) | (Zip Code) | |||
(425) 453-9400
(Registrant’s telephone number, including area code)
Check the appropriate box below if the Form 8-K filing is intended to simultaneously satisfy the filing obligation of the registrant under any of the following provisions:
| ¨ | Written communication pursuant to Rule 425 under the Securities Act (17 CFR 230.425) |
| ¨ | Soliciting material pursuant to Rule 14a-12 under the Exchange Act (17 CFR 240.14a-12) |
| ¨ | Pre-commencement communications pursuant to Rule 14d-2(b) under the Exchange Act (17 CFR 240.14d-2(b)) |
| ¨ | Pre-commencement communications pursuant to Rule 13e-4(c) under the Exchange Act (17 CFR 240.13e-4(c)) |
| Item 2.02 | Results of Operations and Financial Condition. |
On February 4, 2016, Esterline Technologies Corporation issued a press release announcing financial results for the three months ended January 1, 2016. A copy of the press release is attached hereto as Exhibit 99.1 and is incorporated herein by reference. In addition, supplemental information regarding the financial results for periods presented in the press release is attached hereto as Exhibit 99.2. The press release and the supplemental financial information should be read in conjunction with the note regarding forward-looking statements, which is included in the text of the press release and as part of the supplemental financial information.
| Item 9.01 | Financial Statements and Exhibits. |
(d) Exhibits.
| Exhibit No. |
Description | |
| 99.1 | Press release announcing financial results issued by Esterline Technologies Corporation dated February 4, 2016. | |
| 99.2 | Supplemental Financial Information dated February 4, 2016. | |
SIGNATURES
Pursuant to the requirements of the Securities Exchange Act of 1934, the registrant has duly caused this report to be signed on its behalf by the undersigned hereunto duly authorized.
| ESTERLINE TECHNOLOGIES CORPORATION | ||||||
| Dated: February 4, 2016 | By: | /s/ ROBERT D. GEORGE | ||||
| Name: | Robert D. George | |||||
| Title: | Chief Financial Officer, Vice President & Corporate Development | |||||
EXHIBIT INDEX
| Exhibit No. |
Description | |
| 99.1 | Press release announcing financial results issued by Esterline Technologies Corporation dated February 4, 2016. | |
| 99.2 | Supplemental Financial Information dated February 4, 2016. | |
Exhibit 99.1

FOR IMMEDIATE RELEASE
Contact: Julie Albrecht
+1 425-453-9400
ESTERLINE REPORTS FISCAL 2016 FIRST QUARTER RESULTS
| • | Sales of $441.5 million in the fiscal first quarter |
| • | Earnings from continuing operations of $9.9 million; adjusted earnings from continuing operations of $18.4 million |
| • | GAAP earnings per diluted share from continuing operations of $0.33; adjusted earnings per diluted share of $0.62 |
| • | Company issues updated full-year guidance |
BELLEVUE, Wash., February 4, 2016 – Esterline Corporation (NYSE: ESL) (www.esterline.com), a leading specialty manufacturer serving the global aerospace and defense markets, today reported results for the first fiscal quarter, ended January 1, 2016. During the quarter, the company reported consolidated revenue of $441.5 million, a decline of 12.5% compared with the year-ago period of $504.6 million. Lower revenue compared with the prior year was primarily attributable to lower end-market demand, shipment and production delays as a result of ongoing integration efforts and an unfavorable impact from foreign exchange rates. These factors were partially offset by the incremental contribution from the defense, aerospace and training businesses (DAT) acquired from Barco N.V. in January of 2015.
All comparisons to the prior year period are being made to a recast fiscal 2015 that reflects the company’s new fiscal calendar. The recast first quarter of fiscal 2015 includes an extremely strong October 2014 that was also the last month in the 2014 fiscal year.
Earnings from continuing operations in the fiscal first quarter of 2016 were $9.9 million, or $0.33 per diluted share, compared with prior-year earnings from continuing operations of $34.5 million, or $1.06 per diluted share. Adjusted earnings from continuing operations for the first fiscal quarter of 2016 were $18.4 million, or $0.62 per diluted share. Adjusted results exclude $0.17 per diluted share related to accelerated integration and incremental compliance activities, and $0.12 per diluted share related to integration costs associated with the DAT business (see Table 1). In the comparable period of the prior year, adjusted earnings from continuing operations were $47.7 million, or $1.48 per diluted share.
Page 2 of 8 Esterline Reports Fiscal 2016 First Quarter Financial Results
Curtis Reusser, Esterline’s Chief Executive Officer, said, “We continue to make important progress across a range of strategic initiatives. We are also increasing our focus on organic sales growth and operational excellence as these combined actions will drive performance for all of our stakeholders. Our revenue performance in the first quarter reflects challenges related to both the condition of our markets and our execution, each of which underlines the necessity of sharper operational focus. While we are not satisfied by our first quarter performance, we remain confident that we are on the right strategic path, we will continue to progress toward our goals, and our teams will deliver strong, sustainable improvement as we move forward.”
Table 1: Effect of Certain Items on 1st Fiscal Quarter
2016 Earnings from Continuing Operations
| $ millions | EPS | |||||||
| Earnings – U.S. GAAP |
$ | 9.9 | $ | 0.33 | ||||
|
|
|
|
|
|||||
| Accelerated Integration Costs |
1.4 | 0.05 | ||||||
| Compliance Costs |
3.5 | 0.12 | ||||||
| DAT Integration Costs |
3.6 | 0.12 | ||||||
| Adjusted Earnings |
$ | 18.4 | $ | 0.62 | ||||
|
|
|
|
|
|||||
Including discontinued operations, net earnings for the first fiscal quarter of 2016 were $5.1 million, or $0.17 per diluted share, compared with $28.6 million, or $0.88 per diluted share, in the comparable period in fiscal 2015. Net earnings in the first fiscal quarter of 2016 included a $4.8 million loss from discontinued operations, while the prior year included a $5.9 million loss from discontinued operations.
New orders in the fiscal first quarter of 2016 were $496.3 million, compared with $466.2 million in the comparable prior-year period. Backlog at the end of the fiscal first quarter of 2016 was $1.28 billion, compared with $1.16 billion at the end of the recast first quarter of fiscal 2015.
Gross profit in the fiscal first quarter of 2016 was $137.7 million, compared with $178.2 million in the prior-year period. Reported gross margin as a percentage of sales in the first fiscal quarter of 2016 was 31.2% compared with 35.3% in the prior-year period. On an adjusted basis, excluding the discrete items consistent with adjusted EPS, the company reported gross margin of $139.3 million, or 31.6% of sales, in the fiscal first quarter of 2016, compared with adjusted gross margin of $182.9 million, or 36.2% of sales, in the prior year. Lower gross margin in the 2016 period primarily reflects the impact of lower fixed cost absorption from lower sales volume, a weaker product mix and certain operational inefficiencies.
Selling, general and administrative (SG&A) expenses during the fiscal first quarter of 2016 were $94.1 million, compared with $98.0 million in the prior year. Fiscal first quarter SG&A expenses as a percent of sales were 21.3%, compared with the prior-year level of 19.4%. The higher rate in fiscal 2016 was mainly a reflection of lower sales compared with the prior year.
Page 3 of 8 Esterline Reports Fiscal 2016 First Quarter Financial Results
Research, development and engineering (R&D) spending in the first quarter of fiscal 2016 was $25.6 million, or 5.8% of sales, compared with $23.5 million, or 4.7% of sales, in the prior-year period. The company expects full-year R&D spending to be approximately 5.0% of sales.
On a GAAP basis, the company recorded a tax benefit of $0.03 million as a result of discrete tax benefits in the United Kingdom and the United States, compared with a tax expense of $11.0 million, or 24.1% in the prior-year. For the full year, the company expects a tax rate of 18% to 20%.
Cash flow from operations through the first fiscal quarter of 2016 was $40.7 million. Excluding capital expenditures of $14.9 million, free cash flow was $25.8 million during the same period.
Updated Guidance for Fiscal Year 2016
The company has updated its full-year guidance for fiscal year ended September 30, 2016, to reflect first quarter results, certain market weakness and the impact of integration activities to ongoing business. The company expects full-year revenue to be in a range of 1.925 billion to $1.975 billion. Full-year adjusted earnings from continuing operations are expected in a range of $4.40 to $4.80 per diluted share. The updated adjusted earnings per share guidance excludes costs expected for accelerated integration, incremental compliance and acquisition integration. The company expects fiscal 2016 free cash flow to be in a range of $110 million to $130 million.
Conference Call Information
Esterline will host a conference call to discuss this announcement today at 5:00 p.m. Eastern Time (2:00 p.m. Pacific Time). The U.S. dial-in number is 877-703-6109; outside the U.S., use 857-244-7308. The pass code for the call is: 89285143. The company has posted a presentation on its website (www.esterline.com) under “Presentations” in the Investor Relations section to provide additional information about its first fiscal quarter operational and financial results. The presentation is also included as Exhibit 99.2 to the company’s report on Form 8-K, which is being submitted today to the SEC.
Non-GAAP Financial Information
This press release and the related presentation providing supplemental financial information include non-GAAP financial measures—adjusted earnings from continuing operations, adjusted earnings from continuing operations per diluted share, adjusted earnings before interest and tax (EBIT), adjusted gross margin, and free cash flow—that have not been calculated in accordance with generally accepted accounting principles in the U.S. (GAAP). Adjusted earnings from continuing operations consist of earnings from continuing operations attributable to Esterline less the costs associated with certain integration activities—including restructuring charges—and incremental compliance costs as well as discrete items associated with our acquisition of the DAT business in January 2015, adjustments to reserves on long-term contracts incurred in the periods presented and unique amounts related to pension expense, in each case, as further detailed in the tables below.
Page 4 of 8 Esterline Reports Fiscal 2016 First Quarter Financial Results
Adjusted earnings from continuing operations per diluted share divides each element of adjusted earnings from continuing operations by the weighted average number of shares outstanding, diluted for the periods presented. EBIT is defined as operating earnings from continuing operations. Adjusted EBIT excludes the same costs excluded from adjusted earnings from continuing operations. First fiscal quarter 2016 adjusted gross margin excludes the cost of certain integration activities of $1.6 million from GAAP gross margin. Fiscal first quarter 2015 adjusted gross margin excludes certain integration and compliance costs and adjustments to long-term contract reserves totaling $4.6 million. First fiscal quarter 2016 free cash flow of $25.8 million equals cash flow from operations of $40.7 million less capital expenditures of $14.9 million. In accordance with the SEC’s requirements, below is the reconciliation of the non-GAAP adjusted earnings from continuing operations to the comparable GAAP earnings from continuing operations.
In millions, except per share amounts
| Three Months Ended January 1, 2016 |
Recast Three Months Ended December 26, 2014 |
|||||||||||||||
| Per Diluted Share |
Per Diluted Share |
|||||||||||||||
| Earnings from Continuing Operations |
||||||||||||||||
| Attributable to Esterline (GAAP), Net of Tax |
$ | 9.9 | $ | 0.33 | $ | 34.5 | $ | 1.06 | ||||||||
| Accelerated Integration Costs, Net of $0.0 and $1.3 Tax |
1.4 | 0.05 | 4.2 | 0.14 | ||||||||||||
| Compliance Costs, Net of $0.0 and $0.8 Tax |
3.5 | 0.12 | 2.7 | 0.08 | ||||||||||||
| DAT Integration Costs, Net of $0.0 Tax |
3.6 | 0.12 | — | — | ||||||||||||
| DAT Closing Expenses, Net of $0.2 Tax |
— | — | 0.5 | 0.02 | ||||||||||||
| Long-term Contract Adjustments, Net of $1.1 Tax |
— | — | 3.5 | 0.11 | ||||||||||||
| Pension Expense, Net of $0.7 Tax |
— | — | 2.3 | 0.07 | ||||||||||||
|
|
|
|
|
|
|
|
|
|||||||||
| Adjusted Earnings from Continuing Operations (non-GAAP), Net of Tax |
$ | 18.4 | $ | 0.62 | $ | 47.7 | $ | 1.48 | ||||||||
|
|
|
|
|
|
|
|
|
|||||||||
The company provides these non-GAAP financial measures as supplemental information to the GAAP financial measures. Management uses these non-GAAP financial measures to (a) evaluate the company’s historical and prospective financial performance and its performance relative to its competitors, (b) allocate resources, and (c) measure the operational performance of the company’s business units.
In addition, management believes investors’ and financial analysts’ understanding of the company’s performance is enhanced by including these non-GAAP financial measures as a reasonable basis for comparing the company’s historical results of operations.
These non-GAAP financial measures are not meant to be considered in isolation or as a substitute for the comparable GAAP measures, and free cash flow is not necessarily indicative of amounts available for discretionary use. There are limitations to these non-GAAP financial measures because they are not prepared in accordance with GAAP and may not be comparable to similarly titled measures of other companies due to potential differences in methods of calculation and items that comprise the calculation. The company compensates for these limitations by using these non-GAAP
Page 5 of 8 Esterline Reports Fiscal 2016 First Quarter Financial Results
financial measures as a supplement to the GAAP measures and by providing reconciliations of the non-GAAP and comparable GAAP financial measures. The non-GAAP financial measures should be read only in conjunction with the company’s consolidated financial statements prepared in accordance with GAAP.
This press release contains “forward-looking statements” within the meaning of the Private Securities Litigation Reform Act of 1995. These statements relate to future events or the company’s future financial performance. In some cases, you can identify forward-looking statements by terminology such as “anticipate,” “believe,” “continue,” “could,” “estimate,” “expect,” “intend,” “may,” “might,” “plan,” “potential,” “predict,” “should” or “will,” or the negative of such terms, or other comparable terminology. These forward-looking statements are only predictions based on the current intent and expectations of the management of Esterline, are not guarantees of future performance or actions, and involve risks and uncertainties that are difficult to predict and may cause Esterline’s or its industry’s actual results, performance or achievements to be materially different from any future results, performance or achievements expressed or implied by the forward-looking statements. Esterline’s actual results and the timing and outcome of events may differ materially from those expressed in or implied by the forward-looking statements due to risks detailed in Esterline’s public filings with the Securities and Exchange Commission including its most recent Transition Report on Form 10-K.
Page 6 of 8 Esterline Reports Fiscal 2016 First Quarter Financial Results
ESTERLINE TECHNOLOGIES CORPORATION
Consolidated Statement of Operations (unaudited)
In thousands, except per share amounts
| Three Months Ended | ||||||||
| January 1, 2016 |
December 26, 2014 |
|||||||
| (Recast) | ||||||||
| Segment Sales |
||||||||
| Avionics & Controls |
$ | 186,245 | $ | 206,617 | ||||
| Sensors & Systems |
152,430 | 182,894 | ||||||
| Advanced Materials |
102,802 | 115,100 | ||||||
|
|
|
|
|
|||||
| Net Sales |
441,477 | 504,611 | ||||||
| Cost of Sales |
303,758 | 326,370 | ||||||
|
|
|
|
|
|||||
| 137,719 | 178,241 | |||||||
| Expenses |
||||||||
| Selling, general and administrative |
94,091 | 98,016 | ||||||
| Research, development and engineering |
25,575 | 23,531 | ||||||
| Restructuring charges |
931 | 3,293 | ||||||
|
|
|
|
|
|||||
| Total Expenses |
120,597 | 124,840 | ||||||
|
|
|
|
|
|||||
| Operating Earnings From Continuing Operations |
17,122 | 53,401 | ||||||
| Interest Income |
(87 | ) | (184 | ) | ||||
| Interest Expense |
7,216 | 8,082 | ||||||
|
|
|
|
|
|||||
| Earnings From Continuing Operations Before Income Taxes |
9,993 | 45,503 | ||||||
| Income Tax Expense (Income) |
(33 | ) | 10,974 | |||||
|
|
|
|
|
|||||
| Earnings From Continuing Operations Including Noncontrolling Interests |
10,026 | 34,529 | ||||||
| Loss (Earnings) Attributable to Noncontrolling Interests |
(162 | ) | 17 | |||||
|
|
|
|
|
|||||
| Earnings From Continuing Operations Attributable to Esterline, Net of Tax |
9,864 | 34,546 | ||||||
| Loss From Discontinued Operations, Attributable to Esterline, Net of Tax |
(4,780 | ) | (5,947 | ) | ||||
|
|
|
|
|
|||||
| Net Earnings Attributable to Esterline |
$ | 5,084 | $ | 28,599 | ||||
|
|
|
|
|
|||||
| Earnings (Loss) Per Share—Basic: |
||||||||
| Continuing Operations |
$ | .33 | $ | 1.09 | ||||
| Discontinued Operations |
(.16 | ) | (.19 | ) | ||||
|
|
|
|
|
|||||
| Earnings (Loss) Per Share—Basic |
$ | .17 | $ | .90 | ||||
|
|
|
|
|
|||||
| Earnings (Loss) Per Share—Diluted: |
||||||||
| Continuing Operations |
$ | .33 | $ | 1.06 | ||||
| Discontinued Operations |
(.16 | ) | (.18 | ) | ||||
|
|
|
|
|
|||||
| Earnings (Loss) Per Share—Diluted |
$ | .17 | $ | .88 | ||||
|
|
|
|
|
|||||
| Weighted Average Numberof Shares Outstanding—Basic |
29,582 | 31,790 | ||||||
| Weighted Average Numberof Shares Outstanding—Diluted |
29,939 | 32,364 | ||||||
Page 7 of 8 Esterline Reports Fiscal 2016 First Quarter Financial Results
ESTERLINE TECHNOLOGIES CORPORATION
Consolidated Sales and Earnings from Continuing Operations by Segment (unaudited)
In thousands
| Three Months Ended | ||||||||
| January 1, 2016 |
December 26, 2014 |
|||||||
| (Recast) | ||||||||
| Segment Sales |
||||||||
| Avionics & Controls |
$ | 186,245 | $ | 206,617 | ||||
| Sensors & Systems |
152,430 | 182,894 | ||||||
| Advanced Materials |
102,802 | 115,100 | ||||||
|
|
|
|
|
|||||
| Net Sales |
$ | 441,477 | $ | 504,611 | ||||
|
|
|
|
|
|||||
| Earnings From Continuing Operations Before Income Taxes |
||||||||
| Avionics & Controls |
$ | 9,413 | $ | 37,399 | ||||
| Sensors & Systems |
12,784 | 17,458 | ||||||
| Advanced Materials |
12,990 | 21,555 | ||||||
|
|
|
|
|
|||||
| Segment Earnings |
35,187 | 76,412 | ||||||
| Corporate Expense |
(18,065 | ) | (23,011 | ) | ||||
| Interest Income |
87 | 184 | ||||||
| Interest Expense |
(7,216 | ) | (8,082 | ) | ||||
|
|
|
|
|
|||||
| Earnings From Continuing Operations Before Income Taxes |
$ | 9,993 | $ | 45,503 | ||||
|
|
|
|
|
|||||
Page 8 of 8 Esterline Reports Fiscal 2016 First Quarter Financial Results
ESTERLINE TECHNOLOGIES CORPORATION
Consolidated Balance Sheet (unaudited)
In thousands
| January 1, | October 2, | |||||||
| 2016 | 2015 | |||||||
| Assets |
||||||||
| Current Assets |
||||||||
| Cash and cash equivalents |
$ | 200,891 | $ | 191,355 | ||||
| Accounts receivable, net |
342,008 | 380,748 | ||||||
| Inventories |
447,272 | 446,768 | ||||||
| Income tax refundable |
12,224 | 12,575 | ||||||
| Deferred income tax benefits |
42,124 | 41,082 | ||||||
| Prepaid expenses |
21,216 | 23,008 | ||||||
| Other current assets |
7,072 | 5,427 | ||||||
| Current assets of businesses held for sale |
25,721 | 27,851 | ||||||
|
|
|
|
|
|||||
| Total Current Assets |
1,098,528 | 1,128,814 | ||||||
| Property, Plant and Equipment, Net |
307,586 | 309,399 | ||||||
| Other Non-Current Assets |
||||||||
| Goodwill |
1,019,506 | 1,041,991 | ||||||
| Intangibles, net |
429,250 | 452,040 | ||||||
| Deferred income tax benefits |
27,636 | 28,979 | ||||||
| Other assets |
14,413 | 14,348 | ||||||
| Non-current assets of businesses held for sale |
22,403 | 24,917 | ||||||
|
|
|
|
|
|||||
| $ | 2,919,322 | $ | 3,000,488 | |||||
|
|
|
|
|
|||||
| Liabilities and Shareholders’ Equity |
||||||||
| Current Liabilities |
||||||||
| Accounts payable |
$ | 116,025 | $ | 117,976 | ||||
| Accrued liabilities |
245,997 | 259,734 | ||||||
| Current maturities of long-term debt |
16,947 | 13,376 | ||||||
| Federal and foreign income taxes |
1,721 | 2,404 | ||||||
| Current liabilities of businesses held for sale |
18,047 | 17,106 | ||||||
|
|
|
|
|
|||||
| Total Current Liabilities |
398,737 | 410,596 | ||||||
| Long-Term Liabilities |
||||||||
| Credit facilities |
150,000 | 160,000 | ||||||
| Long-term debt, net of current maturities |
681,358 | 701,457 | ||||||
| Deferred income tax liabilities |
67,920 | 73,849 | ||||||
| Pension and post-retirement obligations |
72,435 | 75,019 | ||||||
| Other liabilities |
30,910 | 29,367 | ||||||
| Non-current liabilities of businesses held for sale |
642 | 2,409 | ||||||
| Total Shareholders’ Equity |
1,517,320 | 1,547,791 | ||||||
|
|
|
|
|
|||||
| $ | 2,919,322 | $ | 3,000,488 | |||||
|
|
|
|
|
|||||
Q1 2016 Supplemental Financial Information February 4, 2016 Exhibit 99.2
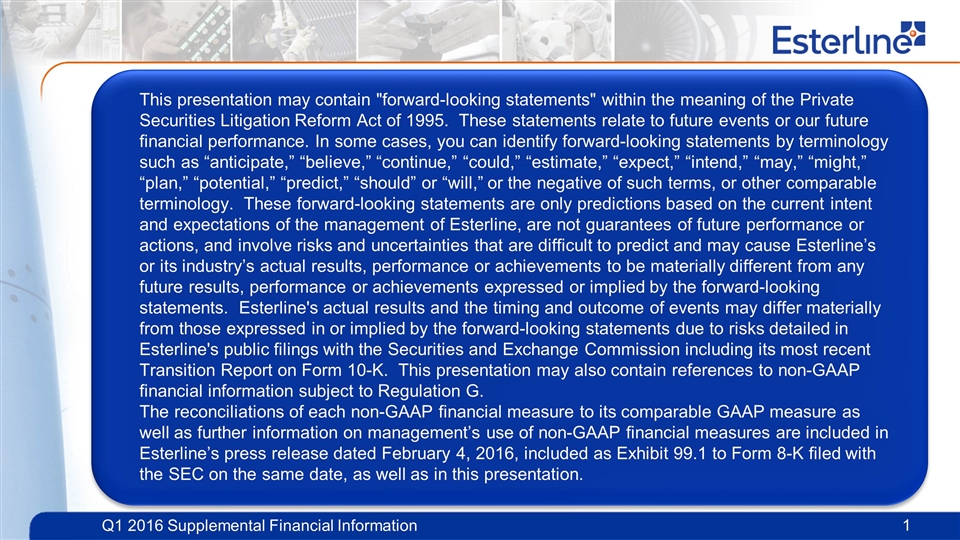
This presentation may contain "forward-looking statements" within the meaning of the Private Securities Litigation Reform Act of 1995. These statements relate to future events or our future financial performance. In some cases, you can identify forward-looking statements by terminology such as “anticipate,” “believe,” “continue,” “could,” “estimate,” “expect,” “intend,” “may,” “might,” “plan,” “potential,” “predict,” “should” or “will,” or the negative of such terms, or other comparable terminology. These forward-looking statements are only predictions based on the current intent and expectations of the management of Esterline, are not guarantees of future performance or actions, and involve risks and uncertainties that are difficult to predict and may cause Esterline’s or its industry’s actual results, performance or achievements to be materially different from any future results, performance or achievements expressed or implied by the forward-looking statements. Esterline's actual results and the timing and outcome of events may differ materially from those expressed in or implied by the forward-looking statements due to risks detailed in Esterline's public filings with the Securities and Exchange Commission including its most recent Transition Report on Form 10-K. This presentation may also contain references to non-GAAP financial information subject to Regulation G. The reconciliations of each non-GAAP financial measure to its comparable GAAP measure as well as further information on management’s use of non-GAAP financial measures are included in Esterline’s press release dated February 4, 2016, included as Exhibit 99.1 to Form 8-K filed with the SEC on the same date, as well as in this presentation.
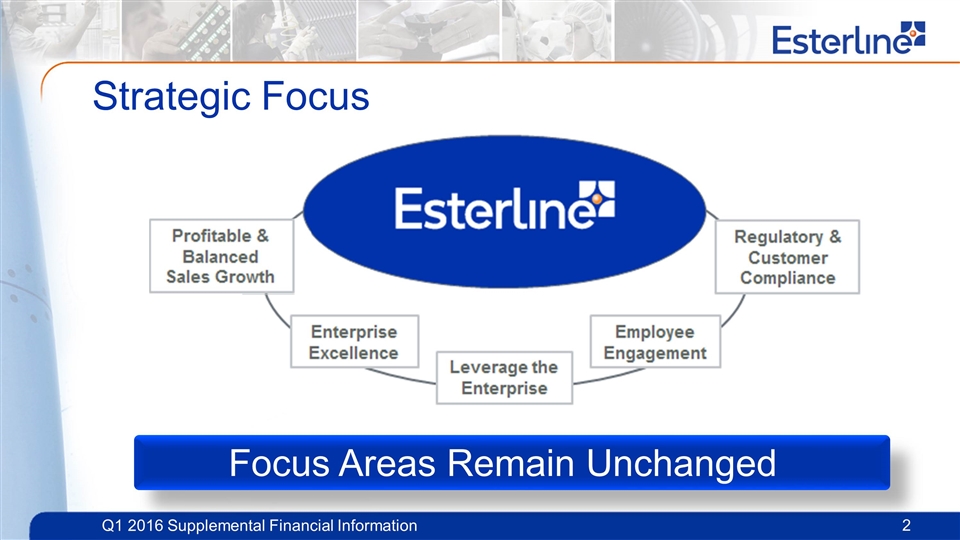
Strategic Focus Focus Areas Remain Unchanged
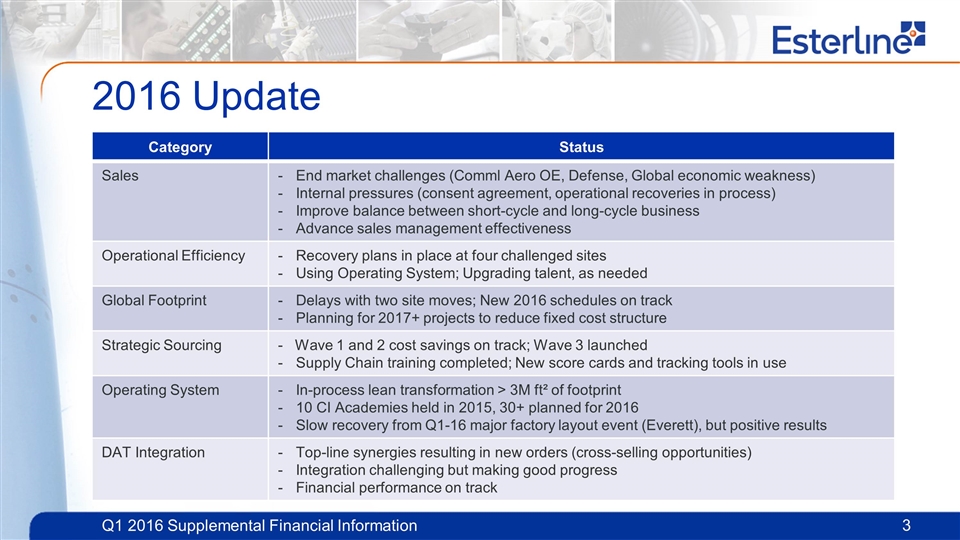
Category Status Sales End market challenges (Comml Aero OE, Defense, Global economic weakness) Internal pressures (consent agreement, operational recoveries in process) Improve balance between short-cycle and long-cycle business Advance sales management effectiveness Operational Efficiency Recovery plans in place at four challenged sites Using Operating System; Upgrading talent, as needed Global Footprint Delays with two site moves; New 2016 schedules on track Planning for 2017+ projects to reduce fixed cost structure Strategic Sourcing - Wave 1 and 2 cost savings on track; Wave 3 launched Supply Chain training completed; New score cards and tracking tools in use Operating System In-process lean transformation > 3M ft² of footprint 10 CI Academies held in 2015, 30+ planned for 2016 Slow recovery from Q1-16 major factory layout event (Everett), but positive results DAT Integration Top-line synergies resulting in new orders (cross-selling opportunities) Integration challenging but making good progress Financial performance on track 2016 Update
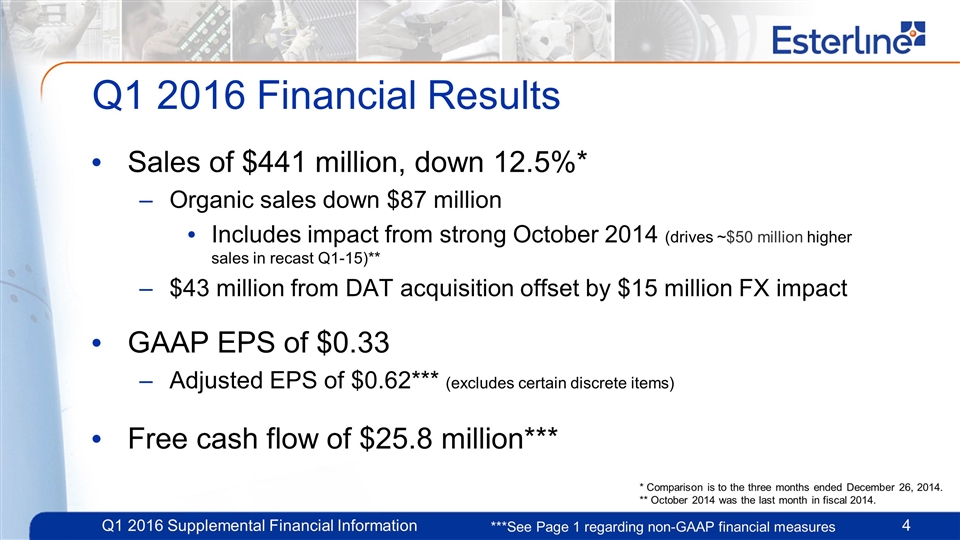
Q1 2016 Financial Results Sales of $441 million, down 12.5%* Organic sales down $87 million Includes impact from strong October 2014 (drives ~$50 million higher sales in recast Q1-15)** $43 million from DAT acquisition offset by $15 million FX impact GAAP EPS of $0.33 Adjusted EPS of $0.62*** (excludes certain discrete items) Free cash flow of $25.8 million*** ***See Page 1 regarding non-GAAP financial measures * Comparison is to the three months ended December 26, 2014. ** October 2014 was the last month in fiscal 2014.
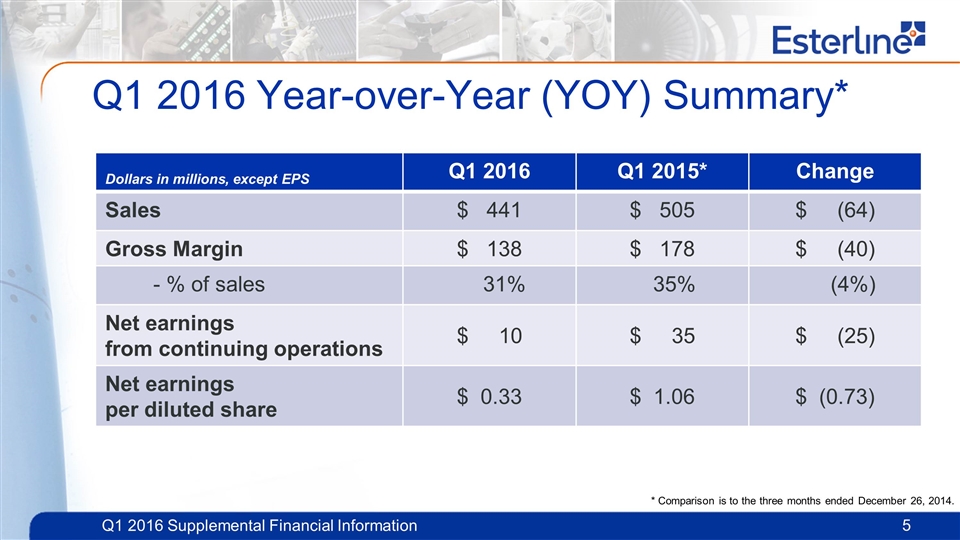
Q1 2016 Year-over-Year (YOY) Summary* Dollars in millions, except EPS Q1 2016 Q1 2015* Change Sales $ 441 $ 505 $ (64) Gross Margin $ 138 $ 178 $ (40) - % of sales 31% 35% (4%) Net earnings from continuing operations $ 10 $ 35 $ (25) Net earnings per diluted share $ 0.33 $ 1.06 $ (0.73) * Comparison is to the three months ended December 26, 2014.
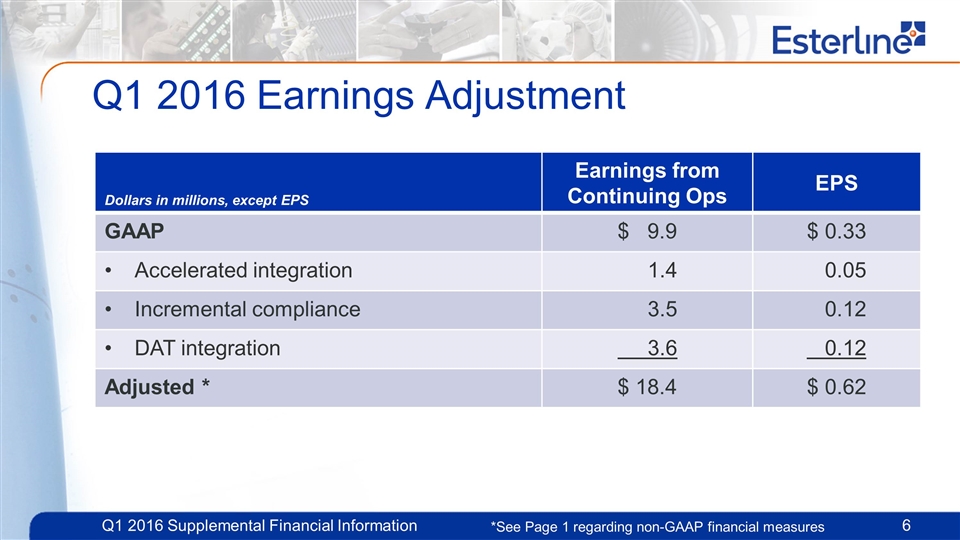
Q1 2016 Earnings Adjustment Dollars in millions, except EPS Earnings from Continuing Ops EPS GAAP $ 9.9 $ 0.33 Accelerated integration 1.4 0.05 Incremental compliance 3.5 0.12 DAT integration 3.6 0.12 Adjusted * $ 18.4 $ 0.62 *See Page 1 regarding non-GAAP financial measures
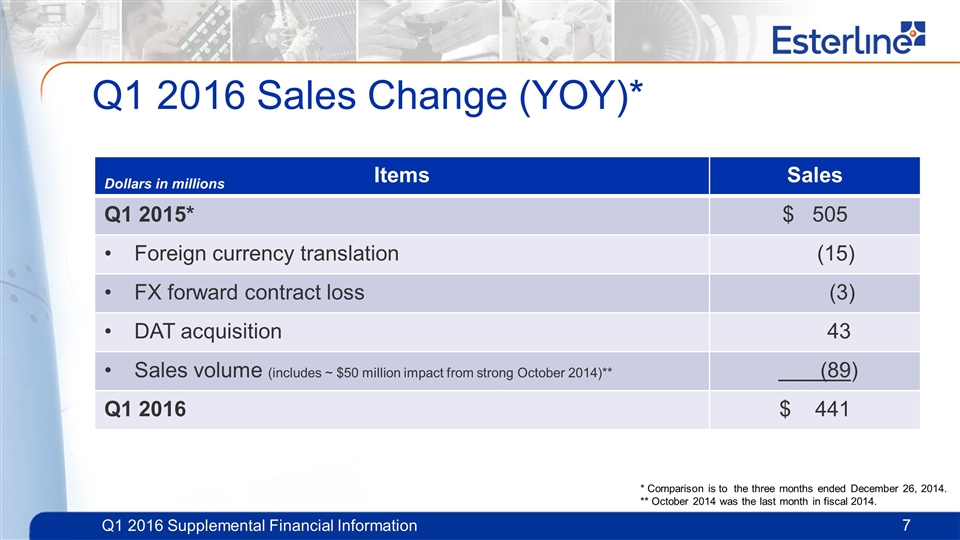
Q1 2016 Sales Change (YOY)* Items Sales Q1 2015* $ 505 Foreign currency translation (15) FX forward contract loss (3) DAT acquisition 43 Sales volume (includes ~ $50 million impact from strong October 2014)** (89) Q1 2016 $ 441 Dollars in millions * Comparison is to the three months ended December 26, 2014. ** October 2014 was the last month in fiscal 2014.
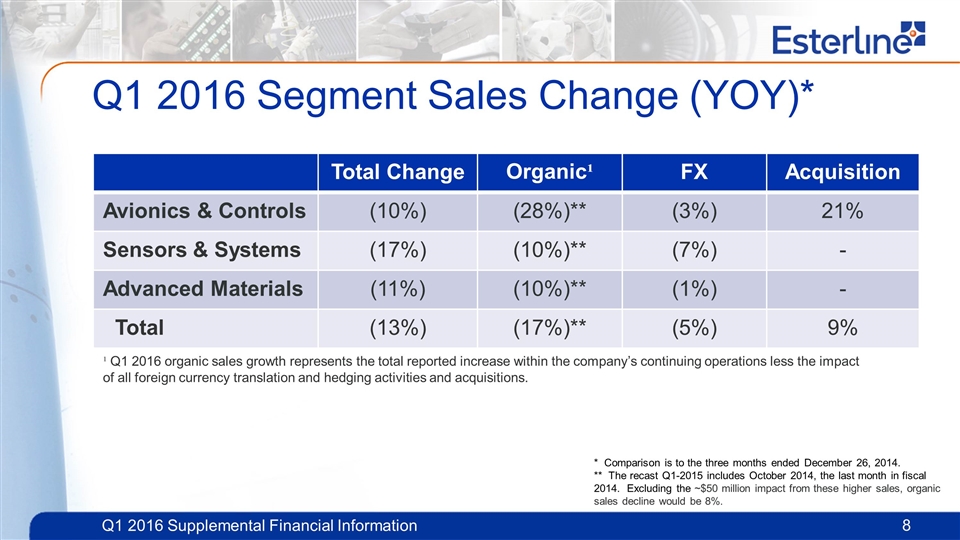
Q1 2016 Segment Sales Change (YOY)* Total Change Organic¹ FX Acquisition Avionics & Controls (10%) (28%)** (3%) 21% Sensors & Systems (17%) (10%)** (7%) - Advanced Materials (11%) (10%)** (1%) - Total (13%) (17%)** (5%) 9% ¹ Q1 2016 organic sales growth represents the total reported increase within the company’s continuing operations less the impact of all foreign currency translation and hedging activities and acquisitions. * Comparison is to the three months ended December 26, 2014. ** The recast Q1-2015 includes October 2014, the last month in fiscal 2014. Excluding the ~$50 million impact from these higher sales, organic sales decline would be 8%.
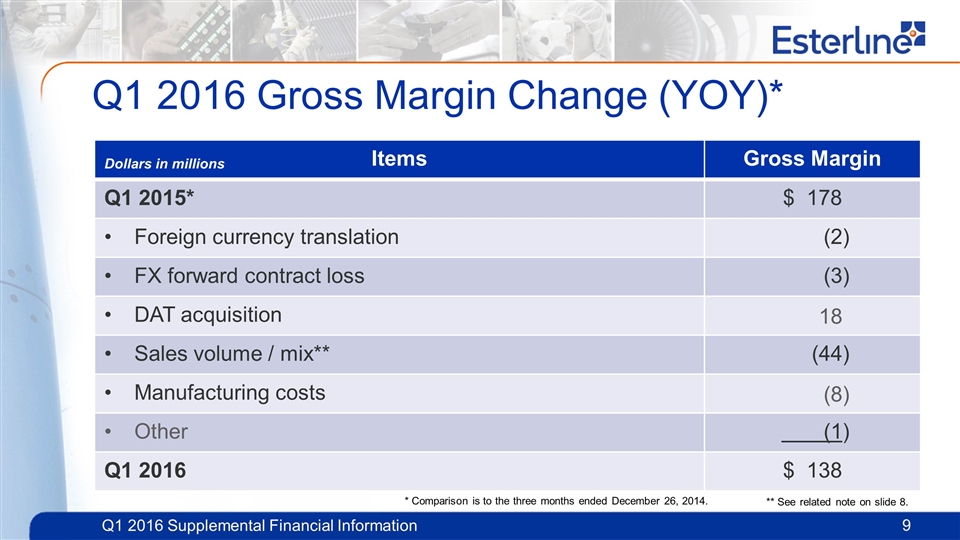
Q1 2016 Gross Margin Change (YOY)* Items Gross Margin Q1 2015* $ 178 Foreign currency translation (2) FX forward contract loss (3) DAT acquisition 18 Sales volume / mix** (44) Manufacturing costs (8) Other (1) Q1 2016 $ 138 Dollars in millions ** See related note on slide 8. * Comparison is to the three months ended December 26, 2014.
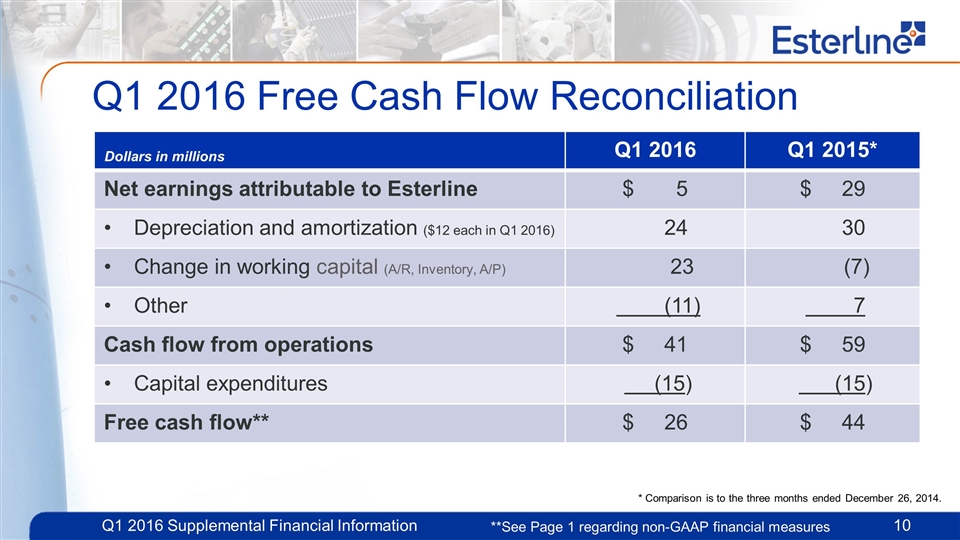
Q1 2016 Free Cash Flow Reconciliation Q1 2016 Q1 2015* Net earnings attributable to Esterline $ 5 $ 29 Depreciation and amortization ($12 each in Q1 2016) 24 30 Change in working capital (A/R, Inventory, A/P) 23 (7) Other (11) 7 Cash flow from operations $ 41 $ 59 Capital expenditures (15) (15) Free cash flow** $ 26 $ 44 Dollars in millions **See Page 1 regarding non-GAAP financial measures * Comparison is to the three months ended December 26, 2014.
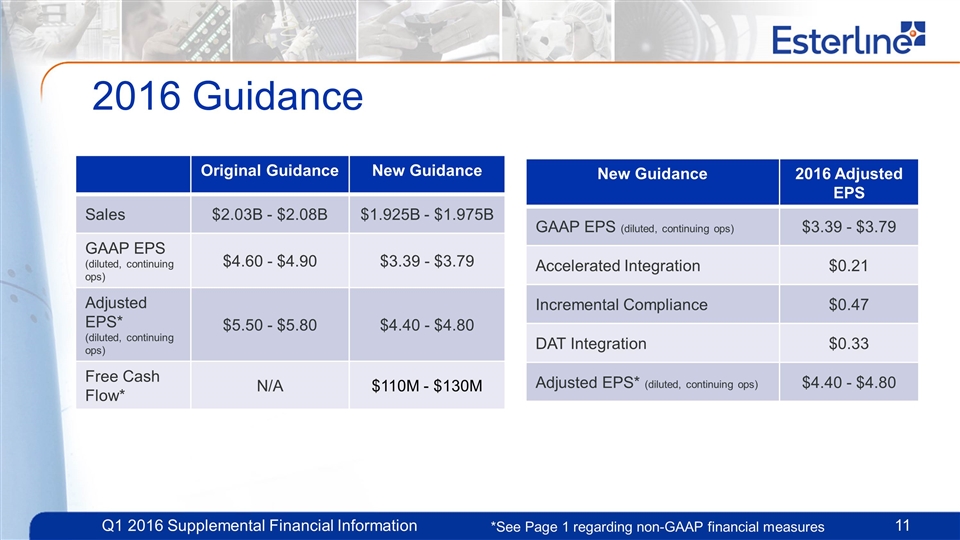
2016 Guidance Original Guidance New Guidance Sales $2.03B - $2.08B $1.925B - $1.975B GAAP EPS (diluted, continuing ops) $4.60 - $4.90 $3.39 - $3.79 Adjusted EPS* (diluted, continuing ops) $5.50 - $5.80 $4.40 - $4.80 Free Cash Flow* N/A $110M - $130M *See Page 1 regarding non-GAAP financial measures New Guidance 2016 Adjusted EPS GAAP EPS (diluted, continuing ops) $3.39 - $3.79 Accelerated Integration $0.21 Incremental Compliance $0.47 DAT Integration $0.33 Adjusted EPS* (diluted, continuing ops) $4.40 - $4.80
Appendix
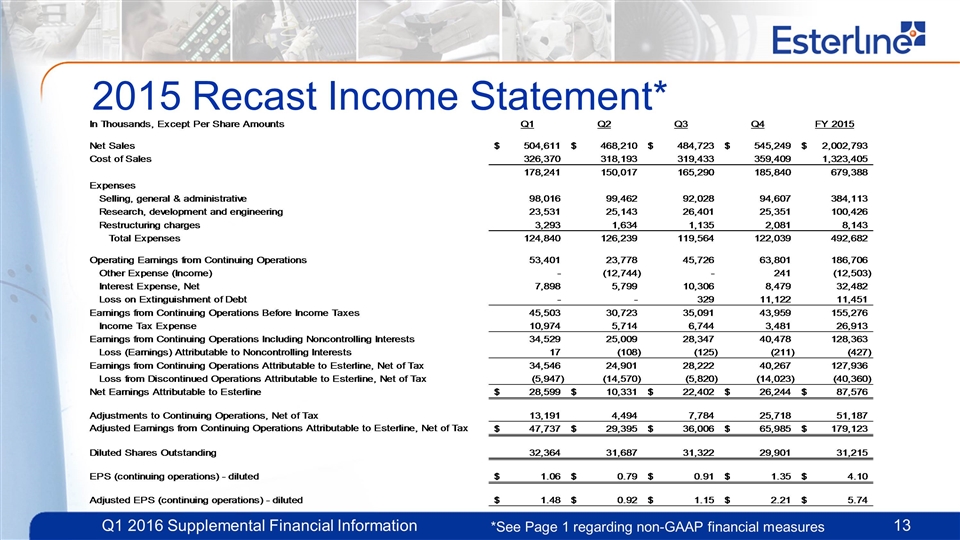
2015 Recast Income Statement* *See Page 1 regarding non-GAAP financial measures
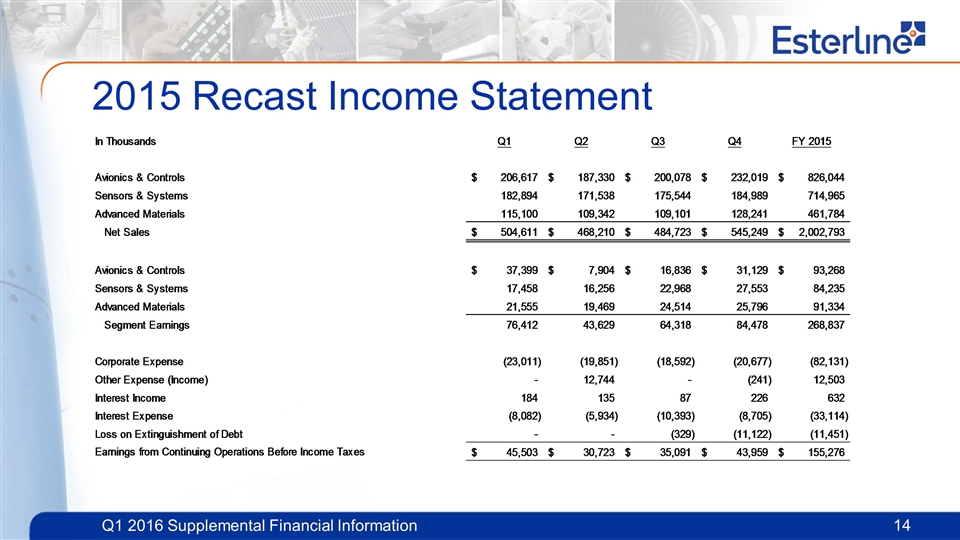
2015 Recast Income Statement
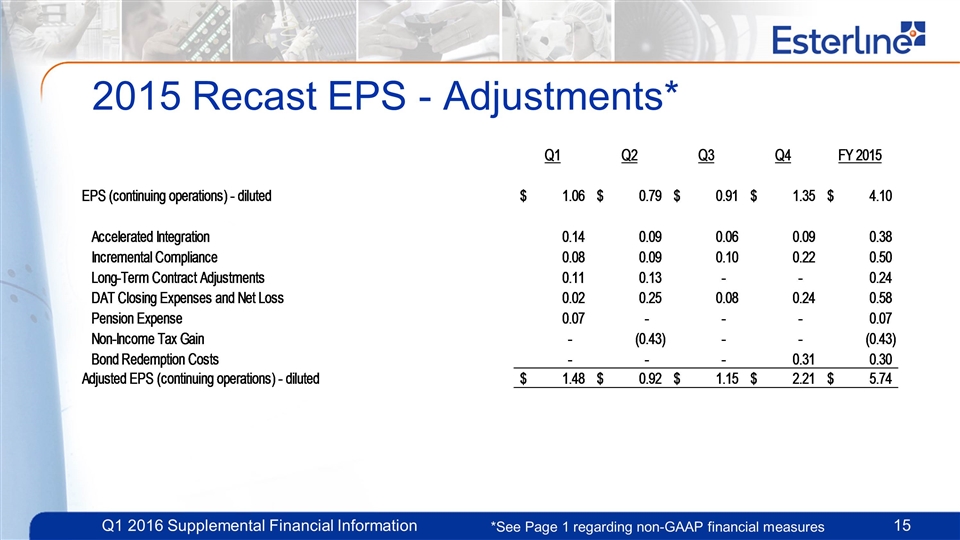
2015 Recast EPS - Adjustments* *See Page 1 regarding non-GAAP financial measures
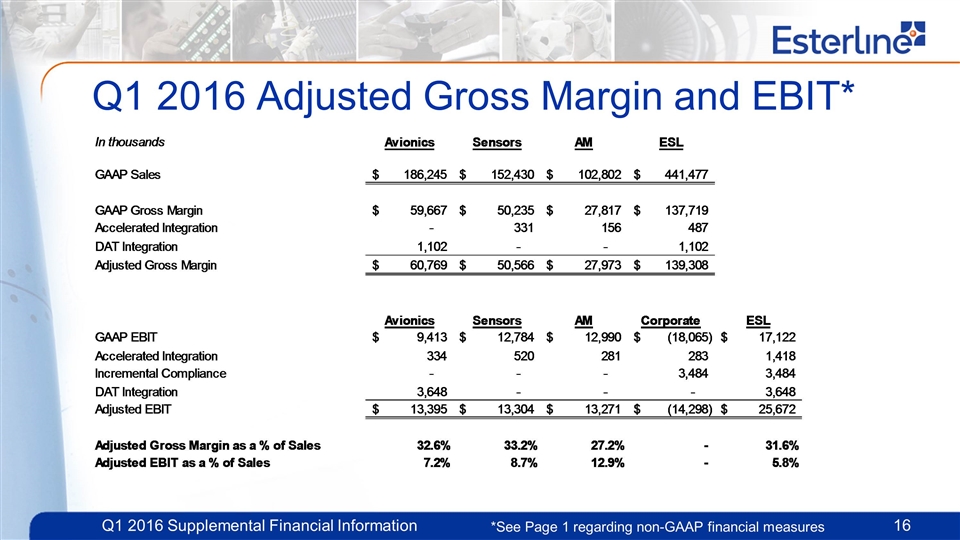
Q1 2016 Adjusted Gross Margin and EBIT* *See Page 1 regarding non-GAAP financial measures
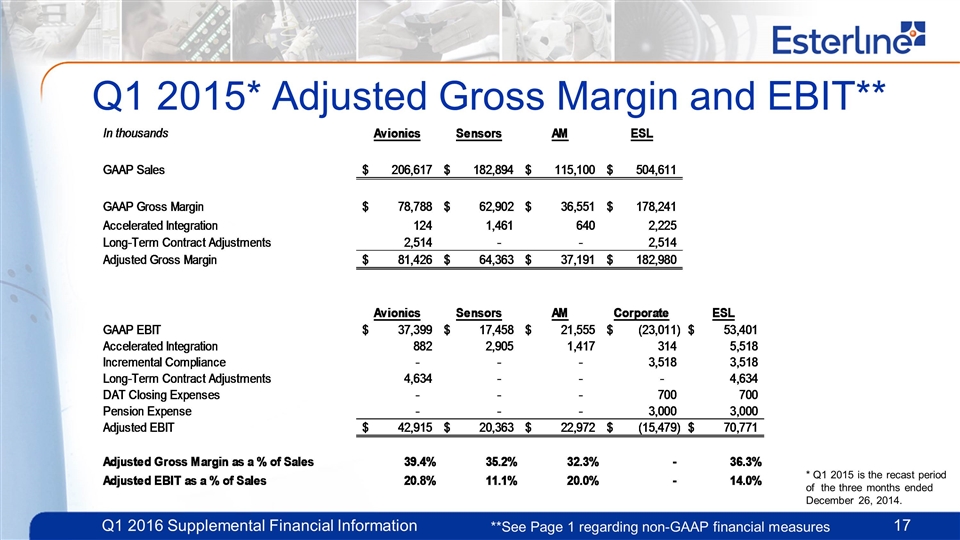
Q1 2015* Adjusted Gross Margin and EBIT** **See Page 1 regarding non-GAAP financial measures * Q1 2015 is the recast period of the three months ended December 26, 2014.
Serious News for Serious Traders! Try StreetInsider.com Premium Free!
You May Also Be Interested In
- New Crypto: AlphaPepe Presale To Announce 5th CEX Within 2 Weeks While Solana Price Prediction Targets $1,000
- Uniswap Price Prediction: DeFi Tokens Return to Focus as Remittix Approaches Its Planned $0.46 Final Stage
- Light & Wonder Releases 2025 Global Corporate Social Responsibility Report
Create E-mail Alert Related Categories
SEC FilingsSign up for StreetInsider Free!
Receive full access to all new and archived articles, unlimited portfolio tracking, e-mail alerts, custom newswires and RSS feeds - and more!
