




Form 8-K ERA GROUP INC. For: Aug 04

FREE Breaking News Alerts from StreetInsider.com!
StreetInsider.com Top Tickers, 10/7/2026
- Nasdaq, S&P 500 slip from record highs as yields and oil rebound
- Want to be a stock market bear? BCA says watch potential U.S. tax increases
- SpaceX seeks $40bn in financing for Nvidia chip purchase
- Chip stock could soar nearly 200%, analyst says: "If you don’t buy it, they will"
- Musk rules out TSMC role in Terafab operations; Intel gains
 Tweet
Tweet Share
Share E-mail
UNITED STATES
SECURITIES AND EXCHANGE COMMISSION
WASHINGTON, DC 20549
FORM 8-K
CURRENT REPORT
Pursuant to Section 13 or 15(d) of the
Securities Exchange Act of 1934
Date of Report (Date of earliest event reported): August 4, 2015
Era Group Inc. |
(Exact Name of Registrant as Specified in Its Charter) |
Delaware | 1-35701 | 72-1455213 | ||
(State or Other Jurisdiction of Incorporation) | (Commission File Number) | (IRS Employer Identification No.) | ||
818 Town & Country Blvd., Suite 200 Houston, Texas | 77024 | |
(Address of Principal Executive Offices) | (Zip Code) | |
Registrant’s telephone number, including area code | (713) 369-4700 | |
Not Applicable |
(Former Name or Former Address, if Changed Since Last Report) |
Check the appropriate box below if the Form 8-K filing is intended to simultaneously satisfy the filing obligation of the registrant under any of the following provisions:
o | Written communications pursuant to Rule 425 under the Securities Act (17 CFR 230.425) |
o | Soliciting material pursuant to Rule 14a-12 under the Exchange Act (17 CFR 240.14a-12) |
o | Pre-commencement communications pursuant to Rule 14d-2(b) under the Exchange Act (17 CFR 240.14d-2(b)) |
o | Pre-commencement communications pursuant to Rule 13e-4(c) under the Exchange Act (17 CFR 240.13e-4(c)) |
Item 2.02 Results of Operations and Financial Condition
On August 4, 2015, Era Group Inc. (“Era Group”) issued a press release setting forth its second quarter 2015 earnings. A copy of the press release is attached hereto as Exhibit 99.1 and hereby incorporated by reference.
The information furnished pursuant to Item 2.02, including Exhibit 99.1, shall not be deemed “filed” for purposes of Section 18 of the Securities Exchange Act of 1934, as amended (the “Exchange Act”), or otherwise subject to the liabilities of that Section, and shall not be incorporated by reference in any filing under the Securities Act of 1933, as amended (the “Securities Act”), or the Exchange Act, except as shall be expressly set forth by specific reference in such a filing.
Item 7.01 Regulation FD Disclosure
On August 5, 2015, Era Group will make a presentation about its second quarter 2015 earnings as noted in the press release described in Item 2.02 above. A copy of the presentation slides are attached hereto as Exhibit 99.2. Additionally, Era Group has posted the presentation on its website at www.eragroupinc.com.
The information furnished pursuant to Item 7.01, including Exhibit 99.2, shall not be deemed “filed” for purposes of Section 18 of the Exchange Act or otherwise subject to the liabilities of that Section, and shall not be incorporated by reference in any filing under the Securities Act or the Exchange Act, except as shall be expressly set forth by specific reference in such a filing.
Item 9.01 Financial Statements and Exhibits
99.1 Press Release of Era Group Inc., dated August 4, 2015.
99.2 Presentation Slides
SIGNATURES
Pursuant to the requirements of the Securities Exchange Act of 1934, the registrant has duly caused this report to be signed on its behalf by the undersigned hereunto duly authorized.
Era Group Inc. | ||||
August 4, 2015 | By: | /s/ Christopher S. Bradshaw | ||
Name: Christopher S. Bradshaw | ||||
Title: President, Chief Executive Officer and Chief Financial Officer | ||||
Exhibit Index
Exhibit No. | Description |
99.1 | Press Release of Era Group Inc., dated August 4, 2015 |
99.2 | Presentation Slides |
Exhibit 99.1
PRESS RELEASE
ERA GROUP INC. REPORTS
SECOND QUARTER 2015 RESULTS
Houston, Texas
August 4, 2015
FOR IMMEDIATE RELEASE — Era Group Inc. (NYSE: ERA) today reported net income of $11.3 million, or $0.55 per diluted share, for its second quarter ended June 30, 2015 (“current quarter”) on operating revenues of $70.7 million compared to net income for the quarter ended June 30, 2014 (“prior year quarter”) of $5.2 million, or $0.26 per diluted share, on operating revenues of $86.6 million. Excluding a pre-tax gain of $12.9 million on the sale of the Company’s fixed base operations (“FBO”) business in Alaska and a one-time net deferred tax expense of $1.0 million in connection with the Sicher acquisition discussed below, current quarter net income would have been $4.1 million, or $0.20 per diluted share.
Earnings before interest, taxes, depreciation and amortization (“EBITDA”) was $33.2 million in the current quarter compared to $23.1 million in the prior year quarter. EBITDA adjusted to exclude gains or losses on asset dispositions and special items was $20.5 million in the current quarter compared to $22.4 million in the prior year quarter. The Company sold five single engine helicopters for losses of $0.2 million in the current quarter compared to gains of $3.1 million in the prior year quarter. Special items in the current quarter consisted of the $12.9 million pre-tax gain on the sale of the Company’s FBO business in Alaska. Special items in the prior year quarter consisted of a $2.5 million pre-tax impairment charge related to a probable loss of a note receivable.
“We are pleased to announce strong profitability in the second quarter despite the challenging industry environment,” said Chris Bradshaw, President, Chief Executive Officer and Chief Financial Officer of Era Group Inc. “Although operating revenues declined $15.8 million compared to the prior year quarter, EBITDA adjusted to exclude gains on asset sales and special items declined only $1.9 million due to effective cost controls and improved efficiency. I want to thank the entire Era team for their contributions in achieving this 3% margin improvement despite an 18% decline in revenues. As further evidence of the success of these efforts, EBITDA adjusted to exclude gains on asset sales, special items and the effects of foreign currency fluctuations increased by 43% on a sequential quarter basis.”
“We are also pleased to announce entry into the Colombian market via the acquisition of Sicher Helicopters SAS. While Colombia has historically been an onshore oil and gas market, the acquisition of Sicher’s air operator certificate and existing operations should allow us to capitalize on the growing demand for new generation helicopters, operated with the highest safety standards, to support the international oil and gas companies who are exploring and developing Colombia’s promising offshore blocks.”
Second Quarter Results
Operating revenues in the current quarter were $15.8 million lower than the prior year quarter primarily due to lower utilization of our medium helicopters and the sale of our FBO business in Alaska.
Operating expenses were $14.9 million lower in the current quarter primarily due to decreased repairs and maintenance expenses, fuel expenses and personnel costs.
Administrative and general expenses were $0.7 million higher primarily due to increased professional service fees.
1
Gains on asset dispositions were $3.4 million lower in the current quarter. In the current quarter, we sold five single engine helicopters for proceeds of $3.0 million and recognized losses of $0.2 million. During the prior year quarter, we sold one medium helicopter for total proceeds of $3.4 million resulting in gains of $3.1 million.
We sold our FBO business in Alaska during the current quarter for cash proceeds of $14.3 million and a pre-tax gain of $12.9 million.
Equity earnings were $0.7 million lower in the current quarter primarily due to the absence of earnings from Lake Palma S.A. (“Lake Palma”), which was sold in July 2014, and losses from our Dart Holding Company Ltd. (“Dart”) joint venture.
Six Months Results
The Company reported net income of $11.3 million, or $0.55 per diluted share, for the six months ended June 30, 2015 (“current six months”) on operating revenues of $138.2 million compared to net income for the six months ended June 30, 2014 (“prior six months”) of $9.7 million, or $0.48 per diluted share, on operating revenues of $166.0 million. In addition to the gains on asset dispositions and special items noted below, the current six months also included $2.4 million of foreign currency losses primarily due to the strengthening of the U.S. dollar resulting in losses on our euro denominated cash balances.
EBITDA was $47.8 million in the current six months compared to $44.8 million in the prior six months. EBITDA adjusted to exclude gains on asset dispositions and special items was $31.5 million in the current six months compared to $41.3 million in the prior six months. Special items in the current six months consisted of the $12.9 million pre-tax gain on the sale of our FBO business in Alaska and a $0.3 million gain on the repurchase of a portion of our 7.750% senior unsecured notes. Special items in the prior six months consisted of a $2.5 million pre-tax impairment charge related to a probable loss of a note receivable.
Operating revenues in the current six months were $27.9 million lower than in the prior six months primarily due to lower utilization of our medium helicopters and the sale of our FBO business in Alaska. Operating expenses were $20.9 million lower primarily due to decreased repairs and maintenance expenses, fuel expenses and personnel costs. Administrative and general expenses were $0.9 million lower primarily due to reduced headcount in the current six months and accelerated stock amortization expense related to changes in senior management in the prior six months. Equity earnings were $1.4 million lower primarily due to the absence of earnings from Lake Palma and losses from Dart.
Sequential Quarter Results
Operating revenues in the current quarter were $3.3 million higher compared to the quarter ended March 31, 2015 (“preceding quarter”) primarily due to the seasonal increase of activities in Alaska, partially offset by the sale of the FBO.
Operating expenses were $3.8 million lower compared to the preceding quarter primarily due to decreases in personnel, repairs and maintenance, parts cost of sales, and fuel expenses.
Administrative and general expenses were $1.0 million higher compared to the preceding quarter primarily due to increased professional service fees and compensation expenses.
Gains on asset dispositions were $3.6 million lower compared to the preceding quarter.
Foreign currency gains positively impacted sequential quarter results by $3.5 million, primarily due to the weakening of the U.S. dollar versus the euro in the current quarter.
EBITDA was $18.6 million higher compared to the preceding quarter. EBITDA adjusted to exclude gains or losses on asset dispositions and special items was $9.6 million higher compared to the preceding quarter.
2
Net income was $11.4 million higher compared to the preceding quarter. Excluding the $12.9 million pre-tax gain on the sale of the FBO and the one-time net deferred tax expense of $1.0 million in connection with the Sicher acquisition discussed below, net income would have been $4.2 million higher compared to the preceding quarter.
Sicher Acquisition
In April 2015, the Company acquired a 75% interest in Hauser Investments Limited which owns 100% of Sicher Helicopters SAS (“Sicher”). Sicher, headquartered in Bogota, is one of the leading helicopter operators in Colombia with a strong presence in the existing onshore oil and gas market. The purchase price included the contribution of an AW139 medium helicopter and $3.2 million in cash. In addition to a Colombian air operator certificate and a hangar facility, the acquired assets include three BO-105 light twin helicopters and one AS350 single engine helicopter. In connection with the acquisition, the transfer of the AW139 helicopter was treated as a sale for U.S. income tax purposes. Accordingly, the Company recognized a one-time income tax expense of $1.0 million, which has been recorded as a deferred tax liability as the Company plans to qualify the sale for like-kind exchange treatment under the Internal Revenue Code.
FBO Sale
On May 1, 2015, the Company sold its FBO business at Ted Stevens Anchorage International Airport to Piedmont Hawthorne Aviation, LLC. Pursuant to the agreement, Piedmont Hawthorne Aviation, LLC acquired 100% of Era Group’s wholly-owned subsidiary, Era FBO LLC, for cash proceeds of $14.3 million.
Houma Super Base Grand Opening
On June 25, 2015, the Company celebrated the grand opening of its 35-acre super base in Houma, Louisiana, which is now the premier helicopter operating facility in the Gulf Coast region. Designed with safety as the top operational priority, the new Houma facility features enhanced storm protection, state-of-the-art fire suppression systems, reduced flyaway limitations and an airport infrastructure equipped to provide increased reliability of flight operations in adverse weather conditions. The implementation of automated check-in kiosks, enhanced baggage transfer capabilities, robust security screening equipment and additional customer service functions will streamline passenger processing. The new, larger passenger terminal features a variety of amenities including real-time flight status screens, big screen televisions, guest wi-fi access, comfortable seating and expanded food and beverage selections. The new, larger maintenance hangar is fully climate controlled and features advanced crane systems. Era’s new super base in Houma will house more than 30 aircraft and facilitate approximately 15,000 passengers per month traveling to and from offshore oil and gas installations in the U.S. Gulf of Mexico.
Fleet Update
During the current quarter, the Company’s capital expenditures were $30.8 million, which consisted primarily of deposit payments for S92 heavy helicopters and our base expansion project in Houma, Louisiana.
The excess capacity in our medium helicopter fleet remains greater than in recent periods. Excess helicopters include our helicopters other than those under customer contracts, undergoing maintenance or dedicated for charter activity. We are participating in several competitive bids to place some or all of the excess medium helicopters on contract. We have recently been awarded a number of new contracts in the U.S. Gulf of Mexico and Brazil. Some of those contracts have already begun, but most of them are not scheduled to begin until the second half of 2015 or early 2016. If we are not successful in securing sufficient new projects, our financial results will be negatively impacted. In addition, we may sell certain helicopters on an opportunistic basis consistent with our stated strategy.
Capital Commitments
The Company’s unfunded capital commitments as of June 30, 2015 consisted primarily of orders for helicopters and totaled $175.0 million, of which $66.4 million is payable during 2015 with the balance payable through 2017. The Company also had $1.7 million of deposits paid on options not yet exercised. The
3
Company may terminate $106.7 million of its total commitments (inclusive of deposits paid on options not yet exercised) without further liability other than aggregate liquidated damages of $2.5 million.
Included in these capital commitments are agreements to purchase nine AW189 heavy helicopters, four S92 heavy helicopters and five AW169 light twin helicopters. The AW189 helicopters are scheduled to be delivered beginning in 2015 through 2017. The S92 helicopters are scheduled to be delivered in 2015 through 2017. Delivery dates for the AW169 helicopters have yet to be determined. In addition, the Company had outstanding options to purchase up to an additional ten AW189 helicopters and four S92 helicopters. If these options are exercised, the helicopters would be scheduled for delivery beginning in 2016 through 2018.
Liquidity
As of June 30, 2015, the Company had $17.0 million in cash balances and remaining availability under its senior secured revolving credit facility of $219.1 million. The Company also had $6.8 million of escrow deposits.
Conference Call
Management will conduct a conference call starting at 10:00 a.m. ET (9:00 a.m. CT) on Wednesday, August 5, 2015, to review the results for the second quarter ended June 30, 2015. The conference call can be accessed as follows:
All callers will need to reference the access code 5317676
Within the U.S.: Operator Assisted Toll-Free Dial-In Number: (888) 218-8176
Outside the U.S.: Operator Assisted International Dial-In Number: (913) 312-0979
Replay
A telephone replay will be available through August 19, 2015 and may be accessed by calling (888) 203-1112 for domestic callers or (719) 457-0820 for international callers. An audio replay will also be available on the Company’s website at www.eragroupinc.com shortly after the call and will be accessible for approximately 90 days.
4
About Era Group
Era Group is one of the largest helicopter operators in the world and the longest serving helicopter transport operator in the U.S. In addition to servicing its U.S. customers, Era Group also provides helicopters and related services to third-party helicopter operators and customers in other countries, including Brazil, Colombia, India, Norway, Spain, and the United Kingdom. Era Group’s helicopters are primarily used to transport personnel to, from and between offshore installations, drilling rigs and platforms.
Certain statements discussed in this release as well as in other reports, materials and oral statements that the Company releases from time to time to the public include "forward-looking statements" within the meaning of Section 27A of the Securities Act of 1933, as amended, and Section 21E of the Securities Exchange Act of 1934, as amended. Such forward-looking statements concerning management's expectations, strategic objectives, business prospects, anticipated performance and financial condition and other similar matters involve known and unknown risks, uncertainties and other important factors that could cause the actual results, performance or achievements of results to differ materially from any future results, performance or achievements discussed or implied by such forward-looking statements. Such risks, uncertainties and other important factors include, among others, the Company’s dependence on, and the cyclical nature of, offshore oil and gas exploration, development and production activity; fluctuations in worldwide prices of and demand for oil and natural gas; the Company’s reliance on a small number of customers and reduction of the Company’s customer base resulting from consolidation; inherent risks in operating helicopters; the failure to maintain an acceptable safety record; the ability to successfully expand into other geographic and helicopter service markets; the impact of increased United States (“U.S.”) and foreign government regulation and legislation, including potential government implemented moratoriums on drilling activities; the requirement to engage in competitive processes or expend significant resources with no guaranty of recoupment; the grounding of all or a portion of the Company’s fleet for extended periods of time or indefinitely; reduction or cancellation of services for government agencies; the Company’s reliance on a small number of helicopter manufacturers and suppliers; political instability, governmental action, war, acts of terrorism and changes in the economic condition in any foreign country where the Company does business, which may result in expropriation, nationalization, confiscation or deprivation of its assets or result in claims of a force majeure situation; declines in the global economy and financial markets; foreign currency exchange controls and exposure, including the impact of fluctuations in foreign currency exchange rates on the Company’s cost to purchase helicopters, spare parts and related services and on asset values; credit risk exposure; the ongoing need to replace aging helicopters; the Company’s reliance on the secondary used helicopter market to dispose of older helicopters; the Company’s reliance on information technology; allocation of risk between the Company and its customers; liability, legal fees and costs in connection with providing emergency response services; risks associated with the Company’s debt structure; operational and financial difficulties of the Company’s joint ventures and partners; conflict with the other owners of the Company’s non-wholly owned subsidiaries and other equity investees; adverse results of legal proceedings; adverse weather conditions and seasonality; adequacy of insurance coverage; the attraction and retention of qualified personnel; restrictions on the amount of foreign ownership of the Company’s common stock; and various other matters and factors, many of which are beyond the Company’s control. In addition, these statements constitute Era Group's cautionary statements under the Private Securities Litigation Reform Act of 1995. It is not possible to predict or identify all such factors. Consequently, the foregoing should not be considered a complete discussion of all potential risks or uncertainties. The words "estimate," "project," "intend," "believe," "plan" and similar expressions are intended to identify forward-looking statements. Forward-looking statements speak only as of the date of the document in which they are made. Era Group disclaims any obligation or undertaking to provide any updates or revisions to any forward-looking statement to reflect any change in Era Group's expectations or any change in events, conditions or circumstances on which the forward-looking statement is based. The forward-looking statements in this release should be evaluated together with the many uncertainties that affect the Company's businesses, particularly those mentioned under "Risk Factors" in Era Group's Annual Report on Form 10-K for the year ended December 31, 2014, in Era Group's subsequent Quarterly Reports on Form 10-Q and in Era Group's current reporting on Form 8-K (if any), which are incorporated by reference.
For additional information concerning Era Group, contact Benjamin Slusarchuk at (713) 369-4630 or visit Era Group’s website at www.eragroupinc.com.
5
ERA GROUP INC. CONDENSED CONSOLIDATED STATEMENTS OF OPERATIONS (unaudited, in thousands, except share and per share amounts) | ||||||||||||||||
Three Months Ended June 30, | Six Months Ended June 30, | |||||||||||||||
2015 | 2014 | 2015 | 2014 | |||||||||||||
Operating revenues | $ | 70,738 | $ | 86,580 | $ | 138,153 | $ | 166,023 | ||||||||
Costs and expenses: | ||||||||||||||||
Operating | 39,784 | 54,679 | 83,389 | 104,319 | ||||||||||||
Administrative and general | 10,779 | 10,065 | 20,522 | 21,399 | ||||||||||||
Depreciation | 11,398 | 11,425 | 23,000 | 22,712 | ||||||||||||
Total costs and expenses | 61,961 | 76,169 | 126,911 | 148,430 | ||||||||||||
Gains (losses) on asset dispositions, net | (242 | ) | 3,139 | 3,146 | 6,030 | |||||||||||
Operating income | 8,535 | 13,550 | 14,388 | 23,623 | ||||||||||||
Other income (expense): | ||||||||||||||||
Interest income | 317 | 143 | 568 | 288 | ||||||||||||
Interest expense | (2,881 | ) | (3,840 | ) | (6,426 | ) | (7,593 | ) | ||||||||
Gain on debt extinguishment | — | — | 264 | — | ||||||||||||
Derivative losses, net | (10 | ) | (11 | ) | (22 | ) | (41 | ) | ||||||||
Note receivable impairment | — | (2,457 | ) | — | (2,457 | ) | ||||||||||
Foreign currency gains (losses), net | 543 | 21 | (2,417 | ) | (36 | ) | ||||||||||
Gain on sale of FBO | 12,946 | — | 12,946 | — | ||||||||||||
Other, net | (9 | ) | 13 | (9 | ) | 13 | ||||||||||
Total other income (expense) | 10,906 | (6,131 | ) | 4,904 | (9,826 | ) | ||||||||||
Income before income taxes and equity earnings | 19,441 | 7,419 | 19,292 | 13,797 | ||||||||||||
Income tax expense | 8,138 | 2,759 | 8,083 | 5,262 | ||||||||||||
Income before equity earnings | 11,303 | 4,660 | 11,209 | 8,535 | ||||||||||||
Equity earnings (losses), net of tax | (198 | ) | 536 | (343 | ) | 1,035 | ||||||||||
Net income | 11,105 | 5,196 | 10,866 | 9,570 | ||||||||||||
Net loss attributable to non-controlling interest in subsidiary | 228 | 25 | 425 | 96 | ||||||||||||
Net income attributable to Era Group Inc. | $ | 11,333 | $ | 5,221 | $ | 11,291 | $ | 9,666 | ||||||||
Earnings per common share, basic | $ | 0.55 | $ | 0.26 | $ | 0.55 | $ | 0.48 | ||||||||
Earnings per common share, diluted | $ | 0.55 | $ | 0.26 | $ | 0.55 | $ | 0.48 | ||||||||
Weighted average common shares outstanding, basic | 20,273,780 | 20,066,060 | 20,235,082 | 20,009,808 | ||||||||||||
Weighted average common shares outstanding, diluted | 20,332,657 | 20,134,473 | 20,295,498 | 20,080,117 | ||||||||||||
EBITDA | $ | 33,205 | $ | 23,077 | $ | 47,807 | $ | 44,849 | ||||||||
Adjusted EBITDA | $ | 20,259 | $ | 25,534 | $ | 34,597 | $ | 47,306 | ||||||||
Adjusted EBITDA excluding Gains | $ | 20,501 | $ | 22,395 | $ | 31,451 | $ | 41,276 | ||||||||
6
ERA GROUP INC. CONDENSED CONSOLIDATED STATEMENTS OF OPERATIONS (unaudited, in thousands, except share and per share amounts) | ||||||||||||||||||||
Three Months Ended | ||||||||||||||||||||
Jun 30, 2015 | Mar 31, 2015 | Dec 31, 2014 | Sep 30, 2014 | Jun 30, 2014 | ||||||||||||||||
Operating revenues | $ | 70,738 | $ | 67,415 | $ | 74,689 | $ | 90,510 | $ | 86,580 | ||||||||||
Costs and expenses: | ||||||||||||||||||||
Operating | 39,784 | 43,605 | 45,772 | 54,282 | 54,679 | |||||||||||||||
Administrative and general | 10,779 | 9,743 | 9,647 | 12,941 | 10,065 | |||||||||||||||
Depreciation | 11,398 | 11,602 | 11,854 | 11,746 | 11,425 | |||||||||||||||
Total costs and expenses | 61,961 | 64,950 | 67,273 | 78,969 | 76,169 | |||||||||||||||
Gains (losses) on asset dispositions, net | (242 | ) | 3,388 | 29 | 42 | 3,139 | ||||||||||||||
Operating income | 8,535 | 5,853 | 7,445 | 11,583 | 13,550 | |||||||||||||||
Other income (expense): | ||||||||||||||||||||
Interest income | 317 | 251 | 122 | 130 | 143 | |||||||||||||||
Interest expense | (2,881 | ) | (3,545 | ) | (3,556 | ) | (3,629 | ) | (3,840 | ) | ||||||||||
Gain on debt extinguishment | — | 264 | — | — | — | |||||||||||||||
Derivative gains (losses), net | (10 | ) | (12 | ) | 800 | (1,703 | ) | (11 | ) | |||||||||||
Note receivable impairment | — | — | — | — | (2,457 | ) | ||||||||||||||
Foreign currency gains (losses), net | 543 | (2,960 | ) | (1,856 | ) | (485 | ) | 21 | ||||||||||||
Gain on sale of FBO | 12,946 | — | — | — | — | |||||||||||||||
Other, net | (9 | ) | — | (14 | ) | (3 | ) | 13 | ||||||||||||
Total other income (expense) | 10,906 | (6,002 | ) | (4,504 | ) | (5,690 | ) | (6,131 | ) | |||||||||||
Income (loss) before income taxes and equity earnings | 19,441 | (149 | ) | 2,941 | 5,893 | 7,419 | ||||||||||||||
Income tax expense (benefit) | 8,138 | (55 | ) | 155 | 2,868 | 2,759 | ||||||||||||||
Income before equity earnings (losses) | 11,303 | (94 | ) | 2,786 | 3,025 | 4,660 | ||||||||||||||
Equity earnings (losses), net of tax | (198 | ) | (145 | ) | 354 | 1,286 | 536 | |||||||||||||
Net income (loss) | 11,105 | (239 | ) | 3,140 | 4,311 | 5,196 | ||||||||||||||
Net loss (income) attributable to non-controlling interest in subsidiary | 228 | 197 | 45 | (45 | ) | 25 | ||||||||||||||
Net income (loss) attributable to Era Group Inc. | $ | 11,333 | $ | (42 | ) | $ | 3,185 | $ | 4,266 | $ | 5,221 | |||||||||
Earnings (loss) per common share, basic | $ | 0.55 | $ | — | $ | 0.16 | $ | 0.21 | $ | 0.26 | ||||||||||
Earnings (loss) per common share, diluted | $ | 0.55 | $ | — | $ | 0.16 | $ | 0.21 | $ | 0.26 | ||||||||||
Weighted average common shares outstanding, basic | 20,273,780 | 20,195,955 | 20,173,583 | 20,098,239 | 20,066,060 | |||||||||||||||
Weighted average common shares outstanding, diluted | 20,332,657 | 20,195,955 | 20,232,025 | 20,163,990 | 20,134,474 | |||||||||||||||
EBITDA | $ | 33,205 | $ | 14,602 | $ | 18,583 | $ | 22,424 | $ | 23,077 | ||||||||||
Adjusted EBITDA | $ | 20,259 | $ | 14,338 | $ | 18,583 | $ | 24,886 | $ | 25,534 | ||||||||||
Adjusted EBITDA excluding Gains | $ | 20,501 | $ | 10,950 | $ | 18,554 | $ | 24,844 | $ | 22,395 | ||||||||||
7
ERA GROUP INC. OPERATING REVENUES BY LINE OF SERVICE (unaudited, in thousands) | ||||||||||||||||||||
Three Months Ended | ||||||||||||||||||||
Jun 30, 2015 | Mar 31, 2015 | Dec 31, 2014 | Sep 30, 2014 | Jun 30, 2014 | ||||||||||||||||
Oil and gas:(1) | ||||||||||||||||||||
U.S. Gulf of Mexico | $ | 41,821 | $ | 41,913 | $ | 45,837 | $ | 52,870 | $ | 51,715 | ||||||||||
Alaska | 6,009 | 3,801 | 6,496 | 7,984 | 9,305 | |||||||||||||||
International | 47 | — | 183 | 1,514 | 173 | |||||||||||||||
Total oil and gas | 47,877 | 45,714 | 52,516 | 62,368 | 61,193 | |||||||||||||||
Dry-leasing | 12,233 | 11,956 | 11,911 | 12,392 | 11,466 | |||||||||||||||
Search and rescue | 4,989 | 5,238 | 5,650 | 5,666 | 5,095 | |||||||||||||||
Air medical services | 1,914 | 2,367 | 2,301 | 2,569 | 3,137 | |||||||||||||||
Flightseeing | 3,118 | — | — | 4,043 | 2,946 | |||||||||||||||
Fixed base operations | 614 | 2,146 | 2,403 | 3,562 | 2,858 | |||||||||||||||
Eliminations | (7 | ) | (6 | ) | (92 | ) | (90 | ) | (115 | ) | ||||||||||
$ | 70,738 | $ | 67,415 | $ | 74,689 | $ | 90,510 | $ | 86,580 | |||||||||||
FLIGHT HOURS BY LINE OF SERVICE(2) (unaudited) | |||||||||||||||
Three Months Ended | |||||||||||||||
Jun 30, 2015 | Mar 31, 2015 | Dec 31, 2014 | Sep 30, 2014 | Jun 30, 2014 | |||||||||||
Oil and gas:(1) | |||||||||||||||
U.S. Gulf of Mexico | 8,717 | 7,612 | 8,514 | 10,594 | 11,065 | ||||||||||
Alaska | 607 | 290 | 560 | 939 | 1,122 | ||||||||||
International | 14 | — | — | — | — | ||||||||||
Total oil and gas | 9,338 | 7,902 | 9,074 | 11,533 | 12,187 | ||||||||||
Search and rescue | 260 | 300 | 355 | 348 | 258 | ||||||||||
Air medical services | 826 | 825 | 831 | 1,239 | 1,100 | ||||||||||
Flightseeing | 1,118 | — | — | 1,505 | 1,080 | ||||||||||
11,542 | 9,027 | 10,260 | 14,625 | 14,625 | |||||||||||
____________________
(1) | Primarily oil and gas services, but also includes revenues from activities such as firefighting and utility support. |
(2) | Does not include hours flown by helicopters in our dry-leasing line of service. |
8
ERA GROUP INC. CONDENSED CONSOLIDATED BALANCE SHEETS (in thousands) | ||||||||||||||||||||
Jun 30, 2015 | Mar 31, 2015 | Dec 31, 2014 | Sep 30, 2014 | Jun 30, 2014 | ||||||||||||||||
ASSETS | (unaudited) | (unaudited) | (unaudited) | (unaudited) | ||||||||||||||||
Current assets: | ||||||||||||||||||||
Cash and cash equivalents | $ | 17,002 | $ | 33,691 | $ | 40,867 | $ | 40,357 | $ | 14,940 | ||||||||||
Receivables: | ||||||||||||||||||||
Trade, net of allowance for doubtful accounts | 39,866 | 38,949 | 33,390 | 48,307 | 52,582 | |||||||||||||||
Other | 2,110 | 2,567 | 2,062 | 1,679 | 2,078 | |||||||||||||||
Inventories, net | 25,808 | 26,189 | 26,869 | 27,039 | 26,863 | |||||||||||||||
Prepaid expenses and other | 3,847 | 4,081 | 2,661 | 1,712 | 2,991 | |||||||||||||||
Deferred income taxes | 2,507 | 2,167 | 1,996 | 2,065 | 1,991 | |||||||||||||||
Escrow deposits | 6,762 | 2,800 | — | — | — | |||||||||||||||
Total current assets | 97,902 | 110,444 | 107,845 | 121,159 | 101,445 | |||||||||||||||
Property and equipment | 1,192,445 | 1,171,548 | 1,171,267 | 1,128,510 | 1,116,678 | |||||||||||||||
Accumulated depreciation | (314,484 | ) | (315,399 | ) | (308,141 | ) | (296,294 | ) | (284,547 | ) | ||||||||||
Net property and equipment | 877,961 | 856,149 | 863,126 | 832,216 | 832,131 | |||||||||||||||
Equity investments and advances | 30,945 | 31,397 | 31,753 | 31,641 | 36,053 | |||||||||||||||
Goodwill | 1,823 | 352 | 352 | 352 | 352 | |||||||||||||||
Intangible assets | 1,410 | — | — | — | — | |||||||||||||||
Other assets | 14,547 | 15,156 | 14,098 | 14,794 | 15,868 | |||||||||||||||
Total assets | $ | 1,024,588 | $ | 1,013,498 | $ | 1,017,174 | $ | 1,000,162 | $ | 985,849 | ||||||||||
LIABILITIES, REDEEMABLE NONCONTROLLING INTEREST AND STOCKHOLDERS’ EQUITY | ||||||||||||||||||||
Current liabilities: | ||||||||||||||||||||
Accounts payable and accrued expenses | $ | 12,026 | $ | 13,904 | $ | 15,120 | $ | 21,819 | $ | 23,129 | ||||||||||
Accrued wages and benefits | 7,293 | 6,822 | 7,521 | 9,651 | 9,791 | |||||||||||||||
Accrued interest | 813 | 4,791 | 949 | 4,805 | 950 | |||||||||||||||
Accrued income taxes | 7,613 | 37 | 267 | 1,029 | 236 | |||||||||||||||
Derivative instruments | 192 | 275 | 1,109 | 1,991 | 569 | |||||||||||||||
Current portion of long-term debt | 26,130 | 26,729 | 27,426 | 2,787 | 2,787 | |||||||||||||||
Other current liabilities | 3,556 | 3,121 | 3,162 | 4,154 | 4,258 | |||||||||||||||
Total current liabilities | 57,623 | 55,679 | 55,554 | 46,236 | 41,720 | |||||||||||||||
Long-term debt | 267,671 | 277,424 | 282,118 | 277,390 | 278,023 | |||||||||||||||
Deferred income taxes | 218,802 | 217,200 | 217,027 | 216,985 | 214,117 | |||||||||||||||
Deferred gains and other liabilities | 1,994 | 1,937 | 2,111 | 2,898 | 3,120 | |||||||||||||||
Total liabilities | 546,090 | 552,240 | 556,810 | 543,509 | 536,980 | |||||||||||||||
Redeemable noncontrolling interest | 5,195 | — | — | — | — | |||||||||||||||
Equity: | ||||||||||||||||||||
Era Group Inc. stockholders’ equity: | ||||||||||||||||||||
Common stock | 206 | 206 | 204 | 204 | 204 | |||||||||||||||
Additional paid-in capital | 431,233 | 430,251 | 429,109 | 428,530 | 425,010 | |||||||||||||||
Retained earnings | 43,088 | 31,755 | 31,797 | 28,612 | 24,346 | |||||||||||||||
Treasury shares, at cost | (563 | ) | (560 | ) | (551 | ) | (547 | ) | (547 | ) | ||||||||||
Accumulated other comprehensive income (loss), net of tax | (44 | ) | 93 | 95 | 99 | 146 | ||||||||||||||
Total Era Group Inc. stockholders’ equity | 473,920 | 461,745 | 460,654 | 456,898 | 449,159 | |||||||||||||||
Non-controlling interest | (617 | ) | (487 | ) | (290 | ) | (245 | ) | (290 | ) | ||||||||||
Total equity | 473,303 | 461,258 | 460,364 | 456,653 | 448,869 | |||||||||||||||
Total liabilities, redeemable noncontrolling interest and stockholders’ equity | $ | 1,024,588 | $ | 1,013,498 | $ | 1,017,174 | $ | 1,000,162 | $ | 985,849 | ||||||||||
9
Our management uses EBITDA and Adjusted EBITDA to assess the performance and operating results of our business. EBITDA is defined as Earnings before Interest (includes interest income and interest expense), Taxes, Depreciation and Amortization. Adjusted EBITDA is defined as EBITDA further adjusted for certain items noted in the reconciliation below that occur during the reported period. We include EBITDA and Adjusted EBITDA to provide investors with a supplemental measure of our operating performance. Neither EBITDA nor Adjusted EBITDA is a recognized term under generally accepted accounting principles in the U.S. (“GAAP”). Accordingly, they should not be used as an indicator of, or an alternative to, net income as a measure of operating performance. In addition, EBITDA and Adjusted EBITDA are not intended to be measures of free cash flow available for management’s discretionary use, as they do not consider certain cash requirements, such as debt service requirements. Because the definitions of EBITDA and Adjusted EBITDA (or similar measures) may vary among companies and industries, they may not be comparable to other similarly titled measures used by other companies.
The following table provides a reconciliation of Net Income, the most directly comparable GAAP measure, to EBITDA and Adjusted EBITDA (in thousands).
Three Months Ended | Six Months Ended | |||||||||||||||||||||||||||
Jun 30, 2015 | Mar 31, 2015 | Dec 31, 2014 | Sep 30, 2014 | Jun 30, 2014 | Jun 30, 2015 | Jun 30, 2014 | ||||||||||||||||||||||
Net Income | $ | 11,105 | $ | (239 | ) | $ | 3,140 | $ | 4,311 | $ | 5,196 | $ | 10,866 | $ | 9,570 | |||||||||||||
Depreciation | 11,398 | 11,602 | 11,854 | 11,746 | 11,425 | 23,000 | 22,712 | |||||||||||||||||||||
Interest income | (317 | ) | (251 | ) | (122 | ) | (130 | ) | (143 | ) | (568 | ) | (288 | ) | ||||||||||||||
Interest expense | 2,881 | 3,545 | 3,556 | 3,629 | 3,840 | 6,426 | 7,593 | |||||||||||||||||||||
Income tax expense (benefit) | 8,138 | (55 | ) | 155 | 2,868 | 2,759 | 8,083 | 5,262 | ||||||||||||||||||||
EBITDA | $ | 33,205 | $ | 14,602 | $ | 18,583 | $ | 22,424 | $ | 23,077 | $ | 47,807 | $ | 44,849 | ||||||||||||||
Special items (1) | (12,946 | ) | (264 | ) | — | 2,462 | 2,457 | (13,210 | ) | 2,457 | ||||||||||||||||||
Adjusted EBITDA | $ | 20,259 | $ | 14,338 | $ | 18,583 | $ | 24,886 | $ | 25,534 | $ | 34,597 | $ | 47,306 | ||||||||||||||
Losses (gains) on asset dispositions, net (“Gains”) | 242 | (3,388 | ) | (29 | ) | (42 | ) | (3,139 | ) | (3,146 | ) | (6,030 | ) | |||||||||||||||
Adjusted EBITDA excluding Gains | $ | 20,501 | $ | 10,950 | $ | 18,554 | $ | 24,844 | $ | 22,395 | $ | 31,451 | $ | 41,276 | ||||||||||||||
____________________
(1) | Special items include the following: |
• | In the three months ended June 30, 2015, a pre-tax gain of $12.9 million on the sale of our FBO in Alaska. |
• | In the three months ended March 31, 2015, a pre-tax gain on the extinguishment of debt of $0.3 million related to the repurchase of a portion of our 7.750% Senior Notes; |
• | In the three months ended September 30, 2014, a pre-tax charge of $2.5 million for severance-related expenses for the Company’s former CEO; and |
• | In the three and six months ended June 30, 2014, a pre-tax impairment charge of $2.5 million on a note receivable from a foreign company with whom we participated in bids for contracts. |
10
ERA GROUP INC. FLEET COUNTS (1) (unaudited) | |||||||||||||||
Jun 30, 2015 | Mar 31, 2015 | Dec 31, 2014 | Sep 30, 2014 | Jun 30, 2014 | |||||||||||
Heavy: | |||||||||||||||
H225 | 9 | 9 | 9 | 9 | 9 | ||||||||||
Medium: | |||||||||||||||
AW139 | 39 | 39 | 39 | 39 | 38 | ||||||||||
B212 | 8 | 8 | 9 | 9 | 9 | ||||||||||
B412 | 3 | 3 | 6 | 6 | 6 | ||||||||||
S76 A++ | 2 | 2 | 2 | 2 | 2 | ||||||||||
S76 C+/C++ | 6 | 6 | 6 | 6 | 6 | ||||||||||
58 | 58 | 62 | 62 | 61 | |||||||||||
Light—twin engine: | |||||||||||||||
A109 | 7 | 7 | 9 | 9 | 9 | ||||||||||
BK-117 | 3 | 3 | 3 | 3 | 3 | ||||||||||
BO-105 | 3 | — | — | — | — | ||||||||||
H135 | 19 | 19 | 20 | 20 | 20 | ||||||||||
H145 | 5 | 5 | 5 | 5 | 5 | ||||||||||
37 | 34 | 37 | 37 | 37 | |||||||||||
Light—single engine: | |||||||||||||||
A119(2) | 17 | 17 | 17 | 17 | 24 | ||||||||||
AS350 | 31 | 35 | 35 | 35 | 35 | ||||||||||
48 | 52 | 52 | 52 | 59 | |||||||||||
Total Helicopters | 152 | 153 | 160 | 160 | 166 | ||||||||||
____________________
(1) | Includes all owned, joint ventured, leased-in and managed helicopters and excludes helicopters fully paid for and delivered but not yet placed in service as of the applicable dates. |
(2) | Effective July 24, 2014, we sold our 51% interest in Lake Palma, which owned seven of the A119 helicopters listed above as of June 30, 2014. |
11

Q2 2015 Earnings Presentation 0August 5, 2015 Exhibit 99.2
I. Introduction Harmony Packard, Corporate Communications II. Operational Highlights Chris Bradshaw, President, CEO and CFO III. Financial Review Chris Bradshaw, President, CEO and CFO IV. Questions & Answers Q2 2015 Earnings Call Agenda 1
2 This presentation contains “forward-looking statements.” Forward-looking statements give the Company’s current expectations or forecasts of future events. Forward-looking statements generally can be identified by the use of forward-looking terminology such as “may,” “will,” “expect,” “intend,” “estimate,” “anticipate,” “believe,” “project,” or “continue,” or other similar words. These statements reflect management’s current views with respect to future events and are subject to risks and uncertainties, both known and unknown. The Company’s actual results may vary materially from those anticipated in forward-looking statements. The Company cautions investors not to place undue reliance on any forward-looking statements. Such risks, uncertainties and other important factors include, among others, the Company’s dependence on, and the cyclical nature of, the offshore oil and gas industry; the Company’s dependence on, and the cyclical nature of, offshore oil and gas exploration, development and production activity; fluctuations in worldwide prices of and demand for oil and natural gas; the Company’s reliance on a small number of customers and reduction of the Company’s customer base due to consolidation; inherent risks in operating helicopters; the failure to maintain an acceptable safety record; the ability to successfully expand into other geographic and helicopter service markets; the impact of increased United States (“U.S.”) and foreign government regulation and legislation, including potential government implemented moratoriums on drilling activities; the requirement to engage in competitive processes or expend significant resources with no guaranty of recoupment; the grounding of all or a portion of our fleet for extended periods of time or indefinitely; reduction or cancellation of services for government agencies; reliance on a small number of helicopter manufacturers and suppliers; political instability, governmental action, war, acts of terrorism and changes in the economic condition in any foreign country where the Company does business, which may result in expropriation, nationalization, confiscation or deprivation of our assets or result in claims of a force majeure situation; declines in the global economy and financial markets; foreign currency exposure and exchange controls, including the impact of fluctuations in foreign currency exchange rates on the Company’s cost to purchase helicopters, spare parts and related services and on asset values; credit risk exposure; the ongoing need to replace aging helicopters; the Company’s reliance on information technology; the Company’s reliance on the secondary used helicopter market to dispose of older helicopters; allocation of risk between the Company and its customers; liability, legal fees and costs in connection with providing emergency response services; risks associated with the Company’s debt structure; operational and financial difficulties of the Company’s joint ventures and partners; conflict with the other owners of the Company’s non-wholly owned subsidiaries and other equity investees; adverse results of legal proceedings; adverse weather conditions and seasonality; adequacy of insurance coverage; the attraction and retention of qualified personnel; restrictions on the amount of foreign ownership of the Company’s common stock; and various other matters and factors, many of which are beyond the Company’s control. These factors are not exhaustive, and new factors may emerge or changes to the foregoing factors may occur that could impact the Company’s business. Except to the extent required by law, the Company undertakes no obligation to update or revise any forward-looking statements, whether as a result of new information, future events or otherwise. Cautionary Statement Regarding Forward Looking Statements
3 This presentation includes EBITDA and Adjusted EBITDA as supplemental measures of the Company’s operating performance. EBITDA is defined as Earnings before Interest (includes interest income, interest expense and interest expense on advances from SEACOR), Taxes, Depreciation and Amortization. Adjusted EBITDA is defined as EBITDA further adjusted for SEACOR Management Fees and certain other Special items that occurred during the reporting period. Neither EBITDA nor Adjusted EBITDA is a recognized term under generally accepted accounting principles in the U.S. (“GAAP”). Accordingly, they should not be used as an indicator of, or an alternative to, net income as a measure of operating performance. In addition, EBITDA and Adjusted EBITDA are not intended to be a measure of free cash flow available for discretionary use, as they do not take into account certain cash requirements, such as debt service requirements. EBITDA and Adjusted EBITDA have limitations as analytical tools, and you should not consider them in isolation, nor as a substitute for analysis of our results as reported under GAAP. Because the definitions of EBITDA and Adjusted EBITDA (or similar measures) may vary among companies and industries, they may not be comparable to other similarly titled measures used by other companies. A reconciliation of EBITDA, Adjusted EBITDA and Adjusted EBITDA further adjusted to exclude gains on asset dispositions is included in this presentation. Non-GAAP Financial Measures Reconciliation
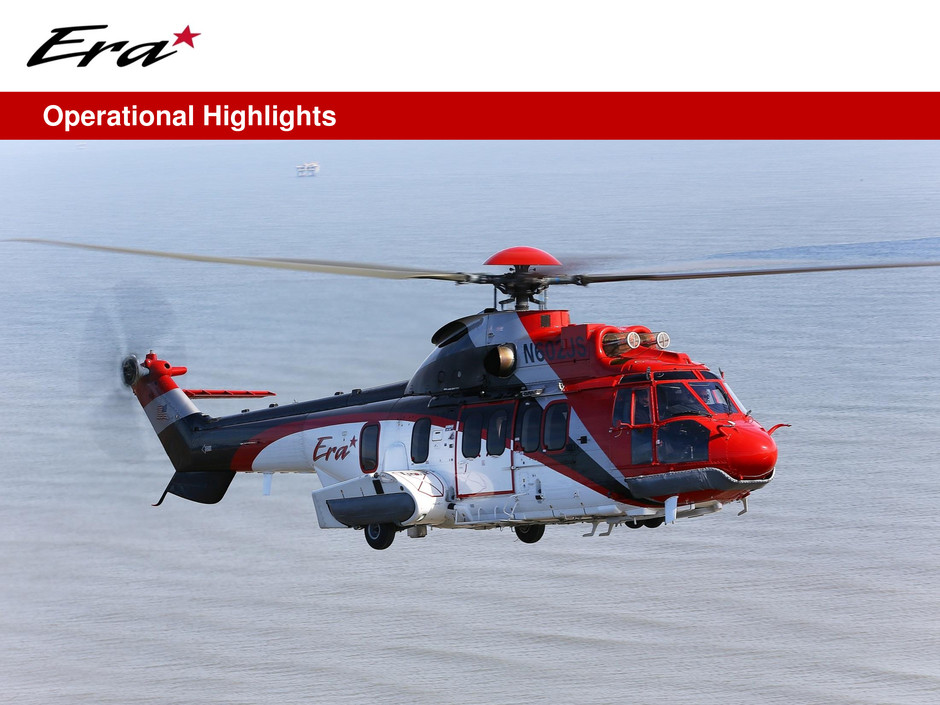
4 Operational Highlights
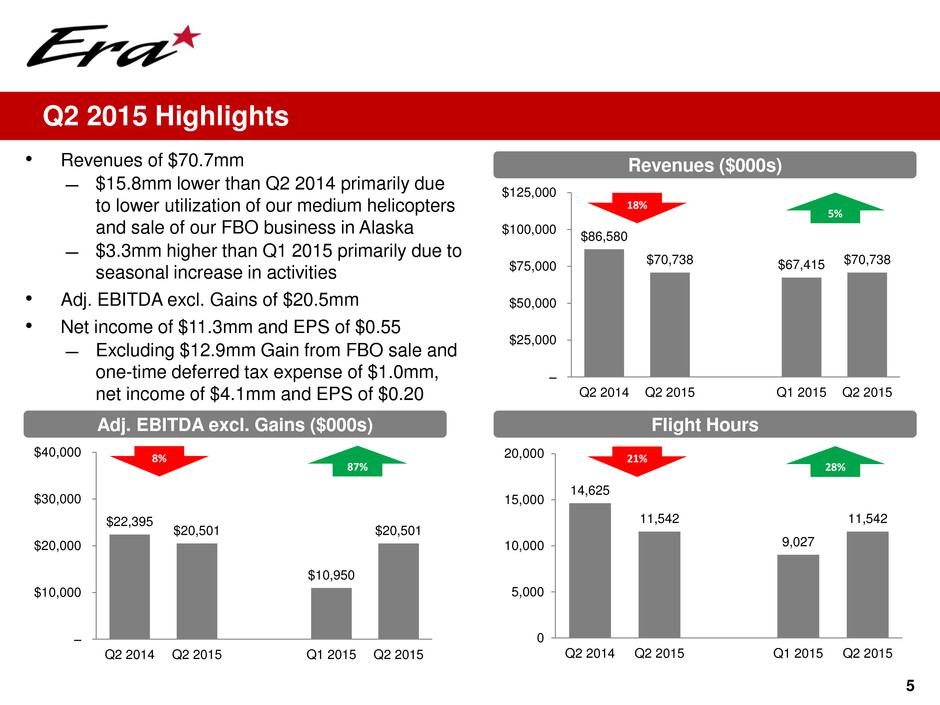
$86,580 $70,738 $67,415 $70,738 – $25,000 $50,000 $75,000 $100,000 $125,000 Q2 2014 Q2 2015 Q1 2015 Q2 2015 14,625 11,542 9,027 11,542 0 5,000 10,000 15,000 20,000 Q2 2014 Q2 2015 Q1 2015 Q2 2015 • Revenues of $70.7mm ̶ $15.8mm lower than Q2 2014 primarily due to lower utilization of our medium helicopters and sale of our FBO business in Alaska ̶ $3.3mm higher than Q1 2015 primarily due to seasonal increase in activities • Adj. EBITDA excl. Gains of $20.5mm • Net income of $11.3mm and EPS of $0.55 ̶ Excluding $12.9mm Gain from FBO sale and one-time deferred tax expense of $1.0mm, net income of $4.1mm and EPS of $0.20 5 Q2 2015 Highlights Revenues ($000s) Adj. EBITDA excl. Gains ($000s) Flight Hours 18% 5% 21% 28% 8% 87% $22,395 $20,501 $10,950 $20,501 – $10,000 $20,000 $30,000 $40,000 Q2 2014 Q2 2015 Q1 2015 Q2 2015
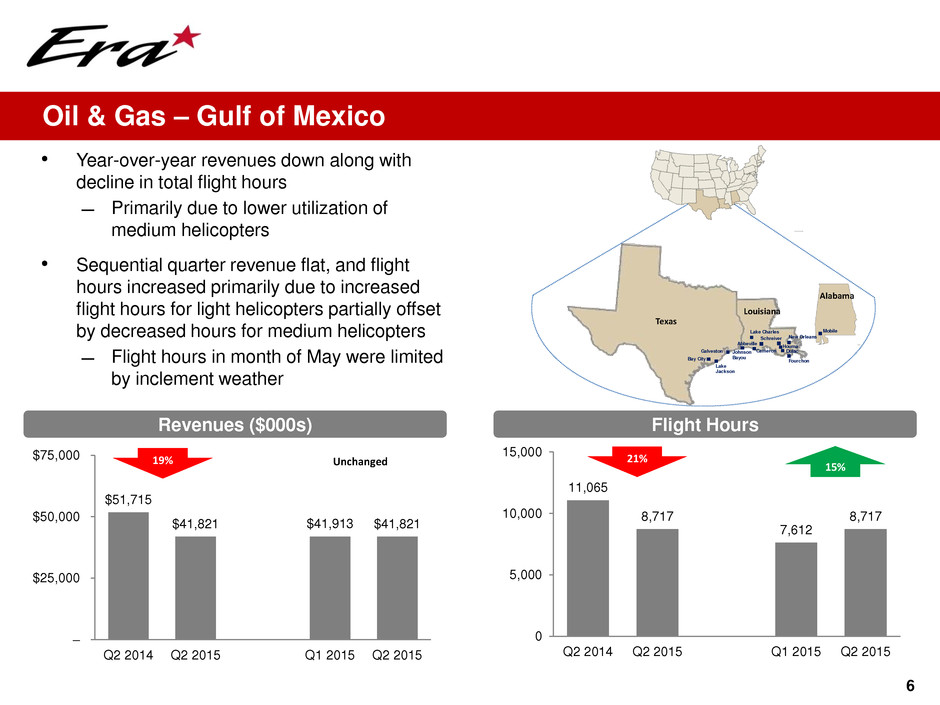
$51,715 $41,821 $41,913 $41,821 – $25,000 $50,000 $75,000 Q2 2014 Q2 2015 Q1 2015 Q2 2015 11,065 8,717 7,612 8,717 0 5,000 10,000 15,000 Q2 2014 Q2 2015 Q1 2015 Q2 2015 6 Oil & Gas – Gulf of Mexico Revenues ($000s) Flight Hours • Year-over-year revenues down along with decline in total flight hours ̶ Primarily due to lower utilization of medium helicopters • Sequential quarter revenue flat, and flight hours increased primarily due to increased flight hours for light helicopters partially offset by decreased hours for medium helicopters ̶ Flight hours in month of May were limited by inclement weather 19% 21% 15%Unchanged Alabama Mobile Fourchon Lake Charles Johnson Bayou Dulac Abbeville New OrleansSchreiver Houma Louisiana Lake Jackson Texas Galveston Bay City Cameron
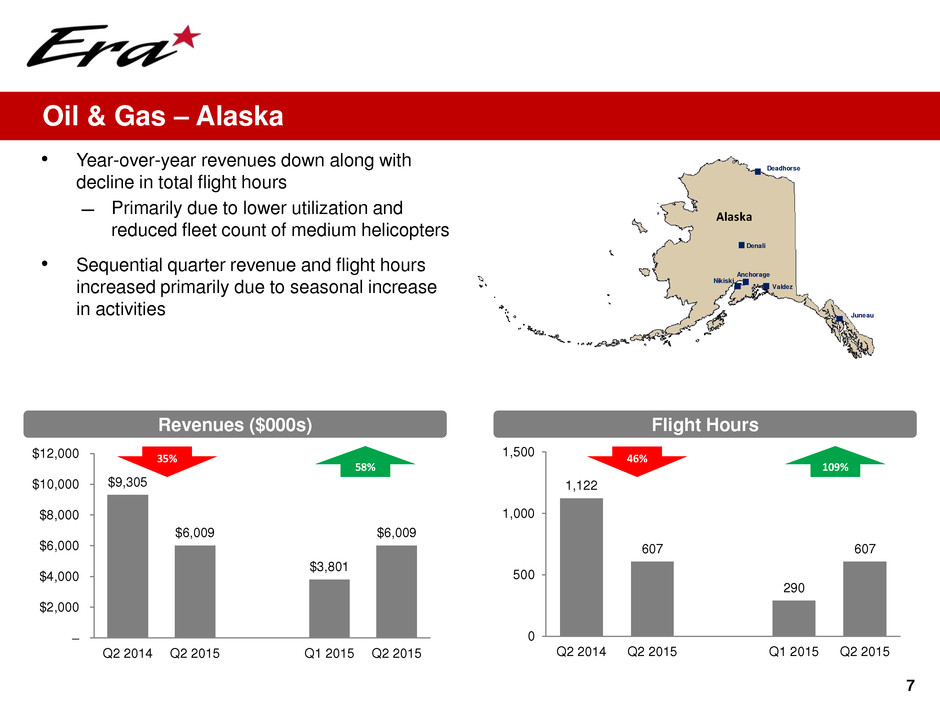
$9,305 $6,009 $3,801 $6,009 – $2,000 $4,000 $6,000 $8,000 $10,000 $12,000 Q2 2014 Q2 2015 Q1 2015 Q2 2015 1,122 607 290 607 0 500 1,000 1,500 Q2 2014 Q2 2015 Q1 2015 Q2 2015 7 Oil & Gas – Alaska Revenues ($000s) Flight Hours 46% 109% 35% 58% • Year-over-year revenues down along with decline in total flight hours ̶ Primarily due to lower utilization and reduced fleet count of medium helicopters • Sequential quarter revenue and flight hours increased primarily due to seasonal increase in activities Juneau Valdez Anchorage Nikiski Denali Deadhorse Alaska
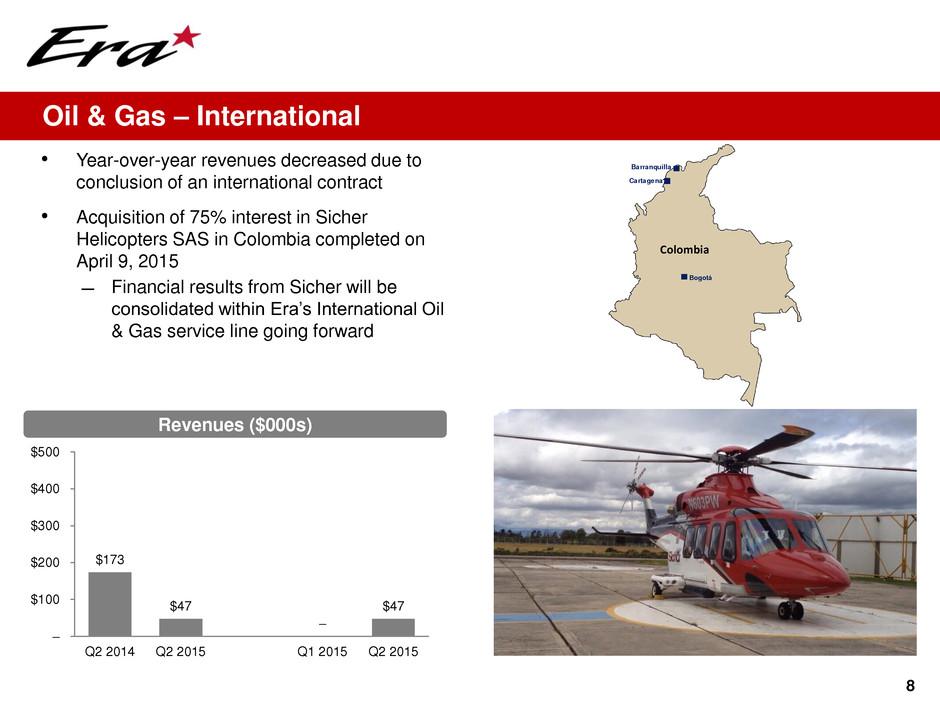
8 Oil & Gas – International Revenues ($000s) • Year-over-year revenues decreased due to conclusion of an international contract • Acquisition of 75% interest in Sicher Helicopters SAS in Colombia completed on April 9, 2015 ̶ Financial results from Sicher will be consolidated within Era’s International Oil & Gas service line going forward $173 $47 – $47 – $100 $200 $300 $400 $500 Q2 2014 Q2 2015 Q1 2015 Q2 2015 Bogotá Colombia Barranquilla Cartagena
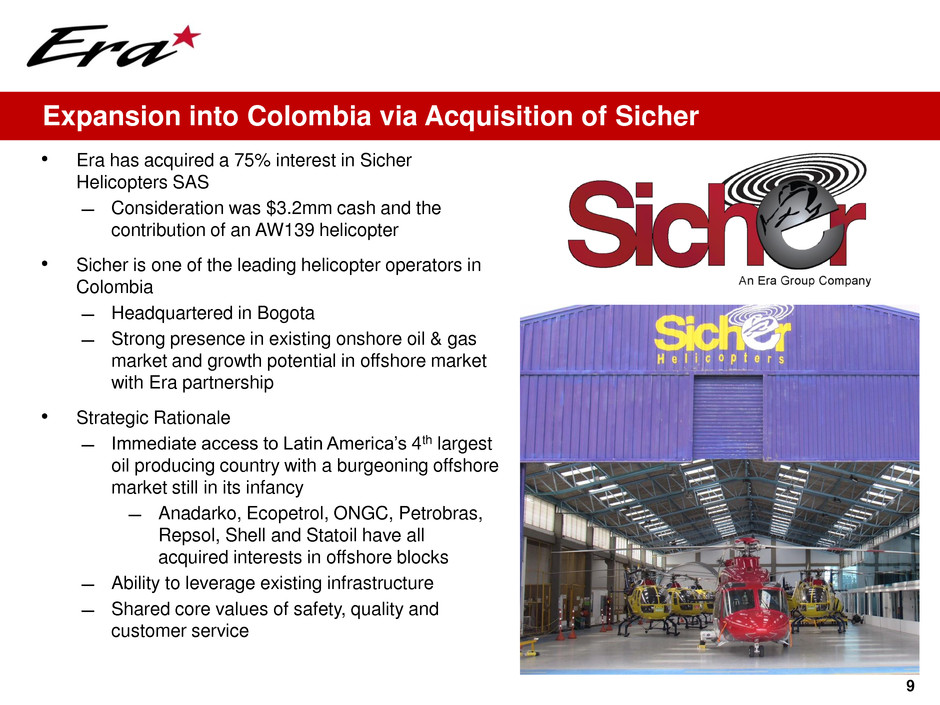
9 Expansion into Colombia via Acquisition of Sicher • Era has acquired a 75% interest in Sicher Helicopters SAS ̶ Consideration was $3.2mm cash and the contribution of an AW139 helicopter • Sicher is one of the leading helicopter operators in Colombia ̶ Headquartered in Bogota ̶ Strong presence in existing onshore oil & gas market and growth potential in offshore market with Era partnership • Strategic Rationale ̶ Immediate access to Latin America’s 4th largest oil producing country with a burgeoning offshore market still in its infancy ̶ Anadarko, Ecopetrol, ONGC, Petrobras, Repsol, Shell and Statoil have all acquired interests in offshore blocks ̶ Ability to leverage existing infrastructure ̶ Shared core values of safety, quality and customer service
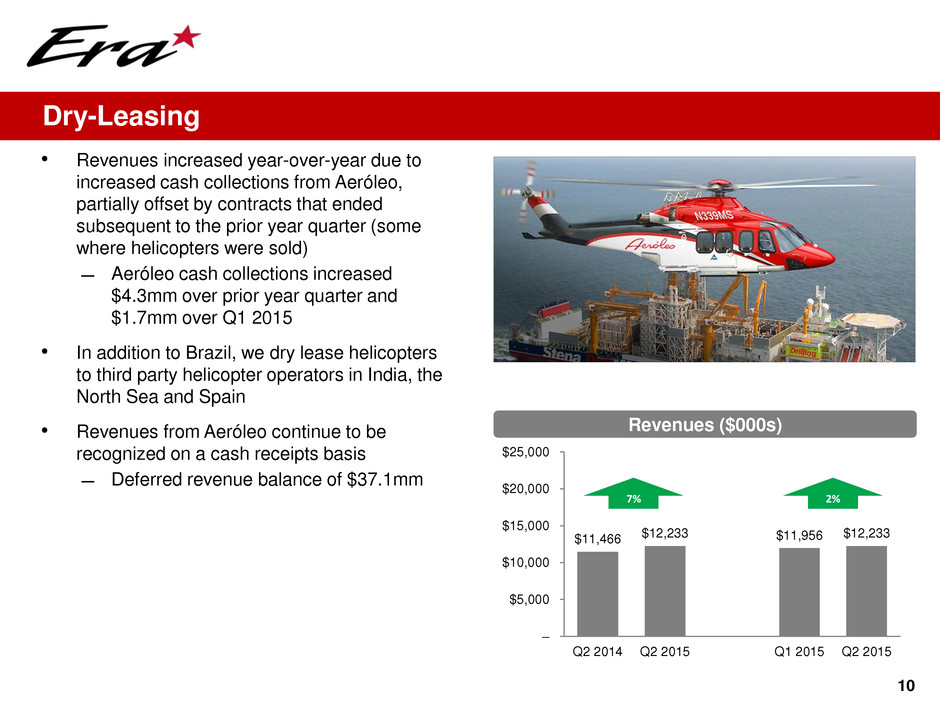
$11,466 $12,233 $11,956 $12,233 – $5,000 $10,000 $15,000 $20,000 $25,000 Q2 2014 Q2 2015 Q1 2015 Q2 2015 10 Dry-Leasing Revenues ($000s) 7% • Revenues increased year-over-year due to increased cash collections from Aeróleo, partially offset by contracts that ended subsequent to the prior year quarter (some where helicopters were sold) ̶ Aeróleo cash collections increased $4.3mm over prior year quarter and $1.7mm over Q1 2015 • In addition to Brazil, we dry lease helicopters to third party helicopter operators in India, the North Sea and Spain • Revenues from Aeróleo continue to be recognized on a cash receipts basis ̶ Deferred revenue balance of $37.1mm 2%
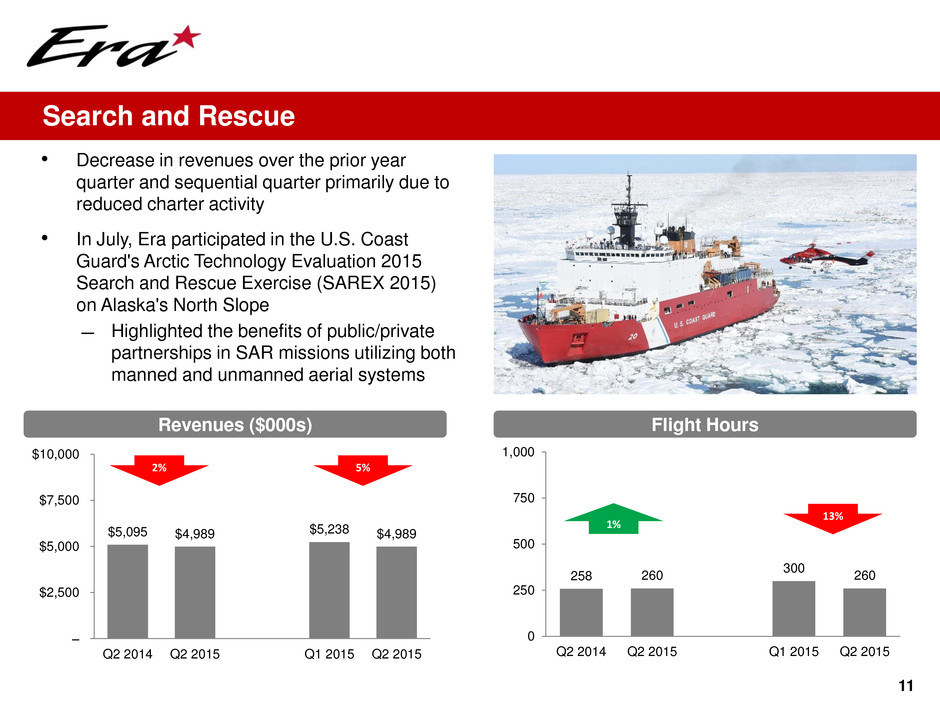
$5,095 $4,989 $5,238 $4,989 – $2,500 $5,000 $7,500 $10,000 Q2 2014 Q2 2015 Q1 2015 Q2 2015 258 260 300 260 0 250 500 750 1,000 Q2 2014 Q2 2015 Q1 2015 Q2 2015 11 Search and Rescue Revenues ($000s) Flight Hours • Decrease in revenues over the prior year quarter and sequential quarter primarily due to reduced charter activity • In July, Era participated in the U.S. Coast Guard's Arctic Technology Evaluation 2015 Search and Rescue Exercise (SAREX 2015) on Alaska's North Slope ̶ Highlighted the benefits of public/private partnerships in SAR missions utilizing both manned and unmanned aerial systems 13% 2% 5% 1%
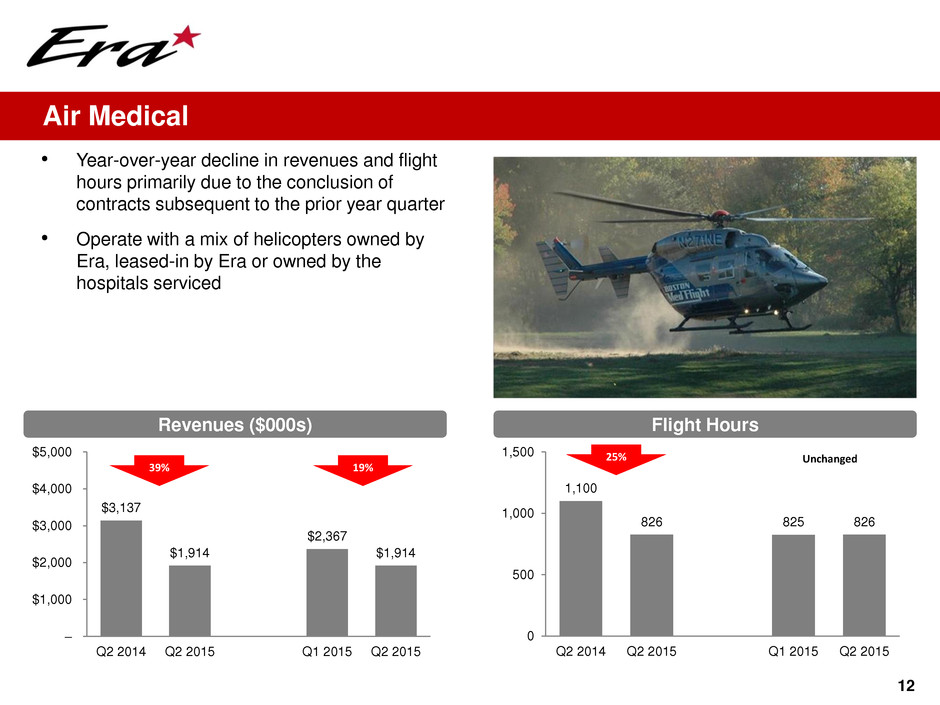
$3,137 $1,914 $2,367 $1,914 – $1,000 $2,000 $3,000 $4,000 $5,000 Q2 2014 Q2 2015 Q1 2015 Q2 2015 1,100 826 825 826 0 500 1,000 1,500 Q2 2014 Q2 2015 Q1 2015 Q2 2015 12 • Year-over-year decline in revenues and flight hours primarily due to the conclusion of contracts subsequent to the prior year quarter • Operate with a mix of helicopters owned by Era, leased-in by Era or owned by the hospitals serviced Air Medical Revenues ($000s) Flight Hours 25% 39% 19% Unchanged
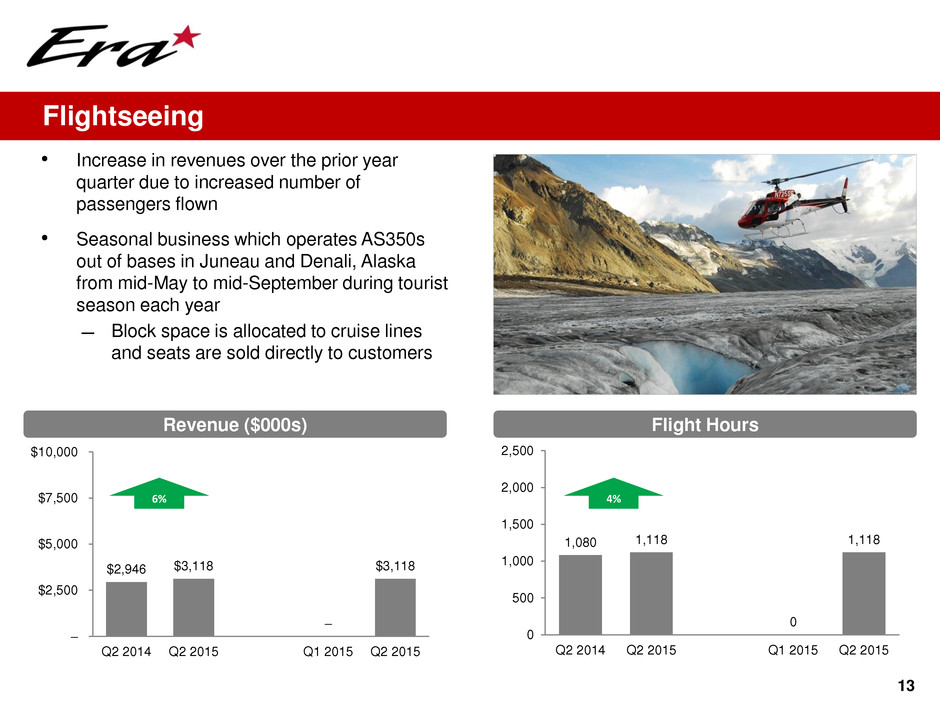
13 • Increase in revenues over the prior year quarter due to increased number of passengers flown • Seasonal business which operates AS350s out of bases in Juneau and Denali, Alaska from mid-May to mid-September during tourist season each year ̶ Block space is allocated to cruise lines and seats are sold directly to customers Flightseeing Revenue ($000s) Flight Hours $2,946 $3,118 – $3,118 – $2,500 $5,000 $7,500 $10,000 Q2 2014 Q2 2015 Q1 2015 Q2 2015 1,080 1,118 0 1,118 0 500 1,000 1,500 2,000 2,500 Q2 2014 Q2 2015 Q1 2015 Q2 2015 4%6%
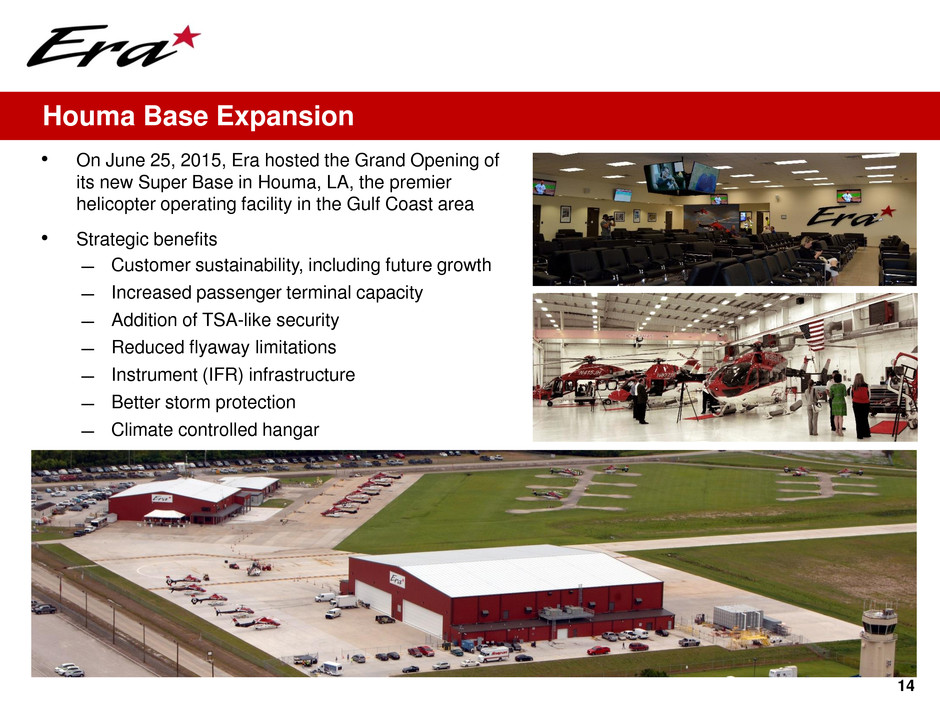
14 Houma Base Expansion • On June 25, 2015, Era hosted the Grand Opening of its new Super Base in Houma, LA, the premier helicopter operating facility in the Gulf Coast area • Strategic benefits ̶ Customer sustainability, including future growth ̶ Increased passenger terminal capacity ̶ Addition of TSA-like security ̶ Reduced flyaway limitations ̶ Instrument (IFR) infrastructure ̶ Better storm protection ̶ Climate controlled hangar
15 Financial Review
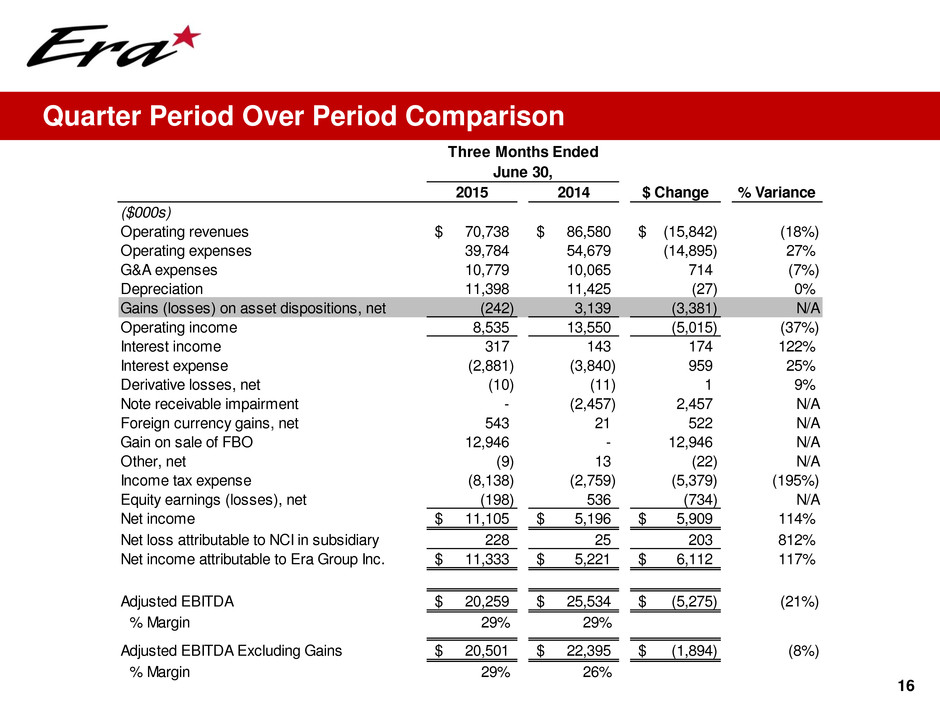
16 Quarter Period Over Period Comparison Three Months Ended June 30, 2015 2014 $ Change % Variance ($000s) Operating revenues 70,738$ 86,580$ (15,842)$ (18%) Operating expenses 39,784 54,679 (14,895) 27% G&A expenses 10,779 10,065 714 (7%) Depreciation 11,398 11,425 (27) 0% Gains (losses) on asset dispositions, net (242) 3,139 (3,381) N/A Operating income 8,535 13,550 (5,015) (37%) Interest income 317 143 174 122% Interest expense (2,881) (3,840) 959 25% Derivative losses, net (10) (11) 1 9% Note receivable impairment - (2,457) 2,457 N/A Foreign currency gains, net 543 21 522 N/A Gain on sale of FBO 12,946 - 12,946 N/A Other, net (9) 13 (22) N/A Income tax expense (8,138) (2,759) (5,379) (195%) Equity earnings (losses), net (198) 536 (734) N/A Net income 11,105$ 5,196$ 5,909$ 114% Net loss attributable to NCI in subsidiary 228 25 203 812% Net income attributable to Era Group Inc. 11,333$ 5,221$ 6,112$ 117% Adjusted EBITDA 20,259$ 25,534$ (5,275)$ (21%) % Margin 29% 29% Adjusted EBITDA Excluding Gains 20,501$ 22,395$ (1,894)$ (8%) % Margin 29% 26%
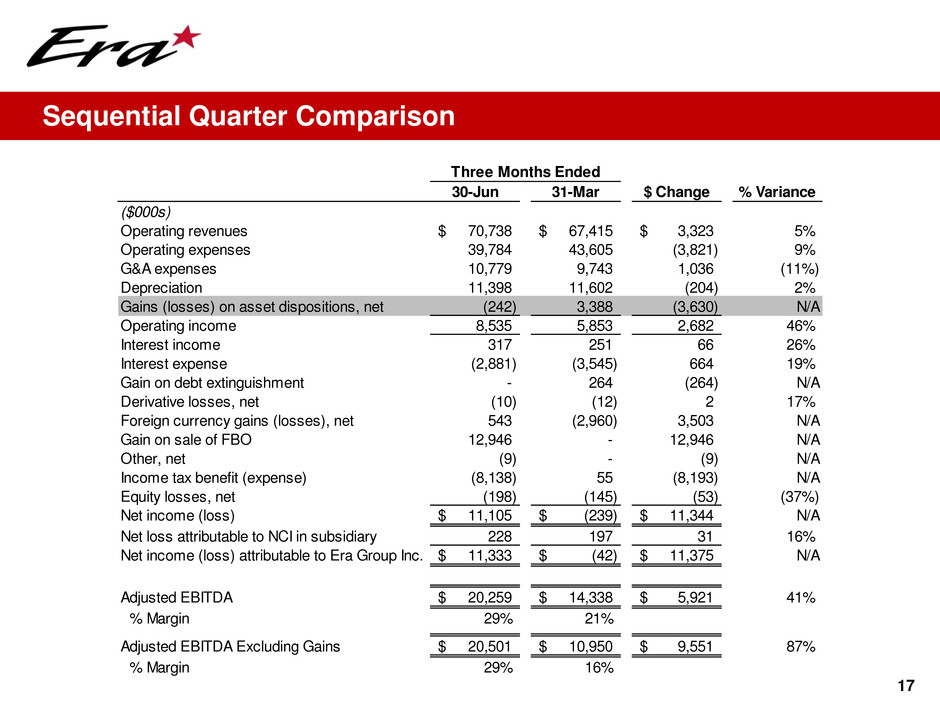
17 Sequential Quarter Comparison Three Months Ended 30-Jun 31-Mar $ Change % Variance ($000s) Operating revenues 70,738$ 67,415$ 3,323$ 5% Operating expenses 39,784 43,605 (3,821) 9% G&A expenses 10,779 9,743 1,036 (11%) Depreciation 11,398 11,602 (204) 2% Gains (losses) on asset dispositions, net (242) 3,388 (3,630) N/A Operating income 8,535 5,853 2,682 46% Interest income 317 251 66 26% Interest expense (2,881) (3,545) 664 19% Gain on debt extinguishment - 264 (264) N/A Derivative losses, net (10) (12) 2 17% Foreign currency gains (losses), net 543 (2,960) 3,503 N/A Gain on sale of FBO 12,946 - 12,946 N/A Other, net (9) - (9) N/A Income tax benefit (expense) (8,138) 55 (8,193) N/A Equity losses, net (198) (145) (53) (37%) Net income (loss) 11,105$ (239)$ 11,344$ N/A Net loss attributable to NCI in subsidiary 228 197 31 16% Net income (loss) attributable to Era Group Inc. 11,333$ (42)$ 11,375$ N/A Adjusted EBITDA 20,259$ 14,338$ 5,921$ 41% % Margin 29% 21% Adjusted EBITDA Excluding Gains 20,501$ 10,950$ 9,551$ 87% % Margin 29% 16%
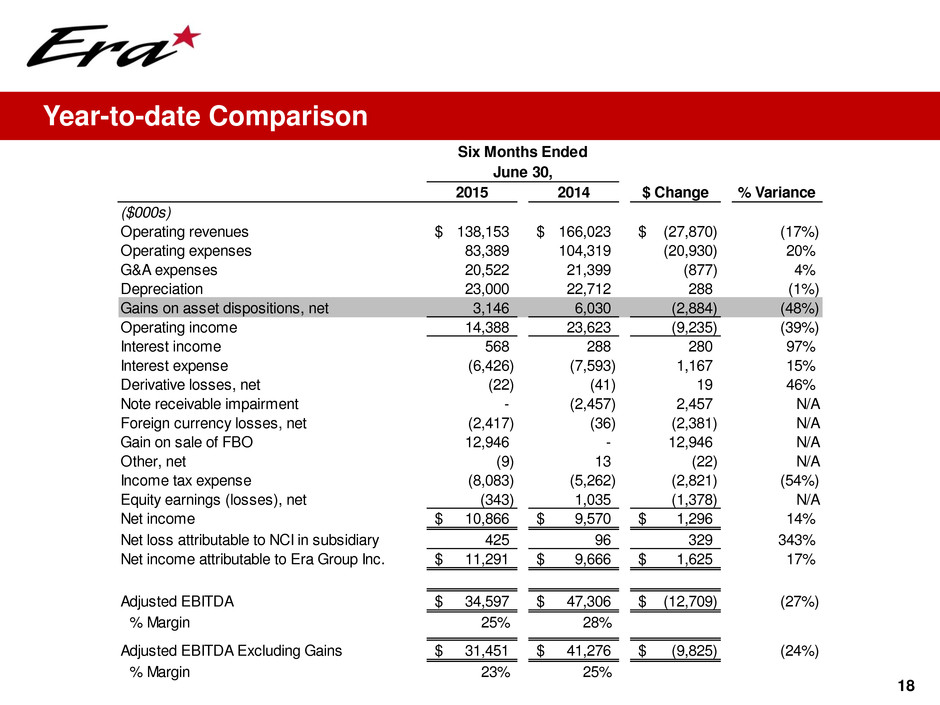
18 Year-to-date Comparison Six Months Ended June 30, 2015 2014 $ Change % Variance ($000s) Operating revenues 138,153$ 166,023$ (27,870)$ (17%) Operating expenses 83,389 104,319 (20,930) 20% G&A expenses 20,522 21,399 (877) 4% Depreciation 23,000 22,712 288 (1%) Gains on asset dispositions, net 3,146 6,030 (2,884) (48%) Operating income 14,388 23,623 (9,235) (39%) Interest income 568 288 280 97% Interest expense (6,426) (7,593) 1,167 15% Derivative losses, net (22) (41) 19 46% Note receivable impairment - (2,457) 2,457 N/A Foreign currency losses, net (2,417) (36) (2,381) N/A Gain on sale of FBO 12,946 - 12,946 N/A Other, net (9) 13 (22) N/A Income tax expense (8,083) (5,262) (2,821) (54%) Equity earnings (losses), net (343) 1,035 (1,378) N/A Net income 10,866$ 9,570$ 1,296$ 14% Net loss attributable to NCI in subsidiary 425 96 329 343% Net income attributable to Era Group Inc. 11,291$ 9,666$ 1,625$ 17% Adjusted EBITDA 34,597$ 47,306$ (12,709)$ (27%) % Margin 25% 28% Adjusted EBITDA Excluding Gains 31,451$ 41,276$ (9,825)$ (24%) % Margin 23% 25%
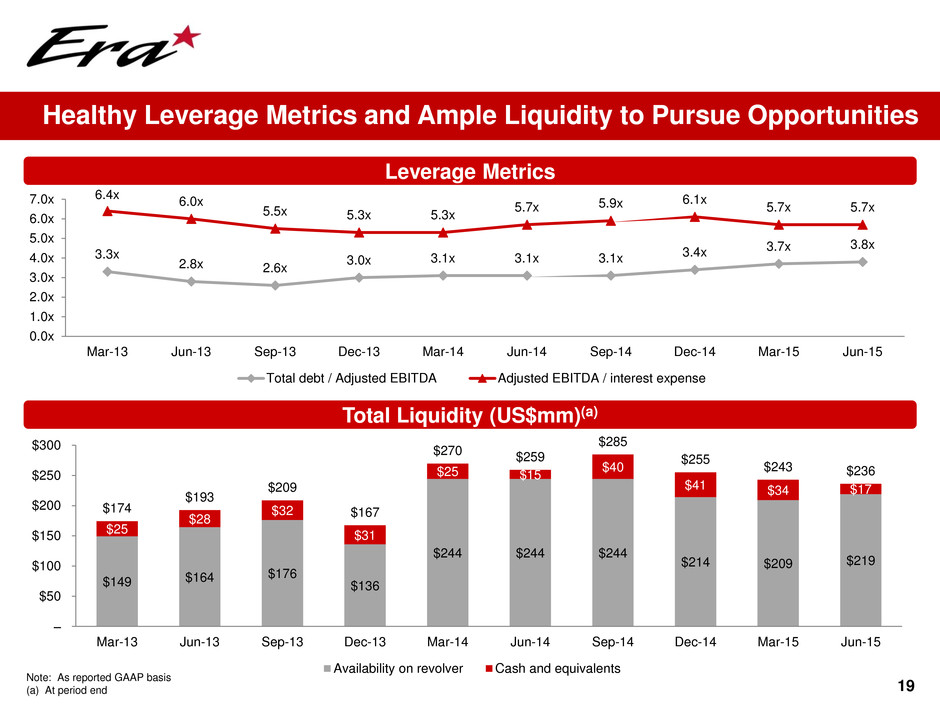
19 Leverage Metrics Total Liquidity (US$mm)(a) Healthy Leverage Metrics and Ample Liquidity to Pursue Opportunities Note: As reported GAAP basis (a) At period end $149 $164 $176 $136 $244 $244 $244 $214 $209 $219 $25 $28 $32 $31 $25 $15 $40 $41 $34 $17 $174 $193 $209 $167 $270 $259 $285 $255 $243 $236 – $50 $100 $150 $200 $250 $300 Mar-13 Jun-13 Sep-13 Dec-13 Mar-14 Jun-14 Sep-14 Dec-14 Mar-15 Jun-15 Availability on revolver Cash and equivalents 3.3x 2.8x 2.6x 3.0x 3.1x 3.1x 3.1x 3.4x 3.7x 3.8x 6.4x 6.0x 5.5x 5.3x 5.3x 5.7x 5.9x 6.1x 5.7x 5.7x 0.0x 1.0x 2.0x 3.0x 4.0x 5.0x 6.0x 7.0x Mar-13 Jun-13 Sep-13 Dec-13 Mar-14 Jun-14 Sep-14 Dec-14 Mar-15 Jun-15 Total debt / Adjusted EBITDA Adjusted EBITDA / interest expense
20 Appendix
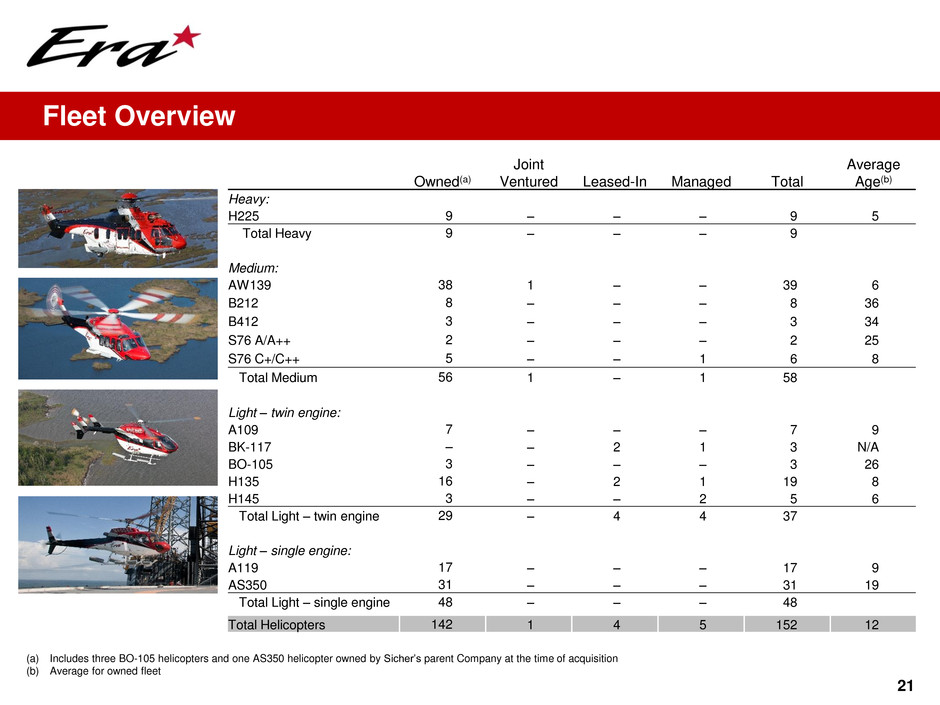
21 Owned(a) Joint Ventured Leased-In Managed Total Average Age(b) Heavy: H225 9 – – – 9 5 Total Heavy 9 – – – 9 Medium: AW139 38 1 – – 39 6 B212 8 – – – 8 36 B412 3 – – – 3 34 S76 A/A++ 2 – – – 2 25 S76 C+/C++ 5 – – 1 6 8 Total Medium 56 1 – 1 58 Light – twin engine: A109 7 – – – 7 9 BK-117 – – 2 1 3 N/A BO-105 3 – – – 3 26 H135 16 – 2 1 19 8 H145 3 – – 2 5 6 Total Light – twin engine 29 – 4 4 37 Light – single engine: A119 17 – – – 17 9 AS350 31 – – – 31 19 Total Light – single engine 48 – – – 48 Total Helicopters 142 1 4 5 152 12 (a) Includes three BO-105 helicopters and one AS350 helicopter owned by Sicher’s parent Company at the time of acquisition (b) Average for owned fleet Fleet Overview
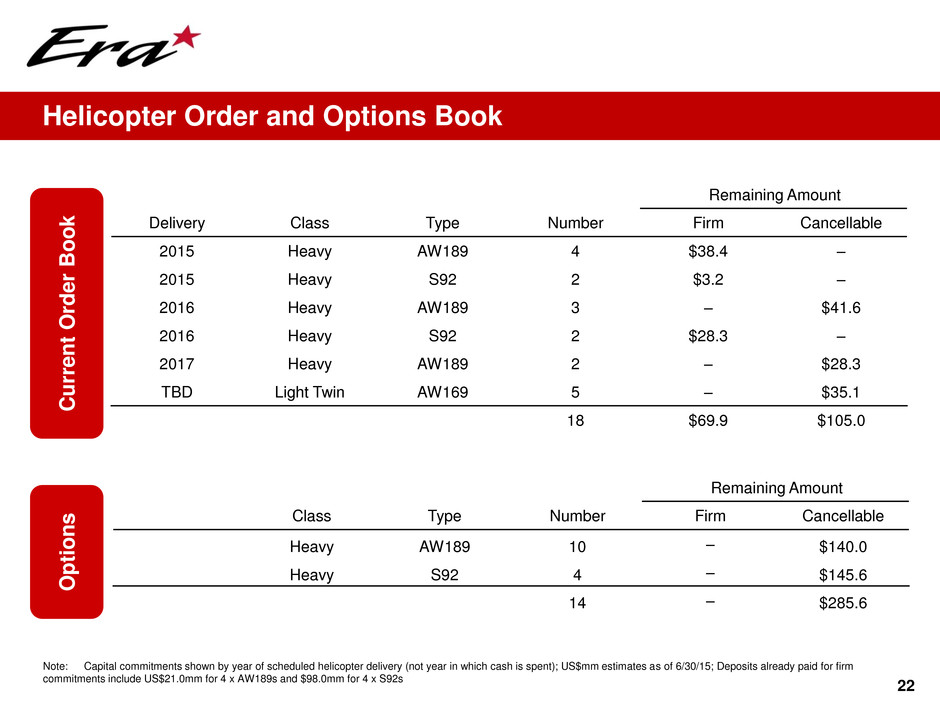
22 Cu rr ent Orde r Boo k O p tio n s Delivery Class Type Number Remaining Amount Firm Cancellable 2015 Heavy AW189 4 $38.4 – 2015 Heavy S92 2 $3.2 – 2016 Heavy AW189 3 – $41.6 2016 Heavy S92 2 $28.3 – 2017 Heavy AW189 2 – $28.3 TBD Light Twin AW169 5 – $35.1 18 $69.9 $105.0 Note: Capital commitments shown by year of scheduled helicopter delivery (not year in which cash is spent); US$mm estimates as of 6/30/15; Deposits already paid for firm commitments include US$21.0mm for 4 x AW189s and $98.0mm for 4 x S92s Class Type Number Remaining Amount Firm Cancellable Heavy AW189 10 – $140.0 Heavy S92 4 – $145.6 14 – $285.6 Helicopter Order and Options Book
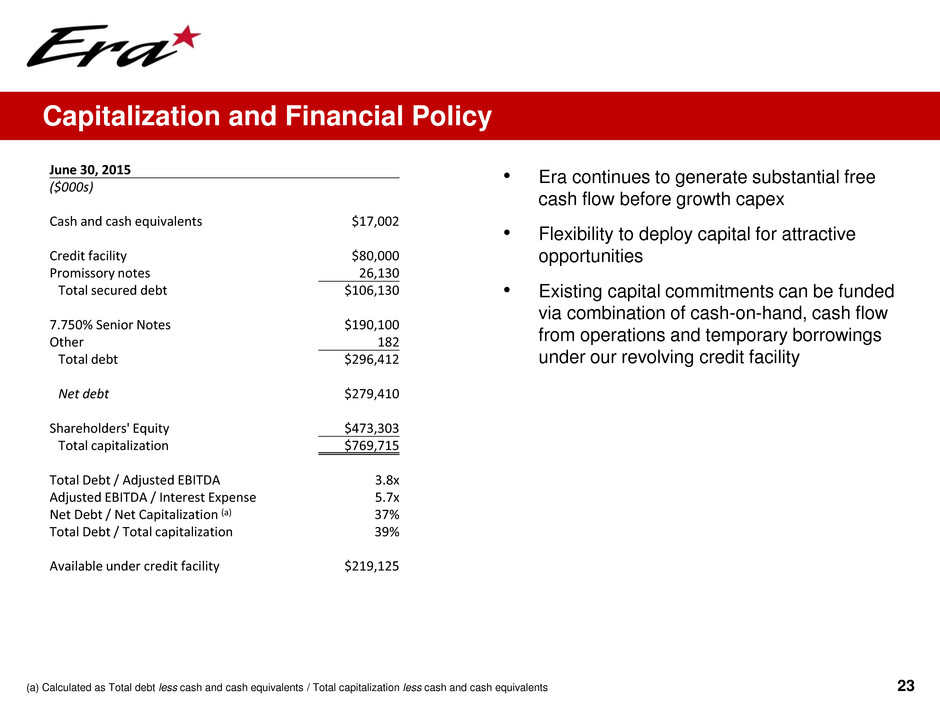
June 30, 2015 ($000s) Cash and cash equivalents $17,002 Credit facility $80,000 Promissory notes 26,130 Total secured debt $106,130 7.750% Senior Notes $190,100 Other 182 Total debt $296,412 Net debt $279,410 Shareholders' Equity $473,303 Total capitalization $769,715 Total Debt / Adjusted EBITDA 3.8x Adjusted EBITDA / Interest Expense 5.7x Net Debt / Net Capitalization (a) 37% Total Debt / Total capitalization 39% Available under credit facility $219,125 23 • Era continues to generate substantial free cash flow before growth capex • Flexibility to deploy capital for attractive opportunities • Existing capital commitments can be funded via combination of cash-on-hand, cash flow from operations and temporary borrowings under our revolving credit facility Capitalization and Financial Policy (a) Calculated as Total debt less cash and cash equivalents / Total capitalization less cash and cash equivalents
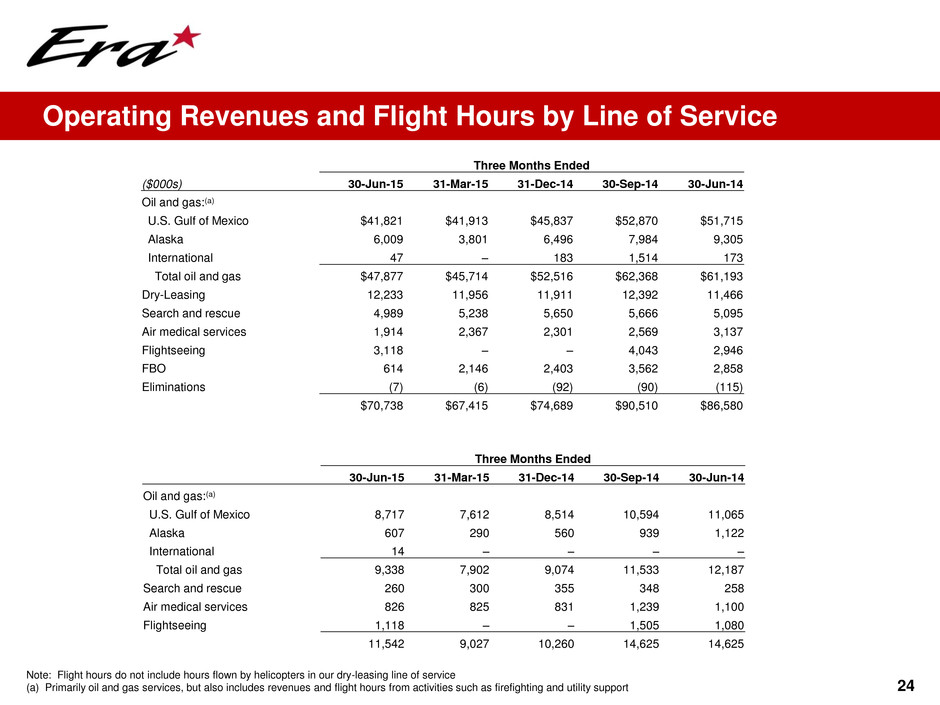
24 Operating Revenues and Flight Hours by Line of Service Note: Flight hours do not include hours flown by helicopters in our dry-leasing line of service (a) Primarily oil and gas services, but also includes revenues and flight hours from activities such as firefighting and utility support Three Months Ended ($000s) 30-Jun-15 31-Mar-15 31-Dec-14 30-Sep-14 30-Jun-14 Oil and gas:(a) U.S. Gulf of Mexico $41,821 $41,913 $45,837 $52,870 $51,715 Alaska 6,009 3,801 6,496 7,984 9,305 International 47 – 183 1,514 173 Total oil and gas $47,877 $45,714 $52,516 $62,368 $61,193 Dry-Leasing 12,233 11,956 11,911 12,392 11,466 Search and rescue 4,989 5,238 5,650 5,666 5,095 Air medical services 1,914 2,367 2,301 2,569 3,137 Flightseeing 3,118 – – 4,043 2,946 FBO 614 2,146 2,403 3,562 2,858 Eliminations (7) (6) (92) (90) (115) $70,738 $67,415 $74,689 $90,510 $86,580 Three Months Ended 30-Jun-15 31-Mar-15 31-Dec-14 30-Sep-14 30-Jun-14 Oil and gas:(a) U.S. Gulf of Mexico 8,717 7,612 8,514 10,594 11,065 Alaska 607 290 560 939 1,122 International 14 – – – – Total oil and gas 9,338 7,902 9,074 11,533 12,187 Search and rescue 260 300 355 348 258 Air medical services 826 825 831 1,239 1,100 Flightseeing 1,118 – – 1,505 1,080 11,542 9,027 10,260 14,625 14,625
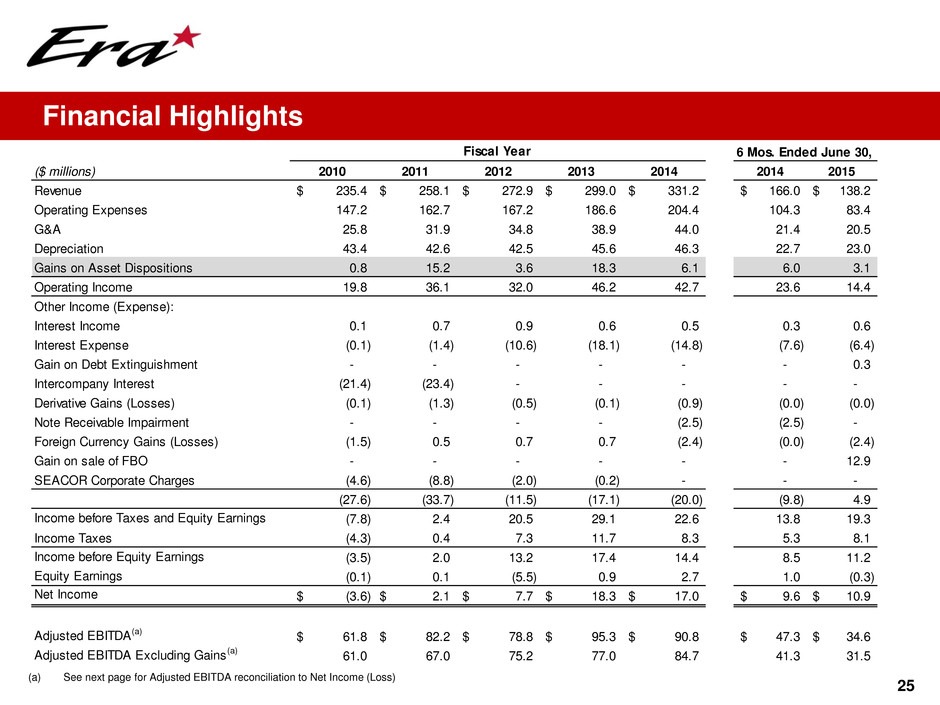
25 (a) See next page for Adjusted EBITDA reconciliation to Net Income (Loss) Financial Highlights Fiscal Year 6 Mos. Ended June 30, ($ millions) 2010 2011 2012 2013 2014 2014 2015 Revenue 235.4$ 258.1$ 272.9$ 299.0$ 331.2$ 166.0$ 138.2$ Operating Expenses 147.2 162.7 167.2 186.6 204.4 104.3 83.4 G&A 25.8 31.9 34.8 38.9 44.0 21.4 20.5 Depreciation 43.4 42.6 42.5 45.6 46.3 22.7 23.0 Gains on Asset Dispositions 0.8 15.2 3.6 18.3 6.1 6.0 3.1 Operating Income 19.8 36.1 32.0 46.2 42.7 23.6 14.4 Other Income (Expense): Interest Income 0.1 0.7 0.9 0.6 0.5 0.3 0.6 Interest Expense (0.1) (1.4) (10.6) (18.1) (14.8) (7.6) (6.4) Gain on Debt Extinguishment - - - - - - 0.3 Intercompany Interest (21.4) (23.4) - - - - - Derivative Gains (Losses) (0.1) (1.3) (0.5) (0.1) (0.9) (0.0) (0.0) Note Receivable Impairment - - - - (2.5) (2.5) - Foreign Currency Gains (Losses) (1.5) 0.5 0.7 0.7 (2.4) (0.0) (2.4) Gain on sale of FBO - - - - - - 12.9 SEACOR Corporate Charges (4.6) (8.8) (2.0) (0.2) - - - (27.6) (33.7) (11.5) (17.1) (20.0) (9.8) 4.9 Income before Taxes and Equity Earnings (7.8) 2.4 20.5 29.1 22.6 13.8 19.3 Income Taxes (4.3) 0.4 7.3 11.7 8.3 5.3 8.1 Income before Equity Earnings (3.5) 2.0 13.2 17.4 14.4 8.5 11.2 Equity Earnings (0.1) 0.1 (5.5) 0.9 2.7 1.0 (0.3) Net Income (3.6)$ 2.1$ 7.7$ 18.3$ 17.0$ 9.6$ 10.9$ Adjusted EBITDA(a) 61.8$ 82.2$ 78.8$ 95.3$ 90.8$ 47.3$ 34.6$ Adjusted EBITDA Excluding Gains (a) 61.0 67.0 75.2 77.0 84.7 41.3 31.5
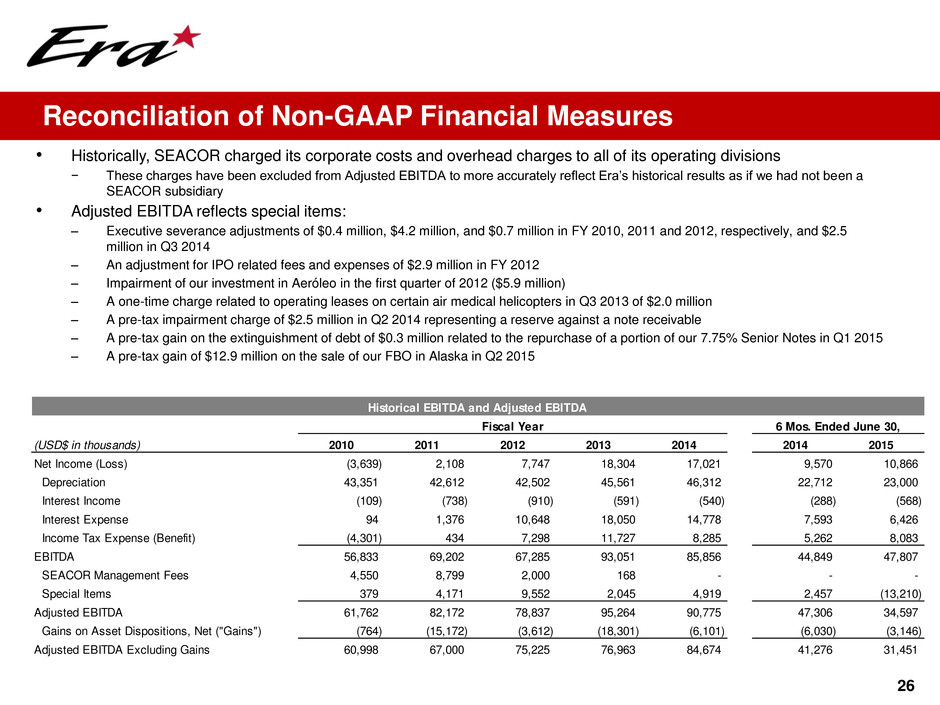
• Historically, SEACOR charged its corporate costs and overhead charges to all of its operating divisions − These charges have been excluded from Adjusted EBITDA to more accurately reflect Era’s historical results as if we had not been a SEACOR subsidiary • Adjusted EBITDA reflects special items: – Executive severance adjustments of $0.4 million, $4.2 million, and $0.7 million in FY 2010, 2011 and 2012, respectively, and $2.5 million in Q3 2014 – An adjustment for IPO related fees and expenses of $2.9 million in FY 2012 – Impairment of our investment in Aeróleo in the first quarter of 2012 ($5.9 million) – A one-time charge related to operating leases on certain air medical helicopters in Q3 2013 of $2.0 million – A pre-tax impairment charge of $2.5 million in Q2 2014 representing a reserve against a note receivable – A pre-tax gain on the extinguishment of debt of $0.3 million related to the repurchase of a portion of our 7.75% Senior Notes in Q1 2015 – A pre-tax gain of $12.9 million on the sale of our FBO in Alaska in Q2 2015 26 Reconciliation of Non-GAAP Financial Measures Historical EBITDA and Adjusted EBITDA Quarterly Historical Fiscal Year 6 Mos. Ended June 30, (USD$ in thousands) 2010 2011 2012 2013 2014 2014 2015 Net Income (Loss) (3,639) 2,108 7,747 18,304 17,021 9,570 10,866 Depreciation 43,351 42,612 42,502 45,561 46,312 22,712 23,000 Int rest In ome (109) (738) (910) (591) (540) (288) (568) I t rest Ex nse 94 1,376 10,648 18,050 14,778 7,593 6,426 I com Tax Expense (Benefit) (4,301) 434 7,298 11,727 8,285 5,262 8,083 EBITD 56,833 69,202 67,285 93,051 85,856 44,849 47,807 SEACOR Management Fees 4,550 8,799 2,000 168 - - - Special Items 379 4,171 9,552 2,045 4,919 2,457 (13,210) Adjusted EBITDA 61,762 82,172 78,837 95,264 90,775 47,306 34,597 Gains on Asset Dispositions, Net ("Gains") (764) (15,172) (3,612) (18,301) (6,101) (6,030) (3,146) Adjusted EBITDA Excluding Gains 60,998 67,000 75,225 76,963 84,674 41,276 31,451
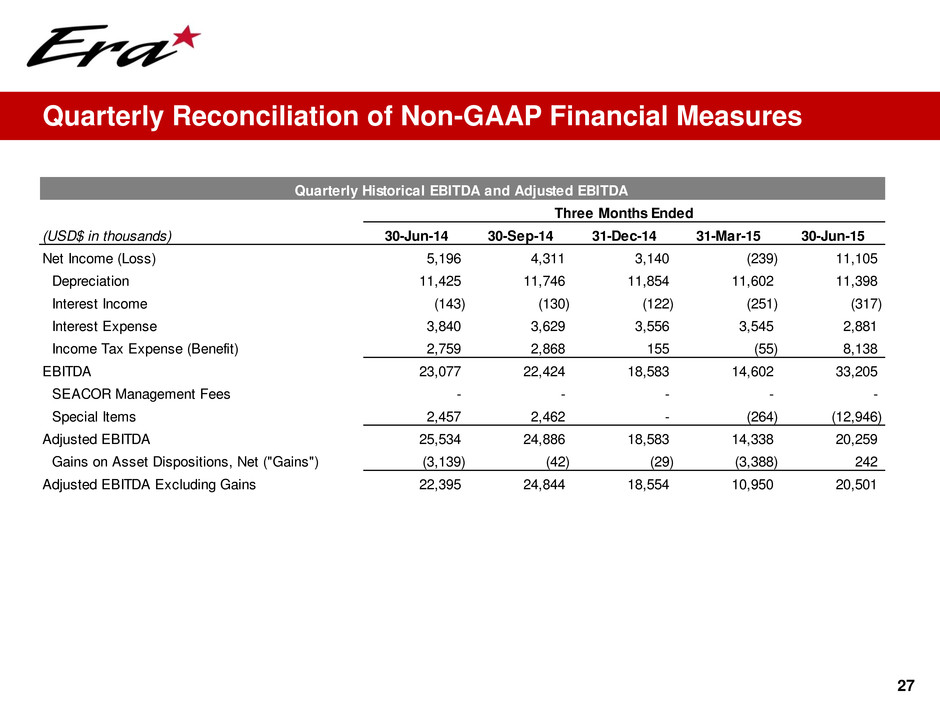
27 Quarterly Reconciliation of Non-GAAP Financial Measures Quarterly Historical EBITDA and Adjusted EBITDA Three Months Ended (USD$ in thousands) 30-Jun-14 30-Sep-14 31-Dec-14 31-Mar-15 30-Jun-15 Net Income (Loss) 5,196 4,311 3,140 (239) 11,105 Depreciation 11,425 11,746 11,854 11,602 11,398 Interest Income (143) (130) (122) (251) (317) Interest Expense 3,840 3,629 3,556 3,545 2,881 Income Tax Expense (Benefit) 2,759 2,868 155 (55) 8,138 EBITDA 23,077 22,424 18,583 14,602 33,205 SEACOR Management Fees - - - - - Special Items 2,457 2,462 - (264) (12,946) Adjusted EBITDA 25,534 24,886 18,583 14,338 20,259 Gains on Asset Dispositions, Net ("Gains") (3,139) (42) (29) (3,388) 242 Adjusted EBITDA Excluding Gains 22,395 24,844 18,554 10,950 20,501
Serious News for Serious Traders! Try StreetInsider.com Premium Free!
You May Also Be Interested In
- Nexus Medical Enterprises Announces Promotion of Aaron Black to Senior Vice President of Clinical & Administrative Operations
- Palmetto Publishing Releases Anne Elder's Small-Town Mystery Novel The Silence Has Spoken
- Dana Incorporated to Announce 2026 Third-quarter Financial Results, Host Conference Call and Webcast on October 28
Create E-mail Alert Related Categories
SEC FilingsSign up for StreetInsider Free!
Receive full access to all new and archived articles, unlimited portfolio tracking, e-mail alerts, custom newswires and RSS feeds - and more!
