

Form 8-K EPR PROPERTIES For: May 05
 Tweet
Tweet Share
ShareExhibit 99.1
EPR PROPERTIES REPORTS FIRST QUARTER 2021 RESULTS
Kansas City, MO, May 5, 2021 -- EPR Properties (NYSE:EPR) today announced operating results for the first quarter ended March 31, 2021 (dollars in thousands, except per share data):
| Three Months Ended March 31, | ||||||||||||||
| 2021 | 2020 | |||||||||||||
| Total revenue | $ | 111,765 | $ | 151,012 | ||||||||||
| Net (loss) income available to common shareholders | (2,654) | 31,084 | ||||||||||||
| Net (loss) income available to common shareholders per diluted common share | (0.04) | 0.40 | ||||||||||||
| Funds From Operations as adjusted (FFOAA) (1) | 35,605 | 75,926 | ||||||||||||
| FFOAA per diluted common share (1) | 0.48 | 0.97 | ||||||||||||
| Adjusted Funds From Operations (AFFO) (1) | 38,926 | 90,067 | ||||||||||||
| AFFO per diluted common share (1) | 0.52 | 1.14 | ||||||||||||
| (1) a non-GAAP financial measure | ||||||||||||||
First Quarter Company Headlines
•Quarterly Collections Continue to Increase - Cash collections from customers continue to improve and were approximately 72% and 77% of contractual cash revenue for the first quarter of 2021 and April 2021, respectively. In addition, year-to-date through April 30, 2021, the Company collected $40.0 million of deferred rent and interest from accrual basis tenants and borrowers that reduced receivables.
•Strong Increase in Theatre Reopenings Expected - Approximately 71% of the Company's theatre properties were open as of April 30, 2021. Additionally, with Regal's announced reopening schedule, it is expected that by May 21, 2021, approximately 98% of the Company's theatres will be open.
•Continued Capital Recycling - During the first quarter, the Company received $13.7 million in net proceeds and recognized a net gain of $0.2 million from property dispositions. During the past year, the Company has sold three theatre properties and has an additional six theatres under contract to sell with closings anticipated through the remainder of 2021 and into 2022.
•Strong Liquidity Position - The Company had cash on hand of $538.1 million at quarter-end. Subsequent to quarter-end, due to stronger collections, proceeds from dispositions and significant liquidity, the Company used $90.0 million of its cash on hand to pay off the remaining borrowings under its $1.0 billion unsecured revolving credit facility.
CEO Comments
“Our first quarter results reflect the acceleration of cash collections from tenants and borrowers,” stated Greg Silvers, Company President and CEO. “We are increasingly optimistic about our outlook as vaccination deployment expands, and consumers are exhibiting their desire to re-engage in the experiences that our customers offer them. We are pleased that most markets are largely open, capacity restrictions are easing, and particularly that the much anticipated reopening of theatres across the country is underway. Having managed our business through the pandemic to preserve liquidity, we believe we are at an inflection point, and with increased visibility look forward to further stabilization and a return to growth.”
COVID-19 Response and Update
Collections and Property Openings
Approximately 96% of the Company's non-theatre and 71% of the Company's theatre locations were open for business as of April 30, 2021. It is expected that by May 21, 2021 approximately 98% of the Company's theatres will be open based on Regal's announced reopening schedule. Cash collections from tenants and borrowers continued to improve and were approximately $98.1 million or 72% of contractual cash revenue for the first quarter (including approximately $1.5 million in deferred rent from cash basis tenants and from tenants for which the deferred payments were not previously recognized as revenue). Such cash collections further increased to 77% for April of 2021. Contractual cash revenue is an operational measure and represents aggregate cash payments for which the Company is entitled under existing contracts, excluding the impact of any temporary abatements or deferrals, percentage rent (rents received over base amounts), non-cash revenue and revenue from taxable REIT subsidiaries (TRSs).
In addition, year-to-date through April 30, 2021, collections of deferred rent and interest from accrual basis tenants and borrowers that reduced receivables totaled approximately $40.0 million. These collections are in addition to the collection amounts discussed above.
Theatre Update
During March of 2021, multiple states, most importantly New York and California, began allowing theatres to reopen with capacity limitations that vary from location to location. As vaccinations increase and theatres reopen, studios are releasing more films. With the increased supply and demand, box office increased in March and again in April. Local capacity restrictions and limited film content continue to create a challenging environment for theatre operators, but with increasing vaccinations, recent box office performance, the current major title release schedule, and expected continuing easing of capacity limitations, the Company anticipates that the US box office will continue to improve throughout the remainder of 2021.
Capital Recycling
During the first quarter of 2021, the Company completed the sale of one theatre property and one outparcel for net proceeds totaling $13.7 million and recognized a combined gain on sale of $0.2 million. During the past year, the Company has sold three theatre properties and has an additional six theatres under contract to sell with closings anticipated through the remainder of 2021 and into 2022.
On March 22, 2021, the Company received $5.1 million in proceeds representing prepayment in full on a mortgage note receivable that was secured by a private school property. No prepayment fee was received in connection with this note payoff.
Strong Liquidity Position
The Company remains focused on maintaining strong liquidity and financial flexibility through the pandemic. The Company had $538.1 million of cash on hand at quarter-end. On April 9, 2021, due to stronger collections, proceeds from dispositions and significant liquidity, the Company used $90.0 million of its cash on hand to pay off the remaining borrowings under its $1.0 billion unsecured revolving credit facility.
Portfolio Update
The Company's total investments (a non-GAAP financial measure) were approximately $6.5 billion at March 31, 2021 with Experiential totaling $5.9 billion, or 91%, and Education totaling $0.6 billion, or 9%.
The Company's Experiential portfolio (excluding property under development) consisted of the following property types (owned or financed) at March 31, 2021:
•177 theatre properties;
•55 eat & play properties (including seven theatres located in entertainment districts);
•18 attraction properties;
•13 ski properties;
•six experiential lodging properties;
•one gaming property;
•three cultural properties; and
•seven fitness & wellness properties.
As of March 31, 2021, the Company's owned Experiential portfolio consisted of approximately 19.3 million square feet, which was 92.8% leased and included $94.8 million in property under development and $20.2 million in undeveloped land inventory.
The Company's Education portfolio consisted of the following property types (owned or financed) at March 31, 2021:
•65 early childhood education center properties; and
•9 private school properties.
As of March 31, 2021, the Company's owned Education portfolio consisted of approximately 1.4 million square feet, which was 100% leased and included $3.0 million in undeveloped land inventory.
The combined owned portfolio consisted of 20.7 million square feet and was 93.3% leased.
Investment Update
The Company's investment spending during the three months ended March 31, 2021 totaled $52.1 million, and included the acquisition of a Topgolf property in San Jose, California for $26.7 million as well as spending on build-to-suit development and redevelopment projects.
Dividend Information
The monthly cash dividend to common shareholders was suspended following the common share dividend paid on May 15, 2020 to shareholders of record as of April 30, 2020. The Company is restricted from paying dividends on its common shares during the previously disclosed covenant relief period under certain of its debt agreements, subject to certain limited exceptions, and there can be no assurances as to the Company's ability to reinstitute cash dividend payments to common shareholders or the timing thereof.
The Board declared its regular quarterly dividends to preferred shareholders of $0.359375 per share on its 5.75% Series C cumulative convertible preferred shares, $0.5625 per share on its 9.00% Series E cumulative convertible preferred shares and $0.359375 per share on its 5.75% Series G cumulative redeemable preferred shares.
Conference Call Information
Management will host a conference call to discuss the Company's financial results on May 6, 2021 at 8:30 a.m. Eastern Time. The call may also include discussion of Company developments, and forward-looking and other material information about business and financial matters. The conference will be webcast and can be accessed via the Webcasts page in the Investor Center on the Company's website located at https://investors.eprkc.com/webcasts. To access the call, audio only, dial (866) 587-2930 and when prompted, provide the passcode 9155913.
You may watch a replay of the webcast by visiting the Webcasts page at https://investors.eprkc.com/webcasts.
Quarterly Supplemental
The Company's supplemental information package for the first quarter ended March 31, 2021 is available in the Investor Center on the Company's website located at https://investors.eprkc.com/earnings-supplementals.
EPR Properties
Consolidated Statements of (Loss) Income
(Unaudited, dollars in thousands except per share data)
| Three Months Ended March 31, | |||||||||||
| 2021 | 2020 | ||||||||||
| Rental revenue | $ | 102,614 | $ | 135,043 | |||||||
| Other income | 678 | 7,573 | |||||||||
| Mortgage and other financing income | 8,473 | 8,396 | |||||||||
| Total revenue | 111,765 | 151,012 | |||||||||
| Property operating expense | 15,313 | 13,093 | |||||||||
| Other expense | 2,552 | 9,534 | |||||||||
| General and administrative expense | 11,336 | 10,988 | |||||||||
| Costs associated with loan refinancing or payoff | 241 | — | |||||||||
| Interest expense, net | 39,194 | 34,753 | |||||||||
| Transaction costs | 548 | 1,075 | |||||||||
| Credit loss (benefit) expense | (2,762) | 1,192 | |||||||||
| Depreciation and amortization | 40,326 | 43,810 | |||||||||
| Income before equity in loss from joint ventures and other items | 5,017 | 36,567 | |||||||||
| Equity in loss from joint ventures | (1,431) | (420) | |||||||||
| Gain on sale of real estate | 201 | 220 | |||||||||
| Income before income taxes | 3,787 | 36,367 | |||||||||
| Income tax (expense) benefit | (407) | 751 | |||||||||
| Net income | 3,380 | 37,118 | |||||||||
| Preferred dividend requirements | (6,034) | (6,034) | |||||||||
| Net (loss) income available to common shareholders of EPR Properties | $ | (2,654) | $ | 31,084 | |||||||
| Net (loss) income available to common shareholders of EPR Properties per share: | |||||||||||
| Basic | $ | (0.04) | $ | 0.40 | |||||||
| Diluted | $ | (0.04) | $ | 0.40 | |||||||
| Shares used for computation (in thousands): | |||||||||||
| Basic | 74,627 | 78,467 | |||||||||
| Diluted | 74,627 | 78,476 | |||||||||
EPR Properties
Condensed Consolidated Balance Sheets
(Unaudited, dollars in thousands)
| March 31, 2021 | December 31, 2020 | ||||||||||
| Assets | |||||||||||
| Real estate investments, net of accumulated depreciation of $1,101,727 and $1,062,087 at March 31, 2021 and December 31, 2020, respectively | $ | 4,801,106 | $ | 4,851,302 | |||||||
| Land held for development | 23,225 | 23,225 | |||||||||
| Property under development | 94,822 | 57,630 | |||||||||
| Operating lease right-of-use assets | 179,113 | 163,766 | |||||||||
| Mortgage notes and related accrued interest receivable | 364,969 | 365,628 | |||||||||
| Investment in joint ventures | 28,313 | 28,208 | |||||||||
| Cash and cash equivalents | 538,077 | 1,025,577 | |||||||||
| Restricted cash | 5,928 | 2,433 | |||||||||
| Accounts receivable | 97,517 | 116,193 | |||||||||
| Other assets | 75,032 | 70,223 | |||||||||
| Total assets | $ | 6,208,102 | $ | 6,704,185 | |||||||
| Liabilities and Equity | |||||||||||
| Accounts payable and accrued liabilities | $ | 95,085 | $ | 105,379 | |||||||
| Operating lease liabilities | 217,448 | 202,223 | |||||||||
| Dividends payable | 6,078 | 6,070 | |||||||||
| Unearned rents and interest | 83,565 | 65,485 | |||||||||
| Debt | 3,171,193 | 3,694,443 | |||||||||
| Total liabilities | 3,573,369 | 4,073,600 | |||||||||
| Total equity | $ | 2,634,733 | $ | 2,630,585 | |||||||
| Total liabilities and equity | $ | 6,208,102 | $ | 6,704,185 | |||||||
Non-GAAP Financial Measures
Funds From Operations (FFO), Funds From Operations As Adjusted (FFOAA) and Adjusted Funds From Operations (AFFO)
The National Association of Real Estate Investment Trusts (“NAREIT”) developed FFO as a relative non-GAAP financial measure of performance of an equity REIT in order to recognize that income-producing real estate historically has not depreciated on the basis determined under GAAP. Pursuant to the definition of FFO by the Board of Governors of NAREIT, the Company calculates FFO as net (loss) income available to common shareholders, computed in accordance with GAAP, excluding gains and losses from disposition of real estate and impairment losses on real estate, plus real estate related depreciation and amortization, and after adjustments for unconsolidated partnerships, joint ventures and other affiliates. Adjustments for unconsolidated partnerships, joint ventures and other affiliates are calculated to reflect FFO on the same basis. The Company has calculated FFO for all periods presented in accordance with this definition.
In addition to FFO, the Company presents FFOAA and AFFO. FFOAA is presented by adding to FFO costs associated with loan refinancing or payoff, transaction costs, severance expense, preferred share redemption costs, impairment of operating lease right-of-use assets and credit loss (benefit) expense and subtracting gain on insurance recovery and deferred income tax (benefit) expense. AFFO is presented by adding to FFOAA non-real estate depreciation and amortization, deferred financing fees amortization, share-based compensation expense to management and Trustees and amortization of above and below market leases, net and tenant allowances; and subtracting maintenance capital expenditures (including second generation tenant improvements and leasing commissions), straight-lined rental revenue (removing the impact of straight-lined ground sublease expense), and the non-cash portion of mortgage and other financing income.
FFO, FFOAA and AFFO are widely used measures of the operating performance of real estate companies and are provided here as supplemental measures to GAAP net (loss) income available to common shareholders and earnings per share, and management provides FFO, FFOAA and AFFO herein because it believes this information is useful to investors in this regard. FFO, FFOAA and AFFO are non-GAAP financial measures. FFO, FFOAA and AFFO do not represent cash flows from operations as defined by GAAP and are not indicative that cash flows are adequate to fund all cash needs and are not to be considered alternatives to net income or any other GAAP measure as a measurement of the results of our operations or our cash flows or liquidity as defined by GAAP. It should also be noted that not all REITs calculate FFO, FFOAA and AFFO the same way so comparisons with other REITs may not be meaningful.
The following table summarizes FFO, FFOAA and AFFO for the three months ended March 31, 2021 and 2020 and reconciles such measures to net income available to common shareholders, the most directly comparable GAAP measure:
EPR Properties
Reconciliation of Non-GAAP Financial Measures
(Unaudited, dollars in thousands except per share data)
| Three Months Ended March 31, | ||||||||||||||
| 2021 | 2020 | |||||||||||||
| FFO: | ||||||||||||||
Net (loss) income available to common shareholders of EPR Properties | $ | (2,654) | $ | 31,084 | ||||||||||
| Gain on sale of real estate | (201) | (220) | ||||||||||||
| Real estate depreciation and amortization | 40,109 | 43,525 | ||||||||||||
| Allocated share of joint venture depreciation | 354 | 383 | ||||||||||||
| FFO available to common shareholders of EPR Properties | $ | 37,608 | $ | 74,772 | ||||||||||
| FFO available to common shareholders of EPR Properties | $ | 37,608 | $ | 74,772 | ||||||||||
| Add: Preferred dividends for Series C preferred shares | — | 1,939 | ||||||||||||
| Add: Preferred dividends for Series E preferred shares | — | 1,939 | ||||||||||||
| Diluted FFO available to common shareholders of EPR Properties | $ | 37,608 | $ | 78,650 | ||||||||||
| Three Months Ended March 31, | ||||||||||||||
| 2021 | 2020 | |||||||||||||
| FFOAA: | ||||||||||||||
| FFO available to common shareholders of EPR Properties | $ | 37,608 | $ | 74,772 | ||||||||||
| Costs associated with loan refinancing or payoff | 241 | — | ||||||||||||
| Transaction costs | 548 | 1,075 | ||||||||||||
| Credit loss (benefit) expense | (2,762) | 1,192 | ||||||||||||
| Gain on insurance recovery (included in other income) | (30) | — | ||||||||||||
| Deferred income tax benefit | — | (1,113) | ||||||||||||
| FFOAA available to common shareholders of EPR Properties | $ | 35,605 | $ | 75,926 | ||||||||||
| FFOAA available to common shareholders of EPR Properties | $ | 35,605 | $ | 75,926 | ||||||||||
| Add: Preferred dividends for Series C preferred shares | — | 1,939 | ||||||||||||
| Add: Preferred dividends for Series E preferred shares | — | 1,939 | ||||||||||||
| Diluted FFOAA available to common shareholders of EPR Properties | $ | 35,605 | $ | 79,804 | ||||||||||
| AFFO: | ||||||||||||||
| FFOAA available to common shareholders of EPR Properties | $ | 35,605 | $ | 75,926 | ||||||||||
| Non-real estate depreciation and amortization | 217 | 285 | ||||||||||||
| Deferred financing fees amortization | 1,547 | 1,634 | ||||||||||||
| Share-based compensation expense to management and trustees | 3,784 | 3,509 | ||||||||||||
| Amortization of above and below market leases, net and tenant allowances | (96) | (152) | ||||||||||||
| Maintenance capital expenditures (1) | (756) | (928) | ||||||||||||
| Straight-lined rental revenue | (1,288) | 9,708 | ||||||||||||
| Straight-lined ground sublease expense | 84 | 176 | ||||||||||||
| Non-cash portion of mortgage and other financing income | (171) | (91) | ||||||||||||
| AFFO available to common shareholders of EPR Properties | $ | 38,926 | $ | 90,067 | ||||||||||
| AFFO available to common shareholders of EPR Properties | $ | 38,926 | $ | 90,067 | ||||||||||
| Add: Preferred dividends for Series C preferred shares | — | 1,939 | ||||||||||||
| Add: Preferred dividends for Series E preferred shares | — | 1,939 | ||||||||||||
| Diluted AFFO available to common shareholders of EPR Properties | $ | 38,926 | $ | 93,945 | ||||||||||
| FFO per common share: | ||||||||||||||
| Basic | $ | 0.50 | $ | 0.95 | ||||||||||
| Diluted | 0.50 | 0.95 | ||||||||||||
| FFOAA per common share: | ||||||||||||||
| Basic | $ | 0.48 | $ | 0.97 | ||||||||||
| Diluted | 0.48 | 0.97 | ||||||||||||
| AFFO per common share: | ||||||||||||||
| Basic | $ | 0.52 | $ | 1.15 | ||||||||||
| Diluted | 0.52 | 1.14 | ||||||||||||
| Shares used for computation (in thousands): | ||||||||||||||
| Basic | 74,627 | 78,467 | ||||||||||||
| Diluted | 74,669 | 78,476 | ||||||||||||
| Weighted average shares outstanding-diluted EPS | 74,669 | 78,476 | ||||||||||||
| Effect of dilutive Series C preferred shares | — | 2,232 | ||||||||||||
| Effect of dilutive Series E preferred shares | — | 1,664 | ||||||||||||
| Adjusted weighted average shares outstanding-diluted Series C and Series E | 74,669 | 82,372 | ||||||||||||
| Other financial information: | ||||||||||||||
| Dividends per common share | $ | — | $ | 1.1325 | ||||||||||
(1) Includes maintenance capital expenditures and certain second generation tenant improvements and leasing commissions.
The conversion of the 5.75% Series C cumulative convertible preferred shares and the 9.00% Series E cumulative convertible preferred shares would be dilutive to FFO, FFOAA and AFFO per share for the three months ended March 31, 2020. Therefore, the additional common shares that would result from the conversion and the corresponding add-back of the preferred dividends declared on those shares are included in the calculation of diluted FFO, FFOAA and AFFO per share for this period.
Net Debt
Net Debt represents debt (reported in accordance with GAAP) adjusted to exclude deferred financing costs, net and reduced for cash and cash equivalents. By excluding deferred financing costs, net and reducing debt for cash and cash equivalents on hand, the result provides an estimate of the contractual amount of borrowed capital to be repaid, net of cash available to repay it. The Company believes this calculation constitutes a beneficial supplemental non-GAAP financial disclosure to investors in understanding our financial condition. The Company's method of calculating Net Debt may be different from methods used by other REITs and, accordingly, may not be comparable to such other REITs.
Gross Assets
Gross Assets represents total assets (reported in accordance with GAAP) adjusted to exclude accumulated depreciation and reduced for cash and cash equivalents. By excluding accumulated depreciation and reducing cash and cash equivalents, the result provides an estimate of the investment made by the Company. The Company believes that investors commonly use versions of this calculation in a similar manner. The Company's method of calculating Gross Assets may be different from methods used by other REITs and, accordingly, may not be comparable to such other REITs.
Net Debt to Gross Assets
Net Debt to Gross Assets is a supplemental measure derived from non-GAAP financial measures that the Company uses to evaluate capital structure and the magnitude of debt to gross assets. The Company believes that investors commonly use versions of this ratio in a similar manner. The Company's method of calculating Net Debt to Gross Assets may be different from methods used by other REITs and, accordingly, may not be comparable to such other REITs.
EBITDAre
NAREIT developed EBITDAre as a relative non-GAAP financial measure of REITs, independent of a company's capital structure, to provide a uniform basis to measure the enterprise value of a company. Pursuant to the definition of EBITDAre by the Board of Governors of NAREIT, the Company calculates EBITDAre as net (loss) income, computed in accordance with GAAP, excluding interest expense (net), income tax (benefit) expense, depreciation and amortization, gains and losses from disposition of real estate, impairment losses on real estate, costs associated with loan refinancing or payoff and adjustments for unconsolidated partnerships, joint ventures and other affiliates.
Management provides EBITDAre herein because it believes this information is useful to investors as a supplemental performance measure as it can help facilitate comparisons of operating performance between periods and with other REITs. The Company's method of calculating EBITDAre may be different from methods used by other REITs and, accordingly, may not be comparable to such other REITs. EBITDAre is not a measure of performance under GAAP, does not represent cash generated from operations as defined by GAAP and is not indicative of cash available to fund all cash needs, including distributions. This measure should not be considered an alternative to net income or any other GAAP measure as a measurement of the results of the Company's operations or cash flows or liquidity as defined by GAAP.
Adjusted EBITDAre
Management uses Adjusted EBITDAre in its analysis of the performance of the business and operations of the Company. Management believes Adjusted EBITDAre is useful to investors because it excludes various items that management believes are not indicative of operating performance, and that it is an informative measure to use in computing various financial ratios to evaluate the Company. The Company defines Adjusted EBITDAre as EBITDAre (defined above) for the quarter excluding gain on insurance recovery, severance expense, credit loss (benefit) expense, transaction costs, impairment losses on operating lease right-of-use assets and prepayment fees. For the three months ended March 31, 2020, Adjusted EBITDAre was further adjusted to reflect the write-offs of straight-line rent receivables against rental revenue of $12.5 million related to the COVID-19 disruption.
The Company's method of calculating Adjusted EBITDAre may be different from methods used by other REITs and, accordingly, may not be comparable to such other REITs. Adjusted EBITDAre is not a measure of performance under GAAP, does not represent cash generated from operations as defined by GAAP and is not indicative of cash available to fund all cash needs, including distributions. This measure should not be considered as an alternative to net income or any other GAAP measure as a measurement of the results of the Company's operations or cash flows or liquidity as defined by GAAP.
Reconciliations of debt, total assets and net income (all reported in accordance with GAAP) to Net Debt, Gross Assets, Net Debt to Gross Assets, EBITDAre and Adjusted EBITDA (each of which is a non-GAAP financial measure), as applicable, are included in the following tables (unaudited, in thousands):
| March 31, | |||||||||||
| 2021 | 2020 | ||||||||||
| Net Debt: | |||||||||||
| Debt | $ | 3,171,193 | $ | 3,854,062 | |||||||
| Deferred financing costs, net | 35,036 | 35,933 | |||||||||
| Cash and cash equivalents | (538,077) | (1,225,122) | |||||||||
| Net Debt | $ | 2,668,152 | $ | 2,664,873 | |||||||
| Gross Assets: | |||||||||||
| Total Assets | $ | 6,208,102 | $ | 7,255,340 | |||||||
| Accumulated depreciation | 1,101,727 | 1,023,993 | |||||||||
| Cash and cash equivalents | (538,077) | (1,225,122) | |||||||||
| Gross Assets | $ | 6,771,752 | $ | 7,054,211 | |||||||
| Net Debt to Gross Assets | 39 | % | 38 | % | |||||||
| Three Months Ended March 31, | |||||||||||
| 2021 | 2020 | ||||||||||
| EBITDAre and Adjusted EBITDAre: | |||||||||||
| Net income | $ | 3,380 | $ | 37,118 | |||||||
| Interest expense, net | 39,194 | 34,753 | |||||||||
| Income tax expense (benefit) | 407 | (751) | |||||||||
| Depreciation and amortization | 40,326 | 43,810 | |||||||||
| Gain on sale of real estate | (201) | (220) | |||||||||
| Costs associated with loan refinancing or payoff | 241 | — | |||||||||
| Allocated share of joint venture depreciation | 354 | 383 | |||||||||
| Allocated share of joint venture interest expense | 789 | 735 | |||||||||
| EBITDAre | $ | 84,490 | $ | 115,828 | |||||||
| Gain on insurance recovery (1) | (30) | — | |||||||||
| Transaction costs | 548 | 1,075 | |||||||||
| Credit loss (benefit) expense | (2,762) | 1,192 | |||||||||
| Straight-line receivable write-offs from prior periods (2) | — | 12,532 | |||||||||
| Adjusted EBITDAre | $ | 82,246 | $ | 130,627 | |||||||
| (1) Included in other income in the accompanying consolidated statements of (loss) income. Other income includes the following: | |||||||||||
| Three Months Ended March 31, | |||||||||||
| 2021 | 2020 | ||||||||||
| Income from settlement of foreign currency swap contracts | $ | 52 | $ | 368 | |||||||
| Gain on insurance recovery | 30 | — | |||||||||
| Operating income from operated properties | 295 | 7,201 | |||||||||
| Miscellaneous income | 301 | 4 | |||||||||
| Other income | $ | 678 | $ | 7,573 | |||||||
| (2) Included in rental revenue in the accompanying consolidated statements of (loss) income. Rental revenue includes the following: | |||||||||||
| Three Months Ended March 31, | |||||||||||
| 2021 | 2020 | ||||||||||
| Minimum rent | $ | 94,190 | $ | 138,219 | |||||||
| Tenant reimbursements | 4,822 | 3,698 | |||||||||
| Percentage rent | 2,030 | 2,757 | |||||||||
| Straight-line rental revenue | 1,289 | 2,824 | |||||||||
| Straight-line receivable write-offs from prior periods | — | (12,532) | |||||||||
| Other rental revenue | 283 | 77 | |||||||||
| Rental revenue | $ | 102,614 | $ | 135,043 | |||||||
Total Investments
Total investments is a non-GAAP financial measure defined as the sum of the carrying values of real estate investments (before accumulated depreciation), land held for development, property under development, mortgage notes receivable (including related accrued interest receivable), investment in joint ventures, intangible assets, gross (before accumulated amortization and included in other assets) and notes receivable and related accrued interest receivable, net (included in other assets). Total investments is a useful measure for management and investors as it illustrates across which asset categories the Company's funds have been invested. Our method of calculating total investments may be different from methods used by other REITs and, accordingly, may not be comparable to such other REITs. A reconciliation of total investments to total assets (computed in accordance with GAAP) is included in the following table (unaudited, in thousands):
| March 31, 2021 | December 31, 2020 | ||||||||||
| Total Investments: | |||||||||||
| Real estate investments, net of accumulated depreciation | $ | 4,801,106 | $ | 4,851,302 | |||||||
| Add back accumulated depreciation on real estate investments | 1,101,727 | 1,062,087 | |||||||||
| Land held for development | 23,225 | 23,225 | |||||||||
| Property under development | 94,822 | 57,630 | |||||||||
| Mortgage notes and related accrued interest receivable | 364,969 | 365,628 | |||||||||
| Investment in joint ventures | 28,313 | 28,208 | |||||||||
| Intangible assets, gross (1) | 57,962 | 57,962 | |||||||||
| Notes receivable and related accrued interest receivable, net (1) | 7,284 | 7,300 | |||||||||
| Total investments | $ | 6,479,408 | $ | 6,453,342 | |||||||
| Total investments | $ | 6,479,408 | $ | 6,453,342 | |||||||
| Operating lease right-of-use assets | 179,113 | 163,766 | |||||||||
| Cash and cash equivalents | 538,077 | 1,025,577 | |||||||||
| Restricted cash | 5,928 | 2,433 | |||||||||
| Accounts receivable | 97,517 | 116,193 | |||||||||
| Less: accumulated depreciation on real estate investments | (1,101,727) | (1,062,087) | |||||||||
| Less: accumulated amortization on intangible assets | (17,379) | (16,330) | |||||||||
| Prepaid expenses and other current assets | 27,165 | 21,291 | |||||||||
| Total assets | $ | 6,208,102 | $ | 6,704,185 | |||||||
| (1) Included in other assets in the accompanying consolidated balance sheet. Other assets include the following: | |||||||||||
| March 31, 2021 | December 31, 2020 | ||||||||||
| Intangible assets, gross | $ | 57,962 | $ | 57,962 | |||||||
| Less: accumulated amortization on intangible assets | (17,379) | (16,330) | |||||||||
| Notes receivable and related accrued interest receivable, net | 7,284 | 7,300 | |||||||||
| Prepaid expenses and other current assets | 27,165 | 21,291 | |||||||||
| Total other assets | $ | 75,032 | $ | 70,223 | |||||||
About EPR Properties
EPR Properties is a leading experiential net lease real estate investment trust (REIT), specializing in select enduring experiential properties in the real estate industry. We focus on real estate venues which create value by facilitating out-of-home leisure and recreation experiences where consumers choose to spend their discretionary time and money. We have nearly $6.5 billion in total investments across 44 states. We adhere to rigorous underwriting and investing criteria centered on key industry, property and tenant level cash flow standards. We believe our focused approach provides a competitive advantage and the potential for stable and attractive returns. Further information is available at www.eprkc.com.
CAUTIONARY STATEMENT CONCERNING FORWARD-LOOKING STATEMENTS
The financial results in this press release reflect preliminary, unaudited results, which are not final until the Company’s Quarterly Report on Form 10-Q is filed. With the exception of historical information, certain statements contained or incorporated by reference herein may contain forward-looking statements within the meaning of Section 27A of the Securities Act of 1933, as amended (the “Securities Act”), and Section 21E of the Securities Exchange Act of 1934, as amended (the “Exchange Act”), such as those pertaining to the uncertain financial impact of the COVID-19 pandemic, our capital resources and liquidity, our expected cash flows and liquidity, continuing waivers of financial covenants related to our bank credit facilities and private placement notes, the performance of our customers, including AMC and Regal, our expected cash collections, expected use of proceeds from dispositions and our results of operations and financial condition. The estimates presented herein are based on the Company's current expectations and, given the current economic uncertainty, there can be no assurances that the Company will be able to continue to comply with other applicable covenants under its debt agreements, which could materially impact actual performance. Forward-looking statements involve numerous risks and uncertainties, and you should not rely on them as predictions of actual events. There is no assurance the events or circumstances reflected in the forward-looking statements will occur. You can identify forward-looking statements by use of words such as “will be,” “intend,” “continue,” “believe,” “may,” “expect,” “hope,” “anticipate,” “goal,” “forecast,” “pipeline,” “estimates,” “offers,” “plans,” “would” or other similar expressions or other comparable terms or discussions of strategy, plans or intentions contained or incorporated by reference herein. Forward-looking statements necessarily are dependent on assumptions, data or methods that may be incorrect or imprecise. These forward-looking statements represent our intentions, plans, expectations and beliefs and are subject to numerous assumptions, risks and uncertainties. Many of the factors that will determine these items are beyond our ability to control or predict. For further discussion of these factors see “Item 1A. Risk Factors” in our most recent Annual Report on Form 10-K and, to the extent applicable, our Quarterly Reports on Form 10-Q.
For these statements, we claim the protection of the safe harbor for forward-looking statements contained in the Private Securities Litigation Reform Act of 1995. You are cautioned not to place undue reliance on our forward-looking statements, which speak only as of the date hereof or the date of any document incorporated by reference herein. All subsequent written and oral forward-looking statements attributable to us or any person acting on our behalf are expressly qualified in their entirety by the cautionary statements contained or referred to in this section. Except as required by law, we do not undertake any obligation to release publicly any revisions to our forward-looking statements to reflect events or circumstances after the date hereof.
EPR Properties
Brian Moriarty, 888-EPR-REIT
www.eprkc.com

FIRST QUARTER 2021 EARNINGS CALL May 6, 2021

2 The financial results in this document reflect preliminary, unaudited results, which are not final until the Company’s Annual Report on Form 10-K is filed. With the exception of historical information, certain statements contained or incorporated by reference herein may contain forward-looking statements within the meaning of Section 27A of the Securities Act of 1933, as amended (the “Securities Act”), and Section 21E of the Securities Exchange Act of 1934, as amended (the “Exchange Act”), such as those pertaining to the uncertain financial impact of COVID-19, our capital resources and liquidity, our expected cash flows and liquidity, continuing waivers of financial covenants related to our bank credit facilities and private placement notes, the performance of our customers, including AMC and Regal, our expected cash collections, expected use of proceeds from dispositions and our results of operations and financial condition. The estimates presented herein are based on the Company's current expectations and, given the current economic uncertainty, there can be no assurances that the Company will be able to continue to comply with other applicable covenants under its debt agreements, which could materially impact actual performance. Forward-looking statements involve numerous risks and uncertainties, and you should not rely on them as predictions of actual events. There is no assurance the events or circumstances reflected in the forward- looking statements will occur. You can identify forward-looking statements by use of words such as “will be,” “intend,” “continue,” “believe,” “may,” “expect,” “hope,” “anticipate,” “goal,” “forecast,” “pipeline,” “estimates,” “offers,” “plans,” “would” or other similar expressions or other comparable terms or discussions of strategy, plans or intentions contained or incorporated by reference herein. Forward-looking statements necessarily are dependent on assumptions, data or methods that may be incorrect or imprecise. These forward-looking statements represent our intentions, plans, expectations and beliefs and are subject to numerous assumptions, risks and uncertainties. Many of the factors that will determine these items are beyond our ability to control or predict. For further discussion of these factors see “Item 1A. Risk Factors” in our most recent Annual Report on Form 10-K and, to the extent applicable, our Quarterly Reports on Form 10-Q. For these statements, we claim the protection of the safe harbor for forward-looking statements contained in the Private Securities Litigation Reform Act of 1995. You are cautioned not to place undue reliance on our forward-looking statements, which speak only as of the date hereof or the date of any document incorporated by reference herein. All subsequent written and oral forward-looking statements attributable to us or any person acting on our behalf are expressly qualified in their entirety by the cautionary statements contained or referred to in this section. Except as required by law, we do not undertake any obligation to release publicly any revisions to our forward-looking statements to reflect events or circumstances after the date hereof. DISCLAIMER

INTRODUCTORY COMMENTS 3

PORTFOLIO UPDATE 4

5 PORTFOLIO OVERVIEW Education Portfolio 74 Properties; 8 Operators Occupancy at 100% * See investor supplemental for the applicable period for definitions and calculations of this Non-GAAP measure Experiential Portfolio 280 Properties; 42 Operators Occupancy at 93% $5.9B Total Investments 4 Properties under Development Total Portfolio Snapshot ~$6.5B Total Investments* Occupancy at 93% 354 Properties Q1 Investment Spending $52.1M Create Memorable Experiences in Safe Environments

6 2021 Reopening – 71% of theatres were open as of April 30, anticipate 98% as of May 21 Demonstrated Demand – April’s box office was $189M, 66% increase over March even with continued closures and capacity limitations • High quality content to drive increasing demand through 2021 Lessons Learned – Studios are committed to the exhibition economic model • Studios pushed most major titles to ensure theatrical releases; “at home viewing” not seen as replacement due to economics • Historically over 90% of ticket sales are in 45 days, so shorter release window should not have material impact PORTFOLIO REOPENING Theatres

7 PORTFOLIO REOPENING Reopening – 96% of non-theatre properties are open Other Experiential and Education

8 ASSET MANAGEMENT Capital Recycling Total property disposition proceeds were $13.7M • Sold one theatre property and vacant theatre building, bringing the total number of theatres sold since Q3 2020 to three Executed contracts • 5 remaining transitional AMC properties and former CMX theatre; anticipated closings in 2021 and 2022 Collections and Deferral Agreements Cash collections continue to improve with reopenings • Q1 collections were 72% of contractual cash revenue • April collections were 77% of contractual cash revenue Deferral agreements • Customers representing substantially all contractual cash revenue, including each of our Top 20 customers, are paying their contractual rent or interest or have a deferral agreement in place

FINANCIAL REVIEW 9

1 0 (In millions except per-share data) * See investor supplementals for the applicable periods for definitions and calculations of these non-GAAP measures FINANCIAL HIGHLIGHTS Financial Performance* Quarter ended March 31, 2021 2020 $ Change % Change Total Revenue $111.8 $151.0 ($39.2) (26%) Net (Loss) Income – Common (2.7) 31.1 (33.8) (109%) FFO as adj. – Common* 35.6 75.9 (40.3) (53%) AFFO – Common* 38.9 90.1 (51.2) (57%) Net (Loss) Income/share – Common (0.04) 0.40 (0.44) (110%) FFO/share - Common, as adj.* 0.48 0.97 (0.49) (51%) AFFO/share - Common* 0.52 1.14 (0.62) (54%)

1 1 Net Debt to Gross Assets was 39% at 3/31/21 • $3.2B total debt; $3.1B fixed rate or fixed through int. rate swaps at wtd. avg. = 4.7% • Weighted average debt maturity ~5 years; No scheduled debt maturities until revolver matures in 2022 which currently has no balance outstanding • Continue to be in Covenant Relief Period Liquidity Position • $538.1M unrestricted cash on hand at 3/31/21 • $90M drawn on $1B revolver at 3/31/21 • Strong collections and significant liquidity allowed repayment of remaining balance of revolver on April 9, 2021 • Cash collections 72% and 77% of contractual cash revenue for first quarter and April 2021; Additional $40M of accrued deferred rent and interest receivable collected through 4/30/21 CAPITAL MARKETS UPDATE

1 2 EXPECTED REVENUE RECOGNITION AND COLLECTIONS Q2 2021 Range in $ % of Contractual Cash Revenue1 Revenue recognition $109M - $116M 80% - 85% Collections $102M - $109M 75% - 80% (1) Contractual cash revenue is an operational measure and represents aggregate cash payments for which the Company is entitled under existing contracts, excluding the impact of any temporary abatements or deferrals, percentage rent (rents received over base amounts), non-cash revenue and revenue from taxable REIT subsidiaries (TRSs).

CLOSING COMMENTS 1 3

EPR Properties 909 Walnut Street, Suite 200 Kansas City, MO 64106 www.eprkc.com 816-472-1700 [email protected]
Exhibit 99.3

| Supplemental Operating and Financial Data | ||
| First Quarter Ended March 31, 2021 | ||
| TABLE OF CONTENTS | ||||||||||||||||||||||||||
| SECTION | PAGE | |||||||||||||||||||||||||
| Company Profile | ||||||||||||||||||||||||||
| Investor Information | ||||||||||||||||||||||||||
| Selected Financial Information | ||||||||||||||||||||||||||
| Selected Balance Sheet Information | ||||||||||||||||||||||||||
| Selected Operating Data | ||||||||||||||||||||||||||
| Funds From Operations and Funds From Operations as Adjusted | ||||||||||||||||||||||||||
| Adjusted Funds From Operations | ||||||||||||||||||||||||||
| Capital Structure | ||||||||||||||||||||||||||
| Summary of Ratios | ||||||||||||||||||||||||||
| Summary of Mortgage Notes Receivable | ||||||||||||||||||||||||||
| Investment Spending and Disposition Summaries | ||||||||||||||||||||||||||
| Property Under Development - Investment Spending Estimates | ||||||||||||||||||||||||||
| Lease Expirations | ||||||||||||||||||||||||||
| Top Ten Customers by Total Revenue | ||||||||||||||||||||||||||
| Definitions-Non-GAAP Financial Measures | ||||||||||||||||||||||||||
| Appendix-Reconciliation of Certain Non-GAAP Financial Measures | ||||||||||||||||||||||||||
 | ||||||||
| Q1 2021 Supplemental | Page 2 | |||||||
| CAUTIONARY STATEMENT CONCERNING FORWARD-LOOKING STATEMENTS | ||||||||||||||
The financial results in this document reflect preliminary, unaudited results, which are not final until the Company’s Quarterly Report on Form 10-Q is filed. With the exception of historical information, certain statements contained or incorporated by reference herein may contain forward-looking statements within the meaning of Section 27A of the Securities Act of 1933, as amended (the “Securities Act”), and Section 21E of the Securities Exchange Act of 1934, as amended (the “Exchange Act”), such as those pertaining to the uncertain financial impact of COVID-19, our capital resources and liquidity, our expected cash flows and liquidity, continuing waivers of financial covenants related to our bank credit facilities and private placement notes, the performance of our customers, including AMC and Regal, our expected cash collections, expected use of proceeds from dispositions and our results of operations and financial condition. The estimates presented herein are based on the Company's current expectations and, given the current economic uncertainty, there can be no assurances that the Company will be able to continue to comply with other applicable covenants under its debt agreements, which could materially impact actual performance. Forward-looking statements involve numerous risks and uncertainties, and you should not rely on them as predictions of actual events. There is no assurance the events or circumstances reflected in the forward-looking statements will occur. You can identify forward-looking statements by use of words such as “will be,” “intend,” “continue,” “believe,” “may,” “expect,” “hope,” “anticipate,” “goal,” “forecast,” “pipeline,” “estimates,” “offers,” “plans,” “would” or other similar expressions or other comparable terms or discussions of strategy, plans or intentions contained or incorporated by reference herein. Forward-looking statements necessarily are dependent on assumptions, data or methods that may be incorrect or imprecise. These forward-looking statements represent our intentions, plans, expectations and beliefs and are subject to numerous assumptions, risks and uncertainties. Many of the factors that will determine these items are beyond our ability to control or predict. For further discussion of these factors see “Item 1A. Risk Factors” in our most recent Annual Report on Form 10-K and, to the extent applicable, our Quarterly Reports on Form 10-Q.
For these statements, we claim the protection of the safe harbor for forward-looking statements contained in the Private Securities Litigation Reform Act of 1995. You are cautioned not to place undue reliance on our forward-looking statements, which speak only as of the date hereof or the date of any document incorporated by reference herein. All subsequent written and oral forward-looking statements attributable to us or any person acting on our behalf are expressly qualified in their entirety by the cautionary statements contained or referred to in this section. Except as required by law, we do not undertake any obligation to release publicly any revisions to our forward-looking statements to reflect events or circumstances after the date hereof.
NON-GAAP INFORMATION
This document contains certain non-GAAP measures. These non-GAAP measures, as calculated by the Company, are not necessarily comparable to similarly titled measures reported by other companies. Additionally, these non-GAAP measures are not measurements of financial performance or liquidity under GAAP and should not be considered alternatives to the Company's other financial information determined under GAAP. See pages 22 through 24 for definitions of certain non-GAAP financial measures used in this document and the reconciliations of certain non-GAAP measures on pages 9 and 10 and in the Appendix on pages 25 through 29.
| ||||||||
| Q1 2021 Supplemental | Page 3 | |||||||
| COMPANY PROFILE | ||||||||||||||
| THE COMPANY | COMPANY STRATEGY | |||||||
| EPR Properties ("EPR" or the "Company") is a self-administered and self-managed real estate investment trust. EPR was formed in August 1997 as a Maryland real estate investment trust ("REIT"), and an initial public offering was completed on November 18, 1997. | EPR's primary business objective is to enhance shareholder value by achieving predictable growth in Funds from Operations As Adjusted ("FFOAA") and dividends per share. | |||||||
| Since that time, the Company has been a leading Experiential net lease REIT, specializing in select enduring experiential properties. We are focused on growing our Experiential portfolio with properties that offer a variety of enduring, congregate entertainment, recreation and leisure activities. Separately, our Education portfolio is a legacy investment that provides additional geographic and operator diversity. | Our strategic growth is focused on acquiring or developing experiential real estate venues which create value by facilitating out-of-home congregate entertainment, recreation and leisure experiences where consumers choose to spend their discretionary time and money. These are properties which make up the social infrastructure of society. | |||||||
| This focus is consistent with our depth of knowledge across each of our property types, creating a competitive advantage that allows us to more quickly identify key market trends. We deliberately apply information and our ingenuity to target properties that represent logical extensions within each of our existing property types or potential future investments. | ||||||||
 | ||||||||
| As part of our strategic planning and portfolio management process we assess new opportunities against the following underwriting principles: | ||||||||
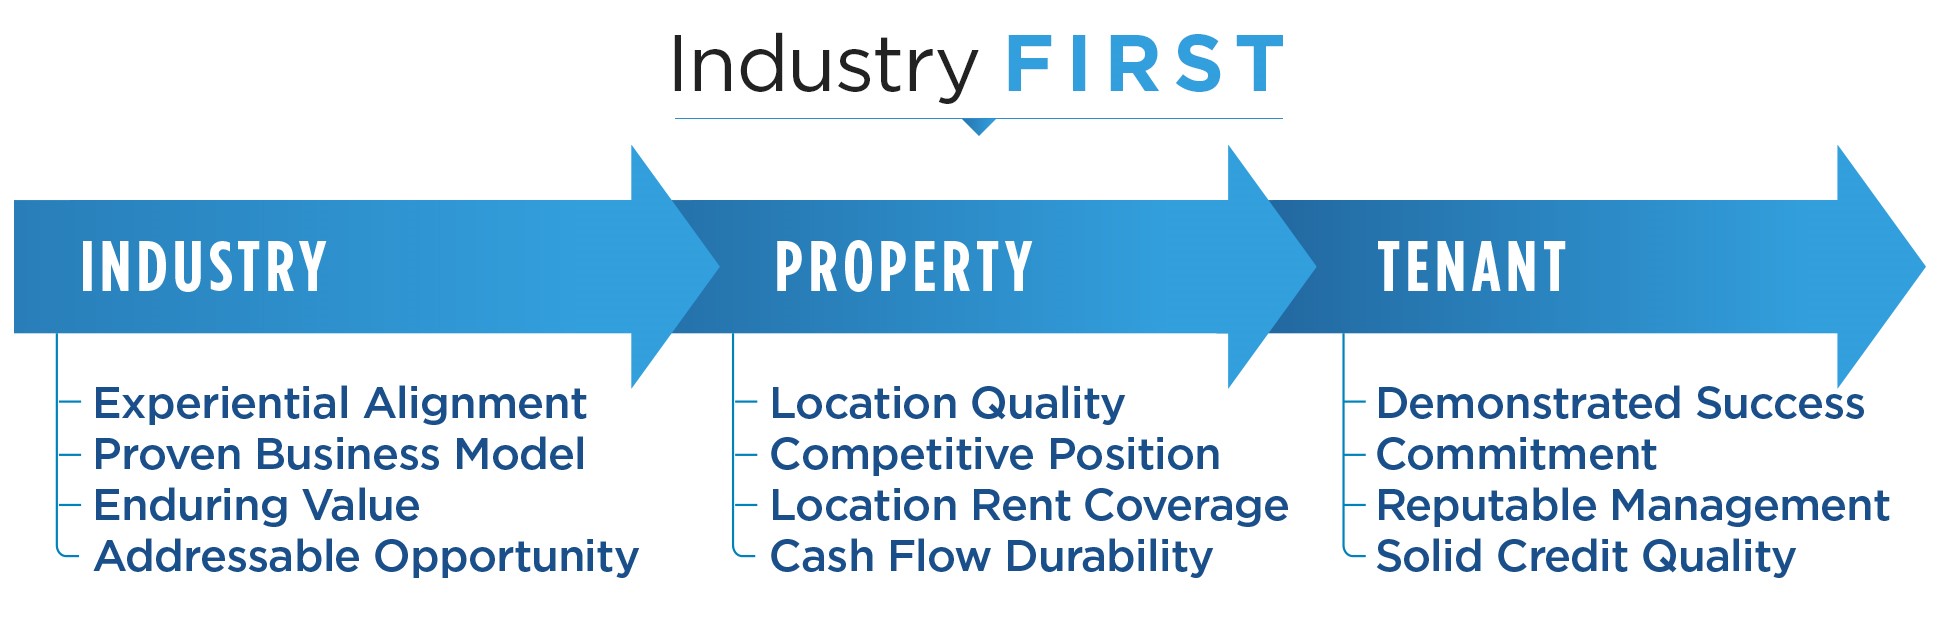 | ||||||||
| BUILDING THE PREMIER EXPERIENTIAL REAL ESTATE PORTFOLIO | ||||||||||||||||||||
 |  |  |  | |||||||||||||||||
| ||||||||
| Q1 2021 Supplemental | Page 4 | |||||||
| INVESTOR INFORMATION | ||||||||
| SENIOR MANAGEMENT | ||||||||
| Greg Silvers | Mark Peterson | |||||||
| President and Chief Executive Officer | Executive Vice President and Chief Financial Officer | |||||||
| Craig Evans | Greg Zimmerman | |||||||
| Executive Vice President, General Counsel and Secretary | Executive Vice President and Chief Investment Officer | |||||||
| Tonya Mater | ||||||||
| Senior Vice President and Chief Accounting Officer | ||||||||
| COMPANY INFORMATION | ||||||||
| CORPORATE HEADQUARTERS | TRADING SYMBOLS | |||||||
| 909 Walnut Street, Suite 200 | Common Stock: | |||||||
| Kansas City, MO 64106 | EPR | |||||||
| 888-EPR-REIT | Preferred Stock: | |||||||
| www.eprkc.com | EPR-PrC | |||||||
| EPR-PrE | ||||||||
| STOCK EXCHANGE LISTING | EPR-PrG | |||||||
| New York Stock Exchange | ||||||||
| EQUITY RESEARCH COVERAGE | ||||||||
| Bank of America Merrill Lynch | Jeffrey Spector/Joshua Dennerlein | 646-855-1363 | ||||||
| Citi Global Markets | Michael Bilerman/Katy McConnell | 212-816-4471 | ||||||
| Janney Montgomery Scott | Rob Stevenson | 646-840-3217 | ||||||
| J.P. Morgan | Anthony Paolone/Nikita Bely | 212-622-6682 | ||||||
| Kansas City Capital Associates | Jonathan Braatz | 816-932-8019 | ||||||
| Keybanc Capital Markets | Jordan Sadler/Todd Thomas | 917-368-2286 | ||||||
| Ladenburg Thalmann | John Massocca | 212-409-2056 | ||||||
| Raymond James & Associates | RJ Milligan | 727-567-2585 | ||||||
| RBC Capital Markets | Michael Carroll | 440-715-2649 | ||||||
| Stifel | Simon Yarmak | 443-224-1345 | ||||||
| SunTrust Robinson Humphrey | Ki Bin Kim | 212-303-4124 | ||||||
EPR Properties is followed by the analysts identified above. Please note that any opinions, estimates, forecasts or recommendations regarding EPR Properties’ performance made by these analysts are theirs alone and do not represent opinions, estimates, forecasts or recommendations of EPR Properties or its management. EPR Properties does not by its reference above or distribution imply its endorsement of or concurrence with such information, conclusions or recommendations.
| ||||||||
| Q1 2021 Supplemental | Page 5 | |||||||
| SELECTED FINANCIAL INFORMATION | |||||||||||
| (UNAUDITED, DOLLARS AND SHARES IN THOUSANDS) | |||||||||||
| THREE MONTHS ENDED MARCH 31, | |||||||||||
| Operating Information: | 2021 | 2020 | |||||||||
| Revenue | $ | 111,765 | $ | 151,012 | |||||||
| Net (loss) income available to common shareholders of EPR Properties | (2,654) | 31,084 | |||||||||
| EBITDAre (1) | 84,490 | 115,828 | |||||||||
| Adjusted EBITDAre (1) | 82,246 | 130,627 | |||||||||
| Interest expense, net | 39,194 | 34,753 | |||||||||
| Capitalized interest | 595 | 262 | |||||||||
| Straight-lined rental revenue | 1,288 | (9,708) | |||||||||
| Dividends declared on preferred shares | 6,034 | 6,034 | |||||||||
| Dividends declared on common shares | — | 88,996 | |||||||||
| General and administrative expense | 11,336 | 10,988 | |||||||||
| MARCH 31, | |||||||||||
| Balance Sheet Information: | 2021 | 2020 | |||||||||
| Total assets | $ | 6,208,102 | $ | 7,255,340 | |||||||
| Accumulated depreciation | 1,101,727 | 1,023,993 | |||||||||
| Cash and cash equivalents | 538,077 | 1,225,122 | |||||||||
| Total assets before accumulated depreciation less cash and cash equivalents (gross assets) | 6,771,752 | 7,054,211 | |||||||||
| Debt | 3,171,193 | 3,854,062 | |||||||||
| Deferred financing costs, net | 35,036 | 35,933 | |||||||||
| Net debt (1) | 2,668,152 | 2,664,873 | |||||||||
| Equity | 2,634,733 | 2,936,481 | |||||||||
| Common shares outstanding | 74,767 | 78,588 | |||||||||
| Total market capitalization (using EOP closing price) | 6,522,602 | 4,939,300 | |||||||||
| Net debt/gross assets | 39 | % | 38 | % | |||||||
| Net debt/Adjusted EBITDAre ratio (2) | Footnote 5 | 5.1 | |||||||||
| Adjusted net debt/Annualized adjusted EBITDAre ratio (1)(3)(4) | Footnote 5 | 4.9 | |||||||||
| (1) See pages 22 through 24 for definitions. See calculation as applicable on page 28. | |||||||||||
| (2) Adjusted EBITDAre in this calculation is for the quarter multiplied times four. See pages 22 through 24 for definitions. See calculation on page 28. | |||||||||||
| (3) Adjusted net debt is net debt less 40% times property under development. See pages 22 through 24 for definitions. | |||||||||||
| (4) Annualized adjusted EBITDAre is adjusted EBITDAre for the quarter further adjusted for in-service and disposed projects, percentage rent and participating interest and other non-recurring items which is then multiplied times four. These calculations can be found on page 28 under the reconciliation of Adjusted EBITDAre and Annualized Adjusted EBITDAre. See pages 22 through 24 for definitions. | |||||||||||
| (5) Not presented as this ratio is not meaningful given the continuing disruption caused by COVID-19 and the associated accounting for tenant rent deferrals and other lease modifications. | |||||||||||
| ||||||||
| Q1 2021 Supplemental | Page 6 | |||||||
| SELECTED BALANCE SHEET INFORMATION | ||||||||||||||||||||||||||||||||||||||
| (UNAUDITED, DOLLARS IN THOUSANDS) | ||||||||||||||||||||||||||||||||||||||
| ASSETS | 1ST QUARTER 2021 | 4TH QUARTER 2020 | 3RD QUARTER 2020 | 2ND QUARTER 2020 | 1ST QUARTER 2020 | 4TH QUARTER 2019 | ||||||||||||||||||||||||||||||||
| Real estate investments | $ | 5,902,833 | $ | 5,913,389 | $ | 6,139,858 | $ | 6,144,830 | $ | 6,208,685 | $ | 6,186,562 | ||||||||||||||||||||||||||
| Less: accumulated depreciation | (1,101,727) | (1,062,087) | (1,072,201) | (1,034,771) | (1,023,993) | (989,254) | ||||||||||||||||||||||||||||||||
| Land held for development | 23,225 | 23,225 | 25,846 | 26,244 | 28,080 | 28,080 | ||||||||||||||||||||||||||||||||
| Property under development | 94,822 | 57,630 | 44,103 | 39,039 | 30,063 | 36,756 | ||||||||||||||||||||||||||||||||
| Operating lease right-of-use assets | 179,113 | 163,766 | 185,459 | 189,058 | 207,605 | 211,187 | ||||||||||||||||||||||||||||||||
| Mortgage notes and related accrued interest receivable | 364,969 | 365,628 | 362,011 | 357,668 | 356,666 | 357,391 | ||||||||||||||||||||||||||||||||
| Investment in joint ventures | 28,313 | 28,208 | 29,571 | 28,925 | 33,897 | 34,317 | ||||||||||||||||||||||||||||||||
| Cash and cash equivalents | 538,077 | 1,025,577 | 985,372 | 1,006,981 | 1,225,122 | 528,763 | ||||||||||||||||||||||||||||||||
| Restricted cash | 5,928 | 2,433 | 2,424 | 2,615 | 4,583 | 2,677 | ||||||||||||||||||||||||||||||||
| Accounts receivable | 97,517 | 116,193 | 129,714 | 134,774 | 72,537 | 86,858 | ||||||||||||||||||||||||||||||||
| Other assets | 75,032 | 70,223 | 75,053 | 107,615 | 112,095 | 94,174 | ||||||||||||||||||||||||||||||||
| Total assets | $ | 6,208,102 | $ | 6,704,185 | $ | 6,907,210 | $ | 7,002,978 | $ | 7,255,340 | $ | 6,577,511 | ||||||||||||||||||||||||||
| LIABILITIES AND EQUITY | ||||||||||||||||||||||||||||||||||||||
| Liabilities: | ||||||||||||||||||||||||||||||||||||||
Accounts payable and accrued liabilities | $ | 95,085 | $ | 105,379 | $ | 95,429 | $ | 96,454 | $ | 112,167 | $ | 122,939 | ||||||||||||||||||||||||||
Operating lease liabilities | 217,448 | 202,223 | 225,379 | 229,030 | 232,343 | 235,650 | ||||||||||||||||||||||||||||||||
Common dividends payable | 44 | 36 | 29 | 19 | 30,063 | 29,424 | ||||||||||||||||||||||||||||||||
Preferred dividends payable | 6,034 | 6,034 | 6,034 | 6,034 | 6,034 | 6,034 | ||||||||||||||||||||||||||||||||
Unearned rents and interest | 83,565 | 65,485 | 75,415 | 81,096 | 84,190 | 74,829 | ||||||||||||||||||||||||||||||||
Line of credit | 90,000 | 590,000 | 750,000 | 750,000 | 750,000 | — | ||||||||||||||||||||||||||||||||
Deferred financing costs, net | (35,036) | (35,552) | (35,140) | (35,907) | (35,933) | (37,165) | ||||||||||||||||||||||||||||||||
Other debt | 3,116,229 | 3,139,995 | 3,139,995 | 3,139,995 | 3,139,995 | 3,139,995 | ||||||||||||||||||||||||||||||||
| Total liabilities | 3,573,369 | 4,073,600 | 4,257,141 | 4,266,721 | 4,318,859 | 3,571,706 | ||||||||||||||||||||||||||||||||
| Equity: | ||||||||||||||||||||||||||||||||||||||
Common stock and additional paid-in-capital | 3,865,243 | 3,858,451 | 3,853,581 | 3,849,803 | 3,845,911 | 3,835,674 | ||||||||||||||||||||||||||||||||
Preferred stock at par value | 148 | 148 | 148 | 148 | 148 | 148 | ||||||||||||||||||||||||||||||||
Treasury stock | (263,982) | (261,238) | (260,594) | (260,351) | (154,357) | (147,435) | ||||||||||||||||||||||||||||||||
| Accumulated other comprehensive income (loss) | 2,978 | 216 | (2,106) | (4,331) | (5,289) | 7,275 | ||||||||||||||||||||||||||||||||
Distributions in excess of net income | (969,654) | (966,992) | (940,960) | (849,012) | (749,932) | (689,857) | ||||||||||||||||||||||||||||||||
| Total equity | 2,634,733 | 2,630,585 | 2,650,069 | 2,736,257 | 2,936,481 | 3,005,805 | ||||||||||||||||||||||||||||||||
| Total liabilities and equity | $ | 6,208,102 | $ | 6,704,185 | $ | 6,907,210 | $ | 7,002,978 | $ | 7,255,340 | $ | 6,577,511 | ||||||||||||||||||||||||||
| ||||||||
| Q1 2021 Supplemental | Page 7 | |||||||
| SELECTED OPERATING DATA | |||||||||||||||||||||||||||||||||||
| (UNAUDITED, DOLLARS IN THOUSANDS) | |||||||||||||||||||||||||||||||||||
| 1ST QUARTER 2021 | 4TH QUARTER 2020 | 3RD QUARTER 2020 | 2ND QUARTER 2020 | 1ST QUARTER 2020 | 4TH QUARTER 2019 | ||||||||||||||||||||||||||||||
| Rental revenue | $ | 102,614 | $ | 84,011 | $ | 55,591 | $ | 97,531 | $ | 135,043 | $ | 154,765 | |||||||||||||||||||||||
| Other income | 678 | 968 | 182 | 416 | 7,573 | 8,386 | |||||||||||||||||||||||||||||
| Mortgage and other financing income | 8,473 | 8,433 | 8,104 | 8,413 | 8,396 | 7,195 | |||||||||||||||||||||||||||||
| Total revenue | 111,765 | 93,412 | 63,877 | 106,360 | 151,012 | 170,346 | |||||||||||||||||||||||||||||
| Property operating expense | 15,313 | 16,406 | 13,759 | 15,329 | 13,093 | 16,097 | |||||||||||||||||||||||||||||
| Other expense | 2,552 | 1,462 | 2,680 | 2,798 | 9,534 | 10,173 | |||||||||||||||||||||||||||||
| General and administrative expense | 11,336 | 11,142 | 10,034 | 10,432 | 10,988 | 10,831 | |||||||||||||||||||||||||||||
Severance expense | — | 2,868 | — | — | — | 423 | |||||||||||||||||||||||||||||
Costs associated with loan refinancing or payoff | 241 | 812 | — | 820 | — | — | |||||||||||||||||||||||||||||
| Interest expense, net | 39,194 | 42,838 | 41,744 | 38,340 | 34,753 | 34,914 | |||||||||||||||||||||||||||||
| Transaction costs | 548 | 814 | 2,776 | 771 | 1,075 | 5,784 | |||||||||||||||||||||||||||||
| Credit loss (benefit) expense | (2,762) | 20,312 | 5,707 | 3,484 | 1,192 | — | |||||||||||||||||||||||||||||
| Impairment charges | — | 22,832 | 11,561 | 51,264 | — | 2,206 | |||||||||||||||||||||||||||||
| Depreciation and amortization | 40,326 | 42,014 | 42,059 | 42,450 | 43,810 | 42,398 | |||||||||||||||||||||||||||||
| Income (loss) before equity in loss from joint ventures, other items and discontinued operations | 5,017 | (68,088) | (66,443) | (59,328) | 36,567 | 47,520 | |||||||||||||||||||||||||||||
| Equity in loss from joint ventures | (1,431) | (1,364) | (1,044) | (1,724) | (420) | (905) | |||||||||||||||||||||||||||||
| Impairment charges on joint ventures | — | — | — | (3,247) | — | — | |||||||||||||||||||||||||||||
| Gain on sale of real estate | 201 | 49,877 | — | 22 | 220 | 3,717 | |||||||||||||||||||||||||||||
| Income tax (expense) benefit | (407) | (402) | (18,417) | 1,312 | 751 | 530 | |||||||||||||||||||||||||||||
| Income (loss) from continuing operations | 3,380 | (19,977) | (85,904) | (62,965) | 37,118 | 50,862 | |||||||||||||||||||||||||||||
| Discontinued operations: | |||||||||||||||||||||||||||||||||||
Income from discontinued operations before other items | — | — | — | — | — | 4,937 | |||||||||||||||||||||||||||||
Impairment on public charter school portfolio sale | — | — | — | — | — | (21,433) | |||||||||||||||||||||||||||||
| Gain on sale of real estate from discontinued operations | — | — | — | — | — | 1,931 | |||||||||||||||||||||||||||||
| Loss from discontinued operations | — | — | — | — | — | (14,565) | |||||||||||||||||||||||||||||
| Net income (loss) | 3,380 | (19,977) | (85,904) | (62,965) | 37,118 | 36,297 | |||||||||||||||||||||||||||||
| Preferred dividend requirements | (6,034) | (6,034) | (6,034) | (6,034) | (6,034) | (6,034) | |||||||||||||||||||||||||||||
Net (loss) income available to common shareholders of EPR Properties | $ | (2,654) | $ | (26,011) | $ | (91,938) | $ | (68,999) | $ | 31,084 | $ | 30,263 | |||||||||||||||||||||||
| ||||||||
| Q1 2021 Supplemental | Page 8 | |||||||
| FUNDS FROM OPERATIONS AND FUNDS FROM OPERATIONS AS ADJUSTED | ||||||||||||||||||||||||||||||||||||||
| (UNAUDITED, DOLLARS IN THOUSANDS EXCEPT PER SHARE INFORMATION) | ||||||||||||||||||||||||||||||||||||||
| FUNDS FROM OPERATIONS ("FFO") (1): | 1ST QUARTER 2021 | 4TH QUARTER 2020 | 3RD QUARTER 2020 | 2ND QUARTER 2020 | 1ST QUARTER 2020 | 4TH QUARTER 2019 | ||||||||||||||||||||||||||||||||
| Net (loss) income available to common shareholders of EPR Properties | $ | (2,654) | $ | (26,011) | $ | (91,938) | $ | (68,999) | $ | 31,084 | $ | 30,263 | ||||||||||||||||||||||||||
| Gain on sale of real estate | (201) | (49,877) | — | (22) | (220) | (5,648) | ||||||||||||||||||||||||||||||||
| Impairment of real estate investments, net (2) | — | 22,832 | 11,561 | 36,255 | — | 23,639 | ||||||||||||||||||||||||||||||||
| Real estate depreciation and amortization | 40,109 | 41,786 | 41,791 | 42,151 | 43,525 | 44,242 | ||||||||||||||||||||||||||||||||
| Allocated share of joint venture depreciation | 354 | 361 | 369 | 378 | 383 | 551 | ||||||||||||||||||||||||||||||||
| Impairment charges on joint ventures | — | — | — | 3,247 | — | — | ||||||||||||||||||||||||||||||||
| FFO available to common shareholders of EPR Properties | $ | 37,608 | $ | (10,909) | $ | (38,217) | $ | 13,010 | $ | 74,772 | $ | 93,047 | ||||||||||||||||||||||||||
| FFO available to common shareholders of EPR Properties | $ | 37,608 | $ | (10,909) | $ | (38,217) | $ | 13,010 | $ | 74,772 | $ | 93,047 | ||||||||||||||||||||||||||
| Add: Preferred dividends for Series C preferred shares | — | — | — | — | 1,939 | 1,937 | ||||||||||||||||||||||||||||||||
| Add: Preferred dividends for Series E preferred shares | — | — | — | — | 1,939 | 1,939 | ||||||||||||||||||||||||||||||||
| Diluted FFO available to common shareholders of EPR Properties | $ | 37,608 | $ | (10,909) | $ | (38,217) | $ | 13,010 | $ | 78,650 | $ | 96,923 | ||||||||||||||||||||||||||
| FUNDS FROM OPERATIONS AS ADJUSTED ("FFOAA") (1): | ||||||||||||||||||||||||||||||||||||||
| FFO available to common shareholders of EPR Properties | $ | 37,608 | $ | (10,909) | $ | (38,217) | $ | 13,010 | $ | 74,772 | $ | 93,047 | ||||||||||||||||||||||||||
| Costs associated with loan refinancing or payoff | 241 | 812 | — | 820 | — | 43 | ||||||||||||||||||||||||||||||||
| Transaction costs | 548 | 814 | 2,776 | 771 | 1,075 | 5,784 | ||||||||||||||||||||||||||||||||
| Severance expense | — | 2,868 | — | — | — | 423 | ||||||||||||||||||||||||||||||||
| Termination fee included in gain on sale | — | — | — | — | — | 1,217 | ||||||||||||||||||||||||||||||||
| Impairment of operating lease right-of-use assets (2) | — | — | — | 15,009 | — | — | ||||||||||||||||||||||||||||||||
| Credit loss (benefit) expense | (2,762) | 20,312 | 5,707 | 3,484 | 1,192 | — | ||||||||||||||||||||||||||||||||
| Gain on insurance recovery (included in other income) | (30) | (809) | — | — | — | — | ||||||||||||||||||||||||||||||||
| Deferred income tax expense (benefit) | — | — | 18,035 | (1,676) | (1,113) | (847) | ||||||||||||||||||||||||||||||||
| FFO as adjusted available to common shareholders of EPR Properties | $ | 35,605 | $ | 13,088 | $ | (11,699) | $ | 31,418 | $ | 75,926 | $ | 99,667 | ||||||||||||||||||||||||||
| FFO as adjusted available to common shareholders of EPR Properties | $ | 35,605 | $ | 13,088 | $ | (11,699) | $ | 31,418 | $ | 75,926 | $ | 99,667 | ||||||||||||||||||||||||||
| Add: Preferred dividends for Series C preferred shares | — | — | — | — | 1,939 | 1,937 | ||||||||||||||||||||||||||||||||
| Add: Preferred dividends for Series E preferred shares | — | — | — | — | 1,939 | 1,939 | ||||||||||||||||||||||||||||||||
| Diluted FFO as adjusted available to common shareholders of EPR Properties | $ | 35,605 | $ | 13,088 | $ | (11,699) | $ | 31,418 | $ | 79,804 | $ | 103,543 | ||||||||||||||||||||||||||
| FFO per common share: | ||||||||||||||||||||||||||||||||||||||
| Basic | $ | 0.50 | $ | (0.15) | $ | (0.51) | $ | 0.17 | $ | 0.95 | $ | 1.19 | ||||||||||||||||||||||||||
| Diluted | 0.50 | (0.15) | (0.51) | 0.17 | 0.95 | 1.18 | ||||||||||||||||||||||||||||||||
| FFO as adjusted per common share: | ||||||||||||||||||||||||||||||||||||||
| Basic | $ | 0.48 | $ | 0.18 | $ | (0.16) | $ | 0.41 | $ | 0.97 | $ | 1.27 | ||||||||||||||||||||||||||
| Diluted | 0.48 | 0.18 | (0.16) | 0.41 | 0.97 | 1.26 | ||||||||||||||||||||||||||||||||
| Shares used for computation (in thousands): | ||||||||||||||||||||||||||||||||||||||
| Basic | 74,627 | 74,615 | 74,613 | 76,310 | 78,467 | 78,456 | ||||||||||||||||||||||||||||||||
| Diluted | 74,669 | 74,615 | 74,613 | 76,310 | 78,476 | 78,485 | ||||||||||||||||||||||||||||||||
| Effect of dilutive Series C preferred shares | — | — | — | — | 2,232 | 2,184 | ||||||||||||||||||||||||||||||||
| Effect of dilutive Series E preferred shares | — | — | — | — | 1,664 | 1,640 | ||||||||||||||||||||||||||||||||
| Adjusted weighted-average shares outstanding-diluted Series C and Series E | 74,669 | 74,615 | 74,613 | 76,310 | 82,372 | 82,309 | ||||||||||||||||||||||||||||||||
| (1) See pages 22 through 24 for definitions. | ||||||||||||||||||||||||||||||||||||||
| (2) Impairment charges recognized during the three months ended June 30, 2020 totaled $51.3 million, which was comprised of $36.3 million of impairments of real estate investments and $15.0 million of impairments of operating lease right-of-use assets. | ||||||||||||||||||||||||||||||||||||||
| Amounts above include the impact of discontinued operations, which are separately classified in the consolidated statements of (loss) income. | ||||||||||||||||||||||||||||||||||||||
| ||||||||
| Q1 2021 Supplemental | Page 9 | |||||||
| ADJUSTED FUNDS FROM OPERATIONS | ||||||||||||||||||||||||||||||||||||||
| (UNAUDITED, DOLLARS IN THOUSANDS EXCEPT PER SHARE INFORMATION) | ||||||||||||||||||||||||||||||||||||||
| ADJUSTED FUNDS FROM OPERATIONS ("AFFO") (1): | 1ST QUARTER 2021 | 4TH QUARTER 2020 | 3RD QUARTER 2020 | 2ND QUARTER 2020 | 1ST QUARTER 2020 | 4TH QUARTER 2019 | ||||||||||||||||||||||||||||||||
FFO available to common shareholders of EPR Properties | $ | 37,608 | $ | (10,909) | $ | (38,217) | $ | 13,010 | $ | 74,772 | $ | 93,047 | ||||||||||||||||||||||||||
| Adjustments: | ||||||||||||||||||||||||||||||||||||||
Costs associated with loan refinancing or payoff | 241 | 812 | — | 820 | — | 43 | ||||||||||||||||||||||||||||||||
| Transaction costs | 548 | 814 | 2,776 | 771 | 1,075 | 5,784 | ||||||||||||||||||||||||||||||||
| Impairment of operating lease right-of-use assets (2) | — | — | — | 15,009 | — | — | ||||||||||||||||||||||||||||||||
| Credit loss (benefit) expense | (2,762) | 20,312 | 5,707 | 3,484 | 1,192 | — | ||||||||||||||||||||||||||||||||
| Severance expense | — | 2,868 | — | — | — | 423 | ||||||||||||||||||||||||||||||||
Termination fees included in gain on sale | — | — | — | — | — | 1,217 | ||||||||||||||||||||||||||||||||
| Gain on insurance recovery (included in other income) | (30) | (809) | — | — | — | — | ||||||||||||||||||||||||||||||||
| Deferred income tax expense (benefit) | — | — | 18,035 | (1,676) | (1,113) | (847) | ||||||||||||||||||||||||||||||||
| Non-real estate depreciation and amortization | 217 | 228 | 268 | 299 | 285 | 288 | ||||||||||||||||||||||||||||||||
| Deferred financing fees amortization | 1,547 | 1,823 | 1,498 | 1,651 | 1,634 | 1,621 | ||||||||||||||||||||||||||||||||
Share-based compensation expense to management and trustees | 3,784 | 3,437 | 3,410 | 3,463 | 3,509 | 3,349 | ||||||||||||||||||||||||||||||||
| Amortization of above/below market leases, net and tenant allowances | (96) | (96) | (124) | (108) | (152) | (119) | ||||||||||||||||||||||||||||||||
| Maintenance capital expenditures (3) | (756) | (247) | (8,911) | (1,291) | (928) | (2,276) | ||||||||||||||||||||||||||||||||
| Straight-lined rental revenue | (1,288) | (898) | 17,969 | (2,229) | 9,708 | (3,516) | ||||||||||||||||||||||||||||||||
| Straight-lined ground sublease expense | 84 | 150 | 216 | 207 | 176 | 237 | ||||||||||||||||||||||||||||||||
Non-cash portion of mortgage and other financing income | (171) | (133) | 71 | (97) | (91) | (91) | ||||||||||||||||||||||||||||||||
| AFFO available to common shareholders of EPR Properties | $ | 38,926 | $ | 17,352 | $ | 2,698 | $ | 33,313 | $ | 90,067 | $ | 99,160 | ||||||||||||||||||||||||||
| AFFO available to common shareholders of EPR Properties | $ | 38,926 | $ | 17,352 | $ | 2,698 | $ | 33,313 | $ | 90,067 | $ | 99,160 | ||||||||||||||||||||||||||
| Add: Preferred dividends for Series C preferred shares | — | — | — | — | 1,939 | 1,937 | ||||||||||||||||||||||||||||||||
| Add: Preferred dividends for Series E preferred shares | — | — | — | — | 1,939 | 1,939 | ||||||||||||||||||||||||||||||||
| Diluted AFFO available to common shareholders of EPR Properties | $ | 38,926 | $ | 17,352 | $ | 2,698 | $ | 33,313 | $ | 93,945 | $ | 103,036 | ||||||||||||||||||||||||||
Weighted average diluted shares outstanding (in thousands) | 74,669 | 74,615 | 74,613 | 76,310 | 78,476 | 78,485 | ||||||||||||||||||||||||||||||||
| Effect of dilutive Series C preferred shares | — | — | — | — | 2,232 | 2,184 | ||||||||||||||||||||||||||||||||
| Effect of dilutive Series E preferred shares | — | — | — | — | 1,664 | 1,640 | ||||||||||||||||||||||||||||||||
| Adjusted weighted-average shares outstanding-diluted | 74,669 | 74,615 | 74,613 | 76,310 | 82,372 | 82,309 | ||||||||||||||||||||||||||||||||
| AFFO per diluted common share | $ | 0.52 | $ | 0.23 | $ | 0.04 | $ | 0.44 | $ | 1.14 | $ | 1.25 | ||||||||||||||||||||||||||
| Dividends declared per common share | $ | — | $ | — | $ | — | $ | 0.3825 | $ | 1.1325 | $ | 1.1250 | ||||||||||||||||||||||||||
| AFFO payout ratio (4) | — | % | — | % | — | % | 87 | % | 99 | % | 90 | % | ||||||||||||||||||||||||||
| (1) See pages 22 through 24 for definitions. | ||||||||||||||||||||||||||||||||||||||
| (2) Impairment charges recognized during the three months ended June 30, 2020 totaled $51.3 million, which was comprised of $36.3 million of impairments of real estate investments and $15.0 million of impairments of operating lease right-of-use assets. | ||||||||||||||||||||||||||||||||||||||
| (3) Includes maintenance capital expenditures and certain second generation tenant improvements and leasing commissions. | ||||||||||||||||||||||||||||||||||||||
| (4) AFFO payout ratio is calculated by dividing dividends declared per common share by AFFO per diluted common share. The monthly cash dividend to common shareholders was suspended following the common share dividend paid on May 15, 2020 to shareholders of record as of April 30, 2020. | ||||||||||||||||||||||||||||||||||||||
| Amounts above include the impact of discontinued operations, which are separately classified in the consolidated statements of (loss) income. | ||||||||||||||||||||||||||||||||||||||
| ||||||||
| Q1 2021 Supplemental | Page 10 | |||||||
| CAPITAL STRUCTURE AS OF MARCH 31, 2021 | |||||||||||||||||||||||||||||||||||
| (UNAUDITED, DOLLARS IN THOUSANDS) | |||||||||||||||||||||||||||||||||||
| CONSOLIDATED DEBT | |||||||||||||||||||||||||||||||||||
| PRINCIPAL PAYMENTS DUE ON DEBT: | |||||||||||||||||||||||||||||||||||
| BONDS/TERM LOAN/OTHER (1) (2) | UNSECURED CREDIT FACILITY (3) | UNSECURED SENIOR NOTES | TOTAL | WEIGHTED AVG INTEREST RATE | |||||||||||||||||||||||||||||||
| YEAR | |||||||||||||||||||||||||||||||||||
| 2021 | $ | — | $ | — | $ | — | $ | — | —% | ||||||||||||||||||||||||||
| 2022 | — | 90,000 | — | 90,000 | 2.13% | ||||||||||||||||||||||||||||||
| 2023 | 400,000 | — | 275,000 | 675,000 | 4.76% | ||||||||||||||||||||||||||||||
| 2024 | — | — | 136,637 | 136,637 | 5.60% | ||||||||||||||||||||||||||||||
| 2025 | — | — | 300,000 | 300,000 | 4.50% | ||||||||||||||||||||||||||||||
| 2026 | — | — | 629,597 | 629,597 | 5.05% | ||||||||||||||||||||||||||||||
| 2027 | — | — | 450,000 | 450,000 | 4.50% | ||||||||||||||||||||||||||||||
| 2028 | — | — | 400,000 | 400,000 | 4.95% | ||||||||||||||||||||||||||||||
| 2029 | — | — | 500,000 | 500,000 | 3.75% | ||||||||||||||||||||||||||||||
| 2030 | — | — | — | — | —% | ||||||||||||||||||||||||||||||
| 2031 | — | — | — | — | —% | ||||||||||||||||||||||||||||||
| Thereafter | 24,995 | — | — | 24,995 | 1.39% | ||||||||||||||||||||||||||||||
| Less: deferred financing costs, net | — | — | — | (35,036) | —% | ||||||||||||||||||||||||||||||
| $ | 424,995 | $ | 90,000 | $ | 2,691,234 | $ | 3,171,193 | 4.56% | |||||||||||||||||||||||||||
| BALANCE | WEIGHTED AVG INTEREST RATE | WEIGHTED AVG MATURITY | |||||||||||||||||||||||||||||||||
| Fixed rate unsecured debt (1) | $ | 3,091,234 | 4.66 | % | 5.29 | ||||||||||||||||||||||||||||||
| Fixed rate secured debt (2) | 24,995 | 1.39 | % | 26.33 | |||||||||||||||||||||||||||||||
| Variable rate unsecured debt | 90,000 | 2.13 | % | 0.91 | |||||||||||||||||||||||||||||||
| Less: deferred financing costs, net | (35,036) | — | % | — | |||||||||||||||||||||||||||||||
| Total | $ | 3,171,193 | 4.56 | % | 5.34 | ||||||||||||||||||||||||||||||
| (1) Includes $400 million of term loan that has been fixed through interest rate swaps through February 7, 2022. | |||||||||||||||||||||||||||||||||||
| (2) Includes $25 million of secured bonds that have been fixed through interest rate swaps through September 30, 2024. | |||||||||||||||||||||||||||||||||||
| (3) Unsecured Revolving Credit Facility Summary: | |||||||||||||||||||||||||||||||||||
| BALANCE | RATE | ||||||||||||||||||||||||||||||||||
| COMMITMENT | AT 3/31/2021 | MATURITY | AT 3/31/2021 | ||||||||||||||||||||||||||||||||
| $1,000,000 | $90,000 | February 27, 2022 | 2.125% | ||||||||||||||||||||||||||||||||
Note: This facility has a seven-month extension available at the Company's option (solely with respect to the unsecured revolving credit portion of the facility) and includes an accordion feature pursuant to which the maximum borrowing amount under the combined unsecured revolving credit and term loan facility can be increased from $1.4 billion to $2.4 billion, in each case, subject to certain terms and conditions. | |||||||||||||||||||||||||||||||||||
| ||||||||
| Q1 2021 Supplemental | Page 11 | |||||||
| CAPITAL STRUCTURE AS OF MARCH 31, 2021 AND DECEMBER 31, 2020 | |||||||||||
| (UNAUDITED, DOLLARS IN THOUSANDS) | |||||||||||
| CONSOLIDATED DEBT (continued) | |||||||||||
| SUMMARY OF DEBT: | March 31, 2021 | December 31, 2020 | |||||||||
| Unsecured revolving variable rate credit facility, LIBOR + 1.625% at March 31, 2021, due February 27, 2022 (1)(2)(3) | $ | 90,000 | $ | 590,000 | |||||||
| Unsecured term loan payable, LIBOR + 2.00% at March 31, 2021 with $350,000 fixed at 4.40% and $50,000 fixed at 4.60%, due February 27, 2023 (1)(2) | 400,000 | 400,000 | |||||||||
| Senior unsecured notes payable, 5.25%, due July 15, 2023 | 275,000 | 275,000 | |||||||||
| Senior unsecured notes payable, 5.60% at December 31, 2020, due August 22, 2024 (1) | 136,637 | 148,000 | |||||||||
| Senior unsecured notes payable, 4.50%, due April 1, 2025 | 300,000 | 300,000 | |||||||||
| Senior unsecured notes payable, 5.81% at December 31, 2020, due August 22, 2026 (1) | 179,597 | 192,000 | |||||||||
| Senior unsecured notes payable, 4.75%, due December 15, 2026 | 450,000 | 450,000 | |||||||||
| Senior unsecured notes payable, 4.50%, due June 1, 2027 | 450,000 | 450,000 | |||||||||
| Senior unsecured notes payable, 4.95%, due April 15, 2028 | 400,000 | 400,000 | |||||||||
| Senior unsecured notes payable, 3.75%, due August 15, 2029 | 500,000 | 500,000 | |||||||||
| Bonds payable, variable rate, fixed at 1.39% through September 30, 2024, due August 1, 2047 | 24,995 | 24,995 | |||||||||
| Less: deferred financing costs, net | (35,036) | (35,552) | |||||||||
| Total debt | $ | 3,171,193 | $ | 3,694,443 | |||||||
(1) During the year ended December 31, 2020, the Company amended its Consolidated Credit Agreement and its Note Purchase Agreement. The amendments modified certain provisions and waived certain covenants of the revolving credit and term loan facilities and the private placement notes through December 31, 2021 (subject to certain conditions) in light of the continuing financial and operational impacts of the COVID-19 pandemic on the Company and its tenants and borrowers. The Company can elect to terminate the Covenant Relief Period early, subject to certain conditions. The Company pays higher interest costs during the Covenant Relief Period but interest rates return to pre-waiver levels after the Covenant Relief Period, with the revolving credit and term loan facilities continuing to be subject to the Company's unsecured ratings. The amendments to the Consolidated Credit Agreement and Note Purchase Agreement also impose additional restrictions on the Company during the Covenant Relief Period, including limitations on certain investments, incurrences of indebtedness, capital expenditures, payment of dividends or other distributions, and share repurchases, in each case subject to certain exceptions. Subsequent to March 31, 2021, the Company paid off the remaining $90.0 million of borrowings under its revolving credit facility.
(2) The unsecured revolving credit facility and unsecured term loan have a LIBOR floor of 0.50% during the Covenant Relief Period and a LIBOR floor of zero thereafter.
(3) The unsecured revolving credit facility is subject to a facility fee of 0.375% during the Covenant Relief Period and returns to pre-waiver levels after the Covenant Relief Period subject to changes in the Company's unsecured debt ratings.
| ||||||||
| Q1 2021 Supplemental | Page 12 | |||||||
| CAPITAL STRUCTURE | |||||||||||||||||||||||
| SENIOR NOTES | |||||||||||||||||||||||
| SENIOR DEBT RATINGS AS OF MARCH 31, 2021 | |||||||||||||||||||||||
| Moody's | Baa3 (negative) | ||||||||||||||||||||||
| Fitch | BB+ (negative) | ||||||||||||||||||||||
| Standard and Poor's | BB+ (negative) | ||||||||||||||||||||||
| SUMMARY OF COVENANTS | |||||||||||||||||||||||
| The Company has outstanding public senior unsecured notes with fixed interest rates of 3.75%, 4.50%, 4.75%, 4.95% and 5.25%. Interest on these notes is paid semiannually. These public senior unsecured notes contain various covenants, including: (i) a limitation on incurrence of any debt that would cause the Company's debt to adjusted total assets ratio to exceed 60%; (ii) a limitation on incurrence of any secured debt which would cause the Company’s secured debt to adjusted total assets ratio to exceed 40%; (iii) a limitation on incurrence of any debt which would cause the Company’s debt service coverage ratio to be less than 1.5 times; and (iv) the maintenance at all times of total unencumbered assets not less than 150% of the Company’s outstanding unsecured debt. | |||||||||||||||||||||||
| The following is a summary of the key financial covenants for the Company's 3.75%, 4.50%, 4.75%, 4.95% and 5.25% public senior unsecured notes, as defined and calculated per the terms of the notes. These calculations, which are not based on U.S. generally accepted accounting principles, or GAAP, measurements, are presented to investors to show the Company's ability to incur additional debt under the terms of the senior unsecured notes only and are not measures of the Company's liquidity or performance. The actual amounts as of March 31, 2021 and December 31, 2020 are: | |||||||||||||||||||||||
| Actual | Actual | ||||||||||||||||||||||
| NOTE COVENANTS | Required | 1st Quarter 2021 (1) | 4th Quarter 2020 (1) | ||||||||||||||||||||
| Limitation on incurrence of total debt (Total Debt/Total Assets) | ≤ 60% | 44% | 48% | ||||||||||||||||||||
| Limitation on incurrence of secured debt (Secured Debt/Total Assets) | ≤ 40% | —% | —% | ||||||||||||||||||||
| Limitation on incurrence of debt: Debt service coverage (Consolidated Income Available for Debt Service/Annual Debt Service) - trailing twelve months | ≥ 1.5 x | 1.7x | 2.1x | ||||||||||||||||||||
| Maintenance of total unencumbered assets (Unencumbered Assets/Unsecured Debt) | ≥ 150% of unsecured debt | 215% | 197% | ||||||||||||||||||||
| (1) See page 14 for details of calculations. | |||||||||||||||||||||||
| ||||||||
| Q1 2021 Supplemental | Page 13 | |||||||
| CAPITAL STRUCTURE | |||||||||||||||||||||||||||||
| SENIOR NOTES | |||||||||||||||||||||||||||||
| (UNAUDITED, DOLLARS IN THOUSANDS) | |||||||||||||||||||||||||||||
| COVENANT CALCULATIONS | |||||||||||||||||||||||||||||
| TOTAL ASSETS: | March 31, 2021 | TOTAL DEBT: | March 31, 2021 | ||||||||||||||||||||||||||
| Total Assets per balance sheet | $ | 6,208,102 | Secured debt obligations | $ | 24,995 | ||||||||||||||||||||||||
| Add: accumulated depreciation | 1,101,727 | Unsecured debt obligations: | |||||||||||||||||||||||||||
| Less: intangible assets, net | (40,583) | Unsecured debt | 3,181,234 | ||||||||||||||||||||||||||
| Total Assets | $ | 7,269,246 | Outstanding letters of credit | — | |||||||||||||||||||||||||
| Guarantees | — | ||||||||||||||||||||||||||||
| TOTAL UNENCUMBERED ASSETS: | September 30, 2020 | Derivatives at fair market value, net, if liability | 13,532 | ||||||||||||||||||||||||||
| Unencumbered real estate assets, gross | $ | 6,203,432 | Total unsecured debt obligations: | 3,194,766 | |||||||||||||||||||||||||
| Cash and cash equivalents | 538,077 | Total Debt | $ | 3,219,761 | |||||||||||||||||||||||||
| Land held for development | 23,225 | ||||||||||||||||||||||||||||
| Property under development | 94,822 | ||||||||||||||||||||||||||||
| Total Unencumbered Assets | $ | 6,859,556 | |||||||||||||||||||||||||||
| CONSOLIDATED INCOME AVAILABLE FOR DEBT SERVICE: | 1ST QUARTER 2021 | 4TH QUARTER 2020 | 3RD QUARTER 2020 | 2ND QUARTER 2020 | TRAILING TWELVE MONTHS | ||||||||||||||||||||||||
| Adjusted EBITDAre | $ | 82,246 | $ | 68,633 | $ | 70,930 | $ | 77,191 | $ | 299,000 | |||||||||||||||||||
| Accounts receivable write-offs from prior periods (1) | — | — | (1,800) | (15,751) | (17,551) | ||||||||||||||||||||||||
| Less: straight-line revenue, net, included in adjusted EBITDAre | (1,289) | (1,768) | (1,958) | (2,229) | (7,244) | ||||||||||||||||||||||||
| CONSOLIDATED INCOME AVAILABLE FOR DEBT SERVICE | $ | 80,957 | $ | 66,865 | $ | 67,172 | $ | 59,211 | $ | 274,205 | |||||||||||||||||||
| ANNUAL DEBT SERVICE: | |||||||||||||||||||||||||||||
| Interest expense, gross | $ | 39,854 | $ | 43,341 | $ | 42,312 | $ | 39,281 | $ | 164,788 | |||||||||||||||||||
| Less: deferred financing fees amortization | (1,547) | (1,823) | (1,498) | (1,651) | (6,519) | ||||||||||||||||||||||||
| ANNUAL DEBT SERVICE | $ | 38,307 | $ | 41,518 | $ | 40,814 | $ | 37,630 | $ | 158,269 | |||||||||||||||||||
| DEBT SERVICE COVERAGE | 2.1 | 1.6 | 1.6 | 1.6 | 1.7 | ||||||||||||||||||||||||
| (1) For purposes of the bond calculation of Consolidated Income Available for Debt Service, the accounts receivable write-offs that were recognized in the third and fourth quarters were reclassified to the quarter such amounts were recognized originally as revenue. | |||||||||||||||||||||||||||||
| ||||||||
| Q1 2021 Supplemental | Page 14 | |||||||
| CAPITAL STRUCTURE AS OF MARCH 31, 2021 | ||||||||||||||||||||||||||||||||||||||||||||
| (UNAUDITED, DOLLARS IN THOUSANDS EXCEPT SHARE INFORMATION) | ||||||||||||||||||||||||||||||||||||||||||||
| EQUITY | ||||||||||||||||||||||||||||||||||||||||||||
| SECURITY | SHARES OUTSTANDING | PRICE PER SHARE AT MARCH 31, 2021 | LIQUIDATION PREFERENCE | DIVIDEND RATE | CONVERTIBLE | CONVERSION RATIO AT MARCH 31, 2021 | CONVERSION PRICE AT MARCH 31, 2021 | |||||||||||||||||||||||||||||||||||||
| Common shares | 74,767,425 | $46.59 | N/A | (1) | N/A | N/A | N/A | |||||||||||||||||||||||||||||||||||||
| Series C | 5,394,050 | $25.52 | $134,851 | 5.750% | Y | 0.4137 | $60.43 | |||||||||||||||||||||||||||||||||||||
| Series E | 3,447,381 | $36.90 | $86,185 | 9.000% | Y | 0.4826 | $51.80 | |||||||||||||||||||||||||||||||||||||
| Series G | 6,000,000 | $25.20 | $150,000 | 5.750% | N | N/A | N/A | |||||||||||||||||||||||||||||||||||||
| (1) The monthly cash dividend to common shareholders was suspended following the common share dividend paid on May 15, 2020 to shareholders of record as of April 30, 2020. | ||||||||||||||||||||||||||||||||||||||||||||
| ||||||||
| Q1 2021 Supplemental | Page 15 | |||||||
| SUMMARY OF RATIOS | |||||||||||||||||||||||||||||||||||
| (UNAUDITED) | |||||||||||||||||||||||||||||||||||
| 1ST QUARTER 2021 | 4TH QUARTER 2020 | 3RD QUARTER 2020 | 2ND QUARTER 2020 | 1ST QUARTER 2020 | 4TH QUARTER 2019 | ||||||||||||||||||||||||||||||
| Net debt to gross assets | 39% | 40% | 42% | 41% | 38% | 37% | |||||||||||||||||||||||||||||
| Net debt/Adjusted EBITDAre ratio (1)(2) | Footnote 9 | Footnote 9 | Footnote 9 | Footnote 9 | 5.1 | 4.6 | |||||||||||||||||||||||||||||
| Adjusted net debt/Annualized adjusted EBITDAre ratio (3)(4) | Footnote 9 | Footnote 9 | Footnote 9 | Footnote 9 | 4.9 | 4.8 | |||||||||||||||||||||||||||||
| Interest coverage ratio (5) | Footnote 9 | Footnote 9 | Footnote 9 | Footnote 9 | 3.6 | 3.8 | |||||||||||||||||||||||||||||
| Fixed charge coverage ratio (5) | Footnote 9 | Footnote 9 | Footnote 9 | Footnote 9 | 3.1 | 3.3 | |||||||||||||||||||||||||||||
| Debt service coverage ratio (5) | Footnote 9 | Footnote 9 | Footnote 9 | Footnote 9 | 3.6 | 3.8 | |||||||||||||||||||||||||||||
| FFO payout ratio (6) | —% | —% | —% | 225% | 119% | 95% | |||||||||||||||||||||||||||||
| FFO as adjusted payout ratio (7) | —% | —% | —% | 93% | 117% | 89% | |||||||||||||||||||||||||||||
| AFFO payout ratio (8) | —% | —% | —% | 87% | 99% | 90% | |||||||||||||||||||||||||||||
| (1) See pages 22 through 24 for definitions. | |||||||||||||||||||||||||||||||||||
| (2) Adjusted EBITDAre is for the quarter multiplied times four. See calculation on page 28. | |||||||||||||||||||||||||||||||||||
| (3) Adjusted net debt is net debt less 40% times property under development. See pages 22 through 24 for definitions. | |||||||||||||||||||||||||||||||||||
| (4) Annualized adjusted EBITDAre is Adjusted EBITDAre for the quarter further adjusted for in-service and disposed projects, percentage rent and participating interest and other non-recurring items which is then multiplied times four. These calculations can be found on page 28 under the reconciliation of Adjusted EBITDAre and Annualized Adjusted EBITDAre. See pages 22 through 24 for definitions. | |||||||||||||||||||||||||||||||||||
| (5) See page 26 for detailed calculation. | |||||||||||||||||||||||||||||||||||
| (6) FFO payout ratio is calculated by dividing dividends declared per common share by FFO per diluted common share. The monthly cash dividend to common shareholders was suspended following the common share dividend paid on May 15, 2020 to shareholders of record as of April 30, 2020. | |||||||||||||||||||||||||||||||||||
| (7) FFO as adjusted payout ratio is calculated by dividing dividends declared per common share by FFO as adjusted per diluted common share. The monthly cash dividend to common shareholders was suspended following the common share dividend paid on May 15, 2020 to shareholders of record as of April 30, 2020. | |||||||||||||||||||||||||||||||||||
| (8) AFFO payout ratio is calculated by dividing dividends declared per common share by AFFO per diluted common share. The monthly cash dividend to common shareholders was suspended following the common share dividend paid on May 15, 2020 to shareholders of record as of April 30, 2020. | |||||||||||||||||||||||||||||||||||
| (9) Not presented as ratio is not meaningful given the continuing disruption caused by COVID-19 and the associated accounting for tenant rent deferrals and other lease modifications. | |||||||||||||||||||||||||||||||||||
| ||||||||
| Q1 2021 Supplemental | Page 16 | |||||||
| SUMMARY OF MORTGAGE NOTES RECEIVABLE | |||||||||||||||||||||||
| (UNAUDITED, DOLLARS IN THOUSANDS) | |||||||||||||||||||||||
| CARRYING AMOUNT AS OF (1) | |||||||||||||||||||||||
| DESCRIPTION | INTEREST RATE | PAYOFF DATE/MATURITY DATE | OUTSTANDING PRINCIPAL AMOUNT OF MORTGAGE | MARCH 31, 2021 | DECEMBER 31, 2020 | ||||||||||||||||||
| Private school property Mableton, Georgia | 9.02 | % | Prepaid in full | $ | — | $ | — | $ | 5,278 | ||||||||||||||
Attraction property Powells Point, North Carolina | 7.75 | % | 6/30/2025 | 28,178 | 27,372 | 27,045 | |||||||||||||||||
| Fitness & wellness property Omaha, Nebraska | 7.85 | % | 1/3/2027 | 10,905 | 11,252 | 11,225 | |||||||||||||||||
Fitness & wellness property Merriam, Kansas | 7.55 | % | 7/31/2029 | 9,090 | 9,370 | 9,355 | |||||||||||||||||
Ski property Girdwood, Alaska | 8.24 | % | 12/31/2029 | 42,645 | 42,515 | 40,680 | |||||||||||||||||
| Fitness & wellness property Omaha, Nebraska | 7.85 | % | 6/30/2030 | 9,839 | 10,082 | 8,630 | |||||||||||||||||
Experiential lodging property Nashville, Tennessee | 7.01 | % | 9/30/2031 | 71,223 | 69,475 | 67,235 | |||||||||||||||||
Eat & play property Austin, Texas | 11.31 | % | 6/1/2033 | 11,150 | 11,357 | 11,929 | |||||||||||||||||
| Ski property West Dover and Wilmington, Vermont | 11.78 | % | 12/1/2034 | 51,050 | 51,037 | 51,031 | |||||||||||||||||
Four ski properties Ohio and Pennsylvania | 10.91 | % | 12/1/2034 | 37,562 | 37,459 | 37,413 | |||||||||||||||||
Ski property Chesterland, Ohio | 11.38 | % | 12/1/2034 | 4,550 | 4,433 | 4,396 | |||||||||||||||||
Ski property Hunter, New York | 8.72 | % | 1/5/2036 | 21,000 | 21,000 | 21,000 | |||||||||||||||||
| Eat & play property Midvale, Utah | 10.25 | % | 5/31/2036 | 17,505 | 17,796 | 18,289 | |||||||||||||||||
| Eat & play property West Chester, Ohio | 9.75 | % | 8/1/2036 | 18,068 | 18,348 | 18,830 | |||||||||||||||||
| Fitness & wellness property Fort Collins, Colorado | 7.85 | % | 1/31/2038 | 10,292 | 10,490 | 10,408 | |||||||||||||||||
| Early childhood education center Lake Mary, Florida | 7.87 | % | 5/9/2039 | 4,200 | 4,357 | 4,348 | |||||||||||||||||
Eat & play property Eugene, Oregon | 8.13 | % | 6/17/2039 | 14,700 | 14,799 | 14,799 | |||||||||||||||||
| Early childhood education center Lithia, Florida | 8.42 | % | 10/31/2039 | 3,959 | 3,827 | 3,737 | |||||||||||||||||
Total | $ | 365,916 | $ | 364,969 | $ | 365,628 | |||||||||||||||||
(1) Amounts include accrued interest.
| ||||||||
| Q1 2021 Supplemental | Page 17 | |||||||
| INVESTMENT SPENDING AND DISPOSITION SUMMARIES | |||||||||||||||||||||||
| (UNAUDITED, DOLLARS IN THOUSANDS) | |||||||||||||||||||||||
| INVESTMENT SPENDING THREE MONTHS ENDED MARCH 31, 2021 | |||||||||||||||||||||||
| INVESTMENT TYPE | TOTAL INVESTMENT SPENDING | NEW DEVELOPMENT | RE-DEVELOPMENT | ASSET ACQUISITION | MORTGAGE NOTES OR NOTES RECEIVABLE | INVESTMENT IN JOINT VENTURES | |||||||||||||||||
| Theatres | $ | 2,440 | $ | 2,382 | $ | 58 | $ | — | $ | — | $ | — | |||||||||||
| Eat & Play | 30,847 | 4,061 | 111 | 26,675 | — | — | |||||||||||||||||
| Attractions | 14 | — | 14 | — | — | — | |||||||||||||||||
| Ski | 1,013 | — | — | — | 1,013 | — | |||||||||||||||||
| Experiential Lodging | 11,993 | 6,680 | 3,688 | — | — | 1,625 | |||||||||||||||||
| Cultural | 4,383 | — | 4 | — | 4,379 | — | |||||||||||||||||
| Fitness & Wellness | 1,423 | — | — | — | 1,423 | — | |||||||||||||||||
| Total Experiential | 52,113 | 13,123 | 3,875 | 26,675 | 6,815 | 1,625 | |||||||||||||||||
| Total Education | — | — | — | — | — | — | |||||||||||||||||
| Total Investment Spending | $ | 52,113 | $ | 13,123 | $ | 3,875 | $ | 26,675 | $ | 6,815 | $ | 1,625 | |||||||||||
| 2021 DISPOSITIONS | |||||||||||||||||||||||
| THREE MONTHS ENDED MARCH 31, 2021 | |||||||||||||||||||||||
| INVESTMENT TYPE | TOTAL DISPOSITIONS | NET PROCEEDS FROM SALE OF REAL ESTATE | NET PROCEEDS FROM PAYDOWN OF MORTGAGE NOTES | ||||||||||||||||||||
| Theatres | $ | 13,707 | $ | 13,707 | $ | — | |||||||||||||||||
| Total Experiential | 13,707 | 13,707 | — | ||||||||||||||||||||
| Private Schools | 5,078 | — | 5,078 | ||||||||||||||||||||
| Total Education | 5,078 | — | 5,078 | ||||||||||||||||||||
| Total Dispositions | $ | 18,785 | $ | 13,707 | $ | 5,078 | |||||||||||||||||
| ||||||||
| Q1 2021 Supplemental | Page 18 | |||||||
| PROPERTY UNDER DEVELOPMENT - INVESTMENT SPENDING ESTIMATES AT MARCH 31, 2021 (1) | |||||||||||||||||||||||||||||||||||||||||||||||
| (UNAUDITED, DOLLARS IN THOUSANDS) | |||||||||||||||||||||||||||||||||||||||||||||||
| MARCH 31, 2021 | OWNED BUILD-TO-SUIT SPENDING ESTIMATES | ||||||||||||||||||||||||||||||||||||||||||||||
| PROPERTY UNDER DEVELOPMENT | # OF PROJECTS | 2ND QUARTER 2021 | 3RD QUARTER 2021 | 4TH QUARTER 2021 | 1ST QUARTER 2022 | THEREAFTER | TOTAL EXPECTED COSTS (2) | % LEASED | |||||||||||||||||||||||||||||||||||||||
| Total Build-to-Suit (3) | $ | 79,154 | 10 | $ | 10,990 | $ | 6,300 | $ | 4,100 | $ | — | $ | — | $ | 100,544 | 100 | % | ||||||||||||||||||||||||||||||
Non Build-to-Suit Development | 15,668 | ||||||||||||||||||||||||||||||||||||||||||||||
Total Property Under Development | $ | 94,822 | |||||||||||||||||||||||||||||||||||||||||||||
| MARCH 31, 2021 | OWNED BUILD-TO-SUIT IN-SERVICE ESTIMATES | ||||||||||||||||||||||||||||||||||||||||||||||
| # OF PROJECTS | 2ND QUARTER 2021 | 3RD QUARTER 2021 | 4TH QUARTER 2021 | 1ST QUARTER 2022 | THEREAFTER | TOTAL IN-SERVICE (2) | ACTUAL IN-SERVICE 1ST QUARTER 2021 | ||||||||||||||||||||||||||||||||||||||||
| Total Build-to-Suit | 10 | $ | 52,587 | $ | 14,739 | $ | 31,175 | $ | 371 | $ | 1,672 | $ | 100,544 | $ | — | ||||||||||||||||||||||||||||||||
| MARCH 31, 2021 | MORTGAGE BUILD-TO-SUIT SPENDING ESTIMATES | ||||||||||||||||||||||||||||||||||||||||||||||
| MORTGAGE NOTES RECEIVABLE | # OF PROJECTS | 2ND QUARTER 2021 | 3RD QUARTER 2021 | 4TH QUARTER 2021 | 1ST QUARTER 2022 | THEREAFTER | TOTAL EXPECTED COSTS (2) | ||||||||||||||||||||||||||||||||||||||||
Total Build-to-Suit Mortgage Notes | $ | 52,597 | 2 | $ | 4,025 | $ | 3,000 | $ | 3,000 | $ | — | $ | 5,484 | $ | 68,106 | ||||||||||||||||||||||||||||||||
Non Build-to-Suit Mortgage Notes | 312,372 | ||||||||||||||||||||||||||||||||||||||||||||||
Total Mortgage Notes Receivable | $ | 364,969 | |||||||||||||||||||||||||||||||||||||||||||||
| (1) This schedule includes only those properties for which the Company has commenced construction as of March 31, 2021. | |||||||||||||||||||||||||||||||||||||||||||||||
| (2) "Total Expected Costs" and "Total In-Service" each reflect the total capital costs expected to be funded by the Company through completion (including capitalized interest or accrued interest as applicable). | |||||||||||||||||||||||||||||||||||||||||||||||
| (3) Total Build-to-Suit excludes property under development related to the Company's two unconsolidated real estate joint ventures that own recreation anchored lodging properties in St. Petersburg, Florida. The Company's spending estimates for this are estimated at $10.3 million for 2021. | |||||||||||||||||||||||||||||||||||||||||||||||
| Note: This schedule includes future estimates for which the Company can give no assurance as to timing or amounts. Development projects have risks. See Item 1A - "Risk Factors" in the Company's most recent Annual Report on Form 10-K and, to the extent applicable, the Company's Quarterly Reports on Form 10-Q. | |||||||||||||||||||||||||||||||||||||||||||||||
| ||||||||
| Q1 2021 Supplemental | Page 19 | |||||||
| LEASE EXPIRATIONS | |||||||||||||||||||||||
| AS OF MARCH 31, 2021 | |||||||||||||||||||||||
| (UNAUDITED, DOLLARS IN THOUSANDS) | |||||||||||||||||||||||
| YEAR | TOTAL NUMBER OF PROPERTIES | RENTAL REVENUE FOR THE TRAILING TWELVE MONTHS ENDED MARCH 31, 2021 (1) | % OF TOTAL REVENUE (2) | ||||||||||||||||||||
| 2021 | — | $ | — | — | % | ||||||||||||||||||
| 2022 | 2 | 1,705 | — | % | |||||||||||||||||||
| 2023 | 2 | 953 | — | % | |||||||||||||||||||
| 2024 | 6 | 6,123 | 2 | % | |||||||||||||||||||
| 2025 | 2 | 2,670 | 1 | % | |||||||||||||||||||
| 2026 | 3 | 5,478 | 1 | % | |||||||||||||||||||
| 2027 | 8 | 17,106 | 5 | % | |||||||||||||||||||
| 2028 | 12 | 6,842 | 2 | % | |||||||||||||||||||
| 2029 | 12 | 7,799 | 2 | % | |||||||||||||||||||
| 2030 | 22 | 20,011 | 5 | % | |||||||||||||||||||
| 2031 | 13 | 2,521 | 1 | % | |||||||||||||||||||
| 2032 | 21 | 8,333 | 2 | % | |||||||||||||||||||
| 2033 | 9 | 7,749 | 2 | % | |||||||||||||||||||
| 2034 | 40 | 23,666 | 6 | % | |||||||||||||||||||
| 2035 | 33 | 59,824 | 16 | % | |||||||||||||||||||
| 2036 | 22 | 23,045 | 6 | % | |||||||||||||||||||
| 2037 | 32 | 36,832 | 10 | % | |||||||||||||||||||
| 2038 | 35 | 23,916 | 6 | % | |||||||||||||||||||
| 2039 | 4 | 6,739 | 2 | % | |||||||||||||||||||
| 2040 | 2 | 2,253 | 1 | % | |||||||||||||||||||
| Thereafter | 35 | 24,740 | 7 | % | |||||||||||||||||||
| 315 | $ | 288,305 | 77 | % | |||||||||||||||||||
| Note: This schedule excludes non-theatre tenant leases within the Company's entertainment districts, properties under development, land held for development, properties operated by the Company and investments in mortgage notes receivable. | |||||||||||||||||||||||
| (1) Rental revenue for the trailing twelve months ended March 31, 2021 includes lease revenue related to the Company's existing operating ground leases (leases in which the Company is a sub-lessor) as well as the gross-up of tenant reimbursed expenses recognized during the trailing twelve months ended March 31, 2021 in accordance with Accounting Standards Update (ASU) No. 2016-02 Leases (Topic 842). | |||||||||||||||||||||||
| (2) Includes the write-offs of straight line rent receivables of $25.4 million and receivables from tenants of $27.1 million against rental revenue during the trailing twelve months ended March 31, 2021. | |||||||||||||||||||||||
| ||||||||
| Q1 2021 Supplemental | Page 20 | |||||||
| TOP TEN CUSTOMERS BY PERCENTAGE OF TOTAL REVENUE | |||||||||||
| (UNAUDITED, DOLLARS IN THOUSANDS) | |||||||||||
| PERCENTAGE OF TOTAL REVENUE | |||||||||||
| FOR THE THREE MONTHS ENDED | |||||||||||
| CUSTOMERS | MARCH 31, 2021 | ||||||||||
| 1. | AMC Theatres | 21.3% | |||||||||
| 2. | Topgolf | 18.3% | |||||||||
| 3. | Cinemark | 9.5% | |||||||||
| 4. | Vail Resorts | 6.2% | |||||||||
| 5. | Camelback Resort | 4.7% | |||||||||
| 6. | Six Flags | 3.6% | |||||||||
| 7. | Endeavor Schools | 3.3% | |||||||||
| 8. | Empire Resorts | 2.4% | |||||||||
| 9. | Creme de la Creme | 2.3% | |||||||||
| 10. | Andretti Indoor Karting & Games | 1.6% | |||||||||
| Total | 73.2% | ||||||||||
| ||||||||
| Q1 2021 Supplemental | Page 21 | |||||||
| DEFINITIONS - NON-GAAP FINANCIAL MEASURES | ||||||||||||||
EBITDAre
The National Association of Real Estate Investment Trusts (“NAREIT”) developed EBITDAre as a relative non-GAAP financial measure of REITs, independent of a company's capital structure, to provide a uniform basis to measure the enterprise value of a company. Pursuant to the definition of EBITDAre by the Board of Governors of NAREIT, the Company calculates EBITDAre as net (loss) income, computed in accordance with GAAP, excluding interest expense (net), income tax (benefit) expense, depreciation and amortization, gains and losses from disposition of real estate, impairment losses on real estate, costs associated with loan refinancing or payoff and adjustments for unconsolidated partnerships, joint ventures and other affiliates. Management provides EBITDAre herein because it believes this information is useful to investors as a supplemental performance measure as it can help facilitate comparisons of operating performance between periods and with other REITs. The Company's method of calculating EBITDAre may be different from methods used by other REITs and, accordingly, may not be comparable to such other REITs. EBITDAre is not a measure of performance under GAAP, does not represent cash generated from operations as defined by GAAP and is not indicative of cash available to fund all cash needs, including distributions. This measure should not be considered an alternative to net (loss) income or any other GAAP measure as a measurement of the results of the Company's operations or cash flows or liquidity as defined by GAAP.
ADJUSTED EBITDAre AND ANNUALIZED ADJUSTED EBITDAre
Management uses Adjusted EBITDAre in its analysis of the performance of the business and operations of the Company. Management believes Adjusted EBITDAre is useful to investors because it excludes various items that management believes are not indicative of operating performance, and that it is an informative measure to use in computing various financial ratios to evaluate the Company. The Company defines Adjusted EBITDAre as EBITDAre (defined above) for the quarter excluding gain on insurance recovery, severance expense, credit loss (benefit) expense, transaction costs, impairment losses on operating lease right-of-use assets and prepayment fees. This number for the quarter is then multiplied by four to get an annual amount. Annualized Adjusted EBITDAre is Adjusted EBITDAre for the quarter further adjusted for in-service and disposed projects, percentage rent and participating interest and other non-recurring items including removing any impact from operating properties, which is then multiplied by four to get an annual amount. Additionally, for the year ended December 31, 2020, Adjusted EBITDAre was further adjusted to add back prior period receivable write-offs related to certain theatre tenants placed on cash basis or receiving abatements during the respective periods.
The Company's method of calculating Adjusted EBITDAre and Annualized Adjusted EBITDAre may be different from methods used by other REITs and, accordingly, may not be comparable to such other REITs. Adjusted EBITDAre and Annualized Adjusted EBITDAre are not measures of performance under GAAP, do not represent cash generated from operations as defined by GAAP and are not indicative of cash available to fund all cash needs, including distributions. These measures should not be considered as an alternative to net (loss) income or any other GAAP measure as a measurement of the results of the Company's operations or cash flows or liquidity as defined by GAAP.
NET DEBT AND ADJUSTED NET DEBT
Net Debt represents debt (reported in accordance with GAAP) adjusted to exclude deferred financing costs, net and reduced for cash and cash equivalents. By excluding deferred financing costs, net and reducing debt for cash and cash equivalents on hand, the result provides an estimate of the contractual amount of borrowed capital to be repaid, net of cash available to repay it. The Company believes this calculation constitutes a beneficial supplemental non-GAAP financial disclosure to investors in understanding its financial condition. Adjusted net debt is net debt less 40% times property under development to remove the estimated portion of property under development that has been financed with debt but has not yet produced earnings. The Company's method of calculating Net Debt and Adjusted Net Debt may be different from methods used by other REITs and, accordingly, may not be comparable to such other REITs.
| ||||||||
| Q1 2021 Supplemental | Page 22 | |||||||
NET DEBT TO ADJUSTED EBITDAre RATIO AND ADJUSTED NET DEBT TO ANNUALIZED ADJUSTED EBITDAre RATIO
Net Debt to Adjusted EBITDAre ratio and Adjusted Net Debt to Annualized Adjusted EBITDAre ratio are supplemental measures derived from non-GAAP financial measures that the Company uses to evaluate its capital structure and the magnitude of its debt against its operating performance. The Company believes that investors commonly use versions of these ratios in a similar manner. In addition, financial institutions use versions of these ratios in connection with debt agreements to set pricing and covenant limitations. The Company's method of calculating both ratios may be different from methods used by other REITs and, accordingly, may not be comparable to such other REITs.
FUNDS FROM OPERATIONS (“FFO”) AND FFO AS ADJUSTED
NAREIT developed FFO as a relative non-GAAP financial measure of performance of an equity REIT in order to recognize that income-producing real estate historically has not depreciated on the basis determined under GAAP and management provides FFO herein because it believes this information is useful to investors in this regard. FFO is a widely used measure of the operating performance of real estate companies and is provided here as a supplemental measure to GAAP net (loss) income available to common shareholders and earnings per share. Pursuant to the definition of FFO by the Board of Governors of NAREIT, the Company calculates FFO as net (loss) income available to common shareholders, computed in accordance with GAAP, excluding gains and losses from disposition of real estate and impairment losses on real estate, plus real estate related depreciation and amortization, and after adjustments for unconsolidated partnerships, joint ventures and other affiliates. Adjustments for unconsolidated partnerships, joint ventures and other affiliates are calculated to reflect FFO on the same basis. The Company has calculated FFO for all periods presented in accordance with this definition. In addition, the Company presents FFO as adjusted. Management believes it is useful to provide FFO as adjusted as a supplemental measure to GAAP net (loss) income available to common shareholders and earnings per share. FFO as adjusted is FFO plus costs associated with loan refinancing or payoff, transaction costs, severance expense, preferred share redemption costs, impairment of operating lease right-of-use assets and credit loss (benefit) expense, and by subtracting gain on insurance recovery and deferred income tax (benefit) expense. FFO and FFO as adjusted are non-GAAP financial measures. FFO and FFO as adjusted do not represent cash flows from operations as defined by GAAP and are not indicative that cash flows are adequate to fund all cash needs and are not to be considered an alternative to net (loss) income or any other GAAP measure as a measurement of the results of the Company's operations, cash flows or liquidity as defined by GAAP. It should also be noted that not all REITs calculate FFO and FFO as adjusted the same way so comparisons with other REITs may not be meaningful.
ADJUSTED FUNDS FROM OPERATIONS (“AFFO”)
In addition to FFO, the Company presents AFFO by adding to FFO costs associated with loan refinancing or payoff, transaction costs, credit loss (benefit) expense, severance expense, preferred share redemption costs, impairment of operating lease right-of-use assets, termination fees associated with tenants' exercises of public charter school buy-out options, non-real estate depreciation and amortization, deferred financing fees amortization, share-based compensation expense to management and trustees and amortization of above and below market leases, net and tenant allowances and by subtracting maintenance capital expenditures (including second generation tenant improvements and leasing commissions), straight-lined rental revenue (removing the impact of straight-line ground sublease expense), non-cash portion of mortgage and other financing income, gain on insurance recovery and deferred income tax (benefit) expense. AFFO is a widely used measure of the operating performance of real estate companies and is provided here as a supplemental measure to GAAP net (loss) income available to common shareholders and earnings per share and management provides AFFO herein because it believes this information is useful to investors in this regard. AFFO is a non-GAAP financial measure. AFFO does not represent cash flows from operations as defined by GAAP and is not indicative that cash flows are adequate to fund all cash needs and is not to be considered an alternative to net (loss) income or any other GAAP measure as a measurement of the results of the Company's operations or its cash flows or liquidity as defined by GAAP. It should also be noted that not all REITs calculate AFFO the same way so comparisons with other REITs may not be meaningful.
| ||||||||
| Q1 2021 Supplemental | Page 23 | |||||||
INTEREST COVERAGE RATIO
The interest coverage ratio is calculated as the interest coverage amount divided by interest expense, gross. The Company calculates the interest coverage amount by adding to net (loss) income impairment charges, credit loss (benefit) expense, transaction costs, interest expense, gross (including interest expense in discontinued operations), severance expense, depreciation and amortization, share-based compensation expense to management and trustees and costs associated with loan refinancing or payoff; subtracting interest cost capitalized, straight-line rental revenue, gain on early extinguishment of debt, gain (loss) on sale of real estate from continuing and discontinued operations, gain on insurance recovery, gain on previously held equity interest, gain on early extinguishment of debt, prepayment fees and deferred income tax benefit (expense). The Company calculates interest expense, gross, by adding to interest expense, net, interest income and interest cost capitalized. The Company considers the interest coverage ratio to be an appropriate supplemental measure of a company’s ability to meet its interest expense obligations and management believes it is useful to investors in this regard. The Company's calculation of the interest coverage ratio may be different from the calculation used by other companies, and therefore, comparability may be limited. This information should not be considered as an alternative to any GAAP liquidity measures.
FIXED CHARGE COVERAGE RATIO
The fixed charge coverage ratio is calculated in exactly the same manner as the interest coverage ratio, except that interest expense, gross and preferred share dividends are also added to the denominator. The Company considers the fixed charge coverage ratio to be an appropriate supplemental measure of a company’s ability to make its interest and preferred share dividend payments and management believes it is useful to investors in this regard. The Company's calculation of the fixed charge coverage ratio may be different from the calculation used by other companies and, therefore, comparability may be limited. This information should not be considered as an alternative to any GAAP liquidity measures.
DEBT SERVICE COVERAGE RATIO
The debt service coverage ratio is calculated in exactly the same manner as the interest coverage ratio, except that interest expense, gross and recurring principal payments are also added to the denominator. The Company considers the debt service coverage ratio to be an appropriate supplemental measure of a company’s ability to make its debt service payments and management believes it is useful to investors in this regard. The Company's calculation of the debt service coverage ratio may be different from the calculation used by other companies and, therefore, comparability may be limited. This information should not be considered as an alternative to any GAAP liquidity measures.
| ||||||||
| Q1 2021 Supplemental | Page 24 | |||||||
| Appendix to Supplemental Operating and Financial Data | ||||||||||||||||||||||||||
| Reconciliation of Certain Non-GAAP Financial Measures | ||||||||||||||||||||||||||
| First Quarter Ended March 31, 2021 | ||||||||||||||||||||||||||
| ||||||||
| Q1 2021 Supplemental | Page 25 | |||||||
| CALCULATION OF INTEREST, FIXED CHARGE AND DEBT SERVICE COVERAGE RATIOS | |||||||||||||||||||||||||||||||||||
| (UNAUDITED, DOLLARS IN THOUSANDS) | |||||||||||||||||||||||||||||||||||
| INTEREST COVERAGE RATIO (1): | 1ST QUARTER 2021 | 4TH QUARTER 2020 | 3RD QUARTER 2020 | 2ND QUARTER 2020 | 1ST QUARTER 2020 | 4TH QUARTER 2019 | |||||||||||||||||||||||||||||
| Net income (loss) | $ | 3,380 | $ | (19,977) | $ | (85,904) | $ | (62,965) | $ | 37,118 | $ | 36,297 | |||||||||||||||||||||||
| Impairment charges | — | 22,832 | 11,561 | 51,264 | — | 23,639 | |||||||||||||||||||||||||||||
| Impairment charges on joint ventures | — | — | — | 3,247 | — | — | |||||||||||||||||||||||||||||
| Transaction costs | 548 | 814 | 2,776 | 771 | 1,075 | 5,784 | |||||||||||||||||||||||||||||
| Credit loss (benefit) expense | (2,762) | 20,312 | 5,707 | 3,484 | 1,192 | — | |||||||||||||||||||||||||||||
| Interest expense, gross | 39,854 | 43,341 | 42,312 | 39,281 | 36,794 | 36,442 | |||||||||||||||||||||||||||||
| Severance expense | — | 2,868 | — | — | — | 423 | |||||||||||||||||||||||||||||
| Depreciation and amortization | 40,326 | 42,014 | 42,059 | 42,450 | 43,810 | 44,530 | |||||||||||||||||||||||||||||
| Share-based compensation expense | |||||||||||||||||||||||||||||||||||
| to management and trustees | 3,784 | 3,437 | 3,410 | 3,463 | 3,509 | 3,348 | |||||||||||||||||||||||||||||
| Costs associated with loan refinancing or payoff | 241 | 812 | — | 820 | — | 43 | |||||||||||||||||||||||||||||
| Interest cost capitalized | (595) | (404) | (325) | (242) | (262) | (273) | |||||||||||||||||||||||||||||
| Straight-line rental revenue | (1,288) | (898) | 17,969 | (2,229) | 9,708 | (3,516) | |||||||||||||||||||||||||||||
Gain on sale of real estate | (201) | (49,877) | — | (22) | (220) | (5,648) | |||||||||||||||||||||||||||||
Gain on insurance recovery | (30) | (809) | — | — | — | — | |||||||||||||||||||||||||||||
| Deferred income tax expense (benefit) | — | — | 18,035 | (1,676) | (1,113) | (847) | |||||||||||||||||||||||||||||
| Interest coverage amount | $ | 83,257 | $ | 64,465 | $ | 57,600 | $ | 77,646 | $ | 131,611 | $ | 140,222 | |||||||||||||||||||||||
| Interest expense, net | $ | 39,194 | $ | 42,838 | $ | 41,744 | $ | 38,340 | $ | 34,753 | $ | 34,907 | |||||||||||||||||||||||
| Interest income | 65 | 99 | 243 | 699 | 1,779 | 1,262 | |||||||||||||||||||||||||||||
| Interest cost capitalized | 595 | 404 | 325 | 242 | 262 | 273 | |||||||||||||||||||||||||||||
| Interest expense, gross | $ | 39,854 | $ | 43,341 | $ | 42,312 | $ | 39,281 | $ | 36,794 | $ | 36,442 | |||||||||||||||||||||||
| Interest coverage ratio | Footnote 2 | Footnote 2 | Footnote 2 | Footnote 2 | 3.6 | 3.8 | |||||||||||||||||||||||||||||
| FIXED CHARGE COVERAGE RATIO (1): | |||||||||||||||||||||||||||||||||||
| Interest coverage amount | $ | 83,257 | $ | 64,465 | $ | 57,600 | $ | 77,646 | $ | 131,611 | $ | 140,222 | |||||||||||||||||||||||
| Interest expense, gross | $ | 39,854 | $ | 43,341 | $ | 42,312 | $ | 39,281 | $ | 36,794 | $ | 36,442 | |||||||||||||||||||||||
| Preferred share dividends | 6,034 | 6,034 | 6,034 | 6,034 | 6,034 | 6,034 | |||||||||||||||||||||||||||||
| Fixed charges | $ | 45,888 | $ | 49,375 | $ | 48,346 | $ | 45,315 | $ | 42,828 | $ | 42,476 | |||||||||||||||||||||||
| Fixed charge coverage ratio | Footnote 2 | Footnote 2 | Footnote 2 | Footnote 2 | 3.1 | 3.3 | |||||||||||||||||||||||||||||
| DEBT SERVICE COVERAGE RATIO (1): | |||||||||||||||||||||||||||||||||||
| Interest coverage amount | $ | 83,257 | $ | 64,465 | $ | 57,600 | $ | 77,646 | $ | 131,611 | $ | 140,222 | |||||||||||||||||||||||
| Interest expense, gross | $ | 39,854 | $ | 43,341 | $ | 42,312 | $ | 39,281 | $ | 36,794 | $ | 36,442 | |||||||||||||||||||||||
| Recurring principal payments | — | — | — | — | — | — | |||||||||||||||||||||||||||||
| Debt service | $ | 39,854 | $ | 43,341 | $ | 42,312 | $ | 39,281 | $ | 36,794 | $ | 36,442 | |||||||||||||||||||||||
| Debt service coverage ratio | Footnote 2 | Footnote 2 | Footnote 2 | Footnote 2 | 3.6 | 3.8 | |||||||||||||||||||||||||||||
| (1) See pages 22 through 24 for definitions. | |||||||||||||||||||||||||||||||||||
| (2) Not presented as this ratio is not meaningful given the continuing disruption caused by COVID-19 and the associated accounting for tenant rent deferrals and other lease modifications. | |||||||||||||||||||||||||||||||||||
| Amounts above include the impact of discontinued operations, which are separately classified in the consolidated statements of (loss) income. | |||||||||||||||||||||||||||||||||||
| ||||||||
| Q1 2021 Supplemental | Page 26 | |||||||
| RECONCILIATION OF INTEREST COVERAGE AMOUNT TO NET CASH PROVIDED BY OPERATING ACTIVITIES | ||||||||||||||||||||||||||||||||||||||
| (UNAUDITED, DOLLARS IN THOUSANDS) | ||||||||||||||||||||||||||||||||||||||
| The interest coverage amount per the table on page 26 is a non-GAAP financial measure and should not be considered an alternative to any GAAP liquidity measures. It is most directly comparable to the GAAP liquidity measure, “Net cash provided by operating activities,” and is not directly comparable to the GAAP liquidity measures, “Net cash used by investing activities” and “Net cash provided by financing activities.” The interest coverage amount can be reconciled to “Net cash provided by operating activities” per the consolidated statements of cash flows as follows: | ||||||||||||||||||||||||||||||||||||||
| 1ST QUARTER 2021 | 4TH QUARTER 2020 | 3RD QUARTER 2020 | 2ND QUARTER 2020 | 1ST QUARTER 2020 | 4TH QUARTER 2019 | |||||||||||||||||||||||||||||||||
| Net cash provided (used) by operating activities | $ | 78,306 | $ | 5,795 | $ | 2,065 | $ | (31,631) | $ | 89,044 | $ | 102,268 | ||||||||||||||||||||||||||
| Equity in loss from joint ventures | (1,431) | (1,364) | (1,044) | (1,724) | (420) | (905) | ||||||||||||||||||||||||||||||||
| Distributions from joint ventures | (90) | — | — | — | — | — | ||||||||||||||||||||||||||||||||
| Amortization of deferred financing costs | (1,547) | (1,823) | (1,498) | (1,651) | (1,634) | (1,621) | ||||||||||||||||||||||||||||||||
Amortization of above and below market leases, net and tenant allowances | 96 | 96 | 124 | 108 | 152 | 119 | ||||||||||||||||||||||||||||||||
Changes in assets and liabilities, net: | ||||||||||||||||||||||||||||||||||||||
Amortization of operating lease assets and liabilities | 120 | 230 | (14) | (287) | (273) | (161) | ||||||||||||||||||||||||||||||||
Mortgage notes and related accrued interest receivable | (280) | 3,297 | 1,154 | 2,613 | 512 | (8) | ||||||||||||||||||||||||||||||||
| Accounts receivable | (18,687) | 4,422 | (5,053) | 62,163 | (14,149) | 14,320 | ||||||||||||||||||||||||||||||||
| Direct financing lease receivable | — | — | — | — | — | 17 | ||||||||||||||||||||||||||||||||
| Other assets | 7,323 | (367) | (2,208) | 819 | 4,454 | (1,888) | ||||||||||||||||||||||||||||||||
| Accounts payable and accrued liabilities | (997) | 404 | (4,348) | 6,555 | 13,517 | (21,851) | ||||||||||||||||||||||||||||||||
| Unearned rents and interest | (18,075) | 9,312 | 5,690 | 3,100 | (6,907) | 11,132 | ||||||||||||||||||||||||||||||||
| Straight-line rental revenue | (1,288) | (898) | 17,969 | (2,229) | 9,708 | (3,516) | ||||||||||||||||||||||||||||||||
| Interest expense, gross | 39,854 | 43,341 | 42,312 | 39,281 | 36,794 | 36,442 | ||||||||||||||||||||||||||||||||
| Interest cost capitalized | (595) | (404) | (325) | (242) | (262) | (273) | ||||||||||||||||||||||||||||||||
| Transaction costs | 548 | 814 | 2,776 | 771 | 1,075 | 5,784 | ||||||||||||||||||||||||||||||||
| Severance expense (cash portion) | — | 1,610 | — | — | — | 363 | ||||||||||||||||||||||||||||||||
| Interest coverage amount (1) | $ | 83,257 | $ | 64,465 | $ | 57,600 | $ | 77,646 | $ | 131,611 | $ | 140,222 | ||||||||||||||||||||||||||
| Net cash (used) provided by investing activities | $ | (29,894) | $ | 204,883 | $ | (17,919) | $ | (13,219) | $ | (39,759) | $ | 381,255 | ||||||||||||||||||||||||||
| Net cash (used) provided by financing activities | $ | (532,435) | $ | (170,716) | $ | (5,994) | $ | (175,358) | $ | 649,237 | $ | (73,886) | ||||||||||||||||||||||||||
| (1) See pages 22 through 24 for definitions. | ||||||||||||||||||||||||||||||||||||||
| ||||||||
| Q1 2021 Supplemental | Page 27 | |||||||
| RECONCILIATION OF EBITDAre, ADJUSTED EBITDAre, ANNUALIZED ADJUSTED EBITDAre AND ANNUALIZED ADJUSTED REVENUE | ||||||||||||||||||||||||||||||||||||||
| (UNAUDITED, DOLLARS IN THOUSANDS) | ||||||||||||||||||||||||||||||||||||||
| ADJUSTED EBITDAre (4): | 1ST QUARTER 2021 | 4TH QUARTER 2020 | 3RD QUARTER 2020 | 2ND QUARTER 2020 | 1ST QUARTER 2020 | 4TH QUARTER 2019 | ||||||||||||||||||||||||||||||||
| Net income (loss) | $ | 3,380 | $ | (19,977) | $ | (85,904) | $ | (62,965) | $ | 37,118 | $ | 36,297 | ||||||||||||||||||||||||||
| Interest expense, net | 39,194 | 42,838 | 41,744 | 38,340 | 34,753 | 34,907 | ||||||||||||||||||||||||||||||||
| Income tax expense (benefit) | 407 | 402 | 18,417 | (1,312) | (751) | (530) | ||||||||||||||||||||||||||||||||
| Depreciation and amortization | 40,326 | 42,014 | 42,059 | 42,450 | 43,810 | 44,530 | ||||||||||||||||||||||||||||||||
| Gain on sale of real estate | (201) | (49,877) | — | (22) | (220) | (5,648) | ||||||||||||||||||||||||||||||||
| Impairment of real estate investments, net (3) | — | 22,832 | 11,561 | 36,255 | — | 23,639 | ||||||||||||||||||||||||||||||||
| Costs associated with loan refinancing or payoff | 241 | 812 | — | 820 | — | 43 | ||||||||||||||||||||||||||||||||
| Allocated share of joint venture depreciation | 354 | 361 | 369 | 378 | 383 | 551 | ||||||||||||||||||||||||||||||||
| Allocated share of joint venture interest expense | 789 | 872 | 741 | 736 | 735 | 735 | ||||||||||||||||||||||||||||||||
| Impairment charges on joint ventures | — | — | — | 3,247 | — | — | ||||||||||||||||||||||||||||||||
| EBITDAre | $ | 84,490 | $ | 40,277 | $ | 28,987 | $ | 57,927 | $ | 115,828 | $ | 134,524 | ||||||||||||||||||||||||||
| Gain on insurance recovery (1) | (30) | (809) | — | — | — | — | ||||||||||||||||||||||||||||||||
| Severance expense | — | 2,868 | — | — | — | 423 | ||||||||||||||||||||||||||||||||
| Transaction costs | 548 | 814 | 2,776 | 771 | 1,075 | 5,784 | ||||||||||||||||||||||||||||||||
| Credit loss (benefit) expense | (2,762) | 20,312 | 5,707 | 3,484 | 1,192 | — | ||||||||||||||||||||||||||||||||
| Accounts receivable write-offs from prior periods (2) | — | 4,301 | 13,533 | — | — | — | ||||||||||||||||||||||||||||||||
| Straight-line receivable write-offs from prior periods (2) | — | 870 | 19,927 | — | 12,532 | — | ||||||||||||||||||||||||||||||||
| Impairment of operating lease right-of-use assets (3) | — | — | — | 15,009 | — | — | ||||||||||||||||||||||||||||||||
| Adjusted EBITDAre (for the quarter) | $ | 82,246 | $ | 68,633 | $ | 70,930 | $ | 77,191 | $ | 130,627 | $ | 140,731 | ||||||||||||||||||||||||||
| Adjusted EBITDAre (5) | Footnote 10 | Footnote 10 | Footnote 10 | Footnote 10 | $ | 522,508 | $ | 562,924 | ||||||||||||||||||||||||||||||
| ANNUALIZED ADJUSTED EBITDAre (4): | ||||||||||||||||||||||||||||||||||||||
| Adjusted EBITDAre (for the quarter) | Footnote 10 | Footnote 10 | Footnote 10 | Footnote 10 | $ | 130,627 | $ | 140,731 | ||||||||||||||||||||||||||||||
| Corporate/unallocated and other NOI | (145) | 403 | ||||||||||||||||||||||||||||||||||||
| In-service and disposition adjustments (6) | 1,351 | (4,580) | ||||||||||||||||||||||||||||||||||||
| Percentage rent/participation adjustments (7) | 979 | (2,947) | ||||||||||||||||||||||||||||||||||||
| Non-recurring adjustments (8) | 3,999 | 1,170 | ||||||||||||||||||||||||||||||||||||
| Annualized Adjusted EBITDAre (for the quarter) | $ | 136,811 | $ | 134,777 | ||||||||||||||||||||||||||||||||||
| Annualized Adjusted EBITDAre (9) | $ | 547,244 | $ | 539,108 | ||||||||||||||||||||||||||||||||||
| See footnotes on following page. | ||||||||||||||||||||||||||||||||||||||
| ||||||||
| Q1 2021 Supplemental | Page 28 | |||||||
| (1) Included in other income in the consolidated statements of (loss) income in the Company's Annual Reports on Form 10-K and the Company's Quarterly Reports on Form 10-Q. Reconciliation is as follows: | ||||||||||||||||||||||||||||||||||||||
| 1ST QUARTER 2021 | 4TH QUARTER 2020 | 3RD QUARTER 2020 | 2ND QUARTER 2020 | 1ST QUARTER 2020 | 4TH QUARTER 2019 | |||||||||||||||||||||||||||||||||
| Income from settlement of foreign currency swap contracts | $ | 52 | $ | 110 | $ | 154 | $ | 408 | $ | 368 | $ | 252 | ||||||||||||||||||||||||||
| Gain on insurance recovery | 30 | 809 | — | — | — | — | ||||||||||||||||||||||||||||||||
| Operating income from operated properties | 295 | 45 | 16 | 8 | 7,201 | 7,996 | ||||||||||||||||||||||||||||||||
| Miscellaneous income | 301 | 4 | 12 | — | 4 | 138 | ||||||||||||||||||||||||||||||||
| Other income | $ | 678 | $ | 968 | $ | 182 | $ | 416 | $ | 7,573 | $ | 8,386 | ||||||||||||||||||||||||||
| (2) Included in rental revenue from continuing operations in the consolidated statements of (loss) income in the Company's Annual Reports on Form 10-K and the Company's Quarterly Reports on Form 10-Q. Reconciliation is as follows: | ||||||||||||||||||||||||||||||||||||||
| 1ST QUARTER 2021 | 4TH QUARTER 2020 | 3RD QUARTER 2020 | 2ND QUARTER 2020 | 1ST QUARTER 2020 | 4TH QUARTER 2019 | |||||||||||||||||||||||||||||||||
| Minimum rent | $ | 94,190 | $ | 79,342 | $ | 83,230 | $ | 89,589 | $ | 138,219 | $ | 139,529 | ||||||||||||||||||||||||||
| Accounts receivable write-offs from prior periods | — | (4,301) | (13,533) | — | — | — | ||||||||||||||||||||||||||||||||
| Tenant reimbursements | 4,822 | 4,831 | 2,413 | 4,169 | 3,698 | 5,790 | ||||||||||||||||||||||||||||||||
| Percentage rent | 2,030 | 3,040 | 1,303 | 1,454 | 2,757 | 6,428 | ||||||||||||||||||||||||||||||||
| Straight-line rental revenue | 1,289 | 1,768 | 1,958 | 2,229 | 2,824 | 2,926 | ||||||||||||||||||||||||||||||||
| Straight-line write-offs from prior periods | — | (870) | (19,927) | — | (12,532) | — | ||||||||||||||||||||||||||||||||
| Other rental revenue | 283 | 201 | 147 | 90 | 77 | 92 | ||||||||||||||||||||||||||||||||
| Rental revenue | $ | 102,614 | $ | 84,011 | $ | 55,591 | $ | 97,531 | $ | 135,043 | $ | 154,765 | ||||||||||||||||||||||||||
| (3) Impairment charges recognized during the three months ended June 30, 2020 totaled $51.3 million, which was comprised of $36.3 million of impairments of real estate investments and $15.0 million of impairments of operating lease right-of-use assets. | ||||||||||||||||||||||||||||||||||||||
| (4) See pages 22 through 24 for definitions. | ||||||||||||||||||||||||||||||||||||||
| (5) Adjusted EBITDAre for the quarter is multiplied by four to calculate an annual amount. | ||||||||||||||||||||||||||||||||||||||
| (6) Adjustments for properties commencing or terminating GAAP net operating income during the quarter and adjustments to revenue from mortgage notes receivable to be consistent with end of quarter balance, for continuing properties only. | ||||||||||||||||||||||||||||||||||||||
| (7) To adjust percentage rents and participating interest income from the actual latest quarterly amount to the trailing twelve month amount divided by four. | ||||||||||||||||||||||||||||||||||||||
| (8) Non-recurring adjustments relate to properties under operating agreements with third parties, as applicable, and COVID-19 related adjustments. | ||||||||||||||||||||||||||||||||||||||
| (9) Annualized Adjusted EBITDAre for the quarter is multiplied by four to calculate an annual amount. | ||||||||||||||||||||||||||||||||||||||
| (10) Not presented as this metric is not meaningful given the continuing disruption caused by the COVID-19 pandemic and the associated accounting for tenant rent deferrals and other lease modifications. | ||||||||||||||||||||||||||||||||||||||
| Amounts above include the impact of discontinued operations, which are separately classified in the consolidated statements of (loss) income. | ||||||||||||||||||||||||||||||||||||||
| ||||||||
| Q1 2021 Supplemental | Page 29 | |||||||
Serious News for Serious Traders! Try StreetInsider.com Premium Free!
You May Also Be Interested In
- Enanta Pharmaceuticals’ Partner AbbVie Receives European Commission Approval of MAVIRET® (Glecaprevir/Pibrentasvir) for People with Acute Hepatitis C Virus
- Invest Qatar Gateway Introduces New Feature, Connecting Startups to Venture Capital Funds
- Worldly Named as a Representative Vendor in the 2026 Gartner® Market Guide for Sustainable Procurement Applications
Create E-mail Alert Related Categories
SEC FilingsSign up for StreetInsider Free!
Receive full access to all new and archived articles, unlimited portfolio tracking, e-mail alerts, custom newswires and RSS feeds - and more!