



Form 8-K EPIQ SYSTEMS INC For: Apr 28
 Tweet
Tweet Share
Share E-mail
UNITED STATES
SECURITIES AND EXCHANGE COMMISSION
Washington, D.C. 20549
FORM 8-K
CURRENT REPORT
Pursuant to Section 13 or 15(d)
of the Securities Exchange Act of 1934
Date of Report (Date of earliest event reported): April 28, 2015
EPIQ SYSTEMS, INC.
(Exact name of registrant as specified in its charter)
| Missouri | 001-36633 | 48-1056429 | ||
| (State or other jurisdiction of incorporation) |
(Commission File Number) |
(IRS Employer Identification Number) |
501 Kansas Avenue
Kansas City, Kansas 66105
(Address of principal executive offices, including zip code)
(913) 621-9500
(Registrant’s telephone number, including area code)
Check the appropriate box below if the Form 8-K filing is intended to simultaneously satisfy the filing obligation of the registrant under any of the following provisions (see General Instruction A.2. below):
| ¨ | Written communications pursuant to Rule 425 under the Securities Act (17 CFR 230.425). |
| ¨ | Soliciting material pursuant to Rule 14a-12 under the Exchange Act (17 CFR 240.14a-12). |
| ¨ | Pre-commencement communications pursuant to Rule 14d-2(b) under the Exchange Act (17 CFR 240.14d-2(b)). |
| ¨ | Pre-commencement communications pursuant to Rule 13e-4(c) under the Exchange Act (17 CFR 240.13e-4(c)). |
Item 2.02. Results of Operations and Financial Conditions.
On April 28, 2015, Epiq Systems, Inc. (“Epiq Systems”) issued a press release announcing its financial results for the three months ended March 31, 2015. The full text of the press release (including financial tables) as well as the investor presentation with respect to Epiq Systems’ financial results for the three months ended March 31, 2015 for use in connection with an earnings conference call are being furnished as Exhibit 99.1 and Exhibit 99.2 to this Current Report on Form 8-K, respectively, and are incorporated herein by reference.
The press release and the investor presentation include the following non-GAAP financial measures: (i) adjusted net income (net income adjusted for amortization of acquisition intangibles, share-based compensation, acquisition and related expense, one-time technology expense, loan fee amortization, litigation expense, timing of recognition of expense, reorganization expense, (gain) loss on disposition of assets, strategic review expense, and the effect of tax adjustments that are outside of Epiq Systems’ anticipated effective tax rate, all net of tax), (ii) adjusted net income per share, calculated as adjusted net income on a fully diluted per share basis, and (iii) adjusted EBITDA (net income adjusted for depreciation and amortization, share-based compensation, acquisition and related expense, one-time technology expense, net expense related to financing, litigation expense, timing of recognition of expense, reorganization expense, (gain) loss on disposition of assets, strategic review expense, and provision for income taxes). Income taxes typically represent a complex element of a company’s income statement and effective tax rates can vary widely between different periods. Epiq Systems uses an approximate statutory tax rate of 40% to reflect income tax effects in the presentation of its adjusted net income and adjusted net income per share. Utilization of an approximate statutory tax rate for presentation of the non-GAAP measures is done to allow a consistent basis for investors to understand financial performance of the company across historical periods.
These non-GAAP financial measures are intended to supplement the GAAP financial information by providing additional insight regarding results of operations and to allow a comparison with other companies, many of whom use similar non-GAAP financial measures to supplement their GAAP results. These non-GAAP financial measures are reconciled in the press release and the investor presentation slides to the most directly comparable measures as reported in accordance with GAAP, and should be viewed in addition to, and not in lieu of, such comparable financial measures.
Management of Epiq Systems uses these non-GAAP financial measures, together with GAAP results, as it assesses current and prospective operating results and for assessing anticipated operating results for potential acquisitions. The compensation committee has used non-GAAP financial measures in evaluating the performance of management and in determining executive bonuses. Management of Epiq Systems believes these non-GAAP measures may be useful to investors by comparing the results of operations of Epiq Systems without the effect of these items. Certain items are excluded from these non-GAAP financial measures to provide additional comparability measures from period to period. These non-GAAP financial measures will not be defined in the same manner by all companies and may not be comparable to other companies.
The information in this Current Report on Form 8-K, including Exhibit 99.1 and Exhibit 99.2, shall not be deemed “filed” for purposes of Section 18 of the Securities Exchange Act of 1934, as amended (the “Exchange Act”), or otherwise subject to the liabilities of that section, and shall not be deemed to be incorporated by reference into any registration statement or other filing with the Securities and Exchange Commission made by Epiq Systems under the Securities Act of 1933, as amended, or the Exchange Act, whether filed before or after the date hereof, except as otherwise expressly stated by specific reference in such filing.
Item 9.01. Financial Statements and Exhibits.
(d) Exhibits
The following exhibits are furnished as part of this report:
| Exhibit 99.1 | Epiq Systems, Inc. Press Release issued April 28, 2015, reporting Epiq Systems, Inc.’s financial results for the three months ended March 31, 2015. | |
| Exhibit 99.2 | Investor presentation with respect to Epiq Systems, Inc.’s financial results for the three months ended March 31, 2015 for use on the earnings conference call on April 28, 2015. | |
SIGNATURES
Pursuant to the requirements of the Securities Exchange Act of 1934, the registrant has duly caused this report to be signed on its behalf by the undersigned hereunto duly authorized.
| EPIQ SYSTEMS, INC. | ||||||
| Date: April 28, 2015 | By: | /s/ TOM W. OLOFSON | ||||
| Name: | Tom W. Olofson | |||||
| Title: | Chairman of the Board, Chief Executive Officer and Director | |||||
EXHIBIT INDEX
| Exhibit No. |
Description | |
| 99.1 | Epiq Systems, Inc. Press Release issued April 28, 2015, reporting Epiq Systems, Inc.’s financial results for the three months ended March 31, 2015. | |
| 99.2 | Investor presentation with respect to Epiq Systems, Inc.’s financial results for the three months ended March 31, 2015 for use on the earnings conference call on April 28, 2015. | |
Exhibit 99.1

|

|
Legal Technology Solutions Provider Epiq Systems Reports
Q1 Results and Updates 2015 Outlook
Conference Call Today at 4:30 pm ET
Kansas City, KS (April 28, 2015) – Epiq Systems, Inc. (NASDAQ: EPIQ) a leading global provider of integrated technology solutions for the legal profession, today announced results for its first quarter ended March 31, 2015 and provided updated financial guidance for 2015. Epiq will hold a conference call today at 4:30 pm ET to review its results (details below).
| Summary Results (Unaudited) | ||||||||
| Q1 | ||||||||
| (In millions, except share count and per share data) |
2015 | 2014 | ||||||
| Total Operating Revenue |
$ | 107.8 | $ | 116.2 | ||||
| Net Income (Loss) |
$ | 1.7 | ($2.3 | ) | ||||
| Net Income (Loss) Per Share (Diluted) |
$ | 0.05 | ($0.07 | ) | ||||
| Adjusted EBITDA(1) |
$ | 21.4 | $ | 23.5 | ||||
| Adjusted Net Income(1) |
$ | 5.7 | $ | 6.8 | ||||
| Adjusted Earnings Per Share(1) (Diluted) |
$ | 0.15 | $ | 0.19 | ||||
| Adjusted Diluted Shares (in thousands) |
36,914 | 35,415 | ||||||
| Net Cash from Operating Activities |
$ | 3.8 | ($0.8 | ) | ||||
| (1) | Adjusted net income, adjusted EBITDA and adjusted earnings per share are all non-GAAP financial measures. See the accompanying tables herein for information regarding these measures and reconciliation to the most comparable GAAP measure. |
Q1 Financial Overview
First quarter 2015 operating revenue, adjusted EBITDA and adjusted EPS were in line with company expectations. Net cash provided by operating activities increased by $4.7 million compared to the prior year quarter. A decline in operating revenue for the Technology segment compared to the prior year quarter reflected reduced demand across the legal industry in the first two months of 2015 and pricing pressure in North American ESI work. The decline was offset partially by continued operating revenue growth from international operations and record data volumes in North American ESI in March, which is expected to continue into the second quarter. The Bankruptcy and Settlement Administration segment operating revenue increased compared to the prior year quarter reflecting additional work related to the Energy Future
1
Holdings Chapter 11 engagement that began in the second quarter of 2014, in addition to an increase in engagements for non-traditional projects. The absence of one-time expenses in the current year period related to data center consolidation, executive reorganization and strategic acquisitions that were included in the prior year’s period contributed to an increase in net income. Total capital expenditures including software development costs declined over 20% in the current quarter.
Recent Business Highlights
| • | Entered into agreement to acquire Iris Data Services to accelerate growth of eDiscovery managed services; expected to close on or around April 30, 2015. |
| • | Continued focus on the ongoing strategic review process by Epiq’s Board of Directors, including its Strategic Alternatives Committee. |
| • | Retained to provide response services for the Premera Blue Cross data breach and expanded data breach solutions group to meet client demand for cross functional expertise that combines eDiscovery and Settlement Administration services. |
| • | Completed reorganization of New York City real estate footprint in April for the eDiscovery and corporate restructuring businesses to optimize document review capacity and maximize operational efficiency. |
| • | Continued expansion of Epiq’s information governance practice (a previously identified growth opportunity that spans full-lifecycle information governance consulting, records management and information risk mitigation) both organically and via strategic partnerships, such as Contoural, Inc. |
| • | Declared a quarterly cash dividend of $0.09 per share, Epiq’s 20th consecutive quarterly dividend. |
“Epiq’s first quarter results were consistent with our expectations. eDiscovery held its ground in a challenging start to the year for the overall legal services industry, and we continue to win new engagements and expand our service delivery for our bankruptcy and settlement administration clients. Our global footprint and unprecedented capacity and resources ensure that we are winning more of the market share than our competitors, irrespective of the market conditions,” said Tom W. Olofson, chairman and CEO of Epiq Systems.
“A number of organizational initiatives that we began in 2014, such as data center consolidation and human resource reorganizations, are now beginning to benefit our bottom line. Additionally, international growth continues to accelerate, particularly in Europe as we prepare to launch a Frankfurt, Germany-based office later this year.
2
“We are excited to close the purchase of Iris Data Services and accelerate the growth of our managed services offering and its expected positive contribution to Epiq’s future financial performance. Iris brings the market leading managed services solution to Epiq, which broadens our client base and diversifies our mix of transactional and recurring revenue. Iris’s strong reputation and pioneering capabilities (managed services in particular) are among the reasons it is a strategic fit. We expect Iris to continue to run as a stand-alone division of our global eDiscovery business in the short-term, while taking advantage of some obvious near-term cost synergies. We look forward to its future contributions to Epiq.”
Segment Review
| Technology Segment (eDiscovery) | ||||||||
| Q1 | ||||||||
| (In millions)(Unaudited) |
2015 | 2014 | ||||||
| Operating Revenue |
$ | 70.0 | $ | 81.2 | ||||
| Adjusted EBITDA |
$ | 18.2 | $ | 22.3 | ||||
| Operating Revenue Mix |
||||||||
| By Service Type |
||||||||
| Electronically Stored Information (ESI) |
60 | % | 55 | % | ||||
| Document Review |
40 | % | 45 | % | ||||
| By Region |
||||||||
| North America |
77 | % | 84 | % | ||||
| Europe and Asia |
23 | % | 16 | % | ||||
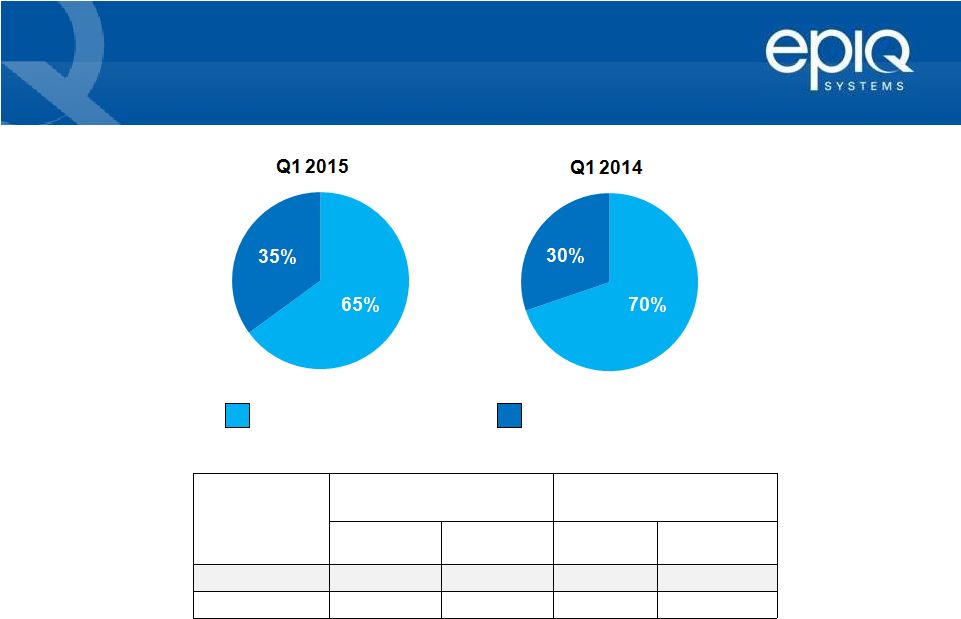
Epiq’s Technology segment provides integrated technology solutions for electronic discovery (eDiscovery), including global electronically stored information (ESI) and global document review. The proportion of higher margin ESI revenue relative to document review continued to expand during the first quarter of 2015; however, the decline in adjusted EBITDA compared to the prior year quarter was due primarily to continued pricing pressure in North American ESI services. The decline was offset partially by an increased proportion of operating revenue from its Europe and Asia operations, which produced higher margins than its North American operations.
3
| Bankruptcy and Settlement Administration Segment | ||||||||
| Q1 | ||||||||
| (In millions)(Unaudited) |
2015 | 2014 | ||||||
| Operating Revenue |
$ | 37.7 | $ | 35.1 | ||||
| Adjusted EBITDA |
$ | 12.7 | $ | 12.0 | ||||
A low level of Chapter 11 bankruptcy filings persisted in the first quarter, a trend that is expected to continue for the balance of 2015. Total U.S. bankruptcy filings fell 11% percent in the first quarter 2015 compared to the prior year quarter. Epiq continues to win non-traditional work and special projects from current clients to supplement operating revenue. In Settlement and Administration, Epiq began work on a large response engagement related to the Premera Blue Cross data breach incident that it expects to continue through the second quarter of 2015.
Updated 2015 Financial Guidance
Based on current market conditions and expectations including performance from Iris Data Services, Epiq has updated its prior 2015 guidance and now estimates overall operating revenue for 2015 between $500 million and $520 million, adjusted EBITDA between $109 million and $115 million, and adjusted EPS between $0.90 and $0.96. This guidance includes a number of assumptions based on current facts and expectations, which are subject to change.
Conference Call Information:
| Call Dial in: | (877) 303-6311 or (631) 813-4730 | |
| Webcast URL: | http://www.epiqsystems.com/investors/corporate-overview/ | |
| Audio replay: | (855) 859-2056, ID# 27345143, available through May 5, 2015 | |
About Epiq Systems
Epiq Systems is a leading global provider of integrated technology solutions for the legal profession, including electronic discovery, bankruptcy, and class action and mass tort administration. We offer full-service capabilities to support litigation, investigations, financial transactions, regulatory compliance and other legal matters. Our innovative technology and services, deep subject-matter expertise and global presence spanning 45 countries served from 20 locations allow us to provide secure, reliable solutions to the worldwide legal community. Visit us at www.epiqsystems.com.
Use of Non-GAAP Financial Measures
This press release includes the following non-GAAP financial measures: (i) adjusted net income (net income adjusted for amortization of acquisition intangibles, share-based compensation, acquisition and related expense, one-time technology expense, loan fee amortization, litigation expense, timing of recognition of expense, reorganization expense, loss on disposition of assets, strategic review expense, and the effect of tax adjustments that are outside of Epiq Systems’ anticipated effective tax rate, all net of tax), (ii) adjusted earnings per share, calculated as adjusted net income on a fully diluted per share basis, and (iii) adjusted EBITDA (net income
4
adjusted for depreciation and amortization, share-based compensation, acquisition and related expense, one-time technology expense, net expense related to financing, litigation expense, timing of recognition of expense, reorganization expense, loss on disposition of assets, strategic review expense, and provision for (benefit from) income taxes). Income taxes typically represent a complex element of a company’s income statement and effective tax rates can vary widely between different periods. Epiq Systems uses an approximate statutory tax rate of 40% to reflect income tax effects in the presentation of its adjusted net income and adjusted net income per share. Utilization of an approximate statutory tax rate for presentation of the non-GAAP measures is done to allow a consistent basis for investors to understand financial performance of the company across historical periods.
Although Epiq Systems reports its results using GAAP, Epiq Systems also uses non-GAAP financial measures when management believes those measures provide useful information for its shareholders. These non-GAAP financial measures are intended to supplement the GAAP financial information by providing additional insight regarding results of operations and to allow a comparison with other companies, many of whom use similar non-GAAP financial measures to supplement their GAAP results. Certain items are excluded from these non-GAAP financial measures to provide additional comparability measures from period to period. These non-GAAP financial measures will not be defined in the same manner by all companies and may not be comparable to other companies. These non-GAAP financial measures are reconciled in the accompanying tables to the most directly comparable measures as reported in accordance with GAAP, and should be viewed in addition to, and not in lieu of, such comparable financial measures.
Forward-looking and Cautionary Statements
This press release includes forward-looking statements. These forward-looking statements include, but are not limited to any projection or expectation of earnings, revenue or other financial items; the plans, strategies and objectives of management for future operations; factors that may affect our operating results; new products or services; the demand for our products and services; our ability to consummate acquisitions, successfully integrate them into our operations and achieve expected synergies; future capital expenditures; effects of current or future economic conditions or performance; industry trends and other matters that do not relate strictly to historical facts or statements of assumptions underlying any of the foregoing. These forward-looking statements are based on our current expectations. In this press release, we make statements that plan for or anticipate the future. Forward-looking statements may be identified by words or phrases such as “believe,” “expect,” “anticipate,” “should,” “planned,” “may,” “estimated,” “goal,” “objective,” “seeks,” and “potential” and variations of these words and similar expressions or negatives of these words. Section 27A of the Securities Act of 1933, as amended, and Section 21E of the Securities Exchange Act of 1934, as amended, provide a “safe harbor” for forward-looking statements. Because forward-looking statements involve future risks and uncertainties, listed below are a variety of factors that could cause actual results and experience to differ materially from the anticipated results or other expectations expressed in our forward-looking statements. These factors include (1) failure to keep pace with technological changes and significant changes in the competitive environment, (2) risks associated with cyber-attacks, interruptions or delays in services at data centers, (3) risks of errors or failures of software or services, (4) interruptions or delays in service at data centers we utilize for delivery of our services, (5) undetected errors in, and failure of operation of, software products releases, (6) our reliance on third-party hardware and software, (7) failure of our financial, operating and information systems to operate as intended, (8) our inability to attract, develop and retain executives and other qualified employees, (9) risks associated with the integration of acquisitions into our existing business operations, (10) risks associated with our international operations, (11) lack of protection of our intellectual property through patents and formal copyright registration, (12) risks of litigation against us for infringement of proprietary rights, (13) material changes in the number of bankruptcy filings, class action filings or mass tort
5
actions each year, or changes in government legislation or court rules affecting these filings, (14) any material non-cash write-downs based on impairment of our goodwill, (15) fluctuations in our quarterly results that could cause fluctuations in the market price of our common stock, (16) our inability to maintain compliance with debt covenant ratios, (17) risks associated with indebtedness and interest rate fluctuations, (18) risks associated with provisions of our articles of incorporation that prevent a takeover of Epiq, (19) overall strength and stability of general economic conditions, both in the United States and in the global markets, (20) the difficulties a third party may have in acquiring our Company due to our shareholder rights plan, (21) the impact of our current review process of strategic alternatives, (22) the successful fulfillment or waiver of all closing conditions for the acquisition of Iris without unexpected delays or material changes, circumstances, effects or conditions that would constitute a material adverse effect, and (23) other risks detailed from time to time in our filings with the Securities and Exchange Commission, including our Annual Report on Form 10-K, Quarterly Reports on Form 10-Q and Current Reports on Form 8-K. In addition, there may be other factors not included in our Securities and Exchange Commission filings that may cause actual results to differ materially from any forward-looking statements. We undertake no obligation to update publicly or revise any forward-looking statements contained herein to reflect future events or developments, except as required by law.
Investor Contacts
| Kelly Bailey | Chris Eddy or David Collins | |
| Epiq Systems | Catalyst Global | |
| 913-621-9500 | 212-924-9800 | |
| [email protected] | [email protected] |
6
EPIQ SYSTEMS, INC.
CONDENSED CONSOLIDATED STATEMENTS OF OPERATIONS
(In thousands, except per share data)
(Unaudited)
| Three Months Ended | ||||||||
| March 31, | ||||||||
| 2015 | 2014 | |||||||
| REVENUE: |
||||||||
| Operating revenue |
$ | 107,755 | $ | 116,220 | ||||
| Reimbursable expenses |
11,273 | 7,051 | ||||||
|
|
|
|
|
|||||
| Total Revenue |
119,028 | 123,271 | ||||||
| OPERATING EXPENSE: |
||||||||
| Direct cost of operating revenue (exclusive of depreciation and amortization shown separately below) |
51,029 | 57,635 | ||||||
| Reimbursable expenses |
10,504 | 6,803 | ||||||
| Selling, general and administrative expense |
39,064 | 44,176 | ||||||
| Depreciation and software and leasehold amortization |
8,765 | 8,700 | ||||||
| Amortization of identifiable intangible assets |
2,685 | 3,120 | ||||||
| Fair value adjustment to contingent consideration |
— | 1,142 | ||||||
| Other operating expense, net |
137 | 69 | ||||||
|
|
|
|
|
|||||
| Total Operating Expense |
112,184 | 121,645 | ||||||
| INCOME FROM OPERATIONS |
6,844 | 1,626 | ||||||
| INTEREST EXPENSE (INCOME): |
||||||||
| Interest expense |
4,229 | 4,877 | ||||||
| Interest income |
(4 | ) | (4 | ) | ||||
|
|
|
|
|
|||||
| Net Interest Expense |
4,225 | 4,873 | ||||||
| INCOME (LOSS) BEFORE INCOME TAXES |
2,619 | (3,247 | ) | |||||
| PROVISION FOR (BENEFIT FROM) INCOME TAXES |
886 | (949 | ) | |||||
|
|
|
|
|
|||||
| NET INCOME (LOSS) |
$ | 1,733 | ($2,298 | ) | ||||
|
|
|
|
|
|||||
| NET INCOME (LOSS) PER SHARE INFORMATION: |
||||||||
| Basic |
$ | 0.05 | ($0.07 | ) | ||||
| Diluted |
$ | 0.05 | ($0.07 | ) | ||||
| WEIGHTED-AVERAGE COMMON SHARES OUTSTANDING: |
||||||||
| Basic |
36,281 | 34,862 | ||||||
| Diluted |
36,914 | 34,862 | ||||||
| Cash dividends declared per common share |
$ | 0.09 | $ | 0.09 | ||||
7
EPIQ SYSTEMS, INC.
CONDENSED CONSOLIDATED BALANCE SHEETS
(In thousands)
| March 31, | December 31, | |||||||
| 2015 | 2014 | |||||||
| (Unaudited) | ||||||||
| ASSETS: |
||||||||
| Cash and cash equivalents |
$ | 38,308 | $ | 54,226 | ||||
| Trade accounts receivable, net |
129,801 | 117,854 | ||||||
| Property and equipment, net |
70,217 | 70,579 | ||||||
| Internally developed software, net |
14,795 | 14,713 | ||||||
| Goodwill |
403,990 | 404,187 | ||||||
| Other intangibles, net |
26,919 | 29,605 | ||||||
| Other |
47,194 | 47,088 | ||||||
|
|
|
|
|
|||||
| Total Assets |
$ | 731,224 | $ | 738,252 | ||||
|
|
|
|
|
|||||
| LIABILITIES: |
||||||||
| Current liabilities, excluding debt |
49,788 | 53,395 | ||||||
| Indebtedness |
311,034 | 313,481 | ||||||
| Other non-current liabilities |
46,395 | 46,439 | ||||||
| Total Equity |
324,007 | 324,937 | ||||||
|
|
|
|
|
|||||
| Total Liabilities and Equity |
$ | 731,224 | $ | 738,252 | ||||
|
|
|
|
|
|||||
8
EPIQ SYSTEMS, INC.
CONDENSED CONSOLIDATED STATEMENTS OF CASH FLOWS
(In thousands)
(Unaudited)
| Three Months Ended | ||||||||
| March 31, | ||||||||
| 2015 | 2014 | |||||||
| CASH FLOWS FROM OPERATING ACTIVITIES: |
||||||||
| Net income (loss) |
$ | 1,733 | ($2,298 | ) | ||||
| Non-cash adjustments to net income (loss): |
||||||||
| Depreciation and amortization |
11,450 | 11,820 | ||||||
| Other, net |
2,662 | 5,688 | ||||||
| Changes in operating assets and liabilities, net |
||||||||
| Trade accounts receivable |
(13,349 | ) | 3,093 | |||||
| Other, net |
1,328 | (19,134 | ) | |||||
|
|
|
|
|
|||||
| Net cash provided by (used in) operating activities |
3,824 | (831 | ) | |||||
|
|
|
|
|
|||||
| CASH FLOWS FROM INVESTING ACTIVITIES: |
||||||||
| Property and equipment; and internally developed software |
(8,618 | ) | (10,901 | ) | ||||
| Other |
1 | 4 | ||||||
|
|
|
|
|
|||||
| Net cash used in investing activities |
(8,617 | ) | (10,897 | ) | ||||
|
|
|
|
|
|||||
| CASH FLOWS FROM FINANCING ACTIVITIES: |
||||||||
| Net change in indebtedness |
(2,496 | ) | (2,133 | ) | ||||
| Common stock repurchases |
(4,017 | ) | (3,214 | ) | ||||
| Cash dividends paid |
(3,340 | ) | (3,152 | ) | ||||
| Payment of acquisition-related liabilities |
(18 | ) | (3,457 | ) | ||||
| Debt issuance costs |
(612 | ) | (837 | ) | ||||
| Other, net |
506 | 3,343 | ||||||
|
|
|
|
|
|||||
| Net cash used in financing activities |
(9,977 | ) | (9,450 | ) | ||||
|
|
|
|
|
|||||
| Effect of exchange rate changes on cash |
(1,148 | ) | 35 | |||||
|
|
|
|
|
|||||
| NET DECREASE IN CASH AND CASH EQUIVALENTS |
($15,918 | ) | ($21,143 | ) | ||||
|
|
|
|
|
|||||
9
EPIQ SYSTEMS, INC.
RECONCILIATION OF NET INCOME (LOSS) TO
ADJUSTED EBITDA
(In thousands)
(Unaudited)
| Three months ended | ||||||||
| March 31, | ||||||||
| 2015 | 2014 | |||||||
| NET INCOME (LOSS) |
$ | 1,733 | ($2,298 | ) | ||||
| Plus: |
||||||||
| Depreciation and amortization |
11,450 | 11,820 | ||||||
| Share-based compensation |
1,621 | 3,539 | ||||||
| Acquisition and related expense (1) |
203 | 1,589 | ||||||
| One-time technology expense (2) |
— | 2,113 | ||||||
| Expense related to financing, net (3) |
4,111 | 4,870 | ||||||
| Litigation (recovery) expense, net (4) |
(520 | ) | 112 | |||||
| Timing of recognition of expense (5) |
(290 | ) | — | |||||
| Reorganization expense (6) |
1,182 | 2,655 | ||||||
| Loss on disposition of assets |
18 | — | ||||||
| Strategic review expense |
1,047 | — | ||||||
| Provision for (benefit from) income taxes |
886 | (949 | ) | |||||
|
|
|
|
|
|||||
| 19,708 | 25,749 | |||||||
|
|
|
|
|
|||||
| ADJUSTED EBITDA |
$ | 21,441 | $ | 23,451 | ||||
|
|
|
|
|
|||||
| (1) | Acquisition and related expense includes one-time costs associated with acquisitions. |
| (2) | One-time technology related costs associated with security and consolidation of data centers from acquisitions. |
| (3) | Expense related to financing is net of interest income. |
| (4) | Litigation expense and recovery related to significant one-time matters. |
| (5) | Adjustment to match timing of expenses to be consistent with timing of GAAP revenue and recoveries for settlement administration matters. |
| (6) | Expenses primarily related to one-time charges for post-employment benefits. |
10
EPIQ SYSTEMS, INC.
RECONCILIATION OF NET INCOME (LOSS)
TO ADJUSTED NET INCOME
(In thousands, except per share data)
(Unaudited)
| Three months ended | ||||||||
| March 31, | ||||||||
| 2015 | 2014 | |||||||
| NET INCOME (LOSS) |
$ | 1,733 | ($2,298 | ) | ||||
| Plus (net of tax) (1) : |
||||||||
| Amortization of acquisition intangibles |
1,611 | 1,872 | ||||||
| Share-based compensation |
973 | 2,124 | ||||||
| Acquisition and related expense (2) |
146 | 986 | ||||||
| One-time technology expense (3) |
— | 1,268 | ||||||
| Loan fee amortization and write-off |
362 | 681 | ||||||
| Litigation (recovery) expense, net (4) |
(172 | ) | 209 | |||||
| Timing of recognition of expense (5) |
(174 | ) | — | |||||
| Reorganization expense (6) |
709 | 1,593 | ||||||
| Loss on disposition of assets |
11 | — | ||||||
| Strategic review expense |
628 | — | ||||||
| Effective tax rate adjustment (7) |
(162 | ) | 350 | |||||
|
|
|
|
|
|||||
| 3,932 | 9,083 | |||||||
|
|
|
|
|
|||||
| ADJUSTED NET INCOME |
$ | 5,665 | $ | 6,785 | ||||
|
|
|
|
|
|||||
| ADJUSTED EARNINGS PER SHARE – DILUTED |
$ | 0.15 | $ | 0.19 | ||||
|
|
|
|
|
|||||
| (1) | Individual adjustments are calculated using a tax rate of 40%. |
| (2) | Acquisition and related expense includes one-time costs associated with acquisitions. |
| (3) | One-time technology related costs associated with security and consolidation of data centers from acquisitions. |
| (4) | Litigation expense or recovery related to significant one-time matters. |
| (5) | Adjustment to match timing of expenses to be consistent with timing of GAAP revenue and recoveries for settlement administration matters. |
| (6) | Expenses primarily related to one-time charges for post-employment benefits. |
| (7) | The effective tax rate adjustment reflects a non-GAAP provision for income taxes at a tax rate of 40%. |
11
EPIQ SYSTEMS, INC.
OPERATING REVENUE
(In thousands)
(Unaudited)
| Three months ended | ||||||||
| March 31, | ||||||||
| 2015 | 2014 | |||||||
| Technology |
$ | 70,023 | $ | 81,169 | ||||
| Bankruptcy |
20,082 | 17,365 | ||||||
| Settlement Administration |
17,650 | 17,686 | ||||||
|
|
|
|
|
|||||
| Total Bankruptcy and Settlement Administration |
37,732 | 35,051 | ||||||
|
|
|
|
|
|||||
| TOTAL OPERATING REVENUE |
$ | 107,755 | $ | 116,220 | ||||
|
|
|
|
|
|||||
EPIQ SYSTEMS, INC.
ADJUSTED EBITDA
(In thousands)
(Unaudited)
| Three months ended | ||||||||
| March 31, | ||||||||
| 2015 | 2014 | |||||||
| Technology |
$ | 18,208 | $ | 22,298 | ||||
| Bankruptcy and Settlement Administration |
12,704 | 11,951 | ||||||
| Unallocated Corporate |
(9,471 | ) | (10,798 | ) | ||||
|
|
|
|
|
|||||
| TOTAL ADJUSTED EBITDA(1) |
$ | 21,441 | $ | 23,451 | ||||
|
|
|
|
|
|||||
| (1) | Unallocated corporate adjusted EBITDA excludes expenses related to share-based compensation, acquisition and related expense, one-time technology expense, non-routine litigation expense or recovery, timing of recognition of expense, gain or loss on disposition of assets, strategic review expense, and one-time reorganization expense. |
12
EPIQ SYSTEMS, INC.
CALCULATION OF DILUTED NET INCOME (LOSS) PER SHARE AND
DILUTED ADJUSTED EARNINGS PER SHARE
(In thousands, except per share data)
(Unaudited)
| Three months ended | ||||||||
| March 31, | ||||||||
| 2015 | 2014 | |||||||
| NET INCOME (LOSS) |
$ | 1,733 | ($2,298 | ) | ||||
| BASIC WEIGHTED AVERAGE SHARES |
36,281 | 34,862 | ||||||
| Adjustment to reflect share-based awards |
633 | — | ||||||
|
|
|
|
|
|||||
| DILUTED WEIGHTED AVERAGE SHARES (1) |
36,914 | 34,862 | ||||||
|
|
|
|
|
|||||
| NET INCOME (LOSS) PER SHARE – DILUTED |
$ | 0.05 | ($0.07 | ) | ||||
|
|
|
|
|
|||||
| ADJUSTED NET INCOME |
$ | 5,665 | $ | 6,785 | ||||
| BASIC WEIGHTED AVERAGE SHARES |
36,281 | 34,862 | ||||||
| Adjustment to reflect share-based awards |
633 | 553 | ||||||
|
|
|
|
|
|||||
| DILUTED WEIGHTED AVERAGE SHARES |
36,914 | 35,415 | ||||||
|
|
|
|
|
|||||
| ADJUSTED EARNINGS PER SHARE – DILUTED |
$ | 0.15 | $ | 0.19 | ||||
|
|
|
|
|
|||||
| (1) | Diluted weighted average shares outstanding for the three months ended March 31, 2014 exclude the dilutive impact of options and nonvested shares outstanding due to the GAAP net loss reported for the first quarter of 2014. |
13
 First Quarter 2015
Earnings Conference Call
April 28, 2015
NASDAQ: EPIQ
www.epiqsystems.com
Exhibit 99.2 |
 2
Forward Looking Statements
& Use of Non-GAAP Measures
This presentation includes forward-looking statements. These
forward-looking statements include, but are not limited to any projection or expectation of earnings, revenue or other financial items; the
plans, strategies and objectives of management for future operations; factors that
may affect our operating results; new products or services; the demand for our products and services; our ability to
consummate acquisitions, successfully integrate them into our operations and
achieve expected synergies; future capital expenditures; effects of current or future economic conditions or
performance; industry trends and other matters that do not relate strictly to
historical facts or statements of assumptions underlying any of the foregoing. These forward-looking statements are based
on
our
current
expectations.
In
this
press
release,
we
make
statements
that
plan
for
or
anticipate
the
future.
Forward-looking
statements
may
be
identified
by
words
or
phrases
such
as
“believe,”
“expect,”
“anticipate,”
“should,”
“planned,”
“may,”
“estimated,”
“goal,”
“objective,”
“seeks,”
and
“potential”
and
variations
of
these
words
and
similar
expressions
or
negatives
of
these
words.
Section
27A
of
the
Securities
Act
of
1933,
as
amended,
and
Section
21E
of
the
Securities
Exchange
Act
of
1934,
as
amended,
provide
a
“safe
harbor”
for
forward-looking
statements.
Because
forward-
looking
statements
involve
future
risks
and
uncertainties,
listed
below
are
a
variety
of
factors
that
could
cause
actual
results
and
experience
to
differ
materially
from
the
anticipated
results
or
other
expectations
expressed
in
our
forward-looking
statements.
These
factors
include
(1)
failure
to
keep
pace
with
technological
changes
and
significant
changes
in
the
competitive
environment,
(2)
risks
associated with cyber-attacks, interruptions or delays in services at data
centers, (3) risks of errors or failures of software or services, (4) interruptions or delays in service at data centers we utilize for
delivery
of
our
services,
(5)
undetected
errors
in,
and
failure
of
operation
of,
software
products
releases,
(6)
our
reliance
on
third-party
hardware
and
software,
(7)
failure
of
our
financial,
operating
and information systems to operate as intended, (8) our inability to attract,
develop and retain executives and other qualified employees, (9) risks associated with the integration of acquisitions into
our
existing
business
operations,
(10)
risks
associated
with
our
international
operations,
(11)
lack
of
protection
of
our
intellectual
property
through
patents
and
formal
copyright
registration,
(12)
risks
of
litigation
against
us
for
infringement
of
proprietary
rights,
(13)
material
changes
in
the
number
of
bankruptcy
filings,
class
action
filings
or
mass
tort
actions
each
year,
or
changes
in
government
legislation or court rules affecting these filings, (14) any material non-cash
write-downs based on impairment of our goodwill, (15) fluctuations in our quarterly results that could cause fluctuations in
the
market
price
of
our
common
stock,
(16)
our
inability
to
maintain
compliance
with
debt
covenant
ratios,
(17)
risks
associated
with
indebtedness
and
interest
rate
fluctuations,
(18)
risks
associated
with
provisions
of
our
articles
of
incorporation
that
prevent
a
takeover
of
Epiq,
(19)
overall
strength
and
stability
of
general
economic
conditions,
both
in
the
United
States
and
in
the
global
markets,
(20)
the
difficulties
a
third
party
may
have
in
acquiring
our
Company
due
to
our
shareholder
rights
plan,
(21)
the
impact
of
our
current
review
process
of
strategic
alternatives,
(22)
the
successful
fulfillment
or
waiver
of
all
closing
conditions
for
the
acquisition
of
Iris
without
unexpected
delays
or
material
changes,
circumstances,
effects
or
conditions
that
would
constitute
a
material
adverse
effect, and (23) other risks detailed from time to time in our filings with the
Securities and Exchange Commission, including our Annual Report on Form 10-K, Quarterly Reports on Form 10-Q and
Current Reports on Form 8-K. In addition, there may be other factors not
included in our Securities and Exchange Commission filings that may cause actual results to differ materially from any
forward-looking statements. We undertake no obligation to update publicly or
revise any forward-looking statements contained herein to reflect future events or developments, except as required by
law.
This
presentation
includes
the
following
non-GAAP
financial
measures:
(i)
adjusted
net
income
(net
income
adjusted
for
amortization
of
acquisition
intangibles,
share-based
compensation,
acquisition
and
related
expense,
one-time
technology
expense,
loan
fee
amortization,
litigation
expense,
timing
of
recognition
of
expense,
reorganization
expense,
loss
on
disposition
of
assets,
strategic
review
expense
and
the
effect
of
tax
adjustments
that
are
outside
of
Epiq
Systems’
anticipated
effective
tax
rate,
all
net
of
tax),
(ii)
adjusted
earnings
per
share,
calculated
as
adjusted
net
income
on
a
fully
diluted
per
share
basis,
and
(iii)
adjusted
EBITDA
(net
income
(loss)
adjusted
for
depreciation
and
amortization,
share-based
compensation,
acquisition
and
related
expense,
one-
time
technology
expense,
net
expense
related
to
financing,
litigation
expense,
timing
of
recognition
of
expense,
reorganization
expense,
loss
on
disposition
of
assets,
strategic
review
expense
and
provision
for
(benefit
from)
income
taxes).
Income
taxes
typically
represent
a
complex
element
of
a
company’s
income
statement
and
effective
tax
rates
can
vary
widely
between
different
periods.
Epiq
Systems
uses
an
approximate
statutory
tax
rate
of
40%
to
reflect
income
tax
effects
in
the
presentation
of
its
adjusted
net
income
and
adjusted
net
income
per
share.
Utilization
of
an
approximate
statutory
tax
rate
for
presentation
of
the
non-GAAP
measures
is
done
to
allow
a
consistent
basis
for
investors
to
understand
financial
performance
of
the
company
across
historical
periods.
Although
Epiq
Systems
reports
its
results
using
GAAP,
Epiq
Systems
also
uses
non-GAAP
financial
measures
when
management
believes
those
measures
provide
useful
information
for
its
shareholders.
These
non-GAAP
financial
measures
are
intended
to
supplement
the
GAAP
financial
information
by
providing
additional
insight
regarding
results
of
operations
and
to
allow
a
comparison
with
other
companies,
many
of
whom
use
similar
non-GAAP
financial
measures
to
supplement
their
GAAP
results.
Certain
items
are
excluded
from
these
non-GAAP
financial
measures
to
provide
additional
comparability
measures
from
period
to
period.
These
non-GAAP
financial
measures
will
not
be
defined
in
the
same
manner
by
all
companies
and
may
not
be
comparable
to
other
companies.
These
non-GAAP
financial
measures
are
reconciled
in
the
accompanying
tables
to
the
most
directly
comparable
measures
as
reported
in
accordance
with
GAAP,
and
should
be
viewed
in
addition
to,
and
not
in
lieu
of,
such
comparable
financial
measures. |
 Q1
2015 Earnings Conference Call 3
(1) A non-GAAP measure, refer to page 8 for reconciliation to most
directly comparable GAAP measure. (2) A non-GAAP measure, refer to
page 9 for reconciliation to most directly comparable GAAP measure.
(3) A non-GAAP measure, refer to page 10 for calculation.
Financial Results
(In millions, except share count and
per share data) (Unaudited)
March 31, 2015
March 31, 2014
Operating Revenue
$107.8
$116.2
Net Income (Loss)
$1.7
($2.3)
Net Income (Loss) per share
(Diluted)
$0.05
($0.07)
Adjusted Net Income
(1)
$5.7
$6.8
Adjusted EBITDA
(2)
$21.4
$23.5
Adjusted Earnings Per Share (EPS)
(Diluted)
(3)
$0.15
$0.19
Adjusted Diluted Shares
(in thousands)
36,914
35,415
Net Cash from Operations
$3.8
($0.8) |
 Q1
2015 Earnings Conference Call 4
(In thousands)
March 31, 2015
(Unaudited)
Dec 31, 2014
Cash and Cash Equivalents
$38,308
$54,226
Trade Accounts Receivable, Net
129,801
117,854
Property and Equipment, Net
70,217
70,579
Goodwill
403,990
404,187
Other Intangibles, Net
26,919
29,605
Indebtedness
311,034
313,481
Equity
324,007
324,937
Selected Balance Sheet Data |
 Q1
2015 Earnings Conference Call 5
(In thousands) (Unaudited)
March 31, 2015
March 31,
2014
Net Income (Loss)
$1,733
($2,298)
Non-cash Adjustments to Net Income (Loss)
Depreciation and Amortization
11,450
11,820
Other, Net
2,662
5,688
Changes in Operating Assets and Liabilities, Net
Trade Accounts Receivable
(13,349)
3,093
Other, Net
1,328
(19,134)
Net Cash Provided by (Used in) Operating
Activities
$3,824
($831)
Cash from Operating Activities |
 Q1
2015 Earnings Conference Call 6
Segment Operating Results
Technology
Bankruptcy & Settlement Administration
(In millions)
Technology
Bankruptcy and
Settlement Administration
Operating
Revenue
Adjusted
EBITDA
Operating
Revenue
Adjusted
EBITDA
Q1 2015
$70.0
$18.2
$37.7
$12.7
Q1 2014
$81.2
$22.3
$35.1
$12.0 |
 2015
Financial Guidance •
Updated guidance estimates for fiscal year 2015, which include the Iris
acquisition •
Guidance
estimates
may
be
updated
in
future
periods
as
conditions
permit
(1)
2015E
Operating Revenue
$500 -
$520 million
Adjusted EBITDA
$109 -
$115 million
Adjusted EPS
$0.90 -
$0.96
(1)
This guidance includes a number of assumptions based on current facts and
expectations, which are subject to change. Q1 2015 Earnings Conference
Call 7 |
 Q1
2015 Earnings Conference Call 8
(In thousands, except per share data) (Unaudited)
Q1 2015
Q1 2014
Net Income (Loss)
$1,733
($2,298)
Plus (net of tax
(1)
):
Amortization of Acquisition Intangibles
1,611
1,872
Share-based Compensation
973
2,124
Acquisition and Related Expense
(2)
146
986
One-time Technology Expense
(3)
-
1,268
Loan Fee Amortization and Write-off
362
681
Litigation (Recovery) Expense, Net
(4)
(172)
209
Timing of Recognition of Expense
(5)
(174)
-
Reorganization Expense
(6)
709
1,593
Loss on Disposition of Assets
11
-
Strategic Review Expense
628
-
Effective Tax Rate Adjustment
(7)
(162)
350
Adjusted Net Income
$5,665
$6,785
Adjusted
Earnings
Per
Share
–
Diluted
$0.15
$0.19
(1)
Individual adjustments are calculated using a tax rate of 40%.
(2)
Acquisition and related expense includes one-time costs associated with
acquisitions. (3)
One-time technology related costs associated with security and consolidation
of data centers from acquisitions. (4)
Litigation expense and recovery related to significant one-time matters.
(5)
Adjustment to match timing of expenses to be consistent with timing of GAAP
revenue and recoveries for settlement administration matters.
(6)
Expenses primarily related to one-time charges for post-employment
benefits. (7)
The effective tax rate adjustment reflects a non-GAAP provision for income
taxes at a tax rate of 40%. Adjusted Net Income
Reconciliation |
 Q1
2015 Earnings Conference Call 9
(In thousands) (Unaudited)
Q1 2015
Q1 2014
Net Income (Loss)
$1,733
($2,298)
Plus:
Depreciation and Amortization
11,450
11,820
Share-based Compensation
1,621
3,539
Acquisition and Related Expense
(1)
203
1,589
One-time Technology Expense
(2)
-
2,113
Expense Related to Financing, Net
(3)
4,111
4,870
Litigation (Recovery) Expense, Net
(4)
(520)
112
Timing of Recognition of Expense
(5)
(290)
-
Reorganization Expense
(6)
1,182
2,655
Loss on Disposition of Assets
18
-
Strategic Review Expense
1,047
-
Provision for (Benefit from) Income Taxes
886
(949)
Adjusted EBITDA
$21,441
$23,451
(1)
Acquisition and related expense includes one-time costs associated with
acquisitions. (2)
One-time technology related costs associated with security and consolidation
of data centers from acquisitions. (3)
Expense related to financing is net of interest income.
(4)
Litigation expense and recovery related to significant one-time matters.
(5)
Adjustment to match timing of expenses to be consistent with timing of GAAP
revenue and recoveries for settlement administration matters.
(6)
Expenses primarily related to one-time charges for post-employment
benefits. Adjusted EBITDA
Reconciliation |
 Q1
2015 Earnings Conference Call 10
(In thousands, except per share data) (Unaudited)
Q1 2015
Q1 2014
Net Income (Loss)
$1,733
($2,298)
Basic Weighted Average Shares
36,281
34,862
Adjustment to reflect share-based awards
633
553
Diluted Weighted Average Shares(1)
36,914
35,415
Net
Income
(Loss)
Per
Share
–
Diluted
$0.05
($0.07)
Adjusted Net Income
$5,665
$6,785
Adjusted
Earnings
Per
Share
–
Diluted
$0.15
$0.19
(1)
Diluted weighted average shares outstanding for the three months ended March 31,
2014 exclude the dilutive impact of options and nonvested shares
outstanding due to the GAAP net loss reported for the first quarter of 2014.
Diluted Net Income (Loss) Per Share Calculation |
 Investor Contacts
Kelly Bailey
Epiq Systems
(913) 621-9500
IR@epiqsystems.com
Chris Eddy
Catalyst Global
(212) 924-9800
epiq@catalyst-ir.com
NASDAQ: EPIQ
www.epiqsystems.com |
Serious News for Serious Traders! Try StreetInsider.com Premium Free!
You May Also Be Interested In
- "Superior Products of Qingdao" Features at Panama International Tire & Auto Expo, deepening Footprint in Latin American Market
- Quanta Computer and Quantinuum Partner to Build an Industrial Foundation for Large-Scale Quantum Computing
- More Cancer Patients Are Opting to Preserve Their Tumors
Create E-mail Alert Related Categories
SEC FilingsSign up for StreetInsider Free!
Receive full access to all new and archived articles, unlimited portfolio tracking, e-mail alerts, custom newswires and RSS feeds - and more!
