




Form 8-K DENNYS CORP For: Jan 12

FREE Breaking News Alerts from StreetInsider.com!
StreetInsider.com Top Tickers, 10/16/2026
- S&P 500 ends higher as traders shift from AI to healthcare
- U.S. producer prices rise by 1.3% month-on-month in September
- Brent steady as US weighs easing sanctions on global 'shadow fleet'
- UBS now expects a third Fed rate hike after hot September inflation print
- Tesla-SpaceX Merger could be announced before December, Barclays says
 Tweet
Tweet Share
Share E-mail
UNITED STATES
SECURITIES AND EXCHANGE COMMISSION
Washington, D.C. 20549
FORM 8-K
�
CURRENT�REPORT
PURSUANT TO SECTION 13 OR 15(d) OF THE SECURITIES EXCHANGE ACT OF 1934
�
Date of Report (Date of earliest event reported) January 12, 2015

DENNYS CORPORATION
(Exact name of registrant as specified in its charter)
Delaware | 0-18051 | 13-3487402 |
(State or other jurisdiction of | Commission File No. | (I.R.S. Employer |
Incorporation or organization | � | Identification No.) |
203 East Main Street
Spartanburg, South Carolina 29319-0001
(Address of principal executive offices)
(Zip Code)
(864) 597-8000
(Registrants telephone number, including area code)
�
Check the appropriate box below if the Form 8-K filing is intended to simultaneously satisfy the filing obligations of the registrant under any of the following provisions:
�
[��� ]� Written communications pursuant to Rule 425 under the Securities Act (17 CFR 230.425)
�
[��� ]� Soliciting material pursuant to Rule 14a-12 under the Exchange Act (17 CFR 240.14a-12)
�
[��� ]� Pre-commencement communications pursuant to Rule 14d-2(b) under the Exchange Act (17 CFR 240.14d-2(b))
�
[��� ]� Pre-commencement communications pursuant to Rule 13e-4(c) under the Exchange Act (17 CFR 240.13e-4(c))
Item 2.02 Results of Operations and Financial Condition
On January 12, 2015, Denny's Corporation (the "Company") issued a press release announcing certain preliminary financial results for the fourth quarter and year ended December 31, 2014. A copy of the press release is attached as Exhibit 99.1 hereto and incorporated herein by reference.
Item 7.01 Regulation FD Disclosure
Company management will present to members of the investment community as part of the ICR XChange Conference in Orlando, FL on�Monday, January 12, 2015, Tuesday, January 13, 2015 and Wednesday, January 14, 2015. A copy of the investor presentation to be used during the conference is attached to this Current Report on Form 8-K as�Exhibit 99.2 and is also available in the
Investor Relations
section of the Companys website at�www.dennys.com.
The information in this Item 7.01 of this Current Report on Form 8-K, including Exhibit 99.2 hereto, shall not be deemed
filed
for purposes of Section 18 of the Securities Exchange Act of 1934, as amended (the
Exchange Act
), or otherwise subject to the liabilities of that section. The information in this Item 7.01 of this Current Report on Form 8-K shall not be deemed to be incorporated by reference in any filing under the Securities Act of 1933, as amended, or the Exchange Act, except as expressly set forth by specific reference in such filing.
Item 9.01 Financial Statements and Exhibits
(d) Exhibits
Exhibit 99.1 -- Press release issued by Denny's Corporation on January 12, 2015.
Exhibit 99.2 -- Investor Presentation, dated January 12, 2015.
SIGNATURES
�
Pursuant to the requirements of the Securities Exchange Act of 1934, the registrant has duly caused this report to be signed on its behalf by the undersigned hereunto duly authorized.
�
�
�
� | Denny's Corporation |
� | � |
� | � |
� | � |
Date: January 12, 2015 | /s/ F. Mark Wolfinger |
� | F. Mark Wolfinger |
� | Executive Vice President, |
� | Chief Administrative Officer and |
� | Chief Financial Officer |

�
DENNYS CORPORATION RELEASES PRELIMINARY FINANCIAL RESULTS FOR FOURTH QUARTER AND FULL YEAR 2014
- Achieves Highest Quarter of Domestic System-Wide Same-Store Sales in Over Eight Years -
- Increases Full Year 2014 Financial Guidance -
SPARTANBURG, S.C., January 12, 2015 - Dennys Corporation (NASDAQ: DENN), franchisor and operator of one of America's largest franchised full-service restaurant chains, based on the number of restaurants, today reported preliminary results on domestic same-store sales and restaurant openings and closings for its fourth quarter and full year ended December 31, 2014.
Dennys fourth quarter domestic system-wide same-store sales grew 4.7%, comprised of a 4.6% increase at domestic franchised restaurants and 5.8% growth at company restaurants. In addition to growing system-wide same-store sales in 14 of the past 15 quarters, Dennys has achieved its fourth consecutive year of positive system-wide same-store sales and highest annual system-wide same-store sales growth since 2006.
In the fourth quarter 2014, Dennys opened 22 system restaurants. For the full year 2014, Dennys opened 38 restaurants, including six international locations, bringing the total restaurant count to 1,702. This is the sixth consecutive year of positive net system growth for the brand.
Based on preliminary results, Dennys is increasing its full year 2014 guidance ranges for Adjusted EBITDA* and Free Cash Flow* with Adjusted EBITDA* now expected to be between $80 million and $82 million and Free Cash Flow* now expected to be between $47 million and $49 million. Dennys expects to release financial and operating results for its fourth quarter and full year ended December 31, 2014 after the market closes on Wednesday, February 18, 2015.
Preliminary Results | Quarter Ended 12/31/14 | Year Ended 12/31/14 |
Domestic Same-Store Sales | ||
System-wide Restaurants | 4.7% | 2.8% |
Franchised Restaurants | 4.6% | 2.5% |
Company Restaurants | 5.8% | 4.2% |
Restaurants Opened** | 22 | 38 |
Franchised & Licensed | 21 | 37 |
Company | 1 | 1 |
Restaurants Closed** | 9 | 36 |
Franchised & Licensed | 9 | 33 |
Company | 0 | 3 |
* | Please refer to the tables in the Third Quarter 2014 Earnings Release dated October 27, 2014 for non-GAAP financial reconciliations of net income to Adjusted EBITDA and Free Cash Flow. |
** | Includes the temporary closure and reopening of the company operated restaurant in Las Vegas. |
Upcoming Investor Conference Presentation
Dennys will be presenting at the 17th Annual ICR XChange Conference on Tuesday, January 13, 2015. The event will be held at the JW Marriott Orlando Grande Lakes in Orlando, Florida, and the Companys presentation will begin at 10:00 a.m Eastern Time. Investors and interested parties may listen to a live audio webcast of the presentation which will be available online in the Events and Presentations section of Denny's Investor Relations website at investor.dennys.com. A replay of the presentation webcast will be available following the live presentation. Investors and interested parties may access a copy of the presentation in the Events and Presentations section of Denny's website.
About Dennys Corporation
Denny's is the franchisor and operator of one of America's largest franchised full-service restaurant chains, based on number of restaurants. As of December 31, 2014, Dennys had 1,702 franchised, licensed, and company restaurants around the world, with combined sales of approximately $2.6 billion, including 1,596 restaurants in the United States and 106 restaurants in Canada, Costa Rica, Mexico, Honduras, Guam, Cura�ao, Puerto Rico, Dominican Republic, El Salvador, Chile and New Zealand. At the end of 2014, 1,541 of Dennys restaurants were franchised and 161 restaurants were company operated. For further information on Denny's, including news releases, links to SEC filings and other financial information, please visit the Denny's investor relations website at investor.dennys.com.
The Company urges caution in considering its current trends and any outlook on earnings disclosed in this press release.��In addition, certain matters discussed in this release may constitute forward-looking statements.��These forward-looking statements, which reflect its best judgment based on factors currently known, are intended to speak only as of the date such statements are made and involve risks, uncertainties, and other factors that may cause the actual performance of Dennys Corporation, its subsidiaries and underlying restaurants to be materially different from the performance indicated or implied by such statements.��Words such as
expects
,
anticipates
,
believes
,
intends
,
plans
,
hopes
, and variations of such words and similar expressions are intended to identify such forward-looking statements.��Except as may be required by law, the Company expressly disclaims any obligation to update these forward-looking statements to reflect events or circumstances after the date of this release or to reflect the occurrence of unanticipated events.��Factors that could cause actual performance to differ materially from the performance indicated by these forward-looking statements include, among others:��the competitive pressures from within the restaurant industry; the level of success of the Companys strategic and operating initiatives; advertising and promotional efforts; adverse publicity; changes in business strategy or development plans; terms and availability of capital; regional weather conditions; overall changes in the general economy, particularly at the retail level; political environment (including acts of war and terrorism); and other factors from time to time set forth in the Companys SEC reports and other filings, including but not limited to the discussion in Managements Discussion and Analysis and the risks identified in Item 1A. Risk Factors contained in the Companys Annual Report on Form 10-K for the year ended December�25, 2013 (and in the Companys subsequent quarterly reports on Form 10-Q).
Investor Contact: | Whit Kincaid |
877-784-7167
����
Media Contact: | Liz DiTrapano, ICR |
646-277-1226
WELCOME TO AMERICAS DINER� Investor Presentation January 12 14, 2015
�
2 Dennys Corporation urges caution in considering its current trends and any outlook on earnings disclosed in this presentation. In addition, certain matters discussed may constitute forward-looking statements. These forward-looking statements, which reflect the Companys best judgment based on factors currently known, are intended to speak only as of the date such statements are made and involve risks, uncertainties, and other factors that may cause the actual performance of Dennys Corporation, its subsidiaries and underlying restaurants to be materially different from the performance indicated or implied by such statements. Words such as
expects
,
anticipates
,
believes
,
intends
,
plans
,
hopes
, and variations of such words and similar expressions are intended to identify such forward-looking statements. Except as may be required by law, the Company expressly disclaims any obligation to update these forward-looking statements to reflect events or circumstances after the date of this presentation or to reflect the occurrence of unanticipated events. Factors that could cause actual performance to differ materially from the performance indicated by these forward-looking statements include, among others: the competitive pressures from within the restaurant industry; the level of success of the Companys operating initiatives, advertising and promotional efforts; adverse publicity; changes in business strategy or development plans; terms and availability of capital; regional weather conditions; overall changes in the general economy, particularly at the retail level; political environment (including acts of war and terrorism); and other factors from time to time set forth in the Companys SEC reports, including but not limited to the discussion in Managements Discussion and Analysis and the risks identified in Item 1A. Risk Factors contained in the Companys Annual Report on Form 10-K for the year ended December 25, 2013 (and in the Companys subsequent quarterly reports on Form 10-Q). The presentation includes references to the Companys non-GAAP financials measures. The Company believes that, in addition to other financial measures, Adjusted Income Before Taxes, Adjusted EBITDA, Free Cash Flow, Adjusted Net Income and Adjusted Net Income Per Share are appropriate indicators to assist in the evaluation of its operating performance on a period-to-period basis. The Company also uses Adjusted Income, Adjusted EBITDA and Free Cash Flow internally as performance measures for planning purposes, including the preparation of annual operating budgets, and for compensation purposes, including bonuses for certain employees. Adjusted EBITDA is also used to evaluate its ability to service debt because the excluded charges do not have an impact on its prospective debt servicing capability and these adjustments are contemplated in its credit facility for the computation of its debt covenant ratios. Free Cash Flow, defined as Adjusted EBITDA less cash portion of interest expense net of interest income, capital expenditures, and cash taxes, is used to evaluate operating effectiveness and decisions regarding the allocation of resources. However, Adjusted Income, Adjusted EBITDA, Free Cash Flow, Adjusted Net Income and Adjusted Net Income Per Share should be considered as a supplement to, not a substitute for, operating income, net income or other financial performance measures prepared in accordance with U.S. generally accepted accounting principles. See Appendix for non-GAAP reconciliations. Forward Looking Statements and Non-GAAP Financial Measures
�
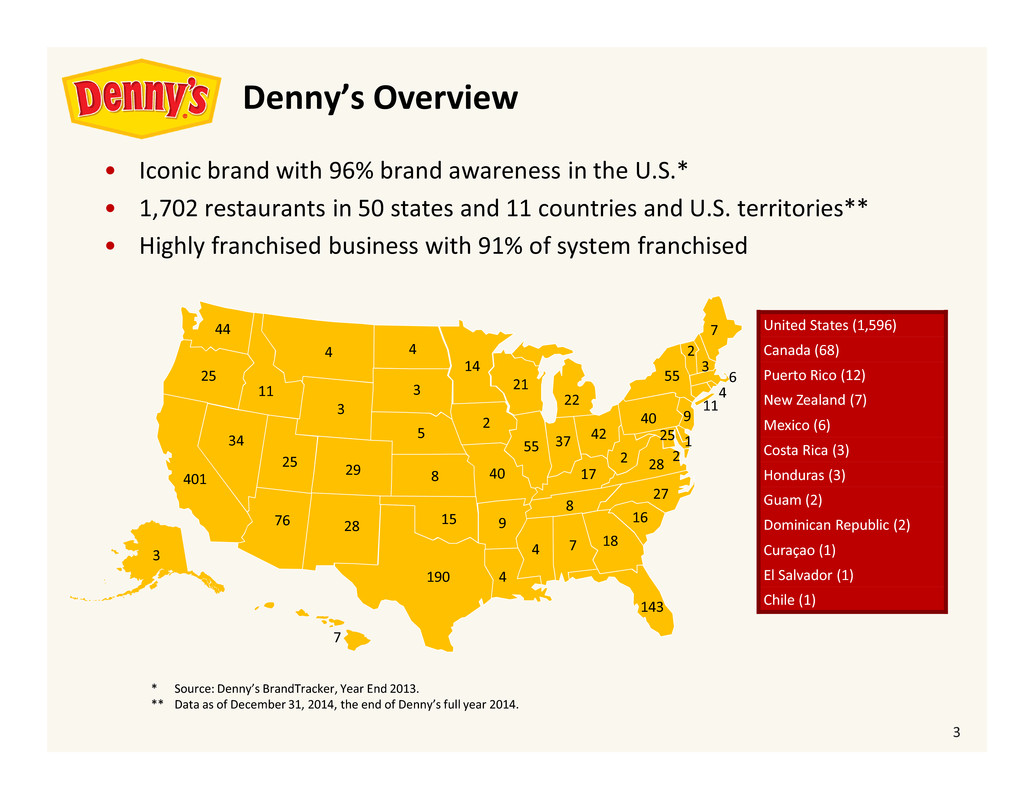
3 United States (1,596) Canada (68) Puerto Rico (12) New Zealand (7) Mexico (6) Costa Rica (3) Honduras (3) Guam (2) Dominican Republic (2) Cura�ao (1) El Salvador (1) Chile (1) Dennys Overview " Iconic brand with 96% brand awareness in the U.S.* " 1,702 restaurants in 50 states and 11 countries and U.S. territories** " Highly franchised business with 91% of system franchised 401 3 7 25 44 190 2876 34 11 4 3 2925 15 8 5 3 4 14 2 40 9 4 4 7 18 143 16 27 8 21 55 17 22 37 42 40 2 28 55 7 9 25 1 2 3 11 4 6 * Source: Dennys BrandTracker, Year End 2013. ** Data as of December 31, 2014, the end of Dennys full year 2014. 2
�
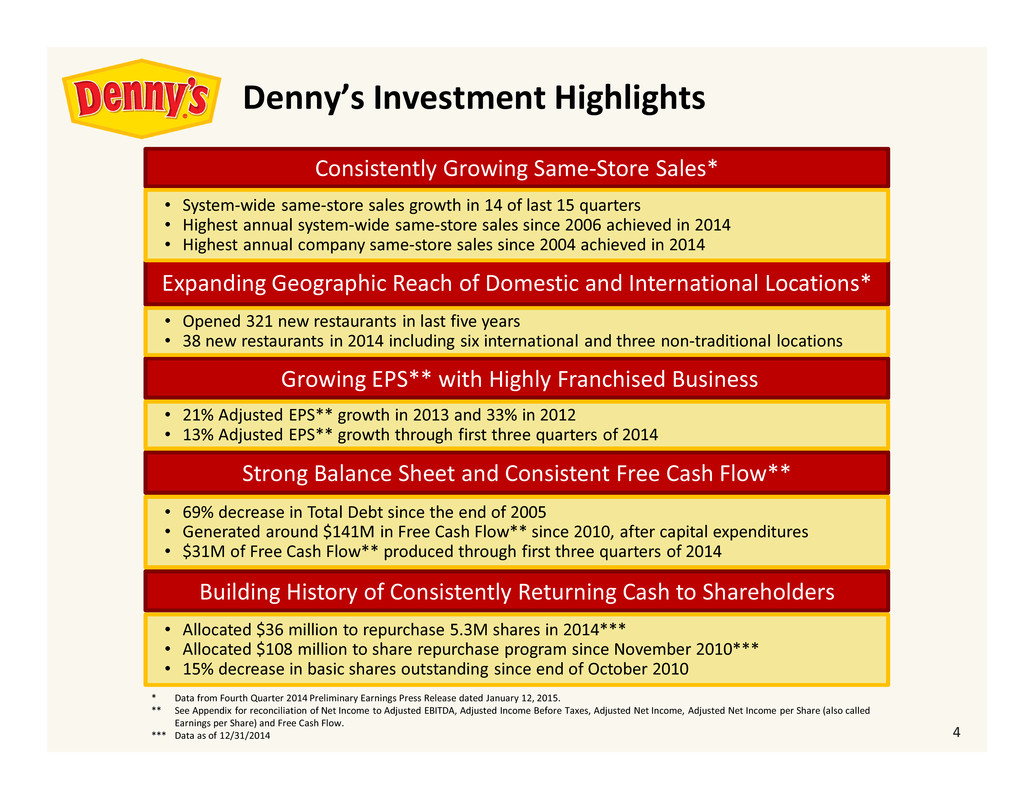
4 Dennys Investment Highlights Consistently Growing Same-Store Sales* Expanding Geographic Reach of Domestic and International Locations* Growing EPS** with Highly Franchised Business Strong Balance Sheet and Consistent Free Cash Flow** Building History of Consistently Returning Cash to Shareholders " System-wide same-store sales growth in 14 of last 15 quarters " Highest annual system-wide same-store sales since 2006 achieved in 2014 " Highest annual company same-store sales since 2004 achieved in 2014 " Opened 321 new restaurants in last five years " 38 new restaurants in 2014 including six international and three non-traditional locations " 69% decrease in Total Debt since the end of 2005 " Generated around $141M in Free Cash Flow** since 2010, after capital expenditures " $31M of Free Cash Flow** produced through first three quarters of 2014 " Allocated $36 million to repurchase 5.3M shares in 2014*** " Allocated $108 million to share repurchase program since November 2010*** " 15% decrease in basic shares outstanding since end of October 2010 " 21% Adjusted EPS** growth in 2013 and 33% in 2012 " 13% Adjusted EPS** growth through first three quarters of 2014 * Data from Fourth Quarter 2014 Preliminary Earnings Press Release dated January 12, 2015. ** See Appendix for reconciliation of Net Income to Adjusted EBITDA, Adjusted Income Before Taxes, Adjusted Net Income, Adjusted Net Income per Share (also called Earnings per Share) and Free Cash Flow. *** Data as of 12/31/2014
�
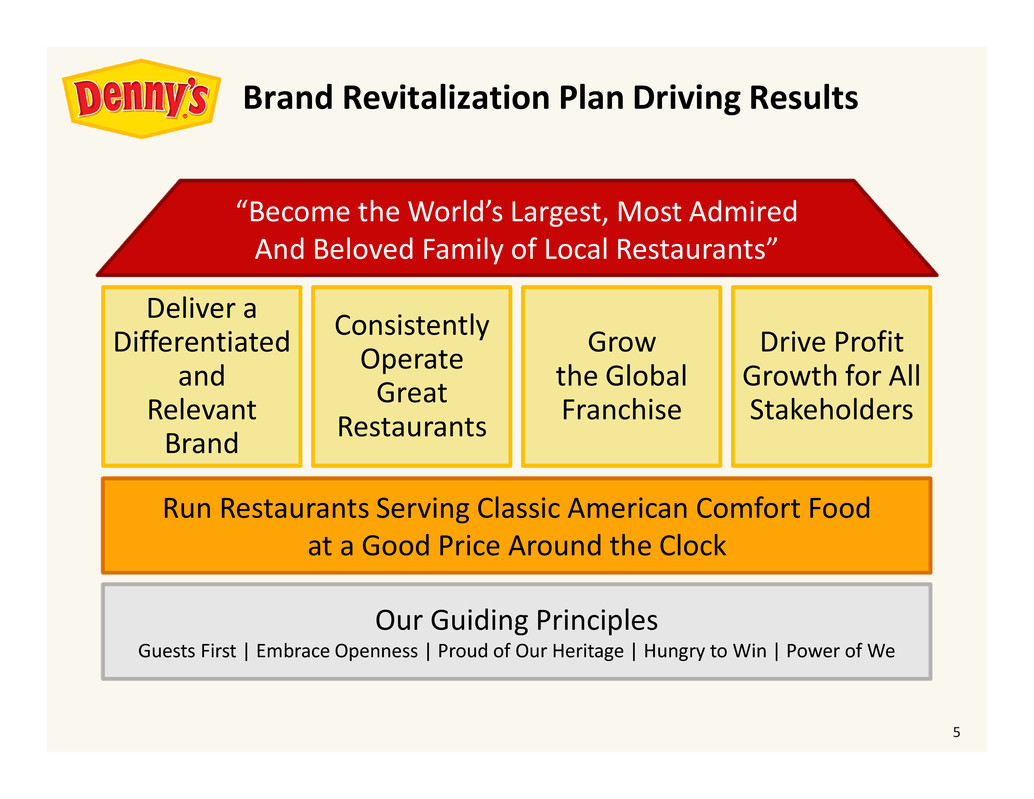
5 Brand Revitalization Plan Driving Results Drive Profit Growth for All Stakeholders Grow the Global Franchise Consistently Operate Great Restaurants Deliver a Differentiated and Relevant Brand
Become the Worlds Largest, Most Admired And Beloved Family of Local Restaurants
Run Restaurants Serving Classic American Comfort Food at a Good Price Around the Clock Our Guiding Principles Guests First | Embrace Openness | Proud of Our Heritage | Hungry to Win | Power of We
�
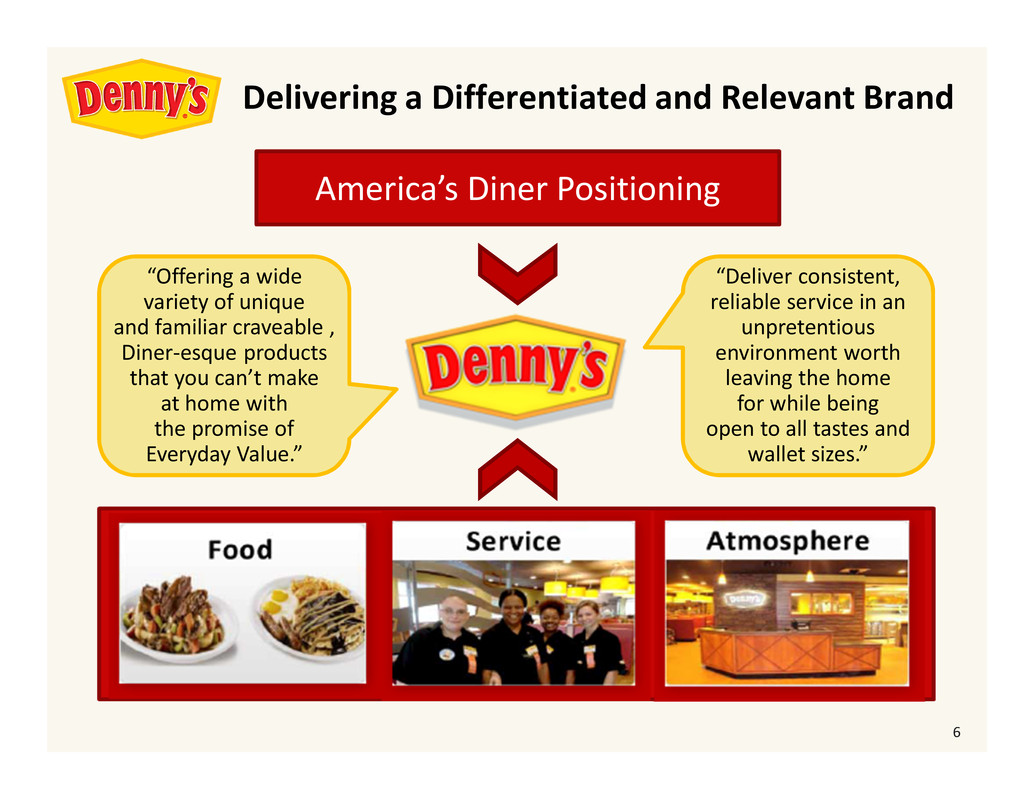
6
Offering a wide variety of unique and familiar craveable , Diner-esque products that you cant make at home with the promise of Everyday Value.
Americas Diner Positioning
Deliver consistent, reliable service in an unpretentious environment worth leaving the home for while being open to all tastes and wallet sizes.
Delivering a Differentiated and Relevant Brand
�

7
Brand Anthem Holiday
Commercial YouTube Video Link https://www.youtube.com/watch?v=OReMLPCOK-w
�
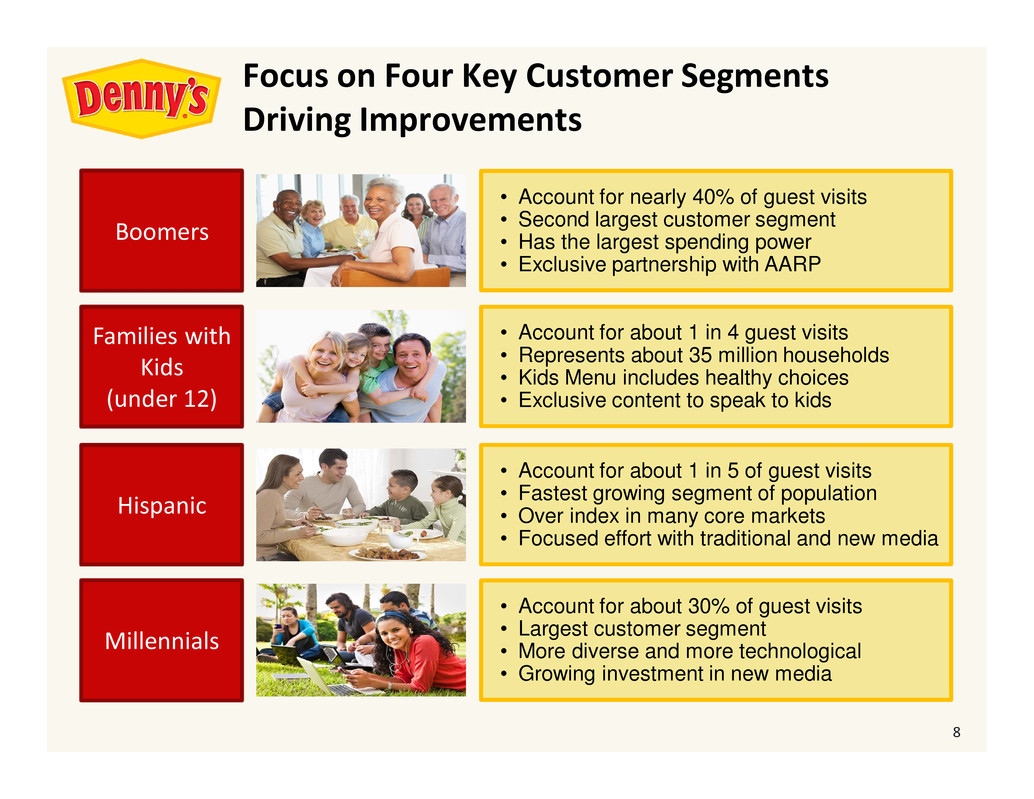
8 Hispanic Focus on Four Key Customer Segments Driving Improvements Families with Kids (under 12) Boomers Millennials " Account for about 1 in 5 of guest visits " Fastest growing segment of population " Over index in many core markets " Focused effort with traditional and new media " Account for about 1 in 4 guest visits " Represents about 35 million households " Kids Menu includes healthy choices " Exclusive content to speak to kids " Account for nearly 40% of guest visits " Second largest customer segment " Has the largest spending power " Exclusive partnership with AARP " Account for about 30% of guest visits " Largest customer segment " More diverse and more technological " Growing investment in new media
�

9
The Grand Slams Booth vs. Counter
Video YouTube Video Link https://www.youtube.com/watch?v=nf5uFqMWpIk
�
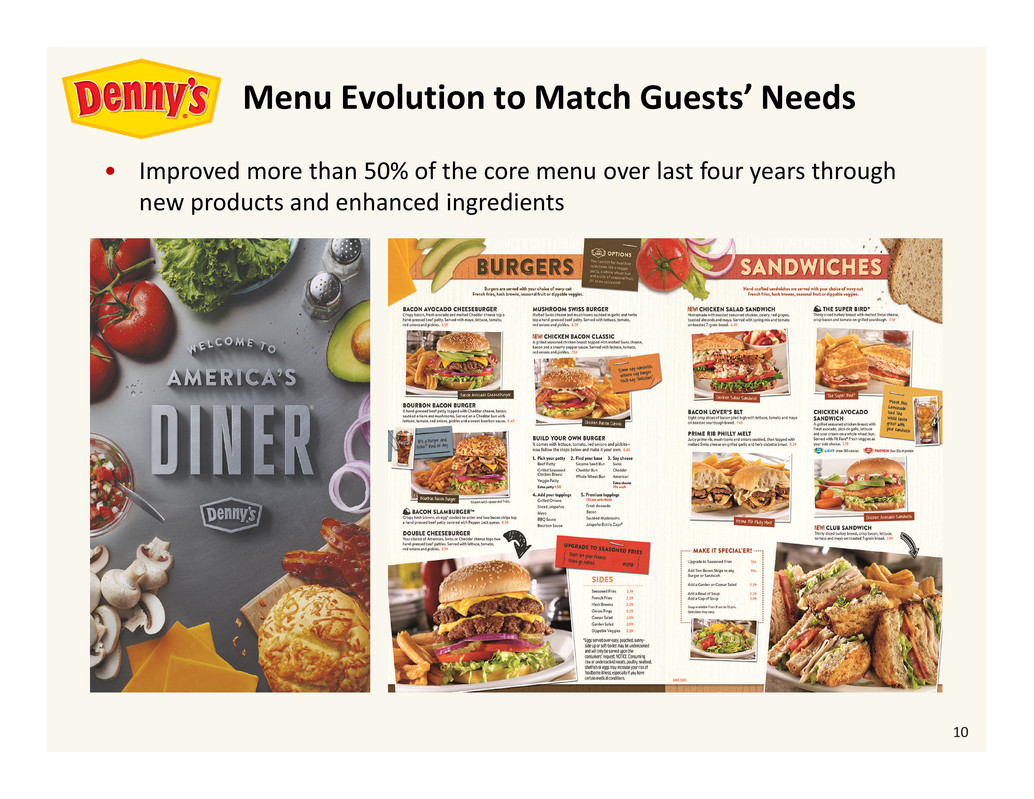
10 Menu Evolution to Match Guests Needs " Improved more than 50% of the core menu over last four years through new products and enhanced ingredients
�
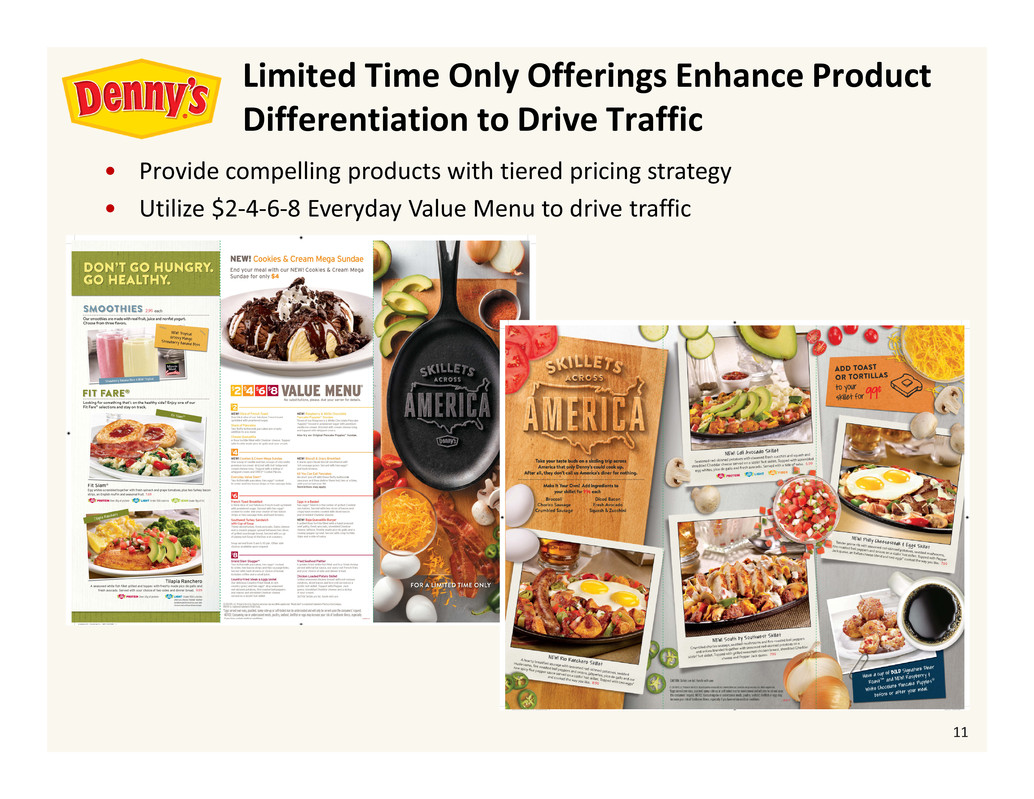
11 " Provide compelling products with tiered pricing strategy " Utilize $2-4-6-8 Everyday Value Menu to drive traffic Limited Time Only Offerings Enhance Product Differentiation to Drive Traffic
�

12
Roaring Skillets
Commercial YouTube Video Link https://www.youtube.com/watch?v=jAeSh15xeuU
�
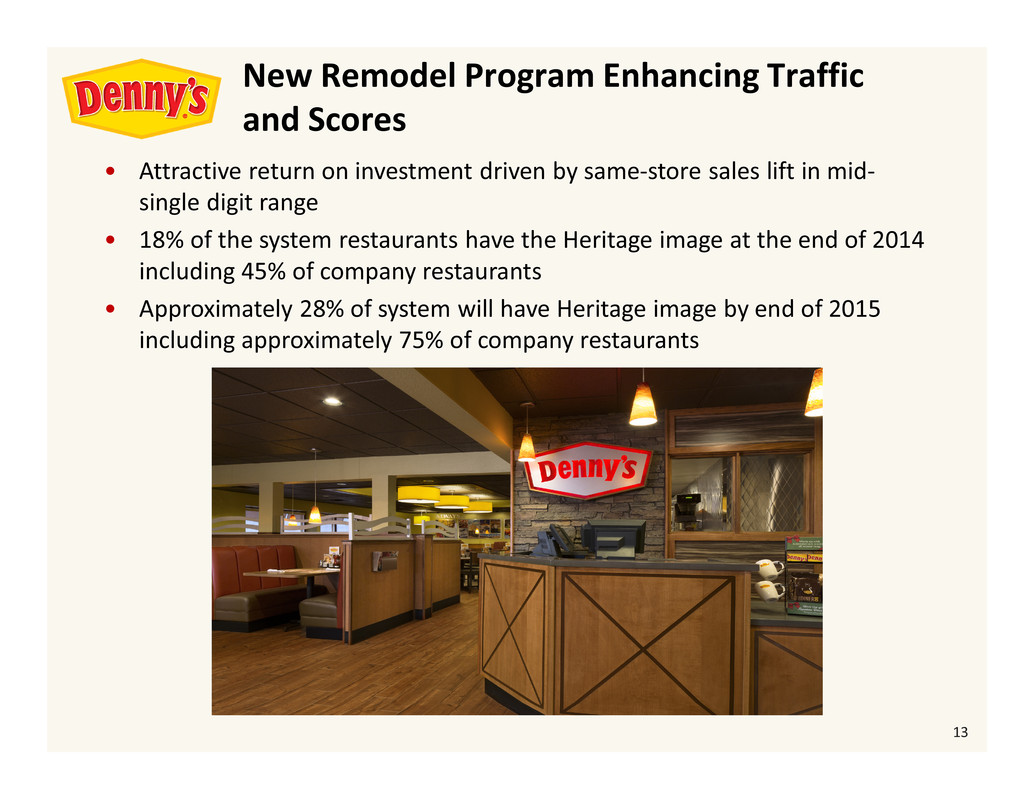
13 " Attractive return on investment driven by same-store sales lift in mid- single digit range " 18% of the system restaurants have the Heritage image at the end of 2014 including 45% of company restaurants " Approximately 28% of system will have Heritage image by end of 2015 including approximately 75% of company restaurants New Remodel Program Enhancing Traffic and Scores
�
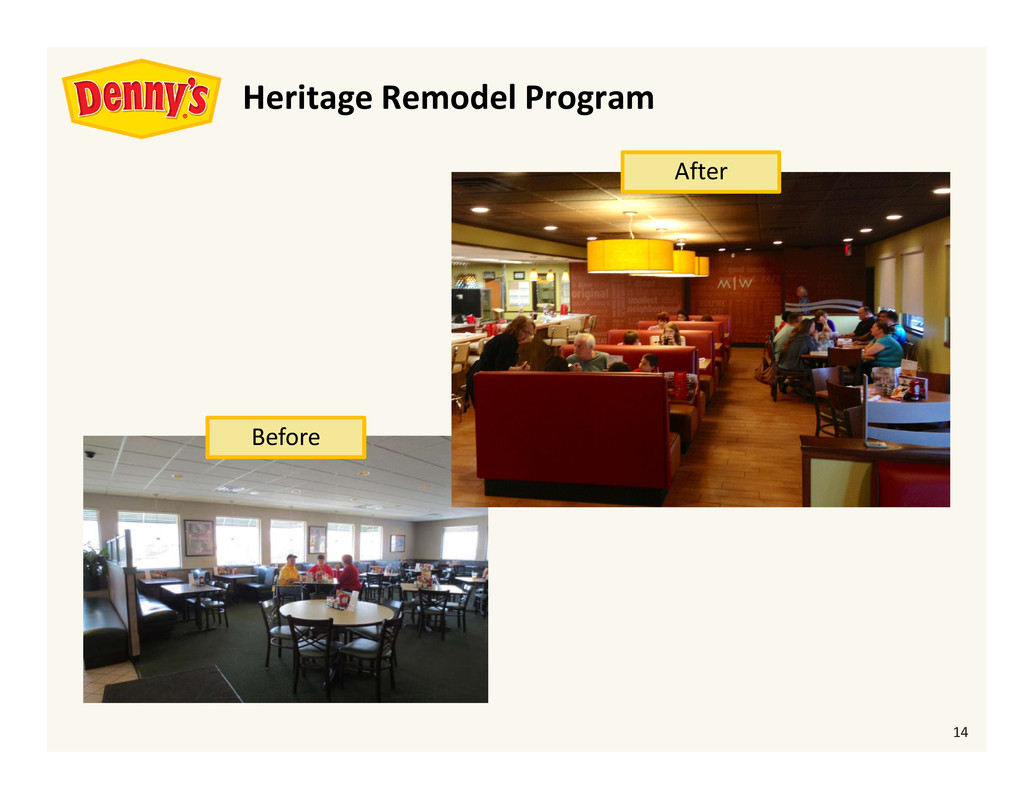
14 Before After Heritage Remodel Program
�
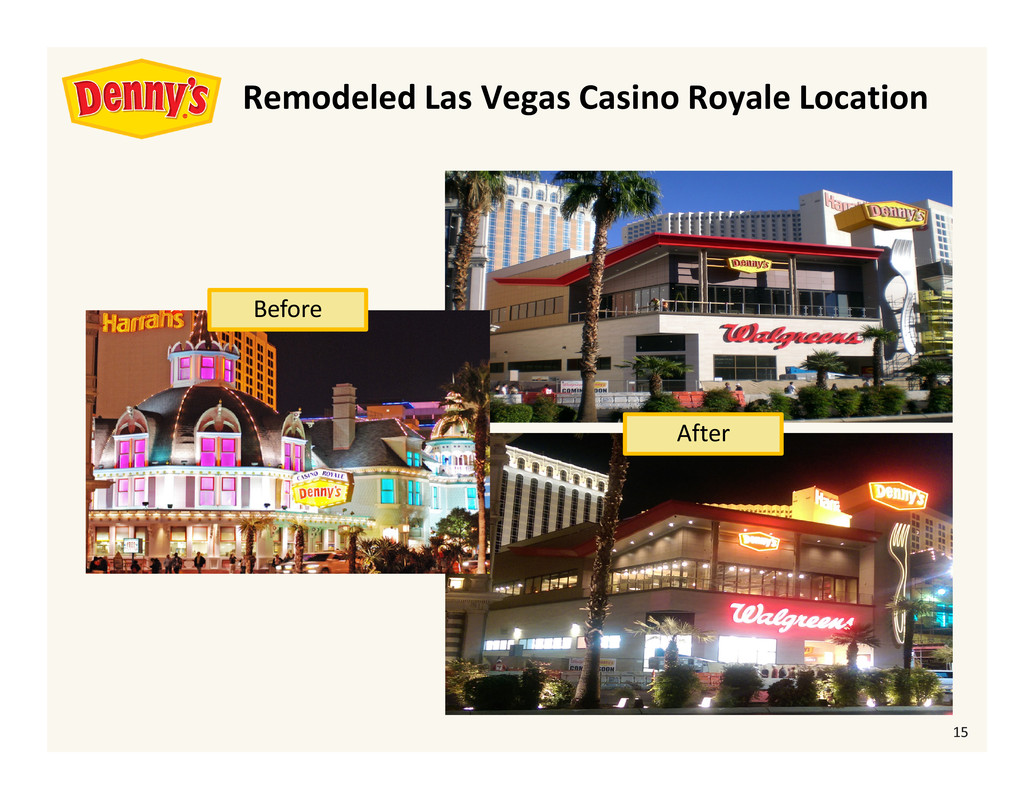
15 Remodeled Las Vegas Casino Royale Location Before After
�
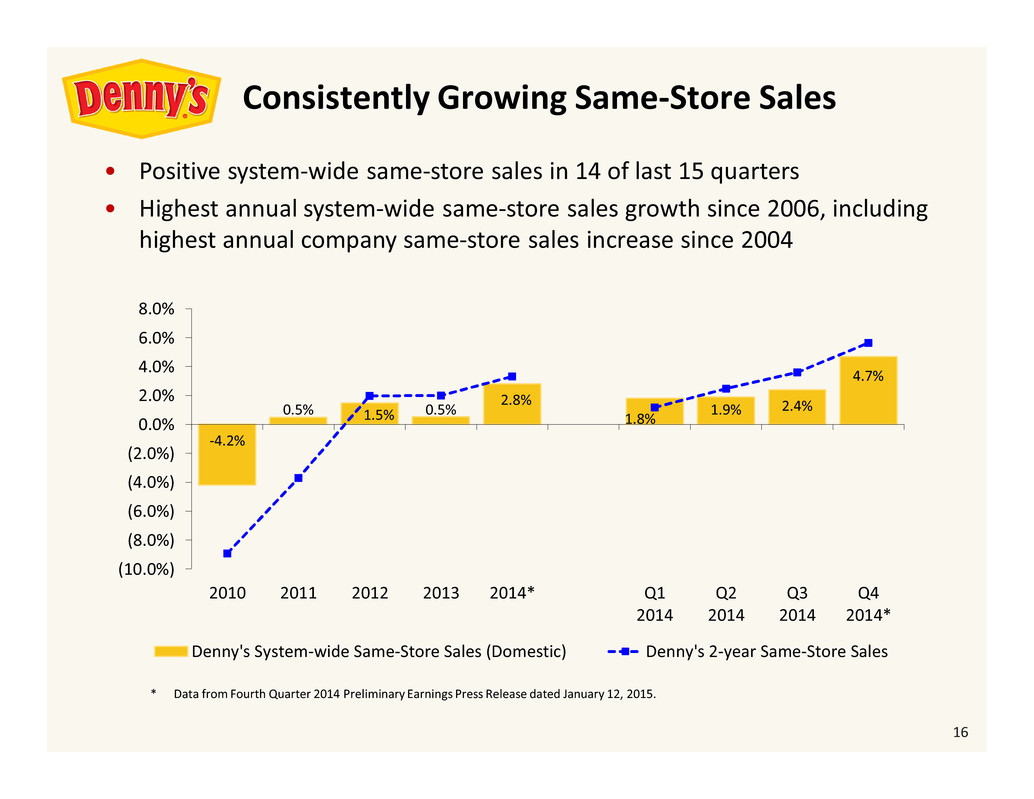
16 -4.2% 0.5% 1.5% 0.5% 2.8% 1.8% 1.9% 2.4% 4.7% (10.0%) (8.0%) (6.0%) (4.0%) (2.0%) 0.0% 2.0% 4.0% 6.0% 8.0% 2010 2011 2012 2013 2014* Q1 2014 Q2 2014 Q3 2014 Q4 2014* Denny's System-wide Same-Store Sales (Domestic) Denny's 2-year Same-Store Sales " Positive system-wide same-store sales in 14 of last 15 quarters " Highest annual system-wide same-store sales growth since 2006, including highest annual company same-store sales increase since 2004 Consistently Growing Same-Store Sales * Data from Fourth Quarter 2014 Preliminary Earnings Press Release dated January 12, 2015.
�
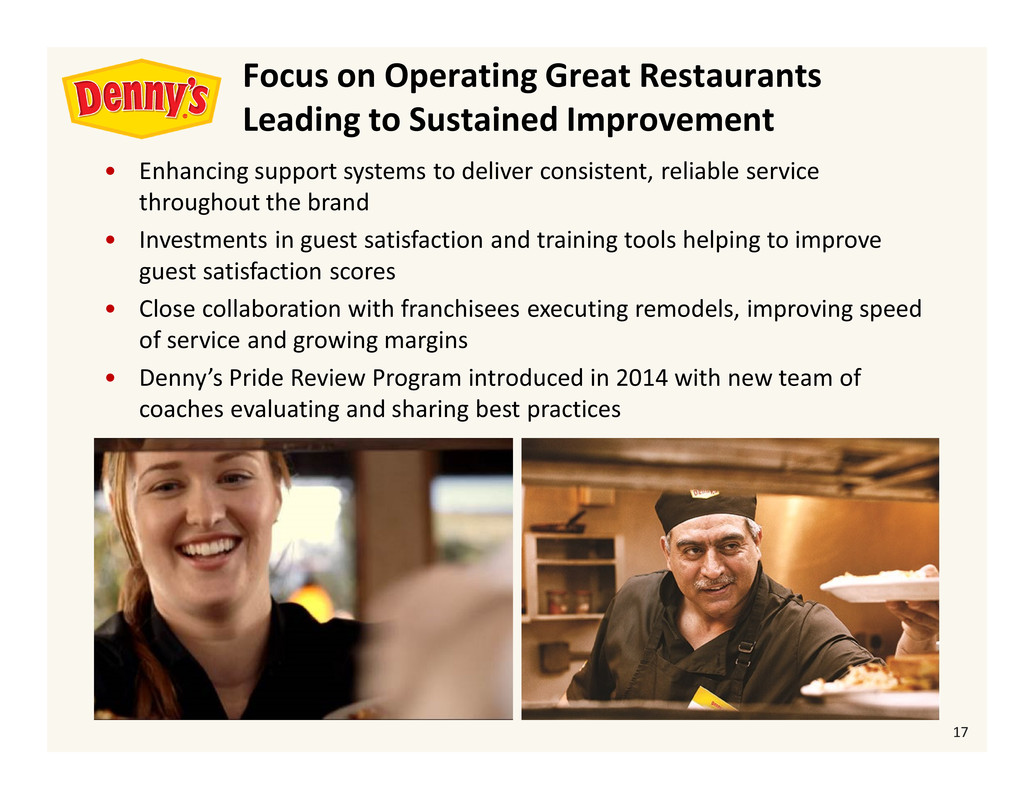
17 " Enhancing support systems to deliver consistent, reliable service throughout the brand " Investments in guest satisfaction and training tools helping to improve guest satisfaction scores " Close collaboration with franchisees executing remodels, improving speed of service and growing margins " Dennys Pride Review Program introduced in 2014 with new team of coaches evaluating and sharing best practices Focus on Operating Great Restaurants Leading to Sustained Improvement
�
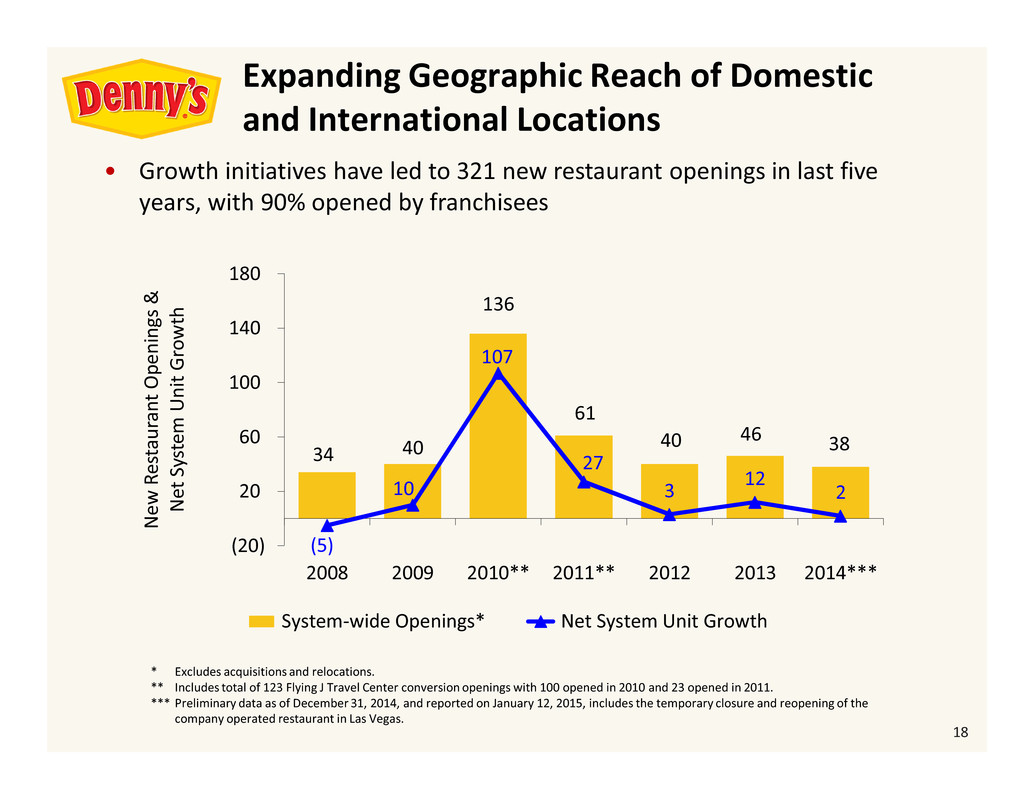
18 " Growth initiatives have led to 321 new restaurant openings in last five years, with 90% opened by franchisees 34 40 136 61 40 46 38 (5) 10 107 27 3 12 2 (20) 20 60 100 140 180 2008 2009 2010** 2011** 2012 2013 2014*** N e w R e s t a u r a n t O p e n i n g s & N e t S y s t e m U n i t G r o w t h System-wide Openings* Net System Unit Growth * Excludes acquisitions and relocations. ** Includes total of 123 Flying J Travel Center conversion openings with 100 opened in 2010 and 23 opened in 2011. *** Preliminary data as of December 31, 2014, and reported on January 12, 2015, includes the temporary closure and reopening of the company operated restaurant in Las Vegas. Expanding Geographic Reach of Domestic and International Locations
�
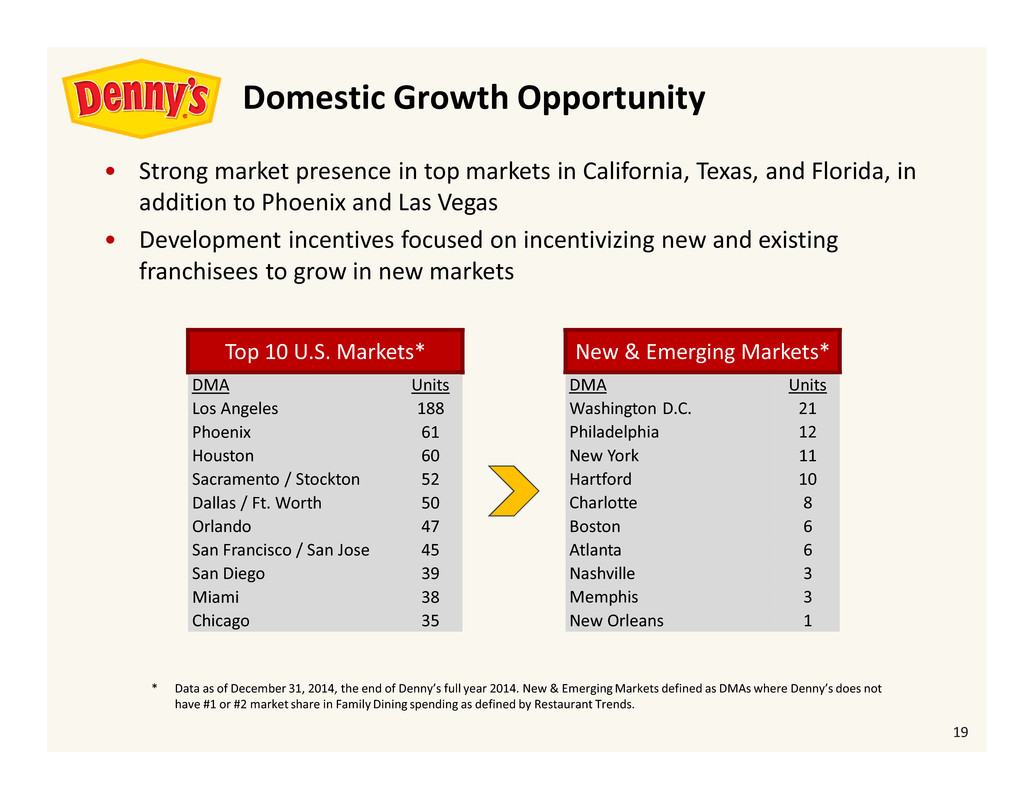
19 " Strong market presence in top markets in California, Texas, and Florida, in addition to Phoenix and Las Vegas " Development incentives focused on incentivizing new and existing franchisees to grow in new markets New & Emerging Markets* DMA Units Washington D.C. 21 Philadelphia 12 New York 11 Hartford 10 Charlotte 8 Boston 6 Atlanta 6 Nashville 3 Memphis 3 New Orleans 1 Domestic Growth Opportunity * Data as of December 31, 2014, the end of Dennys full year 2014. New & Emerging Markets defined as DMAs where Dennys does not have #1 or #2 market share in Family Dining spending as defined by Restaurant Trends. Top 10 U.S. Markets* DMA Units Los Angeles 188 Phoenix 61 Houston 60 Sacramento / Stockton 52 Dallas / Ft. Worth 50 Orlando 47 San Francisco / San Jose 45 San Diego 39 Miami 38 Chicago 35
�
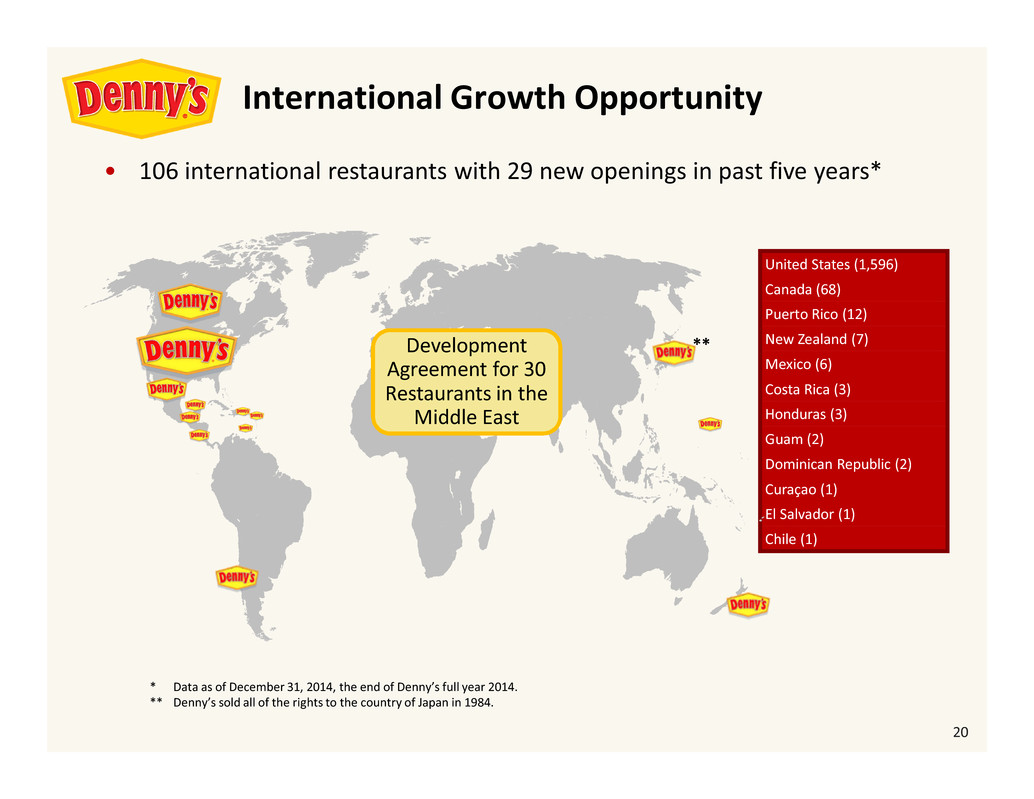
20 " 106 international restaurants with 29 new openings in past five years* United States (1,596) Canada (68) Puerto Rico (12) New Zealand (7) Mexico (6) Costa Rica (3) Honduras (3) Guam (2) Dominican Republic (2) Cura�ao (1) El Salvador (1) Chile (1) * Data as of December 31, 2014, the end of Dennys full year 2014. ** Dennys sold all of the rights to the country of Japan in 1984. **Development Agreement for 30 Restaurants in the Middle East International Growth Opportunity
�
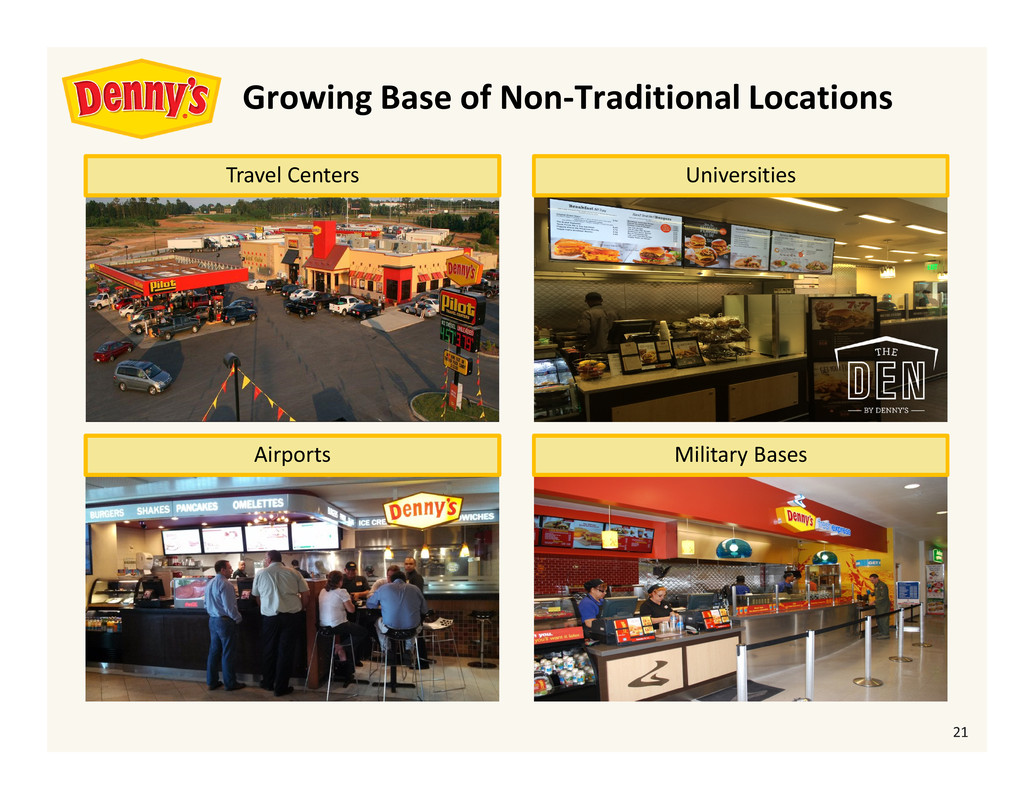
21 Travel Centers Airports Universities Military Bases Growing Base of Non-Traditional Locations
�
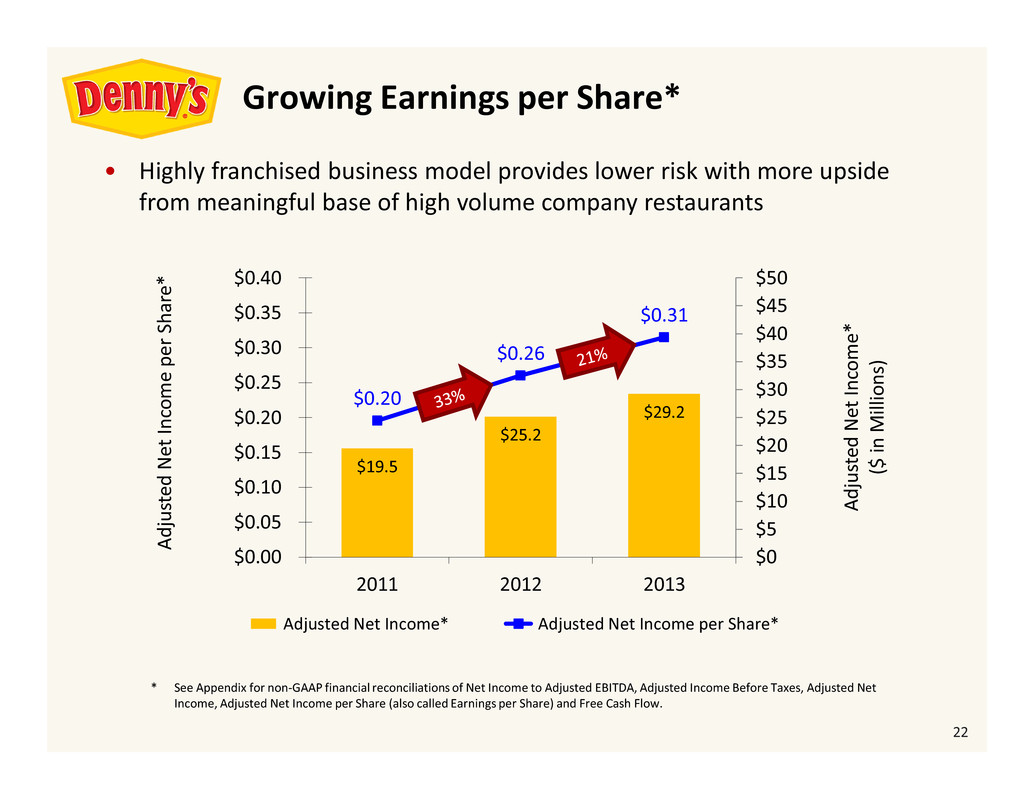
22 $19.5 $25.2 $29.2 $0.20 $0.26 $0.31 $0 $5 $10 $15 $20 $25 $30 $35 $40 $45 $50 $0.00 $0.05 $0.10 $0.15 $0.20 $0.25 $0.30 $0.35 $0.40 2011 2012 2013 A d j u s t e d N e t I n c o m e * ( $ i n M i l l i o n s ) A d j u s t e d N e t I n c o m e p e r S h a r e * Adjusted Net Income* Adjusted Net Income per Share* * See Appendix for non-GAAP financial reconciliations of Net Income to Adjusted EBITDA, Adjusted Income Before Taxes, Adjusted Net Income, Adjusted Net Income per Share (also called Earnings per Share) and Free Cash Flow. " Highly franchised business model provides lower risk with more upside from meaningful base of high volume company restaurants Growing Earnings per Share*
�
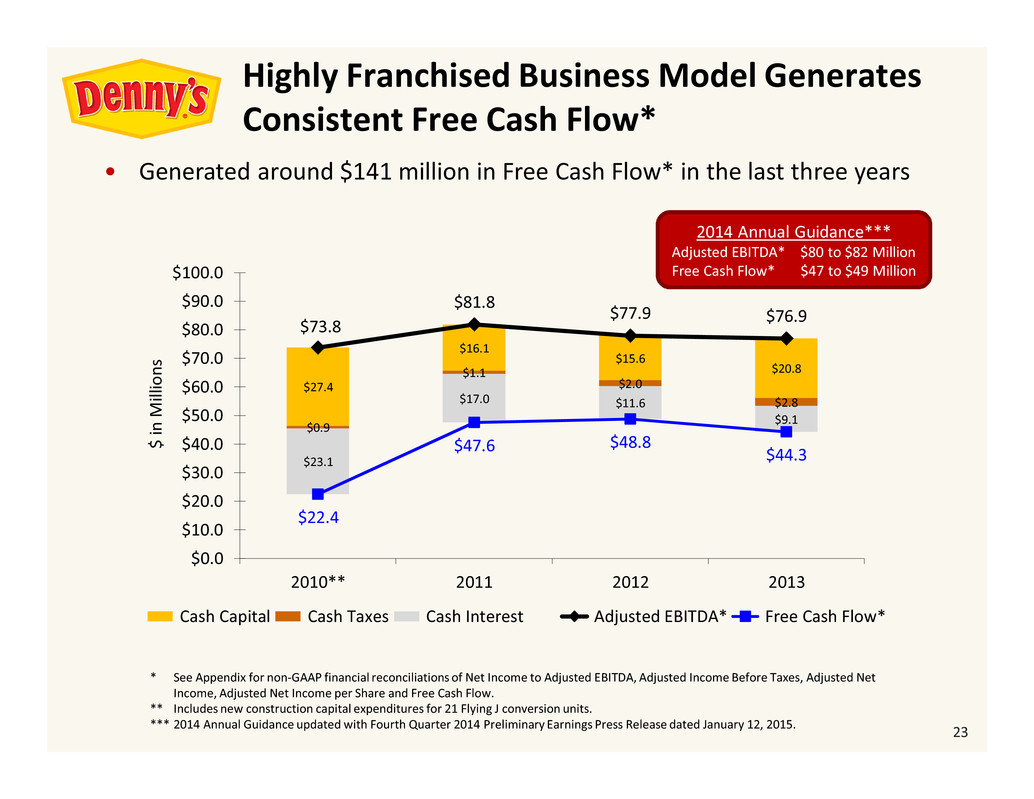
23 " Generated around $141 million in Free Cash Flow* in the last three years * See Appendix for non-GAAP financial reconciliations of Net Income to Adjusted EBITDA, Adjusted Income Before Taxes, Adjusted Net Income, Adjusted Net Income per Share and Free Cash Flow. ** Includes new construction capital expenditures for 21 Flying J conversion units. *** 2014 Annual Guidance updated with Fourth Quarter 2014 Preliminary Earnings Press Release dated January 12, 2015. $23.1 $17.0 $11.6 $9.1 $0.9 $1.1 $2.0 $2.8 $27.4 $16.1 $15.6 $20.8 $73.8 $81.8 $77.9 $76.9 $22.4 $47.6 $48.8 $44.3 $0.0 $10.0 $20.0 $30.0 $40.0 $50.0 $60.0 $70.0 $80.0 $90.0 $100.0 2010** 2011 2012 2013 $ i n M i l l i o n s Cash Capital Cash Taxes Cash Interest Adjusted EBITDA* Free Cash Flow* 2014 Annual Guidance*** Adjusted EBITDA* $80 to $82 Million Free Cash Flow* $47 to $49 Million Highly Franchised Business Model Generates Consistent Free Cash Flow*
�
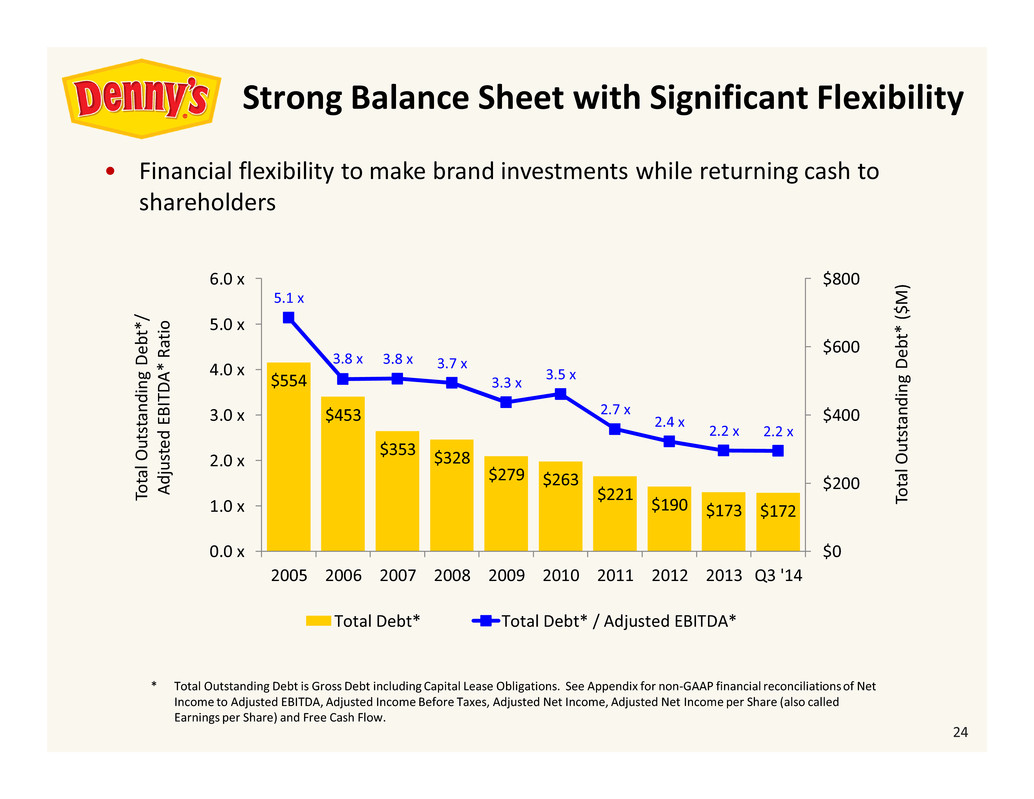
24 " Financial flexibility to make brand investments while returning cash to shareholders $554 $453 $353 $328 $279 $263 $221 $190 $173 $172 5.1 x 3.8 x 3.8 x 3.7 x 3.3 x 3.5 x 2.7 x 2.4 x 2.2 x 2.2 x 0.0 x 1.0 x 2.0 x 3.0 x 4.0 x 5.0 x 6.0 x 2005 2006 2007 2008 2009 2010 2011 2012 2013 Q3 '14 $0 $200 $400 $600 $800 T o t a l O u t s t a n d i n g D e b t * / A d j u s t e d E B I T D A * R a t i o T o t a l O u t s t a n d i n g D e b t * ( $ M ) Total Debt* Total Debt* / Adjusted EBITDA* * Total Outstanding Debt is Gross Debt including Capital Lease Obligations. See Appendix for non-GAAP financial reconciliationsof Net Income to Adjusted EBITDA, Adjusted Income Before Taxes, Adjusted Net Income, Adjusted Net Income per Share (also called Earnings per Share) and Free Cash Flow. Strong Balance Sheet with Significant Flexibility
�
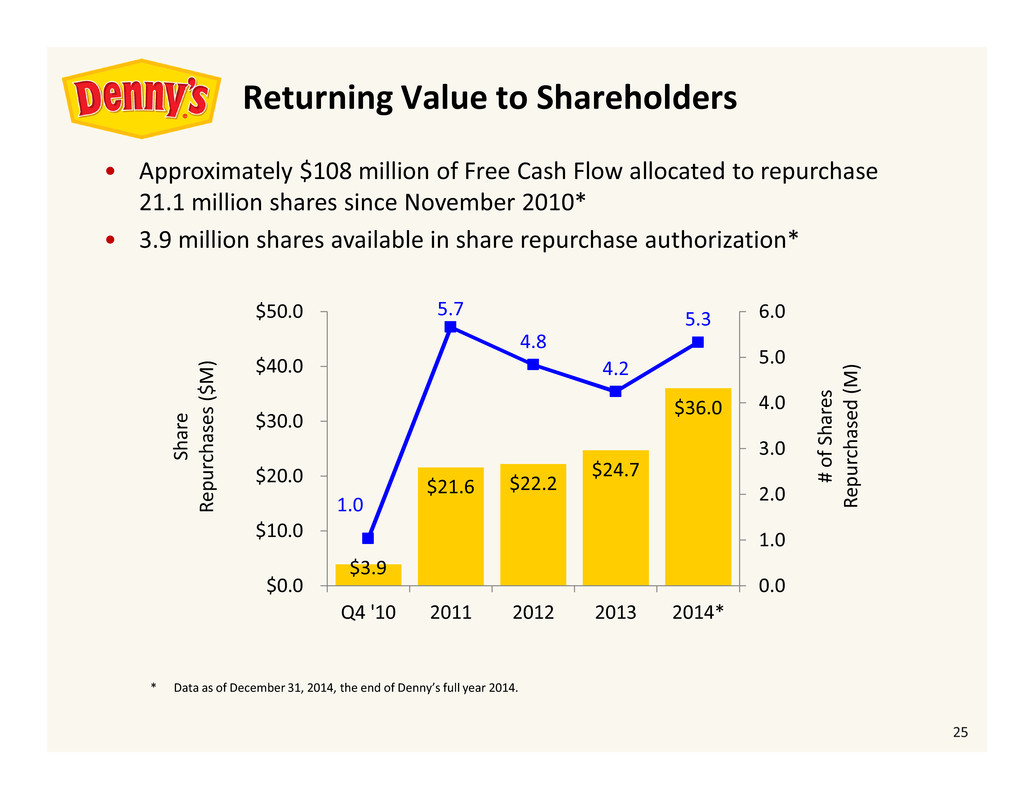
25 " Approximately $108 million of Free Cash Flow allocated to repurchase 21.1 million shares since November 2010* " 3.9 million shares available in share repurchase authorization* $3.9 $21.6 $22.2 $24.7 $36.0 1.0 5.7 4.8 4.2 5.3 0.0 1.0 2.0 3.0 4.0 5.0 6.0 Q4 '10 2011 2012 2013 2014* $0.0 $10.0 $20.0 $30.0 $40.0 $50.0 # o f S h a r e s R e p u r c h a s e d ( M ) S h a r e R e p u r c h a s e s ( $ M ) Returning Value to Shareholders * Data as of December 31, 2014, the end of Dennys full year 2014.
�
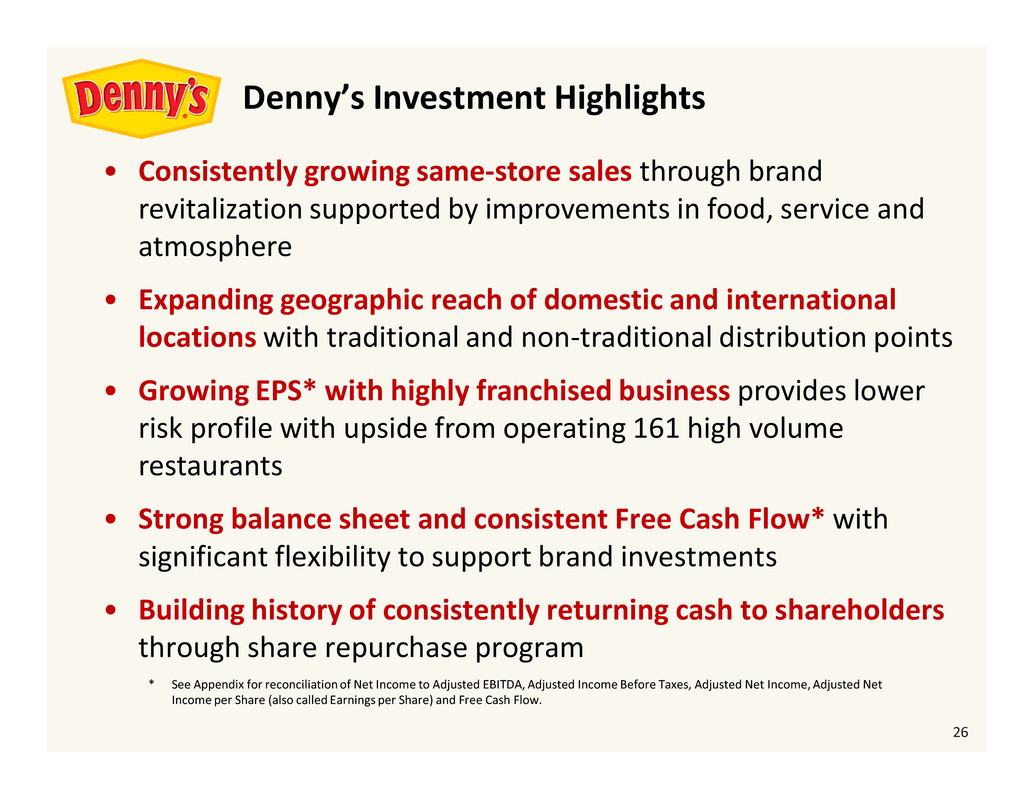
26 * See Appendix for reconciliation of Net Income to Adjusted EBITDA, Adjusted Income Before Taxes, Adjusted Net Income, Adjusted Net Income per Share (also called Earnings per Share) and Free Cash Flow. " Consistently growing same-store sales through brand revitalization supported by improvements in food, service and atmosphere " Expanding geographic reach of domestic and international locations with traditional and non-traditional distribution points " Growing EPS* with highly franchised business provides lower risk profile with upside from operating 161 high volume restaurants " Strong balance sheet and consistent Free Cash Flow* with significant flexibility to support brand investments " Building history of consistently returning cash to shareholders through share repurchase program Dennys Investment Highlights
�
WELCOME TO AMERICAS DINER� APPENDIX
�
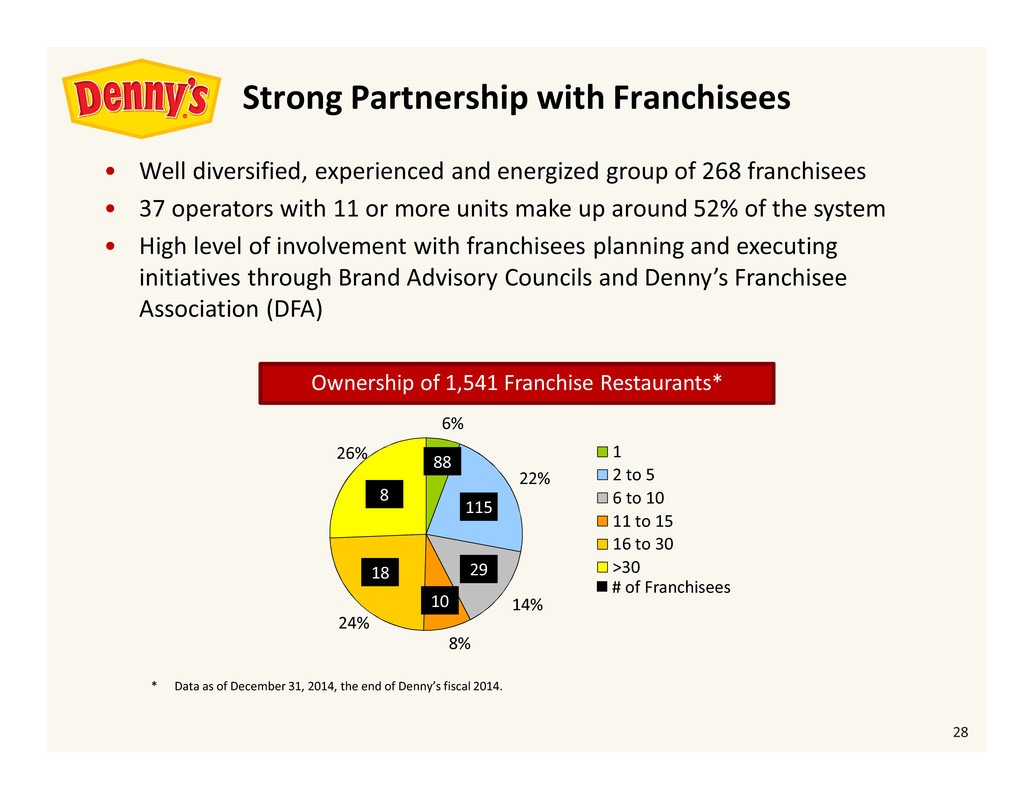
28 6% 22% 14% 8% 24% 26% 1 2 to 5 6 to 10 11 to 15 16 to 30 >3029 # of Franchisees 10 18 8 88 115 Ownership of 1,541 Franchise Restaurants* Strong Partnership with Franchisees " Well diversified, experienced and energized group of 268 franchisees " 37 operators with 11 or more units make up around 52% of the system " High level of involvement with franchisees planning and executing initiatives through Brand Advisory Councils and Dennys Franchisee Association (DFA) * Data as of December 31, 2014, the end of Dennys fiscal 2014.
�
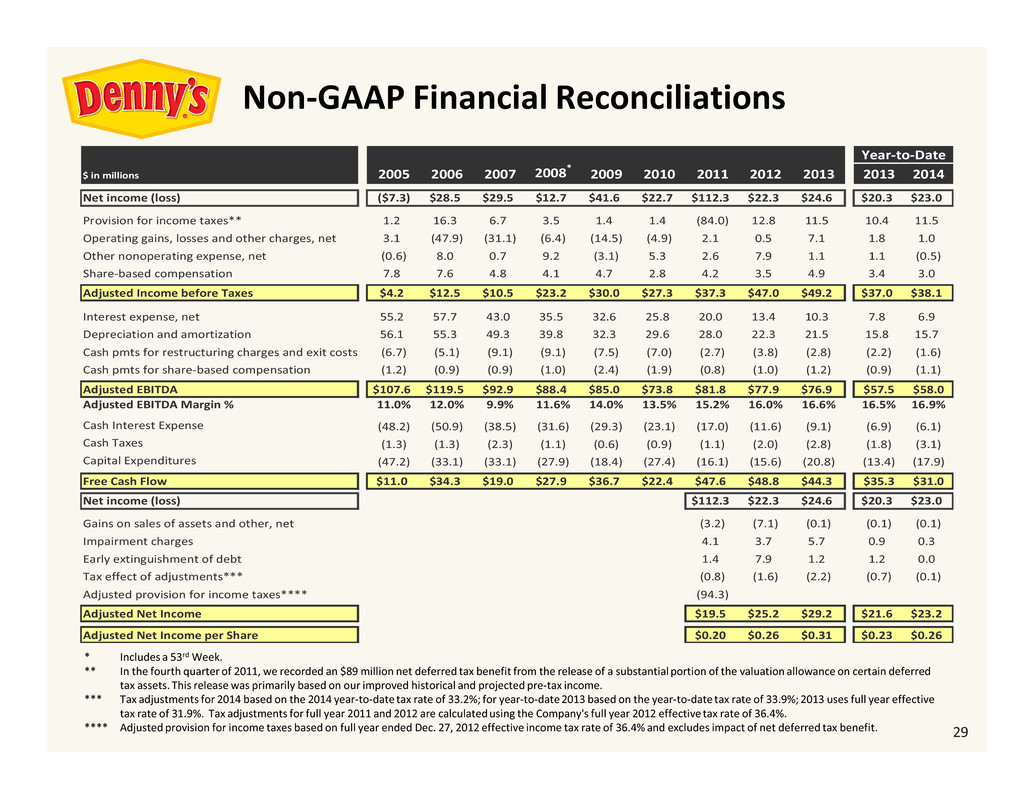
29 $ in millions 2005 2006 2007 2008* 2009 2010 2011 2012 2013 2013 2014 Net income (loss) ($7.3) $28.5 $29.5 $12.7 $41.6 $22.7 $112.3 $22.3 $24.6 $20.3 $23.0 Provision for income taxes** 1.2 16.3 6.7 3.5 1.4 1.4 (84.0) 12.8 11.5 10.4 11.5 Operating gains, losses and other charges, net 3.1 (47.9) (31.1) (6.4) (14.5) (4.9) 2.1 0.5 7.1 1.8 1.0 Other nonoperating expense, net (0.6) 8.0 0.7 9.2 (3.1) 5.3 2.6 7.9 1.1 1.1 (0.5) Share-based compensation 7.8 7.6 4.8 4.1 4.7 2.8 4.2 3.5 4.9 3.4 3.0 Adjusted Income before Taxes $4.2 $12.5 $10.5 $23.2 $30.0 $27.3 $37.3 $47.0 $49.2 $37.0 $38.1 Interest expense, net 55.2 57.7 43.0 35.5 32.6 25.8 20.0 13.4 10.3 7.8 6.9 Depreciation and amortization 56.1 55.3 49.3 39.8 32.3 29.6 28.0 22.3 21.5 15.8 15.7 Cash pmts for restructuring charges and exit costs (6.7) (5.1) (9.1) (9.1) (7.5) (7.0) (2.7) (3.8) (2.8) (2.2) (1.6) Cash pmts for share-based compensation (1.2) (0.9) (0.9) (1.0) (2.4) (1.9) (0.8) (1.0) (1.2) (0.9) (1.1) Adjusted EBITDA $107.6 $119.5 $92.9 $88.4 $85.0 $73.8 $81.8 $77.9 $76.9 $57.5 $58.0 Adjusted EBITDA Margin % 11.0% 12.0% 9.9% 11.6% 14.0% 13.5% 15.2% 16.0% 16.6% 16.5% 16.9% Cash Interest Expense (48.2) (50.9) (38.5) (31.6) (29.3) (23.1) (17.0) (11.6) (9.1) (6.9) (6.1) Cash Taxes (1.3) (1.3) (2.3) (1.1) (0.6) (0.9) (1.1) (2.0) (2.8) (1.8) (3.1) Capital Expenditures (47.2) (33.1) (33.1) (27.9) (18.4) (27.4) (16.1) (15.6) (20.8) (13.4) (17.9) Free Cash Flow $11.0 $34.3 $19.0 $27.9 $36.7 $22.4 $47.6 $48.8 $44.3 $35.3 $31.0 Net income (loss) $112.3 $22.3 $24.6 $20.3 $23.0 Gains on sales of assets and other, net (3.2) (7.1) (0.1) (0.1) (0.1) Impairment charges 4.1 3.7 5.7 0.9 0.3 Early extinguishment of debt 1.4 7.9 1.2 1.2 0.0 Tax effect of adjustments*** (0.8) (1.6) (2.2) (0.7) (0.1) Adjusted provision for income taxes**** (94.3) Adjusted Net Income $19.5 $25.2 $29.2 $21.6 $23.2 Adjusted Net Income per Share $0.20 $0.26 $0.31 $0.23 $0.26 Year-to-Date * Includes a 53rd Week. ** In the fourth quarter of 2011, we recorded an $89 million net deferred tax benefit from the release of a substantial portion of the valuation allowance on certain deferred tax assets. This release was primarily based on our improved historical and projected pre-tax income. *** Tax adjustments for 2014 based on the 2014 year-to-date tax rate of 33.2%; for year-to-date 2013 based on the year-to-date tax rate of 33.9%; 2013 uses full year effective tax rate of 31.9%. Tax adjustments for full year 2011 and 2012 are calculated using the Company's full year 2012 effective tax rate of 36.4%. **** Adjusted provision for income taxes based on full year ended Dec. 27, 2012 effective income tax rate of 36.4% and excludes impact of net deferred tax benefit. Non-GAAP Financial Reconciliations
�
Serious News for Serious Traders! Try StreetInsider.com Premium Free!
You May Also Be Interested In
- Solana Price Prediction: Alpenglow Is Scheduled for October 21 as Remittix Prepares Its November 24 Token Debut
- Norsk Hydro: Reminder - Invitation to Hydro's third quarter results 2026
- Advantech Partners with DEKRA, Signing MOU to Strengthen Global Industrial Cybersecurity Compliance in Response to EU CRA
Create E-mail Alert Related Categories
SEC FilingsSign up for StreetInsider Free!
Receive full access to all new and archived articles, unlimited portfolio tracking, e-mail alerts, custom newswires and RSS feeds - and more!
