

Form 8-K CROWN CASTLE INTERNATION For: Jul 20
 Tweet
Tweet Share
ShareExhibit 99.1
 | NEWS RELEASE July 20, 2022 | |||||||
| Contacts: Dan Schlanger, CFO | |||||
| Ben Lowe, SVP & Treasurer | |||||
| FOR IMMEDIATE RELEASE | Crown Castle International Corp. | ||||
713-570-3050 | |||||
CROWN CASTLE REPORTS SECOND QUARTER 2022 RESULTS AND UPDATES OUTLOOK FOR FULL YEAR 2022
July 20, 2022 - HOUSTON, TEXAS - Crown Castle International Corp. (NYSE: CCI) ("Crown Castle") today reported results for the second quarter ended June 30, 2022 and updated its full year 2022 outlook to reflect improving operating conditions offset by increasing interest expense.
| (dollars in millions, except per share amounts) | Current Full Year 2022 Outlook(a) | Full Year 2021 Actual | % Change | Previous Full Year 2022 Outlook(b) | Current Compared to Previous Outlook | ||||||||||||
| Site rental revenues | $6,265 | $5,719 | 10% | $6,265 | $— | ||||||||||||
| Income (loss) from continuing operations | $1,694 | $1,158(c) | 46% | $1,714 | -$20 | ||||||||||||
| Income (loss) from continuing operations per share—diluted | $3.90 | $2.67(c) | 46% | $3.94 | -$0.04 | ||||||||||||
Adjusted EBITDA(d) | $4,352 | $3,816 | 14% | $4,332 | +$20 | ||||||||||||
AFFO(d) | $3,201 | $3,013 | 6% | $3,201 | $— | ||||||||||||
AFFO per share(d) | $7.36 | $6.95 | 6% | $7.36 | $— | ||||||||||||
(a)Reflects midpoint of full year 2022 Outlook as issued on July 20, 2022.
(b)Reflects midpoint of full year 2022 Outlook as issued on April 20, 2022.
(c)Does not reflect the impact related to the ATO Settlement (as defined in the Form 8-K filed with the Securities and Exchange Commission on April 26, 2021 ("April 2021 8-K"), which is attributable to discontinued operations in the first quarter of 2021 as discussed in the April 2021 8-K.
(d)See "Non-GAAP Financial Measures, Segment Measures and Other Calculations" for further information and reconciliation of non-GAAP financial measures to income (loss) from continuing operations, as computed in accordance with GAAP.
"We delivered another solid quarter of growth in the second quarter and once again increased our operating expectations for the full year 2022," stated Jay Brown, Crown Castle’s Chief Executive Officer. "Consistent with the last couple of decades, it is clear to us that the U.S. represents the highest growth and lowest risk market in the world for communications infrastructure ownership. We are busy supporting our customers as they have begun to upgrade their existing cell sites and deploy thousands of new sites on our macro towers as part of the first phase of the 5G build out, which drove 6% organic revenue growth in our Towers segment through the first half of this year. At the same time, 2022 represents an important transition year for our small cells and fiber business as we prepare to double the rate of expected small cell deployments next year when compared to the approximately 5,000 small cell nodes we expect to deploy this year. We believe our comprehensive offering of 40,000 towers, 115,000 small cells on air or under contract and 85,000 route miles of fiber provides shareholders with the most exposure to the development of next-generation wireless networks in the best market in the world and extends our opportunity to create value for our shareholders by delivering long-term annual dividend per share growth of 7% to 8%."
The pathway to possible.
CrownCastle.com
| News Release continued: | Page 2 | |||||||
RESULTS FOR THE QUARTER
The table below sets forth select financial results for the quarter ended June 30, 2022 and June 30, 2021.
| (dollars in millions, except per share amounts) | Q2 2022 | Q2 2021 | Change | Change % | ||||||||||
| Site rental revenues | $1,567 | $1,425 | $142 | 10% | ||||||||||
| Income (loss) from continuing operations | $421 | $333 | $88 | 26% | ||||||||||
| Income (loss) from continuing operations per share—diluted | $0.97 | $0.77 | $0.20 | 26% | ||||||||||
Adjusted EBITDA(a) | $1,078 | $958 | $120 | 13% | ||||||||||
AFFO(a) | $783 | $741 | $42 | 6% | ||||||||||
AFFO per share(a) | $1.80 | $1.71 | $0.09 | 5% | ||||||||||
(a)See "Non-GAAP Financial Measures, Segment Measures and Other Calculations" for further information and reconciliation of non-GAAP financial measures to income (loss) from continuing operations, as computed in accordance with GAAP.
HIGHLIGHTS FROM THE QUARTER
•Site rental revenues. Site rental revenues grew 10%, or $142 million, from second quarter 2021 to second quarter 2022, inclusive of approximately $58 million in Organic Contribution to Site Rental Billings and a $75 million increase in straight-lined revenues. The $58 million in Organic Contribution to Site Rental Billings represents approximately 4.7% growth, comprised of approximately 7.8% growth from core leasing activity and contracted tenant escalations, net of approximately 3.1% from tenant non-renewals.
•Income from continuing operations. Income from continuing operations for the second quarter 2022 was $421 million compared to $333 million for the second quarter 2021.
•Adjusted EBITDA. Second quarter 2022 Adjusted EBITDA was $1.1 billion compared to $958 million for the second quarter 2021, representing 13% growth from the second quarter 2021 as a result of the growth in site rental revenues and higher services contribution.
•AFFO and AFFO per share. Second quarter 2022 AFFO was $783 million, or $1.80 per share, representing growth from the second quarter 2021 of 6% and 5%, respectively.
•Capital expenditures. Capital expenditures during the quarter were $303 million, comprised of $21 million of sustaining capital expenditures and $282 million of discretionary capital expenditures. Discretionary capital expenditures during the quarter primarily included approximately $235 million attributable to Fiber and approximately $42 million attributable to Towers.
•Common stock dividend. During the quarter, Crown Castle paid common stock dividends of approximately $637 million in the aggregate, or $1.47 per common share, an increase of approximately 11% on a per share basis compared to the same period a year ago.
HIGHLIGHTS SUBSEQUENT TO THE QUARTER
•Crown Castle International Corp. to change name to Crown Castle Inc. Crown Castle plans to change its corporate name to Crown Castle Inc., effective August 1, 2022, while its common stock will continue to trade under the ticker symbol "CCI" on the New York Stock Exchange.
•Financing activities. In July 2022, Crown Castle increased the commitments under its Senior Unsecured Revolving Credit Facility by $2 billion, for aggregate commitments of $7 billion, and extended the maturity date on its Senior Unsecured Credit Facility from June 2026 to July 2027.
The pathway to possible.
CrownCastle.com
| News Release continued: | Page 3 | |||||||
"We are excited about the growth in our business as our customers are deploying 5G at scale, which is resulting in meaningfully higher operating performance relative to our expectations at the beginning of the year," stated Dan Schlanger, Crown Castle’s Chief Financial Officer. "Although we expect the rapid rise in interest rates to prevent that outperformance from flowing through to additional AFFO growth this year, we believe our business and balance sheet will allow us to deliver compelling growth through various economic cycles. Our cost structure is largely fixed in nature, and we have taken deliberate steps to further strengthen our balance sheet position to where we sit today with nine years of weighted average term remaining and 85% fixed-rate debt. With significant liquidity following the increase in our Revolving Credit Facility to $7 billion and limited debt maturities through 2024, we are well positioned to pursue investment opportunities that are consistent with our strategy and support our ability to deliver attractive risk-adjusted returns through a combination of dividends and growth."
OUTLOOK
This Outlook section contains forward-looking statements, and actual results may differ materially. Information regarding potential risks which could cause actual results to differ from the forward-looking statements herein is set forth below and in Crown Castle's filings with the SEC.
The following table sets forth Crown Castle's current outlook for full year 2022.
| (in millions, except per share amounts) | Full Year 2022 | Change to Midpoint from Previous Outlook(d) | |||||||||||||||
| Site rental revenues | $6,242 | to | $6,287 | $— | |||||||||||||
Site rental costs of operations(a) | $1,548 | to | $1,593 | $— | |||||||||||||
| Income (loss) from continuing operations | $1,654 | to | $1,734 | -$20 | |||||||||||||
Adjusted EBITDA(b) | $4,329 | to | $4,374 | +$20 | |||||||||||||
Interest expense and amortization of deferred financing costs(c) | $680 | to | $725 | +$45 | |||||||||||||
FFO(b) | $3,343 | to | $3,388 | -$15 | |||||||||||||
AFFO(b) | $3,178 | to | $3,223 | $— | |||||||||||||
AFFO per share(b) | $7.31 | to | $7.41 | $— | |||||||||||||
(a)Exclusive of depreciation, amortization and accretion.
(b)See "Non-GAAP Financial Measures, Segment Measures and Other Calculations" for further information and reconciliation of non-GAAP financial measures to income (loss) from continuing operations, as computed in accordance with GAAP.
(c)See reconciliation of "Components of Outlook for Interest Expense and Amortization of Deferred Financing Costs" for a discussion of non-cash interest expense.
(d)As issued on April 20, 2022.
•The increase to the midpoint of the full year 2022 Outlook for Adjusted EBITDA reflects a $20 million increase in expected services contribution.
•The full year 2022 Outlook for AFFO is unchanged, with the $20 million increase to the Outlook for Adjusted EBITDA combined with $25 million in lower expected sustaining capital expenditures and cash taxes offset by a $45 million increase to the expected full year interest expense resulting from higher expected interest rates.
The pathway to possible.
CrownCastle.com
| News Release continued: | Page 4 | |||||||
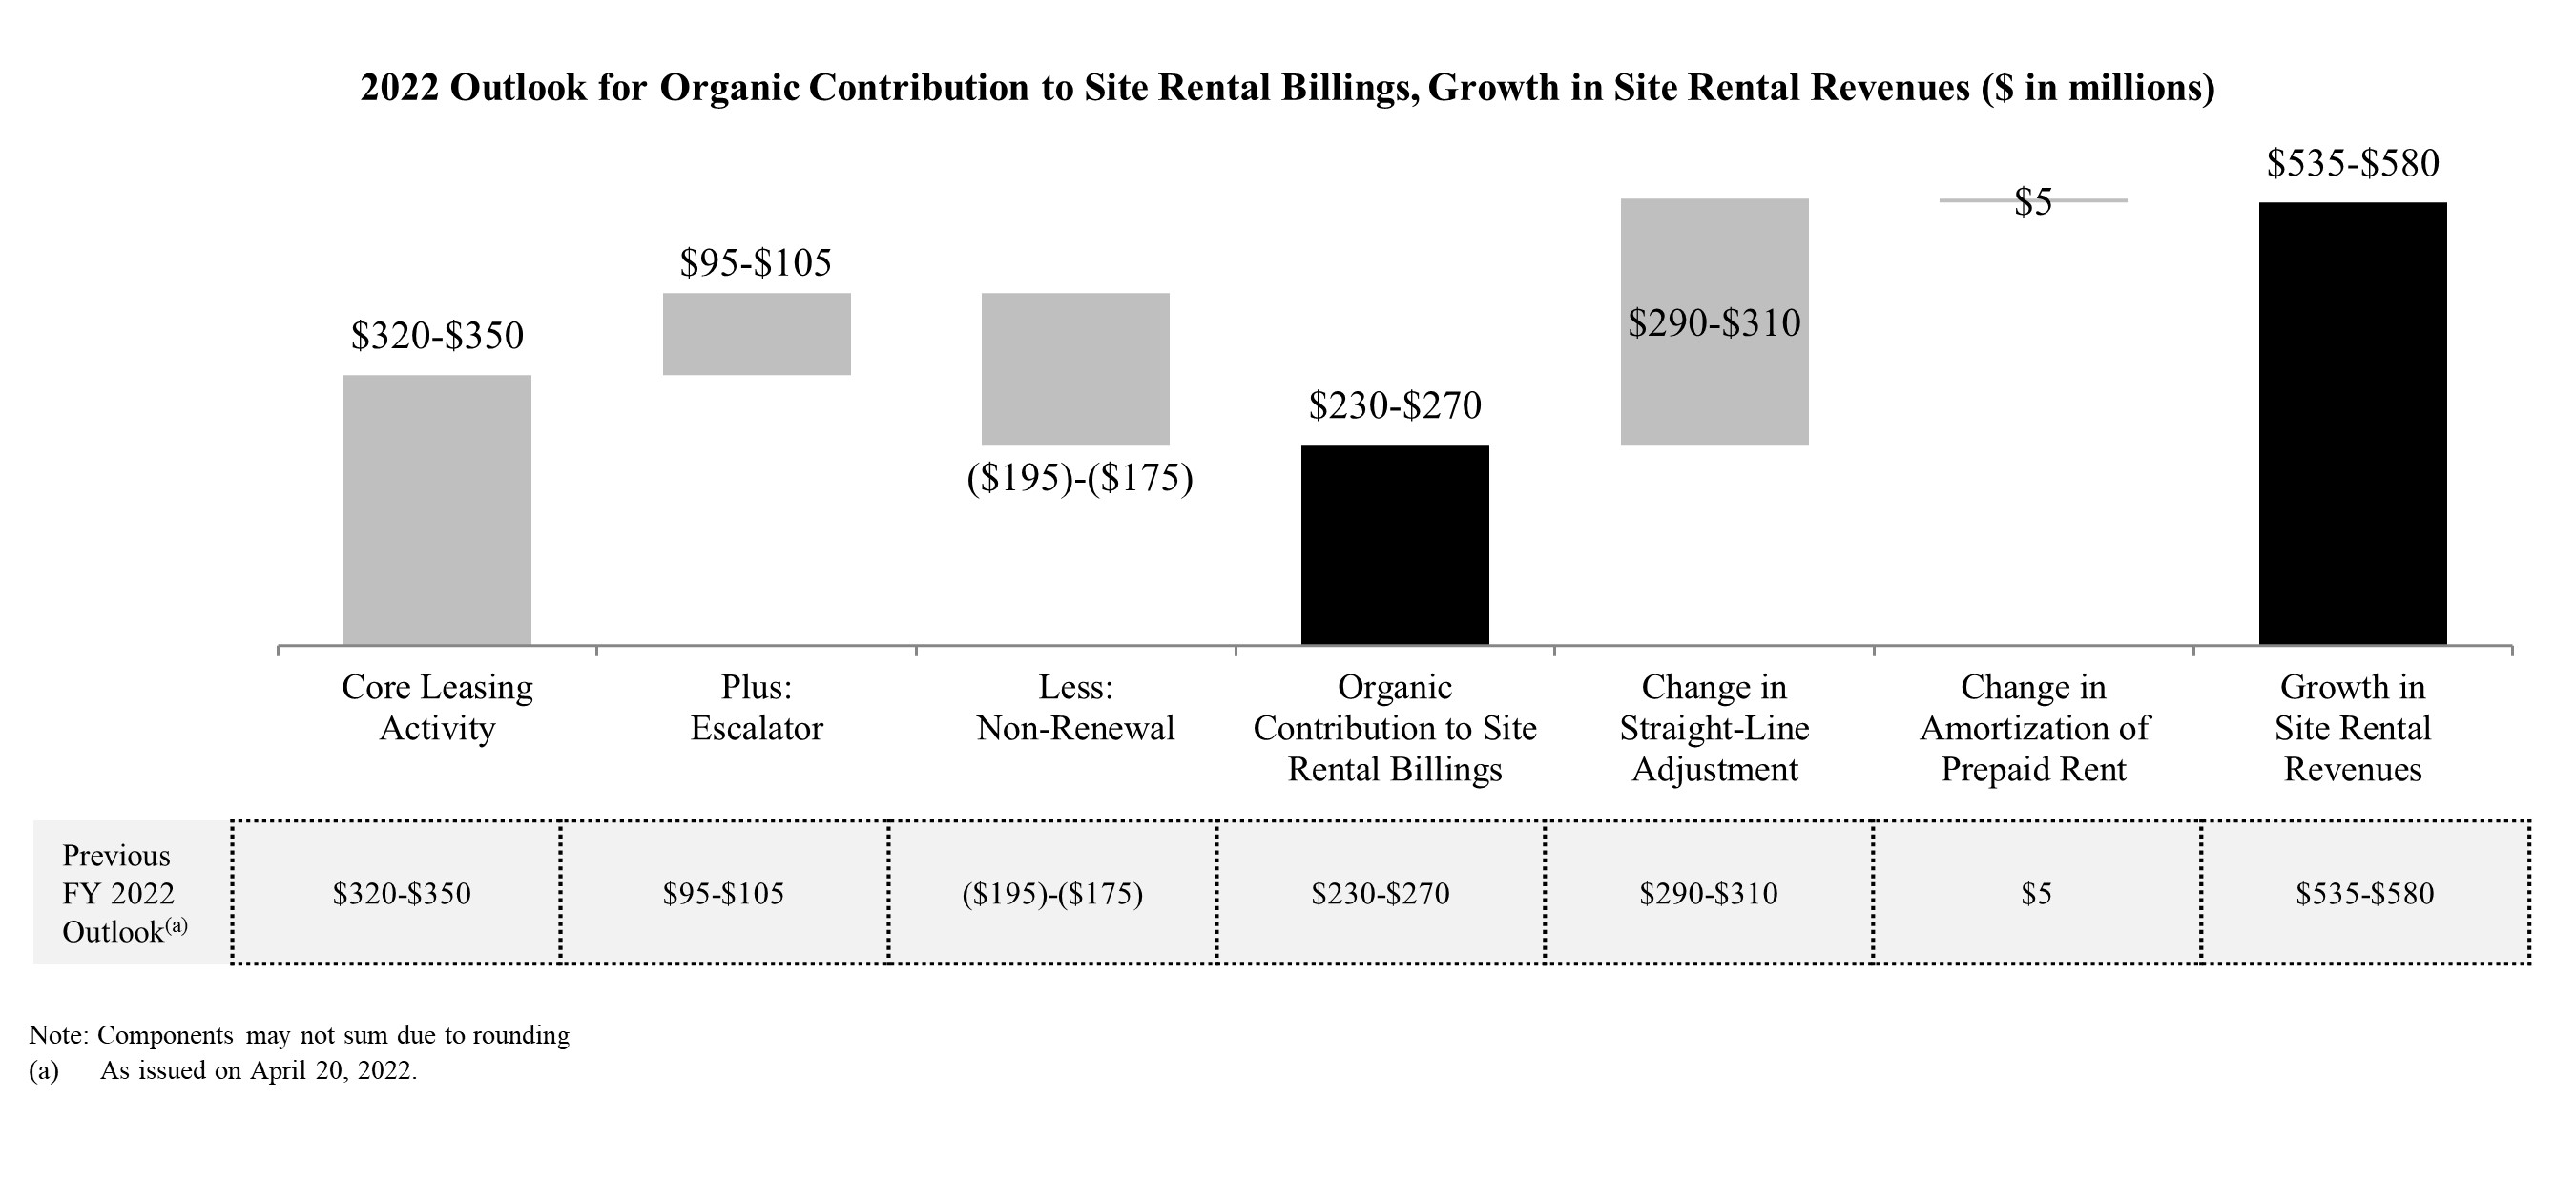
•The chart below reconciles the components of expected growth in site rental revenues from 2021 to 2022 of $535 million to $580 million, inclusive of Organic Contribution to Site Rental Billings during 2022 of $230 million to $270 million, or approximately 5%.
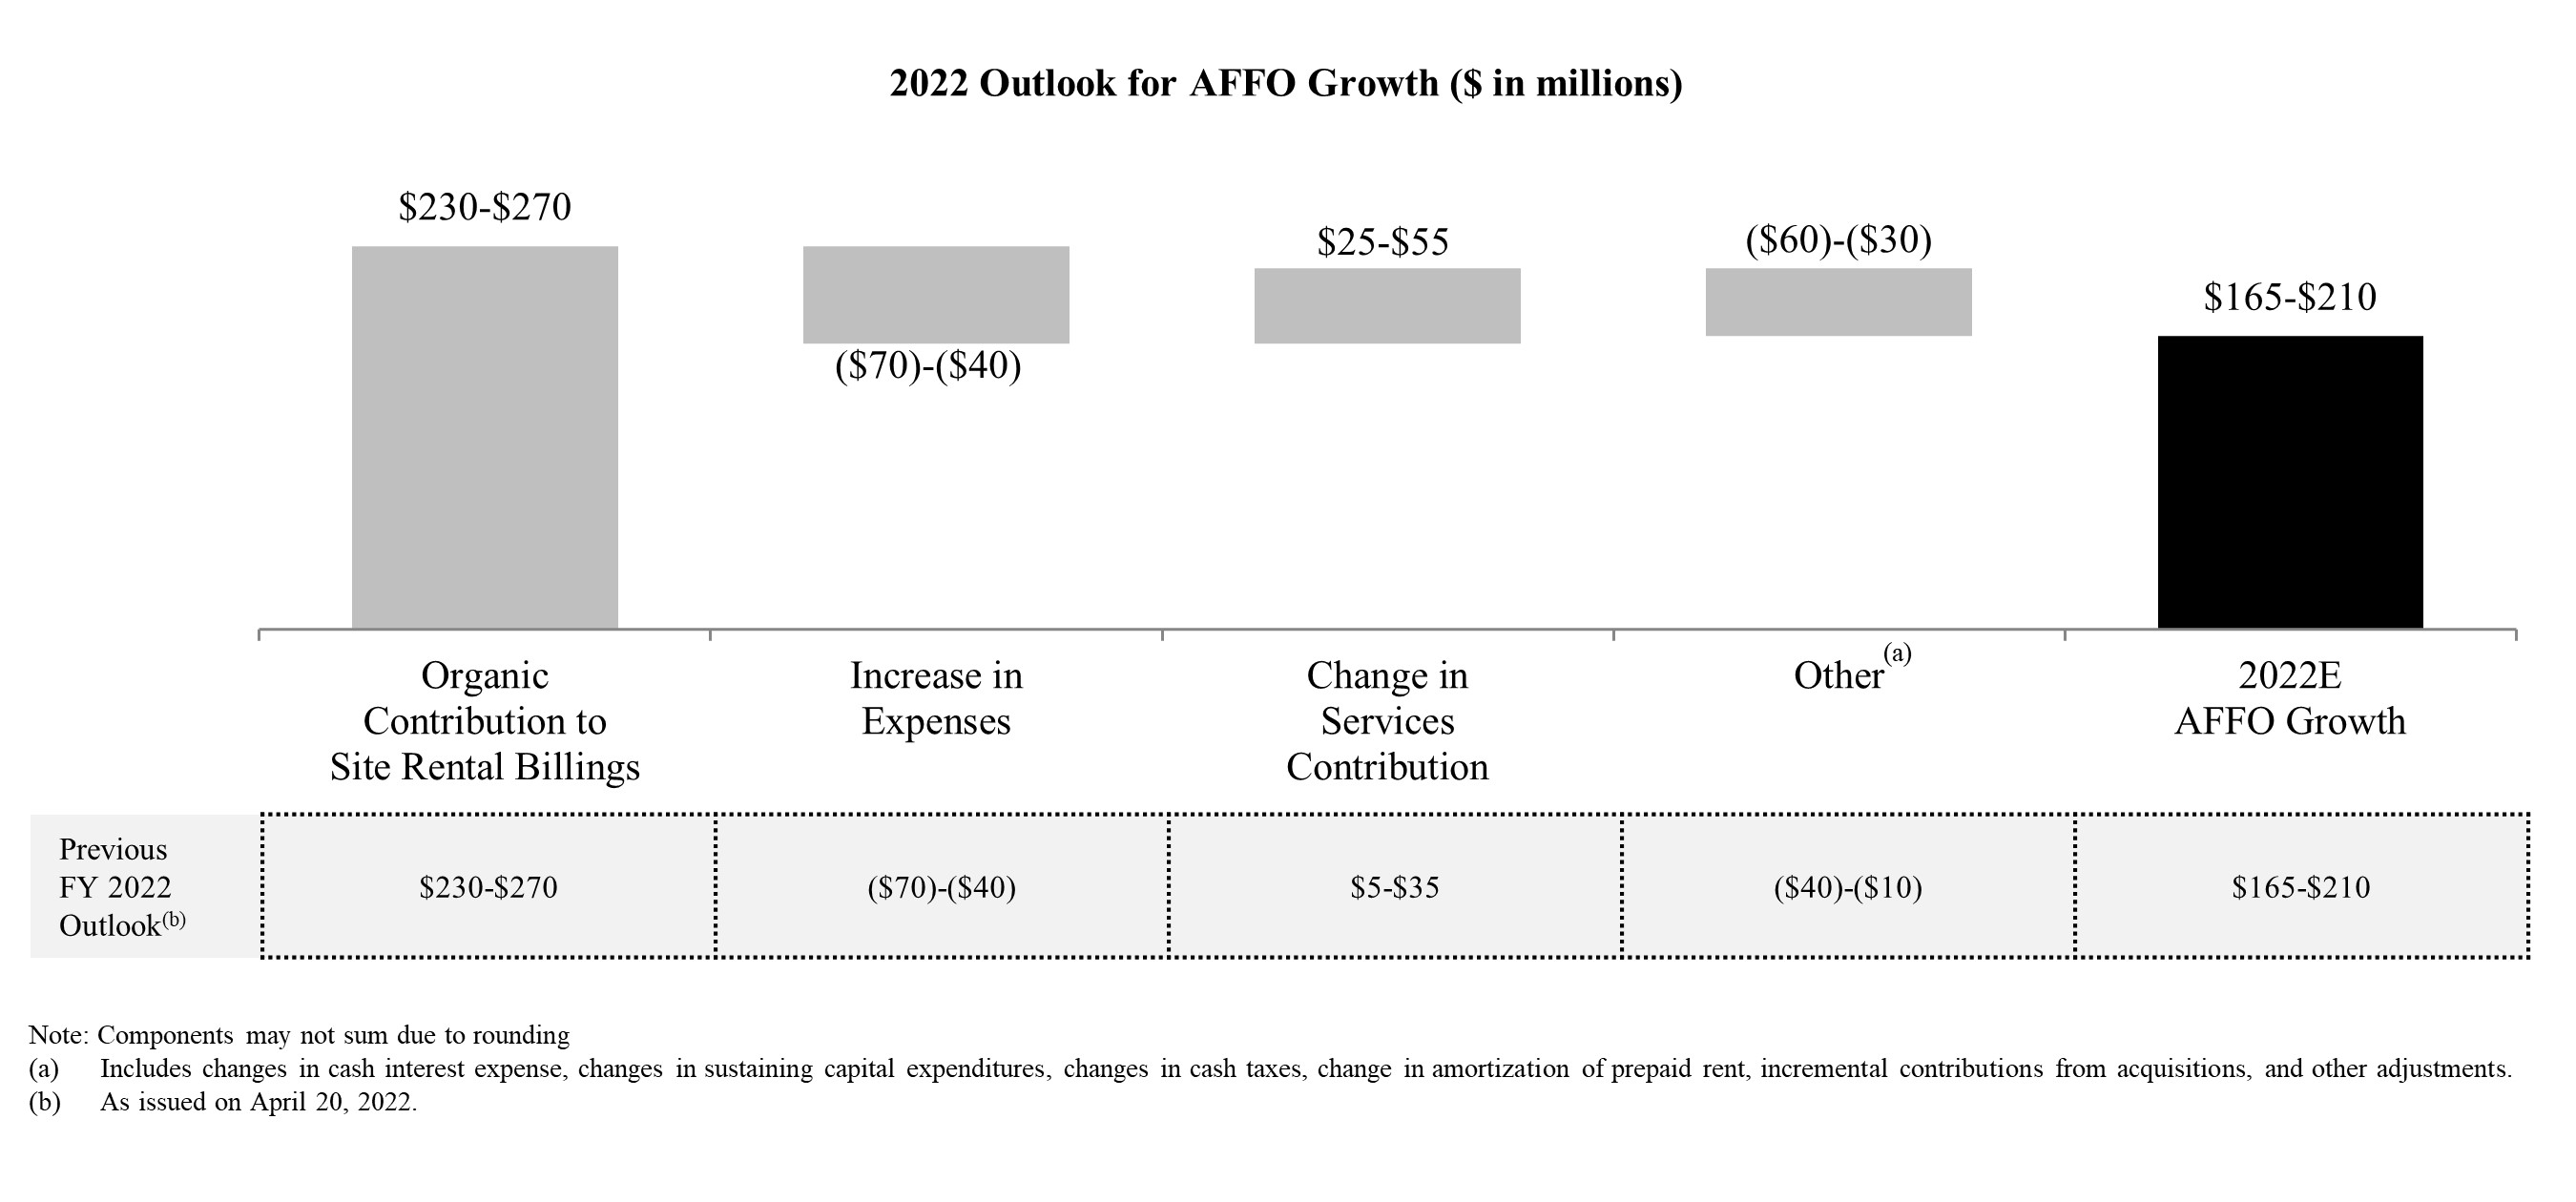
•The chart below reconciles the components of expected growth in AFFO from 2021 to 2022 of $165 million to $210 million.
Additional information is available in Crown Castle's quarterly Supplemental Information Package posted in the Investors section of our website.
The pathway to possible.
CrownCastle.com
| News Release continued: | Page 5 | |||||||
CONFERENCE CALL DETAILS
Crown Castle has scheduled a conference call for Thursday, July 21, 2022, at 10:30 a.m. Eastern time to discuss its second quarter 2022 results. The conference call may be accessed by dialing 800-263-0877 and asking for the Crown Castle call (access code 7823263) at least 30 minutes prior to the start time. The conference call may also be accessed live over the Internet at investor.crowncastle.com. Supplemental materials for the call have been posted on the Crown Castle website at investor.crowncastle.com.
A telephonic replay of the conference call will be available from 1:30 p.m. Eastern time on Thursday, July 21, 2022, through 1:30 p.m. Eastern time on Wednesday, October 19, 2022, and may be accessed by dialing 888-203-1112 and using access code 7823263. An audio archive will also be available on Crown Castle's website at investor.crowncastle.com shortly after the call and will be accessible for approximately 90 days.
ABOUT CROWN CASTLE
Crown Castle owns, operates and leases more than 40,000 cell towers and approximately 85,000 route miles of fiber supporting small cells and fiber solutions across every major U.S. market. This nationwide portfolio of communications infrastructure connects cities and communities to essential data, technology and wireless service - bringing information, ideas and innovations to the people and businesses that need them. For more information on Crown Castle, please visit www.crowncastle.com.
The pathway to possible.
CrownCastle.com
| News Release continued: | Page 6 | |||||||
Non-GAAP Financial Measures, Segment Measures and Other Calculations
This press release includes presentations of Adjusted EBITDA, Adjusted Funds from Operations ("AFFO"), including per share amounts, Funds from Operations ("FFO"), including per share amounts, and Organic Contribution to Site Rental Billings, which are non-GAAP financial measures. These non-GAAP financial measures are not intended as alternative measures of operating results or cash flow from operations (as determined in accordance with Generally Accepted Accounting Principles ("GAAP")).
Our non-GAAP financial measures may not be comparable to similarly titled measures of other companies, including other companies in the communications infrastructure sector or other real estate investment trusts ("REITs").
In addition to the non-GAAP financial measures used herein, we also provide Segment Site Rental Gross Margin, Segment Services and Other Gross Margin and Segment Operating Profit, which are key measures used by management to evaluate our operating segments. These segment measures are provided pursuant to GAAP requirements related to segment reporting. In addition, we provide the components of certain GAAP measures, such as site rental revenues and capital expenditures.
Our non-GAAP financial measures are presented as additional information because management believes these measures are useful indicators of the financial performance of our business. Among other things, management believes that:
•Adjusted EBITDA is useful to investors or other interested parties in evaluating our financial performance. Adjusted EBITDA is the primary measure used by management (1) to evaluate the economic productivity of our operations and (2) for purposes of making decisions about allocating resources to, and assessing the performance of, our operations. Management believes that Adjusted EBITDA helps investors or other interested parties meaningfully evaluate and compare the results of our operations (1) from period to period and (2) to our competitors, by removing the impact of our capital structure (primarily interest charges from our outstanding debt) and asset base (primarily depreciation, amortization and accretion) from our financial results. Management also believes Adjusted EBITDA is frequently used by investors or other interested parties in the evaluation of the communications infrastructure sector and other REITs to measure financial performance without regard to items such as depreciation, amortization and accretion, which can vary depending upon accounting methods and the book value of assets. In addition, Adjusted EBITDA is similar to the measure of current financial performance generally used in our debt covenant calculations. Adjusted EBITDA should be considered only as a supplement to income (loss) from continuing operations computed in accordance with GAAP as a measure of our performance.
•AFFO, including per share amounts, is useful to investors or other interested parties in evaluating our financial performance. Management believes that AFFO helps investors or other interested parties meaningfully evaluate our financial performance as it includes (1) the impact of our capital structure (primarily interest expense on our outstanding debt and dividends on our preferred stock (in periods where applicable)) and (2) sustaining capital expenditures, and excludes the impact of our (1) asset base (primarily depreciation, amortization and accretion) and (2) certain non-cash items, including straight-lined revenues and expenses related to fixed escalations and rent free periods. GAAP requires rental revenues and expenses related to leases that contain specified rental increases over the life of the lease to be recognized evenly over the life of the lease. In accordance with GAAP, if payment terms call for fixed escalations or rent free periods, the revenues or expenses are recognized on a straight-lined basis over the fixed, non-cancelable term of the contract. Management notes that Crown Castle uses AFFO only as a performance measure. AFFO should be considered only as a supplement to income (loss) from continuing operations computed in accordance with GAAP as a measure of our performance and should not be considered as an alternative to cash flow from operations or as residual cash flow available for discretionary investment.
•FFO, including per share amounts, is useful to investors or other interested parties in evaluating our financial performance. Management believes that FFO may be used by investors or other interested parties as a basis to compare our financial performance with that of other REITs. FFO helps investors or other interested parties meaningfully evaluate financial performance by excluding the impact of our asset base (primarily real estate depreciation, amortization and accretion). FFO is not a key performance indicator used by Crown Castle. FFO should be considered only as a supplement to income (loss) from continuing operations computed in accordance with GAAP as a measure of our performance and should not be considered as an alternative to cash flow from operations.
The pathway to possible.
CrownCastle.com
| News Release continued: | Page 7 | |||||||
•Organic Contribution to Site Rental Billings is useful to investors or other interested parties in understanding the components of the year-over-year changes in our site rental revenues computed in accordance with GAAP. Management uses Organic Contribution to Site Rental Billings to assess year-over-year growth rates for our rental activities, to evaluate current performance, to capture trends in rental rates, core leasing activities and tenant non-renewals in our core business, as well as to forecast future results. Organic Contribution to Site Rental Billings is not meant as an alternative measure of revenue and should be considered only as a supplement in understanding and assessing the performance of our site rental revenues computed in accordance with GAAP.
We define our non-GAAP financial measures, segment measures and other calculations as follows:
Non-GAAP Financial Measures
Adjusted EBITDA. We define Adjusted EBITDA as income (loss) from continuing operations plus restructuring charges (credits), asset write-down charges, acquisition and integration costs, depreciation, amortization and accretion, amortization of prepaid lease purchase price adjustments, interest expense and amortization of deferred financing costs, (gains) losses on retirement of long-term obligations, net (gain) loss on interest rate swaps, (gains) losses on foreign currency swaps, impairment of available-for-sale securities, interest income, other (income) expense, (benefit) provision for income taxes, cumulative effect of a change in accounting principle and stock-based compensation expense.
Adjusted Funds from Operations. We define Adjusted Funds from Operations as FFO before straight-lined revenues, straight-lined expenses, stock-based compensation expense, non-cash portion of tax provision, non-real estate related depreciation, amortization and accretion, amortization of non-cash interest expense, other (income) expense, (gains) losses on retirement of long-term obligations, net (gain) loss on interest rate swaps, (gains) losses on foreign currency swaps, impairment of available-for-sale securities, acquisition and integration costs, restructuring charges (credits), cumulative effect of a change in accounting principle and adjustments for noncontrolling interests, less sustaining capital expenditures.
AFFO per share. We define AFFO per share as AFFO divided by diluted weighted-average common shares outstanding.
Funds from Operations. We define Funds from Operations as income (loss) from continuing operations plus real estate related depreciation, amortization and accretion and asset write-down charges, less noncontrolling interest and cash paid for preferred stock dividends (in periods where applicable), and is a measure of funds from operations attributable to common stockholders.
FFO per share. We define FFO per share as FFO divided by diluted weighted-average common shares outstanding.
Organic Contribution to Site Rental Billings. We define Organic Contribution to Site Rental Billings as the sum of the change in GAAP site rental revenues related to core leasing activity and escalators, less non-renewals of tenant contracts.
Segment Measures
Segment site rental gross margin. We define segment site rental gross margin as segment site rental revenues less segment site rental costs of operations, excluding stock-based compensation expense and amortization of prepaid lease purchase price adjustments recorded in consolidated site rental costs of operations.
Segment services and other gross margin. We define segment services and other gross margin as segment services and other revenues less segment services and other costs of operations, excluding stock-based compensation expense recorded in consolidated services and other costs of operations.
Segment operating profit. We define segment operating profit as segment site rental gross margin plus segment services and other gross margin, and segment other operating (income) expense, less selling, general and administrative expenses attributable to the respective segment.
All of these measurements of profit or loss are exclusive of depreciation, amortization and accretion, which are shown separately. Additionally, certain costs are shared across segments and are reflected in our segment measures through allocations that management believes to be reasonable.
Other Calculations
Site rental billings. We define site rental billings as site rental revenues exclusive of the impacts from (1) straight-lined revenues, (2) amortization of prepaid rent in accordance with GAAP and (3) contribution from recent acquisitions until the one-year anniversary of such acquisitions.
Core leasing activity. We define core leasing activity as site rental revenues growth from tenant additions across our entire portfolio and renewals or extensions of tenant contracts, exclusive of the impacts from both straight-lined revenues and amortization of prepaid rent in accordance with GAAP.
The pathway to possible.
CrownCastle.com
| News Release continued: | Page 8 | |||||||
Non-renewals. We define non-renewals of tenant contracts as the reduction in site rental revenues as a result of tenant churn, terminations and, in limited circumstances, reductions of existing lease rates.
Discretionary capital expenditures. We define discretionary capital expenditures as those capital expenditures made with respect to activities which we believe exhibit sufficient potential to enhance long-term stockholder value. They primarily consist of expansion or development of communications infrastructure (including capital expenditures related to (1) enhancing communications infrastructure in order to add new tenants for the first time or support subsequent tenant equipment augmentations or (2) modifying the structure of a communications infrastructure asset to accommodate additional tenants) and construction of new communications infrastructure. Discretionary capital expenditures also include purchases of land interests (which primarily relates to land assets under towers as we seek to manage our interests in the land beneath our towers), certain technology-related investments necessary to support and scale future customer demand for our communications infrastructure, and other capital projects.
Sustaining capital expenditures. We define sustaining capital expenditures as those capital expenditures not otherwise categorized as discretionary capital expenditures, such as (1) maintenance capital expenditures on our communications infrastructure assets that enable our tenants' ongoing quiet enjoyment of the communications infrastructure and (2) ordinary corporate capital expenditures.
The tables set forth on the following pages reconcile the non-GAAP financial measures used herein to comparable GAAP financial measures.
The pathway to possible.
CrownCastle.com
| News Release continued: | Page 9 | |||||||
Reconciliations of Non-GAAP Financial Measures, Segment Measures and Other Calculations to Comparable GAAP Financial Measures:
Reconciliation of Historical Adjusted EBITDA:
| For the Three Months Ended | For the Six Months Ended | For the Twelve Months Ended | ||||||||||||||||||||||||||||||
| (in millions) | June 30, 2022 | June 30, 2021 | June 30, 2022 | June 30, 2021 | December 31, 2021 | |||||||||||||||||||||||||||
| Income (loss) from continuing operations | $ | 421 | $ | 333 | $ | 842 | $ | 455 | (a) | $ | 1,158 | (a) | ||||||||||||||||||||
| Adjustments to increase (decrease) income (loss) from continuing operations: | ||||||||||||||||||||||||||||||||
| Asset write-down charges | 9 | 6 | 23 | 9 | 21 | |||||||||||||||||||||||||||
| Acquisition and integration costs | 1 | 1 | 1 | 1 | 1 | |||||||||||||||||||||||||||
| Depreciation, amortization and accretion | 427 | 408 | 847 | 816 | 1,644 | |||||||||||||||||||||||||||
| Amortization of prepaid lease purchase price adjustments | 4 | 4 | 8 | 9 | 18 | |||||||||||||||||||||||||||
Interest expense and amortization of deferred financing costs(b) | 165 | 161 | 329 | 330 | 657 | |||||||||||||||||||||||||||
| (Gains) losses on retirement of long-term obligations | — | 1 | 26 | 144 | 145 | |||||||||||||||||||||||||||
| Interest income | — | (1) | (1) | (1) | (1) | |||||||||||||||||||||||||||
| Other (income) expense | 2 | 5 | 4 | 12 | 21 | |||||||||||||||||||||||||||
| (Benefit) provision for income taxes | 5 | 6 | 11 | 13 | 21 | |||||||||||||||||||||||||||
| Stock-based compensation expense | 44 | 34 | 83 | 68 | 131 | |||||||||||||||||||||||||||
Adjusted EBITDA(c)(d) | $ | 1,078 | $ | 958 | $ | 2,173 | $ | 1,856 | $ | 3,816 | ||||||||||||||||||||||
Reconciliation of Current Outlook for Adjusted EBITDA:
| Full Year 2022 | |||||||||||
| (in millions) | Outlook(f) | ||||||||||
| Income (loss) from continuing operations | $1,654 | to | $1,734 | ||||||||
| Adjustments to increase (decrease) income (loss) from continuing operations: | |||||||||||
| Asset write-down charges | $20 | to | $30 | ||||||||
| Acquisition and integration costs | $1 | to | $9 | ||||||||
| Depreciation, amortization and accretion | $1,650 | to | $1,745 | ||||||||
| Amortization of prepaid lease purchase price adjustments | $16 | to | $18 | ||||||||
Interest expense and amortization of deferred financing costs(e) | $680 | to | $725 | ||||||||
| (Gains) losses on retirement of long-term obligations | $25 | to | $75 | ||||||||
| Interest income | $(3) | to | $(2) | ||||||||
| Other (income) expense | $0 | to | $5 | ||||||||
| (Benefit) provision for income taxes | $20 | to | $28 | ||||||||
| Stock-based compensation expense | $135 | to | $139 | ||||||||
Adjusted EBITDA(c)(d) | $4,329 | to | $4,374 | ||||||||
(a)Does not reflect the impact related to the ATO Settlement (as defined in the April 2021 8-K), which is attributable to discontinued operations in the first quarter of 2021 as discussed in the April 2021 8-K.
(b)See reconciliation of "Components of Historical Interest Expense and Amortization of Deferred Financing Costs" for a discussion of non-cash interest expense.
(c)See "Non-GAAP Financial Measures, Segment Measures and Other Calculations" for a discussion of our definition of Adjusted EBITDA.
(d)The above reconciliation excludes line items included in our definition which are not applicable for the periods shown.
(e)See reconciliation of "Components of Outlook for Interest Expense and Amortization of Deferred Financing Costs" for a discussion of non-cash interest expense.
(f)As issued on July 20, 2022.
The pathway to possible.
CrownCastle.com
| News Release continued: | Page 10 | |||||||
Reconciliation of Historical FFO and AFFO:
| For the Three Months Ended | For the Six Months Ended | For the Twelve Months Ended | ||||||||||||||||||||||||||||||
| (in millions, except per share amounts) | June 30, 2022 | June 30, 2021 | June 30, 2022 | June 30, 2021 | December 31, 2021 | |||||||||||||||||||||||||||
| Income (loss) from continuing operations | $ | 421 | $ | 333 | $ | 842 | $ | 455 | (a) | $ | 1,158 | (a) | ||||||||||||||||||||
| Real estate related depreciation, amortization and accretion | 412 | 395 | 820 | 790 | 1,593 | |||||||||||||||||||||||||||
| Asset write-down charges | 9 | 6 | 23 | 9 | 21 | |||||||||||||||||||||||||||
FFO(b)(c) | $ | 842 | $ | 734 | $ | 1,685 | $ | 1,254 | $ | 2,772 | ||||||||||||||||||||||
| Weighted-average common shares outstanding—diluted | 434 | 434 | 434 | 434 | 434 | |||||||||||||||||||||||||||
FFO per share(b)(c) | $ | 1.94 | $ | 1.69 | $ | 3.88 | $ | 2.89 | $ | 6.39 | ||||||||||||||||||||||
| FFO (from above) | $ | 842 | $ | 734 | $ | 1,685 | $ | 1,254 | $ | 2,772 | ||||||||||||||||||||||
| Adjustments to increase (decrease) FFO: | ||||||||||||||||||||||||||||||||
| Straight-lined revenues | (120) | (45) | (235) | (35) | (111) | |||||||||||||||||||||||||||
| Straight-lined expenses | 19 | 20 | 37 | 39 | 76 | |||||||||||||||||||||||||||
| Stock-based compensation expense | 44 | 34 | 83 | 68 | 131 | |||||||||||||||||||||||||||
| Non-cash portion of tax provision | (3) | (7) | 2 | — | 1 | |||||||||||||||||||||||||||
| Non-real estate related depreciation, amortization and accretion | 15 | 13 | 27 | 26 | 51 | |||||||||||||||||||||||||||
| Amortization of non-cash interest expense | 4 | 4 | 7 | 6 | 13 | |||||||||||||||||||||||||||
| Other (income) expense | 2 | 5 | 4 | 12 | 21 | |||||||||||||||||||||||||||
| (Gains) losses on retirement of long-term obligations | — | 1 | 26 | 144 | 145 | |||||||||||||||||||||||||||
| Acquisition and integration costs | 1 | 1 | 1 | 1 | 1 | |||||||||||||||||||||||||||
| Sustaining capital expenditures | (21) | (19) | (42) | (36) | (87) | |||||||||||||||||||||||||||
AFFO(b)(c) | $ | 783 | $ | 741 | $ | 1,595 | $ | 1,479 | $ | 3,013 | ||||||||||||||||||||||
| Weighted-average common shares outstanding—diluted | 434 | 434 | 434 | 434 | 434 | |||||||||||||||||||||||||||
AFFO per share(b)(c) | $ | 1.80 | $ | 1.71 | $ | 3.67 | $ | 3.41 | $ | 6.95 | ||||||||||||||||||||||
(a)Does not reflect the impact related to the ATO Settlement (as defined in the April 2021 8-K), which is attributable to discontinued operations in the first quarter of 2021 as discussed in the April 2021 8-K.
(b)See "Non-GAAP Financial Measures, Segment Measures and Other Calculations" for a discussion of our definitions of FFO and AFFO, including per share amounts.
(c)The above reconciliation excludes line items included in our definition which are not applicable for the periods shown.
The pathway to possible.
CrownCastle.com
| News Release continued: | Page 11 | |||||||
Reconciliation of Current Outlook for FFO and AFFO:
| Full Year 2022 | |||||||||||
| (in millions, except per share amounts) | Outlook(a) | ||||||||||
| Income (loss) from continuing operations | $1,654 | to | $1,734 | ||||||||
| Real estate related depreciation, amortization and accretion | $1,607 | to | $1,687 | ||||||||
| Asset write-down charges | $20 | to | $30 | ||||||||
FFO(b)(c) | $3,343 | to | $3,388 | ||||||||
Weighted-average common shares outstanding—diluted(d) | 435 | ||||||||||
FFO per share(b)(c)(d) | $7.69 | to | $7.79 | ||||||||
| FFO (from above) | $3,343 | to | $3,388 | ||||||||
| Adjustments to increase (decrease) FFO: | |||||||||||
| Straight-lined revenues | $(419) | to | $(399) | ||||||||
| Straight-lined expenses | $56 | to | $76 | ||||||||
| Stock-based compensation expense | $135 | to | $139 | ||||||||
| Non-cash portion of tax provision | $0 | to | $15 | ||||||||
| Non-real estate related depreciation, amortization and accretion | $43 | to | $58 | ||||||||
| Amortization of non-cash interest expense | $5 | to | $15 | ||||||||
| Other (income) expense | $0 | to | $5 | ||||||||
| (Gains) losses on retirement of long-term obligations | $25 | to | $75 | ||||||||
| Acquisition and integration costs | $1 | to | $9 | ||||||||
| Sustaining capital expenditures | $(98) | to | $(78) | ||||||||
AFFO(b)(c) | $3,178 | to | $3,223 | ||||||||
Weighted-average common shares outstanding—diluted(d) | 435 | ||||||||||
AFFO per share(b)(c)(d) | $7.31 | to | $7.41 | ||||||||
(a)As issued on July 20, 2022.
(b)See "Non-GAAP Financial Measures, Segment Measures and Other Calculations" for a discussion of our definitions of FFO and AFFO, including per share amounts.
(c)The above reconciliation excludes line items included in our definition which are not applicable for the periods shown.
(d)The assumption for diluted weighted-average common shares outstanding for full year 2022 Outlook is based on the diluted common shares outstanding as of June 30, 2022.
The pathway to possible.
CrownCastle.com
| News Release continued: | Page 12 | |||||||
For Comparative Purposes - Reconciliation of Previous Outlook for Adjusted EBITDA:
| Previously Issued | |||||||||||
| Full Year 2022 | |||||||||||
| (in millions) | Outlook(a) | ||||||||||
| Income (loss) from continuing operations | $1,674 | to | $1,754 | ||||||||
| Adjustments to increase (decrease) income (loss) from continuing operations: | |||||||||||
| Asset write-down charges | $15 | to | $25 | ||||||||
| Acquisition and integration costs | $0 | to | $8 | ||||||||
| Depreciation, amortization and accretion | $1,650 | to | $1,745 | ||||||||
| Amortization of prepaid lease purchase price adjustments | $16 | to | $18 | ||||||||
Interest expense and amortization of deferred financing costs(b) | $635 | to | $680 | ||||||||
| (Gains) losses on retirement of long-term obligations | $25 | to | $75 | ||||||||
| Interest income | $(1) | to | $0 | ||||||||
| Other (income) expense | $0 | to | $5 | ||||||||
| (Benefit) provision for income taxes | $25 | to | $33 | ||||||||
| Stock-based compensation expense | $135 | to | $139 | ||||||||
Adjusted EBITDA(c)(d) | $4,309 | to | $4,354 | ||||||||
For Comparative Purposes - Reconciliation of Previous Outlook for FFO and AFFO:
| Previously Issued | |||||||||||
| Full Year 2022 | |||||||||||
| (in millions, except per share amounts) | Outlook(a) | ||||||||||
| Income (loss) from continuing operations | $1,674 | to | $1,754 | ||||||||
| Real estate related depreciation, amortization and accretion | $1,607 | to | $1,687 | ||||||||
| Asset write-down charges | $15 | to | $25 | ||||||||
FFO(c)(d) | $3,358 | to | $3,403 | ||||||||
Weighted-average common shares outstanding—diluted(e) | 435 | ||||||||||
FFO per share(c)(d)(e) | $7.72 | to | $7.82 | ||||||||
| FFO (from above) | $3,358 | to | $3,403 | ||||||||
| Adjustments to increase (decrease) FFO: | |||||||||||
| Straight-lined revenues | $(419) | to | $(399) | ||||||||
| Straight-lined expenses | $56 | to | $76 | ||||||||
| Stock-based compensation expense | $135 | to | $139 | ||||||||
| Non-cash portion of tax provision | $0 | to | $15 | ||||||||
| Non-real estate related depreciation, amortization and accretion | $43 | to | $58 | ||||||||
| Amortization of non-cash interest expense | $5 | to | $15 | ||||||||
| Other (income) expense | $0 | to | $5 | ||||||||
| (Gains) losses on retirement of long-term obligations | $25 | to | $75 | ||||||||
| Acquisition and integration costs | $0 | to | $8 | ||||||||
| Sustaining capital expenditures | $(113) | to | $(93) | ||||||||
AFFO(c)(d) | $3,178 | to | $3,223 | ||||||||
Weighted-average common shares outstanding—diluted(e) | 435 | ||||||||||
AFFO per share(c)(d)(e) | $7.31 | to | $7.41 | ||||||||
(a)As issued on April 20, 2022.
(b)See reconciliation of "Components of Outlook for Interest Expense and Amortization of Deferred Financing Costs" for a discussion of non-cash interest expense.
(c)See "Non-GAAP Financial Measures, Segment Measures and Other Calculations" for a discussion of our definitions of Adjusted EBITDA as well as FFO and AFFO, including per share amounts
(d)The above reconciliation excludes line items included in our definition which are not applicable for the periods shown.
(e)The assumption for diluted weighted-average common shares outstanding for full year 2022 Outlook is based on the diluted common shares outstanding as of June 30, 2022.
The pathway to possible.
CrownCastle.com
| News Release continued: | Page 13 | |||||||
Components of Changes in Site Rental Revenues for the Quarters Ended June 30, 2022 and 2021:
| Three Months Ended June 30, | |||||||||||
| (dollars in millions) | 2022 | 2021 | |||||||||
Components of changes in site rental revenues:(a) | |||||||||||
Prior year site rental billings(b) | $ | 1,245 | $ | 1,181 | |||||||
Core leasing activity(b) | 75 | 82 | |||||||||
| Escalators | 22 | 23 | |||||||||
Non-renewals(b) | (39) | (43) | |||||||||
Organic Contribution to Site Rental Billings(b) | 58 | 62 | |||||||||
| Impact from straight-lined revenues associated with fixed escalators | 120 | 45 | |||||||||
| Impact from prepaid rent amortization | 143 | 136 | |||||||||
Acquisitions(c) | 1 | 1 | |||||||||
| Other | — | — | |||||||||
| Total GAAP site rental revenues | $ | 1,567 | $ | 1,425 | |||||||
| Year-over-year changes in revenues: | |||||||||||
| Reported GAAP site rental revenues | 10.0 | % | |||||||||
Contribution from core leasing and escalators(b)(d) | 7.8 | % | |||||||||
Organic Contribution to Site Rental Billings(b)(e) | 4.7 | % | |||||||||
Components of Changes in Site Rental Revenues for Full Year 2022 Outlook:
| (dollars in millions) | Current Full Year 2022 Outlook(f) | ||||||||||
Components of changes in site rental revenues:(a) | |||||||||||
Prior year site rental billings(b) | $5,048 | ||||||||||
Core leasing activity(b) | $320 | to | $350 | ||||||||
| Escalators | $95 | to | $105 | ||||||||
Non-renewals(b) | $(195) | to | $(175) | ||||||||
Organic Contribution to Site Rental Billings(b) | $230 | to | $270 | ||||||||
| Impact from straight-lined revenues associated with fixed escalators | $399 | to | $419 | ||||||||
| Impact from prepaid rent amortization | $560 | to | $570 | ||||||||
Acquisitions(c) | — | ||||||||||
| Other | — | ||||||||||
| Total GAAP site rental revenues | $6,242 | to | $6,287 | ||||||||
| Year-over-year changes in revenues: | |||||||||||
| Reported GAAP site rental revenues | 9.5%(g) | ||||||||||
Contribution from core leasing and escalators(b)(d) | 8.6%(g) | ||||||||||
Organic Contribution to Site Rental Billings(b)(e) | 5.0%(g) | ||||||||||
(a)Additional information regarding our site rental revenues, including projected revenues from tenant contracts, straight-lined revenues and prepaid rent is available in our quarterly Supplemental Information Package posted in the Investors section of our website.
(b)See "Non-GAAP Financial Measures, Segment Measures and Other Calculations" for our definitions of site rental billings, core leasing activity, non-renewals and Organic Contribution to Site Rental Billings.
(c)Represents the contribution from recent acquisitions. The financial impact of recent acquisitions is excluded from Organic Contribution to Site Rental Billings until the one-year anniversary of such acquisitions.
(d)Calculated as the percentage change from prior year site rental billings compared to the sum of core leasing and escalators for the current period.
(e)Calculated as the percentage change from prior year site rental billings compared to Organic Contribution to Site Rental Billings for the current period.
(f)As issued on July 20, 2022.
(g)Calculated based on midpoint of full year 2022 Outlook.
The pathway to possible.
CrownCastle.com
| News Release continued: | Page 14 | |||||||
Components of Historical Interest Expense and Amortization of Deferred Financing Costs:
| For the Three Months Ended | |||||||||||
| (in millions) | June 30, 2022 | June 30, 2021 | |||||||||
| Interest expense on debt obligations | $ | 161 | $ | 157 | |||||||
| Amortization of deferred financing costs and adjustments on long-term debt, net | 7 | 7 | |||||||||
| Capitalized interest | (3) | (3) | |||||||||
| Interest expense and amortization of deferred financing costs | $ | 165 | $ | 161 | |||||||
Components of Outlook for Interest Expense and Amortization of Deferred Financing Costs:
| (in millions) | Current Full Year 2022 Outlook(a) | Previous Full Year 2022 Outlook(b) | |||||||||||||||||||||
| Interest expense on debt obligations | $682 | to | $702 | $637 | to | $657 | |||||||||||||||||
| Amortization of deferred financing costs and adjustments on long-term debt, net | $25 | to | $30 | $25 | to | $30 | |||||||||||||||||
| Capitalized interest | $(20) | to | $(15) | $(20) | to | $(15) | |||||||||||||||||
| Interest expense and amortization of deferred financing costs | $680 | to | $725 | $635 | to | $680 | |||||||||||||||||
(a)As issued on July 20, 2022.
(b)As issued on April 20, 2022.
The pathway to possible.
CrownCastle.com
| News Release continued: | Page 15 | |||||||
Debt Balances and Maturity Dates as of June 30, 2022:
| (in millions) | Face Value | Final Maturity | |||||||||
| Cash, cash equivalents and restricted cash | $ | 446 | |||||||||
Secured Notes, Series 2009-1, Class A-2(a) | 50 | Aug. 2029 | |||||||||
Tower Revenue Notes, Series 2015-2(b) | 700 | May 2045 | |||||||||
Tower Revenue Notes, Series 2018-2(b) | 750 | July 2048 | |||||||||
Finance leases and other obligations | 235 | Various | |||||||||
| Total secured debt | $ | 1,735 | |||||||||
2016 Revolver(c)(d) | 1,150 | July 2027 | |||||||||
2016 Term Loan A(c) | 1,207 | July 2027 | |||||||||
Commercial Paper Notes(e) | 952 | Various | |||||||||
3.150% Senior Notes | 750 | July 2023 | |||||||||
3.200% Senior Notes | 750 | Sept. 2024 | |||||||||
1.350% Senior Notes | 500 | July 2025 | |||||||||
4.450% Senior Notes | 900 | Feb. 2026 | |||||||||
3.700% Senior Notes | 750 | June 2026 | |||||||||
| 1.050% Senior Notes | 1,000 | July 2026 | |||||||||
| 2.900% Senior Notes | 750 | Mar. 2027 | |||||||||
4.000% Senior Notes | 500 | Mar. 2027 | |||||||||
3.650% Senior Notes | 1,000 | Sept. 2027 | |||||||||
3.800% Senior Notes | 1,000 | Feb. 2028 | |||||||||
4.300% Senior Notes | 600 | Feb. 2029 | |||||||||
| 3.100% Senior Notes | 550 | Nov. 2029 | |||||||||
3.300% Senior Notes | 750 | July 2030 | |||||||||
2.250% Senior Notes | 1,100 | Jan. 2031 | |||||||||
| 2.100% Senior Notes | 1,000 | Apr. 2031 | |||||||||
| 2.500% Senior Notes | 750 | July 2031 | |||||||||
| 2.900% Senior Notes | 1,250 | Apr. 2041 | |||||||||
4.750% Senior Notes | 350 | May 2047 | |||||||||
5.200% Senior Notes | 400 | Feb. 2049 | |||||||||
| 4.000% Senior Notes | 350 | Nov. 2049 | |||||||||
| 4.150% Senior Notes | 500 | July 2050 | |||||||||
| 3.250% Senior Notes | 900 | Jan. 2051 | |||||||||
| Total unsecured debt | $ | 19,709 | |||||||||
| Total net debt | $ | 20,998 | |||||||||
(a)The Senior Secured Notes, 2009-1, Class A-2 principal amortizes over a period ending in August 2029.
(b)If the respective series of Tower Revenue Notes are not paid in full on or prior to an applicable anticipated repayment date, then the Excess Cash Flow (as defined in the indenture) of the issuers of such notes will be used to repay principal of the applicable series, and additional interest (of an additional approximately 5% per annum) will accrue on the respective series. The Senior Secured Tower Revenue Notes, 2015-2 and 2018-2 have anticipated repayment dates in 2025 and 2028, respectively. Notes are prepayable at par if voluntarily repaid within eighteen months of maturity; earlier prepayment may require additional consideration.
(c)Gives effect to the July 2022 amendment to the credit agreement governing the Senior Unsecured Credit Facility ("2022 Credit Agreement Amendment").
(d)As of June 30, 2022, after giving effect to the 2022 Credit Agreement Amendment, the undrawn availability under the $7.0 billion 2016 Revolver was $5.8 billion.
(e)As of June 30, 2022, the Company had $1.0 billion available for issuance under the $2.0 billion unsecured commercial paper program. The maturities of the Commercial Paper Notes, when outstanding, may vary but may not exceed 397 days from the date of issue.
The pathway to possible.
CrownCastle.com
| News Release continued: | Page 16 | |||||||
Net Debt to Last Quarter Annualized Adjusted EBITDA Calculation:
| (dollars in millions) | For the Three Months Ended June 30, 2022 | ||||
| Total face value of debt | $ | 21,444 | |||
| Less: Ending cash, cash equivalents and restricted cash | 446 | ||||
| Total Net Debt | $ | 20,998 | |||
| Adjusted EBITDA for the three months ended June 30, 2022 | $ | 1,078 | |||
| Last quarter annualized Adjusted EBITDA | 4,312 | ||||
| Net Debt to Last Quarter Annualized Adjusted EBITDA | 4.9 | x | |||
Components of Capital Expenditures:(a)
| For the Three Months Ended | |||||||||||||||||||||||||||||
| (in millions) | June 30, 2022 | June 30, 2021 | |||||||||||||||||||||||||||
| Towers | Fiber | Other | Total | Towers | Fiber | Other | Total | ||||||||||||||||||||||
| Discretionary: | |||||||||||||||||||||||||||||
| Purchases of land interests | $ | 15 | $ | — | $ | — | $ | 15 | $ | 21 | $ | — | $ | — | $ | 21 | |||||||||||||
Communications infrastructure improvements and other capital projects | 27 | 235 | 5 | 267 | 39 | 223 | 6 | 268 | |||||||||||||||||||||
| Sustaining | 3 | 12 | 6 | 21 | 3 | 12 | 4 | 19 | |||||||||||||||||||||
| Total | $ | 45 | $ | 247 | $ | 11 | $ | 303 | $ | 63 | $ | 235 | $ | 10 | $ | 308 | |||||||||||||
| For the Six Months Ended | |||||||||||||||||||||||||||||
| (in millions) | June 30, 2022 | June 30, 2021 | |||||||||||||||||||||||||||
| Towers | Fiber | Other | Total | Towers | Fiber | Other | Total | ||||||||||||||||||||||
| Discretionary: | |||||||||||||||||||||||||||||
| Purchases of land interests | $ | 25 | $ | — | $ | — | $ | 25 | $ | 35 | $ | — | $ | — | $ | 35 | |||||||||||||
Communications infrastructure improvements and other capital projects | 62 | 444 | 11 | 517 | 73 | 449 | 16 | 538 | |||||||||||||||||||||
| Sustaining | 5 | 25 | 12 | 42 | 6 | 23 | 7 | 36 | |||||||||||||||||||||
| Total | $ | 92 | $ | 469 | $ | 23 | $ | 584 | $ | 114 | $ | 472 | $ | 23 | $ | 609 | |||||||||||||
(a)See "Non-GAAP Financial Measures, Segment Measures and Other Calculations" for further discussion of our components of capital expenditures.
The pathway to possible.
CrownCastle.com
| News Release continued: | Page 17 | |||||||
Cautionary Language Regarding Forward-Looking Statements
This news release contains forward-looking statements and information that are based on our management's current expectations as of the date of this news release. Statements that are not historical facts are hereby identified as forward-looking statements. In addition, words such as "estimate," "see," "anticipate," "project," "plan," "intend," "believe," "expect," "likely," "predicted," "positioned," "continue," "target," "focus," and any variations of these words and similar expressions are intended to identify forward-looking statements. Such statements include our full year 2022 Outlook and plans, projections, and estimates regarding (1) potential benefits, growth, returns, capabilities, opportunities and shareholder value which may be derived from our business, strategy, risk profile, assets and customer solutions, investments, acquisitions and dividends, (2) our business, strategy, strategic position, business model and capabilities and the strength thereof, (3) 5G deployment in the United States and our customers' strategy and plans with respect thereto and demand for our assets and solutions created by such deployment and our customers' strategy and plans, (4) our long- and short-term prospects and the trends, events and industry activities impacting our business, (5) opportunities we see to deliver value to our shareholders, (6) our dividends (including timing of payment thereof), dividend targets, dividend payout ratio, and our long- and short-term dividend (including on a per share basis) growth rate, and its driving factors, (7) our debt and debt maturities, (8) cash flows, including growth thereof, (9) leasing environment and the leasing activity we see in our business (including with respect to our Towers segment), and benefits and opportunities created thereby, (10) tenant non-renewals, including the impact and timing thereof, (11) capital expenditures, including sustaining and discretionary capital expenditures, the timing and funding thereof and any benefits that may result therefrom, (12) revenues and growth thereof (including with respect to our Towers business) and benefits derived therefrom, (13) Income (loss) from continuing operations (including on a per share basis), (14) Adjusted EBITDA, including components thereof and growth thereof, (15) costs and expenses, including interest expense (and the increase thereof) and amortization of deferred financing costs, (16) FFO (including on a per share basis) and growth thereof, (17) AFFO (including on a per share basis) and its components and growth thereof and corresponding driving factors, (18) Organic Contribution to Site Rental Billings and its components, including growth thereof and contributions therefrom, (19) our weighted-average common shares outstanding (including on a diluted basis) and growth thereof, (20) site rental revenues and the growth thereof, (21) annual small cell deployment and the impacts therefrom, including its driving factors, (22) prepaid rent, including the additions and the amortization and growth thereof, (23) the strength of the U.S. market for communications infrastructure ownership, (24) the strength of our balance sheet, (25) the utility of certain financial measures, including non-GAAP financial measures, (26) investment opportunities and the benefits that may be derived therefrom, (27) interest rates, including the increase thereof, and the impacts therefrom, (28) our liquidity, (29) the change to our corporate name, including the timing thereof, (30) our operating conditions and expectations and (31) services contribution. All future dividends are subject to declaration by our board of directors.
Such forward-looking statements are subject to certain risks, uncertainties and assumptions, including prevailing market conditions and the following:
•Our business depends on the demand for our communications infrastructure, driven primarily by demand for data, and we may be adversely affected by any slowdown in such demand. Additionally, a reduction in the amount or change in the mix of network investment by our tenants may materially and adversely affect our business (including reducing demand for our communications infrastructure or services).
•A substantial portion of our revenues is derived from a small number of tenants, and the loss, consolidation or financial instability of any of such tenants may materially decrease revenues or reduce demand for our communications infrastructure and services.
•The expansion or development of our business, including through acquisitions, increased product offerings or other strategic growth opportunities, may cause disruptions in our business, which may have an adverse effect on our business, operations or financial results.
•Our Fiber segment has expanded rapidly, and the Fiber business model contains certain differences from our Towers business model, resulting in different operational risks. If we do not successfully operate our Fiber business model or identify or manage the related operational risks, such operations may produce results that are lower than anticipated.
•Failure to timely, efficiently and safely execute on our construction projects could adversely affect our business.
•New technologies may reduce demand for our communications infrastructure or negatively impact our revenues.
•If we fail to retain rights to our communications infrastructure, including the rights to land under our towers and the right-of-way and other agreements related to our small cells and fiber, our business may be adversely affected.
•Our services business has historically experienced significant volatility in demand, which reduces the predictability of our results.
•If radio frequency emissions from wireless handsets or equipment on our communications infrastructure are demonstrated to cause negative health effects, potential future claims could adversely affect our operations, costs or revenues.
•Cybersecurity breaches or other information technology disruptions could adversely affect our operations, business and reputation.
The pathway to possible.
CrownCastle.com
| News Release continued: | Page 18 | |||||||
•Our business may be adversely impacted by climate-related events, natural disasters, including wildfires, and other unforeseen events.
•The impact of COVID-19 and related risks could materially affect our financial position, results of operations and cash flows.
•As a result of competition in our industry, we may find it more difficult to negotiate favorable rates on our new or renewing tenant contracts.
•New wireless technologies may not deploy or be adopted by tenants as rapidly or in the manner projected.
•Our substantial level of indebtedness could adversely affect our ability to react to changes in our business, and the terms of our debt instruments limit our ability to take a number of actions that our management might otherwise believe to be in our best interests. In addition, if we fail to comply with our covenants, our debt could be accelerated.
•We have a substantial amount of indebtedness. In the event we do not repay or refinance such indebtedness, we could face substantial liquidity issues and might be required to issue equity securities or securities convertible into equity securities, or sell some of our assets to meet our debt payment obligations.
•Sales or issuances of a substantial number of shares of our common stock or securities convertible into shares of our common stock may adversely affect the market price of our common stock.
•Certain provisions of our restated certificate of incorporation, amended and restated by-laws and operative agreements, and domestic and international competition laws may make it more difficult for a third party to acquire control of us or for us to acquire control of a third party, even if such a change in control would be beneficial to our stockholders.
•If we fail to comply with laws or regulations which regulate our business and which may change at any time, we may be fined or even lose our right to conduct some of our business.
•Future dividend payments to our stockholders will reduce the availability of our cash on hand available to fund future discretionary investments, and may result in a need to incur indebtedness or issue equity securities to fund growth opportunities. In such event, the then current economic, credit market or equity market conditions will impact the availability or cost of such financing, which may hinder our ability to grow our per share results of operations.
•Remaining qualified to be taxed as a REIT involves highly technical and complex provisions of the U.S. Internal Revenue Code. Failure to remain qualified as a REIT would result in our inability to deduct dividends to stockholders when computing our taxable income, which would reduce our available cash.
•Complying with REIT requirements, including the 90% distribution requirement, may limit our flexibility or cause us to forgo otherwise attractive opportunities, including certain discretionary investments and potential financing alternatives.
•REIT related ownership limitations and transfer restrictions may prevent or restrict certain transfers of our capital stock.
Should one or more of these or other risks or uncertainties materialize, or should underlying assumptions prove incorrect, actual results may vary materially from those expected. More information about potential risk factors which could affect our results is included in our filings with the SEC. Our filings with the SEC are available through the SEC website at www.sec.gov or through our investor relations website at investor.crowncastle.com. We use our investor relations website to disclose information about us that may be deemed to be material. We encourage investors, the media and others interested in us to visit our investor relations website from time to time to review up-to-date information or to sign up for e-mail alerts to be notified when new or updated information is posted on the site.
As used in this release, the term "including," and any variation thereof, means "including without limitation."
The pathway to possible.
CrownCastle.com
| News Release continued: | Page 19 | |||||||
| CROWN CASTLE INTERNATIONAL CORP. CONDENSED CONSOLIDATED BALANCE SHEET (UNAUDITED) (Amounts in millions, except par values) | ||||
| June 30, 2022 | December 31, 2021 | ||||||||||
| ASSETS | |||||||||||
| Current assets: | |||||||||||
| Cash and cash equivalents | $ | 281 | $ | 292 | |||||||
| Restricted cash | 160 | 169 | |||||||||
| Receivables, net | 516 | 543 | |||||||||
| Prepaid expenses | 158 | 105 | |||||||||
| Other current assets | 175 | 145 | |||||||||
| Total current assets | 1,290 | 1,254 | |||||||||
| Deferred site rental receivables | 1,796 | 1,588 | |||||||||
| Property and equipment, net | 15,219 | 15,269 | |||||||||
| Operating lease right-of-use assets | 6,663 | 6,682 | |||||||||
| Goodwill | 10,087 | 10,078 | |||||||||
| Other intangible assets, net | 3,822 | 4,046 | |||||||||
| Other assets, net | 136 | 123 | |||||||||
| Total assets | $ | 39,013 | $ | 39,040 | |||||||
| LIABILITIES AND EQUITY | |||||||||||
| Current liabilities: | |||||||||||
| Accounts payable | $ | 230 | $ | 246 | |||||||
| Accrued interest | 180 | 182 | |||||||||
| Deferred revenues | 701 | 776 | |||||||||
| Other accrued liabilities | 342 | 401 | |||||||||
| Current maturities of debt and other obligations | 70 | 72 | |||||||||
| Current portion of operating lease liabilities | 348 | 349 | |||||||||
| Total current liabilities | 1,871 | 2,026 | |||||||||
| Debt and other long-term obligations | 21,212 | 20,557 | |||||||||
| Operating lease liabilities | 6,017 | 6,031 | |||||||||
| Other long-term liabilities | 2,052 | 2,168 | |||||||||
| Total liabilities | 31,152 | 30,782 | |||||||||
| Commitments and contingencies | |||||||||||
| Stockholders' equity: | |||||||||||
| Common stock, $0.01 par value; 1,200 shares authorized; shares issued and outstanding: June 30, 2022—433 and December 31, 2021—432 | 4 | 4 | |||||||||
| Additional paid-in capital | 18,050 | 18,011 | |||||||||
| Accumulated other comprehensive income (loss) | (5) | (4) | |||||||||
| Dividends/distributions in excess of earnings | (10,188) | (9,753) | |||||||||
| Total equity | 7,861 | 8,258 | |||||||||
| Total liabilities and equity | $ | 39,013 | $ | 39,040 | |||||||
The pathway to possible.
CrownCastle.com
| News Release continued: | Page 20 | |||||||
| CROWN CASTLE INTERNATIONAL CORP. CONDENSED CONSOLIDATED STATEMENT OF OPERATIONS (UNAUDITED) (Amounts in millions, except per share amounts) | ||||
| Three Months Ended June 30, | Six Months Ended June 30, | ||||||||||||||||||||||
| 2022 | 2021 | 2022 | 2021 | ||||||||||||||||||||
| Net revenues: | |||||||||||||||||||||||
| Site rental | $ | 1,567 | $ | 1,425 | $ | 3,143 | $ | 2,794 | |||||||||||||||
| Services and other | 167 | 158 | 333 | 274 | |||||||||||||||||||
| Net revenues | 1,734 | 1,583 | 3,476 | 3,068 | |||||||||||||||||||
| Operating expenses: | |||||||||||||||||||||||
Costs of operations:(a) | |||||||||||||||||||||||
| Site rental | 402 | 389 | 798 | 770 | |||||||||||||||||||
| Services and other | 112 | 105 | 225 | 186 | |||||||||||||||||||
| Selling, general and administrative | 190 | 169 | 371 | 333 | |||||||||||||||||||
| Asset write-down charges | 9 | 6 | 23 | 9 | |||||||||||||||||||
| Acquisition and integration costs | 1 | 1 | 1 | 1 | |||||||||||||||||||
| Depreciation, amortization and accretion | 427 | 408 | 847 | 816 | |||||||||||||||||||
| Total operating expenses | 1,141 | 1,078 | 2,265 | 2,115 | |||||||||||||||||||
| Operating income (loss) | 593 | 505 | 1,211 | 953 | |||||||||||||||||||
| Interest expense and amortization of deferred financing costs | (165) | (161) | (329) | (330) | |||||||||||||||||||
| Gains (losses) on retirement of long-term obligations | — | (1) | (26) | (144) | |||||||||||||||||||
| Interest income | — | 1 | 1 | 1 | |||||||||||||||||||
| Other income (expense) | (2) | (5) | (4) | (12) | |||||||||||||||||||
| Income (loss) before income taxes | 426 | 339 | 853 | 468 | |||||||||||||||||||
| Benefit (provision) for income taxes | (5) | (6) | (11) | (13) | |||||||||||||||||||
| Income (loss) from continuing operations | 421 | 333 | 842 | 455 | |||||||||||||||||||
| Discontinued operations: | |||||||||||||||||||||||
| Net gain (loss) from disposal of discontinued operations, net of tax | — | 1 | — | (62) | |||||||||||||||||||
| Income (loss) from discontinued operations, net of tax | — | 1 | — | (62) | |||||||||||||||||||
| Net income (loss) | $ | 421 | $ | 334 | $ | 842 | $ | 393 | |||||||||||||||
| Net income (loss), per common share: | |||||||||||||||||||||||
| Income (loss) from continuing operations, basic | $ | 0.97 | $ | 0.77 | $ | 1.95 | $ | 1.05 | |||||||||||||||
| Income (loss) from discontinued operations, basic | — | — | — | (0.14) | |||||||||||||||||||
| Net income (loss), basic | $ | 0.97 | $ | 0.77 | $ | 1.95 | $ | 0.91 | |||||||||||||||
| Income (loss) from continuing operations, diluted | $ | 0.97 | $ | 0.77 | $ | 1.94 | $ | 1.04 | |||||||||||||||
| Income (loss) from discontinued operations, diluted | — | — | — | (0.14) | |||||||||||||||||||
| Net income (loss), diluted | $ | 0.97 | $ | 0.77 | $ | 1.94 | $ | 0.90 | |||||||||||||||
| Weighted-average common shares outstanding: | |||||||||||||||||||||||
| Basic | 433 | 432 | 433 | 432 | |||||||||||||||||||
| Diluted | 434 | 434 | 434 | 434 | |||||||||||||||||||
(a)Exclusive of depreciation, amortization and accretion shown separately.
The pathway to possible.
CrownCastle.com
| News Release continued: | Page 21 | |||||||
| CROWN CASTLE INTERNATIONAL CORP. CONDENSED CONSOLIDATED STATEMENT OF CASH FLOWS (UNAUDITED) (In millions of dollars) | ||||
| Six Months Ended June 30, | |||||||||||
| 2022 | 2021 | ||||||||||
| Cash flows from operating activities: | |||||||||||
| Income (loss) from continuing operations | $ | 842 | $ | 455 | |||||||
| Adjustments to reconcile income (loss) from continuing operations to net cash provided by (used for) operating activities: | |||||||||||
| Depreciation, amortization and accretion | 847 | 816 | |||||||||
| (Gains) losses on retirement of long-term obligations | 26 | 144 | |||||||||
| Amortization of deferred financing costs and other non-cash interest, net | 7 | 6 | |||||||||
| Stock-based compensation expense | 83 | 67 | |||||||||
| Asset write-down charges | 23 | 9 | |||||||||
| Deferred income tax (benefit) provision | 1 | 3 | |||||||||
| Other non-cash adjustments, net | 3 | 14 | |||||||||
| Changes in assets and liabilities, excluding the effects of acquisitions: | |||||||||||
| Increase (decrease) in liabilities | (232) | (56) | |||||||||
| Decrease (increase) in assets | (263) | (87) | |||||||||
| Net cash provided by (used for) operating activities | 1,337 | 1,371 | |||||||||
| Cash flows from investing activities: | |||||||||||
| Capital expenditures | (584) | (609) | |||||||||
| Payments for acquisitions, net of cash acquired | (15) | (15) | |||||||||
| Other investing activities, net | (10) | 8 | |||||||||
| Net cash provided by (used for) investing activities | (609) | (616) | |||||||||
| Cash flows from financing activities: | |||||||||||
| Proceeds from issuance of long-term debt | 748 | 3,985 | |||||||||
| Principal payments on debt and other long-term obligations | (36) | (1,038) | |||||||||
| Purchases and redemptions of long-term debt | (1,274) | (1,789) | |||||||||
| Borrowings under revolving credit facility | 2,050 | 580 | |||||||||
| Payments under revolving credit facility | (1,565) | (870) | |||||||||
| Net borrowings (repayments) under commercial paper program | 687 | (210) | |||||||||
| Payments for financing costs | (8) | (39) | |||||||||
| Purchases of common stock | (63) | (68) | |||||||||
| Dividends/distributions paid on common stock | (1,287) | (1,163) | |||||||||
| Net cash provided by (used for) financing activities | (748) | (612) | |||||||||
| Net increase (decrease) in cash, cash equivalents, and restricted cash | (20) | 143 | |||||||||
| Effect of exchange rate changes on cash | — | 1 | |||||||||
| Cash, cash equivalents, and restricted cash at beginning of period | 466 | 381 | |||||||||
| Cash, cash equivalents, and restricted cash at end of period | $ | 446 | $ | 525 | |||||||
| Supplemental disclosure of cash flow information: | |||||||||||
| Interest paid | 324 | 344 | |||||||||
| Income taxes paid | 9 | 13 | |||||||||
The pathway to possible.
CrownCastle.com
| News Release continued: | Page 22 | |||||||
| CROWN CASTLE INTERNATIONAL CORP. SEGMENT OPERATING RESULTS (UNAUDITED) (In millions of dollars) | ||||
| SEGMENT OPERATING RESULTS | |||||||||||||||||||||||||||||||||||||||||||||||
| Three Months Ended June 30, 2022 | Three Months Ended June 30, 2021 | ||||||||||||||||||||||||||||||||||||||||||||||
| Towers | Fiber | Other | Consolidated Total | Towers | Fiber | Other | Consolidated Total | ||||||||||||||||||||||||||||||||||||||||
| Segment site rental revenues | $ | 1,078 | $ | 489 | $ | 1,567 | $ | 952 | $ | 473 | $ | 1,425 | |||||||||||||||||||||||||||||||||||
| Segment services and other revenues | 164 | 3 | 167 | 154 | 4 | 158 | |||||||||||||||||||||||||||||||||||||||||
| Segment revenues | 1,242 | 492 | 1,734 | 1,106 | 477 | 1,583 | |||||||||||||||||||||||||||||||||||||||||
| Segment site rental costs of operations | 232 | 162 | 394 | 221 | 161 | 382 | |||||||||||||||||||||||||||||||||||||||||
| Segment services and other costs of operations | 107 | 2 | 109 | 100 | 3 | 103 | |||||||||||||||||||||||||||||||||||||||||
Segment costs of operations(a)(b) | 339 | 164 | 503 | 321 | 164 | 485 | |||||||||||||||||||||||||||||||||||||||||
Segment site rental gross margin(c) | 846 | 327 | 1,173 | 731 | 312 | 1,043 | |||||||||||||||||||||||||||||||||||||||||
Segment services and other gross margin(c) | 57 | 1 | 58 | 54 | 1 | 55 | |||||||||||||||||||||||||||||||||||||||||
Segment selling, general and administrative expenses(b) | 28 | 46 | 74 | 26 | 44 | 70 | |||||||||||||||||||||||||||||||||||||||||
Segment operating profit(c) | 875 | 282 | 1,157 | 759 | 269 | 1,028 | |||||||||||||||||||||||||||||||||||||||||
Other selling, general and administrative expenses(b) | $ | 79 | 79 | $ | 70 | 70 | |||||||||||||||||||||||||||||||||||||||||
| Stock-based compensation expense | 44 | 44 | 34 | 34 | |||||||||||||||||||||||||||||||||||||||||||
Depreciation, amortization and accretion | 427 | 427 | 408 | 408 | |||||||||||||||||||||||||||||||||||||||||||
Interest expense and amortization of deferred financing costs | 165 | 165 | 161 | 161 | |||||||||||||||||||||||||||||||||||||||||||
Other (income) expenses to reconcile to income (loss) before income taxes(d) | 16 | 16 | 16 | 16 | |||||||||||||||||||||||||||||||||||||||||||
Income (loss) before income taxes | $ | 426 | $ | 339 | |||||||||||||||||||||||||||||||||||||||||||
| FIBER SEGMENT SITE RENTAL REVENUES SUMMARY | |||||||||||||||||||||||||||||||||||
| Three Months Ended June 30, | |||||||||||||||||||||||||||||||||||
| 2022 | 2021 | ||||||||||||||||||||||||||||||||||
| Fiber Solutions | Small Cells | Total | Fiber Solutions | Small Cells | Total | ||||||||||||||||||||||||||||||
| Site rental revenues | $ | 333 | $ | 156 | $ | 489 | $ | 329 | $ | 144 | $ | 473 | |||||||||||||||||||||||
(a)Exclusive of depreciation, amortization and accretion shown separately.
(b)Segment costs of operations exclude (1) stock-based compensation expense of $7 million and $5 million for the three months ended June 30, 2022 and 2021, respectively, (2) prepaid lease purchase price adjustments of $4 million for each of the the three months ended June 30, 2022 and 2021. Selling, general and administrative expenses exclude stock-based compensation expense of $37 million and $29 million for the three months ended June 30, 2022 and 2021, respectively.
(c)See "Non-GAAP Financial Measures, Segment Measures and Other Calculations" for a discussion of our definitions of segment site rental gross margin, segment services and other gross margin and segment operating profit.
(d)See condensed consolidated statement of operations for further information.
The pathway to possible.
CrownCastle.com
| News Release continued: | Page 23 | |||||||
| SEGMENT OPERATING RESULTS | |||||||||||||||||||||||||||||||||||||||||||||||
| Six Months Ended June 30, 2022 | Six Months Ended June 30, 2021 | ||||||||||||||||||||||||||||||||||||||||||||||
| Towers | Fiber | Other | Consolidated Total | Towers | Fiber | Other | Consolidated Total | ||||||||||||||||||||||||||||||||||||||||
| Segment site rental revenues | $ | 2,153 | $ | 990 | $ | 3,143 | $ | 1,847 | $ | 947 | $ | 2,794 | |||||||||||||||||||||||||||||||||||
| Segment services and other revenues | 327 | 6 | 333 | 265 | 9 | 274 | |||||||||||||||||||||||||||||||||||||||||
| Segment revenues | 2,480 | 996 | 3,476 | 2,112 | 956 | 3,068 | |||||||||||||||||||||||||||||||||||||||||
| Segment site rental costs of operations | 458 | 323 | 781 | 433 | 322 | 755 | |||||||||||||||||||||||||||||||||||||||||
| Segment services and other costs of operations | 216 | 4 | 220 | 175 | 6 | 181 | |||||||||||||||||||||||||||||||||||||||||
Segment costs of operations(a)(b) | 674 | 327 | 1,001 | 608 | 328 | 936 | |||||||||||||||||||||||||||||||||||||||||
Segment site rental gross margin(c) | 1,695 | 667 | 2,362 | 1,414 | 625 | 2,039 | |||||||||||||||||||||||||||||||||||||||||
Segment services and other gross margin(c) | 111 | 2 | 113 | 90 | 3 | 93 | |||||||||||||||||||||||||||||||||||||||||
Segment selling, general and administrative expenses(b) | 56 | 93 | 149 | 51 | 89 | 140 | |||||||||||||||||||||||||||||||||||||||||
Segment operating profit(c) | 1,750 | 576 | 2,326 | 1,453 | 539 | 1,992 | |||||||||||||||||||||||||||||||||||||||||
Other selling, general and administrative expenses(b) | $ | 153 | 153 | $ | 136 | 136 | |||||||||||||||||||||||||||||||||||||||||
| Stock-based compensation expense | 83 | 83 | 68 | 68 | |||||||||||||||||||||||||||||||||||||||||||
Depreciation, amortization and accretion | 847 | 847 | 816 | 816 | |||||||||||||||||||||||||||||||||||||||||||
Interest expense and amortization of deferred financing costs | 329 | 329 | 330 | 330 | |||||||||||||||||||||||||||||||||||||||||||
Other (income) expenses to reconcile to income (loss) before income taxes(d) | 61 | 61 | 174 | 174 | |||||||||||||||||||||||||||||||||||||||||||
Income (loss) before income taxes | $ | 853 | $ | 468 | |||||||||||||||||||||||||||||||||||||||||||
| FIBER SEGMENT SITE RENTAL REVENUES SUMMARY | |||||||||||||||||||||||||||||||||||
| Six Months Ended June 30, | |||||||||||||||||||||||||||||||||||
| 2022 | 2021 | ||||||||||||||||||||||||||||||||||
| Fiber Solutions | Small Cells | Total | Fiber Solutions | Small Cells | Total | ||||||||||||||||||||||||||||||
| Site rental revenues | $ | 679 | $ | 311 | $ | 990 | $ | 659 | $ | 288 | $ | 947 | |||||||||||||||||||||||
(a) Exclusive of depreciation, amortization and accretion shown separately.
(b) Segment costs of operations exclude (1) stock-based compensation expense of $14 million and $11 million for the six months ended June 30, 2022 and 2021, respectively, and (2) prepaid lease purchase price adjustments of $8 million and $9 million for the six months ended June 30, 2022 and 2021, respectively. Selling, general and administrative expenses exclude stock-based compensation expense of $69 million and $57 million for the six months ended June 30, 2022 and 2021, respectively.
(c) See "Non-GAAP Financial Measures, Segment Measures and Other Calculations" for a discussion of our definitions of segment site rental gross margin, segment services and other gross margin and segment operating profit.
(d) See condensed consolidated statement of operations for further information.
The pathway to possible.
CrownCastle.com
Exhibit 99.2
 | NEWS RELEASE July 20, 2022 | |||||||
| Contacts: Dan Schlanger, CFO | |||||
| Ben Lowe, SVP & Treasurer | |||||
| FOR IMMEDIATE RELEASE | Crown Castle International Corp. | ||||
| 713-570-3050 | |||||
Crown Castle Releases 2021 ESG Report
July 20, 2022 - HOUSTON, TEXAS - Crown Castle International Corp. (NYSE: CCI) ("Crown Castle" or the "Company") announced today the release of its 2021 Environmental, Social and Governance (ESG) Report and launch of its ESG website, furthering its approach of providing timely and accessible ESG disclosures.
"For over 25 years, Crown Castle has met the increased need for connectivity through its shared communications infrastructure model, which is inherently sustainable. We build once and use our infrastructure for multiple customers," stated Jay Brown, Crown Castle's Chief Executive Officer. "As 5G drives demand in the US across our assets – towers, small cells and fiber – we're taking important steps to make progress on our previously established ESG goals. We are also focused on improving our ESG disclosure, increasing transparency and continuing to build an inclusive and diverse community that creates long-term, sustainable benefits to our teammates, stakeholders and all who interact with Crown Castle."
Crown Castle ESG highlights:
•In 2021, Crown Castle established a goal to be carbon neutral in Scope 1 and Scope 2 emissions by 2025 and entered into a multi-year contract to source renewable energy, which for 2022 represents over 60% of Crown Castle’s estimated annual electricity consumption.
•As part of Crown Castle's efforts to reduce energy consumption, the Company has converted more than 50% of its lit towers to energy efficient LED lighting.
•In line with Crown Castle's focus on providing profitable solutions to connect communities and people, the Company has invested an aggregate of approximately $10 billion of capital in communication infrastructure in low-income areas.
•Crown Castle established a goal in 2021 to increase spending with diverse suppliers to 16% by 2026, which represented the top quartile in US diversity spend among more than 100 large companies.1 In 2021, 10% of the Company's addressable spend was with diverse suppliers.
•Following the execution of Crown Castle's board refreshment strategy, 60% of its board of directors is comprised of women and/or persons of color, with a diverse balance of applicable skills, background and expertise.
The 2021 ESG Report, and many of the ESG disclosures and policies included in prior ESG reports, can now be found on the ESG website at www.crowncastle.com/esg.
ABOUT CROWN CASTLE
Crown Castle owns, operates and leases more than 40,000 cell towers and approximately 85,000 route miles of fiber supporting small cells and fiber solutions across every major U.S. market. This nationwide portfolio of communications infrastructure connects cities and communities to essential data, technology and wireless service – bringing information, ideas and innovations to the people and businesses that need them. For more information on Crown Castle, please visit www.crowncastle.com.
CAUTIONARY LANGUAGE REGARDING FORWARD-LOOKING STATEMENTS
This news release contains forward-looking statements that are based on management's current expectations. Such statements include plans, commitments, projections, estimates and expectations regarding (1) 5G deployment and the demand for our assets created thereby, (2) our ESG goals, progress made with respect thereto and plans related thereto, (3) an inclusive and diverse community and the benefits derived therefrom, and (4) electricity consumption and consumption reduction plans and investments. Such forward-looking statements are subject to certain risks, uncertainties and assumptions, including prevailing market conditions. Should one or more of these risks or uncertainties materialize, or should underlying assumptions prove incorrect, actual results may vary materially from those expected. More information about potential risks that could affect Crown Castle and its results is included in Crown Castle's filings with the Securities and Exchange Commission. The term "including," and any variation thereof, means "including, without limitation."
1 Source: The Hackett Group, 2021 Supplier Diversity Study.
Exhibit 99.3


Supplemental Information Package
and Non-GAAP Reconciliations
Second Quarter • June 30, 2022
The pathway to possible.
CrownCastle.com
Crown Castle International Corp.
Second Quarter 2022
| TABLE OF CONTENTS | |||||
| Page | |||||
| Company Overview | |||||
| Company Profile | |||||
| Strategy | |||||
| AFFO per Share | |||||
| Asset Portfolio Footprint | |||||
| General Company Information, Executive Management Team and Board of Directors | |||||
| Research Coverage | |||||
| Historical Common Stock Data | |||||
| Summary Portfolio and Financial Highlights | |||||
| Outlook | |||||
| Financials & Metrics | |||||
| Condensed Consolidated Balance Sheet | |||||
| Condensed Consolidated Statement of Operations | |||||
| Segment Operating Results | |||||
| Fiber Segment Site Rental Revenues Summary | |||||
| FFO and AFFO Reconciliations | |||||
| Condensed Consolidated Statement of Cash Flows | |||||
| Components of Changes in Site Rental Revenues | |||||
| Summary of Site Rental Straight-Lined Revenues and Expenses and Prepaid Rent Activity | |||||
| Summary of Capital Expenditures | |||||
| Projected Revenues from Tenant Contracts | |||||
| Projected Expenses from Existing Ground Leases and Fiber Access Agreements | |||||
| Annualized Rental Cash Payments at Time of Renewal | |||||
| Consolidated Tenant Overview | |||||
| Fiber Solutions Revenue Mix | |||||
| Segment Cash Yields on Invested Capital | |||||
| Consolidated Return on Invested Capital | |||||
| Asset Portfolio Overview | |||||
| Summary of Tower Portfolio by Vintage | |||||
| Tower Portfolio Overview | |||||
| Distribution of Tower Tenancy | |||||
| Ground Interest Overview | |||||
| Ground Interest Activity | |||||
| Capitalization Overview | |||||
| Capitalization Overview | |||||
| Debt Maturity Overview | |||||
| Liquidity Overview | |||||
| Summary of Maintenance and Financial Covenants | |||||
| Interest Rate Sensitivity | |||||
| Appendix | |||||
1
Crown Castle International Corp.
Second Quarter 2022
Cautionary Language Regarding Forward-Looking Statements
This supplemental information package ("Supplement") contains forward-looking statements and information that are based on our management's current expectations as of the date of this Supplement. Statements that are not historical facts are hereby identified as forward-looking statements. Words such as "Outlook," "guide," "forecast," "estimate," "anticipate," "project," "plan," "intend," "believe," "expect," "likely," "predicted," "positioned," and any variations of these words and similar expressions are intended to identify such forward looking statements. Such statements include plans, projections and estimates regarding (1) demand for data and our communications infrastructure, and benefits derived therefrom, (2) cash flow growth, (3) tenant additions, (4) our Outlook for full year 2022, (5) our business and strategy and the potential benefits and stockholder value derived therefrom, (6) strategic position of our assets, (7) revenues from tenant contracts, (8) expenses from existing ground leases and fiber access agreements, (9) the recurrence and impact of Nontypical Items, (10) availability under our 2016 Revolver, (11) growth in the Fiber segment and any benefits derived therefrom and (12) the utility of certain financial measures, including non-GAAP financial measures.
Such forward-looking statements are subject to certain risks, uncertainties and assumptions, including, but not limited to, prevailing market conditions. Should one or more of these or other risks or uncertainties materialize, or should underlying assumptions prove incorrect, actual results may vary materially from those expected. Crown Castle assumes no obligation to update publicly any forward-looking statements, whether as a result of new information, future events or otherwise. More information about potential risk factors which could affect our results is included in our filings with the Securities and Exchange Commission ("SEC"). Our filings with the SEC are available through the SEC website at www.sec.gov or through our investor relations website at investor.crowncastle.com. We use our investor relations website to disclose information about us that may be deemed to be material. We encourage investors, the media and others interested in us to visit our investor relations website from time to time to review up-to-date information or to sign up for e-mail alerts to be notified when new or updated information is posted on the site.
This Supplement contains certain figures, projections and calculations based in part on management's underlying assumptions. Management believes these assumptions are reasonable; however, other reasonable assumptions could provide differing outputs.
The components of financial information presented herein, both historical and forward looking, may not sum due to rounding. Definitions and reconciliations of non-GAAP financial measures, segment measures and other calculations are provided in the Appendix to this Supplement.
As used herein, the term "including" and any variation thereof, means "including without limitation." The use of the word "or" herein is not exclusive.
2
Crown Castle International Corp.
Second Quarter 2022
| COMPANY OVERVIEW | FINANCIALS & METRICS | ASSET PORTFOLIO OVERVIEW | CAPITALIZATION OVERVIEW | APPENDIX | ||||||||||
COMPANY PROFILE | ||||||||||||||
Crown Castle International Corp. (to which the terms "Crown Castle," "CCIC," "we," "our," "the Company" or "us" as used herein refer) owns, operates and leases shared communications infrastructure that is geographically dispersed throughout the U.S., including (1) more than 40,000 towers and other structures, such as rooftops (collectively, "towers"), and (2) approximately 85,000 route miles of fiber primarily supporting small cell networks ("small cells") and fiber solutions. We refer to our towers, fiber and small cell assets collectively as "communications infrastructure," and to our customers on our communications infrastructure as "tenants." Our towers have a significant presence in each of the top 100 basic trading areas, and the majority of our small cells and fiber are located in major metropolitan areas, including a presence within every major U.S. market.
Our operating segments consist of (1) Towers and (2) Fiber, which includes both small cells and fiber solutions. Our core business is providing access, including space or capacity, to our shared communications infrastructure via long-term contracts in various forms, including lease, license, sublease and service agreements (collectively, "tenant contracts"). We seek to increase our site rental revenues by adding more tenants on our shared communications infrastructure, which we expect to result in significant incremental cash flows due to our low incremental operating costs.
We operate as a Real Estate Investment Trust ("REIT") for U.S. federal income tax purposes.
STRATEGY | ||||||||||||||
As a leading provider of shared communications infrastructure in the U.S., our strategy is to create long-term stockholder value via a combination of (1) growing cash flows generated from our existing portfolio of communications infrastructure, (2) returning a meaningful portion of our cash generated by operating activities to our common stockholders in the form of dividends and (3) investing capital efficiently to grow cash flows and long-term dividends per share. Our strategy is based, in part, on our belief that the U.S. is the most attractive market for shared communications infrastructure investment with the greatest long-term growth potential. We measure our efforts to create "long-term stockholder value" by the combined payment of dividends to stockholders and growth in our per-share results. The key elements of our strategy are to:
•Grow cash flows from our existing communications infrastructure. We are focused on maximizing the recurring site rental cash flows generated from providing our tenants with long-term access to our shared infrastructure assets, which we believe is the core driver of value for our stockholders. Tenant additions or modifications of existing tenant equipment (collectively, "tenant additions") enable our tenants to expand coverage and capacity in order to meet increasing demand for data, while generating high incremental returns for our business. We believe our product offerings of towers and small cells provide a comprehensive solution to our wireless tenants' growing network needs through our shared communications infrastructure model, which is an efficient and cost-effective way to serve our tenants. Additionally, we believe our ability to share our fiber assets across multiple tenants to deploy both small cells and offer fiber solutions allows us to generate cash flows and increase stockholder return.
•Return cash generated by operating activities to common stockholders in the form of dividends. We believe that distributing a meaningful portion of our cash generated by operating activities appropriately provides common stockholders with increased certainty for a portion of expected long-term stockholder value while still allowing us to retain sufficient flexibility to invest in our business and deliver growth. We believe this decision reflects the translation of the high-quality, long-term contractual cash flows of our business into stable capital returns to common stockholders.
•Invest capital efficiently to grow cash flows and long-term dividends per share. In addition to adding tenants to existing communications infrastructure, we seek to invest our available capital, including the net cash generated by our operating activities and external financing sources, in a manner that will increase long-term stockholder value on a risk-adjusted basis. These investments include constructing and acquiring new communications infrastructure that we expect will generate future cash flow growth and attractive long-term returns by adding tenants to those assets over time. Our historical investments have included the following (in no particular order):
◦construction of towers, fiber and small cells;
◦acquisitions of towers, fiber and small cells;
◦acquisitions of land interests (which primarily relate to land assets under towers);
◦improvements and structural enhancements to our existing communications infrastructure;
◦purchases of shares of our common stock from time to time; and
◦purchases, repayments or redemptions of our debt.
3
Crown Castle International Corp.
Second Quarter 2022
| COMPANY OVERVIEW | FINANCIALS & METRICS | ASSET PORTFOLIO OVERVIEW | CAPITALIZATION OVERVIEW | APPENDIX | ||||||||||
Our strategy to create long-term stockholder value is based on our belief that there will be considerable future demand for our communications infrastructure based on the location of our assets and the rapid growth in the demand for data. We believe that such demand for our communications infrastructure will continue, will result in growth of our cash flows due to tenant additions on our existing communications infrastructure, and will create other growth opportunities for us, such as demand for newly constructed or acquired communications infrastructure, as described above. Further, we seek to augment the long-term value creation associated with growing our recurring site rental cash flows by offering certain ancillary site development and installation services within our Towers segment.
4
Crown Castle International Corp.
Second Quarter 2022
| COMPANY OVERVIEW | FINANCIALS & METRICS | ASSET PORTFOLIO OVERVIEW | CAPITALIZATION OVERVIEW | APPENDIX | ||||||||||
AFFO PER SHARE(a) | ||
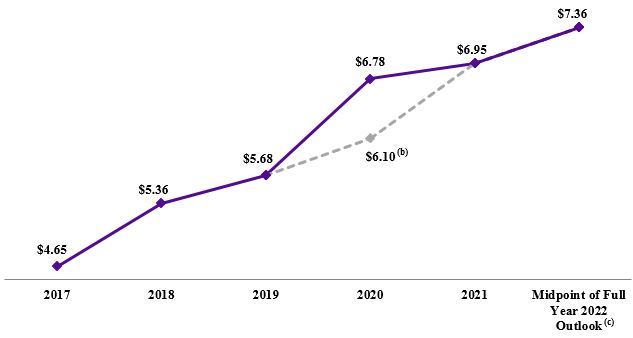
| ASSET PORTFOLIO FOOTPRINT | ||||||||
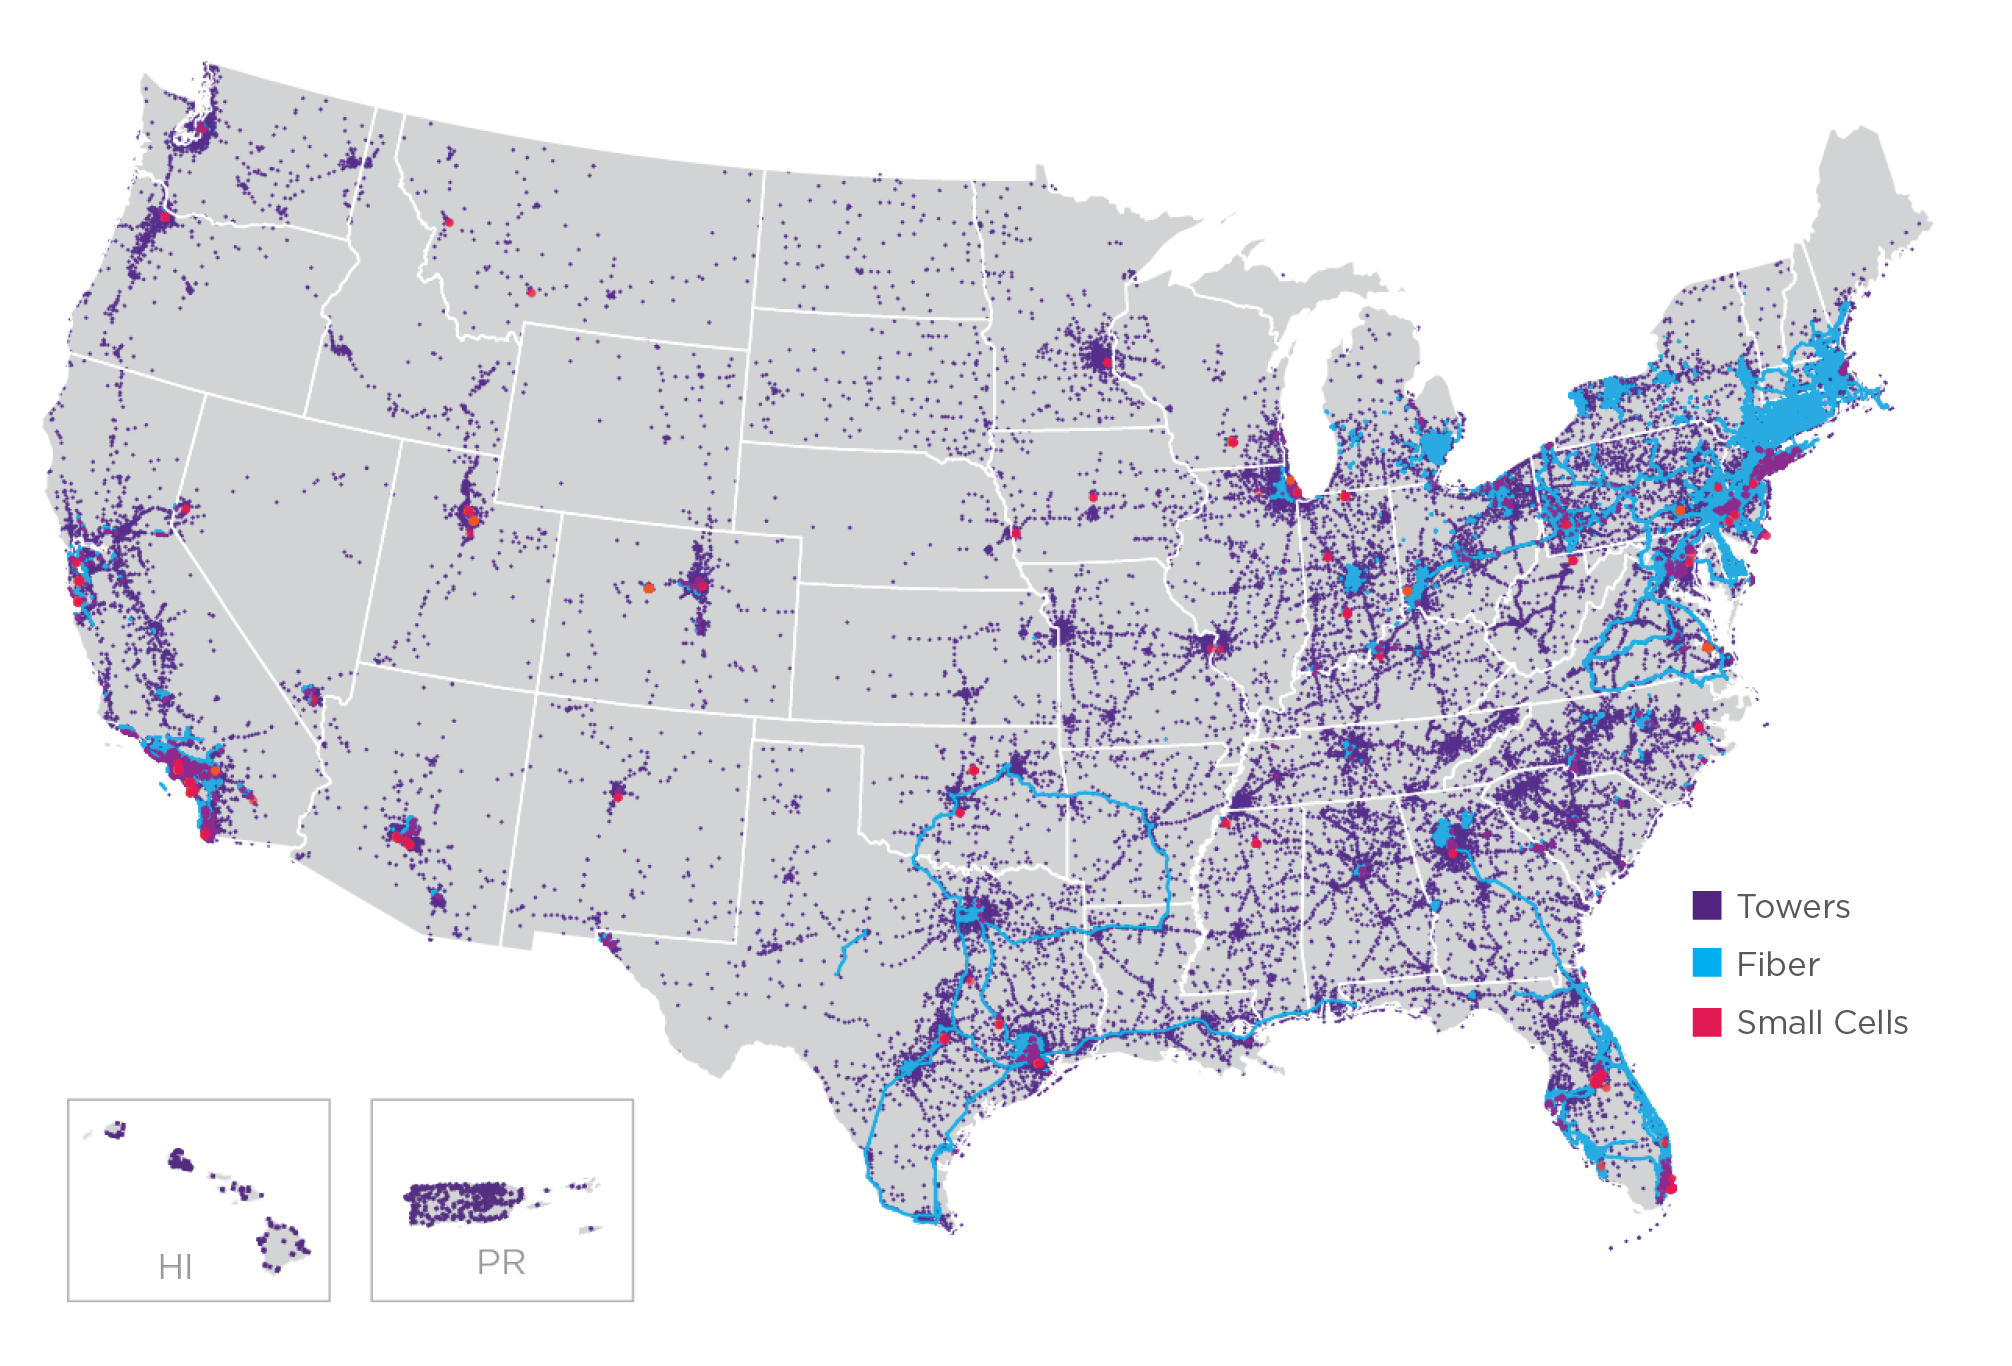 | ||||||||
(a)See "Non-GAAP Financial Measures, Segment Measures and Other Calculations" for further information and reconciliation of non-GAAP financial measures to income (loss) from continuing operations, as computed in accordance with GAAP.
(b)Excludes the impact of nontypical items that were completed in fourth quarter 2020 ("Nontypical Items"), as described in our press release dated January 27, 2021 and reconciled in "Non-GAAP Financial Measures, Segment Measures and Other Calculations" herein.
(c)Calculated based on midpoint of full year 2022 Outlook as issued on July 20, 2022.
5
Crown Castle International Corp.
Second Quarter 2022
| COMPANY OVERVIEW | FINANCIALS & METRICS | ASSET PORTFOLIO OVERVIEW | CAPITALIZATION OVERVIEW | APPENDIX | ||||||||||
| GENERAL COMPANY INFORMATION | |||||
| Principal executive offices | 8020 Katy Freeway, Houston, TX 77024 | ||||
| Common shares trading symbol | CCI | ||||
| Stock exchange listing | New York Stock Exchange | ||||
| Fiscal year ending date | December 31 | ||||
| Fitch - Long Term Issuer Default Rating | BBB+ | ||||
| Moody’s - Long Term Corporate Family Rating | Baa3 | ||||
| Standard & Poor’s - Long Term Local Issuer Credit Rating | BBB- | ||||
Note: These credit ratings may not reflect the potential risks relating to the structure or trading of the Company’s securities and are provided solely for informational purposes. Credit ratings are not recommendations to buy, sell or hold any security, and may be revised or withdrawn at any time by the issuing organization in its sole discretion. The Company does not undertake any obligation to maintain the ratings or to advise of any change in the ratings. Each agency’s rating should be evaluated independently of any other agency’s rating. An explanation of the significances of the ratings can be obtained from each of the ratings agencies.
| EXECUTIVE MANAGEMENT TEAM | |||||||||||
| Name | Age | Years with Company | Position | ||||||||
| Jay A. Brown | 49 | 22 | President and Chief Executive Officer | ||||||||
| Daniel K. Schlanger | 48 | 6 | Executive Vice President and Chief Financial Officer | ||||||||
| Catherine Piche | 51 | 11 | Executive Vice President and Chief Operating Officer - Towers | ||||||||
| Christopher D. Levendos | 54 | 4 | Executive Vice President and Chief Operating Officer - Fiber | ||||||||
| Kenneth J. Simon | 61 | 6 | Executive Vice President and General Counsel | ||||||||
| Michael J. Kavanagh | 54 | 11 | Executive Vice President and Chief Commercial Officer | ||||||||
| Philip M. Kelley | 49 | 25 | Executive Vice President - Corporate Development and Strategy | ||||||||
| Laura B. Nichol | 62 | 8 | Executive Vice President - Business Support | ||||||||
| BOARD OF DIRECTORS | ||||||||||||||
| Name | Position | Committees | Age | Years as Director | ||||||||||
| P. Robert Bartolo | Chair | Audit, Compensation, Strategy | 50 | 8 | ||||||||||
| Cindy Christy | Director | Compensation, NESG(a), Strategy | 56 | 14 | ||||||||||
| Ari Q. Fitzgerald | Director | Compensation, NESG(a), Strategy | 59 | 19 | ||||||||||
| Anthony J. Melone | Director | Audit, NESG(a), Strategy | 62 | 7 | ||||||||||
| Jay A. Brown | Director | 49 | 6 | |||||||||||
| Andrea J. Goldsmith | Director | NESG(a), Strategy | 57 | 4 | ||||||||||
| Tammy K. Jones | Director | Audit, NESG(a), Strategy | 56 | 1 | ||||||||||
| W. Benjamin Moreland | Director | Strategy | 58 | 15 | ||||||||||
| Kevin A. Stephens | Director | Audit, Compensation, Strategy | 60 | 1 | ||||||||||
| Matthew Thornton III | Director | Compensation, Strategy | 63 | 1 | ||||||||||
(a)Nominating, Environmental, Social and Governance Committee
6
Crown Castle International Corp.
Second Quarter 2022
| COMPANY OVERVIEW | FINANCIALS & METRICS | ASSET PORTFOLIO OVERVIEW | CAPITALIZATION OVERVIEW | APPENDIX | ||||||||||
| RESEARCH COVERAGE | ||||||||
| Equity Research | ||||||||
| Bank of America David Barden (646) 855-1320 | Barclays Tim Long (212) 526-4043 | Citigroup Michael Rollins (212) 816-1116 | ||||||
| Cowen and Company Gregory Williams (646) 562-1367 | Credit Suisse Sami Badri (212) 538-1727 | Deutsche Bank Matthew Niknam (212) 250-4711 | ||||||
| Goldman Sachs Brett Feldman (212) 902-8156 | Green Street David Guarino (949) 640-8780 | Jefferies Jonathan Petersen (212) 284-1705 | ||||||
| JPMorgan Philip Cusick (212) 622-1444 | KeyBanc Brandon Nispel (503) 821-3871 | LightShed Partners Walter Piecyk (646) 450-9258 | ||||||
| MoffettNathanson Nick Del Deo (212) 519-0025 | Morgan Stanley Simon Flannery (212) 761-6432 | New Street Research Jonathan Chaplin (212) 921-9876 | ||||||
| Raymond James Ric Prentiss (727) 567-2567 | RBC Capital Markets Jonathan Atkin (415) 633-8589 | Truist Securities Greg Miller (212) 303-4169 | ||||||
| UBS Batya Levi (212) 713-8824 | Wells Fargo Securities, LLC Eric Luebchow (312) 630-2386 | Wolfe Research Andrew Rosivach (646) 582-9350 | ||||||
| Rating Agencies | ||||||||
| Fitch John Culver (312) 368-3216 | Moody’s Lori Marks (212) 553-1098 | Standard & Poor’s Ryan Gilmore (212) 438-0602 | ||||||
| HISTORICAL COMMON STOCK DATA | |||||||||||||||||
| Three Months Ended | |||||||||||||||||
| (in millions, except per share amounts) | 6/30/22 | 3/31/22 | 12/31/21 | 9/30/21 | 6/30/21 | ||||||||||||
High price(a) | $ | 198.23 | $ | 205.42 | $ | 206.27 | $ | 198.25 | $ | 193.04 | |||||||
Low price(a) | $ | 153.70 | $ | 154.31 | $ | 162.15 | $ | 168.89 | $ | 165.09 | |||||||
Period end closing price(b) | $ | 168.38 | $ | 182.97 | $ | 205.14 | $ | 169.07 | $ | 188.98 | |||||||
| Dividends paid per common share | $ | 1.47 | $ | 1.47 | $ | 1.47 | $ | 1.33 | $ | 1.33 | |||||||
Volume weighted average price for the period(a) | $ | 178.94 | $ | 174.46 | $ | 179.24 | $ | 186.74 | $ | 180.16 | |||||||
| Common shares outstanding, at period end | 433 | 433 | 432 | 432 | 432 | ||||||||||||
Market value of outstanding common shares, at period end(c) | $ | 72,915 | $ | 79,230 | $ | 88,664 | $ | 73,072 | $ | 81,678 | |||||||
(a) Based on the sales price, adjusted for common stock dividends, as reported by Bloomberg.
(b) Based on the period end closing price, adjusted for common stock dividends, as reported by Bloomberg.
(c) Period end market value of outstanding common shares is calculated as the product of (1) shares of common stock outstanding at period end and (2) closing share price at period end, adjusted for common stock dividends, as reported by Bloomberg.
7
Crown Castle International Corp.
Second Quarter 2022
| COMPANY OVERVIEW | FINANCIALS & METRICS | ASSET PORTFOLIO OVERVIEW | CAPITALIZATION OVERVIEW | APPENDIX | ||||||||||
| SUMMARY PORTFOLIO HIGHLIGHTS | |||||
| (as of June 30, 2022) | |||||
| Towers | |||||
Number of towers (in thousands)(a) | 40 | ||||
| Average number of tenants per tower | 2.4 | ||||
Remaining contracted tenant receivables ($ in billions)(b) | $ | 36 | |||
Weighted average remaining tenant contract term (years)(b)(c) | 7 | ||||
| Percent of towers in the Top 50 / 100 Basic Trading Areas | 56% / 71% | ||||
Percent of ground leased / owned(d) | 59% / 41% | ||||
Weighted average maturity of ground leases (years)(d)(e) | 36 | ||||
| Fiber | |||||
| Number of route miles of fiber (in thousands) | 85 | ||||
Remaining contracted tenant receivables ($ in billions)(b) | $ | 5 | |||
Weighted average remaining tenant contract term (years)(b)(c) | 4 | ||||
| SUMMARY FINANCIAL HIGHLIGHTS | |||||||||||||||||||||||
| Three Months Ended June 30, | Six Months Ended June 30, | ||||||||||||||||||||||
| (in millions, except per share amounts) | 2022 | 2021 | 2022 | 2021 | |||||||||||||||||||
| Operating Data: | |||||||||||||||||||||||
| Net revenues | |||||||||||||||||||||||
| Site rental | $ | 1,567 | $ | 1,425 | $ | 3,143 | $ | 2,794 | |||||||||||||||
| Services and other | 167 | 158 | 333 | 274 | |||||||||||||||||||
| Net revenues | $ | 1,734 | $ | 1,583 | $ | 3,476 | $ | 3,068 | |||||||||||||||
Costs of operations (exclusive of depreciation, amortization and accretion) | |||||||||||||||||||||||
| Site rental | $ | 402 | $ | 389 | $ | 798 | $ | 770 | |||||||||||||||
| Services and other | 112 | 105 | 225 | 186 | |||||||||||||||||||
| Total costs of operations | $ | 514 | $ | 494 | $ | 1,023 | $ | 956 | |||||||||||||||
| Income (loss) from continuing operations | $ | 421 | $ | 333 | $ | 842 | $ | 455 | |||||||||||||||
Income (loss) from continuing operations per share—diluted(f) | $ | 0.97 | $ | 0.77 | $ | 1.94 | $ | 1.04 | |||||||||||||||
Non-GAAP Data:(g) | |||||||||||||||||||||||
| Adjusted EBITDA | $ | 1,078 | $ | 958 | $ | 2,173 | $ | 1,856 | |||||||||||||||
| FFO | 842 | 734 | 1,685 | 1,254 | |||||||||||||||||||
| AFFO | 783 | 741 | 1,595 | 1,479 | |||||||||||||||||||
AFFO per share(f) | $ | 1.80 | $ | 1.71 | $ | 3.67 | $ | 3.41 | |||||||||||||||
(a)Excludes third-party land interests.
(b)Excludes renewal terms at tenants' option.
(c)Weighted by site rental revenues.
(d)Weighted by Towers segment site rental gross margin exclusive of straight-lined revenues, amortization of prepaid rent and straight-lined expenses.
(e)Includes all renewal terms at the Company's option.
(f)Based on diluted weighted-average common shares outstanding of 434 million for each of the three and six months ended June 30, 2022 and 2021.
(g)See "Non-GAAP Financial Measures, Segment Measures and Other Calculations" for further information and reconciliation of non-GAAP financial measures to income (loss) from continuing operations, as computed in accordance with GAAP.
8
Crown Castle International Corp.
Second Quarter 2022
| COMPANY OVERVIEW | FINANCIALS & METRICS | ASSET PORTFOLIO OVERVIEW | CAPITALIZATION OVERVIEW | APPENDIX | ||||||||||
| SUMMARY FINANCIAL HIGHLIGHTS (CONTINUED) | |||||||||||
| Six Months Ended June 30, | |||||||||||
| (in millions) | 2022 | 2021 | |||||||||
Summary Cash Flow Data:(a) | |||||||||||
| Net cash provided by (used for) operating activities | $ | 1,337 | $ | 1,371 | |||||||
Net cash provided by (used for) investing activities(b) | (609) | (616) | |||||||||
| Net cash provided by (used for) financing activities | (748) | (612) | |||||||||
| (in millions) | June 30, 2022 | December 31, 2021 | |||||||||
| Balance Sheet Data (at period end): | |||||||||||
| Cash and cash equivalents | $ | 281 | $ | 292 | |||||||
| Property and equipment, net | 15,219 | 15,269 | |||||||||
| Total assets | 39,013 | 39,040 | |||||||||
| Total debt and other long-term obligations | 21,282 | 20,629 | |||||||||
| Total stockholders' equity | 7,861 | 8,258 | |||||||||
| Three Months Ended June 30, 2022 | |||||
| Other Data: | |||||
Net debt to last quarter annualized Adjusted EBITDA(c) | 4.9 | x | |||
| Dividend per common share | $ | 1.47 | |||
| OUTLOOK FOR FULL YEAR 2022 | |||||||||||
| (in millions, except per share amounts) | Full Year 2022(d) | ||||||||||
| Site rental revenues | $6,242 | to | $6,287 | ||||||||
Site rental costs of operations(e) | $1,548 | to | $1,593 | ||||||||
| Income (loss) from continuing operations | $1,654 | to | $1,734 | ||||||||
Income (loss) from continuing operations per share—diluted(f) | $3.80 | to | $3.99 | ||||||||
Adjusted EBITDA(g) | $4,329 | to | $4,374 | ||||||||
Interest expense and amortization of deferred financing costs(h) | $680 | to | $725 | ||||||||
FFO(g) | $3,343 | to | $3,388 | ||||||||
AFFO(g) | $3,178 | to | $3,223 | ||||||||
AFFO per share(f)(g) | $7.31 | to | $7.41 | ||||||||
(a)Includes impacts of restricted cash. See the condensed consolidated statement of cash flows for further information.
(b)Includes net cash used for acquisitions of approximately $15 million for each of the six months ended June 30, 2022 and 2021.
(c)See the "Net Debt to Last Quarter Annualized Adjusted EBITDA Calculation" in the Appendix.
(d)As issued on July 20, 2022.
(e)Exclusive of depreciation, amortization and accretion.
(f)The assumption for diluted weighted-average common shares outstanding for full year 2022 Outlook is based on the diluted common shares outstanding as of June 30, 2022.
(g)See "Non-GAAP Financial Measures, Segment Measures and Other Calculations" for further information and reconciliation of non-GAAP financial measures to income (loss) from continuing operations, as computed in accordance with GAAP.
(h)See reconciliation of "Components of Outlook for Interest Expense and Amortization of Deferred Financing Costs" for a discussion of non-cash interest expense.
9
Crown Castle International Corp.
Second Quarter 2022
| COMPANY OVERVIEW | FINANCIALS & METRICS | ASSET PORTFOLIO OVERVIEW | CAPITALIZATION OVERVIEW | APPENDIX | ||||||||||
| ACTUAL RESULTS FOR FULL YEAR 2021 AND OUTLOOK FOR FULL YEAR 2022 COMPONENTS OF CHANGES IN SITE RENTAL REVENUES | |||||||||||||||||
| (dollars in millions) | Full Year 2021 | Current Full Year 2022 Outlook(a) | |||||||||||||||
| Components of changes in site rental revenues: | |||||||||||||||||
Prior year site rental billings(b) | $4,779 | $5,048 | |||||||||||||||
Core leasing activity(b) | 343 | $320 | to | $350 | |||||||||||||
| Escalators | 93 | $95 | to | $105 | |||||||||||||
Non-renewals(b) | (170) | $(195) | to | $(175) | |||||||||||||
Organic Contribution to Site Rental Billings(b) | 266 | $230 | to | $270 | |||||||||||||
| Impact from straight-lined revenues associated with fixed escalators | 111 | $399 | to | $419 | |||||||||||||
| Impact from prepaid rent amortization | 560 | $560 | to | $570 | |||||||||||||
Acquisitions(c) | 3 | — | |||||||||||||||
| Other | — | — | |||||||||||||||
| Total GAAP site rental revenues | $5,719 | $6,242 | to | $6,287 | |||||||||||||
| Year-over-year changes in revenues: | |||||||||||||||||
| Reported GAAP site rental revenues | 7.5% | 9.5%(f) | |||||||||||||||
Contribution from core leasing and escalators(b)(d) | 9.1% | 8.6%(f) | |||||||||||||||
Organic Contribution to Site Rental Billings(b)(e) | 5.6% | 5.0%(f) | |||||||||||||||
(a)As issued on July 20, 2022.
(b)See "Non-GAAP Financial Measures, Segment Measures and Other Calculations" for our definitions of site rental billings, core leasing activity, non-renewals and Organic Contribution to Site Rental Billings.
(c)Represents the contribution from recent acquisitions. The financial impact of recent acquisitions is excluded from Organic Contribution to Site Rental Billings until the one-year anniversary of such acquisitions.
(d)Calculated as the percentage change from prior year site rental billings compared to the sum of core leasing and escalators for the current period.
(e)Calculated as the percentage change from prior year site rental billings compared to Organic Contribution to Site Rental Billings for the current period.
(f)Calculated based on midpoint of full year 2022 Outlook.
10
Crown Castle International Corp.
Second Quarter 2022
| COMPANY OVERVIEW | FINANCIALS & METRICS | ASSET PORTFOLIO OVERVIEW | CAPITALIZATION OVERVIEW | APPENDIX | ||||||||||
| CONDENSED CONSOLIDATED BALANCE SHEET (Unaudited) | |||||||||||
| (in millions, except par values) | June 30, 2022 | December 31, 2021 | |||||||||
| ASSETS | |||||||||||
| Current assets: | |||||||||||
| Cash and cash equivalents | $ | 281 | $ | 292 | |||||||
| Restricted cash | 160 | 169 | |||||||||
| Receivables, net | 516 | 543 | |||||||||
| Prepaid expenses | 158 | 105 | |||||||||
| Other current assets | 175 | 145 | |||||||||
| Total current assets | 1,290 | 1,254 | |||||||||
| Deferred site rental receivables | 1,796 | 1,588 | |||||||||
| Property and equipment, net | 15,219 | 15,269 | |||||||||
| Operating lease right-of-use assets | 6,663 | 6,682 | |||||||||
| Goodwill | 10,087 | 10,078 | |||||||||
| Other intangible assets, net | 3,822 | 4,046 | |||||||||
| Other assets, net | 136 | 123 | |||||||||
| Total assets | $ | 39,013 | $ | 39,040 | |||||||
| LIABILITIES AND EQUITY | |||||||||||
| Current liabilities: | |||||||||||
| Accounts payable | $ | 230 | $ | 246 | |||||||
| Accrued interest | 180 | 182 | |||||||||
| Deferred revenues | 701 | 776 | |||||||||
| Other accrued liabilities | 342 | 401 | |||||||||
| Current maturities of debt and other obligations | 70 | 72 | |||||||||
| Current portion of operating lease liabilities | 348 | 349 | |||||||||
| Total current liabilities | 1,871 | 2,026 | |||||||||
| Debt and other long-term obligations | 21,212 | 20,557 | |||||||||
| Operating lease liabilities | 6,017 | 6,031 | |||||||||
| Other long-term liabilities | 2,052 | 2,168 | |||||||||
| Total liabilities | 31,152 | 30,782 | |||||||||
| Commitments and contingencies | |||||||||||
| Stockholders' equity: | |||||||||||
| Common stock, $0.01 par value; 1,200 shares authorized; shares issued and outstanding: June 30, 2022—433 and December 31, 2021—432 | 4 | 4 | |||||||||
| Additional paid-in capital | 18,050 | 18,011 | |||||||||
| Accumulated other comprehensive income (loss) | (5) | (4) | |||||||||
| Dividends/distributions in excess of earnings | (10,188) | (9,753) | |||||||||
| Total equity | 7,861 | 8,258 | |||||||||
| Total liabilities and equity | $ | 39,013 | $ | 39,040 | |||||||
11
Crown Castle International Corp.
Second Quarter 2022
| COMPANY OVERVIEW | FINANCIALS & METRICS | ASSET PORTFOLIO OVERVIEW | CAPITALIZATION OVERVIEW | APPENDIX | ||||||||||
| CONDENSED CONSOLIDATED STATEMENT OF OPERATIONS (Unaudited) | |||||||||||||||||||||||
| Three Months Ended June 30, | Six Months Ended June 30, | ||||||||||||||||||||||
| (in millions, except per share amounts) | 2022 | 2021 | 2022 | 2021 | |||||||||||||||||||
| Net revenues: | |||||||||||||||||||||||
| Site rental | $ | 1,567 | $ | 1,425 | $ | 3,143 | $ | 2,794 | |||||||||||||||
| Services and other | 167 | 158 | 333 | 274 | |||||||||||||||||||
| Net revenues | 1,734 | 1,583 | 3,476 | 3,068 | |||||||||||||||||||
| Operating expenses: | |||||||||||||||||||||||
Costs of operations:(a) | |||||||||||||||||||||||
| Site rental | 402 | 389 | 798 | 770 | |||||||||||||||||||
| Services and other | 112 | 105 | 225 | 186 | |||||||||||||||||||
| Selling, general and administrative | 190 | 169 | 371 | 333 | |||||||||||||||||||
| Asset write-down charges | 9 | 6 | 23 | 9 | |||||||||||||||||||
| Acquisition and integration costs | 1 | 1 | 1 | 1 | |||||||||||||||||||
| Depreciation, amortization and accretion | 427 | 408 | 847 | 816 | |||||||||||||||||||
| Total operating expenses | 1,141 | 1,078 | 2,265 | 2,115 | |||||||||||||||||||
| Operating income (loss) | 593 | 505 | 1,211 | 953 | |||||||||||||||||||
| Interest expense and amortization of deferred financing costs | (165) | (161) | (329) | (330) | |||||||||||||||||||
| Gains (losses) on retirement of long-term obligations | — | (1) | (26) | (144) | |||||||||||||||||||
| Interest income | — | 1 | 1 | 1 | |||||||||||||||||||
| Other income (expense) | (2) | (5) | (4) | (12) | |||||||||||||||||||
| Income (loss) before income taxes | 426 | 339 | 853 | 468 | |||||||||||||||||||
| Benefit (provision) for income taxes | (5) | (6) | (11) | (13) | |||||||||||||||||||
| Income (loss) from continuing operations | 421 | 333 | 842 | 455 | |||||||||||||||||||
| Discontinued operations: | |||||||||||||||||||||||
| Net gain (loss) from disposal of discontinued operations, net of tax | — | 1 | — | (62) | |||||||||||||||||||
| Income (loss) from discontinued operations, net of tax | — | 1 | — | (62) | |||||||||||||||||||
| Net income (loss) | $ | 421 | $ | 334 | $ | 842 | $ | 393 | |||||||||||||||
| Net income (loss), per common share: | |||||||||||||||||||||||
| Income (loss) from continuing operations, basic | $ | 0.97 | $ | 0.77 | $ | 1.95 | $ | 1.05 | |||||||||||||||
| Income (loss) from discontinued operations, basic | — | — | — | (0.14) | |||||||||||||||||||
| Net income (loss), basic | $ | 0.97 | $ | 0.77 | $ | 1.95 | $ | 0.91 | |||||||||||||||
| Income (loss) from continuing operations, diluted | $ | 0.97 | $ | 0.77 | $ | 1.94 | $ | 1.04 | |||||||||||||||
| Income (loss) from discontinued operations, diluted | — | — | — | (0.14) | |||||||||||||||||||
| Net income (loss), diluted | $ | 0.97 | $ | 0.77 | $ | 1.94 | $ | 0.90 | |||||||||||||||
| Weighted-average common shares outstanding: | |||||||||||||||||||||||
| Basic | 433 | 432 | 433 | 432 | |||||||||||||||||||
| Diluted | 434 | 434 | 434 | 434 | |||||||||||||||||||
(a)Exclusive of depreciation, amortization and accretion shown separately.
12
Crown Castle International Corp.
Second Quarter 2022
| COMPANY OVERVIEW | FINANCIALS & METRICS | ASSET PORTFOLIO OVERVIEW | CAPITALIZATION OVERVIEW | APPENDIX | ||||||||||
| SEGMENT OPERATING RESULTS | |||||||||||||||||||||||||||||||||||||||||||||||
| Three Months Ended June 30, 2022 | Three Months Ended June 30, 2021 | ||||||||||||||||||||||||||||||||||||||||||||||
| (in millions) | Towers | Fiber | Other | Consolidated Total | Towers | Fiber | Other | Consolidated Total | |||||||||||||||||||||||||||||||||||||||
| Segment site rental revenues | $ | 1,078 | $ | 489 | $ | 1,567 | $ | 952 | $ | 473 | $ | 1,425 | |||||||||||||||||||||||||||||||||||
| Segment services and other revenues | 164 | 3 | 167 | 154 | 4 | 158 | |||||||||||||||||||||||||||||||||||||||||
| Segment revenues | 1,242 | 492 | 1,734 | 1,106 | 477 | 1,583 | |||||||||||||||||||||||||||||||||||||||||
| Segment site rental costs of operations | 232 | 162 | 394 | 221 | 161 | 382 | |||||||||||||||||||||||||||||||||||||||||
| Segment services and other costs of operations | 107 | 2 | 109 | 100 | 3 | 103 | |||||||||||||||||||||||||||||||||||||||||
Segment costs of operations(a)(b) | 339 | 164 | 503 | 321 | 164 | 485 | |||||||||||||||||||||||||||||||||||||||||
Segment site rental gross margin(c) | 846 | 327 | 1,173 | 731 | 312 | 1,043 | |||||||||||||||||||||||||||||||||||||||||
Segment services and other gross margin(c) | 57 | 1 | 58 | 54 | 1 | 55 | |||||||||||||||||||||||||||||||||||||||||
Segment selling, general and administrative expenses(b) | 28 | 46 | 74 | 26 | 44 | 70 | |||||||||||||||||||||||||||||||||||||||||
Segment operating profit(c) | 875 | 282 | 1,157 | 759 | 269 | 1,028 | |||||||||||||||||||||||||||||||||||||||||
Other selling, general and administrative expenses(b) | $ | 79 | 79 | $ | 70 | 70 | |||||||||||||||||||||||||||||||||||||||||
| Stock-based compensation expense | 44 | 44 | 34 | 34 | |||||||||||||||||||||||||||||||||||||||||||
| Depreciation, amortization and accretion | 427 | 427 | 408 | 408 | |||||||||||||||||||||||||||||||||||||||||||
| Interest expense and amortization of deferred financing costs | 165 | 165 | 161 | 161 | |||||||||||||||||||||||||||||||||||||||||||
Other (income) expenses to reconcile to income (loss) before income taxes(d) | 16 | 16 | 16 | 16 | |||||||||||||||||||||||||||||||||||||||||||
| Income (loss) before income taxes | $ | 426 | $ | 339 | |||||||||||||||||||||||||||||||||||||||||||
| FIBER SEGMENT SITE RENTAL REVENUES SUMMARY | |||||||||||||||||||||||||||||||||||
| Three Months Ended June 30, | |||||||||||||||||||||||||||||||||||
| 2022 | 2021 | ||||||||||||||||||||||||||||||||||
| (in millions) | Fiber Solutions | Small Cells | Total | Fiber Solutions | Small Cells | Total | |||||||||||||||||||||||||||||
| Site rental revenues | $ | 333 | $ | 156 | $ | 489 | $ | 329 | $ | 144 | $ | 473 | |||||||||||||||||||||||
(a)Exclusive of depreciation, amortization and accretion shown separately.
(b)Segment costs of operations exclude (1) stock-based compensation expense of $7 million and $5 million for the three months ended June 30, 2022 and 2021, respectively, and (2) prepaid lease purchase price adjustments of $4 million for each of the three months ended June 30, 2022 and 2021. Selling, general and administrative expenses exclude stock-based compensation expense of $37 million and $29 million for the three months ended June 30, 2022 and 2021, respectively.
(c)See "Non-GAAP Financial Measures, Segment Measures and Other Calculations" for a discussion of our definitions of segment site rental gross margin, segment services and other gross margin and segment operating profit.
(d)See condensed consolidated statement of operations for further information.
13
Crown Castle International Corp.
Second Quarter 2022
| COMPANY OVERVIEW | FINANCIALS & METRICS | ASSET PORTFOLIO OVERVIEW | CAPITALIZATION OVERVIEW | APPENDIX | ||||||||||
| SEGMENT OPERATING RESULTS | |||||||||||||||||||||||||||||||||||||||||||||||
| Six Months Ended June 30, 2022 | Six Months Ended June 30, 2021 | ||||||||||||||||||||||||||||||||||||||||||||||
| (in millions) | Towers | Fiber | Other | Consolidated Total | Towers | Fiber | Other | Consolidated Total | |||||||||||||||||||||||||||||||||||||||
| Segment site rental revenues | $ | 2,153 | $ | 990 | $ | 3,143 | $ | 1,847 | $ | 947 | $ | 2,794 | |||||||||||||||||||||||||||||||||||
| Segment services and other revenues | 327 | 6 | 333 | 265 | 9 | 274 | |||||||||||||||||||||||||||||||||||||||||
| Segment revenues | 2,480 | 996 | 3,476 | 2,112 | 956 | 3,068 | |||||||||||||||||||||||||||||||||||||||||
| Segment site rental costs of operations | 458 | 323 | 781 | 433 | 322 | 755 | |||||||||||||||||||||||||||||||||||||||||
| Segment services and other costs of operations | 216 | 4 | 220 | 175 | 6 | 181 | |||||||||||||||||||||||||||||||||||||||||
Segment costs of operations(a)(b) | 674 | 327 | 1,001 | 608 | 328 | 936 | |||||||||||||||||||||||||||||||||||||||||
Segment site rental gross margin(c) | 1,695 | 667 | 2,362 | 1,414 | 625 | 2,039 | |||||||||||||||||||||||||||||||||||||||||
Segment services and other gross margin(c) | 111 | 2 | 113 | 90 | 3 | 93 | |||||||||||||||||||||||||||||||||||||||||
Segment selling, general and administrative expenses(b) | 56 | 93 | 149 | 51 | 89 | 140 | |||||||||||||||||||||||||||||||||||||||||
Segment operating profit(c) | 1,750 | 576 | 2,326 | 1,453 | 539 | 1,992 | |||||||||||||||||||||||||||||||||||||||||
Other selling, general and administrative expenses(b) | $ | 153 | 153 | $ | 136 | 136 | |||||||||||||||||||||||||||||||||||||||||
| Stock-based compensation expense | 83 | 83 | 68 | 68 | |||||||||||||||||||||||||||||||||||||||||||
Depreciation, amortization and accretion | 847 | 847 | 816 | 816 | |||||||||||||||||||||||||||||||||||||||||||
Interest expense and amortization of deferred financing costs | 329 | 329 | 330 | 330 | |||||||||||||||||||||||||||||||||||||||||||
Other (income) expenses to reconcile to income (loss) before income taxes(d) | 61 | 61 | 174 | 174 | |||||||||||||||||||||||||||||||||||||||||||
Income (loss) before income taxes | $ | 853 | $ | 468 | |||||||||||||||||||||||||||||||||||||||||||
| FIBER SEGMENT SITE RENTAL REVENUES SUMMARY | |||||||||||||||||||||||||||||||||||
| Six Months Ended June 30, | |||||||||||||||||||||||||||||||||||
| 2022 | 2021 | ||||||||||||||||||||||||||||||||||
| (in millions) | Fiber Solutions | Small Cells | Total | Fiber Solutions | Small Cells | Total | |||||||||||||||||||||||||||||
| Site rental revenues | $ | 679 | $ | 311 | $ | 990 | $ | 659 | $ | 288 | $ | 947 | |||||||||||||||||||||||
(a)Exclusive of depreciation, amortization and accretion shown separately.
(b)Segment costs of operations exclude (1) stock-based compensation expense of $14 million and $11 million for the six months ended June 30, 2022 and 2021, respectively, and (2) prepaid lease purchase price adjustments of $8 million and $9 million for the six months ended June 30, 2022 and 2021, respectively. Selling, general and administrative expenses exclude stock-based compensation expense of $69 million and $57 million for the six months ended June 30, 2022 and 2021, respectively.
(c)See "Non-GAAP Financial Measures, Segment Measures and Other Calculations" for a discussion of our definitions of segment site rental gross margin, segment services and other gross margin and segment operating profit.
(d)See condensed consolidated statement of operations for further information.
14
Crown Castle International Corp.
Second Quarter 2022
| COMPANY OVERVIEW | FINANCIALS & METRICS | ASSET PORTFOLIO OVERVIEW | CAPITALIZATION OVERVIEW | APPENDIX | ||||||||||
| FFO AND AFFO RECONCILIATIONS | ||||||||||||||||||||||||||
| Three Months Ended June 30, | Six Months Ended June 30, | |||||||||||||||||||||||||
| (in millions, except per share amounts) | 2022 | 2021 | 2022 | 2021 | ||||||||||||||||||||||
| Income (loss) from continuing operations | $ | 421 | $ | 333 | $ | 842 | $ | 455 | (a) | |||||||||||||||||
| Real estate related depreciation, amortization and accretion | 412 | 395 | 820 | 790 | ||||||||||||||||||||||
| Asset write-down charges | 9 | 6 | 23 | 9 | ||||||||||||||||||||||
FFO(b)(c) | $ | 842 | $ | 734 | $ | 1,685 | $ | 1,254 | ||||||||||||||||||
| Weighted-average common shares outstanding—diluted | 434 | 434 | 434 | 434 | ||||||||||||||||||||||
FFO per share(b)(c) | $ | 1.94 | $ | 1.69 | $ | 3.88 | $ | 2.89 | ||||||||||||||||||
| FFO (from above) | $ | 842 | $ | 734 | $ | 1,685 | $ | 1,254 | ||||||||||||||||||
| Adjustments to increase (decrease) FFO: | ||||||||||||||||||||||||||
| Straight-lined revenues | (120) | (45) | (235) | (35) | ||||||||||||||||||||||
| Straight-lined expenses | 19 | 20 | 37 | 39 | ||||||||||||||||||||||
| Stock-based compensation expense | 44 | 34 | 83 | 68 | ||||||||||||||||||||||
| Non-cash portion of tax provision | (3) | (7) | 2 | — | ||||||||||||||||||||||
| Non-real estate related depreciation, amortization and accretion | 15 | 13 | 27 | 26 | ||||||||||||||||||||||
| Amortization of non-cash interest expense | 4 | 4 | 7 | 6 | ||||||||||||||||||||||
| Other (income) expense | 2 | 5 | 4 | 12 | ||||||||||||||||||||||
| (Gains) losses on retirement of long-term obligations | — | 1 | 26 | 144 | ||||||||||||||||||||||
| Acquisition and integration costs | 1 | 1 | 1 | 1 | ||||||||||||||||||||||
| Sustaining capital expenditures | (21) | (19) | (42) | (36) | ||||||||||||||||||||||
AFFO(b)(c) | $ | 783 | $ | 741 | $ | 1,595 | $ | 1,479 | ||||||||||||||||||
| Weighted-average common shares outstanding—diluted | 434 | 434 | 434 | 434 | ||||||||||||||||||||||
AFFO per share(b)(c) | $ | 1.80 | $ | 1.71 | $ | 3.67 | $ | 3.41 | ||||||||||||||||||
(a)Does not reflect the impact related to the ATO Settlement (as defined in the Form 8-K filed with the SEC on April 26, 2021 ("April 2021 8-K"), which is attributable to discontinued operations in the first quarter of 2021 as discussed in the April 2021 8-K.
(b)See "Non-GAAP Financial Measures, Segment Measures and Other Calculations" for a discussion of our definitions of FFO and AFFO, including per share amounts.
(c)The above reconciliation excludes line items included in our definition which are not applicable for the periods shown.
15
Crown Castle International Corp.
Second Quarter 2022
| COMPANY OVERVIEW | FINANCIALS & METRICS | ASSET PORTFOLIO OVERVIEW | CAPITALIZATION OVERVIEW | APPENDIX | ||||||||||
| CONDENSED CONSOLIDATED STATEMENT OF CASH FLOWS (Unaudited) | ||||||||||||||||||||||||||
| Six Months Ended June 30, | ||||||||||||||||||||||||||
| (in millions) | 2022 | 2021 | ||||||||||||||||||||||||
| Cash flows from operating activities: | ||||||||||||||||||||||||||
| Income (loss) from continuing operations | $ | 842 | $ | 455 | ||||||||||||||||||||||
| Adjustments to reconcile income (loss) from continuing operations to net cash provided by (used for) operating activities: | ||||||||||||||||||||||||||
| Depreciation, amortization and accretion | 847 | 816 | ||||||||||||||||||||||||
| (Gains) losses on retirement of long-term obligations | 26 | 144 | ||||||||||||||||||||||||
| Amortization of deferred financing costs and other non-cash interest, net | 7 | 6 | ||||||||||||||||||||||||
| Stock-based compensation expense | 83 | 67 | ||||||||||||||||||||||||
| Asset write-down charges | 23 | 9 | ||||||||||||||||||||||||
| Deferred income tax (benefit) provision | 1 | 3 | ||||||||||||||||||||||||
| Other non-cash adjustments, net | 3 | 14 | ||||||||||||||||||||||||
| Changes in assets and liabilities, excluding the effects of acquisitions: | ||||||||||||||||||||||||||
| Increase (decrease) in liabilities | (232) | (56) | ||||||||||||||||||||||||
| Decrease (increase) in assets | (263) | (87) | ||||||||||||||||||||||||
| Net cash provided by (used for) operating activities | 1,337 | 1,371 | ||||||||||||||||||||||||
| Cash flows from investing activities: | ||||||||||||||||||||||||||
| Capital expenditures | (584) | (609) | ||||||||||||||||||||||||
| Payments for acquisitions, net of cash acquired | (15) | (15) | ||||||||||||||||||||||||
| Other investing activities, net | (10) | 8 | ||||||||||||||||||||||||
| Net cash provided by (used for) investing activities | (609) | (616) | ||||||||||||||||||||||||
| Cash flows from financing activities: | ||||||||||||||||||||||||||
| Proceeds from issuance of long-term debt | 748 | 3,985 | ||||||||||||||||||||||||
| Principal payments on debt and other long-term obligations | (36) | (1,038) | ||||||||||||||||||||||||
| Purchases and redemptions of long-term debt | (1,274) | (1,789) | ||||||||||||||||||||||||
| Borrowings under revolving credit facility | 2,050 | 580 | ||||||||||||||||||||||||
| Payments under revolving credit facility | (1,565) | (870) | ||||||||||||||||||||||||
| Net borrowings (repayments) under commercial paper program | 687 | (210) | ||||||||||||||||||||||||
| Payments for financing costs | (8) | (39) | ||||||||||||||||||||||||
| Purchases of common stock | (63) | (68) | ||||||||||||||||||||||||
| Dividends/distributions paid on common stock | (1,287) | (1,163) | ||||||||||||||||||||||||
| Net cash provided by (used for) financing activities | (748) | (612) | ||||||||||||||||||||||||
| Net increase (decrease) in cash, cash equivalents, and restricted cash | (20) | 143 | ||||||||||||||||||||||||
| Effect of exchange rate changes on cash | — | 1 | ||||||||||||||||||||||||
| Cash, cash equivalents, and restricted cash at beginning of period | 466 | 381 | ||||||||||||||||||||||||
| Cash, cash equivalents, and restricted cash at end of period | $ | 446 | $ | 525 | ||||||||||||||||||||||
| Supplemental disclosure of cash flow information: | ||||||||||||||||||||||||||
| Interest paid | 324 | 344 | ||||||||||||||||||||||||
| Income taxes paid | 9 | 13 | ||||||||||||||||||||||||
16
Crown Castle International Corp.
Second Quarter 2022
| COMPANY OVERVIEW | FINANCIALS & METRICS | ASSET PORTFOLIO OVERVIEW | CAPITALIZATION OVERVIEW | APPENDIX | ||||||||||
| COMPONENTS OF CHANGES IN SITE RENTAL REVENUES | |||||||||||
| Three Months Ended June 30, | |||||||||||
| (dollars in millions) | 2022 | 2021 | |||||||||
| Components of changes in site rental revenues: | |||||||||||
Prior year site rental billings(a) | $ | 1,245 | $ | 1,181 | |||||||
Core leasing activity(a) | 75 | 82 | |||||||||
| Escalators | 22 | 23 | |||||||||
Non-renewals(a) | (39) | (43) | |||||||||
Organic Contribution to Site Rental Billings(a) | 58 | 62 | |||||||||
| Impact from straight-lined revenues associated with fixed escalators | 120 | 45 | |||||||||
| Impact from prepaid rent amortization | 143 | 136 | |||||||||
Acquisitions(b) | 1 | 1 | |||||||||
| Other | — | — | |||||||||
| Total GAAP site rental revenues | $ | 1,567 | $ | 1,425 | |||||||
| Year-over-year changes in revenues: | |||||||||||
| Reported GAAP site rental revenues | 10.0 | % | |||||||||
Contribution from core leasing and escalators(a)(c) | 7.8 | % | |||||||||
Organic Contribution to Site Rental Billings(a)(d) | 4.7 | % | |||||||||
SUMMARY OF SITE RENTAL STRAIGHT-LINED REVENUES AND EXPENSES ASSOCIATED WITH FIXED ESCALATORS(e) | |||||||||||||||||||||||||||||||||||
| Three Months Ended June 30, | |||||||||||||||||||||||||||||||||||
| 2022 | 2021 | ||||||||||||||||||||||||||||||||||
| (in millions) | Towers | Fiber | Total | Towers | Fiber | Total | |||||||||||||||||||||||||||||
| Site rental straight-lined revenues | $ | 120 | $ | — | $ | 120 | $ | 44 | $ | 1 | $ | 45 | |||||||||||||||||||||||
| Site rental straight-lined expenses | 19 | — | 19 | 19 | 1 | 20 | |||||||||||||||||||||||||||||
| Six Months Ended June 30, | |||||||||||||||||||||||||||||||||||
| 2022 | 2021 | ||||||||||||||||||||||||||||||||||
| (in millions) | Towers | Fiber | Total | Towers | Fiber | Total | |||||||||||||||||||||||||||||
| Site rental straight-lined revenues | $ | 235 | $ | — | $ | 235 | $ | 33 | $ | 2 | $ | 35 | |||||||||||||||||||||||
| Site rental straight-lined expenses | 37 | — | 37 | 38 | 1 | 39 | |||||||||||||||||||||||||||||
(a)See "Non-GAAP Financial Measures, Segment Measures and Other Calculations" for our definitions of site rental billings, core leasing activity, non-renewals and Organic Contribution to Site Rental Billings.
(b)Represents the contribution from recent acquisitions. The financial impact of recent acquisitions is excluded from Organic Contribution to Site Rental Billings until the one-year anniversary of such acquisitions.
(c)Calculated as the percentage change from prior year site rental billings compared to the sum of core leasing and escalators for the current period.
(d)Calculated as the percentage change from prior year site rental billings compared to Organic Contribution to Site Rental Billings for the current period.
(e)In accordance with GAAP accounting, if payment terms call for fixed escalations or rent free periods, the revenues are recognized on a straight-line basis over the fixed, non-cancelable term of the contract. Since the Company recognizes revenues on a straight-line basis, a portion of the site rental revenues in a given period represents cash collected or contractually collectible in other periods.
17
Crown Castle International Corp.
Second Quarter 2022
| COMPANY OVERVIEW | FINANCIALS & METRICS | ASSET PORTFOLIO OVERVIEW | CAPITALIZATION OVERVIEW | APPENDIX | ||||||||||
SUMMARY OF PREPAID RENT ACTIVITY(a) | |||||||||||||||||||||||||||||||||||
| Three Months Ended June 30, | |||||||||||||||||||||||||||||||||||
| 2022 | 2021 | ||||||||||||||||||||||||||||||||||
| (in millions) | Towers | Fiber | Total | Towers | Fiber | Total | |||||||||||||||||||||||||||||
| Prepaid rent additions | $ | 23 | $ | 39 | $ | 62 | $ | 28 | $ | 36 | $ | 64 | |||||||||||||||||||||||
| Amortization of prepaid rent | 80 | 63 | 143 | 79 | 57 | 136 | |||||||||||||||||||||||||||||
| Six Months Ended June 30, | |||||||||||||||||||||||||||||||||||
| 2022 | 2021 | ||||||||||||||||||||||||||||||||||
| (in millions) | Towers | Fiber | Total | Towers | Fiber | Total | |||||||||||||||||||||||||||||
| Prepaid rent additions | $ | 45 | $ | 89 | $ | 134 | $ | 54 | $ | 96 | $ | 150 | |||||||||||||||||||||||
| Amortization of prepaid rent | 159 | 125 | 284 | 158 | 114 | 272 | |||||||||||||||||||||||||||||
| SUMMARY OF CAPITAL EXPENDITURES | |||||||||||||||||||||||||||||||||||||||||||||||
| Three Months Ended June 30, | |||||||||||||||||||||||||||||||||||||||||||||||
| 2022 | 2021 | ||||||||||||||||||||||||||||||||||||||||||||||
| (in millions) | Towers | Fiber | Other | Total | Towers | Fiber | Other | Total | |||||||||||||||||||||||||||||||||||||||
| Discretionary: | |||||||||||||||||||||||||||||||||||||||||||||||
| Purchases of land interests | $ | 15 | $ | — | $ | — | $ | 15 | $ | 21 | $ | — | $ | — | $ | 21 | |||||||||||||||||||||||||||||||
| Communications infrastructure improvements and other capital projects | 27 | 235 | 5 | 267 | 39 | 223 | 6 | 268 | |||||||||||||||||||||||||||||||||||||||
| Sustaining | 3 | 12 | 6 | 21 | 3 | 12 | 4 | 19 | |||||||||||||||||||||||||||||||||||||||
| Total | $ | 45 | $ | 247 | $ | 11 | $ | 303 | $ | 63 | $ | 235 | $ | 10 | $ | 308 | |||||||||||||||||||||||||||||||
| Six Months Ended June 30, | |||||||||||||||||||||||||||||||||||||||||||||||
| 2022 | 2021 | ||||||||||||||||||||||||||||||||||||||||||||||
| (in millions) | Towers | Fiber | Other | Total | Towers | Fiber | Other | Total | |||||||||||||||||||||||||||||||||||||||
| Discretionary: | |||||||||||||||||||||||||||||||||||||||||||||||
| Purchases of land interests | $ | 25 | $ | — | $ | — | $ | 25 | $ | 35 | $ | — | $ | — | $ | 35 | |||||||||||||||||||||||||||||||
| Communications infrastructure improvements and other capital projects | 62 | 444 | 11 | 517 | 73 | 449 | 16 | 538 | |||||||||||||||||||||||||||||||||||||||
| Sustaining | 5 | 25 | 12 | 42 | 6 | 23 | 7 | 36 | |||||||||||||||||||||||||||||||||||||||
| Total | $ | 92 | $ | 469 | $ | 23 | $ | 584 | $ | 114 | $ | 472 | $ | 23 | $ | 609 | |||||||||||||||||||||||||||||||
PROJECTED REVENUES FROM TENANT CONTRACTS(b) | |||||||||||||||||
| Remaining Six Months | Years Ending December 31, | ||||||||||||||||
| (as of June 30, 2022; in millions) | 2022 | 2023 | 2024 | 2025 | 2026 | ||||||||||||
| Components of site rental revenues: | |||||||||||||||||
Site rental billings(c) | $ | 2,670 | $ | 5,449 | $ | 5,613 | $ | 5,551 | $ | 5,658 | |||||||
| Amortization of prepaid rent | 269 | 456 | 328 | 252 | 211 | ||||||||||||
| Straight-lined site rental revenues associated with fixed escalators | 172 | 249 | 151 | 37 | (61) | ||||||||||||
| GAAP site rental revenues | $ | 3,111 | $ | 6,154 | $ | 6,092 | $ | 5,840 | $ | 5,808 | |||||||
(a)Reflects up-front consideration from long-term tenants and other deferred credits (commonly referred to as prepaid rent), and the amortization thereof for GAAP revenue recognition purposes.
(b)Based on tenant licenses in place as of June 30, 2022. All tenant licenses are assumed to renew for a new term no later than the respective current term end date, and as such, projected revenues do not reflect the impact of estimated annual churn. CPI-linked tenant contracts are assumed to escalate at 3% per annum.
(c)See "Non-GAAP Financial Measures, Segment Measures and Other Calculations" for our definition of site rental billings.
18
Crown Castle International Corp.
Second Quarter 2022
| COMPANY OVERVIEW | FINANCIALS & METRICS | ASSET PORTFOLIO OVERVIEW | CAPITALIZATION OVERVIEW | APPENDIX | ||||||||||
PROJECTED EXPENSES FROM EXISTING GROUND LEASES AND FIBER ACCESS AGREEMENTS(a) | |||||||||||||||||
| Remaining Six Months | Years Ending December 31, | ||||||||||||||||
| (as of June 30, 2022; in millions) | 2022 | 2023 | 2024 | 2025 | 2026 | ||||||||||||
| Components of ground lease and fiber access agreement expenses: | |||||||||||||||||
| Ground lease and fiber access agreement expenses exclusive of straight-line associated with fixed escalators | $ | 473 | $ | 962 | $ | 982 | $ | 1,002 | $ | 1,023 | |||||||
| Straight-lined site rental lease expenses associated with fixed escalators | 33 | 56 | 45 | 33 | 21 | ||||||||||||
| GAAP ground lease and fiber access agreement expenses | $ | 506 | $ | 1,018 | $ | 1,027 | $ | 1,035 | $ | 1,044 | |||||||
ANNUALIZED RENTAL CASH PAYMENTS AT TIME OF RENEWAL(b) | |||||||||||||||||
| Remaining Six Months | Years Ending December 31, | ||||||||||||||||
| (as of June 30, 2022; in millions) | 2022 | 2023 | 2024 | 2025 | 2026 | ||||||||||||
| T-Mobile | $ | 17 | $ | 46 | $ | 44 | $ | 241 | $ | 53 | |||||||
| AT&T | 19 | 328 | 17 | 19 | 30 | ||||||||||||
| Verizon | 10 | 19 | 19 | 31 | 36 | ||||||||||||
| All Others Combined | 104 | 222 | 176 | 126 | 93 | ||||||||||||
| Total | $ | 150 | $ | 615 | $ | 256 | $ | 417 | $ | 212 | |||||||
| CONSOLIDATED TENANT OVERVIEW | |||||||||||
| (as of June 30, 2022) | Percentage of Q2 2022 LQA Site Rental Revenues | Weighted Average Current Term Remaining(c) | Long-Term Credit Rating (S&P / Moody’s) | ||||||||
| T-Mobile | 37% | 9 | BB+ / Ba1 | ||||||||
| AT&T | 19% | 5 | BBB / Baa2 | ||||||||
| Verizon | 19% | 8 | BBB+ / Baa1 | ||||||||
| All Others Combined | 25% | 3 | N/A | ||||||||
| Total / Weighted Average | 100% | 7 | |||||||||
| FIBER SOLUTIONS REVENUE MIX | |||||
| (as of June 30, 2022) | Percentage of Q2 2022 LQA Site Rental Revenues | ||||
Carrier(d) | 37% | ||||
| Education | 13% | ||||
| Healthcare | 11% | ||||
| Financial Services | 9% | ||||
| Other | 30% | ||||
| Total | 100% | ||||
(a)Based on existing ground leases and fiber access agreements as of June 30, 2022. CPI-linked leases are assumed to escalate at 3% per annum.
(b)Reflects lease renewals by year by tenant; dollar amounts represent annualized cash site rental revenues from assumed renewals or extensions as reflected in "Projected Revenues from Tenant Contracts" above.
(c)Weighted by site rental revenues and excludes renewals at the tenants' option.
(d)Includes revenues derived from both wireless carriers and wholesale carriers.
19
Crown Castle International Corp.
Second Quarter 2022
| COMPANY OVERVIEW | FINANCIALS & METRICS | ASSET PORTFOLIO OVERVIEW | CAPITALIZATION OVERVIEW | APPENDIX | ||||||||||
SEGMENT CASH YIELDS ON INVESTED CAPITAL(a) | |||||||||||
| Q2 2022 LQA | |||||||||||
| (as of June 30, 2022; dollars in millions) | Towers | Fiber | |||||||||
Segment site rental gross margin(b) | $ | 3,384 | $ | 1,308 | |||||||
| Less: Amortization of prepaid rent | (320) | (252) | |||||||||
| Less: Site rental straight-lined revenues | (479) | (1) | |||||||||
| Add: Site rental straight-lined expenses | 75 | 1 | |||||||||
Add: Indirect labor costs(c) | — | 101 | |||||||||
| Numerator | $ | 2,660 | $ | 1,157 | |||||||
Segment net investment in property and equipment(d) | $ | 13,166 | $ | 8,359 | |||||||
| Segment investment in site rental contracts and tenant relationships | 4,566 | 3,287 | |||||||||
Segment investment in goodwill(e) | 5,351 | 4,082 | |||||||||
Segment Net Invested Capital(a) | $ | 23,083 | $ | 15,728 | |||||||
Segment Cash Yield on Invested Capital(a) | 11.5 | % | 7.4 | % | |||||||
CONSOLIDATED RETURN ON INVESTED CAPITAL(a) | |||||
| (as of June 30, 2022; dollars in millions) | Q2 2022 LQA | ||||
Adjusted EBITDA(f) | $ | 4,312 | |||
| Cash taxes refunded (paid) | (35) | ||||
| Numerator | $ | 4,277 | |||
Historical gross investment in property and equipment(g) | $ | 26,896 | |||
| Historical gross investment in site rental contracts and tenant relationships | 7,853 | ||||
| Historical gross investment in goodwill | 10,087 | ||||
Consolidated Invested Capital(a) | $ | 44,836 | |||
Consolidated Return on Invested Capital(a) | 9.5 | % | |||
(a)See "Non-GAAP Financial Measures, Segment Measures and Other Calculations" for further information on, and our definitions and calculations of, Segment Cash Yield on Invested Capital, Segment Net Invested Capital, Consolidated Return on Invested Capital and Consolidated Invested Capital.
(b)See "Segment Operating Results" and "Non-GAAP Financial Measures, Segment Measures and Other Calculations" for further information on, and our definition and calculation of, segment site rental gross margin.
(c)This adjustment represents indirect labor costs in the Fiber segment that are not capitalized, but that primarily support the Company's ongoing expansion of its Fiber segment that management expects to generate future revenues for the Company. Removal of these indirect labor costs presents Segment Cash Yield on Invested Capital on a direct cost basis, consistent with the methodology used by management when evaluating project-level investment opportunities.
(d)Segment net investment in property and equipment excludes the impact of construction in process and non-productive assets (such as information technology assets and buildings) and is reduced by the amount of prepaid rent received from tenants (excluding any deferred credits recorded in connection with acquisitions).
(e)Segment investment in goodwill excludes the impact of certain assets and liabilities recorded in connection with acquisitions (primarily deferred credits).
(f)See "Non-GAAP Financial Measures, Segment Measures and Other Calculations" for further information and reconciliation of Adjusted EBITDA to income (loss) from continuing operations, as computed in accordance with GAAP.
(g)Historical gross investment in property and equipment excludes the impact of construction in process.
20
Crown Castle International Corp.
Second Quarter 2022
| COMPANY OVERVIEW | FINANCIALS & METRICS | ASSET PORTFOLIO OVERVIEW | CAPITALIZATION OVERVIEW | APPENDIX | ||||||||||
SUMMARY OF TOWER PORTFOLIO BY VINTAGE(a) | |||||
| (as of June 30, 2022; dollars in thousands) | |||||
CASH YIELD(b) | NUMBER OF TENANTS PER TOWER | ||||
LQA CASH SITE RENTAL REVENUES PER TOWER(c) | LQA TOWERS SEGMENT SITE RENTAL GROSS CASH MARGIN PER TOWER(d) | ||||
NET INVESTED CAPITAL PER TOWER(e) | NUMBER OF TOWERS | ||||
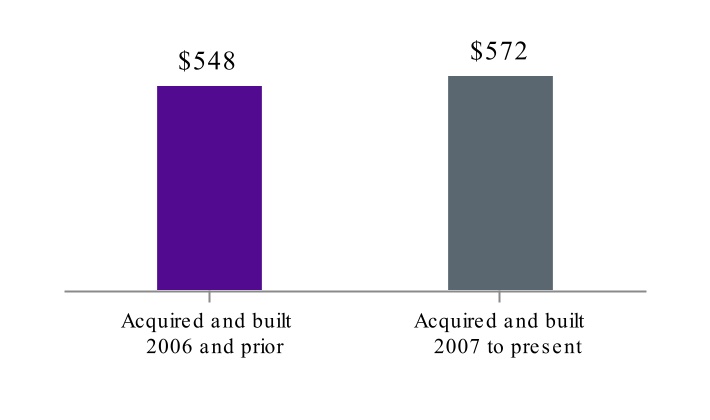
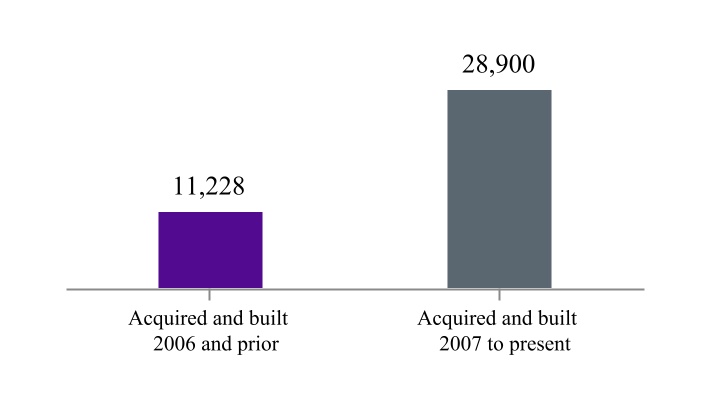
(a)All tower portfolio figures are calculated exclusively for the Company’s towers and rooftops and do not give effect to other activities within the Company’s Towers segment.
(b)Cash yield is calculated as LQA Towers segment site rental gross margin, exclusive of straight-lined revenues and amortization of prepaid rent, divided by invested capital net of the amount of prepaid rent received from tenants.
(c)Exclusive of straight-lined revenues and amortization of prepaid rent.
(d)Exclusive of straight-lined revenues, amortization of prepaid rent and straight-lined expenses.
(e)Reflects gross total assets (including incremental capital invested by the Company since time of acquisition or construction completion), less any prepaid rent. Inclusive of invested capital related to land at the tower site.
21
Crown Castle International Corp.
Second Quarter 2022
| COMPANY OVERVIEW | FINANCIALS & METRICS | ASSET PORTFOLIO OVERVIEW | CAPITALIZATION OVERVIEW | APPENDIX | ||||||||||
TOWER PORTFOLIO OVERVIEW(a) | ||||||||
| (as of June 30, 2022; dollars in thousands) | ||||||||
| NUMBER OF TOWERS | TENANTS PER TOWER | LQA CASH SITE RENTAL REVENUES PER TOWER(b) | ||||||
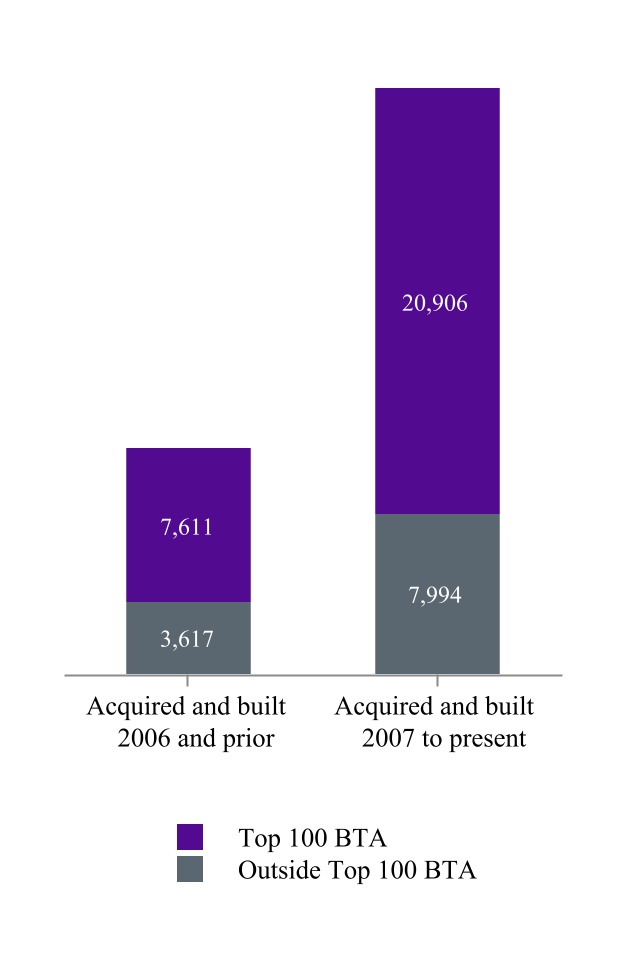
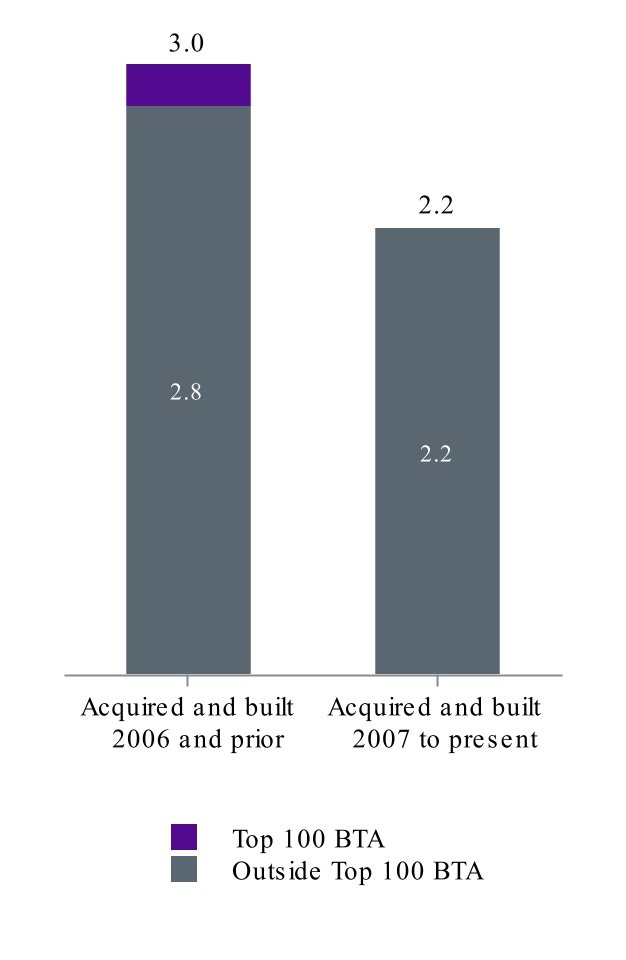
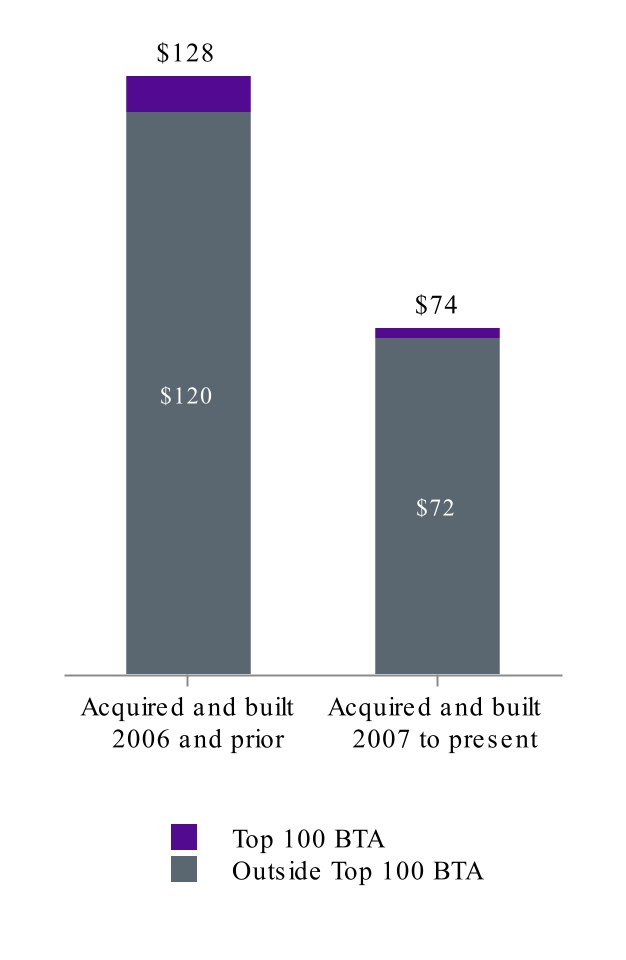
(a) All tower portfolio figures are calculated exclusively for the Company’s towers and rooftops and do not give effect to other activities within the Company’s Towers segment.
(b) Exclusive of straight-lined revenues and amortization of prepaid rent.
22
Crown Castle International Corp.
Second Quarter 2022
| COMPANY OVERVIEW | FINANCIALS & METRICS | ASSET PORTFOLIO OVERVIEW | CAPITALIZATION OVERVIEW | APPENDIX | ||||||||||
DISTRIBUTION OF TOWER TENANCY (as of June 30, 2022)(a) | |||||||||||||||||
| PERCENTAGE OF TOWERS BY TENANTS PER TOWER | |||||||||||||||||
| SITES ACQUIRED AND BUILT 2006 AND PRIOR | SITES ACQUIRED AND BUILT 2007 TO PRESENT | ||||||||||||||||
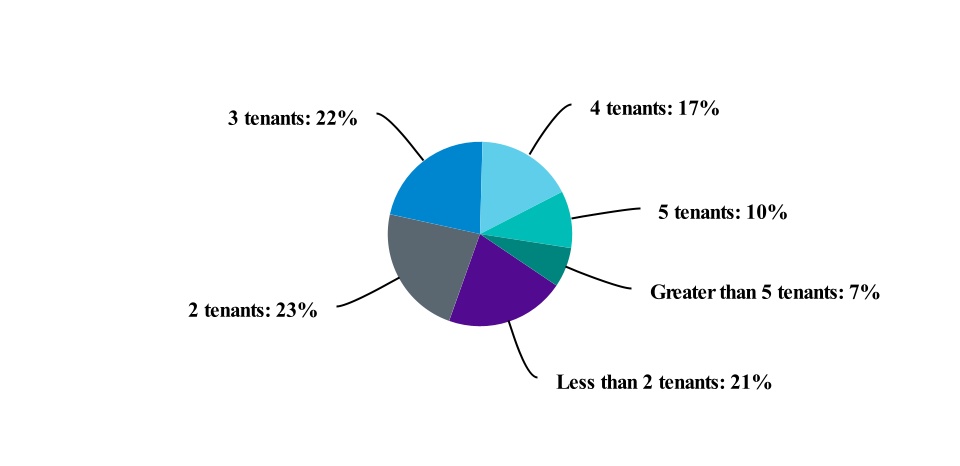
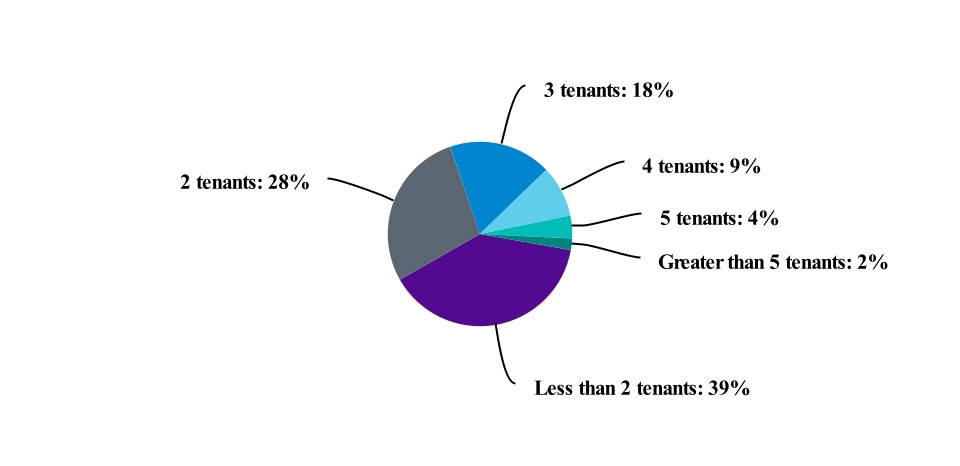
| Average: 2.9 | Average: 2.2 | ||||
GEOGRAPHIC TOWER DISTRIBUTION (as of June 30, 2022)(a) | |||||
| PERCENTAGE OF TOWERS BY GEOGRAPHIC LOCATION | PERCENTAGE OF LQA CASH SITE RENTAL REVENUES BY GEOGRAPHIC LOCATION(b) | ||||
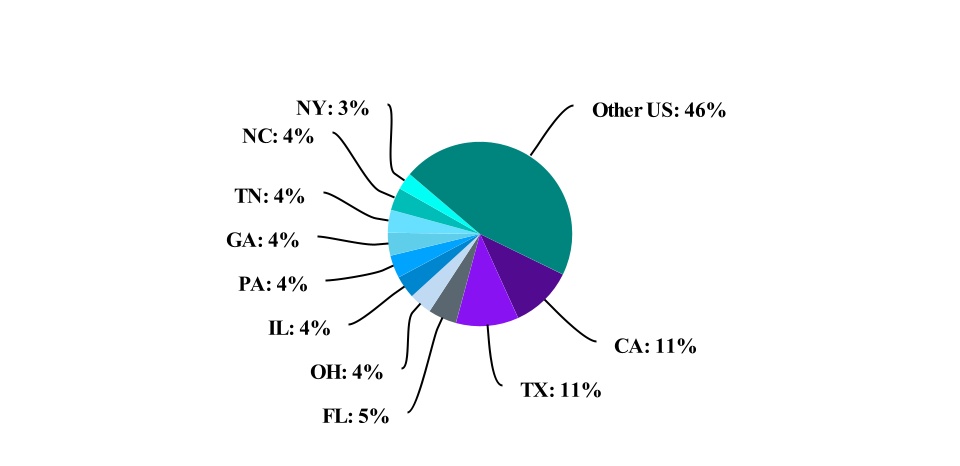
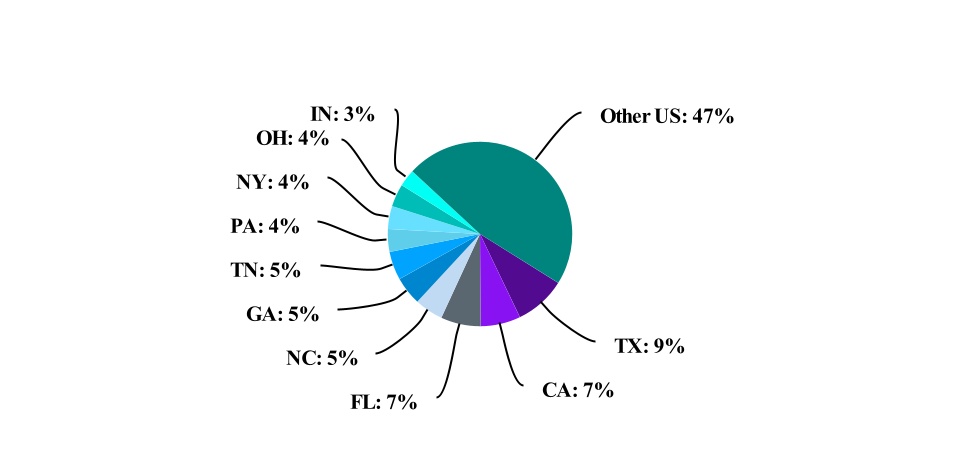
(a)All tower portfolio figures are calculated exclusively for the Company’s towers and rooftops and do not give effect to other activities within the Company’s Towers segment.
(b)Exclusive of straight-lined revenues and amortization of prepaid rent.
23
Crown Castle International Corp.
Second Quarter 2022
| COMPANY OVERVIEW | FINANCIALS & METRICS | ASSET PORTFOLIO OVERVIEW | CAPITALIZATION OVERVIEW | APPENDIX | ||||||||||
| GROUND INTEREST OVERVIEW | |||||||||||||||||||||||
| (as of June 30, 2022; dollars in millions) | LQA Cash Site Rental Revenues(a) | Percentage of LQA Cash Site Rental Revenues(a) | LQA Towers Segment Site Rental Gross Cash Margin(b) | Percentage of LQA Towers Segment Site Rental Gross Cash Margin(b) | Number of Towers(c) | Percentage of Towers | Weighted Average Term Remaining (by years)(d) | ||||||||||||||||
| Less than 10 years | $ | 379 | 11 | % | $ | 198 | 7 | % | 5,385 | 13 | % | ||||||||||||
| 10 to 20 years | 475 | 13 | % | 286 | 11 | % | 5,885 | 15 | % | ||||||||||||||
| Greater than 20 years | 1,505 | 43 | % | 1,087 | 41 | % | 17,549 | 44 | % | ||||||||||||||
| Total leased | $ | 2,359 | 67 | % | $ | 1,571 | 59 | % | 28,819 | 72 | % | 36 | |||||||||||
| Owned | $ | 1,175 | 33 | % | $ | 1,100 | 41 | % | 11,309 | 28 | % | ||||||||||||
| Total / Average | $ | 3,534 | 100 | % | $ | 2,671 | 100 | % | 40,128 | 100 | % | ||||||||||||
| GROUND INTEREST ACTIVITY | |||||||||||
| (dollars in millions) | Three Months Ended June 30, 2022 | Six Months Ended June 30, 2022 | |||||||||
| Ground Extensions Under Crown Castle Towers: | |||||||||||
| Number of ground leases extended | 147 | 276 | |||||||||
| Average number of years extended | 28 | 27 | |||||||||
Percentage increase in consolidated cash ground lease expense due to extension activities(e) | 0.1 | % | — | % | |||||||
| Ground Purchases Under Crown Castle Towers: | |||||||||||
| Number of ground leases purchased | 46 | 85 | |||||||||
| Ground lease purchases (including capital expenditures, acquisitions and installment purchases) | $ | 19 | $ | 32 | |||||||
| Percentage of Towers segment site rental gross margin from towers on purchased land | <1% | <1% | |||||||||
(a)Exclusive of straight-lined revenues and amortization of prepaid rent.
(b)Exclusive of straight-lined revenues, amortization of prepaid rent and straight-lined expenses.
(c)Excludes small cells, fiber and third-party land interests.
(d)Includes all renewal terms at the Company's option and weighted by Towers segment site rental gross margin, exclusive of straight-lined revenues, amortization of prepaid rent and straight-lined expenses.
(e)Includes the impact from the amortization of lump sum payments.
24
Crown Castle International Corp.
Second Quarter 2022
| COMPANY OVERVIEW | FINANCIALS & METRICS | ASSET PORTFOLIO OVERVIEW | CAPITALIZATION OVERVIEW | APPENDIX | ||||||||||
CAPITALIZATION OVERVIEW | |||||||||||||||||
| (as of June 30, 2022; dollars in millions) | Face Value | Fixed vs. Variable | Interest Rate(a) | Net Debt to LQA Adjusted EBITDA(b) | Maturity | ||||||||||||
| Cash, cash equivalents and restricted cash | $ | 446 | |||||||||||||||
Senior Secured Notes, Series 2009-1, Class A-2(c) | 50 | Fixed | 9.0% | 2029 | |||||||||||||
Senior Secured Tower Revenue Notes, Series 2015-2(d) | 700 | Fixed | 3.7% | 2045 | |||||||||||||
Senior Secured Tower Revenue Notes, Series 2018-2(d) | 750 | Fixed | 4.2% | 2048 | |||||||||||||
| Finance leases and other obligations | 235 | Various | Various | Various | |||||||||||||
| Total secured debt | $ | 1,735 | 4.1% | 0.4x | |||||||||||||
2016 Revolver(e)(f) | 1,150 | Variable | 2.7% | 2027 | |||||||||||||
2016 Term Loan A(e) | 1,207 | Variable | 2.7% | 2027 | |||||||||||||
Commercial Paper Notes(g) | 952 | Variable | 2.4% | 2022 | |||||||||||||
| 3.150% Senior Notes | 750 | Fixed | 3.2% | 2023 | |||||||||||||
| 3.200% Senior Notes | 750 | Fixed | 3.2% | 2024 | |||||||||||||
| 1.350% Senior Notes | 500 | Fixed | 1.4% | 2025 | |||||||||||||
| 4.450% Senior Notes | 900 | Fixed | 4.5% | 2026 | |||||||||||||
| 3.700% Senior Notes | 750 | Fixed | 3.7% | 2026 | |||||||||||||
| 1.050% Senior Notes | 1,000 | Fixed | 1.1% | 2026 | |||||||||||||
| 2.900% Senior Notes | 750 | Fixed | 2.9% | 2027 | |||||||||||||
| 4.000% Senior Notes | 500 | Fixed | 4.0% | 2027 | |||||||||||||
| 3.650% Senior Notes | 1,000 | Fixed | 3.7% | 2027 | |||||||||||||
| 3.800% Senior Notes | 1,000 | Fixed | 3.8% | 2028 | |||||||||||||
| 4.300% Senior Notes | 600 | Fixed | 4.3% | 2029 | |||||||||||||
| 3.100% Senior Notes | 550 | Fixed | 3.1% | 2029 | |||||||||||||
| 3.300% Senior Notes | 750 | Fixed | 3.3% | 2030 | |||||||||||||
| 2.250% Senior Notes | 1,100 | Fixed | 2.3% | 2031 | |||||||||||||
| 2.100% Senior Notes | 1,000 | Fixed | 2.1% | 2031 | |||||||||||||
| 2.500% Senior Notes | 750 | Fixed | 2.5% | 2031 | |||||||||||||
| 2.900% Senior Notes | 1,250 | Fixed | 2.9% | 2041 | |||||||||||||
| 4.750% Senior Notes | 350 | Fixed | 4.8% | 2047 | |||||||||||||
| 5.200% Senior Notes | 400 | Fixed | 5.2% | 2049 | |||||||||||||
| 4.000% Senior Notes | 350 | Fixed | 4.0% | 2049 | |||||||||||||
| 4.150% Senior Notes | 500 | Fixed | 4.2% | 2050 | |||||||||||||
| 3.250% Senior Notes | 900 | Fixed | 3.3% | 2051 | |||||||||||||
| Total unsecured debt | $ | 19,709 | 3.1% | 4.6x | |||||||||||||
| Total net debt | $ | 20,998 | 3.1% | 4.9x | |||||||||||||
Market Capitalization(h) | 72,915 | ||||||||||||||||
Firm Value(i) | $ | 93,913 | |||||||||||||||
(a)Represents the weighted-average stated interest rate, as applicable.
(b)Represents the applicable amount of debt divided by LQA consolidated Adjusted EBITDA. See the "Net Debt to Last Quarter Annualized Adjusted EBITDA Calculation" in the Appendix.
(c)The Senior Secured Notes, 2009-1, Class A-2 principal amortizes over a period ending in August 2029.
(d)If the respective series of Tower Revenue Notes are not paid in full on or prior to an applicable anticipated repayment date, then the Excess Cash Flow (as defined in the indenture) of the issuers of such notes will be used to repay principal of the applicable series, and additional interest (of an additional approximately 5% per annum) will accrue on the respective series. The Senior Secured Tower Revenue Notes, 2015-2 and 2018-2 have anticipated repayment dates in 2025 and 2028, respectively. Notes are prepayable at par if voluntarily repaid within eighteen months of maturity; earlier prepayment may require additional consideration.
(e)Gives effect to the July 2022 amendment to the credit agreement governing the Senior Unsecured Credit Facility ("2022 Credit Agreement Amendment").
(f)As of June 30, 2022, after giving effect to the 2022 Credit Agreement Amendment, the undrawn availability under the $7.0 billion 2016 Revolver was $5.8 billion.
(g)As of June 30, 2022, the Company had $1.0 billion available for issuance under the $2.0 billion unsecured commercial paper program ("CP Program"). The maturities of the Commercial Paper Notes ("CP Notes"), when outstanding, may vary but may not exceed 397 days from the date of issue.
(h)Market capitalization calculated based on $168.38 closing price and 433 million shares outstanding as of June 30, 2022.
(i)Represents the sum of net debt and market capitalization.
25
Crown Castle International Corp.
Second Quarter 2022
| COMPANY OVERVIEW | FINANCIALS & METRICS | ASSET PORTFOLIO OVERVIEW | CAPITALIZATION OVERVIEW | APPENDIX | ||||||||||
DEBT MATURITY OVERVIEW(a)(b)(c) | ||
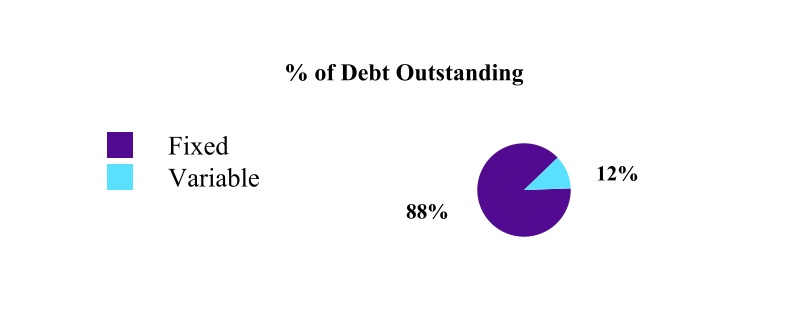
(as of June 30, 2022; dollars in millions)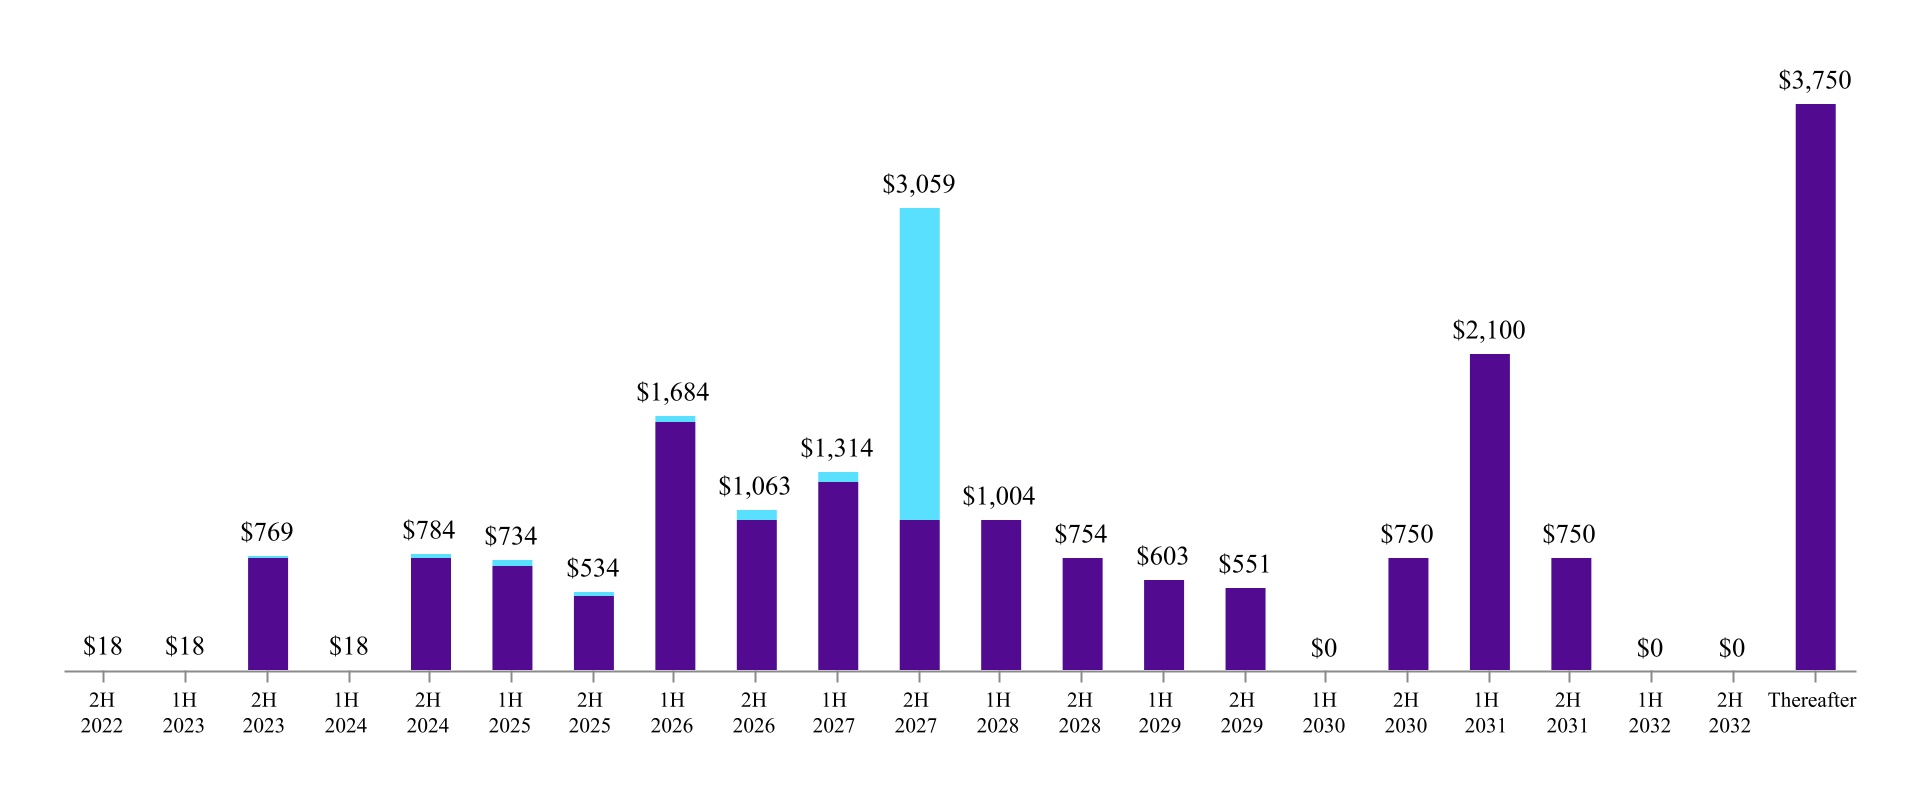
(a)Where applicable, maturities reflect the Anticipated Repayment Date, as defined in the respective debt agreement; excludes finance leases and other obligations; amounts presented at face value, net of repurchases held at the Company.
(b)The $1.0 billion outstanding in CP Notes have been excluded from this table. Amounts available under the CP Program may be borrowed, repaid and re-borrowed from time to time. We intend to maintain available commitments under our 2016 Revolver in an amount at least equal to the amount of CP Notes outstanding at any point in time.
(c)Reflects the extension of the maturity date following the 2022 Credit Agreement Amendment.
26
Crown Castle International Corp.
Second Quarter 2022
| COMPANY OVERVIEW | FINANCIALS & METRICS | ASSET PORTFOLIO OVERVIEW | CAPITALIZATION OVERVIEW | APPENDIX | ||||||||||
LIQUIDITY OVERVIEW(a) | ||||||||
| (in millions) | June 30, 2022 | |||||||
Cash, cash equivalents, and restricted cash(b) | $ | 446 | ||||||
Undrawn 2016 Revolver availability(c)(d) | 5,816 | |||||||
| Total debt and other long-term obligations | 21,282 | |||||||
| Total equity | 7,861 | |||||||
| SUMMARY OF MAINTENANCE AND FINANCIAL COVENANTS | |||||||||||||||||
| Debt | Borrower / Issuer | Covenant(e) | Covenant Level Requirement | As of June 30, 2022 | |||||||||||||
Maintenance Financial Covenants(f) | |||||||||||||||||
| 2016 Credit Facility | CCIC | Total Net Leverage Ratio | ≤ 6.50x | 5.1x | |||||||||||||
| 2016 Credit Facility | CCIC | Total Senior Secured Leverage Ratio | ≤ 3.50x | 0.4x | |||||||||||||
| 2016 Credit Facility | CCIC | Consolidated Interest Coverage Ratio(g) | N/A | N/A | |||||||||||||
| Financial covenants requiring excess cash flows to be deposited in a cash trap reserve account and not released | |||||||||||||||||
| 2015 Tower Revenue Notes | Crown Castle Towers LLC and its Subsidiaries | Debt Service Coverage Ratio | > 1.75x | (h) | 17.5x | ||||||||||||
| 2018 Tower Revenue Notes | Crown Castle Towers LLC and its Subsidiaries | Debt Service Coverage Ratio | > 1.75x | (h) | 17.5x | ||||||||||||
| 2009 Securitized Notes | Pinnacle Towers Acquisition Holdings LLC and its Subsidiaries | Debt Service Coverage Ratio | > 1.30x | (h) | 18.8x | ||||||||||||
| Financial covenants restricting ability of relevant issuer to issue additional notes under the applicable indenture | |||||||||||||||||
| 2015 Tower Revenue Notes | Crown Castle Towers LLC and its Subsidiaries | Debt Service Coverage Ratio | ≥ 2.00x | (i) | 17.5x | ||||||||||||
| 2018 Tower Revenue Notes | Crown Castle Towers LLC and its Subsidiaries | Debt Service Coverage Ratio | ≥ 2.00x | (i) | 17.5x | ||||||||||||
| 2009 Securitized Notes | Pinnacle Towers Acquisition Holdings LLC and its Subsidiaries | Debt Service Coverage Ratio | ≥ 2.34x | (i) | 18.8x | ||||||||||||
(a)In addition, we have the following sources of liquidity:
i.In March 2021, we established an at-the-market stock offering program ("ATM Program") through which we may, from time to time, issue and sell shares of our common stock having an aggregate gross sales price of up to $750 million to or through sales agents. No shares of common stock have been sold under the ATM Program.
ii.In April 2019, we established a CP Program through which we may issue short term, unsecured CP Notes. Amounts available under the CP Program may be issued, repaid and re-issued from time to time, with the aggregate principal amount of CP Notes outstanding under the CP Program at any time not to exceed $2.0 billion. As of June 30, 2022, there were $1.0 billion of CP Notes outstanding under our CP Program. We intend to maintain available commitments under our 2016 Revolver in an amount at least equal to the amount of CP Notes outstanding at any point in time.
(b)Inclusive of $5 million included within "Other assets, net" on our condensed consolidated balance sheet.
(c)Availability at any point in time is subject to reaffirmation of the representations and warranties in, and there being no default under, the credit agreement governing our 2016 Revolver.
(d)Reflects the increased commitments of $2.0 billion, for aggregate commitments of $7.0 billion, following the 2022 Credit Agreement Amendment.
(e)As defined in the respective debt agreement. In the indentures for the 2015 Tower Revenue Notes, 2018 Tower Revenue Notes and the 2009 Securitized Notes, the defined term for Debt Service Coverage Ratio is "DSCR." Total Net Leverage Ratio, Total Senior Secured Leverage Ratio and all DSCR ratios are calculated using the trailing twelve months.
(f)Failure to comply with the financial maintenance covenants would, absent a waiver, result in an event of default under the credit agreement governing our 2016 Credit Facility.
(g)Applicable solely to the extent that the senior unsecured debt rating by any two of S&P, Moody's and Fitch is lower than BBB-, Baa3 or BBB-, respectively. If applicable, the consolidated interest coverage ratio must be greater than or equal to 2.50.
(h)The 2015 Tower Revenue Notes, 2018 Tower Revenue Notes and 2009 Securitized Notes also include the potential for amortization events, which could result in applying current and future cash flow to the prepayment of debt with applicable prepayment consideration. An amortization event occurs when the Debt Service Coverage Ratio falls below 1.45x, 1.45x or 1.15x, in each case as described under the indentures for the 2015 Tower Revenue Notes, 2018 Tower Revenue Notes or 2009 Securitized Notes, respectively.
(i)Rating Agency Confirmation (as defined in the respective debt agreement) is also required.
27
Crown Castle International Corp.
Second Quarter 2022
| COMPANY OVERVIEW | FINANCIALS & METRICS | ASSET PORTFOLIO OVERVIEW | CAPITALIZATION OVERVIEW | APPENDIX | ||||||||||
INTEREST RATE SENSITIVITY(a) | ||||||||
| Remaining Six Months | Year Ending December 31, | |||||||
| (as of June 30, 2022; in millions) | 2022 | 2023 | ||||||
| Fixed Rate Debt: | ||||||||
Face Value of Principal Outstanding(b) | $ | 17,897 | $ | 17,890 | ||||
Current Interest Payment Obligations(c) | 290 | 580 | ||||||
Effect of 0.125% Change in Interest Rates(d) | — | — | ||||||
Floating Rate Debt:(e)(f) | ||||||||
Face Value of Principal Outstanding(b) | $ | 3,294 | $ | 3,264 | ||||
Current Interest Payment Obligations(g) | 45 | 90 | ||||||
Effect of 0.125% Change in Interest Rates(h) | 2 | 4 | ||||||
(a)Excludes finance leases and other obligations.
(b)Face value, net of required amortizations; assumes no maturity or balloon principal payments; excludes finance leases.
(c)Interest expense calculated based on current interest rates.
(d)Interest expense calculated based on current interest rates until the sooner of the (1) stated maturity date or (2) the Anticipated Repayment Date, at which time the face value amount outstanding of such indebtedness is refinanced at current interest rates as of June 30, 2022, plus 12.5 bps.
(e)Excludes the commitment fee the Company pays on the undrawn available amount under the 2016 Revolver. As of June 30, 2022, the commitment fee ranged from 0.080% to 0.300%, based on the Company's senior unsecured debt rating, per annum.
(f)In June 2021, the Company entered into an amendment to the credit agreement governing our 2016 Credit Facility that provided for, among other things, reductions to the interest rate spread ("Spread") and unused commitment fee ("Commitment Fee") percentage upon meeting specified annual sustainability targets ("Targets") and increases to the Spread and Commitment Fee percentage upon the failure to meet specified annual sustainability thresholds ("Thresholds"). The Spread and Commitment Fee are subject to an upward adjustment of up to 0.05% and 0.01%, respectively, if the Company fails to achieve the Thresholds. The Spread and Commitment Fee are subject to a downward adjustment of up to 0.05% and 0.01%, respectively, if the Company achieves the Targets. In January 2022, the Company submitted the required documentation and received confirmation from its administrative agent that all Targets were met as of December 31, 2021, and, as such, the Spread and Commitment Fee percentage were reduced for 2022. The reduction of the Spread on the 2016 Credit Facility is not reflected in the table above for the year ending December 31, 2023.
(g)Interest expense calculated based on interest rates as of June 30, 2022, after giving effect to the 2022 Credit Agreement Amendment and the change to the pricing benchmark from LIBOR to Term SOFR. Calculation assumes no changes in the borrower’s senior unsecured credit rating.
(h)Interest expense calculated based on interest rates as of June 30, 2022, after giving effect to the 2022 Credit Agreement Amendment and the change to the pricing benchmark from LIBOR to Term SOFR, plus 12.5 bps.
28
Crown Castle International Corp.
Second Quarter 2022
| COMPANY OVERVIEW | FINANCIALS & METRICS | ASSET PORTFOLIO OVERVIEW | CAPITALIZATION OVERVIEW | APPENDIX | ||||||||||
| DEFINITIONS | ||
Non-GAAP Financial Measures, Segment Measures and Other Calculations
This Supplement includes presentations of Income (Loss) from Continuing Operations (As Adjusted), Adjusted EBITDA, Adjusted Funds from Operations ("AFFO"), including per share amounts, Funds from Operations ("FFO"), including per share amounts, Organic Contribution to Site Rental Billings, Consolidated Return on Invested Capital and Segment Cash Yield on Invested Capital, which are non-GAAP financial measures. These non-GAAP financial measures are not intended as alternative measures of operating results or cash flow from operations (as determined in accordance with Generally Accepted Accounting Principles ("GAAP")).
Our non-GAAP financial measures may not be comparable to similarly titled measures of other companies, including other companies in the communications infrastructure sector or other REITs.
In addition to the non-GAAP financial measures used herein, we also provide segment site rental gross margin, segment services and other gross margin and segment operating profit, which are key measures used by management to evaluate our operating segments. These segment measures are provided pursuant to GAAP requirements related to segment reporting. In addition, we provide the components of certain GAAP measures, such as site rental revenues and capital expenditures.
Our non-GAAP financial measures are presented as additional information because management believes these measures are useful indicators of the financial performance of our business. Among other things, management believes that:
•Income (Loss) from Continuing Operations (As Adjusted) is useful to investors and other interested parties in evaluating our financial performance. Management believes that this measure is meaningful to investors as it adjusts income (loss) from continuing operations to exclude the impact of the Nontypical Items (as defined in this Supplemental Information Package and described further in our press release dated January 27, 2021), which management believes are unusual (including with respect to magnitude), infrequent and not reasonably likely to recur in the near term, to provide further insight into our results of operations and underlying trends and projections. Management also believes that identifying the impact of Nontypical Items as adjustments provides more transparency and comparability across periods. There can be no assurances that such items will not recur in future periods. Income (Loss) from Continuing Operations (As Adjusted) should be considered only as a supplement to income (loss) from continuing operations computed in accordance with GAAP as a measure of our performance.
•Adjusted EBITDA is useful to investors or other interested parties in evaluating our financial performance. Adjusted EBITDA is the primary measure used by management (1) to evaluate the economic productivity of our operations and (2) for purposes of making decisions about allocating resources to, and assessing the performance of, our operations. Management believes that Adjusted EBITDA helps investors or other interested parties meaningfully evaluate and compare the results of our operations (1) from period to period and (2) to our competitors, by removing the impact of our capital structure (primarily interest charges from our outstanding debt) and asset base (primarily depreciation, amortization and accretion) from our financial results. Management also believes Adjusted EBITDA is frequently used by investors or other interested parties in the evaluation of the communications infrastructure sector and other REITs to measure financial performance without regard to items such as depreciation, amortization and accretion, which can vary depending upon accounting methods and the book value of assets. In addition, Adjusted EBITDA is similar to the measure of current financial performance generally used in our debt covenant calculations. Adjusted EBITDA should be considered only as a supplement to income (loss) from continuing operations computed in accordance with GAAP as a measure of our performance.
•AFFO, including per share amounts, is useful to investors or other interested parties in evaluating our financial performance. Management believes that AFFO helps investors or other interested parties meaningfully evaluate our financial performance as it includes (1) the impact of our capital structure (primarily interest expense on our outstanding debt and dividends on our preferred stock (in periods where applicable)) and (2) sustaining capital expenditures, and excludes the impact of our (a) asset base (primarily depreciation, amortization and accretion) and (b) certain non-cash items, including straight-lined revenues and expenses related to fixed escalations and rent free periods. GAAP requires rental revenues and expenses related to leases that contain specified rental increases over the life of the lease to be recognized evenly over the life of the lease. In accordance with GAAP, if payment terms call for fixed escalations, or rent free periods, the revenues or expenses are recognized on a straight-lined basis over the fixed, non-cancelable term of the contract. Management notes that Crown Castle uses AFFO only as a performance measure. Separately, we are also disclosing AFFO as adjusted to exclude the impact of Nontypical Items, which management believes are unusual (including with respect to magnitude), infrequent and not reasonably likely to recur in the near term, to provide further insight into our results of operations and underlying trends and projections. Management also believes that identifying the impact of Nontypical Items as adjustments provides increased transparency and comparability across periods. There can be no assurances that such items will not recur in future periods.
29
Crown Castle International Corp.
Second Quarter 2022
| COMPANY OVERVIEW | FINANCIALS & METRICS | ASSET PORTFOLIO OVERVIEW | CAPITALIZATION OVERVIEW | APPENDIX | ||||||||||
AFFO (including as further adjusted to exclude Nontypical Items) should be considered only as a supplement to income (loss) from continuing operations computed in accordance with GAAP as a measure of our performance and should not be considered as an alternative to cash flow from operations or as residual cash flow available for discretionary investment.
•FFO, including per share amounts, is useful to investors or other interested parties in evaluating our financial performance. Management believes that FFO may be used by investors or other interested parties as a basis to compare our financial performance with that of other REITs. FFO helps investors or other interested parties meaningfully evaluate financial performance by excluding the impact of our asset base (primarily real estate depreciation, amortization and accretion). FFO is not a key performance indicator used by Crown Castle. FFO should be considered only as a supplement to income (loss) from continuing operations computed in accordance with GAAP as a measure of our performance and should not be considered as an alternative to cash flow from operations.
•Organic Contribution to Site Rental Billings is useful to investors or other interested parties in understanding the components of the year-over-year changes in our site rental revenues computed in accordance with GAAP. Management uses Organic Contribution to Site Rental Billings to assess year-over-year growth rates for our rental activities, to evaluate current performance, to capture trends in rental rates, core leasing activities and tenant non-renewals in our core business, as well as to forecast future results. Organic Contribution to Site Rental Billings is not meant as an alternative measure of revenue and should be considered only as a supplement in understanding and assessing the performance of our site rental revenues computed in accordance with GAAP.
•Consolidated Return on Invested Capital and Segment Cash Yield on Invested Capital are useful to investors or other interested parties in evaluating the financial performance of our assets. Management believes that these metrics are useful in assessing our efficiency at allocating capital to generate returns over time. Consolidated Return on Invested Capital and Segment Cash Yield on Invested Capital are not meant as alternatives to GAAP measures such as revenues, operating income, segment site rental gross margin, and certain asset classes (such as property and equipment, site rental contracts and tenant relationships, and goodwill) computed in accordance with GAAP. Such non-GAAP metrics should be considered only as a supplement in understanding and assessing the performance of our assets.
We define our non-GAAP financial measures, segment measures and other calculations as follows:
Non-GAAP Financial Measures
Income (Loss) from Continuing Operations (As Adjusted). We define Income (Loss) from Continuing Operations (As Adjusted) as income (loss) from continuing operations less other operating income resulting from the Nontypical Items, plus incremental operating expenses and asset write-downs as a result of the Nontypical Items.
Adjusted EBITDA. We define Adjusted EBITDA as income (loss) from continuing operations plus restructuring charges (credits), asset write-down charges, acquisition and integration costs, depreciation, amortization and accretion, amortization of prepaid lease purchase price adjustments, interest expense and amortization of deferred financing costs, (gains) losses on retirement of long-term obligations, net (gain) loss on interest rate swaps, (gains) losses on foreign currency swaps, impairment of available-for-sale securities, interest income, other (income) expense, (benefit) provision for income taxes, cumulative effect of a change in accounting principle and stock-based compensation expense.
Adjusted Funds from Operations. We define Adjusted Funds from Operations as FFO before straight-lined revenues, straight-lined expenses, stock-based compensation expense, non-cash portion of tax provision, non-real estate related depreciation, amortization and accretion, amortization of non-cash interest expense, other (income) expense, (gains) losses on retirement of long-term obligations, net (gain) loss on interest rate swaps, (gains) losses on foreign currency swaps, impairment of available-for-sale securities, acquisition and integration costs, restructuring charges (credits), cumulative effect of a change in accounting principle and adjustments for noncontrolling interests, less sustaining capital expenditures. Separately, Adjusted Funds from Operations, as adjusted to exclude the impact of Nontypical Items, reflects Adjusted Funds from Operations, less other operating income resulting from the Nontypical Items, plus incremental operating expenses as a result of the Nontypical Items.
AFFO per share. We define AFFO per share as AFFO, including as adjusted to exclude the impact of Nontypical Items, divided by diluted weighted-average common shares outstanding.
Funds from Operations. We define Funds from Operations as income (loss) from continuing operations plus real estate related depreciation, amortization and accretion and asset write-down charges, less noncontrolling interest and cash paid for preferred stock dividends (in periods where applicable), and is a measure of funds from operations attributable to common stockholders.
30
Crown Castle International Corp.
Second Quarter 2022
| COMPANY OVERVIEW | FINANCIALS & METRICS | ASSET PORTFOLIO OVERVIEW | CAPITALIZATION OVERVIEW | APPENDIX | ||||||||||
FFO per share. We define FFO per share as FFO divided by diluted weighted-average common shares outstanding.
Organic Contribution to Site Rental Billings. We define Organic Contribution to Site Rental Billings as the sum of the change in GAAP site rental revenues related to core leasing activity and escalators, less non-renewals of tenant contracts.
Consolidated Invested Capital. We define Consolidated Invested Capital as the historical gross investment in (1) property and equipment (excluding the impact of construction in process), (2) site rental contracts and tenant relationships and (3) goodwill.
Consolidated Return on Invested Capital. We define Consolidated Return on Invested Capital as Adjusted EBITDA less cash taxes paid divided by Consolidated Invested Capital.
Segment Net Invested Capital. We define Segment Net Invested Capital as the investment in (1) property and equipment, excluding the impact of construction in process and non-productive assets (such as information technology assets and buildings), reduced by the amount of prepaid rent received from tenants (excluding any deferred credits recorded in connection with acquisitions), (2) site rental contracts and tenant relationships, and (3) goodwill, excluding the impact of certain assets and liabilities recorded in connection with acquisitions (primarily deferred credits).
Segment Cash Yield on Invested Capital. We define Segment Cash Yield on Invested Capital as segment site rental gross margin adjusted for the impacts of (1) amortization of prepaid rent, (2) straight-lined revenues, (3) straight-lined expenses and (4) indirect labor costs related to the Fiber segment divided by Segment Net Invested Capital.
Segment Measures
Segment site rental gross margin. We define segment site rental gross margin as segment site rental revenues less segment site rental costs of operations, excluding stock-based compensation expense and amortization of prepaid lease purchase price adjustments recorded in consolidated site rental costs of operations.
Segment services and other gross margin. We define segment services and other gross margin as segment services and other revenues less segment services and other costs of operations, excluding stock-based compensation expense recorded in consolidated services and other costs of operations.
Segment operating profit. We define segment operating profit as segment site rental gross margin plus segment services and other gross margin, and segment other operating (income) expense, less selling, general and administrative expenses attributable to the respective segment.
All of these measurements of profit or loss are exclusive of depreciation, amortization and accretion, which are shown separately. Additionally, certain costs are shared across segments and are reflected in our segment measures through allocations that management believes to be reasonable.
Other Calculations
Site rental billings. We define site rental billings as site rental revenues exclusive of the impacts from (1) straight-lined revenues, (2) amortization of prepaid rent in accordance with GAAP and (3) contribution from recent acquisitions until the one-year anniversary of such acquisitions.
Core leasing activity. We define core leasing activity as site rental revenues growth from tenant additions across our entire portfolio and renewals or extensions of tenant contracts, exclusive of the impacts from both straight-lined revenues and amortization of prepaid rent in accordance with GAAP.
Non-renewals. We define non-renewals of tenant contracts as the reduction in site rental revenues as a result of tenant churn, terminations and, in limited circumstances, reductions of existing lease rates.
31
Crown Castle International Corp.
Second Quarter 2022
| COMPANY OVERVIEW | FINANCIALS & METRICS | ASSET PORTFOLIO OVERVIEW | CAPITALIZATION OVERVIEW | APPENDIX | ||||||||||
Discretionary capital expenditures. We define discretionary capital expenditures as those capital expenditures made with respect to activities which we believe exhibit sufficient potential to enhance long-term stockholder value. They primarily consist of expansion or development of communications infrastructure (including capital expenditures related to (1) enhancing communications infrastructure in order to add new tenants for the first time or support subsequent tenant equipment augmentations or (2) modifying the structure of a communications infrastructure asset to accommodate additional tenants) and construction of new communications infrastructure. Discretionary capital expenditures also include purchases of land interests (which primarily relates to land assets under towers as we seek to manage our interests in the land beneath our towers), certain technology-related investments necessary to support and scale future customer demand for our communications infrastructure, and other capital projects.
Sustaining capital expenditures. We define sustaining capital expenditures as those capital expenditures not otherwise categorized as discretionary capital expenditures, such as (1) maintenance capital expenditures on our communications infrastructure assets that enable our tenants' ongoing quiet enjoyment of the communications infrastructure and (2) ordinary corporate capital expenditures.
The tables set forth on the following pages reconcile certain non-GAAP financial measures used herein to comparable GAAP financial measures. The components in these tables may not sum to the total due to rounding.
32
Crown Castle International Corp.
Second Quarter 2022
| COMPANY OVERVIEW | FINANCIALS & METRICS | ASSET PORTFOLIO OVERVIEW | CAPITALIZATION OVERVIEW | APPENDIX | ||||||||||
Reconciliations of Non-GAAP Financial Measures to Comparable GAAP Financial Measures and Other Calculations:
Reconciliation of Historical Adjusted EBITDA:
| Three Months Ended June 30, | Six Months Ended June 30, | |||||||||||||||||||||||||
| (in millions) | 2022 | 2021 | 2022 | 2021 | ||||||||||||||||||||||
| Income (loss) from continuing operations | $ | 421 | $ | 333 | $ | 842 | $ | 455 | (a) | |||||||||||||||||
| Adjustments to increase (decrease) income (loss) from continuing operations: | ||||||||||||||||||||||||||
| Asset write-down charges | 9 | 6 | 23 | 9 | ||||||||||||||||||||||
| Acquisition and integration costs | 1 | 1 | 1 | 1 | ||||||||||||||||||||||
| Depreciation, amortization and accretion | 427 | 408 | 847 | 816 | ||||||||||||||||||||||
| Amortization of prepaid lease purchase price adjustments | 4 | 4 | 8 | 9 | ||||||||||||||||||||||
Interest expense and amortization of deferred financing costs(b) | 165 | 161 | 329 | 330 | ||||||||||||||||||||||
| (Gains) losses on retirement of long-term obligations | — | 1 | 26 | 144 | ||||||||||||||||||||||
| Interest income | — | (1) | (1) | (1) | ||||||||||||||||||||||
| Other (income) expense | 2 | 5 | 4 | 12 | ||||||||||||||||||||||
| (Benefit) provision for income taxes | 5 | 6 | 11 | 13 | ||||||||||||||||||||||
| Stock-based compensation expense | 44 | 34 | 83 | 68 | ||||||||||||||||||||||
Adjusted EBITDA(c)(d) | $ | 1,078 | $ | 958 | $ | 2,173 | $ | 1,856 | ||||||||||||||||||
Reconciliation of Current Outlook for Adjusted EBITDA:
| (in millions) | Full Year 2022 Outlook(f) | ||||||||||
| Income (loss) from continuing operations | $1,654 | to | $1,734 | ||||||||
| Adjustments to increase (decrease) income (loss) from continuing operations: | |||||||||||
| Asset write-down charges | $20 | to | $30 | ||||||||
| Acquisition and integration costs | $1 | to | $9 | ||||||||
| Depreciation, amortization and accretion | $1,650 | to | $1,745 | ||||||||
| Amortization of prepaid lease purchase price adjustments | $16 | to | $18 | ||||||||
Interest expense and amortization of deferred financing costs(e) | $680 | to | $725 | ||||||||
| (Gains) losses on retirement of long-term obligations | $25 | to | $75 | ||||||||
| Interest income | $(3) | to | $(2) | ||||||||
| Other (income) expense | $0 | to | $5 | ||||||||
| (Benefit) provision for income taxes | $20 | to | $28 | ||||||||
| Stock-based compensation expense | $135 | to | $139 | ||||||||
Adjusted EBITDA(c)(d) | $4,329 | to | $4,374 | ||||||||
(a)Does not reflect the impact related to the ATO Settlement (as defined in the April 2021 8-K), which is attributable to discontinued operations in the first quarter of 2021 as discussed in the April 2021 8-K.
(b)See reconciliation of "Components of Historical Interest Expense and Amortization of Deferred Financing Costs" for a discussion of non-cash interest expense
(c)See "Non-GAAP Financial Measures, Segment Measures and Other Calculations" for a discussion of our definition of Adjusted EBITDA.
(d)The above reconciliation excludes line items included in our definition which are not applicable for the periods shown.
(e)See reconciliation of "Components of Outlook for Interest Expense and Amortization of Deferred Financing Costs" for a discussion of non-cash interest expense.
(f)As issued on July 20, 2022.
33
Crown Castle International Corp.
Second Quarter 2022
| COMPANY OVERVIEW | FINANCIALS & METRICS | ASSET PORTFOLIO OVERVIEW | CAPITALIZATION OVERVIEW | APPENDIX | ||||||||||
Components of Historical Interest Expense and Amortization of Deferred Financing Costs:
| Three Months Ended June 30, | |||||||||||
| (in millions) | 2022 | 2021 | |||||||||
| Interest expense on debt obligations | $ | 161 | $ | 157 | |||||||
| Amortization of deferred financing costs and adjustments on long-term debt, net | 7 | 7 | |||||||||
| Other, net | (3) | (3) | |||||||||
| Interest expense and amortization of deferred financing costs | $ | 165 | $ | 161 | |||||||
Components of Outlook for Interest Expense and Amortization of Deferred Financing Costs:
| (in millions) | Current Full Year 2022 Outlook(a) | Previous Full Year 2022 Outlook(b) | |||||||||||||||||||||
| Interest expense on debt obligations | $682 | to | $702 | $637 | to | $657 | |||||||||||||||||
| Amortization of deferred financing costs and adjustments on long-term debt, net | $25 | to | $30 | $25 | to | $30 | |||||||||||||||||
| Other, net | $(20) | to | $(15) | $(20) | to | $(15) | |||||||||||||||||
| Interest expense and amortization of deferred financing costs | $680 | to | $725 | $635 | to | $680 | |||||||||||||||||
(a)As issued on July 20, 2022.
(b)As issued on April 20, 2022.
34
Crown Castle International Corp.
Second Quarter 2022
| COMPANY OVERVIEW | FINANCIALS & METRICS | ASSET PORTFOLIO OVERVIEW | CAPITALIZATION OVERVIEW | APPENDIX | ||||||||||
Reconciliation of Historical FFO and AFFO:
| Three Months Ended June 30, | Six Months Ended June 30, | |||||||||||||||||||||||||
| (in millions, except per share amounts) | 2022 | 2021 | 2022 | 2021 | ||||||||||||||||||||||
| Income (loss) from continuing operations | $ | 421 | $ | 333 | $ | 842 | $ | 455 | (a) | |||||||||||||||||
| Real estate related depreciation, amortization and accretion | 412 | 395 | 820 | 790 | ||||||||||||||||||||||
| Asset write-down charges | 9 | 6 | 23 | 9 | ||||||||||||||||||||||
FFO(b)(c) | $ | 842 | $ | 734 | $ | 1,685 | $ | 1,254 | ||||||||||||||||||
| Weighted-average common shares outstanding—diluted | 434 | 434 | 434 | 434 | ||||||||||||||||||||||
FFO per share(b)(c) | $ | 1.94 | $ | 1.69 | $ | 3.88 | $ | 2.89 | ||||||||||||||||||
| FFO (from above) | $ | 842 | $ | 734 | $ | 1,685 | $ | 1,254 | ||||||||||||||||||
| Adjustments to increase (decrease) FFO: | ||||||||||||||||||||||||||
| Straight-lined revenues | (120) | (45) | (235) | (35) | ||||||||||||||||||||||
| Straight-lined expenses | 19 | 20 | 37 | 39 | ||||||||||||||||||||||
| Stock-based compensation expense | 44 | 34 | 83 | 68 | ||||||||||||||||||||||
| Non-cash portion of tax provision | (3) | (7) | 2 | — | ||||||||||||||||||||||
| Non-real estate related depreciation, amortization and accretion | 15 | 13 | 27 | 26 | ||||||||||||||||||||||
| Amortization of non-cash interest expense | 4 | 4 | 7 | 6 | ||||||||||||||||||||||
| Other (income) expense | 2 | 5 | 4 | 12 | ||||||||||||||||||||||
| (Gains) losses on retirement of long-term obligations | — | 1 | 26 | 144 | ||||||||||||||||||||||
| Acquisition and integration costs | 1 | 1 | 1 | 1 | ||||||||||||||||||||||
| Sustaining capital expenditures | (21) | (19) | (42) | (36) | ||||||||||||||||||||||
AFFO(b)(c) | $ | 783 | $ | 741 | $ | 1,595 | $ | 1,479 | ||||||||||||||||||
| Weighted-average common shares outstanding—diluted | 434 | 434 | 434 | 434 | ||||||||||||||||||||||
AFFO per share(b)(c) | $ | 1.80 | $ | 1.71 | $ | 3.67 | $ | 3.41 | ||||||||||||||||||
(a)Does not reflect the impact related to the ATO Settlement (as defined in the April 2021 8-K), which is attributable to discontinued operations in the first quarter of 2021 as discussed in the April 2021 8-K.
(b)See "Non-GAAP Financial Measures, Segment Measures and Other Calculations" for a discussion of our definitions of FFO and AFFO, including per share amounts.
(c)The above reconciliation excludes line items included in our definition which are not applicable for the periods shown.
35
Crown Castle International Corp.
Second Quarter 2022
| COMPANY OVERVIEW | FINANCIALS & METRICS | ASSET PORTFOLIO OVERVIEW | CAPITALIZATION OVERVIEW | APPENDIX | ||||||||||
Reconciliation of Historical FFO and AFFO:
| Year Ended December 31, | |||||||||||||||||||||||||||||
| (in millions, except per share amounts) | 2021 | 2020 | 2019 | 2018 | 2017 | ||||||||||||||||||||||||
| Income (loss) from continuing operations | $ | 1,158 | (a) | $ | 1,056 | $ | 860 | $ | 622 | $ | 366 | ||||||||||||||||||
| Real estate related depreciation, amortization and accretion | 1,593 | 1,555 | 1,517 | 1,471 | 1,210 | ||||||||||||||||||||||||
| Asset write-down charges | 21 | 74 | 19 | 26 | 17 | ||||||||||||||||||||||||
| Dividends/distributions on preferred stock | — | (85) | (113) | (113) | (30) | ||||||||||||||||||||||||
FFO(b)(c)(d)(e) | $ | 2,772 | $ | 2,600 | $ | 2,284 | $ | 2,005 | $ | 1,563 | |||||||||||||||||||
Weighted-average common shares outstanding—diluted(f) | 434 | 425 | 418 | 415 | 383 | ||||||||||||||||||||||||
FFO per share(b)(c)(d)(e)(f) | $ | 6.39 | $ | 6.12 | $ | 5.47 | $ | 4.83 | $ | 4.08 | |||||||||||||||||||
| FFO (from above) | $ | 2,772 | $ | 2,600 | $ | 2,284 | $ | 2,005 | $ | 1,563 | |||||||||||||||||||
| Adjustments to increase (decrease) FFO: | |||||||||||||||||||||||||||||
| Straight-lined revenues | (111) | (22) | (80) | (72) | — | ||||||||||||||||||||||||
| Straight-lined expenses | 76 | 83 | 93 | 90 | 93 | ||||||||||||||||||||||||
| Stock-based compensation expense | 131 | 133 | 116 | 108 | 96 | ||||||||||||||||||||||||
| Non-cash portion of tax provision | 1 | 1 | 5 | 2 | 9 | ||||||||||||||||||||||||
| Non-real estate related depreciation, amortization and accretion | 51 | 53 | 55 | 56 | 31 | ||||||||||||||||||||||||
| Amortization of non-cash interest expense | 13 | 6 | 1 | 7 | 9 | ||||||||||||||||||||||||
| Other (income) expense | 21 | 5 | (1) | (1) | (1) | ||||||||||||||||||||||||
| (Gains) losses on retirement of long-term obligations | 145 | 95 | 2 | 106 | 4 | ||||||||||||||||||||||||
| Acquisition and integration costs | 1 | 10 | 13 | 27 | 61 | ||||||||||||||||||||||||
| Sustaining capital expenditures | (87) | (86) | (117) | (105) | (85) | ||||||||||||||||||||||||
AFFO(b)(c)(d)(e) | $ | 3,013 | $ | 2,878 | $ | 2,371 | $ | 2,223 | $ | 1,781 | |||||||||||||||||||
Weighted-average common shares outstanding—diluted(f) | 434 | 425 | 418 | 415 | 383 | ||||||||||||||||||||||||
AFFO per share(b)(c)(d)(e)(f) | $ | 6.95 | $ | 6.78 | $ | 5.68 | $ | 5.36 | $ | 4.65 | |||||||||||||||||||
(a)Does not reflect the impact related to the ATO Settlement (as defined in the April 2021 8-K), which is attributable to discontinued operations in the first quarter of 2021 as discussed in the April 2021 8-K.
(b)See "Non-GAAP Financial Measures, Segment Measures and Other Calculations" for a discussion of our definitions of FFO and AFFO, including per share amounts.
(c)FFO and AFFO are reduced by cash paid for preferred stock dividends during the period in which they are paid.
(d)The above reconciliation excludes line items included in our definition which are not applicable for the periods shown.
(e)Attributable to CCIC common shareholders.
(f)For all periods prior to the year ended December 31, 2020, the diluted weighted-average common shares outstanding does not include any conversions of preferred stock in the share count.
36
Crown Castle International Corp.
Second Quarter 2022
| COMPANY OVERVIEW | FINANCIALS & METRICS | ASSET PORTFOLIO OVERVIEW | CAPITALIZATION OVERVIEW | APPENDIX | ||||||||||
Reconciliation of Current Outlook for FFO and AFFO:
| (in millions, except per share amounts) | Full Year 2022 Outlook(d) | ||||||||||
| Income (loss) from continuing operations | $1,654 | to | $1,734 | ||||||||
| Real estate related depreciation, amortization and accretion | $1,607 | to | $1,687 | ||||||||
| Asset write-down charges | $20 | to | $30 | ||||||||
FFO(a)(b) | $3,343 | to | $3,388 | ||||||||
Weighted-average common shares outstanding—diluted(c) | 435 | ||||||||||
FFO per share(a)(b)(c) | $7.69 | to | $7.79 | ||||||||
| FFO (from above) | $3,343 | to | $3,388 | ||||||||
| Adjustments to increase (decrease) FFO: | |||||||||||
| Straight-lined revenues | $(419) | to | $(399) | ||||||||
| Straight-lined expenses | $56 | to | $76 | ||||||||
| Stock-based compensation expense | $135 | to | $139 | ||||||||
| Non-cash portion of tax provision | $0 | to | $15 | ||||||||
| Non-real estate related depreciation, amortization and accretion | $43 | to | $58 | ||||||||
| Amortization of non-cash interest expense | $5 | to | $15 | ||||||||
| Other (income) expense | $0 | to | $5 | ||||||||
| (Gains) losses on retirement of long-term obligations | $25 | to | $75 | ||||||||
| Acquisition and integration costs | $1 | to | $9 | ||||||||
| Sustaining capital expenditures | $(98) | to | $(78) | ||||||||
AFFO(a)(b) | $3,178 | to | $3,223 | ||||||||
Weighted-average common shares outstanding—diluted(c) | 435 | ||||||||||
AFFO per share(a)(b)(c) | $7.31 | to | $7.41 | ||||||||
(a)See "Non-GAAP Financial Measures, Segment Measures and Other Calculations" for a discussion of our definitions of FFO, including per share amounts, and AFFO, including per share amounts.
(b)The above reconciliation excludes line items included in our definition which are not applicable for the periods shown.
(c)The assumption for diluted weighted-average common shares outstanding for full year 2022 Outlook is based on the diluted common shares outstanding as of June 30, 2022.
(d)As issued on July 20, 2022.
37
Crown Castle International Corp.
Second Quarter 2022
| COMPANY OVERVIEW | FINANCIALS & METRICS | ASSET PORTFOLIO OVERVIEW | CAPITALIZATION OVERVIEW | APPENDIX | ||||||||||
Reconciliation of Results Adjusted for Nontypical Items to As Reported Results:
| Full Year 2020 | ||||||||||||||||||||
| (dollars in millions, except per share amounts) | As Reported | Less: Impact from Nontypical Items | Exclusive of Impact from Nontypical Items | |||||||||||||||||
| Income (loss) from continuing operations | $ | 1,056 | $ | (223) | (b) | $ | 833 | |||||||||||||
AFFO(a) | 2,878 | (286) | (c) | 2,592 | ||||||||||||||||
AFFO per share(a) | $ | 6.78 | $ | (0.68) | (c) | $ | 6.10 | |||||||||||||
Net Debt to Last Quarter Annualized Adjusted EBITDA Calculation:
| Three Months Ended June 30, | |||||||||||
| (dollars in millions) | 2022 | 2021(d) | |||||||||
| Total face value of debt | $ | 21,444 | $ | 20,268 | |||||||
| Less: Ending cash, cash equivalents and restricted cash | 446 | 525 | |||||||||
| Total net debt | $ | 20,998 | $ | 19,743 | |||||||
| Adjusted EBITDA | $ | 1,078 | $ | 958 | |||||||
| Last quarter annualized Adjusted EBITDA | 4,312 | 3,834 | |||||||||
| Net debt to Last Quarter Annualized Adjusted EBITDA | 4.9 | x | 5.1 | x | |||||||
Cash Interest Coverage Ratio Calculation:
| Three Months Ended June 30, | |||||||||||
| (dollars in millions) | 2022 | 2021 | |||||||||
| Adjusted EBITDA | $ | 1,078 | $ | 958 | |||||||
| Interest expense on debt obligations | 161 | 157 | |||||||||
| 6.7 | x | 6.1 | x | ||||||||
(a)See "Non-GAAP Financial Measures, Segment Measures and Other Calculations" for further information and reconciliation of non-GAAP financial measures to income (loss) from continuing operations, as computed in accordance with GAAP.
(b)Impact from Nontypical Items on income (loss) from continuing operations included in the 2020 fourth quarter operating results is comprised of other operating income of $362 million, offset by incremental operating expenses of $76 million and associated asset write-downs of $63 million.
(c)Impact from Nontypical Items on AFFO and AFFO per share included in the 2020 fourth quarter operating results is comprised of other operating income of $362 million, offset by incremental operating expenses of $76 million.
(d)Does not reflect the use of net proceeds from the June 2021 senior notes offering to repay the Senior Secured Tower Revenue Notes, Series 2015-1, in July 2021.
38
Serious News for Serious Traders! Try StreetInsider.com Premium Free!
You May Also Be Interested In
- €243B Tech Spend Ahead, but Only 1 in 4 Firms Achieves Scale: WBAM Research Reveals Structural Paradox
- Rockstar Games Announces Pre-Orders for Grand Theft Auto VI
- A New Era of School Storytelling Begins: DistrictWON Announces a $20+ Million Historic Investment in School News
Create E-mail Alert Related Categories
SEC FilingsSign up for StreetInsider Free!
Receive full access to all new and archived articles, unlimited portfolio tracking, e-mail alerts, custom newswires and RSS feeds - and more!