

Form 8-K CONSUMERS ENERGY CO For: Jul 28 Filed by: CMS ENERGY CORP
 Tweet
Tweet Share
Share
UNITED STATES
SECURITIES AND EXCHANGE COMMISSION
Washington, D.C. 20549
FORM
CURRENT REPORT
PURSUANT TO SECTION 13 OR 15(d) OF
THE SECURITIES EXCHANGE ACT OF 1934
Date of Report (Date of earliest event reported)
| Commission | Registrant; State of Incorporation; | IRS Employer | ||
| File Number | Address; and Telephone Number | Identification No. | ||
|
(A |
||||
|
(A
|
Check the appropriate box below if the Form 8-K filing is intended to simultaneously satisfy the filing obligation of the registrant under any of the following provisions:
Securities registered pursuant to Section 12(b) of the Act:
| Title of each class | Trading Symbol(s) | Name of each exchange on which registered | ||
| Cumulative Redeemable Perpetual Preferred Stock, Series C | ||||
Indicate by check mark whether the registrant is an emerging growth company as defined in Rule 405 of the Securities Act of 1933 (§230.405 of this chapter) or Rule 12b-2 of the Securities Exchange Act of 1934 (§240.12b-2 of this chapter).
Emerging growth
company: CMS Energy Corporation
If an emerging growth company, indicate by check mark if the registrant has elected not to use the extended transition period for complying with any new or revised financial accounting standards provided pursuant to Section 13(a) of the Exchange Act.
CMS Energy Corporation ¨ Consumers Energy Company ¨
Item 2.02. Results of Operations and Financial Condition.
On July 28, 2022, CMS Energy Corporation (“CMS Energy”) issued a News Release, in which it announced its 2022 second quarter results. Attached as Exhibit 99.1 to this report and incorporated herein by reference is a copy of the CMS Energy News Release, furnished as a part of this report.
Exhibit 99.1 contains certain financial measures that are considered “non-GAAP financial measures” as defined in Securities and Exchange Commission rules. Other than forward-looking earnings guidance, Exhibit 99.1 contains a reconciliation of these non-GAAP financial measures to their most directly comparable financial measures calculated and presented in accordance with accounting principles generally accepted in the United States. Adjustments could include items such as discontinued operations, asset sales, impairments, restructuring costs, changes in accounting principles, changes in federal tax policy, regulatory items from prior years, unrealized gains or losses from mark-to-market adjustments recognized in net income related to CMS Enterprises’ interest expense, or other items. Management views adjusted earnings as a key measure of the company’s present operating financial performance and uses adjusted earnings for external communications with analysts and investors. Internally, the company uses adjusted earnings to measure and assess performance. Because CMS Energy is not able to estimate the impact of specific line items, which have the potential to significantly impact, favorably or unfavorably, reported earnings in future periods, Exhibit 99.1 does not contain reported earnings guidance nor a reconciliation for the comparable future period earnings. The adjusted earnings should be considered supplemental information to assist in understanding our business results, rather than as a substitute for the reported earnings. All references to net income refer to net income available to common stockholders and references to earnings per share are on a diluted basis.
Item 7.01. Regulation FD Disclosure.
The information set forth in the CMS Energy News Release dated July 28, 2022, attached as Exhibit 99.1, is incorporated by reference in response to this Item 7.01.
CMS Energy will hold a webcast to discuss its 2022 second quarter results and provide a business and financial outlook on July 28 at 9:30 a.m. (ET). A copy of the CMS Energy presentation is furnished as Exhibit 99.2 to this report. A webcast of the presentation will be available on the CMS Energy website, www.cmsenergy.com.
In accordance with General Instruction B.2 of Form 8-K, the information in this Current Report on Form 8-K, including Exhibits 99.1 and 99.2, shall not be deemed “filed” for the purposes of Section 18 of the Securities Exchange Act of 1934, or otherwise subject to the liabilities of that section, nor shall it be deemed incorporated by reference in any filing under the Securities Act of 1933.
Investors and others should note that CMS Energy routinely posts important information on its website and considers the Investor Relations section, www.cmsenergy.com/investor-relations, a channel of distribution.
Item 9.01. Financial Statements and Exhibits.
(d) Exhibits.
| Exhibit Index | ||
| 99.1 | CMS Energy News Release dated July 28, 2022 | |
| 99.2 | CMS Energy presentation dated July 28, 2022 | |
| 104 | Cover Page Interactive Data File (the cover page XBRL tags are embedded in the Inline XBRL document). | |
SIGNATURES
Pursuant to the requirements of the Securities Exchange Act of 1934, the Registrants have duly caused this report to be signed on their behalf by the undersigned hereunto duly authorized.
| CMS ENERGY CORPORATION |
| Dated: July 28, 2022 | By: | /s/ Rejji P. Hayes |
| Rejji P. Hayes | ||
| Executive Vice President and Chief Financial Officer |
| CONSUMERS ENERGY COMPANY |
| Dated: July 28, 2022 | By: | /s/ Rejji P. Hayes |
| Rejji P. Hayes | ||
| Executive Vice President and Chief Financial Officer |
Exhibit 99.1

CMS Energy Announces Strong Second Quarter Results, Reaffirms 2022 Adjusted EPS Guidance
JACKSON, Mich., July 28, 2022 – CMS Energy announced today reported earnings per share of $0.50 for the second quarter of 2022, compared to $0.61 per share for the same quarter in 2021. The company’s adjusted earnings per share for the second quarter of 2022 were $0.53, compared to $0.55 per share for the same quarter in 2021. For the first six months of the year, the company reported $1.71 per share compared to $1.82 per share for the same timeframe in 2021. On an adjusted earnings per share basis year to date, the company reported $1.73 per share in 2022, compared to $1.64 per share in 2021.
CMS Energy reaffirmed its 2022 adjusted earnings guidance of $2.85 to $2.89* per share (*See below for important information about non-GAAP measures) and reaffirmed long-term adjusted EPS growth of 6 to 8 percent, with continued confidence toward the high end of the adjusted EPS growth range.
“Our company took a major step forward with the regulatory approvals of our natural gas rate case settlement and the Integrated Resource Plan, eliminating coal generation by 2025 and leading the clean energy transformation by adding more solar and battery storage, while increasing reliability,” said Garrick Rochow, President and CEO of CMS Energy and Consumers Energy. “These approvals strengthen our financial outlook for investors while driving the decarbonatization of our electric and gas systems at affordable prices for our customers and the communities we serve.”
CMS Energy (NYSE: CMS) is a Michigan-based energy provider featuring Consumers Energy as its primary business. It also owns and operates independent power generation businesses.
# # #
CMS Energy will hold a webcast to discuss its 2022 second quarter results and provide a business and financial outlook on Thursday, July 28 at 9:30 a.m. (EDT). To participate in the webcast, go to CMS Energy’s homepage (cmsenergy.com) and select “Events and Presentations.”
Important information for investors about non-GAAP measures and other disclosures.
This news release contains non-Generally Accepted Accounting Principles (non-GAAP) measures, such as adjusted earnings. All references to net income refer to net income available to common stockholders and references to earnings per share are on a diluted basis. Adjustments could include items such as discontinued operations, asset sales, impairments, restructuring costs, changes in accounting principles, changes in federal tax policy, regulatory items from prior years, unrealized gains or losses from mark-to-market adjustments recognized in net income related to CMS Enterprises’ interest expense, or other items. Management views adjusted earnings as a key measure of the company's present operating financial performance and uses adjusted earnings for external communications with analysts and investors. Internally, the company uses adjusted earnings to measure and assess performance. Because the company is not able to estimate the impact of specific line items, which have the potential to significantly impact, favorably or unfavorably, the company's reported earnings in future periods, the company is not providing reported earnings guidance nor is it providing a reconciliation for the comparable future period earnings. The company’s adjusted earnings should be considered supplemental information to assist in understanding our business results, rather than as a substitute for the reported earnings.
This news release contains "forward-looking statements." The forward-looking statements are subject to risks and uncertainties that could cause CMS Energy’s and Consumers Energy’s results to differ materially. All forward-looking statements should be considered in the context of the risk and other factors detailed from time to time in CMS Energy's and Consumers Energy's Securities and Exchange Commission filings.
Investors and others should note that CMS Energy routinely posts important information on its website and considers the Investor Relations section, www.cmsenergy.com/investor-relations, a channel of distribution.
For more information on CMS Energy, please visit our website at cmsenergy.com. To sign up for email alert notifications, please visit the Investor Relations section of our website.
Media Contacts: Katie Carey, 517/740-1739
Investment Analyst Contact: Travis Uphaus, 517/817-9241
2
Page 1 of 3
CMS ENERGY CORPORATION
Consolidated Statements of Income
(Unaudited)
| In Millions, Except Per Share Amounts | ||||||||||||||||
| Three Months Ended | Six Months Ended | |||||||||||||||
| 6/30/22 | 6/30/21 | 6/30/22 | 6/30/21 | |||||||||||||
| Operating revenue | $ | 1,920 | $ | 1,558 | $ | 4,294 | $ | 3,571 | ||||||||
| Operating expenses | 1,681 | 1,306 | 3,599 | 2,889 | ||||||||||||
| Operating Income | 239 | 252 | 695 | 682 | ||||||||||||
| Other income | 43 | 48 | 91 | 92 | ||||||||||||
| Interest charges | 126 | 125 | 250 | 249 | ||||||||||||
| Income Before Income Taxes | 156 | 175 | 536 | 525 | ||||||||||||
| Income tax expense | 14 | 22 | 53 | 64 | ||||||||||||
| Income From Continuing Operations | 142 | 153 | 483 | 461 | ||||||||||||
| Income from discontinued operations, net of tax | - | 18 | 4 | 52 | ||||||||||||
| Net Income | 142 | 171 | 487 | 513 | ||||||||||||
| Loss attributable to noncontrolling interests | (6 | ) | (5 | ) | (14 | ) | (12 | ) | ||||||||
| Net Income Attributable to CMS Energy | 148 | 176 | 501 | 525 | ||||||||||||
| Preferred stock dividends | 3 | - | 5 | - | ||||||||||||
| Net Income Available to Common Stockholders | $ | 145 | $ | 176 | $ | 496 | $ | 525 | ||||||||
| Diluted Earnings Per Average Common Share | ||||||||||||||||
| Income from continuing operations per average common share available to common stockholders | $ | 0.50 | $ | 0.55 | $ | 1.70 | $ | 1.64 | ||||||||
| Income from discontinued operations per average common share available to common stockholders | - | 0.06 | 0.01 | 0.18 | ||||||||||||
| Diluted earnings per average common share | $ | 0.50 | $ | 0.61 | $ | 1.71 | $ | 1.82 | ||||||||
Page 2 of 3
CMS ENERGY CORPORATION
Summarized Consolidated Balance Sheets
(Unaudited)
| In Millions | ||||||||
| As of | ||||||||
| 6/30/22 | 12/31/21 | |||||||
| Assets | ||||||||
| Current assets | ||||||||
| Cash and cash equivalents | $ | 77 | $ | 452 | ||||
| Restricted cash and cash equivalents | 19 | 24 | ||||||
| Other current assets | 2,297 | 2,151 | ||||||
| Total current assets | 2,393 | 2,627 | ||||||
| Non-current assets | ||||||||
| Plant, property, and equipment | 21,627 | 22,352 | ||||||
| Other non-current assets | 5,020 | 3,774 | ||||||
| Total Assets | $ | 29,040 | $ | 28,753 | ||||
| Liabilities and Equity | ||||||||
| Current liabilities (1) | $ | 1,670 | $ | 1,822 | ||||
| Non-current liabilities (1) | 7,469 | 7,269 | ||||||
| Capitalization | ||||||||
| Debt, finance leases, and other financing (excluding securitization debt) (2) | ||||||||
| Debt, finance leases, and other financing (excluding non-recourse and securitization debt) | 12,246 | 12,200 | ||||||
| Non-recourse debt | - | 76 | ||||||
| Total debt, finance leases, and other financing (excluding securitization debt) | 12,246 | 12,276 | ||||||
| Preferred stock and securities | 224 | 224 | ||||||
| Noncontrolling interests | 593 | 557 | ||||||
| Common stockholders' equity | 6,654 | 6,407 | ||||||
| Total capitalization (excluding securitization debt) | 19,717 | 19,464 | ||||||
| Securitization debt (2) | 184 | 198 | ||||||
| Total Liabilities and Equity | $ | 29,040 | $ | 28,753 | ||||
| (1) | Excludes debt, finance leases, and other financing. |
| (2) | Includes current and non-current portions. |
CMS ENERGY CORPORATION
Summarized Consolidated Statements of Cash Flows
(Unaudited)
| In Millions | ||||||||
| Six Months Ended | ||||||||
| 6/30/22 | 6/30/21 | |||||||
| Beginning of Period Cash and Cash Equivalents, Including Restricted Amounts | $ | 476 | $ | 185 | ||||
| Net cash provided by operating activities | 1,059 | 1,367 | ||||||
| Net cash used in investing activities | (1,139 | ) | (851 | ) | ||||
| Cash flows from operating and investing activities | (80 | ) | 516 | |||||
| Net cash used in financing activities | (300 | ) | (409 | ) | ||||
| Total Cash Flows | $ | (380 | ) | $ | 107 | |||
| End of Period Cash and Cash Equivalents, Including Restricted Amounts | $ | 96 | $ | 292 | ||||
Page 3 of 3
CMS ENERGY CORPORATION
Reconciliation of GAAP Net Income to Non-GAAP Adjusted Net Income
(Unaudited)
| In Millions, Except Per Share Amounts | ||||||||||||||||
| Three Months Ended | Six Months Ended | |||||||||||||||
| 6/30/22 | 6/30/21 | 6/30/22 | 6/30/21 | |||||||||||||
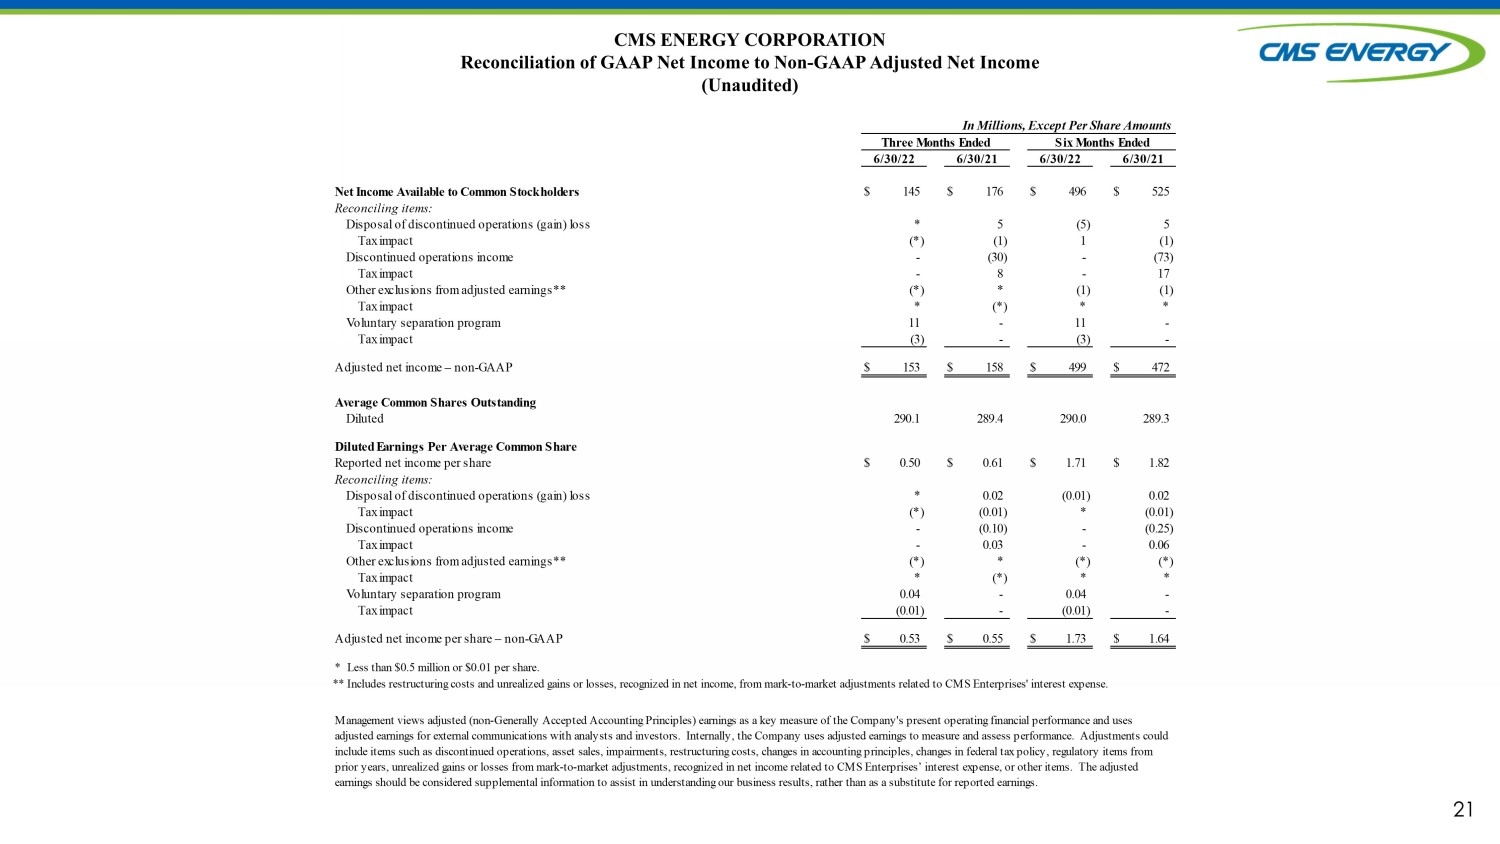
| Net Income Available to Common Stockholders | $ | 145 | $ | 176 | $ | 496 | $ | 525 | ||||||||
| Reconciling items: | ||||||||||||||||
| Disposal of discontinued operations (gain) loss | * | 5 | (5 | ) | 5 | |||||||||||
| Tax impact | (* | ) | (1 | ) | 1 | (1 | ) | |||||||||
| Discontinued operations income | - | (30 | ) | - | (73 | ) | ||||||||||
| Tax impact | - | 8 | - | 17 | ||||||||||||
| Other exclusions from adjusted earnings** | (* | ) | * | (1 | ) | (1 | ) | |||||||||
| Tax impact | * | (* | ) | * | * | |||||||||||
| Voluntary separation program | 11 | - | 11 | - | ||||||||||||
| Tax impact | (3 | ) | - | (3 | ) | - | ||||||||||
| Adjusted net income – non-GAAP | $ | 153 | $ | 158 | $ | 499 | $ | 472 | ||||||||
| Average Common Shares Outstanding | ||||||||||||||||
| Diluted | 290.1 | 289.4 | 290.0 | 289.3 | ||||||||||||
| Diluted Earnings Per Average Common Share | ||||||||||||||||
| Reported net income per share | $ | 0.50 | $ | 0.61 | $ | 1.71 | $ | 1.82 | ||||||||
| Reconciling items: | ||||||||||||||||
| Disposal of discontinued operations (gain) loss | * | 0.02 | (0.01 | ) | 0.02 | |||||||||||
| Tax impact | (* | ) | (0.01 | ) | * | (0.01 | ) | |||||||||
| Discontinued operations income | - | (0.10 | ) | - | (0.25 | ) | ||||||||||
| Tax impact | - | 0.03 | - | 0.06 | ||||||||||||
| Other exclusions from adjusted earnings** | (* | ) | * | (* | ) | (* | ) | |||||||||
| Tax impact | * | (* | ) | * | * | |||||||||||
| Voluntary separation program | 0.04 | - | 0.04 | - | ||||||||||||
| Tax impact | (0.01 | ) | - | (0.01 | ) | - | ||||||||||
| Adjusted net income per share – non-GAAP | $ | 0.53 | $ | 0.55 | $ | 1.73 | $ | 1.64 | ||||||||
| * | Less than $0.5 million or $0.01 per share. |
| ** | Includes restructuring costs and unrealized gains or losses, recognized in net income, from mark-to-market adjustments related to CMS Enterprises' interest expense. |
Management views adjusted (non-Generally Accepted Accounting Principles) earnings as a key measure of the Company's present operating financial performance and uses adjusted earnings for external communications with analysts and investors. Internally, the Company uses adjusted earnings to measure and assess performance. Adjustments could include items such as discontinued operations, asset sales, impairments, restructuring costs, changes in accounting principles, changes in federal tax policy, regulatory items from prior years, unrealized gains or losses from mark-to-market adjustments, recognized in net income related to CMS Enterprises’ interest expense, or other items. The adjusted earnings should be considered supplemental information to assist in understanding our business results, rather than as a substitute for reported earnings.
Exhibit 99.2

Second Quarter 2022 Results and Outlook July 28, 2022 Leading the CLEAN ENERGY TRANSFORMATION

2 Enter “so what” if necessary – Century Gothic, Bold, Size 18 or smaller This presentation is made as of the date hereof and contains “forward - looking statements” as defined in Rule 3b - 6 of the Securit ies Exchange Act of 1934, Rule 175 of the Securities Act of 1933, and relevant legal decisions. The forward - looking statements are subject to risks and uncertainties. All forward - looking statements should be considered in the context of the risk and other factors detailed from time to time in CMS E nergy’s and Consumers Energy’s Securities and Exchange Commission filings. Forward - looking statements should be read in conjunction with “FO RWARD - LOOKING STATEMENTS AND INFORMATION” and “RISK FACTORS” sections of CMS Energy’s and Consumers Energy’s most recent Form 10 - K and as upda ted in reports CMS Energy and Consumers Energy file with the Securities and Exchange Commission. CMS Energy’s and Consumers Energy’ s “ FORWARD - LOOKING STATEMENTS AND INFORMATION” and “RISK FACTORS” sections are incorporated herein by reference and discuss important fa cto rs that could cause CMS Energy’s and Consumers Energy’s results to differ materially from those anticipated in such statements. CMS Ene rgy and Consumers Energy undertake no obligation to update any of the information presented herein to reflect facts, events or circumstances af ter the date hereof. The presentation also includes non - GAAP measures when describing CMS Energy’s results of operations and financial performance. A reconciliation of each of these measures to the most directly comparable GAAP measure is included in the appendix and posted on our website at www.cmsenergy.com. Investors and others should note that CMS Energy routinely posts important information on its website and considers the Inves tor Relations section, www.cmsenergy.com/investor - relations, a channel of distribution. Presentation endnotes are included after the appendix. 2
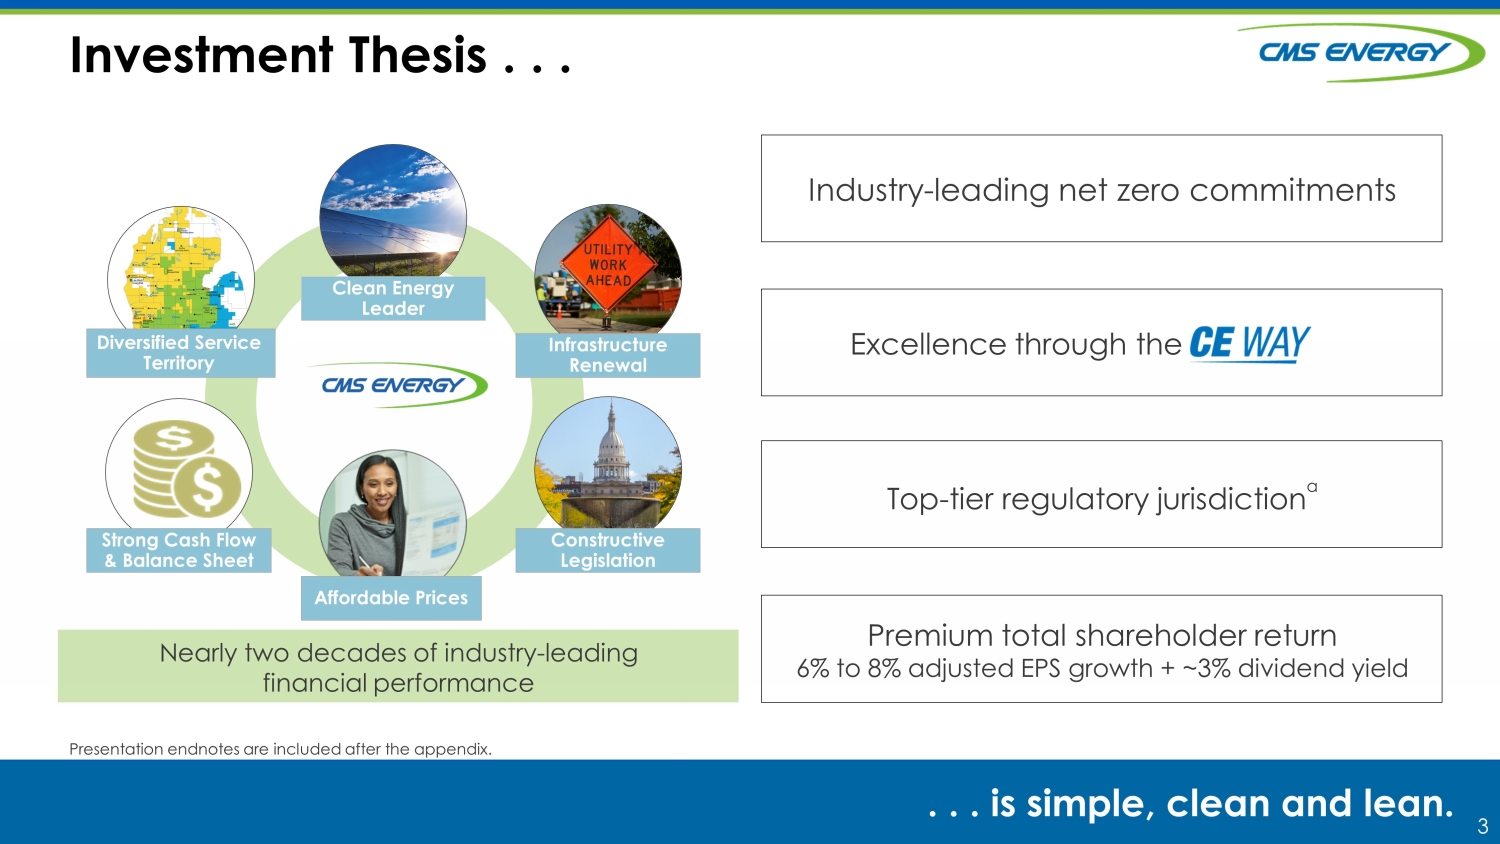
3 Investment Thesis . . . . . . is simple, clean and lean. Infrastructure Renewal Constructive Legislation Strong Cash Flow & Balance Sheet Clean Energy Leader Diversified Service Territory Nearly two decades of industry - leading financial performance Affordable Prices Industry - leading net zero commitments Excellence through the Top - tier regulatory jurisdiction a Premium total shareholder r eturn 6% to 8% adjusted EPS growth + ~3% dividend yield Presentation endnotes are included after the appendix.

4 Michigan Regulatory Environment . . . . . . remains top - tier. Supportive Energy Law • Timely recovery of investments x Forward - looking test years x 10 - month rate cases x Earn authorized ROEs x Monthly fuel adjustment trackers (PSCR/GCR) • Supportive incentives x Constructive ROEs x 10.7% ROE for RPS x EE incentive (~$ 50 M/yr) x FCM adder on PPAs • Appointed Commissioners 7 10 17 11 6 5 4 3 2 1 1 Top - Tier Regulatory Jurisdiction a Michigan 2013 - present Presentation endnotes are included after the appendix.
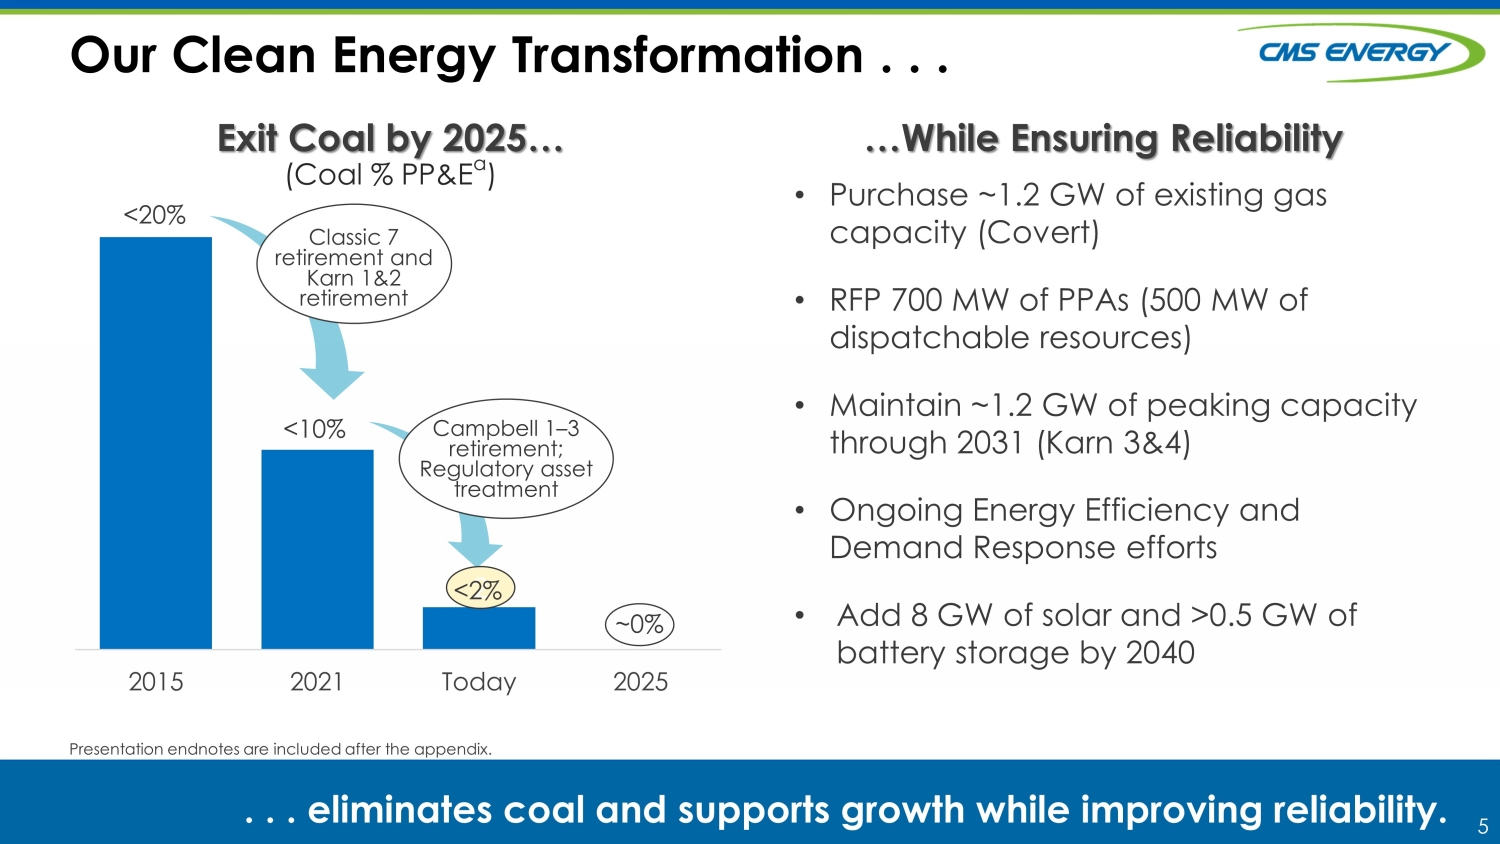
5 Our Clean Energy Transformation . . . <20% Campbell 1&2 2015 2021 Today 2025 Exit Coal by 2025… …While Ensuring Reliability <10% Campbell 1 – 3 retirement; Regulatory asset treatment ~0% . . . eliminates coal and supports growth while improving reliability . Presentation endnotes are included after the appendix. Classic 7 retirement and Karn 1&2 retirement • Purchase ~ 1.2 GW of existing gas capacity (Covert) • RFP 700 MW of PPAs (500 MW of dispatchable resources) • Maintain ~1.2 GW of peaking capacity through 2031 ( Karn 3&4) • Ongoing Energy Efficiency and Demand Response efforts • Add 8 GW of solar and >0.5 GW of battery storage by 2040 (Coal % PP&E a ) 2 <2%
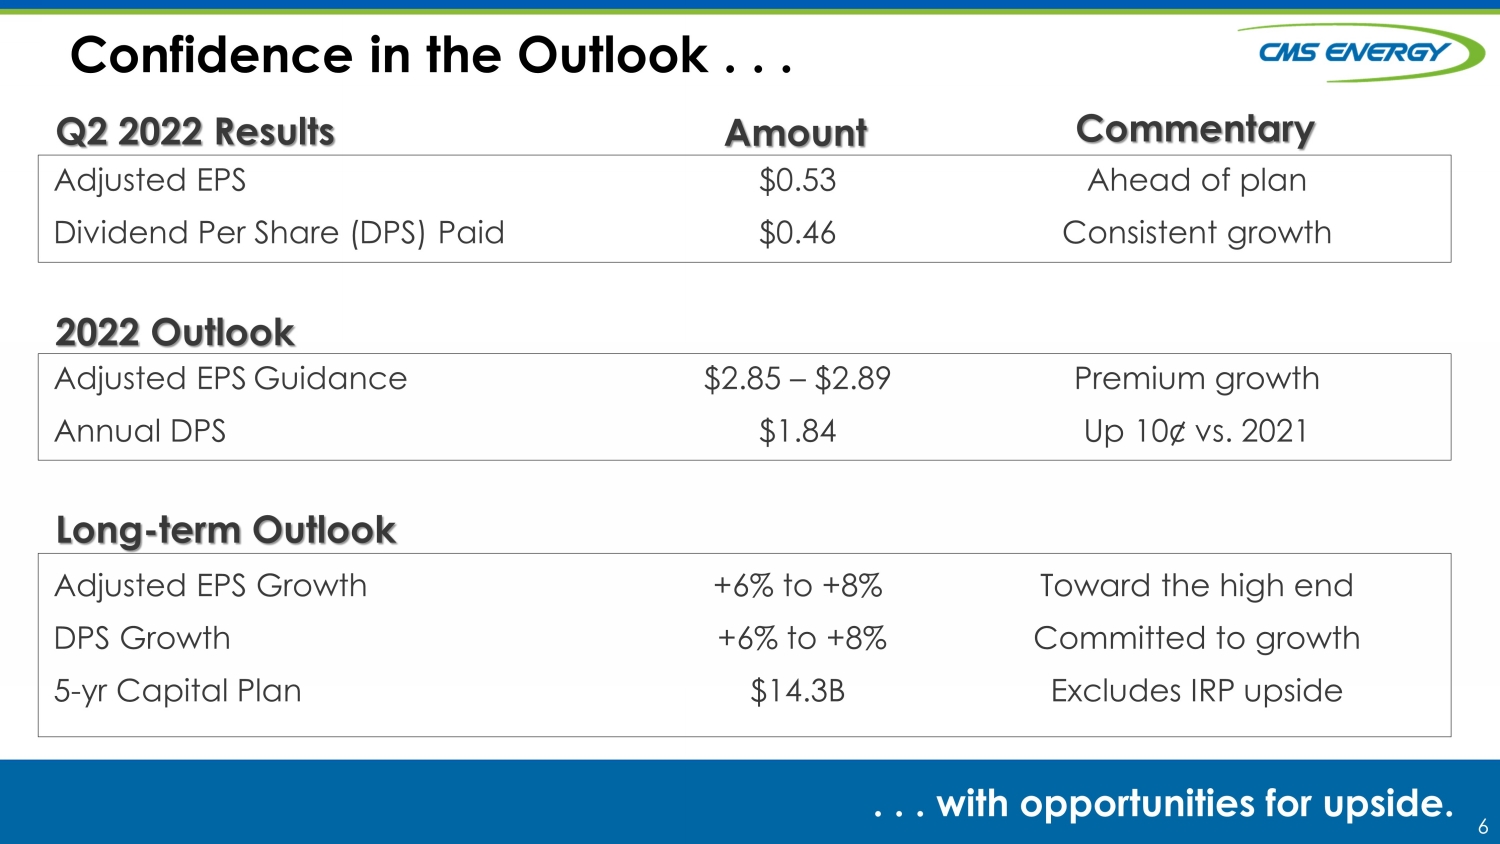
6 Commentary Amount Confidence in the Outlook . . . . . . with opportunities for upside. Q2 2022 Results Adjusted EPS Dividend Per Share (DPS) Paid $0.53 $0.46 Ahead of plan Consistent growth Adjusted EPS Guidance Annual DPS $2.85 – $2.89 $1.84 Premium growth Up 10¢ vs. 2021 Adjusted EPS Growth DPS Growth 5 - yr Capital Plan +6% to +8% +6% to +8% $14.3B Toward the high end Committed to growth Excludes IRP upside Long - term Outlook 2022 Outlook

7 2022 Adjusted EPS . . . . . . managing through COVID - 19 risks. . . . i s well positioned for the second half of the year. First Half 9 ¢ Six Months To - Go 11¢ – 15 ¢ Presentation endnotes are included after the appendix. 2021 Weather Rates & Investment Customer Initiatives Usage, Enterprises, Tax & Other Normal Weather Rates & Investment Cost Savings & Normalized Storms Usage, Enterprises, Tax & Other 2022 $2.85 – $2.89 16¢ $2.65 3 ¢ (3)¢ (1)¢ 10¢ (24)¢ – (28)¢ (7)¢ 30¢ First Half $1 .73 First Half $ 1.64 2021 2022 Reported EPS $1.82 $1.71 Adjustments a ( 0.18) 0.02 Adjusted EPS a $ 1.64 $ 1.73 First Half EPS Results x Base rates set for 2022 x

8 . Ratings Drivers Credit Metrics Maintained . . . Consumers Energy CMS Energy • Strong financial position • Growing operating cash flow • Constructive return on regulated investment • Supportive regulatory environment • Lower business risk Senior Secured Commercial Paper Outlook Senior Unsecured Junior Subordinated Outlook Last Review A A - 2 Stable BBB BBB - Stable Mar. 2022 A1 P - 2 Stable Baa2 Baa3 Stable May 2022 A+ F - 2 Stable BBB BB+ Stable Mar. 2022 S&P Moody’s Fitch . . . at solid investment - grade levels. x x x
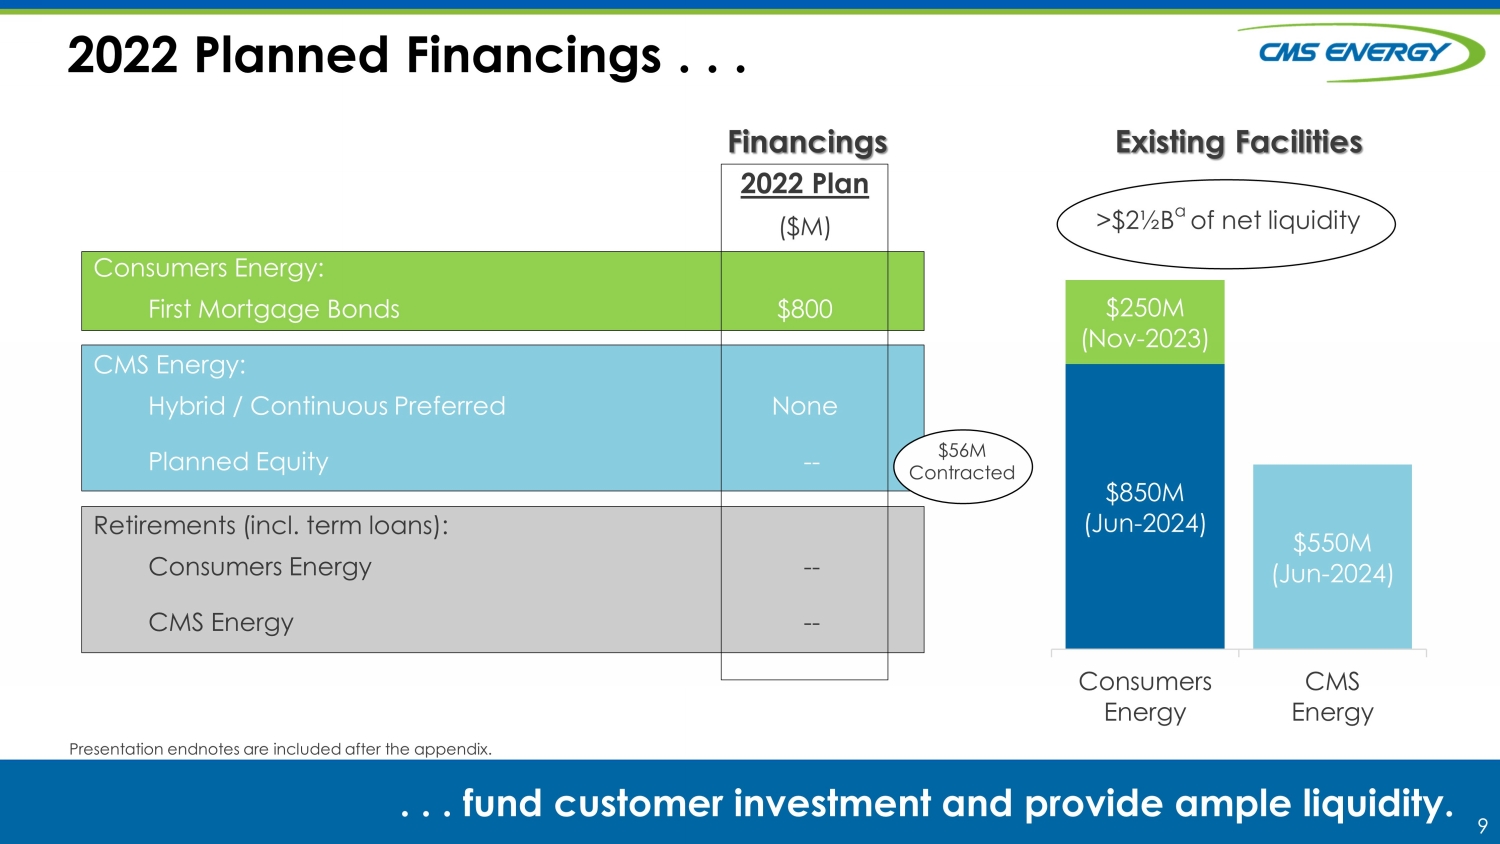
9 2022 Plan ($M) Consumers Energy: First Mortgage Bonds $800 CMS Energy: Hybrid / Continuous Preferred None Planned Equity -- Retirements (incl. term loans): Consumers Energy -- CMS Energy -- Existing Facilities $850M (Jun - 2024) $550M (Jun - 2024) $250M (Nov - 2023) Consumers Energy CMS Energy Financings 2022 Planned Financings . . . . . . fund customer investment and provide ample liquidity. Presentation endnotes are included after the appendix. $56M Contracted > $2 ½ B a of net liquidity

10 Recession Industry - Leading Financial Performance . . . . . . for nearly two decades, regardless of co nditions . 2003 2004 2005 2006 2007 2008 2009 2010 2011 2012 2013 2014 2015 2016 2017 2018 2019 2020 2021 2022+ Future Recession Adjusted EPS a Dividend +6% to +8% Weather Help Hurt Cold winter Mild summer Hot Summer Warm winter Mild summer Cold winter Summer - less Hot summer Hot summer Warm winter Mild summer Polar vortex Cold Feb Warm Dec Warm winter Warm winter Hot summer Storms Hot Summer Storms Governor (D) Governor (R) Governor (D) Commission (D) Commission (D) Commission (R) Commission (I) Commission (D) Dave Joos John Russell Patti Poppe K. Whipple Garrick Rochow Recession / Pandemic Presentation endnotes are included after the appendix.

11 11 Q&A Thank You!

12 12 Appendix

13 2022 Michigan’s Strong Regulatory Construct . . . Gas . . . ensures forward - looking visibility. 2021 Integrated Resource Plan (IRP) Electric Dec. 22 nd : Final Order $59M a 9.9% ROE U - 20963 x Q1 2023: Expected Final Order Jun. 30 th : Filed IRP U - 21090 x Filed Dec. 1 st : Updated $233M 10.25% ROE U - 21148 x Presentation endnotes are included after the appendix. Gas stay - out - Amortization of gas tax benefits c in 2021 of ~$35M and 2022 of ~$75M Apr. 28 th : Filed $272M b 10.25% ROE U - 21224 x Jun. 23 rd : Settlement Approved IRP U - 21090 x Jul. 7 th Settlement Approved $170M, 9.9% ROE (Oct. 1 st ) U - 21224 x Gas

14 Utility Sales Continue to Recover . . . . . . w ith supportive economic backdrop in Michigan . Weather - Normalized Electric Deliveries a Residential Commercial Industrial Total ( 0.6) % 3.1% 2.9% b 1.5% b Presentation endnotes are included after the appendix. (YTD 2022 vs. YTD 2021) Economic Development Electric Customers Gas Customers ~1% ~1% (5 - Yr Avg. Customer Count) Residential Customer Growth 2016 – 2021 2016 2017 2018 2019 2020 2021 105 MW 126 MW 75 MW 45 MW 101 MW 69 MW Attracted > 500 MW of new or expanding business to our service territory since 2015 • $1B of state incentives • New energy intensive economic development rate Policy Support

15 2022 Sensitivities . . . . . . r eflect effective risk mitigation. Presentation endnotes are included after the appendix. Full - Year Impact Sensitivity Adj. EPS OCF Sales a Electric (~37,000 GWh) Gas (~304 Bcf ) + + 1% 1 + + ( ¢) 7 3 + + ($M) 27 13 Gas Prices + 50 ¢ + 0 + 60 Utility Earned ROE Electric Gas + + 10 bps 10 + + 2 1 + + 8 5 Interest Rates + 25 bps 1 1 Effective Tax Rate (10%) + 100 bps 3 0 + + + + Electric Residential Commercial Industrial 4¢ 2½ 2½¢ (1% Full Year in Volume) 2022 Adj. EPS Sensitivities Gas ½ ~½ ~½ Impact Electric ~$6½/ Month ($10/MWh) Electric PSCR Residential Bill Sensitivity Impact Gas ($1/Mcf) Gas Price Residential Bill Sensitivity ~$7½/ Month <
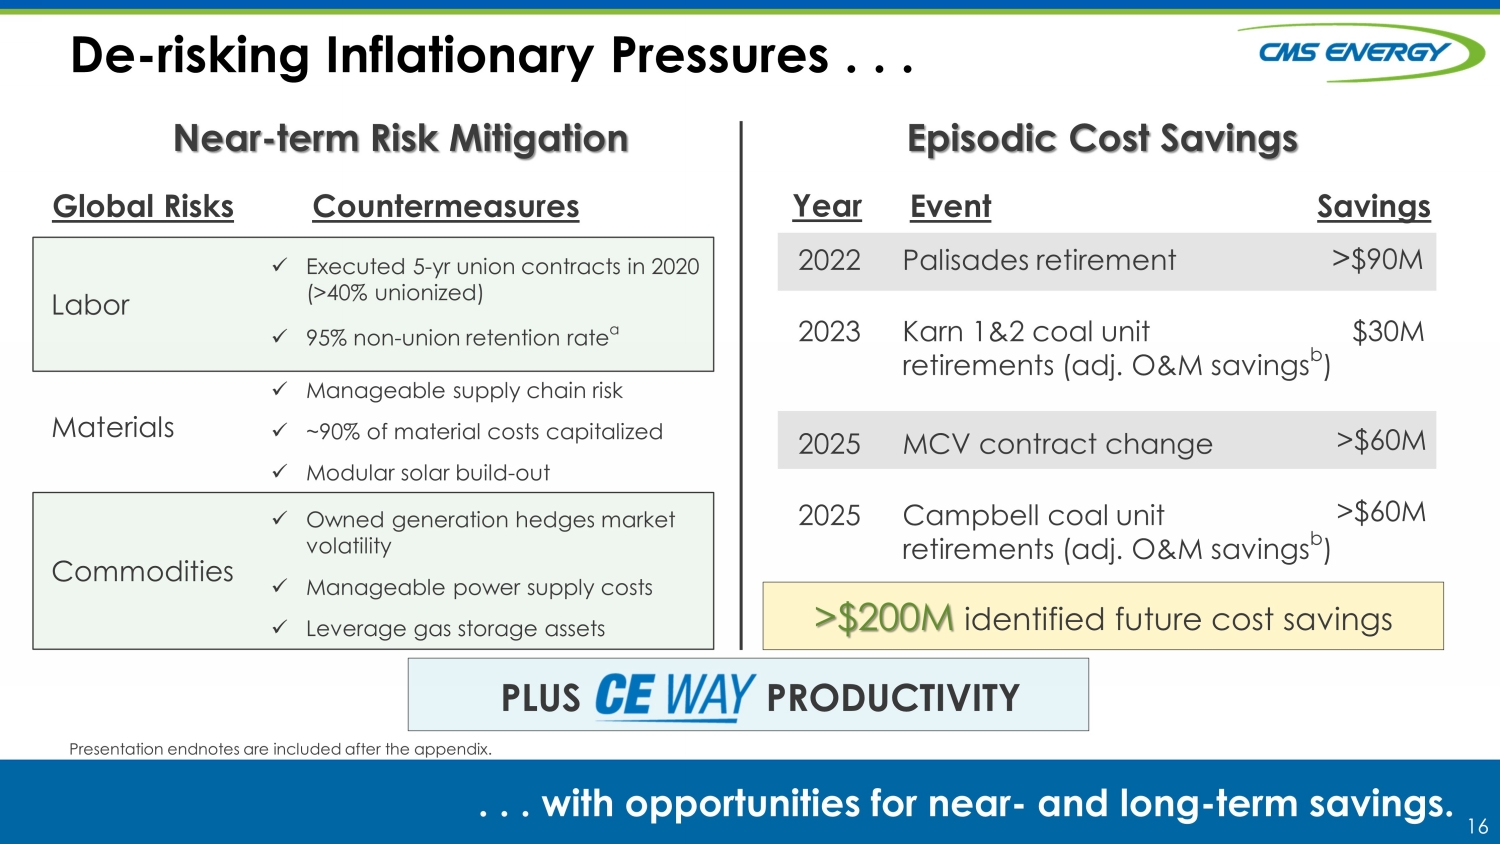
16 De - risking Inflationary Pressures . . . . . . with opportunities for near - and long - term savings. Presentation endnotes are included after the appendix. Near - term Risk Mitigation PLUS PRODUCTIVITY Episodic Cost Savings x Executed 5 - yr union contracts in 2020 (>40% unionized) x 95% non - union retention rate a x Manageable supply chain risk x ~90% of material costs capitalized x Modular solar build - out x Owned generation hedges market volatility x Manageable power supply costs x Leverage gas storage assets Labor Materials Commodities Global Risks Countermeasures 2022 2023 2025 2025 Palisades retirement Karn 1&2 coal unit retirements (adj. O&M savings b ) MCV contract change Campbell coal unit retirements (adj. O&M savings b ) > $90M $30M >$60M >$60M Year Event Savings >$200M identified future cost savings
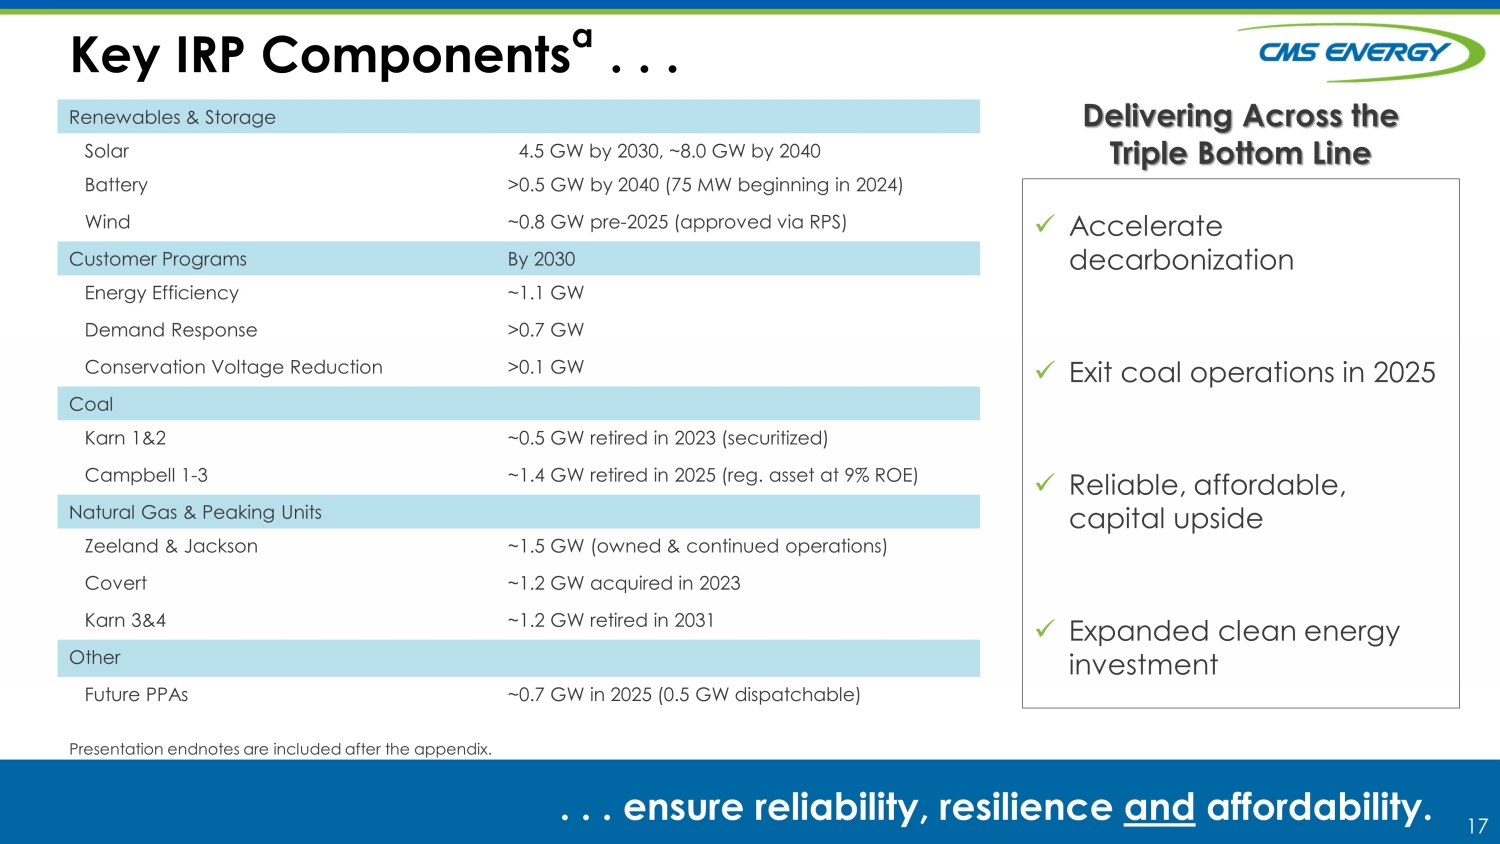
17 Renewables & Storage Solar 4.5 GW by 2030, ~8.0 GW by 2040 Battery >0.5 GW by 2040 (75 MW beginning in 2024) Wind ~0.8 GW pre - 2025 (approved via RPS) Customer Programs By 2030 Energy Efficiency ~1.1 GW Demand Response >0.7 GW Conservation Voltage Reduction >0.1 GW Coal Karn 1&2 ~0.5 GW retired in 2023 (securitized) Campbell 1 - 3 ~1.4 GW retired in 2025 (reg. asset at 9% ROE) Natural Gas & Peaking Units Zeeland & Jackson ~1.5 GW (owned & continued operations) Covert ~1.2 GW acquired in 2023 Karn 3&4 ~1.2 GW retired in 2031 Other Future PPAs ~0.7 GW in 2025 (0.5 GW dispatchable) x Accelerate decarbonization x Exit coal operations in 2025 x Reliable, affordable, capital upside x Expanded clean energy investment Key IRP Components a . . . . . . e nsure reliability, resilience and affordability. Delivering Across the Triple Bottom Line Presentation endnotes are included after the appendix.

18 18 Endnotes

19 19 Slide 3: a UBS Research, 2022 state rankings and D.C. Slide 4: a UBS Research, 2018 - 2022 state rankings and D.C.; Barclays Research, 2013 – 2017 state rankings and D.C. Slide 5 : a PP&E associated with coal based on calendar year; Today refers to 2Q2022 or ~$2.3B of coal assets less $678M securitization for Karn 1&2 and ~$1.3B regulatory asset treatment for Campbell 1 - 3 assets as a percent of total utility PP&E of $20,581M; 2025 assumes year - end total remaining utility coal assets of ~$300M are fully depreciated Slide 7: a See GAAP reconciliation on slide 21 Slide 9 : a Includes available revolvers, unrestricted cash and term loan at Consumers Energy executed in July 2022; excludes restricted cash Slide 10: a Excludes discontinued operations Slide 13: a Excludes $27M of lower depreciation expense previously approved and includes revised MPSC order approving ~$5M of depreciation expense i n March of 2022 b $272M request includes $6M surcharge for the recovery of distribution investments made in 2021 that exceeded what was authori zed in rates c Rate relief equivalent Slide 14: a YTD 2022 over YTD 2021 change in GWh, excludes ROA and other b Excludes one large, low - margin industrial customer Slide 15: a Reflects 2022 sales forecast; weather - normalized Slide 16: a Consumers Energy, non - union employees, average 3 - yr retention rate b Excludes potential fuel savings Slide 17: a Capacity references are in nameplate Presentation Endnotes

20 20 GAAP Reconciliation CMS Energy provides historical financial results on both a reported (GAAP) and adjusted (non - GAAP) basis and provides forward - lo oking guidance on an adjusted basis. During an oral presentation, references to “earnings” are on an adjusted basis. All references to net income refer to net income available t o c ommon stockholders and references to earnings per share are on a diluted basis. Adjustments could include items such as discontinued operations, asset sales, impairments, restructuring cos ts, changes in accounting principles, changes in federal tax policy, regulatory items from prior years, unrealized gains or losses from mark - to - market adjustments recognized in net income related t o CMS Enterprises’ interest expense, or other items. Management views adjusted earnings as a key measure of the company’s present operating financial performance and uses adjusted earnings for external communications with analysts and investors. Internally, the company uses adjusted earnings to measure and assess performance. Because the company is not able to estimate th e impact of specific line items, which have the potential to significantly impact, favorably or unfavorably, the company's reported earnings in future periods, the company is not providi ng reported earnings guidance nor is it providing a reconciliation for the comparable future period earnings. The adjusted earnings should be considered supplemental information to assist in under sta nding our business results, rather than as a substitute for the reported earnings.
21 CMS ENERGY CORPORATION Reconciliation of GAAP Net Income to Non - GAAP Adjusted Net Income (Unaudited ) Net Income Available to Common Stockholders $ 145 $ 176 $ 496 $ 525 Reconciling items: Disposal of discontinued operations (gain) loss * 5 (5) 5 Tax impact (*) (1) 1 (1) Discontinued operations income - (30) - (73) Tax impact - 8 - 17 Other exclusions from adjusted earnings** (*) * (1) (1) Tax impact * (*) * * Voluntary separation program 11 - 11 - Tax impact (3) - (3) - Adjusted net income – non-GAAP $ 153 $ 158 $ 499 $ 472 Average Common Shares Outstanding Diluted 290.1 289.4 290.0 289.3 Diluted Earnings Per Average Common Share Reported net income per share $ 0.50 $ 0.61 $ 1.71 $ 1.82 Reconciling items: Disposal of discontinued operations (gain) loss * 0.02 (0.01) 0.02 Tax impact (*) (0.01) * (0.01) Discontinued operations income - (0.10) - (0.25) Tax impact - 0.03 - 0.06 Other exclusions from adjusted earnings** (*) * (*) (*) Tax impact * (*) * * Voluntary separation program 0.04 - 0.04 - Tax impact (0.01) - (0.01) - Adjusted net income per share – non-GAAP $ 0.53 $ 0.55 $ 1.73 $ 1.64 * Less than $0.5 million or $0.01 per share. **Includes restructuring costs and unrealized gains or losses, recognized in net income, from mark-to-market adjustments related to CMS Enterprises' interest expense. Management views adjusted (non-Generally Accepted Accounting Principles) earnings as a key measure of the Company's present operating financial performance and uses adjusted earnings for external communications with analysts and investors. Internally, the Company uses adjusted earnings to measure and assess performance. Adjustments could include items such as discontinued operations, asset sales, impairments, restructuring costs, changes in accounting principles, changes in federal tax policy, regulatory items from prior years, unrealized gains or losses from mark-to-market adjustments, recognized in net income related to CMS Enterprises’ interest expense, or other items. The adjusted earnings should be considered supplemental information to assist in understanding our business results, rather than as a substitute for reported earnings. In Millions, Except Per Share Amounts Three Months Ended Six Months Ended 6/30/22 6/30/21 6/30/22 6/30/21

22 CMS ENERGY CORPORATION Reconciliation of GAAP Net Income to Non - GAAP Adjusted Net Income by Quarter (Unaudited ) Net Income Available to Common Stockholders $ 351 $ 145 Reconciling items: Electric utility and gas utility - 11 Tax impact - (3) Enterprises (1) (*) Tax impact * * Corporate interest and other - * Tax impact - (*) Disposal of discontinued operations (gain) loss (5) * Tax impact 1 (*) Adjusted Net Income – Non-GAAP $ 346 $ 153 Average Common Shares Outstanding – Diluted 289.9 290.1 Diluted Earnings Per Average Common Share $ 1.21 $ 0.50 Reconciling items: Electric utility and gas utility - 0.04 Tax impact - (0.01) Enterprises (*) (*) Tax impact * * Corporate interest and other - * Tax impact - (*) Disposal of discontinued operations (gain) loss (0.01) * Tax impact * (*) Adjusted Diluted Earnings Per Average Common Share – Non-GAAP $ 1.20 $ 0.53 Net Income Available to Common Stockholders $ 349 $ 176 $ 186 $ 637 Reconciling items: Electric utility and gas utility - - - 29 Tax impact - - - (7) Enterprises (1) * (*) * Tax impact * (*) * (*) Corporate interest and other - (*) - * Tax impact - * - (*) Disposal of discontinued operations (gain) loss - 5 3 (665) Tax impact - (1) (1) 145 Discontinued operations income (43) (30) (42) - Tax impact 9 8 10 - Adjusted Net Income – Non-GAAP $ 314 $ 158 $ 156 $ 139 Average Common Shares Outstanding – Diluted 289.1 289.4 289.6 289.7 Diluted Earnings Per Average Common Share $ 1.21 $ 0.61 $ 0.64 $ 2.20 Reconciling items: Electric utility and gas utility - - - 0.10 Tax impact - - - (0.03) Enterprises (*) * (*) * Tax impact * (*) * (*) Corporate interest and other - (*) - * Tax impact - * - (*) Disposal of discontinued operations (gain) loss - 0.02 0.01 (2.30) Tax impact - (0.01) (*) 0.50 Discontinued operations income (0.15) (0.10) (0.14) - Tax impact 0.03 0.03 0.03 - Adjusted Diluted Earnings Per Average Common Share – Non-GAAP $ 1.09 $ 0.55 $ 0.54 $ 0.47 * Less than $0.5 million or $0.01 per share. In Millions, Except Per Share Amounts 2022 1Q 2Q In Millions, Except Per Share Amounts 2021 1Q 2Q 3Q 4Q
Serious News for Serious Traders! Try StreetInsider.com Premium Free!
You May Also Be Interested In
- CMS Energy (CMS) Misses Q1 EPS by 1c ; Offers Guidance
- Åsa Vilsson new CFO at Elanders
- CMS Energy (CMS) PT Raised to $66 at KeyBanc
Create E-mail Alert Related Categories
SEC FilingsSign up for StreetInsider Free!
Receive full access to all new and archived articles, unlimited portfolio tracking, e-mail alerts, custom newswires and RSS feeds - and more!
