



Form 8-K AMAG PHARMACEUTICALS For: May 05
 Tweet
Tweet Share
Share E-mail
UNITED STATES
SECURITIES AND EXCHANGE COMMISSION
WASHINGTON, DC 20549
FORM 8-K
CURRENT REPORT PURSUANT
TO SECTION 13 OR 15(d) OF THE
SECURITIES EXCHANGE ACT OF 1934
Date of report (Date of earliest event reported): May 5, 2015
AMAG PHARMACEUTICALS, INC.
(Exact name of registrant as specified in its charter)
Delaware
(State or other jurisdiction of incorporation)
|
001-10865 |
|
04-2742593 |
|
(Commission File Number) |
|
(IRS Employer Identification No.) |
|
|
|
|
|
1100 Winter Street |
|
|
|
Waltham, Massachusetts |
|
02451 |
|
(Address of principal executive offices) |
|
(Zip Code) |
(617) 498-3300
(Registrant’s telephone number, including area code)
Check the appropriate box below if the Form 8-K filing is intended to simultaneously satisfy the filing obligation of the registrant under any of the following provisions:
o Written communications pursuant to Rule 425 under the Securities Act (17 CFR 230.425)
o Soliciting material pursuant to Rule 14a-12 under the Exchange Act (17 CFR 240.14a-12)
o Pre-commencement communications pursuant to Rule 14d-2(b) under the Exchange Act (17 CFR 240.14d-2(b))
o Pre-commencement communications pursuant to Rule 13e-4(c) under the Exchange Act (17 CFR 240.13e-4(c))
Item 2.02. Results of Operations and Financial Condition.
The following information and Exhibits 99.1 and 99.2 attached hereto shall not be deemed “filed” for purposes of Section 18 of the Securities Exchange Act of 1934, as amended, or otherwise subject to the liabilities of that section, nor shall it or they be deemed incorporated by reference in any filing under the Securities Act of 1933, as amended, except as expressly set forth by specific reference in such filing.
On May 5, 2015, AMAG Pharmaceuticals, Inc., (the “Company”) issued a press release regarding its operating results and revenues for the quarter ended March 31, 2015 and its intention to hold a conference call to discuss the Company’s financial results and growth prospects. A copy of the Company’s press release is furnished herewith as Exhibit 99.1 and a copy of the presentation slides to be used during the conference call are furnished herewith as Exhibit 99.2.
Item 9.01. Financial Statements and Exhibits.
(d) Exhibits.
The Company hereby furnishes the following exhibits:
|
Exhibit |
|
Description |
|
99.1 |
|
Press Release dated May 5, 2015. |
|
99.2 |
|
Copy of presentation slides of the Company during May 5, 2015 conference call. |
SIGNATURES
Pursuant to the requirements of the Securities Exchange Act of 1934, the Registrant has duly caused this report to be signed on its behalf by the undersigned thereunto duly authorized.
|
|
AMAG PHARMACEUTICALS, INC. | |
|
|
| |
|
|
| |
|
|
By: |
/s/ Scott B. Townsend |
|
|
Scott B. Townsend | |
|
|
General Counsel and Senior Vice President of Legal Affairs | |
|
|
| |
|
|
| |
|
|
Date: May 5, 2015 | |
EXHIBIT INDEX
|
Exhibit |
|
Description |
|
99.1 |
|
Press Release dated May 5, 2015 (furnished herewith). |
|
99.2 |
|
Copy of presentation slides of the Company during May 5, 2015 conference call (furnished herewith). |
Exhibit 99.1

FOR IMMEDIATE RELEASE
AMAG Pharmaceuticals Reports Record First Quarter 2015 Financial Results
and Increases Financial Guidance
· First Quarter 2015 net product sales of $77.4 million and adjusted EBITDA of $47.4 million
· Company increases top and bottom line 2015 financial guidance
Conference call scheduled for 8:00 a.m. ET today
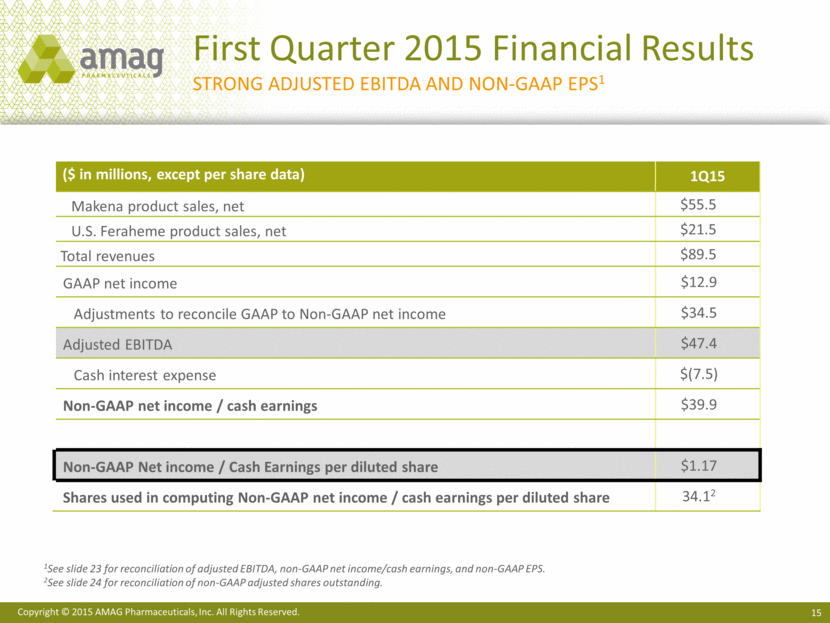
WALTHAM, MA (May 5, 2015) — AMAG Pharmaceuticals, Inc. (NASDAQ: AMAG), a specialty pharmaceutical company, today reported unaudited consolidated financial results for the first quarter of 2015. Total revenues for the first quarter of 2015 increased to $89.5 million, compared with $20.8 million in the first quarter of 2014. This increase was primarily due to the addition of the company’s newest product, Makena® (hydroxyprogesterone caproate injection), which contributed $55.5 million of product sales to the first quarter results.
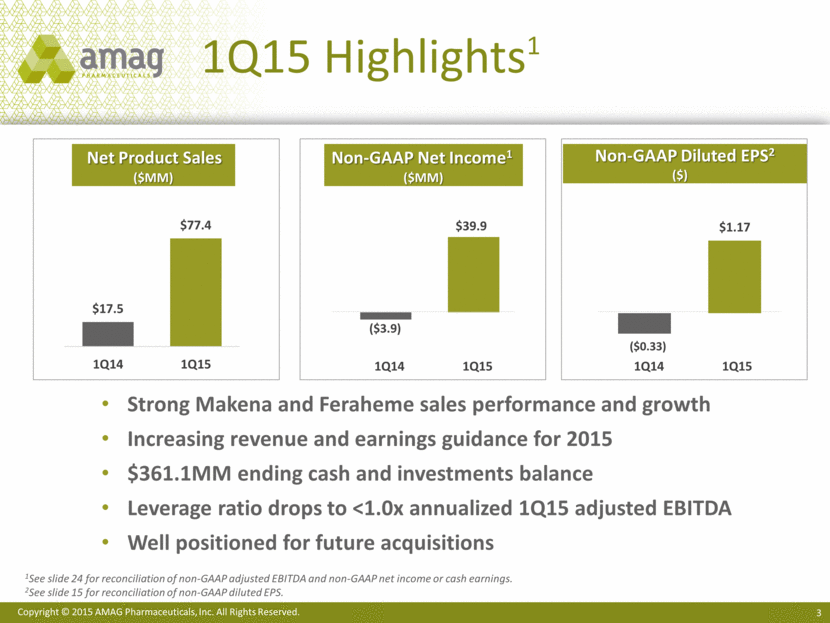
The company reported net income of $12.9 million, or $0.47 per basic share and $0.39 per diluted share, for the first quarter of 2015, compared with a net loss of $7.1 million, or $0.33 per basic share and diluted share, for the same period in 2014. Non-GAAP net income, or cash earnings(1), for the first quarter of 2015 totaled $39.9 million, or $1.17 per diluted share, compared with a non-GAAP net loss of $3.9 million, or $0.33 per diluted share, for the same period in 2014.
“I am pleased to report a very strong start to 2015 with this quarter’s financial results,” said William Heiden, chief executive officer of AMAG. “Solid commercial execution led to strong growth for each of our product offerings, with Makena contributing most significantly to our record first quarter revenues and earnings. Our performance in the first quarter of 2015 allows us to increase our full year top and bottom line guidance, and puts us in an outstanding financial position to continue to expand our portfolio through additional product or company acquisitions.”
1Q15 Business Highlights
· The company delivered record financial results in the first quarter of 2015, including non-GAAP adjusted EBITDA(1) of $47.4 million, up from a loss of $3.3 million in the first quarter of 2014.
(1) See summary of non-GAAP adjustments to reconcile net Income to non-GAAP adjusted EBITDA (earnings before interest, taxes, depreciation and amortization) and non-GAAP net income/cash earnings at conclusion of this press release.
|
May 5, 2015 |
AMAG Pharmaceuticals, Inc. |
|
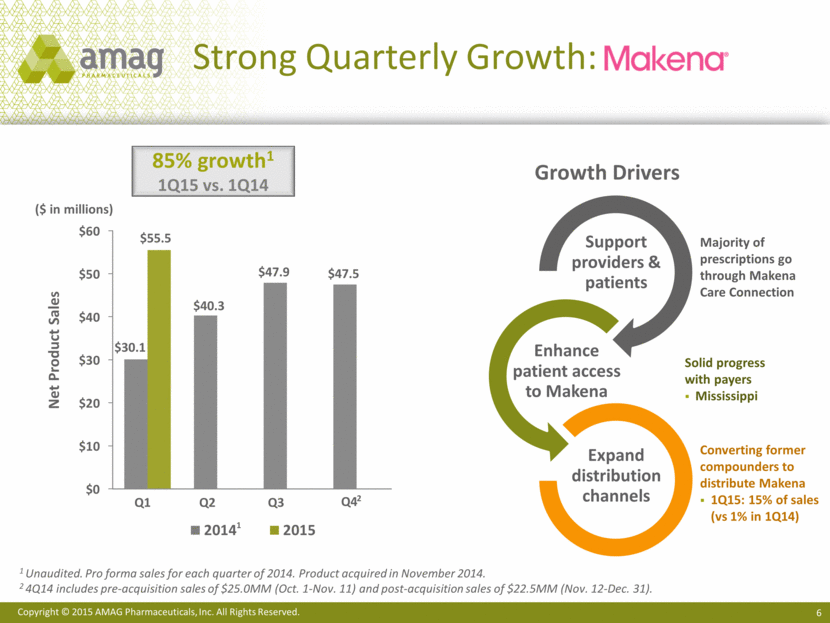
· Net product sales increased to $77.4 million in the first quarter of 2015, compared to $17.5 million in the corresponding period in 2014. This increase was driven by sales of Makena, which grew 85% over the first quarter of 2014.(2)
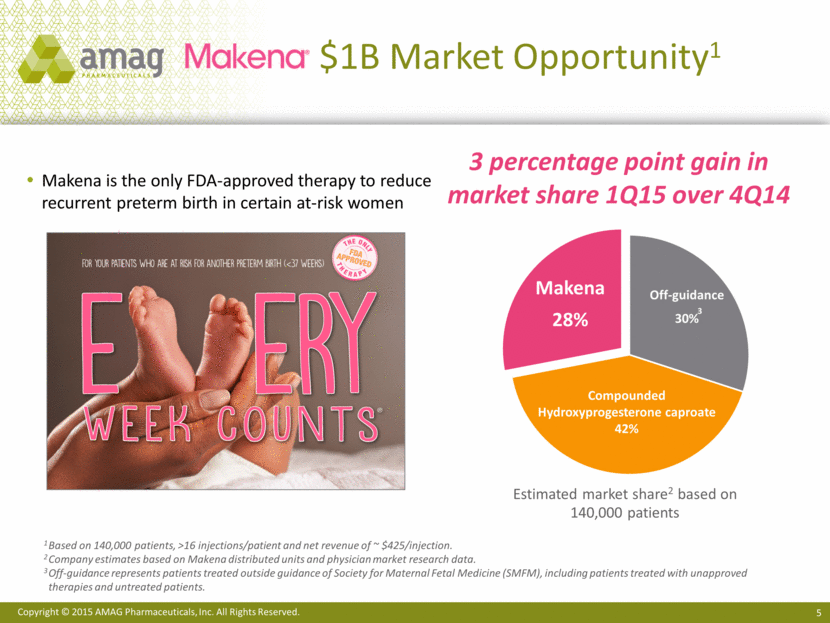
· Makena’s market share grew three percentage points over the fourth quarter of 2014 (from 25% to 28%), as the company continued to take share from compounded product.
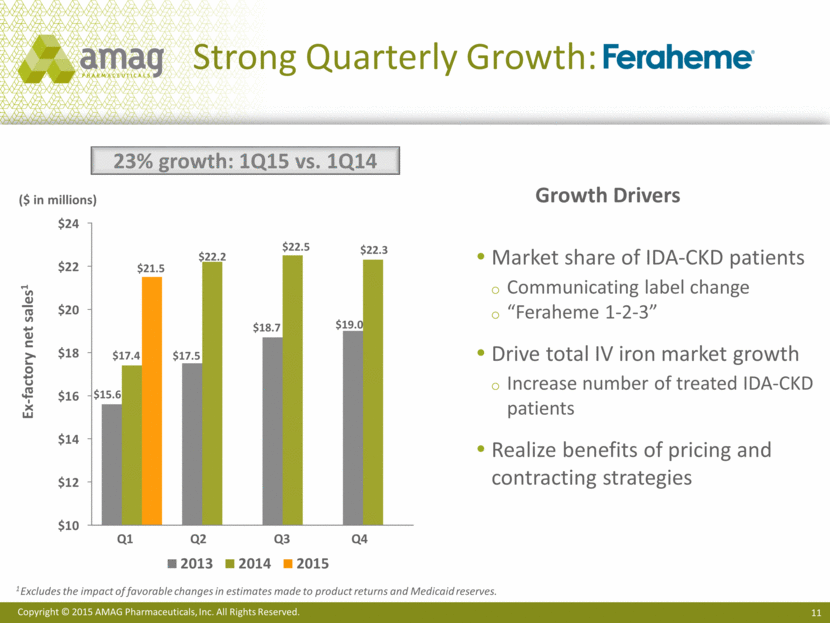
· Feraheme® (ferumoxytol) Injection revenues rose 23% over the first quarter of 2014, driven by increases in both volume and net revenue per gram. The company also finalized changes to the label with the U.S. Food and Drug Administration (FDA) at the end of the first quarter of 2015 and recently began communicating that new label to customers.
· The company completed a $200 million public offering of common stock, including the full exercise of underwriters’ option, which combined with the nearly $40 million of cash earnings generated in the first quarter of 2015, lowered its leverage ratio(3) to less than one times annualized first quarter adjusted EBITDA.
First Quarter 2015 Financial Results (unaudited)
Total revenues for the first quarter of 2015 were $89.5 million, compared with $20.8 million for the same period in 2014. This increase was primarily due to the addition of Makena, acquired in November 2014, as well as higher Feraheme and MuGard net product sales.
Net product sales for the first quarter of 2015 totaled $77.4 million, compared with $17.5 million in the first quarter of 2014. Sales of Makena in the first quarter of 2015 totaled $55.5 million, representing an increase of 85% from $30.1 million of Makena sales for the same period in 2014(2). This growth was driven by volume increases, as more clinically indicated pregnant women utilized Makena therapy to reduce their risk of preterm birth. Makena’s volume increased across all distribution channels, including compounding pharmacies that now dispense Makena instead of compounded hydroxyprogesterone caproate. This channel represents the fastest growing segment and accounted for approximately 15% of Makena’s first quarter sales, compared with 1% in the first quarter of 2014. Feraheme net product sales grew 23% to $21.5 million in the first quarter of 2015, compared with $17.4 million for the same period in 2014. The growth in Feraheme sales was driven by increased net revenue per gram of 15% and increased volume of 8%, versus the first quarter of 2014.
Total operating expenses, excluding cost of product sales, for the first quarter of 2015 were $39.7 million, compared with $24.0 million for the same period in 2014. The increases in operating expenses were primarily due to costs associated with managing the company’s expanded product portfolio. 2015 operating expense synergy savings related to the Lumara Health acquisition are tracking at or better than the previously communicated $20 million target.
The company reported net income of $12.9 million, or $0.47 per basic share and $0.39 per diluted share, for the first quarter of 2015, compared with net loss of $7.1 million, or $0.33 per basic and diluted share, for the same period in 2014. The weighted average diluted shares used in calculating diluted net income
(2) Based on unaudited pro forma sales for the first quarter of 2014. Product acquired in November 2014.
(3) Net debt divided by annualized first quarter adjusted EBITDA.
|
May 5, 2015 |
AMAG Pharmaceuticals, Inc. |
|
per share for the first quarter of 2015 followed the if-converted method of accounting for the convertible debt, as required by GAAP.
Non-GAAP adjusted EBITDA for the first quarter of 2015 was $47.4 million, compared with a loss of $3.3 million for the same period in 2014. After deducting cash interest expense, the Company generated non-GAAP net income, or cash earnings, of $39.9 million, or $1.17 per non-GAAP diluted share. The weighted average diluted shares used in calculating the non-GAAP cash earnings per diluted share for the first quarter of 2015 followed the treasury stock method of accounting for the convertible debt and related warrants.
AMAG ended the first quarter of 2015 with $361.1 million in cash and investments and $531.5 million in total debt (face value).
“We are off to a strong start in 2015 and believe we are well positioned, financially and operationally, to achieve the goals we’ve laid out for the year,” said Frank Thomas, president and chief operating officer of AMAG. “Our first quarter results are a clear demonstration of the earnings power of our business. The cash generated by Makena and Feraheme sales this quarter, combined with our recent $200 million equity offering, provide additional capital for us to invest in drivers of growth for our current business and compete aggressively for new products or companies to acquire.”
Increasing 2015 Financial Outlook
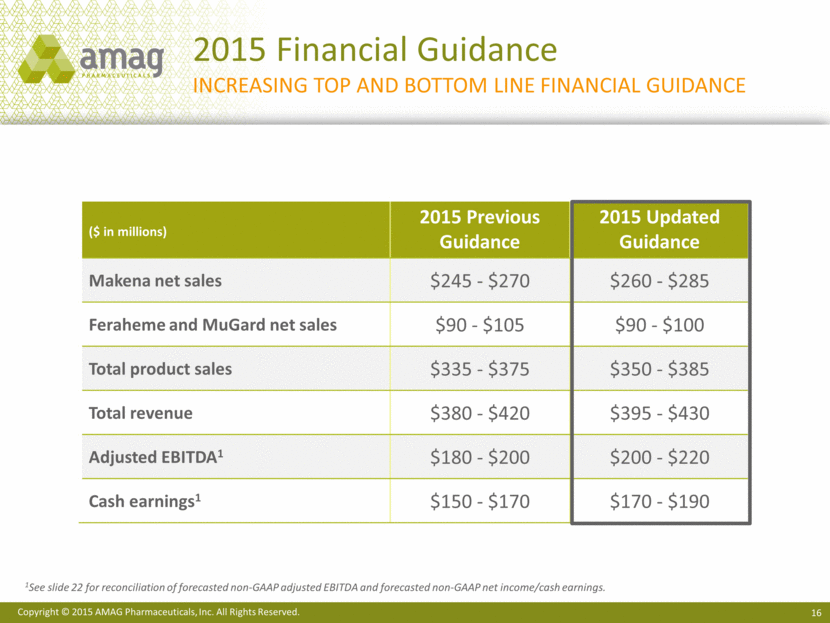
Based on the strong performance in the first quarter and projected sales and operating expenses for the remainder of 2015, the company is increasing its 2015 financial guidance:
|
$ in millions |
|
Previous 2015 Guidance |
|
Updated 2015 Guidance |
|
Makena net sales |
|
$245 - $270 |
|
$260 - $285 |
|
Feraheme and MuGard net sales |
|
$90 - $105 |
|
$90 - $100 |
|
Total product sales |
|
$335 - $375 |
|
$350 - $385 |
|
Total revenue |
|
$380 - $420 |
|
$395 - $430 |
|
Adjusted EBITDA(4) |
|
$180 - $200 |
|
$200 - $220 |
|
Cash earnings(4) |
|
$150 - $170 |
|
$170 - $190 |
Conference Call and Webcast Access
AMAG Pharmaceuticals, Inc. will host a conference call and webcast with slides today at 8:00 a.m. ET, during which management will discuss the company’s financial results and growth prospects. To access the conference call via telephone, please dial (877) 412-6083 from the United States or (702) 495-1202 for international access. A telephone replay will be available from approximately 11:00 a.m. ET on May 5, 2015 through midnight on May 12, 2015. To access a replay of the conference call, dial (855) 859-2056 from the United States or (404) 537-3406 for international access. The pass code for the live call and the replay is 33122806.
(4) See summary of forecasted Non-GAAP adjusted EBITDA and Non-GAAP net income / cash earnings at conclusion of this press release.
|
May 5, 2015 |
AMAG Pharmaceuticals, Inc. |
|
The call will be webcast with slides and accessible through the Investors section of the company’s website at www.amagpharma.com. The webcast replay will be available from approximately 11:00 a.m. ET on May 5, 2015 through midnight June 4, 2015.
Use of Non-GAAP Financial Measures
AMAG has presented certain non-GAAP financial measures, including non-GAAP adjusted EBITDA (earnings before income taxes, depreciation and amortization), non-GAAP net income or cash earnings and non-GAAP diluted earnings per share. These non-GAAP financial measures exclude certain amounts, expenses or income, from the corresponding financial measures determined in accordance with accounting principles generally accepted in the U.S. (GAAP). Management believes this non-GAAP information is useful for investors, taken in conjunction with AMAG’s GAAP financial statements, because it provides greater transparency regarding AMAG’s operating performance. Management uses these measures, among other factors, to assess and analyze operational results and trends and to make financial and operational decisions. Non-GAAP information is not prepared under a comprehensive set of accounting rules and should only be used to supplement an understanding of AMAG’s operating results as reported under GAAP, not as a substitute for GAAP. In addition, these non-GAAP financial measures are unlikely to be comparable with non-GAAP information provided by other companies. The determination of the amounts that are excluded from non-GAAP financial measures is a matter of management judgment and depends upon, among other factors, the nature of the underlying expense or income amounts. Reconciliations between these non-GAAP financial measures and the most comparable GAAP financial measures are included in the tables accompanying this press release after the unaudited condensed consolidated financial statements.
About AMAG
AMAG Pharmaceuticals, Inc. is a specialty pharmaceutical company with a focus on maternal health, anemia and cancer supportive care. The primary goal of AMAG is to bring to market therapies that provide clear benefits and improve patients’ lives. In addition to continuing to pursue opportunities to make new advancements in patients’ health and to enhance treatment accessibility, AMAG intends to continue to expand and diversify its portfolio through the in-license or purchase of additional pharmaceutical products or companies. For additional company information, please visit www.amagpharma.com.
About Makena® (hydroxyprogesterone caproate injection)
Makena® is a progestin indicated to reduce the risk of preterm birth in women with a singleton pregnancy who have a history of singleton spontaneous preterm birth.
The effectiveness of Makena is based on improvement in the proportion of women who delivered <37 weeks of gestation. There are no controlled trials demonstrating a direct clinical benefit, such as improvement in neonatal mortality and morbidity.
Limitation of use: While there are many risk factors for preterm birth, safety and efficacy of Makena has been demonstrated only in women with a prior spontaneous singleton preterm birth. It is not intended for use in women with multiple gestations or other risk factors for preterm birth.
|
May 5, 2015 |
|
AMAG Pharmaceuticals, Inc. |
|
|
Makena should not be used in women with any of the following conditions: blood clots or other blood clotting problems, breast cancer or other hormone-sensitive cancers, or history of these conditions; unusual vaginal bleeding not related to the current pregnancy, yellowing of the skin due to liver problems during pregnancy, liver problems, including liver tumors, or uncontrolled high blood pressure. Before patients receive Makena, they should tell their healthcare provider if they have an allergy to hydroxyprogesterone caproate, castor oil, or any of the other ingredients in Makena; diabetes or prediabetes, epilepsy, migraine headaches, asthma, heart problems, kidney problems, depression, or high blood pressure.
In one clinical study, certain complications or events associated with pregnancy occurred more often in women who received Makena. These included miscarriage (pregnancy loss before 20 weeks of pregnancy), stillbirth (fetal death occurring during or after the 20th week of pregnancy), hospital admission for preterm labor, preeclampsia (high blood pressure and too much protein in the urine), gestational hypertension (high blood pressure caused by pregnancy), gestational diabetes, and oligohydramnios (low amniotic fluid levels).
Makena may cause serious side effects including blood clots, allergic reactions, depression, and yellowing of the skin and the whites of the eyes. The most common side effects of Makena include injection site reactions (pain, swelling, itching, bruising, or a hard bump), hives, itching, nausea, and diarrhea. For additional U.S. product information, including full prescribing information, please visit www.makena.com.
About Feraheme® (ferumoxytol) Injection
Feraheme received marketing approval from the FDA on June 30, 2009 for the treatment of iron deficiency anemia (IDA) in adult chronic kidney disease (CKD) patients and was commercially launched by AMAG in the U.S. shortly thereafter. Ferumoxytol is protected in the U.S. by six issued patents covering the composition and dosage form of the product. Each issued patent is listed in the FDA’s Orange Book, the last of which expires in June 2023.
Ferumoxytol received marketing approval in Canada in December 2012, where it has been marketed by Takeda as Feraheme. Takeda had been commercializing the product outside of the U.S. under a license arrangement with AMAG. In December 2014, AMAG and Takeda mutually agreed to terminate the license arrangement and are in the process of transferring the licensed rights back to AMAG.
Fatal and serious hypersensitivity reactions including anaphylaxis have occurred in patients receiving Feraheme. Initial symptoms may include hypotension, syncope, unresponsiveness, cardiac/cardiorespiratory arrest. Feraheme is contraindicated in patients with a known hypersensitivity to Feraheme or any of its components, or a history of allergic reaction to any intravenous iron product.
For additional U.S. product information, please see full Prescribing Information, including Boxed Warning, available at www.feraheme.com.
|
May 5, 2015 |
|
AMAG Pharmaceuticals, Inc. |
|
|
Forward-Looking Statements
This press release contains forward-looking statements within the meaning of the Private Securities Litigation Reform Act of 1995 (PSLRA) and other federal securities laws. Any statements contained herein which do not describe historical facts, including, among others, statements regarding AMAG’s expectations as to its financial and operational ability to achieve its 2015 goals; AMAG’s financing capacity to invest in drivers of growth for its current business and compete for the potential acquisition of new products or companies; beliefs about AMAG’s earning power; expectations regarding potential synergy savings related to the Lumara Health acquisition; and AMAG’s updated 2015 financial guidance, including net product sales, adjusted EBITDA and cash earnings, are forward-looking statements which involve risks and uncertainties that could cause actual results to differ materially from those discussed in such forward-looking statements.
Such risks and uncertainties include, among others, those risks identified in AMAG’s filings with the U.S. Securities and Exchange Commission (SEC), including its Annual Report on Form 10-K for the year ended December 31, 2014 and subsequent filings with the SEC. Any such risks and uncertainties could materially and adversely affect AMAG’s results of operations, its profitability and its cash flows, which would, in turn, have a significant and adverse impact on AMAG’s stock price. Use of the term “including” in the two paragraphs above shall mean in each case “including, but not limited to.” AMAG cautions you not to place undue reliance on any forward-looking statements, which speak only as of the date they are made.
AMAG disclaims any obligation to publicly update or revise any such statements to reflect any change in expectations or in events, conditions or circumstances on which any such statements may be based, or that may affect the likelihood that actual results will differ from those set forth in the forward-looking statements.
AMAG Pharmaceuticals® and Feraheme® are registered trademarks of AMAG Pharmaceuticals, Inc. Lumara Health™ is a trademark of Lumara Health Inc. Makena® is a registered trademark of Lumara Health Inc. MuGard® is a registered trademark of PlasmaTech Biopharmaceuticals, Inc.
— Tables Follow —
|
May 5, 2015 |
|
AMAG Pharmaceuticals, Inc. |
|
|
AMAG Pharmaceuticals, Inc.
Condensed Consolidated Statements of Operations
(unaudited, amounts in thousands, except per share data)
|
|
|
Three Months Ended March 31, |
| ||||
|
|
|
2015 |
|
2014 |
| ||
|
Revenues: |
|
|
|
|
| ||
|
Makena product sales, net |
|
$ |
55,529 |
|
$ |
— |
|
|
Feraheme product sales, net |
|
21,458 |
|
$ |
17,375 |
| |
|
MuGard product sales, net |
|
428 |
|
148 |
| ||
|
License fee, collaboration and other revenues |
|
12,090 |
|
3,312 |
| ||
|
Total revenues |
|
89,505 |
|
20,835 |
| ||
|
|
|
|
|
|
| ||
|
Operating costs and expenses: |
|
|
|
|
| ||
|
Cost of product sales |
|
21,026 |
|
2,837 |
| ||
|
Research and development expenses |
|
6,988 |
|
6,498 |
| ||
|
Selling, general and administrative expenses |
|
32,112 |
|
17,491 |
| ||
|
Restructuring expenses |
|
571 |
|
— |
| ||
|
Total operating costs and expenses |
|
60,697 |
|
26,826 |
| ||
|
|
|
|
|
|
| ||
|
Operating income (loss) |
|
28,808 |
|
(5,991 |
) | ||
|
|
|
|
|
|
| ||
|
Interest expense |
|
(10,367 |
) |
(1,476 |
) | ||
|
Interest and dividend income, net |
|
71 |
|
265 |
| ||
|
Other income |
|
— |
|
100 |
| ||
|
Total other income (expense) |
|
(10,296 |
) |
(1,111 |
) | ||
|
|
|
|
|
|
| ||
|
Net income (loss) before income taxes |
|
18,512 |
|
(7,102 |
) | ||
|
Income tax expense |
|
5,608 |
|
— |
| ||
|
Net income (loss) |
|
$ |
12,904 |
|
$ |
(7,102 |
) |
|
Net income (loss) per share: |
|
|
|
|
| ||
|
Basic |
|
$ |
0.47 |
|
$ |
(0.33 |
) |
|
Diluted |
|
$ |
0.39 |
|
$ |
(0.33 |
) |
|
Weighted average shares outstanding used to compute net income (loss) per share: |
|
|
|
|
| ||
|
Basic |
|
27,213 |
|
21,824 |
| ||
|
Diluted |
|
38,245 |
|
21,824 |
| ||
|
May 5, 2015 |
AMAG Pharmaceuticals, Inc. |
|
AMAG Pharmaceuticals, Inc.
Condensed Consolidated Balance Sheets
(unaudited, amounts in thousands)
|
|
|
March 31, 2015 |
|
December 31, 2014 |
| ||
|
Cash and cash equivalents |
|
$ |
243,801 |
|
$ |
119,296 |
|
|
Short-term investments |
|
117,338 |
|
24,890 |
| ||
|
Accounts receivable, net |
|
56,176 |
|
38,172 |
| ||
|
Inventories |
|
35,939 |
|
40,610 |
| ||
|
Receivable from collaboration |
|
— |
|
4,518 |
| ||
|
Deferred tax assets |
|
54,896 |
|
32,094 |
| ||
|
Other current assets |
|
11,381 |
|
14,456 |
| ||
|
Total current assets |
|
519,531 |
|
274,036 |
| ||
|
|
|
|
|
|
| ||
|
Property and equipment, net |
|
1,439 |
|
1,519 |
| ||
|
Goodwill |
|
205,824 |
|
205,824 |
| ||
|
Intangible assets, net |
|
876,426 |
|
887,908 |
| ||
|
Other assets |
|
17,222 |
|
19,646 |
| ||
|
Total assets |
|
$ |
1,620,442 |
|
$ |
1,388,933 |
|
|
|
|
|
|
|
| ||
|
Accounts payable |
|
$ |
5,958 |
|
$ |
7,301 |
|
|
Accrued expenses |
|
88,811 |
|
80,811 |
| ||
|
Current portion of long-term debt |
|
38,250 |
|
34,000 |
| ||
|
Deferred revenues |
|
33,563 |
|
44,376 |
| ||
|
Total current liabilities |
|
166,582 |
|
166,488 |
| ||
|
|
|
|
|
|
| ||
|
Long-term debt, net |
|
281,904 |
|
293,905 |
| ||
|
Convertible 2.5% senior notes, net |
|
169,090 |
|
167,441 |
| ||
|
Acquisition-related contingent consideration |
|
220,537 |
|
217,984 |
| ||
|
Deferred tax liabilities |
|
106,030 |
|
77,619 |
| ||
|
Other long-term liabilities |
|
5,123 |
|
5,543 |
| ||
|
Total long-term liabilities |
|
782,684 |
|
762,492 |
| ||
|
|
|
|
|
|
| ||
|
Total stockholders’ equity |
|
671,176 |
|
459,953 |
| ||
|
Total liabilities and stockholders’ equity |
|
$ |
1,620,442 |
|
$ |
1,388,933 |
|
|
May 5, 2015 |
AMAG Pharmaceuticals, Inc. |
|
AMAG Pharmaceuticals, Inc.
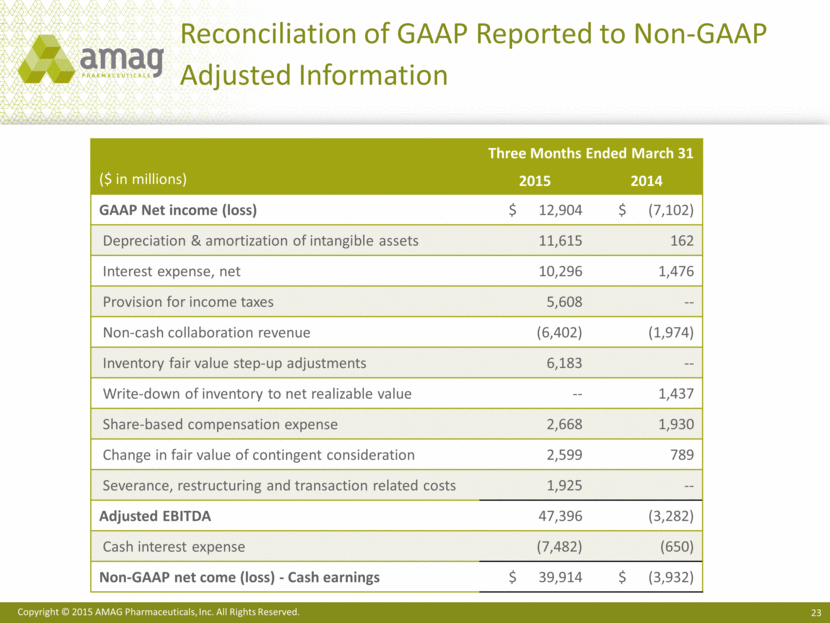
Reconciliation of GAAP Reported to Non-GAAP Adjusted Information
(unaudited, amounts in thousands, except per share data)
|
|
|
Three Months Ended March 31, |
| ||||
|
|
|
2015 |
|
2014 |
| ||
|
GAAP net income (loss) |
|
$ |
12,904 |
|
$ |
(7,102 |
) |
|
Depreciation & intangible asset amortization |
|
11,615 |
|
162 |
| ||
|
Interest expense, net |
|
10,296 |
|
1,476 |
| ||
|
Provision for income taxes |
|
5,608 |
|
— |
| ||
|
Non-cash collaboration revenue |
|
(6,402 |
) |
(1,974 |
) | ||
|
Inventory fair value step-up adjustments |
|
6,183 |
|
— |
| ||
|
Write-down inventory to net realizable value |
|
— |
|
1,437 |
| ||
|
Share-based compensation expense |
|
2,668 |
|
1,930 |
| ||
|
Change in fair value contingent consideration |
|
2,599 |
|
789 |
| ||
|
Severance, restructuring and transaction-related expenses |
|
1,925 |
|
— |
| ||
|
Adjusted EBITDA |
|
47,396 |
|
(3,282 |
) | ||
|
Cash interest expense |
|
(7,482 |
) |
(650 |
) | ||
|
Non-GAAP net income (loss) — cash earnings |
|
$ |
39,914 |
|
$ |
(3,932 |
) |
|
|
|
|
|
|
| ||
|
GAAP Net income (loss) per share |
|
|
|
|
| ||
|
Basic |
|
$ |
0.47 |
|
$ |
(0.33 |
) |
|
Diluted |
|
$ |
0.39 |
|
$ |
(0.33 |
) |
|
|
|
|
|
|
| ||
|
Weighted average shares outstanding used to compute net income (loss) per share |
|
|
|
|
| ||
|
Basic |
|
27,213 |
|
21,824 |
| ||
|
Diluted |
|
38,245 |
|
21,824 |
| ||
|
|
|
|
|
|
| ||
|
Non-GAAP Net income (loss) per share |
|
|
|
|
| ||
|
Basic |
|
$ |
1.47 |
|
$ |
(0.33 |
) |
|
Diluted |
|
$ |
1.17 |
|
$ |
(0.33 |
) |
|
|
|
|
|
|
| ||
|
Non-GAAP weighted average shares outstanding used to compute non-GAAP net income (loss) per share |
|
|
|
|
| ||
|
Basic |
|
27,213 |
|
21,824 |
| ||
|
Diluted |
|
34,058 |
|
21,824 |
| ||
|
May 5, 2015 |
AMAG Pharmaceuticals, Inc. |
|
AMAG Pharmaceuticals, Inc.
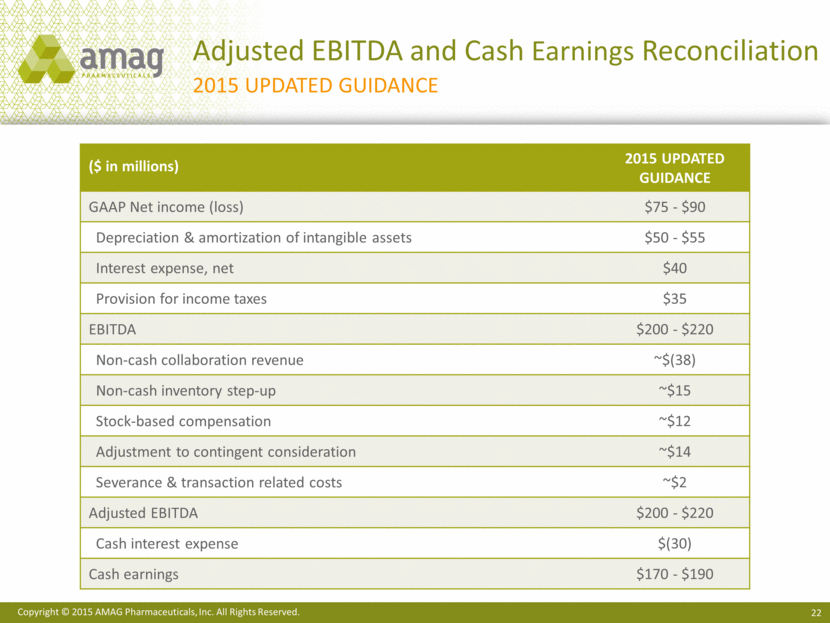
Reconciliation of 2015 Updated Guidance of Non-GAAP Adjusted EBITDA
and Non-GAAP Net Income / Cash Earnings
(unaudited, amounts in thousands)
|
|
|
2015 Updated |
| |
|
GAAP net income (loss) |
|
$ |
75 - 90 |
|
|
Depreciation & intangible asset amortization |
|
50 - 55 |
| |
|
Interest expense, net |
|
40 |
| |
|
Provision (benefit) for income taxes |
|
35 |
| |
|
EBITDA |
|
$ |
200 -220 |
|
|
Non-cash collaboration revenue |
|
~(38 |
) | |
|
Non-cash inventory step-up adjustments |
|
~15 |
| |
|
Stock-based compensation |
|
~12 |
| |
|
Adjustment to contingent consideration |
|
~14 |
| |
|
Severance and transaction-related costs |
|
~2 |
| |
|
Adjusted EBITDA |
|
$ |
200 - 220 |
|
|
Cash interest expense |
|
(30 |
) | |
|
Non-GAAP net income (loss) — cash earnings |
|
$ |
170 - 190 |
|
CONTACT:
AMAG Pharmaceuticals, Inc.
Linda Lennox, 617-498-2846
Vice President, Investor Relations & Corporate Communications
###
|
May 5, 2015 |
AMAG Pharmaceuticals, Inc. |
|
Exhibit 99.2
|
|
AMAG Pharmaceuticals 1Q 2015 Financial Results May 5, 2015 |
|
|
This presentation contains forward-looking statements within the meaning of the Private Securities Litigation Reform Act of 1995 (PSLRA) and other federal securities laws. Any statements contained herein which do not describe historical facts, including among others, statements regarding AMAG’s updated 2015 financial guidance, including net product sales, adjusted EBITDA and cash earnings; the market opportunity for Makena, including opportunities to increase market share; Makena’s growth strategies and drivers for 2015; potential regulatory approval and launch of the single-dose, preservative-free Makena formulation and expectations for other lifecycle management initiatives; Feraheme growth opportunities, including in the chronic kidney disease (CKD) market and if approval of the broader iron deficiency anemia (IDA) label is pursued and received; AMAG’s future expansion opportunities, business development targeting strategy, ability to fund future acquisitions and positioning; expectations regarding significant cash generation in connection with planned deleveraging and portfolio expansion opportunities; AMAG’s 2015 goals, including product growth across the portfolio, increase in adjusted EBITDA margin, execution on Makena’s line extension/lifecycle management program, the path forward (if any) for the broad IDA indication in the U.S. and plans to further expand AMAG’s product portfolio are forward-looking statements which involve risks and uncertainties that could cause actual results to differ materially from those discussed in such forward-looking statements. Such risks and uncertainties include, among others, those risks identified in Forward-Looking Statements AMAG’s filings with the U.S. Securities and Exchange Commission (SEC), including its Annual Report on Form 10-K for the year ended December 31, 2014 and subsequent filings with the SEC. Any of the above risks and uncertainties could materially and adversely affect AMAG’s results of operations, its profitability and its cash flows, which would, in turn, have a significant and adverse impact on AMAG’s stock price. Use of the term “including” in the two paragraphs above shall mean in each case “including, but not limited to.” AMAG cautions you not to place undue reliance on any forward-looking statements, which speak only as of the date they are made. AMAG disclaims any obligation to publicly update or revise any such statements to reflect any change in expectations or in events, conditions or circumstances on which any such statements may be based, or that may affect the likelihood that actual results will differ from those set forth in the forward-looking statements. AMAG Pharmaceuticals® and Feraheme® are registered trademarks of AMAG Pharmaceuticals, Inc. Lumara Health™ is a trademark of Lumara Health Inc. Makena® is a registered trademark of Lumara Health Inc. MuGard® is a registered trademark of PlasmaTech Biopharmaceuticals, Inc. |
|
|
1Q15 Earnings Call Speakers: Bill Heiden, Chief Executive Officer Frank Thomas, President & Chief Operating Officer Scott Holmes, Senior Vice President, Finance & Investor Relations Linda Lennox, Vice President, Investor Relations & Corporate Communications Agenda Company Highlights 1Q15 Product Performance Makena Feraheme 1Q15 Results and Financial Update Portfolio Expansion Update 2015 Goals |
|
|
1Q15 Highlights1 Net Product Sales ($MM) Non-GAAP Net Income1 ($MM) Non-GAAP Diluted EPS2 ($) 1Q14 1Q15 Strong Makena and Feraheme sales performance and growth Increasing revenue and earnings guidance for 2015 $361.1MM ending cash and investments balance Leverage ratio drops to <1.0x annualized 1Q15 adjusted EBITDA Well positioned for future acquisitions 1Q14 1Q15 1See slide 24 for reconciliation of non-GAAP adjusted EBITDA and non-GAAP net income or cash earnings. 2See slide 15 for reconciliation of non-GAAP diluted EPS. $39.9 ($3.9) ($0.33) $1.17 |
|
|
Maternal Health |

|
|
$1B Market Opportunity1 Estimated market share2 based on 140,000 patients 1 Based on 140,000 patients, >16 injections/patient and net revenue of ~ $425/injection. 2 Company estimates based on Makena distributed units and physician market research data. 3 Off-guidance represents patients treated outside guidance of Society for Maternal Fetal Medicine (SMFM), including patients treated with unapproved therapies and untreated patients. Makena is the only FDA-approved therapy to reduce recurrent preterm birth in certain at-risk women 3 percentage point gain in market share 1Q15 over 4Q14 Makena 28% Compounded Hydroxyprogesterone caproate 42% Off-guidance 30% 3 |
|
|
Strong Quarterly Growth: ($ in millions) 1 Unaudited. Pro forma sales for each quarter of 2014. Product acquired in November 2014. 2 4Q14 includes pre-acquisition sales of $25.0MM (Oct. 1-Nov. 11) and post-acquisition sales of $22.5MM (Nov. 12-Dec. 31). Net Product Sales 85% growth1 1Q15 vs. 1Q14 Majority of prescriptions go through Makena Care Connection Solid progress with payers Mississippi Converting former compounders to distribute Makena 1Q15: 15% of sales (vs 1% in 1Q14) Growth Drivers $0 $10 $20 $30 $40 $50 $60 $30.1 $40.3 $47.9 $47.5 $55.5 2014 2015 1 Q1 Q3 Q2 Q4 2 Support providers & patients Enhance patient access to Makena Expand distribution channels |
|
|
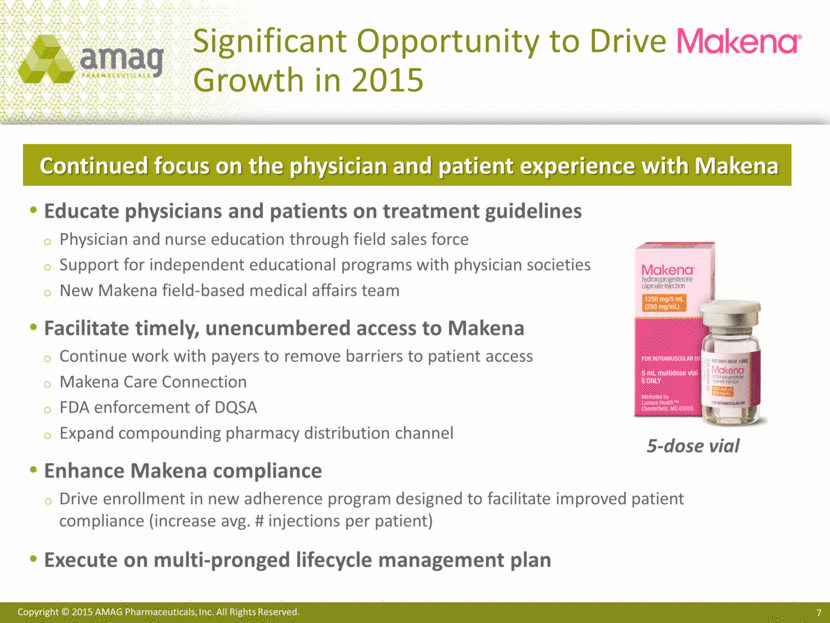
Significant Opportunity to Drive Growth in 2015 Educate physicians and patients on treatment guidelines Physician and nurse education through field sales force Support for independent educational programs with physician societies New Makena field-based medical affairs team Facilitate timely, unencumbered access to Makena Continue work with payers to remove barriers to patient access Makena Care Connection FDA enforcement of DQSA Expand compounding pharmacy distribution channel Enhance Makena compliance Drive enrollment in new adherence program designed to facilitate improved patient compliance (increase avg. # injections per patient) Execute on multi-pronged lifecycle management plan Continued focus on the physician and patient experience with Makena 5-dose vial |
|
|
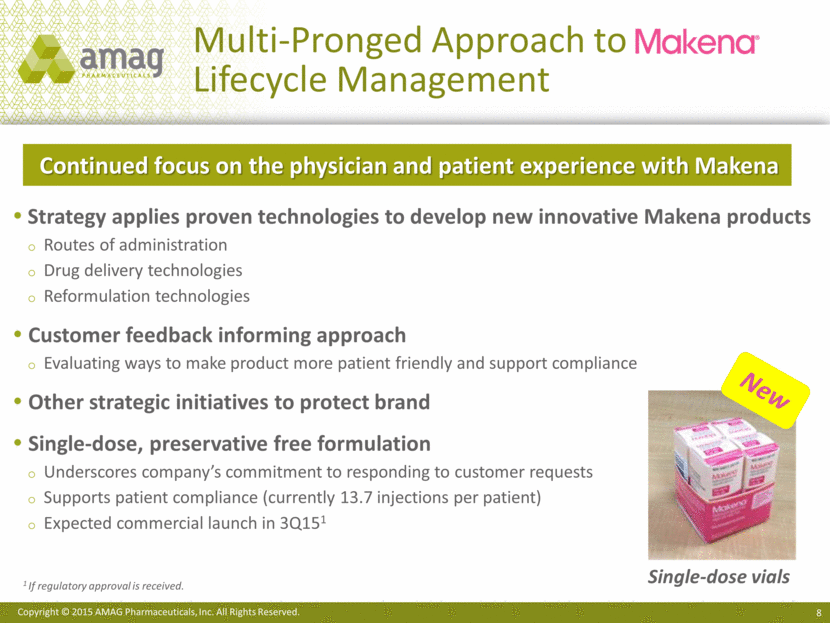
Multi-Pronged Approach to Lifecycle Management Strategy applies proven technologies to develop new innovative Makena products Routes of administration Drug delivery technologies Reformulation technologies Customer feedback informing approach Evaluating ways to make product more patient friendly and support compliance Other strategic initiatives to protect brand Single-dose, preservative free formulation Underscores company’s commitment to responding to customer requests Supports patient compliance (currently 13.7 injections per patient) Expected commercial launch in 3Q151 Single-dose vials 1 If regulatory approval is received. New Continued focus on the physician and patient experience with Makena |
|
|
Hematology / Oncology and Hospital |

|
|
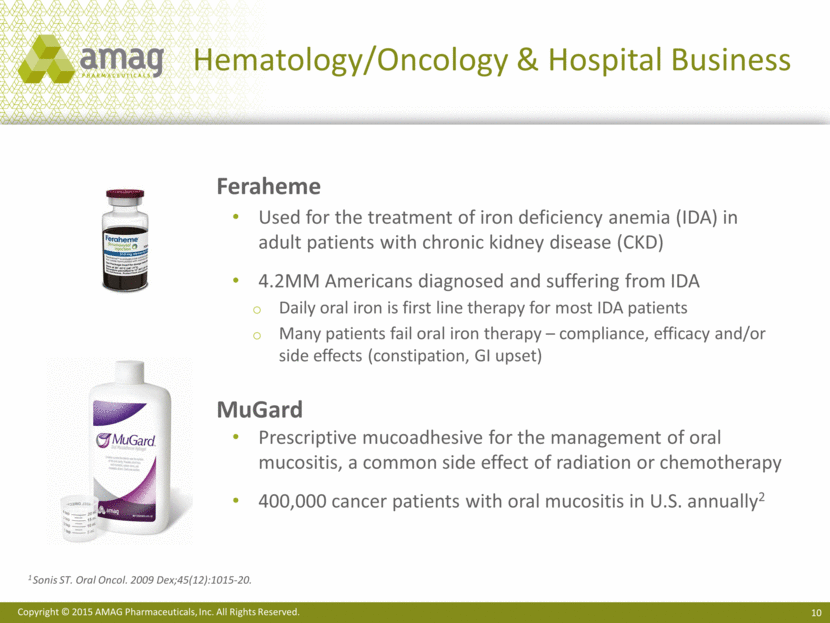
Hematology/Oncology & Hospital Business Feraheme Used for the treatment of iron deficiency anemia (IDA) in adult patients with chronic kidney disease (CKD) 4.2MM Americans diagnosed and suffering from IDA Daily oral iron is first line therapy for most IDA patients Many patients fail oral iron therapy – compliance, efficacy and/or side effects (constipation, GI upset) MuGard Prescriptive mucoadhesive for the management of oral mucositis, a common side effect of radiation or chemotherapy 400,000 cancer patients with oral mucositis in U.S. annually2 1 Sonis ST. Oral Oncol. 2009 Dex;45(12):1015-20. |
|
|
Strong Quarterly Growth: ($ in millions) Ex-factory net sales1 23% growth: 1Q15 vs. 1Q14 Market share of IDA-CKD patients Communicating label change “Feraheme 1-2-3” Drive total IV iron market growth Increase number of treated IDA-CKD patients Realize benefits of pricing and contracting strategies 1 Excludes the impact of favorable changes in estimates made to product returns and Medicaid reserves. Growth Drivers $10 $12 $14 $16 $18 $20 $22 $24 $15.6 $17.5 $18.7 $19.0 $17.4 $22.2 $22.5 $22.3 $21.5 2013 2014 2015 Q1 Q3 Q2 Q4 |
|
|
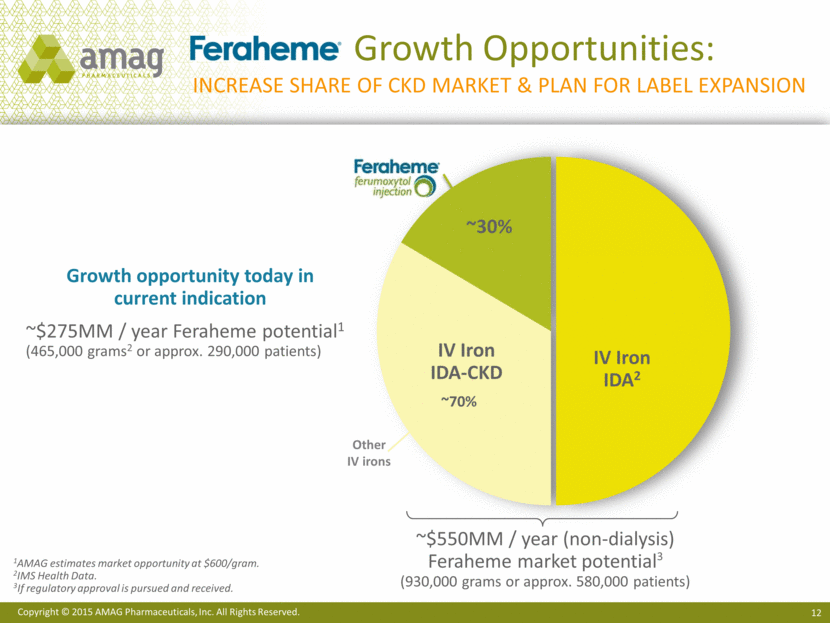
Growth Opportunities: Increase share of ckd market & plan for label expansion ~30% 1AMAG estimates market opportunity at $600/gram. 2IMS Health Data. 3 If regulatory approval is pursued and received. ~$550MM / year (non-dialysis) Feraheme market potential3 (930,000 grams or approx. 580,000 patients) IV Iron IDA2 ~70% IV Iron IDA-CKD Growth opportunity today in current indication ~$275MM / year Feraheme potential1 (465,000 grams2 or approx. 290,000 patients) Other IV irons |
|
|
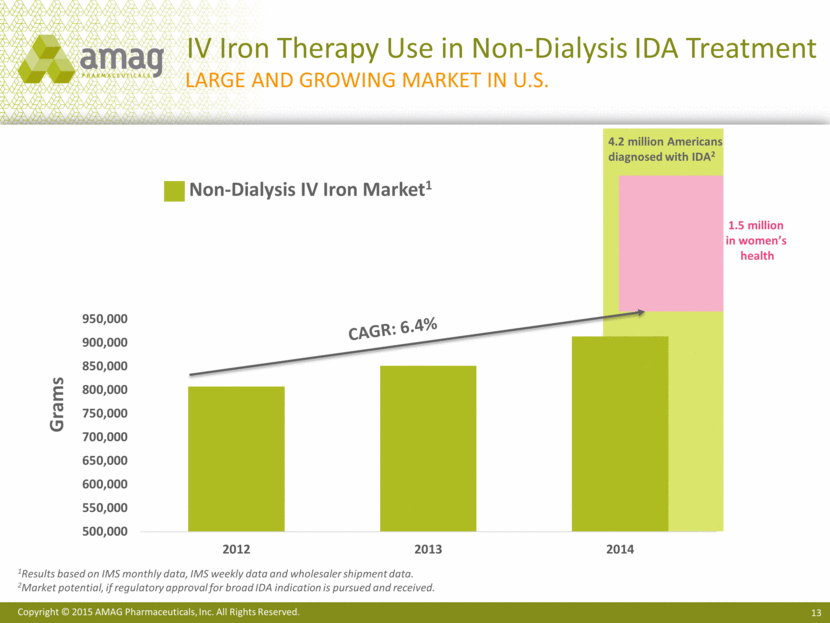
IV Iron Therapy Use in Non-Dialysis IDA Treatment 13 Large and growing market in U.S. CAGR: 6.4% 1Results based on IMS monthly data, IMS weekly data and wholesaler shipment data. 2Market potential, if regulatory approval for broad IDA indication is pursued and received. 4.2 million Americans diagnosed with IDA2 1.5 million in women’s health Non-Dialysis IV Iron Market1 Grams |
|
|
Financial Update |

|
|
First Quarter 2015 Financial Results Strong Adjusted EBITDA and non-gaap eps1 ($ in millions, except per share data) 1Q15 Makena product sales, net $55.5 U.S. Feraheme product sales, net $21.5 Total revenues $89.5 GAAP net income $12.9 Adjustments to reconcile GAAP to Non-GAAP net income $34.5 Adjusted EBITDA $47.4 Cash interest expense $(7.5) Non-GAAP net income / cash earnings $39.9 Non-GAAP Net income / Cash Earnings per diluted share $1.17 Shares used in computing Non-GAAP net income / cash earnings per diluted share 34.12 1See slide 23 for reconciliation of adjusted EBITDA, non-GAAP net income/cash earnings, and non-GAAP EPS. 2See slide 24 for reconciliation of non-GAAP adjusted shares outstanding. |
|
|
2015 Financial Guidance Increasing Top and Bottom line financial guidance 1See slide 22 for reconciliation of forecasted non-GAAP adjusted EBITDA and forecasted non-GAAP net income/cash earnings. ($ in millions) 2015 Previous Guidance 2015 Updated Guidance Makena net sales $245 - $270 $260 - $285 Feraheme and MuGard net sales $90 - $105 $90 - $100 Total product sales $335 - $375 $350 - $385 Total revenue $380 - $420 $395 - $430 Adjusted EBITDA1 $180 - $200 $200 - $220 Cash earnings1 $150 - $170 $170 - $190 |
|
|
Future Expansion Opportunities |

|
|
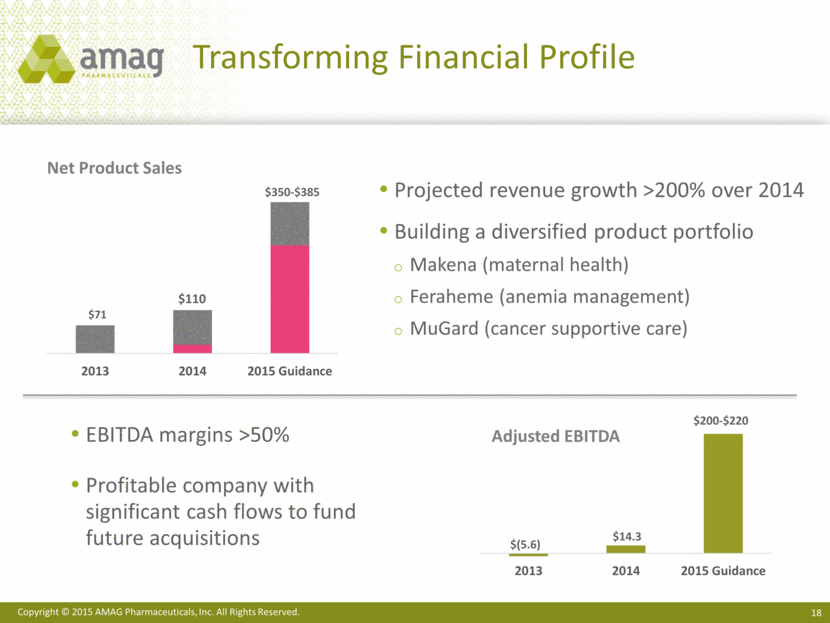
Projected revenue growth >200% over 2014 Building a diversified product portfolio Makena (maternal health) Feraheme (anemia management) MuGard (cancer supportive care) Transforming Financial Profile Net Product Sales Adjusted EBITDA EBITDA margins >50% Profitable company with significant cash flows to fund future acquisitions $350-$385 $200-$220 $14.3 2013 2014 2015 Guidance $(5.6) |
|
|
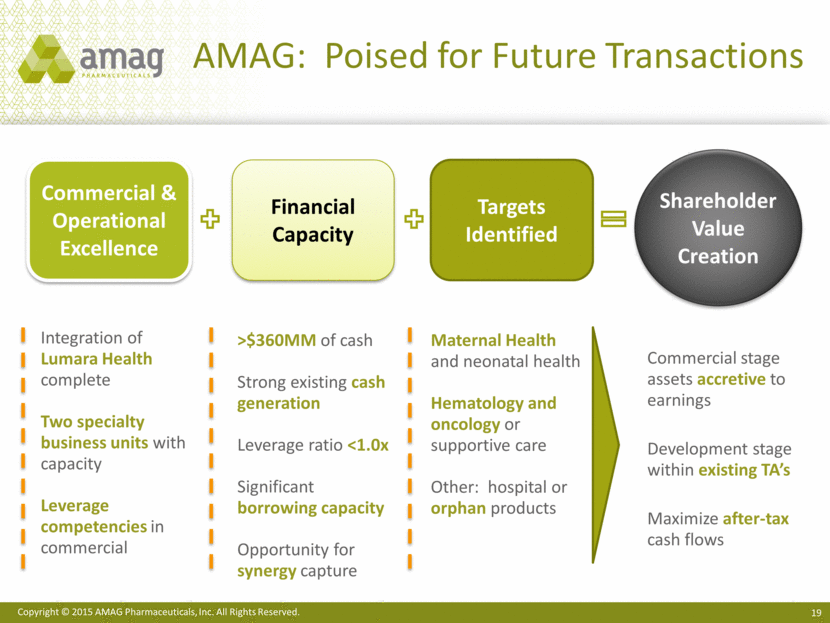
AMAG: Poised for Future Transactions Commercial & Operational Excellence Financial Capacity Targets Identified Shareholder Value Creation Integration of Lumara Health complete Two specialty business units with capacity Leverage competencies in commercial >$360MM of cash Strong existing cash generation Leverage ratio <1.0x Significant borrowing capacity Opportunity for synergy capture Maternal Health and neonatal health Hematology and oncology or supportive care Other: hospital or orphan products Commercial stage assets accretive to earnings Development stage within existing TA’s Maximize after-tax cash flows |
|
|
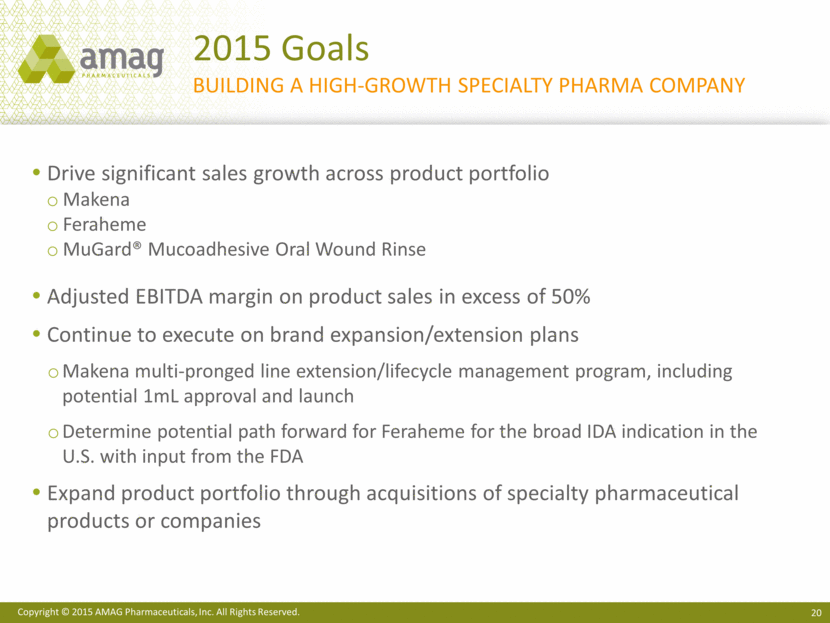
2015 Goals building a high-growth specialty pharma company Drive significant sales growth across product portfolio Makena Feraheme MuGard® Mucoadhesive Oral Wound Rinse Adjusted EBITDA margin on product sales in excess of 50% Continue to execute on brand expansion/extension plans Makena multi-pronged line extension/lifecycle management program, including potential 1mL approval and launch Determine potential path forward for Feraheme for the broad IDA indication in the U.S. with input from the FDA Expand product portfolio through acquisitions of specialty pharmaceutical products or companies |
|
|
AMAG Pharmaceuticals 1Q15 Financial Results May 5, 2015 |
|
|
Adjusted EBITDA and Cash Earnings Reconciliation 2015 Updated Guidance ($ in millions) 2015 Updated Guidance GAAP Net income (loss) $75 - $90 Depreciation & amortization of intangible assets $50 - $55 Interest expense, net $40 Provision for income taxes $35 EBITDA $200 - $220 Non-cash collaboration revenue ~$(38) Non-cash inventory step-up ~$15 Stock-based compensation ~$12 Adjustment to contingent consideration ~$14 Severance & transaction related costs ~$2 Adjusted EBITDA $200 - $220 Cash interest expense $(30) Cash earnings $170 - $190 |
|
|
Reconciliation of GAAP Reported to Non-GAAP Adjusted Information Three Months Ended March 31 ($ in millions) 2015 2014 GAAP Net income (loss) $ 12,904 $ (7,102) Depreciation & amortization of intangible assets 11,615 162 Interest expense, net 10,296 1,476 Provision for income taxes 5,608 -- Non-cash collaboration revenue (6,402) (1,974) Inventory fair value step-up adjustments 6,183 -- Write-down of inventory to net realizable value -- 1,437 Share-based compensation expense 2,668 1,930 Change in fair value of contingent consideration 2,599 789 Severance, restructuring and transaction related costs 1,925 -- Adjusted EBITDA 47,396 (3,282) Cash interest expense (7,482) (650) Non-GAAP net come (loss) - Cash earnings $ 39,914 $ (3,932) |
|
|
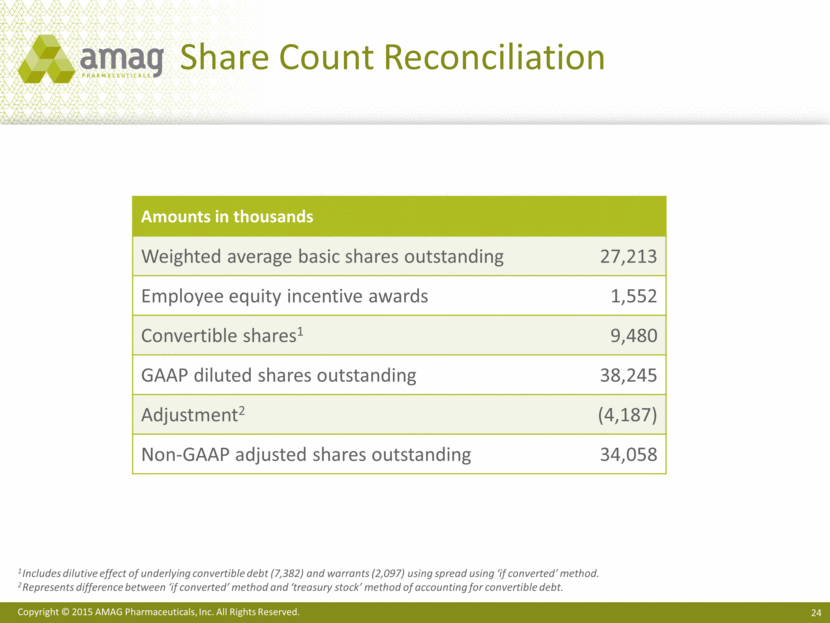
Share Count Reconciliation Amounts in thousands Weighted average basic shares outstanding 27,213 Employee equity incentive awards 1,552 Convertible shares1 9,480 GAAP diluted shares outstanding 38,245 Adjustment2 (4,187) Non-GAAP adjusted shares outstanding 34,058 1 Includes dilutive effect of underlying convertible debt (7,382) and warrants (2,097) using spread using ‘if converted’ method. 2 Represents difference between ‘if converted’ method and ‘treasury stock’ method of accounting for convertible debt. |
Serious News for Serious Traders! Try StreetInsider.com Premium Free!
You May Also Be Interested In
- Alithya Reports First Quarter Fiscal 2027 Results
- Trilith Foundation Brings the Science of Human Flourishing to Life at the 2026 Flourishing Summit
- BlueRose Publishers Announces the Release of "Covid-19 Pandemic: A Third Eye" by Dr. Amitav Banerjee
Create E-mail Alert Related Categories
SEC FilingsSign up for StreetInsider Free!
Receive full access to all new and archived articles, unlimited portfolio tracking, e-mail alerts, custom newswires and RSS feeds - and more!
