Form 8-K AAR CORP For: Jul 17
UNITED STATES
SECURITIES AND EXCHANGE COMMISSION
Washington, D.C. 20549
FORM 8-K
CURRENT REPORT
Pursuant to Section 13 or 15(d) of the Securities Exchange Act of 1934
Date of Report (Date of Earliest Event Reported): July 17, 2019
AAR CORP.
(Exact name of registrant as specified in its charter)
|
Delaware |
|
1-6263 |
|
36-2334820 |
|
(State of Incorporation) |
|
(Commission File Number) |
|
(IRS Employer Identification No.) |
One AAR Place
1100 N. Wood Dale Road
Wood Dale, Illinois 60191
(Address and Zip Code of Principal Executive Offices)
Registrant’s telephone number, including area code: (630) 227-2000
Not Applicable
(Former name or former address, if changed since last report)
Check the appropriate box below if the Form 8-K filing is intended to simultaneously satisfy the filing obligation of the registrant under any of the following provisions:
o Written communications pursuant to Rule 425 under the Securities Act (17 CFR 230.425)
o Soliciting material pursuant to Rule 14a-12 under the Exchange Act (17 CFR 240.14a-12)
o Pre-commencement communications pursuant to Rule 14d-2(b) under the Exchange Act (17 CFR 240.14d-2(b))
o Pre-commencement communications pursuant to Rule 13e-4(c) under the Exchange Act (17 CFR 240.13e-4(c))
Securities registered pursuant to Section 12(b) of the Act:
|
Title of Each Class |
|
Trading Symbol(s) |
|
Name of Each Exchange on Which Registered |
|
Common Stock, $1.00 par value |
|
AIR |
|
New York Stock Exchange |
Indicate by check mark whether the registrant is an emerging growth company as defined in Rule 405 of the Securities Act of 1933 (§ 230.405 of this chapter) or Rule 12b-2 of the Securities Exchange Act of 1934 (§ 240.12b—2 of this chapter).
Emerging growth company o
If an emerging growth company, indicate by check mark if the registrant has elected not to use the extended transition period for complying with any new or revised financial accounting standards provided pursuant to Section 13(a) of the Exchange Act. o
Item 7.01 Regulation FD Disclosure
AAR CORP. (the “Company”) will hold an “Investor Day” conference in New York City on Wednesday, July 17, 2019. Attached as Exhibit 99.1 are the slides that will be used by the Company’s management at the conference.
The information furnished under Item 7.01 of this Current Report on Form 8-K, including Exhibit 99.1 attached hereto shall not be deemed to be “filed” for the purposes of Section 18 of the Securities and Exchange Act of 1934, as amended, or otherwise subject to the liabilities of that section, nor shall it be deemed to be incorporated by reference in any registration statement or other document filed under the Securities Act of 1933, as amended, or the Exchange Act, except as otherwise stated in such filing.
Item 9.01 Financial Statements and Exhibits.
(d) Exhibits.
|
Exhibit No. |
|
Description |
|
99.1 |
|
Investor Day conference slides presented by AAR CORP. on July 17, 2019 in New York City. |
EXHIBIT INDEX
|
Exhibit No. |
|
Description |
|
99.1 |
|
Investor Day conference slides presented by AAR CORP. on July 17, 2019 in New York City. |
SIGNATURES
Pursuant to the requirements of the Securities Exchange Act of 1934, the registrant has duly caused this report to be signed on its behalf by the undersigned hereunto duly authorized.
|
Date: July 17, 2019 |
AAR CORP. | |
|
|
|
|
|
|
|
|
|
|
By: |
|
|
|
|
/s/ SEAN M. GILLEN |
|
|
|
Sean M. Gillen |
|
|
|
Vice President and Chief Financial Officer |
|
|
|
(Principal Financial Officer) |
Forward-Looking Statements This presentation includes certain statements relating to future results, which are forward-looking statements as that term is defined in the Private Securities Litigation Reform Act of 1995. These forward-looking statements are based on beliefs of Company management, as well as assumptions and estimates based on information currently available to the Company, and are subject to certain risks and uncertainties that could cause actual results to differ materially from historical results or those anticipated, including those factors discussed under Item 1A, entitled “Risk Factors,” included in the Company’s most recent Form 10-K. Should one or more of these risks or uncertainties materialize adversely, or should underlying assumptions or estimates prove incorrect, actual results may vary materially from those described. These events and uncertainties are difficult or impossible to predict accurately and many are beyond the Company’s control. The Company assumes no obligation to update any forward-looking statements to reflect events or circumstances after the date of such statements or to reflect the occurrence of anticipated or unanticipated events. For additional information, see the comments included in AAR’s filings with the Securities and Exchange Commission.
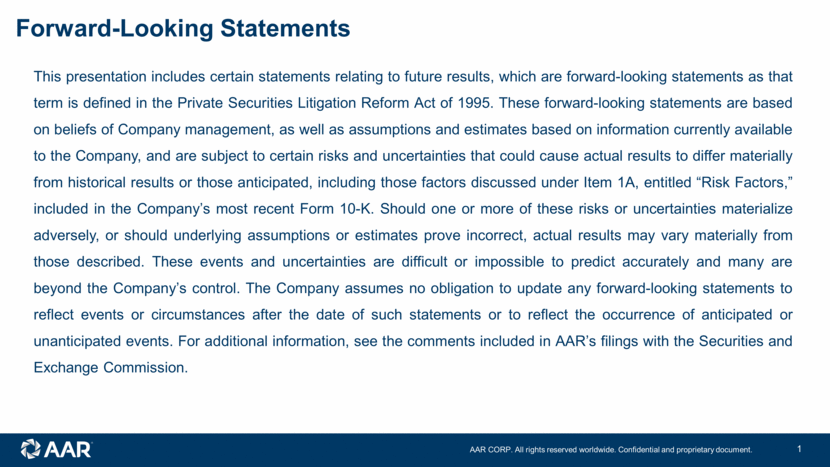
Agenda Company and Strategy Market Overview and Position Operations: Parts Supply: Trading Parts Supply: OEM Solutions Repair & Engineering Integrated Solutions Digital Initiatives Financial Overview Closing Comments and Q&A
Company and Strategy John Holmes
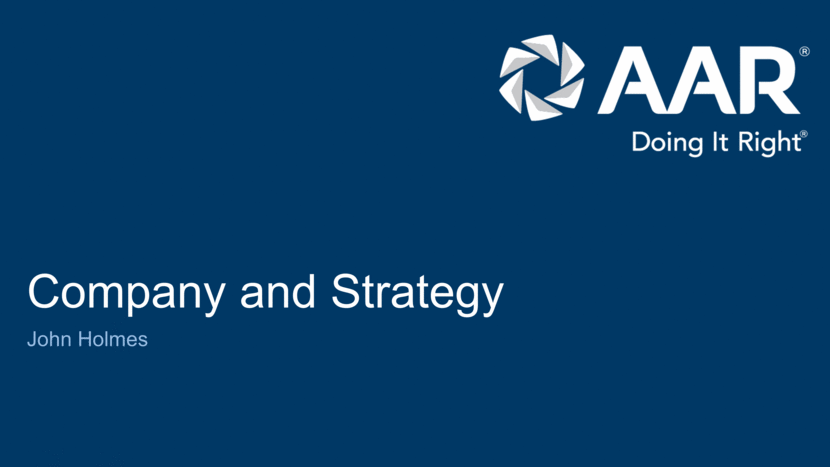
Aviation Services Market Expert Since 1955 Leading independent provider of aviation services to commercial and government markets NYSE: AIR $2B revenue 65 years as a market leader in aviation support Approximately 6,000 employees in over 20 countries Close-to-the-customer business model
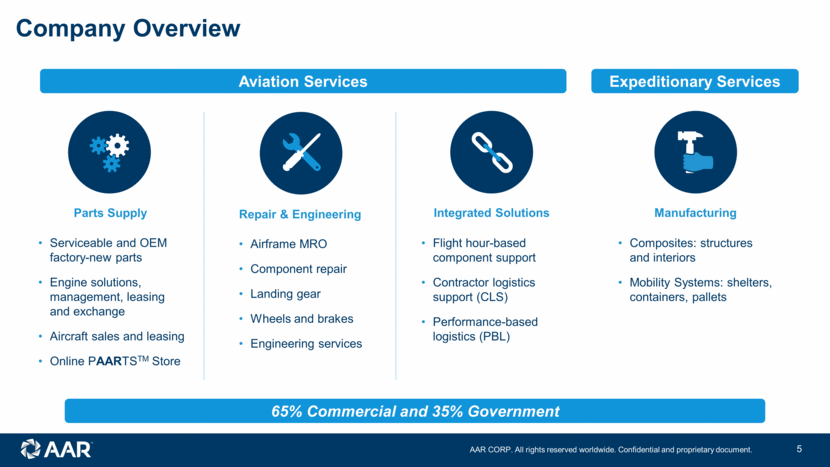
Company Overview Integrated Solutions Flight hour-based component support Contractor logistics support (CLS) Performance-based logistics (PBL) Serviceable and OEM factory-new parts Engine solutions, management, leasing and exchange Aircraft sales and leasing Online PAARTSTM Store Parts Supply Airframe MRO Component repair Landing gear Wheels and brakes Engineering services Repair & Engineering Composites: structures and interiors Mobility Systems: shelters, containers, pallets Manufacturing 65% Commercial and 35% Government Aviation Services Expeditionary Services
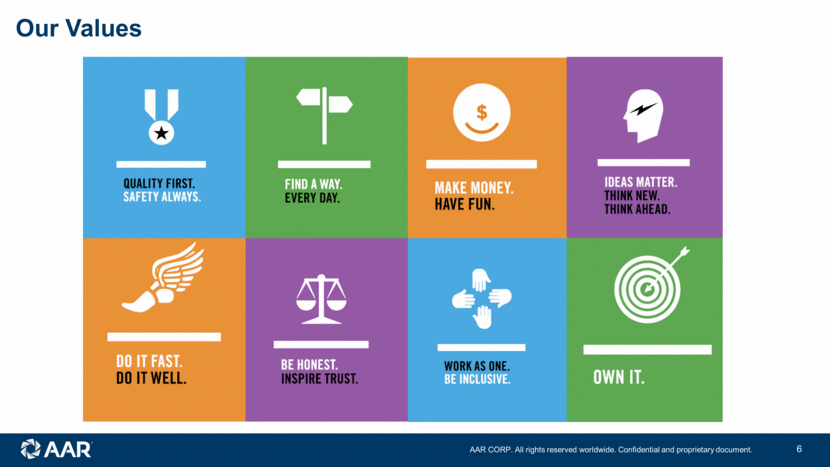
Our Values To be the best at designing and delivering technical, operational and financial solutions to enhance the efficiency and competitiveness of our commercial aviation and government customers
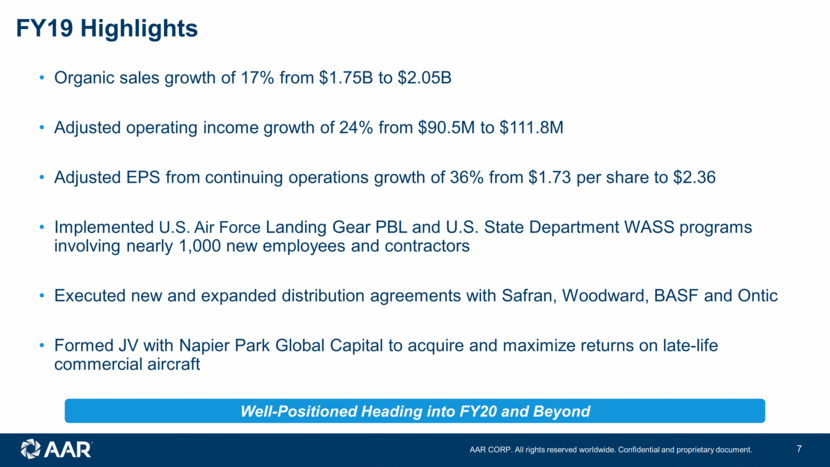
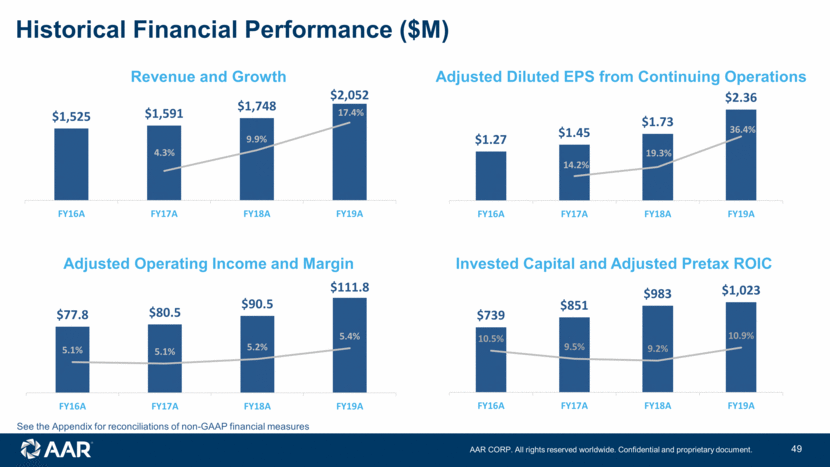
Organic sales growth of 17% from $1.75B to $2.05B Adjusted operating income growth of 24% from $90.5M to $111.8M Adjusted EPS from continuing operations growth of 36% from $1.73 per share to $2.36 Implemented U.S. Air Force Landing Gear PBL and U.S. State Department WASS programs involving nearly 1,000 new employees and contractors Executed new and expanded distribution agreements with Safran, Woodward, BASF and Ontic Formed JV with Napier Park Global Capital to acquire and maximize returns on late-life commercial aircraft FY19 Highlights Well-Positioned Heading into FY20 and Beyond
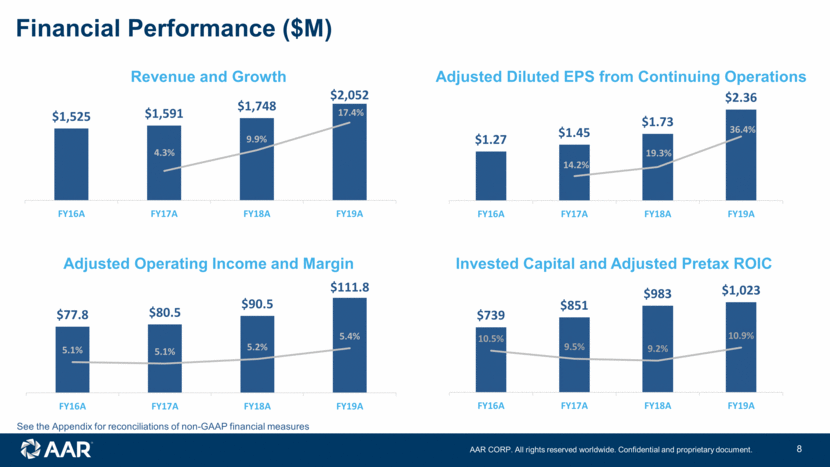
Adjusted Operating Income and Margin Revenue and Growth See the Appendix for reconciliations of non-GAAP financial measures Invested Capital and Adjusted Pretax ROIC Adjusted Diluted EPS from Continuing Operations Financial Performance ($M) $1.27 $1.45 $1.73 $2.36 14.2% 19.3% 36.4% FY16A FY17A FY18A FY19A $739 $851 $983 $1,023 10.5% 9.5% 9.2% 10.9% FY16A FY17A FY18A FY19A $77.8 $80.5 $90.5 $111.8 5.1% 5.1% 5.2% 5.4% FY16A FY17A FY18A FY19A $1,525 $1,591 $1,748 $2,052 4.3% 9.9% 17.4% FY16A FY17A FY18A FY19A
Corporate Strategy Entrepreneurial Nimble Portfolio Drive connected businesses that reinforce collective growth prospects Expand margins through differentiated capabilities / intellectual property Utilize data and digital solutions to improve offerings and efficiency Leverage independence to offer OEM/airline alternative Increase international presence Attract, empower and deploy exceptional, entrepreneurial talent Fewer, more integrated businesses Intellectual property Predictable revenue Scale, global Entrepreneurial $0 to $2B Strategic Growth Imperatives Connected Businesses Digital Independent IP International Be the Leading Independent Aviation Services Provider Globally $2B+
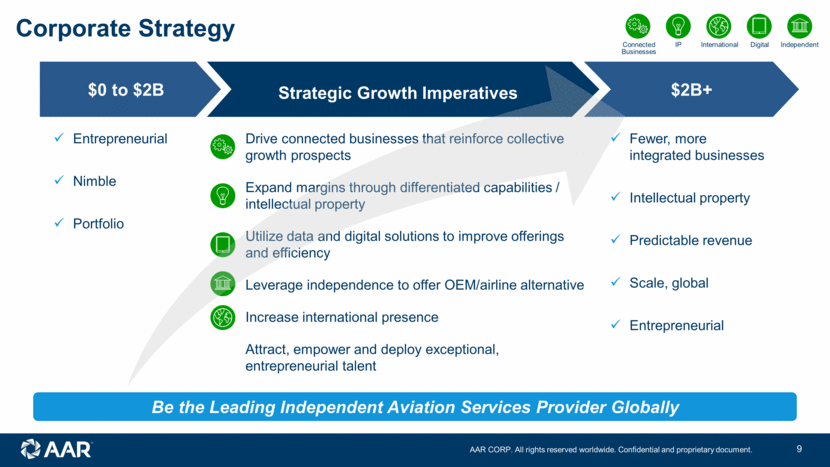
Connected Businesses Model Unique Value Proposition Parts Supply Transactional data collection Exclusive relationships with OEMs and customers Inventory pooling with programs Repair & Engineering Strategic relationships with airlines Technical repair knowledge and data collection Develop parts for internal and external consumption Integrated Solutions Strategic relationships with airlines, MROs, OEMs and repair vendors Fuel parts supply business Fund component repair capability development Long-term contracts / predictable revenue Integrated businesses leveraged to reinforce and grow the whole
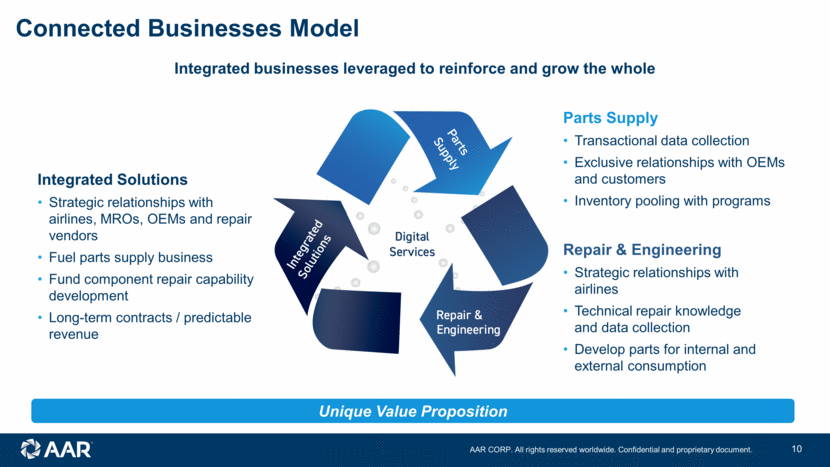
Differentiated Capabilities and Predictable Revenue Parts Supply Repair & Engineering Integrated Solutions Exclusive aftermarket parts supply contracts Exclusive new parts OEM distribution contracts Long-term new parts supply contracts with comm’l and gov’t customers Digital channels to market Long-term contractual maintenance relationships Proprietary (DER) repair development and utilization PMA utilization OEM partnerships and licensing Long-term contracts with government and commercial customers Increase internal repair content More PMA/DER usage and partnerships
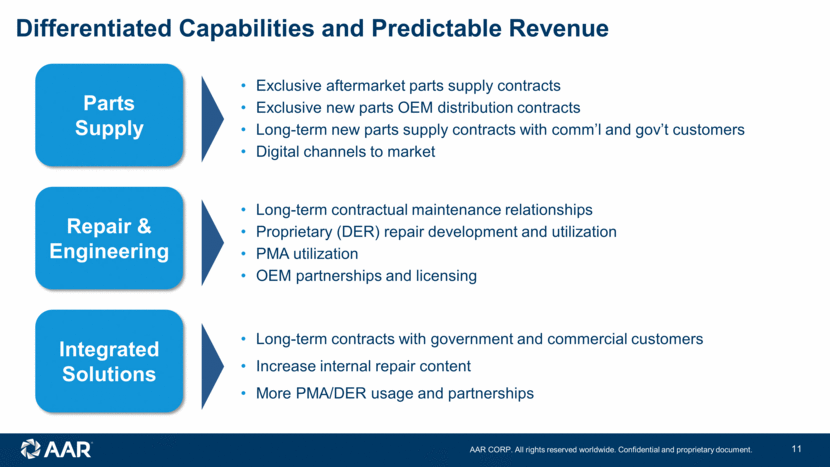
AAR Investment Highlights 1 2 3 4 Supportive macroeconomic environment with strong global aviation aftermarket growth and robust government spending expected Leading aftermarket parts supplier distinctly positioned to benefit from market dynamics Largest independent aerospace distributor of OEM factory-new parts leveraging exclusive relationships and unique sales channels #1 Americas MRO footprint enables integrated services model 6 Strong balance sheet supports continued investments in growth and/or increased capital return to shareholders 5 Integrated solutions offering well-positioned for continued growth in both government and commercial markets Unique Combination of Integrated Services Leveraging Our Independent Market Position
Market Overview and Position Chris Jessup

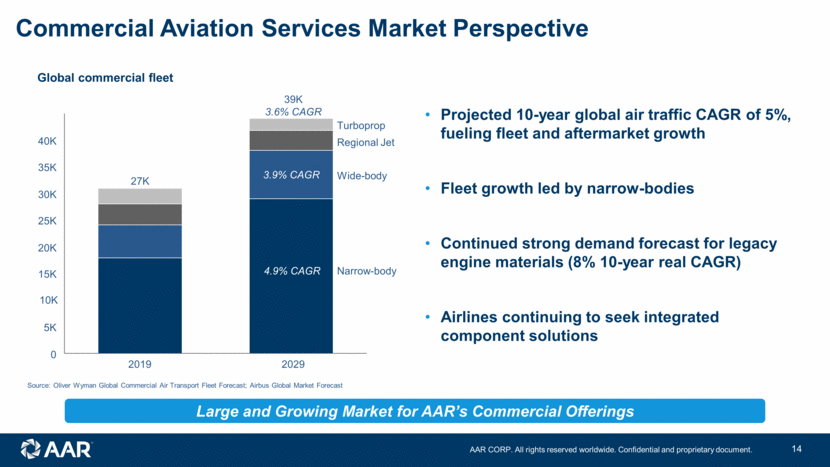
Commercial Aviation Services Market Perspective Large and Growing Market for AAR’s Commercial Offerings Source: Oliver Wyman Global Commercial Air Transport Fleet Forecast; Airbus Global Market Forecast Projected 10-year global air traffic CAGR of 5%, fueling fleet and aftermarket growth Fleet growth led by narrow-bodies Continued strong demand forecast for legacy engine materials (8% 10-year real CAGR) Airlines continuing to seek integrated component solutions Global commercial fleet 0 25K 30K 20K 40K 35K 5K 15K Narrow-body Regional Jet 2029 2019 Turboprop Wide-body 27K 39K 3.6% CAGR 3.9% CAGR 4.9% CAGR 10K
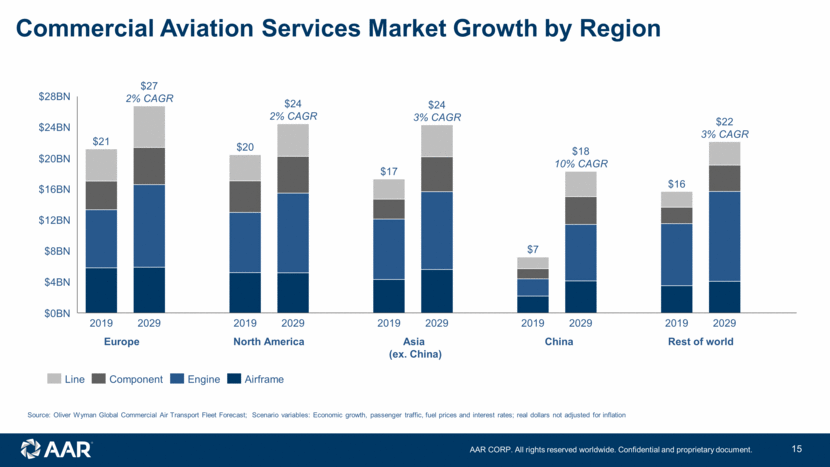
Commercial Aviation Services Market Growth by Region $4BN $16BN $0BN $8BN $28BN $12BN $24BN $20BN $21 2019 2029 2019 2029 2019 2019 2029 $18 10% CAGR 2019 2029 $7 2029 $27 2% CAGR $20 $24 2% CAGR $17 $24 3% CAGR $22 3% CAGR $16 Asia (ex. China) China North America Rest of world Europe Source: Oliver Wyman Global Commercial Air Transport Fleet Forecast; Scenario variables: Economic growth, passenger traffic, fuel prices and interest rates; real dollars not adjusted for inflation Line Component Engine Airframe
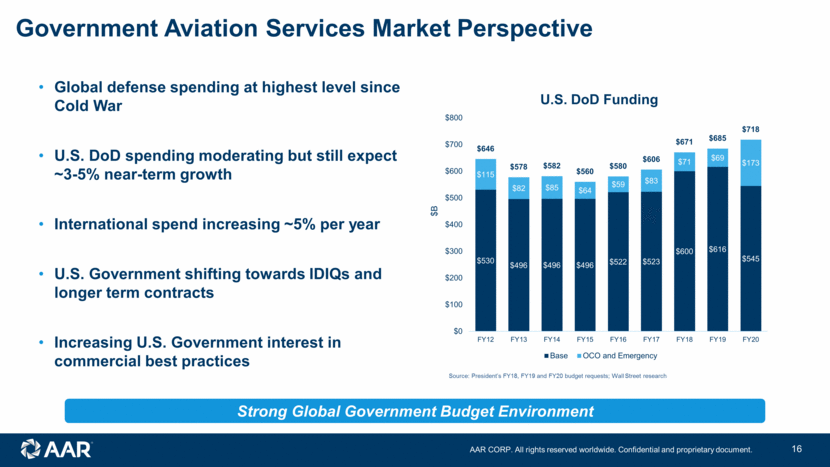
Government Aviation Services Market Perspective Global defense spending at highest level since Cold War U.S. DoD spending moderating but still expect ~3-5% near-term growth International spend increasing ~5% per year U.S. Government shifting towards IDIQs and longer term contracts Increasing U.S. Government interest in commercial best practices Source: President’s FY18, FY19 and FY20 budget requests; Wall Street research Strong Global Government Budget Environment $530 $496 $496 $496 $522 $523 $600 $616 $545 $115 $82 $85 $64 $59 $83 $71 $69 $173 $646 $578 $582 $560 $580 $606 $671 $685 $718 $0 $100 $200 $300 $400 $500 $600 $700 $800 FY12 FY13 FY14 FY15 FY16 FY17 FY18 FY19 FY20 $B U.S. DoD Funding Base OCO and Emergency
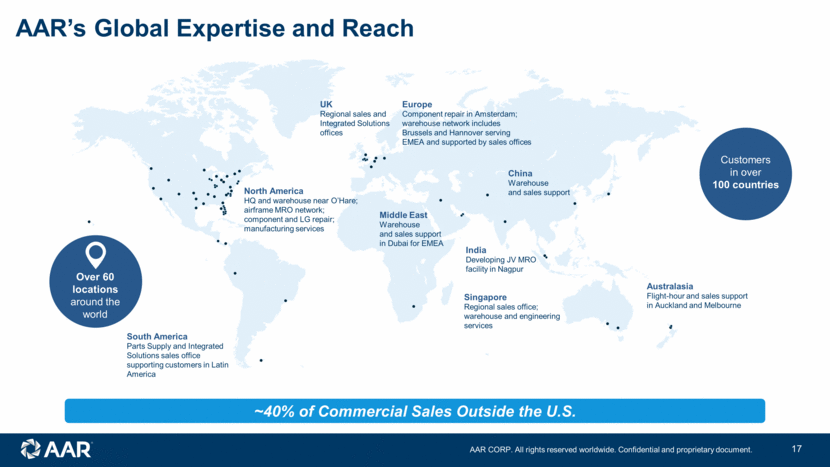
AAR’s Global Expertise and Reach North America HQ and warehouse near O’Hare; airframe MRO network; component and LG repair; manufacturing services UK Regional sales and Integrated Solutions offices Europe Component repair in Amsterdam; warehouse network includes Brussels and Hannover serving EMEA and supported by sales offices China Warehouse and sales support Middle East Warehouse and sales support in Dubai for EMEA Australasia Flight-hour and sales support in Auckland and Melbourne Singapore Regional sales office; warehouse and engineering services Over 60 locations around the world Customers in over 100 countries India Developing JV MRO facility in Nagpur South America Parts Supply and Integrated Solutions sales office supporting customers in Latin America ~40% of Commercial Sales Outside the U.S.
AAR’s Strong Industry Relationships Airlines Cargo Airlines Regional Airlines OEMs Government
Parts Supply: Trading Sal Marino
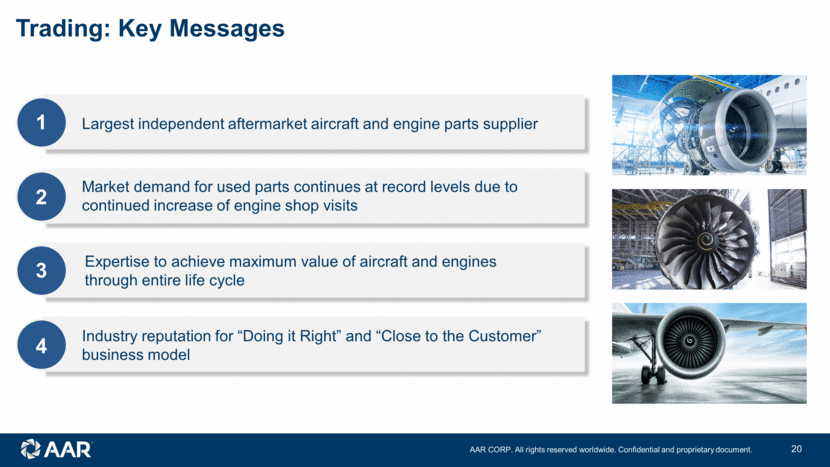
Trading: Key Messages 1 2 3 4 Largest independent aftermarket aircraft and engine parts supplier Market demand for used parts continues at record levels due to continued increase of engine shop visits Industry reputation for “Doing it Right” and “Close to the Customer” business model Expertise to achieve maximum value of aircraft and engines through entire life cycle
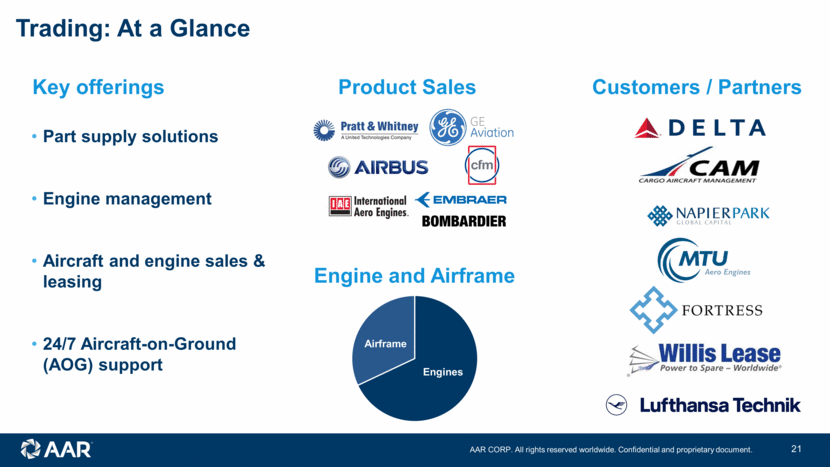
Trading: At a Glance Product Sales Key offerings Engine and Airframe Customers / Partners Part supply solutions Engine management Aircraft and engine sales & leasing 24/7 Aircraft-on-Ground (AOG) support Engines Airframe
Trading: Value Proposition Customer Impact Mission Be the most sought-after supplier to airlines, MROs and leasing companies Extensive offering of aftermarket aircraft and engine parts Substantial savings over OEM prices Worldwide inventory locations Reduced inventory / lead time Understanding customer quality expectations Delivering valuable KPIs Doing business digitally Ease of transacting AAR Value Proposition
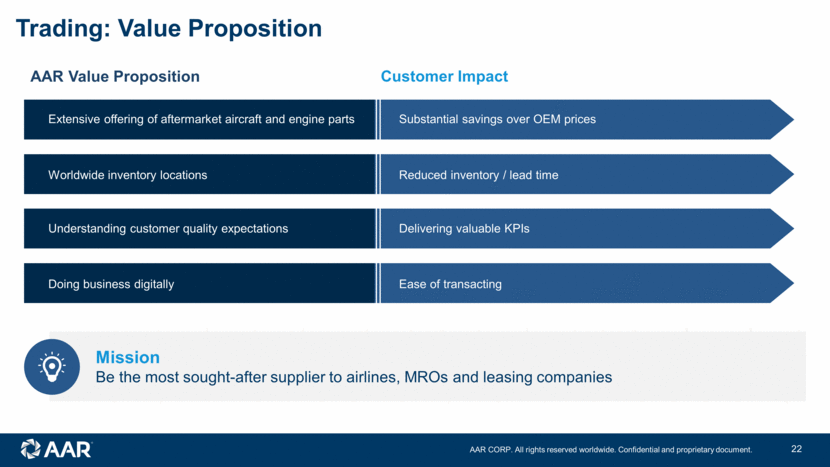
Trading Case Study: Narrow-Body Engine Asset Sales and Leasing AAR Acquires a Used Engine AAR Contracts a Shop Work scope engine Induct engine for repair Contract Shop Disassembles Inspect/recertify parts onsite AAR routes parts out for repair Parts unrepairable and scrap Contract Shop Reassembles Parts that are inspected/repaired Scrap replacement by AAR Test cell & certification AAR Sale / Lease $53M $120M AAR manages all repairs and exclusive part replacement during overhaul; 65% of engine overhaul cost is in parts 22,000 CFM56-5B/7B (A320/737NG) and 7,000 V2500-A5 (A320 family) in service 60% of CFM56-7B fleet have not had their first overhaul Currently 50% of fleet under OEM/PBH control Costs to repair CFM engines expected to double over next decade due to part prices increasing ~6-9% / year Source: IBA 842 951 1,066 850 951 934 806 1,842 1,670 1,630 1,733 1,816 1,877 1,897 1,018 1,306 1,224 1,208 1,106 1,098 1,036 0 200 400 600 800 1,000 1,200 1,400 1,600 1,800 2,000 2019 2020 2021 2022 2023 2024 2025 Engine Shop Visits CFM56-5B CFM56-7B V2500-A5
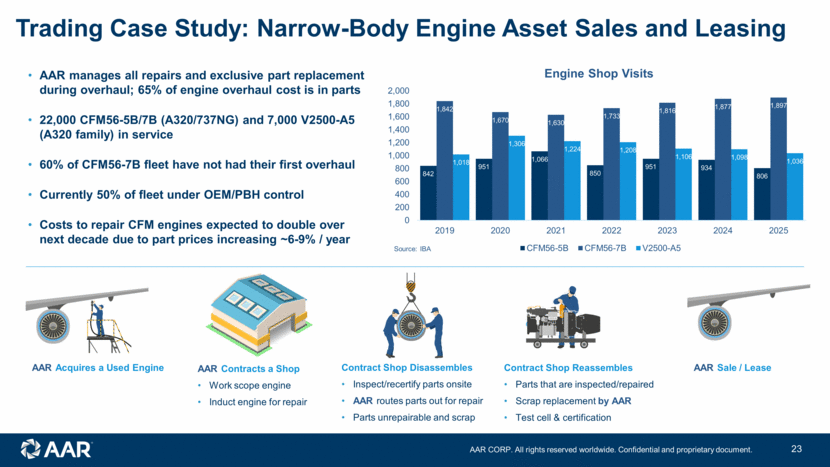
Trading: Strategic Growth Plan Strategic Priorities Key Initiatives Grow contractual business Expand existing programs CFM56-5B/7B and V2500 opportunities Global leader in AOG services Continue to build AOG desk Enhance digital interface with customers Expand engine trading Proactively repair engines for sale / lease Parts readily available to reduce turn time Connected Businesses Digital Independent IP International
Parts Supply: OEM Solutions Eric Young
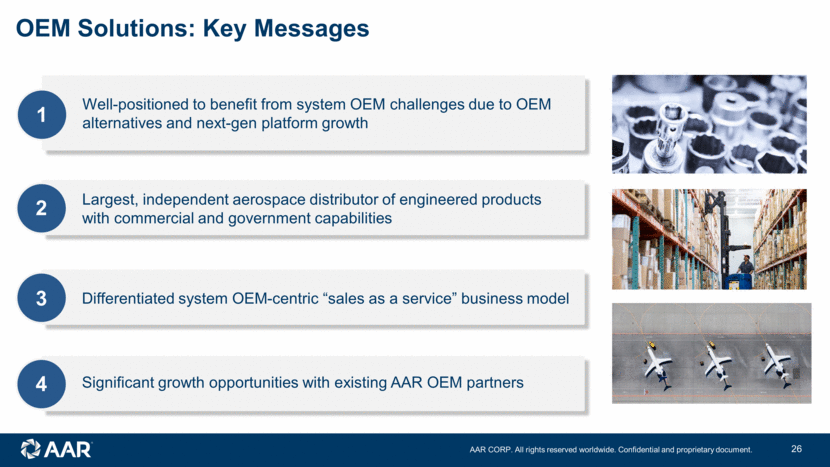
OEM Solutions: Key Messages 2 3 4 Differentiated system OEM-centric “sales as a service” business model Significant growth opportunities with existing AAR OEM partners 1 Well-positioned to benefit from system OEM challenges due to OEM alternatives and next-gen platform growth Largest, independent aerospace distributor of engineered products with commercial and government capabilities
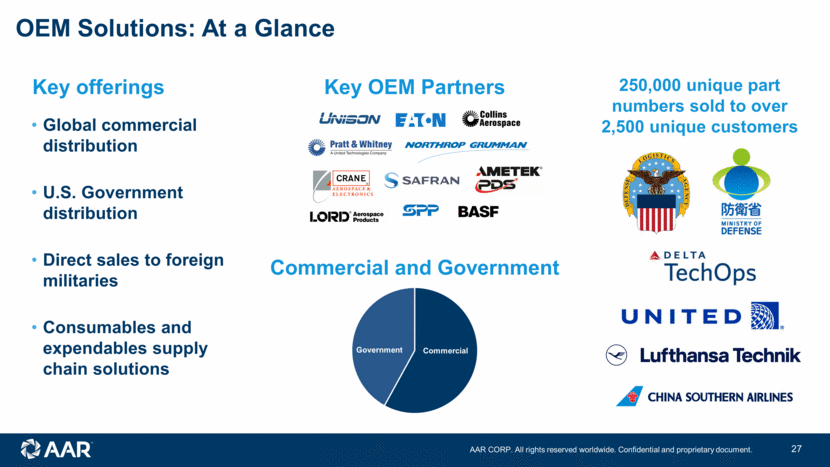
OEM Solutions: At a Glance Key OEM Partners Key offerings Commercial and Government Global commercial distribution U.S. Government distribution Direct sales to foreign militaries Consumables and expendables supply chain solutions 250,000 unique part numbers sold to over 2,500 unique customers Commercial Government
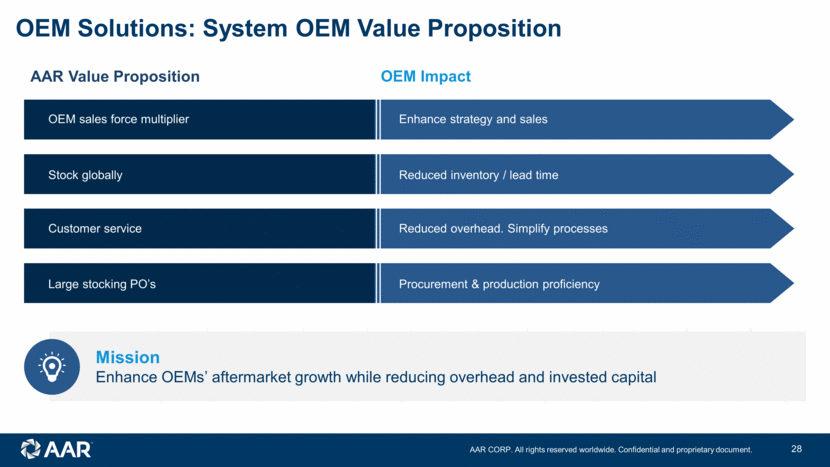
OEM Solutions: System OEM Value Proposition OEM Impact Mission Enhance OEMs’ aftermarket growth while reducing overhead and invested capital OEM sales force multiplier Enhance strategy and sales Stock globally Reduced inventory / lead time Customer service Reduced overhead. Simplify processes Large stocking PO’s Procurement & production proficiency AAR Value Proposition
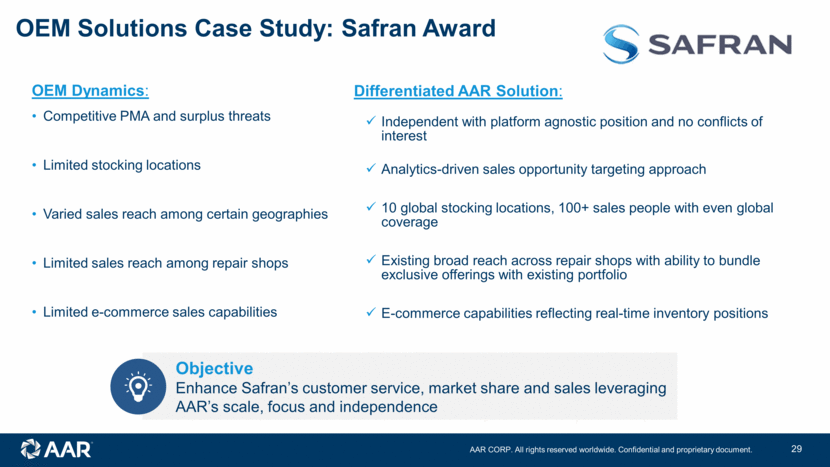
OEM Dynamics: Competitive PMA and surplus threats Limited stocking locations Varied sales reach among certain geographies Limited sales reach among repair shops Limited e-commerce sales capabilities Differentiated AAR Solution: Independent with platform agnostic position and no conflicts of interest Analytics-driven sales opportunity targeting approach 10 global stocking locations, 100+ sales people with even global coverage Existing broad reach across repair shops with ability to bundle exclusive offerings with existing portfolio E-commerce capabilities reflecting real-time inventory positions Objective Enhance Safran’s customer service, market share and sales leveraging AAR’s scale, focus and independence OEM Solutions Case Study: Safran Award
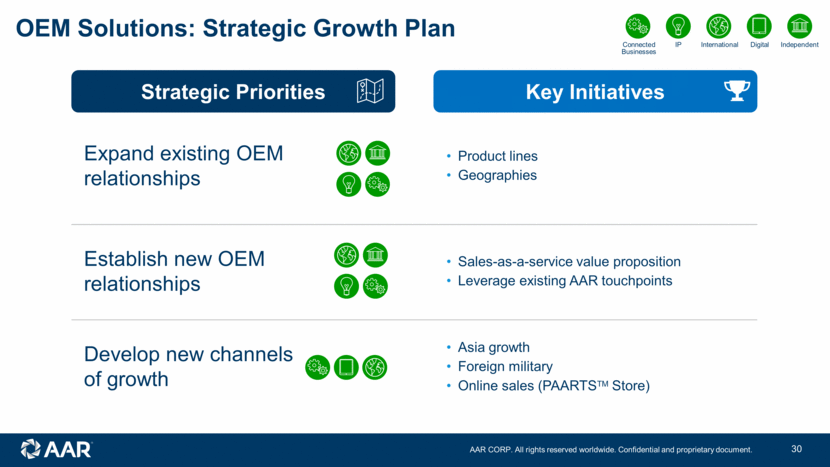
OEM Solutions: Strategic Growth Plan Strategic Priorities Key Initiatives Expand existing OEM relationships Product lines Geographies Establish new OEM relationships Sales-as-a-service value proposition Leverage existing AAR touchpoints Develop new channels of growth Asia growth Foreign military Online sales (PAARTSTM Store) Connected Businesses Digital Independent IP International
Repair & Engineering Brian Sartain

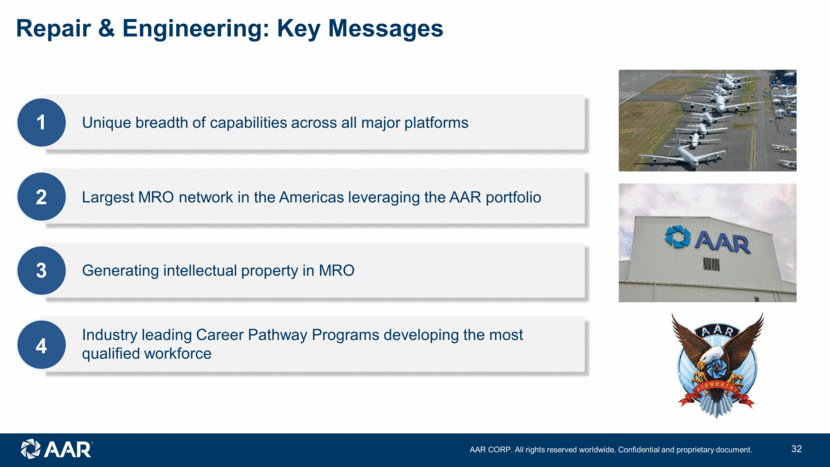
Repair & Engineering: Key Messages 1 2 3 4 Unique breadth of capabilities across all major platforms Largest MRO network in the Americas leveraging the AAR portfolio Industry leading Career Pathway Programs developing the most qualified workforce Generating intellectual property in MRO
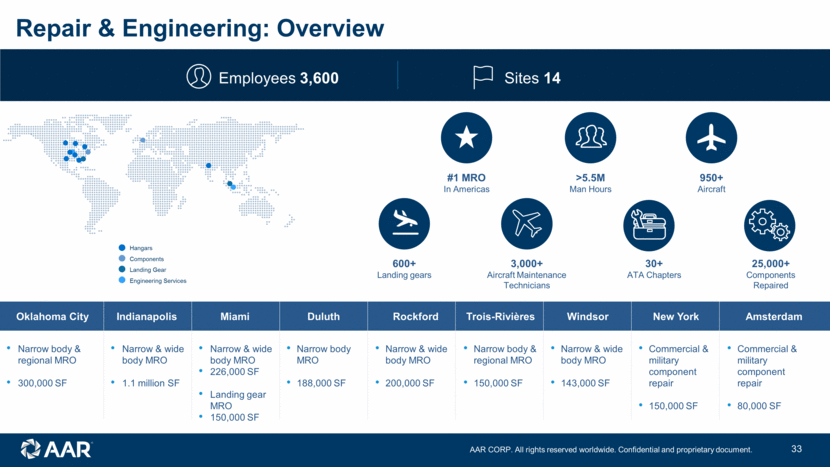
Repair & Engineering: Overview Oklahoma City Narrow body & regional MRO 300,000 SF Narrow & wide body MRO 1.1 million SF Indianapolis Narrow & wide body MRO 226,000 SF Landing gear MRO 150,000 SF Miami Duluth Narrow & wide body MRO 200,000 SF Rockford Trois-Rivières Narrow body & regional MRO 150,000 SF Narrow & wide body MRO 143,000 SF Windsor Narrow body MRO 188,000 SF Commercial & military component repair 150,000 SF Amsterdam Employees 3,600 Sites 14 Commercial & military component repair 80,000 SF #1 MRO In Americas >5.5M Man Hours 950+ Aircraft 3,000+ Aircraft Maintenance Technicians 600+ Landing gears 30+ ATA Chapters 25,000+ Components Repaired New York Hangars Components Landing Gear Engineering Services
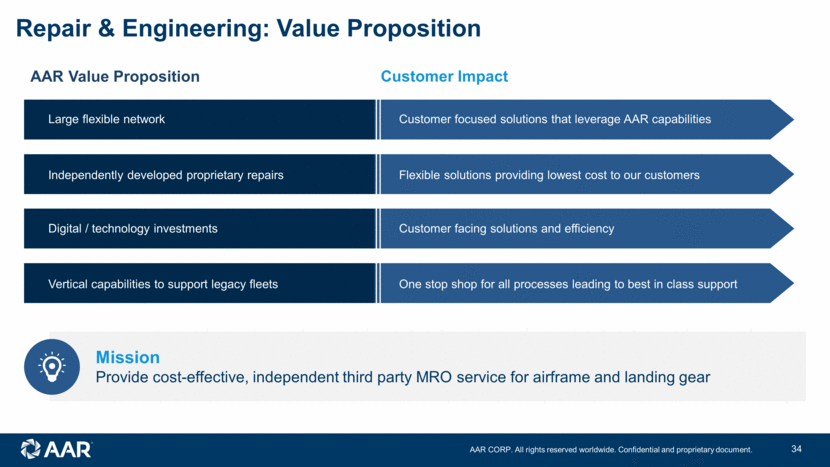
Repair & Engineering: Value Proposition Customer Impact Mission Provide cost-effective, independent third party MRO service for airframe and landing gear Large flexible network Customer focused solutions that leverage AAR capabilities Independently developed proprietary repairs Flexible solutions providing lowest cost to our customers Digital / technology investments Customer facing solutions and efficiency Vertical capabilities to support legacy fleets One stop shop for all processes leading to best in class support AAR Value Proposition
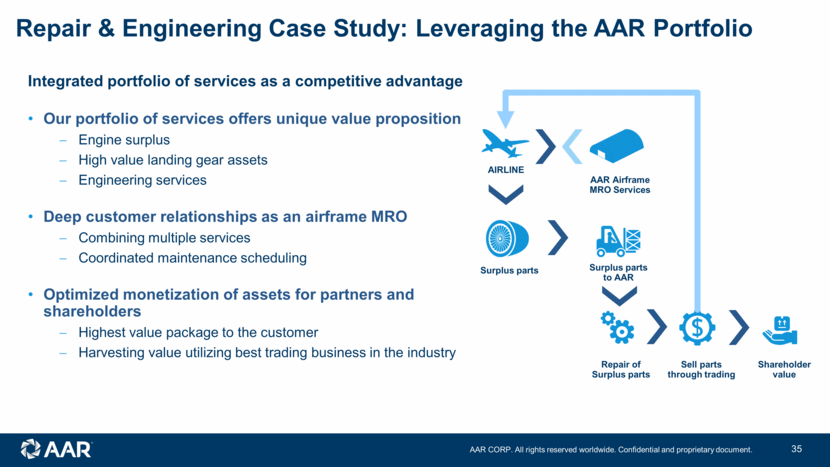
Repair & Engineering Case Study: Leveraging the AAR Portfolio Integrated portfolio of services as a competitive advantage Our portfolio of services offers unique value proposition Engine surplus High value landing gear assets Engineering services Deep customer relationships as an airframe MRO Combining multiple services Coordinated maintenance scheduling Optimized monetization of assets for partners and shareholders Highest value package to the customer Harvesting value utilizing best trading business in the industry AIRLINE Surplus parts AAR Airframe MRO Services Surplus parts to AAR Repair of Surplus parts Sell parts through trading Shareholder value
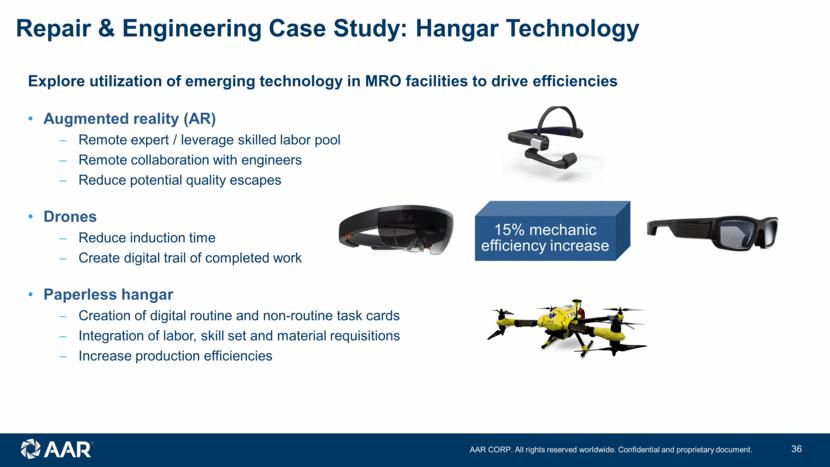
Repair & Engineering Case Study: Hangar Technology Explore utilization of emerging technology in MRO facilities to drive efficiencies Augmented reality (AR) Remote expert / leverage skilled labor pool Remote collaboration with engineers Reduce potential quality escapes Drones Reduce induction time Create digital trail of completed work Paperless hangar Creation of digital routine and non-routine task cards Integration of labor, skill set and material requisitions Increase production efficiencies 15% mechanic efficiency increase
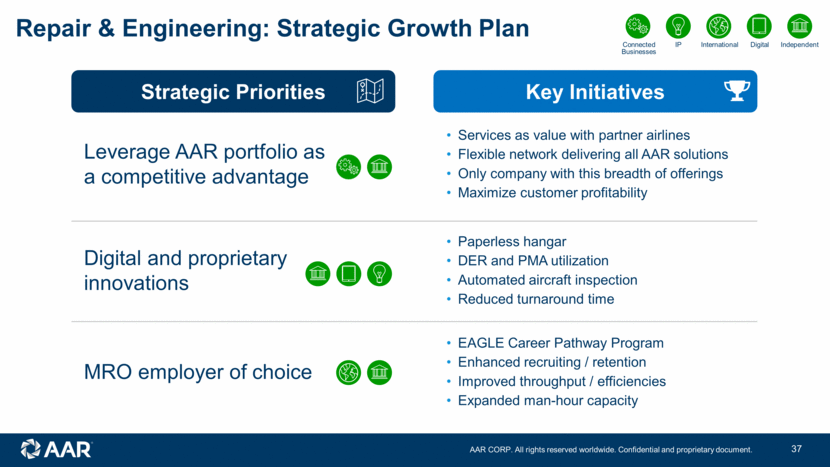
Repair & Engineering: Strategic Growth Plan Strategic Priorities Key Initiatives Leverage AAR portfolio as a competitive advantage Services as value with partner airlines Flexible network delivering all AAR solutions Only company with this breadth of offerings Maximize customer profitability Digital and proprietary innovations Paperless hangar DER and PMA utilization Automated aircraft inspection Reduced turnaround time MRO employer of choice EAGLE Career Pathway Program Enhanced recruiting / retention Improved throughput / efficiencies Expanded man-hour capacity Connected Businesses Digital Independent IP International
Integrated Solutions Nick Gross

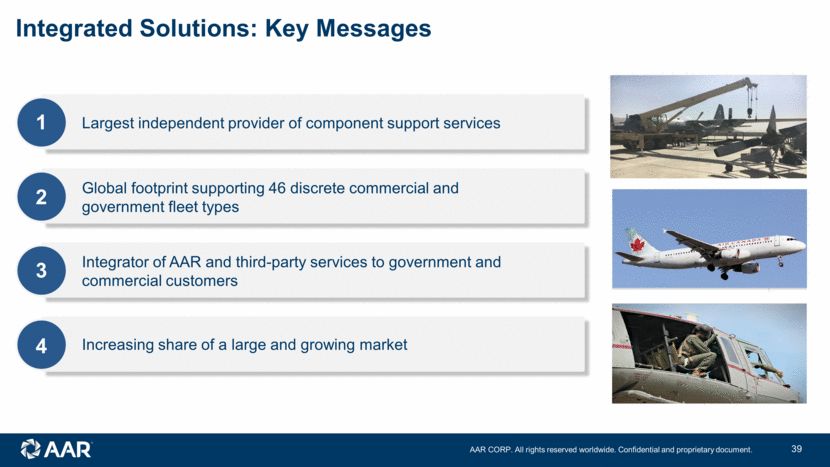
Integrated Solutions: Key Messages 1 2 3 4 Image placeholder Image placeholder Image placehoder Largest independent provider of component support services Global footprint supporting 46 discrete commercial and government fleet types Integrator of AAR and third-party services to government and commercial customers Increasing share of a large and growing market
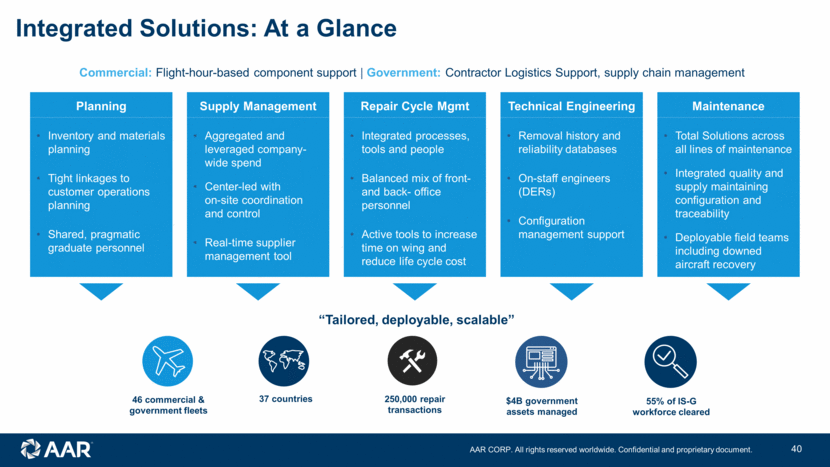
Integrated Solutions: At a Glance Commercial: Flight-hour-based component support Government: Contractor Logistics Support, supply chain management 250,000 repair transactions “Tailored, deployable, scalable” Supply Management Aggregated and leveraged company-wide spend Center-led with on-site coordination and control Real-time supplier management tool Planning Inventory and materials planning Tight linkages to customer operations planning Shared, pragmatic graduate personnel Repair Cycle Mgmt Integrated processes, tools and people Balanced mix of front- and back- office personnel Active tools to increase time on wing and reduce life cycle cost Technical Engineering Removal history and reliability databases On-staff engineers (DERs) Configuration management support 46 commercial & government fleets 37 countries $4B government assets managed 55% of IS-G workforce cleared Maintenance Total Solutions across all lines of maintenance Integrated quality and supply maintaining configuration and traceability Deployable field teams including downed aircraft recovery
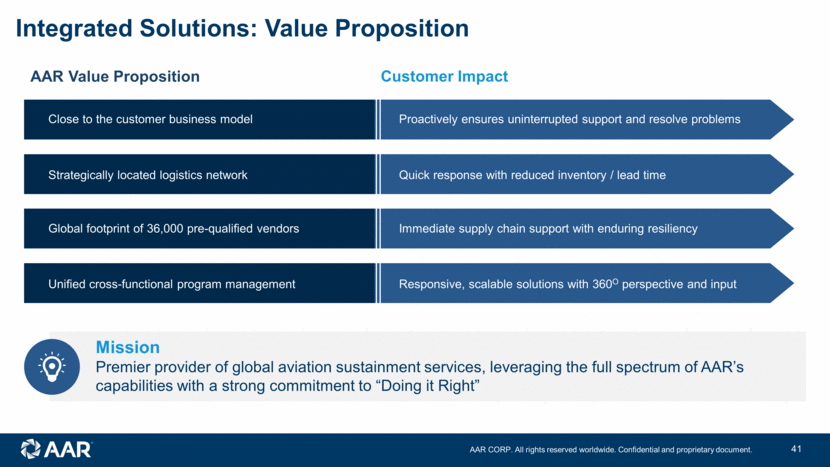
Integrated Solutions: Value Proposition Customer Impact Mission Premier provider of global aviation sustainment services, leveraging the full spectrum of AAR’s capabilities with a strong commitment to “Doing it Right” Close to the customer business model Proactively ensures uninterrupted support and resolve problems Strategically located logistics network Quick response with reduced inventory / lead time Global footprint of 36,000 pre-qualified vendors Immediate supply chain support with enduring resiliency Unified cross-functional program management Responsive, scalable solutions with 360O perspective and input AAR Value Proposition
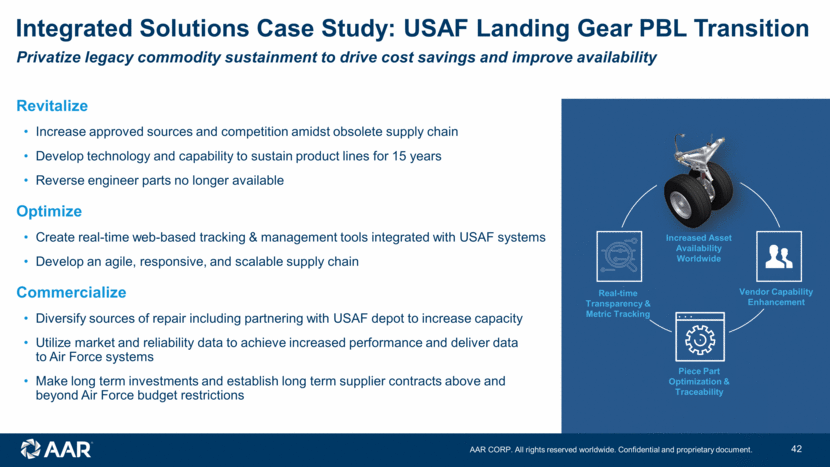
Vendor Capability Enhancement Piece Part Optimization & Traceability Real-time Transparency & Metric Tracking Increased Asset Availability Worldwide Revitalize Increase approved sources and competition amidst obsolete supply chain Develop technology and capability to sustain product lines for 15 years Reverse engineer parts no longer available Optimize Create real-time web-based tracking & management tools integrated with USAF systems Develop an agile, responsive, and scalable supply chain Commercialize Diversify sources of repair including partnering with USAF depot to increase capacity Utilize market and reliability data to achieve increased performance and deliver data to Air Force systems Make long term investments and establish long term supplier contracts above and beyond Air Force budget restrictions Integrated Solutions Case Study: USAF Landing Gear PBL Transition Privatize legacy commodity sustainment to drive cost savings and improve availability
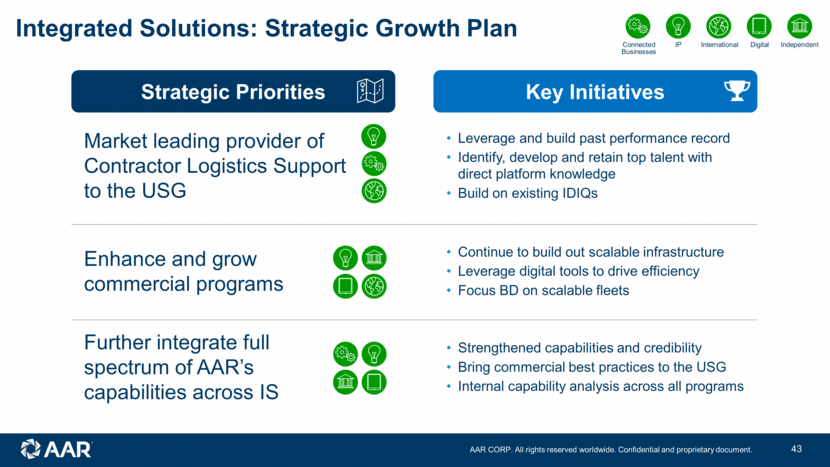
Integrated Solutions: Strategic Growth Plan Strategic Priorities Key Initiatives Market leading provider of Contractor Logistics Support to the USG Leverage and build past performance record Identify, develop and retain top talent with direct platform knowledge Build on existing IDIQs Enhance and grow commercial programs Continue to build out scalable infrastructure Leverage digital tools to drive efficiency Focus BD on scalable fleets Further integrate full spectrum of AAR’s capabilities across IS Strengthened capabilities and credibility Bring commercial best practices to the USG Internal capability analysis across all programs Connected Businesses Digital Independent IP International
Digital Initiatives John Holmes

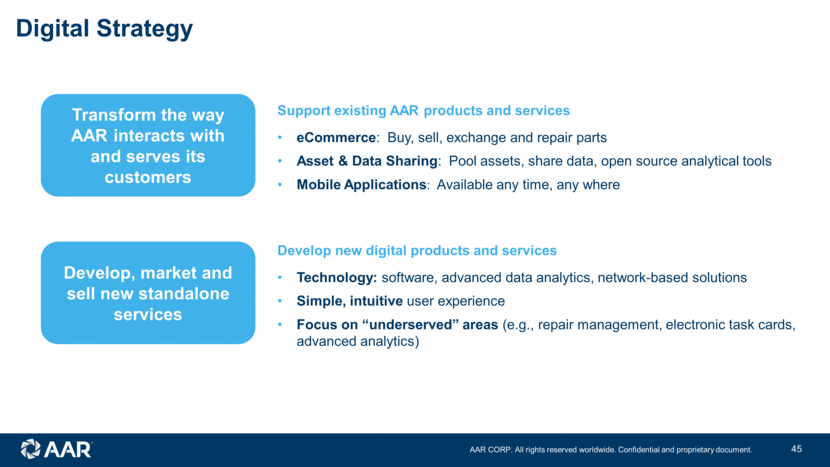
Digital Strategy Transform the way AAR interacts with and serves its customers Develop, market and sell new standalone services Support existing AAR products and services eCommerce: Buy, sell, exchange and repair parts Asset & Data Sharing: Pool assets, share data, open source analytical tools Mobile Applications: Available any time, any where Develop new digital products and services Technology: software, advanced data analytics, network-based solutions Simple, intuitive user experience Focus on “underserved” areas (e.g., repair management, electronic task cards, advanced analytics)
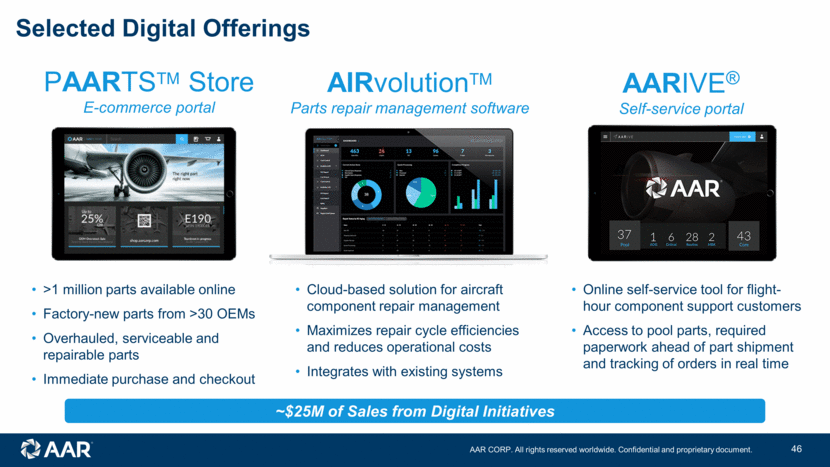
Selected Digital Offerings PAARTSTM Store E-commerce portal AIRvolutionTM Parts repair management software >1 million parts available online Factory-new parts from >30 OEMs Overhauled, serviceable and repairable parts Immediate purchase and checkout Cloud-based solution for aircraft component repair management Maximizes repair cycle efficiencies and reduces operational costs Integrates with existing systems AARIVE® Self-service portal Online self-service tool for flight-hour component support customers Access to pool parts, required paperwork ahead of part shipment and tracking of orders in real time ~$25M of Sales from Digital Initiatives
Financial Overview Sean Gillen

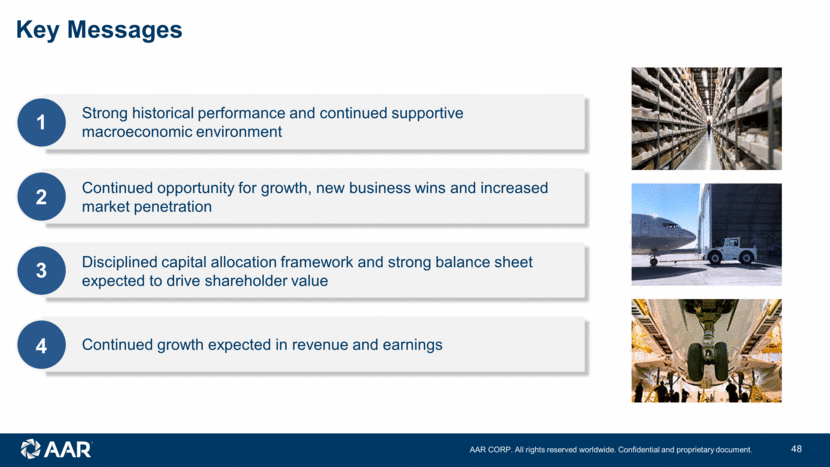
1 2 3 4 Strong historical performance and continued supportive macroeconomic environment Continued opportunity for growth, new business wins and increased market penetration Disciplined capital allocation framework and strong balance sheet expected to drive shareholder value Continued growth expected in revenue and earnings Key Messages
Historical Financial Performance ($M) Adjusted Operating Income and Margin Revenue and Growth See the Appendix for reconciliations of non-GAAP financial measures Invested Capital and Adjusted Pretax ROIC Adjusted Diluted EPS from Continuing Operations $1.27 $1.45 $1.73 $2.36 14.2% 19.3% 36.4% FY16A FY17A FY18A FY19A $739 $851 $983 $1,023 10.5% 9.5% 9.2% 10.9% FY16A FY17A FY18A FY19A $77.8 $80.5 $90.5 $111.8 5.1% 5.1% 5.2% 5.4% FY16A FY17A FY18A FY19A $1,525 $1,591 $1,748 $2,052 4.3% 9.9% 17.4% FY16A FY17A FY18A FY19A
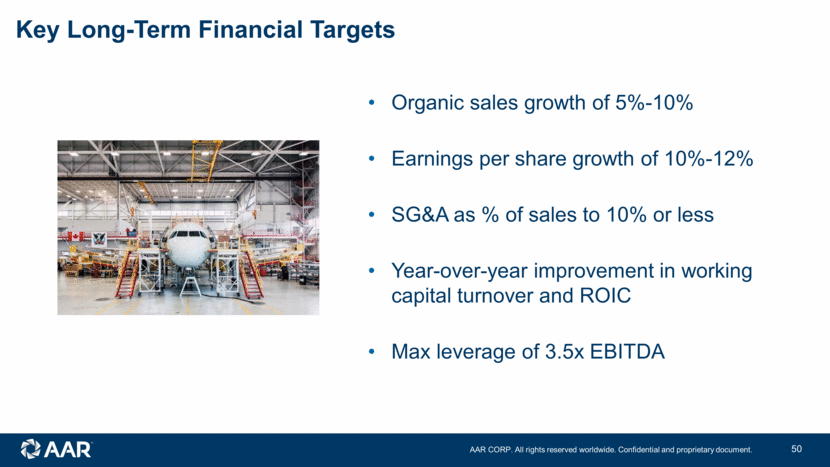
Organic sales growth of 5%-10% Earnings per share growth of 10%-12% SG&A as % of sales to 10% or less Year-over-year improvement in working capital turnover and ROIC Max leverage of 3.5x EBITDA Key Long-Term Financial Targets
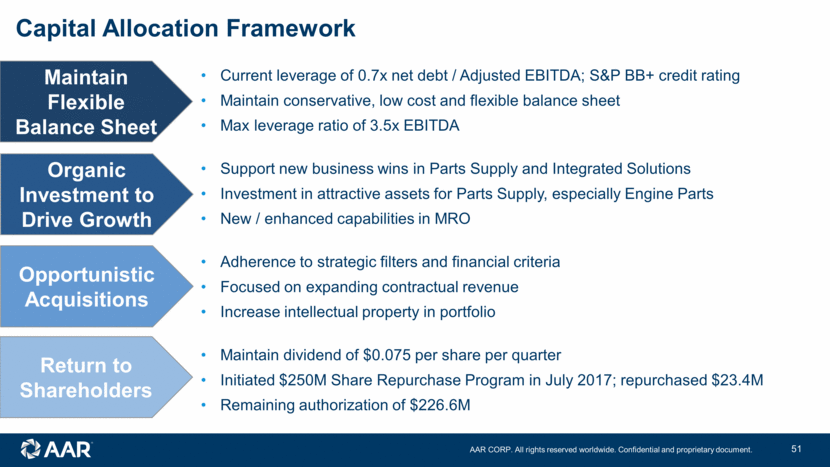
Current leverage of 0.7x net debt / Adjusted EBITDA; S&P BB+ credit rating Maintain conservative, low cost and flexible balance sheet Max leverage ratio of 3.5x EBITDA Support new business wins in Parts Supply and Integrated Solutions Investment in attractive assets for Parts Supply, especially Engine Parts New / enhanced capabilities in MRO Adherence to strategic filters and financial criteria Focused on expanding contractual revenue Increase intellectual property in portfolio Maintain dividend of $0.075 per share per quarter Initiated $250M Share Repurchase Program in July 2017; repurchased $23.4M Remaining authorization of $226.6M Maintain Flexible Balance Sheet Organic Investment to Drive Growth Opportunistic Acquisitions Return to Shareholders Capital Allocation Framework
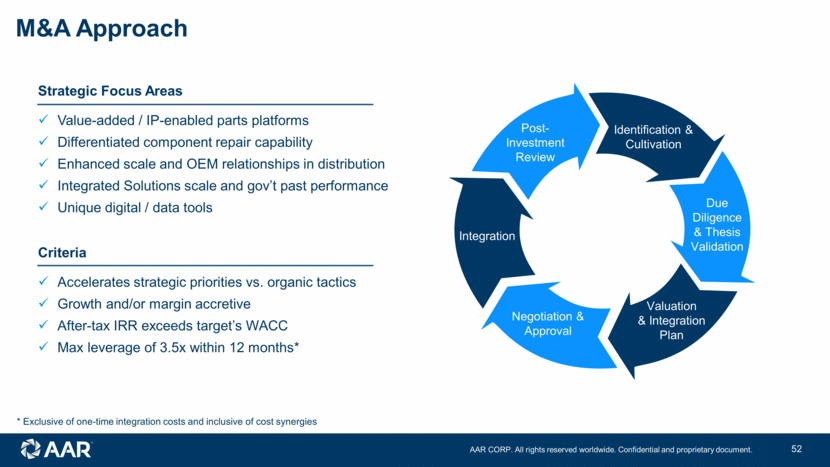
M&A Approach Strategic Focus Areas Value-added / IP-enabled parts platforms Differentiated component repair capability Enhanced scale and OEM relationships in distribution Integrated Solutions scale and gov’t past performance Unique digital / data tools Criteria Accelerates strategic priorities vs. organic tactics Growth and/or margin accretive After-tax IRR exceeds target’s WACC Max leverage of 3.5x within 12 months* Due Diligence Valuation & Integration Plan Negotiation & Approval Integration Post-Investment Review Due Diligence & Thesis Validation Identification & Cultivation * Exclusive of one-time integration costs and inclusive of cost synergies
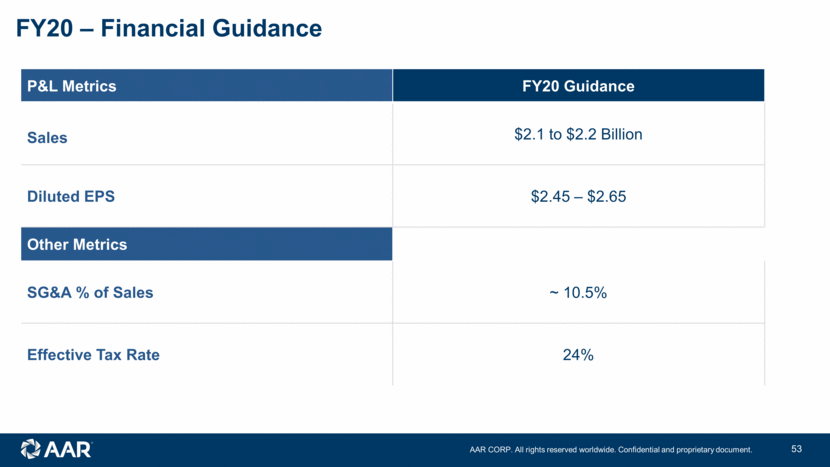
FY20 – Financial Guidance P&L Metrics FY20 Guidance Sales $2.1 to $2.2 Billion Diluted EPS $2.45 – $2.65 Other Metrics SG&A % of Sales ~ 10.5% Effective Tax Rate 24%
Closing Comments John Holmes

Summary End markets healthy and growing Unique combination of integrated aftermarket offerings $10.2B business development pipeline Talented and motivated leadership team Strong balance sheet Continuing to execute on strategy to drive margins and scale Leading Independent Aviation Services Provider Globally
Appendix

Non-GAAP Financial Measures Adjusted operating income, adjusted diluted earnings per share from continuing operations, adjusted return on invested capital, adjusted EBITDA, and net debt are “non-GAAP financial measures” as defined in Regulation G of the Securities Exchange Act of 1934, as amended (the “Exchange Act”). We believe these non-GAAP financial measures are relevant and useful for investors as they provide a better understanding of our actual operating performance unaffected by the impact of certain items. When reviewed in conjunction with our GAAP results and the accompanying reconciliations, we believe these non-GAAP financial measures provide additional information that is useful to gain an understanding of the factors and trends affecting our business and provide a means by which to compare our operating performance against that of other companies in the industries we compete. These non-GAAP measures should be considered as a supplement to, and not as a substitute for, or superior to, the corresponding measures calculated in accordance with GAAP. Adjusted EBITDA is income from continuing operations before interest income (expense), other income (expense), income taxes, depreciation and amortization, stock-based compensation and other items of an unusual nature. These non-GAAP measures exclude items of an unusual nature including but not limited to certain income tax benefits, severance, restructuring costs, facility repositioning costs impairment charges, and significant customer bankruptcies. Pursuant to the requirements of Regulation G of the Exchange Act, we are providing the following tables that reconcile the above mentioned non-GAAP financial measures to the most directly comparable GAAP financial measures:
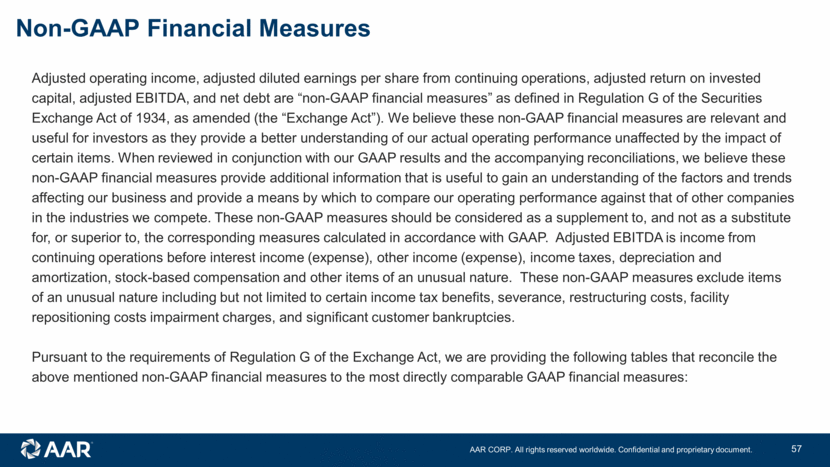
Non-GAAP Financial Measures Adjusted Diluted EPS from Continuing Operations FY2016 FY2017 FY2018 FY2019 Diluted EPS from continuing operations 1.30 $ 1.51 $ 2.11 $ 2.40 $ Deferred tax re-measurement from Tax Reform - - (0.41) - State income tax benefit - - (0.06) (0.15) Recognition of previously reserved income tax benefits - - - (0.19) Other income tax benefits (0.07) - - - Customer bankruptcy charge, net of tax - - - 0.27 Gain on asset disposal, net of tax - (0.08) - - Facility repositioning and impairment costs, net of tax 0.02 - - 0.02 Severance and restructuring charges, net of tax 0.02 0.02 0.09 0.01 Adjusted Diluted EPS from Continuing Operations 1.27 1.45 1.73 2.36 Adjusted Return on Invested Capital FY2016 FY2017 FY2018 FY2019 (in millions) Operating income 75.5 $ 82.3 $ 86.0 $ 98.3 $ Customer bankruptcy charge - - - 12.4 Gain on asset disposal - (2.6) - - Facility repositioning and impairment costs 1.0 - - 0.9 Severance and restructuring charges 1.3 0.8 4.5 0.2 Adjusted operating income 77.8 80.5 90.5 111.8 Invested capital 739.0 851.0 983.0 1,023.0 Adjusted return on invested capital 10.5% 9.5% 9.2% 10.9%
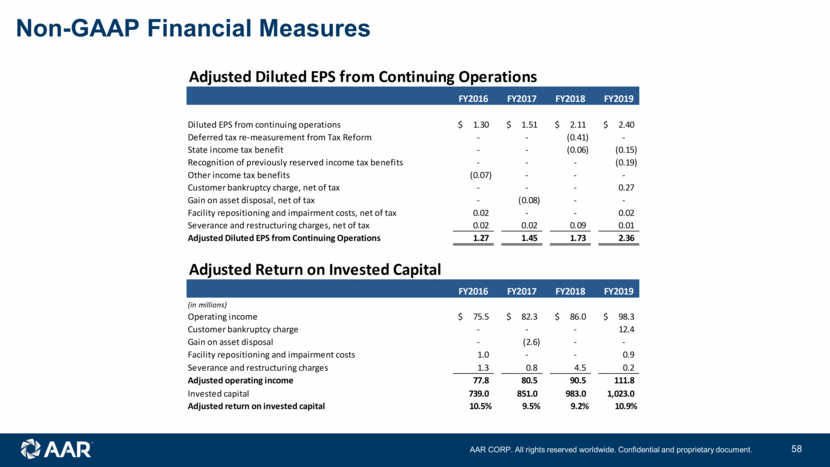
Non-GAAP Financial Measures (Cont’d) Adjusted EBITDA FY2019 (in millions) Net income 7.5 $ Loss from discontinued operations 76.6 Income tax expense 4.9 Other expense, net 0.8 Interest expense, net 8.5 Depreciation and intangible amortization 42.8 Customer bankruptcy charge 12.4 Severance charges 0.2 Facility repositioning costs 0.9 Stock-based compensation 13.5 Adjusted EBITDA 168.1 Net Debt to Adjusted EBITDA 5/31/2019 (in millions) Total debt 142.9 $ Less: Cash and cash equivalents (21.3) Net debt 121.6 Adjusted EBITDA for fiscal 2019 168.1 Net debt to adjusted EBITDA 0.72
Serious News for Serious Traders! Try StreetInsider.com Premium Free!
You May Also Be Interested In
- Form 8.5 (EPT/RI) - Accrol Group Holdings Plc
- Company announcement no 8 Idavang 2024 Annual General Meeting 26-04-2024
- GXO helps Virgin Media O2 cut single use plastic
Create E-mail Alert Related Categories
SEC FilingsSign up for StreetInsider Free!
Receive full access to all new and archived articles, unlimited portfolio tracking, e-mail alerts, custom newswires and RSS feeds - and more!


 Tweet
Tweet Share
Share
