

Form 6-K WESTPAC BANKING CORP For: Nov 07
 Tweet
Tweet Share
Share
UNITED STATES
SECURITIES AND EXCHANGE COMMISSION
Washington, DC 20549
FORM 6-K
REPORT OF FOREIGN PRIVATE ISSUER PURSUANT TO RULE 13a-16 OR 15d-16 UNDER THE SECURITIES EXCHANGE ACT OF 1934
November 7, 2018
Commission File Number 1-10167
WESTPAC BANKING CORPORATION
(Translation of registrant’s name into English)
275 KENT STREET, SYDNEY, NEW SOUTH WALES 2000, AUSTRALIA
(Address of principal executive office)
Indicate by check mark whether the registrant files or will file annual reports under cover of Form 20-F or Form 40-F.
Form 20-F ____x_____ Form 40-F __________
Indicate by check mark if the registrant is submitting the Form 6-K in paper as permitted by Regulation S-T Rule 101(b)(1): __________
Indicate by check mark if the registrant is submitting the Form 6-K in paper as permitted by Regulation S-T Rule 101(b)(7): ___________
Index to Exhibits
|
Exhibit |
|
Description |
|
|
|
|
|
1 |
|
Westpac Group 2018 Full Year Financial Results - Incorporating the requirements of Appendix 4E |
|
2 |
|
Westpac Group 2018 Full Year Financial Results – Presentation & Investor Discussion Pack |
|
3 |
|
Westpac 2018 Full Year Dividend Details |
SIGNATURES
Pursuant to the requirements of the Securities Exchange Act of 1934, the registrant has duly caused this report to be signed on its behalf by the undersigned, thereunto duly authorized.
|
|
WESTPAC BANKING CORPORATION |
| ||
|
|
(Registrant) |
| ||
|
|
| |||
|
|
| |||
|
Date: November 7, 2018 |
By: |
/s/ Sean Crellin |
| |
|
|
|
Sean Crellin |
| |
|
|
|
Director – Corporate, Legal and Secretariat |
| |
2018 Full Year Financial Results Incorporating the requirements of Appendix 4E Proudly Supporting Australia Westpac Banking Corporation ABN 33 007 457 141

Results announcement to the market ASX Appendix 4E Results for announcement to the market1 Report for the full year ended 30 September 20182 13 November 2018 (New York) 1 This document comprises the Westpac Group 2018 Full Year Financial Results, and is provided to the Australian Securities Exchange under Listing Rule 4.3A. 2 This report should be read in conjunction with the 2018 Westpac Group Annual Report and any public announcements made in the period by the Westpac Group in accordance with the continuous disclosure requirements of the Corporations Act 2001 and ASX Listing Rules. 3 Comprises reported interest income, interest expense and non-interest income. 4 All comparisons are with the reported results for the twelve months ended 30 September 2017. ii | Westpac Group 2018 Full Year Financial Results Announcement Revenue from ordinary activities3,4 ($m)up2%to$22,133 Profit from ordinary activities after tax attributable to equity holders4 ($m)up1%to$8,095 Net profit for the period attributable to equity holders4 ($m)up1%to$8,095 Dividend Distributions (cents per ordinary share) Amount per security Franked amount per security Final Dividend Interim Dividend 94 94 94 94 Record date for determining entitlements to the dividend 14 November 2018 (Sydney)

Results announcement to the market Media Release 5 November 2018 Westpac announces 2018 Full Year Results Financial highlights Full Year 2018 compared to Full Year 20171 Westpac Group CEO, Mr Brian Hartzer said, “In a difficult year, Westpac delivered a flat financial result. “While the economic environment remains supportive, this result reflects the tough operating conditions for banks, with higher regulatory, compliance, and funding costs, and increased competitive pressure, particularly in the second half. In addition, provisions for customer refunds and related costs, along with legal costs, were $281 million after tax (equivalent to 3.5% of cash earnings) as we continued to work through regulatory investigations, remediations, and putting things right for customers. “In response to these challenges, we’ve lifted productivity savings 16% to $304 million over the year. “While earnings were flat, our balance sheet remains strong across all dimensions of asset quality, capital, and liquidity. We have also made substantial progress on our service-led strategy and digital transformation program. “Westpac’s mortgage book remains fundamentally sound, with around 70% of Australian customers ahead on repayments2 and 90 day delinquencies remaining low. “Results for the Business Bank and New Zealand divisions were the standout. The Business Bank delivered cash earnings growth of 8% supported by good growth in the small business sector and declining impairment charges. New Zealand’s result benefited from the completion of a two-year restructuring program, with cash earnings up 5% (NZD). WIB maintained good discipline on margin and costs, but cash earnings were down 6% mainly due to lower markets income. “Elsewhere, conditions were more difficult. Provisions for customer refunds were higher for BT Financial Group, and the Consumer division experienced both increased funding costs and higher remediation costs. 1 Reported throughout this release on a cash earnings basis unless otherwise stated. For an explanation of cash earnings and reconciliation to reported results refer to pages 4-6 and 125-128 of the Group’s 2018 Full Year Financial Results Announcement. 2 Including offset balances. Westpac Group 2018 Full Year Financial Results Announcement | iii Statutory net profit $8,095 million, up 1% Cash earnings $8,065 million, little changed Cash earnings per share, 236.2 cents, down 1% Cash return on equity (ROE) 13.0%, at the lower end of the range Westpac is seeking to achieve Unchanged, final, fully franked dividend of 94 cents per share (cps), (full year, fully franked dividend of 188 cps) Common equity Tier 1 capital ratio 10.6%, above APRA’s unquestionably strong benchmark Bank Levy $378 million (pre-tax), effective tax rate including Bank Levy 33%

Results announcement to the market “Out of a total investment spend of $1.4 billion, we invested more than $800 million in system upgrades, digital transformation, and innovation to support our ambition to be one of the world’s great service companies. Our focus has been on delivering our technology platforms, while simplifying and automating processes to make banking easier for customers. We have already migrated 100 applications onto our cloud infrastructure platforms which are now largely complete. Additionally we have over 120 APIs in production and another 180 in development. “These capabilities support our Customer Service Hub which is progressing to schedule. While delivering these major projects, we have also significantly improved system reliability and response times, helping our people to provide better service to customers. “We have introduced a number of new digital initiatives including Siri for Westpac, mobile cheque deposits, new online home loan applications, and E-Sign which allows a customer to complete a mortgage application online or via their mobile. Consumer payment innovations include partnerships with Google Pay, Garmin, Fit Bit, and Beem It—a mobile payment app which enables free and instant payments for anyone in Australia with a debit card, regardless of whom they bank with. “Strategic investments in companies including Assembly Payments, Zip, Uno, and Open Agent, as well as Reinventure’s growing portfolio of Fintech startups, position Westpac to harness the benefits of data and rapid technological change while bringing new value-added services to our customers,” Mr Hartzer said. Royal Commission Mr Hartzer said Westpac continues to focus on addressing issues that have been highlighted during the Royal Commission into Misconduct in the Banking, Superannuation, and Financial Services Industry. “We remain committed to getting things right for our customers and have made good progress on implementing the ABA’s Six Point Plan. We have reinforced our values and service culture to all employees through additional training, introduced the Sedgwick remuneration recommendations for employees two years earlier than required, removed grandfathered commission payments for our salaried financial planners, and launched a simpler and more transparent pricing structure for BT’s investment platform, Panorama. “Importantly, our new Customer and Corporate Relations division has been established to oversee complaints handling across the Group, and to improve the way we deal with customer issues, building on the important role of our Customer Advocate,” Mr Hartzer said. Results iv | Westpac Group 2018 Full Year Financial Results Announcement Margin management Net interest margin (NIM) (%) Net interest margin up 2bps over the year A rise in Treasury & Markets income contributed 1bp to NIM, and margins excluding Treasury & Markets also increased 1bp Higher lending and deposit spreads were largely offset by the full period impact of the Bank Levy Strong balance sheet CET1 capital ratio (%) 10.6% CET1 capital ratio, above APRA’s ‘unquestionably strong’ benchmark Liquidity ratios above regulatory minimums of 100%: -Liquidity coverage ratio 133% -Net stable funding ratio 114%

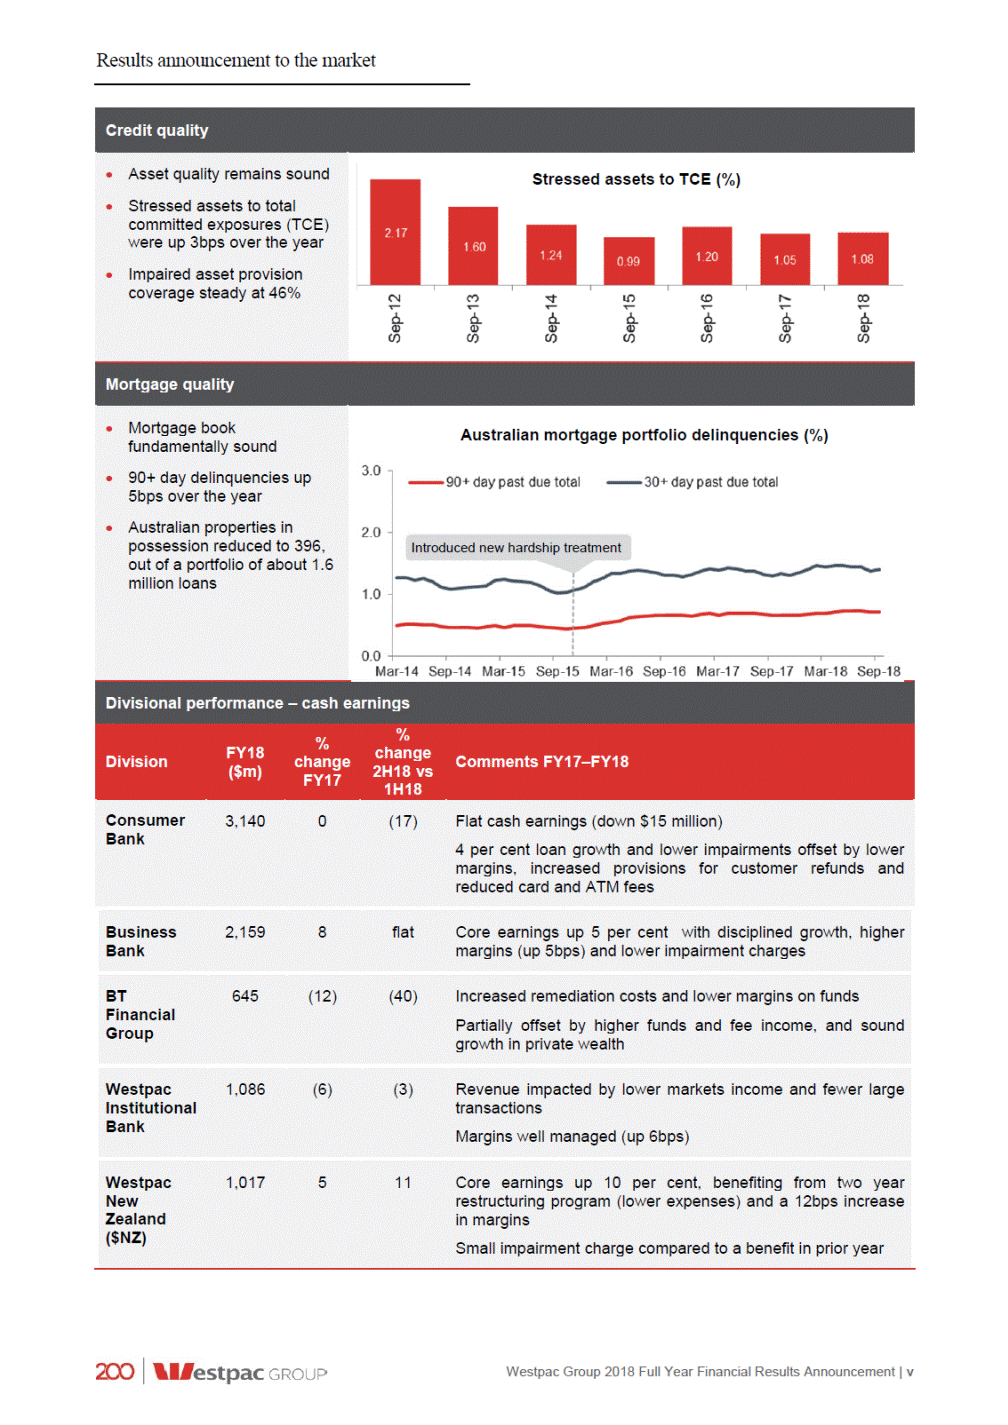
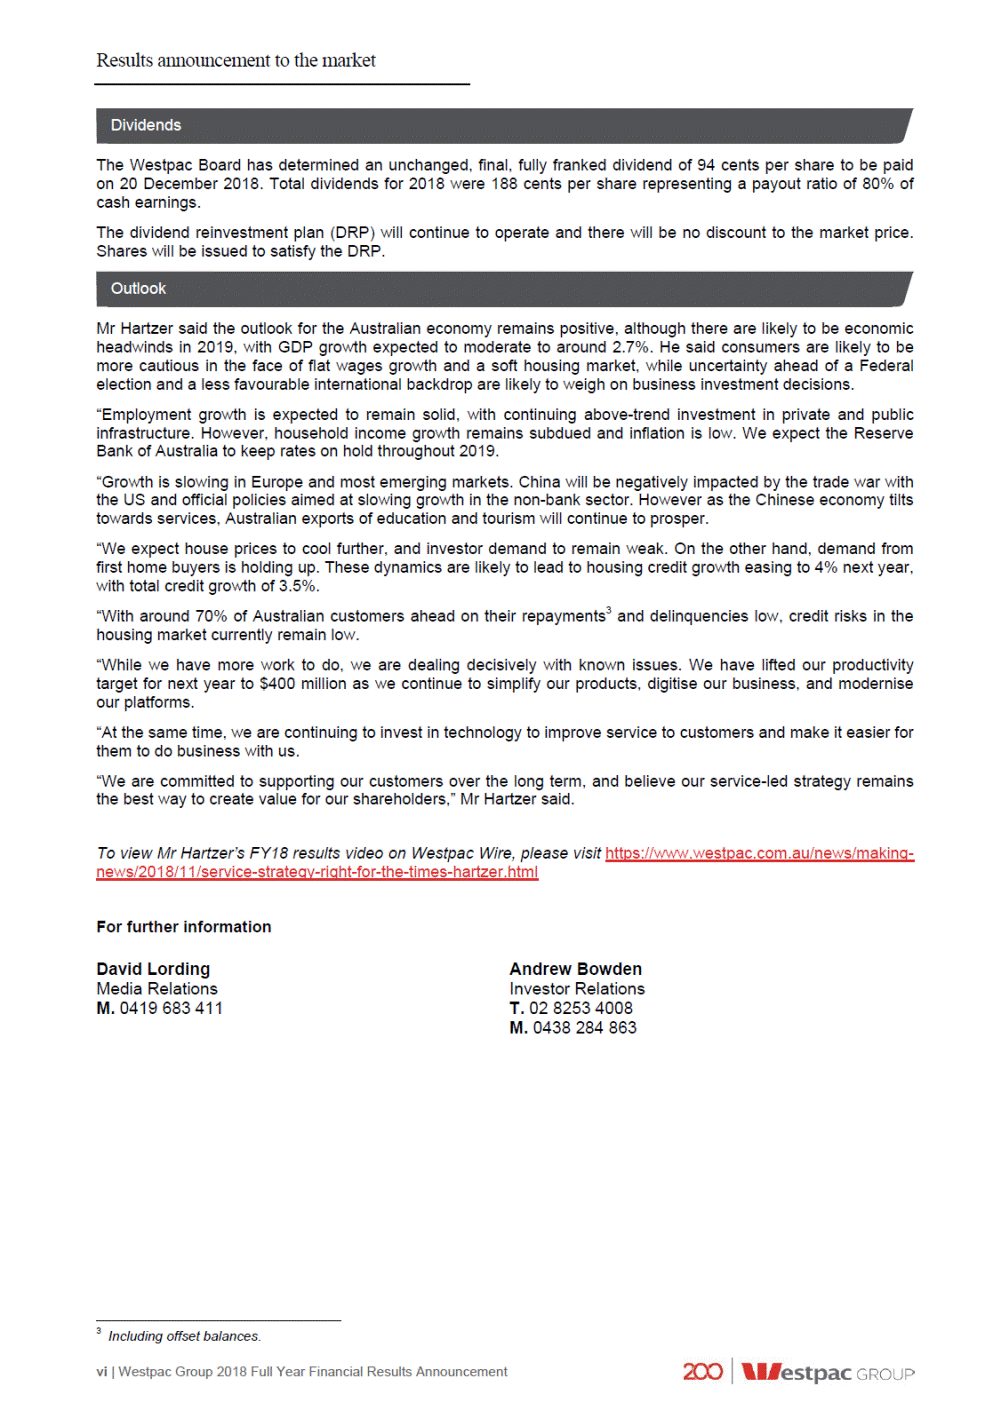
Results announcement to the market 1H18 growth in private wealth Westpac Group 2018 Full Year Financial Results Announcement | v Credit quality Asset quality remains sound Stressed assets to total committed exposures (TCE) were up 3bps over the year Impaired asset provision coverage steady at 46% Stressed assets to TCE (%) Mortgage quality Mortgage book fundamentally sound 90+ day delinquencies up 5bps over the year Australian properties in possession reduced to 396, out of a portfolio of about 1.6 million loans Australian mortgage portfolio delinquencies (%) Introduced new hardship treatment Divisional performance – cash earnings Division FY18 ($m) % change FY17 % change 2H18 vs Comments FY17–FY18 Consumer Bank 3,140 0 (17) Flat cash earnings (down $15 million) 4 per cent loan growth and lower impairments offset by lower margins, increased provisions for customer refunds and reduced card and ATM fees Business Bank 2,159 8 flat Core earnings up 5 per cent with disciplined growth, higher margins (up 5bps) and lower impairment charges BT Financial Group 645 (12) (40) Increased remediation costs and lower margins on funds Partially offset by higher funds and fee income, and sound Westpac Institutional Bank 1,086 (6) (3) Revenue impacted by lower markets income and fewer large transactions Margins well managed (up 6bps) Westpac New Zealand ($NZ) 1,017 5 11 Core earnings up 10 per cent, benefiting from two year restructuring program (lower expenses) and a 12bps increase in margins Small impairment charge compared to a benefit in prior year
Results announcement to the market The Westpac Board has determined an unchanged, final, fully franked dividend of 94 cents per share to be paid on 20 December 2018. Total dividends for 2018 were 188 cents per share representing a payout ratio of 80% of cash earnings. The dividend reinvestment plan (DRP) will continue to operate and there will be no discount to the market price. Shares will be issued to satisfy the DRP. Mr Hartzer said the outlook for the Australian economy remains positive, although there are likely to be economic headwinds in 2019, with GDP growth expected to moderate to around 2.7%. He said consumers are likely to be more cautious in the face of flat wages growth and a soft housing market, while uncertainty ahead of a Federal election and a less favourable international backdrop are likely to weigh on business investment decisions. “Employment growth is expected to remain solid, with continuing above-trend investment in private and public infrastructure. However, household income growth remains subdued and inflation is low. We expect the Reserve Bank of Australia to keep rates on hold throughout 2019. “Growth is slowing in Europe and most emerging markets. China will be negatively impacted by the trade war with the US and official policies aimed at slowing growth in the non-bank sector. However as the Chinese economy tilts towards services, Australian exports of education and tourism will continue to prosper. “We expect house prices to cool further, and investor demand to remain weak. On the other hand, demand from first home buyers is holding up. These dynamics are likely to lead to housing credit growth easing to 4% next year, with total credit growth of 3.5%. “With around 70% of Australian customers ahead on their repayments3 and delinquencies low, credit risks in the housing market currently remain low. “While we have more work to do, we are dealing decisively with known issues. We have lifted our productivity target for next year to $400 million as we continue to simplify our products, digitise our business, and modernise our platforms. “At the same time, we are continuing to invest in technology to improve service to customers and make it easier for them to do business with us. “We are committed to supporting our customers over the long term, and believe our service-led strategy remains the best way to create value for our shareholders,” Mr Hartzer said. To view Mr Hartzer’s FY18 results video on Westpac Wire, please visit https://www.westpac.com.au/news/making-news/2018/11/service-strategy-right-for-the-times-hartzer.html For further information David Lording Media Relations M. 0419 683 411 Andrew Bowden Investor Relations T. 02 8253 4008 M. 0438 284 863 3 Including offset balances. vi | Westpac Group 2018 Full Year Financial Results Announcement Outlook Dividends
Results announcement to the market Index 01 Group results 2 2 3 4 7 1.1 1.2 1.3 1.4 Reported results Key financial information Cash earnings results Market share and system multiple metrics 02 Review of Group operations 8 9 18 33 35 40 46 2.1 2.2 2.3 2.4 2.5 2.6 Performance overview Review of earnings Credit quality Balance sheet and funding Capital and dividends Sustainability performance 03 Divisional results 49 49 52 54 59 62 64 3.1 3.2 3.3 3.4 3.5 3.6 Consumer Bank Business Bank BT Financial Group (Australia) Westpac Institutional Bank Westpac New Zealand Group Businesses 04 2018 Full Year financial report 66 67 80 81 82 83 85 86 116 4.1 4.2 4.3 4.4 4.5 4.6 4.7 4.8 Significant developments Consolidated income statement Consolidated statement of comprehensive income Consolidated balance sheet Consolidated statement of changes in equity Consolidated cash flow statement Notes to the consolidated financial statements Statement in relation to audit of the financial statements 05 Cash earnings financial information 117 06 Other information 130 130 131 131 131 131 133 138 6.1 6.2 6.3 6.4 6.5 6.6 6.7 Disclosure regarding forward-looking statements References to websites Credit ratings Dividend reinvestment plan Changes in control of Group entities Financial calendar and Share Registry details Exchange rates 07 Glossary 140 In this announcement references to ‘Westpac’, ‘WBC’, ‘Westpac Group’, ‘the Group’, ‘we’, ‘us’ and ‘our’ are to Westpac Banking Corporation and its controlled entities, unless it clearly means just Westpac Banking Corporation. All references to $ in this document are to Australian dollars unless otherwise stated. Financial calendar Final results announcement Ex-dividend date for final dividend Record date for final dividend (Sydney) Final dividend payable 5 November 2018 13 November 2018 14 November 2018 20 December 2018 Westpac Group 2018 Full Year Financial Results Announcement | 1

2018 Full Year financial results Group results 1.0 1.1 Group results Reported results Reported net profit attributable to owners of Westpac Banking Corporation is prepared in accordance with the requirements of Australian Accounting Standards (AAS) and regulations applicable to Australian Authorised Deposit-taking Institutions (ADIs). Net profit attributable to owners of Westpac Banking Corporation for Full Year 2018 was $8,095 million, an increase of $105 million or 1% compared to Full Year 2017. Features of this result included a $331 million or 2% increase in net operating income before operating expenses and impairment charges, a $258 million or 3% increase in operating expenses and a $143 million or 17% decrease in impairment charges. Net interest income increased $989 million or 6% compared to Full Year 2017, with total loan growth of 4%, mostly from Australian housing which grew 4%. Reported net interest margin increased 7 basis points to 2.13%, reflecting increased spreads on certain Australian mortgages, a rise in Treasury income and contribution from fair value gains on economic hedges and higher deposit spreads. These increases were partly offset by the full period impact of the Bank Levy which was effective from July 2017. Wholesale funding costs were little changed, as short term funding costs increased while long term funding costs decreased. Net interest income, loans, deposits and other borrowings and net interest margins are discussed further in Sections 2.2.1 to 2.2.4. Non-interest income decreased $658 million or 10% compared to Full Year 2017 primarily due to a decrease in trading income of $257 million, the non-repeat of a large gain of $279 million on disposal of an associate in Full Year 2017 (BTIM)2, a revaluation loss of $104 million on the Pendal investment in Full Year 2018, and additional provisions for estimated customer refunds and payments recorded as negative income. These items were partly offset by income related to the exit of the Hastings business ($135 million). Non-interest income is discussed further in Section 2.2.5. Operating expenses increased $258 million or 3% compared to Full Year 2017. The rise included annual salary increases, higher technology expenses related to the Group’s investment program, and an increase in regulatory and compliance costs and costs associated with the exit of the Hastings business. These increases were partly offset by productivity benefits and lower amortisation of intangibles. Operating expenses are discussed further in Section 2.2.8. Impairment charges were $143 million or 17% lower compared to Full Year 2017. Asset quality remained sound, with stressed exposures as a percentage of total committed exposures at 1.08%, up 3 basis points over the year. The decrease in impairment charges was primarily due to reduced individual provisions for larger facilities. Impairment charges are discussed further in Section 2.2.9. The effective tax rate of 31.0% was higher than the Full Year 2017 effective tax rate of 30.6% mostly related to an increase in non-deductible expenses. Income tax expense is discussed further in Section 2.2.10. 1 Percentage movement represents an increase / (decrease) to the relevant comparative period. 2 Pendal Group Limited (Pendal) was previously called BT Investment Management (BTIM). 2 | Westpac Group 2018 Full Year Financial Results Announcement $m % Mov't1 Half YearSept 18 - March 18Mar 18 % Mov't1 Full YearSept 18 - Sept 17Sept 17 Half Year Full Year Sept 18 Sept 18 Net interest income Non-interest income Net operating income before operating expenses and impairment charges Operating expenses Net profit before impairment charges and income tax expense Impairment charges Profit before income tax Income tax expense Net profit for the period Net profit attributable to non-controlling interests Net profit attributable to owners of Westpac Banking Corporation 8,227 2,753 8,278(1) 2,875(4) 16,505 5,628 15,5166 6,286(10) 10,980 (4,967) 11,153(2) (4,725)5 22,133 (9,692) 21,8022 (9,434)3 6,013 (317) 6,428(6) (393)(19) 12,441 (710) 12,3681 (853)(17) 5,696 (1,797) 6,035(6) (1,835)(2) 11,731 (3,632) 11,5152 (3,518)3 3,899 (2) 4,200(7) (2)-8,099 (4) 7,9971 (7)(43) 3,897 4,198(7) 8,095 7,9901
2018 Full Year financial results Group results 1.2 Key financial information 238.0 3,355 188 13.65% 58,556 58,576 14.66 - 2 - (60bps) 6 6 5 1.89% 6bps 0.17% 2.06% 752,294 43.27% 1bps 7bps 3 52bps 10.56% 16.20% 349,258 404,235 124% 109% 7bps (6bps) 4 5 large large 0.22% 2.39% (2bps) (30bps) 46.30% 1,005,882 1.05% 45bps 0.62% 1.57% 76bps (18bps) 3 3bps (2bps) 5bps 7bps (3bps) 684,919 851,875 533,591 790,533 61,342 4 3 5 3 5 208.4 1,068 4 20 508 (1) 1 Weighted average number of fully paid ordinary shares listed on the ASX for the relevant period less average Westpac shares held by the Group (“Treasury shares”). 2 Refer Glossary for definition. 3 The NSFR was effective from 1 January 2018 for Australian Authorised Deposit-taking Institutions (ADIs). Full Year September 2017 is presented on a proforma basis. 4 Spot balances. 5 Averages are based on six months for the halves and twelve months for the full year. Westpac Group 2018 Full Year Financial Results Announcement | 3 % Mov't Half Year Sept 18 - March 18 Mar 18 % Mov't Full Year Sept 18 - Sept 17Sept 17 Half Year Full Year Sept 18 Sept 18 Shareholder value Earnings per ordinary share (cents) Weighted average ordinary shares (millions)1 Fully franked dividends per ordinary share (cents) Return on average ordinary equity Average ordinary equity ($m) Average total equity ($m) Net tangible asset per ordinary share ($) Business performance Interest spread Benefit of net non-interest bearing assets, liabilities and equity Net interest margin Average interest-earning assets ($m) Expense to income ratio Capital, funding and liquidity Common equity Tier 1 capital ratio - APRA Basel III - Internationally comparable2 Credit risk weighted assets (credit RWA) ($m) Total risk weighted assets (RWA) ($m) Liquidity coverage ratio (LCR) Net stable funding ratio (NSFR)3 Asset quality Gross impaired assets to gross loans Gross impaired assets to equity and total provisions Gross impaired asset provisions to gross impaired assets Total committed exposures (TCE) ($m) Total stressed exposures as a % of TCE Total provisions to gross loans Mortgages 90+ day delinquencies Other consumer loans 90+ day delinquencies Collectively assessed provisions to credit RWA Balance sheet ($m)4 Loans Total assets Deposits and other borrowings Total liabilities Total equity Wealth Management Average Group funds ($bn)5 Life insurance in-force premiums (Australia) ($m) General insurance gross written premiums (Australia) ($m) 123.7(8) 3,3921 94-13.79%(145bps) 61,0513 61,0653 15.003 2.00%(8bps) 0.16%2bps 2.16%(6bps) 767,0112 42.37%287bps 10.50%13bps 16.13%1bps 361,391-415,7442 134%(131bps) 112%135bps 0.22%(2bps) 2.33%(24bps) 45.54%58bps 1,023,0171 1.09%(1bps) 45bps(2bps) 0.65%2bps 1.64%-75bps(2bps) 701,3931 871,8551 547,7362 809,1901 62,6653 217.3-1,276-251-113.8 237.5 3,421 3,406 94 188 12.34% 13.05% 62,978 62,017 63,026 62,048 15.39 15.39 1.92% 1.95% 0.18% 0.18% 2.10% 2.13% 782,834 774,944 45.24% 43.79% 10.63% 10.63% 16.14% 16.14% 362,749 362,749 425,384 425,384 133% 133% 114% 114% 0.20% 0.20% 2.09% 2.09% 46.12% 46.12% 1,038,006 1,038,006 1.08% 1.08% 43bps 43bps 0.67% 0.67% 1.64% 1.64% 73bps 73bps 709,690 709,690 879,592 879,592 559,285 559,285 815,019 815,019 64,573 64,573 217.3 1,277 217.3 1,277 252 503

2018 Full Year financial results Group results 1.3 Cash earnings results Throughout this results announcement, reporting and commentary of financial performance will refer to ‘cash earnings results’, unless otherwise stated. Section 4 is prepared on a reported basis. A reconciliation of cash earnings to reported results is set out in Section 5, Note 8. 1.3.1 Key financial information – cash earnings basis1 78.71% 123bps 1 Averages are based on six months for the halves and twelve months for the full year. 2 Refer to Section 5, Note 9 for further details. 3 Weighted average ordinary shares – cash earnings represents the weighted average number of fully paid ordinary shares listed on the ASX for the relevant period. 4 The dividend payout ratio for 1H18 was based on the number of shares on issue as at 31 March. On 3 April 2018, some CPS converted into ordinary shares. Inclusion of these shares would have resulted in a dividend payout ratio of 75.70%. 5 Average tangible ordinary equity is calculated as average equity less intangible assets (excluding capitalised software). 4 | Westpac Group 2018 Full Year Financial Results Announcement $m % Mov't Half Year Sept 18 - March 18 Mar 18 % Mov't Full YearSept 18 - Sept 17Sept 17 Half Year Full Year Sept 18 Sept 18 Shareholder value Cash earnings per ordinary share (cents) Economic profit ($m)2 Weighted average ordinary shares (millions)3 Dividend payout ratio4 Cash earnings on average ordinary equity (ROE) Cash earnings on average tangible ordinary equity (ROTE) Average ordinary equity ($m) Average tangible ordinary equity ($m)5 Business performance Interest spread Benefit of net non-interest bearing assets, liabilities and equity Net interest margin Average interest-earning assets ($m) Expense to income ratio Full time equivalent employees (FTE) Revenue per FTE ($ '000's) Effective tax rate Impairment charges Impairment charges to average loans annualised Net write-offs to average loans annualised 111.2 1,395 3,429 84.66% 12.08% 14.27% 62,978 53,327 1.87% 0.18% 2.05% 782,834 45.67% 35,029 305 31.26% 9bps 14bps 125.0(11) 2,049(32) 3,4001 75.28%large 13.96%(188bps) 16.60%(233bps) 61,0513 51,3444 2.00%(13bps) 0.17%1bps 2.17%(12bps) 767,0112 41.74%393bps 35,720(2) 315(3) 30.32%94bps 11bps(2bps) 13bps1bps 236.2 3,444 3,414 79.94% 13.00% 15.41% 62,017 52,338 1.94% 0.17% 2.11% 774,944 43.67% 35,029 620 30.77% 10bps 14bps 239.7(1) 3,774(9) 3,3641 13.77%(77bps) 16.55%(114bps) 58,5566 48,7257 1.91%3bps 0.18%(1bps) 2.09%2bps 752,2943 42.24%143bps 35,096-6131 30.43%34bps 13bps(3bps) 22bps(8bps) $m % Mov't Half Year Sept 18 - March 18 Mar 18 % Mov't Full YearSept 18 - Sept 17Sept 17 Half Year Full Year Sept 18 Sept 18 Net interest income Non-interest income Net operating income Operating expenses Core earnings Impairment charges Operating profit before income tax Income tax expense Net profit Net profit attributable to non-controlling interests Cash earnings 8,038 2,762 8,301(3) 2,850(3) 16,339 5,612 15,7044 5,852(4) 10,800 (4,932) 11,151(3) (4,654)6 21,951 (9,586) 21,5562 (9,105)5 5,868 (317) 6,497(10) (393)(19) 12,365 (710) 12,451(1) (853)(17) 5,551 (1,735) 6,104(9) (1,851)(6) 11,655 (3,586) 11,598-(3,529)2 3,816 (2) 4,253(10) (2)-8,069 (4) 8,069-(7)(43) 3,814 4,251(10) 8,065 8,062-

2018 Full Year financial results Group results Cash earnings policy In assessing financial performance, including divisional results, Westpac Group uses a measure of performance referred to as ‘cash earnings’. Cash earnings is viewed as a measure of the level of profit that is generated by ongoing operations and is therefore considered in assessing distributions, including dividends. Cash earnings is neither a measure of cash flow nor net profit determined on a cash accounting basis, as it includes both cash and non-cash adjustments to statutory net profit. Management believes this allows the Group to more effectively assess performance for the current period against prior periods and to compare performance across business divisions and across peer companies. To determine cash earnings, three categories of adjustments are made to reported results: Material items that key decision makers at the Westpac Group believe do not reflect ongoing operations; Items that are not considered when dividends are recommended, such as the amortisation of intangibles, impact of Treasury shares and economic hedging; and Accounting reclassifications between individual line items that do not impact reported results. A full reconciliation of reported results to cash earnings is set out in Section 5, Note 8. Reconciliation of reported results to cash earnings 7,990 137 69 16 (171) 21 1 (88) large (19) large large Outlined below are the cash earnings adjustments to the reported result: Amortisation of intangible assets: Identifiable intangible assets arising from business acquisitions are amortised over their useful lives, ranging between four and twenty years. This amortisation (excluding capitalised software) is a cash earnings adjustment because it is a non-cash flow item and does not affect cash distributions available to shareholders. The last of these intangible assets were fully amortised in December 2017; Fair value on economic hedges (which do not qualify for hedge accounting under AAS) comprise: - The unrealised fair value (gain)/loss on foreign exchange hedges of future New Zealand earnings impacting non-interest income is reversed in deriving cash earnings as they may create a material timing difference on reported results but do not affect the Group’s cash earnings over the life of the hedge; and - The unrealised fair value (gain)/loss on hedges of accrual accounted term funding transactions are reversed in deriving cash earnings as they may create a material timing difference on reported results but do not affect the Group’s cash earnings over the life of the hedge. Ineffective hedges: The unrealised (gain)/loss on ineffective hedges is reversed in deriving cash earnings because the gain or loss arising from the fair value movement in these hedges reverses over time and does not affect the Group’s profits over time; Westpac Group 2018 Full Year Financial Results Announcement | 5 $m % Mov't Half Year Sept 18 - March 18 Mar 18 % Mov't Full YearSept 18 - Sept 17Sept 17 Half Year Full Year Sept 18 Sept 18 NET PROFIT ATTRIBUTABLE TO OWNERS OF WESTPAC BANKING CORPORATION Amortisation of intangible assets Fair value (gain)/loss on economic hedges Ineffective hedges Adjustments related to Pendal (previously BTIM) Treasury shares Total cash earnings adjustments (post-tax) Cash earnings 4,198(7) 17(100) 37large 9(56) --(10)large 3,897 - (163) 4 73 3 8,095 17 (126) 13 73 (7) (83) 53large (30) 72large 3,814 4,251(10) 8,065 8,062-

2018 Full Year financial results Group results Adjustments related to Pendal (previously BTIM): The Group recognised a gain, net of costs, associated with the partial sale of shares in Pendal Group Limited in Full Year 2017. In Full Year 2018, the Group marked to market its current holding of Pendal shares. Consistent with prior years, these items have been treated as a cash earnings adjustment given their size and that it does not reflect ongoing operations. The Group has indicated that it may sell the remaining 10% shareholding in Pendal at some future date. Any future gain or loss on this shareholding will similarly be excluded from the calculation of cash earnings; Treasury shares: Under AAS, Westpac shares held by the Group in the managed funds and life businesses are deemed to be Treasury shares and the results of holding these shares cannot be recognised in the reported results. In deriving cash earnings, these results are included to ensure there is no asymmetrical impact on the Group’s profits because the Treasury shares support policyholder liabilities and equity derivative transactions which are re-valued in determining income; and Accounting reclassifications between individual line items that do not impact reported results comprise: - Policyholder tax recoveries: Income and tax amounts that are grossed up to comply with the AAS covering Life Insurance Business (policyholder tax recoveries) are reversed in deriving income and taxation expense on a cash earnings basis; and - Operating leases: Under AAS rental income on operating leases is presented gross of the depreciation of the assets subject to the lease. These amounts are offset in deriving non-interest income and operating expenses on a cash earnings basis. The guidance provided in Australian Securities and Investments Commission (ASIC) Regulatory Guide 230 has been followed when presenting this information. This Full Year Results Announcement is unaudited PricewaterhouseCoopers has audited the financial statements contained within the Westpac 2018 Full Year financial report and has issued an unmodified audit report. This Full Year Results Announcement has not been subject to audit by PricewaterhouseCoopers. The financial information contained in this Full Year Results Announcement includes financial information extracted from the audited financial statements together with financial information that has not been audited. The cash earnings disclosed as part of this Full Year Results Announcement have not been separately audited, however they are consistent with the financial information included in Note 2 Segment Reporting of the financial statements in the 2018 Annual Report. 6 | Westpac Group 2018 Full Year Financial Results Announcement
2018 Full Year financial results Group results 1.4 1.4.1 Market share and system multiple metrics Market share 1.4.2 System multiples 1 Source: Australian Prudential Regulation Authority (APRA). 2 Includes securitised loans. 3 Source: Reserve Bank of Australia (RBA). 4 Retail deposits as measured by the RBA, financial system includes financial corporations’ deposits. 5 New Zealand comprises New Zealand banking operations. 6 Source: Reserve Bank of New Zealand (RBNZ). 7 Market Share Funds under Management / Funds under Administration based on published market share statistics from Strategic Insight as at 30 June 2018 (for Full Year 2018), as at 31 December 2017 (for First Half 2018), as at 30 June 2017 (for Full Year 2017) and as at 31 December 2016 (for First Half 2017) and represents the BT Wealth business market share reported at these times. 8 n/a indicates that system growth or Westpac growth was negative. Westpac Group 2018 Full Year Financial Results Announcement | 7 Full Year Half YearHalf YearFull YearHalf YearHalf Year Sept 18March 18Sept 17Sept 17March 17 Sept 18 Australia Banking system (APRA)1 Housing credit2 Cards8 Household deposits Business deposits Financial system (RBA)3 Housing credit2 Business credit8 Retail deposits4 New Zealand (RBNZ)5,6 Consumer lending Deposits8 1.0 n/a 1.0 2.0 0.9 0.7 1.0 0.7 0.8 0.91.00.91.10.8 n/an/an/an/a1.1 1.10.81.21.31.1 n/a0.91.11.11.0 0.80.90.91.00.8 0.60.90.51.0n/a 1.30.61.21.30.7 0.60.70.60.60.7 0.11.21.41.4n/a As at As atAs atAs at 31 March30 Sept31 March 201820172017 30 Sept 2018 Australia Banking system (APRA)1 Housing credit2 Cards Household deposits Business deposits Financial system (RBA)3 Housing credit2 Business credit Retail deposits4 New Zealand (RBNZ)5,6 Consumer lending Deposits Business lending Australian Wealth Management7 Platforms (includes Wrap and Corporate Super) Retail (excludes Cash) Corporate Super 24% 23% 23% 20% 23% 19% 22% 19% 18% 16% 19% 18% 13% 25%25%25% 23%23%23% 23%23%23% 20%20%20% 23%23%23% 19%19%19% 21%22%21% 19%19%19% 19%19%19% 16%16%17% 18%19%19% 18%18%18% 13%13%14%

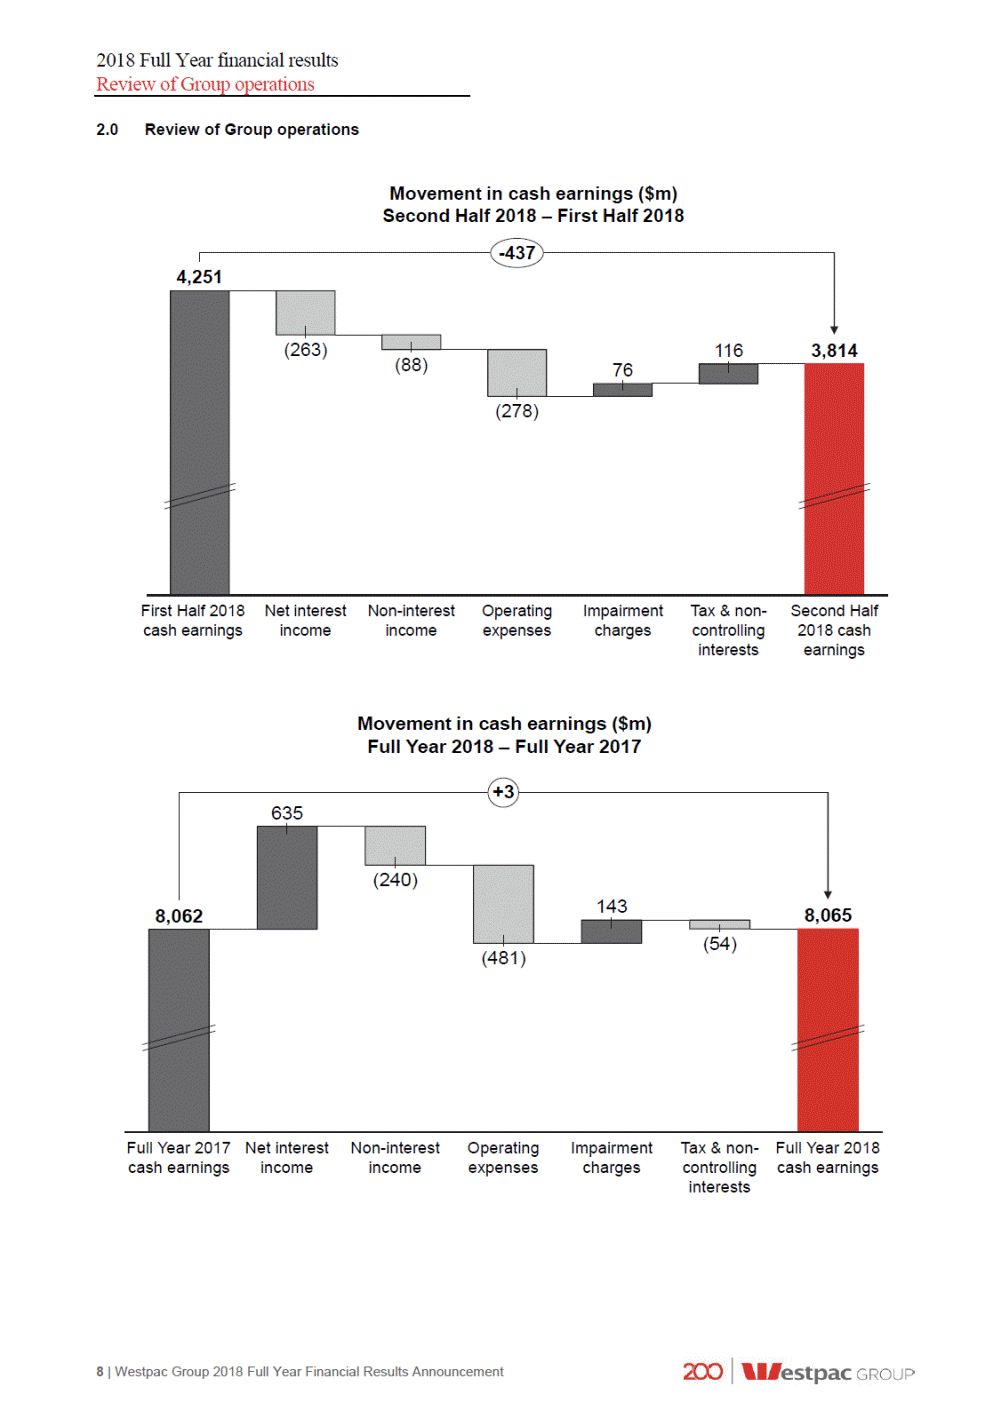
2018 Full Year financial results Review of Group operations 2.0 Review of Group operations Movement in cash earnings ($m) Second Half 2018 – First Half 2018 -437 4,251 (263) 116 3,814 First Half 2018 cash earnings Net interest income Non-interest income Operating expenses Impairment charges Tax & non-controlling interests Second Half 2018 cash earnings Movement in cash earnings ($m) Full Year 2018 – Full Year 2017 +3 Full Year 2017 Net interest Non-interest income Operating expenses Impairment charges Tax & non-controlling interests Full Year 2018 cash earnings cash earnings income 8 | Westpac Group 2018 Full Year Financial Results Announcement 8,062 8,065 143 (54) (481) 635 (240) (88) 76 (278)
2018 Full Year financial results Review of Group operations 2.1 Performance overview Overview Full Year 2018 has been a challenging period for financial services companies, including Westpac, with the commencement of The Royal Commission into Misconduct in the Banking, Superannuation and Financial Services Industry (Royal Commission), a slowdown in system loan and deposit growth, and the full impact of the Bank Levy introduced in July 2017. Within this environment, Westpac reported cash earnings of $8,065 million in Full Year 2018, $3 million higher than for Full Year 2017. Given the significance of the Royal Commission it is important to outline its impact and to discuss how Westpac has been responding to some of the developments. The Royal Commission has been a valuable and rigorous process. Established in mid-December 2017, the Royal Commission has now completed the majority of its hearings, and on 28 September 2018 released its interim report. The interim report raised a number of important points of policy and principle for consideration by Westpac, the industry, regulators and policy makers. It signalled that financial services organisations, including Westpac, must do more to meet the needs of customers and the community, including by preventing, detecting and addressing misconduct while at the same time consistently meeting legal and regulatory obligations. Westpac provided a formal response to the interim report on 26 October 2018. Improving outcomes for customers The stories and examples of poor behaviour affecting customers that have come to light in the Royal Commission are confronting and have understandably impacted the public’s trust in the industry. Westpac has already commenced a number of initiatives to improve its policies, procedures and practices for customers. Many of these started prior to the establishment of the Royal Commission. Major initiatives have included: changing the way Westpac pays its employees. This included the removal of all individual product incentives for branch staff and the full implementation of the Sedgwick recommendations two years ahead of schedule. As a result, 70% of incentives for our front line people are now non-financial measures; ceasing the payment of grandfathered commissions to Westpac employed financial advisers. This will directly benefit more than 140,000 BT advice customers; implementing the Australian Banking Association’s “Six point plan” aimed at improving the sector’s reputation; continuing to conduct detailed product by product reviews to reassess their features and how they can best be structured to meet customer’s needs; and creating a new Group Executive role of Customer and Corporate Relations which, amongst other responsibilities, has been tasked with bringing together the complaints management processes from across the Group to complement the role of Customer Advocate Officer, materially improving complaints handling, more systematically identifying root causes of complaints, helping to protect more vulnerable customers and resolving long-standing issues. At the same time, where Westpac gets things wrong the Group puts things right for customers. In Full Year 2018 the Group booked provisions of $380 million (after tax cost of $281 million) for estimated customer refunds, payments and associated costs. Of these provisions, $105 million was charged against net interest income, and $163 million was charged against non-interest income. A further $112 million was included in expenses. The provisions covered matters including: certain advice fees associated with the Group’s salaried financial planners, including where inadequate advice was provided, incidences where advice services were not provided, or where it has not been possible to verify if the advice services were provided; additional provisions to resolve legacy product issues; and costs associated with the above along with provisions for recent litigation. In Full Year 2017 the Group booked $169 million of provisions for customer refunds and payments, or $118 million after tax. Westpac Group 2018 Full Year Financial Results Announcement | 9
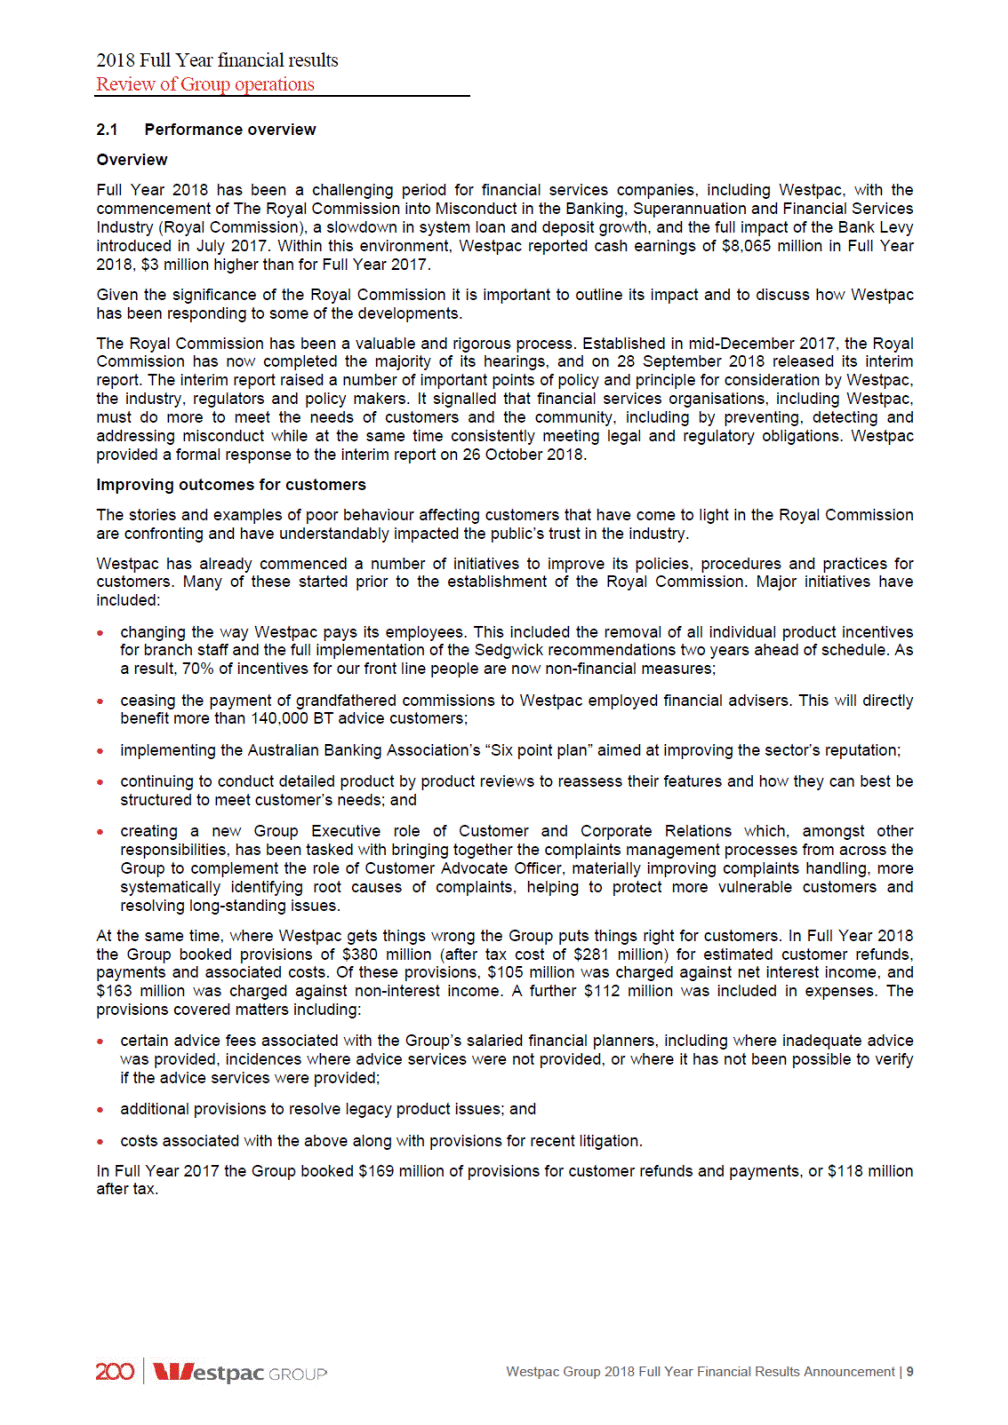
2018 Full Year financial results Review of Group operations Financial Performance Westpac’s cash earnings of $8,065 million in Full Year 2018 was little changed over Full Year 2017 cash earnings of $8,062 million. While underlying business growth was sound, with loan growth of 4%, average funds up 4%, and life insurance in-force premiums 20% higher, the result in Full Year 2018 was impacted by the higher provisions indicated above, the full period impact of the Bank Levy, and a weaker markets contribution ($151 million) in Westpac Institutional Bank (WIB). The Group began the year well with cash earnings of $4,251 million in First Half 2018, however as the provisions and weaker markets impacts were concentrated in the second half of the year, Second Half 2018 cash earnings were 10% lower to $3,814 million. Second Half 2018 also saw a decline in margins, including from higher short term wholesale funding costs. The relatively flat cash earnings combined with a 1% increase in shares on issue, led to a 1% decline in cash earnings per share (EPS) to 236.2 cents in Full Year 2018. New share issuance, as part of the dividend reinvestment plan and the conversion of a portion of Westpac CPS into ordinary shares, increased average ordinary equity by 6% which in turn led to the Group’s ROE falling to 13.0%, down 77 basis points. Consistent with the rise in capital, net tangible assets per share increased 5% to $15.39. While the economic environment remains positive with real GDP reaching 3.4% for the year to June 2018, unemployment remaining at historical lows and business conditions generally improving, the operating environment for financial services has been more challenging. In particular, findings from the Royal Commission have contributed to a deterioration in sentiment towards the sector while credit growth has eased by around 1 percentage point to 4.5% from both a moderation in the housing market and the full period impact of macro-prudential rules on lending. Weaker sentiment toward the sector has also contributed to lower activity in wealth management and insurance. At the same time, competition has remained intense from both local and international financial institutions, including non-banks. While Australia’s cash rate was unchanged over the year, short term interest rates increased with the bank bill swap rate (BBSW) rising from early in calendar 2018 from around 1.7% to closer to 2.0%. The second half of 2018 also saw reduced opportunities in financial markets which in turn led to a lower contribution from WIB markets. Over the year, lending across the Group grew at 4%, a little below system in Australia and New Zealand. Growth eased through the year, with two thirds of the lending increase recorded in the first half. The slower growth in the second half reflected a moderation in housing growth, a small decline in offshore lending and a weakening $NZ. Growth for the year was spread across Australian mortgages (up 4%), Australian Business (up 3%) and in New Zealand (up 4%) while other personal lending (cards, personal lending and auto finance) declined. In Australia, Westpac grew comfortably below APRA’s mortgage macro-prudential rules through the year maintaining investor property growth below 10% per annum and holding the proportion of new interest only mortgages to less than 30% of new flows. Customer deposits increased 6% over the year as the Group continues to target deposit growth higher than lending growth. This year, the increase in customer deposits fully funded loan growth, lifting the deposit to loan ratio to 73% at 30 September 2018. This ratio was up almost 2 percentage points over the year and further improved Westpac’s funding mix. Deposit growth was spread across categories, with term deposits the largest contributor. Savings, transaction and interest offset accounts all experienced sound growth. Net interest margins were up 2 basis points over the year although the trends were different across the halves. In First Half 2018, margins were higher, lifted by the repricing of investor and interest only mortgages in late 2017, higher deposit spreads and increased Treasury income. In Second Half 2018 margins were 12 basis points lower (compared to First Half 2018) as competition remained intense and customers continued to switch to lower spread products (including the switching of interest only lending into principal and interest loans). Margins in Second Half 2018 were also reduced by higher short term wholesale funding costs and lower Treasury income. The Bank Levy cost $378 million in Full Year 2018, up from $95 million in Full Year 2017, and reduced margins by a further 4 basis points over the year. On a cash earnings per share basis, the Full Year 2018 impact of the Bank Levy is equivalent to around 8 cents per share. The Bank Levy only applied for one quarter in 2017. In 2018, Westpac finalised the exit of its infrastructure funds business, Hastings Funds Management (Hastings). While the exit had a small impact on cash earnings it had a more significant impact on non-interest income and costs. In particular, as part of the exit this year, the business recognised $135 million in income while writing off $105 million in goodwill, and incurring other exit costs of $16 million (including restructuring costs). Non-interest income declined $240 million in Full Year 2018 to $5,612 million or 4%. The decline included a $52 million increase in provisions for estimated customer refunds and payments and the Hastings income of $135 million. Excluding these items non-interest income was down $323 million or 5% with the decline mostly due to lower trading income of $291 million and lower fee income including the full period effect of eliminating foreign ATM fees, removing certain transaction fees, and capping account-keeping fees for some legacy accounts to no more than $5 per month. Partially offsetting these declines were higher business line fees, a rise in insurance revenue and gains on NZ hedges. 10 | Westpac Group 2018 Full Year Financial Results Announcement
2018 Full Year financial results Review of Group operations In aggregate, the 4% rise in net interest income, combined with the 4% decline in non-interest income led to total operating income rising 2%. Expenses increased 5% or $481 million. Expense growth this year was impacted by the exit of Hastings, higher provisions for implementing customer refunds and payments, and provisions for estimated litigation settlements. Excluding these infrequent items of $233 million, expenses increased 3%. The Group has continued to offset business as usual cost increases with productivity gains. Productivity savings were $304 million in Full Year 2018, up $42 million over the year. Savings were achieved by: simplifying the organisation: through product rationalisation, reducing the number of products, and operating model changes - such as removing management spans and layers ($180 million); migrating more activity to digital: This included more customers using e-statements, and a shift to digital transactions and self-service, which allowed us to amalgamate 47 branches and remove 443 ATMs across Australia and New Zealand ($61 million); and modernising systems, automating processes, and reviewing and re-negotiating contracts ($63 million). Excluding the infrequent items, most of the increase in costs was related to higher investment and regulatory and compliance spending. This included $62 million in additional expenses associated with the Royal Commission, and higher technology costs including from the NPP, Panorama, and cybersecurity. Given the significant infrequent items (higher costs and negative revenues), the expense to income ratio increased 143 basis points over the year, to be 43.7% for Full Year 2018. Core earnings (revenue less expenses but before impairment charges) were down 1%. Credit quality remained sound, with key metrics relatively stable over the year and over the prior half. Impaired assets were little changed over the year with no new facilities greater than $50 million becoming impaired. As a result, impairment charges were $710 million for Full Year 2018, down 17% (or $143 million) on Full Year 2017 and representing 10 basis points to gross loans. Most of the decline was due to lower new individually assessed provisions with fewer new impairment provisions partially offset by lower write-backs. Lower new impaired assets, along with the continued work-out of facilities contributed to a reduction of $66 million in total provisions for impairment charges on loans and credit commitments for Full Year 2018. The Group’s ratio of gross impaired asset provisions to impaired assets was 46% (down 18 basis points on the year) while the ratio of collectively assessed provisions to credit risk weighted assets was down 3 basis points to 0.73%. The decline in this ratio was due mostly to mortgage modelling changes which lifted RWA. The overlay provision was $22 million lower (to $301 million) mostly from the continuing improvement in the NZ dairy sector. The effective tax rate was 30.8% for the year, this is above the corporate tax rate and higher over the year due to the non-deductibility of certain expenses, including litigation penalties, the write-off of Hastings goodwill, and hybrid distributions. Across divisions, earnings results were mixed. Business Bank recorded an 8% rise cash earnings with higher margins and a 15% decline in impairment charges while New Zealand (in NZ$) recorded a 5% increase in cash earnings, with core earnings up 10% from higher margins and improved efficiency. Consumer Bank’s cash earnings were relatively flat over the year (down $15 million), with lower non-interest income and higher operating expenses mostly offset by lower impairment charges. BT Financial Group recorded a 12% decrease in cash earnings with growth in funds and insurance premiums more than offset by higher provisions for estimated customer refunds and payments and associated costs. WIB recorded a 6% decrease in cash earnings reflecting lower revenue, primarily in Financial Markets, partially offset by an impairment benefit. Balance sheet and credit quality The Group maintained the strength of its balance sheet across all dimensions: a CET1 capital ratio of 10.6%, slightly above the “unquestionably strong” benchmark set by APRA of 10.5%. The ratio was 7 basis points higher over the year as organic capital generation was largely offset by RWA model changes; a liquidity coverage ratio (LCR) of 133%, above the 100% regulatory minimum; a net stable funding ratio (NSFR) of 114%, comfortably above the 100% regulatory minimum which applied from 1 January 2018; and credit quality remaining sound with stressed exposures to TCE remaining low relative to historical experience. Westpac Group 2018 Full Year Financial Results Announcement | 11

2018 Full Year financial results Review of Group operations Stressed exposures to TCE were 1.08% at 30 September 2018, 1 basis point down from 31 March 2018, and 3 basis points higher from September 2017. Looking at the three categories within stressed exposures, impaired assets were little changed, 90+ days past due and not impaired increased by 5 basis points, while watchlist and substandard exposures were 1 basis point lower. Stress has particularly improved across Institutional and in New Zealand, with a small rise in stress in the commercial portfolio. Credit quality of the mortgage portfolio has remained sound with 90+ day delinquencies of 0.67% at 30 September 2018. This ratio was 5 basis points higher over the year and up 2 basis points over the prior six months. There were 396 properties in possession at 30 September 2018, 41 lower than the same period last year. Dividends The Board determined a final ordinary dividend of 94 cents per share, fully franked, unchanged over both Second Half 2017 and First Half 2018. The final ordinary dividend represents a Second Half 2018 payout ratio of 84.7% (Full Year 2018: 79.9%) and a dividend yield of 6.7%1. The Board has determined to issue shares to satisfy the dividend reinvestment plan (DRP) for the final 2018 dividend and to apply no discount to the market price used to determine the number of shares issued under the DRP. The final ordinary dividend will be paid on 20 December 2018 with the record date of 14 November 20182. After allowing for the final dividend, the Group’s adjusted franking account balance was $1,357 million. Strategic Progress Westpac’s vision is: To be one of the world’s great service companies, helping our customers, communities and people to prosper and grow. Westpac’s service-led strategy has remained consistent through the year. This consistency has enabled the Group to make significant progress over the year, modernising its infrastructure, digitising processes and seeking to make banking and financial services easier for customers. The Group invested $1,411 million over Full Year 2018 with 59% of this spend devoted to growth and productivity initiatives, 27% was directed to regulatory change projects and the residual 14% was spent on other technology programs. Overall investment was up 12% over the year with the increase spread across all categories. To outline the Group’s strategic progress, the commentary has been segmented into three categories, service leadership, digital transformation and workforce. The following sections summarise progress through this year. Service leadership Westpac strives to deliver a world class customer experience, combining great in-person service with market leading digital capabilities. In the context of the Royal Commission, there has been a decline in customer satisfaction and net promoter (NPS) scores through the year. While Westpac’s NPS has declined, the fall has been less than peers and this has improved Westpac’s relative consumer NPS ranking (against the major banks) from 4th to 2nd over the last 12 months. To address the underlying causes of this decline much effort has been focused on the Group’s product reviews and ensuring that customer complaints are seen as a second chance to retain customers. Other initiatives completed over the year included: For businesses: enhanced support for small business including new, shorter, plain-English loan documents and strengthened protections under small business contracts; introduced least-cost routing providing choice for contactless debit payments; and further expanding the reach and functionality the Group’s online loan origination system, LOLA. For consumers: introduced voice banking for Siri, Google Assistant and Amazon’s Alexa. Customers can now ask for their account balance and conduct simple banking transactions using their voice; Westpac customers can now access secure live chat on their desktop – often a more convenient way to connect with banking specialists; and 1 Based on the closing share price as at 28 September 2018 of $27.93. 2 Record date for 2018 final dividend in New York is 13 November 2018. 12 | Westpac Group 2018 Full Year Financial Results Announcement

2018 Full Year financial results Review of Group operations launched mobile cheque deposit, a first in Australia that allows customers to deposit cheques via the mobile app. Digital transformation Advances in digital technology provide the Group with the ability to enhance the customer experience while simultaneously improving productivity and risk management. Major developments over the year have included: piloting the Group’s “customer service hub” that will ultimately be the centrepiece of customer origination and service processes. The new system will be rolled out for Westpac mortgages in First Half 2019; extending e-statements to closed deposit and card accounts; introducing BT Open Services, a new online advisor hub supporting independent financial advisors; enhancing the Group’s infrastructure to further reduce cybersecurity risks; and continuing to move applications on to the Group’s private cloud environment, reducing application installation from weeks to hours. Workforce Successful achievement of the Group’s vision depends on the quality and engagement of our people. Westpac is already regarded as a leader in staff engagement, diversity, and flexibility but recognises there is more to do. Recent highlights include: Reinforced our commitment to supporting Veterans. In 2018 Westpac supported the Invictus Games and through a veterans employee action group are seeking to lift Veteran employment while aiming to increase support for Defence Force personnel and their families; Commenced the fourth year of the Equilibrium program, supporting accomplished female leaders (both from within the company and outside financial services) to build a career in Westpac and to bring different perspectives to the Group; Completed the roll-out of a new performance management framework called “Motivate”. The framework is a behaviours-first approach that seeks to emphasise that how outcomes are delivered is just as important as what is delivered; Monthly surveys of employee sentiment have been largely unchanged over the year at 73%; Further reduced the lost time injury frequency rate to 0.39 at 30 September 2018, down from 0.60 at 30 September 2017; Implemented a new half day training program completed for the majority of employees. Called “Navigate”, brings together the Group’s vision, values, code of conduct and service standards to help employees manage tough decisions and have the courage to challenge decisions. The half day sessions reinforced the Group’s expectations around ethical behaviour and appropriate treatment of customers; and Further enhanced LearningBank, the Group’s online portal for self-directed learning. Over 200,000 courses were completed on the platform in 2018. Financial performance summary Second Half 2018 – First Half 2018 Cash earnings of $3,814 million were down 10% with core earnings also down 10%, while impairment charges fell 19%. The result was impacted by a number of infrequent items, the largest of which was $281 million (after tax) in provisions for estimated customer refunds and payments and associated costs along with provisions for estimated litigation settlements. Net interest income fell 3% with a 12 basis point decrease in margins only partially offset by a 2% rise in average interest-earning assets. Margins excluding Treasury and Markets decreased 10 basis points over the half, with the decline due to the customer provisions, higher short term wholesale funding costs and lower mortgage spreads. The decline in mortgage spreads has been due to customers switching from interest only to principal and interest, changes in portfolio mix towards lower margin products (basic products) and lower rates on new mortgages. Total loans grew 1%, with most of the rise due to an increase in Australian mortgage lending. Other areas of growth included 3% growth in SME business lending and 1% growth in commercial loans. In New Zealand, lending was up 2% (down 1% in A$ terms) from growth in mortgages. Australian personal lending was lower over the half, mostly reflecting lower demand. Customer deposits grew 3% over First Half 2018 and fully funded lending over the half. Westpac Group 2018 Full Year Financial Results Announcement | 13
2018 Full Year financial results Review of Group operations Non-interest income was down 3%, impacted by infrequent items, including provisions for estimated customer refunds and payments ($163 million) mostly offset by fees associated with the Hastings exit. Excluding these, non-interest income was down 2% mostly from lower Financial Markets trading income, a reduction in funds management income (from revaluation of investment in boutique funds and seed fund performance and lower fund margins). These declines were offset by higher business line fees, an increase in merchant income, and lower insurance claims. Expenses increased 6%. This included a number of infrequent items, including provisions for estimated costs associated with implementing customer refunds and payments, litigation and the exit of Hastings. Excluding these items, expenses were $79 million higher. Most of this expense growth was due to higher spending associated with investment and an increase in regulatory and compliance costs, with $173 million of productivity savings more than offsetting ordinary cost growth. Impairment charges were $76 million (or 19%) lower than First Half 2018, with most of the decrease due to lower new collectively assessed provisions linked to a reduction in consumer early-cycle (30+ day) delinquencies. In aggregate, mortgage 90+ day delinquencies were 2 basis points higher, while consumer unsecured 90+ day delinquencies were unchanged over the half at 1.64%. The effective tax rate was 31.3% in Second Half 2018, higher due to the non-deductibility of certain expenses, including penalties and the write-off of goodwill. Divisional performance summary The performance of each division based on performance in Full Year 2018 compared to Full Year 2017 is discussed below. Consumer Bank Consumer Bank’s (CB) cash earnings of $3,140 million were $15 million lower than Full Year 2017. Growth in net interest income of 1% and a $114 million reduction in impairment charges were more than offset by lower non-interest income and higher operating expenses. Net interest income increased from a 4% rise in mortgages, and a 5% increase in deposits, offset by a 7 basis point reduction in net interest margin. Margins were impacted by higher short term wholesale funding costs, the full period impact of the Bank Levy, and provisions for estimated customer refunds and payments, partly offset by higher deposit spreads. Mortgage spreads were little changed over the year as the full period impact of repricing undertaken in 2017 was offset by increased competition and customers switching into principal and interest loans from interest-only lending. Non-interest income was $67 million lower, mostly due to the elimination or reduction of certain transaction and account-keeping fees and lower credit card interchange fees. Expenses were up $164 million (or 5%), mostly due to higher investment related costs and regulatory and compliance costs. More customers using digital channels has reduced branch transactions and enabled the rationalisation of 40 branches over the year. The $114 million decrease in impairment charges was largely due to improved collection processes which led to a reduction in write-offs and higher recoveries from the maturity of hardship changes. Recoveries were also higher. Business Bank Business Bank (BB) delivered an 8% increase in cash earnings to $2,159 million reflecting a 5% lift in core earnings and a 15% decline in impairment charges. Lending increased 2%, with SME lending up 3%, and commercial lending up 3%. Deposits rose 4% over the year, with growth spread across term deposits and transaction accounts. The net interest margin was up 5 basis points, from the full period effect of repricing on certain mortgages in Second Half of 2017 and higher deposit spreads. This was partially offset by the full-period impact of the Bank Levy. Non-interest income was up 4% with higher business line fees. Expenses were 3% higher, mostly from higher investment related costs, and regulatory and compliance spending. Credit quality has been sound, although stressed assets to TCE were up 58 basis points, from the downgrade of a small number of commercial customers into the watchlist category. Impairment charges were $52 million lower from lower write-offs in the Auto finance and credit card portfolios. BT Financial Group BT Financial Group (BTFG) cash earnings were 12% lower to $645 million. While the division recorded higher insurance income (both higher premiums and lower claims), a stronger contribution from Private Wealth and 7% growth in funds, this was more than offset by higher provisions for estimated customer refunds and payments and associated costs along with fee changes in advice and platforms. Funds increased $14.2 billion, with most of the growth in platforms. Growth was supported by stronger investment markets and $5.7 billion of net flows onto Panorama. Funds management contribution was lower, impacted by a reduction in platform fees and product mix changes. Expenses were up 8% mostly due to a provision for the costs associated with implementing customer refunds and payments ($55 million) and higher investment related spending including costs associated with Panorama and BT Open Services. Regulatory and compliance costs were lower over the year due to the completion of the MySuper migration in 2017. 14 | Westpac Group 2018 Full Year Financial Results Announcement

2018 Full Year financial results Review of Group operations Westpac Institutional Bank Westpac Institutional Bank (WIB) recorded a 6% decrease in cash earnings to $1,086 million. The $73 million decline was principally due to lower Markets revenue and was partially offset by an impairment benefit. The net impact of Hastings on cash earnings was not material year on year, as additional revenue from the exit of Hastings was largely offset by higher expenses (mostly goodwill write-off) and a higher tax expense (due to non-deductibility of the goodwill writedown). Expenses were up 7%, but excluding Hastings expenses, were well managed, up 1%. The $38 million impairment benefit was due to the successful workout of several large impaired facilities. Westpac New Zealand Westpac New Zealand delivered cash earnings of NZ$1,017 million, up 5%, over the prior year. The business generated 10% core earnings growth although this was offset by a small impairment charge of NZ$3 million which followed a NZ$76 million impairment benefit in Full Year 2017. An 8% lift in net interest income was the main driver of core earnings growth with lending up 4%, deposits rising 6% and margins increasing 12 basis points. The rise in margins followed some repricing of mortgage and business lending partially offset by lower deposit spreads. Expenses were 3% lower as the benefits from the division’s transformation program flowed through. The program has led to a reduction in the size of the branch network and increased self-service via digital. Group Businesses Group Businesses delivered cash earnings of $101 million in Full Year 2018, up $9 million on the prior year. The increase was due to a higher Treasury contribution (from interest rate risk management) and a $68 million improvement in non-interest income due to gains on NZ earnings hedges. These were partially offset by higher expenses and a lower impairment benefit. The rise in expenses was mainly due to a rise in regulatory and compliance costs, including expenses associated with the Royal Commission along with higher restructuring costs. The impairment benefit was $41 million lower mostly due to movements in centrally held impairment overlays. Westpac Group 2018 Full Year Financial Results Announcement | 15

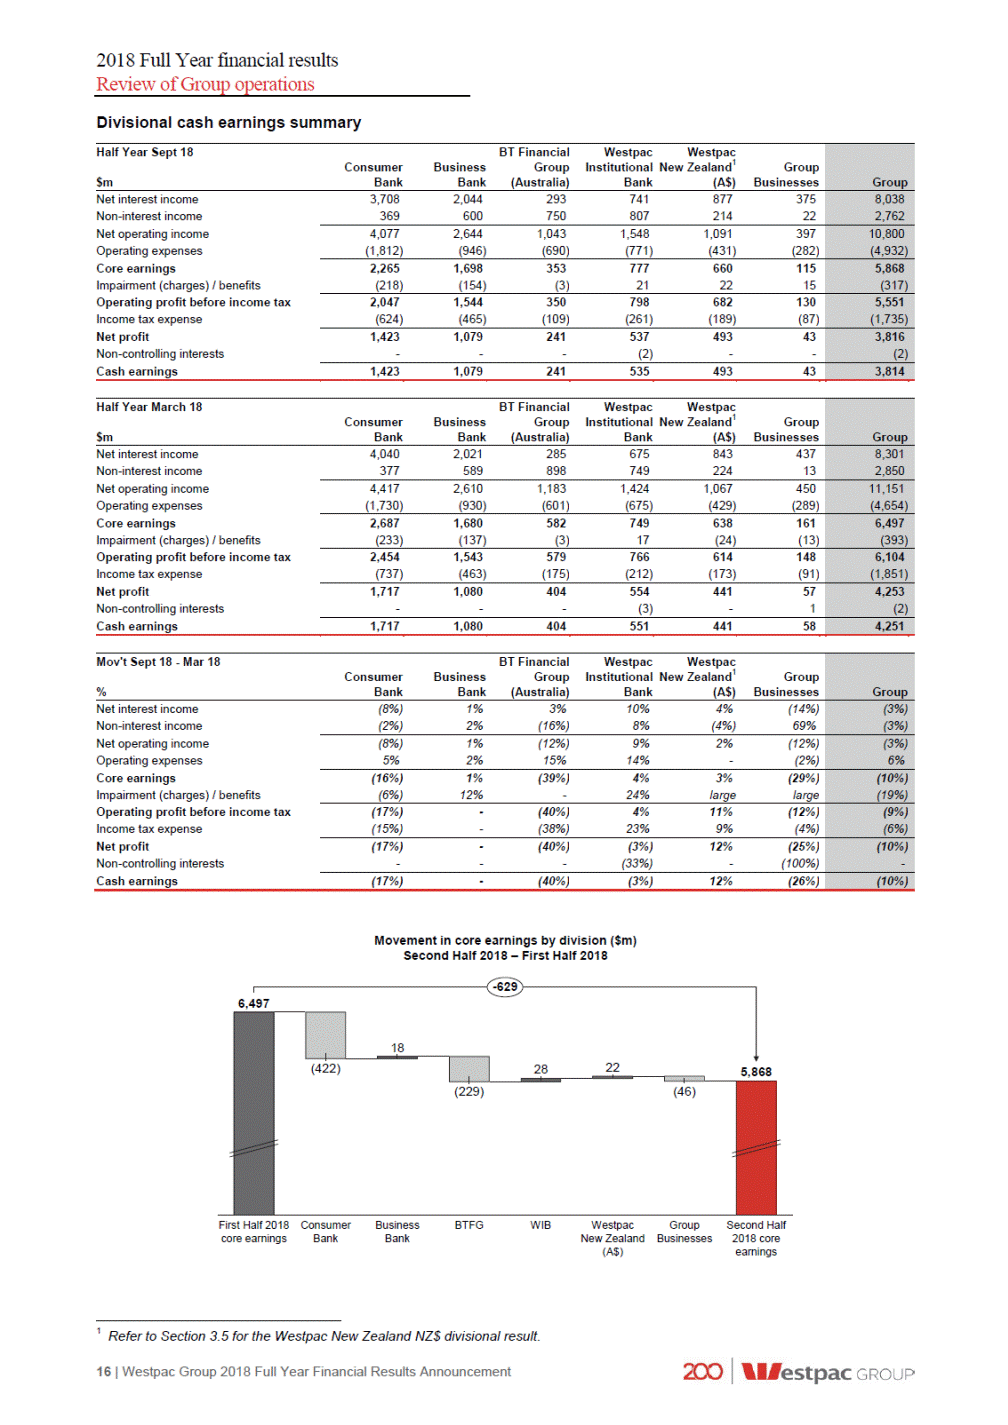
2018 Full Year financial results Review of Group operations Divisional cash earnings summary Movement in core earnings by division ($m) Second Half 2018 – First Half 2018 -629 6,497 First Half 2018 Consumer Business Bank BTFG WIB Westpac New Zealand (A$) Group Businesses Second Half 2018 core earnings core earnings Bank 1 Refer to Section 3.5 for the Westpac New Zealand NZ$ divisional result. 16 | Westpac Group 2018 Full Year Financial Results Announcement 18 (422) 28225,868 (229)(46) Mov't Sept 18 - Mar 18BT FinancialWestpacWestpac ConsumerBusinessGroup Institutional New Zealand1Group %BankBank(Australia)Bank(A$)Businesses Group Net interest income Non-interest income Net operating income Operating expenses Core earnings Impairment (charges) / benefits Operating profit before income tax Income tax expense Net profit Non-controlling interests Cash earnings (8%)1%3%10% 4%(14%) (2%)2%(16%) 8%(4%) 69% (3%) (3%) (8%)1%(12%)9%2%(12%) 5%2%15%14%-(2%) (3%) 6% (16%)1%(39%)4%3%(29%) (6%)12%-24%largelarge (10%) (19%) (17%)-(40%)4%11%(12%) (15%)-(38%)23%9%(4%) (9%) (6%) (17%)-(40%)(3%)12%(25%) ---(33%)-(100%) (10%) - (17%)-(40%)(3%)12%(26%) (10%) Half Year March 18BT FinancialWestpacWestpac ConsumerBusinessGroup Institutional New Zealand1Group $mBankBank(Australia)Bank(A$)Businesses Group Net interest income Non-interest income Net operating income Operating expenses Core earnings Impairment (charges) / benefits Operating profit before income tax Income tax expense Net profit Non-controlling interests Cash earnings 4,0402,021285675843437 37758989874922413 8,301 2,850 4,4172,6101,1831,4241,067450 (1,730)(930)(601) (675) (429)(289) 11,151 (4,654) 2,6871,680582749638161 (233)(137)(3)17(24)(13) 6,497 (393) 2,4541,543579766614148 (737)(463)(175)(212)(173)(91) 6,104 (1,851) 1,7171,08040455444157 ---(3)-1 4,253 (2) 1,7171,08040455144158 4,251 Half Year Sept 18BT FinancialWestpacWestpac ConsumerBusinessGroup Institutional New Zealand1Group $mBankBank(Australia)Bank(A$)Businesses Group Net interest income Non-interest income Net operating income Operating expenses Core earnings Impairment (charges) / benefits Operating profit before income tax Income tax expense Net profit Non-controlling interests Cash earnings 3,7082,044293741877375 36960075080721422 8,038 2,762 4,0772,6441,0431,5481,091397 (1,812)(946)(690) (771) (431)(282) 10,800 (4,932) 2,2651,698353777660115 (218)(154)(3)212215 5,868 (317) 2,0471,544350798682130 (624)(465)(109)(261)(189)(87) 5,551 (1,735) 1,4231,07924153749343 ---(2)--3,816 (2) 1,4231,07924153549343 3,814
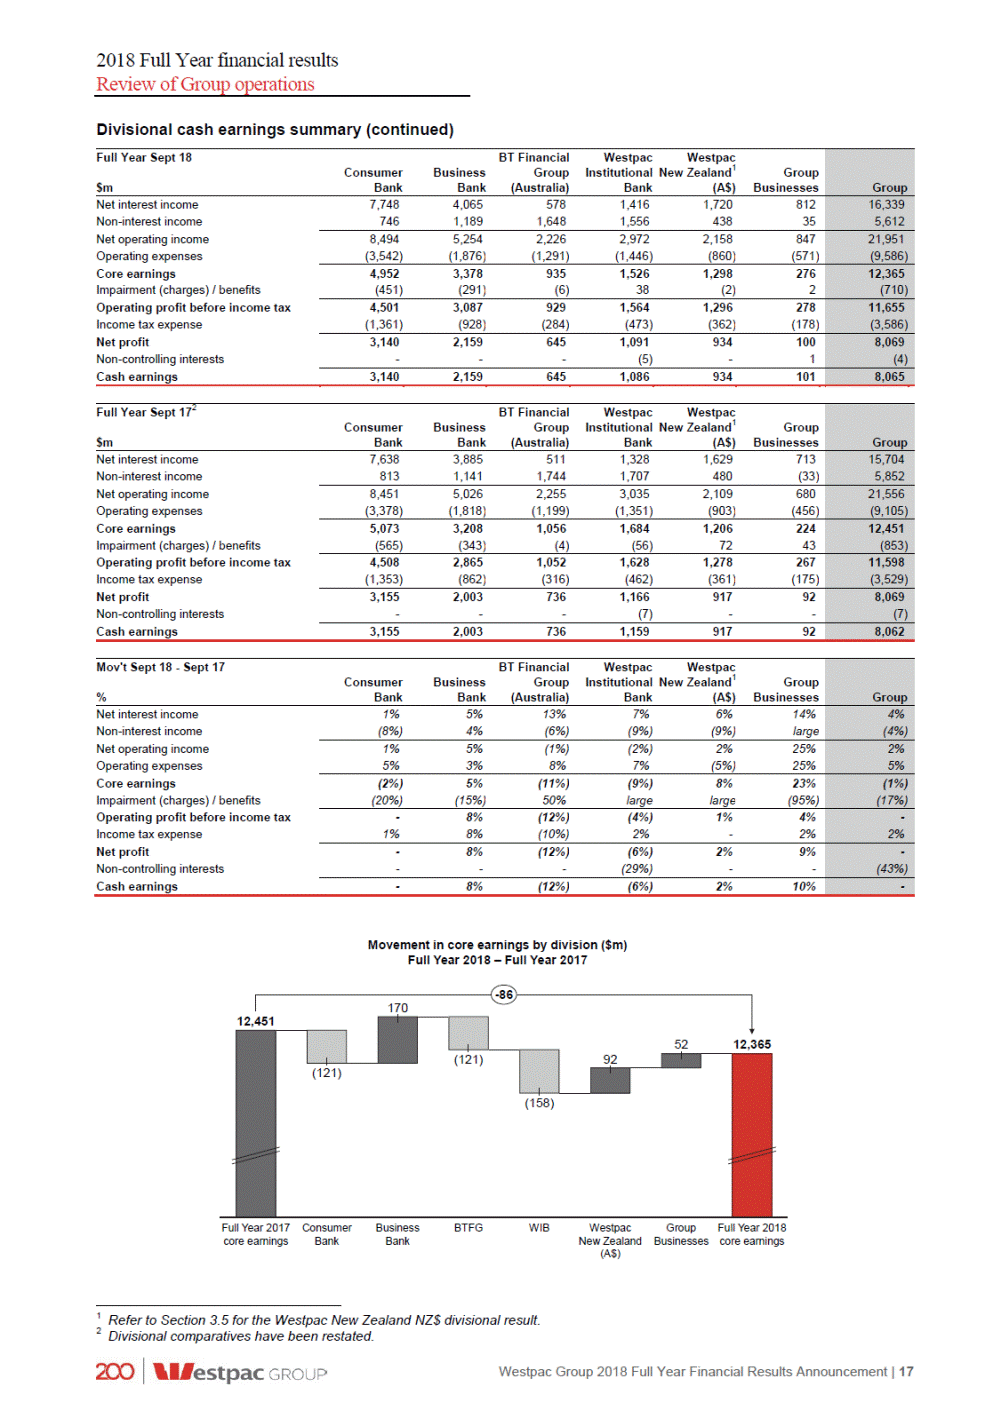
2018 Full Year financial results Review of Group operations Divisional cash earnings summary (continued) Movement in core earnings by division ($m) Full Year 2018 – Full Year 2017 -86 Full Year 2017 Consumer Business Bank BTFG WIB Westpac New Zealand (A$) Group Full Year 2018 Businesses core earnings core earnings Bank 1 Refer to Section 3.5 for the Westpac New Zealand NZ$ divisional result. 2 Divisional comparatives have been restated. Westpac Group 2018 Full Year Financial Results Announcement | 17 12,451 52 12,365 (121) 92 (121) (158) 170 Mov't Sept 18 - Sept 17BT FinancialWestpacWestpac ConsumerBusinessGroup Institutional New Zealand1Group %BankBank(Australia)Bank(A$)Businesses Group Net interest income Non-interest income Net operating income Operating expenses Core earnings Impairment (charges) / benefits Operating profit before income tax Income tax expense Net profit Non-controlling interests Cash earnings 1%5%13% 7% 6%14% (8%)4% (6%)(9%)(9%)large 4% (4%) 1%5%(1%)(2%)2%25% 5%3%8%7%(5%)25% 2% 5% (2%)5%(11%)(9%)8%23% (20%)(15%)50%largelarge(95%) (1%) (17%) -8%(12%)(4%)1%4% 1%8%(10%)2%-2% - 2% -8%(12%)(6%)2%9% ---(29%)--- (43%) -8%(12%)(6%)2%10% - Full Year Sept 172BT FinancialWestpacWestpac ConsumerBusinessGroup Institutional New Zealand1Group $mBankBank(Australia)Bank(A$)Businesses Group Net interest income Non-interest income Net operating income Operating expenses Core earnings Impairment (charges) / benefits Operating profit before income tax Income tax expense Net profit Non-controlling interests Cash earnings 7,6383,8855111,3281,629713 8131,1411,7441,707480(33) 15,704 5,852 8,451 5,026 2,255 3,0352,109680 (3,378)(1,818)(1,199)(1,351) (903)(456) 21,556 (9,105) 5,0733,2081,0561,6841,206224 (565)(343)(4)(56)7243 12,451 (853) 4,5082,8651,0521,6281,278267 (1,353)(862)(316)(462)(361)(175) 11,598 (3,529) 3,1552,0037361,16691792 ---(7)--8,069 (7) 3,1552,0037361,15991792 8,062 Full Year Sept 18BT FinancialWestpacWestpac ConsumerBusinessGroup Institutional New Zealand1Group $mBankBank(Australia)Bank(A$)Businesses Group Net interest income Non-interest income Net operating income Operating expenses Core earnings Impairment (charges) / benefits Operating profit before income tax Income tax expense Net profit Non-controlling interests Cash earnings 7,7484,0655781,4161,720812 7461,1891,6481,55643835 16,339 5,612 8,494 5,254 2,226 2,9722,158847 (3,542)(1,876)(1,291)(1,446) (860)(571) 21,951 (9,586) 4,9523,3789351,5261,298276 (451)(291)(6)38(2)2 12,365 (710) 4,5013,0879291,5641,296278 (1,361)(928)(284)(473)(362)(178) 11,655 (3,586) 3,1402,1596451,091934100 ---(5)-1 8,069 (4) 3,1402,1596451,086934101 8,065
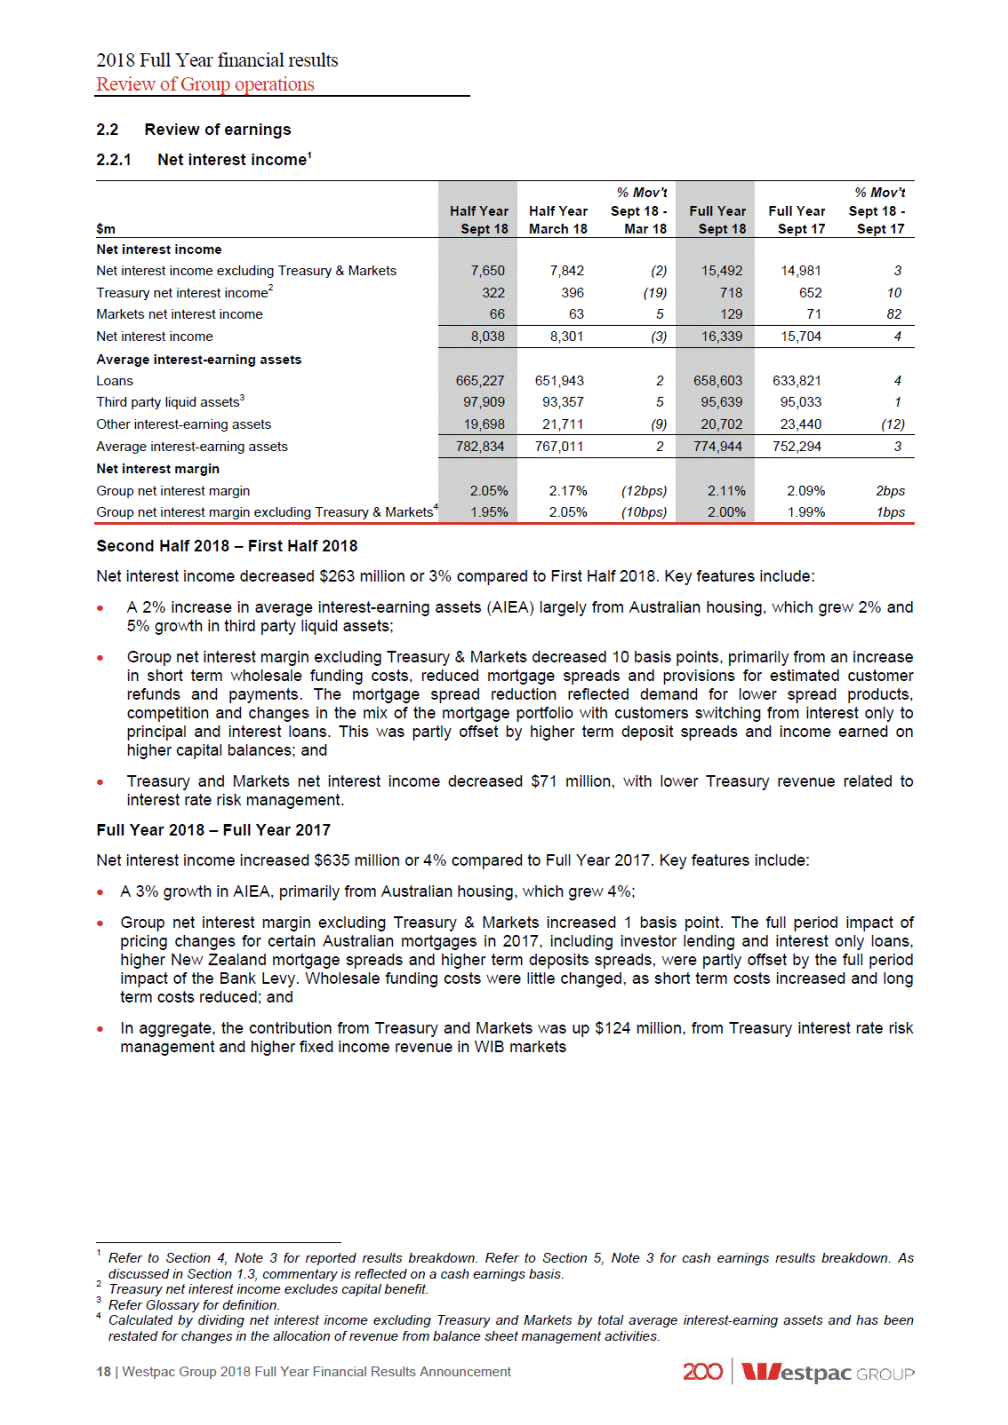
2018 Full Year financial results Review of Group operations 2.2Review of earnings Net interest income1 2.2.1 14,981 652 71 3 10 82 633,821 95,033 23,440 4 1 (12) 2.09% 1.99% 2bps 1bps Second Half 2018 – First Half 2018 Net interest income decreased $263 million or 3% compared to First Half 2018. Key features include: A 2% increase in average interest-earning assets (AIEA) largely from Australian housing, which grew 2% and 5% growth in third party liquid assets; Group net interest margin excluding Treasury & Markets decreased 10 basis points, primarily from an increase in short term wholesale funding costs, reduced mortgage spreads and provisions for estimated customer refunds and payments. The mortgage spread reduction reflected demand for lower spread products, competition and changes in the mix of the mortgage portfolio with customers switching from interest only to principal and interest loans. This was partly offset by higher term deposit spreads and income earned on higher capital balances; and Treasury and Markets net interest income decreased $71 million, with lower Treasury revenue related to interest rate risk management. Full Year 2018 – Full Year 2017 Net interest income increased $635 million or 4% compared to Full Year 2017. Key features include: A 3% growth in AIEA, primarily from Australian housing, which grew 4%; Group net interest margin excluding Treasury & Markets increased 1 basis point. The full period impact of pricing changes for certain Australian mortgages in 2017, including investor lending and interest only loans, higher New Zealand mortgage spreads and higher term deposits spreads, were partly offset by the full period impact of the Bank Levy. Wholesale funding costs were little changed, as short term costs increased and long term costs reduced; and In aggregate, the contribution from Treasury and Markets was up $124 million, from Treasury interest rate risk management and higher fixed income revenue in WIB markets 1 Refer to Section 4, Note 3 for reported results breakdown. Refer to Section 5, Note 3 for cash earnings results breakdown. As discussed in Section 1.3, commentary is reflected on a cash earnings basis. 2 Treasury net interest income excludes capital benefit. 3 Refer Glossary for definition. 4 Calculated by dividing net interest income excluding Treasury and Markets by total average interest-earning assets and has been restated for changes in the allocation of revenue from balance sheet management activities. 18 | Westpac Group 2018 Full Year Financial Results Announcement $m % Mov't Half Year Sept 18 - March 18 Mar 18 % Mov't Full YearSept 18 - Sept 17Sept 17 Half Year Full Year Sept 18 Sept 18 Net interest income Net interest income excluding Treasury & Markets 7,650 7,842(2) 15,492 Treasury net interest income2 322 396(19) 718 Markets net interest income 66 635 129 Net interest income 8,038 8,301(3) 16,339 15,7044 Average interest-earning assets Loans 665,227 651,9432 658,603 Third party liquid assets3 97,909 93,3575 95,639 Other interest-earning assets 19,698 21,711(9) 20,702 Average interest-earning assets 782,834 767,0112 774,944 752,2943 Net interest margin Group net interest margin 2.05% 2.17%(12bps) 2.11% Group net interest margin excluding Treasury & Markets4 1.95% 2.05%(10bps) 2.00%
2018 Full Year financial results Review of Group operations 2.2.2 Loans1 Second Half 2018 – First Half 2018 Total loans increased $8.3 billion or 1% compared to First Half 2018. Excluding foreign currency translation impacts, total loans increased $9.3 billion or 1%. Key features of total loan growth were: Australian housing loans increased $7.5 billion or 2% which was below system growth3. Owner occupied housing balances grew 3% to now comprise 57% of the portfolio (March 2018: 56%, September 2017: 56%). The Group continues to manage interest only growth below the macro-prudential limit of 30% of new flows, with new interest only facilities representing 23% of new mortgage limits for the half. In addition, customers have switched $15.9 billion of interest only loans to principal and interest during this period. Interest only loans now comprise 35% of the portfolio (March 2018: 40%, September 2017: 46%); Australian personal loans and cards decreased $0.7 billion or 3% from lower auto finance and credit card balances; Australian business loans increased $2.4 billion or 2%, with institutional lending up 2% from increased utilisation of existing warehouse facilities and a 1% increase in Business Bank largely from growth in SME and agriculture; and New Zealand loans increased NZ$1.3 billion or 2% due to growth in housing (up 2%), mostly in fixed rate products to owner occupiers. Owner occupied housing represents 75% of the portfolio. 1 Spot loan balances. 2 Includes margin lending. 3 Source: RBA. Westpac Group 2018 Full Year Financial Results Announcement | 19 $m As at As atAs at% Mov't% Mov't 31 March30 SeptSept 18 -Sept 18 - 20182017Mar 18Sept 17 30 Sept 2018 Australia Housing Personal (loans and cards) Business Other2 Provisions New Zealand (A$) New Zealand (NZ$) Housing Personal (loans and cards) Business Other Provisions Other overseas Trade finance Other loans Provisions Total loans 619,630 610,397599,16223 437,239427,16724 21,78921,952(3)(4) 151,904150,54223 1,9631,985(2)(3) (2,498)(2,484)(2)(1) 74,68771,484(1)4 79,55777,68024 47,90746,94324 2,0472,017(4)(3) 29,89828,97914 81921(11) (376)(351)(14)(8) 16,30914,273(2)12 3,9422,818(9)28 12,42911,515-8 (62)(60)-3 444,741 21,079 154,347 1,918 (2,455) 74,045 80,860 48,893 1,958 30,251 82 (324) 16,015 3,600 12,477 (62) 709,690 701,393684,91914
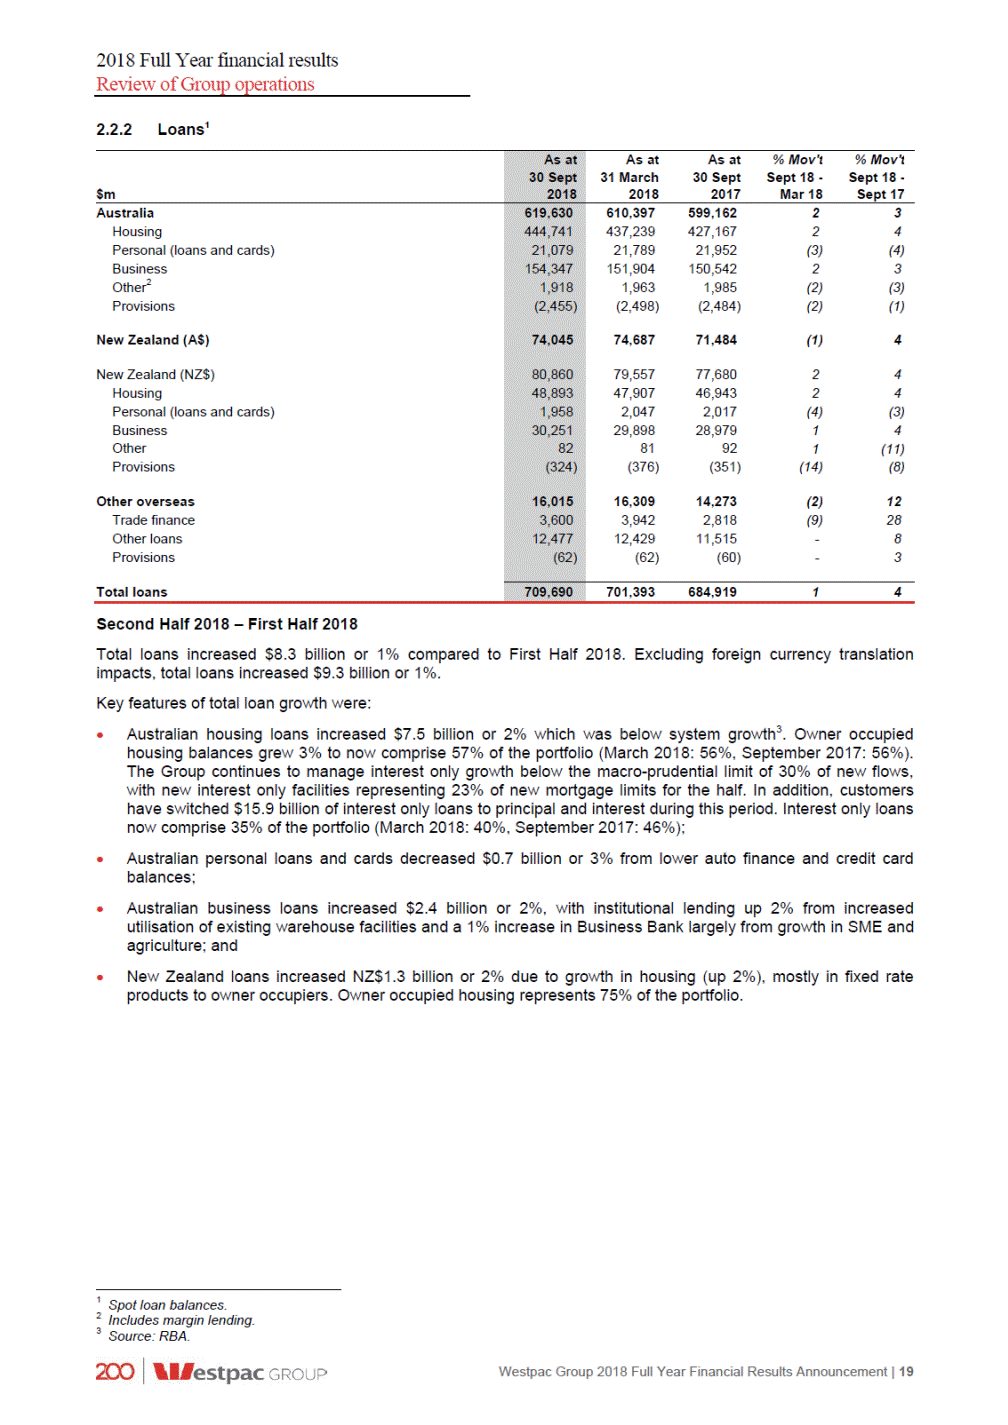
2018 Full Year financial results Review of Group operations Full Year 2018 – Full Year 20171 Total loans increased $24.8 billion or 4% compared to Full Year 2017. Excluding foreign currency translation impacts, total loans increased $24.0 billion or 3%. Key features of total loan growth were: Australian housing loans increased $17.6 billion or 4% (slightly below system growth1). Owner occupied loans increased 6% over the year, while the Group’s investor property lending grew by 2%. Principal and interest loan flows represented 77% of all new flows and now comprise 61% of the portfolio (September 2017: 50%); Australian business loans increased $3.8 billion or 3% from broad based growth in Business Bank including SME, agriculture, manufacturing and property; New Zealand lending increased NZ$3.2 billion or 4%. Housing loans grew at 4% mostly in fixed rate products, while business lending increased 4% supported by growth across agriculture, property and corporate lending; and Other overseas lending increased $1.7 billion or 12%, across trade finance and institutional lending in Asia. 1 Source: RBA. 20 | Westpac Group 2018 Full Year Financial Results Announcement

2018 Full Year financial results Review of Group operations 2.2.3 Deposits and other borrowings1 Second Half 2018 – First Half 2018 Total customer deposits increased $15.7 billion or 3% compared to First Half 2018, with the increase more than fully funding loan growth in the half. Excluding foreign currency translation impacts, customer deposits increased $15.9 billion or 3%. Key features of total customer deposits growth were: Australian customer deposits increased $16.8 billion or 4%, with above system growth2 in household deposits and higher Government balances; and New Zealand customer deposits were little changed (up NZ$0.3 billion). Growth in term deposits of 3% was offset by a decline in business transaction balances. Certificates of deposits decreased $4.1 billion or 9%, reflecting reduced short-term wholesale funding issuance in this form. Full Year 2018 – Full Year 2017 Total customer deposits increased $31.1 billion or 6% compared to Full Year 2017, with the increase more than fully funding loan growth in the year. Excluding foreign currency translation impacts, customer deposits increased $29.5 billion or 6%. Key features of total customer deposits growth were: Australian customer deposits increased $25.8 billion or 6%, particularly across term deposits (up 10%). Household deposits growth was in line with system2 and non-financial corporation deposits grew above system2 Customers continued to direct funds to mortgage offset accounts, supporting 4% growth in Australian non-interest bearing deposits; New Zealand customer deposits increased NZ$3.5 billion or 6%, with the increase fully funding loan growth during the year. Term deposits grew 9%, particularly across household and institutional segments. Non-interest bearing deposits increased 12% from growth in business and consumer transaction deposits, including growth in mortgage offset accounts; and Other overseas deposits increased $2.3 billion or 19% due to growth in deposits across Asia. Certificates of deposits decreased $5.4 billion or 11%, reflecting reduced short-term wholesale funding issuance in this form. 1 Spot deposit balances. 2 Source: APRA. Westpac Group 2018 Full Year Financial Results Announcement | 21 $m As at As atAs at% Mov't% Mov't 31 March30 SeptSept 18 -Sept 18 - 20182017Mar 18Sept 17 30 Sept 2018 Customer deposits Australia At call Term Non-interest bearing New Zealand (A$) New Zealand (NZ$) At call Term Non-interest bearing Other overseas (A$) Total customer deposits Certificates of deposit Australia New Zealand (A$) Other overseas (A$) Total deposits and other borrowings 429,852420,84146 227,021224,26834 161,864156,249610 40,96740,32424 57,85653,746(2)5 61,62858,405-6 24,16423,117(3)1 31,59530,01439 5,8695,274112 14,35512,083-19 446,667 233,052 171,832 41,783 56,671 61,887 23,339 32,645 5,903 14,413 517,751 502,063486,67036 45,67346,921(9)(11) 30,38737,515(5)(23) 521546114104 14,7658,860(21)32 41,534 28,746 1,116 11,672 559,285 547,736533,59125
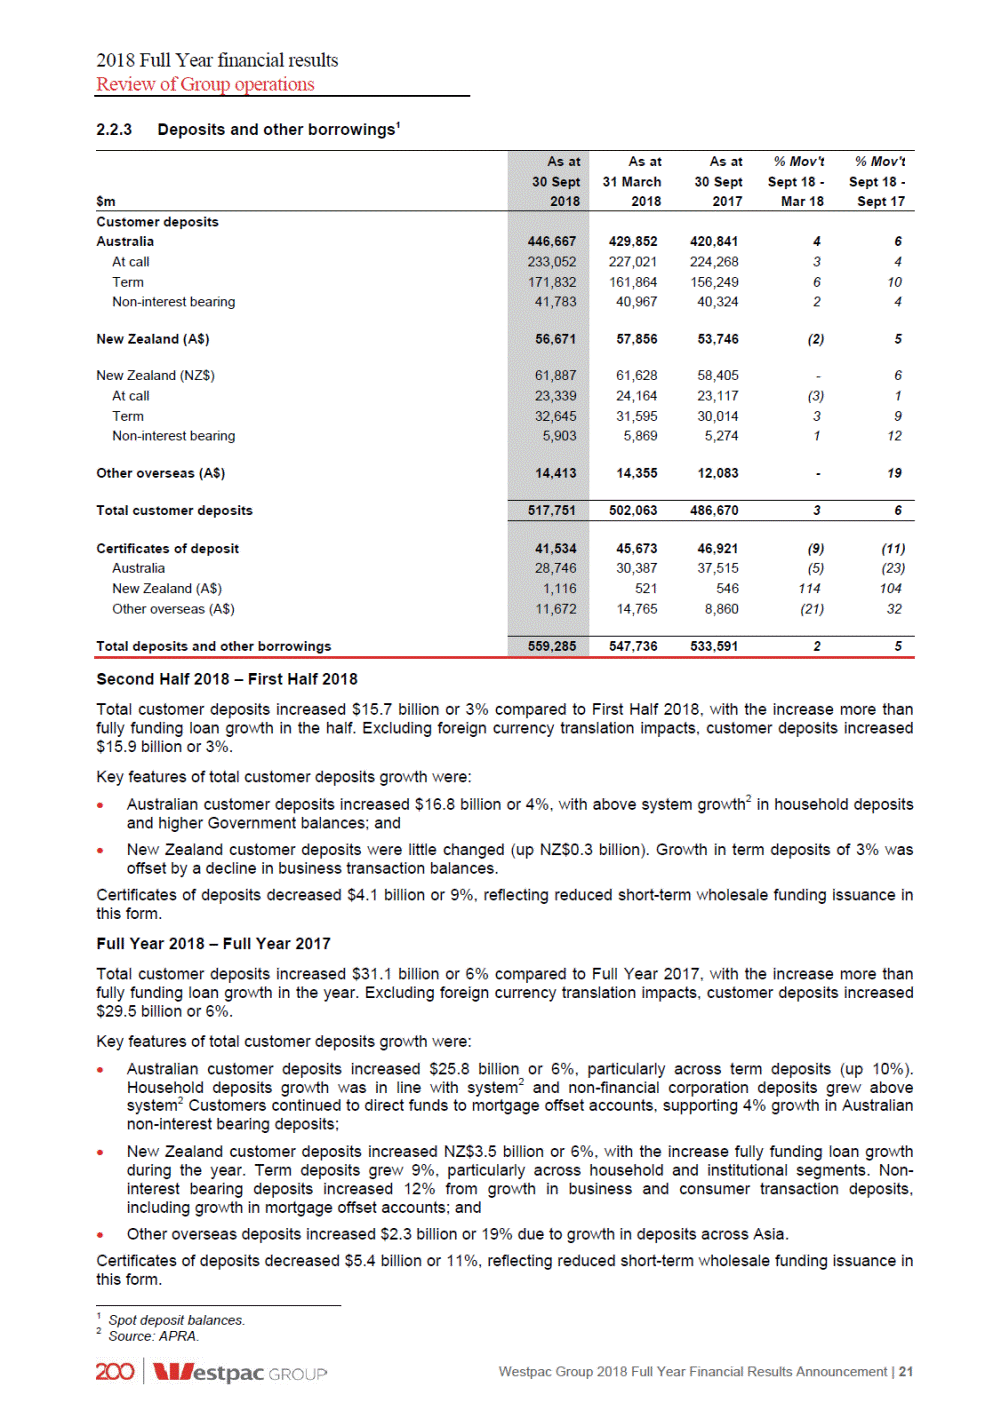
2018 Full Year financial results Review of Group operations 2.2.4 Net interest margin Group net interest margin movement (%) Second Half 2018 – First Half 2018 Group margin down 12bps 2.17% First Half Provisions Loans Customer deposits Short term wholesale funding Term Bank Levy Capital Liquidity Treasury Second & Markets Half 2018 2018 for customer refunds wholesale funding & other Second Half 2018 – First Half 2018 Group net interest margin was 2.05%, a decrease of 12bps compared to First Half 2018. Key features include: 2 basis point decrease from the impact of provisions for estimated customer refunds and payments; 4 basis points decrease from loan spreads primarily due to changes in the mix of the Australian mortgage portfolio as customers preferred lower spread products, retention pricing and continued switching from interest only to principal and interest loans. Competition is impacting lending spreads across all loan markets, particularly mortgages; 1 basis point increase from customer deposit spreads, primarily from term deposits; 5 basis points decrease from a rise in short term wholesale funding costs, including the impact of the bank bill swap rate (BBSW) increasing in Second Half 2018; Capital and other increased 1 basis point largely from income earned on higher capital balances; 1 basis point decrease from liquidity reflecting the increased holdings in third party liquid assets and a higher CLF fee following a $8 billion increase to the CLF from 1 January 2018; and Treasury and Markets contribution decreased 2 basis points, with less market opportunities impacting returns from interest rate risk management. 22 | Westpac Group 2018 Full Year Financial Results Announcement 2.05% (2bps) 1bps (4bps) 0bps 0bps 1bps (5bps) (1bps) Excluding Treasury and Markets down 10bps (2bps) 2.05% 1.95%
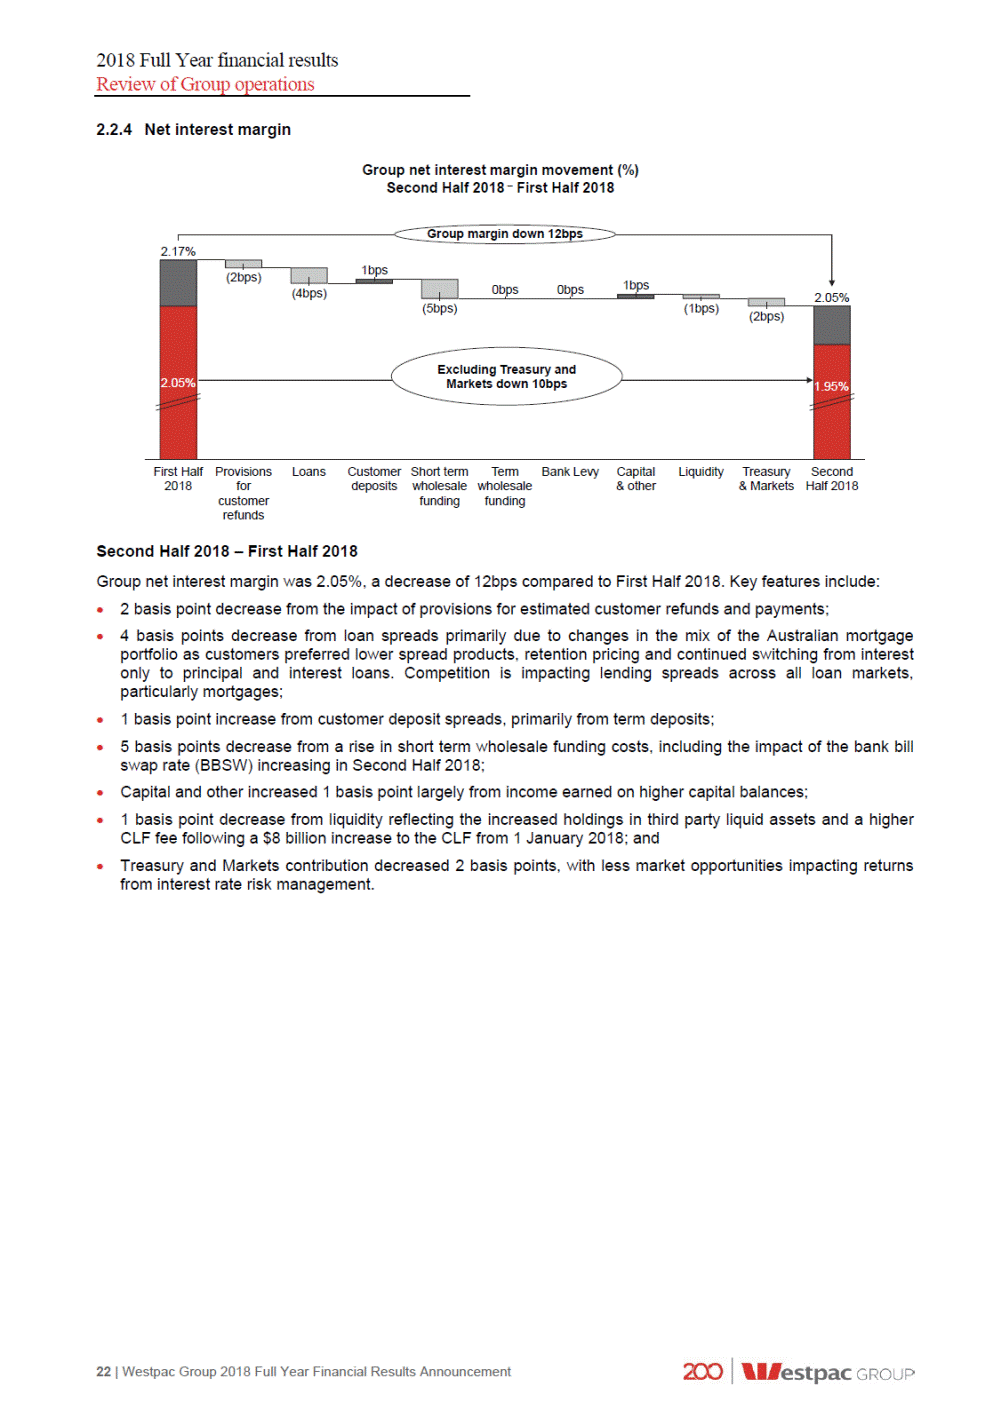
2018 Full Year financial results Review of Group operations Group net interest margin movement (%) Full Year 2018 – Full Year 2017 Group margin up 2bps 1bps 2.11% (2bps) Markets up 1bps Full Year Provisions Loans Customer Short term Term Bank Levy Capital & other Liquidity Treasury & Markets Full Year 2018 2017 for customer refunds deposits wholesale wholesale funding funding Full Year 2018 – Full Year 20171 Group net interest margin was 2.11%, an increase of 2 basis points from Full Year 2017. Key features include: 2 basis points increase from loan spreads. This reflected the full period impact of pricing changes for certain Australian mortgages in late 2017, including interest only and investor lending, along with higher spreads on New Zealand mortgages. These gains were partly offset by the impact of customers switching from interest only to principal and interest loans, retention pricing, customer preference for lower spread basic products and competition across loan markets; 2 basis points increase related to customer deposit spreads, mainly from term deposits, partly offset by the impact of lower rates on the hedging of transaction deposits; 2 basis points decrease from a rise in short term wholesale funding costs, particularly in Second Half 2018; 2 basis points increase from term wholesale funding as pricing for new term issuance was lower than the portfolio average; 4 basis point decrease from the full period impact of the Bank Levy, which was introduced on 1 July 2017; Capital and other increased 1 basis point largely from the positive effect of higher capital balances, partly offset by the impact of lower interest rates; and 1 basis point increase from Treasury and Markets, due to increased Treasury revenue from interest rate risk management. 1 Group net interest margin excluding Treasury and Markets has been restated for changes in the allocation of revenue from balance sheet management activities. Westpac Group 2018 Full Year Financial Results Announcement | 23 2bps 1bps 0bps 2.09% 0bps (4bps) Excluding Treasury and 2.00% 1.99% 2bps 2bps

2018 Full Year financial results Review of Group operations Non-interest income1 2.2.5 1,810 1,217 70 11 (24) 70 Second Half 2018 – First Half 2018 Non-interest income decreased $88 million or 3% compared to First Half 2018. The impact of provisions for estimated customer refunds and payments ($163 million) was mostly offset by fees associated with the exit of the Hastings business ($144 million). Excluding these infrequent items, non-interest income reduced $69 million or 2% mostly reflecting lower markets income, partly offset by growth in business lending fees and higher insurance income. Fees and commissions Fees and commissions decreased $146 million or 11% compared to First Half 2018, largely from: Provisions for estimated customer refunds and payments in the half ($156 million); partly offset by Increase in business lending fees of $15 million primarily driven by portfolio growth. Wealth management and insurance income Wealth management and insurance income increased $159 million, or 17% in the half, due to: Hastings revenue, including fees associated with the exit of Hastings ($144 million); and Higher insurance income ($31 million) primarily from lower general insurance claims; partly offset by Provisions for estimated customer refunds and payments related to wealth products ($7 million); and Platforms and superannuation revenue was little changed. Margin compression from competition and pricing changes to BT Panorama in July 2018, was mostly offset by the benefit of higher asset markets. Refer to Section 2.2.6 for further information on Group funds balance movements. Trading income Trading income was $88 million or 17% lower compared to First Half 2018. Refer to Section 2.2.7 for further detail on Markets related income. Other income Other income decreased $13 million compared to First Half 2018, mostly reflecting lower gains on financial instruments designated at fair value. Full Year 2018 – Full Year 2017 Non-interest income decreased $240 million or 4% over the year. Full Year 2018 was impacted by a number of infrequent items, including income related to the exit of the Hastings business ($135 million), partly offset by an increase in provisions for estimated customer refunds and payments (up $52 million from $111 million in Full Year 2017 to $163 million in Full Year 2018). Excluding the impact of these infrequent items, non-interest income was $323 million or 5% lower, primarily due to reduced markets income and lower banking fee income from the full period impact of regulatory changes to Australian credit card interchange fees and removal of ATM withdrawal fees. Fees and commissions Fees and commissions decreased $205 million or 7% compared to Full Year 2017, largely due to: Additional provisions for estimated customer refunds and payments ($101 million), related to Advice and retail banking products; Lower revenue from the removal of ATM withdrawal fees and changes to transaction fees ($64 million); 1 Refer to Section 4, Note 4 for reported results breakdown. Refer to Section 5, Note 4 for cash earnings results breakdown. As discussed in Section 1.3, commentary is on a cash earnings basis. 24 | Westpac Group 2018 Full Year Financial Results Announcement $m % Mov't Half Year Sept 18 - Mar 18Mar 18 % Mov't Full YearSept 18 - Sept 17Sept 17 Half Year Full Year Sept 18 Sept 18 Fees and commissions 1,202 1,348(11) 2,550 2,755(7) Wealth management and insurance income 1,088 92917 2,017 Trading income 419 507(17) 926 Other income 53 66(20) 119 Non-interest income 2,762 2,850(3) 5,612 5,852(4)
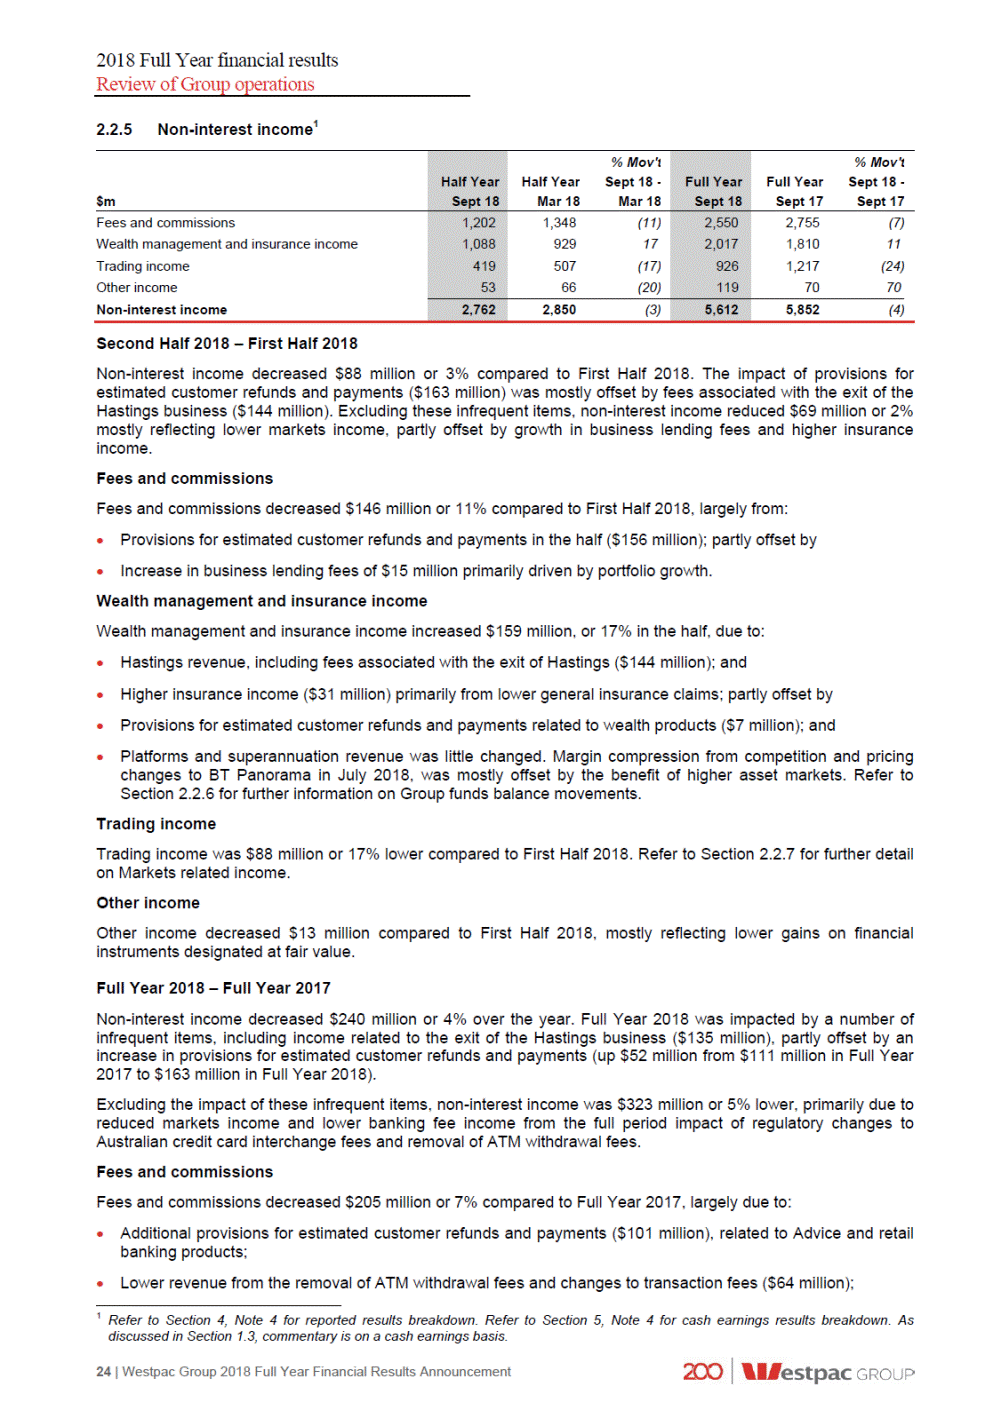
2018 Full Year financial results Review of Group operations Lower credit card income ($49 million) from the full period impact of regulatory interchange rates from 1 July 2017 and lower rewards redemptions; and changes to Australian Lower corporate and institutional lending fees ($23 million) from a reduction in unused customer limits; partly offset by Higher business lending fees ($40 million) primarily driven by portfolio growth. Wealth management and insurance income Wealth management and insurance income increased $207 million or 11% over the year reflecting: A rise in Hastings revenue which included fees of $144 million related to the exit of the business, the associated costs can be seen in other expenses; A fall in provisions for estimated customer refunds and payments for wealth products ($49 million); Higher revenue from investments in boutique funds ($43 million); and Higher insurance income ($17 million) reflecting: -Increase in general insurance income (up $24 million) from lower claims, with the prior year impacted by Cyclone Debbie, and a 2% increase in net earned premiums; -Life insurance income up $10 million from a 17% increase to earned premiums, primarily due to BTFG commencing the management of Group Insurance for BTFG Corporate Super in Full Year 2018. This was partly offset by a rise in claims; and -Lower LMI contribution ($17 million) due to a reduction in loans written at higher LVR bands; partly offset by Lower platforms income ($14 million), impacted by margin compression and pricing changes to BT Panorama in July 2018. This was partly offset by the benefit of higher asset markets. Refer to Section 2.2.6 for further information on Group funds balance movements. Trading income Trading income decreased $291 million or 24% compared to Full Year 2017. The majority of the reduction was due to a lower fixed income trading result. Refer to Section 2.2.7 for further detail on Markets related income. Other income Other income increased $49 million over the year, reflecting the impact of hedging New Zealand earnings, partly offset by a loss on the sale of offshore Hastings business in first half. 2.2.6 Group funds 118.6 38.0 3.7 9.7 115.3 36.4 3.5 9.3 4 4 3 1 7 9 9 5 6.6 12.5 (100) (100) 207.6 9.7 201.9 12.0 4 (75) 6 (80) 1 Averages are based on a six month period. Westpac Group 2018 Full Year Financial Results Announcement | 25 $bn As at As atAs at% Mov't% Mov't 31 March30 SeptSept 18 -Sept 18 - 20182017Mar 18Sept 17 30 Sept 2018 Superannuation 39.3 37.436.259 Platforms 122.9 Packaged Funds 39.6 Other 3.8 New Zealand (A$) 9.8 Total Group funds (excluding Westpac Institutional Bank) 215.4 207.4200.747 Westpac Institutional Bank - Total Group funds Average funds for the Group (excluding Westpac 215.4 214.0213.211 Institutional Bank) 214.9 Westpac Institutional Bank 2.4 Average funds for the Group1 217.3 217.3213.9-2

2018 Full Year financial results Review of Group operations 2.2.7 Markets related income1 1,212 (17) 319 46 (30) (70) Markets income comprises sales and risk management revenue derived from the creation, pricing and distribution of risk management products to the Group’s consumer, business, corporate and institutional customers. Dedicated relationship specialists provide product solutions to these customers to help manage their interest rate, foreign exchange, commodity, credit and structured products risk exposures. Second Half 2018 - First Half 2018 Total markets income decreased by $88 million, or 14% compared to First Half 2018 from a fall in non-customer income from lower trading income in foreign currency and commodities. Full Year 2018 – Full Year 2017 Total markets income decreased by $151 million, or 12%, compared to Full Year 2017, primarily due to lower non-customer income from a reduced fixed income trading result. Customer income decreased 2% year on year, driven by lower fixed income and foreign exchange sales revenue. Markets Value at Risk (VaR)2 Average High Low $m Six months ended 31 March 2018 9.0 19.9 3.8 Six months ended 30 September 2017 11.2 16.0 7.6 The Components of Markets VaR are as follows: 1 Markets income includes WIB Markets, Business Bank, Consumer Bank, BTFG and Westpac New Zealand markets. 2 The daily VaR presented above reflects a WIB divisional view of VaR. It varies from presentations of VaR in the 2018 Westpac Group Annual Report and Australian Prudential Standard (APS) 330 Prudential Disclosure under Basel III where market risk disclosures are segregated into trading and banking book. VaR measures the potential for loss using a history of price volatility. 3 Includes electricity risk. 4 Includes prepayment risk and credit spread risk (exposures to generic credit rating bonds). 26 | Westpac Group 2018 Full Year Financial Results Announcement Average $m Half Year Sept 18 Half YearHalf Year March 18Sept 17 Interest rate risk Foreign exchange risk Equity risk Commodity risk3 Credit and other market risks4 Diversification benefit Net market risk 2.7 2.4 - 6.6 4.4 (5.3) 2.73.0 1.51.5 0.10.1 6.48.1 2.6 3.4 (4.3)(4.9) 10.8 9.011.2 Six months ended 30 September 2018 10.827.17.0 $m % Mov't Half Year Sept 18 - Mar 18Mar 18 % Mov't Full YearSept 18 - Sept 17Sept 17 Half Year Full Year Sept 18 Sept 18 Net interest income 66 635 129 7182 Non-interest income 456 547(17) 1,003 Total Markets income 522 610(14) 1,132 1,283(12) Customer income 448-918(2) 448 896 Non-customer income 60 162(63) 222 Derivative valuation adjustments 14 --14 Total Markets income 522 610(14) 1,132 1,283(12)

2018 Full Year financial results Review of Group operations 2.2.8 Operating expenses1 (962) (2,008) (1,469) (1) 5 11 Second Half 2018 – First Half 2018 Operating expenses increased $278 million or 6% compared to First Half 2018. Expenses were impacted by a number of infrequent items in second half ($199 million)2. Excluding these infrequent items, expenses rose $79 million or 2%. This increase was primarily driven by higher investment spend (up $66 million) across our key programs and an increase in regulatory and compliance costs (up $60 million). Productivity benefits increased $42 million in the half to $173 million, which more than offset growth in operating costs. Staff expenses increased $91 million or 4% during the half due to the full period impact of salary increases and infrequent items of $49 million. In addition, higher restructuring costs resulted from accelerated productivity initiatives in the last quarter which supported a 2% decrease in FTE. These costs were partly offset by productivity benefits. Occupancy expenses were littled changed, with rental increased across retail and corporate sites mostly offset by a reduction in branch numbers (down 20 in the half). Technology expenses increased $26 million or 2% compared to First Half 2018, reflecting a rise in costs related to the Group’s investment program. Higher technology services costs were driven by increased spend across our key platform programs and enhancements to the Group’s technology infrastructure. Amortisation of software assets also increased as programs delivered additional capability (up $16 million). These increases were partly offset by lower software maintenance and license costs (down $28 million) supported by productivity, including renegotiation with vendors. Other expenses increased $159 million or 22% and were impacted by $150 million of infrequent items. Excluding these items, other expenses increased $9 million or 1% due to additional regulatory and compliance activity, partly offset by lower Royal Commission costs and reduced postage and stationary expenses from increased customer use of electronic statements. Full Year 2018 – Full Year 2017 Operating expenses increased $481 million or 5% compared to Full Year 2017, impacted by a number of infrequent items ($233 million)3. Excluding these infrequent items, operating expenses increased 3% primarily from higher regulatory and compliance costs (up $184 million), including expenses relating to the Royal Commission ($62 million), and investment related spend (up $125 million) largely across our banking and wealth platforms. Productivity benefits increased 16% to $304 million, more than offsetting growth in operating costs. Staff expenses increased $221 million or 5% compared to Full Year 2017 from the full period impact of annual salary increases, higher restructuring costs (up $39 million) and additional FTE for regulatory and compliance activities and the Group’s investment program. This was partly offset by lower bonuses and productivity benefits largely related to simplifying the organisation and digitising processes across the branch network and operations. Occupancy expenses decreased $10 million or 1%, with benefits from retail property consolidation (branch numbers down by 47 across the Group) partly offset by higher energy costs. Technology expenses increased $102 million or 5% compared to Full Year 2017, primarily due to the Group’s investment program. Higher technology services costs (up $82 million) and software maintenance and licensing costs (up $29 million) were driven by continued investment spend, increased volumes and new software licences following upgraded capability. This was partly offset by lower IT equipment depreciation (down $17 million) as prior investment in data centres was fully depreciated. 1 Refer to Section 4, Note 5 for reported results breakdown. Refer to Section 5, Note 5 for cash earnings breakdown. As discussed in Section 1.3, commentary is on a cash earnings basis. 2 Exit of Hastings business ($87 million), estimated costs associated with implementing customer refunds and payments ($62 million) and provisions for litigation ($50 million). 3 Exit of Hastings business ($121 million), estimated costs associated with implementing customer refunds and payments ($62 million) and provisions for litigation ($50 million). Westpac Group 2018 Full Year Financial Results Announcement | 27 $m % Mov't Half Year Sept 18 - March 18 Mar 18 % Mov't Full YearSept 18 - Sept 17Sept 17 Half Year Full Year Sept 18 Sept 18 Staff expenses (2,489) (2,398)4 (4,887) (4,666)5 Occupancy expenses (477) (475)-(952) Technology expenses (1,068) (1,042)2 (2,110) Other expenses (898) (739)22 (1,637) Total operating expenses (4,932) (4,654)6 (9,586) (9,105)5
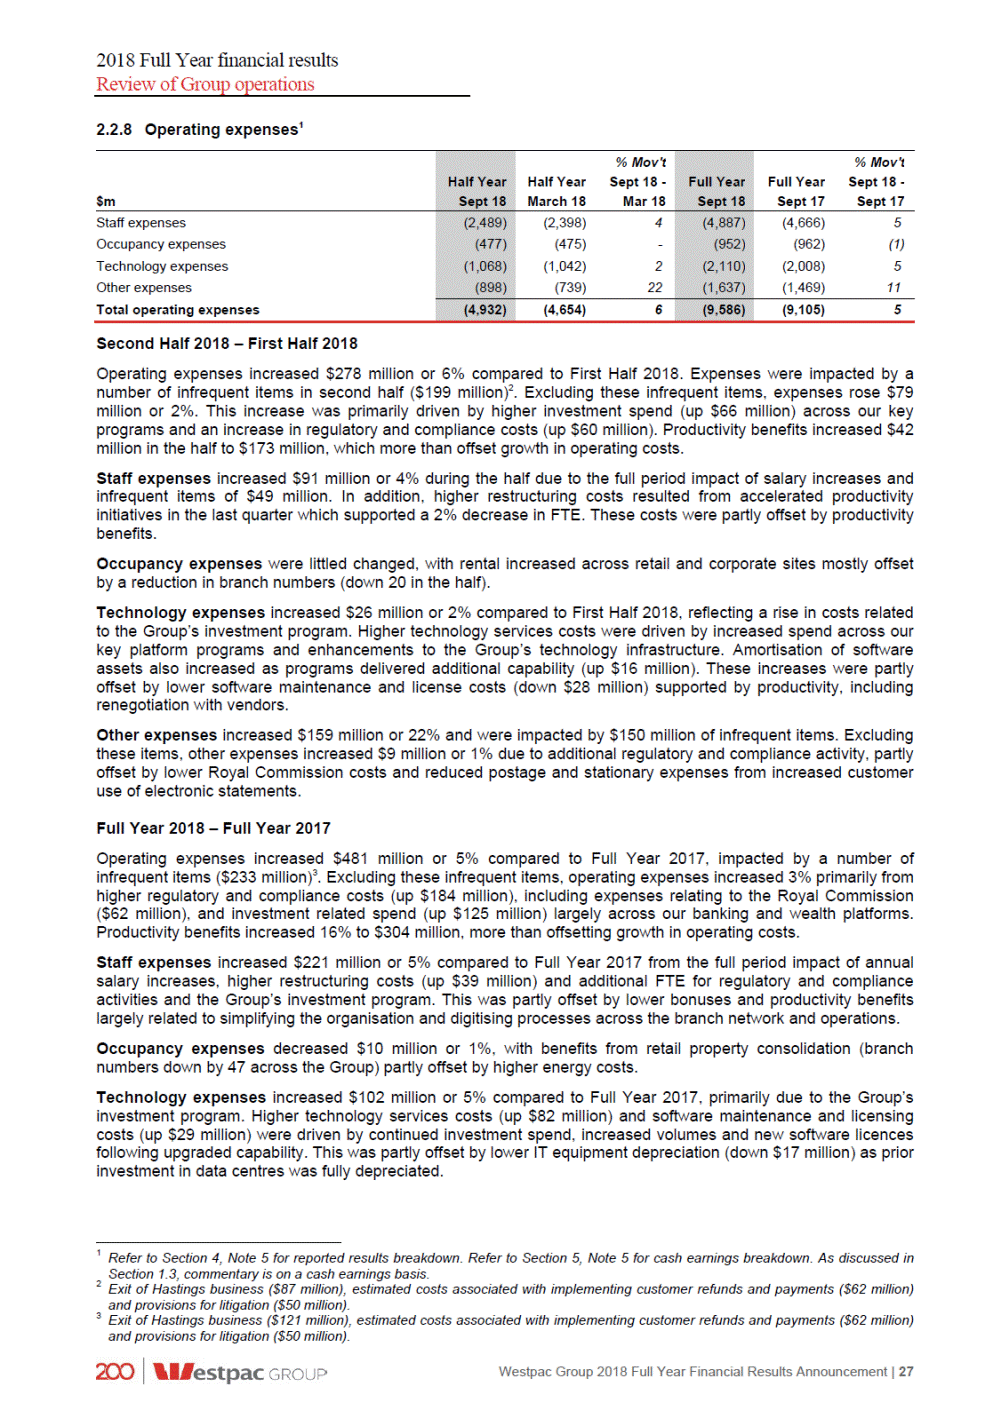
2018 Full Year financial results Review of Group operations Other expenses increased $168 million or 11% during the year and contained a number of infrequent items, including the write-off of Hastings goodwill ($105 million) following the exit of that business, provisions for litigation ($50 million) and costs associated with implementing customer refunds and payments ($25 million). Excluding these items, costs reduced $12 million primarily due to a decrease in postage and stationery costs (down $35 million) as customers migrated to electronic statements; lower credit card loyalty program costs (down $26 million) from changes to reward programs and benefits from disciplined cost management. This was partly offset by costs associated with the Royal Commission. Full Time Equivalent (FTE) employees 3,687 3,052 (9) 10 Second Half 2018 – First Half 2018 FTE decreased 691 or 2% in the half primarily from delivery of productivity initiatives across the Group, including simplifying the organisation and digitising processes across the branch network and operations. Full Year 2018 – Full Year 2017 FTE decreased 67 over the year. Delivery of productivity initiatives accelerated in the last quarter, more than offsetting additional resources required for regulatory and compliance related activities and the Group’s investment programs across the year. Investment spend 777 13 325 139 16 42 The Group invested $1.4 billion in Full Year 2018, with 59% directed to growth and productivity initiatives, 27% to regulatory change and 14% to other technology programs. In line with recent years, 38% of the $1.4 billion was expensed while 62% was capitalised. Spending in the second half of the year was up 21%, and is consistent with patterns over recent years where second half spending typically exceeds that of the first half. Full Year 2018 investment was $155 million (or 12%) higher than Full Year 2017. The Group decided to lift its annual investment to closer to $1.4 billion (compared to recent years where investment has been around $1.3 billion) to increase investment in modernising the Group’s major technology platforms in addition to compliance spending. As a result spending was higher across all investment categories. Across major investment categories the following progress was achieved in Second Half 2018: Growth and Productivity Platform modernisation - Customer Service Hub (CSH) is a major Group program seeking to implement a one bank, multi-brand operating system creating greater efficiencies and a more agile environment. Development through 2018 has focused on simplifying documents and developing a valuation platform ready for its launch in 2019; - Continued roll out of the New Payments Platform (NPP). Capability has now been extended to Tasmania, South Australia and Northern Territory. Over 1.3 million payments, with a total value of over $1.0 billion have been processed on the system; 1 Averages are based on a six month period. 28 | Westpac Group 2018 Full Year Financial Results Announcement $m % Mov't Half Year Sept 18 - Mar 18Mar 18 % Mov't Full YearSept 18 - Sept 17Sept 17 Half Year Full Year Sept 18 Sept 18 Expensed 279 25111 530 47911 Capitalised software and fixed assets 494 38728 881 Total 773 63821 1,411 1,25612 Growth and productivity 446 39114 837 7926 Regulatory change 214 16331 377 Other technology 113 8435 197 Total 773 63821 1,411 1,25612 Number of FTE As at As atAs at% Mov't% Mov't 31 March30 SeptSept 18 -Sept 18 - 20182017Mar 18Sept 17 30 Sept 2018 Permanent employees 31,672 32,03332,044(1)(1) Temporary employees 3,357 FTE 35,029 35,72035,096(2)-Average FTE1 35,362 35,44635,216--
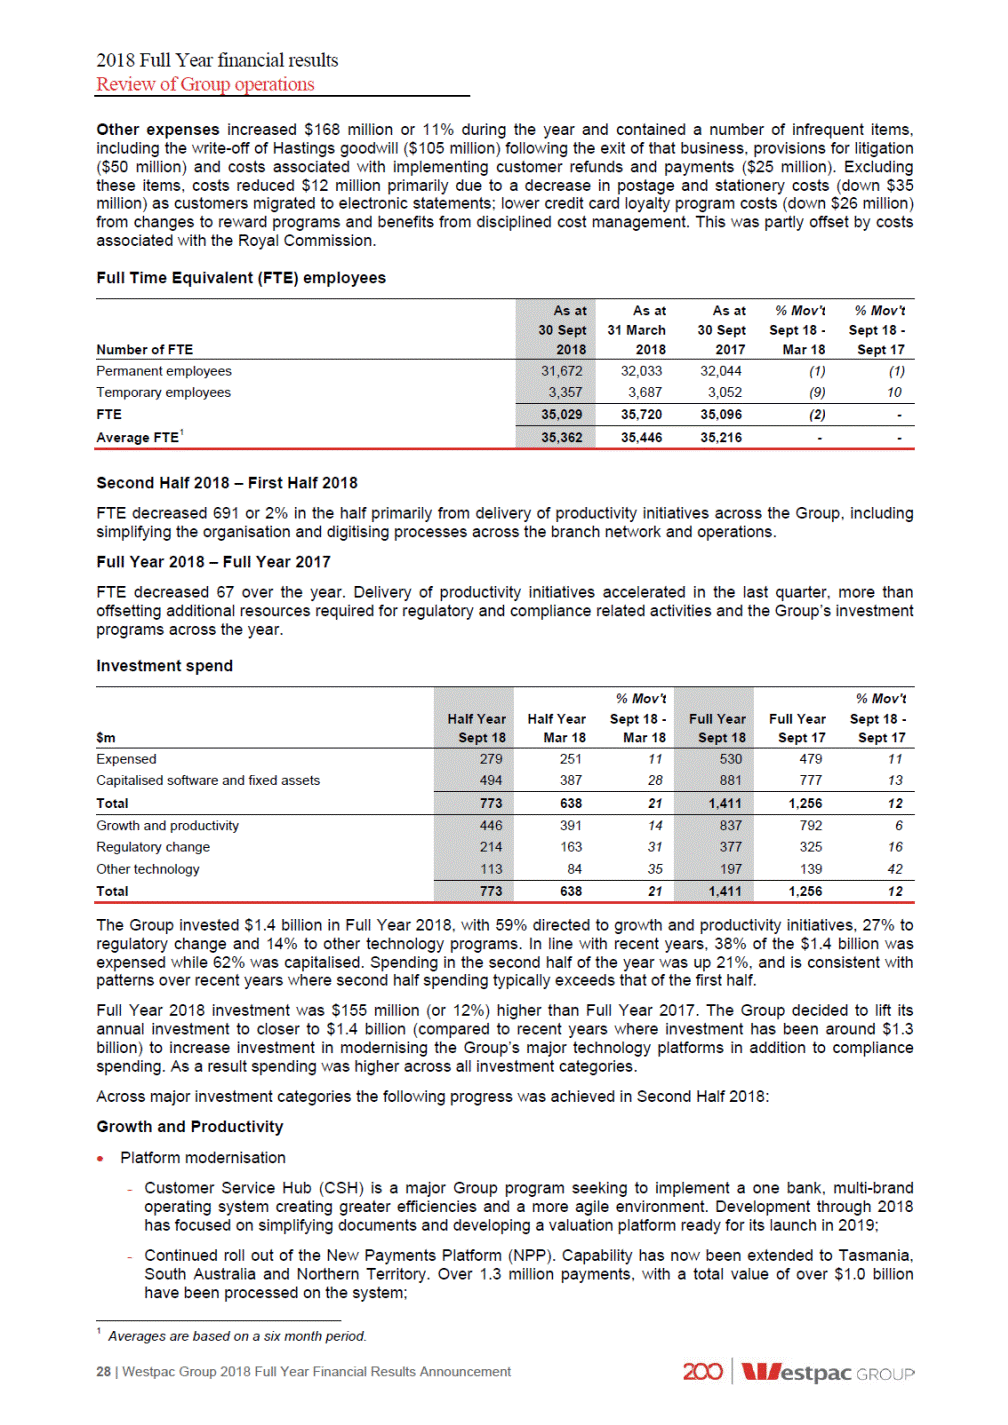
2018 Full Year financial results Review of Group operations - LOLA (online lending platform) has been rolled out to St.George bankers and expanded to include more products and features; and - Additional products and capabilities on Panorama were delivered, including CMA Saver, an interest bearing cash account with no fees and annuities products with integrated account opening and reporting. BT Corporate Super employers have the ability to set up plans online and members can access their super via Panorama and Westpac Live. Advisers can set up client bank accounts online using digital consent capture. Digitising the company - Launched a range of new features for customers to make it easier for them to manage their banking and finances. This includes real time details of Handycard or Debit Mastercard transactions, live chat support, the ability to recover incomplete applications, currency converter, and travel insurance. Customers can now deposit cheques via the mobile banking app, by taking a photo of the cheque with their smartphone; - Launched an Online Home Loan Application – St.George, Bank of Melbourne and BankSA customers can now complete their mortgage application online or via mobile. The process includes on the spot personalised pricing and valuations, live chat support, and ability to stop and re-start the process at any time. Bank of Melbourne customers can receive and sign their mortgage documents electronically through e-sign; - Increased the ways a customer can access their banking, including through simple voice commands with Apple’s Siri, Amazon’s Alexa and Google Assistant. Customers can also transact via wearable devices, such as via FitBit, Garmin and Apple watch; and - Launched Beem It, a third party payment app that allows instant secure payments between family and friends, no matter who they bank with. Beem It was developed jointly with CBA and NAB. Reducing complexity - Expansion of Presto Smart, an integrated payment solution enabling merchants to link payments from different sources to their terminal, removing manual input and reconciliations; and - Closed 27 business deposit products making it easier for customers and bankers. Regulatory Change Major developments over the half included: Delivered a number of regulatory and industry reporting requirements including Common Reporting Standards and Tax Country by Country reporting which supports global tax compliance, reporting of business transactions through the payments systems to the Australian Taxation Office, reporting of life insurance commissions, implementation of AASB 9, and updates to a range of economic and financial statistics reporting; and Continued update of systems and processes to comply with Comprehensive Credit Reporting and Open Banking. Other technology Major initiatives under this category included further upgrades to the Group's infrastructure, migration of applications onto cloud technologies and reducing cybersecurity risks. Capitalised software 766 (614) (14) (3) 15 1 (86) (67) Capitalised software increased 9% over the half and 14% over the year. Contributing to the increase was both higher investment spending (up $155 million over the year) and a higher proportion of investment spent on larger infrastructure programs (CSH, NPP, Panorama) which have a longer assessed life. A number of projects remain in development which has also contributed to the higher capitalisation rate, as amortisation is yet to commence. Westpac Group 2018 Full Year Financial Results Announcement | 29 $m % Mov't Half Year Sept 18 - March 18 Mar 18 % Mov't Full YearSept 18 - Sept 17Sept 17 Half Year Full Year Sept 18 Sept 18 Opening balance 2,005 1,9165 1,916 1,7818 Total additions 493 38927 882 Amortisation expense (317) (301)5 (618) Impairment expense - (2)(100) (2) Foreign exchange translation (4) 3large (1) Closing balance 2,177 2,0059 2,177 1,91614
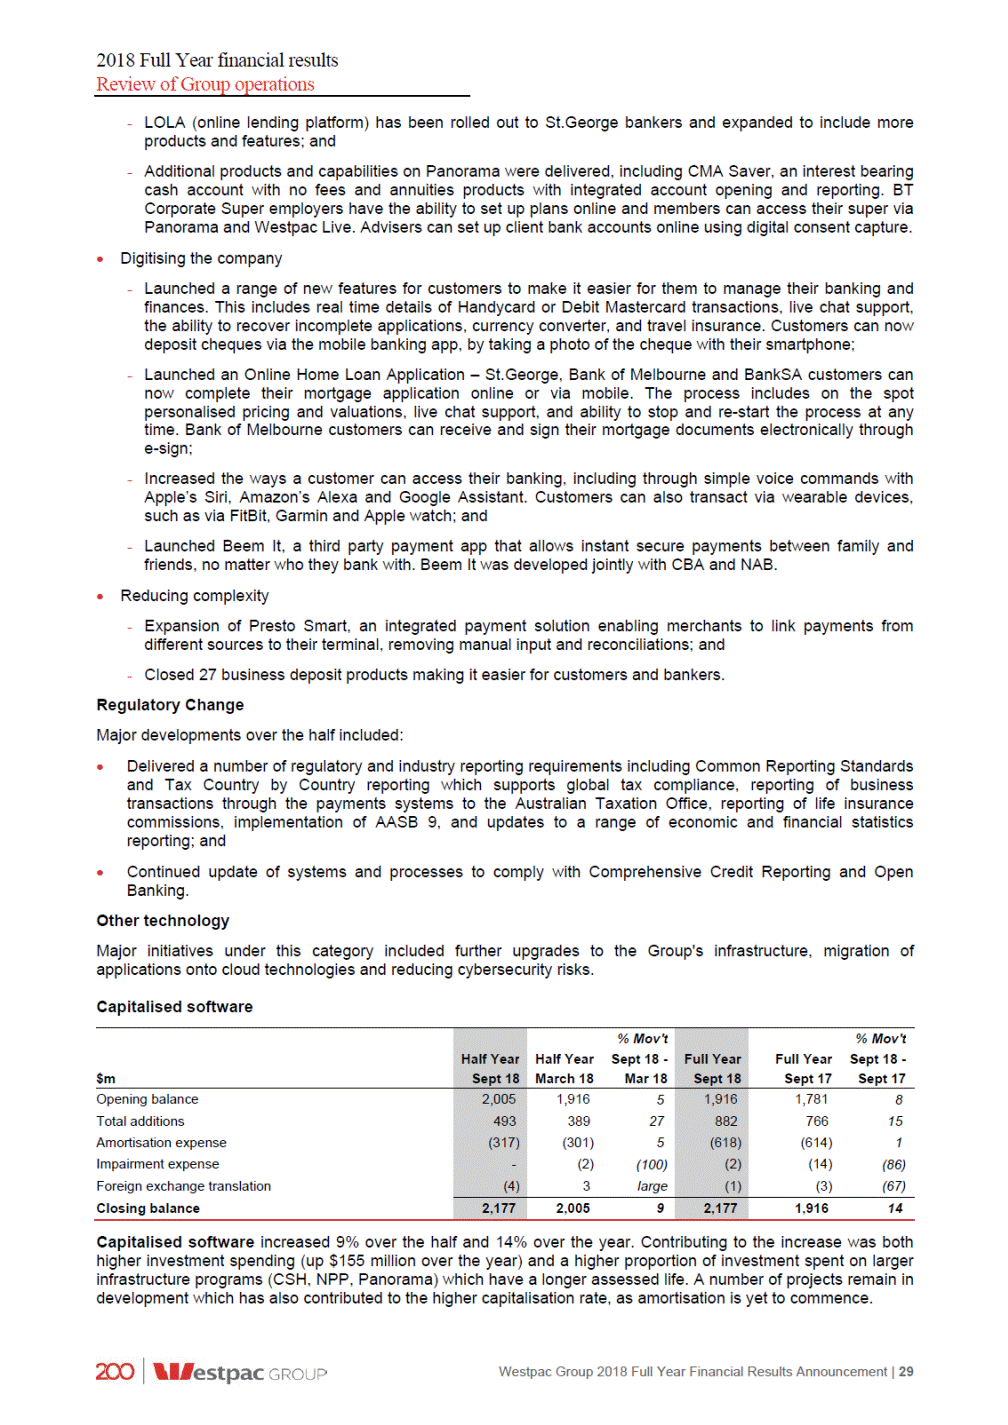
2018 Full Year financial results Review of Group operations Software amortisation was $4 million higher compared to Full Year 2017. In Second Half 2018 amortisation increased $16 million (5%) compared to First Half 2018 as more projects were completed. In addition, as part of the Group’s regular asset review, $2 million in amortised software was assessed as impaired and written off during the year. Overall, the average amortisation period for capitalised software assets is 3.1 years. 30 | Westpac Group 2018 Full Year Financial Results Announcement

2018 Full Year financial results Review of Group operations 2.2.9Impairment charges (610) 288 168 (39) (48) 7 (968) 269 (11) (29) Asset quality remained sound through Full Year 2018 with stressed assets to total committed exposures increasing by 3 basis points to 1.08%. The increase in stress mostly reflects higher mortgage delinquencies and a small rise in stressed exposures in Business Bank. Impaired assets were lower, with gross impaired assets to gross loans 2 basis points lower at 0.20% compared to 30 September 2017. Provisioning levels at 30 September 2018 of $3,053 million were $66 million lower compared to 30 September 2017. IAPs were $58 million lower in line with the decline in impaired facilities while CAPs were $8 million lower. Within collectively assessed provisions the overlay was down $22 million to $301 million at 30 September 2018. Second Half 2018 – First Half 2018 Impairment charges for Second Half 2018 were $317 million, down $76 million compared to First Half 2018, and were equivalent to 9 basis points of average gross loans. The decrease was mostly due to lower total new CAPs. Key movements included: Total IAPs less write-backs and recoveries were $30 million higher than First Half 2018 principally due to: - New IAPs were up $25 million mostly from higher new impaired assets in Business Bank. No facility greater than $50 million migrated to impaired in either half. This rise was partially offset by a small reduction in New Zealand IAPs; and - Recoveries were $21 million lower primarily in the Australian unsecured consumer portfolio and the New Zealand institutional portfolio; partly offset by: - Write-backs were $16 million higher with WIB, Business Bank and New Zealand (in business) all recording a small increase in write-backs. Total new CAPs were $106 million lower than First Half 2018. Key movements included: - Write-offs were $2 million lower in Second Half 2018; - Benefits from other changes in CAPs were $104 million higher related to the seasonal decrease in consumer early cycle delinquencies in Australia and New Zealand. Second Half 2018 continued to benefit from improved conditions in the dairy sector, with lower stressed assets and an associated reduction in provisions; and - The provisioning overlay was reduced $34 million in Second Half 2018 compared to an increase of $12 million in First Half 2018. The reduction in Second Half 2018 was mostly due to provisions utilised or no longer required for New Zealand dairy and the Australian automotive industry. Full Year 2018 – Full Year 2017 Impairment charges for Full Year 2018 of $710 million are equivalent to 10 basis points of average loans and were down $143 million when compared to Full Year 2017. Key movements included: Total new IAPs less write-backs and recoveries were $112 million lower than Full Year 2017. This was due to lower new IAPs (down $239 million) partially offset by lower write-backs. The reduction in new IAPs was due to a small number of large impairments in WIB in Full Year 2017 while in 2018 no new large impaired loans (greater than $50 million) emerged during the year. New IAP’s in Business Bank were also lower. This was partially offset by higher new IAPs in New Zealand; and Westpac Group 2018 Full Year Financial Results Announcement | 31 $m % Mov't Half Year Sept 18 - March 18 Mar 18 % Mov't Full Year Sept 18 - Sept 17Sept 17 Half Year Full Year Sept 18 Sept 18 Individually assessed provisions (IAPs) New IAPs (198) (173)14 (371) Write-backs 83 6724 150 Recoveries 79 100(21) 179 Total IAPs, write-backs and recoveries (36) (6)large (42) (154)(73) Collectively assessed provisions (CAPs) Write-offs (428) (430)-(858) Other changes in CAPs 147 43large 190 Total new CAPs (281) (387)(27) (668) (699)(4) Total impairment charges (317) (393)(19) (710) (853)(17)

2018 Full Year financial results Review of Group operations Total new CAPs were $31 million lower due to a $110 million reduction in write-offs partially offset by a $79 million fall in the benefit from other changes in CAPs. Write-offs were lower, principally in Consumer Bank from the credit card portfolio and in Business Bank related to the auto finance and commercial portfolios. The overlay was $22 million lower over Full Year 2018 compared to a $66 million reduction in Full Year 2017. 2.2.10 Income tax expense Second Half 2018 – First Half 2018 The effective tax rate of 31.3% in Second Half 2018 was higher than the 30.3% recorded in First Half 2018. The increase was largely due to the non-deductibility of certain expenses, including penalties and the write-off of Hastings goodwill associated with the exit of that business. Full Year 2018 – Full Year 2017 The effective tax rate of 30.8% in Full Year 2018 is higher than the 30.4% recorded in Full Year 2017. The increase was largely due to the non-deductibility of certain expenses, including penalties and the write-off of Hastings goodwill associated with the exit of that business. 2.2.11 Non-controlling interests Non-controlling interests represent profits of non-wholly owned subsidiaries attributable to shareholders other than Westpac. These include profits attributable to the 10.1% shareholding in Westpac Bank-PNG-Limited and the 25% shareholding in St.George Motor Finance Limited that are not owned by Westpac. 32 | Westpac Group 2018 Full Year Financial Results Announcement

2018 Full Year financial results Review of Group operations 2.3 Credit quality Credit quality remained sound over the year with total stressed exposures to TCE increasing modestly and remaining low relative to historical experience. Stressed exposures to TCE were 1.08%, 3 basis points higher than 30 September 2017 and 1 basis point lower compared to 31 March 2018 (see 2.3.1 Credit quality key metrics). The 3 basis points rise in stressed assets relates to 90 days past due and not impaired facilities which increased by 5 basis points over the year, partially offset by a 1 basis point reduction in both impaired and in watchlist and substandard facilities. The increase in 90 day past due and not impaired was due to an increase in mortgage 90 + day delinquencies and a small increase in business facilities. Provisioning levels at 30 September 2018 of $3,053 million were $66 million lower compared to 30 September 2017, due mainly to a decrease in IAPs from the workout of impaired facilities. The ratio of gross impaired asset provisions to gross impaired assets remains high at 46.1%, while the ratio of collectively assessed provisions to credit risk weighted assets was lower at 73 basis points. Portfolio segments The institutional segment continued to perform well – this has been reflected in no new large (greater than $50 million) facilities migrating to impaired over the last 18 months. With little growth in new stressed facilities, the overall level of stressed assets has reduced as the Group continued to work-out existing stressed assets through refinance or repayment. The tightening of standards on new commercial property lending over recent years has continued to contribute to relatively low levels of stress. At 30 September 2018 the level of stressed assets to TCE was 1.7% and remains well below long term averages. Over the year, stress has increased modestly (up from 1.3%) with the rise due predominantly to a small number of medium sized apartment developments becoming stressed. The small and medium business portfolio has seen stress emerge in a small number of companies in Second Half 2018. Over recent years, new stress has typically been concentrated in Western Australia (WA) and Queensland (Qld), consistent with the more challenging conditions in those states. In 2018, new stress in these markets has abated and new stressed assets have tended to originate in South Australia (SA), Victoria (Vic) and New South Wales (NSW). Over the year, there has been little stress emerge in the agriculture portfolio from drought conditions evident in NSW and Qld. New stress has been more prevalent in the retail trade and health sectors. The New Zealand business portfolio has continued to benefit from the improving prospects of the New Zealand dairy sector with a number of facilities returning to performing. The credit quality of the mortgage portfolio remains sound with Australian mortgage 90+ day delinquencies 5 basis points higher over the twelve months to 30 September 2018 to end the year at 0.72%. The rise in delinquencies has been more broadly spread across the country. This year NSW delinquencies have risen from a low base and while they remain below the portfolio average, given NSW accounts for a large portion of the Group’s portfolio it had the largest influence on overall delinquencies. Australian properties in possession decreased over Full Year 2018 by 41 to 396 due principally to those states and regions impacted by the slowing of the mining investment cycle which had seen elevated levels in Second Half 2017. Realised mortgage losses for the Group were $89 million for Full Year 2018, equivalent to 2 basis points. Consumer unsecured delinquencies were higher over Full Year 2018. Total Group other consumer 90+ day delinquencies were 1.64%, up 7 basis points since 30 September 2017 and were unchanged compared to 31 March 2018. New Zealand mortgage 90+ day delinquencies decreased 1 basis point from 30 September 2018 to 0.11% and improved 5 basis points in Second Half 2018 in line with seasonal trends. Delinquencies remain at or near historical lows and reflect the favourable economic conditions, and the positive impact of prudential controls reducing the level of higher LVR lending. New Zealand unsecured delinquencies were higher at 0.62%. Other consumer 90+ day delinquencies increased 5 basis points since 30 September 2017 and were 24 basis points lower than 31 March 2018. Provisioning Westpac has maintained adequate provisioning coverage: The ratio of gross impaired asset provisions to gross impaired assets remain high at 46.1% (46.3% at 30 September 2017); and The ratio of collectively assessed provisions to credit risk weighted assets was 73 basis points with the ratio down 2 basis points compared to 30 September 2017. Most of the decline is due to higher risk weighted assets, mostly from mortgage RWA modelling changes. Westpac Group 2018 Full Year Financial Results Announcement | 33

2018 Full Year financial results Review of Group operations 2.3.1 Credit quality key metrics 0.15% 0.37% 0.57% 0.15% 0.34% 0.56% 0.20% 0.35% 0.59% 0.48% 0.74% 0.04% 0.47% 0.62% 0.06% 0.63% 0.68% 0.17% 0.65% 0.69% 0.16% 0.62% 0.67% 0.12% 0.63% 0.67% 0.14% 1.64% 1.71% 0.86% 1.57% 1.66% 0.57% 1.55% 1.63% 0.58% 0.22% 45.54% 45bps 65bps 75bps 76bps 11bps 13bps 0.22% 46.30% 45bps 65bps 76bps 77bps 11bps 25bps 0.30% 52.07% 52bps 67bps 77bps 87bps 15bps 19bps 1 Averages are based on a six month period. 34 | Westpac Group 2018 Full Year Financial Results Announcement As at As atAs atAs at 31 March30 Sept31 March 201820172017 30 Sept 2018 Stressed exposures by credit grade as a % of TCE: Impaired 90 days past due and not impaired Watchlist and substandard Total stressed exposures Gross impaired assets to TCE for business and institutional: Business Australia Business New Zealand Institutional Mortgage 90+ day delinquencies: Group Australia New Zealand Other consumer loans 90+ day delinquencies: Group Australia New Zealand Other: Gross impaired assets to gross loans Gross impaired asset provisions to gross impaired assets Total provisions to gross loans Collectively assessed provisions to risk weighted assets Collectively assessed provisions to credit risk weighted assets Total provisions to risk weighted assets Impairment charges to average loans annualised1 Net write-offs to average loans annualised1 0.14% 0.39% 0.55% 1.08% 0.47% 0.50% 0.02% 0.67% 0.72% 0.11% 1.64% 1.73% 0.62% 0.20% 46.12% 43bps 62bps 73bps 72bps 9bps 14bps 1.09%1.05%1.14%
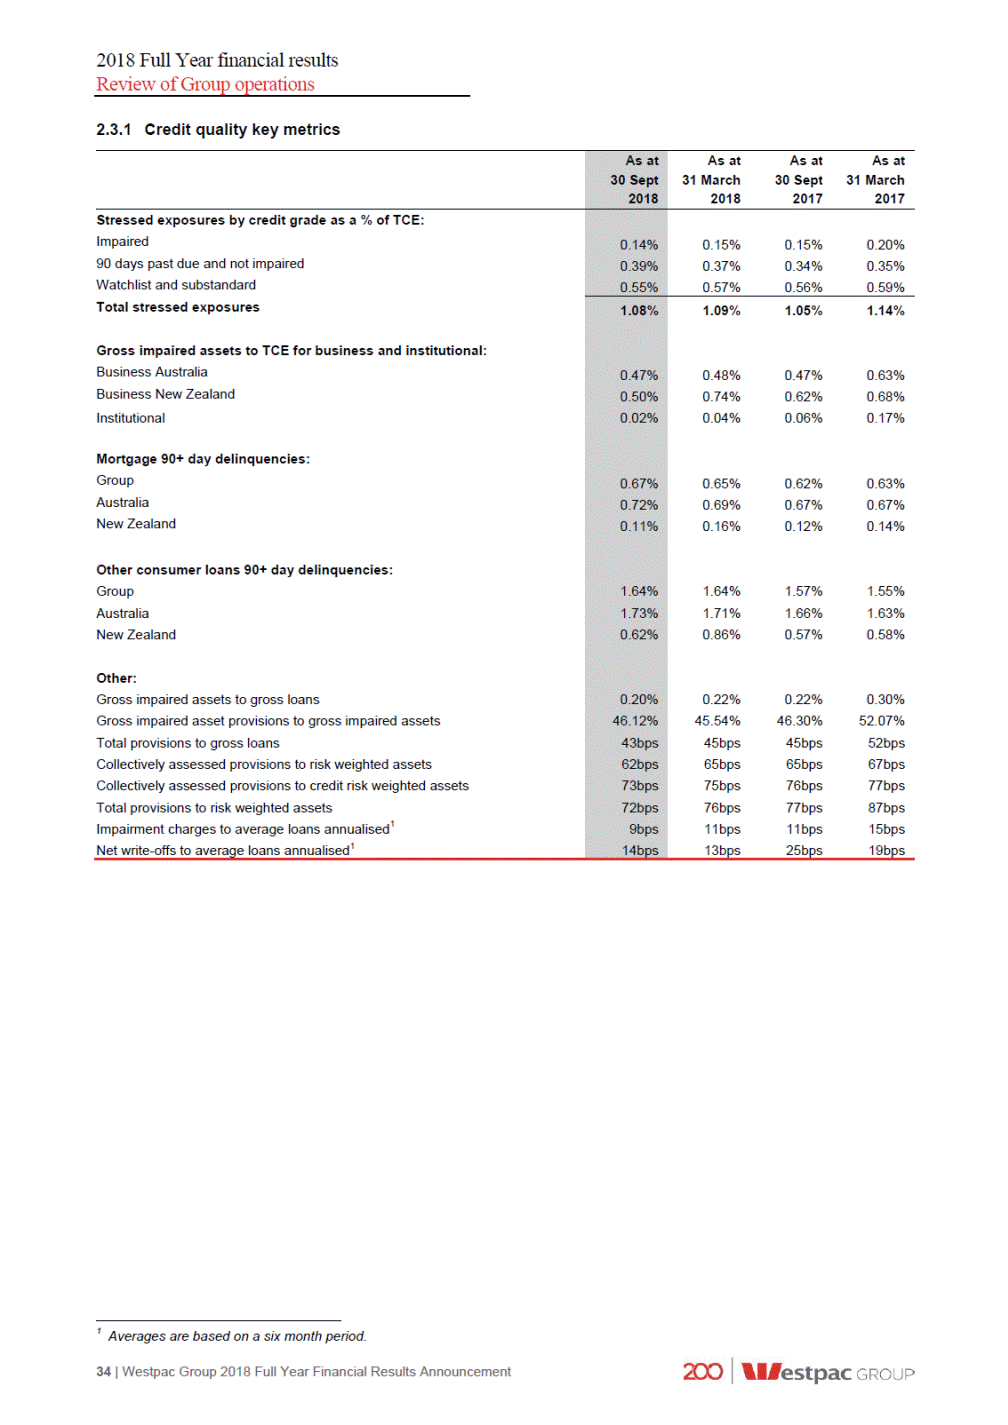
2018 Full Year financial results Review of Group operations 2.4 2.4.1 Balance sheet and funding Balance sheet 21,580 3,977 18,397 7,128 22 46 44 (19) 85,484 26,904 701,393 10,481 22,036 86,034 24,033 684,919 10,643 20,721 (3) (10) 1 (10) (5) (3) - 4 (11) 1 19,073 547,736 5,590 24,066 174,138 8,763 18,333 11,491 21,907 533,591 4,056 25,375 168,356 9,019 17,666 10,563 (5) 2 (23) 1 (1) (13) (6) - (17) 5 6 (4) 3 (16) (2) 8 62,615 50 61,288 54 3 4 5 (4) Second Half 2018 – First Half 2018 Key movements during the half included: Assets Cash and balances with central banks increased $4.9 billion or 22% reflecting higher liquid assets held in this form; Receivables due from other financial institutions increased $1.8 billion or 46% mainly due to an increase in collateral posted with derivative counterparties and higher interbank lending; Trading securities and financial assets designated at fair value and available-for-sale securities decreased $2.2 billion or 3% reflecting lower holdings of liquid assets in this form; Derivative assets decreased $2.8 billion or 10% mainly driven by foreign currency translation impacts on cross currency swaps and forward contracts, and movements in interest rate swaps; Loans grew $8.3 billion or 1%. Refer to Section 2.2.2 Loans for further information; and Life insurance assets decreased $1.0 billion or 10%, due to the transfer by an investor to another Group managed fund that is not consolidated. Liabilities Payables due to other financial institutions decreased $0.9 billion or 5% due to lower securities sold under agreements to repurchase, and collateral posted by derivative counterparties, partly offset by higher interbank borrowings and offshore central bank deposits; Deposits and other borrowings increased $11.5 billion or 2%. Refer to Section 2.2.3 Deposits and other borrowings for further information; Other financial liabilities at fair value through the income statement decreased $1.3 billion or 23% reflecting lower securities sold under agreements to repurchase; Westpac Group 2018 Full Year Financial Results Announcement | 35 $m As at As atAs at% Mov't% Mov't 31 March30 SeptSept 18 -Sept 18 - 20182017Mar 18Sept 17 30 Sept 2018 Assets Cash and balances with central banks 26,431 Receivables due from other financial institutions 5,790 Trading securities and financial assets designated at fair value and available-for-sale securities 83,253 Derivative financial instruments 24,101 Loans 709,690 Life insurance assets 9,450 Other assets 20,877 Total assets 879,592 871,855851,87513 Liabilities Payables due to other financial institutions 18,137 Deposits and other borrowings 559,285 Other financial liabilities at fair value through income statement 4,297 Derivative financial instruments 24,407 Debt issues 172,596 Life insurance liabilities 7,597 Loan capital 17,265 Other liabilities 11,435 Total liabilities 815,019 809,190790,53313 Equity Total equity attributable to owners of Westpac Banking Corporation 64,521 Non-controlling interests 52 Total equity 64,573 62,66561,34235

2018 Full Year financial results Review of Group operations Life insurance liabilities decreased $1.2 billion or 13%, due to the transfer by an investor to another Group managed fund that is not consolidated; Debt issues decreased $1.5 billion or 1% ($7.8 billion or 4% decrease excluding foreign currency impacts). Refer to Section 2.4.2 Funding and liquidity risk management for further information; and Loan capital decreased $1.1 billion or 6% as maturities exceeded new issuance for Tier 2 capital instruments offset by higher Additional Tier 1 capital. Equity attributable to owners of Westpac Banking Corporation increased $1.9 billion or 3% reflecting retained profits less dividends paid during the period and shares issued under the 2018 interim dividend reinvestment plan (DRP) and the conversion of some convertible preference shares to ordinary share capital. Full Year 2018 – Full Year 2017 Key movements included: Assets Cash and balances with central banks increased $8.0 billion or 44% reflecting higher liquid assets held in this form; Receivables due from other financial institutions decreased $1.3 billion or 19% mainly due to a reduction in collateral posted with derivative counterparties and lower interbank lending; Trading securities and financial assets designated at fair value and available-for-sale securities decreased $2.8 billion or 3% reflecting lower holdings of liquid assets in this form; Loans grew $24.8 billion or 4%. Refer to Section 2.2.2 Loans for further information; and Life insurance assets decreased $1.2 billion or 11%, due to the transfer by an investor to another Group managed fund that is not consolidated. Liabilities Payables due to other financial institutions decreased $3.8 billion or 17% due to lower securities sold under agreements to repurchase, interbank borrowings and collateral posted by derivative counterparties, partly offset by higher offshore central bank deposits; Deposits and other borrowings increased $25.7 billion or 5%. Refer to Section 2.2.3 Deposits and other borrowings for further information; Debt issues increased $4.2 billion or 3% ($6.8 billion or 4% decrease excluding foreign currency impacts). Refer to Section 2.4.2 Funding and liquidity risk management for further information; and Life insurance liabilities decreased $1.4 billion or 16%, due to the transfer by an investor to another Group managed fund that is not consolidated. Equity attributable to owners of Westpac Banking Corporation increased $3.2 billion reflecting retained profits less dividends paid during the period and shares issued under the 2018 interim DRP and 2017 final DRP and the conversion of some convertible preference shares to ordinary share capital. 36 | Westpac Group 2018 Full Year Financial Results Announcement
2018 Full Year financial results Review of Group operations 2.4.2 Funding and liquidity risk management Liquidity risk is the risk that the Group will be unable to fund assets and meet obligations as they become due. This type of risk is inherent for all banks through their role as intermediaries between depositors and borrowers. The Group has a liquidity risk management framework which seeks to meet the objective of meeting cash flow obligations under a wide range of market conditions, including name specific and market-wide stress scenarios, as well as meeting the regulatory requirements of the LCR and NSFR1. In Full Year 2018 the Group maintained an appropriate funding and liquidity profile. Key measures of balance sheet strength and funding and liquidity metrics remained comfortably above regulatory minimums at 30 September 2018, including an LCR of 133% and an NSFR of 114%. Liquid Assets The Group’s liquid asset portfolio includes both high-quality liquid assets (HQLA) and other securities that are eligible for repurchase with a central bank. In total, Westpac held $153.7 billion in unencumbered liquid assets as at 30 September 2018 (31 March 2018: $147.6 billion; 30 September 2017: $137.8 billion). At 30 September 2018 the portfolio comprised: $76.3 billion of cash, deposits at central banks, government and semi-government bonds; $21.9 billion of repo-eligible private securities; and $55.5 billion of self-originated AAA rated mortgage backed securities, which are eligible collateral for repurchase agreement with the RBA or the RBNZ. LCR The LCR requires banks to hold sufficient HQLA, as defined, to withstand 30 days under a regulator-defined acute stress scenario. Given the limited amount of government debt in Australia, the RBA, jointly with APRA, makes available to ADIs a CLF. Subject to satisfaction of qualifying conditions, the CLF can be accessed to help meet the LCR requirement. In order to have access to a CLF, ADIs are required to pay a fee of 15 basis points (0.15%) per annum to the RBA on the approved undrawn facility. APRA approved Westpac’s CLF allocation of $57 billion for the 2018 calendar year (2017 calendar year: $49 billion). APRA has approved a CLF allocation for Westpac of $54 billion for the 2019 calendar year. The Group’s LCR as at 30 September 2018 was 133% (31 March 2018: 134%; 30 September 2017: 124%) and the average LCR for the quarter ended 30 September 2018 was 131%2. NSFR The Group is required to maintain a NSFR, designed to encourage longer-term funding resilience, of at least 100%. The NSFR came into effect for Australian ADIs on 1 January 2018. Westpac had a NSFR of 114% at 30 September 2018 (31 March 2018: 112%). Improvement in the ratio since 31 March 2018 mainly reflects growth in customer deposits and higher capital balances. Funding The Group monitors the composition and stability of its funding so that it remains within the Group’s funding risk appetite. This includes compliance with both the LCR and NSFR. The Group’s funding composition improved over Full Year 2018, with an increase in the proportion of stable funding. Customer deposits as a proportion of total funding increased by 127 basis points to 63.1% (30 September 2017: 61.8%), while the proportion of long term funding to total funding increased by 45 basis points to 15.7% (30 September 2017: 15.2%). There was little change in other sources of stable funding, with securitisation and equity to total funding remaining relatively stable. Short term wholesale funding as a proportion of total funding decreased by 165 basis points to 12.4% (30 September 2017: 14.1%). The Group’s short term funding portfolio (including long term to short term scroll) of $102 billion has a weighted average maturity of 151 days and is more than covered by the $153.7 billion of repo-eligible liquid assets held by the Group. In Full Year 2018, the Group raised $32 billion of long term wholesale funding. The majority of new issuance came in the form of senior unsecured and covered bond format, in core currencies of AUD, USD, EUR and GBP. The Group also continued to benefit from its position as the only major Australian bank with an active Auto ABS capability and the only Australian bank with access to the US SEC registered market, raising funds in both these markets during the year. New term issuance also included $3 billion of Basel III compliant Additional Tier 1 and Tier 2 capital. 1 Refer to Glossary for definition. 2 Calculated as a simple average of the daily observations over the 30 September 2018 quarter. Westpac Group 2018 Full Year Financial Results Announcement | 37

2018 Full Year financial results Review of Group operations The Group maintained its consistent approach to lengthening the tenor of its long term funding portfolio. In Full Year 2018, 76% of new term issuance had a contractual maturity of five years or more and this contributed to a weighted average maturity (excluding securitisation) of new term issuance in Full Year 2018 of 6.5 years (Full Year 2017: 5.8 years). Liquidity coverage ratio 57,000 49,100 - 16 66,222 8,411 21,405 65,612 12,231 20,109 6 14 (4) 7 (22) 2 Net stable funding ratio4 529,100 521,048 - 2 Funding by residual maturity 61,245 16,973 27,522 7.6 2.1 3.4 63,173 19,776 27,955 8.0 2.5 3.6 105,740 13.1 110,904 14.1 128,921 16.0 119,494 15.2 137,107 17.0 127,703 16.2 Deposits to net loans ratio1 701,393 684,919 71.6 71.1 1 Refer to Glossary for definition. 2 Other flows include credit and liquidity facilities, collateral outflows and inflows from customers. 3 Calculated on a spot basis. 4 The NSFR was effective from 1 January 2018 for ADIs. 5 Scroll represents wholesale funding with an original maturity greater than 12 months that now has a residual maturity less than 12 months. 6 Includes total share capital, share based payments reserve and retained profits. 38 | Westpac Group 2018 Full Year Financial Results Announcement As at 30 Sept 2018 As at 31 March 2018As at 30 Sept 2017 $mRatio %$mRatio % $mRatio % Customer deposits 517,751 502,063486,670 Net loans 709,69073.0 As at 30 Sept 2018 As at 31 March 2018As at 30 Sept 2017 $mRatio %$mRatio % $mRatio % Wholesale funding Less than 6 months 53,6496.5 6 to 12 months 18,5372.3 Long term to short term scroll5 29,8943.6 Wholesale funding - residual maturity less than 12 months 102,08012.4 Securitisation 7,5880.9 8,1861.08,2091.0 Greater than 12 months 128,27615.7 Wholesale funding - residual maturity greater than 12 months 135,86416.6 Customer deposits 517,75163.1 502,06362.1486,67061.8 Equity6 64,9787.9 63,2257.861,9257.9 Total funding 820,673100.0 808,135100.0787,202100.0 $m Proforma As atas at% Mov't% Mov't 31 March30 SeptSept 18 -Sept 18 - 20182017Mar 18Sept 17 As at 30 Sept 2018 Available stable funding 601,184 593,669566,30416 Required stable funding 529,463 Net stable funding ratio 114% 112%109%135bpslarge $m As at As atAs at% Mov't% Mov't 31 March30 SeptSept 18 -Sept 18 - 20182017Mar 18Sept 17 30 Sept 2018 High Quality Liquid Assets (HQLA)1 76,482 71,95271,90466 Committed Liquidity Facility (CLF)1 57,000 Total LCR liquid assets 133,482 128,952121,004410 Cash outflows in a modelled 30-day APRA defined stressed scenario Customer deposits 70,348 Wholesale funding 9,570 Other flows2 20,476 Total 100,394 96,03897,95252 LCR3 133% 134%124%(131bps)large
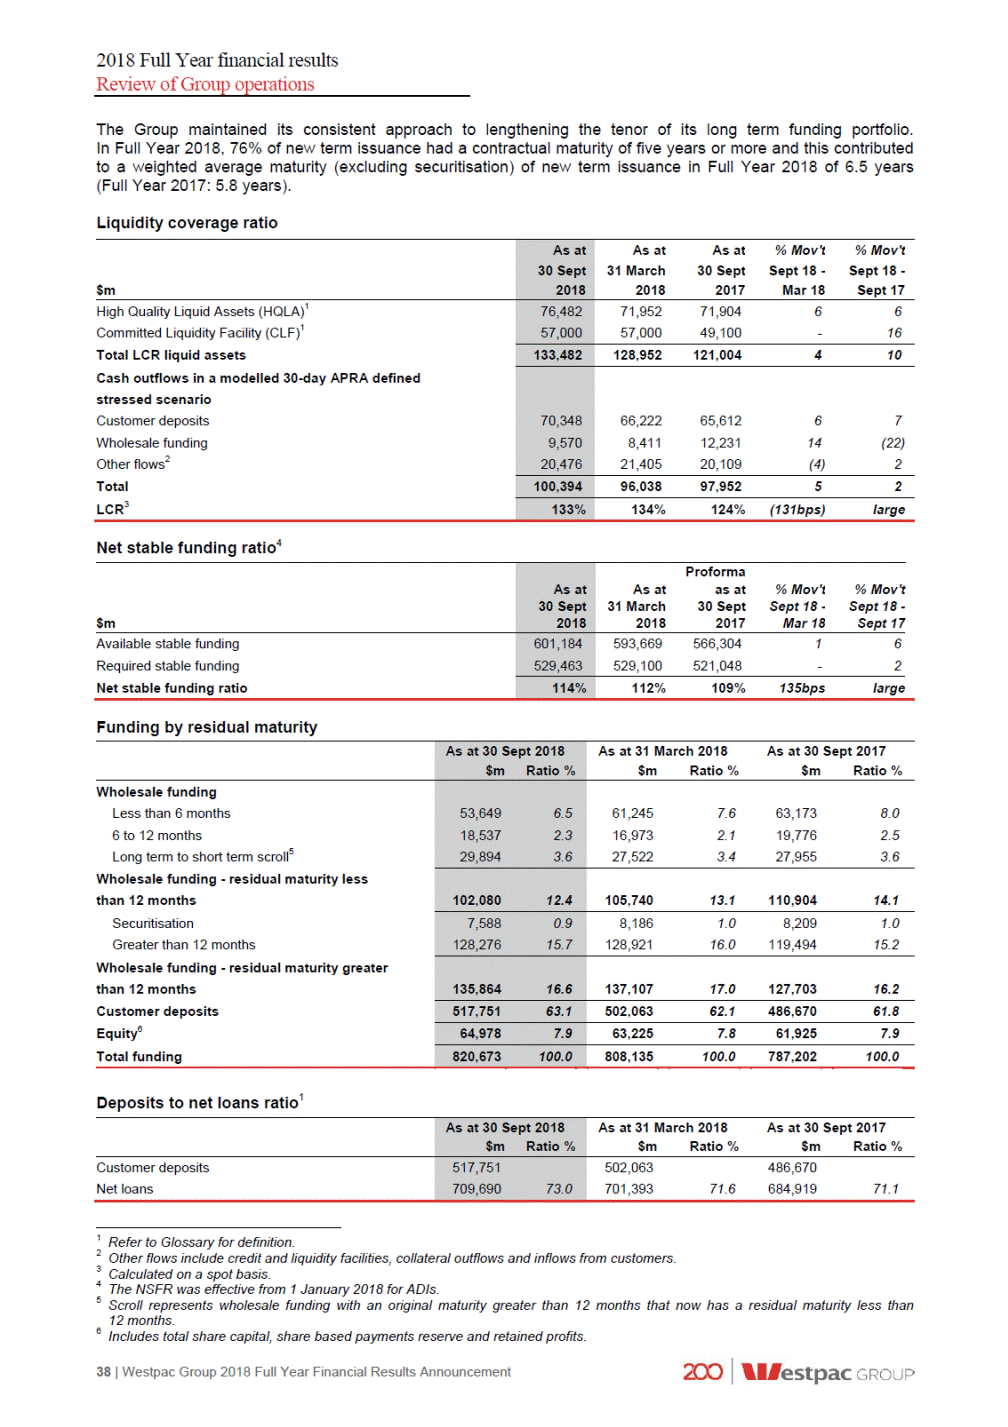
2018 Full Year financial results Review of Group operations Funding view of the balance sheet As at 31 Mar 2018 Total assets Total liabilities Total equity Total Net loans2 147,634 - - - (502,063) - - (242,847) - 660,417 - (63,225) 63,804 (64,280) 560 871,855 (809,190) (62,665) 147,634 (502,063) (242,847) 597,192 84 - 55,058 - - 646,335 - 701,393 As at 30 Sept 2017 Total assets Total liabilities Total equity Total Net loans2 137,797 - - - (486,670) - - (238,607) - 651,573 - (61,925) 62,505 (65,256) 583 851,875 (790,533) (61,342) 137,797 (486,670) (238,607) 589,648 (2,168) - 47,935 - - 636,984 - 684,919 1 Refer to Glossary for definition. 2 Liquid assets in net loans include internally securitised assets that are eligible for repurchase agreements with the RBA / RBNZ. Westpac Group 2018 Full Year Financial Results Announcement | 39 $m Total liquidCustomerWholesaleCustomerMarket assets1depositsfundingfranchiseinventoryTotal As at 30 Sept 2018 Total assets 153,694--668,23757,661879,592 Total liabilities -(517,751)(237,944)-(59,324)(815,019) Total equity ---(64,978)405(64,573) Total 153,694(517,751)(237,944)603,259(1,258)-Net loans2 55,500--654,190-709,690
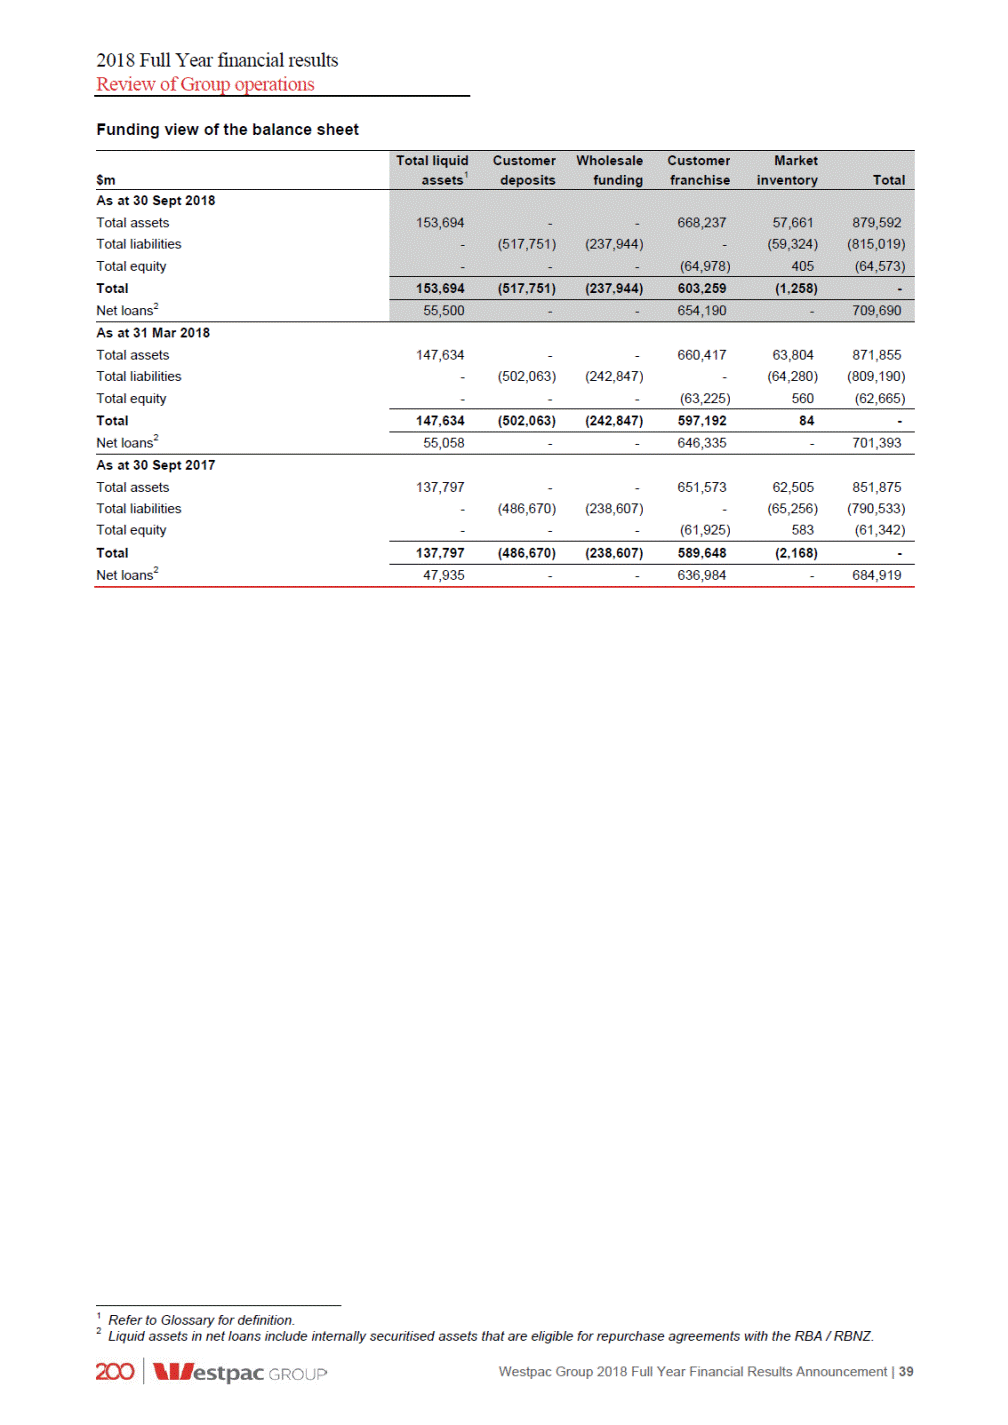
2018 Full Year financial results Review of Group operations 2.5 Capital and dividends 43,639 415,744 42,670 404,235 4 2 6 5 2.31% 2.10% (16bps) 5bps 2.02% 2.16% (6bps) (20bps) Capital management strategy In light of APRA’s announcement on ‘unquestionably strong’ capital benchmarks on 19 July 2017, Westpac will seek to operate with a CET1 capital ratio of at least 10.5% in March and September as measured under the existing capital framework. This also takes into consideration: Current regulatory capital minimums and the capital conservation buffer (CCB), which together are the total CET1 requirement. In line with the above, the total CET1 requirement for Westpac is at least 8.0%, based upon an industry minimum CET1 requirement of 4.5% plus a capital buffer of at least 3.5% applicable to domestic systemically important banks (D-SIBs)2; Stress testing to calibrate an appropriate buffer against a downturn; and Quarterly volatility of capital ratios due to the half yearly cycle of ordinary dividend payments. Should the CET1 capital ratio fall below the total CET1 requirement, restrictions on the distribution of earnings will apply. This includes restrictions on the amount of earnings that can be distributed through dividends, Additional Tier 1 capital distributions and discretionary staff bonuses. Westpac will revise its target capital level once APRA finalises its review of the capital adequacy framework. Common Equity Tier 1 capital ratio movement for Second Half 2018 31 Mar 2018 Cash earnings Interim dividend (net of DRP) Ordinary RWA growth Other capital movements Impact of RWA model changes $566m residual CPS converted Exit of investments FX translation impact 30 Sep 2018 Westpac’s CET1 capital ratio was 10.63% at 30 September 2018, up 13 basis points from 31 March 2018. The increase was principally due to 20 basis points of organic capital growth and conversion of some preference shares (14 basis points increase), with these items partially offset by regulatory measurement changes of 30 basis points for mortgage risk weights and operational risk RWA. Organic capital generation of 20 basis points included: Second Half 2018 cash earnings of $3.8 billion (90 basis point increase); The 2018 interim dividend payment, net of DRP share issuance (68 basis point decrease); 1 Refer to Glossary for definition. 2 Noting that APRA may apply higher CET1 requirements for an individual ADI. 40 | Westpac Group 2018 Full Year Financial Results Announcement 10.50% 90bps 5bps 4bps 10.63% 3bps (68bps) (5bps) 14bps (30bps) Organic Other items (+20bps) (-7bps) As at As atAs at% Mov't% Mov't 31 March30 SeptSept 18 -Sept 18 - 20182017Mar 18Sept 17 30 Sept 2018 Regulatory capital structure Common equity Tier 1 capital after deductions ($m) 45,239 Risk weighted assets (RWA) ($m) 425,384 Common equity Tier 1 capital ratio (CET1) 10.63% 10.50%10.56%13bps7bps Additional Tier 1 capital ratio 2.15% Tier 1 capital ratio 12.78% 12.81%12.66%(3bps)12bps Tier 2 capital ratio 1.96% Total regulatory capital ratio 14.74% 14.83%14.82%(9bps)(8bps) APRA leverage ratio1 5.84% 5.75%5.66%9bps18bps

2018 Full Year financial results Review of Group operations Ordinary RWA (3 basis point increase); and A 5 basis point reduction from other capital movements. Other items, in aggregate, reduced the CET1 capital ratio by 7 basis points. Regulatory measurement changes impacting mortgages and operational risk RWA (30 basis point decrease) were mostly offset by the conversion of $566m of convertible preference shares to ordinary shares (14 basis point increase), the exit of Hastings and the reduction in equity investments in Ascalon (5 basis point increase) and foreign currency translation impacts (4 basis point increase). Additional Tier 1 and Tier 2 capital movement for Second Half 2018 During the half Westpac: Converted $566 million of convertible preference shares to ordinary shares (14 basis point decrease to the additional Tier 1 capital ratio); Issued $0.7 billion of new Tier 2 capital instruments (17 basis point increase); and Redeemed $0.9 billion of Tier 2 capital instruments (22 basis points decrease). Common Equity Tier 1 capital ratio movement for Full Year 2018 30 Sep 2017 Cash earnings Dividends (net of DRP) Ordinary RWA growth Other capital movements Impact of RWA model changes $566m residual CPS converted Exit of investments FX translation impact 30 Sep 2018 The 30 September 2018 CET1 capital ratio of 10.63%, 7 basis points higher than reported at 30 September 2017, mostly reflects organic capital generation (38 basis point increase), conversion of $566 million of convertible preference shares (14 basis point increase) and the exit of Hastings and reduction in equity investments in Ascalon (5 basis point increase) offset by regulatory modelling changes (52 basis point decrease). Leverage ratio The leverage ratio represents the amount of Tier 1 capital relative to exposure. At 30 September 2018, Westpac’s leverage ratio was 5.8%1, up 9 basis points since 31 March 2018. Internationally comparable capital ratios The APRA Basel III capital adequacy requirements are more conservative than those of the Basel Committee on Banking Supervision (BCBS), leading to lower reported capital ratios when compared to international peers. APRA conducted a study in July 2015 outlining its methodology for measuring international comparable capital ratios. For details on the adjustments refer to Westpac’s 2018 Full Year Investor Discussion Pack. The table below calculates the Group’s reported capital ratios consistent with this methodology. 16.13% 19.06% 21.68% 6.39% 16.20% 18.64% 21.09% 6.33% 1bps (4bps) (18bps) 9bps (6bps) 38bps 41bps 15bps 1 The leverage ratio is based on the same definition of Tier 1 as used for APRA capital requirements and is not comparable to the Basel Committee for Banking Supervision leverage ratio calculation. Westpac Group 2018 Full Year Financial Results Announcement | 41 As at As atAs at% Mov't% Mov't 31 March30 SeptSept 18 -Sept 18 - 20182017Mar 18Sept 17 30 Sept 2018 Internationally comparable capital ratios Common equity Tier 1 capital ratio 16.14% Tier 1 capital ratio 19.02% Total regulatory capital ratio 21.50% Leverage ratio 6.48% 10.56% 192bps 14bps 5bps 2bps 10.63% (138bps) (5bps) (11bps) (52bps) Organic Other items (+38bps) (-31bps)

2018 Full Year financial results Review of Group operations Risk Weighted Assets (RWA) 34,872 1,536 6,253 129,748 6,553 14,056 16,017 57,239 5,869 10,639 7,019 34,638 1,505 5,905 127,825 5,665 13,250 11,708 57,081 4,167 9,946 6,408 2 7 6 2 (4) (2) 2 - 1 1 (6) 2 9 12 4 11 4 39 - 42 8 3 7,406 30,866 12,875 3,206 8,094 31,229 11,101 4,553 (9) 27 1 19 (17) 25 17 (16) Second Half 2018 – First Half 2018 Total RWA increased $9.6 billion this half: Credit risk RWA increased $1.4 billion or 0.4% from: -Regulatory modelling updates to mortgage probability of default increased mortgage RWA by $4.1 billion; -Portfolio growth (mostly mortgages) added $1.5 billion to RWA; -Credit quality improvements, mainly from mortgages, decreased RWA by $3.4 billion; -Foreign currency translation impacts, mainly related to NZ$ lending, decreased RWA by $0.4 billion; and -Decrease in mark-to-market related credit risk RWA of $0.4 billion. Non-credit RWA increased $8.2 billion or 15.2%, mostly from a $7.5 billion increase to operational risk RWA as we introduced a model overlay to approximate the standardised approach. 1 Corporate – typically includes exposure where the borrower has annual turnover greater than $50 million, and other business exposures not captured under the definitions of either Business lending or Small Business. 2 Business lending – includes exposures not captured elsewhere where the borrower has annual turnover less than or equal to $50 million. 3 Sovereign – includes exposures to governments themselves and other non-commercial enterprises that are owned or controlled by them. 4 Bank – includes exposures to licensed banks and their owned or controlled subsidiaries, and overseas central banks. 5 Small business – program managed business lending exposures. 6 Specialised lending – property and project finance – includes exposures to entities created to finance and / or operates specific assets where, apart from the income received from the assets being financed, the borrower has little or no independent capacity to repay from other activities or assets. 7 Securitisation – exposures reflect Westpac’s involvement in activities ranging from originator to investor and include the provision of securitisation services for clients wishing to access capital markets. 8 Operational risk – the risk of loss resulting from inadequate or failed internal processes, people and systems or from external events, including legal risk but excluding strategic or reputational risk. 42 | Westpac Group 2018 Full Year Financial Results Announcement $m As at As atAs at% Mov't% Mov't 31 March30 SeptSept 18 -Sept 18 - 20182017Mar 18Sept 17 30 Sept 2018 Corporate1 69,584 71,59071,160(3)(2) Business lending2 35,417 Sovereign3 1,644 Bank4 6,606 Residential mortgages 132,734 Australian credit cards 6,313 Other retail 13,777 Small business5 16,329 Specialised lending: Property and project finance6 57,043 Securitisation7 5,918 Standardised 10,778 Mark-to-market related credit risk 6,606 Credit risk 362,749 361,391349,258-4 Market risk 6,723 Operational risk8 39,113 Interest rate risk in the banking book (IRRBB) 12,989 Other 3,810 Total 425,384 415,744404,23525

2018 Full Year financial results Review of Group operations Full Year 2018 – Full Year 2017 Total RWA increased $21.1 billion over the year: Credit risk RWA increased $13.5 billion or 3.9%: -Regulatory modelling changes added $10.1 billion to RWA mostly from: updates to mortgage probability of default models increased mortgage RWA by $4.1 billion: implementation of APRA’s revised prudential standard for securitisation (APS 120) effective from 1 January 2018 ($1.4 billion increase); updates to models for small business in line with APRA guidance on the definition of default ($1.8 billion increase); changes in the modelling for credit cards and personal loans which include updated data for facilities in hardship ($2.1 billion increase); and reclassification of $6.6 billion of mortgage exposures to business related categories ($0.7 billion net RWA increase). The reclassification follows APRA industry guidance that where the purpose of a mortgage loan is business related these loans should be reclassified under business related categories. o o o o o -Portfolio growth added $4.9 billion to RWA; -Foreign currency translation impacts increased RWA by $0.8 billion; -Increase in mark-to-market related credit risk RWA of $0.2 billion; and -Credit quality improvements, mainly from mortgages, decreased RWA by $2.5 billion. Non-credit RWA increased $7.6 billion or 13.9%, mostly from a $7.5 billion increase to operational risk RWA as we introduced a model overlay to approximate the standardised approach. Westpac Group 2018 Full Year Financial Results Announcement | 43

2018 Full Year financial results Review of Group operations Capital adequacy (522) (14) 50 27,122 (558) 15 54 26,100 (1,238) 254 (1,153) 253 (8,656) (1,116) (1,032) (1,867) (1,628) (1,532) (1,192) (339) - (680) - (46) (1) (8,670) (1,110) (1,065) (1,913) (1,603) (1,589) (861) (332) - (679) - (27) (1) 566 1,190 473 55 - 1,526 51 - (83) (77) 2.31% 2.10% 2.02% 2.16% 44 | Westpac Group 2018 Full Year Financial Results Announcement $m As at As atAs at 31 March30 Sept 20182017 30 Sept 2018 Tier 1 capital Common equity Tier 1 capital Paid up ordinary capital Treasury shares Equity based remuneration Foreign currency translation reserve Accumulated other comprehensive income Non-controlling interests - other Retained earnings Less retained earnings in life and general insurance, funds management and securitisation entities Deferred fees Total common equity Tier 1 capital Deductions from common equity Tier 1 capital Goodwill (excluding funds management entities) Deferred tax assets Goodwill in life and general insurance, funds management and securitisation entities Capitalised expenditure Capitalised software Investments in subsidiaries not consolidated for regulatory purposes Regulatory expected loss in excess of eligible provisions General reserve for credit losses adjustment Securitisation Equity investments Defined benefit superannuation fund Surplus Regulatory adjustments to fair value positions Other Tier 1 deductions Total deductions from common equity Tier 1 capital Total common equity Tier 1 capital after deductions Additional Tier 1 capital Basel III complying instruments Basel III transitional instruments Total Additional Tier 1 capital Net Tier 1 regulatory capital Tier 2 capital Basel III complying instruments Basel III transitional instruments Eligible general reserve for credit loss Basel III transitional adjustment Total Tier 2 capital Deductions from Tier 2 capital Investments in subsidiaries not consolidated for regulatory purposes Holdings of own and other financial institutions Tier 2 capital instruments Total deductions from Tier 2 capital Net Tier 2 regulatory capital Total regulatory capital Risk weighted assets Common equity Tier 1 capital ratio Additional Tier 1 capital ratio Tier 1 capital ratio Tier 2 capital ratio Total regulatory capital ratio 35,16834,889 (506) (436) 36,054 (507) 1,441 1,4141,356 (379) (11) 55 27,883 (1,218) 258 63,576 61,72860,520 (8,644) (1,169) (942) (1,838) (1,792) (1,567) (1,312) (356) - (570) (78) (68) (1) (18,337) (18,089)(17,850) 45,239 43,63942,670 9,144 9,0417,315 - 9,144 9,6078,505 54,383 53,24651,175 8,025 8,1027,375 486 54 - 8,565 8,6308,952 (140) (140)(140) (93) (233) (223)(217) 8,332 8,4078,735 62,715 61,65359,910 425,384 415,744404,235 10.63% 10.50%10.56% 2.15% 12.78% 12.81%12.66% 1.96% 14.74% 14.83%14.82%

2018 Full Year financial results Review of Group operations Dividends 94 - 78.71% 1,063 14.0 123bps 28 - The Board has determined a final fully franked dividend of 94 cents per share, to be paid on 20 December 2018, to shareholders on the register at the record date of 14 November 20182. The final dividend represents a Second Half 2018 payout ratio on a cash earnings basis of 84.7% (Full Year 2018: 79.9%). In addition to being fully franked, the dividend will also carry NZ$0.07 in New Zealand imputation credits that may be used by New Zealand residents. The Board has determined to satisfy the DRP for the 2018 final dividend by issuing Westpac ordinary shares. The Market Price used to determine the number of shares issued to DRP participants will be set over the 10 trading days commencing 19 November 2018 and will not include any discount. Capital deduction for regulatory expected credit loss For capital adequacy purposes APRA requires the amount of regulatory expected credit losses in excess of eligible provisions deduction. to be deducted from CET1 capital. The table below shows the calculation of this capital 1 The dividend payout ratio for 1H18 was based on the number of shares on issue as at 31 March. On 3 April 2018, some CPS converted into ordinary shares. Inclusion of these shares would have resulted in a dividend payout ratio of 76.50% (75.70% on a cash basis). 2 Record date in New York is 13 November 2018. 3 Provisions associated with portfolios subject to the Basel standardised approach to credit risk are not eligible. Westpac Group 2018 Full Year Financial Results Announcement | 45 $m As at As atAs at 31 March30 Sept 20182017 30 Sept 2018 Provisions associated with eligible portfolios Total provisions for impairment charges (Section 4 Note 10) plus general reserve for credit losses adjustment plus provisions associated with partial write-offs less ineligible provisions3 Total eligible provisions Regulatory expected downturn loss Shortfall in eligible provisions compared to regulatory expected downturn loss Common equity Tier 1 capital deduction for regulatory expected downturn loss in excess of eligible provisions 3,053 356 101 (80) 3,1653,119 339332 82148 (79) (74) 3,430 3,5073,525 4,742 4,6994,386 1,312 1,192861 (1,312) (1,192)(861) Payout ratio (reported)1 82.77% 76.07%large 79.52% 79.28%24bps Payout ratio (cash earnings)1 84.66% 75.28%large 79.94% Adjusted franking credit balance ($m) 1,357 1,2796 1,357 Imputation credit (cents per share - NZ) 7.0 7.0-14.0 Ordinary dividend (cents per share) % Mov't Half Year Sept 18 - March 18 Mar 18 % Mov't Full YearSept 18 - Sept 17Sept 17 Half Year Full Year Sept 18 Sept 18 Interim (fully franked) - 94(100) 94 94-Final (fully franked) 94 --94 Total ordinary dividend 94 94-188 188-
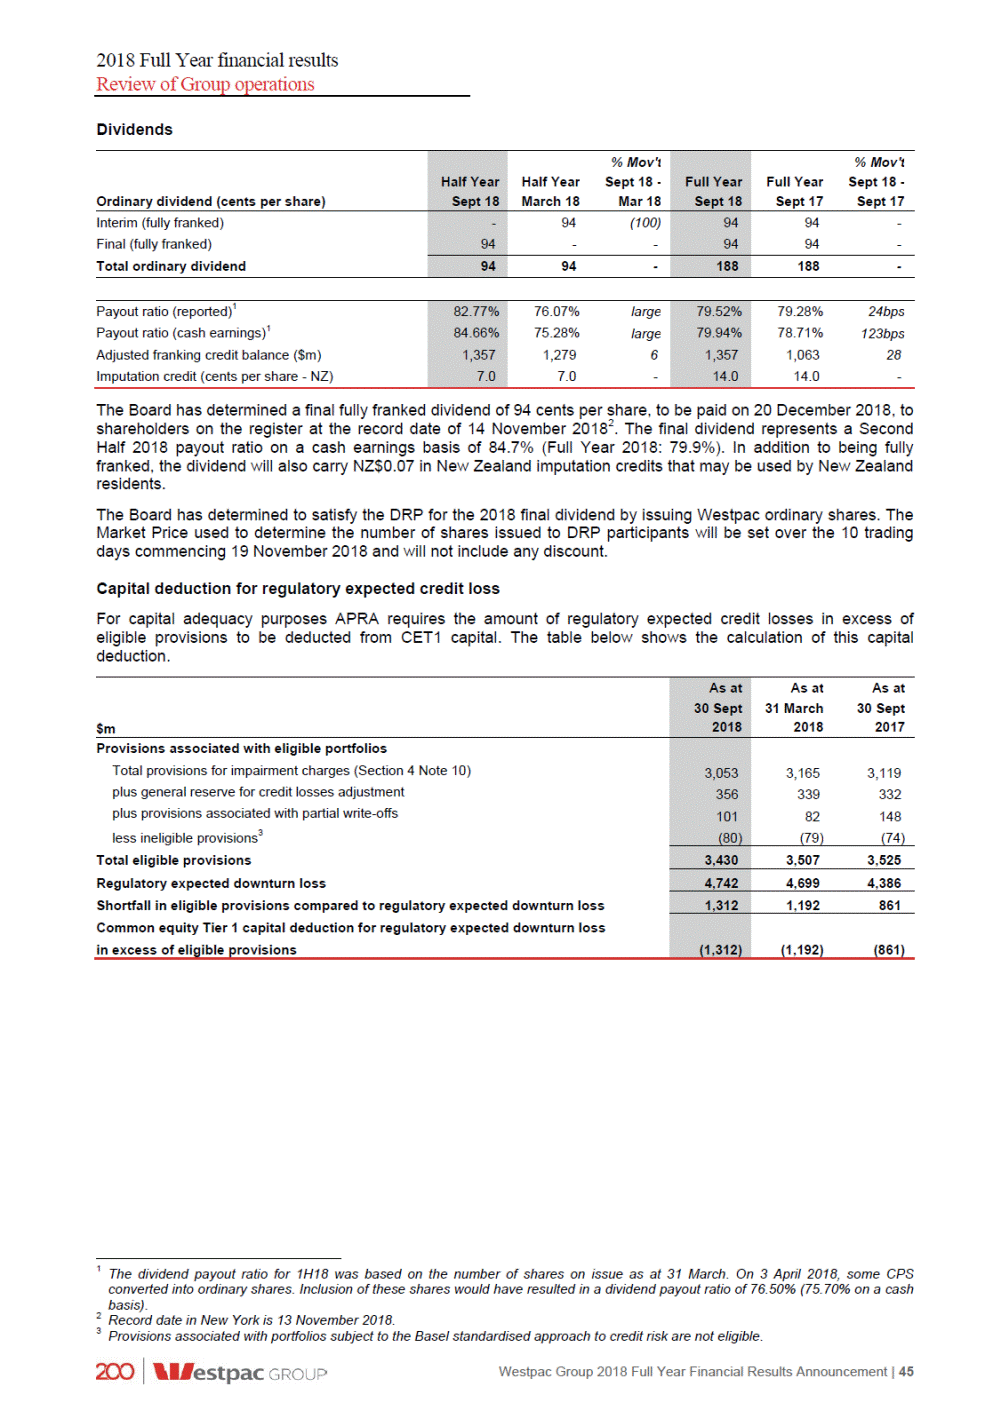
2018 Full Year financial results Review of Group operations 2.6 Sustainability performance As one of Australia’s largest companies, Westpac Group can play a role in helping to create positive social, economic and environmental impact, for the benefit of all. At a time of great scrutiny of the financial services sector and the Royal Commission, it is particularly important that we work in an open and transparent way to build a strong banking system that delivers good outcomes for customers and the economy as a whole. Where mistakes are identified we put it right and seek to remediate the situation. The Group’s approach to operating sustainably is designed to anticipate, respond to and shape new and emerging opportunities and challenges that have the potential to materially impact customers, employees, suppliers, shareholders and communities. We believe that as one of Australia’s largest companies we have a role to play in helping to create positive social, economic and environmental impact, and contribute to the United Nation’s Sustainable Development Goals. This view is embedded within the Group’s business activities, and aligns with the priorities set out in the Group’s strategy. It’s about all of us: 2018-2020 Sustainability Strategy This year marks the start of Westpac Group’s 2018-2020 Sustainability Strategy which outlines the Group’s commitment to building a sustainable future. This includes taking action in the areas where the Group can have the greatest impact and create sustainable, long-term value for customers, communities and the nation by: Helping people make better financial decisions; Helping people by being there when it matters most to them; and Helping people create a prosperous nation. Underpinning these priority areas is a commitment to fostering a culture of care and doing the right thing, and continuing to lead on the sustainability fundamentals – policies, action plans, frameworks and metrics reporting, in particular building on the climate change, human rights and reconciliation action plans. Westpac is committed to regular reporting to enable a comparison of performance over time. The table below summarises first year progress on our 2018-2020 Sustainability Strategy. Further disclosures available in the Westpac Annual Report and Sustainability Performance Report. Performance against sustainability goals Help more people better understand their financial position, improving their financial confidence Continued to offer a range of products and services, including Westpac SmartPlan, an online tool to help customers manage their credit card balance and pay down their debts more easily; and Westpac Life, a flexible savings account that supports customers’ savings goals; Delivered financial literacy programs to individuals, businesses, not-for-profit organisations and community groups through Davidson Institute in Australia and the Managing Your Money program in New Zealand; and Delivered communications promoting financial capability communication for different customer segments, including 512,000 children through Mathspace and Year 13 partnerships, 1.5 million young Australians via The Cusp, 229,000 women through Ruby Connection and 2.5 million Australians aged 65+ via Starts at 60. Helping people make better financial decisions Help people recover from financial hardship Helped customers experiencing financial hardship, issuing over 37,000 financial assistance packages; and Established a specialist team, with experience in areas such as health and social work, to help customers in highly complex vulnerable circumstances. Help people lift out of a difficult time and recover stronger Announced a $100 million Drought Assistance Package including a range of lending support options such as discounted loans, deferring repayments and adjusted interest rates for customers with Farm Management Deposit (FMD); Donated $100,000 to the Salvation Army Rural Support Services Program and a further $100,000 in Community Recovery Resilience grants; Provided 104 relief packages for customers impacted by natural disasters across Australia; and Donated $50,000 to the PNG Salvation Army to assist with relief efforts following a magnitude 7.5 earthquake in Papua New Guinea. Helping people by being there when it matters most to them 46 | Westpac Group 2018 Full Year Financial Results Announcement Full Year 2018 performance Goals Priority areas
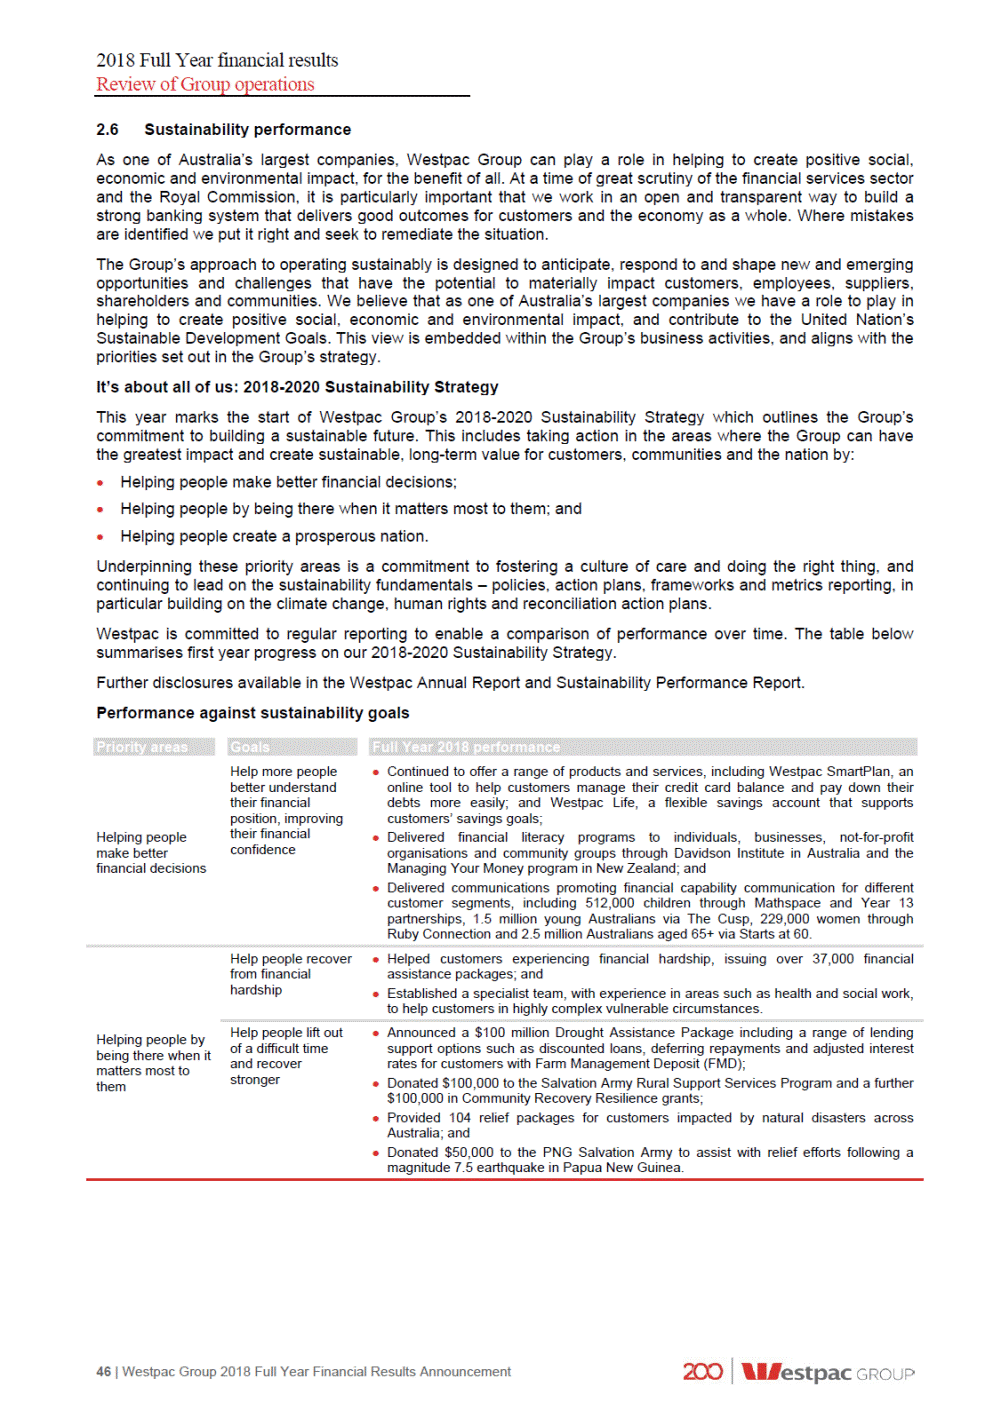
2018 Full Year financial results Review of Group operations Helping our most vulnerable customers Convened the Vulnerable Customer Council which brings together representatives from customer advocate groups, financial counsellors and community organisations to understand their views and perspectives on our approach to issues impacting vulnerable customers; Established processes to assist customers in vulnerable situations earlier in the complaints process for escalation to a high priority resolution team; Announced ‘Loss of a loved one’ tools and resources to help customers and their family managing a deceased estate; Introduced the option for credit cardholders to block transactions with gambling merchants to support customers vulnerable to a gambling problem manage their credit card spend; Commenced preparations to establish a dedicated customer care team to provide specialist support for remote and Indigenous communities; and Expanded dementia-friendly banking to BankSA and Bank of Melbourne. Helping people by being there when it matters most to them Build the workforce of the future Launched additional learning and development offerings as part of our focus on the future of work to assist employees to develop ‘skills for life’; Introduced a Young Leader Program to develop and support high-potential emerging leaders; and Published our Science, Technology, Engineering and Mathematics (STEM) Commitment, a series of initiatives and programs centred on investing in and inspiring the next generation, talent incubation, championing change and fostering innovation. Invest and back the people and ideas shaping Australia Westpac Bicentennial Foundation paid $3.7 million in educational scholarships to 100 scholars during Full Year 2018, bringing the total cohort of Westpac Scholars to 330; Westpac Foundation Social Scale-up Grants supported social enterprises to create over 513 jobs1 for vulnerable Australians; Westpac Foundation awarded $2 million in Community Grants to support 200 not-for-profit organisations; 275 businesses established through our Many Rivers partnership. Since its establishment the partnership has created jobs for 1,949 people, with 718 identifying as Indigenous; Westpac has directly invested in eight early-stage companies; To date, committed $150 million to Reinventure as part of its investment in three funds, supporting 23 early stage companies; Announced 200 Business of Tomorrow program recipients, including a two week study tour to Silicon Valley, $50,000 professional services package and a mentor matching program with notable Australian business leaders offered to the top 20 businesses; and Supported eight early-stage companies through the FUELD accelerator program by supporting them with Data Republic’s data-sharing platform, helping to develop ideas to solve customer and business problems across a range of industries. Helping people creating a prosperous nation Back the growth of climate change solutions Increased committed exposure to climate change solutions relative to Full Year 2017, taking total committed exposure to more than $9 billion, progressing towards our 2020 target of $10 billion; Arranged and issued climate-related bonds of $1.7 billion supporting the Group’s $3 billion funding for climate change solutions; and Undertook analysis to understand the implications of 2-degree and 4-degree climate scenarios on our business. Back the growth of housing affordability solutions Lent $1.36 billion to the social and affordable housing sector, up from $1.32 billion at 30 September 2017; and Conducted an extensive review of the housing affordability challenge, explored support for innovative housing solutions (such as build-to-rent and shared equity), and providing funding to emerging charity HeadStart Homes to help Australians living in social housing take steps towards owning their own home. Bring together partners and harness the Group’s capacity to tackle pressing social issues that matter most to the nation Joined 28 banks in co-founding and drafting the Principles for Responsible Banking, a UNEP-FI initiative to promote alignment of the global banking sector, in making progress on the Sustainable Development Goals and Paris Climate Agreement; Supported dialogue across institutional customers and Westpac experts to collaborate on initiatives towards eradicating modern slavery and other severe human rights issues; and Hosted Westpac’s first Sustainable & Inclusive Sourcing Forum to encourage cross-sector collaboration. 1 All results as at 30 September 2018 except Westpac Social Scale-up jobs created which is as at 30 June 2018. Refer to www.westpac.com.au/sustainabilty for glossary of terms and metrics definitions. Westpac Group 2018 Full Year Financial Results Announcement | 47 Full Year 2018 performance Goals Priority areas
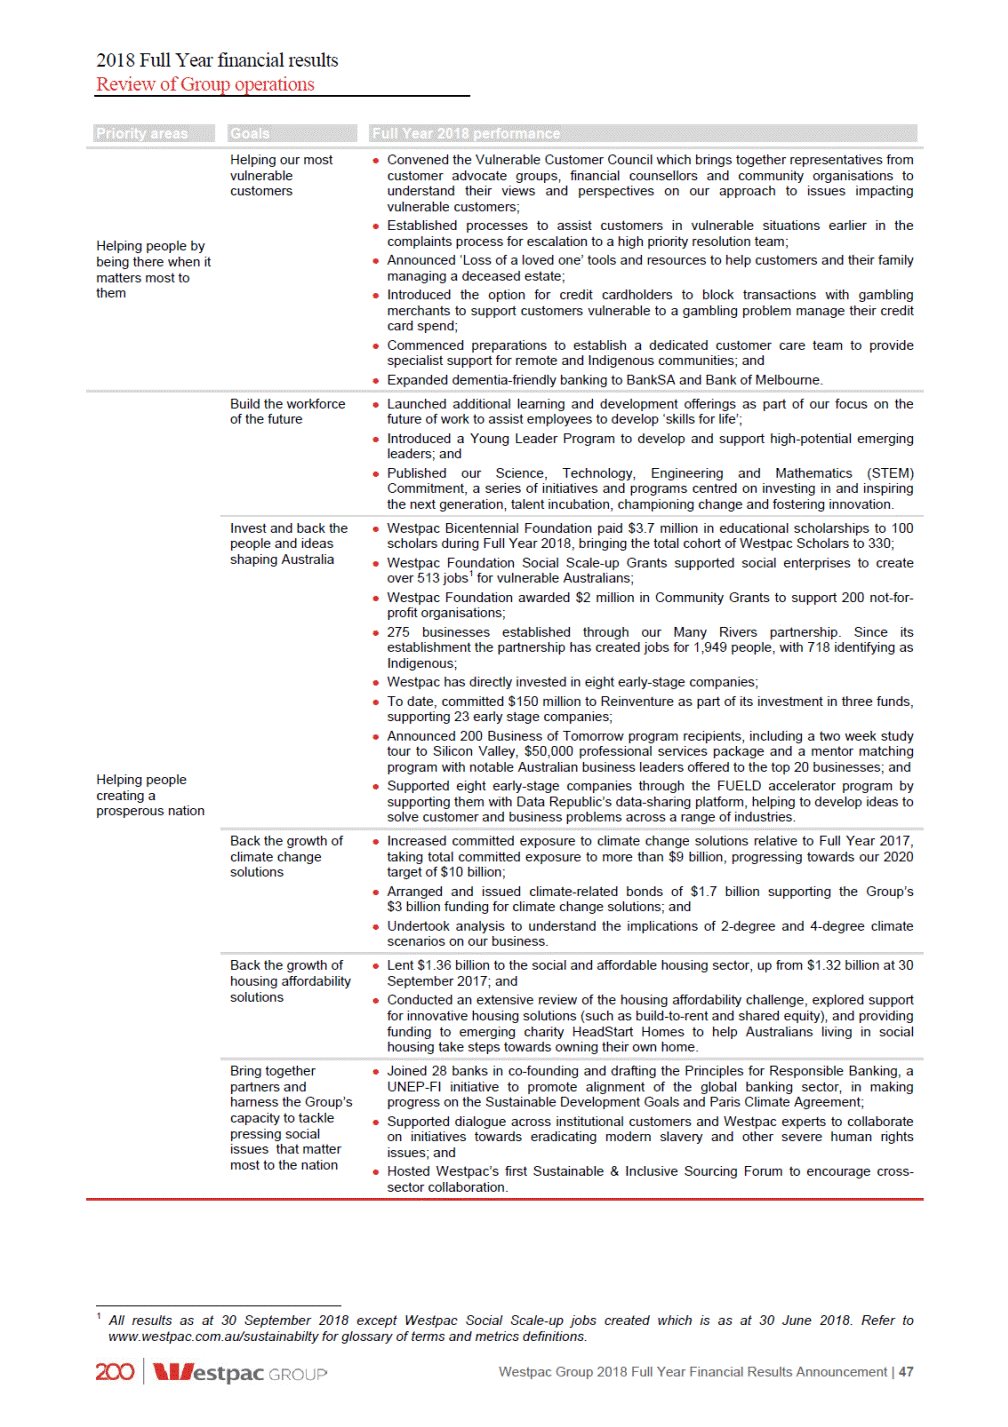
2018 Full Year financial results Review of Group operations Promote an inclusive society, where our workforce reflects our customers Maintained 50% Women in Leadership roles; Indigenous Australian new hires as a percentage of total hiring was 4.3%; Developed a customised recruitment program – Tailored Talent – to remove some of the traditional barriers to work for people on the autism spectrum; Named as Employer of Choice for Gender Equality by the Workplace Gender Equality Agency for the 8th consecutive year; and Became one of six employers to attain the highest Platinum status in the Australian Workplace Equality Index for LGBTI inclusion. A culture that is caring, inclusive and innovative Increase channels where customers can provide feedback Established a new Customer and Corporate Relations Division, bringing together customer complaints teams from across the Group to complement the role of the Customer Advocate office. Employees Held Group-wide Navigate training to reinforce ‘Our Compass’ – a framework which brings together our vision, service promise, values and Code of Conduct; Implemented recommendations of the Sedgwick Review two years earlier than required by changing remuneration structures for customer-facing employees in Business and Consumer bank; Promoted wellbeing initiatives throughout the year including Men’s Health Week, RUOK? Day, Mental Health Week, Women’s Health Week and White Ribbon Day; Continued to increase awareness through campaigns and training to ensure all employees are familiar with our Whistleblower Protection Policy; Completed the Group roll-out of Motivate, our new approach to performance, development and reward; and Achieved total recordable injury frequency rate (TRIFR) of 3.9 and lost time injury frequency rate (LTIFR) of 0.4. Determined Westpac’s salient1 human rights issues; Released 2017 UK Slavery and Human Trafficking Statement; Supported the introduction of comparable Australian legislation to the UK Modern Slavery Act; Continued to invest in cybersecurity capability to protect the privacy, confidentiality, integrity and availability of customer information and sensitive commercial data; Delivered cybersecurity information sessions for business customers across Australian capital cities, as well as security advice via our digital communications channels; and Continued to enhance our data breach management procedures and strengthened our privacy management framework to protect customer data and minimise the impact on affected individuals and the wider community. Human rights Continuing to lead on the Sustainability fundamentals Sustainability lending and investment Released BTFG’s Sustainable Investment Approach, which sets out how we address ESG issues in our internally managed funds as well as expanding the BT Financial Group ESG exclusions framework, along with removing investment in tobacco and controversial weapons to a wider set of funds managed by our internal teams; Strengthened management of climate change risk, establishing a cross-functional committee to oversee initiatives to address the credit, regulatory and legal risks of climate change, including scenario analysis; and Signed the UNEP-FI’s Tobacco-Free Finance Pledge. Environment2 Maintained carbon neutral status; Achieved a 4.4% reduction in GHG emissions compared to Full Year 2017 and 18.1% compared to Full Year 2016; Achieved a 19.7% reduction in Group paper consumption compared to Full Year 2017 and on track to achieve a 40% reduction in Full Year 2020 since 2016; Water consumption in all Australian workplaces on track for a 15% reduction by 2020, consuming 409,944 kL in Full Year 2018; and Achieved 73% diversion of waste from landfill in Australian offices; and Aligned climate reporting with the recommendations of the Task Force on Climate-Financial Disclosures (TCFD). Responsible sourcing $17.7 million sourced from diverse suppliers, including $3.8 million from Indigenous suppliers. Community & social impact Contributed over $131 million to community investment excluding commercial sponsorships across the Group; and 16% employees participated in our volunteering programs. 1 UN language for human rights ‘at risk of most severe negative impact’ through a company’s activities and business relationship. 2 Environmental footprint is as at 30 June 2018. Refer to www.westpac.com.au / sustainability for glossary of terms and metric definitions. 48 | Westpac Group 2018 Full Year Financial Results Announcement Full Year 2018 performance Goals Priority areas

2018 Full Year financial results Divisional results 3.0 Divisional results Comparative divisional results for Full Year 2017 have been restated. The changes include updates to the methodologies to allocate certain costs, revenues and capital to divisions. These changes have no impact on the overall Group’s results or balance sheet. Refer Section 4, Note 2 for further details. 3.1 Consumer Bank Consumer Bank (CB) is responsible for sales and service to consumer customers in Australia under the Westpac, St.George, BankSA, Bank of Melbourne and RAMS brands. Activities are conducted through a dedicated team of specialist consumer relationship managers along with an extensive network of branches, call centres and ATMs. Customers are also supported by a range of internet and mobile banking solutions. CB works in an integrated way with Business Bank, BTFG and WIB in the sales and service of certain financial services and products including wealth and foreign exchange. The revenue from these products is mostly retained by the product originators. 1 Averages are based on a six month period for the halves and a twelve month period for the full year. 2 The presented ratios are for the halves ended 30 September and 31 March. Westpac Group 2018 Full Year Financial Results Announcement | 49 As at As atAs atAs at 31 March30 Sept31 March 201820172017 30 Sept 2018 Credit quality Impairment charges to average loans annualised2 Mortgage 90+ day delinquencies Other consumer loans 90+ day delinquencies Total stressed assets to TCE 0.12%0.16%0.15% 0.73%0.71%0.72% 1.65%1.64%1.86% 0.65%0.64%0.66% 0.11% 0.75% 1.54% 0.66% $bn As at As at% Mov't 31 MarchSept 18 - 2018Mar 18 As at As at% Mov't 30 SeptSept 18 - 2017Sept 17 30 Sept 30 Sept 2018 2018 Deposits Term deposits Other Total deposits Net loans Mortgages Other Provisions Total net loans Deposit to loan ratio Total assets TCE Average interest-earning assets1 58.110 141.31 57.910 138.63 63.9 63.9 142.3 142.3 206.2 199.43 366.02 13.6(2) (0.9)-206.2 196.55 357.44 13.9(4) (0.9)-373.0 373.0 13.3 13.3 (0.9) (0.9) 385.4 378.72 385.4 370.44 53.50% 52.65%85bps 53.50% 53.05%45bps 392.5 386.02 392.5 377.54 448.0 441.12 341.62 448.0 432.34 330.15 349.8 345.7 $m % Mov't Half Year Sept 18 - March 18 Mar 18 % Mov't Full YearSept 18 - Sept 17Sept 17 Half Year Full Year Sept 18 Sept 18 Net interest income Non-interest income Net operating income Operating expenses Core earnings Impairment charges Operating profit before tax Tax and non-controlling interests Cash earnings Economic profit Expense to income ratio Net interest margin 3,708 4,040(8) 377(2) 7,748 7,6381 813(8) 369 746 4,077 4,417(8) (1,730)5 8,494 8,4511 (3,378)5 (1,812) (3,542) 2,265 2,687(16) (233)(6) 4,952 5,073(2) (565)(20) (218) (451) 2,047 2,454(17) (737)(15) 4,501 4,508-(1,353)1 (624) (1,361) 1,423 1,717(17) 3,140 3,155-1,266(34) 39.17%large 2.37%(26bps) 2,420(13) 39.97%173bps 2.31%(7bps) 835 2,101 44.44% 41.70% 2.11% 2.24%
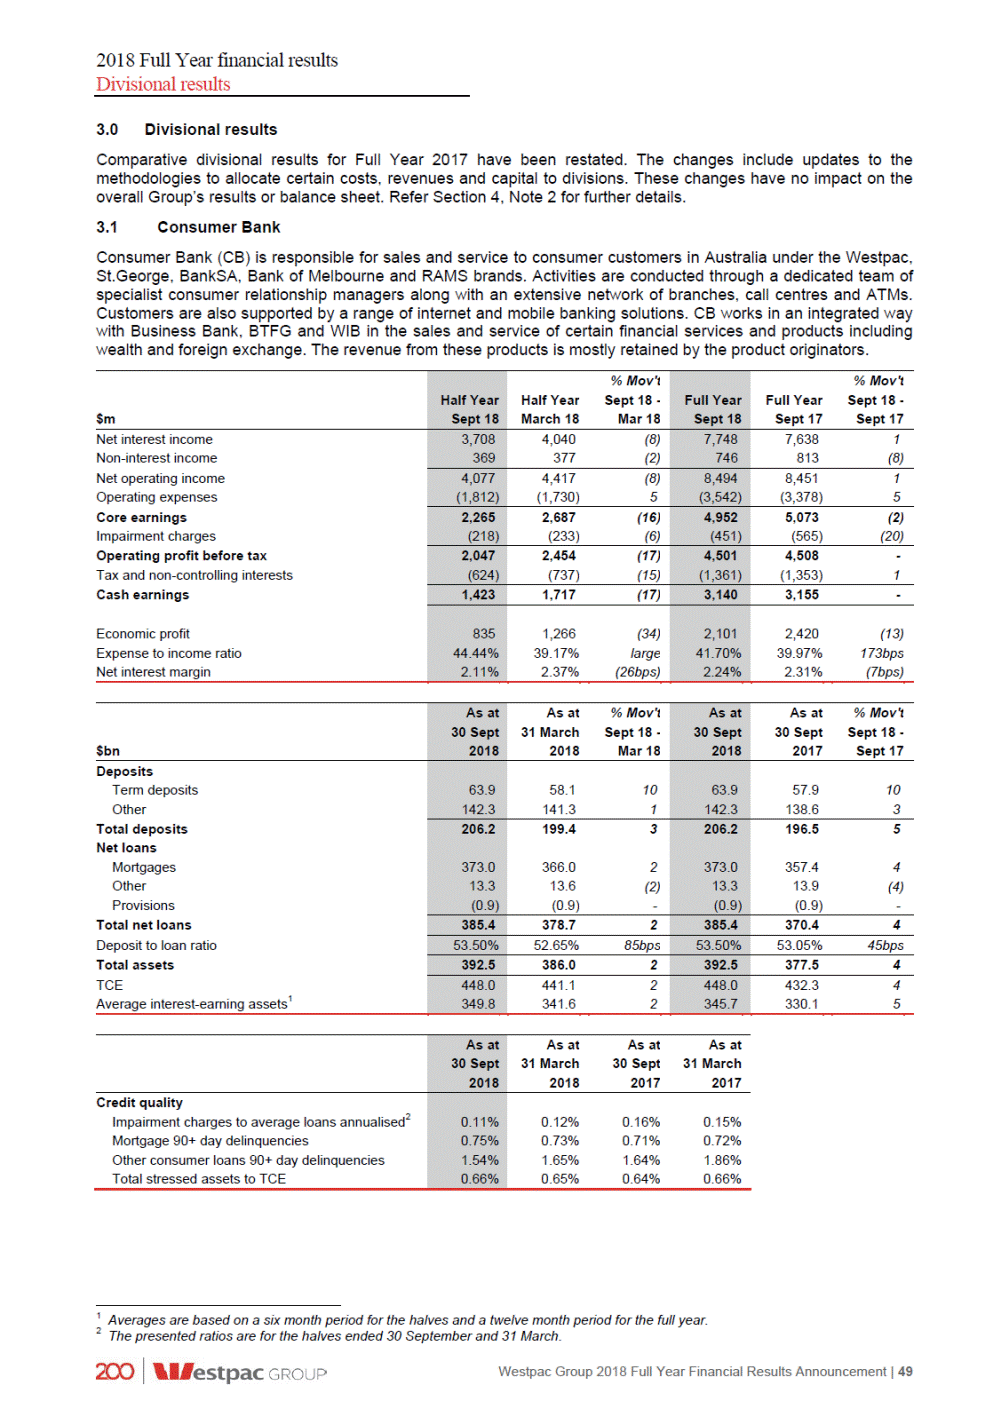
2018 Full Year financial results Divisional results Financial performance Second Half 2018 - First Half 2018 Cash earnings of $1,423 million were $294 million or 17% lower than First Half 2018. The decline in cash earnings was mainly due to a 26 basis point reduction in net interest margin, mostly from an increase in short term wholesale funding costs (13 basis points), provisions for estimated customer refunds and payments (5 basis points), and lower mortgage spreads. Cash earnings were also lower from increased regulatory and compliance costs. 1 Source: APRA 50 | Westpac Group 2018 Full Year Financial Results Announcement Net interest income down $332m, 8% Loans up 2%, mostly in mortgages, which grew at 0.9x times system. The 2% decline in other lending, was mostly due to a 3% decrease in credit cards, reflecting system1 contraction; Deposits increased 3% with most growth in term deposits (up $5.8 billion, or 10%). Transaction accounts (including offset accounts) were up 2%; and Net interest margin was 26 basis points lower mostly from higher short term wholesale funding costs, provisions for estimated customer refunds and lower mortgage spreads. Mortgage spreads were lower due to increased competition and customers switching into principal and interest loans from interest only loans. These declines were partially offset by higher deposit spreads. Non-interest income down $8m, 2% Decline from lower foreign exchange fees and a higher provision for estimated customer refunds and payments. Partly offsetting this was higher cards income from lower rewards costs. Expenses up $82m, 5% Drivers of the increase included: - Provisions for costs associated with implementing customer refunds and payments and estimated litigation (up $39 million); - Higher compliance related costs and investment costs including for the CSH, NPP and cybersecurity. Other increases, including annual salary reviews and inflation, were more than offset by productivity benefits, including: - New digital capabilities increasing customer self-service and the take-up of e-statements; - Continued migration to digital channels (branch transactions down 8% over the year) enabling a further consolidation of the network (19 branches closed in Second Half 2018 and 21 in First Half 2018). Impairment charges down $15m, 6% Credit quality remains sound, with stressed assets to TCE up 1 basis point to 0.66%; and Impairment charges lower mostly due to a reduction in 30+ day mortgage delinquencies (less new collective provisions) and lower individually assessed provisions. Economic profit down $431m, 34% Economic profit decreased more than cash earnings as more capital was allocated to the division following implementation of new risk weighted asset models for mortgages.

2018 Full Year financial results Divisional results Full Year 2018 – Full Year 2017 Core earnings were 2% lower from a 7 basis point decline in net interest margin, the removal of certain ATM fees, changes in card interchange fees and increased regulatory and compliance costs. A $114 million decline in impairment charges resulted in cash earnings of $3,140 million, down $15 million, over the year. Westpac Group 2018 Full Year Financial Results Announcement | 51 Net interest income up $110m, 1% Lending increased 4% mostly in mortgages. Other lending decreased 4% mostly due to a 3% decline in credit cards, which was in line with the decline in the overall system; A 10% increase in term deposits, and a 5% rise in transaction accounts (including offsets) supported the 5% rise in deposits; and Net interest margin was down 7 basis points. The decline was due to higher short term wholesale funding costs, the full period impact of the Bank Levy, and higher provisions for estimated customer refunds and payments. The decline was partly offset by higher deposit spreads. Non-interest income down $67m, 8% The decline was mostly due to the removal of certain ATM fees and changes to account keeping fees announced in 2017; and Lower credit card income, mostly from changes in interchange fees, contributed to the fall. Expenses up $164m, 5% Most of the expense increase was due to: - Provisions for costs associated with implementing customer refunds and payments and estimated litigation; - Compliance costs (up $61 million) and investment related costs (up $61 million); and - Investment to improve financial crime systems and processes, cyber security and complaints management. Other cost increases including annual salary reviews and inflationary rises were more than offset by productivity from: - Digital capabilities increasing customer self-service including take-up of e-statements; - Full period benefit of 45 branches closed in 2017 and 40 branches closed in 2018; and - Benefits from organisation redesign. Impairment charges down $114m, 20% Credit quality remains sound. Other consumer delinquencies reduced 10 basis points to 1.54% from improved collections processes; and Impairment charges were lower from reduced write-offs due to improved collection processes and higher recoveries from the maturing of hardship changes. Economic profit down $319m, 13% Additional capital allocated to the division following new risk weighted asset models for mortgages reduced economic profit.
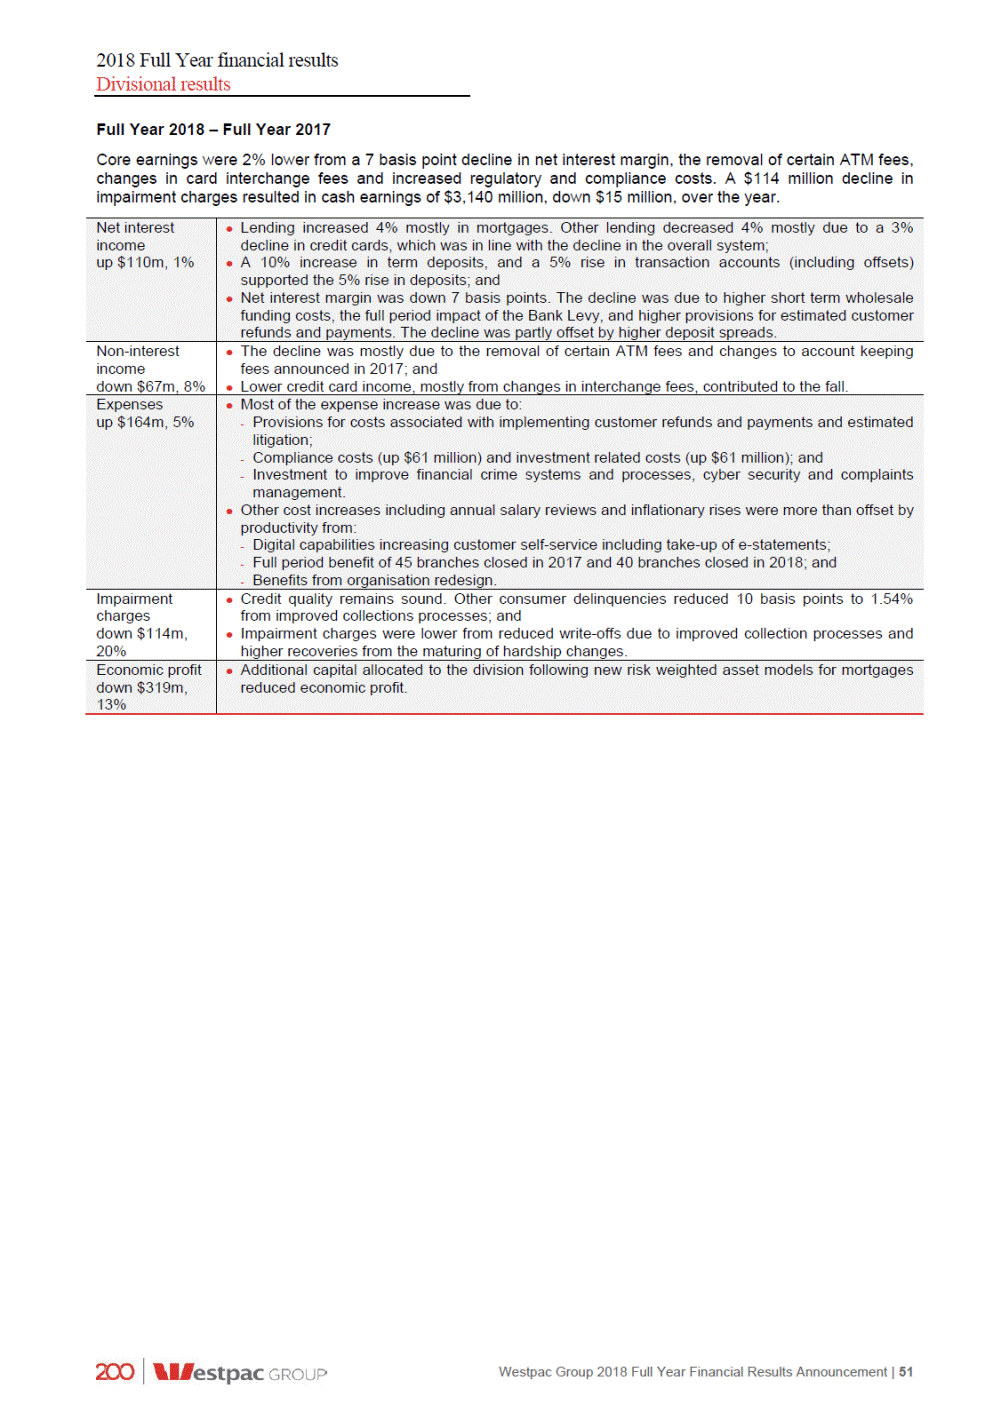
2018 Full Year financial results Divisional results 3.2 Business Bank Business Bank (BB) is responsible for sales and service to SME and commercial business customers in Australia for facilities up to approximately $150 million. The division operates under the Westpac, St.George, BankSA and Bank of Melbourne brands. Customers are provided with a wide range of banking and financial products and services to support their borrowing, payments and transaction needs. In addition, specialist services are provided for cash flow finance, trade finance, automotive and equipment finance and property finance. The division is also responsible for consumer customers with auto finance loans. BB works in an integrated way with BTFG and WIB in the sales, referral and service of certain financial services and products including corporate superannuation, foreign exchange and interest rate hedging. The revenue from these products is mostly retained by the product originator. 1 Averages are based on a six month period for the halves and a twelve month period for the full year. 2 The presented ratios are for the halves ended 30 September and 31 March. 52 | Westpac Group 2018 Full Year Financial Results Announcement As at As atAs atAs at 31 March30 Sept31 March 201820172017 30 Sept 2018 Credit quality Impairment charges to average loans annualised2 Mortgage 90+ day delinquencies Other consumer loans 90+ day delinquencies Business: impaired assets to TCE Total stressed assets to TCE 0.20% 0.71% 2.02% 0.48% 2.71% 0.18%0.19%0.27% 0.64%0.60%0.55% 1.81%1.68%1.32% 0.48%0.47%0.63% 2.48%2.13%2.29% $bn As at As at% Mov't 31 MarchSept 18 - 2018Mar 18 As at As at% Mov't 30 SeptSept 18 - 2017Sept 17 30 Sept 30 Sept 2018 2018 Deposits Term deposits Other Total deposits Net loans Mortgages Business Other Provisions Total net loans Deposit to loan ratio Total assets TCE Average interest-earning assets1 46.8 64.0 45.04 63.31 46.8 64.0 43.77 63.31 110.8 54.9 90.6 8.3 (1.1) 108.32 54.7-89.51 8.6(3) (1.1)-110.8 54.9 90.6 8.3 (1.1) 107.04 53.92 87.93 8.7(5) (1.1)-152.7 151.71 152.7 149.42 72.56% 71.39%117bps 72.56% 71.62%94bps 156.5 155.01 156.5 153.12 199.2 147.8 199.8-145.81 199.2 146.8 199.1-142.83 $m % Mov't Half Year Sept 18 - March 18 Mar 18 % Mov't Full YearSept 18 - Sept 17Sept 17 Half Year Full Year Sept 18 Sept 18 Net interest income Non-interest income Net operating income Operating expenses Core earnings Impairment charges Operating profit before tax Tax and non-controlling interests Cash earnings Economic profit Expense to income ratio Net interest margin 2,044 600 2,0211 5892 4,065 1,189 3,8855 1,1414 2,644 (946) 2,6101 (930)2 5,254 (1,876) 5,0265 (1,818)3 1,698 (154) 1,6801 (137)12 3,378 (291) 3,2085 (343)(15) 1,544 (465) 1,543-(463)-3,087 (928) 2,8658 (862)8 1,079 1,080-2,159 2,0038 710 35.78% 2.76% 717(1) 35.63%15bps 2.78%(2bps) 1,427 35.71% 2.77% 1,30010 36.17%(46bps) 2.72%5bps
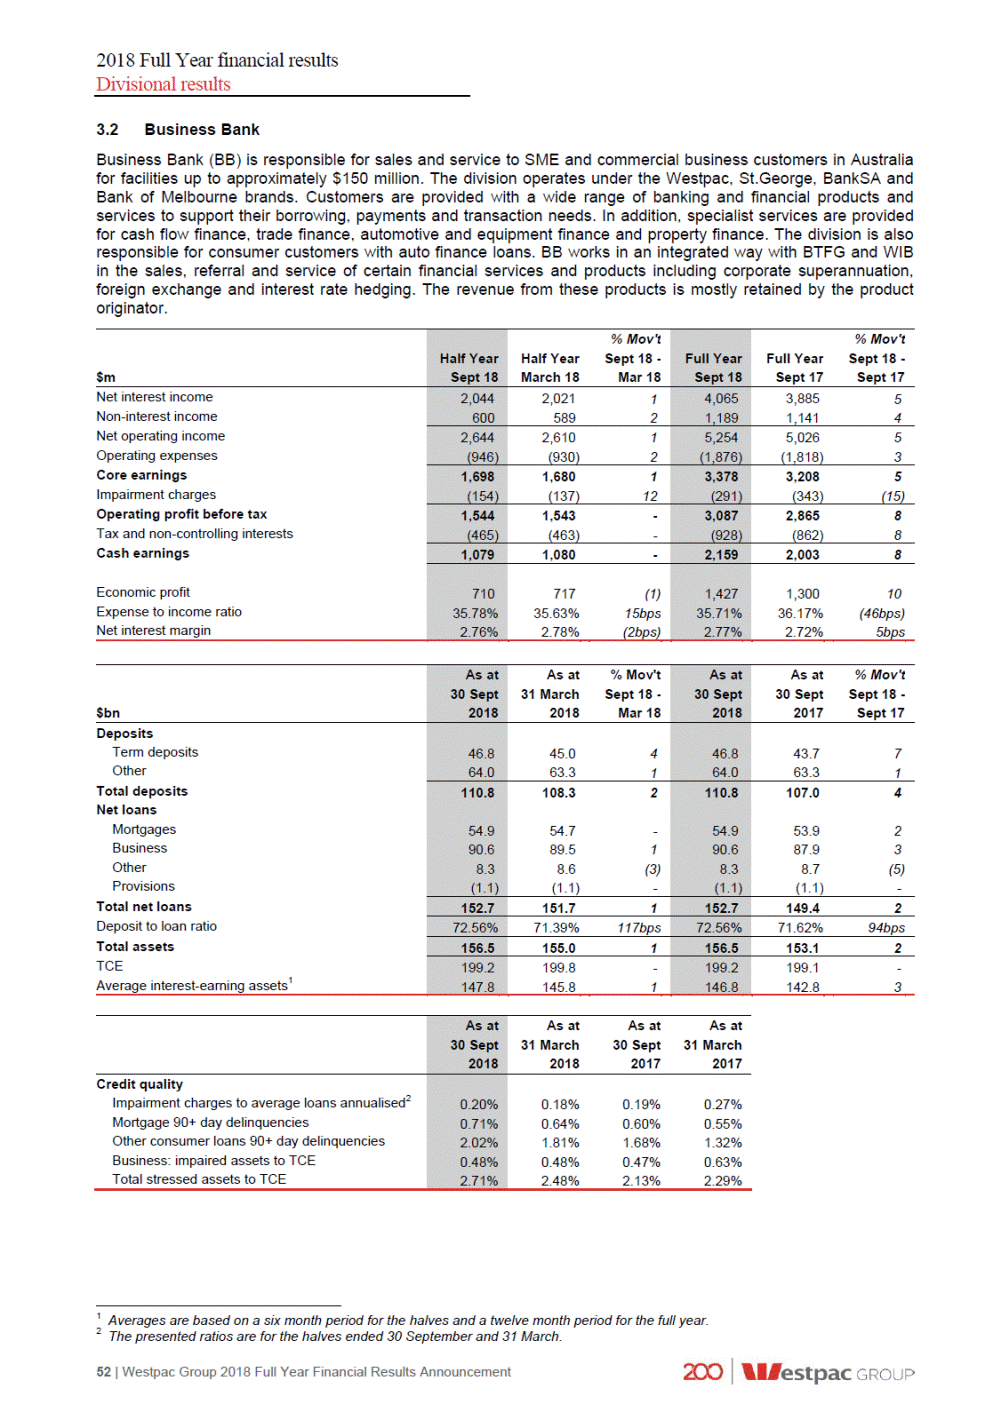
2018 Full Year financial results Divisional results Financial performance Second Half 2018 - First Half 2018 Core earnings increased 1% supported by 1% loan growth and increased fee revenue. Impairment charges increased $17 million over the half resulting in flat cash earnings over Second Half 2018 (down $1 million). The higher impairment charge principally relates to a small number of Commercial exposures migrating to stressed risk grades through the half. Full Year 2018 – Full Year 2017 Cash earnings increased 8% ($156 million), compared to Full Year 2017 from core earnings growth of 5% and a 15% decline in impairment charges. The result was supported by increased fee income and higher margins. Westpac Group 2018 Full Year Financial Results Announcement | 53 Net interest income up $180m, 5% Lending growth of 2% was supported by diversified growth across industries including property, agriculture and manufacturing and in equipment finance. Mortgage growth slowed through the year as demand for investment lending slowed; The 7% increase in term deposits, and 5% higher transaction balances supported the 4% increase in deposits; and Net interest margin was up 5 basis points from repricing of certain mortgages types in the second half of 2017 and higher deposits spreads. These were partly offset by the full period impact of the Bank Levy (5 basis points). Non-interest income up $48m, 4% Higher business line fees from portfolio growth and pricing for facilities, including unused limits. Expenses up $58m, 3% Most of the increase was due to higher investment related costs and regulatory and compliance costs; Increases from other costs were largely offset by productivity benefits from: - Improved banker coverage and support structures; - Better alignment of customers to bankers across SME and industries; and - Process improvements from the extension of LOLA, improved online functionality and standardising risk reviews. Impairment charges down $52m, 15% The level of stressed assets to TCE increased 58 basis points to 2.71% from 2.13%. Most of the increase was from Commercial customers moving into stressed risk grades; and Impairment charges benefited from lower credit card and auto write-offs. Economic profit up $127m, 10% Economic profit increased 10%, with cash earnings growing 8% and capital increasing 6% as capital allocated benefited from optimisation of facility limits and loans under offer. Net interest income up $23m, 1% Loans increased 1% with most of the growth across a range of industries and in equipment finance. Mortgage lending was little changed from a slowdown in investment lending while auto finance decreased; Deposits increased 2%, fully funding loan growth over the half. Most of the growth was in transaction accounts and term deposits; and Net interest margin 2 basis points lower, mostly driven by the reduction in the proportion of higher spread interest only mortgages and higher short term wholesale funding costs. Competition in business lending has also remained high. This was partly offset by increased term deposit spreads. Non-interest income up $11m, 2% Higher business line fees from a combination of portfolio growth and pricing for facilities including unused limits. Expenses up $16m, 2% Most of the increase was due to higher investment related costs and higher regulatory and compliance costs; and Other cost increases have been largely offset by productivity from: - Changes to the way the division engages with customers including better alignment of customers to industry specialists and SME bankers, along with changes to operational support provided to bankers; and - Additional functionality in credit risk management (Optimist), and loan origination (LOLA) platforms and extending their use across more bankers. Impairment charges up $17m, 12% The level of stressed assets to TCE increased 23 basis points to 2.71% from 2.48% from Commercial customers in the property and health sectors; Auto finance delinquencies were higher, mostly due to an operational delay in the write-off of defaulted loans; and Impairment charges were higher, mostly from the rise in stressed commercial facilities partially offset by lower auto finance write-offs. Economic profit down $7m, 1% Economic profit decreased reflecting flat cash earnings and higher allocated capital (up 1%), in line with asset growth.
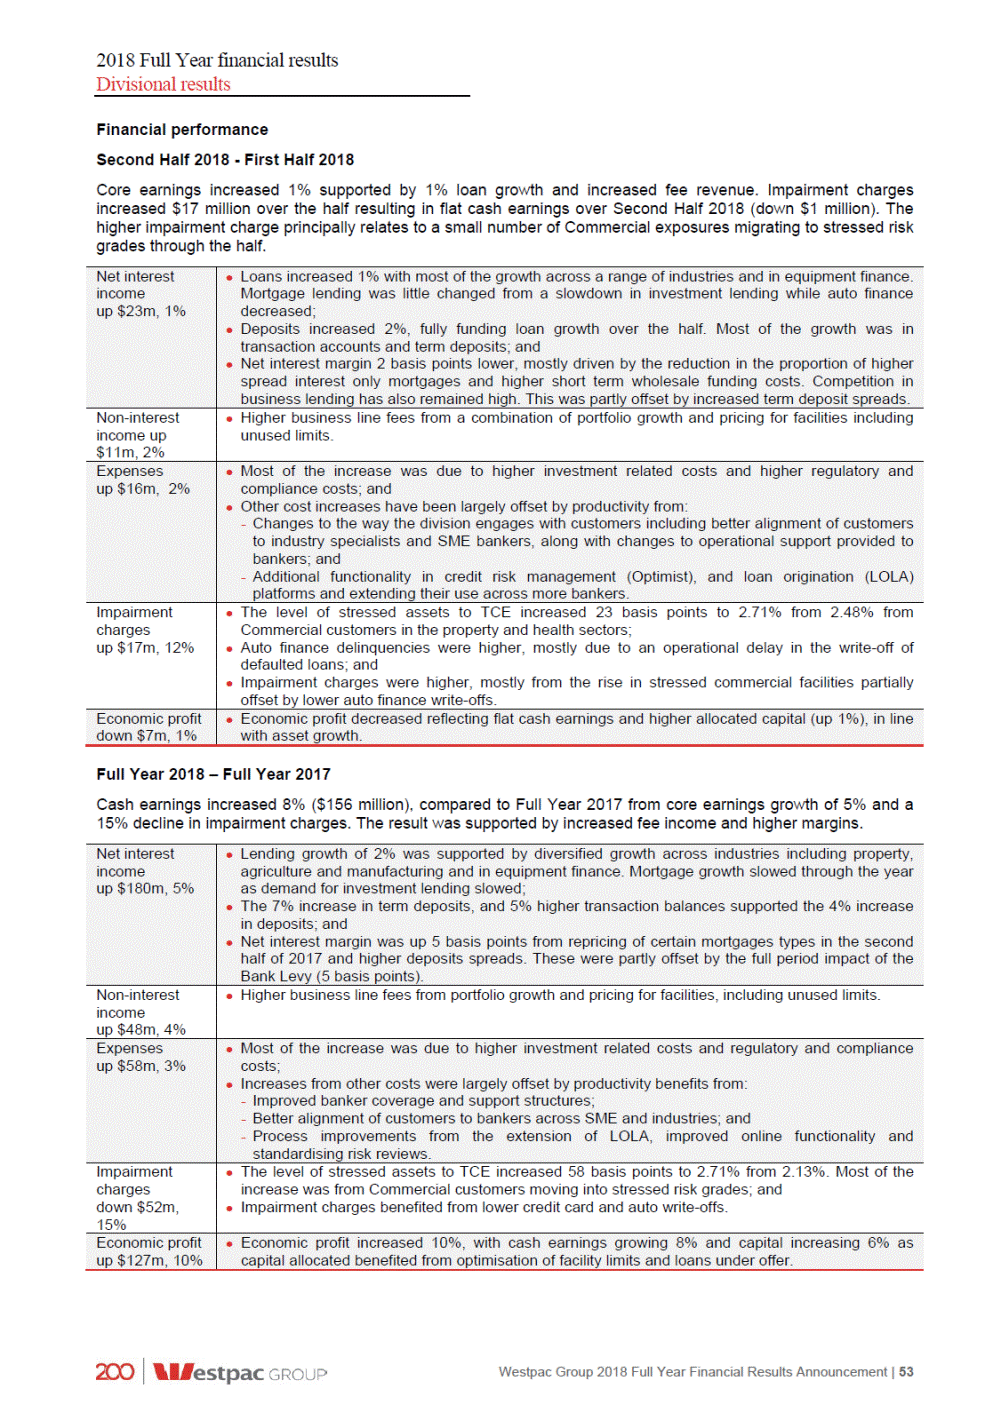
2018 Full Year financial results Divisional results 3.3 BT Financial Group (Australia) BT Financial Group (Australia) (BTFG) is the Australian wealth management and insurance arm of the Westpac Group providing a broad range of associated services. BTFG’s funds management operations include the manufacturing and distribution of investment, superannuation and retirement products, wealth administration platforms, private wealth, margin lending and equities broking. BTFG’s insurance business covers the manufacturing and distribution of life, general and lenders mortgage insurance. The division also uses a third party to manufacture certain general insurance products. In managing risk across all insurance classes the division reinsures certain risks using external providers. In addition to the BT brand, BTFG operates a range of financial service brands along with the banking brands of Westpac, St.George, Bank of Melbourne and BankSA for Private Wealth and Insurance. 1 Income on Invested Capital represents revenue generated from investing BTFG’s capital balances (required for regulatory purposes). 2 Averages are based on a six month period for the halves and a twelve month period for the full year. 54 | Westpac Group 2018 Full Year Financial Results Announcement Cash earnings $m % Mov't Half Year Sept 18 - March 18 Mar 18 % Mov't Full YearSept 18 - Sept 17Sept 17 Half Year Full Year Sept 18 Sept 18 Funds Management business Insurance Total Funds Management and Insurance Capital and other Total cash earnings 74 253(71) 1339 327 413(21) 290(4) 145 278 219 386(43) 1822 605 703(14) 3321 22 40 241 404(40) 645 736(12) $bn As at As at% Mov't 31 MarchSept 18 - 2018Mar 18 As at As at% Mov't 30 SeptSept 18 - 2017Sept 17 30 Sept 30 Sept 2018 2018 Deposits Net loans Loans Provisions Total net loans Deposit to loan ratio Total funds Average funds2 33.0 31.74 20.81 --33.0 30.77 20.14 --21.0 21.0 - - 21.0 20.81 21.0 20.14 157.14% 152.40%large 157.14% 152.74%large 205.6 197.74 198.24 205.6 191.47 188.07 205.2 201.7 $m % Mov't Half Year Sept 18 - March 18 Mar 18 % Mov't Full YearSept 18 - Sept 17Sept 17 Half Year Full Year Sept 18 Sept 18 Net interest income Non-interest income Net operating income Operating expenses Core earnings Impairment charges Operating profit before tax Tax and non-controlling interests Cash earnings Economic profit Expense to income ratio Income on invested capital1 293 2853 898(16) 578 51113 1,744(6) 750 1,648 1,043 1,183(12) (601)15 2,226 2,255(1) (1,199)8 (690) (1,291) 353 582(39) (3)-935 1,056(11) (4)50 (3) (6) 350 579(40) (175)(38) 929 1,052(12) (316)(10) (109) (284) 241 404(40) 645 736(12) 332(65) 50.80%large 2532 565(21) 53.17%large 66(12) 117 449 66.16% 58.00% 33 58
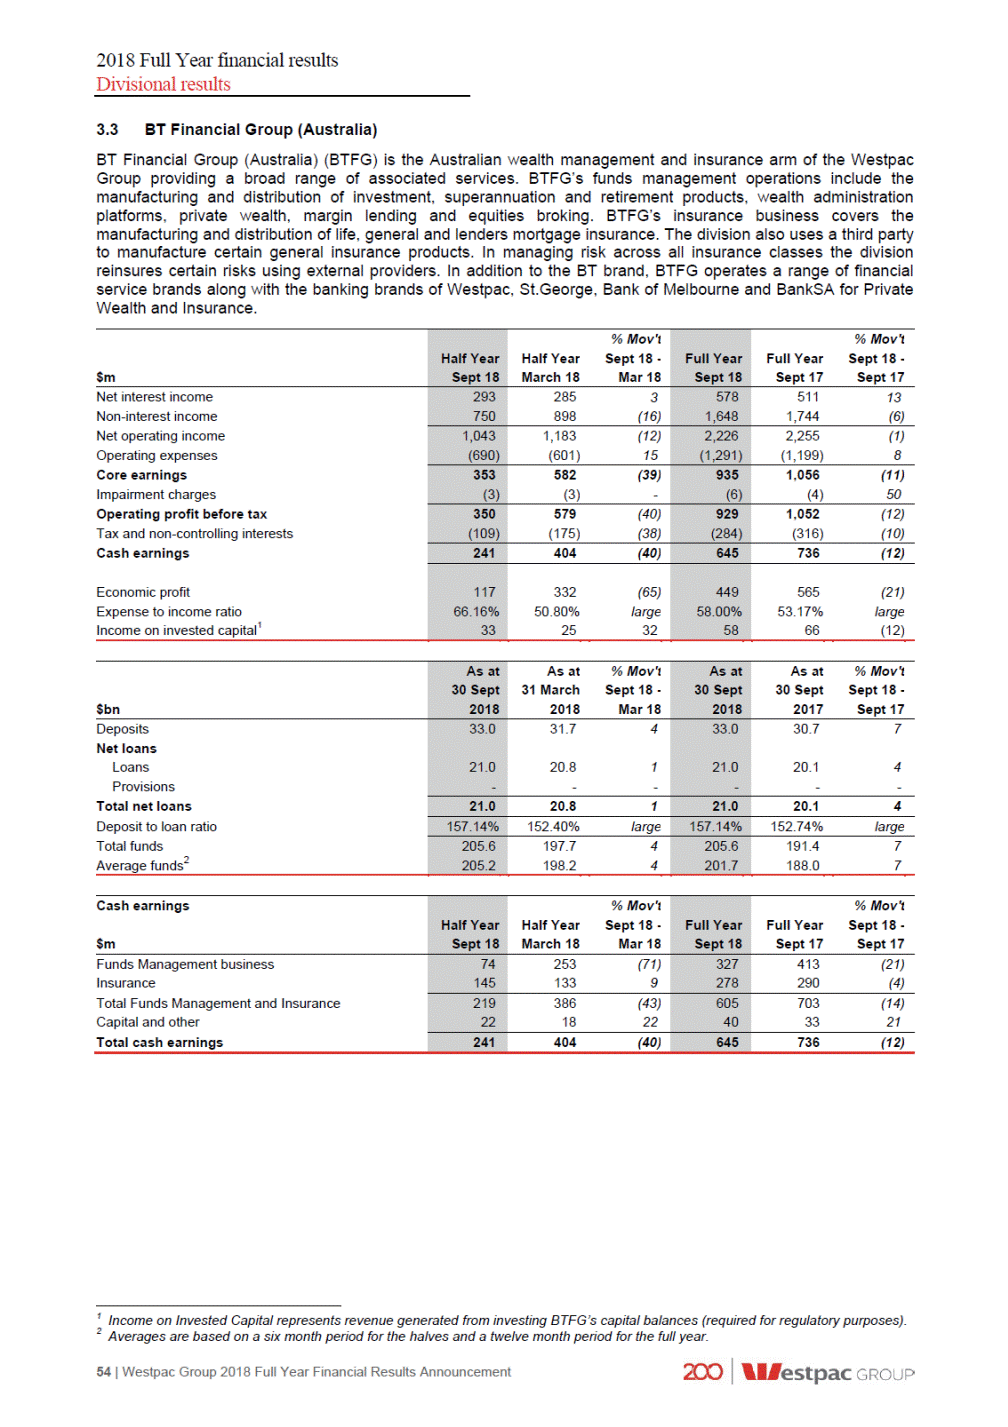
2018 Full Year financial results Divisional results Financial performance1 Second Half 2018 - First Half 2018 Cash earnings of $241 million was 40% (or $163 million) lower than First Half 2018 with performance impacted by increased provisions for estimated customer refunds and payments, and costs associated with these matters ($141 million, net of tax). Excluding these provisions, cash earnings were $22 million down with lower activity in funds management partially offset by a higher Insurance contribution. 1 On 28 September 2018, Westpac entered an agreement with Generation Development Group Limited (GDG) under which GDG will invest in Ascalon Capital Manager and become its ultimate owner. Completion is expected to occur by March 2019. Westpac Group 2018 Full Year Financial Results Announcement | 55 Net interest income up $8m, 3% Growth in Private Wealth was the main contributor to the increase with deposits up 4% mostly in term deposits; and Net interest margin was 2 basis points lower, mostly from higher short term wholesale funding costs, partly offset by higher deposit spreads. Non-interest income down $148m, 16% Funds Management contribution was down $182 million (or 29%): - Provisions for customer refunds and payments ($140 million); - Revaluation of investment in boutique funds and lower seed pool performance ($20 million); - Lower advice income, mostly from reduced activity ($10 million); - Lower funds related revenue from lower margins from repricing and product mix changes, partly offset by a 4% increase in funds to $205.6 billion; and - Panorama has seen funds on the platform rise by around 32% to $12.4 billion. These gains have been partially offset by net outflows on legacy platforms. Insurance income was $26 million or (11%) higher: - General insurance was $34 million higher, mostly from lower claims across both major weather events and working claims. First Half 2018 included a number of major weather events (Victoria hailstorms, Cyclone Marcus, and bushfires in NSW and Victoria); - Life insurance was flat on First Half 2018 with an increase in earned premiums offset by higher claims; and - Partly offsetting this was increased provisions for estimated customer refunds and payments ($6 million) and a lower contribution from LMI ($3 million) from a reduction in new high LVR loans. Return on capital increased $8 million due to a higher investment contribution. Expenses up $89m, 15% Increased expenses due to: - Provision for costs associated with implementing customer refunds and payments ($55 million); - Higher regulatory and compliance costs ($17 million); - Higher costs associated with removal of grandfathered commissions across a number of systems and the implementation of BT Open Services (the new online advisor hub); and - Productivity savings offset seasonally higher expenses in the second half of the year from end of financial year processing. Economic profit down $215m, 65% The decline in economic profit is consistent with decline in cash earnings.
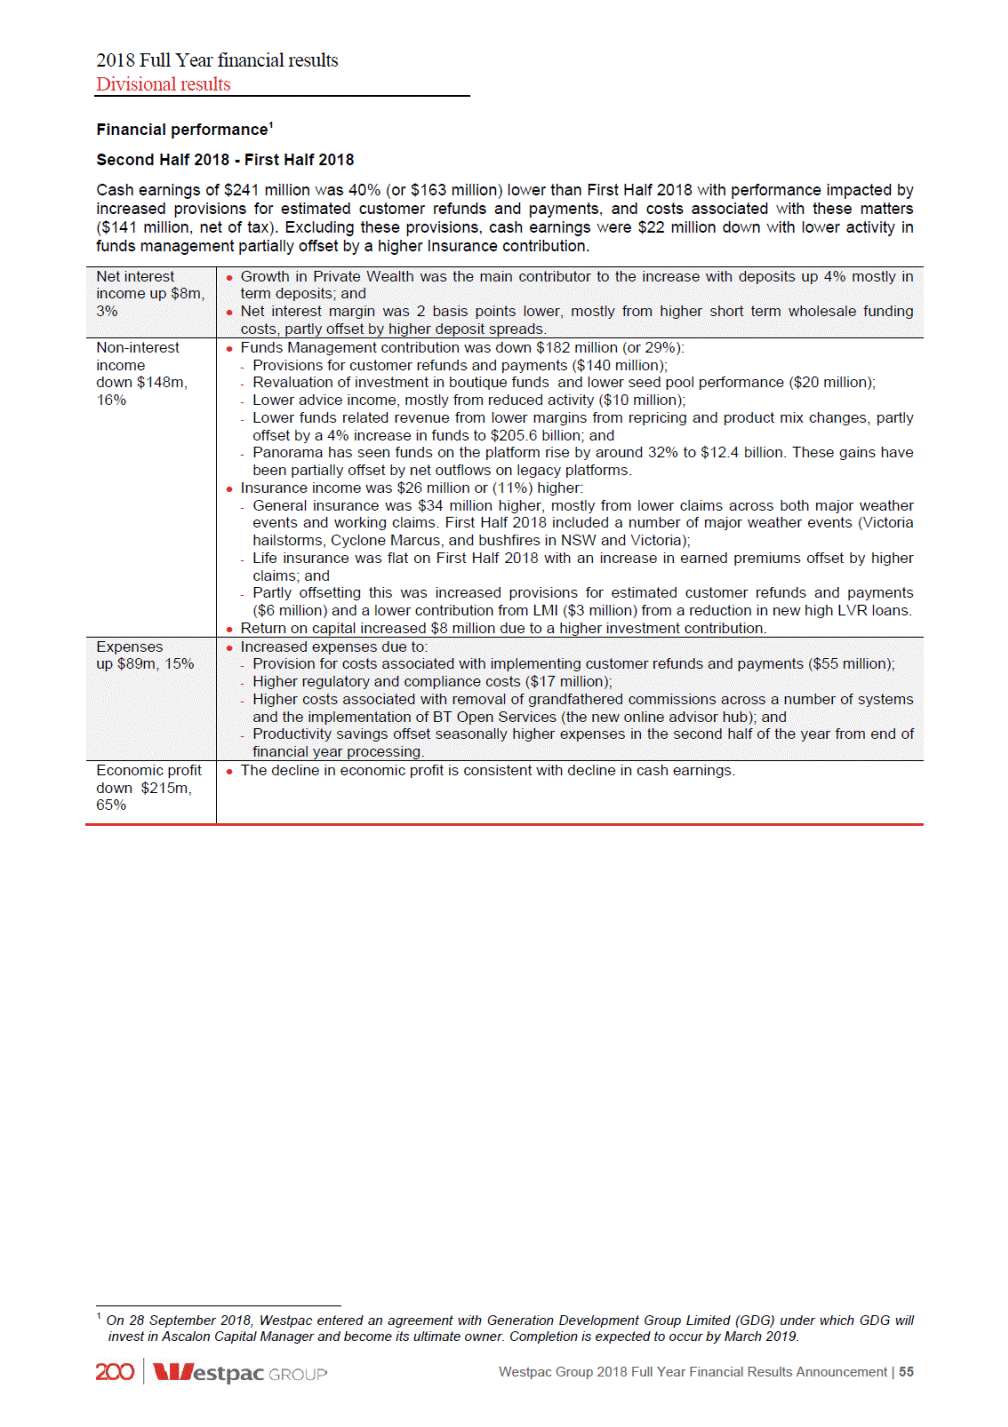
2018 Full Year financial results Divisional results Full Year 2018 – Full Year 2017 Cash earnings were 12% lower ($91 million) than Full Year 2017 impacted by additional provisions for estimated customer refunds and payments and associated costs. Excluding these items, performance was down 1% over the year. Disciplined balance sheet growth, and lower weather related insurance claims were offset by a lower Advice contribution, fund margin compression and higher life insurance claims. 56 | Westpac Group 2018 Full Year Financial Results Announcement Net interest income up $67m, 13% The 4% increase in lending was mostly in mortgages in Private Wealth. Deposits increased 7%, supported by an increase in term deposits, as customers looked for yield; and Net interest margin was up 20 basis points due to disciplined margin management combined with repricing of certain mortgage types and term deposits. This was partly offset by the full period impact of the Bank Levy (an increase of $15 million). Non-interest income down $96m, 6% Funds Management contribution was down $103 million (or 9%): - Increase in provisions for estimated customer refunds and payments ($57 million); - Lower advice income, mostly from reduced activity ($37 million); - Contribution from Pendal (previously BT Investment Management) was $17 million lower, following the further sale of shares in Pendal in May 2017; - Partly offset by a reduced revaluation loss from investments in boutique funds ($22 million) and higher seed pool performance ($5 million); - Funds related revenue was also higher, ($10 million) from a 7% growth in funds, partly offset by lower margins from repricing and product mix changes; and - Panorama has seen funds on the platform increased from $6.7 billion to $12.4 billion (up 85%). These gains have been partially offset by net outflows on legacy platforms. Insurance income was $13 million or, 3%, higher: - General insurance was $29 million higher, mostly from lower claims for major weather events; - Life insurance was $8 million higher from an increase in in-force premiums relating to Group Insurance for BTFG Corporate Super. These gains were partly offset by higher claims and lapses; and - Provisions for estimated customer refunds and payments reduced insurance income by $6 million; - LMI contribution was lower ($17 million) from a reduction in loans originated with an LVR >90%. Return on capital decreased $6 million mostly due to higher hedging costs. Expenses up $92m, 8% Increase mostly due to: - Provisions for the costs associated with customer refunds and payments ($55 million); - Investment costs ($44 million) from the roll-out of additional functionality in Panorama, the implementation of BT Open Services and removing grandfathered commissions across systems; Regulatory costs were lower due to the completion of the MySuper migration and FoFA (Future of Financial Advice); and Productivity savings largely offset other costs increases, including annual salary reviews, property and technology related spending. Economic profit down $116m, 21% The decline in economic profit is consistent with decline in cash earnings.
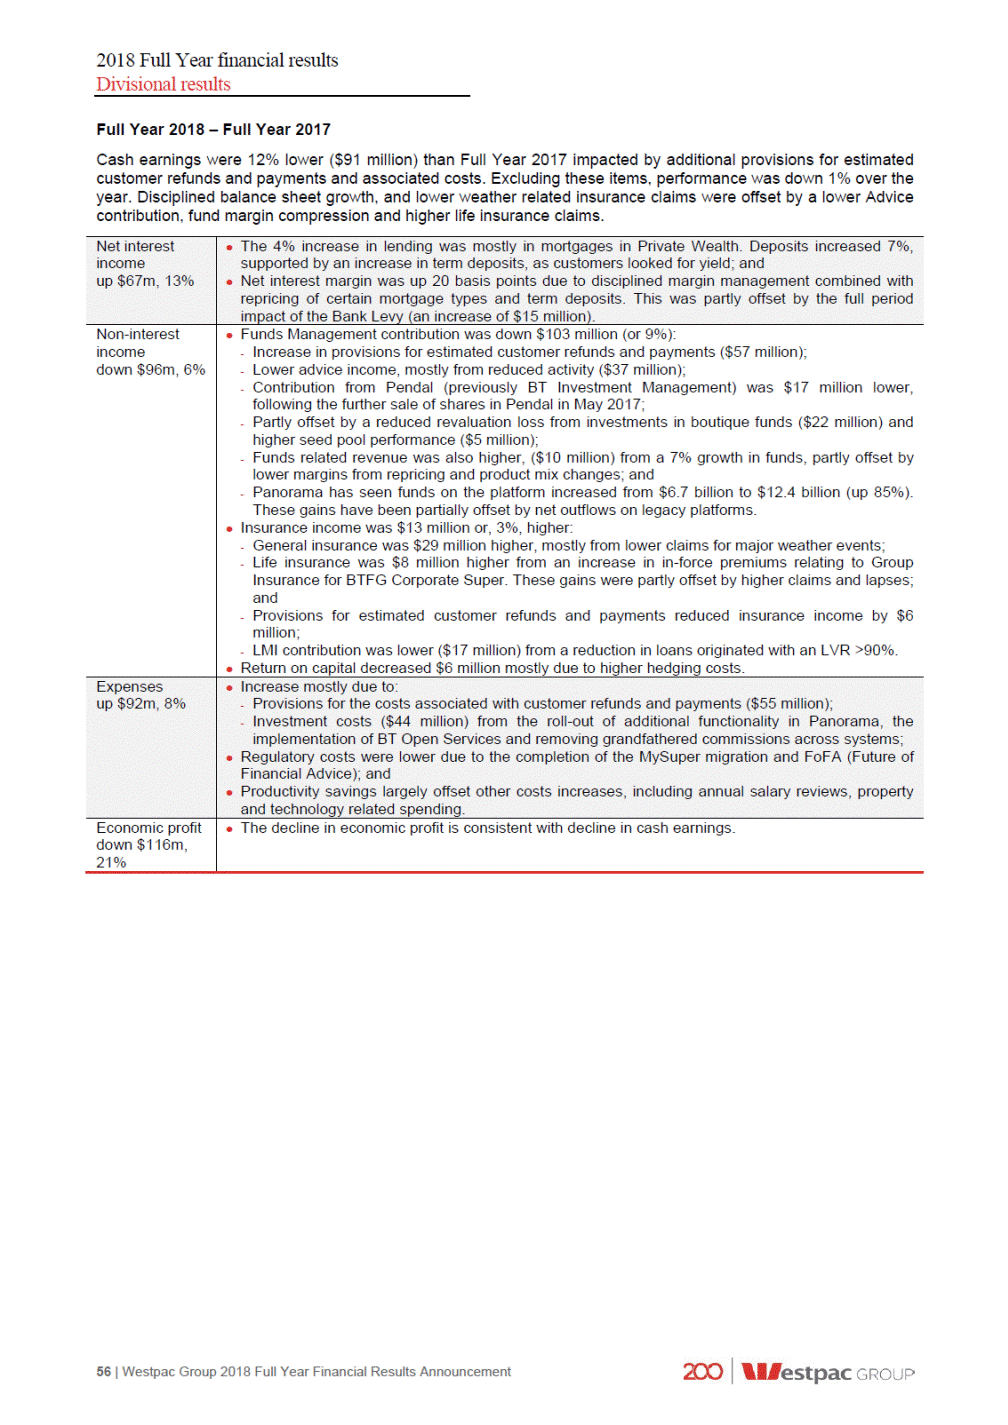
2018 Full Year financial results Divisional results 3.3.1 Funds Management business Movement of Funds Market share in key Australian wealth products are displayed below. Current Australian market share4 Product Market share Rank Platforms (includes Wrap and Corporate Super) Retail (excludes Cash) Corporate Super 18.5% 17.6% 12.7% 1 1 3 1 Other movement includes market movement and other client transactions including fund transfers, account fees and distributions. 2 Packaged funds include Advance and Management Accounts. 3 Other includes Capital and Reserves. 4 Market share of Group Funds based on published market share statistics from Strategic Insight as at 30 June 2018 and represents the addition of St.George Wealth and BT Wealth business market share at this time. Westpac Group 2018 Full Year Financial Results Announcement | 57 $bn As at As at% Mov'tAs at% Mov't NetOther30 Sept Sept 18 - 31 March Sept 18 - InflowsOutflowsFlowsMov't12017Sept 172018Mar 18 30 Sept 2018 Superannuation Platforms Packaged funds2 Other3 Total funds 39.3 4.0(4.0)-3.136.2937.45 25.8(26.6)(0.8)8.4115.37118.64 6.5(5.7)0.82.436.4938.04 ---0.33.593.73 122.9 39.6 3.8 205.6 36.3(36.3)-14.2191.47197.74 $m % Mov't Half Year Sept 18 - March 18 Mar 18 % Mov't Full YearSept 18 - Sept 17Sept 17 Half Year Full Year Sept 18 Sept 18 Net interest income Non-interest income Net operating income Operating expenses Core earnings Impairment charges Operating profit before tax Tax and non-controlling interests Cash earnings Expense to income ratio 291 2814 631(29) 572 49615 1,183(9) 449 1,080 740 912(19) (544)15 1,652 1,679(2) (1,084)8 (627) (1,171) 113 368(69) (4)(25) 481 595(19) (3)133 (3) (7) 110 364(70) (111)(68) 474 592(20) (179)(18) (36) (147) 74 253(71) 327 413(21) 84.73% 59.65%large 70.88% 64.56%large

2018 Full Year financial results Divisional results 3.3.2 Insurance business The Insurance business result includes the Westpac Lenders Mortgage Insurance (LMI) businesses. and St.George Life Insurance, General Insurance and Half Year Sept 18 - Half Year Sept 18 - Insurance key metrics Half Year Sept 18 - Half Year Sept 18 - Half Year Sept 18 - 1 Full Year 2017 includes a methodology change for the calculation of premium discounts, creating a one-off increase of $32 million. This has no impact on earned premiums. Sales/New Business for Full Year 2018 includes $203 million from Group Life insurance for BTFG Corporate Super. 2 As at 1 January 2018, Westpac Life Insurance Services Limited became the preferred insurer for BTFG Corporate Superannuation members. The life insurance in-force premium as at 30 September 2018 consists of $994 million retail, $283 million Group Life Insurance. (31 March 2018: $1 billion retail, $276 million Group Life insurance; 30 September 2017: $993 million retail, $75 million Group Life Insurances). 3 Claims ratios are claims over earned premium plus reinsurance rebate. The lenders mortgage insurance claims ratios have been calculated to include exchange commission. 4 LMI gross written premium includes loans >90% LVR reinsured with Arch Reinsurance Limited. Full Year 2018 gross written premiums includes $123 million from the arrangement (Second Half 2018: $61 million; First Half 2018 $62 million). 58 | Westpac Group 2018 Full Year Financial Results Announcement Gross written premiums $m Half Year Sept 18 % Mov't% Mov't Full YearSept 18 - Sept 17Sept 17 Full Year March 18Mar 18 Sept 18 General Insurance gross written premium Lenders Mortgage Insurance gross written premium4 252 251-90-503 508(1) 250(28) 90 180 Claims ratios3 for Insurance Business (%) Half Year Sept 18 % Mov't% Mov't Full YearSept 18 - Sept 17Sept 17 Full Year March 18Mar 18 Sept 18 Life Insurance General Insurance Lenders Mortgage Insurance 42 44(5) 54(31) 20(45) 43 3716 53(13) 17(6) 37 46 11 16 Life Insurance in-force premiums $m Half Year Sept 18 % Mov't% Mov't Full YearSept 18 - Sept 17Sept 17 Full Year March 18Mar 18 Sept 18 Life Insurance in-force premiums at start of period Sales / New Business1 Lapses Life Insurance in-force premiums at end of period2 1,276 1,06819 283(72) (75)5 1,068 97310 23455 (139)11 80 363 (79) (154) 1,277 1,276-1,277 1,06820 Cash earnings $m Half Year Sept 18 % Mov't% Mov't Full YearSept 18 - Sept 17Sept 17 Full Year March 18Mar 18 Sept 18 Life Insurance General Insurance Lenders Mortgage Insurance Total cash earnings 71 75(5) 4344 15(20) 146 160(9) 9115 39(31) 62 105 12 27 145 1339 278 290(4) $m Half Year Sept 18 % Mov't% Mov't Full YearSept 18 - Sept 17Sept 17 Full Year March 18Mar 18 Sept 18 Net interest income Non-interest income Net operating income Operating expenses Core earnings Impairment (charges) / benefits Operating profit before tax Tax and non-controlling interests Cash earnings Expense to income ratio 2 3(33) 24311 5 10(50) 4993 269 512 271 24610 (55)9 517 5092 (99)16 (60) (115) 211 19110 --402 410(2) --- - 211 19110 (58)14 402 410(2) (120)3 (66) (124) 145 1339 278 290(4) 22.14% 22.36%(22bps) 22.24% 19.45%279bps
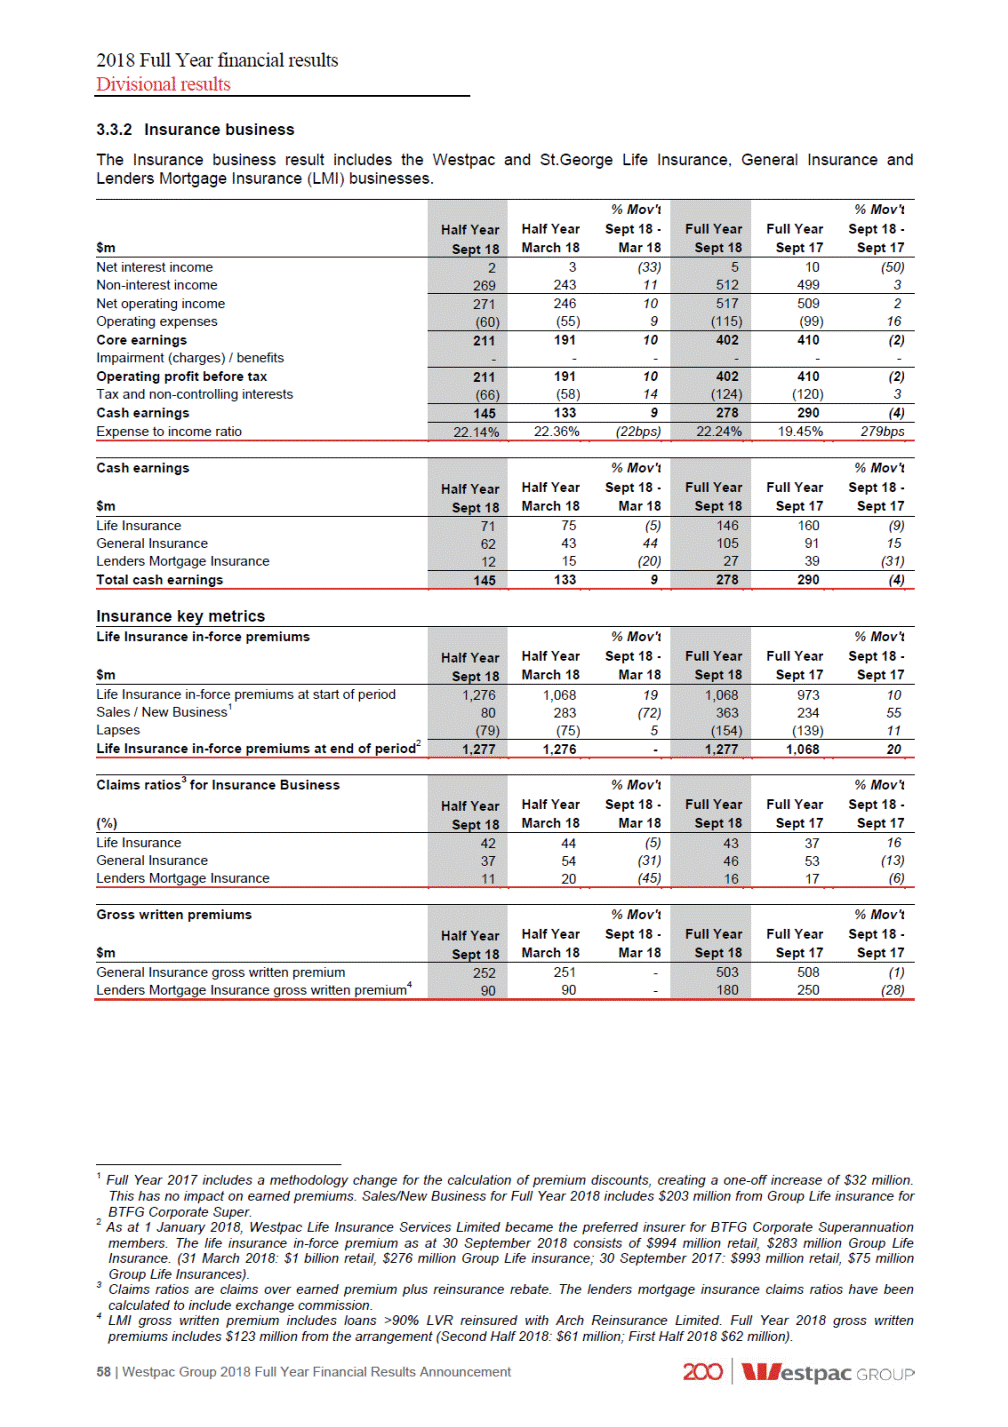
2018 Full Year financial results Divisional results 3.4 Westpac Institutional Bank Westpac Institutional Bank (WIB) delivers a broad range of financial products and services to commercial, corporate, institutional and government customers with connections to Australia and New Zealand. WIB operates through dedicated industry relationship and specialist product teams, with expert knowledge in financing, transactional banking, and financial and debt capital markets. Customers are supported throughout Australia as well as via branches and subsidiaries located in New Zealand, the US, UK and Asia. WIB is also responsible for Westpac Pacific currently providing a range of banking services in Fiji and PNG. WIB works in an integrated way with all the Group’s divisions in the provision of more complex financial needs including across foreign exchange and fixed interest solutions. Revenue contribution 1 Averages are based on a six month period for the halves and a twelve month period for the full year. 2 Includes capital benefit and the Bank Levy. Westpac Group 2018 Full Year Financial Results Announcement | 59 $m Half Year Sept 18 % Mov't Half YearSept 18 - March 18Mar 18 Full Year Sept 18 % Mov't Full YearSept 18 - Sept 17Sept 17 Lending and deposit revenue Markets, sales and fee income Total customer revenue Derivative valuation adjustments Trading revenue Hastings Other2 Total WIB revenue 844 439 7907 451(3) 1,634 890 1,5495 951(6) 1,283 1,2413 2,524 2,5001 14 60 180 11 --161(63) 23large (1)large 14 221 203 10 46(70) 317(30) 93118 79(87) 1,548 1,4249 2,972 3,035(2) $bn As at 30 Sept 2018 As at% Mov't 31 MarchSept 18 - 2018Mar 18 As at 30 Sept 2018 As at% Mov't 30 SeptSept 18 - 2017Sept 17 Deposits Net loans Loans Provisions Total net loans Deposit to loan ratio Total assets TCE Average interest-earning assets1 Impairment charges/(benefits) to average loans annualised Impaired assets to TCE Total stressed assets to TCE Total funds 104.8 77.5 (0.3) 98.96 76.41 (0.3)-104.8 77.5 (0.3) 92.114 74.44 (0.3)-77.2 76.11 77.2 74.14 135.75% 129.96%large 135.75% 124.29%large 102.4 262.1 86.0 (0.05%) 0.02% 0.44% - 104.8(2) 251.24 85.9-(0.05%)-0.04%(2bps) 0.52%(8bps) 6.6(100) 102.4 262.1 86.0 (0.05%) 0.02% 0.44% - 103.1(1) 249.15 83.63 0.08%(13bps) 0.07%(5bps) 0.55%(11bps) 12.5(100) $m Half Year Sept 18 % Mov't Half YearSept 18 - March 18Mar 18 Full Year Sept 18 % Mov't Full YearSept 18 - Sept 17Sept 17 Net interest income Non-interest income Net operating income Operating expenses Core earnings Impairment (charges) / benefits Operating profit before tax Tax and non-controlling interests Cash earnings Economic profit Expense to income ratio Net interest margin 741 807 67510 7498 1,416 1,556 1,3287 1,707(9) 1,548 (771) 1,4249 (675)14 2,972 (1,446) 3,035(2) (1,351)7 777 21 7494 1724 1,526 38 1,684(9) (56)large 798 (263) 7664 (215)22 1,564 (478) 1,628(4) (469)2 535 551(3) 1,086 1,159(6) 254 49.81% 1.72% 22413 47.40%241bps 1.58%14bps 478 48.65% 1.65% 4672 44.51%large 1.59%6bps

2018 Full Year financial results Divisional results Financial performance Second Half 2018 - First Half 2018 Cash earnings were $16 million or 3% lower than First Half 2018, mostly driven by lower markets income partly offset by a 14 basis point rise in net interest margin. During Second Half 2018 the exit of the Hastings business increased both revenue and expenses (and contributed to a higher tax rate). Hastings contributed $19 million in cash earnings in the half. Full Year 2018 – Full Year 2017 Cash earnings were $73 million or 6% lower than Full Year 2017 mostly due to lower markets revenue. The decline was partially offset by higher margins and an impairment benefit. In Full Year 2018 the division exited the Hastings business which lifted both revenues and expenses (and contributed to a higher tax rate) but had little impact on cash earnings. 60 | Westpac Group 2018 Full Year Financial Results Announcement Net interest income up $88m, 7% Lending was up 4%, from increased utilisation of mortgage warehouse facilities and a fall in the A$ lifting Asia trade finance and loan balances; Deposits increased 14% from higher Australian transaction balances and term deposits. Asia term deposits also increased due to foreign exchange translation impacts and to support lending in that region; and Net interest margin was up 6 basis points, from higher transaction deposit margins and reduced wholesale funding costs. This was partially offset by the full period impact of the Bank Levy (5 basis points). Non-interest income down $151m, 9% Hastings contribution up $110 million, mainly from income associated with the exit of Hastings business; Excluding Hastings, non-interest income was down $261 million, or 16%, primarily from the non-repeat of several large infrastructure transactions and lower markets revenue in fixed income sales and trading; and Fee income was also lower from increased utilisation of existing credit limits. Expenses up $95m, 7% Hastings expenses up $87 million, from goodwill write-off and restructuring costs associated with the exit of the business; and Excluding Hastings, operating expenses were up $8 million, or 1%, due to higher technology, regulatory and compliance expenses. Impairment charge positive movement of $94m Stressed and impaired assets to TCE decreased over the year to near historical lows; and The movement in impairment charges was due to the absence of any large downgrade over the year. Economic profit up $11m, 2% Disciplined balance sheet management and a reduction in capital allocated to certain institutional facilities reduced allocated capital; Higher effective tax rate (from non-deductible nature of the goodwill write-off) increased the franking benefit; and These benefits more than offset the lower cash earnings contribution. Net interest income up $66m, 10% Loans up 1%, from higher utilisation of mortgage warehouse facilities, following a run down in balances in First Half 2018; Deposits up 6%, from higher Australian transaction balances; and Net interest margin up 14 basis points, from higher margins on transaction deposits and reduced wholesale funding requirements. Non-interest income up $58m, 8% Hastings contribution up $157 million primarily from income associated with the exit of the business and higher performance fees, which typically occur in second half; and Excluding Hastings, other non-interest income was down $99 million from a decline in trading revenue across commodities and foreign exchange. Expenses up $96m, 14% Hastings expenses were up $84 million, from goodwill write-off and restructuring costs from the exit of the business; and Excluding Hastings, operating expenses were up $12 million or 2% from increased technology and regulatory and compliance expenses. Impairment benefit up $4m, 24% Credit quality remained sound, with both stressed and impaired assets to TCE decreasing over the half; and The impairment benefit reflects no new large impaired assets emerging over the period. Economic profit up $30m, 13% Economic profit increased as disciplined management of credit limits and improving credit quality reduced allocated capital; and Economic profit was also supported by higher franking benefit due to the higher effective tax rate associated with the non-deductibility of the goodwill write-off.
2018 Full Year financial results Divisional results Hastings1 During 2018 the Hastings business was exited. The business contributed $17 million to cash earnings in Full Year 2018. Full Year Full Year $m Sept 17 Sept 18 Net operating income1 Operating expenses Tax and non-controlling interests Cash earnings 94 (71) 204 (158) (9) (29) 14 17 1 Includes capital benefit. Westpac Group 2018 Full Year Financial Results Announcement | 61
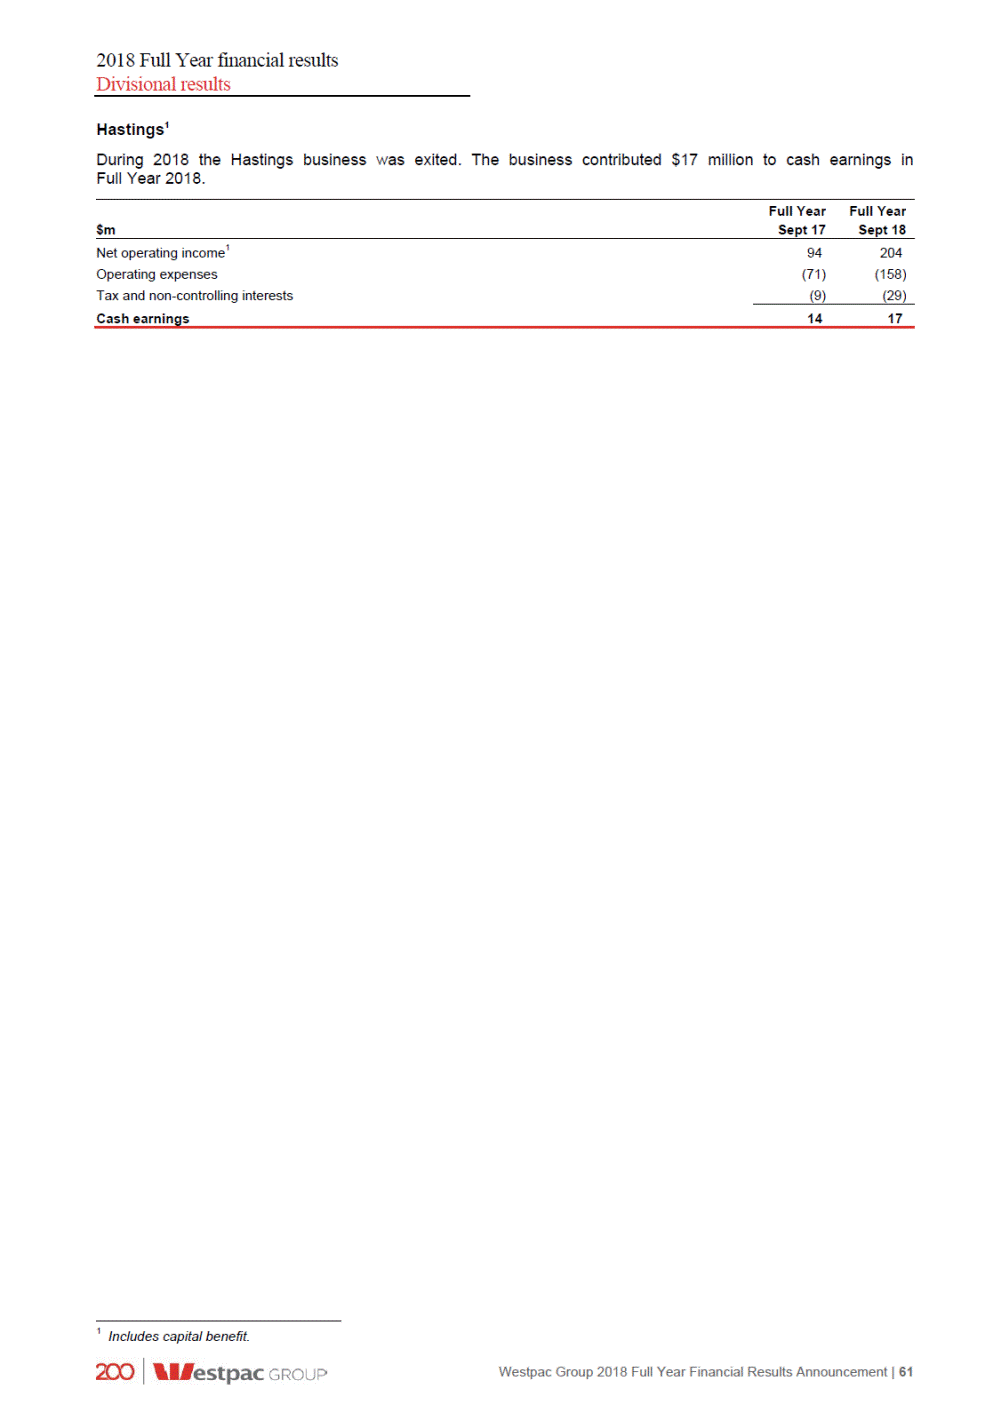
2018 Full Year financial results Divisional results 3.5 Westpac New Zealand Westpac New Zealand is responsible for sales and service of banking, wealth and insurance products for consumers, business and institutional customers in New Zealand. Westpac conducts its New Zealand banking business through two banks in New Zealand: Westpac New Zealand Limited, which is incorporated in New Zealand and Westpac Banking Corporation (New Zealand Branch), which is incorporated in Australia. Westpac New Zealand operates via an extensive network of branches and ATMs across both the North and South Islands. Business and institutional customers are also served through relationship and specialist product teams. Banking products are provided under the Westpac brand while insurance and wealth products are provided under Westpac Life and BT brands, respectively. operations and treasury. New Zealand also maintains its own infrastructure, including technology, 1 Total deposits in this table refer to total customer deposits. 2 Averages are based on a six month period for the halves and a twelve month period for the full year. 3 The presented ratios are for the halves ended 30 September and 31 March. 62 | Westpac Group 2018 Full Year Financial Results Announcement As at As atAs atAs at 31 March30 Sept 31 March 201820172017 30 Sept 2018 Credit quality Impairment charges/(benefits) to average loans annualised3 Mortgage 90+ day delinquencies Other consumer loans 90+ day delinquencies Impaired assets to TCE Total stressed assets to TCE (0.06%) 0.11% 0.62% 0.15% 1.57% 0.07%(0.10%)(0.09%) 0.16%0.12%0.14% 0.86%0.57%0.58% 0.21%0.18%0.20% 1.86%2.06%2.41% NZ$bn As at As at% Mov't 31 MarchSept 18 - 2018Mar 18 As at As at% Mov't 30 Sept Sept 18 - 2017Sept 17 30 Sept 30 Sept 2018 2018 Deposits Term deposits Other Total deposits1 Net loans Mortgages Business Other Provisions Total net loans Deposit to loan ratio Total assets TCE Third party liquid assets Average interest-earning assets2 Total funds 32.6 29.3 31.63 30.0(2) 32.6 29.3 30.09 28.43 61.9 48.9 29.8 2.0 (0.3) 61.6-47.92 29.51 2.1(5) (0.4)(25) 61.9 48.9 29.8 2.0 (0.3) 58.46 46.94 28.64 2.2(9) (0.4)(25) 80.4 79.12 80.4 77.34 76.99% 77.88%(89bps) 76.99% 75.55%144bps 90.0 89.8-90.0 88.32 112.0 7.5 87.9 10.7 111.7-8.6(13) 86.02 10.34 112.0 7.5 87.0 10.7 108.83 8.7(14) 85.81 10.16 NZ$m % Mov't Half Year Sept 18 - March 18 Mar 18 % Mov't Full Year Sept 18 - Sept 17Sept 17 Half Year Full Year Sept 18 Sept 18 Net interest income Non-interest income Net operating income Operating expenses Core earnings Impairment (charges) / benefits Operating profit before tax Tax and non-controlling interests Cash earnings Economic profit Expense to income ratio Net interest margin 950 233 9223 244(5) 1,872 477 1,7388 511(7) 1,183 (468) 1,1661 (468)-2,349 (936) 2,2494 (962)(3) 715 24 6982 (27)large 1,413 (3) 1,28710 76large 739 (204) 67110 (189)8 1,410 (393) 1,3633 (392)-535 48211 1,017 9715 253 39.56% 2.16% 20722 40.14%(58bps) 2.15%1bps 460 39.85% 2.15% 4317 42.77%(292bps) 2.03%12bps

2018 Full Year financial results Divisional results Financial performance (NZ$) Second Half 2018 – First Half 2018 Core earnings increased 2% over the half supported by a 1 basis point increase in net interest margin partly offset by lower non-interest income. A $51 million turnaround in impairments (a $24 million benefit compared to a $27 million charge in First Half 2018), supported the 11% increase in cash earnings. growing at 1.1 times system1; and Full Year 2018 – Full Year 2017 Core earnings increased 10% over the year supported by a 12 basis point increase in net interest margin, and a 3% decline in expenses, partly offset by lower non-interest income. Cash earnings growth was up 5% as Full Year 2018 recorded an impairment charge of $3 million compared to an impairment benefit in Full Year 2017. . 1 RBNZ data: five months April–August 2018. Westpac Group 2018 Full Year Financial Results Announcement | 63 Net interest income up $134m, 8% Loans increased $3.1 billion (4%), with the majority ($2.0 billion) in mortgages. Business growth of $1.2 billion, was across a broad range of sectors. Overall consumer lending was below system as the division balanced return with growth; Deposits increased $3.5 billion, more than funding loan growth over the year, and resulting in the deposit to loan ratio increasing 144 basis points to 77.0%. Most deposit growth was in term products as customers sought higher yields; and Net interest margin was 12 basis points higher from increased mortgage and business lending spreads, partly offset by lower deposit spreads. Non-interest income down $34m, 7% Decline was driven by lower cards income, product simplification (reducing some fees on existing accounts), and customer migration to lower/no fee digital channels; and Higher investment income from a 6% rise in funds and higher merchant and business lending fees, partly offset these declines. Expenses down $26m, 3% Benefits from the transformation program include a reduction in branch numbers (down 6 over the year), lower FTE, and increased self-service from digitisation; Project costs associated with the transformation program were also lower; and Partly offsetting these benefits were increased risk management and regulatory costs and higher costs from annual salary reviews and inflation. Impairment charge of $3m compared to an impairment benefit of $76m Credit quality improved with stressed assets to TCE reducing 49 basis points to 1.57%. The decline was mostly due to the continued improvement in the dairy sector. Consumer 90+ day delinquencies remain near historic lows; and Impairment charges were higher due to the non-repeat of write-backs of some large facilities and improvement in the dairy industry across Full Year 2017. Economic profit up $29m, 7% Growth was broadly in line with the rise in cash earnings of 5%. Net interest income up $28m, 3% Loans were up 2%, mostly from mortgages. Growth was below system for the half (mortgage growth 0.7 times system1) as the division balanced return with growth; Deposits were little changed over the half with growth in term deposits offset by a decline in business deposits. The business focused on retail consumer deposits, with household deposits Net interest margin was up 1 basis point from higher mortgage and business spreads partly offset by lower deposit spreads. Non-interest income down $11m, 5% Decline was primarily due to the removal of certain consumer fees (including some ATM fees); and Partly offset by higher investment income from a 4% rise in fund balances, an increase in financial markets income, and higher business fees. Expenses flat Productivity from the division's transformation program, including lower network costs, increased self-service and digitising more activity, offset increases in business as usual expenses; and Project spend associated with the transformation program was lower and this offset higher regulatory and compliance costs. Impairment benefit of $24m compared to an impairment charge of $27m Credit quality improved with stressed assets to TCE reducing 29 basis points to 1.57%. The decline was mostly due to the continued improvement in the dairy sector. Other consumer delinquencies decreased 24 basis points to 0.62%, mostly from the resolution of an operational issue in collections; and Impairment charges benefited from the write-back and recovery of some facilities and a benefit for provisions no longer required for the New Zealand dairy overlay. Economic profit up $46m, 22% Economic profit increased 22%, with cash earnings growing 11% and allocated capital increasing 2% in line with lending growth.
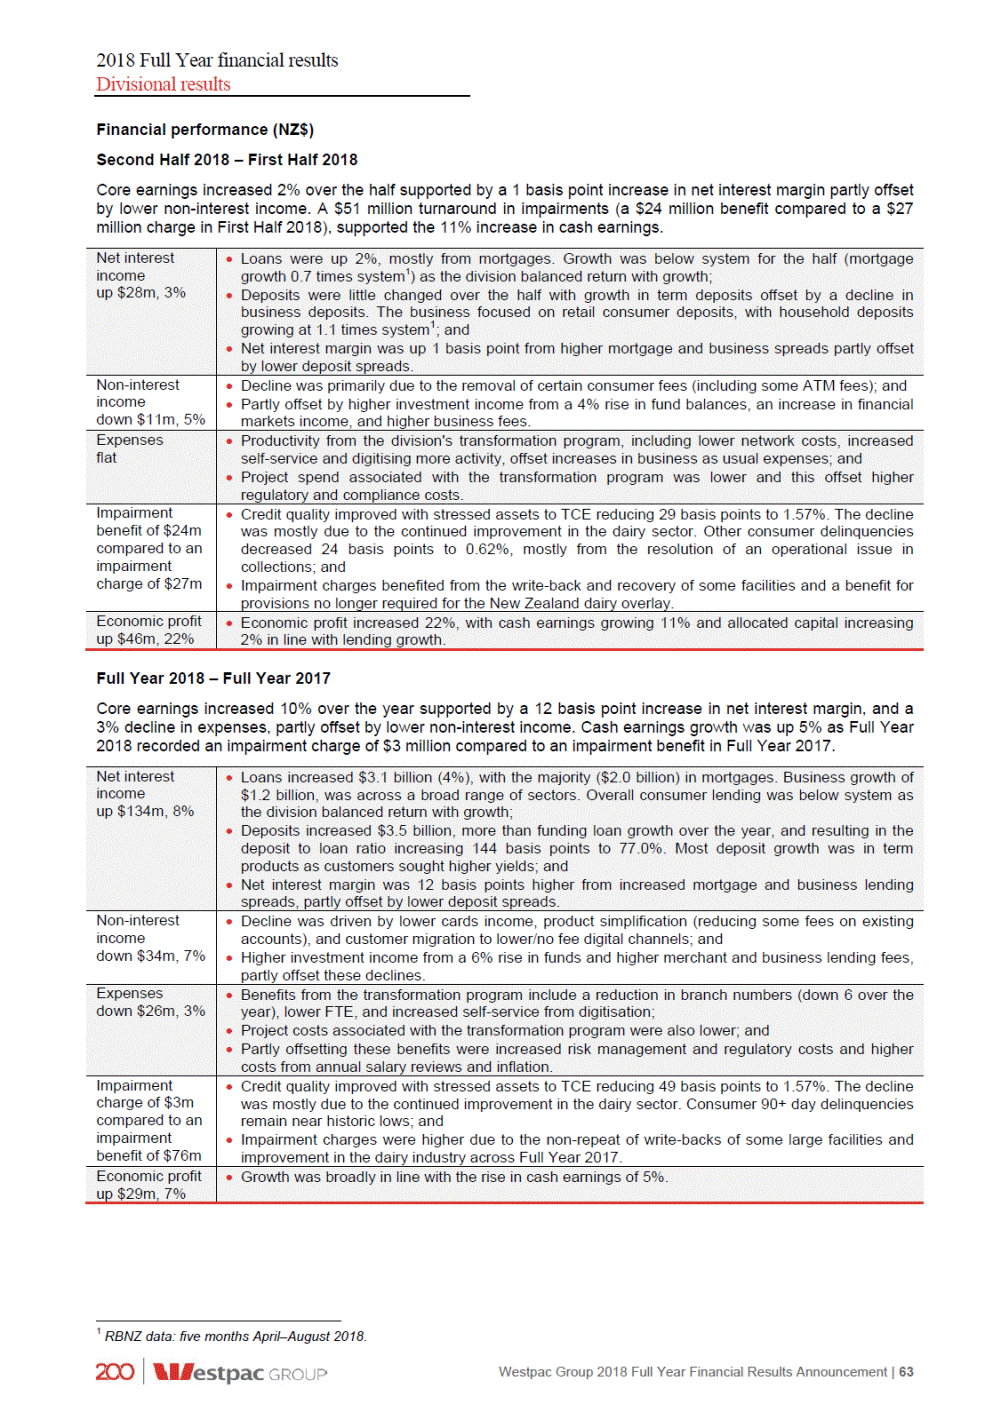
2018 Full Year financial results Divisional results 3.6 Group Businesses This segment comprises: Treasury, which is responsible for the management of the Group’s balance sheet including wholesale funding, capital and management of liquidity. Treasury also manages the interest rate risk and foreign exchange risks inherent in the balance sheet, including managing the mismatch between Group assets and liabilities. Treasury’s earnings are primarily sourced from managing the Group’s balance sheet and interest rate risk (excluding Westpac New Zealand) within set risk limits; Group Technology1, which comprises functions for the Australian businesses, is responsible for technology strategy and architecture, infrastructure and operations, applications development and business integration; Core Support2, which comprises functions performed centrally, including Australian banking operations, property services, strategy, finance, risk, compliance, legal, human resources and customer and corporate relations; and Group Businesses also includes earnings on capital not allocated to divisions, certain intra-group transactions that facilitate presentation of performance of the Group’s operating segments, earnings from non-core asset sales, earnings and costs associated with the Group’s Fintech investments, and certain other head office items such as centrally raised provisions. Treasury Value at Risk (VaR)3 $m Average High Low Six months ended 31 March 2018 Six months ended 30 September 2017 39.3 33.2 56.7 57.4 27.0 24.2 1 Costs are fully allocated to other divisions in the Group. 2 Costs are partially allocated to other divisions in the Group, with costs attributed to enterprise activity retained in Group Businesses. 3 VaR includes trading book and banking book exposures. The banking book component includes interest rate risk, credit spread risk in liquid assets and other basis risks as used for internal management purposes. 64 | Westpac Group 2018 Full Year Financial Results Announcement Six months ended 30 September 2018 29.3 32.625.6 Treasury $m % Mov't Half Year Sept 18 - March 18 Mar 18 % Mov't Full YearSept 18 - Sept 17Sept 17 Half Year Full Year Sept 18 Sept 18 Net interest income Non-interest income Net operating income Cash earnings 331 4 406(18) 6(33) 737 10 6759 825 335 211 412(19) 269(22) 747 480 6839 43610 $m % Mov't Half Year Sept 18 - March 18 Mar 18 % Mov't Full YearSept 18 - Sept 17Sept 17 Half Year Full Year Sept 18 Sept 18 Net interest income Non-interest income Net operating income Operating expenses Core earnings Impairment (charges) / benefits Operating profit before tax Tax and non-controlling interests Cash earnings 375 22 437(14) 1369 812 35 71314 (33)large 397 (282) 450(12) (289)(2) 847 (571) 68025 (456)25 115 15 161(29) (13)large 276 2 22423 43(95) 130 (87) 148(12) (90)(3) 278 (177) 2674 (175)1 43 58(26) 101 9210

2018 Full Year financial results Divisional results Financial performance Second Half 2018 – First Half 2018 Cash earnings decreased $15 million in the half primarily from lower Treasury revenue, partly offset by reduced expenses and a lower impairment charge. Full Year 2018 – Full Year 2017 Cash earnings increased $9 million primarily from higher Treasury revenue and earnings on capital, partly offset by increased expenses and a lower impairment benefit. Westpac Group 2018 Full Year Financial Results Announcement | 65 Net operating income up $167m, 25% Net interest income increased $99 million primarily from Treasury revenue related to Australian interest rate risk management and increased earnings from centrally held capital. Non-interest income increased $68 million primarily due to the impact of New Zealand earnings hedges and a $10 million gain on asset sales. Expenses up $115m, 25% Higher regulatory and compliance costs, including costs associated with the Royal Commission, and estimated provisions for litigation; Higher restructuring costs; and Expenses associated with the Group’s fintech investments Impairment benefit $41m movement Movements in impairments reflect a $2 million benefit from a reduction to centrally held overlays during Full Year 2018, compared to a $43 million benefit in Full Year 2017. Net operating income down $53m, 12% Lower Treasury revenue related to interest rate risk management; partly offset by Higher earnings from centrally held capital and impact of New Zealand earnings hedges. Expenses down $7m, 2% Lower expenses primarily from additional payroll related rebates and a decrease in costs associated with the Royal Commission; partly offset by Higher regulatory and compliance costs. Impairment charges $28m movement Movement in impairments reflects a change to centrally held overlays, predominantly from a reduction in the overlays provision in the half ($14 million), compared to a $12 million charge in First Half 2018. Tax and non-controlling interests down $3m, 3% Effective tax rate is higher than the Australian company tax rate of 30%, mostly due to the impact of hybrid distributions that are not tax deductible.

2018 Full Year financial results Table of Contents 4.1 4.2 4.3 4.4 4.5 4.6 4.7 Significant developments 67 Consolidated income statement 80 Consolidated statement of comprehensive income 81 Consolidated balance sheet 82 Consolidated statement of changes in equity 83 Consolidated cash flow statement 85 Notes to the consolidated financial statements 86 Note 1 Basis of preparation 86 Note 2 Segment reporting 87 Note 3 Net interest income 91 Note 4 Non-interest income 92 Note 5 Operating expenses 93 Note 6 Income tax 94 Note 7 Earnings per share 95 Note 8 Average balance sheet and interest rates 96 Note 9 Loans 97 Note 10 Provisions for impairment charges 98 Note 11 Credit quality 99 Note 12 Deposits and other borrowings 101 Note 13 Fair values of financial assets and liabilities 102 Note 14 Contingent liabilities, contingent assets and credit commitments 108 Note 15 Shareholders’ equity 112 Note 16 Notes to the consolidated cash flow statement 114 Note 17 Subsequent events 115 4.8 Statement in relation to the audit of the financial statements 116 66 | Westpac Group 2018 Full Year Financial Results Announcement 4.0 Full Year financial report 2018

2018 Full Year financial results Significant Developments Significant developments Corporate significant developments Royal Commission into the banking, superannuation and financial services industries On 14 December 2017, the Australian Government established a Royal Commission into potential misconduct in Australia's banks and other financial services entities. The terms of reference for the Royal Commission require it to consider (amongst other things) the conduct of banks, insurers, financial service providers, superannuation funds (not including self-managed superannuation funds) and intermediaries between borrowers and lenders, and the effectiveness of Australian regulators in addressing misconduct in financial institutions. The Royal Commission is not required to inquire into matters such as the financial stability of Australia's banks. A final report is to be provided by the Commission to the Australian Government by 1 February 2019, and an interim report was released and tabled in parliament on 28 September 2018. The Royal Commission is inquiring into potential misconduct and conduct, practices, behaviour or business activities by financial services entities that may fall below community standards and expectations. The Commission has sought and received public submissions as to misconduct issues in financial services and conducted a range of public hearings which have considered case studies of alleged misconduct issues. Westpac has provided the Commission with documents and witness statements and made submissions in all rounds of the Royal Commission to date. The Interim Report of the Commission released on 28 September 2018 outlined a range of views the Commissioner has formed to date based on the information and hearings so far and has requested submissions on key areas of policy that might affect or address misconduct in the financial services industry. Many of those matters could have significant impacts on particular entities (including Westpac) and the financial services industry generally, as well as affecting the financial performance of financial institutions, including banks. Recommendations may include matters which could cause structural change to the financial services industry and/or business models used in the industry, changes to the compensation and incentive structures within the financial services industry, and changes involving the way financial services are regulated. Westpac made submissions in relation to the questions posed in the Interim Report on 26 October 2018. The Commission will ultimately make findings and recommendations having considered the submissions Counsel Assisting, relevant financial institutions, other relevant bodies including regulators and the general public have made during the course of the proceedings of the Commission. The Commission’s findings and recommendations may include recommendations as to civil or criminal prosecutions that should be conducted against financial institutions and individuals, recommendations as to legislative reform and in respect of matters which regulatory or other policy bodies should consider. In the event that the Federal Government supports recommended regulatory changes, the Royal Commission may result in changes to legislation and regulation. The Royal Commission is also considering the regulation and enforcement practices of our regulators. Any findings or recommendations made by the Royal Commission are likely to have and could continue to prompt regulators to commence investigations into various financial services entities including Westpac. Those steps could subsequently result in administrative or enforcement action being taken. The Commission may also prompt our regulators to alter their existing policies and practices (including increasing their expectations for entities that they regulate, including Westpac) and increase the number of potential contraventions they choose to publicly litigate rather than otherwise resolve, which could harm our reputation and increase our liabilities related to legal proceedings. There is also a risk that matters considered during the Royal Commission have resulted in or could encourage civil claims against financial institutions including class actions. Parliamentary inquiries and other reviews On 16 September 2016, the Chairman of the House of Representatives Standing Committee on Economics announced that the Committee had commenced its Review of the Four Major Banks (Parliamentary Review). The terms of reference for the Parliamentary Review are wide-ranging, with one area of focus being how individual banks and the industry as a whole are responding to issues identified through other inquiries, including through the Australian Banking Association (ABA) action plan. Westpac attended public hearings of the Parliamentary Review on 6 October 2016, 8 March 2017, 11 October 2017 and 11 October 2018. The third report of the Parliamentary Review was published on 7 December 2017. In its third report, the Committee made recommendations to ensure merchants have the choice of how to process "tap and go" payments on dual network cards, that the Australian Competition and Consumer Commission (ACCC) as part of its inquiry into residential mortgage products should assess the repricing of interest-only mortgages that occurred in June 2017, that legislation is introduced to mandate banks' participation in Comprehensive Credit Reporting (discussed below) and that the Attorney-General should review the threshold transaction reporting obligations in light of the issues identified in a case brought by the Australian Transaction Reports and Analysis Centre against the Commonwealth Bank of Australia. Westpac Group 2018 Full Year Financial Results Announcement | 67

2018 Full Year financial results Significant Developments On 29 November 2016, the Senate referred an inquiry into the regulatory framework for the protection of consumers, including small businesses, in the banking, insurance and financial services sector to the Senate Economics References Committee. The terms of reference for the inquiry focus on a range of matters relating to the protection of consumers against wrongdoing in the sector. They also require the inquiry to examine the availability and adequacy of redress and support for consumers who have been victims of wrongdoing. The inquiry reporting date has been revised to 15 November 2018 to allow for the interim report of the Royal Commission to be handed down. In addition to the reviews and inquiries mentioned above, the ACCC is undertaking a specific inquiry into the pricing of residential mortgages by those banks affected by the Bank Levy (including Westpac), which include monitoring the extent to which the Bank Levy is passed on to customers. An interim report was published in March 2018 and a final report is due in November 2018. The inquiry into the pricing of residential mortgages is the first task of the Financial Services Unit (FSU), established by the ACCC in 2017 to undertake regular inquiries into specific financial services competition issues. The FSU has commenced market studies work from July 2018. The precise scope of that work has not yet been determined, and could include a review of the impact of regulatory measures which affect the ability of smaller banks to compete against the major banks, barriers to entry in financial services markets and consumer switching. On 2 October 2018, the ACCC announced it was holding an inquiry into the supply of foreign currency conversion services in Australia. The inquiry is the second task of the FSU, and will examine the pricing of foreign currency conversion services and evaluate whether there are impediments to effective price competition in the sector. A report is due to be provided by the ACCC to the Treasurer by 31 May 2019. As these reviews and inquiries progress, they may lead to further regulation and reform. APRA self-assessment On 1 May 2018, in the context of the publication of the final report in relation to the prudential inquiry into the Commonwealth Bank of Australia, APRA indicated that all regulated financial institutions would benefit from conducting a self-assessment into their frameworks and practices in relation to governance, culture and accountability. For large financial institutions such as Westpac, APRA noted it will also be seeking written assessments in relation to these matters that have been reviewed and endorsed by their Board. Westpac’s self-assessment is currently underway and the report is due to APRA on 30 November 2018. Productivity Commission Inquiry into Competition in the Australian Financial System In May 2017, the Australian Government announced a Productivity Commission inquiry into competition in the financial system. This review was a recommendation of the Financial System Inquiry (FSI). The terms of reference were broad and required the Productivity Commission to review competition in Australia's financial system with a view to improving consumer outcomes, the productivity and international competitiveness of the financial system and the economy more broadly, and supporting ongoing financial system innovation, while balancing these with financial stability objectives. The Productivity Commission released its final report on 3 August 2018 in which it found that financial system regulation since the Global Financial Crisis had favoured stability over competition. A number of the Productivity Commission's recommendations were aimed at addressing this perceived regulatory imbalance, including that: the Australian Government should implement an open banking system; the ACCC should receive a mandate to 'champion' competition in the financial system; trail commissions, volume-based commissions, campaign-based commissions and volume-based payments should be banned in mortgage broking and clawback of commissions from brokers restricted to a maximum 2 year period; all brokers, aggregators, lenders and their employees who provide home loans to customers should have a clear legally-backed best interest obligation to their clients; all banks should appoint a Principal Integrity Officer (PIO) obliged by law to report directly to their board on the alignment of any payments made by the institution with the new customer best interest duty. The PIO would also have an obligation to report independently to ASIC in instances in which a board is not responsive to their advice; the ACCC should undertake five-yearly market studies on the effect of vertical and horizontal integration on competition in the financial system. The first of these studies should commence in 2019 and include establishing a robust evidence base of integration activity in the financial system; 68 | Westpac Group 2018 Full Year Financial Results Announcement
2018 Full Year financial results Significant Developments ASIC should require all lenders to provide those borrowers that are levied with lenders mortgage insurance (LMI) with the option of such insurance being levied once at the commencement of their home loan (whether paid as a lump sum or as deferred payments) or it being levied annually over the first 6 years of their loan, including requiring them to also provide borrowers with transparency in relation to the comparison of these options; where LMI is levied at the commencement of the home loan, all lenders should be required to set a schedule of refunds on the cost of LMI when borrowers choose to refinance or pay out their loan within 6 years of the loan being originated. The refund schedule should be made available to the borrower before any fee or charge is levied; and the Payments System Board should introduce a ban on card payment interchange fees by mid-2019. ASIC action on compliance breaches with fees disclosure and renewal notices On 12 October 2018, ASIC announced a review of compliance with requirements for Fee Disclosure Statements (FDS) and Renewal Notices. ASIC advised that it has received a number of breach reports from licensees which indicate they may have failed to comply with the FDS and Renewal Notice requirements that were implemented as part of the FoFA reforms. These reports are currently being investigated by ASIC, and ASIC may take enforcement action where breaches are substantiated. In addition to investigating these particular instances, ASIC announced that it will test compliance with FDS and Renewal Notice requirements across the financial advice sector. ASIC will report its findings in 2019. Residential mortgage lending - reviews by and engagement with regulators In recent years, regulators have focused on aspects of residential mortgage lending standards across the industry. APRA has been looking at, and speaking publicly about, the broader issue of bank serviceability standards pertaining to residential mortgage lending. During the year, Westpac further strengthened its controls on mortgage serviceability requirements. This work has been guided by the findings identified through the 2016/17 targeted review of data used in residential mortgage serviceability assessments, which was undertaken by Westpac (and other large ADIs) at APRA’s request. The focus of the review was on the adequacy of controls used to ensure borrower information in serviceability assessments was complete and accurate. Westpac engaged PricewaterhouseCoopers (PwC) to undertake the targeted review which was completed in May 2017. Based on the results of their evaluation of the design and operating effectiveness of the controls in place, PwC issued a qualified opinion on the basis of 8 of the 10 control objectives stipulated by APRA. While PwC found that Westpac had implemented a wide range of controls related to verifying certain categories of borrower information (particularly in relation to income), they noted that Westpac should give further consideration to strengthening controls in certain areas, such as declared expenses and other debts. Westpac is continuing to engage with APRA in relation to its progress in strengthening these controls together with its risk management framework for residential mortgage lending, including in relation to oversight, operating systems and controls, and assurance. Additionally, in line with APRA’s letter to ADIs dated 26 April 2018 (Embedding Sound Residential Mortgage Lending Practices), Westpac has been engaging with APRA in relation to its residential mortgage lending policies and practices. In the mortgage area, ASIC continues to focus on interest only mortgage origination and high risk customer groups (such as customers with reverse mortgages). ASIC has also reviewed public statements by some banks (including Westpac) about interest rate changes, following the introduction of APRA's macro-prudential limits for ADIs in respect of interest only lending flows. Westpac is working with ASIC on their reviews in these areas. Anti-Money laundering and counter-terrorism financing reforms and initiatives On 13 December 2017, the Anti-Money Laundering and Counter-Terrorism Financing Amendment Act 2017 (Cth) (Amendment Act) became effective and introduced a number of reforms to the Anti-Money Laundering and Counter Terrorism Financing Act 2006 (Cth) (AML/CTF Act), including: expanding the Australian Transaction Reports and Analysis Centre's (AUSTRAC) power to issue infringement notices and remedial directions; refining the 'tipping-off' provisions so that reporting entities can share information with certain related bodies corporate; and regulating digital currency exchange providers. Westpac Group 2018 Full Year Financial Results Announcement | 69
2018 Full Year financial results Significant Developments Many of the changes introduced by the Amendment Act arise from a recent review of Australia's AML/CTF framework (Statutory Review), the findings of which were set out in the Report on the Statutory Review of the AML/CTF Act and Associated Rules and Regulations, which was tabled in Parliament on 29 April 2016. The Statutory Review took into account the relevant findings of the Financial Action Task Force's mutual evaluation of Australia's AML/CTF regime. The Government has published a 'Project Plan' for implementing the reforms recommended by the Statutory Review, and it is likely further reforms will be legislated in the near future. In addition to the potential for ongoing legislative change, over the past few years AUSTRAC has increasingly emphasised its role in collecting, analysing and disseminating financial intelligence data to its law enforcement partners. One way AUSTRAC has sought to do this is through greater collaboration with the financial services industry. In 2016, AUSTRAC created the Fintel Alliance, an initiative which involves AUSTRAC, various financial services entities (including Westpac) and public sector bodies collaborating with the aim of developing and sharing actionable intelligence and insights that address key AML/CTF risks. In this environment of ongoing legislative reform, regulatory change and increased industry focus, Westpac continues to engage with AUSTRAC and has been undertaking a review of its AML/CTF control environment that is designed to consider and assess our AML/CTF policies, the completeness of data feeding into our AML/CTF systems and our anti-money laundering and counter-terrorism financing processes and controls. Westpac has been regularly updating AUSTRAC on the progress of this review and has commenced implementing a number of improvements to its AML/CTF policies, systems and controls together with related remediation work in respect of certain reporting practices. These efforts have related to matters such as customer on-boarding and ongoing customer due diligence. The Group has recently self-reported to AUSTRAC a failure to report a large number of International Funds Transfer Instructions (IFTIs) (as required under Australia’s AML/CTF Act) in relation to one WIB product. These IFTIs relate to batch instructions received from 2009 until recently from a small number of correspondent banks for payments made predominantly to beneficiaries in Australia in Australian dollars. Through the product, Westpac facilitates payments on behalf of clients of certain of its correspondent banks. The majority of the payments are low value and made by Government pension funds and corporates. The Group is investigating and working with AUSTRAC to remediate the failure to report IFTIs. Further details regarding the consequences of the failure to comply with financial crime obligations are set out in the Risk Factors section of the 2018 Westpac Annual Report. Banking Executive Accountability Regime On 1 July 2018 the Banking Executive Accountability Regime (BEAR), which applies to large ADIs such as Westpac, came into effect. The Government's stated intention of BEAR is to introduce a strengthened responsibility and accountability framework for the most senior and influential directors and executives in ADI groups (referred to as 'accountable persons' under BEAR). BEAR involves a range of new measures, including: imposing a set of requirements to be met by ADIs and accountable persons, including accountability obligations; requirements for ADIs to register accountable persons with APRA prior to their commencement in an accountable person role, to maintain and provide APRA with a map of the roles and responsibilities of accountable persons across the ADI group, to give APRA accountability statements for each accountable person detailing that individual's roles and responsibilities and to report any breaches by the ADI or an accountable person of their respective accountability obligations to APRA; and new and stronger APRA enforcement powers, including disqualification powers in relation to accountable persons who breach the obligations of BEAR and a new civil penalty regime that will enable APRA to seek civil penalties in the Federal Court of up to $210 million (for large ADIs, such as Westpac) where an ADI breaches its obligations under BEAR and the breach relates to 'prudential matters'. Westpac implemented BEAR, including filing all required documents with APRA, by the required date of 1 July 2018. Australian Securities and Investments Commission (ASIC) Enforcement Review Taskforce On 19 October 2016, the Australian Government announced that the ASIC Enforcement Review Taskforce (Taskforce) would conduct a review into the suitability of ASIC's existing regulatory tools (including the penalties available) and whether they need to be strengthened. The Taskforce completed its report in December 2017 and made 50 recommendations to the Australian Government. On 20 April 2018, the Australian Government announced that it has agreed, or agreed in principle, to all 50 recommendations and will prioritise the implementation of 30 of those recommendations. The remaining 20 recommendations will be considered with the final report of the Royal Commission. 70 | Westpac Group 2018 Full Year Financial Results Announcement

2018 Full Year financial results Significant Developments The Taskforce made recommendations on, among other things: reforms to the mandatory breach reporting framework including when a reporting obligation is triggered, expanding the class of reports that must be made to include misconduct by individual advisers and employees and strengthening the penalties for failing to report, including through the introduction of an infringement notice regime; strengthening ASIC's licensing powers, which would enable ASIC to take action to refuse to grant, or to suspend or cancel, a licence where the applicant or licensee is not considered to be a fit and proper person; expanding ASIC's powers to ban individuals working in financial services businesses where they are found to be unfit, improper or incompetent; increasing fines and strengthening penalties for corporate and financial sector misconduct; providing ASIC with the power to issue directions to financial services licensees and credit licensees in relation to the conduct of their business; and enhancing ASIC’s search warrant powers to provide them with greater flexibility to use seized materials and granting ASIC access to telecommunications intercept material. Progress has been made in implementing these recommendations, including: ASIC releasing a report on 25 September 2018 on the breach reporting processes of 12 financial services groups, including Westpac; the Australian Government publicly endorsing the proposal by the ASIC Enforcement Review Taskforce to expand ASIC’s powers in respect of corporate and financial services misconduct, including the criminal and civil penalties which apply and introducing the ‘Treasury Laws Amendment (Strengthening Corporate and Financial Sector Penalties) Bill 2018’ (Cth); and the Australian Government announcing an increase in ASIC’s funding in order to introduce a close and continuous monitoring program, in which ASIC embeds staff within the institutions which it supervises. Enhanced penalties for corporate and financial sector misconduct On 24 October 2018, the Australian Government introduced into Parliament the Treasury Laws Amendment (Strengthening Corporate and Financial Sector Penalties) Bill 2018 (Cth), which proposes to strengthen penalties for corporate and financial sector misconduct consistent with the ASIC Enforcement Review Taskforce recommendations. If passed in its current form, the Bill will: update the penalties for certain criminal offences in legislation administered by ASIC, including increasing the maximum imprisonment penalties for certain criminal offences, introducing a formula to calculate financial penalties for criminal offences, and removing imprisonment as a penalty but increasing the financial penalties for all strict and absolute liability offences; introduce ordinary criminal offences that sit alongside strict and absolute liability offences; introduce the ability for courts to make relinquishment orders for civil penalty provision contraventions; modernise and expand the civil penalty regime by making a wider range of offences subject to civil penalties; harmonise and expand the infringement notice regime; introduce a new test that applies to all dishonesty offences under the Corporations Act 2001 (Cth); and ensure the courts prioritise compensating victims over ordering the payment of financial penalties. Product design and distribution obligations and product intervention power On 21 December 2017, the Australian Treasury released draft legislation that would amend the Corporations Act 2001 (Cth) and the National Consumer Credit Protection Act 2009 (Cth) in order to grant ASIC a product intervention power and introduce a new 'principles-based' product design and distribution obligation on issuers and distributors. A further exposure draft was released for consultation in July 2018. Westpac lodged a submission with the Australian Treasury on 12 February 2018 and on 16 August 2018 in response to the draft legislation and its revision respectively. On 20 September 2018, the Treasury Laws Amendment (Design and Distribution Obligations and Product Intervention Powers) Bill 2018 (Cth) was introduced into Parliament. The Bill is currently before the House of Representatives. Exposure draft regulations in relation to the Bill were released for consultation on 23 October 2018. Westpac Group 2018 Full Year Financial Results Announcement | 71

2018 Full Year financial results Significant Developments Australian Banking Association Banking Reform Program and industry initiatives On 21 April 2016, the ABA announced an action plan to protect consumer interests, increase transparency and accountability and build trust and confidence in banks. The reform program includes a number of industry-led initiatives including: a review of product sales commissions and product based payments; the establishment of an independent customer advocate in each bank; supporting the broadening of external dispute resolution schemes; evaluating the establishment of an industry-wide, mandatory, last resort compensation scheme; strengthening protections available to whistleblowers; the implementation of a new information sharing protocol to help stop individuals with a history of poor conduct moving around the industry; strengthening the commitment to customers in the Banking Code of Practice; and supporting ASIC as a strong regulator. On 17 April 2018, the independent governance expert overseeing the ABA action plan, Mr Ian McPhee, released his eighth and final report titled, Australian banking industry: Package of initiatives, which noted that banks have made good progress in delivering the initiatives, with most initiatives now implemented. Reporting by the banks to Ian McPhee about their implementation of key industry initiatives has now concluded. The ABA has committed to member banks providing further bi-annual external reporting on their implementation progress. On 31 July 2018, ASIC approved the Banking Code of Practice with an implementation date of 1 July 2019. The new code replaces the previous version, the Code of Banking Practice 2013. Westpac has fully implemented the recommendations from the Retail Banking Remuneration review chaired by Mr Stephen Sedgwick on 1 October 2018 for our employees, two years ahead of schedule. Changes to wealth business On 20 June 2018, BT Financial Advice announced that its customers operating through the Westpac, St.George, Bank of Melbourne and BankSA networks will benefit from the removal of grandfathered payments attributable to their BT products. The change to remove the majority of grandfathered payments occurred on 1 October 2018 with the removal of certain more complex grandfathered payments to follow shortly. The introduction of the Future of Financial Advice (FoFA) reforms in 2013 included a prospective ban on conflicted remuneration. Generally, arrangements in place prior to the commencement of FoFA were grandfathered, permitting the continuation of grandfathered payments, such as commissions, under those arrangements. On 23 July 2018, BT Financial Group announced three new initiatives: significant pricing changes to its flagship platform, BT Panorama, so that the pricing structure is significantly lower, simpler and no longer based on scale; the launch of a ‘compact’ BT Panorama offer for simpler investment; and an online adviser services hub, BT Open Services. Open banking regime On 9 February 2018, the final report of the Review into Open Banking in Australia was released. The report makes 50 recommendations in total, including recommendations on: the regulatory framework to support open banking; what data should be shared and with whom; what safeguards are needed to inspire confidence in data sharing; how data should be transferred; and how open banking should be rolled out. On 9 May 2018 the Government announced that it agreed with the recommendations of the report, and that it would phase in open banking in stages with all major banks (including Westpac) required to make data available on credit and debit cards, together with deposit and transaction accounts by 1 July 2019 and on mortgages by 1 February 2020. Data on all products recommended by the report will be required to be made available by 1 July 2020. All remaining banks will be required to implement open banking with a 12-month delay on the timelines set for the major banks. The ACCC will be empowered to adjust timeframes if necessary. 72 | Westpac Group 2018 Full Year Financial Results Announcement
2018 Full Year financial results Significant Developments On 15 August 2018, the Australian Treasury released draft legislation that would amend the Competition and Consumer Act 2010 (Cth), the Privacy Act 1988 (Cth) and the Australian Information Commissioner Act 2010 (Cth) to introduce a consumer data right which will apply to particular sectors designated by the Treasurer, in response to which Westpac lodged a submission. A further draft of the legislation (including a draft designation) was released by the Australian Treasury on 24 September 2018. The banking sector is the first sector to which the right will apply. A Consumer Data Right Rules Framework was also released by the ACCC in September 2018 and Westpac lodged a submission on the Framework on 12 October 2018. Harper Competition Reforms In November 2017, the Competition and Consumer Amendment (Competition Policy Review) Act 2017 (Cth) and the inter-related Competition and Consumer Amendment (Misuse of Market Power) Act 2017 (Cth) came into effect, making significant changes to the Competition and Consumer Act 2010 (Cth) following recommendations by the Competition Policy Review which was chaired by Professor Ian Harper. These reforms included: broadening the scope of the existing prohibition on misuse of market power. Corporations with substantial market power are prohibited from engaging in any conduct with the purpose or likely effect of substantially lessening competition in a market in which the corporation (or its related bodies corporate) supplies or acquires goods or services; a new prohibition on engaging in a 'concerted practice' that has the purpose, effect or likely effect of substantially lessening competition; in light of the new concerted practices prohibition, the repeal of the bank-specific prohibition on price signalling; providing the ACCC with a 'class exemption' power which enables it to determine that various provisions in the Competition and Consumer Act 2010 (Cth) do not apply to certain types of conduct; removing the per se prohibition on third line forcing or ‘third party bundling’ of goods and services unless the conduct is notified to the ACCC. Instead this practice will be subject to a test of whether the bundling is likely to have the purpose, effect or likely effect of substantially lessening competition; and streamlining the existing procedure to review proposed mergers. Comprehensive Credit Reporting (CCR) On 28 March 2018, the National Consumer Credit Protection Amendment (Mandatory Comprehensive Credit Reporting) Bill 2018 (Cth) was introduced into Parliament. Whilst the bill remains in the Senate, if passed in its current form, the bill will mandate the provision of CCR data to credit reporting bodies. Westpac is committed to the use of CCR to support our principles of responsible lending, and as such we voluntarily supplied 55% of our consumer credit accounts on 17 September 2018. Westpac will supply the residual 45% of consumer credit accounts by 17 September 2019. To support our implementation, Westpac is now a signatory of the Principles of Reciprocity and Data Exchange, which provides governance and most importantly key consumer data protection protocols within the CCR data sharing environment. Financial benchmarks reform The Treasury Laws Amendment (2017 Measures No.5) Act 2018 (Cth) commenced on 12 April 2018 which strengthens the regulation of financial benchmarks. The measures include: ASIC being empowered to develop enforceable rules for administrators and entities that make submissions to significant benchmarks (such as Westpac), including the power to compel submissions to benchmarks in the case that other calculation mechanisms fail; administrators of significant benchmarks being required to hold a new 'benchmark administrator' licence issued by ASIC (unless granted an exemption); and the manipulation of any financial benchmark or financial product used to determine a financial benchmark (such as negotiable certificates of deposit) being made a specific criminal offence and subject to civil penalties. Issue of Westpac Capital Notes 5 On 13 March 2018, Westpac issued $1.69 billion of securities known as Westpac Capital Notes 5, which qualify as Additional Tier 1 capital under APRA's capital adequacy framework. Westpac Group 2018 Full Year Financial Results Announcement | 73

2018 Full Year financial results Significant Developments Transfer and conversion of Westpac convertible preference shares (CPS) On 13 March 2018, $623 million of CPS were transferred to the Westpac CPS nominated party for $100 each pursuant to the Westpac Capital Notes 5 reinvestment offer. Those CPS were subsequently bought back and cancelled by Westpac. On 3 April 2018, the remaining $566 million of CPS were transferred to the Westpac CPS nominated party for $100 each. Following the transfer, those remaining CPS were converted into 19,189,765 ordinary shares. ASIC's responsible lending litigation against Westpac On 1 March 2017, ASIC commenced Federal Court proceedings against Westpac in relation to home loans entered into between December 2011 and March 2015, which were automatically approved by Westpac's systems as part of broader processes. On 4 September 2018 Westpac and ASIC agreed to settle the proceedings on the basis of a proposed $35 million penalty and declarations that Westpac contravened the National Consumer Credit Protection Act 2009 (Cth) (NCCPA). The proposed settlement is subject to Court approval, and involves Westpac accepting that during the relevant period (December 2011 – March 2015), the way that Westpac used the Household Expenditure Measure (HEM) benchmark to assess home loans, and the way that Westpac assessed certain interest only loans breached the NCCPA. This meant that during the relevant period, approximately 10,500 home loans should have been referred to manual assessment by a credit officer. A hearing on the proposed settlement was held on 24 October 2018 and judgment has been reserved. Outbound scaled advice division proceedings On 22 December 2016, ASIC commenced Federal Court proceedings against BT Funds Management Limited (BTFM) and Westpac Securities Administration Limited in relation to a number of superannuation account consolidation campaigns conducted between 2013 and 2016. ASIC has alleged that in the course of some of these campaigns, customers were provided with personal advice in contravention of a number of Corporations Act 2001 (Cth) provisions. ASIC has selected 15 specific customers as the focus of their claim. The proceedings were heard in February 2018. Judgment is pending. ASIC’s proceedings against Westpac for poor financial advice by a financial planner On 14 June 2018, ASIC commenced proceedings in the Federal Court against Westpac in relation to alleged poor financial advice provided by a former financial planner, Mr Sudhir Sinha. Mr Sinha was dismissed by Westpac in November 2014 and subsequently banned by ASIC. Westpac has proactively initiated remediation to identify and compensate affected customers and has completed remediation activities. ASIC’s proceedings relate to advice provided by Mr Sinha in respect of four specific customer files. Westpac has filed a response to ASIC’s allegations. Class action against Westpac Banking Corporation and Westpac Life Insurance Services Limited On 12 October 2017 a class action was filed in the Federal Court of Australia on behalf of customers who, since October 2011, obtained insurance issued by Westpac Life Insurance Services Limited (WLIS) on the recommendation of financial advisers employed within the Westpac Group. The plaintiffs have alleged that aspects of the financial advice provided by those advisers breached fiduciary and statutory duties owed to the advisers' clients, including the duty to act in the best interests of the client, and that WLIS was knowingly involved in those alleged breaches. Westpac and WLIS are defending the proceedings. These proceedings are currently stayed by order of the Court, pending the outcome of an appeal concerning a procedural issue unrelated to the substantive claims made in the class action. BBSW proceedings Following ASIC's investigations into the interbank short-term money market and its impact on the setting of the bank bill swap reference rate (BBSW), on 5 April 2016, ASIC commenced civil proceedings against Westpac in the Federal Court of Australia, alleging certain misconduct, including market manipulation and unconscionable conduct. The conduct that was the subject of the proceedings was alleged to have occurred between 6 April 2010 and 6 June 2012. ASIC sought declarations from the court that Westpac breached various provisions of the Corporations Act 2001 (Cth) and the Australian Securities and Investments Commission Act 2001 (Cth), pecuniary penalties of unspecified amounts and orders requiring Westpac to implement a comprehensive compliance program for persons involved in Westpac's trading in the relevant market. The proceedings were heard in late 2017. On 24 May 2018, Justice Beach found that Westpac had not engaged in market manipulation or misleading or deceptive conduct under the Corporations Act 2001 (Cth). His Honour also found that there was no ‘trading practice’ of manipulating the BBSW rate. However, the Court found that Westpac engaged in unconscionable conduct on 4 occasions and that Westpac breached its supervisory duty. Costs and penalties will be determined in the coming months. In August 2016, a class action was filed in the United States District Court for the Southern District of New York against Westpac and a large number of other Australian and international banks alleging misconduct in relation to BBSW. These proceedings are at an early stage and the level of damages sought has not been specified. Westpac is defending these proceedings. 74 | Westpac Group 2018 Full Year Financial Results Announcement
2018 Full Year financial results Significant Developments Bank Levy for Authorised Deposit-taking Institutions (ADIs) On 23 June 2017, legislation was enacted that introduced a new levy on ADIs with liabilities of at least $100 billion (Bank Levy). The Bank Levy became effective from 1 July 2017 and the rate is set at 0.06% per annum of certain ADI liabilities. There is no end date provided for the Bank Levy. In the first 12 months following the introduction of the Bank Levy, Westpac paid $376 million to the Australian Government. Taxation of cross-border financing arrangements The Australian and New Zealand Governments have each decided to implement the Organisation for Economic Co-operation and Development's (OECD) proposals relating to the taxation treatment of cross-border financing arrangements. These proposals affect the taxation arrangements for certain 'hybrid' regulatory capital instruments issued by Westpac. The Australian provisions were enacted on 24 August 2018 and provide for limited grandfathering of certain previously issued Additional Tier 1 capital securities. The New Zealand provisions were enacted on 27 June 2018 and similarly provide for limited grandfathering of certain previously issued Tier 2 capital securities. APRA's proposed changes to capital standards The final report of the FSI in 2014 recommended that APRA set capital standards such that the capital ratios of Australian ADIs are "unquestionably strong". On 19 July 2017, APRA released an Information Paper titled 'Strengthening Banking System Resilience - Establishing Unquestionably Strong Capital Ratios'. In its release, APRA concluded that the four major Australian banks, including Westpac, need to have a CET1 ratio of at least 10.5%, as measured under the existing capital framework to be considered "unquestionably strong." Banks are expected to meet this new benchmark by 1 January 2020. APRA has announced that it expects to consult on draft prudential standards giving effect to the new framework in 2018, leading to the determination of final prudential standards in 2019. The new framework is anticipated to take effect in early 2021. During 2018, APRA commenced consultation and issued the following discussion papers: 'Revision to the Capital Framework for Authorised Deposit-Taking Institutions'. The paper included proposed revisions to the capital framework which incorporates the finalisation of the Basel Committee on Banking Supervision (BCBS) Basel III reforms in December 2017, as well as other changes to better align the framework to risks, including in relation to home lending. In relation to proposed traded market risk reforms published by the BCBS (also referred to as “Fundamental Review of the Trading Book”), APRA have advised that it will defer its decision on the scope and timing of any domestic implementation of the market risk framework until after it has been finalised by the BCBS. 'Leverage Ratio Requirements for Authorised Deposit-Taking Institutions'. This discussion paper proposes to impose a minimum leverage ratio requirement of 4% for ADIs that use the internal ratings-based approach to determine capital adequacy from 1 July 2019. Australian banks are currently required to report leverage ratios under the existing requirements as part of Pillar 3 disclosures. ‘Improving the transparency, comparability and flexibility of the ADI capital framework’. The discussion paper outlines options APRA is considering for the presentation of capital ratios, minimum capital requirements and capital instrument triggers. This could result in changes to capital ratios and minimum capital requirements and the Capital Trigger Event level of 5.125% could stay the same or increase. The dollar amount of CET1 surplus above the Capital Trigger Event level of 5.125% will depend on the final option implemented by APRA. As the proposals are at an early consultation stage it is too soon to determine final impacts. APRA has announced that its revisions to the capital framework are not intended to necessitate further capital increases for the industry above the 10.5% benchmark. However, given the proposals include higher risk weights for certain mortgage products, such as interest only loans and loans for investment purposes, the impact on individual banks may vary. Given that the proposals are at the early consultation stage and final details remain unclear, it is too soon to determine the impact on Westpac. Further details of Westpac’s other regulatory disclosures required in accordance with prudential standard APS 330 can be accessed at https://www.westpac.com.au/about-westpac/investor-centre/financial-information/regulatory-disclosures/. Resolution planning including additional loss absorbing capacity and APRA's crisis management powers In response to the FSI recommendations, the Australian Government also agreed to further reforms regarding crisis management and to establish a framework for minimum loss-absorbing and recapitalisation capacity. Westpac Group 2018 Full Year Financial Results Announcement | 75

2018 Full Year financial results Significant Developments On 5 March 2018, legislation came into effect which strengthens APRA's crisis management powers. The intention of these reforms is to strengthen APRA's powers to facilitate the orderly resolution of an institution so as to protect the interests of depositors and to protect the stability of the financial system. The reforms also enhance APRA's ability to take actions in relation to resolution planning, including measures to ensure regulated entities and their groups are better prepared for resolution. APRA expects to commence consultation on a framework for minimum loss-absorbing and recapitalisation capacity later in 2018. The intention of this would be to facilitate the orderly resolution of banks and minimise taxpayer support. Macro-prudential regulation From December 2014, APRA began using macro-prudential measures targeting mortgage lending. This included limiting investment property lending growth to below 10%, imposing additional levels of conservatism in serviceability assessments, and restricting mortgage lending with interest only terms to 30% of new mortgage lending. APRA also indicated that it expects ADIs to place strict internal limits on the volume of interest only loans with loan-to-valuation ratios (LVR) above 80%. Westpac has implemented steps to achieve these limits, including introducing differential pricing for investor property loans and interest only loans, a restriction on the volume of interest only loans with an LVR of greater than 80% (includes limit increases, interest only term extension and switches), no repayment switch fee for customers switching to principal and interest from interest only loans and no longer accepting external refinances (from other financial institutions) for owner occupied interest only loans. Interest only residential mortgages constituted 22.6% of new mortgage lending for the quarter ended 30 September 2018 (currently 34.7% of Westpac's overall Australian residential mortgage portfolio as at 30 September 2018). On 26 April 2018, APRA announced its intention to remove the existing 10% limit on investment property lending growth and replace it with more permanent measures to strengthen lending standards. In order to no longer be subject to this limit from 1 July 2018, ADIs will be required to demonstrate to APRA that they have been operating below the 10% limit for at least the past 6 months. In addition, an ADI’s Board will be required to provide an assurance to APRA in relation to its lending policies and practices. Westpac is currently subject to the 10% limit. Net Stable Funding Ratio In December 2016, APRA released an updated prudential standard on liquidity (APS 210) which took effect from 1 January 2018. The revised APS 210 includes the Net Stable Funding Ratio (NSFR) requirement; a measure designed to encourage longer-term funding of assets and better match the duration of assets and liabilities. Westpac's NSFR as at 30 September 2018 was 114%, above the NSFR requirement of 100%. Committed Liquidity Facility - annual application The Reserve Bank of Australia makes available to ADIs a Committed Liquidity Facility (CLF) that, subject to qualifying conditions, can be accessed to meet LCR requirements under APS210 Liquidity. Westpac's CLF allocation has been decreased from $57.0 billion in 2018 to $54.0 billion for 2019. Transition to AASB 9 AASB 9 Financial Instruments (AASB 9) will replace AASB 139 Financial Instruments: Recognition and Measurement from 1 October 2018. AASB 9 includes a forward looking 'expected credit loss' impairment model, revised classification and measurement model and modifies the approach to hedge accounting. The adoption of AASB 9 is expected to reduce retained earnings at 1 October 2018 by approximately $709 million (net of tax) primarily due to the increase in impairment provisions under the new standard. The Group continues to assess and refine certain aspects of our impairment provisioning process. There is no significant impact to our regulatory capital. Further details of the changes under the new standard are included in Note 1 to the financial statements. Transition to AASB 15 AASB 15 Revenue from Contracts with Customers (AASB 15) will replace AASB 118 Revenue and related Interpretations from 1 October 2018. AASB 15 provides a systematic approach to revenue recognition by introducing a five-step model governing revenue measurement and recognition. The application of AASB 15 will not have a material impact on the Group’s net profit or retained earnings. Further details of the changes under the new standard are included in Note 1 to the financial statements. 76 | Westpac Group 2018 Full Year Financial Results Announcement

2018 Full Year financial results Significant Developments APRA Prudential Standard APS 222: Associations with Related Entities On 2 July 2018, APRA released a Discussion Paper and consultation draft in relation to prudential standard APS 222: Associations with Related Entities. The Discussion Paper proposes changes to the requirements for ADIs in managing their risks from associations with related parties. The proposals include changes to the definition and measurement of exposures to related entities, prudential limits and broadening the definition of related entities to include substantial shareholders, individual board directors and other related individuals. The proposals are at consultation stage and final details remain unclear. It is expected that once finalised, the framework will be implemented from 1 January 2020. APRA Prudential Standard CPS 234: Information Security Management On 7 March 2018, APRA released a consultation draft of a new cross-industry prudential standard CPS 234: Information Security Management. APRA announced that the proposed standard is aimed at improving the ability of APRA-regulated entities to detect cyber adversaries and respond swiftly and effectively in the event of a breach. The proposed prudential standard would require APRA-regulated entities to (amongst other things): define the information security related roles and responsibilities of the board, senior management and governing bodies; maintain an information security capability that is commensurate with the size and extent of threats the entity faces; implement information security controls to protect information assets; undertake regular testing and assurance on the effectiveness of those information security controls; have mechanisms to detect and respond to information security incidents in a timely manner; and notify APRA of material information security incidents. APRA announced that it intends to finalise the proposed prudential standard towards the end of 2018, with a view to implementing from 1 July 2019. Westpac continues to enhance its systems and processes to further mitigate cybersecurity risks. Brexit On 29 March 2017, the Prime Minister of the United Kingdom (UK) notified the European Council in accordance with Article 50 of the Treaty on European Union of the UK's intention to withdraw from the European Union (EU), triggering a two year period for the negotiation of the UK's withdrawal from the EU. As Westpac's business and operations are based predominantly in Australia and New Zealand, the direct impact of the UK's departure from the EU is unlikely to be material to Westpac. However, it remains difficult to predict the impact that Brexit may have on financial markets, the global economy and the global financial services industry. Westpac has contingency planning in place and is continuing to monitor the implications of Brexit. London Interbank Offered Rate In July 2017, the Financial Conduct Authority, which regulates the London Interbank Offered Rate (LIBOR), announced that it would not require panel banks to continue to submit rates for the calculation of the LIBOR benchmark after 2021. Accordingly, the continuation of LIBOR in its current form will not be guaranteed after 2021, and it is likely that LIBOR will be discontinued or modified by 2021. It is currently uncertain what developments or future changes will occur in the administration of LIBOR or any other benchmarks. Any such developments or changes could impact the return on, value of and market for, securities and other instruments whose returns are linked to any such benchmarks, including those securities or other instruments issued by the Group. European Union General Data Protection Regulation The European Union (EU) General Data Protection Regulation (GDPR) contains new data protection requirements that came into effect from 25 May 2018. The GDPR is intended to 'strengthen and unify' data protection for individuals across the EU and supersedes the existing EU Data Protection Directive. Australian businesses of any size may need to comply if they have an establishment in the EU, if they offer goods or services in the EU, or if they monitor the behaviour of individuals in the EU. Westpac implemented a number of changes and updates to policies and systems prior to the commencement of the GDPR, and those changes to policies and systems are continuing. Westpac Group 2018 Full Year Financial Results Announcement | 77
2018 Full Year financial results Significant Developments OTC derivatives reform International regulatory reforms relating to over-the-counter (OTC) derivatives continue to be implemented across the globe, with a current focus on initial margin and risk mitigation practices for non-centrally cleared derivatives. Australian standards for risk mitigation practices relating to trading relationship documentation, trade confirmations, portfolio reconciliation and compression and valuation and dispute resolution processes came into force in March 2018 and have now been implemented. Global initial margin requirements commenced on 1 September 2016. These requirements are being introduced in phases until 1 September 2020 and work is underway within Westpac to comply with these regulations. New Zealand Regulatory reforms and significant developments in New Zealand include: RBNZ - Revised Outsourcing Policy On 19 September 2017, the RBNZ advised Westpac New Zealand Limited (WNZL) of changes to its conditions of registration that will give effect to the RBNZ's revised Outsourcing Policy (BS11) (Revised Outsourcing Policy). Both the changes to the conditions of registration and the Revised Outsourcing Policy came into effect on 1 October 2017. The Revised Outsourcing Policy sets out requirements that banks need to meet when outsourcing particular functions and services, especially if the service provider is a related party of the bank. WNZL will have two years before it must fully comply with the requirement to maintain a compendium of outsourcing arrangements and five years to fully comply with other aspects of the Revised Outsourcing Policy. RBNZ Capital Review The RBNZ is undertaking a Bank Capital Adequacy Framework review on the makeup of bank capital. The RBNZ has now made “in principle” decisions on the risk weighted assets framework, including the introduction of dual reporting, a standardised methodology for operational risk, and capital floors to internal rating models. These changes will be reflected in the revised framework which is scheduled to be released in Q4 2019. The RBNZ will progress the in principle decisions over 2018 and 2019, informed by a quantitative impact study and feedback on the minimum capital settings during Q4 2018. Reform of the regulation of financial advice In July 2016, the New Zealand Government announced plans for changes to the regime regulating financial advice. The new regime is set out in the Financial Services Legislation Amendment Bill (FSLAB), which had its second reading in Parliament in September 2018. Under FSLAB, financial advice will be provided by licensed firms who will employ financial advisers and nominated representatives. A Code of Conduct will apply to all advice and advisers and representatives will be subject to the same duties and ethical standards. Firms will be responsible for ensuring that their advisers and representatives comply with these duties. The reforms will also remove legislative barriers to the provision of robo-advice. A two stage transition is proposed. At this stage, the Code of Conduct is expected to be approved in Q2 2019. There will be a 9-month period from the Code’s approval to initial implementation of the new regime, after which a 2-year safe harbour for competency requirements will apply. RBNZ - Review under section 95 of the Reserve Bank of New Zealand Act 1989 On 10 February 2017, the RBNZ issued WNZL with a notice under section 95 of the Reserve Bank of New Zealand Act 1989, requiring WNZL to obtain an independent review of its compliance with advanced internal rating-based aspects of the RBNZ's 'Capital Adequacy Framework (Internal Models Based Approach)' (BS2B). WNZL has disclosed non-compliance with BS2B (compliance with which is a condition of registration for WNZL) in its quarterly disclosure statements. On 15 November 2017, the RBNZ advised WNZL of changes to its conditions of registration resulting from the review. The changes to WNZL's conditions of registration came into effect on 31 December 2017 and increase the minimum Total Capital ratio, Tier 1 Capital ratio and Common Equity Tier 1 Capital ratio of WNZL and its controlled entities by 2%. WNZL has also undertaken to the RBNZ to maintain the Total Capital ratio of WNZL and its controlled entities above 15.1%. WNZL and its controlled entities retain an appropriate amount of capital to comply with the increased minimum ratios. The RBNZ requires WNZL to sufficiently address non-compliance issues by 30 June 2019. A remediation plan has been provided to the RBNZ. WNZL is providing regular updates on the scope of its remediation activity to the RBNZ to ensure compliance by 30 June 2019. 78 | Westpac Group 2018 Full Year Financial Results Announcement
2018 Full Year financial results Significant Developments Review of the Reserve Bank of New Zealand Act In November 2017, the New Zealand Government announced it will undertake a review of the Reserve Bank of New Zealand Act 1989 (Act) (RBNZ Review). The RBNZ Review aims to ensure the RBNZ's monetary and financial policy framework still provides the most efficient and effective model for New Zealand. The RBNZ Review will consist of two phases. Phase 1 focuses on whether the RBNZ's decision-making process for monetary policy is robust, and draft legislation for the proposed Phase 1 related changes to the Act has been published. The terms of reference for Phase 2 were released in June 2018 and will consider broader issues, including the macro-prudential framework, the current prudential supervision model and trans-Tasman coordination. The first consultation on Phase 2 was issued on 1 November 2018. Residential Mortgage Bond Collateral Standard Review When the RBNZ lends to banks and other counterparties it does so against 'eligible collateral' (mortgage bonds). In New Zealand, mortgage bonds are not generally traded. On 17 December 2017, the RBNZ published an issues paper proposing an enhanced mortgage bond standard aimed at supporting confidence and liquidity in the financial system, and a more standardised and transparent framework for mortgage bonds, which would improve their quality and make them more marketable and a new format for mortgage bonds. The RBNZ is engaging with industry to develop this new mortgage bond standard. RBNZ/FMA – Financial Services Conduct & Culture Review In May 2018, the RBNZ and FMA commenced a review in respect of New Zealand’s 10 major banks & 15 life insurers, including WNZL and Westpac Life-NZ-Limited, to explain why conduct issues highlighted by the Australian Royal Commission are not present in New Zealand. WNZL and Westpac Life have provided the regulators with information in relation to this review. An industry thematic review report for the banks is expected to be released in November 2018 and for the life insurers in December 2018. Westpac Group 2018 Full Year Financial Results Announcement | 79

2018 Full Year financial results Consolidated financial statements 4.2 Consolidated income statement Westpac Banking Corporation and its controlled entities (15,716) 2 6,286 (10) 21,802 (9,434) (853) 2 3 (17) (3,518) 3 (7) (43) 7,990 1 238.0 229.3 - - The above consolidated income statement should be read in conjunction with the accompanying notes. 80 | Westpac Group 2018 Full Year Financial Results Announcement $mNote % Mov't Half Year Sept 18 - March 18 Mar 18 % Mov't Full Year Sept 18 - Sept 17Sept 17 Half Year Full Year Sept 18 Sept 18 Interest income3 16,481 16,0902 32,571 31,2324 Interest expense3 (8,254) (7,812)6 (16,066) Net interest income 8,227 8,278(1) 16,505 15,5166 Non-interest income4 2,753 2,875(4) 5,628 Net operating income before operating expenses and impairment charges 10,980 11,153(2) 22,133 Operating expenses5 (4,967) (4,725)5 (9,692) Impairment charges10 (317) (393)(19) (710) Profit before income tax 5,696 6,035(6) 11,731 11,5152 Income tax expense6 (1,797) (1,835)(2) (3,632) Net profit for the period 3,899 4,200(7) 8,099 7,9971 Net profit attributable to non-controlling interests (2) (2)-(4) Net profit attributable to owners of Westpac Banking Corporation 3,897 4,198(7) 8,095 Earnings per share (cents) Basic7 113.8 123.7(8) 237.5 Diluted7 110.0 119.7(8) 230.1
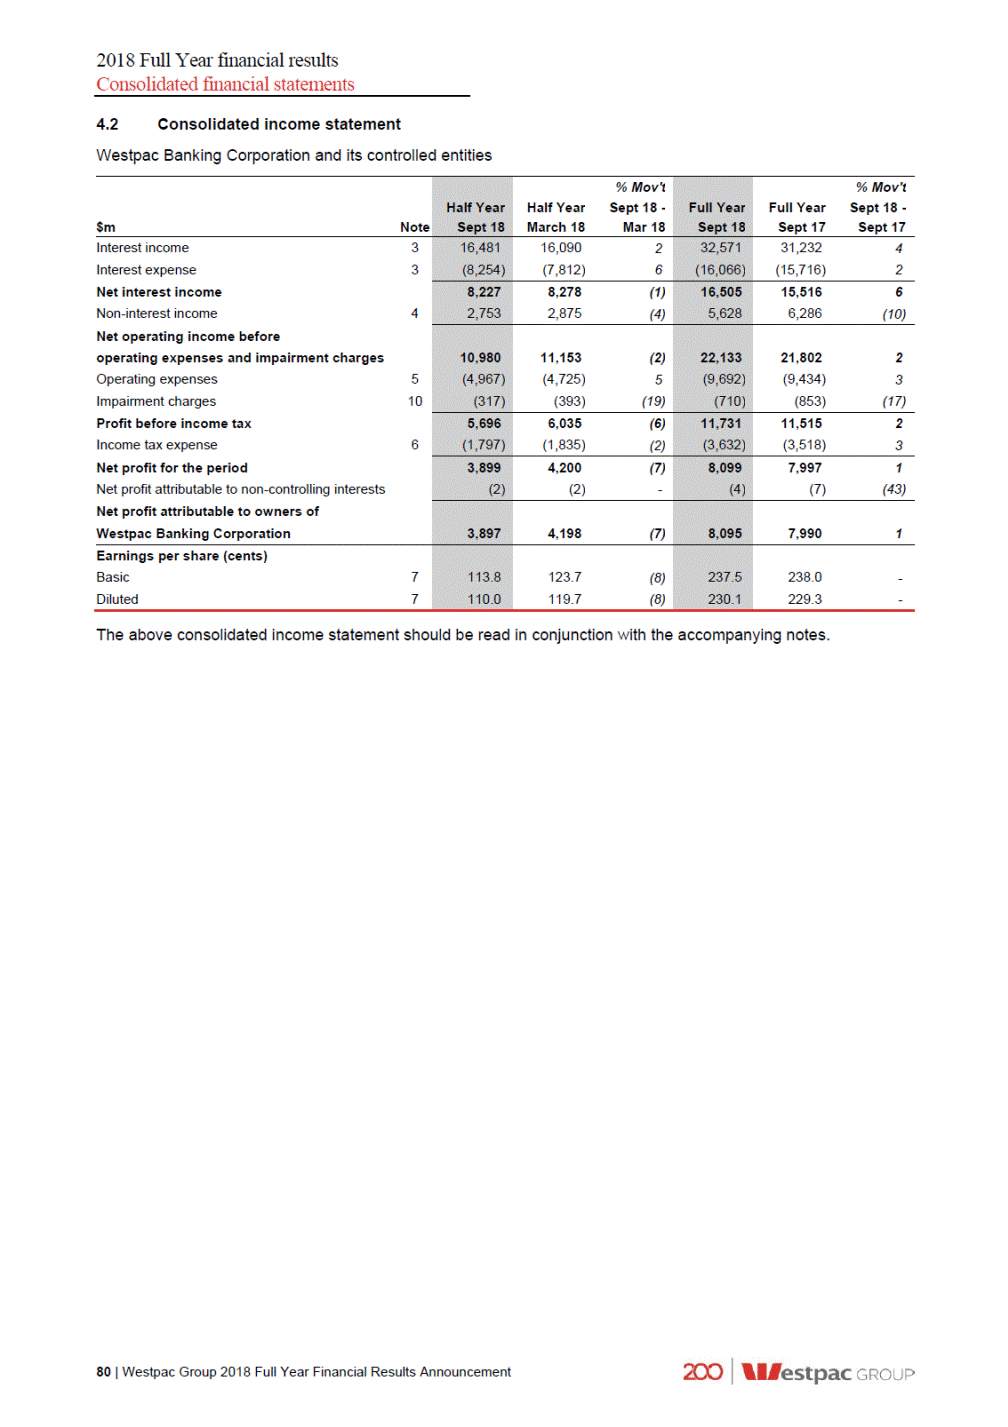
2018 Full Year financial results Consolidated financial statements 4.3 Consolidated statement of comprehensive income Westpac Banking Corporation and its controlled entities 75 (3) large large (91) 115 77 77 (116) - large - (18) (6) large 117 3 9 (100) (100) (164) large 190 (76) (6) large 7,984 7 5 (43) The above consolidated statement of comprehensive accompanying notes. income should be read in conjunction with the 1 Half year March 2018 restated. Westpac Group 2018 Full Year Financial Results Announcement | 81 $m % Mov't Half Year Sept 18 - March 18 Mar 18 % Mov't Full YearSept 18 - Sept 17Sept 17 Half Year Full Year Sept 18 Sept 18 Net profit for the period 3,899 4,200(7) 8,099 7,9971 Other comprehensive income Items that may be reclassified subsequently to profit or loss Gains/(losses) on available-for-sale securities: Recognised in equity (69) (33)109 (102) Transferred to income statements 75 (9)large 66 Gains/(losses) on cash flow hedging instruments: Recognised in equity (96) (65)48 (161) Transferred to income statements 109 9416 203 Movement in foreign currency translation reserve: Exchange differences on translation of foreign operations1 143 38large 181 Transferred to income statements1 - (3)(100) (3) Income tax on items taken to or transferred from equity: Available-for-sale securities reserve (4) 13large 9 Cash flow hedge reserve (4) (9)(56) (13) Share of associates' other comprehensive income: Recognised in equity (net of tax) - --- Transferred to income statements - --- Items that will not be reclassified subsequently to profit or loss Own credit adjustment on financial liabilities designated at fair value (net of tax) 19 24(21) 43 Remeasurement of defined benefit obligation recognised in equity (net of tax) 58 (13)large 45 Other comprehensive income for the period (net of tax) 231 37large 268 Total comprehensive income for the period 4,130 4,237(3) 8,367 7,9915 Attributable to: Owners of Westpac Banking Corporation 4,128 4,235(3) 8,363 Non-controlling interests 2 2-4 Total comprehensive income for the period 4,130 4,237(3) 8,367 7,9915

2018 Full Year financial results Consolidated financial statements Consolidated balance sheet1 4.4 Westpac Banking Corporation and its controlled entities 21,580 3,977 18,397 7,128 22 46 44 (19) 20,627 26,904 64,857 701,393 10,481 1,318 80 1,328 1,120 11,693 6,497 25,324 24,033 60,710 684,919 10,643 1,048 60 1,487 1,112 11,652 5,362 7 (10) (6) 1 (10) 3 44 - 5 1 (21) (13) - 1 4 (11) 29 92 (11) 6 1 (4) 19,073 547,736 21,907 533,591 (5) 2 (17) 5 5,590 24,066 174,138 299 8,763 1,416 17 9,759 4,056 25,375 168,356 308 9,019 1,639 10 8,606 (23) 1 (1) (1) (13) 36 6 (6) 6 (4) 3 (4) (16) 18 80 7 35,168 (565) 890 27,122 34,889 (495) 794 26,100 3 (13) 21 3 3 - 36 7 62,615 61,288 3 5 62,665 61,342 3 5 The above consolidated balance sheet should be read in conjunction with the accompanying notes. 1 For further detail refer to Note 35 of the financial statements contained within the 2018 Westpac Group Annual Report. 2 Comparatives have been revised to reclassify conduct related provisions (refer to Notes 28 and 29 of the financial statements contained within the 2018 Westpac Group Annual Report). 82 | Westpac Group 2018 Full Year Financial Results Announcement $mNote As at As atAs at% Mov't% Mov't 31 March30 SeptSept 18 -Sept 18 - 20182017Mar 18Sept 17 30 Sept 2018 Assets Cash and balances with central banks Receivables due from other financial institutions Trading securities and financial assets designated at fair value Derivative financial instruments Available-for-sale securities Loans9 Life insurance assets Regulatory deposits with central banks overseas Investments in associates1 Property and equipment Deferred tax assets Intangible assets Other assets 26,431 5,790 22,134 24,101 61,119 709,690 9,450 1,355 115 1,329 1,180 11,763 5,135 Total assets 879,592 871,855851,87513 Liabilities Payables due to other financial institutions Deposits and other borrowings12 Other financial liabilities at fair value through income statement Derivative financial instruments Debt issues Current tax liabilities Life insurance liabilities Provisions2 Deferred tax liabilities Other liabilities2 18,137 559,285 4,297 24,407 172,596 296 7,597 1,928 18 9,193 Total liabilities excluding loan capital 797,754 790,857772,86713 Loan capital 17,265 18,33317,666(6)(2) Total liabilities 815,019 809,190790,53313 Net assets 64,573 62,66561,34235 Shareholders’ equity Share capital: Ordinary share capital15 Treasury shares and RSP treasury shares15 Reserves15 Retained profits 36,054 (493) 1,077 27,883 Total equity attributable to owners of Westpac Banking Corporation 64,521 Non-controlling interests 52 50544(4) Total shareholders' equity and non-controlling interests 64,573

2018 Full Year financial results Consolidated financial statements 4.5 Consolidated statement of changes in equity Westpac Banking Corporation and its controlled entities The above consolidated statement of changes in equity should be read in conjunction with the accompanying notes. 1 2018 comprises 2018 interim dividend 94 cents per share ($3,213 million) and 2017 final dividend 94 cents per share ($3,187 million) (2017: 2017 interim dividend 94 cents per share ($3,150 million) and 2016 final dividend 94 cents per share ($3,141 million)), all fully franked at 30%. Westpac Group 2018 Full Year Financial Results Announcement | 83 Total equity attributable to owners Shareof WestpacNon-CapitalRetainedBanking controlling $m(Note 15) Reservesprofits Corporationinterests Total shareholders' equity and non-controlling interests Balance at 1 October 2016 Net profit for the year Net other comprehensive income for the year Total comprehensive income for the year Transactions in capacity as equity holders Dividends on ordinary shares1 Dividend reinvestment plan Other equity movements Share-based payment arrangements Exercise of employee share options and rights Purchase of shares (net of issue costs) Net (acquisition)/disposal of treasury shares Other Total contributions and distributions Balance at 30 September 2017 33,01472724,37958,12061 58,181 --7,9907,9907 -(32)26(6)-7,997 (6) -(32)8,0167,9847 7,991 --(6,291)(6,291)-1,452--1,452--98-98-11 - - 11 - (43) - - (43) - (40) - - (40) - -1(4)(3)(14) (6,291) 1,452 98 11 (43) (40) (17) 1,38099(6,295)(4,816)(14) (4,830) 34,39479426,10061,28854 61,342 Net profit for the year Net other comprehensive income for the year Total comprehensive income for the year Transactions in capacity as equity holders Dividends on ordinary shares1 Dividend reinvestment plan Conversion of Convertible Preference Shares Other equity movements Share-based payment arrangements Exercise of employee share options and rights Purchase of shares (net of issue costs) Net (acquisition)/disposal of treasury shares Other Total contributions and distributions Balance at 30 September 2018 --8,0958,0954 -18088268-8,099 268 -1808,1838,3634 8,367 --(6,400)(6,400)-631--631-566--566--103-103-3--3-(35)--(35)-2--2-----(6) (6,400) 631 566 103 3 (35) 2 (6) 1,167103(6,400)(5,130)(6) (5,136) 35,5611,07727,88364,52152 64,573

2018 Full Year financial results Consolidated financial statements 4.5 Consolidated statement of changes in equity (continued) Westpac Banking Corporation and its controlled entities The above consolidated statement of changes in equity should be read in conjunction with the accompanying notes. 1 Second Half 2018 reflects the 2018 interim dividend 94 cents per share ($3,213 million) and First Half 2018 reflects the 2017 final dividend 94 cents per share ($3,187), all fully franked at 30%. 84 | Westpac Group 2018 Full Year Financial Results Announcement Total equity attributable to owners Shareof WestpacNon-CapitalRetainedBanking controlling $m(Note 15) ReservesprofitsCorporationinterests Total shareholders' equity and non-controlling interests Balance at 1 October 2017 Net profit for the period Net other comprehensive income for the period Total comprehensive income for the period Transactions in capacity as equity holders Dividends on ordinary shares1 Dividend reinvestment plan Other equity movements Share-based payment arrangements Exercise of employee share options and rights Purchase of shares (net of issue costs) Net (acquisition)/disposal of treasury shares Other Total contributions and distributions Balance at 31 March 2018 34,39479426,10061,28854 61,342 --4,1984,1982 -261137-4,200 37 -264,2094,2352 4,237 --(3,187)(3,187)-310--310--69-69-- - - - - (31) - - (31) - (70) - - (70) - -1-1(6) (3,187) 310 69 - (31) (70) (5) 20970(3,187)(2,908)(6) (2,914) 34,60389027,12262,61550 62,665 Net profit for the period Net other comprehensive income for the period Total comprehensive income for the period Transactions in capacity as equity holders Dividends on ordinary shares1 Dividend reinvestment plan Conversion of Convertible Preference Shares Other equity movements Share-based payment arrangements Exercise of employee share options and rights Purchase of shares (net of issue costs) Net (acquisition)/disposal of treasury shares Other Total contributions and distributions Balance at 30 September 2018 --3,8973,8972 -15477231-3,899 231 -1543,9744,1282 4,130 --(3,213)(3,213)-321--321-566--566--34-34-3--3-(4)--(4)-72--72--(1)-(1)-(3,213) 321 566 34 3 (4) 72 (1) 95833(3,213)(2,222)-(2,222) 35,5611,07727,88364,52152 64,573

2018 Full Year financial results Consolidated financial statements 4.6 Consolidated cash flow statement Westpac Banking Corporation and its controlled entities The above consolidated cash flow statement should be read in conjunction with the accompanying notes. Details of the reconciliation of net cash provided by/(used in) operating activities to net profit are provided in Note 16. Westpac Group 2018 Full Year Financial Results Announcement | 85 $mNote % Mov't Half Year Sept 18 - March 18 Mar 18 % Mov't Full YearSept 18 - Sept 17 Sept 17 Half Year Full Year Sept 18 Sept 18 Cash flows from operating activities Interest received Interest paid Dividends received excluding life business Other non-interest income received Operating expenses paid Income tax paid excluding life business Life business: Receipts from policyholders and customers Interest and other items of similar nature Dividends received Payments to policyholders and suppliers Income tax paid Cash flows from operating activities before changes in operating assets and liabilities Net (increase)/decrease in: Trading securities and financial assets designated at fair value Loans Receivables due from other financial institutions Life insurance assets and liabilities Regulatory deposits with central banks overseas Derivative financial instruments Other assets Net increase/(decrease) in: Other financial liabilities at fair value through income statement Deposits and other borrowings Payables due to other financial institutions Other liabilities Net cash provided by/(used in) operating activities16 Cash flows from investing activities Proceeds from available-for-sale securities Purchase of available-for-sale securities Proceeds from disposal of controlled entities, net of cash disposed Proceeds from sale of associates Purchase of associates Proceeds from disposal of property and equipment Purchase of property and equipment Purchase of intangible assets Net cash provided by/(used in) investing activities Cash flows from financing activities Issue of loan capital (net of issue costs) Redemption of loan capital Net increase/(decrease) in debt issues Proceeds from exercise of employee options Purchase of shares on exercise of employee options and rights Shares purchased for delivery of employee share plan Purchase of RSP treasury shares Net sale/(purchase) of other treasury shares Payment of dividends Payment of distributions to non-controlling interests Net cash provided by/(used in) financing activities Net increase/(decrease) in cash and cash equivalents Effect of exchange rate changes on cash and cash equivalents Cash and cash equivalents as at the beginning of the period Cash and cash equivalents as at the end of the period 15,998 4 (7,820) 2 1large 2,901 (24) (4,310) (15) (1,793) - 94612 15(87) 83large (794)63 (51) 80 31,133 5 (15,415)2 27(67) 5,064 1 (7,966) - (3,388) 6 2,239 (10) 24(29) 433 48 (1,861) 12 (164)(13) 16,641 32,639 (7,969) (15,789) 8 9 2,196 5,097 (3,681) (7,991) (1,792) (3,585) 1,062 2,008 2 17 559 642 (1,295) (2,089) (92) (143) 5,1769 4,982large (14,764)(32) 3,245large (88) 61 (250) (79) (1,100)large (126)large 1,526large 12,008(1) (2,965)(63) 48large 10,1267 (5,054)large (26,815)(8) 2,653(37) 219large 308large (5,042)large 200(20) (681)large 23,0624 3,859large (15)large 5,639 10,815 (1,155) 3,827 (9,976) (24,740) (1,567) 1,678 (142) (230) (53) (303) 9,684 8,584 286 160 (1,283) 243 11,920 23,928 (1,107) (4,072) (136) (88) 12,110 7,69257 19,802 2,820large 11,4958 (15,575)(43) 9(100) --(13) 31 63 (56) (95) 126 (389) 27 25,717(7) (27,028)(10) --630 (100) (52) (42) 65 40 (264) 17 (766) 15 12,383 23,878 (8,801) (24,376) - 9 - - (17) (30) 28 91 (215) (310) (493) (882) 2,885 (4,505)large (1,620) (1,698)(5) 1,618(55) (1,025)33 2,124large - - (4) - (27) (100) (70) (99) - - (2,877)1 (6)(100) 4,437(47) (2,188)9 3,249large 11 (73) (17) (53) (27) - (68) 4 7large (4,839)19 (13) (54) 724 2,342 (1,362) (2,387) (7,366) (5,242) 3 3 (4) (8) - (27) (1) (71) 73 73 (2,892) (5,769) - (6) (10,825) (267)large (11,092) 552large 4,170 2,92043 263159 18,39717 7,090 1,674large (292)large 17,0158 681 944 21,580 18,397 26,431 21,58022 26,431 18,39744

2018 Full Year financial results Notes to the consolidated financial statements 4.7 Notes to the consolidated financial statements Note 1. Basis of preparation The accounting policies and methods of computation adopted in the financial year were in accordance with the requirements for an authorised deposit-taking institution under the Banking Act 1959 (as amended), Australian Accounting Standards (AAS) and Interpretations as issued by the Australian Accounting Standards Board and the Corporations Act 2001. Westpac’s financial statements also comply with International Financial Reporting Standards as issued by the International Accounting Standards Board. Where necessary, comparative figures have been adjusted to conform to changes in presentation in the current period. All amounts have been rounded to the nearest million dollars unless otherwise stated. 86 | Westpac Group 2018 Full Year Financial Results Announcement

2018 Full Year financial results Notes to the consolidated financial statements Note 2. Segment reporting Operating segments are presented on a basis consistent with information provided internally to Westpac's key decision makers and reflects the management of the business, rather than the legal structure of the Group. Internally, Westpac uses 'cash earnings' in assessing the financial performance of its divisions. Management believes this allows the Group to: more effectively assess current year performance against prior years; compare performance across business divisions; and compare performance across peer companies. Cash earnings is viewed as a measure of the level of profit that is generated by ongoing operations and is therefore considered in assessing distributions, including dividends. Cash earnings is neither a measure of cash flow nor net profit determined on a cash accounting basis, as it includes both cash and non-cash adjustments to statutory net profit. To determine cash earnings, three categories of adjustments are made to statutory results: material items that key decision makers at the Westpac Group believe do not reflect ongoing operations; items that are not considered when dividends are recommended, such as the amortisation of intangibles, impact of Treasury shares and economic hedging; and accounting reclassifications between individual line items that do not impact statutory results. Internal charges and transfer pricing adjustments have been reflected in the performance of each operating segment. Inter-segment pricing is determined on an arm's length basis. Reportable operating segments The operating segments are defined by the customers they service and the services they provide: Consumer Bank (CB): - responsible for sales and service of banking and financial products and services; - customer base is consumer in Australia; and - operates under the Westpac, St.George, BankSA, Bank of Melbourne and RAMS brands. Business Bank (BB): - responsible for sales and service of banking and financial products and services; - customer base is SME and commercial business customers in Australia for facilities up to approximately $150 million; and - operates under the Westpac, St.George, BankSA and Bank of Melbourne brands. BT Financial Group (Australia) (BTFG): - Westpac’s Australian wealth management and insurance division; - services include the manufacturing and distribution of investment, superannuation and retirement products, wealth administration platforms, private wealth, margin lending and equities broking; - BTFG’s insurance business covers the manufacturing and distribution of life, general and lenders mortgage insurance; - in addition to the BT brand, BTFG operates a range of financial services brands along with the banking brands of Westpac, St.George, Bank of Melbourne and BankSA for Private Wealth and Insurance. Westpac Institutional Bank (WIB): - Westpac’s institutional financial services division delivering a broad range of financial products and services; - services include transactional banking, financial and debt capital markets, specialised capital and alternative investment solutions; - customer base includes commercial, corporate, institutional and government customers; - customers are supported throughout Australia, as well as via branches and subsidiaries located in New Zealand, US, UK and Asia; and Westpac Group 2018 Full Year Financial Results Announcement | 87
2018 Full Year financial results Notes to the consolidated financial statements Note 2. Segment reporting (continued) - also responsible for Westpac Pacific, providing a range of banking services in Fiji and Papua New Guinea. Westpac New Zealand: - responsible for sales and service of banking, wealth and insurance products to customers in New Zealand; - customer base includes consumers, business and institutional customers; and - operates under the Westpac brand for banking products, the Westpac Life brand for life insurance products and the BT brand for wealth products. Group Businesses include: - Treasury, which is responsible for the management of the Group’s balance sheet including wholesale funding, capital and management of liquidity. Treasury also manages the interest rate risk and foreign exchange risks inherent in the balance sheet, including managing the mismatch between Group assets and liabilities. Treasury’s earnings are primarily sourced from managing the Group’s balance sheet and interest rate risk (excluding Westpac New Zealand) within set risk limits; - Group Technology1, which comprises functions for the Australian businesses, is responsible for technology strategy and architecture, infrastructure and operations, applications development and business integration; - Core Support2, which comprises functions performed centrally, including Australian banking operations, property services, strategy, finance, risk, compliance, legal, human resources and customer and corporate relations; and - Group Businesses also includes earnings on capital not allocated to divisions, accounting entries for certain intra-group transactions that facilitate the presentation of the performance of the Group’s operating segments, earnings from non-core asset sales, earnings and costs associated with the Group’s fintech investments and certain other head office items such as centrally held provisions. Revisions to segment allocations In 2018, Westpac implemented a number of changes to the presentation of its divisional financial information. These changes have no impact on the Group’s overall results or balance sheet but impact divisional results and balance sheets. Comparative divisional financial information has been restated for these changes. The changes include updates to the methodologies to allocate certain costs, revenues and capital to the divisions. These changes can be summarised as: 1. Allocating additional capital from Group Businesses to operating divisions, following greater clarity from APRA on updates to its capital framework; 2. Updating the Group’s cost of funds transfer pricing methodology, including the allocation of revenue from balance sheet management activities; 3. Realigning divisional earnings and balance sheet disclosures for recent customer transfers; and 4. Refining expense allocations to improve the allocation of support costs to divisions. 1 2 Costs are fully allocated to other divisions in the Group. Costs are partially allocated to other divisions in the Group, with costs attributed to enterprise activity retained in Group Businesses. 88 | Westpac Group 2018 Full Year Financial Results Announcement

2018 Full Year financial results Notes to the consolidated financial statements Note 2. Segment reporting (continued) The tables below present the segment results on a cash earnings basis for the Group: Half Year Sept 18 Half Year March 18 Westpac Group 2018 Full Year Financial Results Announcement | 89 $m Westpac BT FinancialWestpacNew ConsumerBusinessGroupInstitutionalZealandGroup BankBank(Australia)Bank(A$)Businesses Group Net interest income Non-interest income Net operating income before operating expenses and impairment charges Operating expenses Impairment (charges) / benefits Profit before income tax Income tax expense Net profit attributable to non-controlling interests Cash earnings for the period Net cash earnings adjustments Net profit for the period attributable to owners of Westpac Banking Corporation Total assets Total liabilities 4,0402,021285675843437 8,301 37758989874922413 2,850 4,4172,6101,1831,4241,067450 11,151 (1,730)(930)(601)(675)(429)(289) (4,654) (233)(137)(3)17(24)(13) (393) 2,4541,543579766614148 6,104 (737)(463)(175)(212)(173)(91) (1,851) ---(3)-1 (2) 1,7171,08040455144158 4,251 (15)(2)--10(46) (53) 1,7021,07840455145112 4,198 385,959154,96935,806104,76684,285106,070 871,855 203,801111,48642,058124,13073,801253,914 809,190 $m Westpac BT FinancialWestpacNew ConsumerBusinessGroupInstitutionalZealandGroup BankBank(Australia)Bank(A$)Businesses Group Net interest income Non-interest income Net operating income before operating expenses and impairment charges Operating expenses Impairment (charges) / benefits Profit before income tax Income tax expense Net profit attributable to non-controlling interests Cash earnings for the period Net cash earnings adjustments Net profit for the period attributable to owners of Westpac Banking Corporation Total assets Total liabilities 3,7082,044293741877375 8,038 36960075080721422 2,762 4,0772,6441,0431,5481,091397 10,800 (1,812)(946)(690)(771)(431)(282) (4,932) (218)(154)(3)212215 (317) 2,0471,544350798682130 5,551 (624)(465)(109)(261)(189)(87) (1,735) ---(2)--(2) 1,4231,07924153549343 3,814 --(73)-3153 83 1,4231,079168535496196 3,897 392,495156,52334,923102,38082,424110,847 879,592 212,472114,13742,500126,62072,078247,212 815,019
2018 Full Year financial results Notes to the consolidated financial statements Note 2. Segment reporting (continued) Full Year Sept 18 Full Year Sept 17¹ 1 Divisional comparatives have been restated. 90 | Westpac Group 2018 Full Year Financial Results Announcement $m Westpac BT FinancialWestpacNew ConsumerBusinessGroupInstitutionalZealandGroup BankBank(Australia)Bank(A$)Businesses Group Net interest income Non-interest income Net operating income before operating expenses and impairment charges Operating expenses Impairment (charges) / benefits Profit before income tax Income tax expense Net profit attributable to non-controlling interests Cash earnings for the period Net cash earnings adjustments Net profit for the period attributable to owners of Westpac Banking Corporation Total assets Total liabilities 7,6383,8855111,3281,629713 8131,1411,7441,707480(33) 15,704 5,852 8,451 5,026 2,2553,0352,109 680 (3,378)(1,818)(1,199) (1,351)(903)(456) (565)(343)(4) (56)72 43 21,556 (9,105) (853) 4,5082,8651,0521,6281,278267 11,598 (1,353)(862)(316)(462)(361)(175) ---(7)--(3,529) (7) 3,1552,0037361,15991792 8,062 (116)(10)160-(14)(92) (72) 3,0391,9938961,159903-7,990 377,457153,07835,237103,08081,285101,738 851,875 202,689111,38541,431118,87571,432244,721 790,533 $m Westpac BT FinancialWestpacNew ConsumerBusinessGroupInstitutionalZealandGroup BankBank(Australia)Bank(A$)Businesses Group Net interest income Non-interest income Net operating income before operating expenses and impairment charges Operating expenses Impairment (charges) / benefits Profit before income tax Income tax expense Net profit attributable to non-controlling interests Cash earnings for the period Net cash earnings adjustments Net profit for the period attributable to owners of Westpac Banking Corporation Total assets Total liabilities 7,7484,0655781,4161,720812 16,339 7461,1891,6481,55643835 5,612 8,4945,2542,2262,9722,158847 21,951 (3,542)(1,876)(1,291)(1,446)(860)(571) (9,586) (451)(291)(6)38(2)2 (710) 4,5013,0879291,5641,296278 11,655 (1,361)(928)(284)(473)(362)(178) (3,586) ---(5)-1 (4) 3,1402,1596451,086934101 8,065 (15)(2)(73)-13107 30 3,1252,1575721,086947208 8,095 392,495156,52334,923102,38082,424110,847 879,592 212,472114,13742,500126,62072,078247,212 815,019

2018 Full Year financial results Notes to the consolidated financial statements Note 3. Net interest income 241 110 (22) 35 (2) (18) 558 1,795 28,504 17 29 (3) 7 4 35 93 (279) (8,868) (2,065) (3,585) (693) (95) (131) 14 2 (54) 25 12 large 3 Westpac Group 2018 Full Year Financial Results Announcement | 91 $m % Mov't Half Year Sept 18 - March 18 Mar 18 % Mov't Full YearSept 18 - Sept 17Sept 17 Half Year Full Year Sept 18 Sept 18 Interest income Cash and balances with central banks 185 14032 325 Receivables due from other financial institutions 59 4920 108 Net ineffectiveness on qualifying hedges (5) (13)(62) (18) Trading securities and financial assets designated at fair value 267 275(3) 542 Available-for-sale securities 984 9306 1,914 Loans 14,943 14,6782 29,621 Regulatory deposits with central banks overseas 14 956 23 Other interest income 34 2255 56 Total interest income 16,481 16,0902 32,571 31,2324 Interest expense Payables due to other financial institutions (166) (153)8 (319) Deposits and other borrowings (4,653) (4,368)7 (9,021) Trading liabilities (385) (574)(33) (959) Debt issues (2,392) (2,088)15 (4,480) Loan capital (398) (376)6 (774) Bank Levy (192) (186)3 (378) Other interest expense (68) (67)1 (135) Total interest expense (8,254) (7,812)6 (16,066) (15,716)2 Total net interest income 8,227 8,278(1) 16,505 15,5166
2018 Full Year financial results Notes to the consolidated financial statements Note 4. Non-interest income 1,333 1,193 229 1 (7) (57) 1,590 15 210 12 2 279 6 - 50 (100) large - 52 (85) 11 - 143 17 19 large - (25) large large 1 2 Wealth management and insurance income includes policy holder tax recoveries. On 26 May 2017, the Group sold 60 million Pendal Group Limited shares (formerly BT Investment Management Limited) (19% of Pendal’s shares on issue). 3 Income from derivatives held for risk management purposes reflects the impact of economic hedges of foreign currency capital and earnings. 4 Other includes $104 million of impairment on the remaining shareholdings of Pendal Group Limited in 2018. 92 | Westpac Group 2018 Full Year Financial Results Announcement $mNote % Mov't Half Year Sept 18 - March 18 Mar 18 % Mov't Full Year Sept 18 - Sept 17Sept 17 Half Year Full Year Sept 18 Sept 18 Fees and commissions Facility fees 668 679(2) 1,347 Transaction fees and commissions 552 553-1,105 Other non-risk fee income (18) 116large 98 Total fees and commissions 1,202 1,348(11) 2,550 2,755(7) Wealth management and insurance income Life insurance and funds management net operating income1 980 84516 1,825 General insurance and lenders mortgage insurance net operating income 130 10623 236 Total wealth management and insurance income 1,110 95117 2,061 1,80015 Trading income 458 487(6) 945 1,202(21) Other income Dividends received from other entities 2 1100 3 Net gain on disposal of associates2 - --- Net gain on disposal of assets 14 1040 24 Net gain/(loss) on hedging overseas operations - --- Net gain/(loss) on derivatives held for risk management purposes3 17 (9)large 8 Net gain/(loss) on financial instruments designated at fair value 12 26(54) 38 Net gain/(loss) on disposal of controlled entities16 - (9)(100) (9) Rental income on operating leases 47 60(22) 107 Share of associates' net profit/(loss) (7) (3)133 (10) Other4 (102) 13large (89) Total other income (17) 89large 72 529(86) Total non-interest income 2,753 2,875(4) 5,628 6,286(10)
2018 Full Year financial results Notes to the consolidated financial statements Note 5. Operating expenses 4,133 380 113 75 4 2 (16) 52 648 291 134 (2) (16) 16 628 158 639 313 190 80 (1) (11) 13 9 10 (4) 755 9 192 217 155 152 73 108 (28) (16) 12 (17) 82 (20) 1 Professional and processing services relates to: - services provided by external suppliers including items such as cash handling and security services, marketing costs and research and recruitment fees (Full Year 2018: $271 million; Full Year 2017 $268 million); - operations processing (Full Year 2018: $195 million; Full Year 2017 $184 million); - consultants (Full Year 2018: $151 million; Full Year 2017 $162 million); - credit assessment (Full Year 2018: $58 million; Full Year 2017 $53 million); - legal and audit fees (Full Year 2018: $111 million; Full Year 2017 $61 million); and - regulatory fees and share market related costs (Full Year 2018: $38 million; Full Year 2017 $27 million). Westpac Group 2018 Full Year Financial Results Announcement | 93 $m % Mov't Half Year Sept 18 - March 18 Mar 18 % Mov't Full YearSept 18 - Sept 17Sept 17 Half Year Full Year Sept 18 Sept 18 Staff expenses Employee remuneration, entitlements and on-costs 2,173 2,1193 4,292 Superannuation expense 189 197(4) 386 Share-based payments 47 48(2) 95 Restructuring costs 80 34135 114 Total staff expenses 2,489 2,3984 4,887 4,7014 Occupancy expenses Operating lease rentals 313 319(2) 632 Depreciation of property and equipment 114 131(13) 245 Other 85 7120 156 Total occupancy expenses 512 521(2) 1,033 1,073(4) Technology expenses Amortisation and impairment of software assets 317 3035 620 Depreciation and impairment of IT equipment 68 73(7) 141 Technology services 380 34111 721 Software maintenance and licenses 157 185(15) 342 Telecommunications 107 1025 209 Data processing 39 383 77 Total technology expenses 1,068 1,0422 2,110 2,0085 Other expenses Professional and processing services1 439 38514 824 Amortisation and impairment of intangible assets and deferred expenditure 95 43121 138 Postage and stationery 87 95(8) 182 Advertising 80 93(14) 173 Credit card loyalty programs 56 70(20) 126 Non-lending losses 93 40133 133 Other expenses 48 3826 86 Total other expenses 898 76418 1,662 1,6521 Total operating expenses 4,967 4,7255 9,692 9,4343
2018 Full Year financial results Notes to the consolidated financial statements Note 6. Income tax The income tax expense is reconciled to the profit before income tax as follows: 3,455 2 64 8 8 (1) (3) (3) 32 (30) 4 (8) 200 - (67) 67 100 (7) 125 125 94 | Westpac Group 2018 Full Year Financial Results Announcement $m % Mov't Half Year Sept 18 - March 18 Mar 18 % Mov't Full YearSept 18 - Sept 17Sept 17 Half Year Full Year Sept 18 Sept 18 Profit before income tax 5,696 6,035(6) 11,731 11,5152 Tax at the Australian company tax rate of 30% 1,708 1,811(6) 3,519 The effect of amounts which are not deductible/(assessable) in calculating taxable income Hybrid capital distributions 36 339 69 Life insurance: Tax adjustment on policyholder earnings 16 8100 24 Adjustment for life business tax rates (1) --(1) Dividend adjustments - (1)(100) (1) Other non-assessable items (5) --(5) Other non-deductible items 47 17176 64 Adjustment for overseas tax rates (14) (14)-(28) Income tax (over)/under provided in prior periods 7 2large 9 Other items 3 (21)large (18) Total income tax expense 1,797 1,835(2) 3,632 3,5183 Effective income tax rate 31.55% 30.41%114bps 30.96% 30.55%41bps
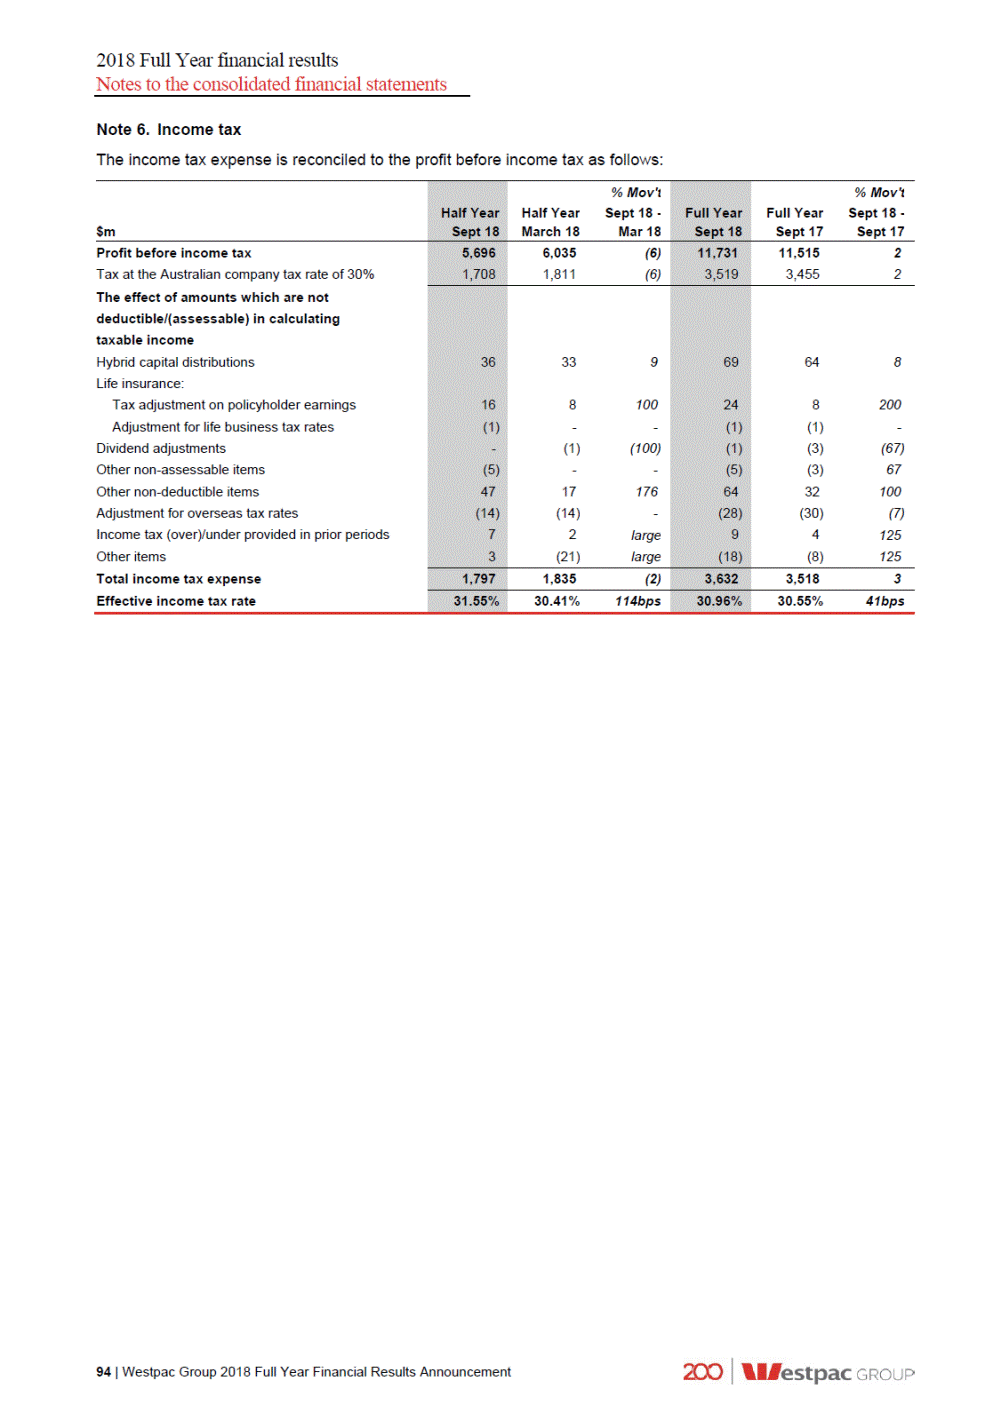
2018 Full Year financial results Notes to the consolidated financial statements Note 7. Earnings per share Basic earnings per share (EPS) is calculated by dividing the net profit attributable to shareholders by the weighted average number of ordinary shares on issue during the period, adjusted for treasury shares. Diluted EPS is calculated by adjusting the basic earnings per share by assuming all dilutive potential ordinary shares are converted. (6) - - 253 3,364 (9) 3,364 (9) - - 4 236 1 Some RSP share rights have not vested and are not ordinary shares but do receive dividends. These RSP dividends are deducted to show the profit attributable to ordinary shareholders. In Half Year September 2018, RSP share rights were antidilutive. 2 The Group has issued convertible loan capital which is expected to convert into ordinary shares in the future. These convertible loan capital instruments are all dilutive and diluted EPS is therefore calculated as if the instruments had already been converted at the volume weighted average price (VWAP) for the 20 days preceding the start of the respective period. Westpac Group 2018 Full Year Financial Results Announcement | 95 $m Half Year Sept 18 Half Year March 18 BasicDiluted Full Year Sept 18 Full Year Sept 17 BasicDiluted BasicDiluted BasicDiluted Net profit attributable to shareholders 3,8973,897 4,1984,198 8,0958,095 7,9907,990 Adjustment for Restricted Share Plan (RSP) dividends1 (3)(3) (2)-(5)-Adjustment for potential dilution: Distributions to convertible loan capital holders2 -148 -135 -283 Adjusted net profit attributable to shareholders 3,8944,042 4,1964,333 8,0908,378 7,9848,243 Weighted average number of ordinary shares (millions) Weighted average number of ordinary shares on issue 3,4293,429 3,4003,400 3,4143,414 Treasury shares (including RSP share rights) (8)(8) (8)(8) (8)(8) Adjustment for potential dilution: Share-based payments -1 -3 -3 Convertible loan capital2 -253 -225 -232 Adjusted weighted average number of ordinary shares 3,4213,675 3,3923,620 3,4063,641 3,3553,595 Earnings per ordinary share (cents) 113.8110.0 123.7119.7 237.5230.1 238.0229.3

2018 Full Year financial results Notes to the consolidated financial statements Note 8. Average balance sheet and interest rates 30 September 2017 Balance $m Interest $m Rate % 9,123 110 1.2 25,870 58,208 1,035 658,058 558 1,795 17 28,752 2.2 3.1 1.6 4.4 752,294 31,232 4.2 2,000 37,673 12,447 60,111 18,833 484,713 17,208 174,170 279 8,868 693 5,876 1.5 1.8 4.0 3.4 694,924 15,716 2.3 46,099 42,780 10,560 11,586 20 557,865 72,938 27,255 24,772 3,460 520 4.4 4.7 1.9 409,586 51,042 24,085 7,344 1,173 351 1.8 2.3 1.5 1 Loans and other receivables are stated net of provisions for impairment charges on loans. Other receivables include cash and balances with central banks and other interest earning assets. Includes property and equipment, intangible assets, deferred tax assets, non-interest bearing loans relating to mortgage offset accounts and other assets. Includes net impact of Treasury balance sheet management activities and the Bank Levy. Includes other current liabilities, provisions and deferred tax liabilities. 2 3 4 96 | Westpac Group 2018 Full Year Financial Results Announcement Full Year Full Year 30 September 2018 AverageIncomeAverage AverageIncomeAverage BalanceInterestRate $m$m% Assets Interest earning assets Receivables due from other financial institutions Trading securities and financial assets designated at fair value Available-for-sale securities Regulatory deposits with central banks overseas Loans and other receivables1 Total interest earning assets and interest income Non-interest earning assets Cash, receivables due from other financial institutions and regulatory deposits Derivative financial instruments Life insurance assets All other assets2 Total non-interest earning assets Total assets Liabilities Interest bearing liabilities Payables due to other financial institutions Deposits and other borrowings Loan capital Other interest bearing liabilities3 Total interest bearing liabilities and interest expense Non-interest bearing liabilities Deposits and payables due to other financial institutions Derivative financial instruments Life insurance liabilities All other liabilities4 Total non-interest bearing liabilities Total liabilities Shareholders' equity Non-controlling interests Total equity Total liabilities and equity Loans and other receivables1 Australia New Zealand Other overseas Deposits and other borrowings Australia New Zealand Other overseas 5,5651081.9 23,2445422.3 61,5401,9143.1 1,040232.2 683,55529,9844.4 774,94432,5714.2 2,376 34,702 10,664 61,938 109,680 112,231 884,624 864,525 19,2783191.7 499,9739,0211.8 17,9977744.3 178,2615,9523.3 715,50916,0662.2 48,490 37,504 8,874 12,199 107,067 111,025 822,576 805,949 62,017 58,556 31 62,048 58,576 884,624 864,525 579,74925,7094.4 73,8043,5144.8 30,0027612.5 422,0067,3081.7 51,3681,1962.3 26,5995171.9
2018 Full Year financial results Notes to the consolidated financial statements Note 9. Loans 437,239 21,789 151,904 1,872 91 427,167 21,952 150,542 1,885 100 2 (3) 2 (2) (3) 4 (4) 3 (3) (12) 44,974 1,922 28,068 76 43,198 1,856 26,667 85 - (7) (1) - 4 (3) 4 (11) 3,942 12,429 2,818 11,515 (9) - 28 8 (2,913) (2,866) (3) (2) 1 Total net loans include securitised loans of $7,135 million as at 30 September 2018 ($7,436 million as at 31 March 2018 and $7,651 million as at 30 September 2017). The level of securitised loans excludes loans where Westpac is the holder of related debt securities. Total net loans include assets pledged for the covered bond programs of $35,175 million as at 30 September 2018 ($34,106 million as at 31 March 2018 and $35,473 million as at 30 September 2017). 2 Westpac Group 2018 Full Year Financial Results Announcement | 97 $mNote As at As atAs at% Mov't% Mov't 31 March30 SeptSept 18 -Sept 18 - 20182017Mar 18Sept 17 30 Sept 2018 Australia Housing 444,741 Personal (loans and cards) 21,079 Business 154,347 Margin lending 1,830 Other 88 Total Australia 622,085 612,895601,64613 New Zealand Housing 44,772 Personal (loans and cards) 1,793 Business 27,701 Other 76 Total New Zealand 74,342 75,04071,806(1)4 Other overseas Trade finance 3,600 Other 12,477 Total other overseas 16,077 16,37114,333(2)12 Total loans 712,504 704,306687,78514 Provisions for impairment charges on loans10 (2,814) Total net loans1,2 709,690 701,393684,91914
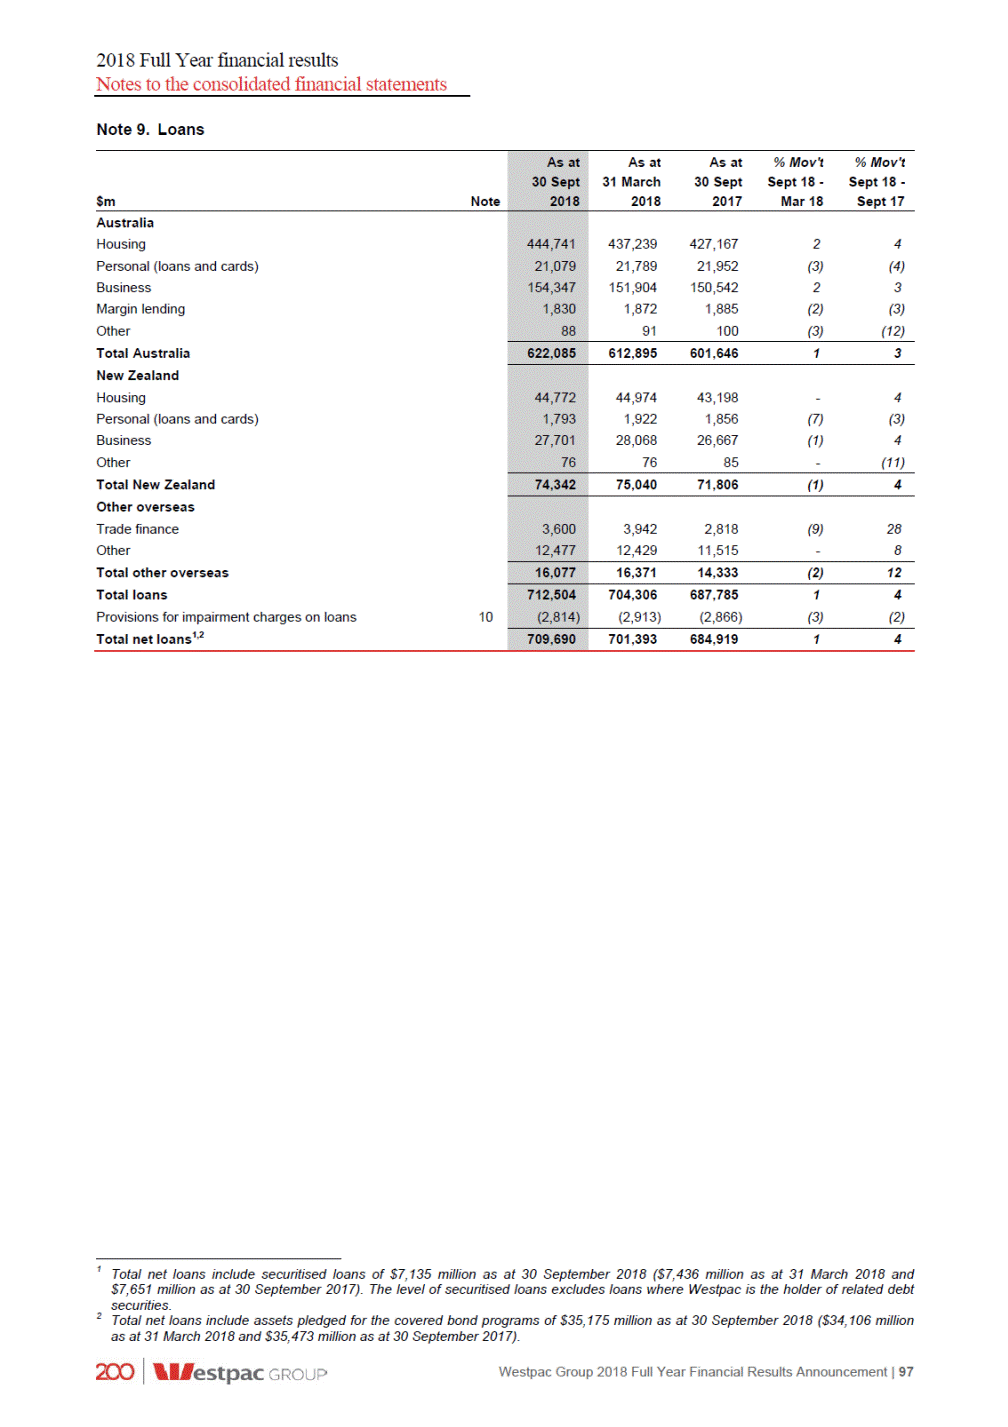
2018 Full Year financial results Notes to the consolidated financial statements Note 10. Provisions for impairment charges 98 | Westpac Group 2018 Full Year Financial Results Announcement $m Half Year Half Year March Full Year Full Year Sept 17 Sept 18 Sept 18 Reconciliation of impairment charges Individually assessed provisions raised Write-backs Recoveries Collectively assessed provisions raised Impairment charges 198 (83) (79) 281 173 (67) (100) 387 371 (150) (179) 668 610 (288) (168) 699 317 393 710 853 $m Half Year Half Year March 18 Full Year Full Year Sept 17 Sept 18 Sept 18 Individually assessed provisions Opening balance Provisions raised Write-backs Write-offs Interest adjustment Other adjustments Closing balance Collectively assessed provisions Opening balance Provisions raised Write-offs Interest adjustment Other adjustments Closing balance Total provisions for impairment charges on loans and credit commitments Less: provisions for credit commitments Total provisions for impairment charges on loans 480 173 (67) (104) (7) (4) 480 371 (150) (269) (11) 1 869 610 (288) (688) (16) (7) 471 198 (83) (165) (4) 5 422 471 422 480 2,694 281 (428) 90 (6) 2,639 387 (430) 89 9 2,639 668 (858) 179 3 2,733 699 (968) 188 (13) 2,631 2,694 2,631 2,639 3,053 (239) 3,165 (252) 3,053 (239) 3,119 (253) 2,814 2,913 2,814 2,866

2018 Full Year financial results Notes to the consolidated financial statements Note 11. Credit quality Impaired assets Australia New Zealand Other Overseas Total 1,120 (503) 1,142 (507) 29 (10) 27 (12) 386 (186) 373 (195) 1,535 (699) 1,542 (714) 1 Includes individually assessed provisions and collectively assessed provisions on impaired loans. 2 Includes collectively assessed provisions on impaired loans. Westpac Group 2018 Full Year Financial Results Announcement | 99 $m As at 30 Sept 2018 As atAs at 31 March30 Sept 20182017 As at 30 Sept 2018 As atAs at 31 March30 Sept 20182017 As at 30 Sept 2018 As atAs at 31 March30 Sept 20182017 As at 30 Sept 2018 As atAs at 31 March30 Sept 20182017 Non-Performing loans: Gross amount 882 923975 124 184152 13 1315 1,019 Impairment provisions1 (422) (444)(460) (30) (54)(41) (6) (5)(6) (458) Net 460 479515 94 130111 7 89 561 617635 Restructured loans: Gross amount 9 1112 14 1615 3 2-26 Impairment provisions1 (1) (5)(7) (4) (4)(5) (1) (1)-(6) Net 8 65 10 1210 2 1-20 1915 Overdrafts, personal loans and revolving credit greater than 90 days past due: Gross amount 358 368362 12 1711 1 1-371 Impairment provisions2 (179) (172)(187) (9) (13)(8) (1) (1)-(189) Net 179 196175 3 43 - --182 200178 Total impaired assets: Gross amount 1,249 1,3021,349 150 217178 17 1615 1,416 Impairment provisions1 (602) (621)(654) (43) (71)(54) (8) (7)(6) (653) Net 647 681695 107 146124 9 99 763 836828

2018 Full Year financial results Notes to the consolidated financial statements Note 11. Credit quality (continued) Movement in gross impaired loans1 471 (534) (387) 442 1 440 (924) (471) 518 1 (4) 11 2 (7) large 2 (36) (17) (20) large Items 90 days past due, or otherwise in default, and not impaired 2,860 736 2,672 650 6 14 13 29 124 31 18 89 28 19 (20) (10) 61 11 - 53 1 Movement represents a six month period. 100 | Westpac Group 2018 Full Year Financial Results Announcement $m As at As atAs at% Mov't% Mov't 31 March30 SeptSept 18 -Sept 18 - 20182017Mar 18Sept 17 30 Sept 2018 Australia Housing products 3,023 Other products 838 Total Australia 3,861 3,5963,322716 New Zealand Housing products 99 Other products 28 Other overseas 29 Total overseas 156 173136(10)15 Total 4,017 3,7693,458716 $m As at As atAs at% Mov't% Mov't 31 March30 SeptSept 18 -Sept 18 - 20182017Mar 18Sept 17 30 Sept 2018 Opening balance 1,535 1,5421,978-(22) New and increased - individually managed 450 Write-offs (593) Returned to performing or repaid (393) Portfolio managed - new/increased/returned/repaid 413 Exchange rate and other adjustments 4 Balance as at period end 1,416 1,5351,542(8)(8)

2018 Full Year financial results Notes to the consolidated financial statements Note 12. Deposits and other borrowings 30,387 40,967 227,021 161,864 37,515 40,324 224,268 156,249 (5) 2 3 6 (23) 4 4 10 521 5,510 22,685 29,661 546 4,853 21,273 27,620 114 (2) (6) 1 104 11 - 8 14,765 748 1,309 12,298 8,860 810 1,505 9,768 (21) 11 25 (3) 32 2 9 22 502,399 487,022 3 6 Westpac Group 2018 Full Year Financial Results Announcement | 101 $m As at As atAs at% Mov't% Mov't 31 March30 SeptSept 18 -Sept 18 - 20182017Mar 18Sept 17 30 Sept 2018 Australia Certificates of deposit 28,746 Non-interest bearing, repayable at call 41,783 Other interest bearing at call 233,052 Other interest bearing term 171,832 Total Australia 475,413 460,239458,35634 New Zealand Certificates of deposit 1,116 Non-interest bearing, repayable at call 5,406 Other interest bearing at call 21,368 Other interest bearing term 29,897 Total New Zealand 57,787 58,37754,292(1)6 Overseas Certificates of deposit 11,672 Non-interest bearing, repayable at call 830 Other interest bearing at call 1,638 Other interest bearing term 11,945 Total overseas 26,085 29,12020,943(10)25 Total deposits and other borrowings 559,285 547,736533,59125 Deposits and other borrowings at fair value 41,178 45,33746,569(9)(12) Deposits and other borrowings at amortised cost 518,107 Total deposits and other borrowings 559,285 547,736533,59125
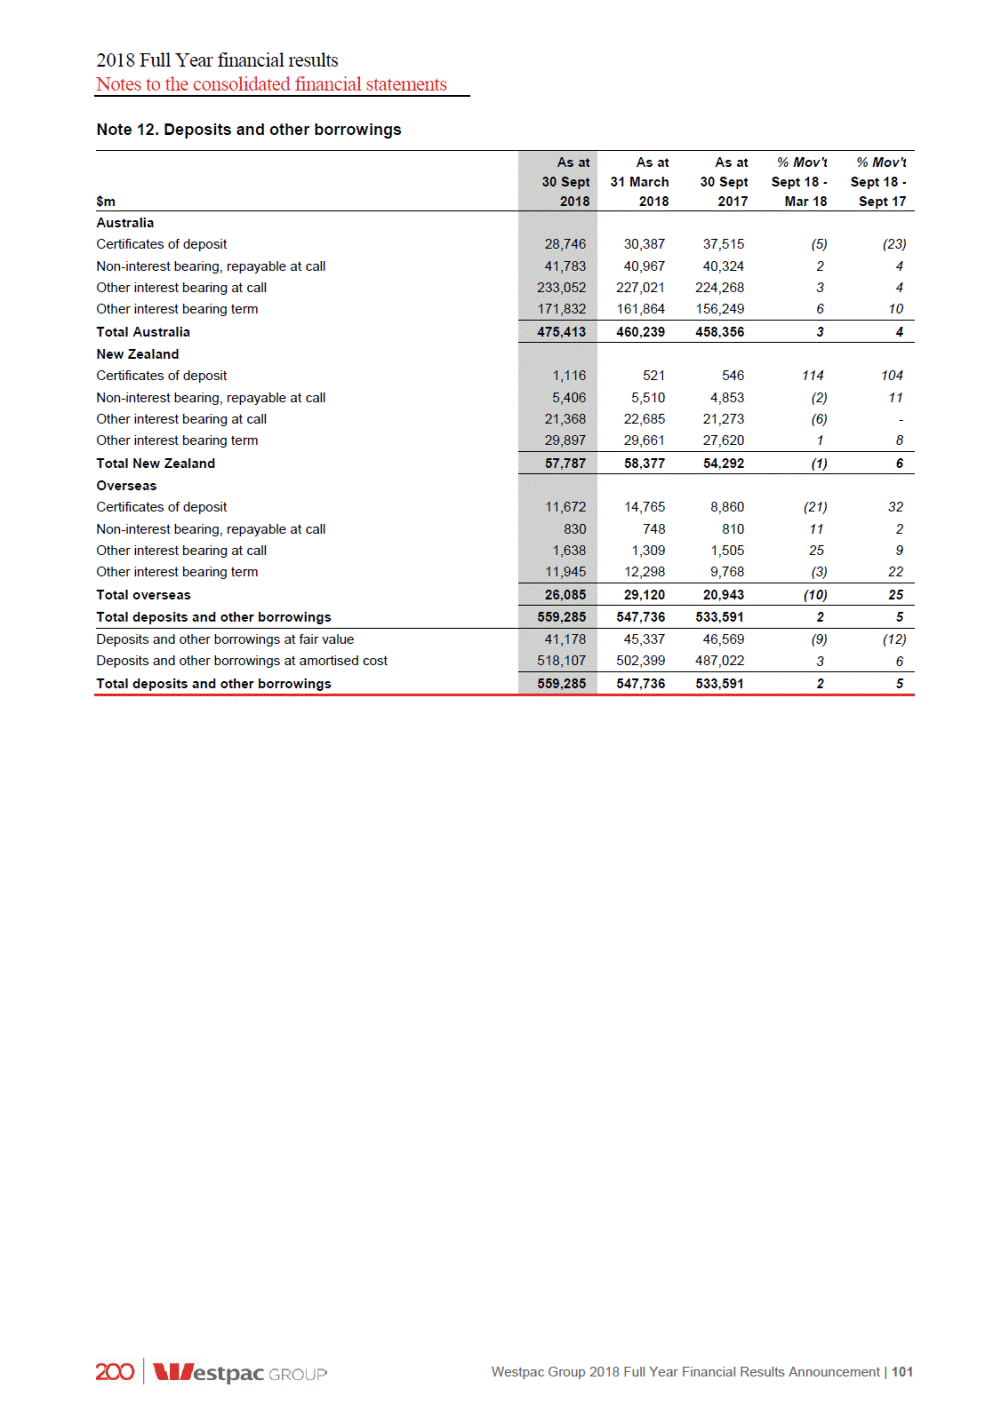
2018 Full Year financial results Notes to the consolidated financial statements Note 13. Fair values of financial assets and financial liabilities Fair Valuation Control Framework The Group uses a Fair Valuation Control Framework where the fair value is either determined or validated by a function independent of the transaction. This framework formalises the policies and procedures used to achieve compliance with relevant accounting, industry and regulatory standards. The framework includes specific controls relating to: the revaluation of financial instruments; independent price verification; fair value adjustments; and financial reporting. A key element of the Framework is the Revaluation Committee, comprising senior valuation specialists from within the Group. The Revaluation Committee reviews the application of the agreed policies and procedures to assess that a fair value measurement basis has been applied. The method of determining fair value differs depending on the information available. Fair value hierarchy A financial instrument’s categorisation within the valuation hierarchy is based on the lowest level input that is significant to the fair value measurement. The Group categorises all fair value instruments according to the hierarchy described below. Valuation techniques The Group applies market accepted valuation techniques in determining the fair valuation of over the counter (OTC) derivatives. This includes credit valuation adjustments (CVA) and funding valuation adjustments (FVA), which incorporate credit risk and funding costs and benefits that arise in relation to uncollateralised derivative positions, respectively. The specific valuation techniques, the observability of the inputs used in valuation models and the subsequent classification for each significant product category are outlined below: Level 1 instruments The fair value of financial instruments traded in active markets based on recent unadjusted quoted prices. These prices are based on actual arm’s length basis transactions. The valuations of Level 1 instruments require little or no management judgement. Instrument Balance sheet category Includes: Valuation Exchange traded interest rate futures and options and commodity, energy and carbon futures Exchange traded products Derivatives Derivatives FX spot and futures contracts products Derivatives Trading securities and financial assets designated at fair value Other financial liabilities at fair value through income statement All these instruments are traded in liquid, active markets where prices are readily observable. No modelling or assumptions are used in the valuation. Equity products Listed equities and equity indices debt instruments Commonwealth government bonds Listed equities, exchange traded derivatives and short sale of listed equities within controlled managed investment schemes Life insurance assets Life insurance liabilities Life insurance assets and liabilities 102 | Westpac Group 2018 Full Year Financial Results Announcement Trading securities and financial assets designated at fair value Non-asset backedAvailable-for-sale securitiesAustralian and New Zealand Other financial liabilities at fair value through income statement Foreign exchange
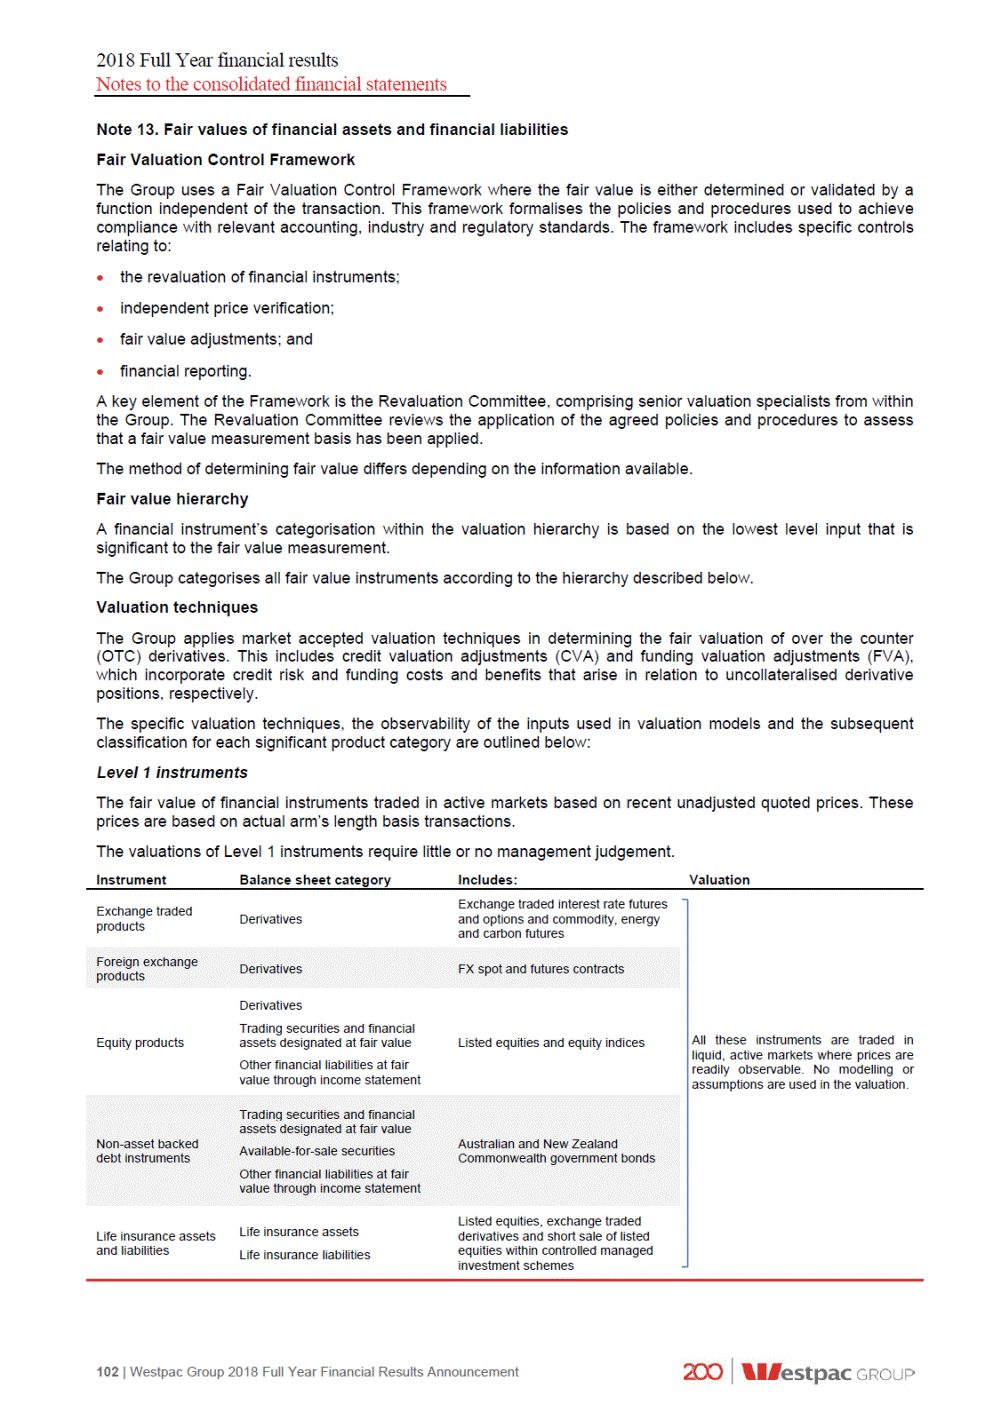
2018 Full Year financial results Notes to the consolidated financial statements Note 13. Fair values of financial assets and financial liabilities (continued) Level 2 instruments The fair value for financial instruments that is not actively traded are determined using valuation techniques which maximise the use of observable market prices. Valuation techniques include: the use of market standard discounting methodologies; option pricing models; and other valuation techniques widely used and accepted by market participants. Instrument Balance sheet category Includes: Valuation Industry standard valuation models are used to calculate the expected future value of payments by product, which is discounted back to a present value. The model’s interest rate inputs are benchmark interest rates and active broker quoted interest rates in the swap, bond and future markets. Interest rate volatilities are sourced from brokers and consensus data providers. If consensus prices are not available, these are classified as Level 3 instruments. Interest rate and inflation swaps, swaptions, caps, floors, collars and other non-vanilla interest rate derivatives Interest rate products Derivatives contracts, FX options and Derived from market observable inputs or consensus exchange Derivatives derivatives Valued using an industry standard model that incorporates the credit spread as its principal input. Credit spreads are obtained from consensus data providers. If consensus prices are not available, these are classified as Level 3 instruments. Other credit products Single Name and Index credit default swaps (CDS) Derivatives volatilities implied from market observable inputs, discount products carbon derivatives Due to low liquidity exchange traded options are Level 2. Valued using industry standard models based on observable parameters such as stock prices, dividends, volatilities and interest rates. Exchange traded equity options, OTC equity options and equity warrants Equity products Derivatives mortgage backed securities at fair value valued using prices sourced from a consensus data debt instruments Australian dollar and other asset backed securities Available-for-sale securities classified as Level 3 instruments. Westpac Group 2018 Full Year Financial Results Announcement | 103 Trading securities andAustralian residentialValued using an industry approach to value floating rate Asset backedfinancial assets designated(RMBS) denominated indebt with prepayment features. Australian RMBS are provider. If consensus prices are not available these are (ABS). Valued using industry standard models. The models calculate the expected future value of deliveries and payments and discounts them back to a CommodityDerivativesCommodity, energy andpresent value. The model inputs include forward curves, curves and underlying spot and futures prices. The significant inputs are market observable or available through a consensus data service. If consensus prices are not available, these are classified as Level 3 instruments. ForeignFX swap, FX forward productsother non-vanilla FXpricing providers using industry standard models.

2018 Full Year financial results Notes to the consolidated financial statements Note 13. Fair values of financial assets and financial liabilities (continued) Level 2 instruments (continued) Instrument Balance sheet category Includes: Valuation Trading securities and financial assets designated at fair value State and other government bonds, corporate bonds and commercial paper Non-asset backed debt instruments Available-for-sale securities Valued using observable market prices, which are sourced from consensus pricing services, broker quotes or inter-dealer prices. Security repurchase agreements and reverse repurchase agreements over non-asset backed debt securities Regulatory deposits with central banks overseas Other financial liabilities through income statement Loans Fixed rate bills value timing of cash flows, adjusted for creditworthiness Certificates of deposit Deposits and other borrowings Discounted cash flow using market rates offered for deposits of similar remaining maturities. Certificates of deposit fair value cash flows adjusted for market observable changes in Corporate bonds, over the counter derivatives, units in unlisted unit trusts, life insurance contract liabilities, life investment contract liabilities and external liabilities of managed investment schemes controlled by statutory life funds. Life insurance assets and liabilities Life insurance assets Valued using observable market prices or other widely used and accepted valuation techniques utilising observable market input. Life insurance liabilities Level 3 instruments Financial instruments valued where at least one input that could have a significant effect on the instrument’s valuation is not based on observable market data due to illiquidity or complexity of the product. These inputs are generally derived and extrapolated from other relevant market data and calibrated against current market trends and historical transactions. These valuations are calculated using a high degree of management judgement. Instrument Balance sheet category Includes: Valuation Trading securities and financial assets designated at fair value As prices for these securities are not available from a consensus provider these are revalued based on third party revaluations (lead manager or inter-dealer). Due to their illiquidity and/or complexity they are classified as Level 3 assets. Collateralised loan obligations and offshore asset-backed debt instruments. Asset backed debt instruments Available-for-sale securities Non-asset Government securities Government securities from illiquid markets are financial assets designated instruments bonds) reference to recent issuances. Valued using valuation techniques appropriate to the investment, including the use of recent arm’s length transactions where available, discounted cash flow approach, reference to the net assets of the entity or to the most recent fund unit pricing. Due to their illiquidity, complexity and/or use of unobservable inputs into valuation models, they are classified as Level 3 assets. Trading securities and financial assets designated at fair value Investments in unlisted funds, boutique investment management companies and strategic equity investments. Equity investments Available-for-sale securities 104 | Westpac Group 2018 Full Year Financial Results Announcement Trading securities and backed debtat fair value(predominantly PNG governmentclassified as Level 3. Fair value is monitored by Available-for-sale securities Discounted cash flows, using a discount rate which Debt issues atDebt issuesDebt issuesreflects the terms of the instrument and the timing of Westpac’s implied credit worthiness. Discounted cash flow approach, using a discount rate Loans at fairwhich reflects the terms of the instrument and the based on market observable inputs.

2018 Full Year financial results Notes to the consolidated financial statements Note 13. Fair values of financial assets and financial liabilities (continued) The table below summarises the attribution of financial instruments carried at fair value to the fair value hierarchy: - 375 22 - - 45,337 5,215 24,038 4,031 8,763 - - 6 - - 45,337 5,590 24,066 4,031 8,763 - 208 8 - - 46,569 3,848 25,358 4,673 9,019 - - 9 - - 46,569 4,056 25,375 4,673 9,019 Westpac Group 2018 Full Year Financial Results Announcement | 105 $m As at 30 Sept 2018 As at 31 March 2018As at 30 Sept 2017 Level 1 Level 2 Level 3 Total Level 1Level 2Level 3TotalLevel 1Level 2Level 3Total Financial assets measured at fair value on a recurring basis 5,57814,55849120,6276,81517,74276725,324 3026,8621226,904924,0091524,033 11,35052,92458364,8577,25252,84161760,710 -3,789-3,789-4,587-4,587 2,6817,800-10,4812,7687,875-10,643 -966-966-659-659 Trading securities and financial assets designated at fair value 8,958 12,846 330 22,134 Derivative financial instruments 20 24,066 15 24,101 Available-for-sale securities 11,996 48,504 619 61,119 Loans - 3,250 - 3,250 Life insurance assets 1,345 8,105 - 9,450 Regulatory deposits with central banks overseas - 998 - 998 Total financial assets carried at fair value 22,319 97,769 964 121,052 19,639106,8991,086127,62416,844107,7131,399125,956 Financial liabilities measured at fair value on a recurring basis Deposits and other borrowings at fair value - 41,178 - 41,178 Other financial liabilities at fair value through income statement 496 3,801 - 4,297 Derivative financial instruments 76 24,325 6 24,407 Debt issues at fair value - 3,355 - 3,355 Life insurance liabilities - 7,597 - 7,597 Total financial liabilities carried at fair value 572 80,256 6 80,834 39787,384687,78721689,467989,692

2018 Full Year financial results Notes to the consolidated financial statements Note 13. Fair values of financial assets and financial liabilities (continued) Analysis of movements between fair value hierarchy levels Transfers into or out of Level 3 are discussed in the following table. The table below summarises the changes in financial instruments carried at fair value derived from non-market observable valuation techniques (Level 3): Full Year Sept 18 Transfers into and out of Level 3 have occurred due to changes in observability in the significant inputs into the valuation models used to determine the fair value of the related financial instruments. Transfers in and transfers out are reported using the end of year fair values. Significant unobservable inputs Sensitivities to reasonably possible changes in non-market observable valuation assumptions would not have a material impact on the Group’s reported results. Day one profit or loss The closing balance of unrecognised day one profit for the period was $4 million (30 September 2017: $5 million profit). 106 | Westpac Group 2018 Full Year Financial Results Announcement $m Trading Securities and Financial AssetsAvailable-Designatedfor-Sale at Fair ValueDerivatives Securities Total Level 3 Assets Derivatives Total Level 3 Liabilities Balance as at 1 October 201776715617 1,399 9 9 Gains/(losses) on assets and (gains)/losses on liabilities recognised in: Income statements21-3 1 1 Available-for-sale reserve--(7) (7) - - Acquisitions and issues6731,446 1,516 1 1 Disposals and settlements(433)(4)(1,456) (1,893) (5) (5) Transfers into or out of non-market observables(75)--(75) - - Foreign currency translation impacts2-19 21 - - Balance as at 30 September 201833015619 964 6 6 Unrealised gains/(losses) recognised in the income statement for financial instrument held as at 30 September 2018(7)4-(3) (2) (2)

2018 Full Year financial results Notes to the consolidated financial statements Note 13. Fair values of financial assets and financial liabilities (continued) Financial instruments not measured at fair value The following table summarises the estimated fair value of financial instruments not measured at fair value for the Group: Amount Value Amount Value A detailed description of how fair value is derived for financial instruments not measured at fair value is disclosed in Note 23 of the Group’s annual financial statements for the year ended 30 September 2018. 1 The estimated fair value of debt issues includes the impact of changes in Westpac’s credit spreads since origination. Westpac Group 2018 Full Year Financial Results Announcement | 107 As at 30 Sept 2018 As at 31 March 2018As at 30 Sept 2017 $m CarryingFair CarryingFair CarryingFair AmountValue Financial assets not measured at fair value Cash and balances with central banks Receivables due from other financial institutions Loans Regulatory deposits with central banks overseas Other financial assets Total financial assets not measured at fair value Financial liabilities not measured at fair value Payables due to other financial institutions Deposits and other borrowings Debt issues1 Loan capital Other financial liabilities Total financial liabilities not measured at fair value 26,43126,431 5,7905,790 706,440706,742 357357 4,5144,514 21,58021,58018,39718,397 3,9773,9777,1287,128 697,604697,905680,332680,568 352352389389 5,8935,8934,7544,754 743,532743,834 729,406729,707711,000711,236 --18,13718,137 518,107518,791 169,241170,060 17,26517,438 7,8557,855 19,07319,07321,90721,907 502,399503,095487,022487,723 170,107171,221163,683165,151 18,33318,57117,66618,087 8,5898,5897,4907,490 730,605732,281 718,501720,549697,768700,358

2018 Full Year financial results Notes to the consolidated financial statements Note 14. Contingent liabilities, contingent assets and credit commitments Undrawn credit commitments The Group enters into various arrangements with customers which are only recognised in the balance sheet when called upon. These arrangements include commitments to extend credit, bill endorsements, financial guarantees, standby letters of credit and underwriting facilities. They expose the Group to liquidity risk when called upon and also to credit risk if the customer fails to repay the amounts owed at the due date. The maximum exposure to credit loss is the contractual or notional amount of the instruments disclosed below. Some of the arrangements can be cancelled by the Group at any time and a significant portion is expected to expire without being drawn. The actual required liquidity and credit risk exposure is therefore less than the amounts disclosed. The Group uses the same credit policies when entering into these arrangements as it does for on-balance sheet instruments. Refer to Note 22 of the Group’s annual financial statements for the year ended 30 September 2018 for further details of liquidity risk and credit risk management. Undrawn credit commitments excluding derivatives at 30 September are as follows: 15,306 176,258 249 15,460 178,443 648 2 (1) (38) 1 (2) (76) Contingent assets The credit commitments shown in the table above also constitute contingent assets. These commitments would be classified as loans in the balance sheet on the contingent event occurring. Contingent liabilities Contingent liabilities are possible obligations whose existence will be confirmed only by uncertain future events and present obligations where the transfer of economic resources is not probable or cannot be reliably measured. Contingent liabilities are not recognised on the balance sheet but are disclosed unless the outflow of economic resources is remote. The Royal Commission and regulatory action Globally, regulators and other bodies continue to progress various reviews involving the financial services sector. The nature of these reviews can be wide ranging and, in Australia, currently include investigations into potential misconduct in credit and financial services. For example, the Royal Commission into Misconduct in the Banking, Superannuation and Financial Services Industry (the Royal Commission) is currently investigating conduct, practices, behaviour or business activities by financial services entities including the Group that may amount to potential misconduct or that may fall below community standards and expectations. The Royal Commission may make findings that the Group (including persons or entities acting on its behalf) has engaged in misconduct including breaches of law or conduct that falls below community standards and expectations. 1 Letters of credit are undertakings to pay, against presentation documents, and obligation in the event of a default by a customer. Guarantees are unconditional undertakings given to support the obligations of a customer to third parties. The Group may hold cash as collateral for certain guarantees issued. 2 Commitments to extend credit include all obligations on the part of the Group to provide credit facilities. As facilities may expire without being drawn upon, the notional amounts do not necessarily reflect future cash requirements. In addition to the commitments disclosed above, at 30 September 2018 the Group had offered $5.7 billion (31 March 2018: $4.6 billion, 30 September 2017 $5.5 billion) of facilities to customers, which had not yet been accepted. 108 | Westpac Group 2018 Full Year Financial Results Announcement 2018 $m Up toOver 1 toOver 3 toOver 1 Year3 Years5 Years5 YearsTotal Letters of credit and guarantees Commitments to extend credit Other Total undrawn credit commitments 8,9832,7178902,99515,585 50,29249,32014,63760,409174,658 -742555154 59,27552,11115,55263,459190,397 $m As at As atAs at% Mov't% Mov't 31 Mar30 SeptSept 18 -Sept 18 - 20182017Mar 18Sept 17 30 Sept 2018 Undrawn credit commitments Letters of credit and guarantees1 15,585 Commitments to extend credit2 174,658 Other 154 Total undrawn credit commitments 190,397 191,813194,551(1)(2)

2018 Full Year financial results Notes to the consolidated financial statements Note 14. Contingent liabilities, contingent assets and credit commitments (continued) Any findings made by the Royal Commission as it progresses, may result in litigation (including class action proceedings against the Group), fines, penalties, revocation, suspension or variation of conditions of relevant regulatory licences or other enforcement or administrative action being taken by regulators or other parties. Regulators such as ASIC, APRA, ACCC, AUSTRAC and the ATO are also currently conducting reviews and inquiries (some of which are industry-wide) that currently involve or may involve the Group in the future. These reviews are separately considering a range of matters, including matters such as consumer credit insurance, responsible lending (including in the context of reverse mortgages and interest only lending), anti-money laundering and counter-terrorism financing processes and procedures (including in relation to customer on-boarding and ongoing customer due diligence), financial adviser conduct (including compliance with the obligation to act in the client’s best interests), life insurance claims handling, and the pricing of residential mortgages. The Group has recently self-reported to AUSTRAC a failure to report a large number of International Funds Transfer Instructions (IFTIs) (as required under Australia’s AML/CTF Act) in relation to one WIB product. These IFTIs relate to batch instructions received from 2009 until recently from a small number of correspondent banks for payments made predominantly to beneficiaries in Australia in Australian dollars. Through the product, Westpac facilitates payments on behalf of clients of certain of its correspondent banks. The majority of the payments are low value and made by Government pension funds and corporates. The Group is investigating and working with AUSTRAC to remediate the failure to report IFTIs. No provision has been raised for this matter including in relation to any potential regulatory action. Westpac has received various notices and requests for information from the Royal Commission, as well as from regulators as part of both industry-wide and Westpac-specific reviews and inquiries. These reviews and inquiries, which may be conducted by a regulator, and in some cases also an external third party assurance provider retained either by the regulator or by the Group (including where a matter has been self-identified by the Group), may result in litigation (including class action proceedings against the Group), fines, penalties, revocation, suspension or variation of conditions of relevant regulatory licences or other enforcement or administrative action being taken by regulators or other parties. An assessment of the likely cost to the Group of these reviews and actions has been made on a case-by-case basis for the purpose of the financial statements but cannot always be reliably estimated. Where appropriate, specific provisions have been made (refer to Note 28 of the financial statements contained within the 2018 Westpac Group Annual Report). Litigation There are ongoing court proceedings, claims and possible claims for and against the Group. Contingent liabilities exist in respect of actual and potential claims and proceedings, including those listed below. An assessment of the Group's likely loss has been made on a case-by-case basis for the purpose of the financial statements but cannot always be reliably estimated. Where appropriate, specific provisions have been made. (refer to Note 28 of the financial statements contained within the 2018 Westpac Group Annual Report). Following ASIC's investigations into the interbank short-term money market and its impact on the setting of the bank bill swap reference rate (BBSW), on 5 April 2016, ASIC commenced civil proceedings against Westpac in the Federal Court of Australia, alleging certain misconduct, including market manipulation and unconscionable conduct. The conduct that was the subject of the proceedings was alleged to have occurred between 6 April 2010 and 6 June 2012. ASIC sought declarations from the court that Westpac breached various provisions of the Corporations Act 2001 (Cth) and the Australian Securities and Investments Commission Act 2001 (Cth), pecuniary penalties of unspecified amounts and orders requiring Westpac to implement a comprehensive compliance program for persons involved in Westpac's trading in the relevant market. The proceedings were heard in late 2017. On 24 May 2018, Justice Beach found that Westpac had not engaged in market manipulation or misleading or deceptive conduct under the Corporations Act 2001 (Cth). His Honour also found that there was no 'trading practice' of manipulating the BBSW rate. However, the Court found that Westpac engaged in unconscionable conduct on 4 occasions and that Westpac breached its supervisory duty. Costs and penalties will be determined in the coming months. While we have provided for our best estimate of these amounts, there remains a risk that the final outcome may differ from this estimate; In August 2016, a class action was filed in the United States District Court for the Southern District of New York against Westpac and a large number of Australian and international banks alleging misconduct in relation to BBSW. Those proceedings are at a very early stage and the level of damages sought has not been specified. Westpac is defending these proceedings. No provision has been recognised in relation to this matter; Westpac Group 2018 Full Year Financial Results Announcement | 109

2018 Full Year financial results Notes to the consolidated financial statements Note 14. Contingent liabilities, contingent assets and credit commitments (continued) On 1 March 2017, ASIC commenced litigation in relation to certain Westpac home loans (including certain interest only loans) alleging contraventions of the National Consumer Credit Protection Act 2009 (Cth). On 4 September 2018, Westpac and ASIC agreed to settle the proceedings on the basis of a proposed $35 million penalty and declarations that Westpac contravened the National Consumer Credit Protection Act 2009 (Cth). The proposed settlement is subject to Court approval. A hearing on the proposed settlement was held on 24 October 2018 and judgement is reserved. While we have provided for our best estimate of these amounts, there remains a risk that the final outcome may differ from this estimate; and On 22 December 2016, ASIC commenced Federal Court proceedings against BT Funds Management Limited and Westpac Securities Administration Limited in relation to a number of superannuation account consolidation campaigns conducted between 2013 and 2016. ASIC has alleged that in the course of some of these campaigns, customers were provided with personal advice in contravention of a number of Corporations Act 2001 (Cth) provisions. ASIC has selected 15 specific customers as the focus of their claim. The proceedings were heard in February 2018. Judgment is pending. No provision has been recognised in relation to this matter. On 12 October 2017, a class action against Westpac and Westpac Life Insurance Services Limited (WLIS) was filed in the Federal Court of Australia. The class action was filed on behalf of customers who, since October 2011, obtained insurance issued by WLIS on the recommendation of certain financial advisers employed within the Westpac Group. The plaintiffs have alleged that aspects of the financial advice provided by those advisers breached fiduciary and statutory duties owed to the advisers' clients, including the duty to act in the best interests of the client and that WLIS was knowingly involved in those alleged breaches. Westpac and WLIS are defending the proceedings. These proceedings are currently stayed by order of the Court, pending the outcome of an appeal concerning a procedural issue unrelated to the substantive claims made in the class action. No provision has been recognised in relation to this matter. Internal reviews and remediation Westpac is currently undertaking a number of reviews to identify and resolve prior issues that have the potential to impact our customers and reputation. These reviews have identified, and may continue to identify, issues in respect of which we are, or will be, taking steps to put things right (including in relation to areas of industry focus such as compliance with responsible lending obligations and the way some product terms and conditions are operationalised) so that our customers are not at a disadvantage from certain past practices. By undertaking these reviews we can also improve our processes (including in relation to responsible lending controls and financial planning controls). An assessment of the Group’s likely loss has been made on a case-by-case basis for the purpose of the financial statements but cannot always be reliably estimated. Where appropriate, specific provisions have been made (refer to Note 28 of the financial statements contained within the 2018 Westpac Group Annual Report). Contingent liabilities may exist in respect of actual or potential claims, compensation payments and/or refunds identified as part of these reviews (including in relation to the reviews described below). One of the reviews relates to ongoing advice services provided from 2008 by approximately 1,660 planners operating in aligned dealer groups who were at the time authorised representatives of the Group’s wholly owned subsidiaries Securitor Financial Group (Securitor) and Magnitude Group Pty Ltd (Magnitude). Securitor and Magnitude, as the AFSL licensees, retained a portion of the ongoing advice fees paid to those dealer groups by clients since 2008. Westpac is in the early stages of engaging each authorised representative to determine the agreements in place between those representatives and their clients, and the services provided. Given the early stage of the review, the time period under consideration and availability of records in relation to the relevant period, it is not practicable to provide an estimate of any potential remediation costs for circumstances where a client has paid ongoing service fees but those services have not been provided. No provision has been recognised in relation to this matter. Following an error in the Group’s systems, certain customers with an interest only home loan did not have their loans automatically switched to principal and interest repayments at the end of the contracted interest only period. The Group is undertaking a program of work to remediate this issue for affected customers and is engaging with ASIC on potential remediation options. While we have provided for our best estimate of these amounts, there remains a risk that the final outcome may exceed this estimate. Financial Claims Scheme Under the Financial Claims Scheme (FCS) the Australian Government provides depositors a free guarantee of deposits in eligible ADIs up to and including $250,000. The FCS applies to an eligible ADI if APRA has applied for the winding up of the ADI and the responsible Australian Government minister has declared that the FCS applies to the ADI. The Financial Claims Scheme (ADIs) Levy Act 2008 provides for the imposition of a levy to fund the excess of certain APRA FCS costs connected to an ADI. The levy would be imposed on liabilities of eligible ADIs to their depositors and cannot be more than 0.5% of the amount of those liabilities. 110 | Westpac Group 2018 Full Year Financial Results Announcement

2018 Full Year financial results Notes to the consolidated financial statements Note 14. Contingent liabilities, contingent assets and credit commitments (continued) Contingent tax risk Tax and regulatory authorities are reviewing the taxation treatment of certain transactions (including both historical and present-day transactions) undertaken by the Group in the course of normal business activities and the claiming of tax incentives (including research and development tax incentives) and GST. The Group also responds to various notices and requests for information it receives from tax and regulatory authorities. Risk reviews and audits are also being undertaken by revenue authorities in other jurisdictions, as part of normal revenue authority activity in those countries. These reviews, notices and requests may result in additional tax liabilities (including interest and penalties). The Group has assessed these and other taxation claims arising in Australia and elsewhere, including seeking independent advice, and holds provisions. Settlement risk The Group is subject to a credit risk exposure in the event that another counterparty fails to settle for its payments clearing activities (including foreign exchange). The Group seeks to minimise credit risk arising from settlement risk in the payments system by aligning our processing method with the legal certainty of settlement in the relevant clearing mechanism. Parent Entity guarantees and undertakings The Parent Entity makes the following guarantees and undertakings to subsidiaries: letters of comfort for certain subsidiaries which recognise that Westpac has a responsibility that those subsidiaries continue to meet their obligations; and guarantees to certain wholly owned subsidiaries which are Australian financial services or credit licensees to comply with legislative requirements. Each guarantee is capped at $40 million per year and can only be utilised if the entity concerned becomes legally obliged to pay for a claim under the relevant licence. The Parent Entity has a right to recover any funds payable under the guarantees from the relevant subsidiary. Westpac Group 2018 Full Year Financial Results Announcement | 111

2018 Full Year financial results Notes to the consolidated financial statements Note 15. Shareholders’ equity Ordinary Shares Westpac does not have authorised capital and the ordinary shares have no par value. Ordinary shares entitle the holder to participate in dividends and, in the event of Westpac winding up, to a share of the proceeds in proportion to the number of and amounts paid on the shares held. Each ordinary share entitles the holder to one vote, either in person or by proxy, at a shareholder meeting. Reconciliation of movement in number of ordinary shares Consolidated Ordinary shares purchased and sold on market 1 30 September 2018: 3,943,660 unvested shares held (31 March 2018: 3,991,446, 30 September 2017: 3,549,035). 2 30 September 2018: 2,029,795 shares held (31 March 2018: 4,652,579, 30 September 2017: 4,652,579). 3 The price per share for the issuance of shares in relation to the dividend re-investment plan for the 2018 interim dividend was $28.11, 2017 final dividend was $31.62 and 2017 interim dividend was $29.79. 4 The conversion price per share for the issuance of shares in relation to the conversion of Westpac Convertible Preference Shares was $29.49. 5 Ordinary shares allocated to employees under the RSP are classified as treasury shares until the shares vest. 6 No WPP options were exercised during the period. The average exercise price per share received was $24.23 on the exercise of the LTI options. 7 Treasury shares include ordinary shares held by statutory life funds and managed investment schemes and ordinary shares held by Westpac for equity derivatives sold to customers. 8 The purchase of ordinary shares on market resulted in a tax benefit of $0.22 million being recognised as contributed equity. 112 | Westpac Group 2018 Full Year Financial Results Announcement Consolidated Full Year SeptFull Year Sept 20182018 NumberAverage Price ($) For share-based payment arrangements: Employee share plan (ESP) RSP5 Westpac Performance Plan (WPP) - share rights exercised Westpac Long Term Incentive Plan (LTIP) - options exercised6 LTIP - share rights exercised As treasury shares: Treasury shares purchased (excluding RSP)7 Treasury shares purchased Net number of ordinary shares purchased/(sold) on market8 854,26731.86 2,291,89731.32 156,69131.49 103,68628.80 2,92928.42 93,05228.97 (2,715,836)28.10 786,686 As at 30 Sept 2018 As atAs at 31 March 201830 Sept 2017 Opening balance Dividend reinvestment plan3 Conversion of Westpac Convertible Preference Shares4 Issued shares for the period Closing balance 3,404,172,038 11,434,908 19,189,765 3,394,364,2793,356,614,808 9,807,75937,749,471 --30,624,673 9,807,75937,749,471 3,434,796,711 3,404,172,0383,394,364,279 $m As at As atAs at 31 March30 Sept 20182017 30 Sept 2018 Share capital Ordinary share capital, fully paid Treasury shares held for RSP1 Other treasury shares held2 Total treasury shares held Total share capital Non-controlling interests 36,054 (505) 12 35,16834,889 (504)(434) (61)(61) (493) (565)(495) 35,561 34,60334,394 52 5054

2018 Full Year financial results Notes to the consolidated financial statements Note 15. Shareholders’ equity (continued) Reconciliation of movement in reserves 1 Half year March 2018 restated. Westpac Group 2018 Full Year Financial Results Announcement | 113 $m As at As atAs at 31 March30 Sept 20182017 30 Sept 2018 Available-for-sale securities reserve Opening balance Net gains/(losses) from changes in fair value Income tax effect Transferred to income statements Income tax effect Exchange differences Closing balance Share-based payment reserve Opening balance Share-based payment expense Closing balance Cash flow hedge reserve Opening balance Net gains/(losses) from changes in fair value Income tax effect Transferred to income statements Income tax effect Closing balance Foreign currency translation reserve Opening balance Exchange differences on translation of foreign operations (net of associated hedges)1 Transferred to income statements1 Closing balance Other reserves Opening balance Transactions with owners Closing balance Total reserves 35 (71) 24 75 (28) 2 64131 (33) (93) 1027 (9) (2) 31 --37 3564 1,500 34 1,4311,398 6933 1,534 1,5001,431 (134) (96) 28 109 (32) (154)(201) (65)(20) 196 94 86 (28)(25) (125) (134)(154) (494) 143 - (529)(451) 38(78) (3)-(351) (494)(529) (17) (1) (18)(18) 1-(18) (17)(18) 1,077 890794

2018 Full Year financial results Notes to the consolidated financial statements Note 16. Notes to the consolidated cash flow statement 7,997 1 1,269 1,021 (34) (75) 148 219 (419) (10) (13) 182 11 63 32 large 10,126 7 (5,042) large 219 large (5,054) (26,815) 2,653 308 200 large (8) (37) large (20) (681) 23,062 3,859 (15) large 4 large large Non-cash financing activities - - On 13 March 2018, 6,233,643 Westpac CPS were converted to Westpac Capital Notes 5 for a total value of $623 million. On 3 April 2018, the remaining $566 million of Westpac CPS were transferred to the Westpac CPS nominated party for $100 each. Following the transfer, those remaining Westpac CPS were converted into 19,189,765 ordinary shares Businesses disposed in Full Year 2018 Westpac sold its interest in a number of Hastings offshore subsidiaries to Northill Capital. Completion of the sale of the US and UK entities occurred on 28 February 2018 and completion of the Singapore entity occurred on 23 March 2018, with a total loss of $9 million recognised in non-interest income. The total cash consideration received, net of transaction costs and cash held, was $9 million. Refer to Section 6.5 changes in control of Group entities for details. 1 Comparatives have been revised for consistency. 114 | Westpac Group 2018 Full Year Financial Results Announcement $m % Mov't Half Year Sept 18 - March 18 Mar 18 % Mov't Full YearSept 18 - Sept 17Sept 17 Half Year Full Year Sept 18 Sept 18 Shares issued under the dividend reinvestment plan 321 3104 631 1,452(57) Shares issued from the conversion of Westpac CPS 566 --566 $m % Mov't Half Year Sept 18 - March 18 Mar 18 % Mov't Full YearSept 18 - Sept 17Sept 17 Half Year Full Year Sept 18 Sept 18 Reconciliation of net cash provided by/(used in) operating activities to net profit for the period Net profit for the period 3,899 4,200(7) 8,099 Adjustments: Depreciation, amortisation and impairment 594 5508 1,144 Impairment charges 396 493(20) 889 Net (decrease)/increase in current and deferred tax (87) (9)large (96) (Increase)/decrease in accrued interest receivable 13 (96)large (83) (Decrease)/increase in accrued interest payable 225 16large 241 (Decrease)/increase in provisions1 512 (223)large 289 Other non-cash items1 87 245(64) 332 Cash flows from operating activities before changes in operating assets and liabilities 5,639 5,1769 10,815 Net (increase)/decrease in derivative financial instruments 9,684 (1,100)large 8,584 Net (increase)/decrease in life insurance assets and liabilities (142) (88)61 (230) (Increase)/decrease in other operating assets: Trading securities and financial assets designated at fair value (1,155) 4,982large 3,827 Loans (9,976) (14,764)(32) (24,740) Receivables due from other financial institutions (1,567) 3,245large 1,678 Regulatory deposits with central banks overseas (53) (250)(79) (303) Other assets 286 (126)large 160 (Decrease)/increase in other operating liabilities: Other financial liabilities at fair value through income statement (1,283) 1,526large 243 Deposits and other borrowings 11,920 12,008(1) 23,928 Payables due to other financial institutions (1,107) (2,965)(63) (4,072) Other liabilities (136) 48large (88) Net cash provided by/(used in) operating activities 12,110 7,69257 19,802 2,820large
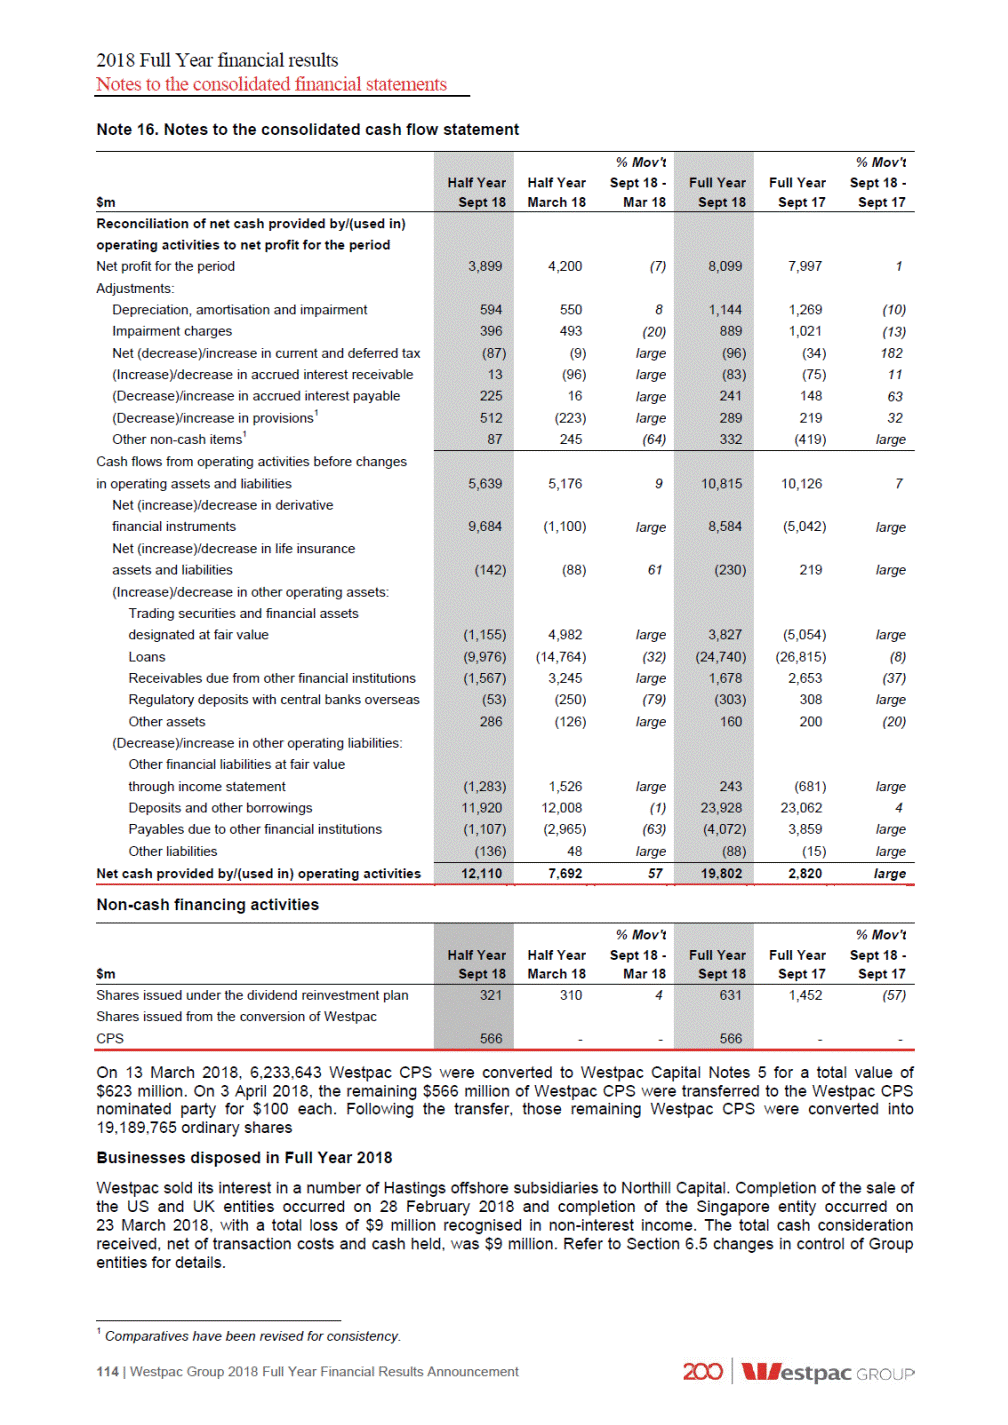
2018 Full Year financial results Notes to the consolidated financial statements Restricted cash The amount of cash and cash equivalents not available for use at 30 September 2018 was nil (31 March 2018: $40 million, 30 September 2017: $38 million) for the Group. Note 17. Subsequent events No other matters have arisen since the year ended 30 September 2018 which is not otherwise dealt with in this Full Year financial results, that has significantly affected or may significantly affect the operations of the Group, the results of its operations or the state of affairs of the Group in subsequent periods. Westpac Group 2018 Full Year Financial Results Announcement | 115

2018 Full Year financial results Statutory statements 4.8 Statement in relation to the audit of the financial statements. PricewaterhouseCoopers has audited the financial statements contained within the Westpac 2018 financial report and has issued an unmodified audit report. A copy of their report is available with the Annual financial report. This full year results announcement has not been subject to audit by PricewaterhouseCoopers. The preceding financial information contained in Section 4 “Full Year 2018 reported financial information” includes financial information extracted from the audited financial statements together with financial information that has not been audited. Dated at Sydney this 5th day of November 2018 for and on behalf of the Board. Tim Hartin Company Secretary 116 | Westpac Group 2018 Full Year Financial Results Announcement

2018 Full Year financial results Cash earnings financial information Note 1 Interest spread and margin analysis (cash earnings basis) 118 Note 2 Average balance sheet and interest rates (cash earnings basis) 119 Note 3 Net interest income (cash earnings basis) 121 Note 4 Non-interest income (cash earnings basis) 122 Note 5 Operating expense analysis (cash earnings basis) 123 Note 6 Deferred expenses 123 Note 7 Earnings per share (cash earnings basis) 124 125 Note 8 Group earnings reconciliation Note 9 Divisional result and economic profit 129 Westpac Group 2018 Full Year Financial Results Announcement | 117 5.0 Cash earnings financial information

2018 Full Year financial results Cash earnings financial information Note 1. Interest spread and margin analysis (cash earnings basis) 752,294 15,704 1.91% 0.18% 2.09% 330,114 142,773 17,563 83,558 80,502 97,784 7,638 3,885 511 1,328 1,629 713 2.31% 2.72% 2.91% 1.59% 2.03% 0.73% 1 Includes capital benefit. Capital benefit represents the notional revenue earned on capital allocated to divisions under Westpac’s economic capital framework. 118 | Westpac Group 2018 Full Year Financial Results Announcement Half Year Half Year March 18 Full Year Full Year Sept 17 Sept 18 Sept 18 Group Average interest-earning assets ($m) 782,834 767,011 774,944 Net interest income ($m) 8,038 8,301 16,339 Interest spread 1.87% 2.00% 1.94% Benefit of net non-interest bearing assets, liabilities and equity 0.18% 0.17% 0.17% Net interest margin 2.05% 2.17% 2.11% Analysis by division Average interest-earning assets ($m) Consumer Bank 349,776 341,604 345,701 Business Bank 147,765 145,822 146,796 BT Financial Group 18,931 18,371 18,652 Westpac Institutional Bank 86,013 85,911 85,962 Westpac New Zealand (A$) Group Businesses 81,038 78,774 96,529 79,909 99,311 97,924 Group total 782,834 767,011 774,944 752,294 Westpac New Zealand (NZ$) Net interest income ($m)1 Consumer Bank Business Bank BT Financial Group Westpac Institutional Bank Westpac New Zealand (A$) Group Businesses 87,858 86,039 4,040 2,021 285 675 843 437 86,951 85,818 3,708 7,748 2,044 4,065 293 578 741 1,416 877 1,720 375 812 Group total 8,038 8,301 16,339 15,704 Westpac New Zealand (NZ$) Interest margin Consumer Bank Business Bank BT Financial Group Westpac Institutional Bank Westpac New Zealand (NZ$) Group Businesses 950 922 2.37% 2.78% 3.11% 1.58% 2.15% 0.91% 1,872 1,738 2.11% 2.24% 2.76% 2.77% 3.09% 3.10% 1.72% 1.65% 2.16% 2.15% 0.75% 0.83% Group total 2.05% 2.17% 2.11% 2.09%
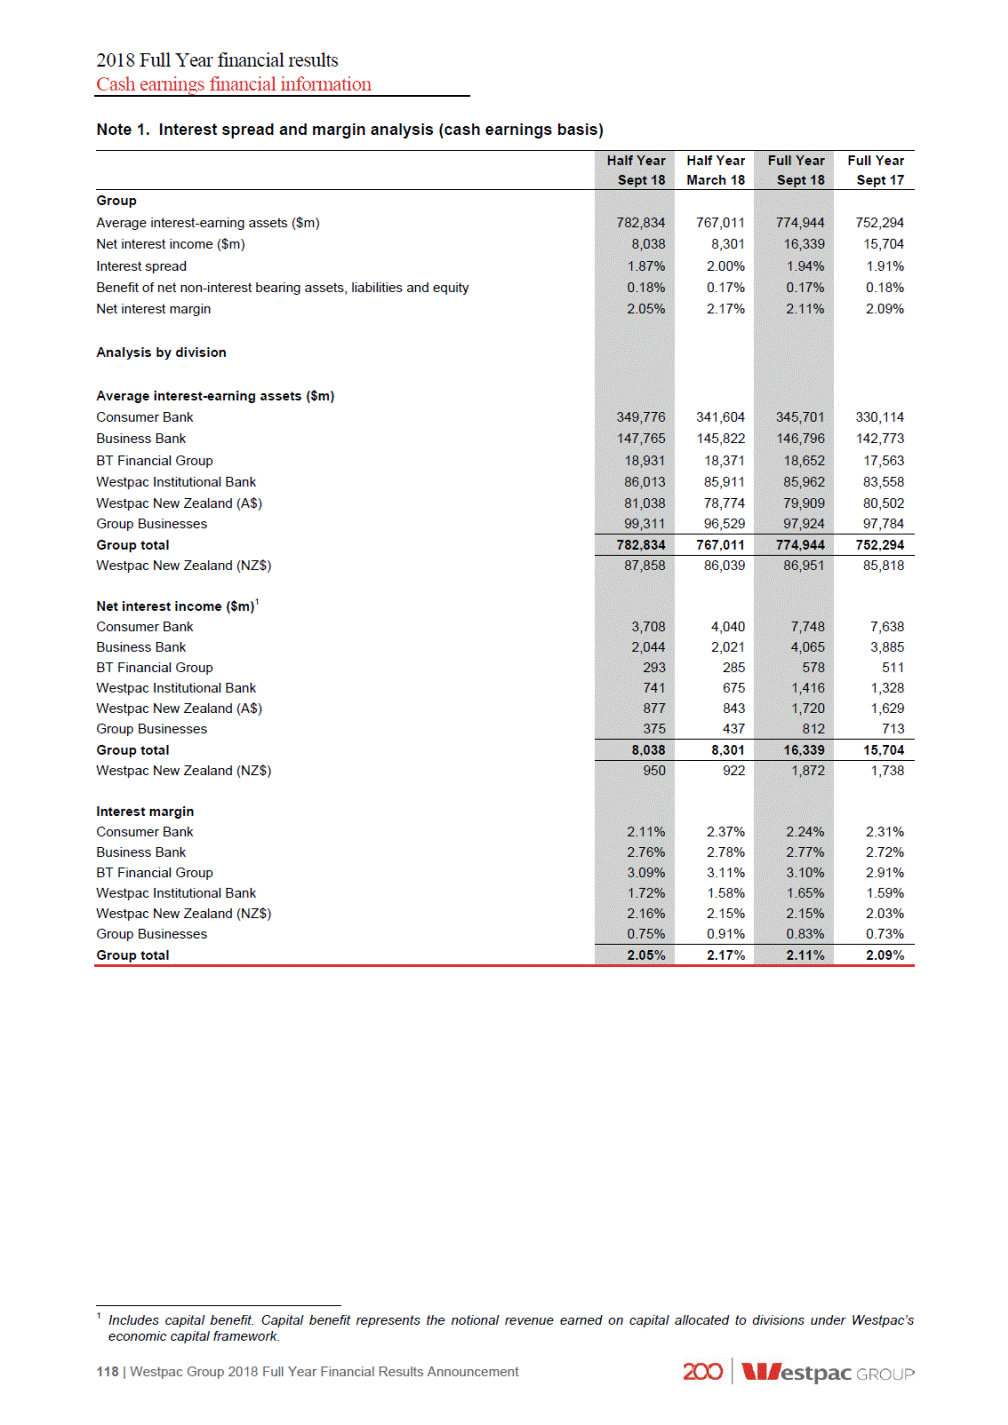
2018 Full Year financial results Cash earnings financial information Note 2. Average balance sheet and interest rates (cash earnings basis) 5,934 23,860 61,023 958 675,236 49 275 930 9 14,840 1.7 2.3 3.1 1.9 4.4 767,011 16,103 4.2 2,459 34,130 10,753 61,643 19,571 494,871 17,935 176,399 153 4,368 376 2,905 1.6 1.8 4.2 3.3 708,776 7,802 2.2 47,978 36,916 9,013 12,248 14 574,357 72,807 28,072 12,779 1,736 325 4.5 4.8 2.3 419,786 50,272 24,813 3,580 577 211 1.7 2.3 1.7 1 Loans and other receivables are stated net of provisions for impairment charges on loans. Other receivables include cash and balances held with central banks and other interest earning assets. 2 Includes property and equipment, intangibles, deferred tax, non-interest bearing loans relating to mortgage offset accounts and other assets. 3 Includes net impact of Treasury balance sheet management activities and the Bank Levy. 4 Includes other liabilities, provisions, current and deferred tax liabilities. Westpac Group 2018 Full Year Financial Results Announcement | 119 Half Year Half Year 31 March 2018 30 September 2018 AverageInterestAverage AverageInterestAverage balanceRate $m$m% balanceRate $m$m% Assets Interest earning assets Receivables due from other financial institutions 5,198592.3 Trading securities and other financial assets designated at fair value 22,6312672.4 Available-for-sale securities 62,0549843.2 Regulatory deposits with central banks overseas 1,122142.5 Loans and other receivables1 691,82915,1624.4 Total interest earning assets and interest income 782,83416,4864.2 Non-interest earning assets Cash, receivables due from other financial institutions and regulatory deposits 2,293 Derivative financial instruments 35,271 Life insurance assets 10,575 All other assets2 62,232 Total non-interest earning assets 110,371 108,985 Total assets 893,205 875,996 Liabilities Interest bearing liabilities Payables due to other financial institutions 18,9871661.7 Deposits and other borrowings 505,0474,6531.8 Loan capital 18,0593984.4 Other interest bearing liabilities3 180,1123,2313.6 Total interest bearing liabilities and interest expense 722,2058,4482.3 Non-interest bearing liabilities Deposits and payables due to other financial institutions 48,999 Derivative financial instruments 38,089 Life insurance policy liabilities 8,736 All other liabilities4 12,150 Total non-interest bearing liabilities 107,974 106,155 Total liabilities 830,179 814,931 Shareholders' equity 62,978 61,051 Non-controlling interests 48 Total equity 63,026 61,065 Total liabilities and equity 893,205 875,996 Loans and other receivables1 Australia 585,11212,9534.4 New Zealand 74,7961,7744.7 Other overseas 31,9214352.7 Deposits and other borrowings Australia 424,2143,7281.8 New Zealand 52,4586192.4 Other overseas 28,3753062.2

2018 Full Year financial results Cash earnings financial information Note 2. Average balance sheet and interest rates (cash earnings basis) 9,123 25,870 58,208 1,035 658,058 110 558 1,795 17 28,774 1.2 2.2 3.1 1.6 4.4 752,294 31,254 4.2 2,000 37,673 12,447 60,111 18,833 484,713 17,208 174,170 279 8,868 693 5,710 1.5 1.8 4.0 3.3 694,924 15,550 2.2 46,099 42,780 10,560 11,586 20 557,865 72,938 27,255 24,783 3,470 521 4.4 4.8 1.9 409,586 51,042 24,085 7,344 1,173 351 1.8 2.3 1.5 1 Loans and other receivables are stated net of provisions for impairment charges on loans. Other receivables include cash and balances held with central banks and other interest earning assets. 2 Includes property and equipment, intangibles, deferred tax, non-interest bearing loans relating to mortgage offset accounts and other assets. 3 Includes net impact of Treasury balance sheet management activities and the Bank Levy. 4 Includes other liabilities, provisions, current and deferred tax liabilities. 120 | Westpac Group 2018 Full Year Financial Results Announcement Full Year Full Year 30 September 2017 30 September 2018 AverageInterestAverage AverageInterestAverage balanceRate $m$m% balanceRate $m$m% Assets Interest earning assets Receivables due from other financial institutions 5,5651081.9 Trading securities and other financial assets designated at fair value 23,2445422.3 Available-for-sale securities 61,5401,9143.1 Regulatory deposits with central banks overseas 1,040232.2 Loans and other receivables1 683,55530,0024.4 Total interest earning assets and interest income 774,94432,5894.2 Non-interest earning assets Cash, receivables due from other financial institutions and regulatory deposits 2,376 Derivative financial instruments 34,702 Life insurance assets 10,664 All other assets2 61,938 Total non-interest earning assets 109,680 112,231 Total assets 884,624 864,525 Liabilities Interest bearing liabilities Payables due to other financial institutions 19,2783191.7 Deposits and other borrowings 499,9739,0211.8 Loan capital 17,9977744.3 Other interest bearing liabilities3 178,2616,1363.4 Total interest bearing liabilities and interest expense 715,50916,2502.3 Non-interest bearing liabilities Deposits and payables due to other financial institutions 48,490 Derivative financial instruments 37,504 Life insurance policy liabilities 8,874 All other liabilities4 12,199 Total non-interest bearing liabilities 107,067 111,025 Total liabilities 822,576 805,949 Shareholders' equity 62,017 58,556 Non-controlling interests 31 Total equity 62,048 58,576 Total liabilities and equity 884,624 864,525 Loans and other receivables1 Australia 579,74925,7324.4 New Zealand 73,8043,5104.8 Other overseas 30,0027602.5 Deposits and other borrowings Australia 422,0067,3081.7 New Zealand 51,3681,1962.3 Other overseas 26,5995171.9
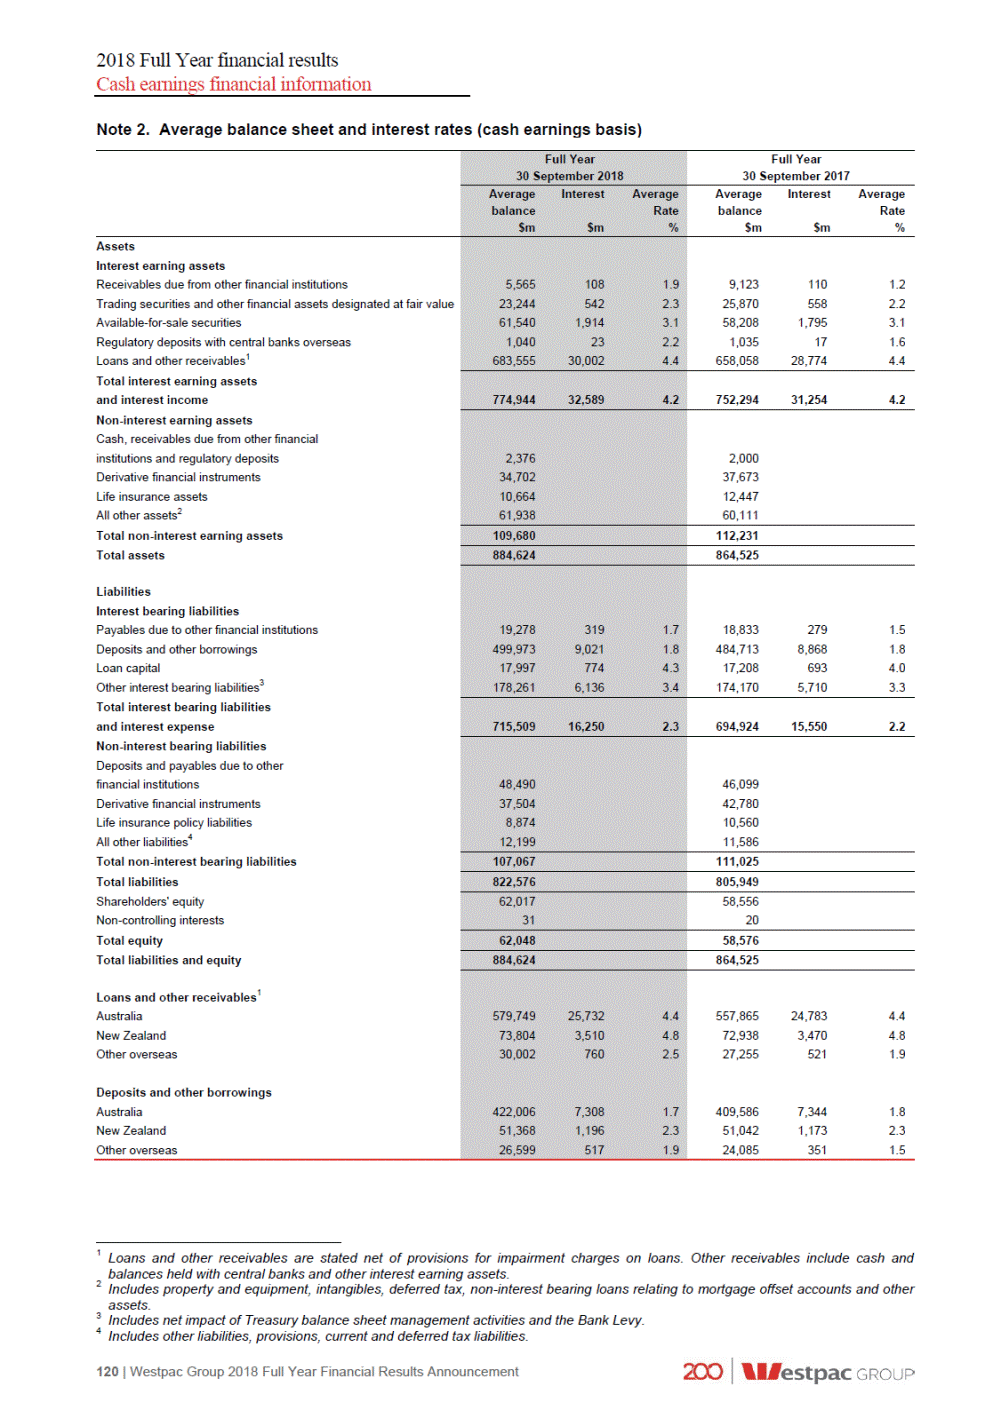
2018 Full Year financial results Cash earnings financial information Note 3. Net interest income (cash earnings basis) 241 110 - 35 (2) - 558 1,795 28,504 17 29 (3) 7 4 35 93 (279) (8,868) (1,898) (3,585) (693) (95) (132) 14 2 (40) 25 12 large 2 Westpac Group 2018 Full Year Financial Results Announcement | 121 $m % Mov't Half Year Sept 18 - March 18 Mar 18 % Mov't Full YearSept 18 - Sept 17Sept 17 Half Year Full Year Sept 18 Sept 18 Interest income Cash and balances with central banks 185 14032 325 Receivables due from other financial institutions 59 4920 108 Net ineffectiveness of qualifying hedges - --- Trading securities and financial assets designated at fair value 267 275(3) 542 Available-for-sale securities 984 9306 1,914 Loans 14,943 14,6782 29,621 Regulatory deposits with central banks overseas 14 956 23 Other interest income 34 2255 56 Total interest income 16,486 16,1032 32,589 31,2544 Interest expense Payables due to other financial institutions (166) (153)8 (319) Deposits and other borrowings (4,653) (4,368)7 (9,021) Trading liabilities (579) (564)3 (1,143) Debt issues (2,392) (2,088)15 (4,480) Loan capital (398) (376)6 (774) Bank levy (192) (186)3 (378) Other interest expense (68) (67)1 (135) Total interest expense (8,448) (7,802)8 (16,250) (15,550)5 Total net interest income 8,038 8,301(3) 16,339 15,7044

2018 Full Year financial results Cash earnings financial information Note 4. Non-interest income (cash earnings basis) 1,333 1,193 229 1 (7) (57) 1,600 11 210 12 2 - 6 - 50 - large - (30) large 11 - 32 30 19 large - (19) large (21) Wealth management and insurance income reconciliation (147) large 148 93 (28) 1 128 (100) 1 Net gain/(loss) on derivatives held for risk management purposes reflects the impact of economic hedges of foreign currency capital and earnings. 122 | Westpac Group 2018 Full Year Financial Results Announcement $m % Mov't Half Year Sept 18 - Mar 18Mar 18 % Mov't Full Year Sept 18 - Sept 17Sept 17 Half Year Full Year Sept 18 Sept 18 BTFG non-interest income 750 898(16) 1,648 1,744(6) Net commission, premium, fee and banking income 86 (78)large 8 BTFG wealth management and insurance income 836 8202 1,656 1,5974 NZ wealth management and insurance income 72 77(6) 149 WIB wealth management income 180 32large 212 CB and BB wealth management and insurance income - --- Total wealth management and insurance income 1,088 92917 2,017 1,81011 $m % Mov't Half Year Sept 18 - March 18 Mar 18 % Mov't Full YearSept 18 - Sept 17Sept 17 Half Year Full Year Sept 18 Sept 18 Fees and commissions Facility fees 668 679(2) 1,347 Transaction fees and commissions 552 553-1,105 Other non-risk fee income (18) 116large 98 Total fees and commissions 1,202 1,348(11) 2,550 2,755(7) Wealth management and insurance income Life insurance and funds management net operating income 958 82316 1,781 General insurance and lenders mortgage insurance net operating income 130 10623 236 Total wealth management and insurance income 1,088 92917 2,017 1,81011 Trading income 419 507(17) 926 1,217(24) Other income Dividends received from other entities 2 1100 3 Net gain on disposal of associates - --- Net gain on disposal of assets 14 1040 24 Net gain/(loss) on hedging overseas operations - --- Net gain/(loss) on derivatives held for risk management purposes1 18 1429 32 Net gain/(loss) on financial instruments designated at fair value 12 26(54) 38 Net gain/(loss) on disposal of controlled entities - (9)(100) (9) Rental income on operating leases 12 14(14) 26 Share of associates net profit (7) (3)133 (10) Other 2 13(85) 15 Total other income 53 66(20) 119 7070 Total non-interest income 2,762 2,850(3) 5,612 5,852(4)
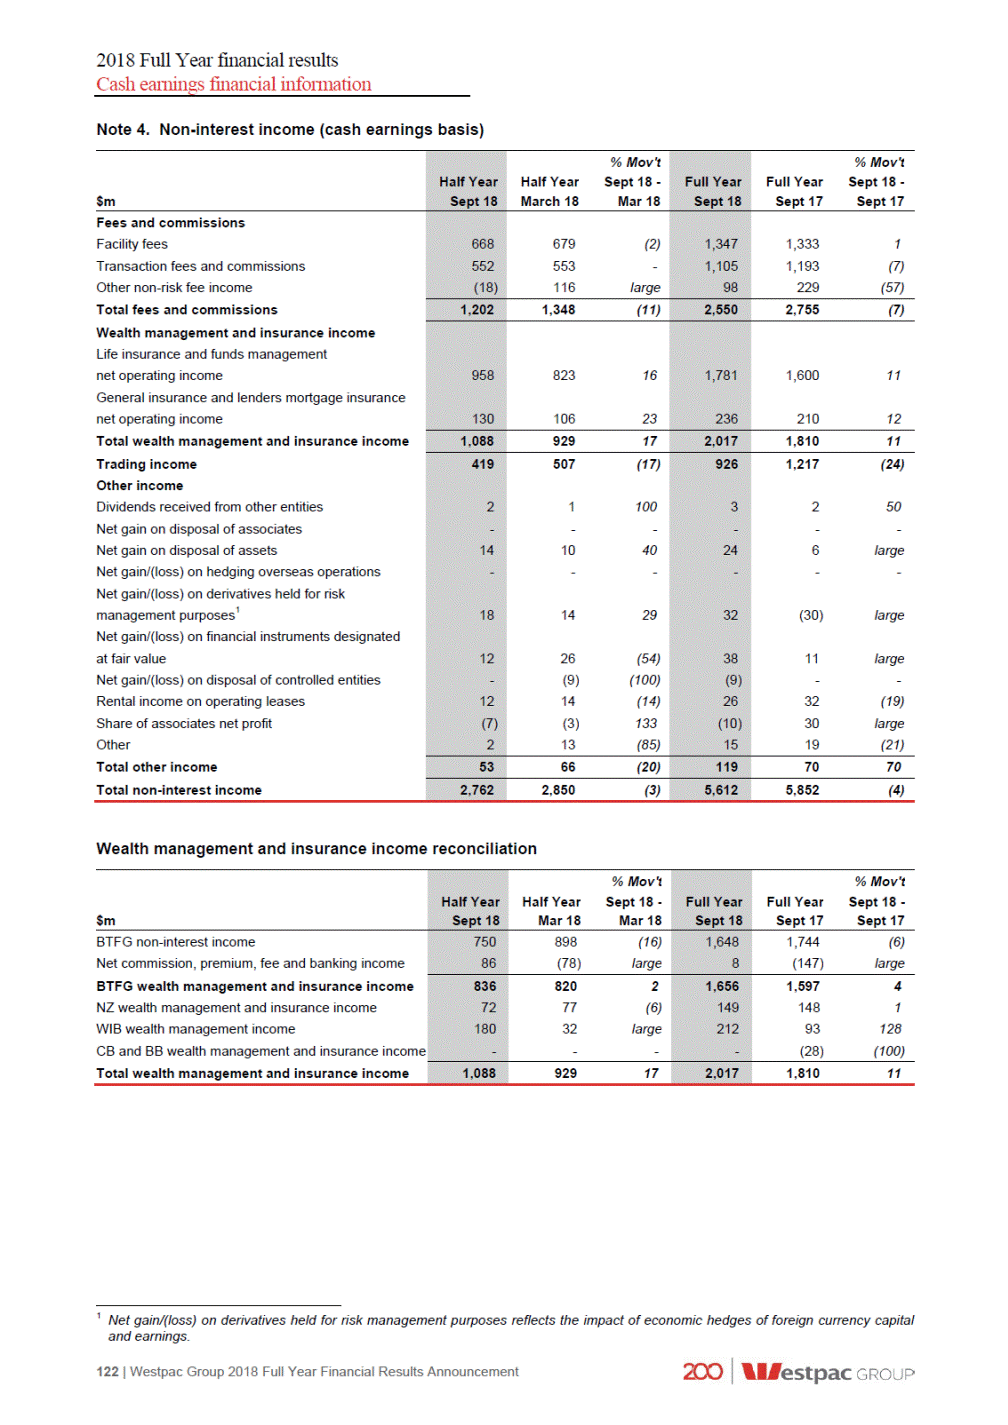
2018 Full Year financial results Cash earnings financial information Note 5. Operating expenses (cash earnings basis) 4,098 380 113 75 5 2 (16) 52 649 179 134 (3) (8) 16 628 158 639 313 190 80 (1) (11) 13 9 10 (4) 755 10 217 155 152 73 107 9 large (16) 12 (17) 82 (20) Note 6. Deferred expenses2 1 Professional and processing services relates to: - services provided by external suppliers including items such as cash handling and security services, marketing costs, and research and recruitment fees (Full Year 2018: $271 million; Full Year 2017: $268 million); - operations processing (Full Year 2018: $195 million; Full Year 2017: $184 million); - consultants (Full Year 2018: $151 million; Full Year 2017: $162 million); - credit assessment (Full Year 2018: $58 million; Full Year 2017: $53 million); - legal and audit fees (Full Year 2018: $111 million; Full Year 2017: $61 million); - regulatory fees and share market related costs (Full Year 2018: $38 million; Full Year 2017: $27 million). 2 Deferred expenses principally relate to a small number of capitalised costs in the wealth business. It does not include insurance deferred acquisition costs (which are offset to revenue) or mortgage broker costs (which are offset to net interest income). Westpac Group 2018 Full Year Financial Results Announcement | 123 $m As at 30 Sept 2018 As atAs at% Mov't% Mov't 31 March30 SeptSpt 18 -Sept 18 - 20182017Mar 18Sept 17 Deferred acquisition costs Other deferred expenditure 71 8086(11)(17) 3028(3)4 29 $m % Mov't Half Year Sept 18 - March 18 Mar 18 % Mov't Full YearSept 18 - Sept 17Sept 17 Half Year Full Year Sept 18 Sept 18 Staff expenses Employee remuneration, entitlements and on-costs 2,173 2,1193 4,292 Superannuation expense 189 197(4) 386 Share-based payments 47 48(2) 95 Restructuring costs 80 34135 114 Total staff expenses 2,489 2,3984 4,887 4,6665 Occupancy expenses Operating lease rentals 313 319(2) 632 Depreciation of property and equipment 79 85(7) 164 Other 85 7120 156 Total occupancy expenses 477 475-952 962(1) Technology expenses Amortisation and impairment of software assets 317 3035 620 Depreciation and impairment of IT equipment 68 73(7) 141 Technology services 380 34111 721 Software maintenance and licenses 157 185(15) 342 Telecommunications 107 1025 209 Data processing 39 383 77 Total technology expenses 1,068 1,0422 2,110 2,0085 Other expenses Professional and processing services1 439 38514 824 Amortisation and impairment of intangible assets 95 18large 113 Postage and stationery 87 95(8) 182 Advertising 80 93(14) 173 Credit card loyalty programs 56 70(20) 126 Non-lending losses 93 40133 133 Other expenses 48 3826 86 Total other expenses 898 73922 1,637 1,46911 Operating expenses 4,932 4,6546 9,586 9,1055

2018 Full Year financial results Cash earnings financial information Note 7. Earnings per share (cash earnings basis) 3,364 239.7 1 (1) 3,346 48 - 124 | Westpac Group 2018 Full Year Financial Results Announcement Half Year Half Year March 18 Full Year Full Year Sept 17 Sept 18 Sept 18 Reconciliation of ordinary shares on issue before the effect of own shares held (millions) Opening balance 3,404 3,394 3,394 Number of shares issued under the Dividend Reinvestment Plan (DRP) 12 10 22 Number of shares issued as conversion of Westpac Convertible Preference Shares 19 - 19 Closing balance 3,435 3,404 3,435 3,394 $m % Mov't Half Year Sept 18 - March 18 Mar 18 % Mov't Full YearSept 18 - Sept 17Sept 17 Half Year Full Year Sept 18 Sept 18 Cash earnings 3,814 4,251(10) 8,065 8,062-Weighted average number of fully paid ordinary shares (millions) 3,429 3,4001 3,414 Cash earnings per ordinary share (cents) 111.2 125.0(11) 236.2

2018 Full Year financial results Cash earnings financial information Note 8. Group earnings reconciliation 1 Pendal (previously BTIM) Westpac Group 2018 Full Year Financial Results Announcement | 125 Cash Earnings adjustments Six months to 30 September 2018 $m Fair value Amortisation(gain)/lossAdjustmentPolicyholder of intangible on economicIneffectiverelated toTreasury Operatingtax assetshedgeshedgesPendal1sharesleasesrecoveries Reported Cash results earnings Net interest income Fees and commission Wealth management and insurance income Trading income Other income Non-interest income Net operating income Staff expenses Occupancy expenses Technology expenses Other expenses Operating expenses Core earnings Impairment charges Operating profit before tax Income tax expense Net profit Net profit attributable to non-controlling interests NET PROFIT ATTRIBUTABLE TO OWNERS OF WBC WBC Cash Earnings adjustments: Amortisation of intangible assets Fair value (gain)/loss on economic hedges Ineffective hedges Adjustment related to Pendal1 Treasury shares 8,227 -(194)5----8,038 1,202 -----------2-(24) -(39)------1-104-(35)-1,202 1,110 1,088 458 419 (17) 53 2,753 -(38)-1042(35)(24) 2,762 10,980 -(232)51042(35)(24) 10,800 (2,489) ------------35---------------(2,489) (512) (477) (1,068) (1,068) (898) (898) (4,967) -----35-(4,932) 6,013 -(232)51042-(24) -------5,868 (317) (317) 5,696 -(232)51042-(24) -69(1)(31)1-24 5,551 (1,797) (1,735) 3,899 -(163)4733---------3,816 (2) (2) 3,897 -(163)4733----------163-------(4)-------(73)-------(3)--3,814 - - (163) - 4 - 73 - 3 - Cash earnings 3,814 -------3,814
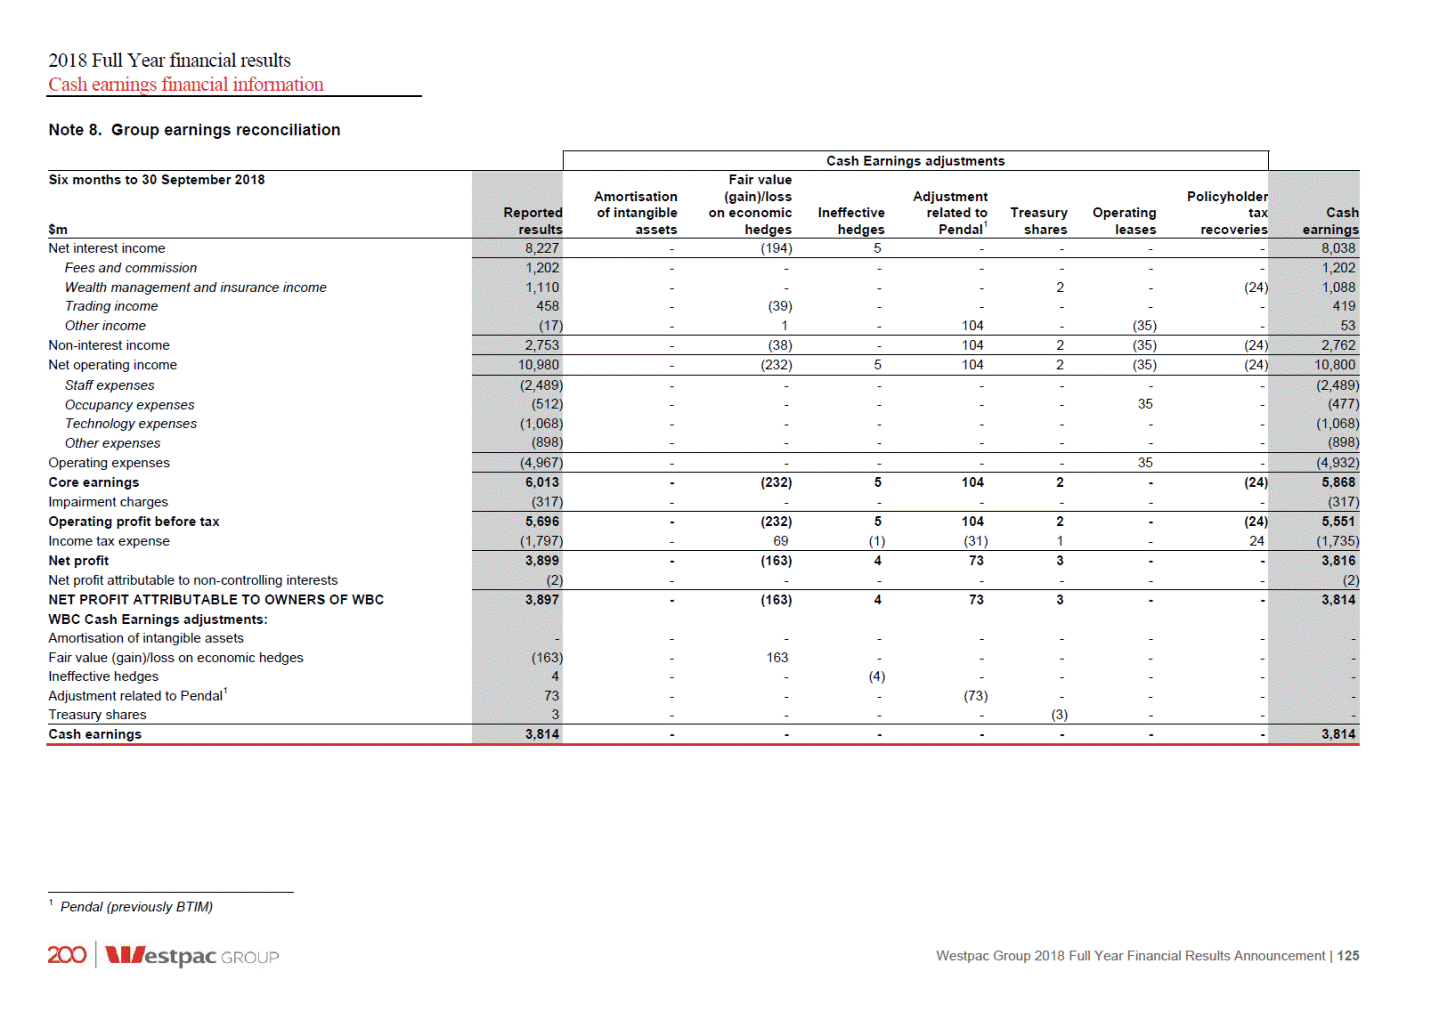
2018 Full Year financial results Cash earnings financial information Note 8. Group earnings reconciliation (continued) 1 Pendal (previously BTIM) 126 | Westpac Group 2018 Full Year Financial Results Announcement Cash Earnings adjustments Six months to 31 March 2018 $m Fair value Amortisation(gain)/lossAdjustmentPolicyholder of intangible on economicIneffectiverelated toTreasuryOperatingtax assetshedgeshedgesPendal1sharesleasesrecoveries Reported Cash results earnings Net interest income Fees and commission Wealth management and insurance income Trading income Other income Non-interest income Net operating income Staff expenses Occupancy expenses Technology expenses Other expenses Operating expenses Core earnings Impairment charges Operating profit before tax Income tax expense Net profit Net profit attributable to non-controlling interests NET PROFIT ATTRIBUTABLE TO OWNERS OF WBC WBC Cash Earnings adjustments: Amortisation of intangible assets Fair value (gain)/loss on economic hedges Ineffective hedges Adjustment related to Pendal1 Treasury shares 8,278 -1013----8,301 1,348 -----------(11)-(11) -20------23---(46)-1,348 951 929 487 507 89 66 2,875 -43--(11)(46)(11) 2,850 11,153 -5313-(11)(46)(11) 11,151 (2,398) ------------46--------25------(2,398) (521) (475) (1,042) (1,042) (764) (739) (4,725) 25----46-(4,654) 6,428 255313-(11)-(11) -------6,497 (393) (393) 6,035 255313-(11)-(11) (8)(16)(4)-1-11 6,104 (1,835) (1,851) 4,200 17379-(10)---------4,253 (2) (2) 4,198 17379-(10)--(17)-------(37)-------(9)---------------10--4,251 17 - 37 - 9 - - - (10) - Cash earnings 4,251 -------4,251

2018 Full Year financial results Cash earnings financial information Note 8. Group earnings reconciliation (continued) 1 Pendal (previously BTIM). Westpac Group 2018 Full Year Financial Results Announcement | 127 Cash Earnings adjustments Twelve months to 30 September 2018 $m Fair value Amortisation(gain)/lossAdjustmentPolicyholder of intangible on economicIneffectiverelated toTreasuryOperatingtax assetshedgeshedgesPendal1sharesleasesrecoveries Reported Cash results earnings Net interest income Fees and commission Wealth management and insurance income Trading income Other income Non-interest income Net operating income Staff expenses Occupancy expenses Technology expenses Other expenses Operating expenses Core earnings Impairment charges Operating profit before tax Income tax expense Net profit Net profit attributable to non-controlling interests NET PROFIT ATTRIBUTABLE TO OWNERS OF WBC WBC Cash Earnings adjustments: Amortisation of intangible assets Fair value (gain)/loss on economic hedges Ineffective hedges Adjustment related to Pendal1 Treasury shares 16,505 -(184)18----16,339 2,550 -----------(9)-(35) -(19)------24-104-(81)-2,550 2,061 2,017 945 926 72 119 5,628 -5-104(9)(81)(35) 5,612 22,133 -(179)18104(9)(81)(35) 21,951 (4,887) ------------81--------25------(4,887) (1,033) (952) (2,110) (2,110) (1,662) (1,637) (9,692) 25----81-(9,586) 12,441 25(179)18104(9)-(35) -------12,365 (710) (710) 11,731 25(179)18104(9)-(35) (8)53(5)(31)2-35 11,655 (3,632) (3,586) 8,099 17(126)1373(7)---------8,069 (4) (4) 8,095 17(126)1373(7)--(17)-------(126)-------(13)-------(73)-------7--8,065 17 - (126) - 13 - 73 - (7) - Cash earnings 8,065 -------8,065

2018 Full Year financial results Cash earnings financial information Note 8. Group earnings reconciliation (continued) 1 Pendal (previously BTIM) 128 | Westpac Group 2018 Full Year Financial Results Announcement Cash Earnings adjustments Twelve months to 30 September 2017 $m Fair value Amortisation(gain)/lossAdjustmentPolicyholder of intangible on economicIneffectiverelated toTreasuryOperatingtax assetshedgeshedgesPendal1sharesleasesrecoveries Reported Cash results earnings Net interest income Fees and commission Wealth management and insurance income Trading income Other income Non-interest income Net operating income Staff expenses Occupancy expenses Technology expenses Other expenses Operating expenses Core earnings Impairment charges Operating profit before tax Income tax expense Net profit Net profit attributable to non-controlling interests NET PROFIT ATTRIBUTABLE TO OWNERS OF WBC WBC Cash Earnings adjustments: Amortisation of intangible assets Fair value (gain)/loss on economic hedges Ineffective hedges Adjustment related to Pendal1 Treasury shares 15,516 -16622---15,704 2,755 -----------21-(11) -15-----13(82)-(279)-(111)-2,755 1,800 1,810 1,202 1,217 529 70 6,286 13(67)-(279)21(111)(11) 5,852 21,802 139922(279)21(111)(11) 21,556 (4,701) ---35--------111--------183------(4,666) (1,073) (962) (2,008) (2,008) (1,652) (1,469) (9,434) 183--35-111-(9,105) 12,368 1969922(244)21-(11) -------12,451 (853) (853) 11,515 1969922(244)21-(11) (59)(30)(6)73--11 11,598 (3,518) (3,529) 7,997 1376916(171)21---------8,069 (7) (7) 7,990 1376916(171)21--(137)-------(69)-------(16)-------171-------(21)--8,062 137 - 69 - 16 - (171) - 21 - Cash earnings 8,062 -------8,062

2018 Full Year financial results Cash earnings financial information Note 9. Divisional result and economic profit Group economic profit is defined as cash earnings plus a franking benefit equivalent of 70% of the value of Australian tax expense less a capital charge calculated at 11% of average ordinary equity. Divisional economic profit is defined as cash earnings plus the franking benefit less a capital charge. The capital charge is calculated at 11% on allocated capital. Economic profit is used as a key measure of financial performance because it focuses on shareholder value generated by requiring a return in excess of a risk-adjusted cost of capital. 1 Cash earnings adjustment relates to amortisation of intangible assets. 2 Cash earnings adjustment relates to amortisation of intangible assets and Pendal (BTIM). 3 In A$ equivalents. 4 For divisions average equity does not include intangible assets. Westpac Group 2018 Full Year Financial Results Announcement | 129 Six months to 30 September 2018 $m BT FinancialWestpac ConsumerBusinessGroup Institutional Westpac New Bank1Bank1(Australia)2BankZealand3 Group Reported results Cash earnings adjustments Cash earnings Franking benefit Adjusted cash earnings Average equity4 Capital charge Economic profit Return on average equity (including intangibles) 3,897 1,4231,079168535496 --73-(3) 1,4231,079241535493 43732677154-(83) 3,814 1,054 4,868 1,8601,405318689493 62,978 18,59512,6073,6417,8954,708 (1,025)(695)(201) (435)(260) (3,473) 1,395 835710117254233 12.7%14.0%8.4%12.6%18.9% 12.1% Six months to 31 March 2018 $m Reported results Cash earnings adjustments Cash earnings Franking benefit Adjusted cash earnings Average equity4 Capital charge Economic profit Return on average equity (including intangibles) 4,198 1,7021,078404551451 152--(10) 1,7171,080404551441 516324122123-53 4,251 1,147 5,398 2,2331,404526674441 61,051 17,62612,5273,5458,1964,614 (967)(687)(194) (450)(253) (3,349) 2,049 1,266717332224188 16.1%14.1%14.4%12.6%17.4% 14.0% Twelve months to 30 September 2018 $m Reported results Cash earnings adjustments Cash earnings Franking benefit Adjusted cash earnings Average equity4 Capital charge Economic profit Return on average equity (including intangibles) 8,095 3,1252,1575721,086947 15273-(13) 3,1402,1596451,086934 953650199277-(30) 8,065 2,201 10,266 4,0932,8098441,363934 62,017 18,11212,5673,5938,0454,661 (1,992)(1,382)(395) (885)(513) (6,822) 3,444 2,1011,427449478421 14.4%14.1%11.4%12.6%18.2% 13.0% Twelve months to 30 September 2017 $m Reported results Cash earnings adjustments Cash earnings Franking benefit Adjusted cash earnings Average equity4 Capital charge Economic profit Return on average equity (including intangibles) 7,990 3,0391,9938961,159903 11610(160)-14 3,1552,0037361,159917 946603221277-72 8,062 2,153 10,215 4,1012,6069571,436917 58,556 15,28111,8753,5628,8094,611 (1,681)(1,306)(392) (969)(507) (6,441) 3,774 2,4201,300565467410 16.5%13.6%13.1%12.3%18.0% 13.8%

2018 Full Year financial results Other information 6.0 6.1 Other information Disclosure regarding forward-looking statements This Full Year Financial Results Announcement contains statements that constitute ‘forward-looking statements’ within the meaning of Section 21E of the US Securities Exchange Act of 1934. Forward-looking statements are statements about matters that are not historical facts. Forward-looking statements appear in a number of places in this Full Year Financial Results Announcement and include statements regarding Westpac’s intent, belief or current expectations with respect to its business and operations, market conditions, results of operations and financial condition, including, without limitation, future loan loss provisions and financial support to certain borrowers. Words such as ‘will’, ‘may’, ‘expect’, ‘intend’, ‘seek’, ‘would’, ‘should’, ‘could’, ‘continue’, ‘plan’, ‘estimate’, ‘anticipate’, ‘believe’, ‘probability’, ‘risk’, ‘aim’ or other similar words are used to identify forward-looking statements. These forward-looking statements reflect Westpac’s current views with respect to future events and are subject to change, certain risks, uncertainties and assumptions which are, in many instances, beyond Westpac’s control, and have been made based upon management’s expectations and beliefs concerning future developments and their potential effect upon Westpac. There can be no assurance that future developments will be in accordance with Westpac’s expectations or that the effect of future developments on Westpac will be those anticipated. Actual results could differ materially from those expected, depending on the outcome of various factors, including, but not limited to: the effect of, and changes in, laws, regulations, taxation or accounting standards or practices and government policy, particularly changes to liquidity, leverage and capital requirements; regulatory investigations and other actions, inquiries, litigation, fines, penalties, restrictions or other regulator imposed conditions, including as a result of our actual or alleged failure to comply with laws (such as financial crime laws), regulations or regulatory policy; internal and external events which may adversely impact Westpac’s reputation; information security breaches, including cyberattacks; reliability and security of Westpac’s technology and risks associated with changes to technology systems; the stability of Australian and international financial systems and disruptions to financial markets and any losses or business impacts Westpac or its customers or counterparties may experience as a result; market volatility, including uncertain conditions in funding, equity and asset markets; adverse asset, credit or capital market conditions; an increase in defaults in credit exposures because of a deterioration in economic conditions; the conduct, behaviour or practices of Westpac or its staff; changes to Westpac’s credit ratings or the methodology used by credit rating agencies; levels of inflation, interest rates, exchange rates and market and monetary fluctuations; market liquidity and investor confidence; changes in economic conditions, consumer spending, saving and borrowing habits in Australia, New Zealand and other countries in which Westpac or its customers or counterparties conduct their operations and Westpac’s ability to maintain or to increase market share, margins and fees, and control expenses; the effects of competition, including from established providers of financial services and from non-financial services entities, in the geographic and business areas in which Westpac conducts its operations; the timely development and acceptance of new products and services and the perceived overall value of these products and services by customers; the effectiveness of Westpac’s risk management policies, including internal processes, systems and employees; the incidence or severity of Westpac-insured events; the occurrence of environmental change (including as a result of climate change) or external events in countries in which Westpac or its customers or counterparties conduct their operations; changes to the value of Westpac’s intangible assets; changes in political, social or economic conditions in any of the major markets in which Westpac or its customers or counterparties operate; the success of strategic decisions involving diversification or innovation, in addition to business expansion activity, business acquisitions and the integration of new businesses; and various other factors beyond Westpac’s control. 130 | Westpac Group 2018 Full Year Financial Results Announcement

2018 Full Year financial results Other information 6.1 Disclosure regarding forward-looking statements (continued) The above list is not exhaustive. For certain other factors that may impact on forward-looking statements made by Westpac, refer to ‘Risk factors’ in the 2018 Westpac Group Annual Report. When relying on forward-looking statements to make decisions with respect to Westpac, investors and others should carefully consider the foregoing factors and other uncertainties and events. Westpac is under no obligation to update any forward-looking statements contained in this Full Year Financial Results Announcement, whether as a result of new information, future events or otherwise, after the date of this Full Year Financial Results Announcement. 6.2 References to websites Information contained in or accessible through the websites mentioned in this Full Year Financial Results Announcement does not form part of this Full Year Financial Results Announcement unless we specifically state that it is incorporated by reference and forms part of this Full Year Financial Results Announcement. All references in this Full Year Financial information only. Results Announcement to websites are inactive textual references and are for 6.3 Credit ratings1 Long Term Short. Term Rating agency Outlook Fitch Ratings Moody’s Investor Services S&P Global Ratings AA-Aa3 AA-F1+ P-1 A-1+ Stable Stable Negative 6.4 Dividend reinvestment plan Westpac operates a DRP that is available to holders of fully paid ordinary shares who are resident in, and whose address on the register of shareholders is in, Australia or New Zealand. As noted in Section 2.5, the Directors have made certain determinations in relation to the calculation of the market price which will apply to the DRP for the 2018 Full Year dividend only. Shareholders who wish to commence participation in the DRP, or to vary their current participation election, must do so by 5.00pm (AEST) on 15 November 2018. Shareholders can provide these instructions by: For shareholders with holdings that have a market value of less than $50,000 (for a single holding) or less than $1,000,000 (per shareholding held within a Link Market Services portfolio), logging into the Westpac share registrar’s website at www.linkmarketservices.com.au and electing the DRP or amending their existing instructions online; or Completing and returning a DRP Application or Variation form to Westpac’s share registry. Registry contact details are listed in Section 6.6. 6.5 Changes in control of Group entities During the twelve months ended 30 September 2018 the following controlled entities were acquired, formed, reinstated or incorporated: Crusade ABS Series 2017-1P Trust (formed 17 October 2017); Crusade ABS Series 2018-1P (formed 14 August 2018); Reinventure Special Purpose Investment Unit Trust (formed 26 April 2018); Reinventure Fund III I.L.P (formed 3 August 2018); and St.George Commercial Credit Corporation Limited (reinstated 13 July 2018). 1 As at 30 September 2018. Westpac Group 2018 Full Year Financial Results Announcement | 131

2018 Full Year financial results Other information During the twelve months ended 30 September 2018 the following controlled entities ceased to be controlled: A.G.C. (Pacific) Limited (removed 26 April 2018); Westpac Cook Cove Trust I (terminated 19 October 2017); Westpac Cook Cove Trust II (terminated 19 October 2017); Westpac Capital Holdings Inc (dissolved 21 November 2017); Westpac Delta LLC (dissolved 21 November 2017); Westpac Equity Pty Limited (deregistered 27 September 2018); Westpac Funds Financing Holdco Pty Limited (deregistered 28 January 2018); Westpac Funds Financing Pty Limited (deregistered 28 January 2018); Crusade ABS Series 2013-1 Trust (terminated 1 July 2018); Crusade Euro Trust No. 1E of 2007 (terminated 31 January 2018); Crusade Global Trust No. 1 of 2007 (terminated 31 January 2018); Crusade CP No. 1 Pty Ltd (deregistered 12 February 2018); Hastings Funds Management (UK) Limited (sold 28 February 2018); Hastings Infrastructure 1 Limited (sold 28 February 2018); Hastings Infrastructure 2 Limited (sold 28 February 2018); Infrastructure GP LLP (sold 28 February 2018); Europe Infrastructure Debt L.P. (sold 28 February 2018); Infrastructure GP 2 LLP (sold 28 February 2018); Core Infrastructure Income Feeder 1 L.P. (sold 28 February 2018); Core Infrastructure Income Feeder 2 L.P. (sold 28 February 2018); Core Infrastructure Income Master L.P. (sold 28 February 2018); Hastings Funds Management (USA) Inc (sold 28 February 2018); Hastings Advisors LLC (sold 28 February 2018); Hastings Investments GP LLC (sold 28 February 2018); Hastings Investment Capital LP (sold 28 February 2018); Hastings Korea Company Limited (sold 13 March 2018); Hastings Funds Management Asia Pte Limited (sold 23 March 2018); Hastings Forestry Investments Limited (removed 2 August 2018); Hastings Forests Australia Pty Limited (deregistered 1 August 2018); Hastings Private Equity Fund IIA Pty Limited (deregistered 13 September 2018); and Hitton Pty Limited (deregistered 27 September 2018). 132 | Westpac Group 2018 Full Year Financial Results Announcement

2018 Full Year financial results Other information 6.6 Financial calendar and Share Registry details Westpac shares are listed on the securities exchanges in Australia (ASX) and New Zealand (NZX) and as American Depository Receipts in New York. Westpac Capital Notes, Westpac Capital Notes 2, Westpac Capital Notes 3, Westpac Capital Notes 4 and Westpac Capital Notes 5 are listed on the ASX. Westpac NZD Subordinated Notes are listed on the NZX. Important dates to note are set out below, subject to change. Payment of any distribution, dividend or interest payment is subject to the relevant payment conditions and the key dates for each payment will be confirmed to the ASX for securities listed on the ASX. Westpac Ordinary Shares (ASX code: WBC, NZX code: WBC, NYSE code: WBK) New York ex-dividend date for final dividend Ex-dividend date for final dividend New York record date for final dividend Record date for final dividend Annual General Meeting Final dividend payable Financial Half Year end Interim results and dividend announcement New York ex-dividend date for interim dividend Ex-dividend date for interim dividend New York record date for interim dividend Record date for interim dividend Interim dividend payable Financial Year end Final results and dividend announcement New York ex-dividend date for final dividend Ex-dividend date for final dividend New York record date for final dividend Record date for final dividend Annual General Meeting Final dividend payable 9 November 2018 13 November 2018 13 November 2018 14 November 2018 12 December 2018 20 December 2018 31 March 2019 6 May 2019 15 May 2019 16 May 2019 16 May 2019 17 May 2019 3 July 2019 30 September 2019 4 November 2019 8 November 2019 12 November 2019 12 November 2019 13 November 2019 12 December 20191 20 December 2019 Westpac Capital Notes (ASX code: WBCPD) Ex-date for quarterly distribution Record date for quarterly distribution Payment date for quarterly distribution Ex-date for quarterly distribution Record date for quarterly distribution Payment date for quarterly distribution Ex-date for quarterly distribution Record date for quarterly distribution Payment date for quarterly distribution Ex-date for quarterly distribution Record date for quarterly distribution Payment date for quarterly distribution Ex-date for quarterly distribution Record date for quarterly distribution Payment date for quarterly distribution 29 November 2018 30 November 2018 10 December 20182 27 February 2019 28 February 2019 8 March 2019 30 May 2019 31 May 2019 11 June 20192 29 August 2019 30 August 20193 9 September 20192 28 November 2019 29 November 20193 9 December 20192 1 Details regarding the location of the meeting and the business to be dealt with will be contained in a Notice of Meeting sent to shareholders in the November before the meeting. 2 Adjusted to next business day as payment date falls on a non-ASX business day. 3 Adjusted to immediately preceding business day as record date falls on a non-ASX business day. Westpac Group 2018 Full Year Financial Results Announcement | 133

2018 Full Year financial results Other information Westpac Capital Notes 2 (ASX code: WBCPE) Ex-date for quarterly distribution Record date for quarterly distribution Payment date for quarterly distribution Ex-date for quarterly distribution Record date for quarterly distribution Payment date for quarterly distribution Ex-date for quarterly distribution Record date for quarterly distribution Payment date for quarterly distribution Ex-date for quarterly distribution Record date for quarterly distribution Payment date for quarterly distribution Ex-date for quarterly distribution Record date for quarterly distribution Payment date for quarterly distribution 13 December 2018 14 December 20182 24 December 20181 14 March 2019 15 March 2019 25 March 20191 13 June 2019 14 June 20192 24 June 20191 12 September 2019 13 September 20192 23 September 2019 12 December 2019 13 December 20192 23 December 2019 Westpac Capital Notes 3 (ASX code: WBCPF) Ex-date for quarterly distribution Record date for quarterly distribution Payment date for quarterly distribution Ex-date for quarterly distribution Record date for quarterly distribution Payment date for quarterly distribution Ex-date for quarterly distribution Record date for quarterly distribution Payment date for quarterly distribution Ex-date for quarterly distribution Record date for quarterly distribution Payment date for quarterly distribution Ex-date for quarterly distribution Record date for quarterly distribution Payment date for quarterly distribution 13 December 2018 14 December 2018 24 December 20181 13 March 2019 14 March 2019 22 March 2019 13 June 2019 14 June 2019 24 June 20191 12 September 2019 13 September 20192 23 September 20191 12 December 2019 13 December 20192 23 December 20191 1 Adjusted to next business day as payment date falls on a non-ASX business day. 2 Adjusted to immediately preceding business day as record date falls on a non-ASX business day. 134 | Westpac Group 2018 Full Year Financial Results Announcement
2018 Full Year financial results Other information Westpac Capital Notes 4 (ASX code: WBCPG) Ex-date for quarterly distribution Record date for quarterly distribution Payment date for quarterly distribution Ex-date for quarterly distribution Record date for quarterly distribution Payment date for quarterly distribution Ex-date for quarterly distribution Record date for quarterly distribution Payment date for quarterly distribution Ex-date for quarterly distribution Record date for quarterly distribution Payment date for quarterly distribution Ex-date for quarterly distribution Record date for quarterly distribution Payment date for quarterly distribution 20 December 2018 21 December 20182 31 December 20181 21 March 2019 22 March 2019 1 April 20191 20 June 2019 21 June 20192 1 July 20191 19 September 2019 20 September 20192 30 September 2019 19 December 2019 20 December 20192 30 December 2019 Westpac Capital Notes 5 (ASX code: WBCPH) Ex-date for quarterly distribution Record date for quarterly distribution Payment date for quarterly distribution Ex-date for quarterly distribution Record date for quarterly distribution Payment date for quarterly distribution Ex-date for quarterly distribution Record date for quarterly distribution Payment date for quarterly distribution Ex-date for quarterly distribution Record date for quarterly distribution Payment date for quarterly distribution Ex-date for quarterly distribution Record date for quarterly distribution Payment date for quarterly distribution 13 December 2018 14 December 2018 24 December 20181 13 March 2019 14 March 2019 22 March 2019 13 June 2019 14 June 2019 24 June 20191 12 September 2019 13 September 20192 23 September 20191 12 December 2019 13 December 20192 23 December 20191 1 Adjusted to next business day as payment date falls on a non-ASX business day. 2 Adjusted to immediately preceding business day as record date falls on a non-ASX business day. Westpac Group 2018 Full Year Financial Results Announcement | 135
2018 Full Year financial results Other information Westpac NZD Subordinated Notes 11 (ASX code: WBC010) Ex-date for quarterly interest payment Record date for quarterly interest payment Payment date for quarterly interest payment Ex-date for quarterly interest payment Record date for quarterly interest payment Payment date for quarterly interest payment Ex-date for quarterly interest payment Record date for quarterly interest payment Payment date for quarterly interest payment Ex-date for quarterly interest payment Record date for quarterly interest payment Payment date for quarterly interest payment Ex-date for quarterly interest payment Record date for quarterly interest payment Payment date for quarterly interest payment 20 November 2018 21 November 2018 3 December 20181 18 February 2019 19 February 2019 1 March 2019 21 May 2019 22 May 2019 4 June 20191 21 August 2019 22 August 2019 2 September 20191 20 November 2019 21 November 2019 2 December 20191 1 Adjusted to next business day as payment date does not fall on a day on which banks are open for general business in Wellington and Auckland, New Zealand and Sydney, Australia. 136 | Westpac Group 2018 Full Year Financial Results Announcement
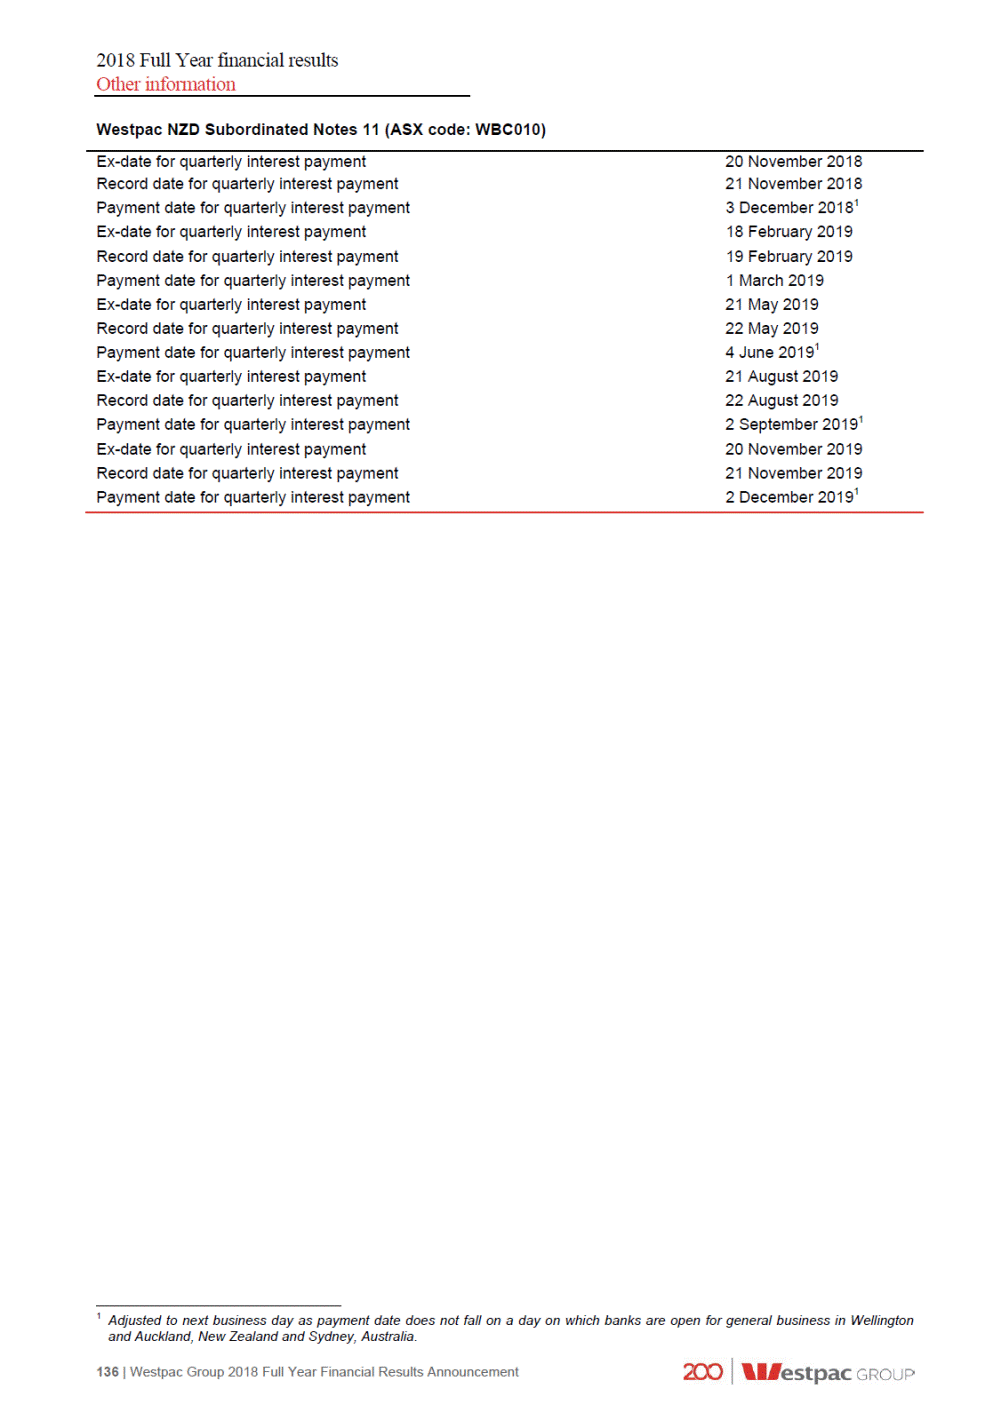
2018 Full Year financial results Other information Registered Office Level 18 275 Kent Street Sydney NSW 2000 Australia Telephone: +61 2 9155 7713 Facsimile: +61 2 8253 4128 International: +61 2 9155 7700 Website: www.westpac.com.au/westpacgroup Share Registries Australia Ordinary shares on the main register, Westpac Capital Notes, Westpac Capital Notes 2, Westpac Capital Notes 3, Westpac Capital Notes 4 and Westpac Capital Notes 5 Link Market Services Limited Level 12, 680 George Street Sydney NSW 2000 Australia Postal Address: Locked Bag A6015, Sydney South NSW 1235, Australia Website: www.linkmarketservices.com.au Email: [email protected] Telephone: 1800 804 255 (toll free in Australia) International: +61 1800 804 255 Facsimile: +61 2 9287 0303 New Zealand Ordinary shares on the New Zealand branch register and Westpac NZD Subordinated Notes Link Market Services Limited Level 11, Deloitte Centre, 80 Queen Street Auckland 1010 New Zealand Postal Address: P.O. Box 91976, Auckland 1142, New Zealand Website: www.linkmarketservices.co.nz Email: [email protected] Telephone: 0800 002 727 (toll free in New Zealand) International: +64 9 375 5998 Facsimile: +64 9 375 5990 New York Depositary in USA for American Depositary Shares BNY Mellon Shareholder Services PO Box 505000 Louisville, KY 40233-5000, USA Website: www-us.computershare.com/investor Email: [email protected] Telephone: +1 888 269 2377 (toll free in USA) International: +1 201 680 6825 For further information contact: Media: David Lording, Group Head of Media Relations, +61 2 8219 8512 Analysts and Investors: Andrew Bowden, Head of Investor Relations +61 2 8253 4008 Westpac Group 2018 Full Year Financial Results Announcement | 137
2018 Full Year financial results Other information 6.7 6.7.1 Exchange rates Exchange rates against A$ 0.5722 1.0926 0.5447 1.0652 0.5954 1.0731 0.5846 1.0867 6.7.2 Westpac New Zealand division performance (A$ Equivalent to Section 3.5) Results have been translated into Australian dollars (A$) at the average exchange rates for each reporting period, Second Half 2018: $1.0842 (First Half 2018: $1.0926; Second Half 2017: $1.0731). Unless otherwise stated, assets and liabilities have been translated at spot rates as at the end of the reporting period. 480 (9) (903) (5) 72 large (361) - 410 42.77% 2.03% 3 (292bps) 12bps 71.1 75.55% 81.3 100.1 8.0 80.5 9.3 4 144bps 1 2 (14) (1) 5 1 Ratios calculated using NZ$. 2 Deposits refer to total customer deposits. 3 Averages are based on a six month period for the halves and a twelve month period for the full year and are converted at average rates. 138 | Westpac Group 2018 Full Year Financial Results Announcement $bn As at As at% Mov't 30 MarchSept 18 - 2018Mar 18 As at As at% Mov't 30 SeptSept 18 - 2017Sept 17 30 Sept 30 Sept 2018 2018 Deposits2 56.7 57.9(2) 56.7 53.76 Net loans 73.6 74.3(1) 73.6 Deposit to loan ratio1 76.99% 77.88%(89bps) 76.99% Total assets 82.4 84.3(2) 82.4 TCE 102.5 104.9(2) 102.5 Third party liquid assets 6.9 8.1(15) 6.9 Average interest-earning assets3 81.0 78.83 79.9 Total funds 9.8 9.71 9.8 $m % Mov't Half Year Sept 18 - March 18 Mar 18 % Mov't Full YearSept 18 - Sept 17Sept 17 Half Year Full Year Sept 18 Sept 18 Net interest income 877 8434 1,720 1,6296 Non-interest income 214 224(4) 438 Net operating income 1,091 1,0672 2,158 2,1092 Operating expenses (431) (429)-(860) Core earnings 660 6383 1,298 1,2068 Impairment (charges)/benefits 22 (24)large (2) Operating profit before tax 682 61411 1,296 1,2781 Tax and non-controlling interests (189) (173)9 (362) Cash earnings 493 44112 934 9172 Economic profit 233 18824 421 Expense to income ratio1 39.56% 40.14%(58bps) 39.85% Net interest margin1 2.16% 2.15%1bps 2.15% Six months to/as at Currency 30 September 2018 31 March 201830 September 2017 AverageSpotAverageSpot AverageSpot US$ 0.74390.7218 0.77760.76700.77020.7844 GBP 0.55860.5521 NZ$ 1.08421.0920 Twelve months to/as at Currency 30 September 2018 AverageSpot 30 September 2017 AverageSpot US$ GBP NZ$ 0.76070.7218 0.56540.5521 1.08841.0920 0.76200.7844 0.60160.5846 1.06651.0867

2018 Full Year financial results Other information 6.7.3 Impact of exchange rate movements on Group results Half Year Sept 18 vs Half Year March 18 Full Year Sept 18 vs Full Year Sept 17 6.7.4 Exchange rate risk on future NZ$ earnings Westpac’s policy in relation to the hedging of the future earnings of the Group’s New Zealand division is to manage the economic risk for volatility of the NZ$ against A$. Westpac manages these flows over a time horizon under which up to 100% of the expected earnings for the following twelve months and 100% of the expected earnings for the subsequent twelve months can be hedged. As at 30 September 2018, Westpac has hedges in place for forecasts up to December 2018 with an average rate of $1.07. Westpac Group 2018 Full Year Financial Results Announcement | 139 $m Cash earnings FX impact growth$m Cash earnings FX impact growth$m Growth Growth ex-FX ex-FX Net interest income Non-interest income Net operating income Operating expenses Core earnings Impairment charges Operating profit before income tax Income tax expense Net profit Net profit attributable to non-controlling interests Cash earnings (3%)12 (3%) 5 (3%) (3%) 4%(36) (4%)50 4% (5%) (3%)17 6%(6) (3%) 6% 2%14 5%14 2% 5% (10%)11 (19%)-(10%) (19%) (1%)28 (17%)-(1%) (17%) (9%)11 (6%)(4) (9%) (6%) -28 2%(10) - 1% (10%)7 --(10%) - -18 (43%)-- (43%) (10%)7 (10%) -18 -

2018 Full Year financial results Glossary 7.0 Glossary Average ordinary equity Average tangible ordinary equity Cash earnings per ordinary share Cash ROE Cash earnings to average tangible equity (ROTE) Dividend payout ratio – cash earnings Dividend payout ratio – net profit Earnings per ordinary share Economic profit – Divisions Economic profit – Group Fully franked dividends per ordinary shares (cents) Net tangible assets per ordinary share Return on equity (ROE) Weighted average ordinary shares (cash earnings) Weighted average ordinary shares (reported) Average total equity less average non-controlling interests. Average ordinary equity less average goodwill and other intangible assets (excluding capitalised software). Cash earnings divided by the weighted average ordinary shares (cash earnings basis). Cash earnings divided by average ordinary equity. Cash earnings divided by average tangible ordinary equity. Ordinary dividend paid/declared calculated on issued shares divided by cash earnings. Ordinary dividend paid/declared calculated on issued shares (net of Treasury shares) divided by the net profit attributable to owners of WBC. Net profit attributable to the owners of WBC divided by the weighted average ordinary shares (reported). Cash earnings less a capital charge calculated at 11% of allocated capital plus 70% of the value of Australian tax expense. Cash earnings less a capital charge calculated at 11% of average ordinary equity plus a value on franking credits calculated as 70% of the Group’s Australian tax expense. Dividends paid out of retained profits which carry a credit for Australian company income tax paid by Westpac. Net tangible assets (total equity less goodwill and other intangible assets less minority interests) divided by the number of ordinary shares on issue (reported). Net profit attributable to the owners of WBC divided by average ordinary equity. Weighted average number of fully paid ordinary shares listed on the ASX for the relevant period. Weighted average number of fully paid ordinary shares listed on the ASX for the relevant period less Westpac shares held by the Group (‘Treasury shares’). Expense to income ratio Full-time equivalent employees (FTE) Revenue per FTE Operating expenses divided by net operating income. A calculation based on the number of hours worked by full and part-time employees as part of their normal duties. For example, the full-time equivalent of one FTE is 76 hours paid work per fortnight. Total operating income divided by the average number of FTE for the period. Average interest-earning assets Average interest-bearing liabilities The average balance of assets held by the Group that generate interest income. Where possible, daily balances are used to calculate the average balance for the period. The average balance of liabilities owed by the Group that incur an interest expense. Where possible, daily balances are used to calculate the average balance for the period. Net interest income (including capital benefit) for a division as a percentage of the average interest earning assets for that division. Divisional margin Net interest margin Calculated by dividing net interest income by average interest-earning assets. The difference between the average yield on all interest-earning assets and the average rate paid on interest bearing liabilities. Interest spread Common equity tier 1 capital ratio Total common equity capital divided by risk weighted assets, as defined by APRA. Credit risk weighted assets represent risk weighted assets (on-balance sheet and off-balance sheet) that relate to credit exposures and therefore exclude market risk, operational risk, interest rate risk in the banking book and other assets. Credit risk weighted assets (Credit RWA) Internationally comparable capital ratios Internationally comparable regulatory capital ratios are Westpac’s estimated ratios after adjusting the capital ratios determined under APRA Basel III regulations for various items. Analysis aligns with the APRA study titled “International capital comparison study” dated 13 July 2015. 140 | Westpac Group 2018 Full Year Financial Results Announcement Capital adequacy Business performance Productivity and efficiency Shareholder value

2018 Full Year financial results Glossary Assets (both on and off-balance sheet) are risk weighted according to each asset’s inherent potential for default and what the likely losses would be in case of default. In the case of non-asset backed risks (ie. market and operational risk), RWA is determined by multiplying the capital requirements for those risks by 12.5. Risk weighted assets (RWA) Tier 1 capital ratio Total regulatory capital ratio Total Tier 1 capital divided by risk weighted assets, as defined by APRA. Total regulatory capital divided by risk weighted assets, as defined by APRA. Tier 1 capital divided by ‘exposure measure’ and expressed as a percentage. ‘Exposure measure’ is the sum of on-balance sheet exposures, derivative exposures, securities financing transaction exposures and other off-balance sheet exposures. APRA leverage ratio Committed Liquidity Facility (CLF) The RBA makes available to Australian Authorised Deposit-taking Institutions a CLF that, subject to qualifying conditions, can be accessed to meet LCR requirements under APS210 Liquidity. Deposit to loan ratio High Quality Liquid Assets (HQLA) Customer deposits divided by total loans. Assets which meet APRA’s criteria for inclusion as HQLA in the numerator of the LCR. An APRA requirement to maintain an adequate level of unencumbered high quality liquid assets, to meet liquidity needs for a 30 calendar day period under an APRA-defined severe stress scenario. Absent a situation of financial stress, the value of the LCR must not be less than 100%, effective 1 January 2015. LCR is calculated as the percentage ratio of stock of HQLA and CLF over the total net cash out-flows in a modelled 30 day defined stressed scenario. Liquidity Coverage Ratio (LCR) The NSFR is defined as the ratio of the amount of available stable funding (ASF) to the amount of required stable funding (RSF) defined by APRA. The amount of ASF is the portion of an ADI’s capital and liabilities expected to be a reliable source of funds over a one year time horizon. The amount of RSF is a function of the liquidity characteristics and residual maturities of an ADI’s assets and off-balance sheet activities. ADI’s must maintain an NSFR of at least 100%. Net Stable Funding Ratio (NSFR) Third party liquid assets HQLA and non LCR qualifying liquid assets, but excludes internally securitised assets that are eligible for a repurchase agreement with the RBA and RBNZ. Third party liquid assets and internally securitised assets that are eligible for a repurchase agreement with a central bank. Total liquid assets 90 days past due and not impaired Includes facilities where: contractual payments of interest and / or principal are 90 or more calendar days overdue, including overdrafts or other revolving facilities that remain continuously outside approved limits by material amounts for 90 or more calendar days (including accounts for customers who have been granted hardship assistance); or an order has been sought for the customer’s bankruptcy or similar legal action has been instituted which may avoid or delay repayment of its credit obligations; and the estimated net realisable value of assets / security to which Westpac has recourse is sufficient to cover repayment of all principal and interest, or where there are otherwise reasonable grounds to expect payment in full and interest is being taken to profit on an accrual basis. These facilities, while in default, are not treated as impaired for accounting purposes. Loans not found to be individually impaired or significant will be collectively assessed in pools of similar assets with similar risk characteristics. The size of the provision is an estimate of the losses already incurred and will be estimated on the basis of historical loss experience for assets with credit characteristics similar to those in the collective pool. The historical loss experience will be adjusted based on current observable data. Included in the collectively assessed provision is an economic overlay provision which is calculated based on changes that occurred in sectors of the economy or in the economy as a whole. Collectively assessed provisions (CAPs) Includes exposures that have deteriorated to the point where full collection of interest and principal is in doubt, based on an assessment of the customer’s outlook, cash flow, and the net realisation of value of assets to which recourse is held: Impaired assets facilities 90 days or more past due, and full recovery is in doubt: exposures where contractual payments are 90 or more days in arrears and the net realisable value of assets to which recourse is held may not be sufficient to allow full collection of interest and principal, including overdrafts or other revolving facilities that remain continuously outside approved limits by material amounts for 90 or more calendar days; non-accrual assets: exposures with individually assessed impairment provisions held against them, excluding restructured loans; restructured assets: exposures where the original contractual terms have been formally modified to provide for concessions of interest or principal for reasons related to the financial difficulties of the customer; other assets acquired through security enforcement (includes other real estate owned): includes the value of any other assets acquired as full or partial settlement of outstanding obligations through the enforcement of security arrangements; and any other assets where the full collection of interest and principal is in doubt. Westpac Group 2018 Full Year Financial Results Announcement | 141 Asset quality Funding and liquidity Capital adequacy (cont’d)

2018 Full Year financial results Glossary Individually assessed provisions (IAPs) Provisions raised for losses that have already been incurred on loans that are known to be impaired and are assessed on an individual basis. The estimated losses on these impaired loans is based on expected future cash flows discounted to their present value and, as this discount unwinds, interest will be recognised in the income statement. Stressed assets Watchlist and substandard, 90 days past due and not impaired and impaired assets. Represents the sum of the committed portion of direct lending (including funds placement overall and deposits placed), contingent and pre-settlement risk plus the committed portion of secondary market trading and underwriting risk. Total committed exposure (TCE) Watchlist and substandard Loan facilities where customers are experiencing operating weakness and financial difficulty but are not expected to incur loss of interest or principal. CVA adjusts the fair value of over-the-counter derivatives for credit risk. CVA is employed on the majority of derivative positions and reflects the market view of the counterparty credit risk. A Debit Valuation Adjustment (DVA) is employed to adjust for our own credit risk. Credit Value Adjustment (CVA) Divisional results Divisional results are presented on a management reporting basis. Internal charges and transfer pricing adjustments are included in the performance of each division reflecting the management structure rather than the legal entity (these results cannot be compared to results for individual legal entities). Where management reporting structures or accounting classifications have changed, financial results for comparative periods have been revised and may differ from results previously reported. Overhead costs are allocated to revenue generating divisions. The Group’s internal transfer pricing frameworks facilitate risk transfer, profitability measurement, capital allocation and divisional alignment, tailored to the jurisdictions in which the Group operates. Transfer pricing allows the Group to measure the relative contribution of products and divisions to the Group’s interest margin and other dimensions of performance. Key components of the Group’s transfer pricing frameworks are funds transfer pricing for interest rate and liquidity risk and allocation of basis and contingent liquidity costs, including capital allocation. First Half 2018 Full Year 2018 Full Year 2017 Net Promoter Score (NPS) Six months ended 31 March 2018. Twelve months ended 30 September 2018. Twelve months ended 30 September 2017. Net Promoter Score measures the net likelihood of recommendation to others of the customer’s main financial institution for retail or business banking. Net Promoter ScoreSM is a trademark of Bain & Co Inc., Satmetrix Systems, Inc., and Mr Frederick Reichheld. For retail banking, using a scale of 1 to 10 (1 means ‘extremely unlikely’ and 10 means ‘extremely likely’), the 1-6 raters (detractors) are deducted from the 9-10 raters (promoters); and For business banking, using a scale of 0 to 10 (0 means ‘extremely unlikely’ and 10 means ‘extremely likely’), the 0-6 raters (detractors) are deducted from the 9-10 raters (promoters). Prior corresponding period Prior half / Prior period Run-off Refers to the six months ended 30 September 2017. Refers to the six months ended 31 March 2018. Scheduled and unscheduled repayments and debt repayments (from, for example, property sales and external refinancing), net of redraws. Second Half 2018 Six months ended 30 September 2018. Women in Leadership refers to the proportion of women (permanent and maximum term) in leadership roles across the Group. It includes the CEO, Group Executive, General Managers, senior leaders with significant influence on business outcomes (direct reports to General Managers and their direct reports), large (3+) team people leaders three levels below General Manager, and Bank and Assistant Bank Managers. Women in Leadership 142 | Westpac Group 2018 Full Year Financial Results Announcement Other Asset quality (cont’d)

Exhibit 2
2018 Full Year Results For the twelve months ended 30 September 2018 Presentation and Investor Discussion Pack Westpac Banking Corporation | ABN 33 007 457 141

Westpac 2018 Full Year Results index 3 Image on front 2018 Full Year Result Presentation 32 Westpac banker Anna Thorpe helped sheep farmer Greg Woodlock fund the expansion of his dam to capture much needed water for his property ‘Kaloola’, The Marra, NSW Investor Discussion Pack of 2018 Full Year Result 33 Strategy Overview Performance discipline Service leadership Workforce revolution Digital transformation Sustainable futures 40 43 45 47 48 56 Image on right Westpac Melbourne head office, 150 Collins Street, Melbourne, Victoria Earnings Revenue Expenses Impairments 60 61 66 68 69 Credit quality 94 Capital, Funding and Liquidity Divisional results Consumer Bank Business Bank BT Financial Group Westpac Institutional Bank Westpac New Zealand 105 106 109 112 116 119 125 Economics 141 Appendix and Disclaimer 150 Contact us 151 Disclaimer
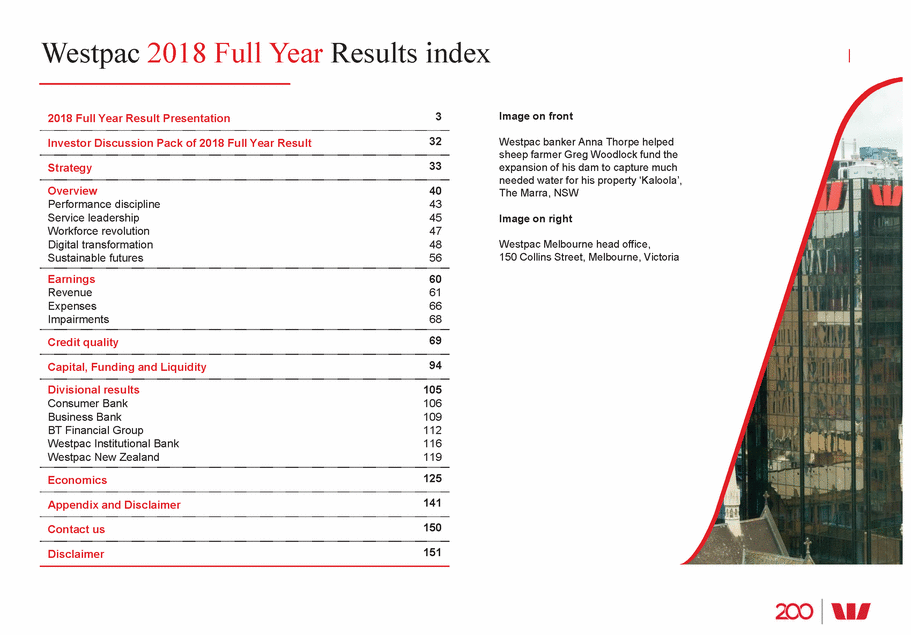
Brian Hartzer Chief Executive Officer Financial results throughout this presentation are in Australian dollars and based on cash earnings unless otherwise stated. Refer page 41 for definition. Results principally cover the FY18, FY17 and 2H18 and 1H18 periods. Comparison of 2H18 versus 1H18 (unless otherwise stated)
Flat result in a difficult year 4 Westpac Group 2018 Final Results Presentation & Investor Discussion Pack •Cash earnings little changed: strong first half, soft second half •Balance sheet in great shape across all dimensions •Challenges -Royal Commission/regulatory actions -Higher cost of funds and full year impact of the bank levy -Customer remediation -Slowing system credit growth •Business unit performance mixed -NZ, Business Bank were standouts -WIB affected by lower markets income -BT and Consumer impacted by customer remediation and margins •Continuing to deliver on our strategy •Australian economy doing well; challenges remain for banks
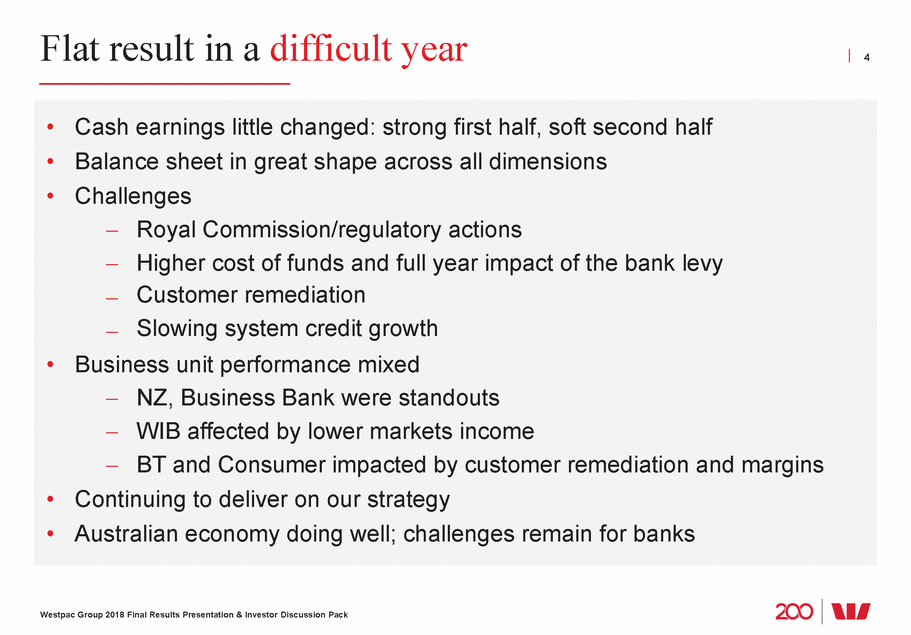
Earnings snapshot 5 1 Cash EPS is cash earnings divided by the weighted average ordinary shares. 2 Return on equity is cash earnings divided by average ordinary equity. 3 Cash earnings basis. 4 Cents per share. Westpac Group 2018 Final Results Presentation & Investor Discussion Pack ChangeChange FY18FY18 – FY172H18 – 1H18 Reported net profit after tax$8,095m 1%(7%) Cash earnings$8,065m-(10%) Cash EPS1 236.2c (1%) (11%) Return on equity (ROE)2 13.0%(77bps)(188bp) Net tangible assets per share$15.39 5%3% Margin (excl. Treasury & Markets)3 2.00%1bp (10bps) Expense to income ratio3 43.7% 143bps 393bps Impairment charge to average loans 10bps(3bps) (2bps) Final dividend4 (fully franked)94cps--
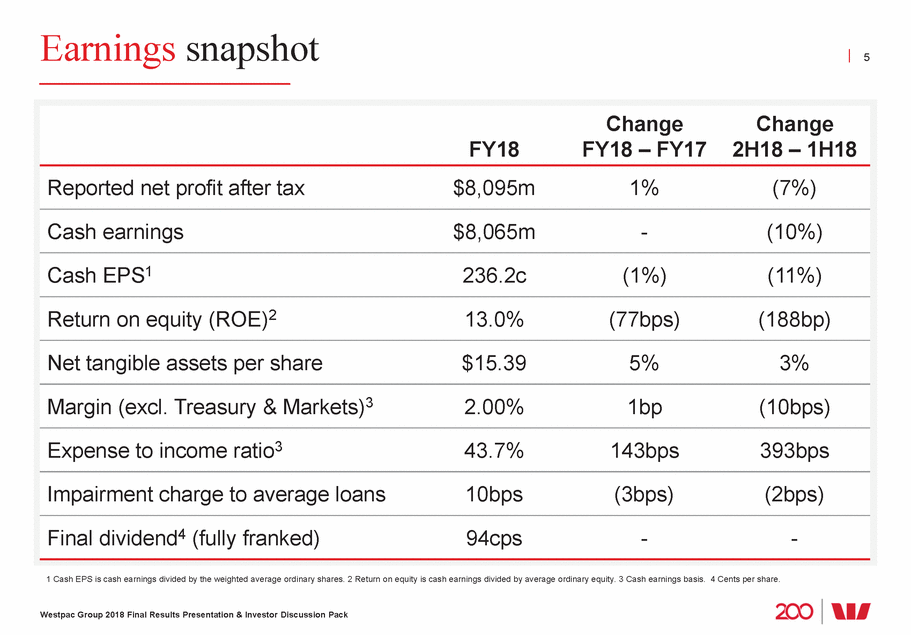
Balance sheet remains strong 6 55 12 10 45 6 5 1 Common equity Tier 1 capital ratio on an APRA Basel III basis. 2 LCR is Liquidity coverage ratio, NSFR is Net stable funding ratio. Westpac Group 2018 Final Results Presentation & Investor Discussion Pack Stressed exposures to total committed exposure (%) 1.05 Sep-12 Sep-13 Sep-14 Sep-15 Sep-16 Sep-17 Mar-18 Sep-18 2.17 1.60 1.24 1.20 1.09 1.08 0.99 Aust/NZ 90+ day delinquencies (%) 2.4 Aus mortgages 2.0 1.6 1.2 0.8 0.4 0.0 Sep-12 Sep-13 Sep-14 Sep-15 Sep-16 Sep-17 Sep-18 NZ mortgages Aus unsecured consumer NZ unsecured consumer Common equity Tier 11 (ratio % and $bn) $bn Ratio (%) 10.6 10.6 11 50 9.1 9.0 9.5 9.5 9 40 8 35 7 30 25 20 4 15 3 Sep-12 Sep-13 Sep-14 Sep-15 Sep-16 Sep-17 Sep-18 45 8.2 43 39 34 30 28 25 Liquidity ratios2 (%) LCR NSFR Mar-17 Sep-17 Mar-18 Sep-18 134 133 125 124 114 112 109 108
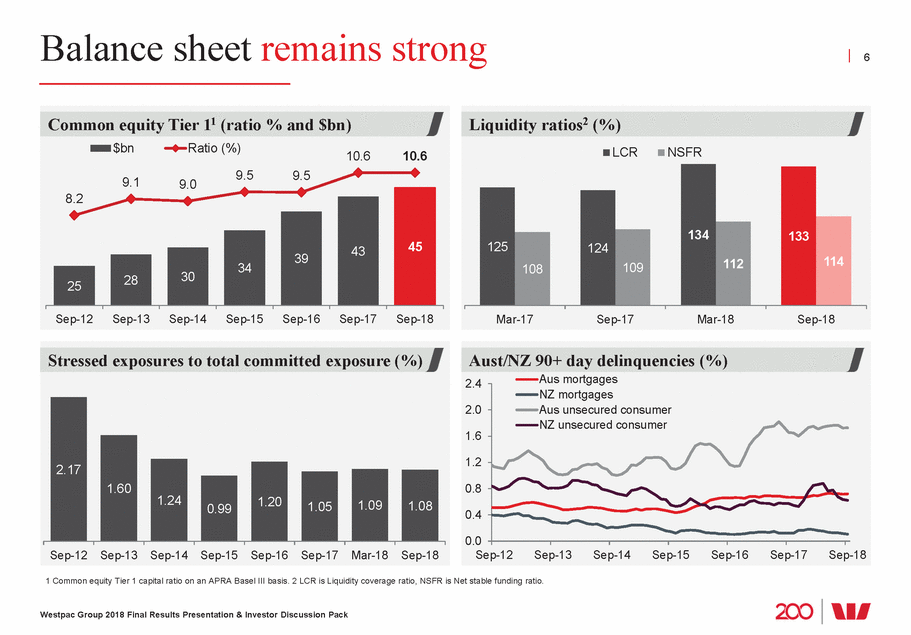
Divisional performance 7 Business Bank 8 BT Financial Group (12) (6) Institutional Bank • Margins well managed (up 6bps) New Zealand (NZ$) 5 Westpac Group 2018 Final Results Presentation & Investor Discussion Pack Cash earnings by division FY18 - FY17 (% change) • Good volume growth offset by margin pressure (down 7bps) Consumer Bank-• Margins lower from mortgage spreads, funding costs • Expenses up 5% reflects remediation and investment • Core earnings up 5%, good fee growth, margins well managed • Impairments down from lower write-offs • Growth in insurance and private wealth offset by lower advice revenue and provisions for remediation • Positioning business for new environment – reduced platform fees, run-down of legacy products Westpac• Revenue impacted by lower markets income and fewer large transactions • Business performing well after phase 1 of restructuring • Good growth, margins up and expenses down
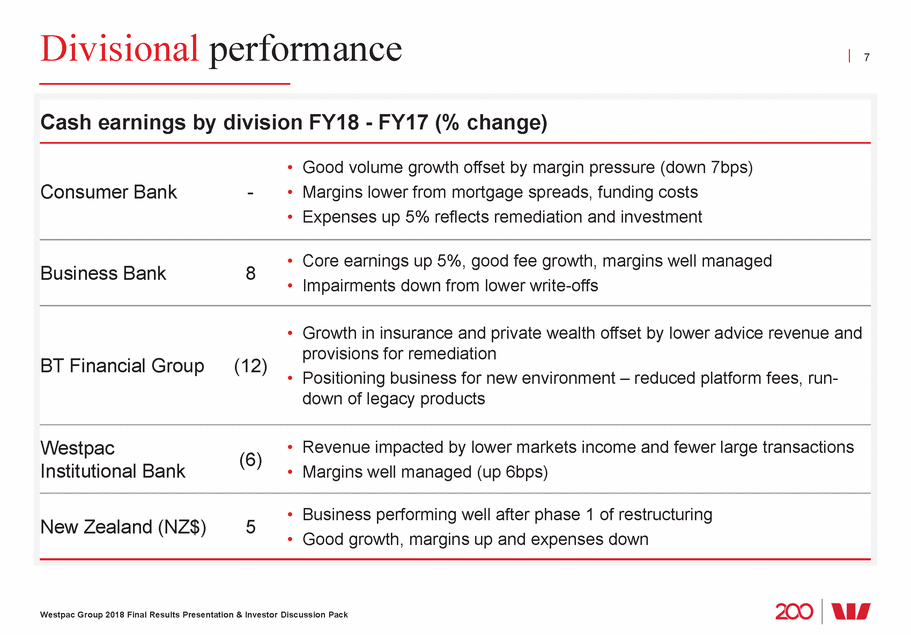
Strategy unchanged, adapted to environment 8 Deal with outstanding issues 1 Non negotiables: • Balance sheet strength • Credit quality Momentum in customer franchise 2 • Return disciplines • Culture • Great service Structural cost reduction 3 Westpac Group 2018 Final Results Presentation & Investor Discussion Pack
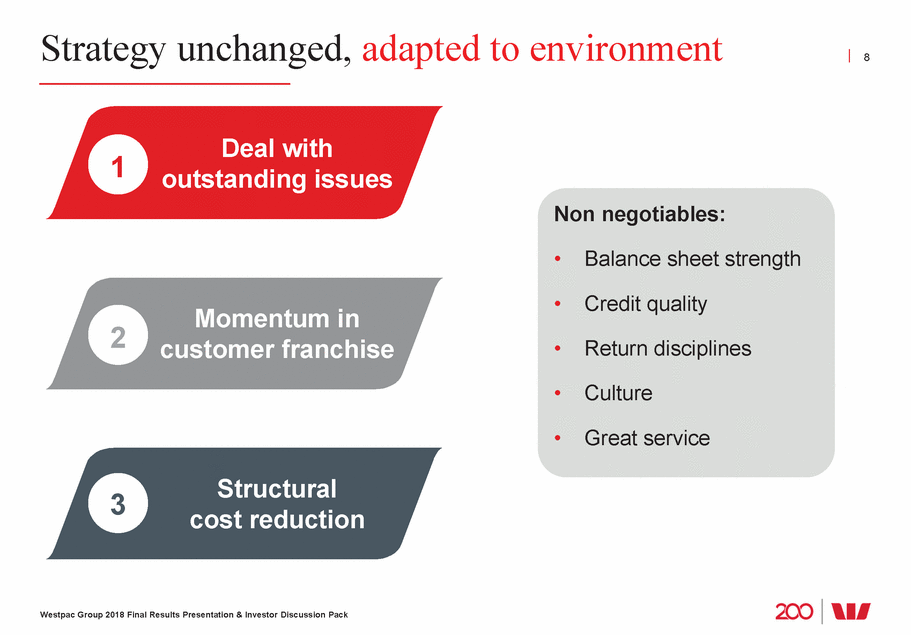
1. Deal with outstanding issues 9 Westpac Group 2018 Final Results Presentation & Investor Discussion Pack Continuing consumer product reviews •Significant number of products reviewed •Halved number of products offered in the Consumer Bank over 3 years Customer remediation provisions •No advice or no record of advice (salaried financial planners) •Inappropriate advice (exited planners) •Other product/operational issues Removed grandfathered commissions to employed financial advisors Litigation
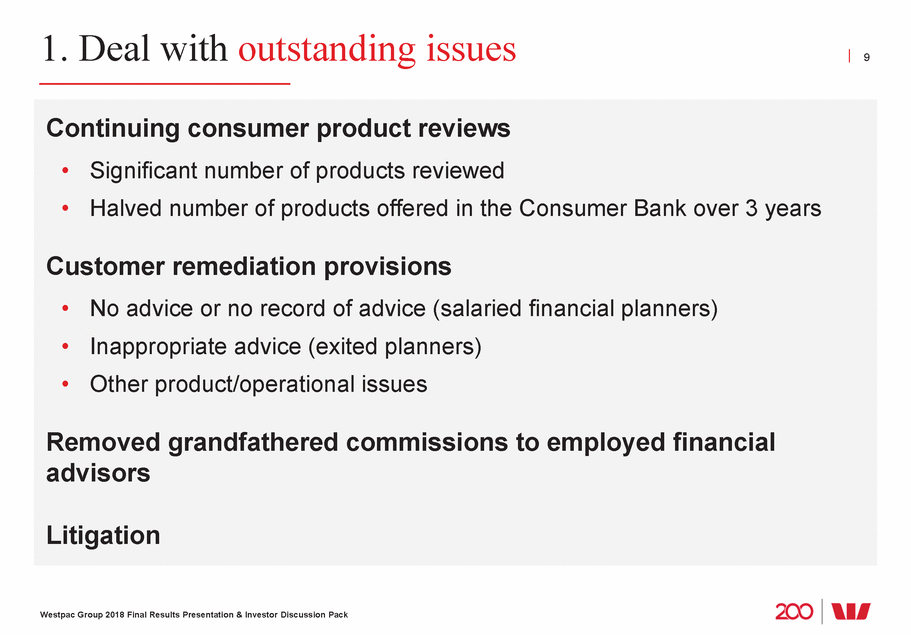
2. Momentum in customer franchise1,2 10 250k new Panorama pricing model 80% of SME loans originated online via LOLA and DriveOnline platforms Service quality Promoter Score Consumer Bank #2 Bank #1 73% sentiment ps Uplift in outbound contact by bankers 1 See page 148 for definitions. 2 Growth FY17 to FY18. Digital/branch metrics are 2H18 on 2H17. 3 Excludes mortgages. Westpac Group 2018 Final Results Presentation & Investor Discussion Pack Cost to serve Customer retention Business Emp loyee • • Improved complaints handling • Launched life events marketing • Call centre wait time down ~ two thirds • Branch transactions down 7% • Digital now >30% of sales3 • ~1 billion mobile logins • 48% of accounts receive e-statements, up 5p New customers Depth of relationship • Australian banking customers reached 11m, to bank • Consumer transaction balances up 6% • Doubled investors on Panorama 31% rise in Advisers using Panorama Net • New • Presto fo • r merchants a new payment/cash flow solution • New digital banking services: -Siri, Alexa, and Google Assistant -Beem It mobile payments app -Digital mortgage application
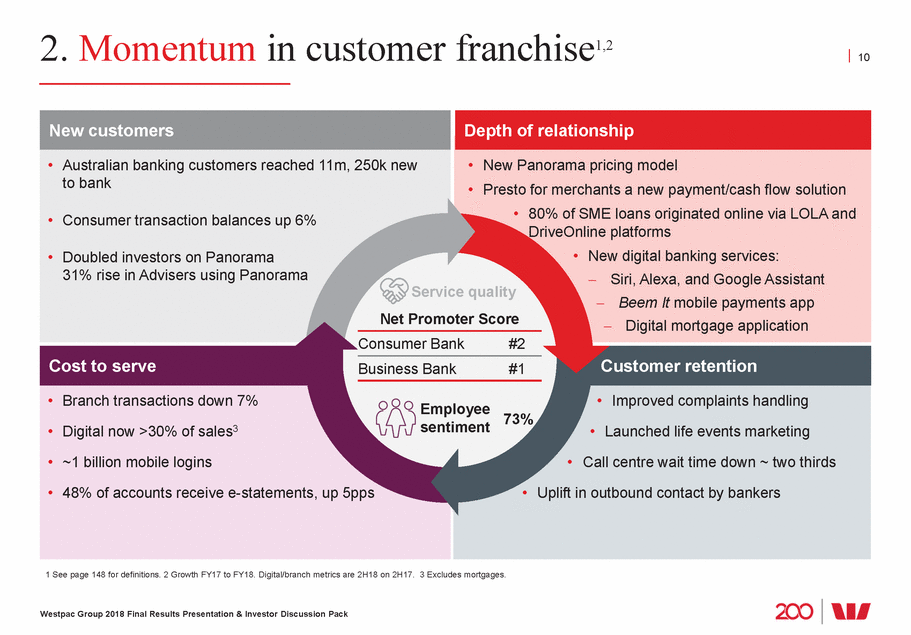
3. Structural cost reduction: Run costs flat 11 158 71 Hastings 87 1 Numbers do not add due to rounding Westpac Group 2018 Final Results Presentation & Investor Discussion Pack Expenses by type1 ($m) 9,586 8,9319,105112 Remediation Regulation and compliance Investments (excl regulation) Run costs (business as usual) FY16FY17FY18 $263m$262m$304mAnnual productivity savings 1,192 1,008 924 1,110 985 903 7,041 7,016 7,017
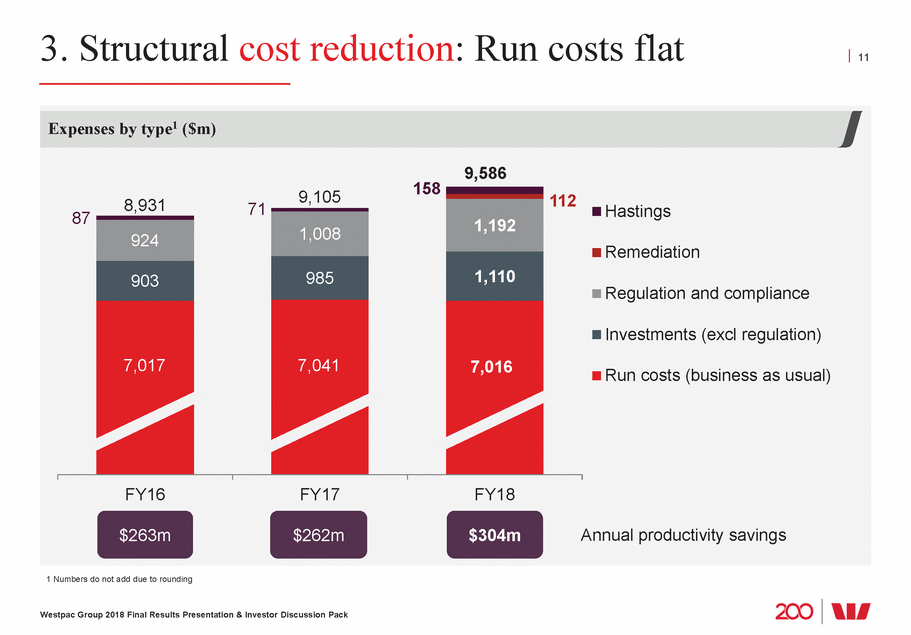
3. Structural cost reduction: $304m in 2018 12 120 APIs in use 1 Excluding BT. 2 See page 148 for definitions. Digital metrics are 2H18 vs 2H17 unless stated. Westpac Group 2018 Final Results Presentation & Investor Discussion Pack SimplifyProduct rationalisation • 35 products1 closed or exited Process simplification • Four of six key home loan processes automated $180m Operating model changes • Better alignment of bankers with customers DigitiseReplace paper • 48% of accounts now on e-statements Digital self service and sales2 • Digital transactions up 10% $61m and ATM rationalisation • 47 branches closed, 443 fewer ATMs for the Group ModerniseCustomer Service Hub (CSH) • Pilot launched CSH in Westpac (proprietary channels) echnology modernisation • Private cloud in place; 69 applications removed, $63m optimisation • Around 180 contract re-negotiations/reviews
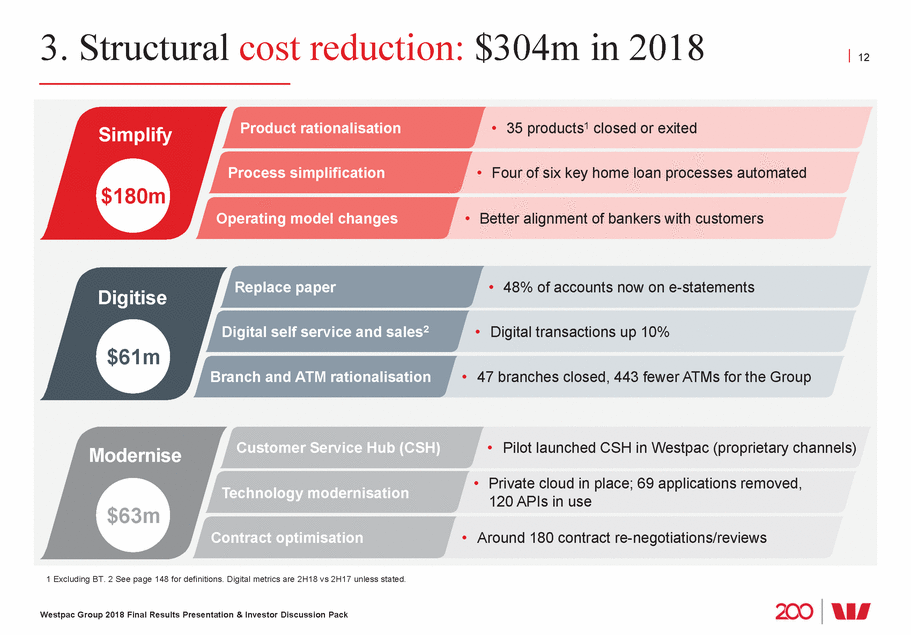
Significant progress on technology transformation 13 2018 2019 2020+ Brokers Consolidate more payment types onto the common payments platform Build out and re-use APIs Integrate more data; extend analytics use cases Continue to enhance cyber security controls Migrate more applications and data to cloud Westpac Group 2018 Full Year Results Presentation & Investor Discussion Pack Private cloud established Dual site offsite private cloud live Infrastructure Transformation Infrastructure Capability upgrade Cyber Security Extend functionality, decommission old, roll out globally New HR system live for Aust. Rolling out new desktop People Management Improve resilience and scalability Big data platform live Big Data Platform Staff enablement API Platform launched API platform migrated to dual site cloud Westpac Digital Platform Roll out to Westpac brand Extend to all regional brands New Payments Platform Superannuation and wrap platforms migrated to Panorama BT Cash Mgmt launch (Panorama) Corporate Super launch Wealth Platforms Customer Roll out to Mortgage Pilot Roll out to Westpac brand (early 2019) and St.George (late 2019) Extend across other products/services Customer Service Hub
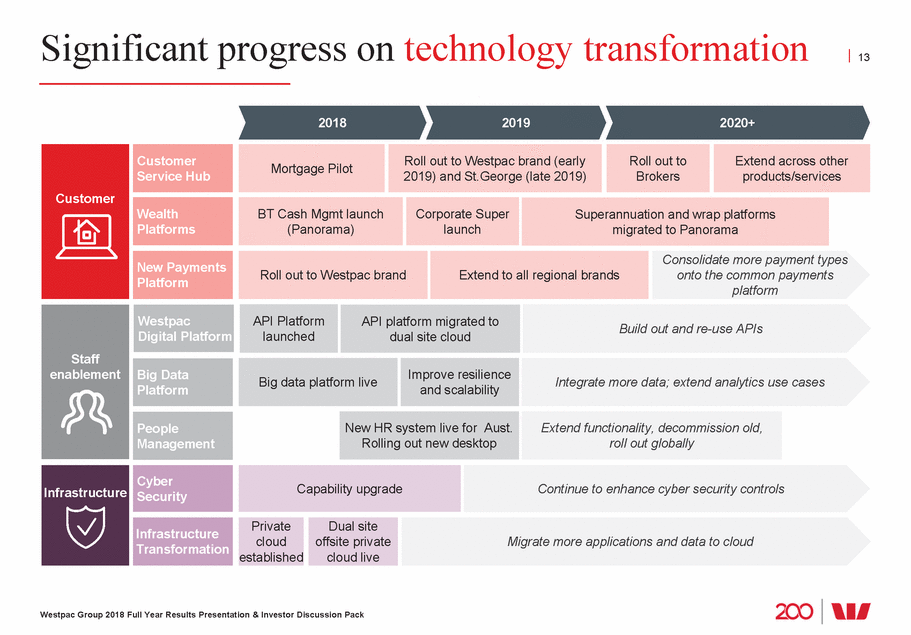
Summary 14 Westpac Group 2018 Final Results Presentation & Investor Discussion Pack •Flat result; stronger balance sheet •Impairment losses at cyclical lows •Strong business portfolio – some short term issues •Remaining focused on improving service for customers •Delivering innovative and modernised digital platform
Peter King Chief Financial Officer
Result impacted by remediation and funding costs 16 (278) 1 NCI is non-controlling interests. Westpac Group 2018 Full Year Results Presentation & Investor Discussion Pack FY17 Net interest income Non-interest income Expenses Impairment charges Tax & NCI¹ FY18 1H18 Net interest income Non-interest income Expenses Impairment charges Tax & NCI¹ 2H18 Cash earnings movements ($m) full year 635 (240) (481) 8,062 143 (54) 8,065 Flat Incl. $163m rise in remediation costs Cash earnings movements ($m) half on half 4,251 (263) (88) 1163,814 76 Down 10% Incl. $430m rise in remediation and funding costs
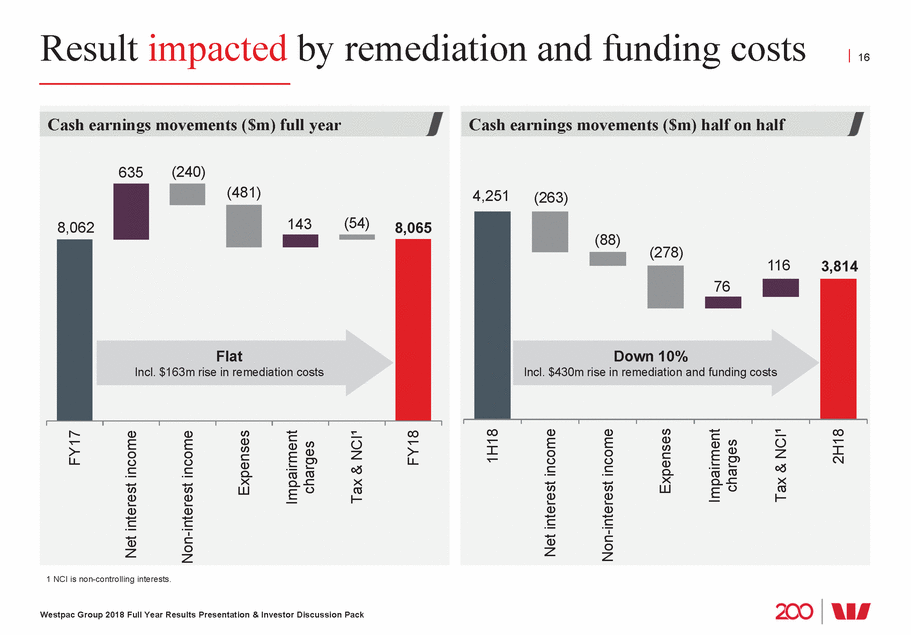
Infrequent/volatile items 17 Remediation2 $281m (after tax) Divisional impact BTFG: $141m, Consumer Bank: $110m, Other $30m Small impact on cash earnings, more significant impact on line items Hastings exit 1 CVA is credit valuation adjustment. 2 Remediation includes provisions for customer refunds and payments and associated costs and estimated litigation costs. Westpac Group 2018 Full Year Results Presentation & Investor Discussion Pack Hastings P&L ($m) 1H182H18FY18 Revenue23181204 Expenses(37)(121)(158) Core earnings(14)6046 Cash earnings(2)1917 Infrequent/volatile items ($m after tax) 2H171H182H18 Asset sales–(7)0 Fund manager revaluations(3)–(13) Group CVA120(1)13 Provisions for remediation2(118)–(281) Total cash earnings impact(101)(8)(281) Key items
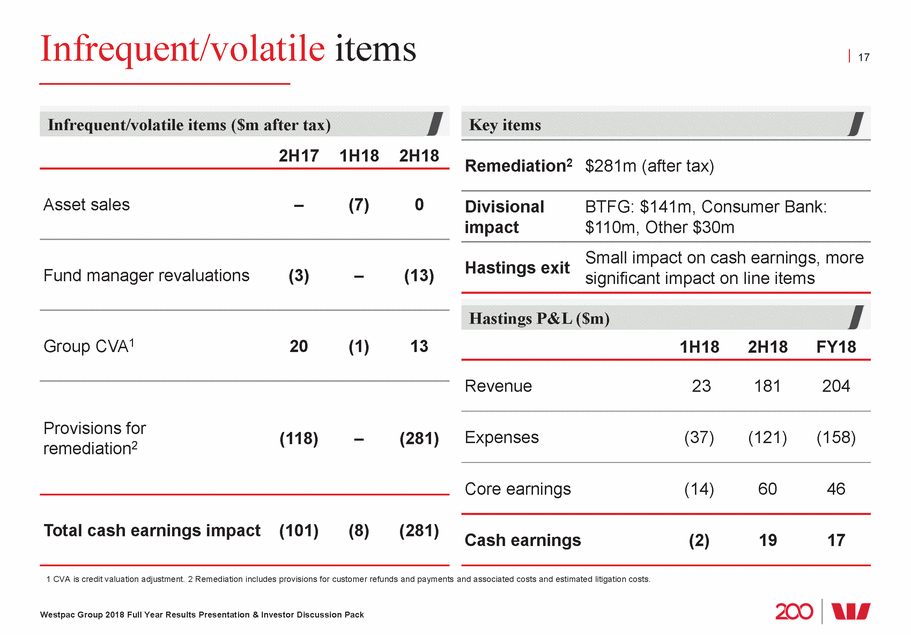
Australian mortgage growth moderating 18 Mortgage portfolio flow composition (%) 1H17 2H17 1H18 2H18 Owner occupied growth 3 4 3 3 4 1 1 Investor growth 3 Basic (% of flow) 22 14 20 29 Fixed rate (% of flow) 23 36 30 23 New mortgage lending dynamics (%) 1H18 2H18 Approvals/Applications 93 93 No. of new loans (change HoH) -10 -5 Average loan size (change HoH) 6 1 New lending (change HoH)2 -5 -4 1 I/O is interest only mortgage lending. P&I is principal and interest mortgage lending. 2 New lending by amount drawn. Westpac Group 2018 Full Year Results Presentation & Investor Discussion Pack Australian mortgages ($bn) and mix (%) 3.2% 2.4% 1.7% $414 $427 $437 $445 % of portfolio Line of credit P&I¹ I/O¹ 5 56 45 49 61 50 46 40 35 Mar-17 Sep-17 Mar-18 Sep-18 Interest only book down $53bn since Mar-17: • Lower I/O flows (19% of 2H18 new flow) • Switching to P&I ($51bn over 18 months) • I/O repayments (11% of balances)
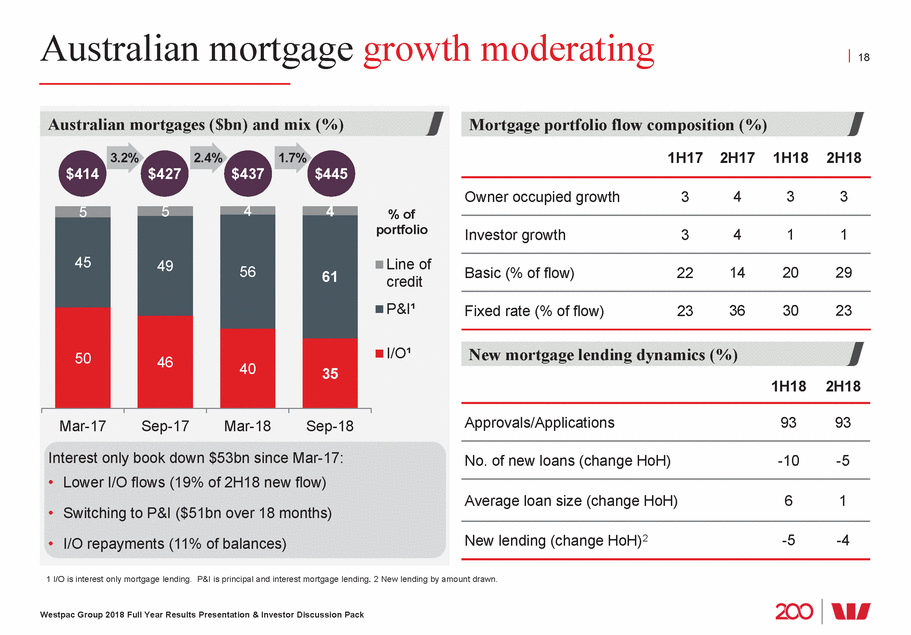
Margins impacted by competition, cost of funds, Treasury 19 2.05 2.14 2.11 2.11 2.11 2.10 2.07 2.06 2.05 2.05 . Westpac Group 2018 Full Year Results Presentation & Investor Discussion Pack Long term margin trend (%) NIM NIM excl. Treasury & Markets 2.17 1.98 1.98 1.97 2.01 2.03 2.01 1.96 2.02 2.05 1.95 1H14 2H14 1H15 2H15 1H16 2H16 1H17 2H17 1H18 2H18 Net interest margin movement (% and bps) NIM excl. Treasury & Markets Treasury & Markets impact on NIM 2.17 (2bps) (5bps) 0.12 (4bps) 1bp 0bp 1bps (1bps) (2bps) 2.05 Down 12bps 0.10 1.95 1H18 Remediation W'sale Loans Customer Term Capital & Liquidity Treasury & 2H18 provisions funding BBSW deposits w'sale funding other Markets
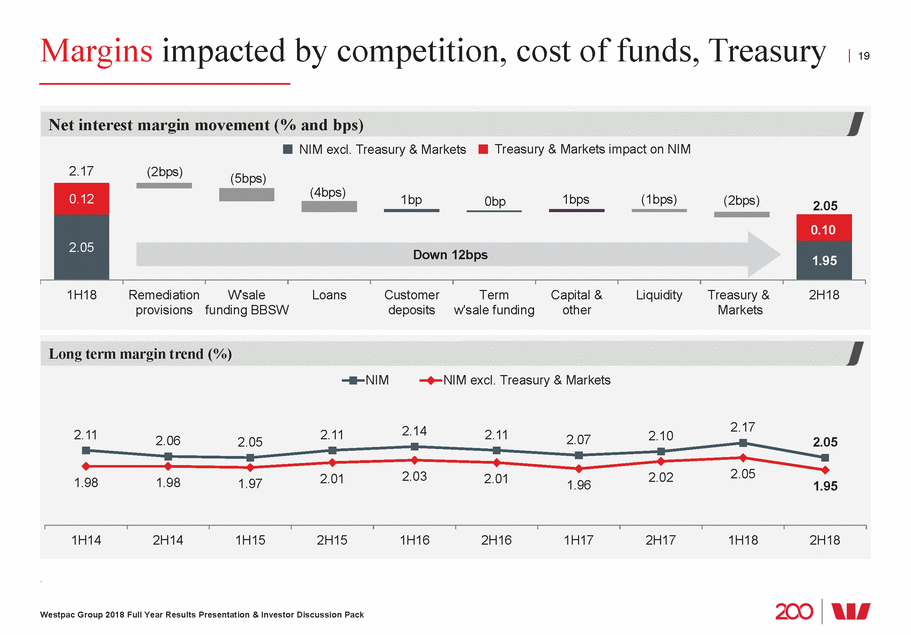
Treasury1 Markets & income skewed to 1H18 20 969 896 1 Includes net interest income and non-interest income but excludes derivative valuation adjustments. Westpac Group 2018 Full Year Results Presentation & Investor Discussion Pack Markets non-customer and Treasury income ($m) 1H 2H 1,030 1,002 2015 2016 2017 2018 918 484 349 395 507 653 574 546 411 Markets customer income ($m) 1H 2H 935 912 918 2015 2016 2017 2018 462 447 436 448 482 473 465 448
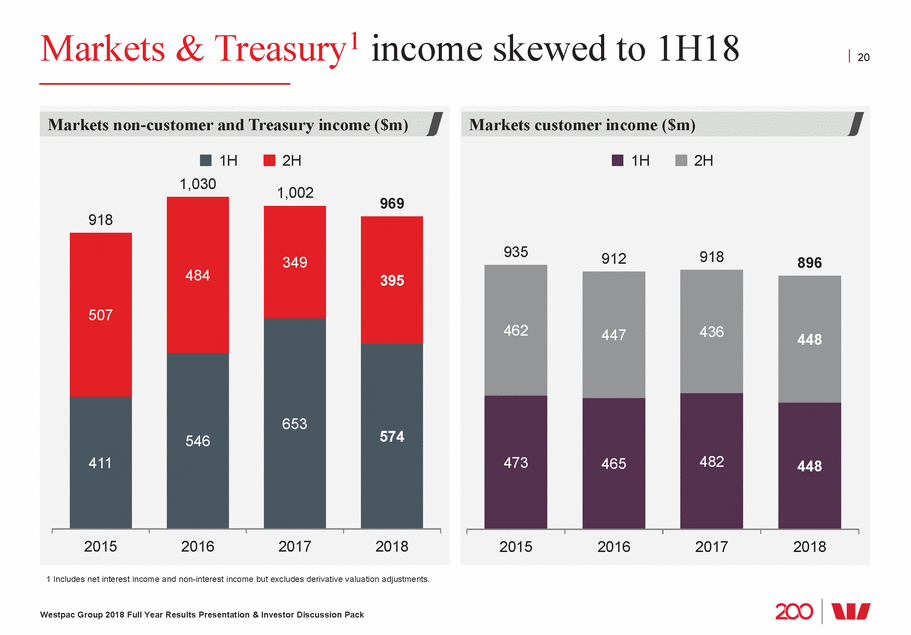
Non-interest income down from trading 21 11% 17% 18% Total 3% Commissions Insurance and Other 2,850 2,784 - Provisions for customer refunds 2,762 remediation Hastings Infrequent items 1 Customer refunds and payments. 2 Fees earned associated with Hastings exit. Westpac Group 2018 Full Year Results Presentation & Investor Discussion Pack Components of non-interest income ($m) Fees & Wealth and Trading + Higher business lending fees, + Increased Hastings income - Lower non-customer & cards fees + Lower insurance claims markets income and payments ($156m) + Revaluation of boutiques 1% 2% n 18% 2H17 1H18 2H18 2H17 1H18 2H18 2H17 1H18 2H18 2H17 1H18 2H18 - Provision for customer 1,329 1,348 1,358 refunds ($7m) Up excl. (156) 1 1,088 1,202 924 929 144 2 531 573 944 Up excl. Dow 472
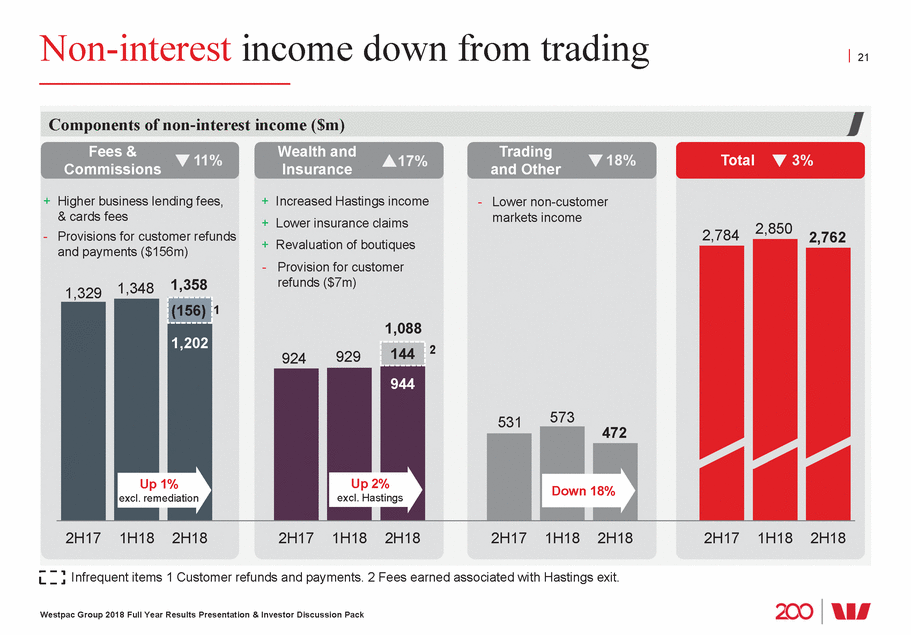
Expenses higher from infrequent items 22 New Payments Platform, Customer Service Hub and Panorama Platforms Strengthening infrastructure Cyber security, network and system refresh, private cloud BEAR, regulatory and compliance costs and remediation resourcing Reg/Compliance 35,720 1 Hasting exit costs $17m 1H18, $104m 2H18. Westpac Group 2018 Full Year Results Presentation & Investor Discussion Pack 1H18 BAU Productivity Regulatory/ compliance Investment 2H18 underlying Remediation provisions Hastings (exit costs)¹ 2H18 1H18 BAU/volumes Productivity Regulatory/ compliance Investment 2H18 FTE movements 174 (775) 35,029 70 (160) Movement in expenses ($m) 874,932 112 126 (173) 66 4,733 4,654 60 Up 1.7% Up 6.0% 2H18 cost drivers
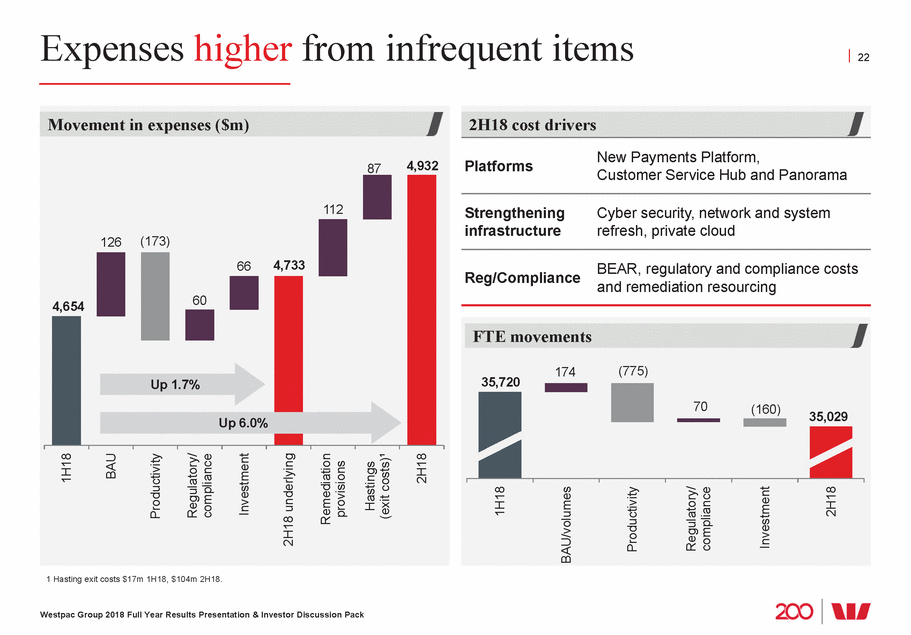
Credit quality sound 23 New Zealand dairy of stressed 1.09 1.08 1.05 0.0 1 TCE is total committed exposure. Westpac Group 2018 Full Year Results Presentation & Investor Discussion Pack Sep-10 Sep-11 Sep-12 Sep-13 Sep-14 Sep-15 Sep-16 Sep-17 Mar-18 Sep-18 Agri, forestry & fishing Wholesale & retail trade Property Services Property services & business services Construction Manufacturing Transport & storage Accommodation, cafes & restaurants Other Mining Stressed assets as a % of TCE1 3.20 Watchlist & substandard 90+ day past due and not impaired Impaired 2.48 2.17 1.60 1.24 1.20 2.07 0.46 0.67 1.45 0.41 0.62 1.24 0.35 0.58 0.85 0.31 0.44 0.71 0.99 0.54 0.260.25 0.270.20 0.65 0.56 0.330.34 0.220.15 0.57 0.37 0.15 0.55 0.39 0.14 Corporate/business stressed exposure by sector ($bn) 1.6 1.4 1.2 1.0 0.8 0.6 0.4 0.2 improvement Two names into stressed Two names out
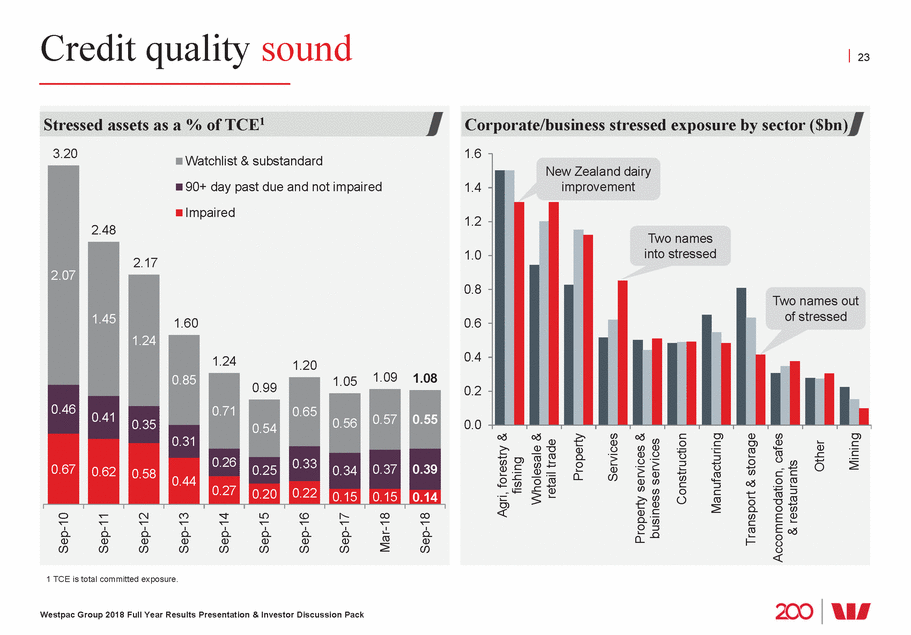
Australian mortgages performing well 24 Customers ahead of repayments 70% 68% 69% 1 Including offset balances. Westpac Group 2018 Full Year Results Presentation & Investor Discussion Pack Property in possession (number) 437 WA QLD Other Mar-17 Sep-17 Mar-18 Sep-18 382 129 398 396 135 152 127 146 122 128 103 162 141 141 127 Australian mortgage portfolio characteristics Sep-17 Mar-18 Sep-18 30+ day delinquencies 130bps 144bps 140bps 90+ day delinquencies 67bps 69bps 72bps 1 Dynamic LVR (weighted average) 52% 52% 54% Australian mortgage portfolio delinquencies (%) 3.0 90+ day past due 2.0 1.0 0.0 Sep-14 Mar-15 Sep-15 Mar-16 Sep-16 Mar-17 Sep-17 Mar-18 Sep-18 90+ day past due investor 30+ day past due Introduced new hardship treatment Australian mortgages 90+ day delinquencies by State (%) 3.0 2.0 1.0 0.0 Mar-15 Sep-15 Mar-16 Sep-16 Mar-17 Sep-17 Mar-18 Sep-18 NSW/ACT VIC/TAS QLD WA SA/NT ALL Introduced new hardship treatment
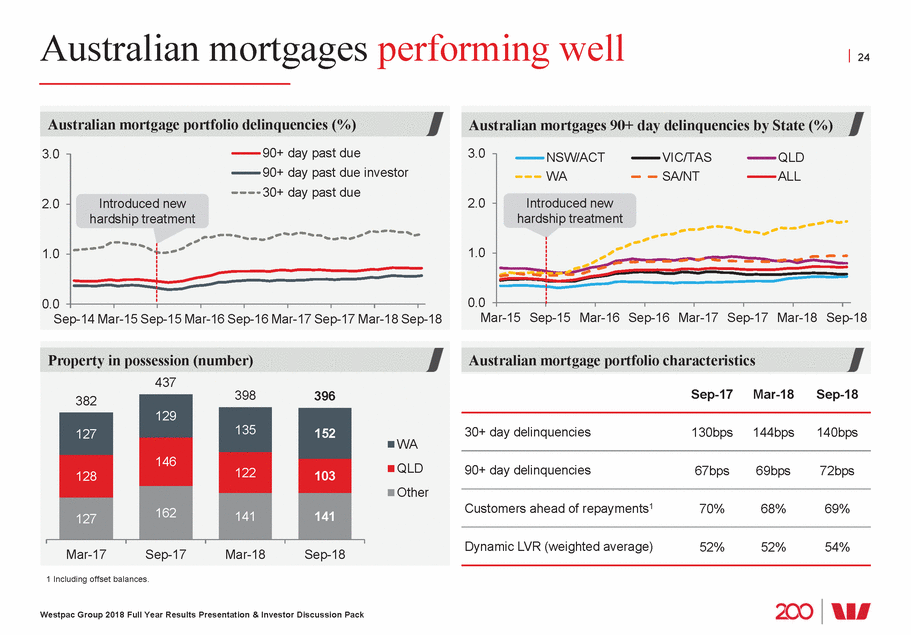
Well collateralised mortgage portfolio 25 by origination date and dynamic LVR2 (%) 1 Analysis based on a portfolio of residential mortgages. Some mortgages not included as they were originated on different systems and have some data differences i.e. RAMS, certain business mortgages (including construction) and SMSF loans. 2 Dynamic LVR is the loan-to-value ratio taking into account the current loan balance, estimated changes in security value, offset account balances and other loan adjustments. Property valuation source Australian Property Monitors. 3 Changes in house prices based on house price indicies (and average not separate valuations) Source: Westpac Economics, CoreLogic. All dwellings Australia - average 8 major capital cities. Prices to September 2018. Westpac Group 2018 Full Year Results Presentation & Investor Discussion Pack Australian housing LVRs (%) Portfolio LVR at origination 80% of portfolio 49 54 0<=60 60<=70 70<=80 80<=90 90<=95 >95 Portfolio dynamic LVR 90% of portfolio 57 712 0<=60 60<=70 70<=80 80<=90 90<=95 >95 16 17 17 14 11 Australian mortgages1 2015 commenced tighter lending standards Dynamic LVR bands (% of total) >80 60-80 <=60 <2011 2011-2014 2015+ % of total portfolio 17% 24% 59% Interest rate floor (%) 6.80 6.80 7.25 Interest rate buffer (%) 1.80 1.80 2.25 Average house price changes3 At least 33% 19% - 42% (4%) – 18% 6 8 14 14 23 45 80 69 41
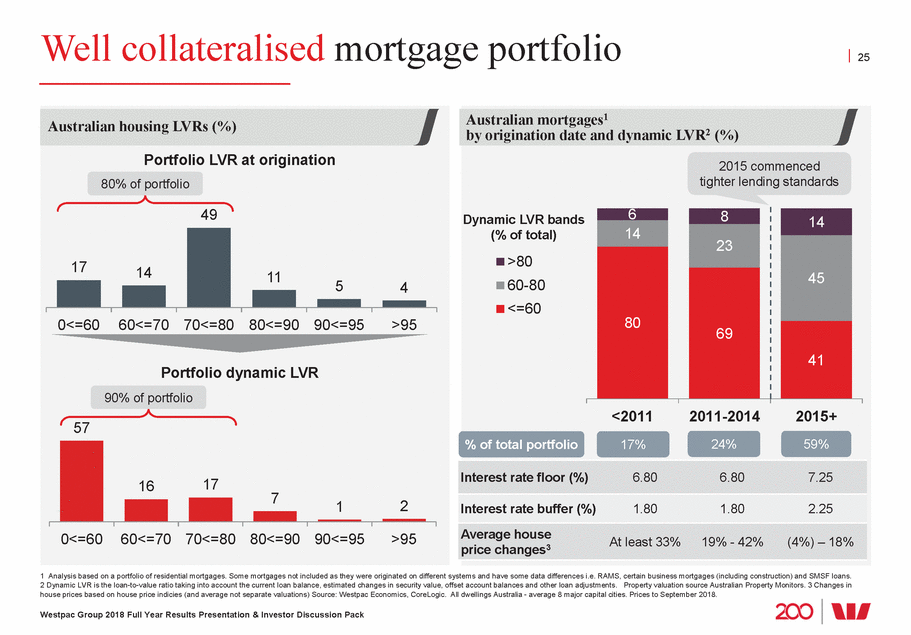
Impairment charge low at 9bps 26 Write-backs Write-offs New IAPs in Collective 1 Interest carrying adjustment is reported in net interest income and not in the impairment charge. Westpac Group 2018 Full Year Results Presentation & Investor Discussion Pack 1H17 364 2H17 246 1H18 173 2H18 198 1H17 (228) 2H17 (228) 1H18 (167) 2H18 (162) 1H17 443 2H17 525 1H18 430 2H18 428 1H17 (86) 2H17 (183) 1H18 (43) (147) 2H18 493 1H17 2H17 360 1H18 393 2H18 317 Individually assessed provisions ($m)Collectively assessed provisions ($m)Total ($m) Other movement & recoveriesdirectprovisions Interest carrying adjustment ($m)1 96 95 93 89
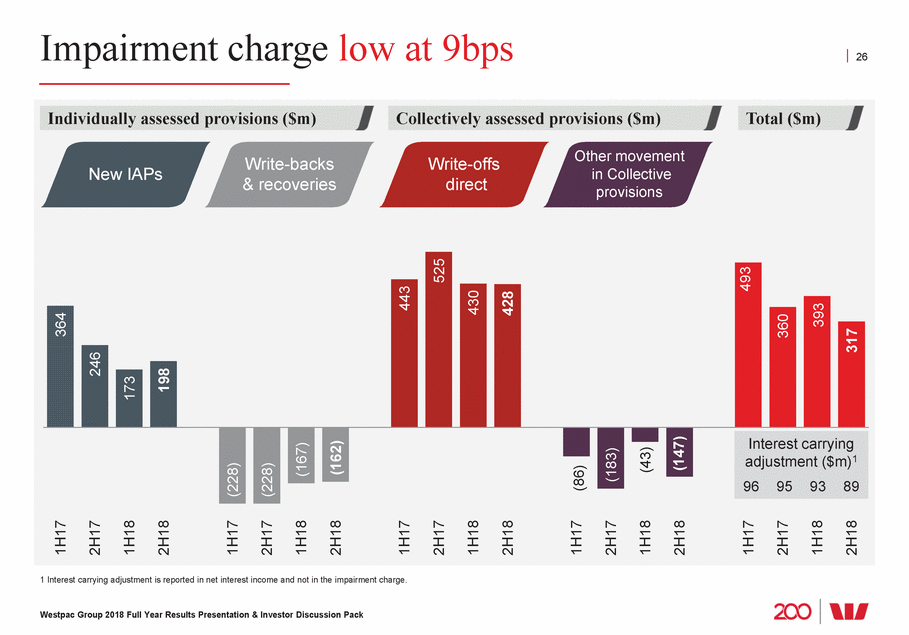
CET1 ratio 10.6% 27 APRA APRA earnings dividend RWA movements RWA model $566m CPS investments translation APRA Int. Comp. introduction related to credit of $1.65bn • Proforma CAP2 to Credit RWA rises to 99bps (from and capital deductions 1 Internationally comparable methodology aligns with the APRA study titled ‘International Capital Comparison Study’ dated 13 July 2015. 2 Collectively assessed provision balance. Westpac Group 2018 Full Year Results Presentation & Investor Discussion Pack Impact of AASB 9 on capital 4.7 • Minimal (<1bps) impact on capital from AASB 9 • Expect ~$974m lift in accounting provisions • New provisions below current capital deductions Accounting capital AASB 139 provisions New AASB 9 provisions 30 Sept 2018 1 Oct 2018 73bps) REL 4.0 3.1 Stage 1 CAP Stage 2 Stage 3 IAP CET1 capital ratio (% and bps) 16.14 Organic +20bps Other -7bps 10.56 10.50 90 (68) 3 (5) (30) 14 5 4 10.63 Higher RWA for operational risk and mortgages Up 13 basis points Sep-17 Mar-18 Cash Final Ordinary Other capital Impacts of Residual Exit of FX Sep-18 Sep-18 1 (net of DRP) growth changes converted impact
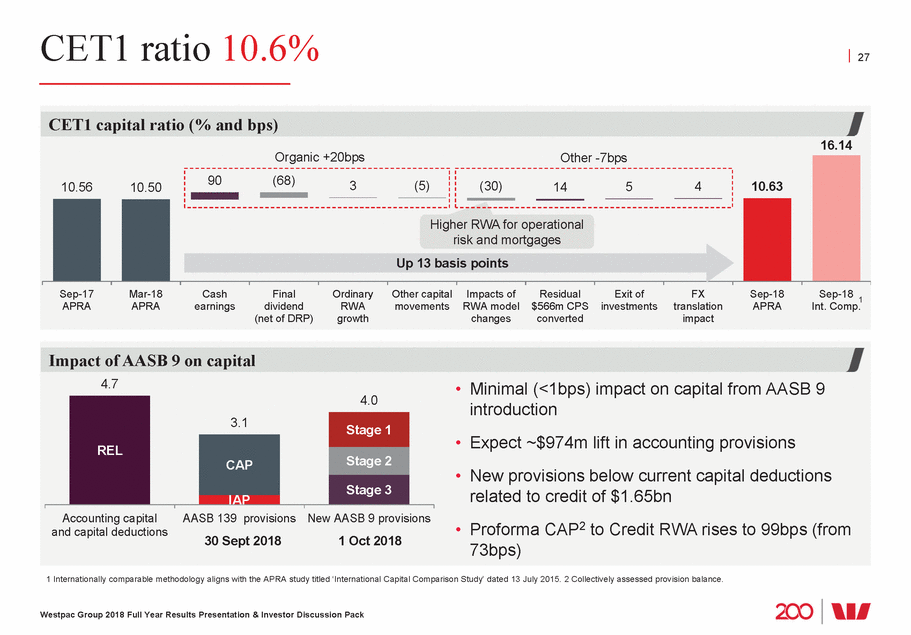
Unchanged dividend 28 93 92 90 76 74 72 72 71 681 65 64 1 Includes conversion of CPS to ordinary shares. 2 2H18 assumes DRP participation rate of 10%. Westpac Group 2018 Full Year Results Presentation & Investor Discussion Pack Dividend payout ratio (%) Payout ratio (cash earnings basis) Effective payout ratio (after DRP shares issued) 74 74 77 74 80 80 79 79 761 85 2 49 51 1H14 2H14 1H15 2H15 1H16 2H16 1H17 2H17 1H18 2H18 Dividends per ordinary share (cents) 94949494949494 1H14 2H14 1H15 2H15 1H16 2H16 1H17 2H17 1H18 2H18 Dividend considerations • Sustainability of the payout ratio over the medium term • CET1 capital ratio = unquestionably strong benchmark • Surplus franking credits • FY18 Bank Levy equivalent to 8 cents per share
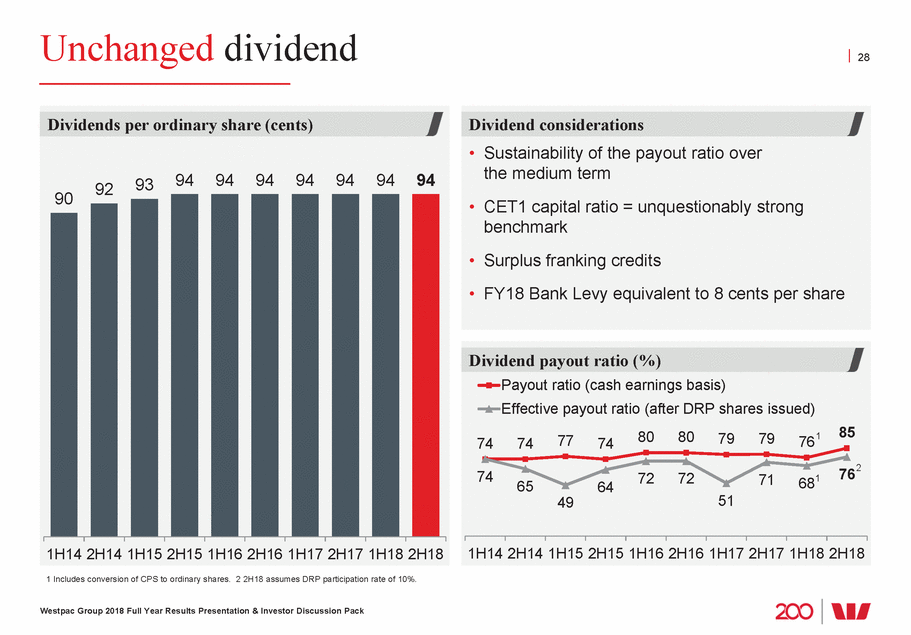
Considerations for FY19 29 1 FY18 cost base includes Hastings costs of $158m and remediation/litigation costs of $112. For FY19, the 1% reduction we are seeking to achieve excludes any potential remediation related costs/litigation and the impact of new accounting standards. Westpac Group 2018 Full Year Results Presentation & Investor Discussion Pack •Expect system credit growth to moderate •Continued focus on return •Margin: recent mortgage repricing to flow through, expect continued price competition and industry changes to calculation of credit card interest rates •Non-interest income: will reflect previously announced impacts of repositioning wealth •Expenses targeting 1% reduction on FY181 -~$400m of productivity savings •Credit quality: expected to remain in good shape •Capital: well placed for unquestionably strong
Brian Hartzer Chief Executive Officer

2019 priorities 31 • • • • ‘Get it right, put it right’ initiative Customer remediation programs Royal Commission response Advice model Deal with outstanding issues 1 • • • Roll out of Customer Service Hub Accelerate growth in Panorama Continue migration to digital sales Momentum in customer franchise 2 and service • • Lift productivity to ~$400m Targeting 1% cost reduction on FY181 Structural cost reduction 3 1 FY18 cost base includes Hastings costs of $158m and remediation/litigation costs of $112. For FY19, the 1% reduction we are seeking to achieve excludes any potential remediation related costs/litigation and the impact of new accounting standards. Westpac Group 2018 Final Results Presentation & Investor Discussion Pack
Financial results throughout this Investor Discussion Pack are in Australian dollars and based on cash earnings unless otherwise stated Refer page 41 for definition. Results principally cover the FY18, FY17 and 2H18 and 1H18 periods. Comparison of 2H18 versus 1H18 (unless otherwise stated)
Strategy

WBC listed on ASX & NZX Westpac Group at a glance: Australia’s First Bank Strategy 34 Pacific wealth administration Key statistics at 30 September 2018 Customers Key financial data for Full Year 2018 Reported net profit after tax 14.2m $8,095m Australian household deposit market share5 23% Cash earnings $8,065m Australian mortgage market share6 Expense to income ratio9 23% 43.7% Australian business credit market share6 19% Common equity Tier 1 capital ratio (APRA basis) 10.6% New Zealand deposit market share7 Return on equity9 18% 13.0% New Zealand consumer lending market share7 19% Total assets $880bn Australian wealth platforms market share8 19% Market capitalisation10 $96bn 1 30 September 2018 Source: S&P Capital IQ, based in US$. 2 Credit Suisse analysis of expense to income ratio of world’s largest banks October 2018. 3 S&P Global Ratings, Moody’s Investors Service and Fitch Ratings respectively. S&P Global Ratings has Westpac on a negative outlook, Moody’s Investor Services and Fitch Ratings have Westpac on a stable outlook. 4 A member of banking sector leadership group DJSI World, since 2002. Ranked leader in Sustainalytics ESG Rating. 5 APRA Banking Statistics, September 2018 6 RBA Financial Aggregates, September 18. 7 RBNZ, September 2018. 8 Strategic Insights June 2018, All Master Funds Admin. 9 Cash earnings basis. 10 Based on share price at 28 September 2018 of $27.93. Westpac Group 2018 Full Year Results Presentation & Investor Discussion Pack • In its 202nd year, Australia’s first bank and first company, opened 1817 Consumer Business BT Financial Institutional Westpac • Australia’s 2nd largest bank and 20th largest bank in the world; Bank Bank Group Bank New Zealand ranked by market capitalisation1 • Well positioned across key markets with a service-led strategy focused on customers • Supporting consumers and businesses in Australia and New Zealand and customers with ties to these markets • Unique portfolio of brands providing a full range of financial services including consumer, business and institutional banking, and • One of the most efficient banks globally2 • Consistent earnings profile over time • Capital ratios are in the top quartile globally, with sound credit quality • Credit ratings3 AA-/ Aa3 / AA-• Leader in sustainability4
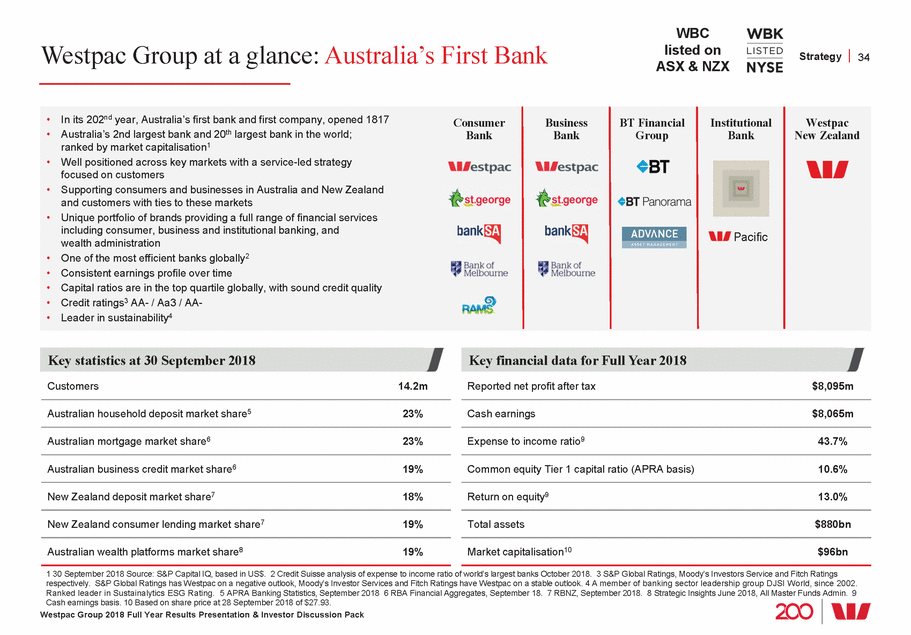
Progress on our strategic agenda Strategy 35 Our Vision: To be one of the world’s great service companies, helping our customers, communities and people to prosper and grow Strategic Priorities Service Leadership Performance Discipline Digital Transformation Targeted Growth Workforce Revolution Cost growth 2-3% per annum and expense to income ratio below 40% In FY19, aiming for 1% reduction in costs2 Employee engagement in top quartile of high performing norms, women in leadership1 50% Seeking to achieve 13-14% ROE (medium-term) Grow customer base and deepen relationships Stronger growth in wealth and SME Measures Expenses up 5% 8 Funds up 7% 9 Women in Customer numbers Leadership 50% 9 9 9 (continuing up 2% Customers with (3% excluding 9 Progress FY18 ROE 13.0% businesses) SME lending 9 up 3% infrequent items3) Employee sentiment 73%3 Down 77bps 9 a wealth product1 Expense to income down 1ppt 8 ratio 43.7% 8 1 Refer pages 148 & 149 for metric definitions. 2 Excluding changes in remediation related costs and the impact of new accounting standards. 3 Infrequent items include Hastings exit costs and provisions for estimated costs associated with customer payments and refunds and litigation settlements. 3 Employee engagement is surveyed every two years. In 2017, employee engagement was 79%. Employee sentiment survey conducted monthly. The six month rolling average of sentiment has been stable at 73% through the year. Westpac Group 2018 Full Year Results Presentation & Investor Discussion Pack
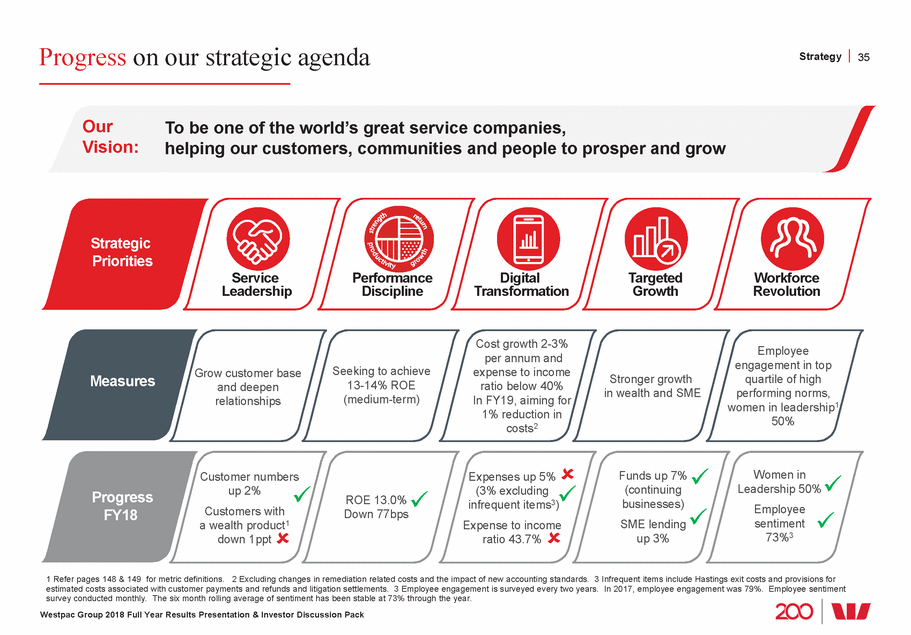
Rebuilding trust Strategy 36 monthly credit card repayment is due cards and block transactions to gambling firms down large items on their credit card into - Westpac Lite a “no frills” credit card partnership with Alzheimer’s Australia retail customers lose money through no fault of lending to farmer and agribusiness customers - Centralising complaints resources complaints handling - Complementing the work of Customer 1 Australian Banking Association. Westpac Group 2018 Full Year Results Presentation & Investor Discussion Pack Delivering for customers • Helping customers manage their finances - Ability to reduce credit card limit online - Enabling alerts via SMS or email 5 days before - Ability to restrict debit transactions on credit - Introduced Westpac SmartPlan, a structured repayment plan, enabling customers to break regular monthly instalments • Helping customers in times of need - Over 37,000 customers in hardship supported with financial assistance packages - Introduced dementia-friendly banking in - Fraud guarantee; monitor fraud and fix it when their own - $100m Drought Assistance Package to support • Enhancing complaints management - Strengthening policy and process around - Reducing long-standing matters Advocate Get it Right. Put it Right • Dedicated initiative to identify where we may not have got it right, and where problems are identified we fix them • Empowering employees to fix issues directly • Progressing a number of programs to improve products, policies, and procedures for customers. Changes implemented include: - Simplified and lowered fees for personal transaction accounts - Introduced simplified mortgage package product - Reduced FX fees for online payments - Updated credit policies around living expenses and commitments - New, shorter, plain-English loan documents and strengthened protections under small business contracts - Introduced least-cost routing on payment terminals for business customers - Removal of grandfathered commissions payments to salaried financial planners - Introduced simplified and lower pricing schedule for Panorama (funds administration platform) - Pricing and underwriting changes to life insurance, including applying minimum medical definitions to all products, including those no longer on sale Completed ABA1 six point plan 1. Reviewing product sales and commissions for bank staff - Sales incentives removed for tellers - Removed product sales targets for personal bankers 2. Making it easier for customers when things go wrong - Created a new division, Customer and Corporate Relations (Jul 18). To centralise and improve complaints management processes, solve issues faster, and better identify root-causes - Customer advocate appointed (Nov 16) - Prioritising long-dated complaints - Updated customer remediation policy and governance 3. Reaffirming support for whistleblowers - Updated whistleblowing policy (Nov 18) 4. Removing individuals from the industry for poor conduct - Implemented Conduct Background Checking Protocol, and consequence management framework 5. Strengthen commitment to customers in the Banking Code of Practice - Revised Banking Code of Practice approved July 2018 - Committed to implementing within 12 months of approval 6. Supporting ASIC as a strong regulator - New funding model in place
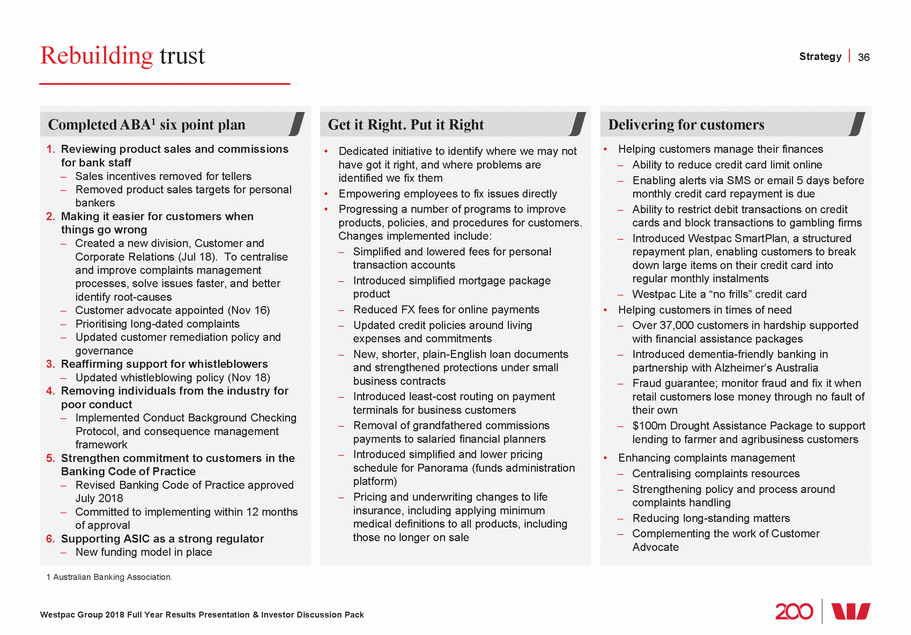
Building the franchise Strategy 37 - 16.1% CET1 capital ratio new issuance 1 RBA Financial Aggregates, September 18. 2 APRA Banking Statistics, September 2018. 3 Refer page s 148 & 149 for metric definitions and details of metric provider. 4 Strategic Insights June 2018, All Master Funds Admin 5 RBNZ, September 2018. 6 S&P Global Ratings, Moody’s Investors Service and Fitch Ratings respectively. S&P Global Ratings has Westpac on a negative outlook, Moody’s Investor Services and Fitch Ratings have Westpac on a stable outlook. Westpac Group 2018 Full Year Results Presentation & Investor Discussion Pack Strong balance sheet • APRA - 10.6% CET1 capital ratio - 5.8% leverage ratio • Internationally comparable - 6.5% leverage ratio • 63% deposit funded • 133% LCR and 114% NSFR • 6.5 years weighted average maturity for • SEC registered • AA-/Aa3/AA-credit rating6 Supporting customers via digital Australia • 4.8m active digital customers • 3.5m active mobile users • 3.8m daily mobile app logins • 9.4m accounts on digital mail • 1.8m digital transactions daily • Australia first to enable Siri voice banking including payment • Australia first to enable mobile cheque deposit New Zealand • 0.8m active digital customers • 0.6m active mobile users • 0.5m daily mobile app logins • # 1 Canstar’s 2018 Bank of the Year for Everyday Banking (third year in a row) Targeted growth Australia • # 2 in mortgage market share1 (23%) • # 2 in credit card market share2 (23%) • # 2 in household deposit market share2 (23%) • #2 MFI consumer market share3 (17%) • #2 MFI SME market share3 (21%) • #2 MFI commercial market share3 (25%) • #1 in platform new flow4 (20%) • #1 in platform funds under administration4 (19%) New Zealand • # 3 in home loan market share5 (19%) • # 2 in deposits5 (18%)
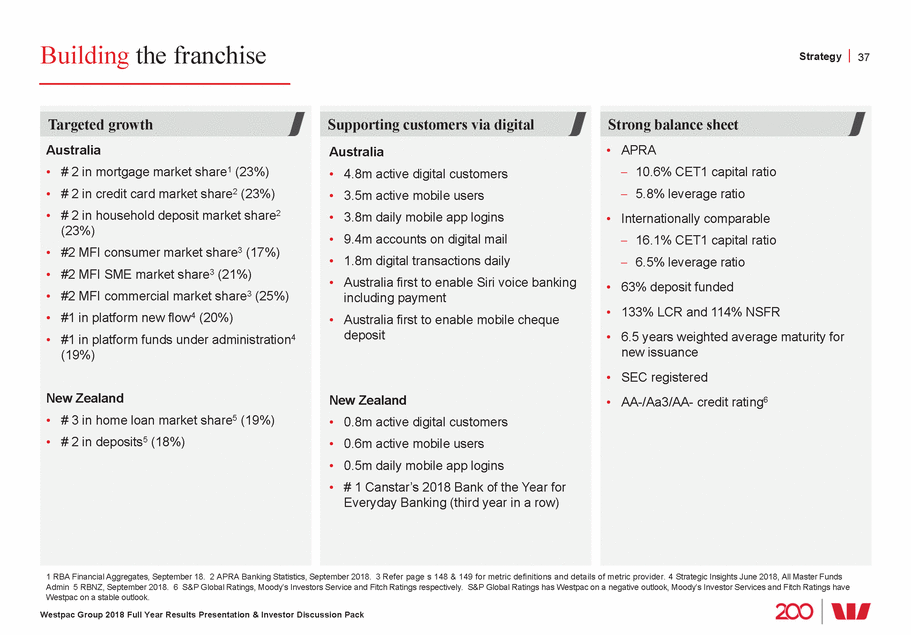
What sets Westpac apart Strategy 38 peers 0.20 Peer 1 Peer 2 Peer 3 WBC 30.2 29.9 29.3 1 Peer 1 and 2 are on continuing operations basis, Peer 3 excludes restructuring expenses. Peers based on FY18 results as reported. Westpac Group 2018 Full Year Results Presentation & Investor Discussion Pack Sustainability leadership • Australia’s first bank and first company, opened 1817 • First Australian bank to: - Sign Equator Principles 2003 - Commit to 2 degree economy 2014 - Publicly support TCFD recommendations 2017 • Foundation member of UNEP FI’s Principles for responsible banking 2018 • Member of global banking leadership group in Dow Jones Sustainability Index since 2002, sector leader 10 times, ranked #17 in 2018 Conservative balance sheet • Strong credit quality with lowest Impaired assets to gross loans1 (%) impaired assets of peers 0.42 • Provision cover at upper end of • Balance sheet weighted to mortgages • Capital ratios at top end of banks globally Capitalised software average amortisation period1 (years) • Disciplined amortisation of 5.5 capitalised software • Only Australian Bank SEC registered – Sarbanes Oxley certification Peer 1 Peer 2 Peer 3 WBC Effective tax rate1 (%) 30.8 Peer 1 Peer 2 Peer 3 WBC 4.3 3.1 3.2 0.33 0.26 Strong strategic position – consistent strategy • No. 1 or 2 position across key markets – all divisions well placed • Unique portfolio of brands, reaching more customers • Strategic position in wealth with a comparative advantage in platforms • No material non-core businesses • Highly experienced executive team
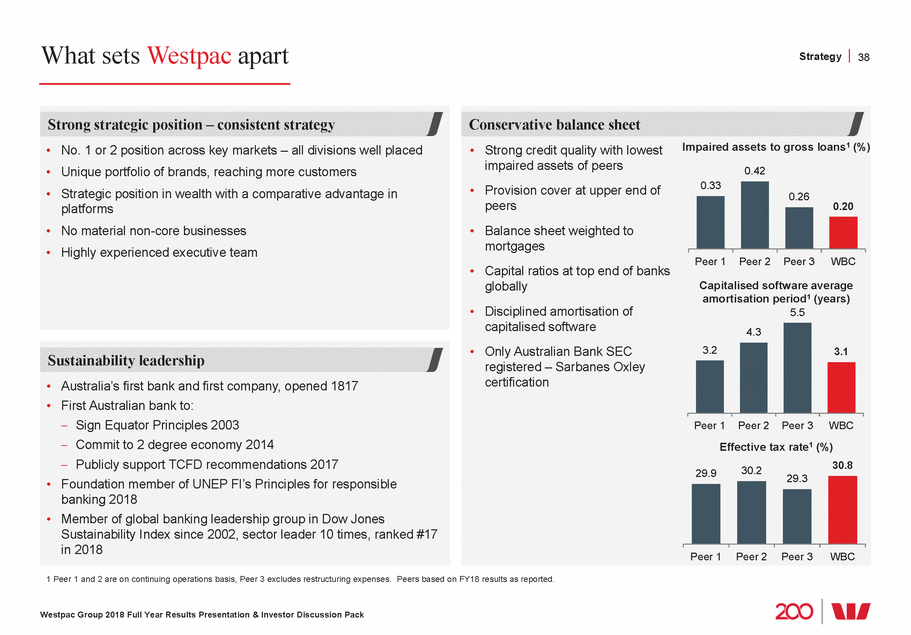
Consistent performer over the long term Strategy 39 227.8 9.1 8.8 8.4 Westpac Group 2018 Full Year Results Presentation & Investor Discussion Pack Ordinary dividend yield (%) Ordinary yield Including franking 9.49.6 1H16 2H16 1H17 2H17 1H18 2H18 6.7 7.7 6.2 6.4 6.6 5.4 5.9 Cash earnings ($bn) 8.18.1 FY08 FY09 FY10 FY11 FY12 FY13 FY14 FY15 FY16 FY17 FY18 7.6 7.8 7.8 7.1 6.6 6.3 5.9 5.0 4.7 Cash earnings per share (cents) 245.4 248.2 235.5 239.7 236.2 FY08 FY09 FY10 FY11 FY12 FY13 FY14 FY15 FY16 FY17 FY18 198.3 197.8 209.3 214.8 163.7
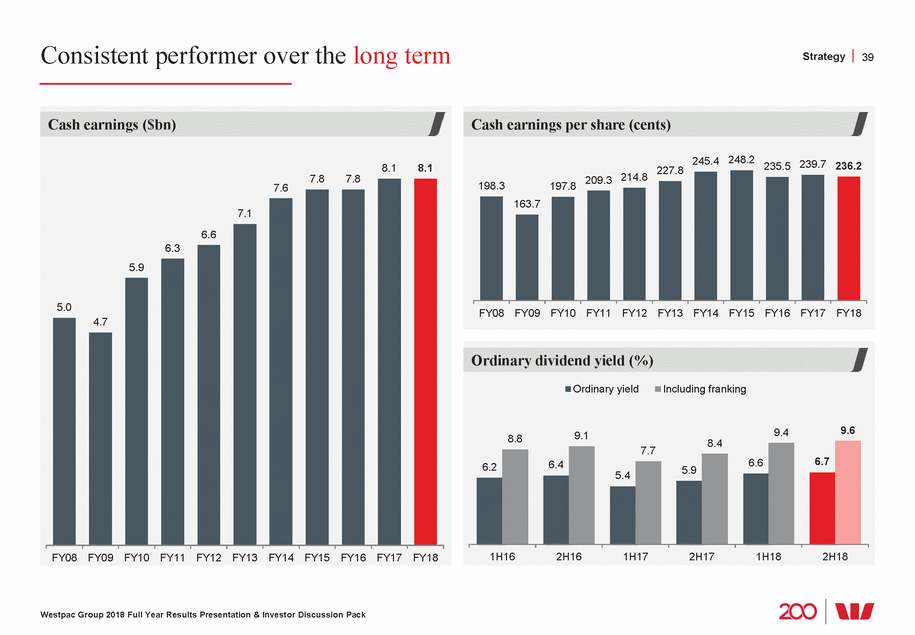
Overview

Cash earnings and reported net profit reconciliation Results 41 Reported net profit and cash earnings adjustments ($m) FY17 FY18 Reported net profit 7,990 8,095 Amortisation of intangible assets 137 17 Fair value (gain)/ loss on economic hedges 69 (126) % chg FY18-FY17 Reported net profit and cash earnings ($bn) % chg 2H18-1H18 Ineffective hedges 16 13 FY18 ($m) Reported profit 8.0 Cash earnings 8.0 8.1 8.1 8.1 Adjustments related to Pendal Group (formerly BTIM) Cash earnings 8,065 - (10%) (171) 73 Cash EPS (cents) 236.2 (1%) (11%) Treasury shares 21 (7) Reported net profit 8,095 1% (7%) Cash earnings 8,062 8,065 Reported EPS (cents) 237.5 - (8%) 1 Cash earnings is not a measure of cash flow or net profit determined on a cash accounting basis, as it includes non-cash items reflected in net profit determined in accordance with AAS (Australian Accounting Standards). The specific adjustments outlined include both cash and non-cash items. Cash earnings is reported net profit adjusted for material items to ensure they appropriately reflect profits available to ordinary shareholders. All adjustments shown are after tax. For further details refer to page 142. Westpac Group 2018 Full Year Results Presentation & Investor Discussion Pack 7.6 7.6 7.8 7.8 7.4 FY14 FY15 FY16 FY17 FY18 Cash earnings1 policy • Westpac Group uses a measure of performance referred to as cash earnings to assess financial performance at both a Group and divisional level • This measure has been used in the Australian banking market for over 15 years and management believes it is the most effective way to assess performance for the current period against prior periods and to compare performance across divisions and across peer companies • To calculate cash earnings, reported net profit is adjusted for: - Material items that key decision makers at Westpac Group believe do not reflect ongoing operations - Items that are not considered when dividends are recommended, such as the amortisation of intangibles, impact of treasury shares and economic hedging impacts - Accounting reclassifications between individual line items that do not impact reported results
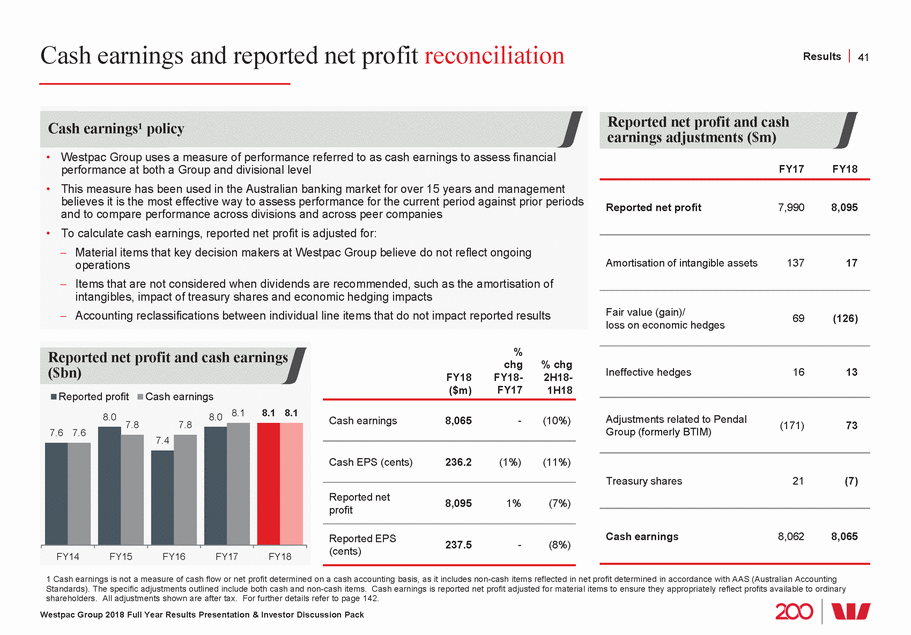
FY18 financial snapshot Results 42 Earnings per share (cents) 236.2 (1%) (11%) (CET1) capital ratio (APRA basis) (%) Core earnings ($m) 12,365 (1%) (10%) (Internationally comparable2) (%) Cash earnings ($m) 8,065 - (10%) Credit quality Impairment charges to average gross loans Net stable funding ratio (%) 114 5ppts 2ppts Liquidity coverage ratio (%) 133 9ppts (1ppt) 1 All measures on a cash earnings basis. 2 Internationally comparable methodology aligns with the APRA study titled ‘International Capital Comparison Study’ dated 13 July 2015. 3 Total liquid assets represent cash, interbank deposits and assets eligible for existing repurchase agreements with a central bank. Westpac Group 2018 Full Year Results Presentation & Investor Discussion Pack Change Change Change Change FY18 FY18 – FY17 2H18 – 1H18 FY18 FY18 – FY17 2H18 – 1H18 Earnings1 Balance sheet Total assets ($bn) 879.6 3% 1% Common equity Tier 1 10.63 7bps 13bps CET1 capital ratio 16.14 (6bps) 1bp CET1 capital ($bn) 45.2 6% 4% Return on equity (%) 13.0 (77bps) (188bps) Risk weighted assets ($bn) 425 5% 2% Dividend (cents per share) 94 - - Loans ($bn) 709.7 4% 1% Expense to income ratio (%) 43.7 143bps 393bps Customer deposits ($bn) 517.8 6% 3% Net interest margin (%) 2.11 2bps (12bps) Net tangible assets per share ($) 15.39 5% 3% Funding and liquidity Customer deposit to loan ratio (%) 73.0 190bps 137bps (bps) 10 (3bps) (2bps) Impaired assets to gross loans (bps) 20 (2bps) (2bps) Impaired provisions to impaired assets (%) 46.1 (18bps) 58bps Total liquid assets3($bn) 153.7 12% 4%
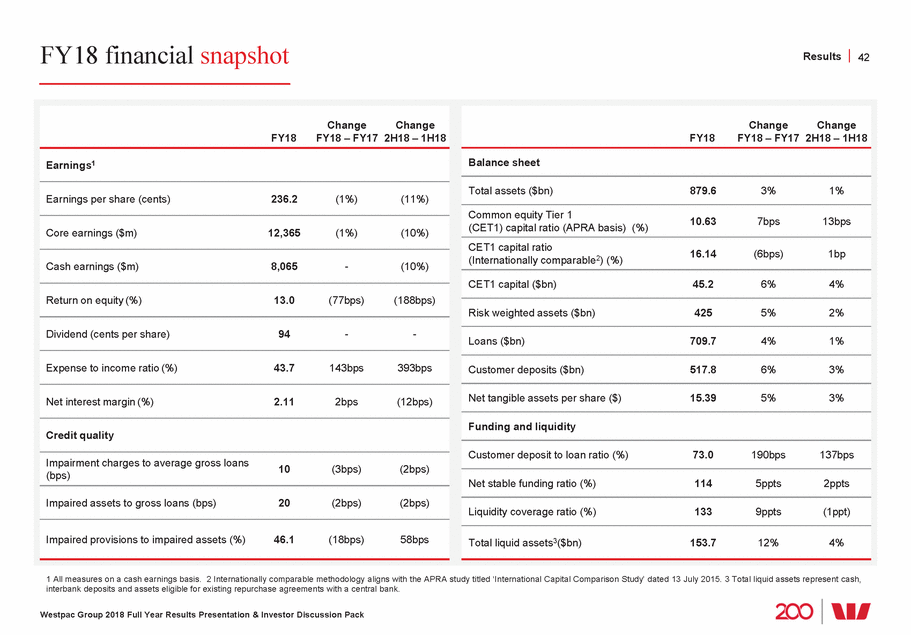
Cash earnings impacted by infrequent items of $281m in 2H18 Performance discipline 43 new IAPs2 (54) margins up 2bps 8,062 143 8,065 16,339 4 (3) income certain ATM and transaction fees, card spending, the exit of Hastings, the customer refunds and payments. Partly offset by customer refunds and payments Provision for costs associated with implementing customer spreads and higher short-term funding costs (88) (278) partly offset by higher Hastings for consumer portfolios and NZ dairy income income charges 1 Average interest-earning assets. 2 Individually assessed provisions. Westpac Group 2018 Full Year Results Presentation & Investor Discussion Pack Cash earnings features of FY18 – FY17 ($m) AIEA1 up 3%, Lower 635 (240) (481) Lower markets income, fees from removing Costs higher from investment interchange fees, and a rise in provisions for Royal Commission and implementing higher Hastings revenue and business fees Flat FY17 Net interest Non-interest Expenses Impairment Tax & NCI FY18 income income charges Cash earnings features of 2H18 – 1H18 ($m) AIEA up 2%, margins down 12bps from lower loan refunds and payments and litigation, the write-off of 4,251 (263) goodwill in Hastings and higher investment spending 76 116 3,814 Provisions for customer refunds and payments and lower markets income, Lower collectively assessed provisions revenue and business fees Down 10% 1H18 Net interest Non-interest Expenses Impairment Tax & NCI 2H18 % Change % Change FY18 FY18 – 2H18 – $m FY17 1H18 Net interest Non-interest income 5,612 (4) (3) Expenses (9,586) 5 6 Core earnings 12,365 (1) (10) Impairment charges (710) (17) (19) Tax and non-controlling (3,590) 2 (6) interests Cash earnings 8,065 - (10) Reported net profit 8,095 1 (7)
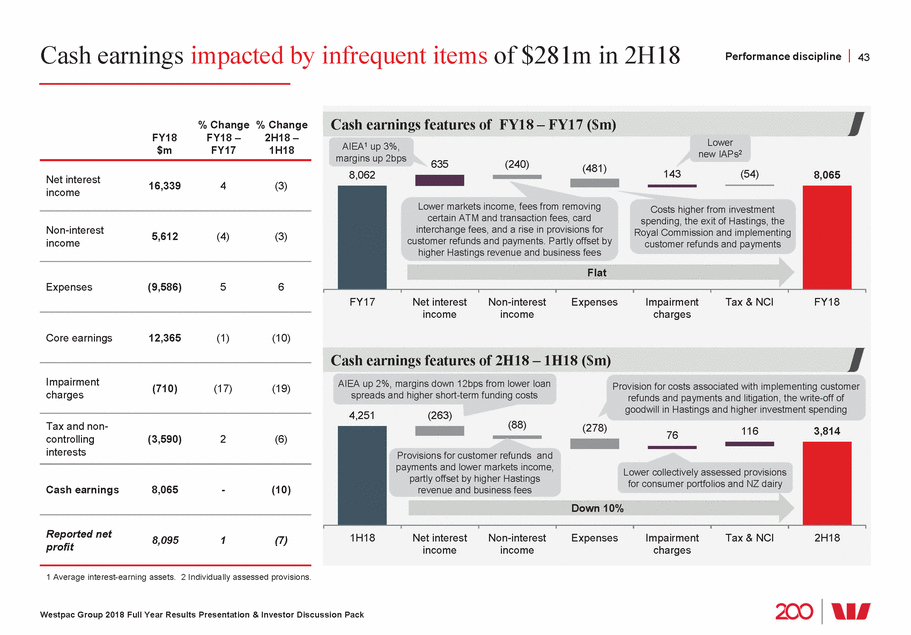
Divisional contributions Performance discipline 44 term wholesale funding remediation Other2 2H18 ($m) CB BB BTFG WIB NZ Group Operating income 4,077 2,644 1,043 1,548 1,091 397 10,800 Expenses (1,812) (946) (690) (771) (431) (282) (4,932) Core earnings 2,265 1,698 353 777 660 115 5,868 Impairment (charges)/benefits (218) (154) (3) 21 22 15 (317) Tax & non-controlling interests (624) (465) (109) (263) (189) (87) (1,737) Cash earnings 1,423 1,079 241 535 493 43 3,814 % of Group cash earnings 37 28 6 14 13 2 1 Refer to division definitions, page 145. 2 Other is Group Businesses (including Treasury). Westpac Group 2018 Full Year Results Presentation & Investor Discussion Pack 2H18 divisional1 core earnings movements ($m) Impacted by higher short Impacted by customer 6,497 (422) and customer remediation 28 22 5,868 1H18 CB BB BTFG WIB NZ Other 2 2H18 18 (229) (46) Down 10% 2H18 divisional1 cash earnings movements ($m) 4,251 (294) (16) 1H18 CB BB BTFG WIB NZ Other 2 2H18 (1) (163) 52 (15) 3,814 Down 10%
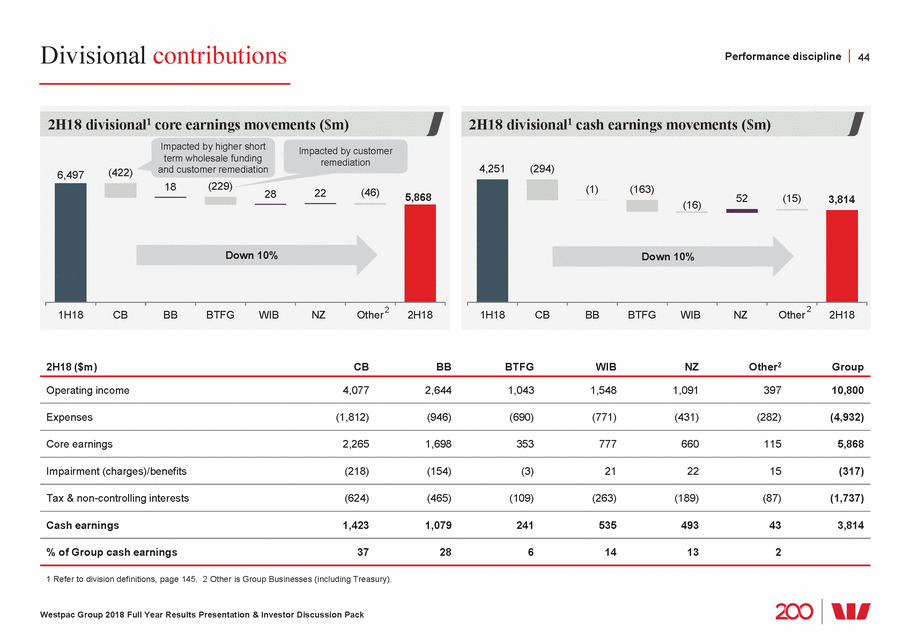
More customers, deeper relationships and strong balance sheet Service leadership 45 and capital ($bn) 8.2 128.8 121.4 15 Sep-16 Sep-17 Sep-18 Wholesale Onshore >1yr 1 Australian banking refers to Consumer Bank and Business Bank. 2 Australian retail refers to Consumer Bank, Business Bank and Private Wealth. 3 WIB includes Group Businesses. 4 In A$. 5 Refer to page 148 for details of metric provider. Westpac Group 2018 Full Year Results Presentation & Investor Discussion Pack Maintain balance shee CET1 capital ratio (%) 9.1 9.0 9.5 Sep-12 Sep-13 Sep-14 Sep-Funding composition by r t strength 10.6 10.6 9.5 esidual maturity (%) Wholesale Onshore <1yr Wholesale Offshore <1yr Wholesale Offshore >1yr Securitisation Equity Customer deposits 11 1 11 1 8 8 10 1 62 63 5 44 Sep-08 Sep-17 Sep-18 16 20 5 8 6 8 45 43 39 34 30 28 25 Deepen relationships Transaction account balances ($bn) 2 3 4 Australian retail WIBNew Zealand 152.1 139.0 Sep-15 Sep-16 Sep-17 Sep-18 Australian customers with a wealth product5 (%) Peers St.GeorgeWestpac 20.3 18.9 17.8 12.5 11.0 Sep-16 Sep-17 Sep-18 Grow customers Customer numbers (#m) Australian banking1 BT and WIB New Zealand 13.2 13.4 13.9 14.2 Sep-15 Sep-16 Sep-17 Sep-18 Increase in customer numbers (#’000’s) 460 FY15 FY16 FY17 FY18 348 256 213 1.4 1.4 1.3 1.4 1.7 1.7 1.6 1.6 10.8 11.1 10.3 10.4
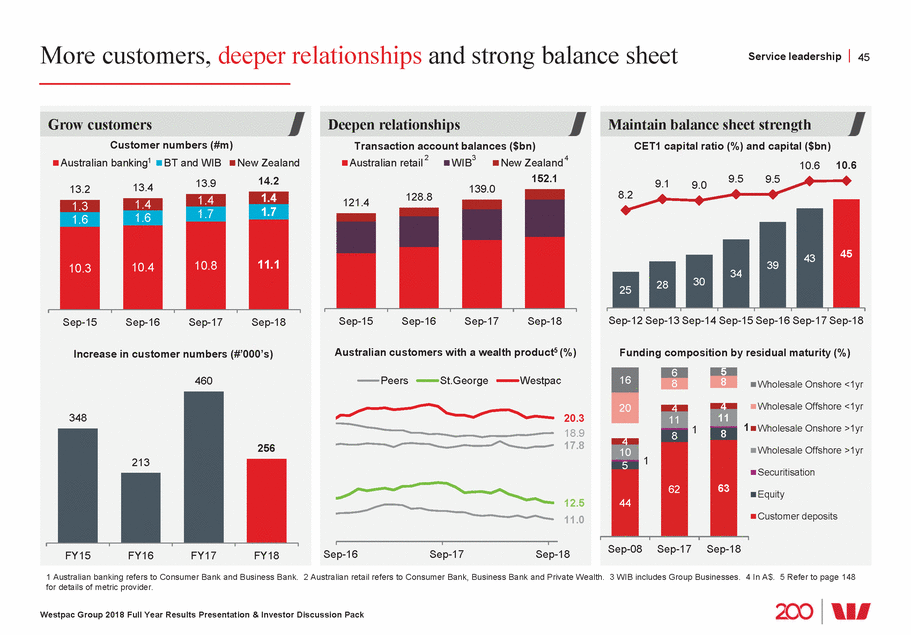
Building long term franchise value – customer service Service leadership 46 Consumer and Business (mean), New Zealand (%) Westpac St.George brands Peers 7.5 2H15 1H16 2H16 1H17 2H17 1H18 2H18 7.1 75% 37% 69% Sep-16 Sep-17 Sep-18 1 Refer page 148 for metric definition and details of provider. Westpac Group 2018 Full Year Results Presentation & Investor Discussion Pack New Zealand Business Consumer Customer complaints (#) Customer satisfaction1 Australian retail (CB, BB and BT) 7.5 7.2 7.2 7.2 Sep-16 Sep-17 Sep-18 Westpac St.George brands Peers 7.6 7.1 New Zealand retail 7.0 6.7 Sep-16Sep-17Sep-18 WestpacPeers 78% wn 4% 76% 71% 2H15 1H16 2H16 1H17 2H17 1H18 2H18 Do wn Do Higher over the year as we have made complaints process easier for customers, and from increased awareness 11% Up Dow n 35%
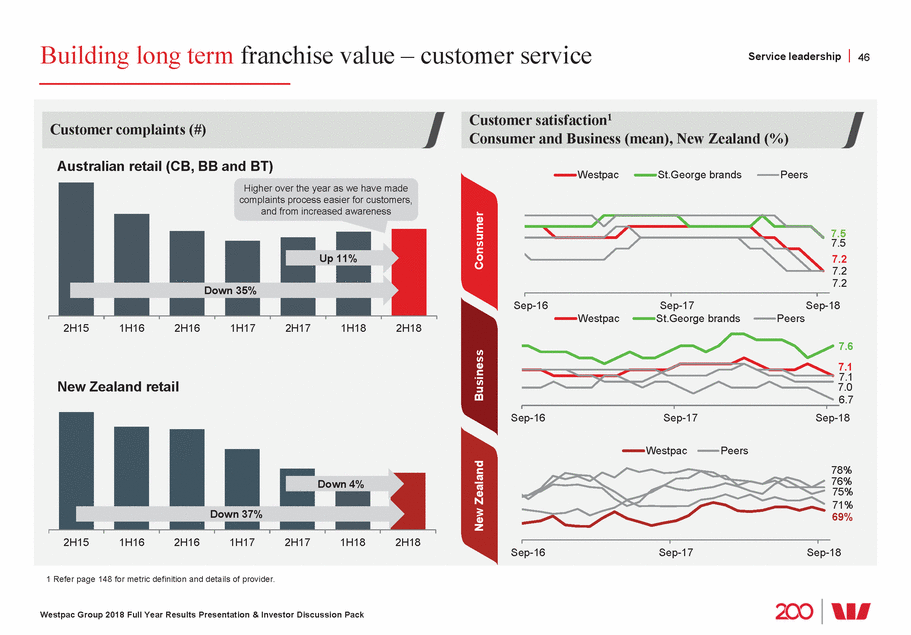
Workforce revolution delivering Workforce revolution 47 Executive Leadership through the AGSM completed by employees via LearningBank, our modes is rapidly changing, combining classroom, performance management called 1 The Culture Index measures four elements: trust and care, service orientation, agility and innovation, and risk culture. 2 Spot number at 30 September for each period. Refer page 149 for metric definition. 3 Lost time injury frequency rate. Westpac Group 2018 Full Year Results Presentation & Investor Discussion Pack Women in Leadership positions2(%) Sep-14 Sep-15 Sep-16 Sep-17 Sep-18 50 50 48 46 44 Employee culture and engagement • Employee engagement is surveyed every two years. In 2017, employee engagement was 79% • Monthly survey of employees conducted The six month rolling average of sentiment has been stable at 73% through the year Culture Index1, with the index six month rolling average stable at 73%. Results suggest confidence in employees feeling safe to speak up and that action will be taken if an issue or risk is raised • A culture assessment against our values, is now mandatory in recruitment process LTIFR3 (rolling 12 months) (#) 1.10 0.80 0.80 0.60 0.39 Sep-14 Sep-15 Sep-16 Sep-17 Sep-18 Learning and development • Over 1,240 leaders have participated in leadership development programs during 2018, with 853 leaders now qualified for the Certificate of • During 2018, 116,000 courses have been online learning platform. The mix of learning online, mobile, and on-the-job experiences • New ‘behaviours-first’ approach to “Motivate” now covers all employees Service leadership - Navigate • The majority of Australian employees have participated in the Navigate program. Bringing together our vision, values, service standards, and code of conduct. The program sought to improve clarity around ethical behaviour and treatment of customers • Introduced ‘Our Compass’ providing our people with a consistent understanding of expectations covering our code of conduct, values, service promise and vision Simplification • Enhanced controls and streamlined critical risk and culture checks for all new employees • Digitised the onboarding experience for new employees, reducing the time for new employees to become fully productive and saving time for people leaders. New employee satisfaction with induction experience is now 97%
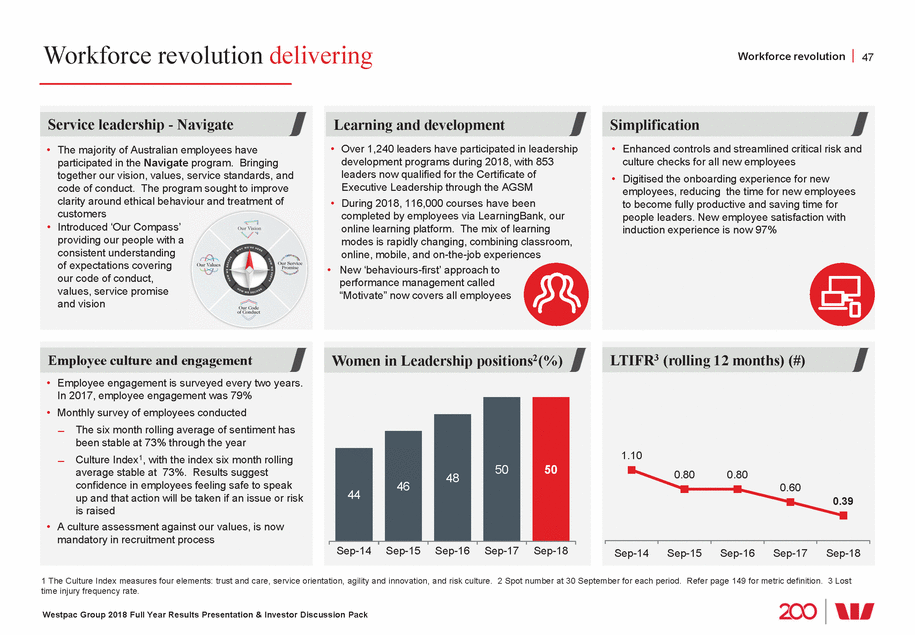
Reinventure – Investing in new fintech businesses1 Digital transformation 48 Westpac has increaseWd eits cpoamc misitamcetnivtetolyfirnetsepcohnvdeinntgurteocdapigitiatal lfuthnrde, aRtesinavnedntouprep,otrotu$n15it0iems2.. Reinventure enables WWesetpeanccto arcacgeessdingsitiaglhitnsnaonvdaatdiojanctehnrtobuugshiniensvseosptipnogrtiunnviteienst.uTrheecmapoidtael,aplsaorthneelrpsshWipesstapnadc dtoirseocut ricnevecosmtmmeenrtcsia. l Westpac can learn pdairretncetrlyshainpsd tghatncraecactesvsaltuoe efomrecrugsitnogmfeinrstech developments. New business models New technology capabilities Data, AI and analytics Enterprise cyber security company that protects businesses from malicious bot attacks A natural language AI system for data analysis targeting relatively simple business queries that comprise 70% of an analyst’s work in a large organisation Peer-to-peer (P2P) online lending platform connecting borrowers and investors Provides a comprehensive cloud-based human resources and employee benefits platform to streamline HR processes Enabling software development teams to scale processes and improve code quality Open Banking API platform that provides connectivity to over 100 financial sources across Australia and NZ A fund of funds for cryptocurrency and blockchain technology A trust framework and secure platform that allows users to exchange data safely and securely Helps home sellers make decisions about who they choose to sell their property BRICKX enables the purchase of residential property, one ‘brick’ at a time Connects ordering apps, payment devices, loyalty and reservations platforms to any point of sale A single platform for verifying and digitising employee certifications, accreditations and qualifications A business loan marketplace that matches SMEs to the best lender based on their characteristics and needs Full stack payments platform AI company that integrates neuroscience into their platform creating capability that not only manages complex problems but is able to form intrinsic relationships with humans Digitised debt collection, leveraging modern communications, automation and machine learning Uses data to shed light on high volume crimes, improving prevention and detection Smart receipts that automatically link purchase receipts to customers’ bank accounts A global big data, business intelligence and enterprise data warehousing company A payment app for customers when dining out or grabbing a coffee on the go Standardises mobile forms into an easily readable format and fillable at the tap of a button A bitcoin wallet and platform 1 Logos are of the respective companies. 2 Increase of $50m in FY18. Westpac Group 2018 Full Year Results Presentation & Investor Discussion Pack
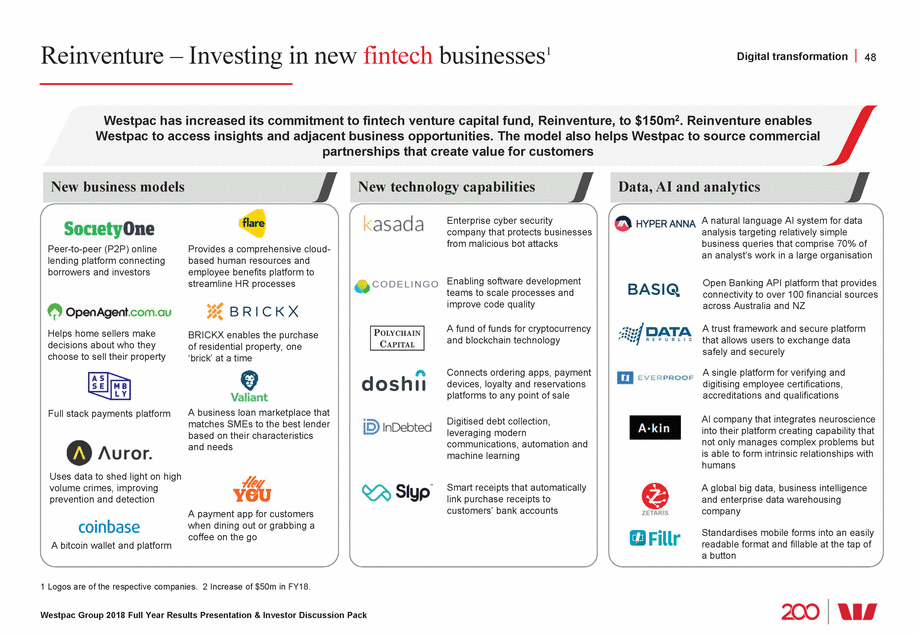
New digital offers for customers1 Digital transformation 49 Examples of how Westpac and Reinventure’s investments are delivering Delivered Presto Smart for Westpac customers 2 Investing in merchant propositions • Based on software built by Assembly, Presto Smart enables a business merchant terminal to connect with a range of point-of-sale systems Investing in the home ownership ecosystem 3 Strategic investment in OpenAgent • Bringing new capability to Australian property buyers, sellers and investors Leveraging Data Republic to accelerate data sharing opportunity and manage risk 6 5 4 Investing in data, AI and analytics • Powered 12 new data partnerships, developed 15 data products and launched 8 new start-ups via the FUELD accelerator 1 Logos are of the respective companies. 2 Zip offers point-of-sale credit and digital payment services. 3 Uno is an online mortgage broker. 4 Discovery Ag is an agribusiness focused on optimising on-farm efficiencies. 5 Quintessence Labs creates opportunities with quantum technology that encrypts confidential data. 6 FUELD is a data accelerator which aims to bring together businesses with data-based companies to solve real world problems. Westpac Group 2018 Full Year Results Presentation & Investor Discussion Pack
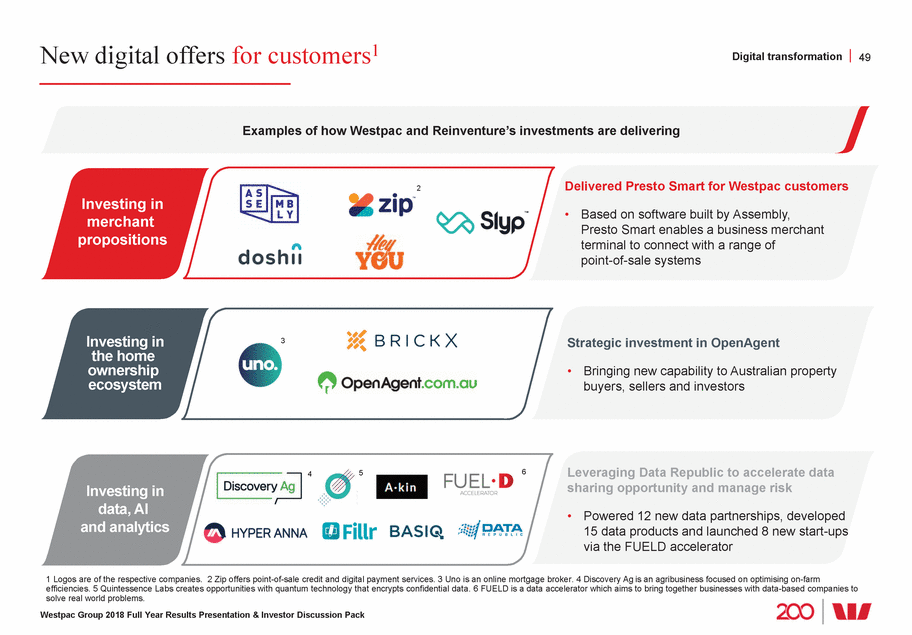
Customer Service Hub Starting with a new mortgage experience Digital transformation 50 Re-engineering the home ownership process: Digitising the end-to-end home loan origination experience by 2020 Customer access via any channel Banker dashboard Customer application tracker At any time customers have clarity on their loan application status Single point for bankers to view customer information and loan application status Applications available seamlessly across channels Digital upload of information Customers can upload documents from home Every element of the process supports providing a record of verification Settlement Digital offer and acceptance Plain English terms & conditions and online acceptance Simplified application assessment / approval for customer and banker Digitises a number of manual processes Digital settlement integrated with land titles registry More home ownership needs met at origination Improved customer experience Increased banker productivity Lower cost of change Increased efficiency 50% reduction in customer documents, faster time to conditional approval 1.7x to 1.2x reduction in costs. Single platform across multiple brands 10% more of customer’s lifestyle and protection needs met 25% reduction in the cost of mortgage origination 25% reduction in banker time spent processing Westpac Group 2018 Full Year Results Presentation & Investor Discussion Pack Leading to: Capabilities to be delivered Strategy
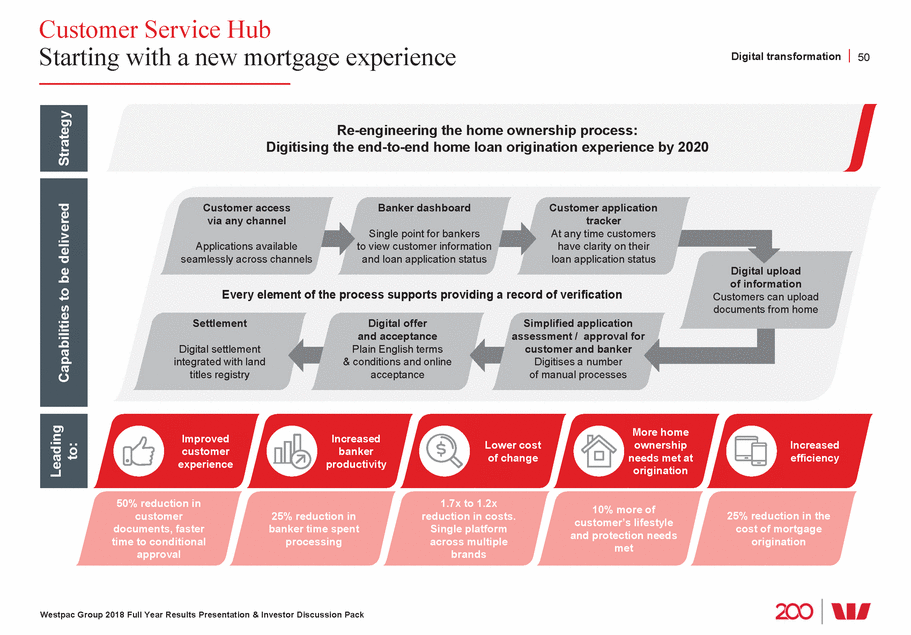
Customer Service Hub pilot now, roll out 2019 Digital transformation 51 One location for everything Application tracking process Better customer conversations • Dashboard currently in use to bring together tasks, applications, opportunities and customer information into one location As a result, bankers spend less time searching for information • Customer conversations made easier with single view of application status; automatic data population across systems; a combined credit and verification decision resulting in quicker and consistent decisions • Greater visibility on how applications are progressing; 70% fewer manual tools • Customer access via any channel Customer application and settlement tracker Digitising the process for customers An integrated customer experience in branch, online or by phone A transparent customer experience Meeting today’s customers’ expectations • Automatically generated loan documents Loan offer review and accept online Upload verification documents anywhere, anytime from any device Simplified documents in plain-English • Customers can track an application 24/7 Simple step-by-step processes to complete application Personalised alerts and notifications Automated, trackable settlement process • Application can be started in any channel and picked up and continued in any other channel Information only provided once For existing customers, pre-population of personal information • • • • • • • • Westpac Group 2018 Full Year Results Presentation & Investor Discussion Pack Improved banker experience Enhanced customer experience
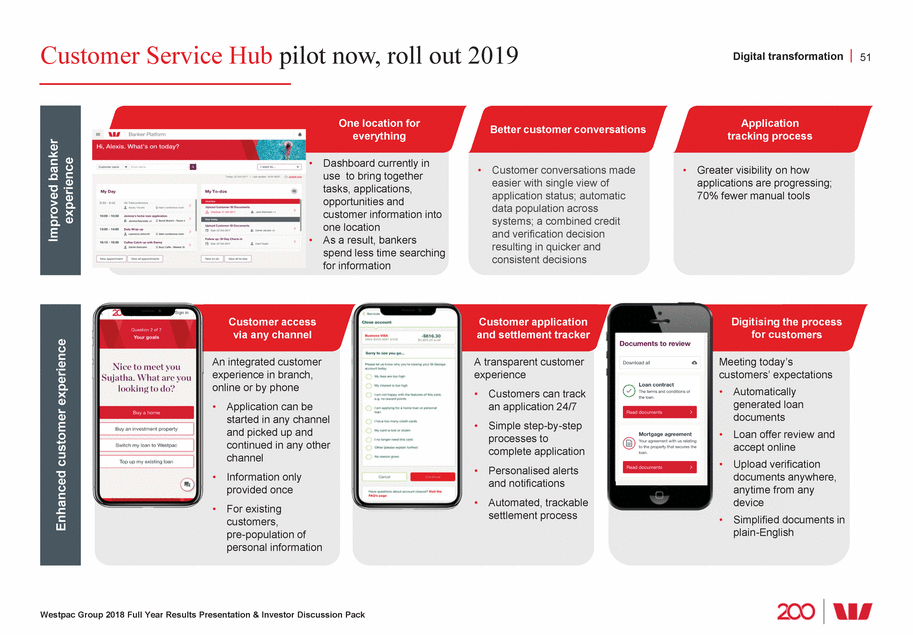
Customers shifting to digital channels1 Digital transformation 52 4.53 380 22.5 21.7 1 Refer page 148 for definitions. Westpac Group 2018 Full Year Results Presentation & Investor Discussion Pack Branch transactions (#m) 25.6 24.4 20.820.1 Down 3% Down 7% 1H16 2H16 1H17 2H17 1H18 2H18 Digital transactions (#m) 333 304 313 262 279 287 Up 6% 10% 1H16 2H16 1H17 2H17 1H18 2H18 Up Digitally active customers (#m) 4.694.81 4.33 Up 3% Mar-16Sep-16 Mar-17 Sep-17 Mar-18 Sep-18 Up 6% 4.18 4.05 Quality digital sales (#000’s) and % of sales via digital Sales % of sales via digital 33 29 24 25 428 287 312 Up 13% Up 37% 1H17 2H17 1H18 2H18
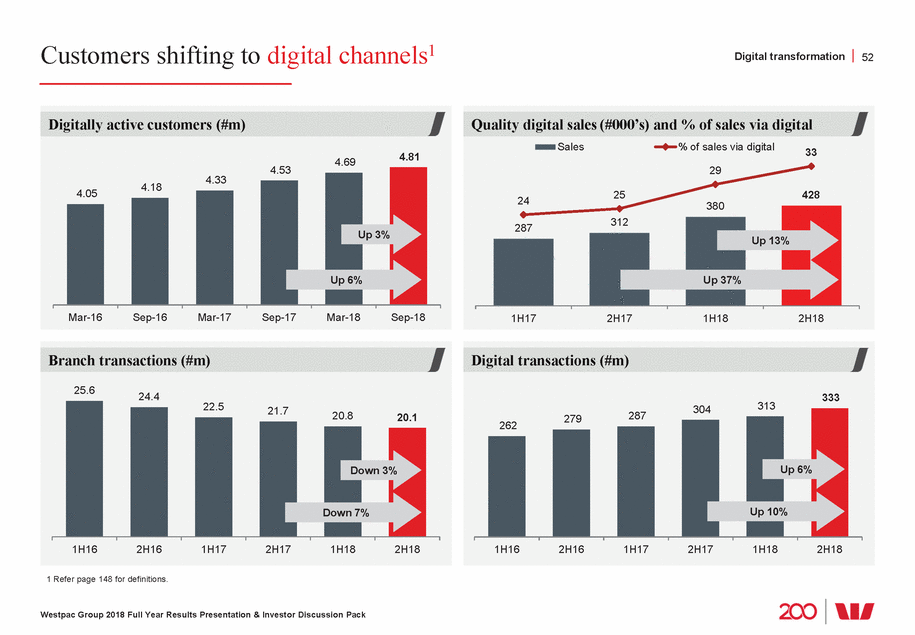
Digital supporting productivity Digital transformation 53 Connect usage (000's)1 491 1 Connect usage for 1H17 is St.George only. 2 Self-service usage for 2H18. 3 Digital Mail launched in March 2018 for St.George, April 2018 for Westpac. Westpac Group 2018 Full Year Results Presentation & Investor Discussion Pack Calls reduced and time saved Paper and postage saved Calling through our ‘Connect’ feature Digital Mail • More customers are initiating calls as authenticated • Customers can receive their documents faster, and customers through ‘Connect’ in the mobile app. Results in a access them anywhere, anytime saving of ~60-90 seconds per call • Also reduces postage and paper usage, and provides a record of customer communication • 9.4m accounts have switched to Digital Mail since launch in 20183 1H17 2H17 1H18 2H18 Accounts with e-statements (%) • When a digital self-service feature is available 35% of customers elect to self-service2 e-statements Paper Customers electing self-service (000's) 174 114 1H17 2H17 1H18 2H18 Mar-17 Sep-17 Mar-18 Sep-18 141 15 64 57 55 52 48 43 45 36 409 282 66

Helping customers via digital Digital transformation 54 Deposit a cheque with a photo Supporting customers anywhere anytime Make payments and check account balance by voice • Siri banking is an Australian first that allows eligible Westpac customers to use Siri to make payments and also ask account enquiry questions • Customers can also use their virtual assistant (Google Assistant and Amazon Alexa) to make enquiries about their account balance, transaction history and reward points • Customers on Westpac desktop can contact Westpac via secure messaging anywhere, anytime • Mobile cheque deposit allows customers to deposit cheques via the mobile app by taking a photo of the cheque • Removes a typical branch transaction to digital Westpac Group 2018 Full Year Results Presentation & Investor Discussion Pack
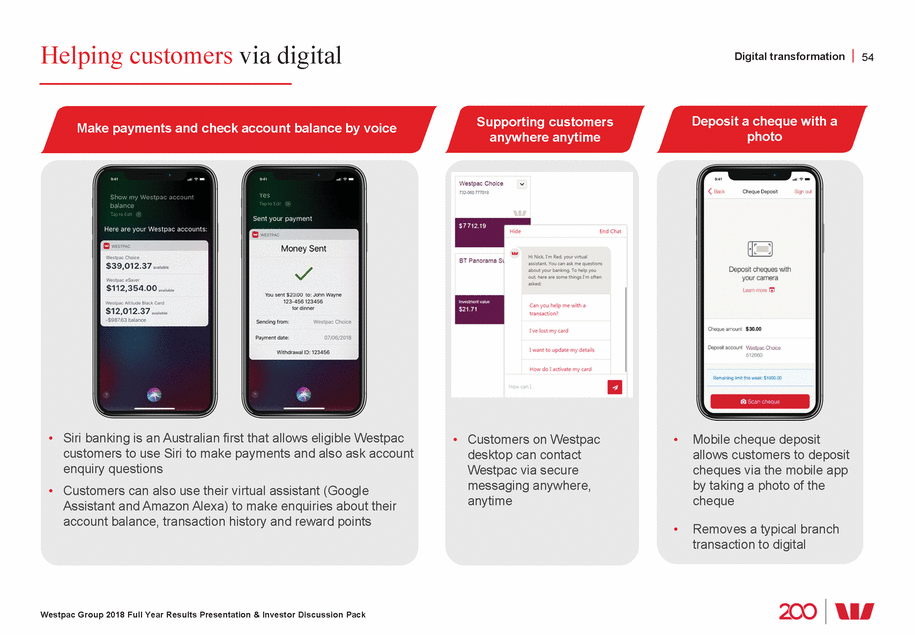
Helping customers via digital Digital transformation 55 Apply for a home loan online (St.George brands only) Support customers overseas Making payment easier See transactions in real time • App to support customers travelling overseas including a currency converter, access to emergency contacts and information on our global ATM alliance • Customers with a Handycard or Debit MasterCard can see merchant transaction details immediately • Applications can be completed online or via mobile with specialist support available via live chat Personalised pricing and valuations available Customers can stop and re-start the process at any time • Just Beem It! Westpac collaboration with two other major banks on a mobile payment app Allows any customer with a debit card (regardless of their bank) to pay and get paid securely, in real-time • • • Westpac Group 2018 Full Year Results Presentation & Investor Discussion Pack
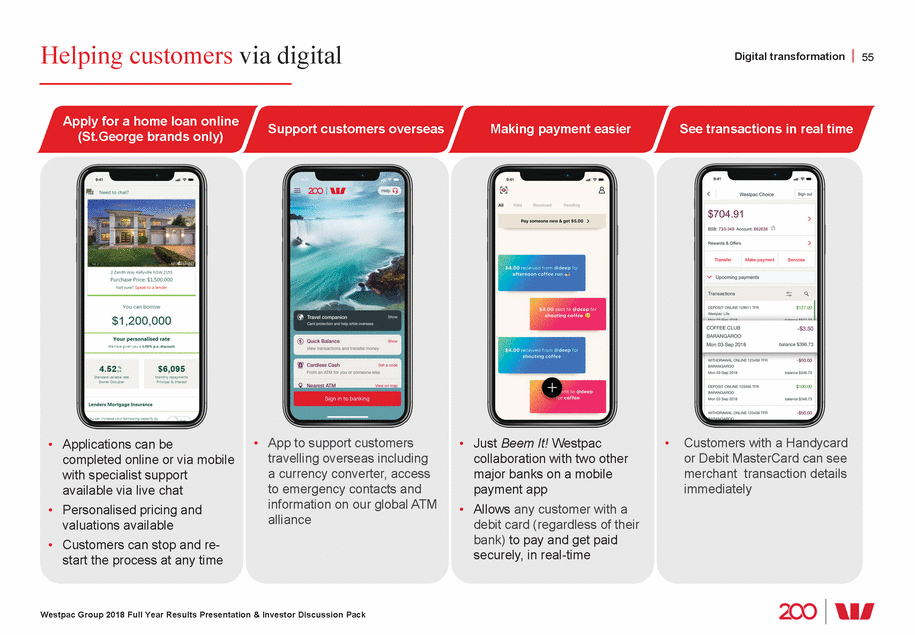
Continued sustainability leadership Sustainable futures 56 2018 outcomes Development Goals alignment priority areas their family with the financial aspects of losing a loved one it matters most to them policies, action plans and • Achieved a 4% reduction in GHG emissions compared to FY17 Westpac Group 2018 Full Year Results Presentation & Investor Discussion Pack United Nations Sustainable Westpac’s sustainability • Improving financial literacy in target segments with specific programs: ņ Youth supported through Mathspace and Year 13 partnerships ņ Young adults and women through The Cusp and Ruby Connection ņ Older Australians through Starts at 60 Helping people make better • Introduced a range of products and services to put customers in control of their finances, financial decisions including Westpac SmartPlan, an online tool to help customers manage their credit card balance and Westpac Life, a savings product that supports customers’ savings goals • Over 37,000 customers experiencing financial hardship supported via Customer Assist • $100 million Drought Assistance Package to support lending to famers and agribusiness customers Helping people by being there when • Developed ‘Loss of a loved one’, which provides tools and resources to help customers and • Credit card holders can block transactions from gambling merchants • Westpac Bicentennial Foundation added another 100 scholars, bringing the total to 330 and $3.7 million paid out in educational scholarships • Westpac Foundation Social Scale-up Grants supported social enterprises, creating 513 jobs Helping people create a prosperous for vulnerable Australians nation • $9.1bn lending to climate change solutions at 30 September 2018 • Established the Customer and Corporate Relations Division, bringing together customer complaints teams from across the Group and complementing the role of the Customer Advocate A culture of doing the right thing • Named as Employer of Choice for Gender Equality by the Workplace Gender Equality Agency for the 8th consecutive year • Sustainable Investment Approach was released, which sets out how ESG issues are The fundamentals – sustainability addressed in funds managed by BTFG, including superannuation funds frameworks Further information on Westpac’s Sustainability strategy and progress on strategic priorities is available at www.westpac.com.au/sustainability
Delivering sustainable value for all stakeholders1 Sustainable futures 57 Customers Employees Community Suppliers Investors Economy Environment 14.2m Customers 38,522 Employees $100m Drought Assistance Package to support lending to farmer and agribusiness customers $5.4bn Spent with suppliers in Australia 13.0% Cash return on equity $3.6bn Income tax FY18 $9.1bn Committed exposure to climate change solutions Provided $75bn New home loans in Australia 50% Women in Leadership positions $1.4bn Committed exposure to social and affordable housing sector $2m In community grants for 200 not for profit organisations2 $3.8m Spent with Indigenous Australian suppliers $6.4bn In dividends to shareholders 30.8% Effective tax rate $1.7bn To facilitate climate solutions Provided $22bn New business lending in Australia (excludes Institutional) $4.9bn Paid to employees $17.7m Spent with diverse Australian suppliers3 620k shareholders and more via super funds 2nd Largest tax payer in Australia4 17 years Recognised as a global banking leader in the Dow Jones Sustainability Indices for 17 years in a row Over 37,000 Customers supported through Westpac Group Assist 90% Of employees5 endorsed new Enterprise Agreement. Effective 1 January 2019 $131m In community contributions 236.2 Cash earnings per ordinary share (cents) $378m Bank Levy 34.0% Effective tax rate including the Bank Levy 1 Data for FY18 or as at 30 September 2018 unless otherwise stated. 2 Through Westpac Foundation. 3 Diverse suppliers includes businesses at least 51% owned and controlled by indigenous Australians or women. Also includes Australian Disability Enterprises and social enterprises. 4 Source: Corporate Tax Transparency Report 2015 - 2016, published December 2017. 5 Represents percentage of employees that voted. Westpac Group 2018 Full Year Results Presentation & Investor Discussion Pack
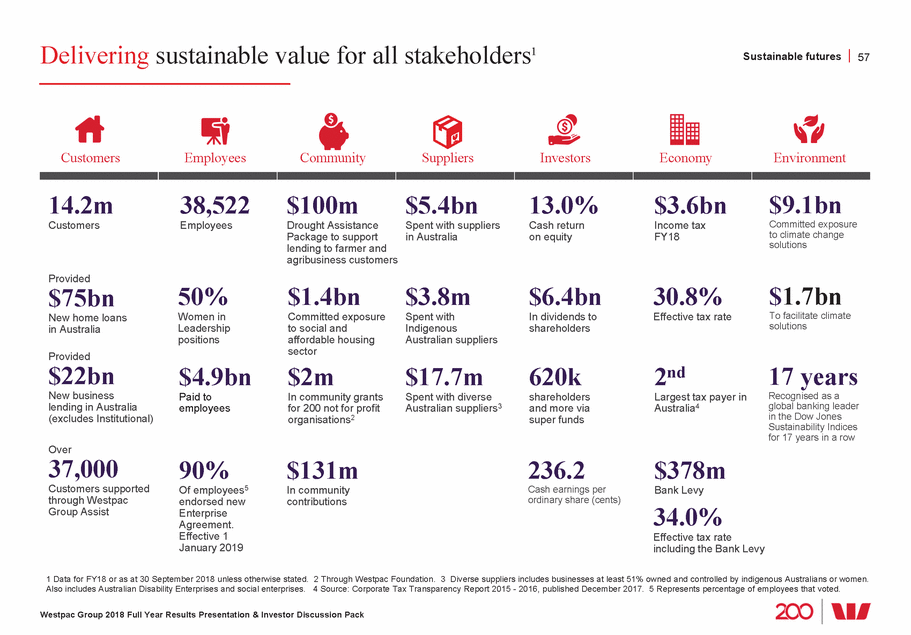
Climate-related metrics Sustainable futures 58 (% of TCE)1 220 203 6.2 6.1 Gas 2 National electricity market (NEM) benchmark 9.7 47.7 infrastructure 5.55.35.4 3.83.9 1 Exposures in WIB only. TCE is total committed exposure. 2 Australia only. NEM benchmark is sourced from Australian Energy Market Operator. Westpac Group 2018 Full Year Results Presentation & Investor Discussion Pack Emissions intensity (tCO -e/MWh)2 Westpac electricity generation portfolio 2020 target 0.91 0.90 0.86 0.82 FY15 FY16 FY17 FY18 0.38 0.38 0.36 0.28 Climate change solutions exposure (% of TCE) TCE at 30 Sep 2018 $9.1bn Green buildings 2.8 1.7 2.4 3.4 Renewable energy Low carbon transport Adaptation Forestry 28.8 Waste Other Mining exposure ($bn) Sep-15 Sep-16 Sep-17 Sep-18 14.5 11.3 10.7 6.4 6.8 5.0 1.40.90.61.4 Total Non-fossil fuel Oil and gas Coal - thermal & metallurgical Electricity generation exposure TCE at 30 Sep 2018 $3.5bn 1.9 0.8 Renewable energy 11.8 14.1 Black coal Brown coal 71.4 Liquid fuel Climate change solutions exposure ($bn) 9.1 7.0 Sep-15 Sep-16 Sep-17 Sep-18 Total scope 1, 2 and 3 emissions (tCO2-e, 000s) 244 194 FY15 FY16 FY17 FY18
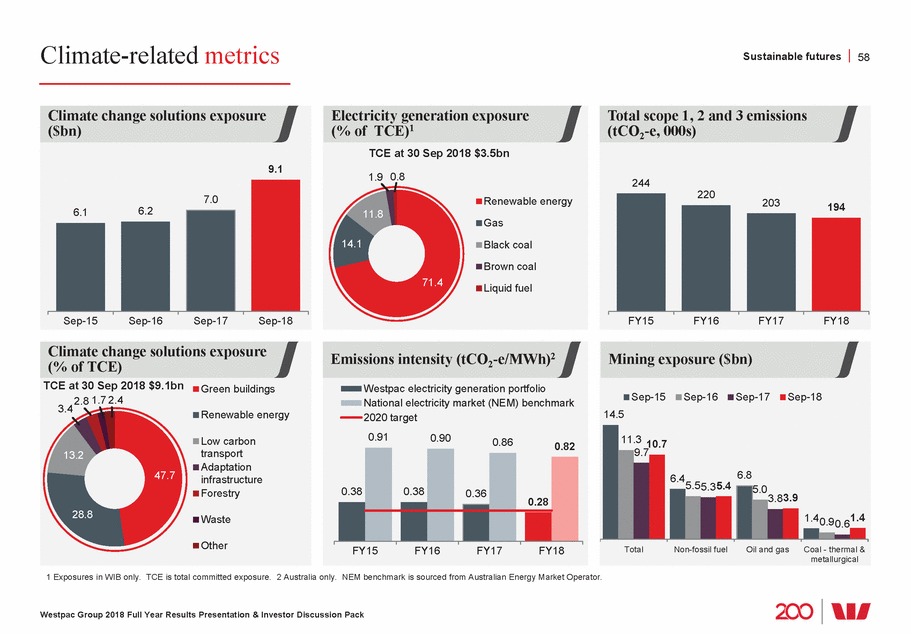
Climate-related disclosures – scenario analysis Sustainable futures 59 70 2050 30 0.4% 1 Australian Business and Institutional lending, excludes retail, sovereign, and bank exposures. 2 Global Cooperation Scenario – where coordinated global action results in a smooth transition to a low carbon economy. For details see page 52 – Westpac 2016 Sustainability Performance report. 3 Five natural perils were assessed: inundation, soil contraction, floods, wind and cyclones, and bushfires. 4 For further information – see Westpac’s 2018 Sustainability Performance Report. Westpac Group 2018 Full Year Results Presentation & Investor Discussion Pack Portfolio physical risk – 4 degree scenario Share of current portfolio exposed to higher physical risk (%) 2030 2050 1.7% Physical risk – key points • Westpac assessed the potential physical risks3 (financial impacts of changes in climate patterns and extreme weather events) • Analysis focused on the Australian mortgage portfolio and exposure to postcodes that may face increased physical risk under a 4 degree scenario • Approximately 1.7% of the portfolio is exposed to postcodes that may experience higher physical risk by 2050 under a 4 degree scenario • Data presented shows the share of current exposure to postcodes that may experience higher physical risk at intervals of 2030 and 2050 under our IPCC RCP 8.5 Scenario4 Portfolio transition risk – 2 degree scenario 80 60 50 40 2030 20 10 0 Low Low-medium Medium Medium-High High Current portfolio exposure to transition risk (%) Transition risk – key points • Westpac assessed the potential transition risks (policy, legal, technology and market changes related to climate change) • Analysis focused on the Group’s current Australian Business and Institutional lending1 and exposure to sectors that may face growth constraints under a range of 2 degree scenarios • Approximately 4% of the portfolio is exposed to sectors that may experience higher risk in a transition to a 2 degree economy • Data presented shows the distribution of current exposure to sectors that may experience higher transition risks at intervals of 2030 and 2050 under Westpac’s Global Cooperation Scenario2.
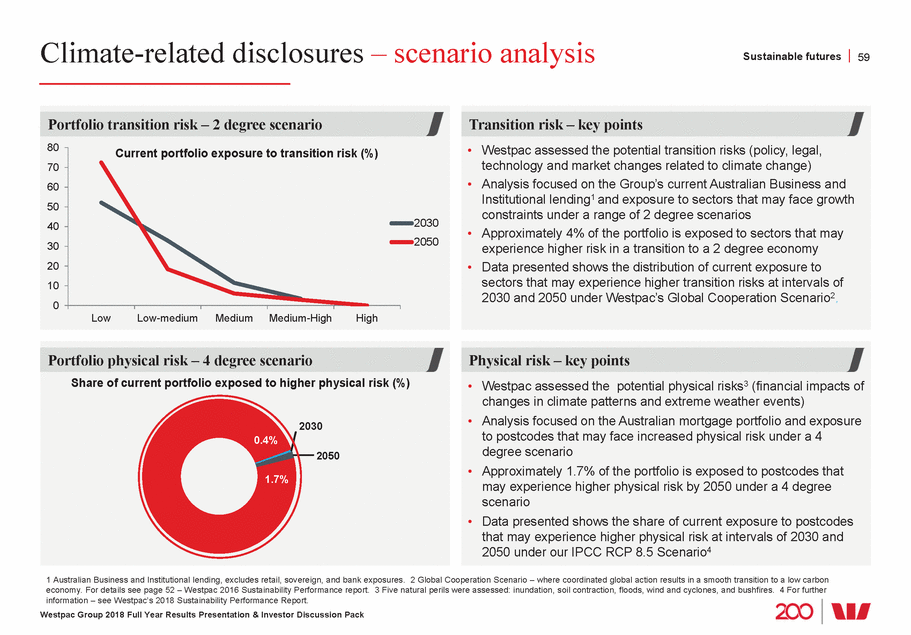
Earnings

Income down 3% over the half; mostly from margin decline and customer remediation Revenue 61 4 BB 10 1 AIEA is average interest-earning assets. 2 Group Businesses. Westpac Group 2018 Full Year Results Presentation & Investor Discussion Pack Net operating income by division ($m) 2H18 Divisional contribution (%) 173 11,151 (340) CB 59 3 (6) 14 38 BTFG WIB 10NZ 24Group 2 2H17 CB BB BTFG WIB NZ Group2 1H18 CB BB BTFG WIB NZ Group2 2H18 10,7957651 34 (140) 124 24 (53) 10,800 Up 3% Down 3% Net operating income movement ($m) 172 (435) 213 19 5 3 39 11,151 2H17 AIEA1 Margins Fees & Wealth Trading Other 1H18 AIEA Margins Fees &WealthTrading Other 2H18 growth commissions growthcommissions 10,795 77 (146) 159 (88) (13) 10,800 Net interest up 4% Non-interest up 2% Net interest down 3% Non-interest down 3%
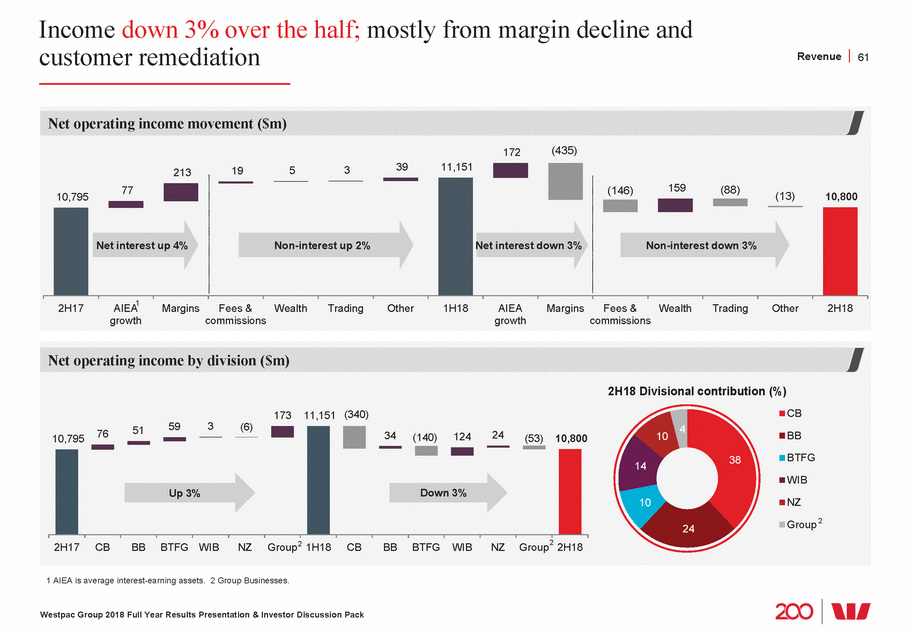
of lending and deposits Composition Revenue 62 427 Aust. institutional 1 Gross loans. Westpac Group 2018 Full Year Results Presentation & Investor Discussion Pack Sep-17 Mar-18 Consumer Bank Business Bank WIB New Zealand Other (inc. BT) Sep-18 Sep-17 Mar-18 New lending Net run off Sep-18 Customer deposit mix ($bn) and % of total Term deposits Savings Transaction 487 502 518 42% 152 29% 29% 143 Up 3% 139 Up 3% 152 155 154 194 204 214 Sep-17 Mar-18 Sep-18 Customer deposit composition ($bn) CB BB WIB BTFG, NZ & Other 518 487 502 Sep-17 Mar-18 Sep-18 96 96 92 105 99 92 111 107 108 206 196 199 Net loans ($bn) 685 701 7 1 1 (1) 1 710 Up 1% Composition of lending (% of total) 2 Aust. mortgages 10 Aust. business 3 Aust. other consumer 13 63 New Zealand lending Other overseas lending Australian mortgage lending1 ($bn) 37 (29) 437 445
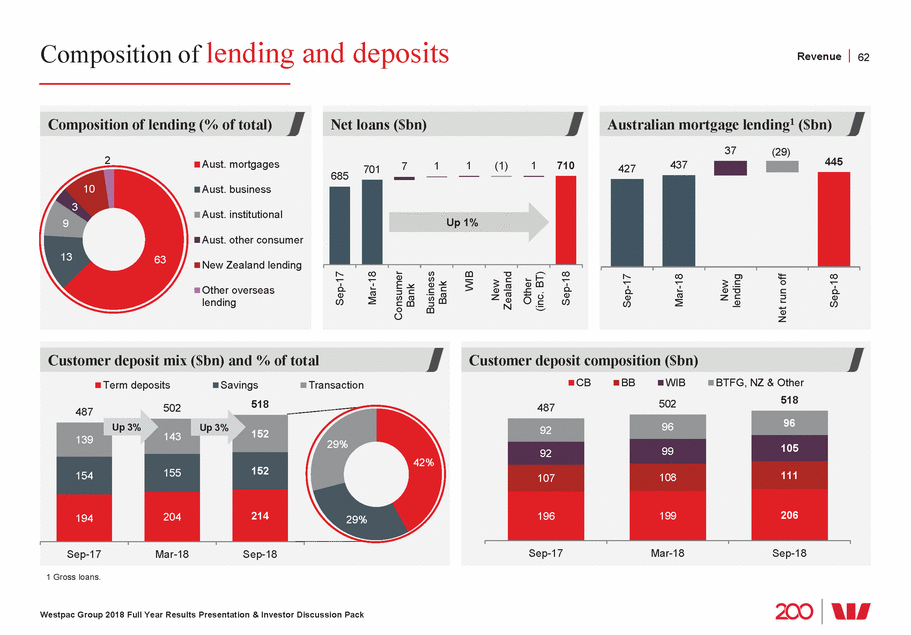
Net interest margin excluding Treasury & Markets down 10bps Revenue 63 1bp (5bps) Westpac Group 2018 Full Year Results Presentation & Investor Discussion Pack 2H17 1H18 Provision for customer refunds and payments Loans Customer deposits Short term wholesale funding Term wholesale funding Bank Levy Capital & other Liquidity Treasury & Markets 2H18 Net interest margin by division (%) 1H17 2H17 1H18 2H18 2.70 2.74 2.78 2.76 1.96 2.09 2.15 2.16 CB BB WIB NZ 2.27 2.36 2.37 2.11 1.56 1.62 1.58 1.72 Net interest margin (NIM) movement (%) Treasury & Markets impact on NIM NIM excl. Treasury & Markets 2.17 (2bps) 2.10 0.12 (4bps) 0bp 0bp 1bp (1bp) (2bps) 2.05 0.08 2.05 Margin excluding Treasury & Markets down 10bps 0.10 2.02 1.95 Net interest margin (%) NIM NIM excl. Treasury & Markets 2.12 2.05 2.03 1.95 2H13 1H14 2H14 1H15 2H15 1H16 2H16 1H17 2H17 1H18 2H18
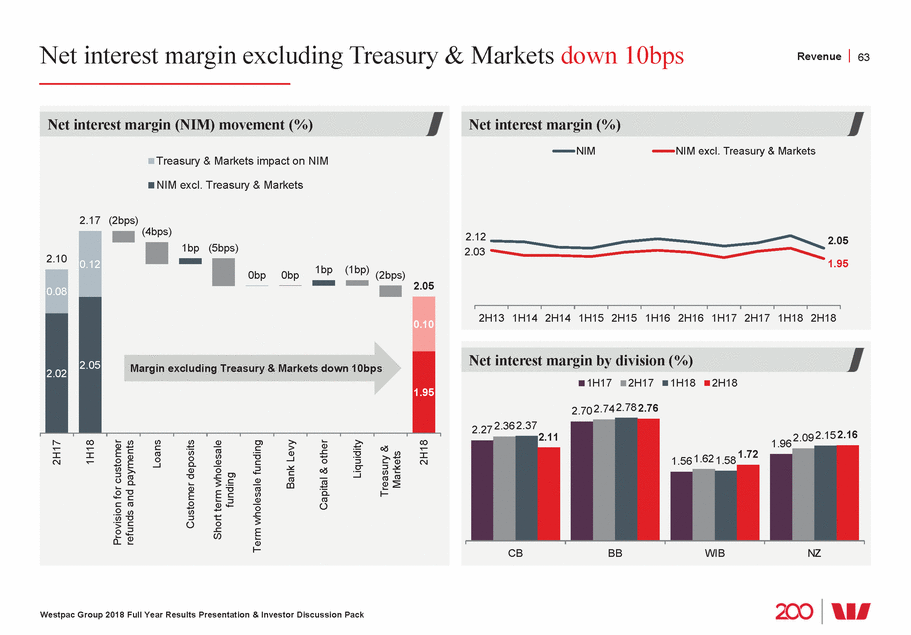
Non-interest income down 3% Revenue 64 2,762 43 25 66 53 10 14 1 2H18 includes $144m of fees associated with Hastings exit. Westpac Group 2018 Full Year Results Presentation & Investor Discussion Pack Wealth management income ($m) FUM/FUA Other (mostly BT) NZ & WIB 7701 2H16 1H17 2H17 1H18 2H18 665 622 585 632 86 201 206 128 196 382 365 371 381 206 82 51 55 187 377 Insurance income ($m) Life General LMI & NZ 339 297 318 2H16 1H17 2H17 1H18 2H18 305 264 82 86 97 42 126 136 80 78 116 143143 70 105 76 143 Non-interest income contributors ($m) Fees and commissions Wealth and insurance Trading Other 2,905 3,068 2,784 2,850 419 2H16 1H17 2H17 1H18 2H18 713 514 504 27 507 970 886 924 929 1,088 1,396 1,426 1,329 1,348 1,202 Markets income by activity ($m) Customer Market related risk Derivative valuation adjustments 748 19 535 0 522 2H16 1H17 2H17 1H18 2H18 546 247 610 162 89 72 27 60 482 448 447 448 436
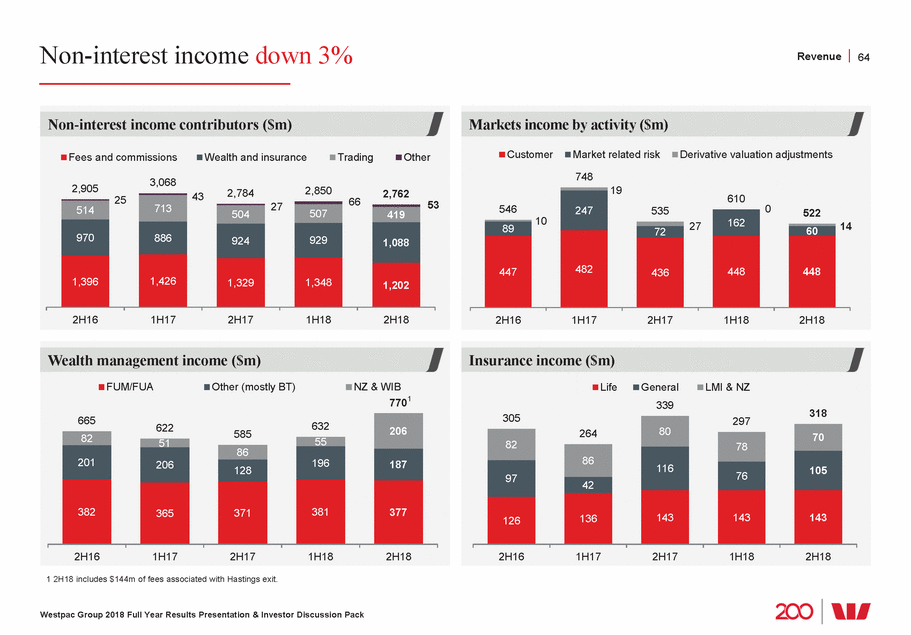
Markets & Treasury1 income Revenue 65 1 Includes net interest income and non-interest income but excludes derivative valuation adjustments. Westpac Group 2018 Full Year Results Presentation & Investor Discussion Pack Markets non-customer and Treasury income ($m) Markets non-customer Treasury 653 574 395 2H15 1H162H161H17 2H171H182H18 546 507 484 142 131 89 376 404 395 247 349 72 406 277 162 412 60 335 Markets customer income ($m) 482 462 465 447 2H15 1H16 2H16 1H17 2H17 1H18 2H18 436 448 448
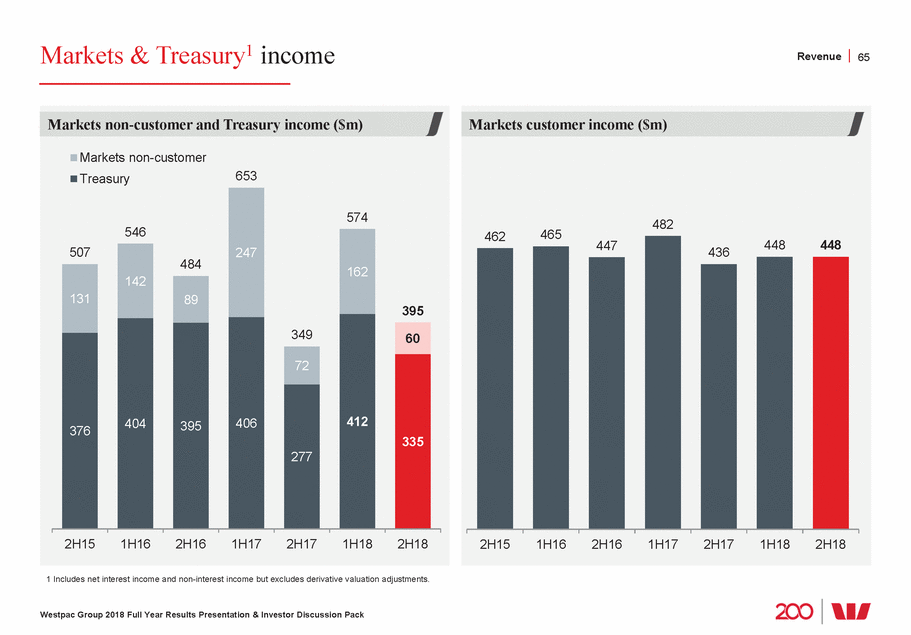
Expenses up 6% from the impact of infrequent items, higher regulatory and compliance costs, and investment spend Expenses 66 litigation and implementing customer refunds and payments 199 126 4,733 66 4,654 60 35,096 247 35,029 expenses compliance infrequent items 49.9 48.1 46.9 45.8 45.0 44.8 43.7 1 Company data, Credit Suisse. Expense to income ratio average for Peer 1, 2 and 3 based on FY18 results, all others based on FY17. Peer 1 and 2 are presented on a continuing operations basis. Peer 3 excludes restructuring costs. European average excludes Deutsche Bank. Westpac Group 2018 Full Year Results Presentation & Investor Discussion Pack US regional average European average UK average Canadian average Korean average Peer 1 Hong Kong average Peer 3 Singapore average Peer 2 WBC Productivity savings ($m) 304 219 239 FY14 FY15 FY16 FY17 FY18 263 262 Global peer comparison of expense to income ratios1 (%) 62.9 61.7 61.1 55.9 Expense movements ($m) Costs associated with the exit of Hastings and provisions for (173) 4,932 Up 2% Up 6% 1H18Ongoing Productivity Investment Regulatory/ 2H18 exInfrequent2H18 items FTE run versus change (#) Run: ongoing operations Change: project based 377 35,720 (497) (194) 2H17 Run Change 1H18 Run Change 2H18
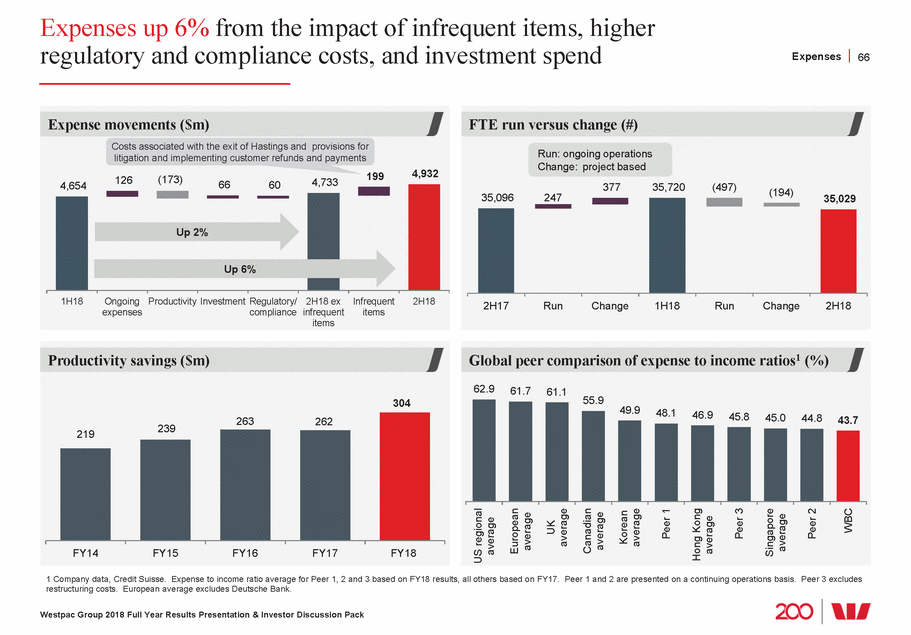
Investment spend focused on growth, productivity and compliance Expenses 67 Investment spend ($m) FY16 FY17 FY18 Expensed 517 479 530 Capitalised 710 777 881 Total investment spend 1,227 1,256 1,411 Investment spend expensed 42% 38% 38% Capitalised software Opening balance 1,654 1,781 1,916 Additions 696 766 882 Amortisation (565) (614) (618) Other1 4 (17) (3) Closing balance 1,781 1,916 2,177 Average amortisation period 2.9yrs 2.9yrs 3.1yrs Other deferred expenses Deferred acquisition costs 101 86 71 Other deferred expenses 45 28 29 1 Includes write-offs, impairments and foreign exchange translation. 2 Peer 1 and 2 are reported on a continuing operations basis. Based on FY18. Westpac Group 2018 Full Year Results Presentation & Investor Discussion Pack Capitalised software2 Capitalised software balance ($bn) Amortisation ($bn) Average amortisation period (years) 5.5 Peer 1 Peer 2 Peer 3 WBC 4.3 3.2 2.90 2.18 3.1 1.82 1.42 0.62 0.57 0.50 0.46 Investment spend mix ($m) Other technology Regulatory change Growth and productivity 1,411 FY16 FY17 FY18 1,227 1,256 197 139 171 377 325 278 837 792 778
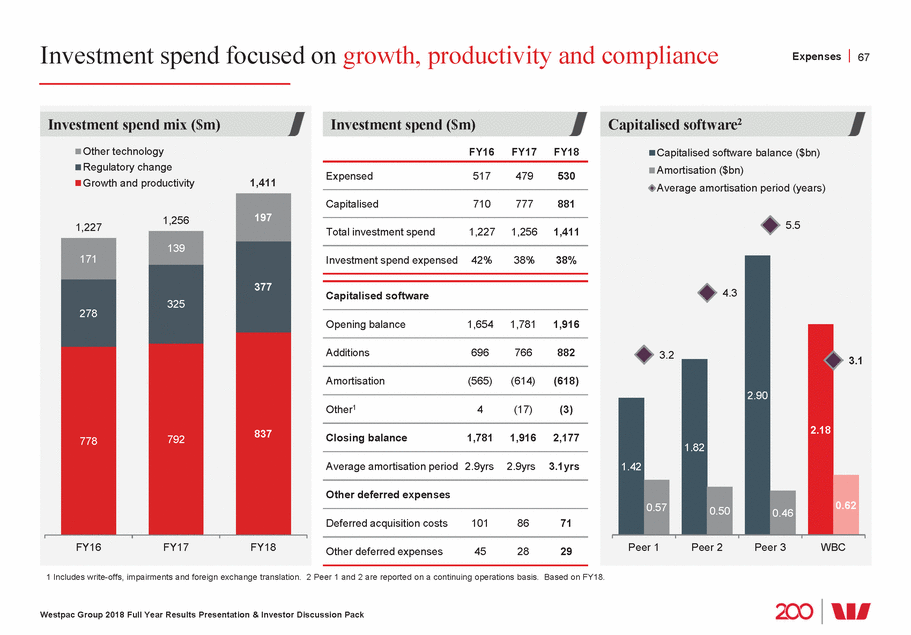
Continued low impairment charge reflects sound credit quality Impairments 68 525 493 (86) (147) (167) (162) (183) Remains low, (228) (228) 80 40 20 1 Interest carrying adjustment is reported as net interest income and not in impairment charges. 2 2008 and 2009 are Pro forma including St.George for the entire period with 1H09 ASX Profit Announcement providing details of Pro forma adjustments. Westpac Group 2018 Full Year Results Presentation & Investor Discussion Pack Impairment charges and stressed exposures2 (bps) 120 500 Impairment charge to average loans 100 400 annualised (lhs) Stressed exposures to TCE (rhs) 300 60 200 100 0 0 2008 2009 2010 2011 2012 2013 2014 1H15 2H15 1H16 2H16 1H17 2H17 1H18 2H18 108bps 9bps Impairment charges ($m) Individually assessed Collectively assessed New IAPs Write-backs & recoveries Write-offs direct Other movements in CAP Total Lower consumer early 364 443 430 428 cycle delinquencies and 360 393317 (43)CAP interest carrying marginally higher in BB 96959389 1H17 2H17 1H18 2H18 1H17 2H17 1H18 2H18 1H17 2H17 1H18 2H18 1H17 2H17 1H18 2H18 1H17 2H17 1H18 2H18 246 173 198 overlay reduction adjustment ($m)1
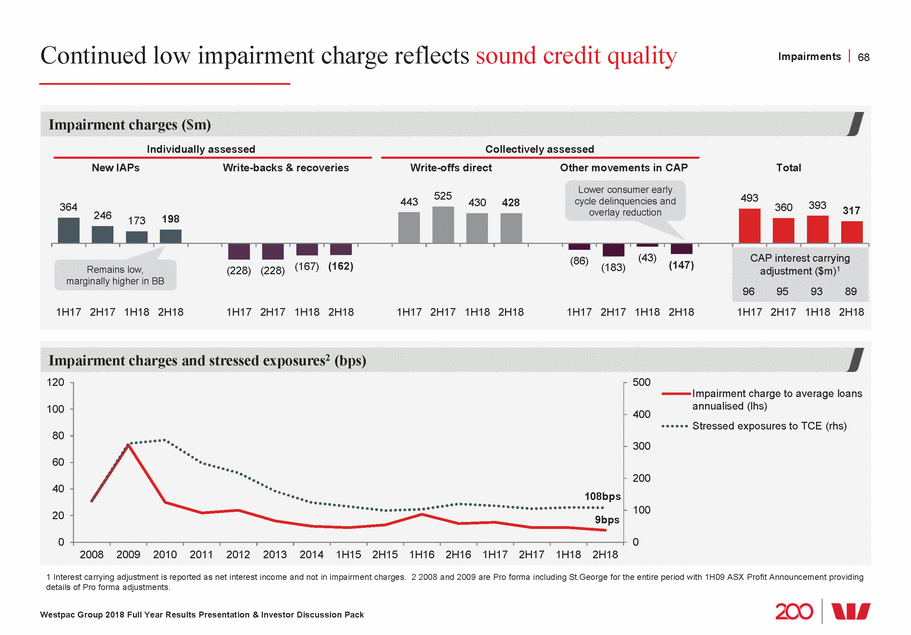
Credit Quality

High quality portfolio with bias to mortgage lending Credit Quality 70 Asset composition (%) Total assets ($880bn) Sep-16 Sep-17 Sep-18 Loans 79 81 81 Trading securities, financial assets at fair value and available-for-sale securities 10 10 9 Derivative financial instruments 4 3 3 Cash and balances with central banks 2 2 3 Life insurance assets 2 1 1 Other consumer Goodwill 1 1 1 Receivables due from other financial institutions 1 1 1 Other assets 1 1 1 Exposure by risk grade at 30 September 2018 ($m) Standard and Poor’s Risk Grade1 Australia NZ / Pacific Asia Americas Europe Group % of Total AAA to AA-92,881 8,691 2,174 17,744 745 122,235 12% A+ to A-34,948 4,645 7,763 5,191 3,501 56,048 5% 56,281 11,585 9,687 2,600 1,412 81,565 8% BBB+ to BBB-BB+ to BB 72,064 11,900 1,487 383 108 85,942 8% 62,836 9,621 120 17 0 72,594 7% BB-to B+ <B+ 5,808 2,356 0 0 0 8,164 1% 508,265 53,819 355 0 0 562,439 54% Mortgages Other consumer products 44,066 4,948 5 0 0 49,019 5% 877,149 107,565 21,591 25,935 5,766 1,038,006 Total committed exposures (TCE) Exposure by region2 (%) 85% 10% 2% 2% 1% 100% 1 Risk grade equivalent. 2 Exposure by booking office. Westpac Group 2018 Full Year Results Presentation & Investor Discussion Pack Lending composition at 30 September 2018 (% of total) Total loans of $710bn Housing 17Business 69 Institutional 11 3
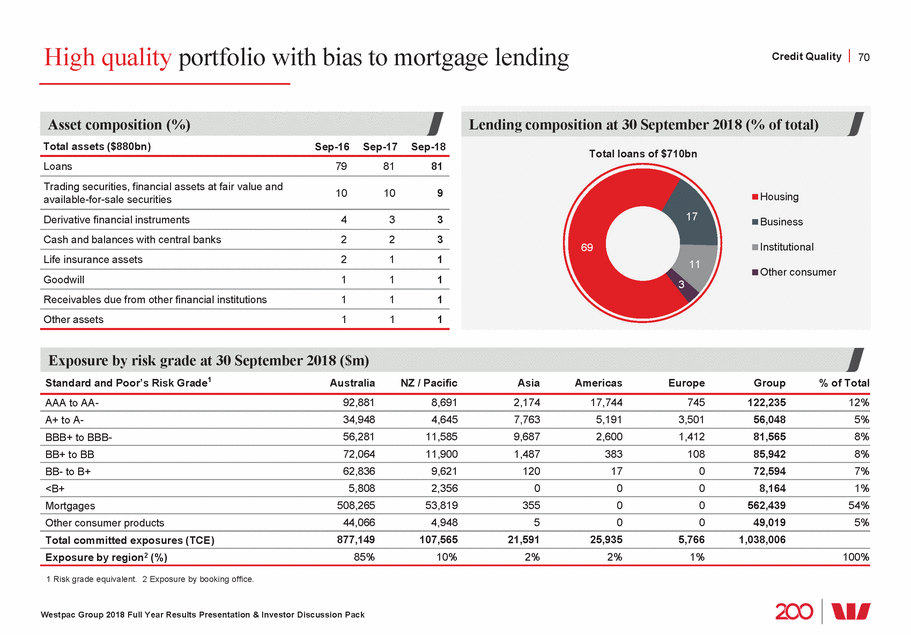
A well diversified loan portfolio Credit Quality 71 Finance & insurance Property 1.2 1.2 1.1 1.1 Mar-18 at 30 September 2018 ($m) A-A+ 1 Exposures at default is an estimate of the committed exposure expected to be drawn by a customer at the time of default. Excludes consumer lending. 2 Finance and insurance includes banks, non-banks, insurance companies and other firms providing services to the finance and insurance sectors. 3 Property includes both residential and non-residential property investors and developers, and excludes real estate agents. 4 Construction includes building and non-building construction, and industries serving the construction sector. 5 NBFI is non-bank financial institutions. Westpac Group 2018 Full Year Results Presentation & Investor Discussion Pack S&P rating or equivalent Top 10 exposures to corporations & NBFIs BBB A BBB+ BBB+ A-BBB+ BBB+ BBB-0 300 600 900 1,200 1,500 1,800 2,100 2,400 Exposures at default1 by sector ($bn) 2 3 Government admin. & defence Wholesale & retail trade Manufacturing Property services & business services Services Agriculture, forestry & fishing Transport & storage Utilities Construction4 Accommodation, cafes & restaurants Mining Other 0 20 40 60 80 100 120 Sep-18 Sep-17 Top 10 exposures to corporations and NBFIs5 (% of TCE) The single largest corporation/NBFI exposure represents less than 0.3% of TCE 1.4 1.3 1.3 1.01.11.0 Sep-09 Sep-10 Sep-11 Sep-12 Sep-13 Sep-14 Sep-15 Sep-16 Sep-17 Sep-18
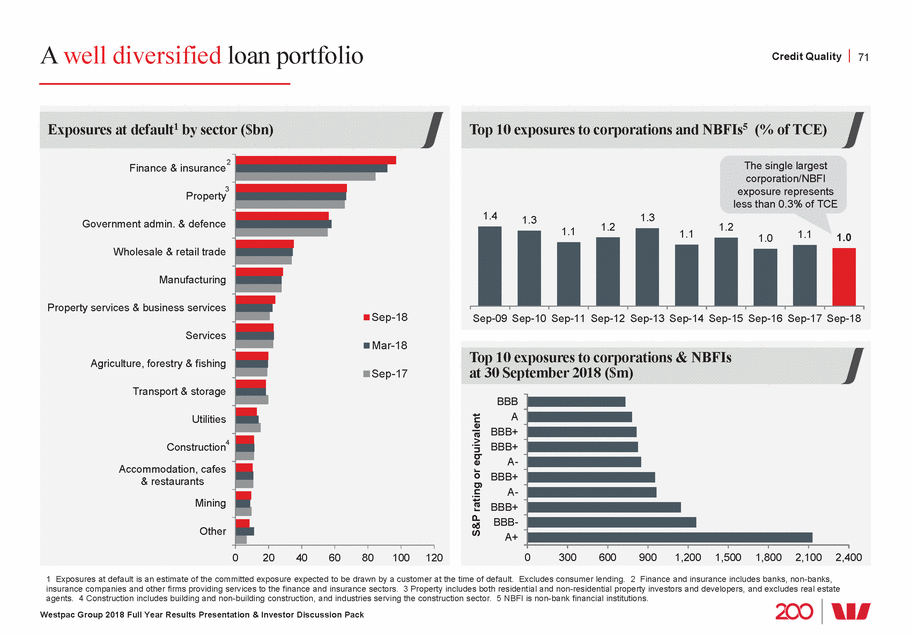
Well provisioned, sound credit quality Credit Quality 72 Provisions for impairments Sep-17 Mar-18 Sep-18 Total provisions to gross loans (bps) 45 45 43 Impaired asset provisions to impaired assets (%) 46 46 46 Collectively assessed provisions to credit RWA (bps) 76 75 73 3,481 Overlay ($m) 323 335 301 36 34 34 Westpac Group 2018 Full Year Results Presentation & Investor Discussion Pack Impaired asset provisions to impaired assets (%) Sep-17 Mar-18 Sep-18 46 46 46 48 50 46 40 Westpac Peer 1 Peer 2 Peer 3 4444 Total impairment provisions ($m) Overlay 5,061 Collectively assessed provisions Individually assessed provisions 4,414 4,241 3,949 3,602 3,1193,1653,053 Sep-10 Sep-11 Sep-12 Sep-13 Sep-14 Sep-15 Sep-16 Sep-17 Mar-18 Sep-18 453 2,986 1,622 346 2,607 1,461 363 2,408 1,470 389 3,332 389 2,196 2,225 2,275 1,364 867669 389 388 2,344 323 2,316 869 480 335 2,359 471 301 2,330 422
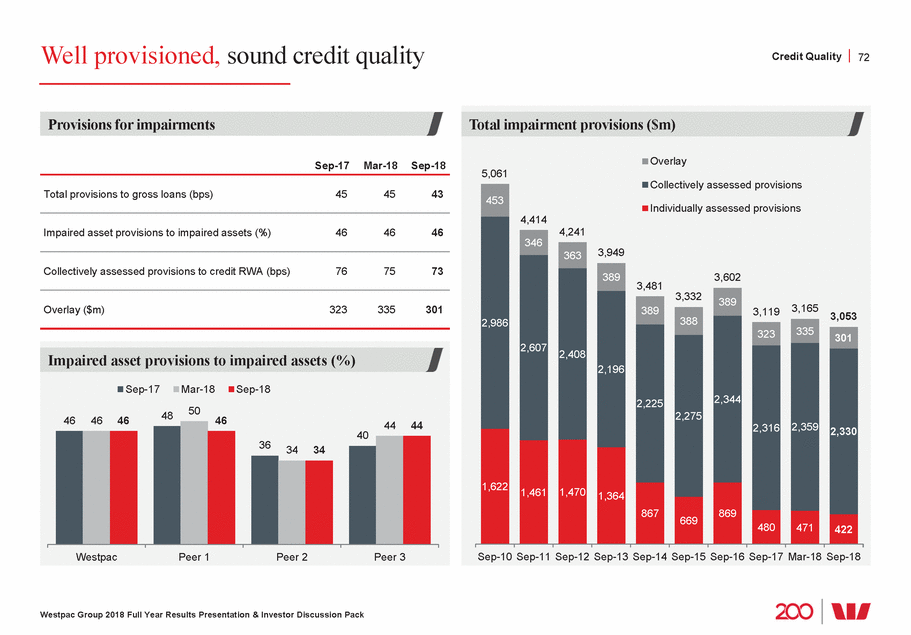
Estimated impact of AASB 9 and AASB 15 AASB 9 and 15 impact 73 ņ Stage 1 - a one year expected loss will be recognised from initial ņ Stage 2 - if the credit risk on that financial instrument has “increased ņ Stage 3 - if the financial instrument is credit impaired (default) lifetime ECL requirements that do not consider future events impact on earnings or capital excess higher from the grossing up of items previously netted net interest margin and expense to • More details will be provided in Westpac Group 2018 Full Year Results Presentation & Investor Discussion Pack Impacts of AASB 15 • Not expected to have a material • Income and expenses will be • Will impact some metrics, such as income ratio 1H19 Interest adjustment AASB 9 • Under AASB 9 the interest carrying adjustment (ICA) will only apply where the asset is in stage 3. In FY18 the CAP component of the ICA was $179m • This will result in higher impairment charges and higher net interest income • Will impact some metrics, such as net interest margin and expense to income ratio Approach to provisioning AASB 9 • The current requirement for provisioning (AASB 139) is based on an “incurred loss approach”, with the revised methodology (AASB 9) based on an “expected credit loss” (ECL) approach • The key elements of provisioning are in three stages: recognition of a financial instrument significantly since initial recognition” then a lifetime ECL is recognised is recognised (similar to existing treatment of impairment provision) • Measurement of the lifetime expected loss needs to be an “unbiased and probability weighted outcome” taking into account past events, current conditions and future forecasts. This differs from the current AASB 139 Current 30 Sept 2018 New from 1 Oct 2018 4.7 4.7 $1.6bn capital4.0Still an $0.7bn AASB 139 Accounting AASB 9 Accounting provisions capital provisions capital and capital and capital deductions deductions 3.1 deduction for excess over provisions Stage 1 CAP Stage 2 Stage 3 IAP Estimated transition impacts of AASB 9 • Impairment provisions higher ņ Estimated $974m increase in impairment provisions due to forward-looking factors and lifetime expected credit losses on stage 2 loans ņ Collectively assessed provisions (CAP) to credit risk weighted assets increase to 99bps (from 73bps) • Retained earnings lower ņ Increase in provisions will be taken through retained earnings with no impact on cash earnings • CET1 capital ratio little change (~1bp) ņ Impacts will be largely netted off in regulatory capital, lower regulatory expected loss deduction vs higher provisions • Full details will be provided in 1H19
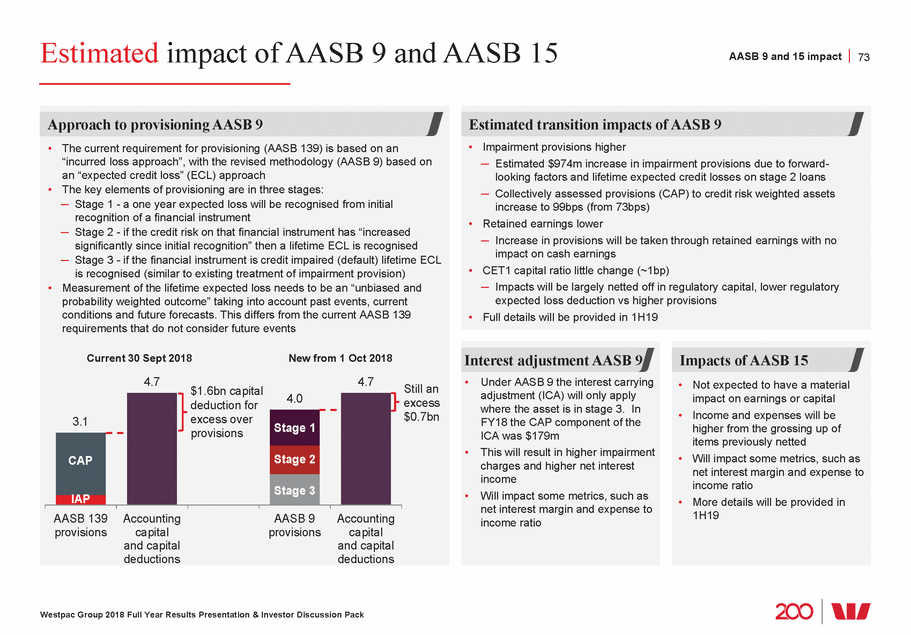
Provision cover by portfolio category Credit Quality 74 Provisioning to TCE (%) Mar-17 Sep-17 Mar-18 Sep-18 Fully performing portfolio • Small cover as low probability of default (PD) • Includes overlay 0.21 0.20 0.20 0.18 portfolio Watchlist & substandard • Still performing but higher cover reflects deterioration 4.52 4.76 4.71 5.27 90+ day past due and not impaired substandard • In default but high level of security 5.04 5.08 5.03 5.11 due and not Impaired assets • In default. High provision cover reflects expected recovery 52.07 46.30 45.54 46.12 Westpac Group 2018 Full Year Results Presentation & Investor Discussion Pack Impaired asset provisions Collective provisions Exposures as a % of TCE Fully performing Watchlist & 90+ day past impaired Impaired Mar-17 Sep-17 Mar-18 Sep-18 0.20 0.15 0.15 0.14 0.34 0.37 0.39 0.35 0.56 0.55 0.57 0.59 98.92 98.91 98.95 98.86
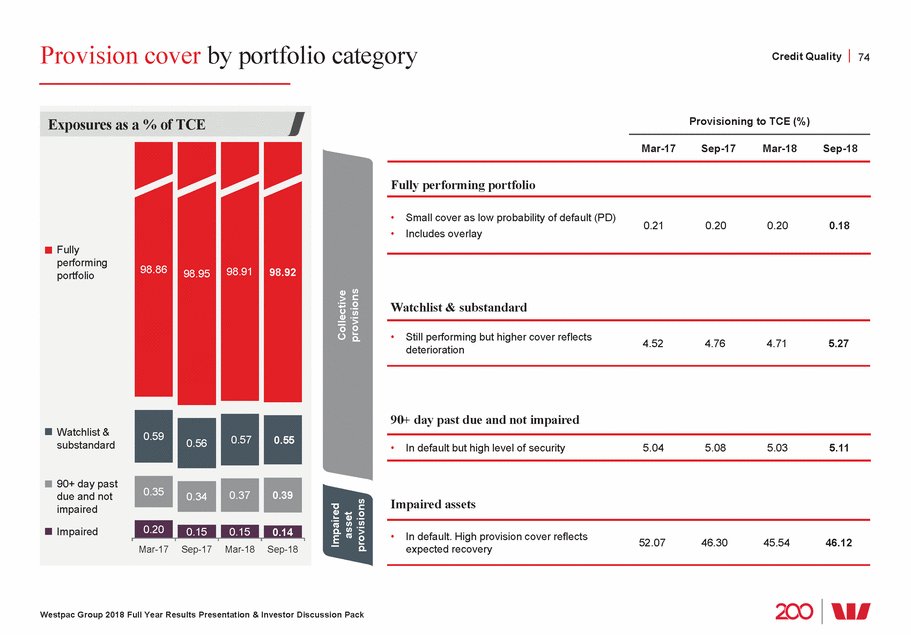
Stressed exposures little changed Credit Quality 75 Stressed exposures as a % of TCE 0 105 Watchlist & substandard 2.48 1 90+ day past due (dpd) and not impaired Impaired 2.17 1.60 1.24 1.20 1.14 1.09 1.08 1.05 1,078 997 958 477 471 440 450 1 Facilities 90 days or more past due date not impaired. These facilities, while in default, are not treated as impaired for accounting purposes. Westpac Group 2018 Full Year Results Presentation & Investor Discussion Pack Sep-11 Sep-12 Sep-13 Sep-14 Sep-15 Sep-16 Mar-17 Sep-17 Mar-18 Sep-18 2H11 Sep-17 1H12 Impaired 2H12 90+ dpd not impaired1 1H13 2H13 Substandard 1H14 Watchlist 2H14 1H15 Mar-18 2H15 Impaired 1H16 90+ dpd not impaired1 2H16 1H17 Substandard 2H17 Watchlist 1H18 Sep-18 2H18 New and increased gross impaired assets ($m) 1,343 1,194 589 1,060 708 609 607 633 1.45 0.41 0.62 1.24 0.35 0.58 0.85 0.31 0.44 0.71 0.99 0.54 0.26 0.25 0.270.20 0.65 0.33 0.22 0.59 0.56 0.35 0.34 0.200.15 0.57 0.37 0.15 0.55 0.39 0.14 Movement in stress categories (bps) 3 0 1 109 (1) 2 3 (5) 108
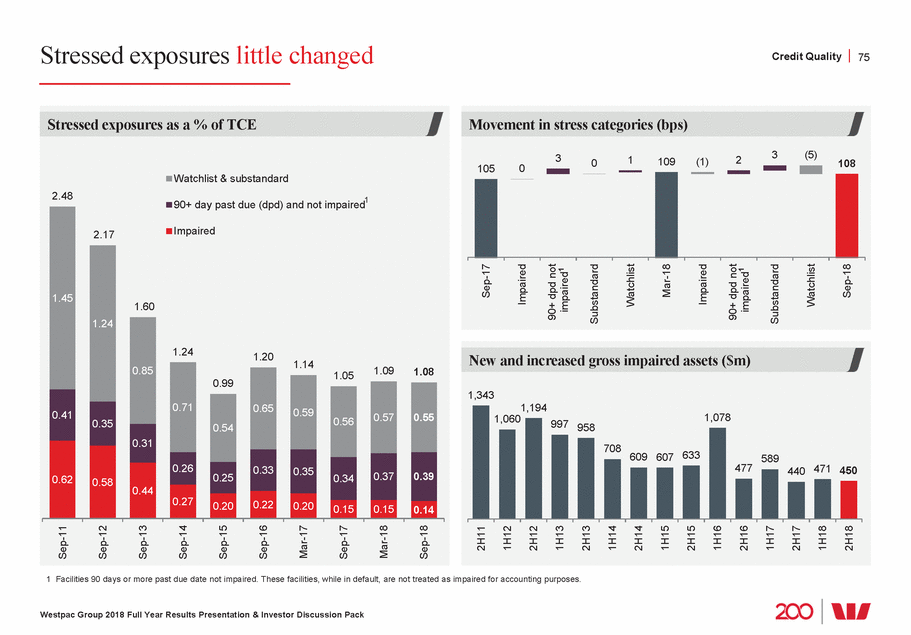
Overall stressed exposures little changed over 2H18 Credit Quality 76 2 exposures 1 Includes Finance & insurance, Utilities, Government admin. & defence. Westpac Group 2018 Full Year Results Presentation & Investor Discussion Pack Agriculture, forestry & fishing Wholesale & retail trade Property Services Property services & business services Construction Manufacturing Transport & storage Accommodation, cafes & restaurants 1 Other Mining Corporate and business portfolio stressed exposures by industry ($bn) 2.0 1.8 1.6 1.4 1.2 1.0 0.8 0.6 0.4 0.2 0.0 Sep-17 Mar-18 Sep-18 New Zealand dairy improvements Reflects retail trade sector challenges 2 exposures
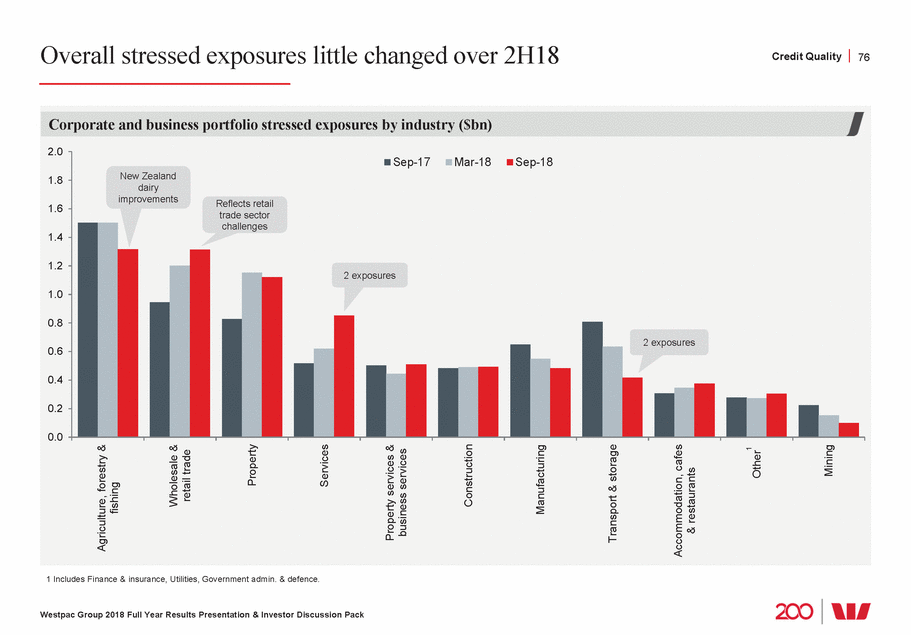
Areas of interest: Commercial property Credit Quality 77 Commercial property portfolio Sep-17 Mar-18 Sep-18 Total committed exposures (TCE) $65.2bn $66.3bn $67.6bn Lending $49.6bn $51.1bn $52.0bn Commercial property as a % of Group TCE 6.48 6.48 6.51 BB equivalent BB equivalent BB+ equivalent Median risk grade % of portfolio graded as stressed1,2 1.27 1.74 1.66 % of portfolio in impaired2 0.38 0.28 0.23 10 15 15 & diversified groups Vic Qld SA & NT 11 21 42 46 Retail Investors >$10m 27 10 Groups and Property (diversified) 1 Includes impaired exposures. 2 Percentage of commercial property portfolio TCE. Westpac Group 2018 Full Year Results Presentation & Investor Discussion Pack Mar-10 Sep-10 Mar-11 Sep-11 Mar-12 Sep-12 Mar-13 Sep-13 Mar-14 Sep-14 Mar-15 Sep-15 Mar-16 Sep-16 Mar-17 Sep-17 Mar-18 Sep-18 Commercial property portfolio composition (%) Region (%) Borrower type (%) Sector (%) NSW & ACT Exposures <$10m Commercial offices Developers >$10m Residential 44 8 WA 31 NZ & Pacific Diversified Property Industrial Institutional Trusts >$10m Commercial property exposures % of TCE and % in stress 10 Commercial property as % of TCE (lhs) 20 8 15 6 10 4 2 5 0 0 Commercial property % in stress (rhs)
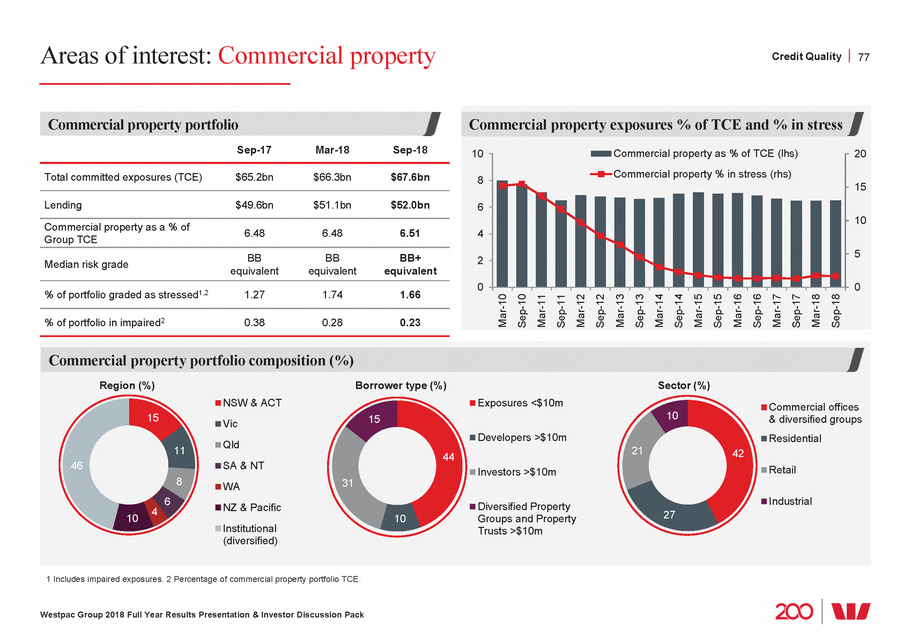
Areas of interest: Inner city apartments Credit Quality 78 Commercial property portfolio TCE ($bn) Sep-17 Mar-18 Sep-18 TCE1 • Market activity is slowing as demand eases and pre-sales and new developments start to slow. Sydney completions expected to peak in 2018, other cities peaked in 2017, still a lot of units to complete. Tightened risk appetite in areas of higher concern, which has been progressively introduced since 2012 Settlements remain slightly slower, but Westpac’s debt has been repaid in full given low LVRs Residential apartment development >$20m 4.2 4.0 4.1 6.1% Residential apartment development >$20m in major markets, shown below 2.7 2.7 2.6 3.8% • Sydney major markets 1.5 1.9 1.8 2.7% • Still active in key markets Inner Melbourne 0.7 0.6 0.6 0.9% • Weighted average LVR 47% Inner Brisbane 0.4 0.2 0.1 0.1% • Slow market. Exposure low Perth metro 0.0 0.0 0.1 0.1% • Activity slowly lifting. New loans at 46.3% weighted average LVR Adelaide CBD 0.1 0.0 0.0 - • Project completed Sep-18 48.4 n 73% 57% % s 1 Percentage of commercial property TCE. Westpac Group 2018 Full Year Results Presentation & Investor Discussion Pack Residential apartment development >$20m weighted average LVR (%) 50.2 48.5 47.3 Average portfolio LVR 48% 2018 2019 2020 2021 Expected completion date Consumer mortgages Consumer mortgages where security is within an inner city residential apartment development Mar-18 Total loans $14.7bn $15.2b Average LVR at origination 73% Average dynamic LVR 56% Dynamic LVR >90% (% of portfolio) 2.65% 2.48 90+ day delinquencies 40bps 44bp
Areas of interest: Retail trade Credit Quality 79 Retail trade portfolio Sep-17 Mar-18 Sep-18 Total committed exposures (TCE) $15.4bn $15.5bn $16.2bn Lending $11.5bn $11.3bn $11.6bn Retail trade as a % of Group TCE 1.53 1.51 1.56 BB equivalent BB equivalent BB equivalent Median risk grade % of portfolio graded as stressed1,2 3.02 4.67 4.84 % of portfolio in impaired2 0.31 0.48 0.41 16.4 16.3 16.2 15.4 15.5 15.3 Stressed 4.84 4.67 retailing services 1 Includes impaired exposures. 2 Percentage of retail trade portfolio TCE. Westpac Group 2018 Full Year Results Presentation & Investor Discussion Pack Retail trade portfolio composition Retail trade exposure (TCE) $bn % of portfolio graded as stressed Retail trade by internal risk grade category $bn Investment 6.4Sub-investment 14.4 5.3 4.5 2.29 2.68 2.51 3.02 Personal andMotor vehicleFood retailing Sep-15 Mar-16 Sep-16 Mar-17 Sep-17 Mar-18 Sep-18 Sep-15 Mar-16 Sep-16 Mar-17 Sep-17 Mar-18 Sep-18 household good retailing and 3.58 Overview • The retail sector continues to be challenged by subdued consumer demand and growth in domestic and international online channels • These changes have been emerging for a number of years and businesses need to continue to adapt • Whilst there has been a small increase in stress, the portfolio is diversified and the credit quality remains sound • The increase in exposure over 2H18 was to high quality investment grade customers
Areas of interest: Aged Care sector Credit Quality 80 Aged Care portfolio Sep-17 Mar-18 Sep-18 Total committed exposures (TCE) $2.6bn $2.5bn $2.7bn Lending $1.5bn $1.5bn $1.6bn Aged Care as a % of Group TCE 0.26 0.24 0.26 BB+ equivalent BB+ equivalent BB+ equivalent Median risk grade % of portfolio graded as stressed1,2 1.97 4.17 4.94 % of portfolio in impaired2 0.00 0.00 0.00 4.17 55 1 Includes impaired exposures. 2 Percentage of Aged Care portfolio TCE. Westpac Group 2018 Full Year Results Presentation & Investor Discussion Pack Aged Care portfolio composition Aged Care exposure (TCE) $bn % of portfolio graded as stressed Aged Care portfolio (TCE) by sector (%) 2.6 2.5 2.6 2.5 2.7 4.94 45 0.89 0.86 0.79 Sep-15 Mar-16 Sep-16 Mar-17 Sep-17 Mar-18 Sep-18 Sep-15 Mar-16 Sep-16 Mar-17 Sep-17 Mar-18 Sep-18 Nursing homes Accommodation for the aged 1.50 1.97 2.1 2.2 Overview • Aged care sector is forecast to grow with significant investment required to meet demand from Australia’s aging population • The stress increase over the year has been driven by the downgrade of three exposures • The portfolio more generally is diversified and credit quality remains sound. Westpac maintains a strong history of involvement in this sector • On 16th September, a Royal Commission into Aged Care Quality and Safety was announced. The interim report is to be provided by 31 October 2019 with a final report no later than 30 April 2020
Areas of interest: Areas experiencing drought conditions Credit Quality 81 Australian Agribusiness1 portfolio Sep-17 Mar-18 Sep-18 Total committed exposures (TCE) $10.3bn $10.6bn $10.6bn Lending $8.1bn $8.2bn $8.5bn Australian Agribusiness as Group TCE a % of 1.02 1.04 1.02 BB equivalent BB equivalent BB equivalent Median risk grade % of portfolio graded as stressed2,3 3.47 4.27 4.40 % of portfolio in impaired3 0.18 0.31 0.27 Areas of rainfall deficiencies last 18mts4 portfolio by state NSW/ACT 13 26 Dairy 5 31 Fishing & Aquaculture 6 10 Forestry & Logging 18 25 1 Agribusiness defined by ANZSICS in Pillar 3 industry Agriculture, fishing and forestry. 2 Includes impaired exposures. 3 Percentage of Australian Agribusiness portfolio TCE. 4 Source: Commonwealth of Australia 2018, Australian Bureau of Meteorology. Issued 7/10/2018. Westpac Group 2018 Full Year Results Presentation & Investor Discussion Pack Australian Agribusiness portfolio composition Agriculture, Forestry and Fishing Portfolio by industry Grain Beef & Sheep 6 QLD 2 Horticulture VIC/TAS Services to Agri 14 WA 6 Cotton 23 SA/NT Viticulture Institutional Poultry Other Overview • Many parts of Australia are currently affected by drought, in particular, NSW. Other areas such as WA are performing well. This is typical in Australia where conditions can vary across the country • In response, Westpac extended its existing support to farmers and agribusiness customers in all states under a new $100m Drought Assistance Package • Past droughts have not impacted the long term health of the portfolio due to a considered approach and limited exposure to farming regions subject to poorer agricultural conditions and which have historically had lower levels of production • Westpac has focused on building a customer base across reliable regions with higher rainfall and access to irrigation, close to a reliable workforce and markets • Since May 2018, we have contacted all agribusiness customers across Western Queensland, NSW and Northern Victoria to assist managing through current conditions
Areas of interest: Mining and NZ dairy Credit Quality 82 Mining (inc. oil and gas) portfolio Sep-17 Mar-18 Sep-18 Total committed exposure (TCE) $9.7bn $9.3bn $10.7bn 37 Lending $5.1bn $5.1bn $5.7bn % of Group TCE 0.96 0.91 1.03 % of portfolio graded as stressed1,2 2.33 1.72 0.99 % of portfolio in impaired2 0.44 0.31 0.17 New Zealand dairy portfolio Sep-17 Mar-18 Sep-18 Economics Total committed exposure (TCE) (NZD) $6.0bn $6.1bn $6.3bn 1 Lending (NZD) $5.8bn $5.8bn $6.0bn % of Group TCE 0.55 0.55 0.55 % of portfolio graded as stressed1,2 17.02 14.94 11.90 % of portfolio in impaired2 0.34 0.47 0.36 1 Includes impaired exposures. 2 Percentage of portfolio TCE. 3 Sourced from Westpac Economics and Bloomberg. 4 The steel index 62% Fe fines benchmark. 5 Brent oil price. 6 Source Fonterra. Westpac Group 2018 Full Year Results Presentation & Investor Discussion Pack NZ dairy portfolio (TCE) by security (%) 24 75 Fully secured Partially secured Unsecured Milk price & Fonterra dividend6 (NZ$) Kg Ms Dividend Westpac $10 Milk price $8 $6 $4 $2 $0 2014/15 2015/16 2016/17 2017/18 2018/19 forecast 0.400.100.30 6.69 6.25 0.25 0.40 6.12 4.40 3.90 Mining portfolio (TCE) by sector (%) 7 15 13 18 10 Oil and gas Iron ore Other metal ore Coal Mining services Other Iron Ore and Oil prices ($)3 Iron ore (USD/t)4 Crude oil (USD/bbl)5 Westpac 100 60 20 Sep-15 Sep-16 Sep-17 Sep-18 Sep-19 Economics forecast
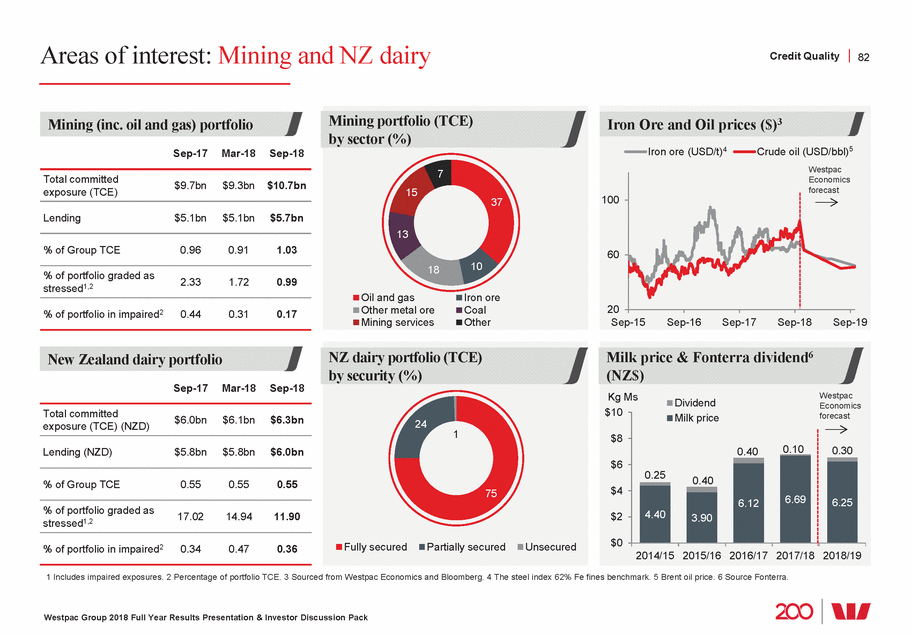
Australian consumer unsecured lending, 3% of Group loans Credit Quality 83 Australian consumer unsecured lending portfolio Sep-17 Mar-18 Sep-18 Lending $22.0bn $21.8bn $21.1bn 30+ day delinquencies (%) 3.60 3.95 3.65 90+ day delinquencies (%) 1.66 1.71 1.73 The small increase in Australian unsecured lending portfolio 90+ day delinquencies over FY18 was driven by an operational issue in collections delaying the write-off of Auto Finance defaulted loans Australian unsecured portfolio ($bn) Sep-17 Mar-18 Sep-18 22 22 21 Hardship reporting 7 7 7 1 Westpac changed hardship treatment following guidance from APRA which is intended to standardise the industry treatment of delinquency classification of facilities in hardship. Hardship allows eligible customers to reduce or defer repayments in the short term to manage through a period of financial difficulty (e.g. unemployment, injury, natural disasters). Solutions are tailored to customer circumstances and may include extending the loan or restructuring. Westpac Group 2018 Full Year Results Presentation & Investor Discussion Pack 10 10 9 5 5 5 Credit cards Personal Auto loans Total loans (consumer) consumer unsecured 90+ day delinquencies (%) Personal loans Auto loans Personal loans Auto loans ex-hardship ex-hardship 3.00 changes commenced1 2.00 1.00 - 90+ day delinquencies (%) Total unsecured Credit cards consumer lending Total ex-hardship Credit cards ex-hardship 3.00 2.00 1.00 - Hardship reporting changes commenced1 90+ day delinquencies (%) by State NSW/ACT VIC/TAS QLD WA SA/NT 3.00 2.00 1.00 - Hardship reporting changes commenced1
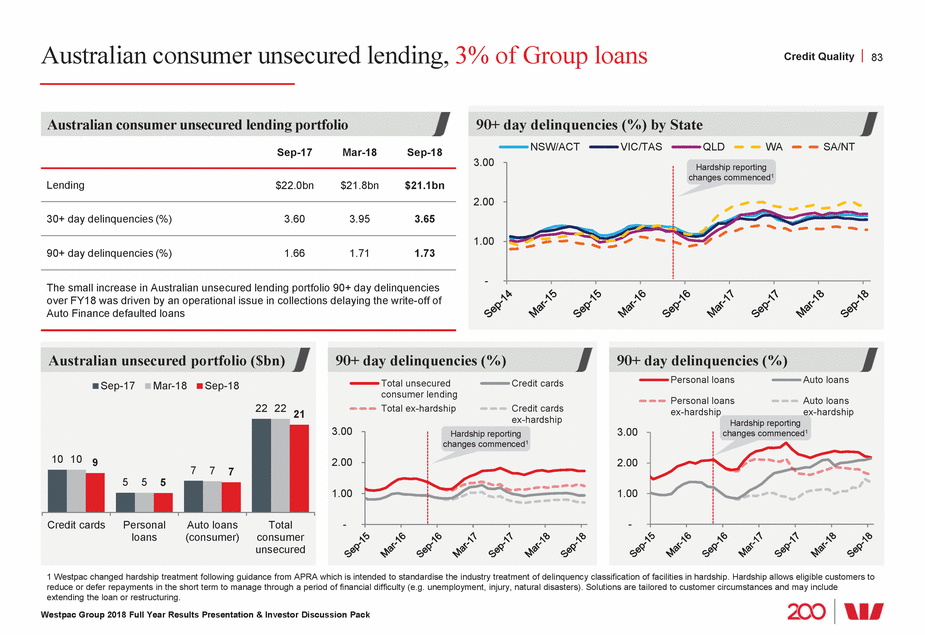
Australian mortgage portfolio performance Credit quality 84 Australian mortgage portfolio delinquencies (%) Australian mortgage delinquencies and properties in possession (PIPs) Sep-17 Mar-18 Sep-18 90+ day past due total 90+ day past due investor 3.0 30+ day delinquencies (bps) 130 144 140 90+ day delinquencies (bps) (includes impaired mortgages) 67 69 72 2.0 Consumer PIPs 437 398 396 1.0 Properties in possession continue to be mostly in WA and Qld however Qld properties reduced over the year, while WA increased. A targeted collections approach has improved customer outcomes, supporting customers through the foreclosure process 0.0 Mar-15 Sep-15 Mar-16 Sep-16 Mar-17 Sep-17 Mar-18 Sep-18 Housing lending portfolio by State (%) Chart does not add to 100 due to rounding Australian banking system1 Westpac Group portfolio FY18 Westpac Group drawdowns 44 41 37 30 27 27 17 17 14 12 9 7 6 7 6 1 Source ABA Cannex August 2018. 2 Under the changes in hardship treatment, an account in hardship continues to migrate through delinquency buckets until 90+ days past due. Accounts are then reported as 90+ days past due until full repayments are maintained for 6 months. Westpac Group 2018 Full Year Results Presentation & Investor Discussion Pack NSW & ACT VIC & TAS QLD WA SA & NT Australian mortgages 90+ day delinquencies by State (%) 3.0 2.0 1.0 0.0 Mar-15 Sep-15 Mar-16 Sep-16 Mar-17 Sep-17 Mar-18 Sep-18 NSW/ACT VIC/TAS QLD WA SA/NT ALL Introduced new hardship treatment2 30+ day past due total Loss rates Introduced new hardship treatment2
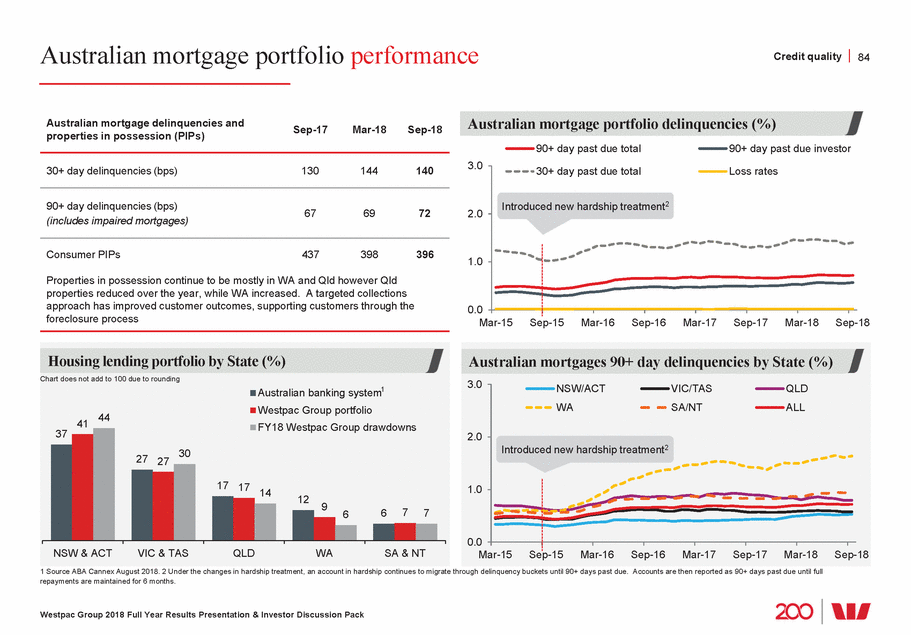
Australian mortgage portfolio well collateralised Credit quality 85 Sep-17 balance Mar-18 balance Sep-18 balance 2H18 flow1 Australian mortgage portfolio 100 FY18 drawdowns LVR at origination Portfolio LVR at origination Portfolio dynamic LVR 5 Total portfolio ($bn) 427.2 437.2 444.7 36.9 Owner occupied (%) 55.5 56.0 56.8 62.0 Investment property loans (%) 39.8 39.5 39.1 37.6 57 Portfolio loan/line of credit (%) 4.7 4.5 4.1 0.4 79 / 21 78 / 22 Variable rate / Fixed rate (%) 77 / 23 77 / 23 45.5 23.1 Interest only (%) 39.6 34.8 17 7 6 5 4 57.3 51.6 Proprietary channel (%) 56.5 56.1 N/A 1 1 1 0 0 First home buyer (%) 8.1 7.9 7.8 8.2 Mortgage insured (%) 17.5 16.9 16.3 11.1 Sep-17 Mar-18 Sep-18 Average loan size2 ($’000) 264 270 273 Customers ahead on repayments including offset account balances3 (%) 70 68 69 Actual mortgage losses net of insurance4 ($m, for the 6 months ending) 48 48 38 Actual mortgage loss rate annualised (bps, for the 6 months ending) 2 2 2 1 Flow is new mortgages settled in the 6 months ended 30 September 2018 and includes RAMS. 2 Includes amortisation. 3 Excludes RAMS in 2H17. Includes RAMS in 1H18 and 2H18. Loans ahead on payments exclude equity/line of credit products as there are no scheduled principal payments. 4 Mortgage insurance claims 2H18 $4m (1H18 $6m; 2H17 $9m). 5 Excludes RAMS in all periods. 6 LVR calculated as simple average by balances. 7 Dynamic LVR is the loan-to-value ratio taking into account the current loan balance, changes in security value, offset account balances and other loan adjustments. Property valuation source Australian Property Monitors. 8 Average LVR of new loans is on rolling 6 months. 9 Weighted average LVR calculation considers size of outstanding balances. Westpac Group 2018 Full Year Results Presentation & Investor Discussion Pack Australian housing loan-to-value ratios (LVRs) (%) 90 80 70 60 50 40 30 20 10 46 49 17 15 14 16 22 10 11 0<=60 60<=70 70<=80 80<=90 90<=95 95<=100 Australian mortgage portfolio LVRs Sep-17 Mar-18 balancebalance >100 Sep-18 balance Simple averages LVR at origination6 (%) 70 70 70 Dynamic LVR5,6,7 (%) 42 41 43 LVR of new loans6,8 (%) 67 69 69 Weighted averages LVR at origination9 (%) 74 74 74 Dynamic LVR 5,7,9 (%) 52 52 54 LVR of new loans 8,9 (%) 73 71 71
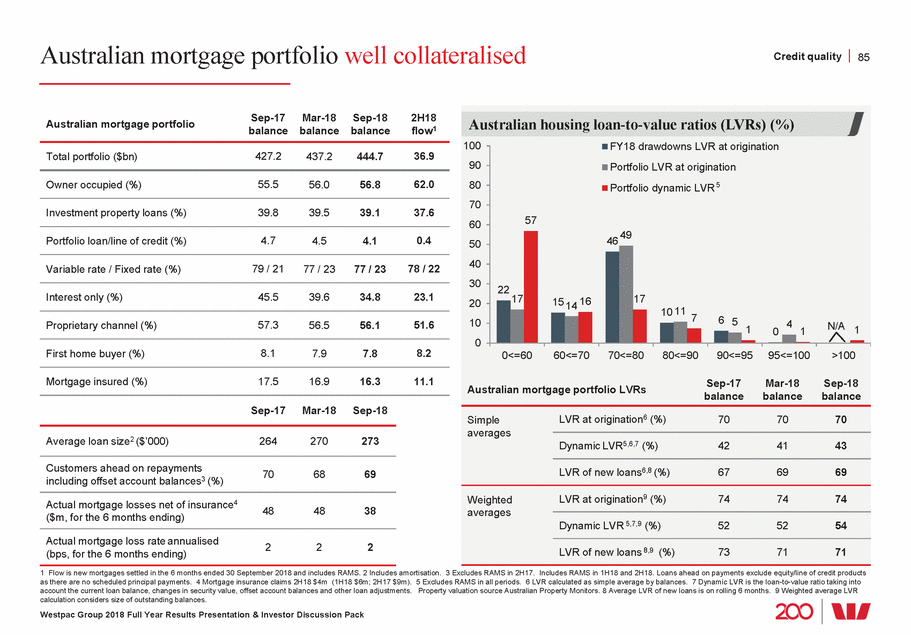
Australian mortgage portfolio standards tightening Credit quality 86 Notable changes to Westpac mortgage lending standards • 10% limit on investment property lending growth announced – implemented by 30 September 2015 2014 • Stricter loan affordability tests for new borrowers – Increase in minimum assessment (‘floor’) rate to 7.25% – Increase in serviceability assessment buffer to 2.25% Credit card repayments assessed at 3% of limit (previously 2%) Expenses benchmark (HEM) adjusted by income bands as well as post settlement postcode location, marital status and dependants Serviceability for loans with interest only terms assessed over the residual P&I term, not full loan term Maximum I/O terms reduced – owner occupied reduced to 5 years • • 2015 • • • Mandatory 20% minimum shading on all non-base income (e.g. rental income, annuity income) – previously non-base income discounted by varying amounts Stopped non-resident lending – For Australian and NZ citizens and permanent visa holders using foreign income, tightened verification and LVR restricted to 70% Maximum I/O terms for new IPLs reduced to 10 years Maximum LVRs restricted to include LMI capitalisation • 2016 • • • • • • 30% limit on new interest-only lending (based on % of limits) Tighter limits on interest-only lending >80% LVR Heightened supervision of mortgage lending warehouses Strengthened pre settlement hind-sighting process of applications with introduction of day 2 review team 2017 • More granular assessment of expenses through the introduction of 13 categories to capture living expenses and other commitments 2018 Westpac Group 2018 Full Year Results Presentation & Investor Discussion Pack Pre-2006 2006 2007 2008 2009 2010 2011 2012 2013 2014 2015 2016 2017 2018 (YTD) Australian mortgage portfolio by calendar year of origination (% of total book) 59% of the portfolio originated after major tightening of lending standards 17 15 14 13 9 7 4 4 4 3 4 2 2 Calendar year 2
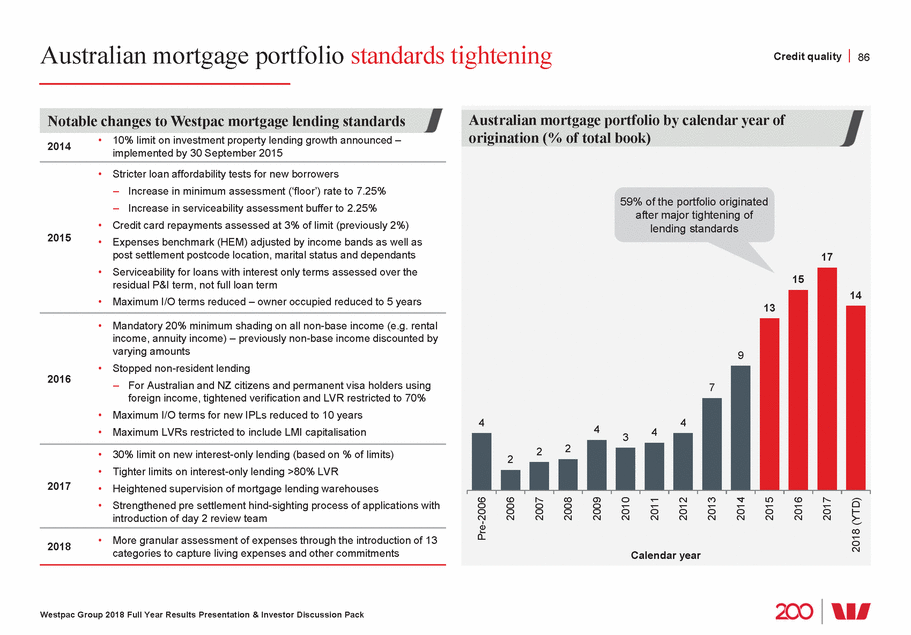
Australian mortgage portfolio repayment buffers Credit quality 87 for a mortgage must discount - 7.25% minimum home loan customers ahead on repayments3 (% by balances) Sep-17 Mar-18 Sep-18 Loans ‘On time' and <1 mth ahead (% of balances) 69.2% of Westpac borrowers are ahead on their mortgage repayments, including offset account balances 49 Investment property loans - incentive is to keep repayments high for tax purposes Accounts opened in the last 12 months 30 29 29 24 23 22 22 22 21 Loans with structural restrictions on repayments e.g. fixed rate Residual - less than 1 month repayment buffer 1 SVR is the Standard Variable Rate for owner-occupied Westpac Rocket Repay Home Loan inclusive of Premier Advantage Package discount. 2 Excludes RAMS. 3 Includes RAMS in 1H18 and 2H18. Customer loans ahead on payments exclude equity/line of credit products as there are no scheduled principal payments. Includes mortgage offset accounts. ‘Behind’ is more than 30 days past due. ‘On time’ includes up to 30 days past due. Westpac Group 2018 Full Year Results Presentation & Investor Discussion Pack Sep-14 Mar-15 Sep-15 Mar-16 Sep-16 Mar-17 Sep-17 Mar-18 Sep-18 Mar-14 Sep-14 Mar-15 Sep-15 Mar-16 Sep-16 Mar-17 Sep-17 Mar-18 Sep-18 Australian 1 1 1 18 19 20 666 Behind On time < 1 Mth < 1 Yr < 2 Yrs >2 Yrs Sep-18 24 6 6 13 Westpac Australian offset account balances2 ($bn) Linked to I/O mortgages Linked to P&I mortgages . 36.2 37.4 38.6 39.2 26.8 30.5 33.4 34.9 20.9 23.6 Mortgage interest rate buffers (%) Westpac owner occupied SVR1 inc package • Borrowers applying be able to service 9 Westpac minimum assessment ('floor') rate the higher of either: 7.25 7 assessment rate; or 5 4.58 - Product rate plus 2.25% buffer 3
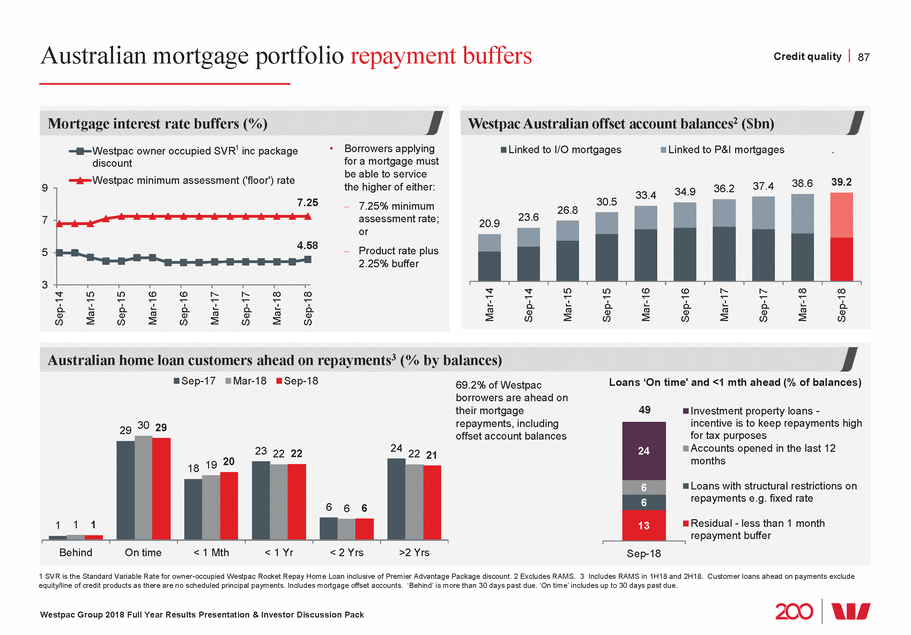
Interest only (I/O) portfolio Credit quality 88 34.8 34.2 >$250k 1 Flow is based on APRA definition. 2 I/O is interest only mortgage lending. P&I is principal and interest mortgage lending. 2 Interest rates as at 7 March 2018 for Westpac Rocket Repay Home Loan inclusive of Premier Advantage Package discount assuming loan amount $250,000 - $499,999. 4 Excludes RAMS. Dynamic LVR is the loan-to-value ratio taking into account the current loan balance, changes in security value, offset account balances and other loan adjustments. Property valuation source Australian Property Monitors. 5 Excludes I/O loans that should have switched to P&I but for the previously announced mortgage processing error. Westpac Group 2018 Full Year Results Presentation & Investor Discussion Pack Scheduled I/O term expiry5 (% of total I/O loans) 19 19 0<1 Yr 1<2 Yrs 2<3 Yrs 3<4 Yrs 4<5 Yrs 5<10 Yrs 10 Yrs+ 16 16 14 9 7 I/O lending (%) By dynamic LVR4 and income band (%) Applicant gross income bands 56 13 $100k - $250k 34 <$100k 29 8 11 2 2 18 13 7 <=60% 60%<=80% >80% Dynamic LVR bands (%) Chart does not add due to rounding 6 I/O portfolio (%) % of total portfolio (at period end) % of all new flows by limit (6 mnth)1 45.5 39.6 2H17 1H18 2H18 22.6 23.1 Switching from I/O to P&I2 ($m) Reached end of I/O period Customer initiated 1Q18 2Q18 3Q18 4Q18 • In FY18 $33bn (17%) of the I/O portfolio switched to P&I (52% proactively; 48% contractually) • Total of $51bn has switched to P&I in last 18mths 4,716 4,326 3,788 4,044 4,110 4,149 3,911 3,623 Variable mortgage interest rates3 (%) at 17 October 2018 Owner occupied Investor 5.64 5.17 5.13 4.58 P&I I/O P&I I/O
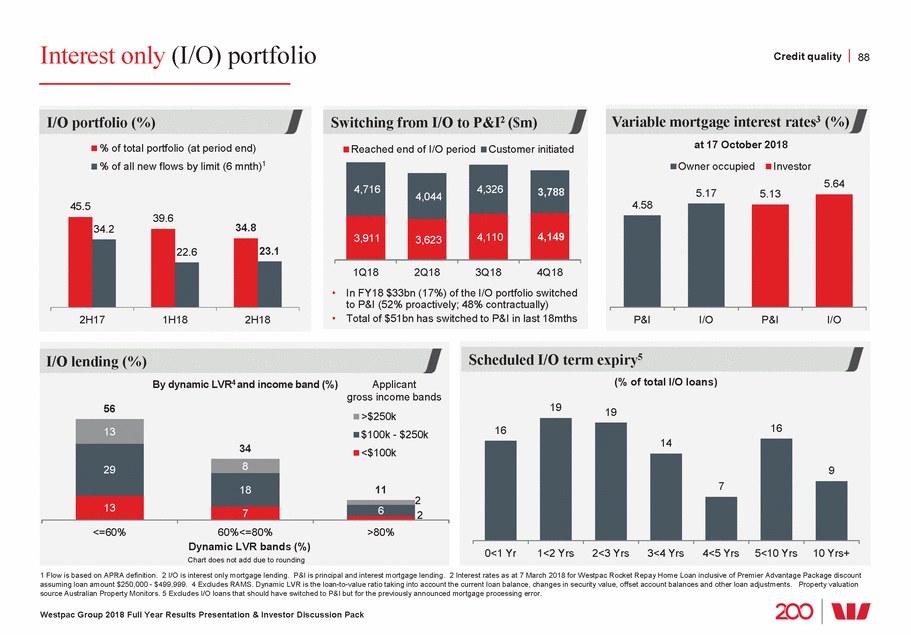
Performance of interest only mortgages Credit quality 89 Interest only lending • Interest only (I/O) loans assessed on a principal and interest basis – Loans originated prior to 2015 were assessed on a principal and interest basis over the full contractual term – Loans originated from 2015 were assessed on a principal and interest basis over the residual amortising term Current serviceability assessments also include an interest rate buffer (at least 2.25%), minimum assessment rate (7.25%) and a requirement to be in surplus1 I/O loans are full recourse 14 • 2 • Interest only portfolio statistics as at 30 September 2018 • • • 74% weighted average LVR of interest only loans at origination2 (portfolio) 65% of customers ahead of repayments (including offset accounts)3 Offset account balances attached to interest only loans represent 50% of offset account balances Introduced new Interest only portfolio performance as at 30 September 2018 • 90+ day delinquencies 64bps (compared to P&I portfolio 73bps) • Annualised loss rate 2bps (net of insurance claims) 1 A surplus requirement measures the extent to which a borrower’s income exceeds loan repayments, expenses and other commitments, as assessed. 2 Weighted average LVR calculation takes into account size of outstanding balances. 3 Customer loans ahead on payments exclude equity/line of credit products as there are no scheduled principal payments. Westpac Group 2018 Full Year Results Presentation & Investor Discussion Pack Sep-15 Nov-15 Jan-16 Mar-16 May-16 Jul-16 Sep-16 Nov-16 Jan-17 Mar-17 May-17 Jul-17 Sep-17 Nov-17 Jan-18 Mar-18 May-18 Jul-18 Sep-18 Australian mortgage portfolio delinquencies (%) I/O P&I 2.0 1.5 1.0 0.5 0.0 Sep-14 Mar-15 Sep-15 Mar-16 Sep-16 Mar-17 Sep-17 Mar-18 Sep-18 Increase in 90+ day delinquencies includes impact of decreasing balances of I/O loans as borrowers switch to P&I and hardship treatment new flows have declined Australian interest only loan portfolio balances ($bn) 250 I/O performing loans balance (lhs) 200 12 10 150 8 100 6 4 50 0 0 I/O 90+ day delinquencies balance (rhs)
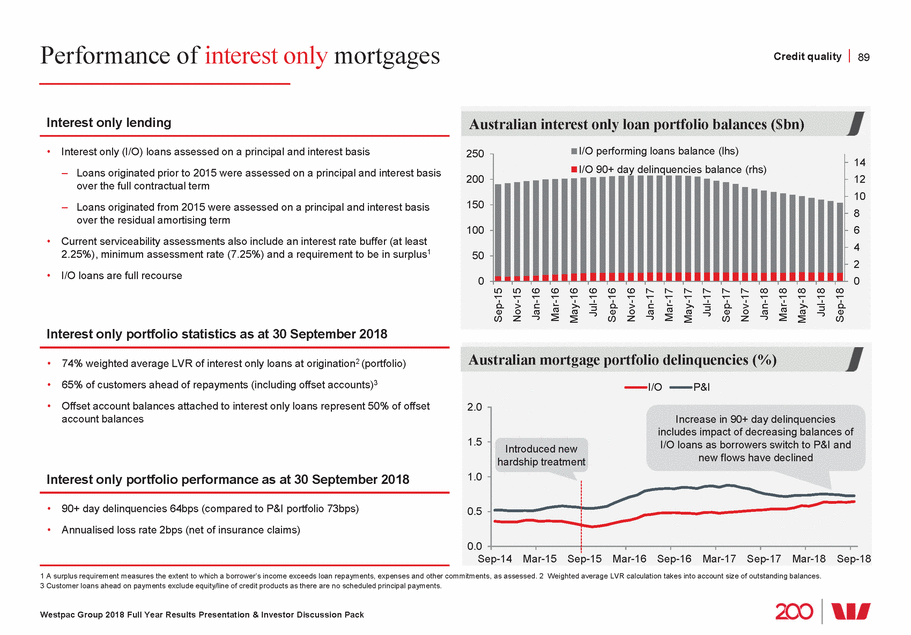
Investment property portfolio Credit quality 90 gross income band (%) 25 Investment property lending (IPL) portfolio Sep-17 Mar-18 Sep-18 Weighted averages LVR of IPL loans at origination1 (%) 73 73 73 LVR of new IPL loans in the period1,2 (%) 72 71 70 Dynamic LVR1,3 of IPL loans (%) 54 54 56 Average loan size4 ($’000) 313 318 321 Customers ahead on repayments including offset accounts5 (%) 59 58 58 90+ day delinquencies (bps) 49 53 57 Annualised loss rate (net of insurance claims) (bps) 3 2 3 1 Weighted average LVR calculation takes into account size of outstanding balances. 2 Average LVR of new loans is on rolling 6 month window. 3 Excludes RAMS . Dynamic LVR is the loan-to-value ratio taking into account the current loan balance, changes in security value, offset account balances and other loan adjustments. Property valuation source Australian Property Monitors. 4 Includes amortisation. 5 Includes RAMS in 1H18 and 2H18. Customer loans ahead on payments exclude equity/line of credit products as there are no scheduled principal payments. Westpac Group 2018 Full Year Results Presentation & Investor Discussion Pack <=50 50<=75 75<=100 100<=125 125<=150 150<=200 200<=500 500<=1m 1m+ 0<=60 60<=70 70<=75 75<=80 80<=85 85<=90 90<=95 95<=97 97+ Mortgage applications by Owner occupied IPL 20 15 10 5 0 Australian mortgage portfolio at 30 September 2018 LVR at origination (%) Owner occupied IPL 50 40 30 20 10 0 Australian mortgage portfolio at 30 September 2018 Investment property portfolio by number of properties per customer (%) 1 1 1 7 2 2 3 26 4 62 5 6+ Chart does not add to 100 due to rounding
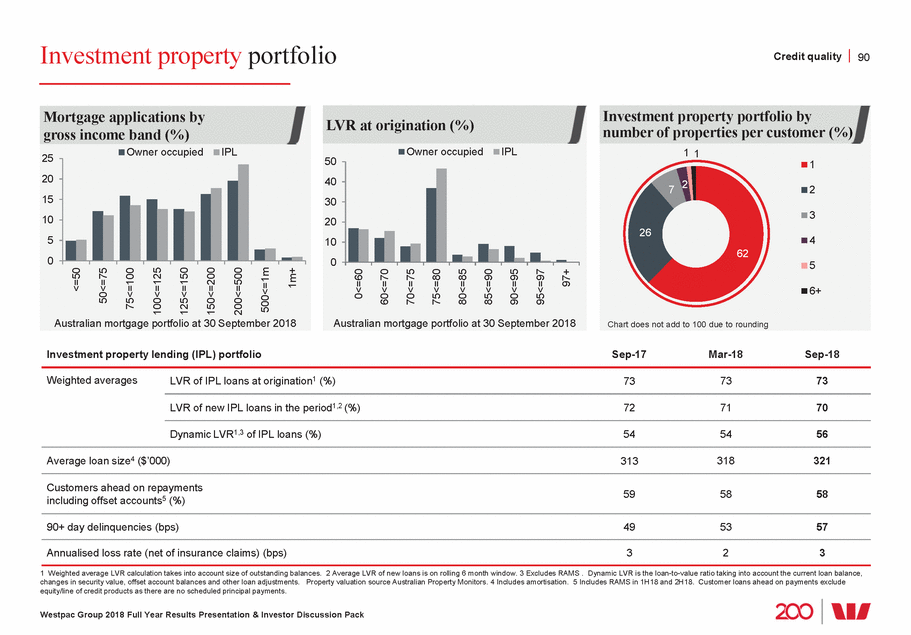
Australian mortgage deep dive Credit quality 91 lending1 by origination date, dynamic LVR2 and income (%) 41 3 1 Portfolio comprised of residential mortgages, excluding RAMS, and business mortgages originated via a separate platform such as construction loans and loans to SMSFs. 2 Dynamic LVR is the loan-to-value ratio taking into account the current loan balance, changes in security value, offset account balances and other loan adjustments. Property valuation source Australian Property Monitors. 3 Based on a specific Rocket Repay rate offered during the period. Westpac Rocket Repay Home Loan exclusive of discounts assuming loan amount $250,000 - $499,999. 4 Source, Westpac Economics, CoreLogic. All dwellings Australia - average 8 major capital cities. Prices to September 2018. Westpac Group 2018 Full Year Results Presentation & Investor Discussion Pack Australian mortgage Chart may not add due to rounding Gross income bands >$250k $100k - $250k <$100k Dynamic LVR2 bands (%) Year of origination <2011 2011-14 2015+ 80 69 3 <60 60-80 >80 <60 60-80 >80 45 8 14 9 25 21 13 11 8 4 <60 60-80 >80 % of portfolio at 30 September 2018 17 24 59 Westpac SVR3 (%) (excl. discounts) 7.86 6.89 – 5.70 5.24 Westpac interest rate buffer (%) 1.80 1.80 2.25 Westpac interest rate floor (%) 6.80 6.80 7.25 House price changes4 At least 33% 19% – 42% (4%) – 18% 12 23 36 22 81 2 13 7 5 7 14 34 38 7 1 6 2 6
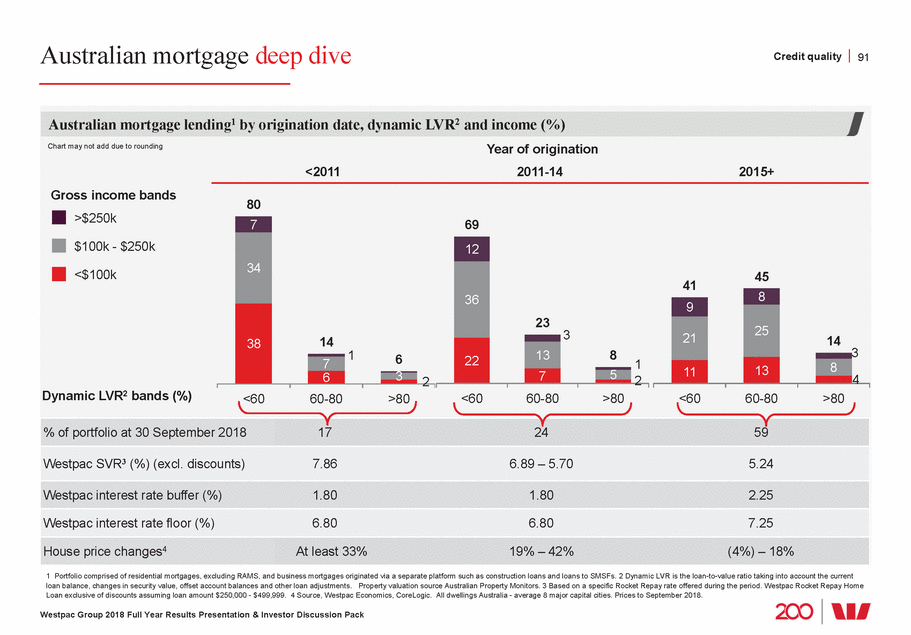
Lenders mortgage insurance arrangements Credit quality 92 100% of risk subsequently transferred to Arch Reinsurance Limited 1 Since 18 May 2015 WLMI has underwritten all mortgage insurance, where required, on Westpac originated Mortgages. The in-force portfolio of loans includes mortgage insurance provided by external providers. 2 Prudential Capital Requirement (PCR) calculated in accordance with APRA standards. 3 Insured coverage is net of quota share. 4 Low doc loans no longer sold. Refers to arrangements in place for legacy products. 5 Loss ratio is claims over the total earned premium plus exchange commission. 6 LMI gross written premium includes loans >90% LVR reinsured with Arch Reinsurance Limited. 2H18 gross written premium includes $61m from the arrangement (1H18: $62m and 2H17: $73m) Westpac Group 2018 Full Year Results Presentation & Investor Discussion Pack Lenders mortgage insurance arrangements LVR Band Insurance • LVR ”80% Not required • Low doc4 LVR ”60% • LVR >80% to ” 90% • Where insurance required, insured through captive insurer, WLMI • Low doc4 • LMI not required for certain borrower groups LVR >60% to ” 80% • Reinsurance arrangements: í 40% risk retained by WLMI í 60% risk transferred through quota share arrangements with Arch Reinsurance Limited, Tokio Millennium Re, Endurance Re, Everest Re, Trans Re, AWAC and Capita 2232 • LVR >90% • 100% reinsurance through Arch Reinsurance Limited í Reinsurance arrangements see loans with LVR >90% insured through WLMI with Insurance statistics 2H17 1H18 2H18 Insurance claims ($m) 9 6 4 WLMI claims ratio5 (%) 27 20 11 WLMI gross written premiums6 ($m) 109 90 90 Lenders mortgage insurance (LMI) • Where mortgage insurance is required, mortgages are insured through Westpac’s captive mortgage insurer, Westpac Lenders Mortgage Insurance1 (WLMI), and reinsured through external LMI providers, based on risk profile • WLMI is well capitalised (separate from bank capital) and subject to APRA regulation. WLMI targets a capitalisation ratio of 1.2x PCR2 and has consistently been above this target • Scenarios indicate sufficient capital to fund claims arising from events of severe stress – estimated losses for WLMI from a 1 in 200 year event are $105m net of re-insurance recoveries (1H18: $110m) Westpac’s Australian mortgage portfolio at 30 Sep 2018 (%) 85 Not insured Insured by third parties 3 Insured by WLMI 6 9
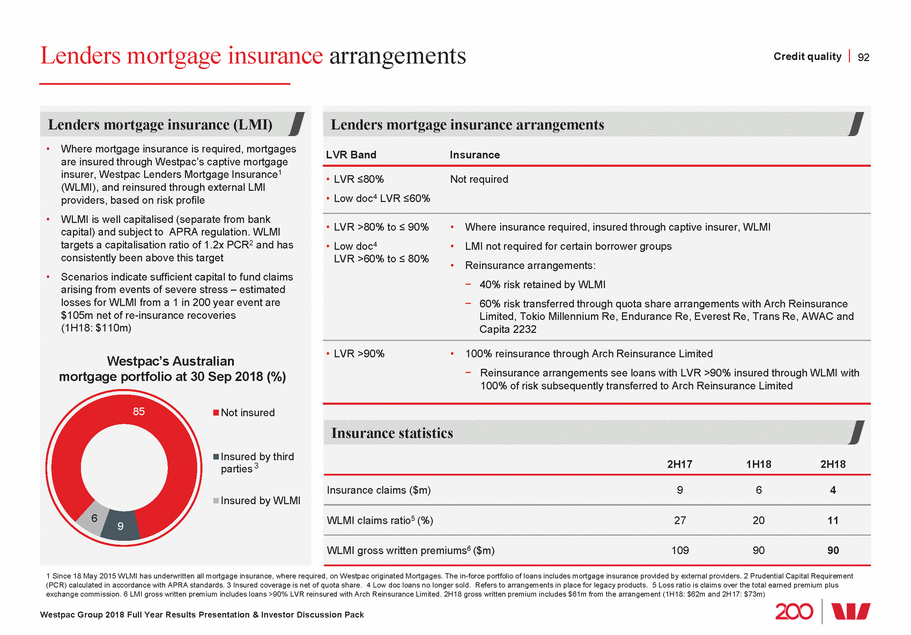
Mortgage portfolio stress testing outcomes Credit quality 93 - (18.5) (29.7) (35.2) (% change cumulative) 1 Assumes 30% of LMI claims will be rejected in a stressed scenario. 2 Stressed loss rates are calculated as a percentage of mortgage gross loans. Westpac Group 2018 Full Year Results Presentation & Investor Discussion Pack Australian mortgage portfolio stres at 30 September 2018 Key assumptions Current s testing Stressed scenario Year 1 Year 2 Year 3 Portfolio size ($bn) 444 428 419 417 Unemployment rate (%) 5.0 11.6 10.6 9.6 Interest rates (cash rate, %)1.500.250.250.25 House prices Annual GDP growth (%)2.4(3.9)(0.2)1.7 Stressed loss outcomes (net of LMI recoveries)1 $ million 86 1,271 2,186 802 Basis points2 2 30 52 19 • Westpac regularly conducts a range of portfolio stress tests as part of its regulatory and risk management activities • The Australian mortgage portfolio stress testing scenario assumes a severe recession in which significant reductions in consumer spending and business investment lead to six consecutive quarters of negative GDP growth. This results in a material increase in unemployment and nationwide falls in property and other asset prices • Estimated Australian housing portfolio losses under these stressed conditions are manageable and within the Group’s risk appetite and capital base í Cumulative total losses of $3.9bn over three years for the uninsured portfolio (1H18: $3.5bn) í Cumulative claims on LMI, both WLMI and external insurers, of $911m over the three years (1H18: $911m) í Peak loss rate in year 2 has increased to 52bps (1H18: 48bps) due to recent declines in house prices which leads to a higher dynamic LVR starting point for the portfolio. In addition, the unemployment rate for September of 5.0% creates a bigger peak to trough change compared to 1H18 í WLMI separately conducts stress testing to test the sufficiency of its capital position to cover mortgage claims arising from a stressed mortgage environment • Capital targets incorporate buffers at the Westpac Group level that also consider the combined impact on the mortgage portfolio and WLMI of severe stress scenarios
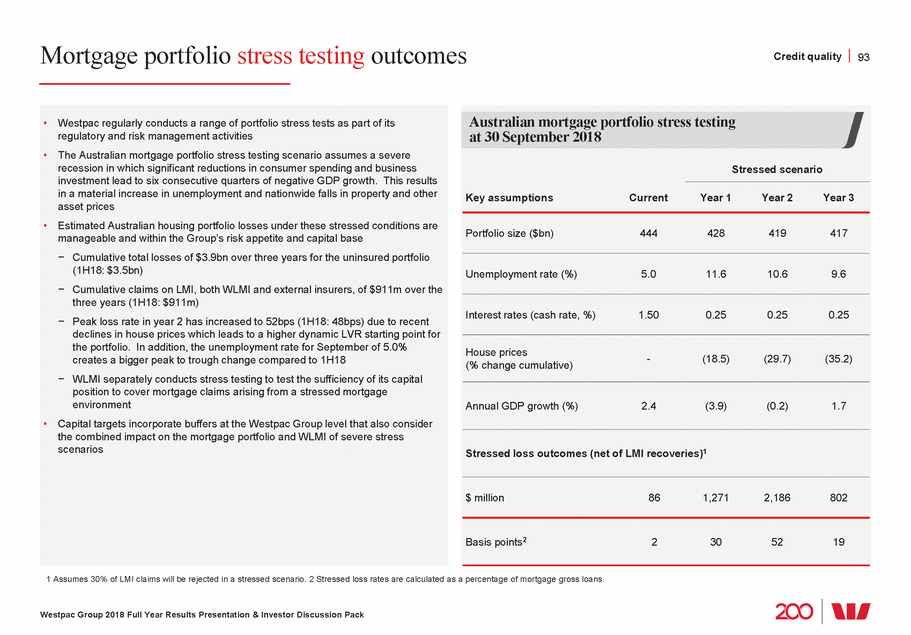
Capital, Funding and Liquidity

Well positioned for “Unquestionably strong” Capital, Funding and Liquidity 95 (APRA basis) guidelines 10.5% residual convertible preference shares 10.6% $bn % Building for 1% 55 12 10.0 10.0 impact 50 Impact of 10 Impact of APRA’s (~$4.1bn RWA) 40 assets disciplined RWA management and an 4 25 1 If the transaction proceeds, a disclosure document will be made available when the securities are offered. Any person who wants to acquire the securities will need to complete an application form that will accompany the disclosure document. 2 Domestic systemically important bank. 3 APRA’s revision to the calculation of RWA for Australian residential mortgages, which came into effect on 1 July 2016. Westpac Group 2018 Full Year Results Presentation & Investor Discussion Pack Jun-15 Sep-15 Dec-15 Mar-16 Jun-16 Sep-16 Dec-16 Mar-17 Jun-17 Sep-17 Dec-17 Mar-18 Jun-18 Sep-18 Highlights CET1 capital ratio (%) and CET1 capital ($bn) • CET1 ratio up 13bps from March 2018 Westpac CET1 capital (lhs, $bn) CET1 ratio • Organic capital growth and conversion of Westpac CET1 capital ratio (rhs, %) APRA industry (CPS) partially offset increases in RWA unquestionably strong from regulatory measurement changes DSIB2 buffer • RWA measurement changes ~30bps CET1 RWA - Operational risk model overlay (~$7.5bn measurement RWAs) 45 changes - Modelling updates for mortgages 8 356 • Excluding the impact of measurement Risk weighted changes, RWAs were broadly flat from 30 improvement in credit quality 2 20 • Further clarity on the revised capital Future framework expected over 2018/19 15 0 developments • Westpac is considering the offer of a new A$ AT1 capital instrument. A transaction may follow, subject to market conditions1 10.6 10.6 10.2 10.5 10.1 10.1 10.5 10.4 9.5 9.5 9.3 9.0 45 44 44 changes to 43 42 mortgage RWA3 40 41 39 38 38 37 37 34 32
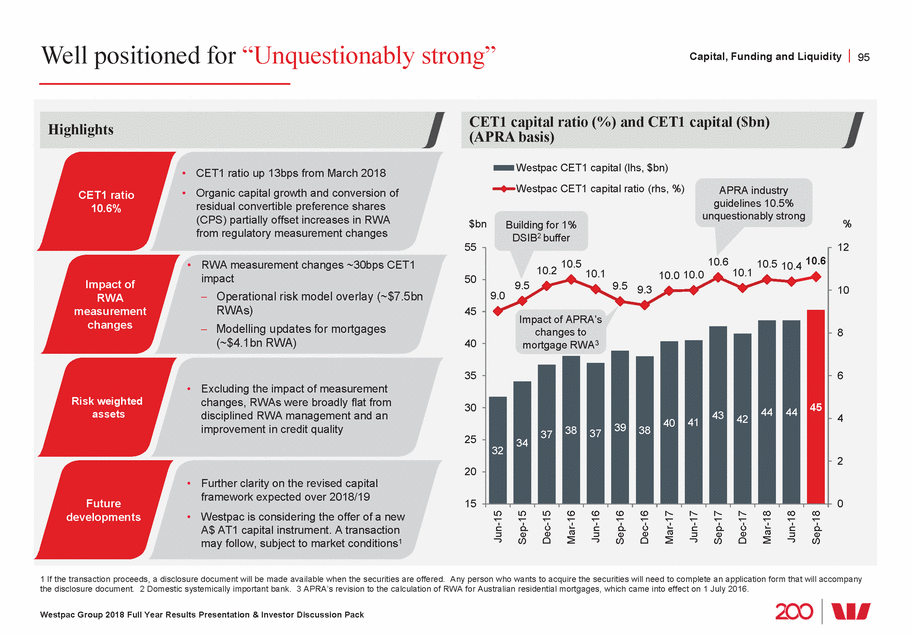
Clarity on changes to the capital framework are expected to emerge over the 2018-2021 transitional period. Capital, Funding and Liquidity 96 2H18 2019 2020 2021 New Basel III framework Counterparty credit risk Leverage ratio Standardised approach to credit risk Advanced approach to credit risk capital Measurement of capital Related party exposures Loss absorbing capacity Westpac Group 2018 Full Year Results Presentation & Investor Discussion Pack Consult Finalise Implementation Implement – 1 July 2019 Finalise Implement – 1 July 2019 Consult Consult and finalise Implementation Consult Consult and finalise Implementation Consult Finalise Implementation Consult Finalise Implementation Commence consult
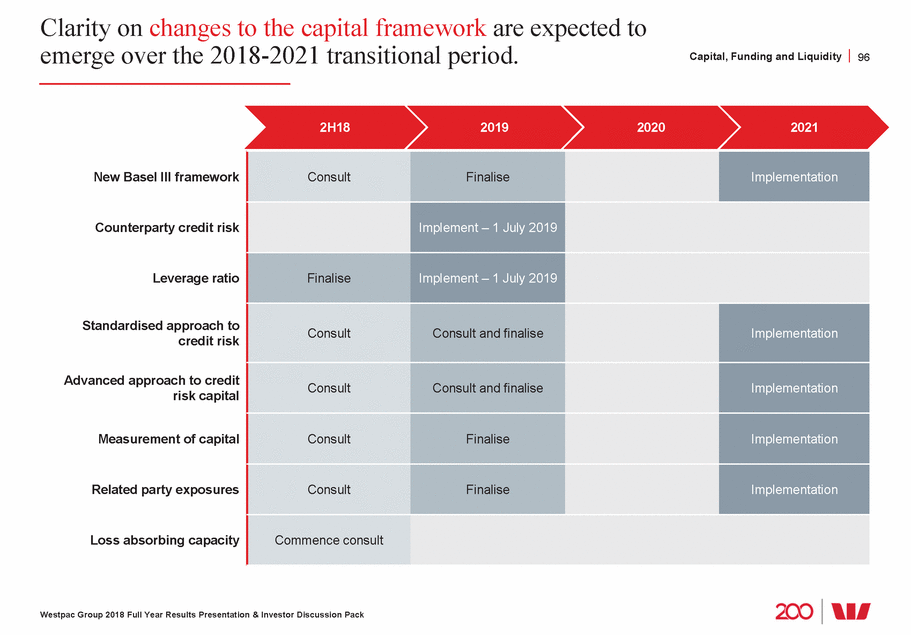
CET1 capital ratio, top quartile globally Capital, Funding and Liquidity 97 BIS 75th percentile2 16.2 16.1 16.1 comparable) 1 Internationally comparable methodology aligns with the APRA study titled ‘International Capital Comparison Study’ dated 13 July 2015. For more details on adjustments refer page 101. 2. Group 1 banks BIS 75th percentile fully phased-in Basel III capital ratios from BIS monitoring report released 4 October 2018. Westpac Group 2018 Full Year Results Presentation & Investor Discussion Pack Capital ratios Sep-17 Mar-18 Sep-18 Key capital ratios (%) APRA basis Internationally comparable1 basis 21.5 16.1 14.7 CET1 Tier 1 Total CET1 Tier 1Total regulatory regulatory capital capital CET1 capital ratio 10.6 10.5 10.6 Additional Tier 1 capital 2.1 2.3 2.2 Tier 1 capital ratio 12.7 12.8 12.8 Tier 2 capital 2.1 2.0 1.9 Total regulatory capital ratio 14.8 14.8 14.7 Risk weighted assets (RWA) ($bn) 404 416 425 Leverage ratio 5.7 5.8 5.8 Internationally comparable ratios1 Leverage ratio (internationally comparable) 6.3 6.4 6.5 CET1 capital ratio (internationally 19.0 12.8 10.6
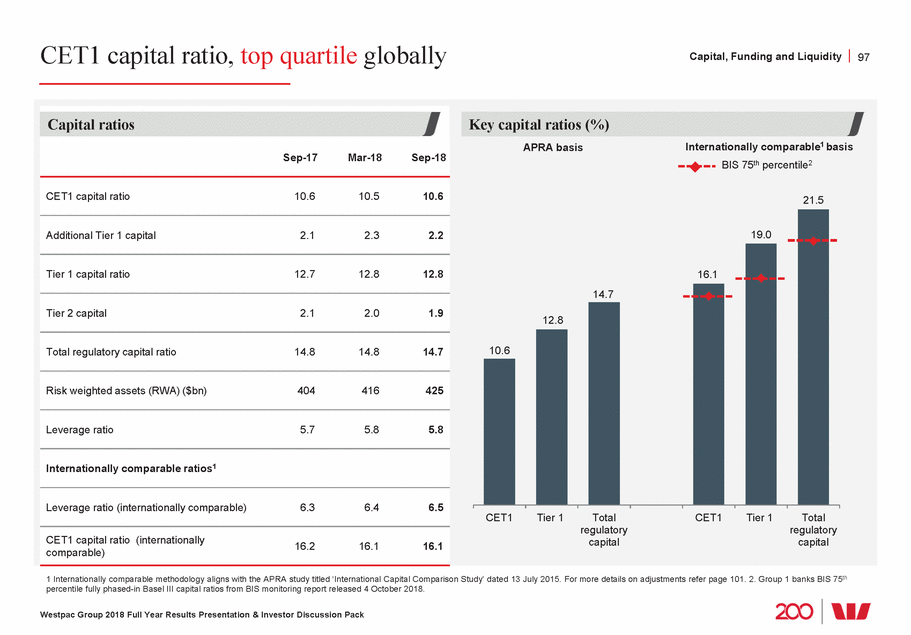
CET1 capital ratio movements Capital, Funding and Liquidity 98 1 Internationally comparable methodology aligns with the APRA study titled ‘International Capital Comparison Study’ dated 13 July 2015. Westpac Group 2018 Full Year Results Presentation & Investor Discussion Pack CET1 capital ratio (% and bps) Higher RWA for 16.14 operational risk and mortgages 90 (68) 10.56 10.50 3 (5) (30) 14 5 4 10.63 Organic +20bps Other -7bps Up 13 basis points Sep-17 Mar-18 Cash Final Ordinary Other capital Impact of Residual Exit of FX Sep-18 Sep-181 APRA APRA earnings dividend RWA movements RWA model $566m CPS investments translation APRAInt. Comp. (net of DRP) growth changes converted impact
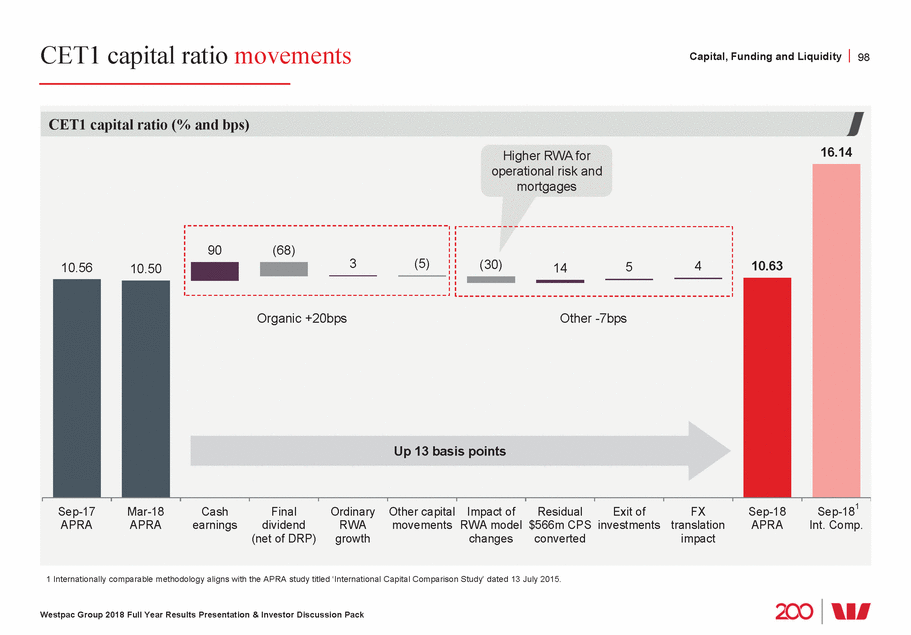
RWA increased from measurement changes Capital, Funding and Liquidity 99 1.4 (0.7) 415.7 0.1 1 Chart does not add due to rounding. Westpac Group 2018 Full Year Results Presentation & Investor Discussion Pack Movement in credit risk weighted assets ($bn)1 361.4 1.5 4.1 (0.4) (3.4) (0.4) 362.7 mortgages Sep-17 Mar-18 Growth Regulatory modelling FX translation Credit quality and Mark-to-market Sep-18 changes impacts portfolio mix 349.3 Modelling updates for Mostly NZ$ loans Up $1.4bn or 0.4% Movement in risk weighted assets ($bn)1 8.20.6425.4 404.2 Includes an operational Sep-17 Mar-18 Credit risk Market IRRBB Operational Other Sep-18 risk risk See below risk overlay Up $9.6bn or 2.3%
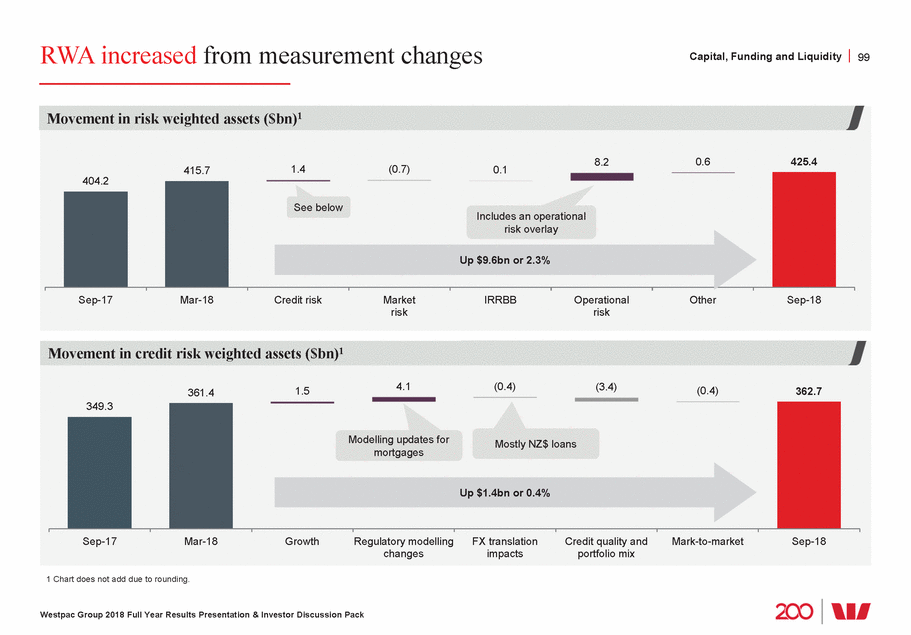
Well placed on internationally comparable CET1 and leverage ratios Capital, Funding and Liquidity 100 Peer group comprises listed commercial banks with assets in excess of A$700bn and which have disclosed fully implemented Basel III ratios or provided sufficient disclosure to estimate. Based on company reports/ presentations. Ratios at 30 Jun 2018, except for Westpac and ANZ which are at 30 September 2018, while Bank of Montreal, Royal Bank of Canada and Toronto Dominion are at 31 Jul 2018. For CET1, assumes Basel III capital reforms fully implemented. Leverage ratio is on a transitional basis. Where accrued expected dividends have been deducted, these have been added back for comparability. US banks are excluded from leverage ratio analysis due to business model differences, for example loans sold to US Government sponsored enterprises. NAB’s leverage ratio is as at 31 March 2018. Westpac Group 2018 Full Year Results Presentation & Investor Discussion Pack China Construction Bank Nordea ICBC Norinchukin Bank Bank of China ANZ Bank of Communications Westpac, 16.14% BBVA RBS Westpac, 6.48% Rabobank CBA CBA BPCE China Merchants Bank Lloyds Agricultural Bank of China Sumitomo Mitsui Intesa Sanpaolo NAB ANZ Standard Chartered Rabobank HSBC Norinchukin Bank ING Group Standard Chartered Deutsche Bank Credit Suisse China Construction HSBC Commerzbank Nordea Credit Suisse Unicredit JPMorgan Chase RBS Intesa Sanpaolo Lloyds Barclays Mitsubishi UFJ Mizuho FG Santander Unicredit Sumitomo Mitsui Mitsubishi UFJ BPCE ICBC Scotiabank Citigroup Commerzbank Wells Fargo Barclays TD Bank ING Group Scotiabank RBC BNP Paribas Societe Generale Credit Agricole SA TD Bank China Merchants Credit Agricole SA Bank of America Mizuho FG Bank of Montreal Deutsche Bank Societe Generale Bank of Montreal Santander RBC BNP Paribas Natixis Bank of China Leverage ratio (%) 8% 6% 4% 2% 0% Common equity Tier 1 ratio (%) 20% 15% 10% 5% 0%

Internationally comparable capital ratio reconciliation Capital, Funding and Liquidity 101 APRA’s Basel III capital requirements are more conservative than those of the Basel Committee on Banking Supervision (BCBS), leading to lower reported capital ratios by Australian banks. In July 2015, APRA published a study that compared the major banks’ capital ratios against a set of international peers1. The following details the adjustments from this study and how Westpac’s APRA Basel III CET1 capital ratio aligns to an internationally comparable ratio (%) Westpac’s CET1 capital ratio (APRA basis) 10.6 0.4 Equity investments Balances below prescribed threshold are risk weighted, compared to a 100% CET1 deduction under APRA’s requirements Deferred tax assets Balances below prescribed threshold are risk weighted, compared to a 100% CET1 deduction under APRA’s requirements 0.3 Interest rate risk in the banking book (IRRBB) APRA requires capital to be held for IRRBB. The BCBS does not have a Pillar 1 capital requirement for IRRBB 0.4 Loss given default (LGD) of 15%, compared to the 20% LGD floor under APRA’s requirements. APRA also applies a correlation factor for mortgages higher than the 15% factor prescribed in the Basel rules Residential mortgages 1.8 Unsecured non-retail exposures LGD of 45%, compared to the 60% or higher LGD under APRA’s requirements 0.7 0.5 Non-retail undrawn commitments Credit conversion factor of 75%, compared to 100% under APRA’s requirements Use of internal-ratings based (IRB) probabilities of default (PD) and LGDs for income producing real estate and project finance exposures, reduced by application of a scaling factor of 1.06. APRA applies higher risk weights under a supervisory 0.8 Specialised lending slotting approach, but does not require the application of the scaling factors Increase in the A$ equivalent concessional threshold level for small business retail and small to medium enterprise corporate exposures Currency conversion threshold 0.2 APRA requires these items to be deducted from CET1. The BCBS only requires exposures classified as intangible assets under relevant accounting standards to be deducted from CET1 Capitalised expenses 0.4 16.1 Internationally comparable CET1 capital ratio Internationally comparable Tier 1 capital ratio 19.0 Internationally comparable total regulatory capital ratio 21.5 1 Methodology aligns with the APRA study titled “International capital comparison study", dated 13 July 2015. Westpac Group 2018 Full Year Results Presentation & Investor Discussion Pack
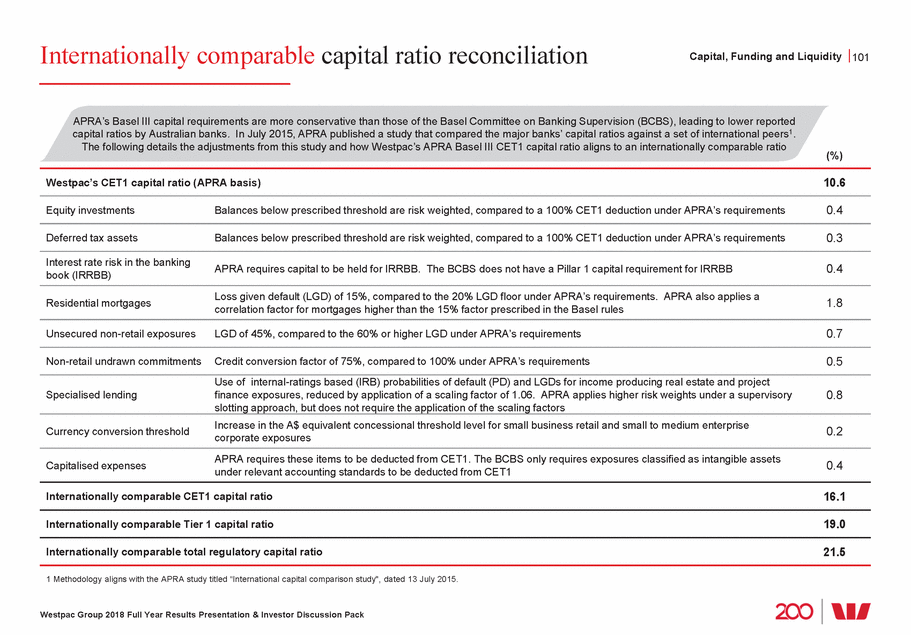
Optimising returns by actively managing capital Capital, Funding and Liquidity 102 Return on AIEA1 (%) Divisional capital and ROE 2007 FY17 FY18 2H18 Allocated capital ($bn) FY17 FY18 2H18 Total Group (including intangibles) Net interest margin 58.6 62.0 63.0 2.16 2.09 2.11 2.05 Consumer Bank 15.3 18.1 18.6 Non-interest income 1.29 0.78 0.72 0.70 Business Bank 11.9 12.6 12.6 Operating expenses BTFG 3.6 3.6 3.6 (1.55) (1.21) (1.24) (1.26) WIB 8.8 8.0 7.9 Impairment charges (0.16) (0.11) (0.09) (0.08) Westpac NZ (A$) 4.6 4.7 4.7 Tax and non-controlling interests Return on equity (%) FY17 FY18 2H18 (0.53) (0.47) (0.46) (0.44) Total Group 13.8 13.0 12.1 Cash earnings (return on AIEA) Consumer Bank 16.5 14.4 12.7 1.20 1.07 1.04 0.97 Business Bank 13.6 14.1 14.0 Leverage (AIEA/AOE) 19.9x 12.8x 12.5x 12.4x BTFG 13.1 11.4 8.4 WIB 12.3 12.6 12.6 Return on equity 23.84 13.77 13.00 12.08 Westpac NZ (A$) 18.0 18.2 18.9 1 Average interest-earning assets. Westpac Group 2018 Full Year Results Presentation & Investor Discussion Pack Return on equity (ROE) is important • ROE is a key measure of performance for the Group and across divisions • Westpac seeking to achieve a ROE of 13 - 14% - Incorporates an appropriate margin above the cost of capital, given nature of banking - Generates sufficient capital for growth to support customers and the economy • Group ROE 77bps lower compared to FY17 with cash earnings flat and average equity up 6% • Leverage lower from the increased average ordinary equity (AOE) • Divisional capital allocation refined in 2018 including $6.0bn of capital to divisions from capital centrally held. Key changes included: - Higher capital allocated to Consumer Bank and Business Bank, principally due to higher RWA from mortgages - A reduction in capital allocated to WIB from lower risk weights for certain corporate exposures • Residual capital held at Group for dividends and Group functions, including Treasury
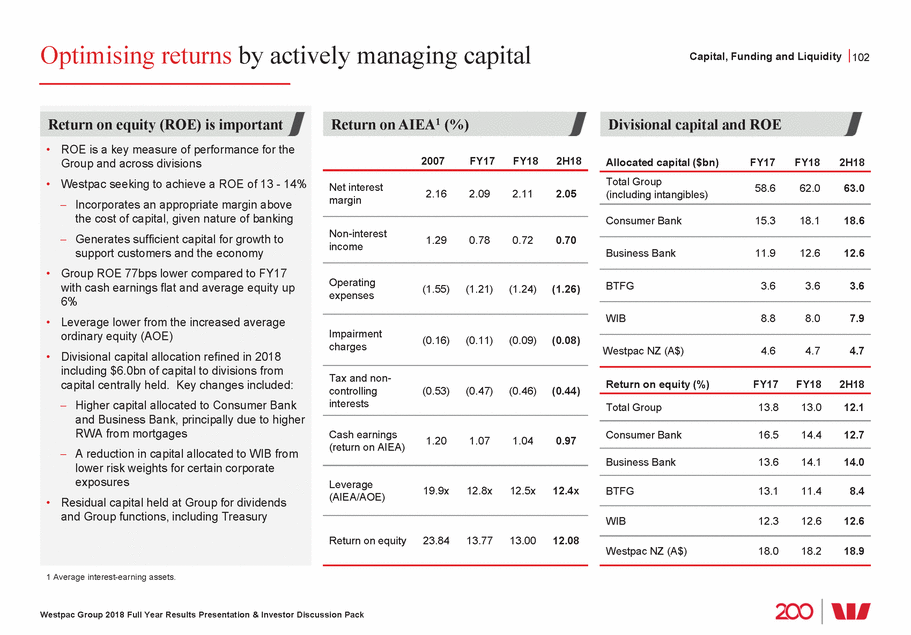
A$32bn new term funding raised in FY18 Capital, Funding and Liquidity 103 2,4 (%) type (%) 1 Based on residual maturity and FX spot currency translation. Includes all debt issuance with contractual maturity greater than 13 months excluding US Commercial Paper and Yankee Certificates of Deposit. 2 Contractual maturity date for hybrids and callable subordinated instruments is the first scheduled conversion date or call date for the purposes of this disclosure. 3 Perpetual sub-debt has been included in >FY23 maturity bucket. Maturities exclude securitisation amortisation. 4 Tenor excludes RMBS and ABS. 5 WAM is weighted average maturity. Westpac Group 2018 Full Year Results Presentation & Investor Discussion Pack New term issuance by c Charts may not add to 100 due to rounding. urrency (%) AUD USD EUR GBP Other 28 54 6 3 4 10 3 11 FY16 FY17 FY18 32 32 21 21 49 22 New term issuance by tenor Charts may not add to 100 due to rounding. 5.4yrs 5.8yrs 6.5yrs WAM5 >5years 5 years 4 years 3 years 2 years 1 year 28 2 2 47 10 45 30 25 7 7 FY16 FY17 FY18 43 30 17 8 New term issuance by Charts may not add to 100 due to rounding. Subordinated Debt Hybrid Securitisation Covered Bonds Senior Unsecured 4 5 12 4 13 18 77 73 66 FY16 FY17 FY18 8 Term debt issuance and maturity profile1,2,3 ($bn) Covered bond Hybrid Senior/Securitisation Sub debt 27 17 FY14 FY15 FY16 FY17 FY18 FY19 FY20 FY21 FY22 FY23 FY24 >FY24 42 Issuance 37 33 31 32 Maturities 29 30 30 22 5
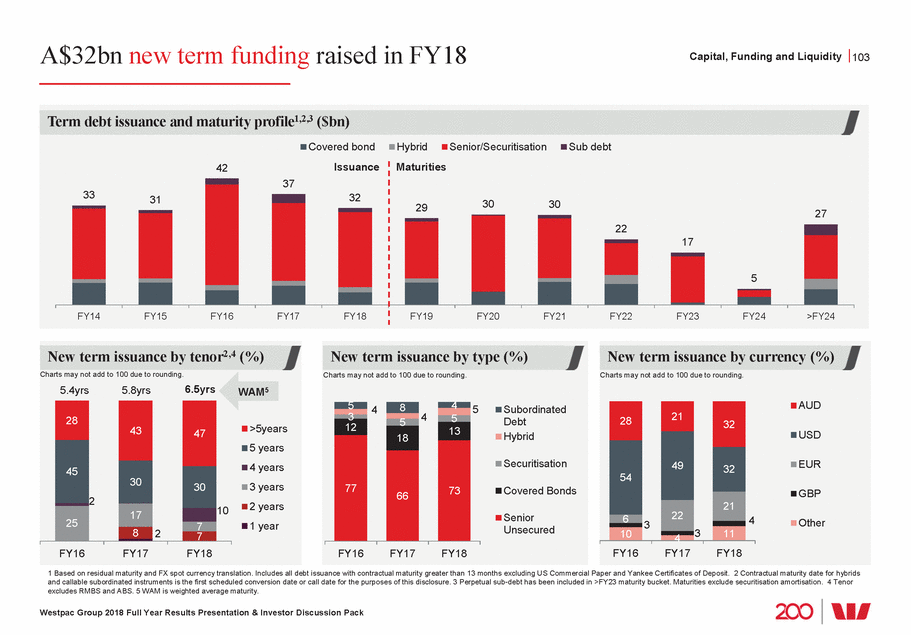
Funding and liquidity metrics Capital, Funding and Liquidity 104 maturity (%) Customer deposits High Quality Liquid Assets NSFR Mar 2018 Sep 2018 112% 114% Institutional 1 Includes long term wholesale funding with a residual maturity less than or equal to 1 year. 2 Equity excludes FX translation, Available-for-Sale securities and Cash Flow Hedging Reserves. 3 LCR is calculated as the percentage ratio of stock of HQLA and CLF over the total net cash outflows in a modelled 30 day defined stressed scenario. Calculated on a spot basis. HQLA includes HQLA as defined in APS 210, RBNZ eligible liquids, less RBA open repos funding end of day ESA balances with the RBA. Committed Liquidity Facility or CLF is made available to Australian Authorised Deposit-taking Institutions by the RBA that, subject to qualifying conditions, can be accessed to meet LCR requirements under APS210 – Liquidity. Other flows include credit and liquidity facilities, collateral outflows and inflows from customers. 4 Other includes derivatives and other assets. 5 Other loans includes off balance sheet exposures and residential mortgages >35% risk weight. Westpac Group 2018 Full Year Results Presentation & Investor Discussion Pack Liquidity coverage ratio (LCR)3 (%) LCR 134% LCR 133% 129.0 133.5 Net cash outflows Liquid assets Net cash outflows Liquid assets 31 March 2018 30 September 2018 Wholesale funding Committed Liquidity Facility Other flows Net stable funding ratio (NSFR) at 30 September 2018 ($bn) 601.2 Liquids Corporate & deposits SME mortgages weight Available Stable Funding Required Stable Funding Wholesale funding and other liabilities 529.5 and other4 31 30 Other loans5 Retail & deposits Residential ”35% risk Capital 96.0 100.4 Funding composition by residual 1 Wholesale Onshore <1yr Wholesale Offshore <1yr1 Wholesale Onshore >1yr Wholesale Offshore >1yr Securitisation Equity 2 Customer deposits 4 1 4 1 12 11 8 8 4 1 63 62 10 5 44 Sep-08 Sep-17 Sep-18 16 20 5 7 6 8
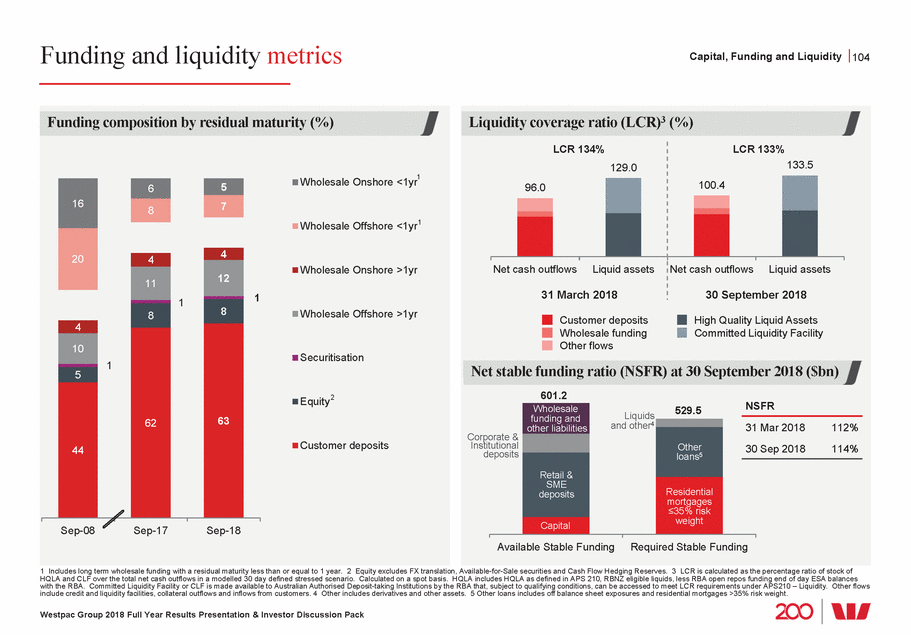
Divisional Results

Consumer Bank growing pressure and remediation the franchise; earnings impacted by margin Consumer 106 Key financial metrics Change 2H17 1H18 2H18 on 1H18 Revenue ($m) (8%) 4,341 4,417 4,077 for mortgages partly offset by higher deposit spreads Net interest margin (%) (26bps) 2.36 2.37 2.11 large Expense to income (%) 39.8 39.2 44.4 Customer deposit to loan ratio (%) 85bps 53.1 52.7 53.5 Stressed assets to TCE (%) 1bp 0.64 0.65 0.66 Key operating metrics Change on 1H18 2H17 1H18 2H18 Total customers (#m) 9.2 9.3 9.5 2% Active digital customers (#m) 4.0 4.1 4.2 3% Digital sales1 (%) 4ppts 25 29 33 Total branches (#) (19) 1,046 1,025 1,006 Total ATMs (#) (293) 2,916 2,835 2,542 7.6 (=2nd) 7.6 (=2nd) 7.3 (2nd) Customer satisfaction1 - +0.9 +0.3 -6.8 Net promoter score (NPS)1,2 6mma Up 1 place (4th) (3rd) (2nd) 1 Refer pages 148 & 149 for metric definitions and details of provider. 2 Westpac Group Westpac Group 2018 Full Year Results Presentation & Investor Discussion Pack 2H17 1H18 Net interest income Non-interest income Operating expenses Impairment charges Tax and NCI 2H18 Cash earnings ($m) AIEA up 2%, margin down 26bps from higher short-term funding costs, mortgage spreads compression and provision for Lower collectively estimated customer refunds and payments, assessed provisions 1,717 (332) (8) (82) 1,624 1131,423 15 Provision for estimated litigation settlement and costs of implementing customer refunds and payments. Investment costs also higher Down $294m or 17%
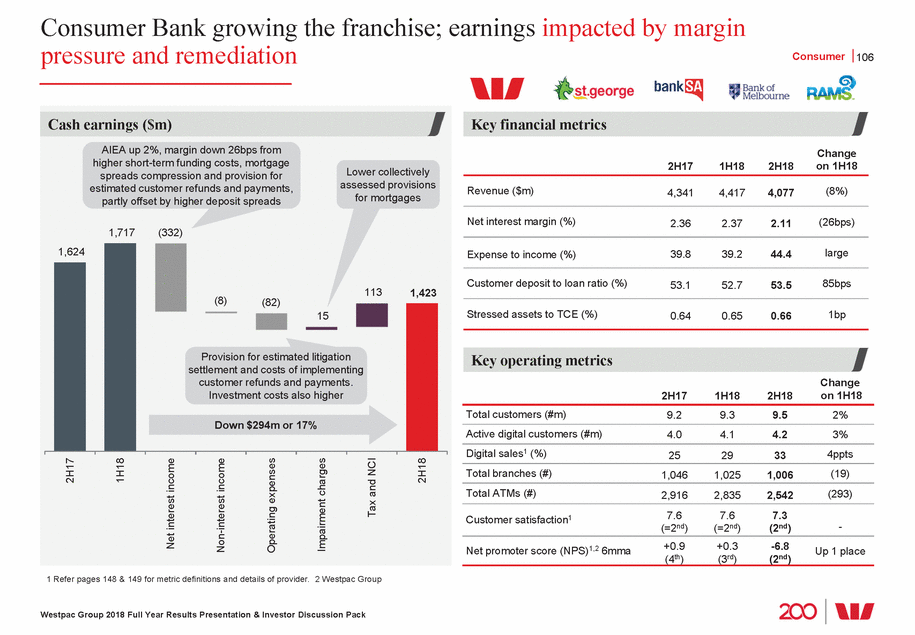
2H18 performance – impacted by margin pressure and infrequent items Consumer 107 and compliance costs including 2,614 2,452 2,459 2,367 398 395 396 401 41.2 40.3 40.2 39.8 39.2 370 353 Westpac Group 2018 Full Year Results Presentation & Investor Discussion Pack Revenue per FTE ($’000) 422 428 1H16 2H16 1H17 2H17 1H18 2H18 Expense to income ratio (%) 44.4 1H16 2H16 1H17 2H17 1H18 2H18 Loans ($bn) & deposit to loan ratio (%) Loans Customer deposit to loan ratio 52.2 52.5 52.8 53.1 52.7 53.5 379385 360 341 Mar-16 Sep-16 Mar-17 Sep-17 Mar-18 Sep-18 Core earnings ($m) Lower margin and higher regulatory provisions for litigation 2,687 1H16 2H16 1H17 2H17 1H18 2H18 2,265 Revenue ($m) Lower margin (down 26bps) from higher short-term funding costs, competition and provisions for estimated customer refunds and payments 4,025 4,106 4,110 4,341 4,417 4,077 1H16 2H16 1H17 2H17 1H18 2H18 Cash earnings ($m) 1,624 1,717 1,459 1,552 1,531 1H16 2H16 1H17 2H17 1H18 2H18 1,423
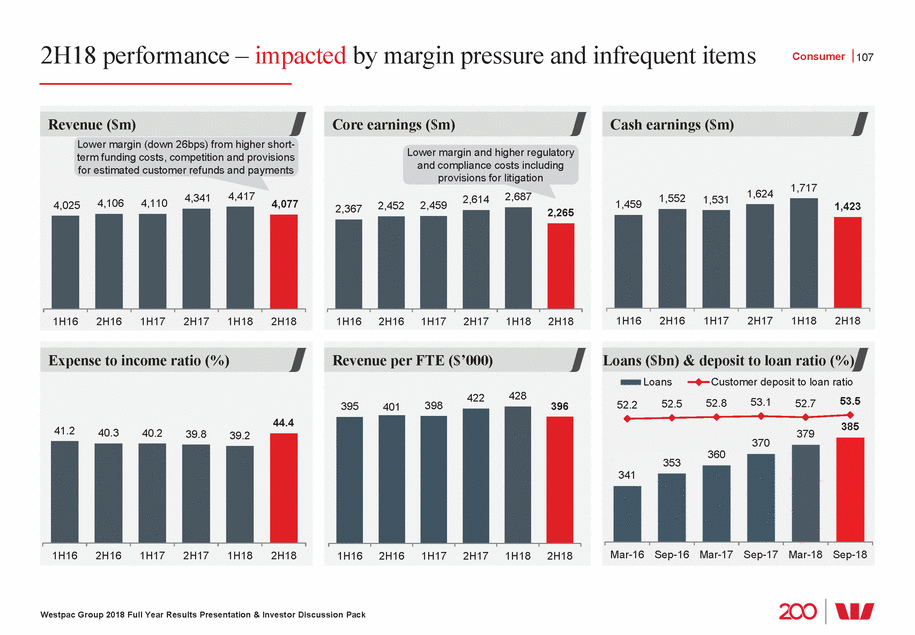
Improving the customer experience through digital Consumer 108 20182 1 This feature is currently only available to Bank of Melbourne customers. 2 Digital Mail launched in March 2018 for St.George, April 2018 for Westpac. Westpac Group 2018 Full Year Results Presentation & Investor Discussion Pack Making it easier to connect Digital Mail • Customers can receive documents faster, and access them anywhere, anytime • Reduces postage and paper usage, and provides a permanent record of customer communication • 3.6m customers have switched to Digital Mail since launch in Webchat Customers on Westpac desktop can contact Westpac via secure messaging and Webchat anywhere, anytime Beem It Just Beem It! Westpac collaboration with two other major banks on a mobile payment app that allows customers to pay and get paid securely in real-time with any bank Digitising St.George online home loan application • Applications can be completed online or via mobile • Documents can be uploaded remotely • Specialist support available via live chat • Personalised pricing and valuations available • Customers can stop and re-start the process at any time • Ability to sign mortgage documents electronically1 Real time transactions Merchant details of HandyCard or debit MasterCard transactions in real time, instead of ‘transaction details available next business day’ Innovation Voice banking Customers can access their accounts, make payments and check balances through simple voice commands with Apple’s Siri, Amazon’s Alexa and Google Assistant Mobile cheque capture Customers can deposit cheques quickly and securely through Westpac’s mobile app by taking a photo with their smartphone Wearables Enables customers to use their FitBit or Garmin smart watch to make secure, contactless payments with their Westpac debit or credit MasterCard
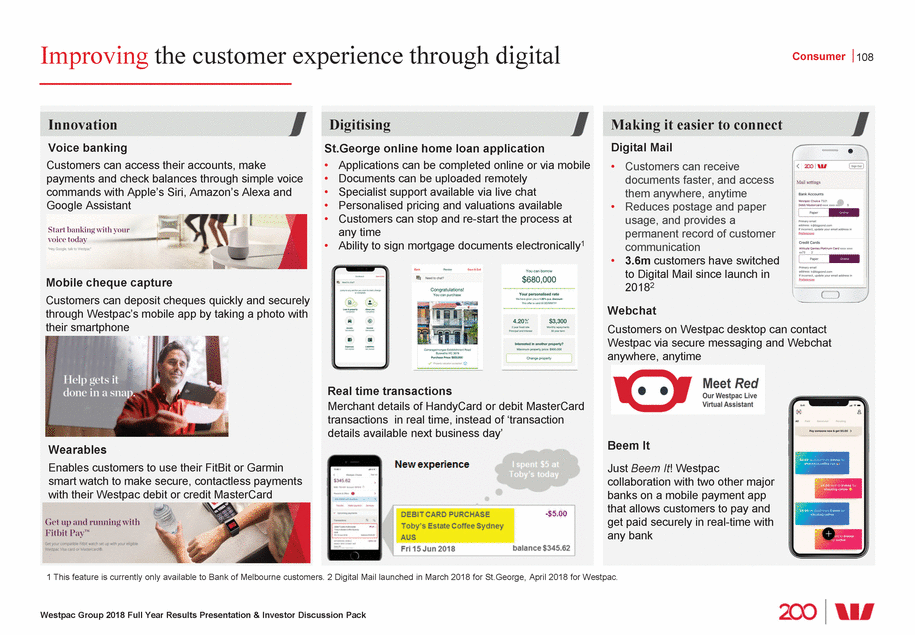
Business Bank, another solid result Business 109 Key financial metrics Change on 1H18 2H17 1H18 2H18 Revenue ($m) 1% 2,559 2,610 2,644 Net interest margin (%) (2bps) 2.74 2.78 2.76 15bps Expense to income (%) 36.0 35.6 35.8 Customer deposit to loan ratio (%) 117bps 71.6 71.4 72.6 Stressed assets to TCE (%) 23bps 2.13 2.48 2.71 Key operating metrics Change on 1H18 2H17 1H18 2H18 Total business customers (‘000’s) (1%) 1,073 1,085 1,079 Customer satisfaction1 (rank) - #1 #1 #1 Customer satisfaction - SME1 (rank) - #1 #1 #1 Accounts migrated to simplified products (‘000’s) 70 110 257 327 Digital sales1 (%) 11 13 15 2ppts 1 Refer page 148 for metric definitions and details of provider. Westpac Group 2018 Full Year Results Presentation & Investor Discussion Pack 2H17 1H18 Net interest income Non-interest income Operating expenses Impairment charges Tax and NCI 2H18 Cash earnings ($m) AIEA up 1% and margin down 2bps Higher from lower asset spreads and investments and increased funding costs regulatory costs 23 11 (16) (17) 1,080 (2) 1,079 1,045 Higher line fees Rise in stressed commercial facilities Down $1m or flat
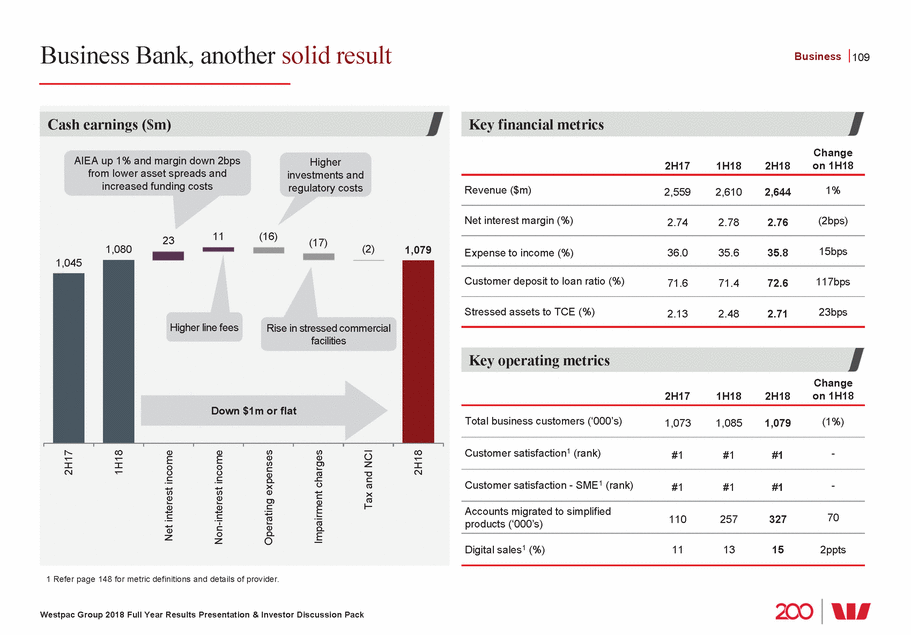
A disciplined 2H18 performance Business 110 1,680 931 36.0 67.1 35.8 35.6 Westpac Group 2018 Full Year Results Presentation & Investor Discussion Pack Revenue per FTE ($’000) 840 1H16 2H16 1H17 2H17 1H18 2H18 826 811 791 780 775 Expense to income ratio (%) 36.8 36.3 36.4 1H16 2H16 1H17 2H17 1H18 2H18 Loans ($bn) & deposit to loan ratio (%) LoansCustomer deposit to loan ratio 71.671.472.6 68.6 69.9 152153 142 146 146 149 Mar-16 Sep-16 Mar-17 Sep-17 Mar-18 Sep-18 Core earnings ($m) 1,698 1H16 2H16 1H17 2H17 1H18 2H18 1,638 1,558 1,570 1,523 Revenue ($m) 2,644 2,610 1H16 2H16 1H17 2H17 1H18 2H18 2,559 2,447 2,467 2,408 Cash earnings ($m) 1,0801,079 1,045 954 958 1H16 2H16 1H17 2H17 1H18 2H18
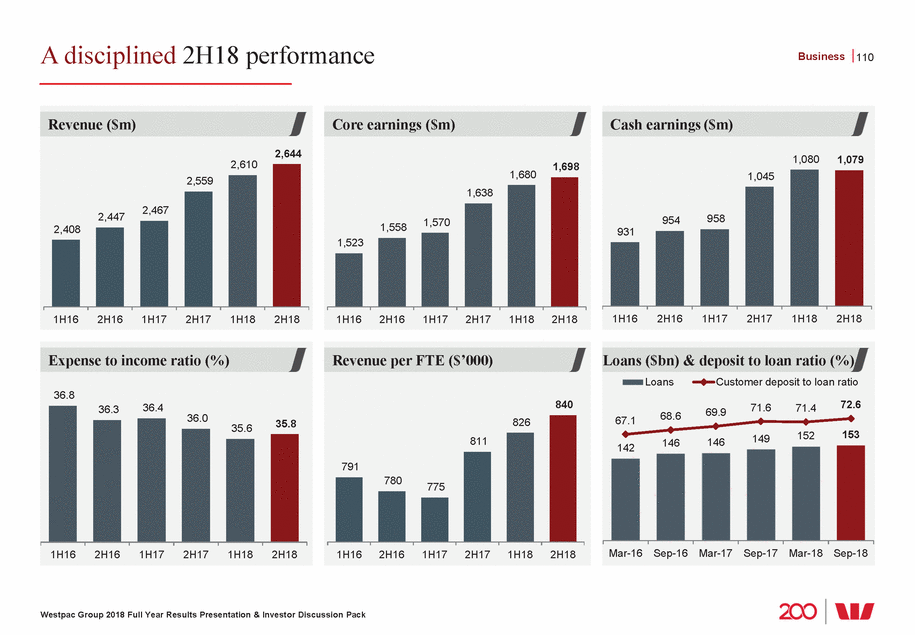
Transforming the Business Bank Business 111 to link payments from a range of sources to their reconciliations and speeds up the sales process with more to be added making it easier for customers and bankers deposit customers, with 27 products closed and simpler product range 1 Refers to Westpac only. Originated online but are completed through manual channels. Westpac Group 2018 Full Year Results Presentation & Investor Discussion Pack Payment and transaction solutions Helping customers take and make payments, meet cash flow shortfalls and manage payables and receivables Presto Smart • An integrated payment solution enabling merchants payment terminal • Removes the need for manual input and • Presto Smart connects to 13 point-of-sale providers Targeted product range • Continue to streamline and simplify deposit products, • Migration is now complete for Westpac business more than 327,000 accounts transferred to the Digital for customers Empowering more customers with online capabilities such as account opening, overdraft access and servicing Improvements to Westpac Live includes: • Removal of virtual keyboard login • Simple navigation • Easier payment search function • Removal of fees to access online cheque/deposit images Increased digital sales • Investment in digital capabilities continues to support growth of digital channels with digital sales now 15% of sales in 2H18, up from 11% in 2H17 • Over 50% of unsecured overdrafts are now originated online1 Investing in bankers Enabling bankers to build great customer relationships through industry insights, paperless processes, simplified products and innovative technologies Transforming business lending • New features in Optimist, our credit risk management tool, enables risk grading for all Commercial and SME customers. Enables a consistent approach for assessments for property lending and industry insights • Launched Business Bank Bill Loan product to St.George customers LOLA for St.George • Expanded the Group’s online lending origination platform (LOLA) to St.George SME bankers and increased features and range of products that can be originated via LOLA. Saving bankers an average of 90 minutes per deal • LOLA and Optimist have simplified processes, saving bankers 32,000 hours over the year
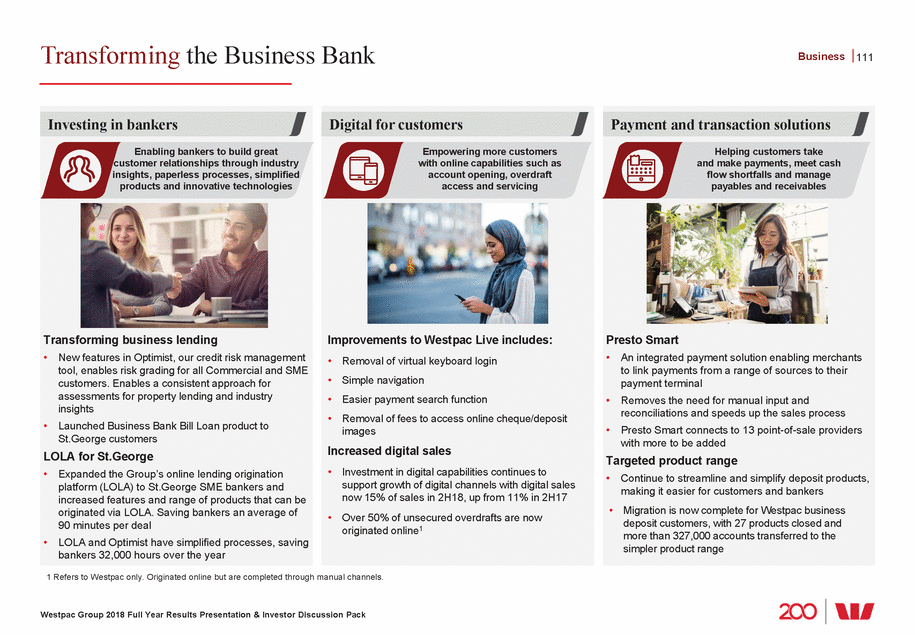
BTFG, a leading wealth provider responding to industry change BT Financial Group 112 Key financial metrics Change on FY17 FY16 FY17 FY18 2,368 2,255 (1%) Revenue ($m) 2,226 50.0 53.2 (5ppts) 58.0 Expense to income (%) 179.2 191.4 7% 205.6 Total funds ($bn) (spot) 58 (10) (12) 782 (141) 786 18.6 20.1 4% Loans ($bn) (spot) 21.0 26.6 30.7 7% 33.0 Deposits ($bn) (spot) Life Insurance in-force premiums5 ($m) 973 1,068 1,277 20% General Insurance GWP ($m) 503 508 503 (1%) Key operating metrics ($m) Change on FY17 FY16 FY17 FY18 Customers with a wealth product6 (%) 17 18 17 (100bps) Planners (salaried & aligned) (#) (spot) 1,134 1,011 803 (21%) Platform FUA market share7 (inc. Corp Super) (%) 19 19 19 (40bps) Platform gross flows market share7 (inc. Corp Super) (%) 21 21 20 (90bps) Life Insurance market share8 (%) 11 12 10 (150bps) H&C insurance market share9 (%) 6 6 6 (10bps) 1 Home and Contents. 2 Gross Written Premiums. 3 Includes $28m of revenue ($15m cash earnings) from the management of Group Insurance for BTFG Corporate Super. 4 Represents income on invested capital required for regulatory purposes primarily for Life Insurance entities. 5 At 1 Jan 18, Westpac Life Insurance Services Limited became the preferred insurer for BTFG Corporate Super members. Life insurance in-force premium at Sep18 consist of $994m retail, $283m Group Life Insurance (1H18 consists $1,000m retail, $276m Group Life Insurance; 2H17: $993m retail, $75m Group Life insurance; 1H17: $966 m, $64m Group Life insurance). 6 Refer page 148 for wealth metrics provider. 7 Strategic Insight, All Master Funds Admin at Jun 18 (for 2H18), at Dec 17 (for 1H18), and at Jun 17 (for 2H17) and represents the BT market share at these times. 8 Strategic Insight (Individual Risk) rolling 12 month average. New sales includes sales, premium re-rates, age and CPI indexation Jun 18. 9 Internally calculated from APRA quarterly general insurance performance statistics, Jun 18. Westpac Group 2018 Full Year Results Presentation & Investor Discussion Pack FY17 Infrequent items Cash earnings impact of Pendal sell down FY17 Pro forma Funds Management income 3 Insurance income Capital and other income4 Expenses Tax and impairment charges FY18 Pro forma Infrequent items FY18 Cash earnings ($m) Loans n4%, deposits n 7%, Life in-force: n 20% Cash earnings impact of funds n 7%. Partly offset by H&C1 GWP2: n 3% provisions for estimated margin compression and lower lower weather claims customer refunds and Advice revenue payments and costs 47 14 (10) (37) 736 Includes implementation of BT Open Services and costs to remove grandfathered commissions payments Up $4m or flat Down $91m or 12% 645
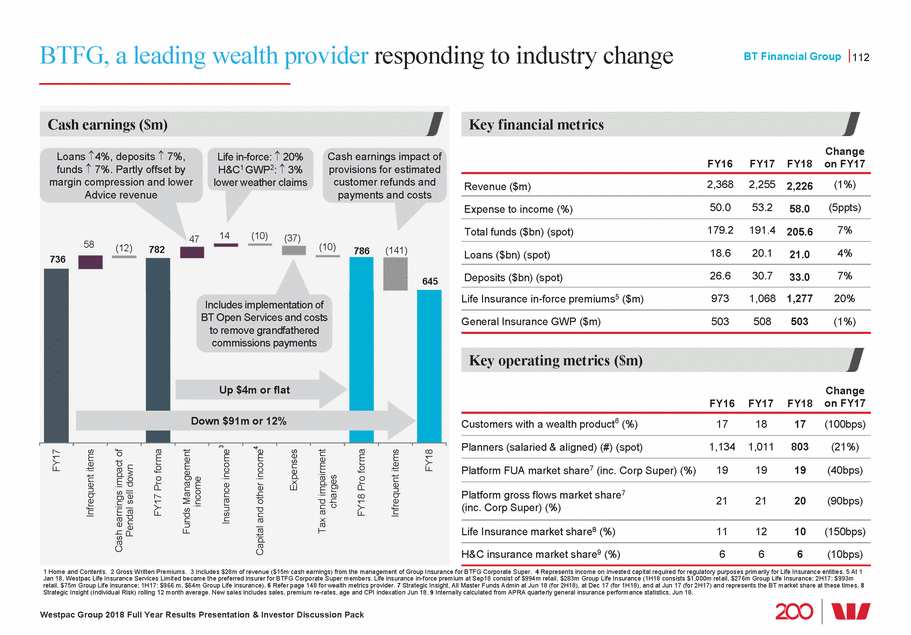
Sound fundamentals BT Financial Group 113 Insurance premiums ($m) Group in-force premiums Retail in-force premiums General Insurance gross written premiums¹ 1,276 1,277 3.5 4.0 1,068 276 1,030 283 973 64 63 910 250 1,000 994 258 258 1 Includes CCI gross written premiums of $13m in 2H18 (1H18: $16m; 2H17:$21m; 1H17:$25m; 2H16:$25m) 2 Retail Platforms market share sourced from Strategic Insight, All Master Funds Admin segment and represents the BT Wealth business market share disclosed in Strategic Insight as at June 2018. 3 Strategic Insights June 2018. 4 Market share is Retail life insurance new sales. Westpac Group 2018 Full Year Results Presentation & Investor Discussion Pack Life insurance lapse rates3 (%) WBC Peer 1 Peer 2 Market Avg Jun-14 Jun-15 Jun-16 Jun-17 Jun-18 Retail platforms market share2,3 (%) WBC Peer 1 Peer 2 Avg next top 4 Jun-14 Jun-15 Jun-16 Jun-17 Jun-18 Life insurance market share3,4 (%) WBC Peer 1 Peer 2 Avg next top 4 Jun-14 Jun-15 Jun-16 Jun-17 Jun-18 251 252 75 993 966 2H16 1H17 2H17 1H18 2H18 Funds ($bn) Platforms Superannuation Packaged funds Other 197.7 205.6 179.2 191.5 191.4 3.7 3.8 38.4 36.4 Sep-16 Mar-17 Sep-17 Mar-18 Sep-18 39.6 38.0 32.1 3.8 39.3 37.4 35.8 36.2 34.4 122.9 113.3 115.3 118.6 108.9 Insurance claims rates (%) General Insurance Life Insurance 71 42 37 2H16 1H17 2H17 1H18 2H18 49 54 38 35 35 44 38
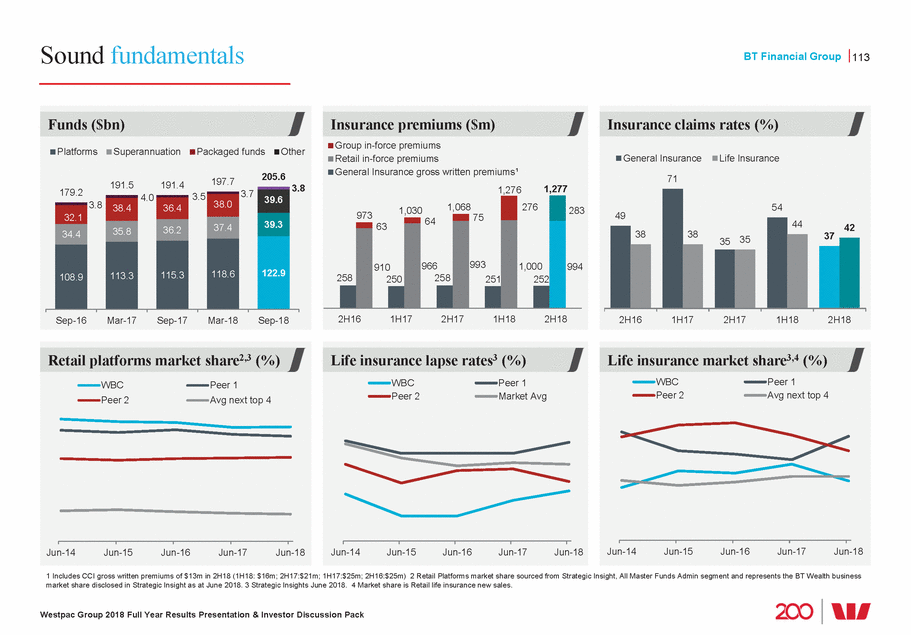
Meeting customers’ wealth needs via digital BT Financial Group 114 New and improved customer services Digitising insurance: improving customer experience BT Open Services1, an online services hub, providing self-licensed advisers and dealer groups access to a range of services on a fee-for-service basis Launch of near real-time (1hour) email re-contacting customers after drop out from a digital Home and Contents (H&C) application form $1.98bn in Managed Accounts FUA, up 209% over last 12 months 80% growth in H&C needs met digitally Continuous improvement to Panorama: ƒ Integrated Annuity offer and stand-alone Cash Management Account (CMA) solution ƒ Thumb print digital consent, supporting online transactions ƒ Managed portfolio solutions Customers can access a H&C quote in 2 minutes online and access better pricing “Return to Work” Award Winner3 Introduced a Cancer Assistance Program which delivers proactive support to customers helping them get them back on track following a cancer diagnosis Launched a corporate super product offered digitally, providing members a range of quality investments (44 investment options available) 2 25% growth in customers wealth needs met digitally LifeCENTRAL+ updated to improve adviser efficiency allowing sharing of quotes within practices, a streamlined application process and improved navigation Website and online form improvements giving customers better access to insurance, superannuation and investment solutions Real-time 24/7 access to client and policy information Underwriting Team of the Year, Client Service Team” 2018 AFA Strategic Insights Awards “Wealth Management Firm of the Year 2018 – Australia” Acquisition International Finance Awards “Best Technology Offering, BT Panorama” 2018 Conexus Financial Superannuation Awards “Best Wealth & Money Management Company 2018” APAC Australian Enterprise Awards Award Winners “2018 The World’s Best Private Banks” Global Finance Awards “SMSF Adviser Investment Platform choice – BT Panorama” “SMSF Member Investment Platform choice – BT Wrap” CoreData Self-Managed Super Fund (SMSF) Service Provider “Net-worth-specific services: Super affluent clients (US$1m-5m) Winner” Euromoney Private Banking & Wealth Management Survey 1 Launch of BT Open Services on 1 November 2018. 2 Launched on 5 September 2018. 3 Awarded in September 2018 at Swiss Re/ALUCA Excellence & Innovation. Westpac Group 2018 Full Year Results Presentation & Investor Discussion Pack
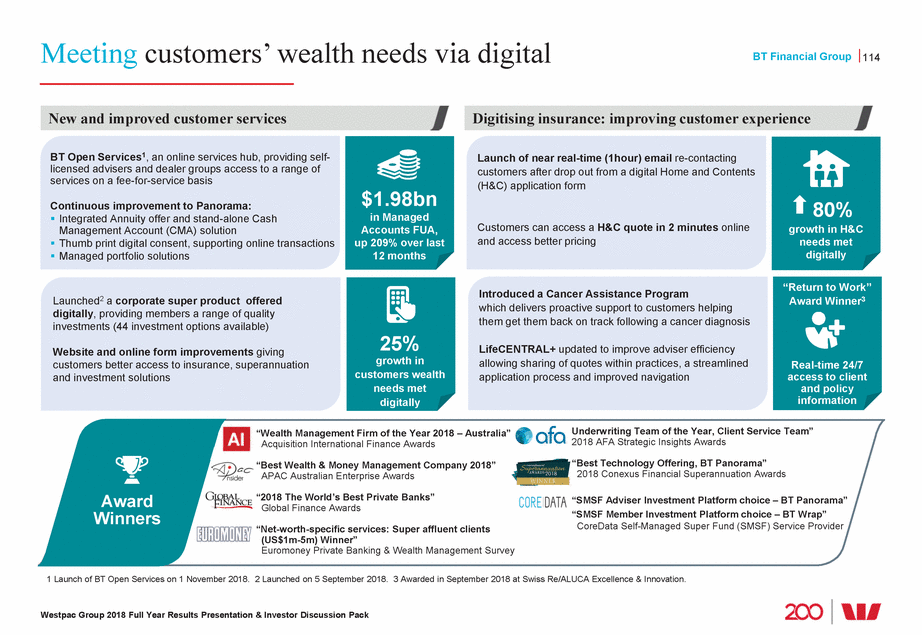
Panorama: new, simple, transparent pricing on BT Panorama – a unique offer for advisers and investors 115 BT Financial Group with price advisers $1,500 p.a., form app Mobile s, 2018 Planner Technology report connectivity Westpac Group 2018 Full Year Results Presentation & Investor Discussion Pack FUA on Panorama ($m) 12,402 p 85% Sep-16 Mar-17 Sep-17 Mar-18 Sep-18 9,363 6,713 3,936 U 2,719 SMSF funds on Panorama(#) 6,215 p 44% Sep-16 Mar-17 Sep-17 Mar-18 Sep-18 5,332 4,305 3,217 U 2,173 Advisers using Panorama (#) 1,775 834 Up 31% Sep-16 Mar-17 Sep-17 Mar-18 Sep-18 1,584 1,355 969 Investors on Panorama (#) 23,462 Up 99% Sep-16 Mar-17Sep-17Mar-18Sep-18 17,608 11,778 6,640 4,274 New pricing structure: • Simple, transparent pricing structure alignment across all channels and • 0.15% p.a. admin fee, capped at with a flat account fee of $540 p.a. • Family account aggregation for up to f family accounts our Panorama app • BT Panorama is the highest rated plat among financial advisers • Winner of “Planner Satisfaction with Access and App” – Investment Trend • >80% of investors logon via the app • Over 43,000 app launches per month One system for One core all investors & operating advisers system BT Panorama’s unique offers Bank SMSFs /security Digital user experience
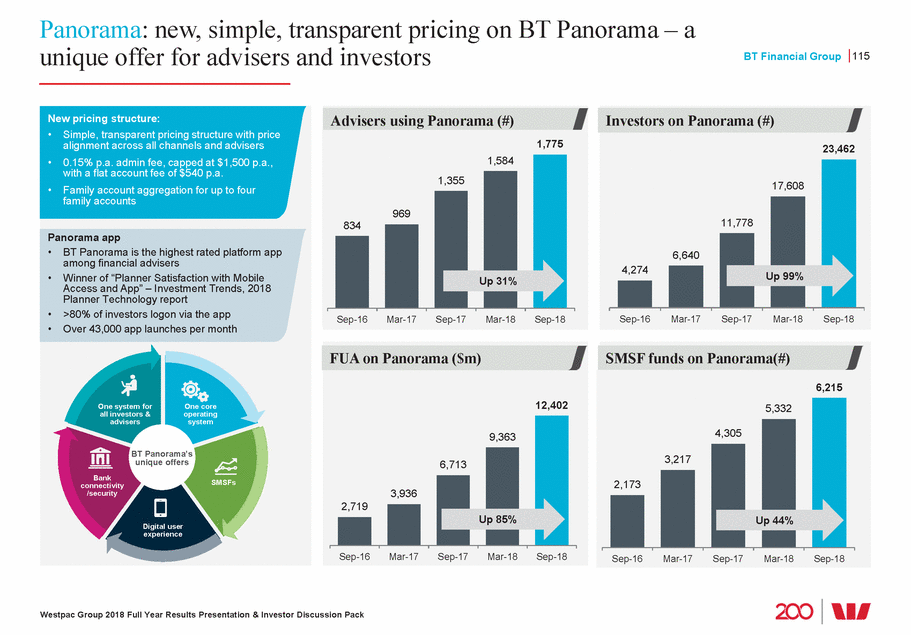
WIB delivers a disciplined performance Westpac Institutional Bank 116 Key financial metrics Change on 1H18 2H17 1H18 2H18 Revenue ($m) 1,421 1,424 1,548 9% Net interest margin (NIM) (%) 1.62 1.58 1.72 14bps 47.9 47.4 49.8 241bps Expense to income ratio (%) Customer deposit to loan ratio (%) 124.3 130.0 135.8 large 535 530 Stressed assets to TCE (%) 0.55 0.52 0.44 (8bps) Key operating metrics Change on 1H18 2H17 1H18 2H18 Customer revenue1 / total revenue (%) 86.7 87.1 82.9 (large) Trading revenue / total revenue (%) 5.0 11.3 3.9 (large) Revenue per FTE ($’000)2 791 794 901 13% Deposits ($bn) 92.1 98.9 104.8 6% 1 WIB customer revenue is lending revenue, deposit revenue, sales and fee income. Excludes trading, derivative valuation adjustments and Hastings. 2 Excludes Westpac Pacific revenue and FTE. Westpac Group 2018 Full Year Results Presentation & Investor Discussion Pack 2H17 1H18 Net interest income Non-interest income Operating expenses Impairment charges Tax and NCI 2H18 Cash earnings ($m) Income associated with Hastings expenses up exit of Hastings offset by lower $84m, mostly goodwill markets income write-off 14bps rise in 58 (96) NIM 66 4(48) 551 Down $16m or 3%
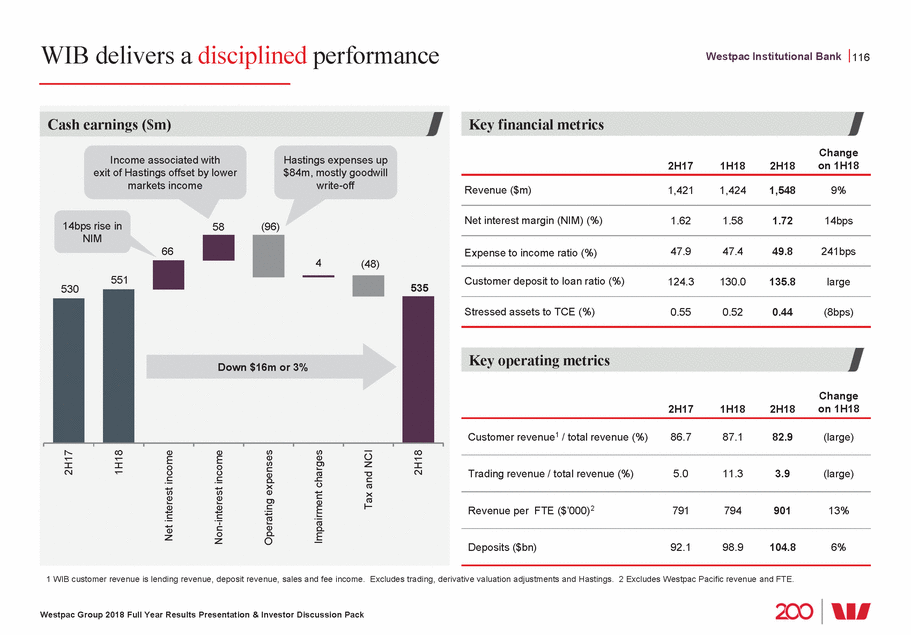
Balance sheet in good shape, maintaining focus on returns Westpac Institutional Bank 117 1% 6% ROE (%) 11.7 2.6 ps 2.1 0.6 90bps 0.4 Westpac Group 2018 Full Year Results Presentation & Investor Discussion Pack Sep-10 Sep-11 Sep-12 Sep-13 Sep-14 Sep-15 Sep-16 Sep-17 Sep-18 12.6 12.6 Flat Up 2H17 1H18 2H18 Margin (%) 1.62 1.58 1.72 Dow n 4bps Up 14b 2H17 1H18 2H18 Stressed exposures as a % of TCE 4.6 . Watchlist & substandard 90+ days past due and not impaired Impaired 1.2 0.9 0.8 0.9 Net loans ($bn) 74.1 76.1 77.2 Up Up 3% Sep-17 Mar-18 Sep-18 Deposits ($bn) 104.8 98.9 92.1 Up Up 7% Sep-17 Mar-18 Sep-18 Risk weighted assets ($bn) 78.2 77.3 77.0 Down <1% Sep-17 Mar-18 Sep-18 Dow n 1%
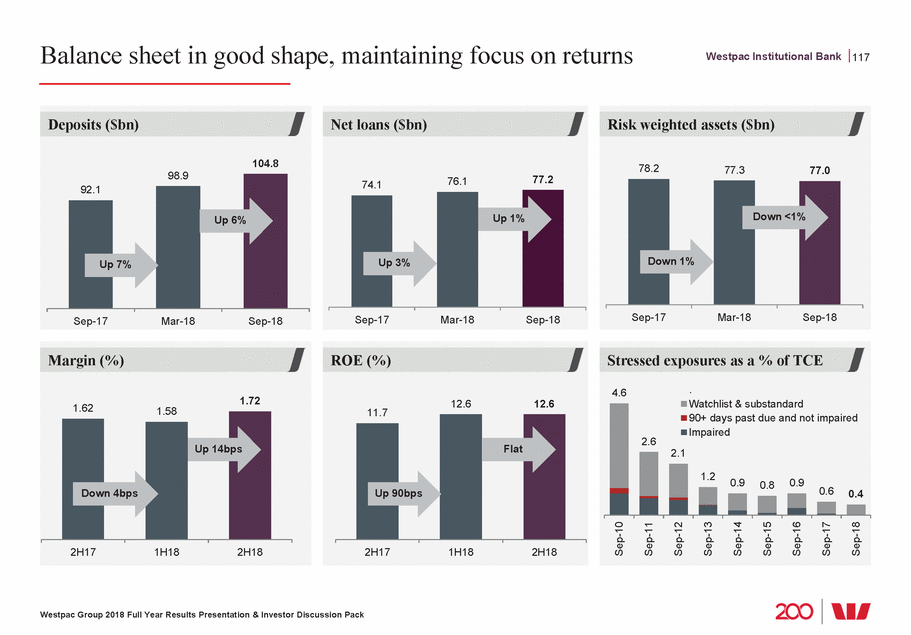
A strong franchise serving customers and delivering innovative solutions in key segments Westpac Institutional Bank 118 Service Efficiency Innovation 9 9 9 9 Banker to 91% of the ASX top 100 99.7% transactional banking retention rate1 95 new to bank customers in FY18 Largest banker to the Australian/NZ public sector, providing significant scale and ability to reinvest in capabilities 9 Developing solutions for customers to enhance data management capabilities and increase efficiency Digitising sales, service and back-office processes Market-leading straight through processing for FX transactions, with approx. 90% of FX flow now electronically executed 9 Track record of delivering innovative industry and policy solutions Significant transactional banking investment Partnering with fintechs to deliver new technologies and increase delivery speed 9 9 9 9 Liquidity and working capital management First release of WIB’s Digital Institutional Bank platform going live in November. Offers Corporate and Institutional customers real-time visibility of account balances, intraday balance movement and a single view of cash liquidity throughout their entire corporate structure Product innovation In partnership with Assembly Payments, launching new digital wallet capabilities for B2B and B2C customer transaction experiences and established a strong pipeline of data analytics opportunities with both corporate and government customers Renewables In FY18, leading financier2 to greenfield renewable energy projects in Australia providing more than $425m of new financing to seven projects Public Sector Both the Victorian and ACT Governments extended their banking contracts with Westpac in FY18 Superannuation First to market with innovative investment solutions and market leader in contributions via QuickSuper – WIB processes transactions for more than 162,000 Australian employers Infrastructure In FY18, more than $1.2bn new funding commitments supporting over $10.6bn in capital investment in Australian infrastructure and energy projects Corporate Loan Portal First to market with online portal providing customers with greater visibility and control over their loans. 150 customers in the pipeline Insights-driven analytics Partnership with ICICI Bank to develop a new payment solution for migrant students, giving students lower fees and enabling Australian universities to automatically reconcile international tuition payments M&A Financing Leverage depth of customer relationships and strength in underwriting and structuring for large syndicated transactions 1 Transactional banking relationships retention rate defined as the percentage of transactional relationships at the start of 2H18 that were retained through to the end of the period. 2 By new financing commitments. Source: IJGlobal data. Westpac Group 2018 Full Year Results Presentation & Investor Discussion Pack Financial Year 2018 Franchise Strength
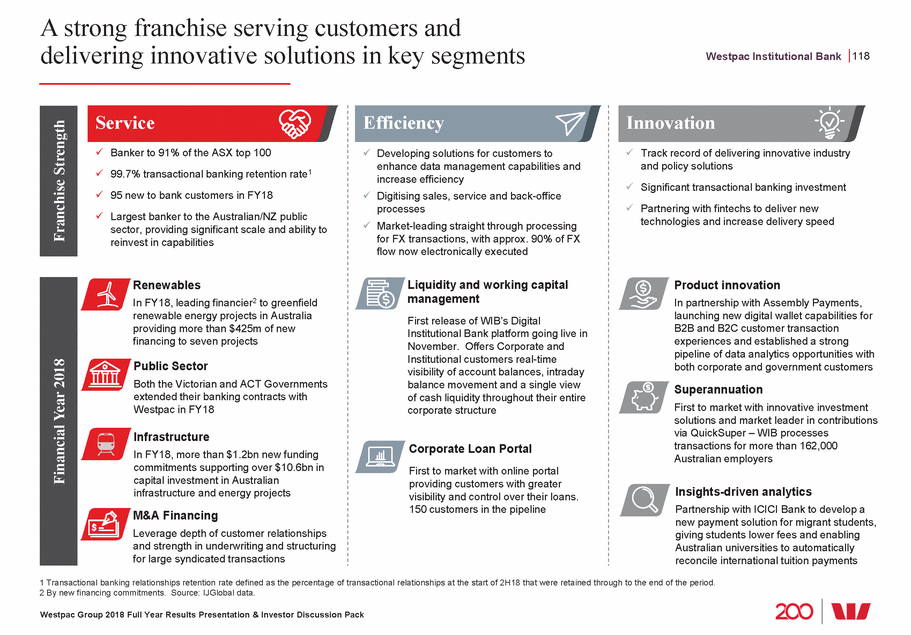
NZ transformation delivering New Zealand 119 Key financial metrics Change on 1H18 2H17 1H18 2H18 Revenue (NZ$m) 1% 1,151 1,166 1,183 Net interest margin (%) 1bp 2.09 2.15 2.16 (58bps) Expense to income (%) 41.3 40.1 39.6 Customer deposit to loan ratio (%) (89bps) 75.5 77.9 77.0 Stressed assets to TCE (%) 2.06 1.86 1.57 (29bps) Key operating metrics Change on 1H18 2H17 1H18 2H18 Customers (#m) 1.35 1.36 1.35 (1%) Branches (#) 169 164 163 (1) Consumer NPS1 +2 +9 +8 (1) Business NPS1 +5 +17 +0 (17) Agri NPS1 +54 +52 +17 (35) FUM and FUA (NZ$bn) (spot) 10.1 10.3 10.7 4% Service quality – complaints (000’s) 9.6 8.5 9.2 8% 1 Refer page 149 for details of metric definition and provider. Westpac Group 2018 Full Year Results Presentation & Investor Discussion Pack 2H17 1H18 Net interest income Non-interest income Operating expenses Impairment charges Tax and NCI 2H18 Cash earnings (NZ$m) Lower consumer delinquencies AIEA up 2% and margin up 1bp from and lower stress in dairy sector higher mortgage and business spreads offset by lower deposit spreads 51(15) 535 508 28 (11) 0 482 Lower fee income from simplification and the removal of some fees Up $53m or 11%
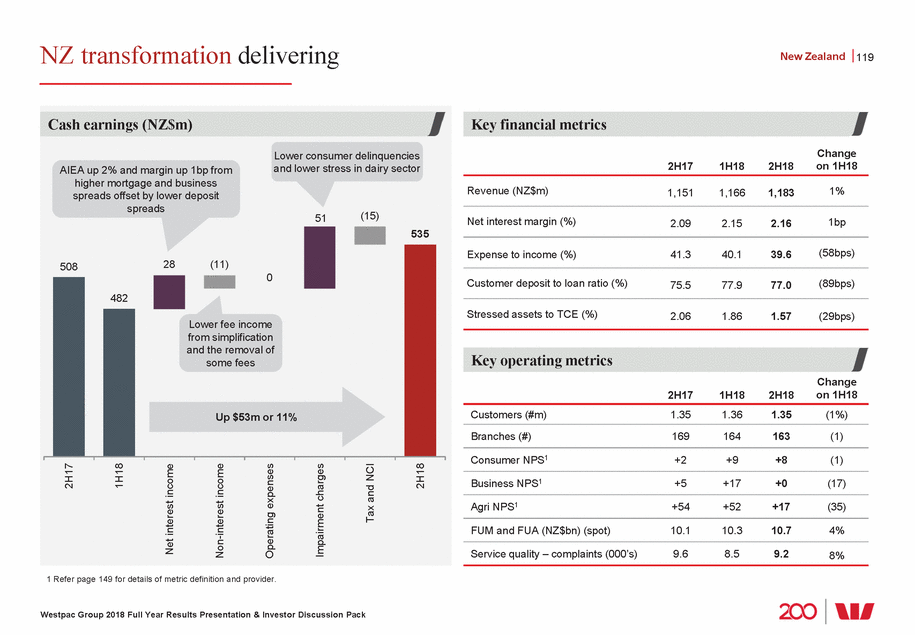
New Zealand key metrics1 New Zealand 120 698 676 653 1 All figures in NZ$ unless otherwise indicated. Westpac Group 2018 Full Year Results Presentation & Investor Discussion Pack Net interest margin (%) 2.13 2.09 2.15 2.16 2H16 1H17 2H17 1H18 2H18 1.96 Expense to income ratio (%) 44.4 39.6 2H16 1H17 2H17 1H18 2H18 42.3 41.3 40.1 Loans ($bn) & deposit to loan ratio (%) Loans Customer deposit to loan ratio 76.6 74.2 75.5 77.9 77.0 75 77 77 79 80 Sep-16 Mar-17 Sep-17 Mar-18 Sep-18 Core earnings ($m) 715 611 2H16 1H17 2H17 1H18 2H18 Revenue ($m) 1,183 1,151 1,166 1,132 2H16 1H17 2H17 1H18 2H18 1,098 Cash earnings ($m) 535 2H16 1H17 2H17 1H18 2H18 508 463 482 434

Improving the customer experience through digital and new services New Zealand 121 introduced in August discovery tool, used customers to identify Up 53% them as well surface achieve their goals conversations have been completed 2.4 2.2 2.1 Down 13% • 470,000 customers have been contacted since recommend Westpac 1 Digital online sales includes fulfilment volumes. Westpac Group 2018 Full Year Results Presentation & Investor Discussion Pack Deeper customer relationships Solutions based on customer goals • Your Story 2018, is a live digital in branches, to assist what’s important to solutions to help them • Since launch, 12,800 Your Story customer Creating ongoing value for customers • Value Me program introduced September 2017, helps customers by identifying best products, services and banking solutions based on their behaviour, saving customers time and money launch, with a 7% increase in customers likely to Making payments easier • Westpac Pay, launched in July 2018, allows customers to use their Android phone to make secure contactless payments with the ability to set the level of security and payment preferences • Westpac Get Paid ® launched in July 2018, is a card reader and mobile app that gives businesses the ability to take payments, create and send quotes, invoices and receipts in real time in a way that’s convenient for their customers • Westpac Direct from Account ® is an online channel providing merchants with the ability to accept authenticated direct credit payments from their customers, without having to leave the merchants’ website Digital for customers Customers increasingly using digital Digital online sales1 (‘000’s) 76 80 52 43 1H17 2H17 1H18 2H18 Over-the-counter transactions (#m) 2.7 1H17 2H17 1H18 2H18 Simple award winning digital banking solutions • Making banking solutions simple and easy for customers has seen Westpac win Canstar’s Bank of the Year – Everyday Banking award for 2018 (third year running)
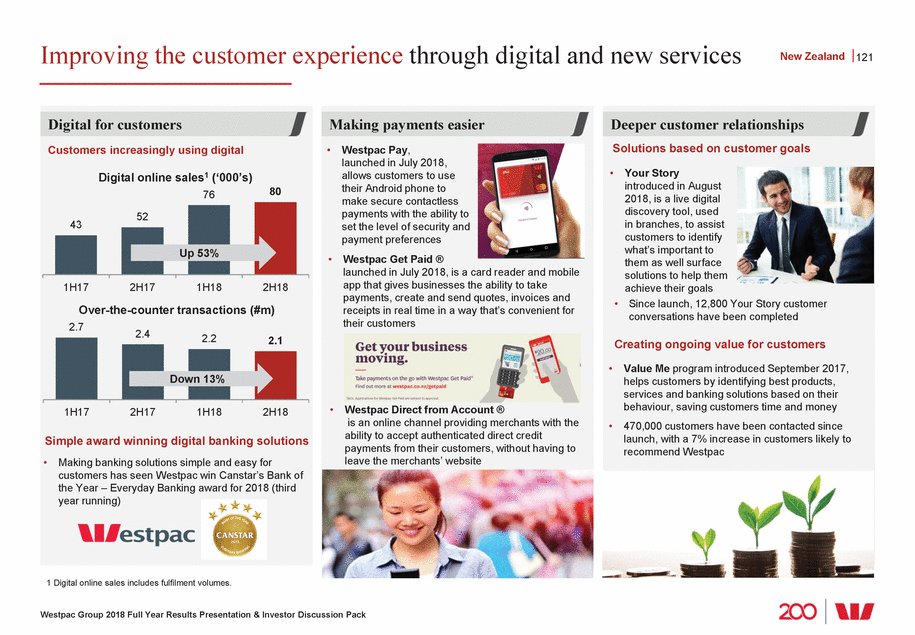
Balance sheet drivers New Zealand 122 58.4 (NZ$bn) and % of total Business 58 57 gage Westpac Group 2018 Full Year Results Presentation & Investor Discussion Pack New Zealand customer loans (NZ$bn) and % of tota 77 Up 1% 77 Up 2% 79 Up 2% 80 Pers l onal 61 29 29 Mort 29 28 46 47 48 49 37 2 Mar-17 Sep-17 Mar-18 Sep-18 New Zealand customer deposits Up 1% Up 5% 62 Flat 62 Transaction Savings Term deposits 22 53 25 15 14 13 12 15 15 15 17 33 32 30 28 Mar-17 Sep-17 Mar-18 Sep-18 New Zealand net loans (NZ$bn) 77.3 79.1 0.9 0.4 80.4 Sep-17 Mar-18 Consumer Business Sep-18 Up 2% New Zealand deposits (NZ$bn) 61.6 0.9 (0.6) 61.9 Sep-17 Mar-18 Consumer Business Sep-18 Flat
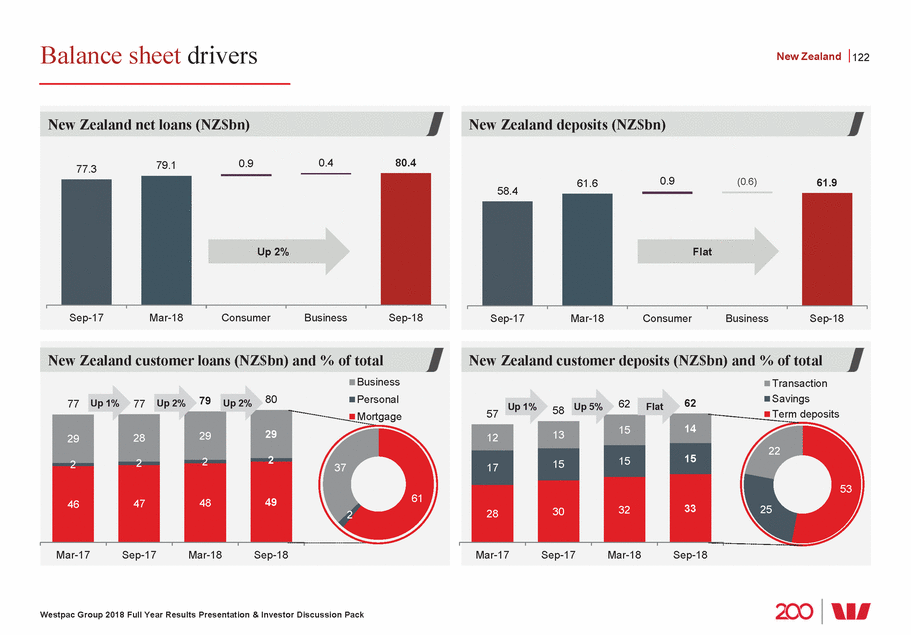
Stressed exposures lower as dairy portfolio improves New Zealand 123 4.4 3.9 0.0 0.0 0.1 0.1 0.1 0.4 0.4 Agribusiness portfolio Sep-17 Mar-18 Sep-18 Westpac TCE (NZ$bn) 8.9 8.9 9.2 Agriculture as a % of total TCE 8.2 8.0 8.3 % of portfolio graded as ‘stressed’2 13.5 12.1 9.7 % of portfolio in impaired 0.41 0.50 0.42 1 Large reduction in stressed exposures from Sep 2011 to Sep 2012 due primarily to transfer of WIB assets during 2012. 2 Includes impaired exposures. 3 Source: Fonterra. Westpac Group 2018 Full Year Results Presentation & Investor Discussion Pack Milk price & Fonterra dividend3 (NZ$) Kg Ms $10 Dividend Milk price Economics $9 $8 $7 $6 $5 $4 $3 $2 $1 $0 2014/15 2015/16 2016/17 2017/18 2018/19 forecast 0.400.100.30 6.69 6.25 0.25 0.40 6.12 4.40 3.90 Dairy portfolio summary • Overall stress has declined and the portfolio’s risk grade profile is stable following favourable milk prices over the last two seasons • Focus remains on supporting existing dairy customers with proven long-term viability • Some headwinds from global milk price volatility driven by increased global milk production and unfavourable exchange rate movements. Regulatory reform and disease issues (M. Bovis) continue to pose challenges Business stressed exposures as a % of New Zealand business TCE 15.6 Watchlist & substandard 1 Property 3 14 Manufacturing 7 Agriculture, forestry & fishing Wholesale trade Construction 56 Other 12.8 13.2 90+ day past due (dpd) and not impaired 0.2 9.6 Impaired 6.8 0.2 4.4 4.9 5.5 5.3 0.2 3.2 3.3 3.4 3.7 3.3 3.4 0.2 2.3 0.1 2.4 0.2 0.1 3.0 2.6 2.2 1.5 0.9 0.8 Sep-10 Sep-11 Sep-121 Sep-13 Sep-14 Sep-15 Mar-16 Sep-16 Mar-17 Sep-17 Mar-18 Sep-18 3.4 2.9 4.0 4.8 5.0
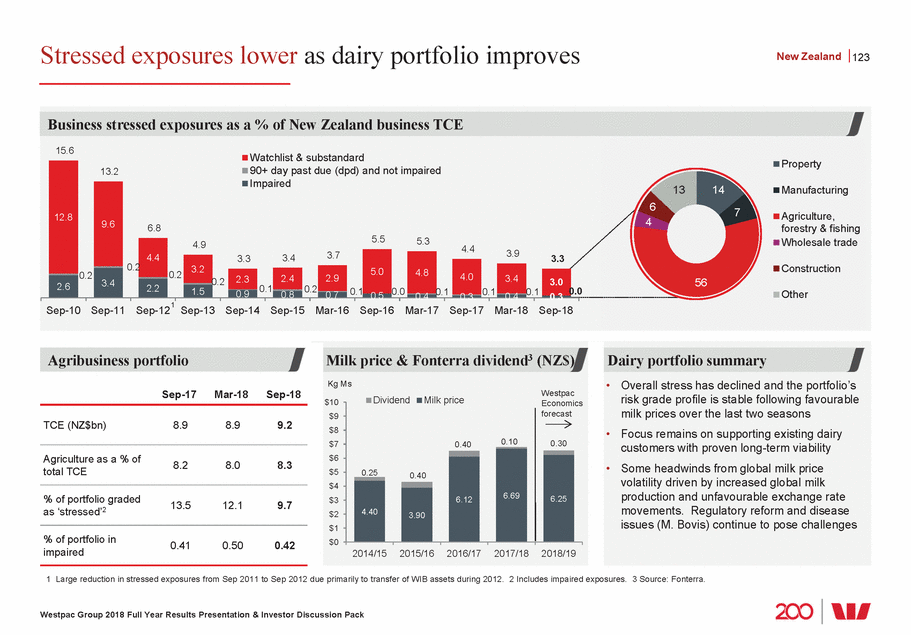
Consumer credit quality in good shape New Zealand 124 0.5 1 LVR based on current loan property value at latest credit event. Westpac Group 2018 Full Year Results Presentation & Investor Discussion Pack Sep-11 Mar-12 Sep-12 Mar-13 Sep-13 Mar-14 Sep-14 Mar-15 Sep-15 Mar-16 Sep-16 Mar-17 Sep-17 Mar-18 Sep-18 Sep-11 2H10 1H11 2H11 1H12 2H12 1H13 2H13 1H14 2H14 1H15 2H15 1H16 2H16 1H17 2H17 1H18 2H18 Mar-12 Sep-12 Mar-13 Sep-13 Mar-14 Sep-14 Mar-15 Sep-15 Mar-16 Sep-16 Mar-17 Sep-17 Mar-18 Sep-18 Mortgage portfolio LVR1 (%) of portfolio 92% of mortgage portfolio less than 80% LVR 46% 23% 23% 5% 3% 0<=60 60<=70 70<=80 80<=90 90+ Mortgage loss rates each half (%) 0.25 0.20 0.15 0.10 0.05 1 0.00 0.0 Mortgages9900++ddaayydsdepelialnisnqtqudueuenenc(cie%iess)(%) 1.0 0.5 0.11 0.0 Unsecured consumer 90+ day delinquencies (%) 1.5 1.0 0.62 0.0 Operational issue now resolved
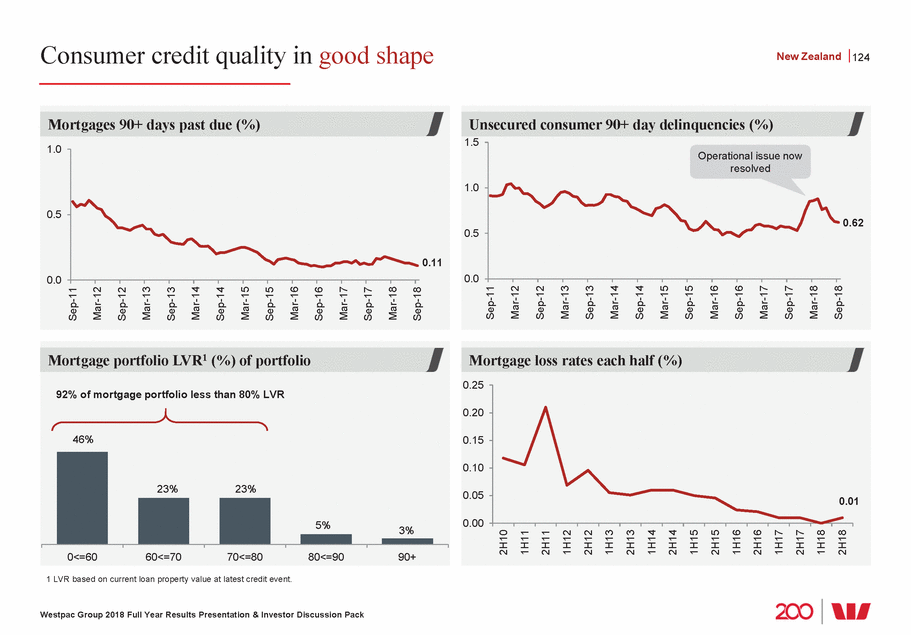
Economics

Australian economic snapshot – growth to moderate 126 Australian economy key statistics (latest available as at October 2018) JPMorgan global manufacturing PMI GDP Westpac Economics Forecast (end calendar 2019) 3.4% 2.7% Unemployment Rate Westpac Economics Forecast (end calendar 2019) 5.0% 5.0% Sources: Reuters, Westpac Economics Sources: ABS, RBA, Westpac Economics Inflation Westpac Economics Forecast (end calendar 2019) 1.9% 1.7% Cash Rate Westpac Economics Forecast (end calendar 2019) 1.50% 1.50% AUD/USD Westpac Economics Forecast (end calendar 2019) US$0.713 US$0.72 Sources: RBA, Westpac Economics. Sources: RBA, Westpac Economics. 1 Average RBA core CPI is average of seasonally adjusted trimmed mean & weighted median CPI. 2 Includes WCFI+BI commodities index, 2 year swap spread and NFD to GDP. 3 Exchange rate at as 31 October 2018. Westpac Group 2018 Full Year Results Presentation & Investor Discussion Pack AUD has moved lower USD 'fair value' band 1.20 AUD/USD actual & forecast2 fc/s to 1.10 9 1.00 0.90 0.80 0.70 0.60 0.50 0.40 Sep-94 Sep-99 Sep-04 Sep-09 Sep-14 Sep-19 end 201 Commodity prices resilient in 2018 RBA Commodity Price Index, AUD terms, based to 100 in 2016-17 index 180 160 140 120 100 80 60 40 20 Sep-03 Sep-06 Sep-09 Sep-12 Sep-15 Sep-18 Global backdrop less positive Index Westpac global trade PMI 60 55 50 45 40 35 30 Sep-98 Sep-02 Sep-06 Sep-10 Sep-14 Sep-18 Inflation remains subdued1 %yr Avg RBA core CPI %qtr (rhs) %qtr 8 Headline CPI %yr (lhs) 3.2 7 2.8 6 2.4 5 2.0 4 1.6 3 1.2 2 0.8 1 0.4 0 0.0 -1 -0.4 Sep-96 Sep-00 Sep-04 Sep-08 Sep-12 Sep-16 Avg RBA core CPI %yr (lhs) f/cs
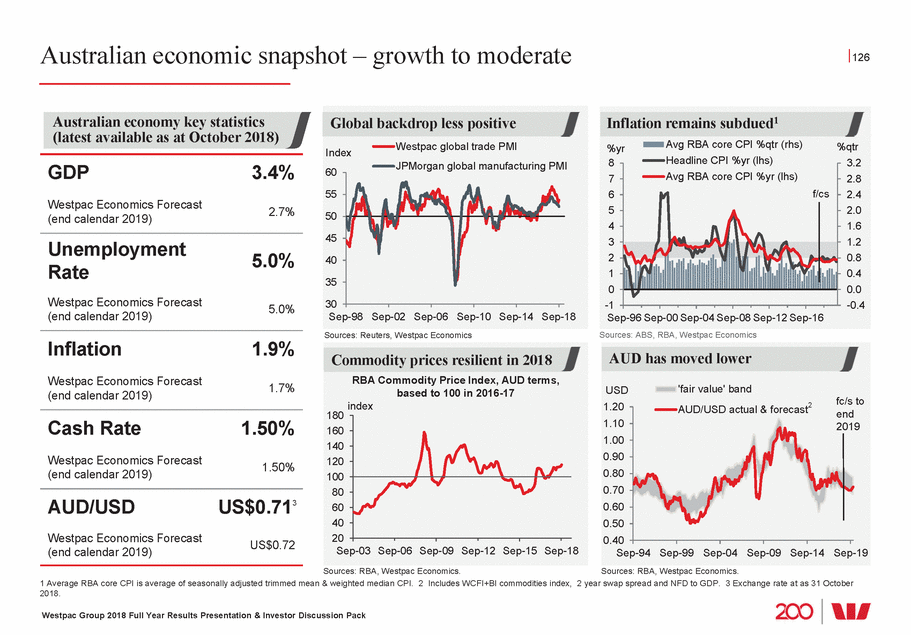
Australian and New Zealand economic forecasts 127 Source: Westpac Economics. 1 Year average growth rates. 2 Through the year growth rates. 3 Business investment adjusted to exclude the effect of public sector purchases of public assets. 4 NZ credit forecasts are for growth over the calendar year. Westpac Group 2018 Full Year Results Presentation & Investor Discussion Pack Private consumption2 3.0 2.6 2.6 Business investment2,3 6.9 1.1 2.5 Unemployment – end period 5.5 5.1 5.0 CPI headline – year end 1.9 2.0 1.7 Interest rates – cash rate 1.50 1.50 1.50 Credit growth, Total – year end 4.8 4.4 3.5 Credit growth, Housing – year end 6.3 4.8 4.0 Credit growth, Business – year end 3.1 4.4 3.5 Unemployment – end period 4.5 4.6 4.6 Consumer prices 1.6 2.3 1.4 Interest rates – official cash rate 1.75 1.75 1.75 Credit growth – Total4 6.5 5.2 4.8 Credit growth – Housing4 7.4 5.7 4.9 Credit growth – Business4 5.2 4.4 4.5 New Zealand GDP2 2.9 3.0 3.1 Key economic indicators (%) as at October 2018 Calendar year 2017 2018F 2019F World GDP1 3.8 3.8 3.6 Australia GDP2 2.4 3.3 2.7
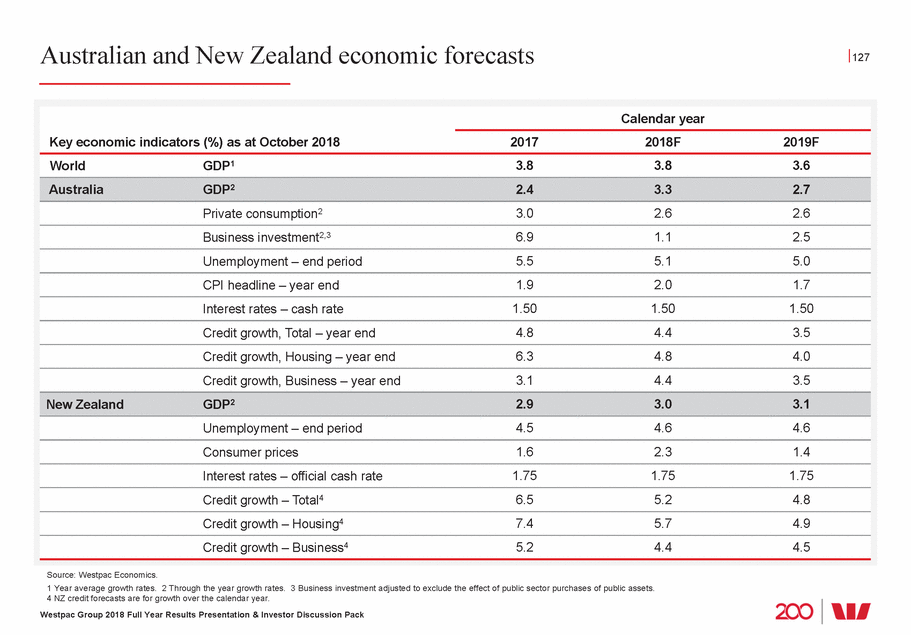
The Australian economy 128 NSW and Victoria 58% of population and employment 19 Construction 9 Wholesale, Retail Finance Relative size of States (Share of Australia, 2016/17, %) GSP Population Employment 35 Exports 33 32 32 Construction 26 26 24 18 20 20 20 6 6 Agriculture 14 7 7 6 4 2 2 2 1 Finance NSW Victoria Queensland WA SA Tasmania Sources: ABS, Westpac Economics 1. Real, financial years, experimental estimates Sources: ABS, Westpac Economics. 1 Excludes ownership of dwellings and taxes less subsidies. Westpac Group 2018 Full Year Results Presentation & Investor Discussion Pack 10 11 23 14 Services employ a large part of the Australian workforce Output 2017 - sector contribution to GDP (%)1 Services Mining 56% 7 Manufacturing Transport, Utilities 10 Agriculture 9 Household services 6 Health 10 Education 8 6 Public administration Business services Australian employment by sector 2017 (%) Services Mining 60% 15 2 7 Manufacturing 9 Transport, Utilities Wholesale, Retail 8 Household services 13 Health, Social Assistance Education 13 3 13 Public Administration Business services

Australian economic outlook: positive but uneven 129 ppts ppts * mining investment Consumer^ Mining * Non-mining Public Net exports GDP Sources: ABS, Westpac Economics. Sources: NAB survey, Westpac Economics. Sources: ABS, Westpac Economics. Sources: RBA, Westpac Economics. Westpac Group 2018 Full Year Results Presentation & Investor Discussion Pack Consumer spending constrained by income growth Australian consumer spending (% ann) vs labour income (% ann) % ann Labour income real 10 8 6 yr 4 2 0 -2 -4 Jun-98 Jun-02 Jun-06 Jun-10 Jun-14 Jun-18 Consumption Consumption long run avg: 3.3% Australian private sector credit growth subdued Australian private sector credit growth (% ann) ann% Housing Total credit Business 25 Forecasts 20 2019 15 10 5 0 -5 -10 Sep-94 Sep-98 Sep-02 Sep-06 Sep-10 Sep-14 Sep-18 end Australian growth mix: shifting drivers Contributions to GDP growth (ppts) 3 2015 2016 2017 2018f 2019f 3 2 2 1 1 0 0 -1 -1 -2 -2 investment ^ incl. housing Positive but moderating business conditions Australian business conditions (net balance) net bal. 30 Goods related Consumer sectors 20 10 0 -10 avg. -20 avg. -30 Sep-06 Sep-08 Sep-10 Sep-12 Sep-14 Sep-16 Sep-18 Business services 3 month moving deviation from
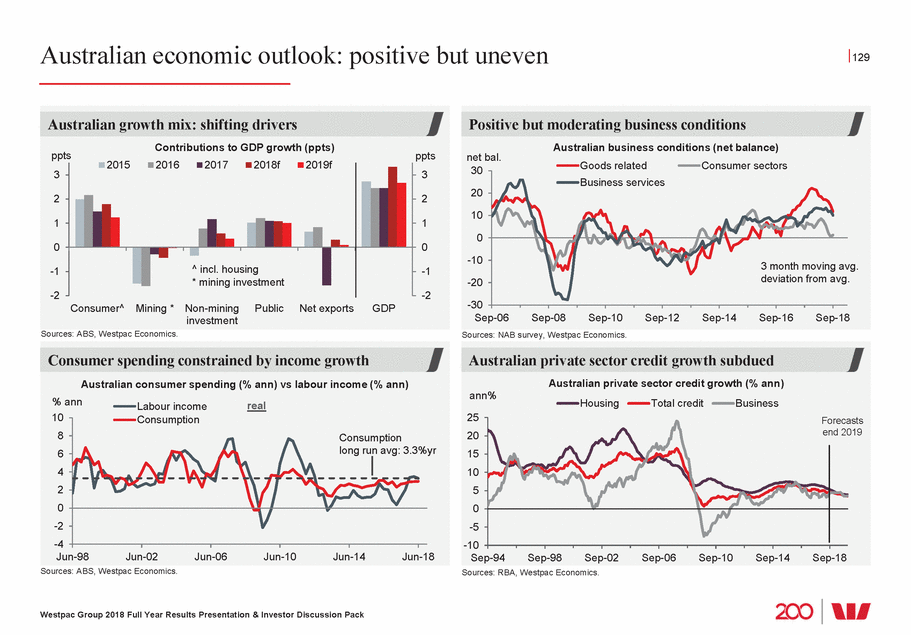
Population growth, public spending, lower AUD boosting activity 130 UK World Australia Sources: ABS, Westpac Economics 120 120 1997 2001 2005 2009 2013 2017 Sources: ABS, Westpac Economics Sources: RBA, Westpac Economics. 1 Business services: $21bn, including: legal & professional services $5.3bn, financial services $4.3bn, IT & Telecomm $3.8bn, Intellectual property rights $1.1bn and other $6.3bn. 2 Includes WCFI+BI commodities index, 2 year swap spread and NFD to GDP. Westpac Group 2018 Full Year Results Presentation & Investor Discussion Pack Infrastructure starts returning to boom levels $bn Commencements $bn 100 100 80 resources 80 60 60 40 40 20 20 0 0 June years Oil & gas Iron ore & Resource Private ex Public % chg +46% coal related -33 +11+5 -24 Lower AUD supports the local economy USD 'fair value' band AUD/USD actual & forecast2 1.20 1.10 c/s to end 1.00 2019 0.90 0.80 0.70 0.60 0.50 0.40 Sep-94 Sep-99 Sep-04 Sep-09 Sep-14 Sep-19 f Population growth remains high Population growth 2006-2016 average (% ann) EU 0.28 Developed US Canada NZ Developing 0.0 0.5 1.0 1.5 2.0 0.33 0.76 0.80 1.08 1.15 1.20 1.37 1.69 Services exports remains strong $bn Rolling annual, nominal $bn 30 ion 30 25 25 20 20 15 15 10 10 5 5 0 0 Jun-94 Jun-98 Jun-02 Jun-06 Jun-10 Jun-14 Jun-18 Educat Total service exports: +7% yr +14% Leisure travel Business services1 +8% Transportation Business travel
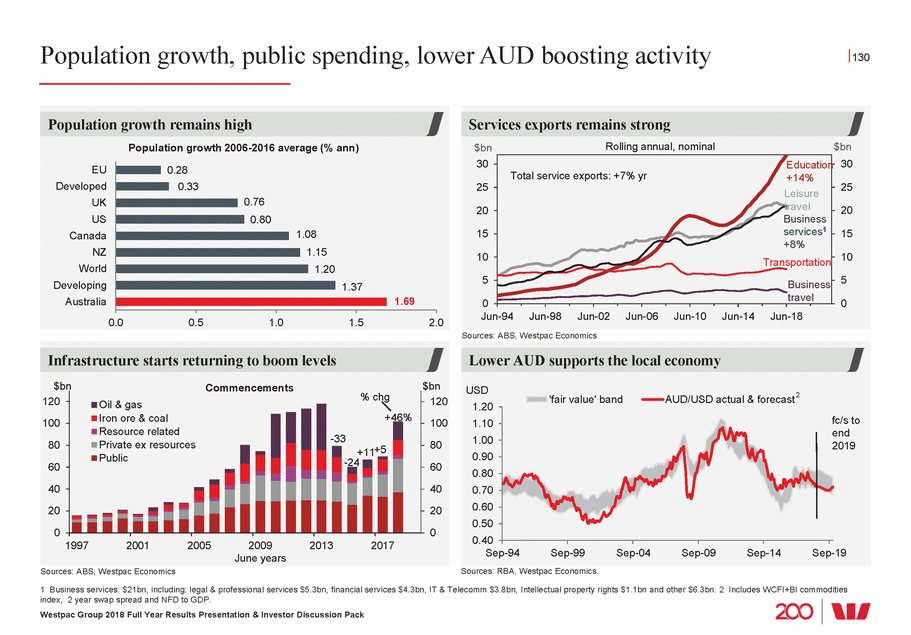
Housing slowdown and wages are headwinds 131 (‘000 change in employment over the last 2 years) Sources: ABS, Westpac Economics. Sources: ABS, Westpac Economics. 5 5 30 -10 Sources: CoreLogic, ABS, Westpac Economics Sources: ABS, Westpac Economics. Westpac Group 2018 Full Year Results Presentation & Investor Discussion Pack Cooling housing market 30 %ann prices new dwelling investment %ann 50 20 40 10 20 0 10 0 -10 -20 -20 -30 -30 Feb-09 Jun-10 Oct-11 Feb-13 Jun-14 Oct-15 Feb-17 Jun-18 Oct-19 turnover Forecast Election uncertainty Australian employment % % 4 4 3 3 2 2 1 1 0 0 -1 -1 -2 -2 Sep-12 Sep-13 Sep-14 Sep-15 Sep-16 Sep-17 Sep-18 6mth annualised pace Jul ‘16 Sep ‘13 election election Jobs are being created… Employment by major sector: Australia education & health production construction white collar retail & wholesale leisure & hospitality 0 50 100 150 200 250 …but Australian wage inflation remains low %yr Australian wage inflation (%, yr) 8 7 6 5 4 3 2 1 0 Jun-98 Jun-00 Jun-02 Jun-04 Jun-06 Jun-08 Jun-10 Jun-12 Jun-14 Jun-16 Jun-18 Aus private sector wages Mining industry wages
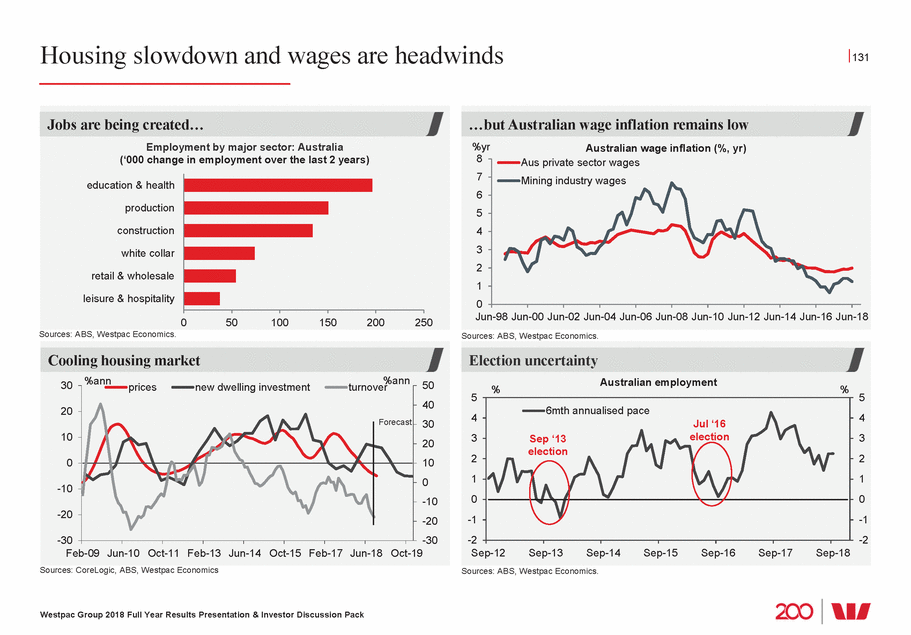
The Australian housing market has cooled 132 Dwelling prices cooling Change in Australian dwelling prices (annual %) ann% ann% 25 30 25 20 25 25 20 15 15 10 10 5 5 0 0 Sources: CoreLogic, Westpac Economics. -5 -5 -10 -10 Oct-10 Oct-12 Oct-14 Oct-16 Oct-18 Sources: CoreLogic, Westpac Economics. Dwelling prices are all dwellings, 6mth annualised growth. 30 30 Capital city % Change last 3mths (Oct-18) % Change YoY (Oct-18) Avg since 2007 Pop’n Sydney 4.8m Down 2.0% Down 7.4% Up 5.1% Melbourne 4.5m Down 2.1% Down 4.7% Up 4.8% Brisbane 2.3m Flat Up 0.4% Up 0.9% Perth 1.9m Down 2.0% Down 3.3% Down 0.8% Sources: CoreLogic, Westpac Economics. Sources: ABS, CoreLogic, Westpac Economics. Westpac Group 2018 Full Year Results Presentation & Investor Discussion Pack Unit pricing vs. detached house pricing Dwelling prices by property type % (%, 3month annualised, seasonally adjusted by Westpac) % 40 40 35 35 25 25 20 20 15 15 10 10 5 5 0 0 -5 -5 -10 -10 -15 -15 Oct-10 Oct-12 Oct-14 Oct-16 Oct-18 Houses Units macro-prudential tightening Sydney Melbourne Brisbane Perth Price decline felt most in the top 25% of house prices Dwelling prices by property value ann % (annual %, all dwellings, seasonally adjusted by Westpac) ann % 40 40 35 35 30 30 20 20 15 15 10 10 5 5 0 0 -5 -5 -10 -10 -15 -15 Oct-10 Oct-12 Oct-14 Oct-16 Oct-18 Top 25% Middle 50% Bottom 25% macro-prudential tightening
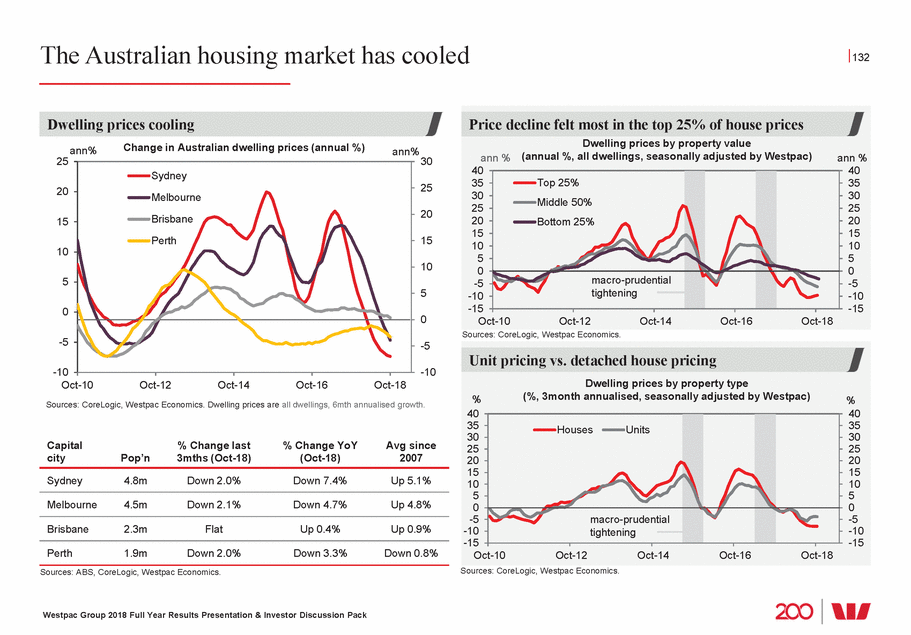
Physical supply/demand fundamentals remain supportive across wider market 133 Population Total increase in dwellings 450 450 350 350 200 200 100 100 2.1 Sources: ABS, Westpac Economics. Dwelling stock is net of demolitions – implied by Census data. Sources: REIA, Westpac Economics 2.4 2.4 2.0 2.0 Mar-92 Mar-96 Mar-00 Mar-04 Mar-08 Mar-12 Mar-16 Mar-20 Sources: ABS, RBA, Westpac Economics. Source: ABS, Westpac Economics Westpac Group 2018 Full Year Results Presentation & Investor Discussion Pack Population growth remains high in Australia % ann % ann Population growth 1.6 1.6 1.2 1.2 0.8 0.8 0.4 0.4 0.0 0.0 Peak, 2008 Average from 2010 = 1.6% Average to 2004 =1.1% Dwelling approvals down from 2016 highs Dwelling approvals (‘000 month, annualised) Private approvals Trend SA 240 240 200 200 160 160 120 120 80 80 Sep-98 Sep-02 Sep-06 Sep-10 Sep-14 Sep-18 RBA easing cycles Dwelling supply has not kept pace with stronger demand ‘000 Population versus dwelling stock (annual average change ‘000) ‘000 400 400 300 300 250 250 150 150 50 50 0 0 1950s 1960s 1970s 1980s 1990s 2000s Last 6yrs Next 4yrs high rise Rental vacancy rates remain low in Sydney and Melbourne % Rental vacancy rates (%, quarterly, seasonally adjusted by Westpac) 8 Sydney Brisbane 7 6 5 5.0 4 3 2.5 2 2.4 1 0 Jun-88 Jun-93 Jun-98 Jun-03 Jun-08 Jun-13 Jun-18 Melbourne Perth National average since 1980
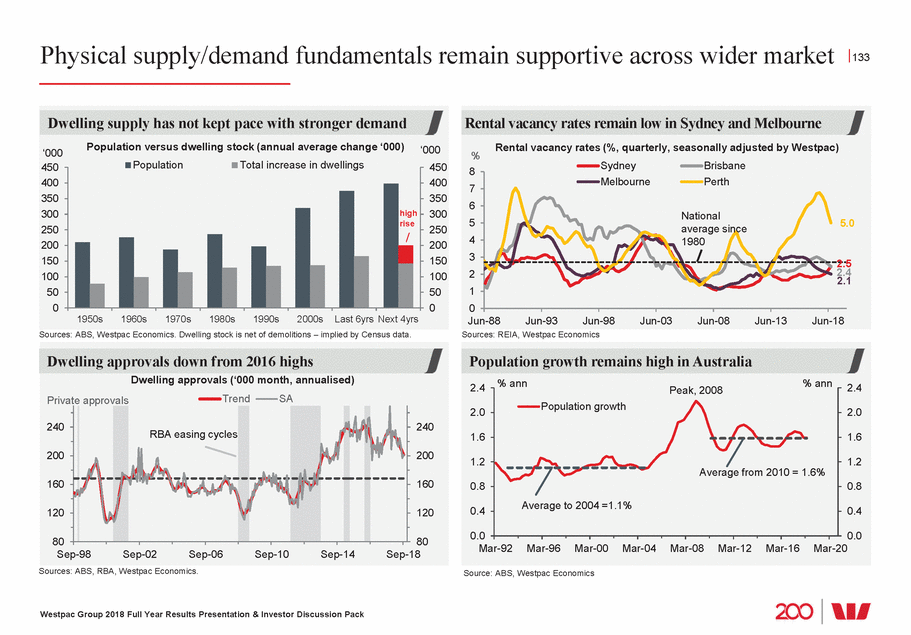
Impact of macro-prudential measures across Australian industry 134 % 16 5.90 0 Source: APRA, RBA, Westpac Economics Sources: RBA, Westpac Economics. % flow limit 3 Sources: ABS, APRA, RBA, Westpac Economics. Sources: ABS, APRA, RBA, Westpac Economics Westpac Group 2018 Full Year Results Presentation & Investor Discussion Pack Lower flow of interest only loans Interest only housing loans 60 50 40 30 20 10 0 Mar-09 Mar-11 Mar-13 Mar-15 Mar-17 Mar-19 Outstanding loans 10% investor APRA 30% New loans credit growth limit interest only new 28.8 16.6 Lower new flow of 90%+ LVR loans % High LVR housing loans 25 20 15 10 6.5 5 0 Mar-09 Mar-11 Mar-13 Mar-15 Mar-17 80-90% 90%+ 13. Change in composition of housing credit Australian housing credit growth (6mth % change annualised) Total 10% limit on investment 30% limit on interest Investor 12 8 6.7 4 4.6 0.8 Sep-12 Sep-13 Sep-14 Sep-15 Sep-16 Sep-17 Sep-18 property annual portfolio growth only originations Owner-occupier Introduction of differentiated mortgage pricing % Mortgage interest rates (major bank average) 7.5 7.0 6.5 6.0 5.5 5.0 Oct-13 Oct-14 Oct-15 Oct-16 Oct-17 Oct-18 Own-occ. - principal and interest Own-occ. - interest only Investor - principal and interest Investor - interest only 6.35 5.90 5.20
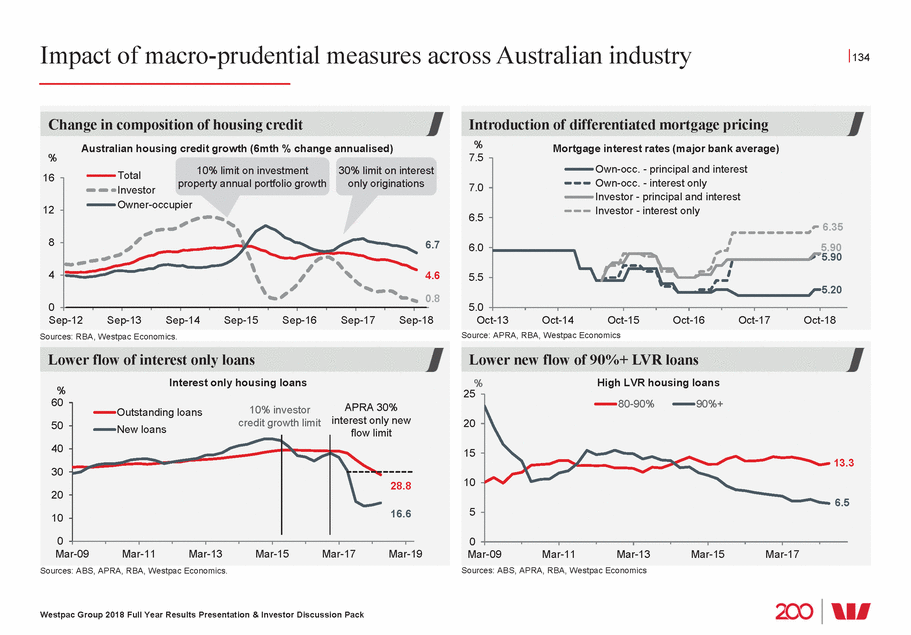
Australian household balance sheets 135 (% income required to service mortgage of 75% median dwelling, all regions) 40 higher 100 60 rtgage offset s –16pts Sep-83 Sep-88 Sep-93 Sep-98 Sep-03 Sep-08 Sep-13 Sep-18 Sources: ABS, RBA, Westpac Economics Sources: RBA, Westpac Economics. Housing credit in 6 month % change annualised. 1400 1200 600 Sources: ABS, RBA, Westpac Economics. Sources: ABS, RBA, Westpac Economics. Westpac Group 2018 Full Year Results Presentation & Investor Discussion Pack Higher income households have increased borrowings % Australian household debt-to-income ratios by income quintile (%) 250 200 150 100 50 0 1st 2nd 3rd 4th 5th 2002 2006 2010 2014 Australian household net wealth has also increased % Annual household disposable income % Total assets Jun-07 Since Jun-07: % +120pts 1200 1000 1000 800 800 600 400 400 200 200 0 0 Jun-83 Jun-88 Jun-93 Jun-98 Jun-03 Jun-08 Jun-13 Jun-18 Jun-23 Total liabilities Total net worth +90pts +30pts Affordability on repayment basis around long run average Housing affordability: all dwellings % 35 30 25 20 15 10 Deteriorate If mortgage rate was 1% Improve 10yr avg long run avg Australian households debt to income ratio remains high Australian households debt to income ratio (%) Total (gross) debt Forecasts 200 180 160 et of all 140 its also 120 funds held 80 40 since peak 20 1988 0 -20 -40 Jun-88 Jun-93 Jun-98 Jun-03 Jun-08 Jun-13 Jun-18 Total debt net of offset accounts end 2019 Total debt net of all deposits* Debt n Trend since Jun-07 depos excludes in mo account * Westpac Economics estimates prior to
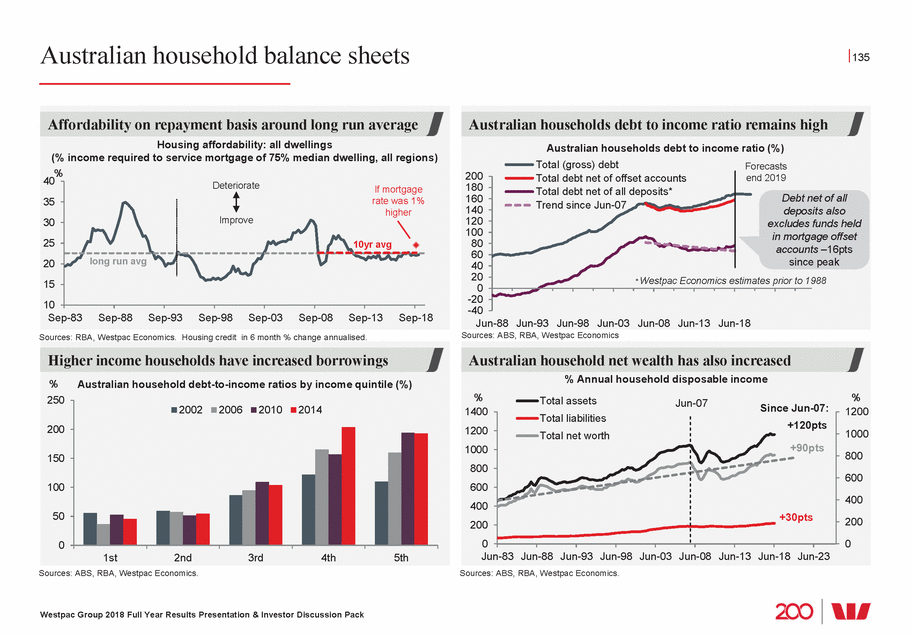
Australia’s high rise apartment market – past the peak although supply still coming online 136 Population Total increase in dwellings 450 450 300 300 200 200 Source: RBA, CoreLogic. Sources: REIA, Westpac Economics. Dwelling stock is net of demolitions – implied by Census data. ‘000s ‘000s Non-high rise Other high rise High rise top 5 areas Sources: ABS, Westpac Economics 1 Estimated proportion of approved dwellings completed by months after approval. Note that not all approved dwellings are completed, reflecting both cancellations and reductions in project size. Also, ‘high rise’ projects often have significant delays between approval and commencement. Westpac Group 2018 Full Year Results Presentation & Investor Discussion Pack Projected dwelling completions, major metro areas Dwelling completions by capital city (‘000s, rolling 6mth totals) 35 35 30 30 25 25 20 20 15 15 10 10 5 5 0 0 Jun-07 Jun-13 Jun-19 Jun-07 Jun-13 Jun-19 Jun-07 Jun-13 Jun-19 Sydney Melbourne Brisbane/SEQ Projected 10% Projected 10% 18% 71% Projected 8% 17% 76% 41% 49% Aggregate supply/demand fundamentals remain positive ‘000 Population versus dwelling stock (annual average change ‘000) ‘000 400 400 350 350 250 250 150 150 100 100 50 50 0 0 1950s 1960s 1970s 1980s 1990s 2000s last 6 yrs next 4yrs high rise Dwelling construction: indicative completion times1 % % 100 100 90 90 80 80 70 70 60 60 50 50 40 40 30 30 20 20 10 10 0 0 0 12 24 36 48 60 Detached houses Low-mid rise High rise Average construction time for ‘high rise’ about 2-2½yrs
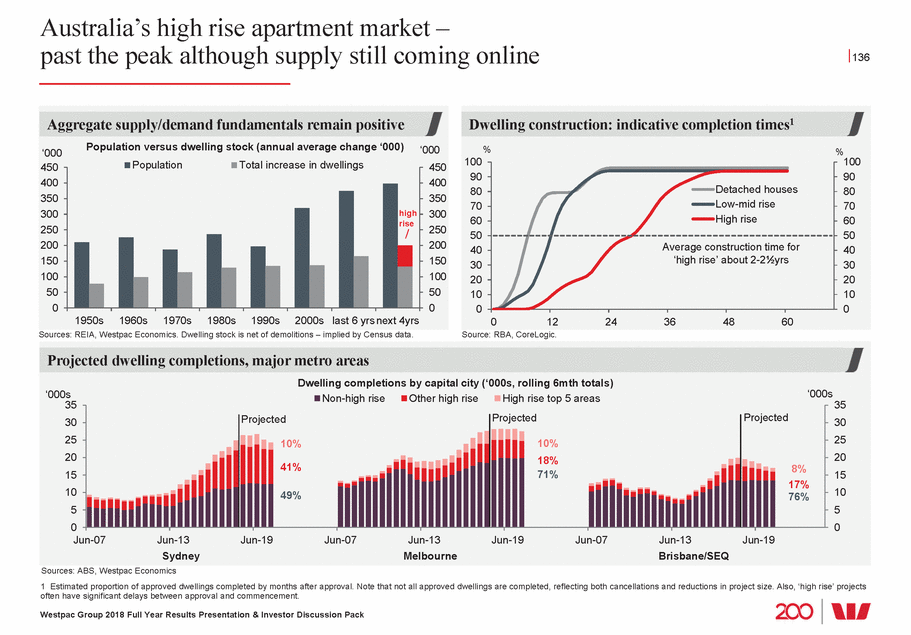
The New Zealand economy 137 Regional GDP - 2017, nominal $NZ Total nominal GDP 2017: $280bn Population 4.9 mil Northland, $7bn 4% of population Auckland, $101bn 35% of population Bay of Plenty, $14bn 6% of population Waikato, $23bn 10% of population Taranaki, Whanganui/Manawatu, $10bn 7% of population Tasman/Nelson, $5bn 2% of population Gisborne/Hawke’s Bay, $9bn 4% of population Wellington, $36bn 11% of population Marlborough, $3bn 1% of population West Coast, $2bn 1% of population Southland, $6n 2% of population Canterbury, $35bn 13% of population Otago, $12bn 5% of population Sources: Stats NZ, Westpac Economics.. Sources: Stats NZ, Westpac Economics Westpac Group 2018 Full Year Results Presentation & Investor Discussion Pack NZ output and employment Output 2018 - sector contribution to GDP (%) Primary 9 7 3 Electricity, gas and water Construction 11 Food manufacturing 4 7 Manufacturing (excl. food) Wholesale, retail and accommodation 12 Transport Financial and professional services 32 5 Public administration Social services (incl. health) Other NZ employment by sector 2018 (%) 2 4 Primary 16 8 Construction 10 Manufacturing Wholesale, retail and accommodation 17 Transport 21 Financial and professional services 17 4 Public administration Social services (incl. health) Other
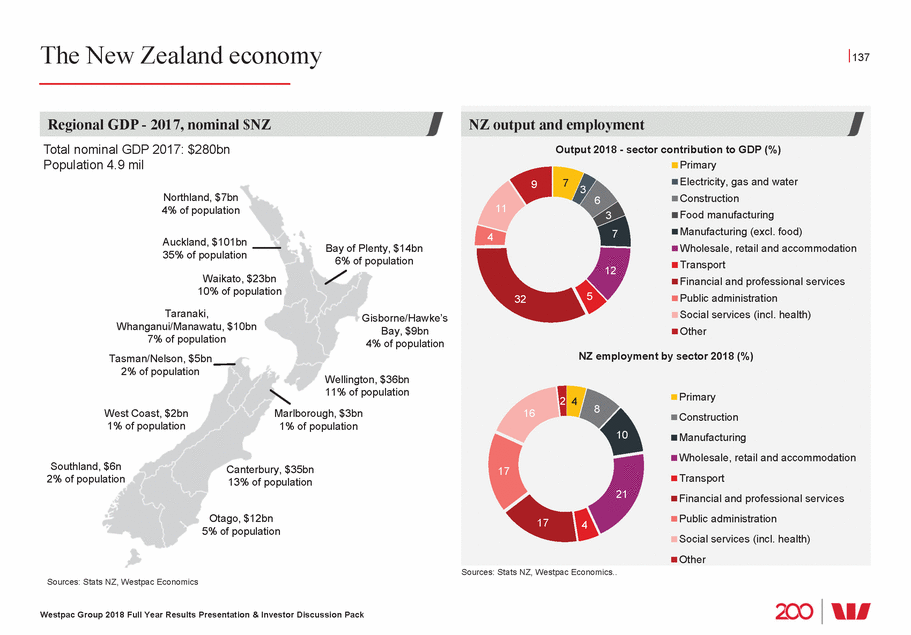
New Zealand economic snapshot – growth has taken a step down 138 New Zealand economy key statistics (latest available as at October 2018) GDP Westpac Economics Forecast (end calendar 2019) 2.7% 3.1% Unemployment Rate Westpac Economics Forecast (end calendar 2019) 4.5% 4.6% Source: Stats NZ, Westpac Economics Source: Stats NZ, Westpac Economics Inflation Westpac Economics Forecast (end calendar 2019) 1.9% 1.4% Total Cash Rate Westpac Economics Forecast (end calendar 2019) 1.75% 1.75% NZD/USD Westpac Economics Forecast (end calendar 2019) US$0.651 US$0.65 Source: Westpac Economics estimates Source: Stats NZ, Westpac Economics 1 Exchange rate as at 31 October 2018. Westpac Group 2018 Full Year Results Presentation & Investor Discussion Pack Migration cycle has started to turn down Net migration (annual ‘000s) 000s 000s 75 75 50 50 25 25 0 0 -25 -25 -50 -50 2000 2004 2008 2012 2016 2020 New Zealanders Forecast Other Large pipeline of construction work $bn Construction spending (annual $bn) $bn 40 40 30 30 20 20 10 10 0 0 2005 2008 2011 2014 2017 2020 2023 Kaikoura earthquake costs Canterbury rebuild Construction (excl. quake costs) For ecast GDP holding firm % GDP (%) % 6 6 4 4 2 2 0 0 -2 -2 2005 2007 2009 2011 2013 2015 2017 2019 Qtr % chg Annual average % change Spending to slow as housing cools % House prices and household spending % 30 6 25 5 20 4 15 3 10 2 5 1 0 0 -5 -1 -10 -2 -15 -3 -20 -4 -25 -5 2000 2003 2006 2009 2012 2015 2018 2021 House price inflation (left axis) Per capita household spending (right axis) Forecast
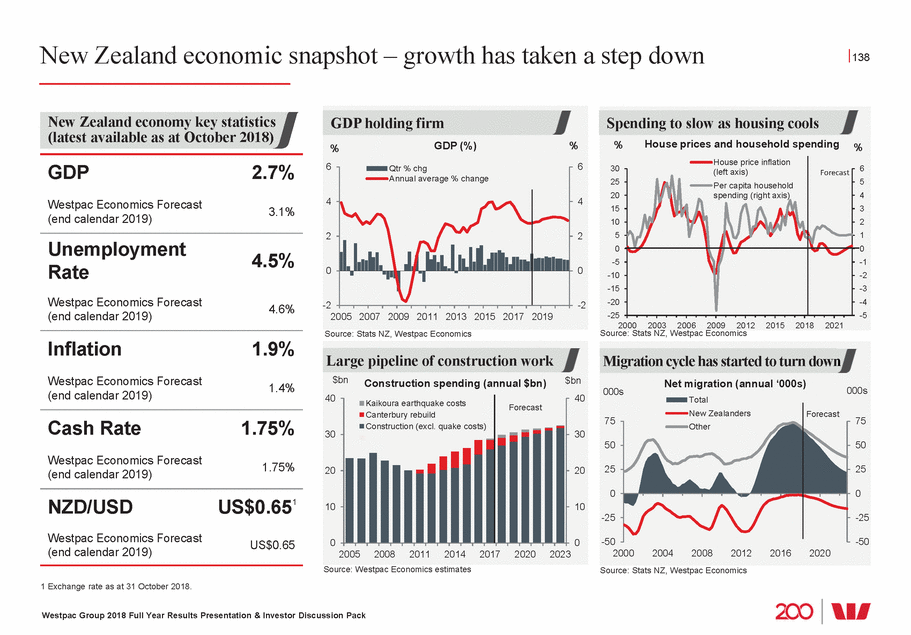
New Zealand economic indicators 139 500 Source: ANZ, Westpac Economics Source: Stats NZ, Westpac Economics Kg Ms Forecast 9 8 9 8 5 5 Source: Fonterra, Westpac Economics Source: RBNZ, Westpac Economics Westpac Group 2018 Full Year Results Presentation & Investor Discussion Pack 2002/03 2003/04 2004/05 2005/06 2006/07 2007/08 2008/09 2009/10 2010/11 2011/12 2012/13 2013/14 2014/15 2015/16 2016/17 2017/18 2018/19 RBNZ on hold, overseas trends to push term rates higher % Interest rates (%) % 10 10 2 year swap rate 7 7 6 6 4 4 3 3 2 2 1 1 2001 2005 2009 2013 2017 2021 90 day bank bill rate Forecast 5 year swap rate Payout to dairy farmers at average levels Dairy payout and dividend ($/Kg Ms) Milk price Dividend $10 $8 $6 $4 $2 $0 Inflation off its lows, boosted by oil prices % Inflation (%) % 6 6 5 5 4 4 3 3 2 2 1 1 0 0 2007 2009 2011 2013 2015 2017 2019 CPI inflation Forecast CPI excluding petrol Export prices remain favourable NZ export commodity price index (world prices) Index Meat,skins & wool Forestry Dairy 450 400 350 300 250 200 150 100 50 2006 2008 2010 2012 2014 2016 2018
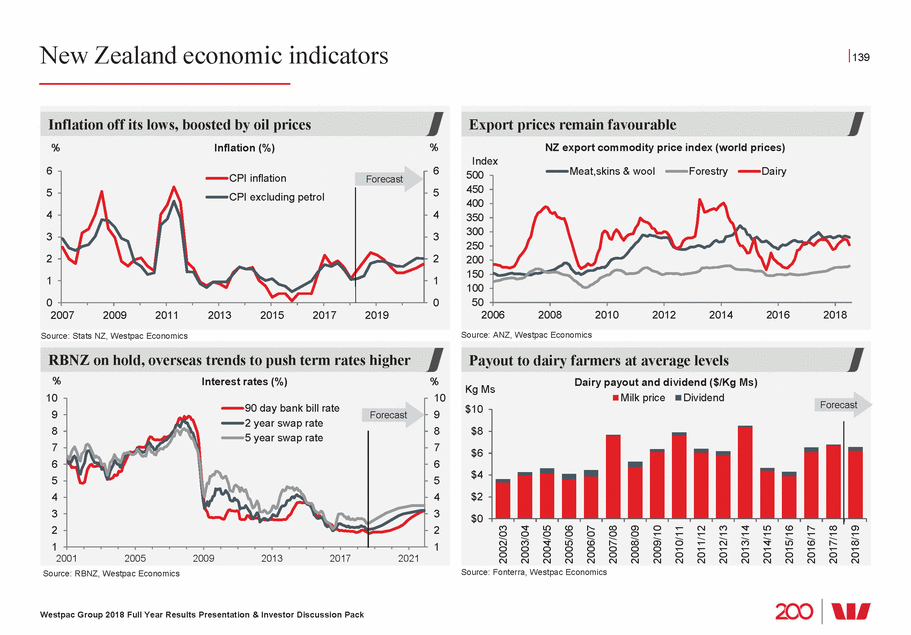
New Zealand housing market expected to be dampened by policy changes 140 Source: REINZ Source: REINZ Investors below 70% LVR Investors above 70% LVR 50 Source: RBNZ Source: REINZ, RBNZ, Westpac Economics Westpac Group 2018 Full Year Results Presentation & Investor Discussion Pack Index = 100 in 2008 Index = 100 in 2008 Macroprudential policies have eased… % Investors’ share of new mortgage lending (%) 40 30 20 10 0 Aug-14 Feb-15 Aug-15 Feb-16 Aug-16 Feb-17 Aug-17 Feb-18 Aug-18 LVRs tightened LVRs tightened LVRs eased …further easing likely if property market slows further % New Zealand house debt statistics % 20 (% of households’ disposable incomes) 175 15 150 10 125 5 100 0 75 2000 2002 2004 2006 2008 2010 2012 2014 2016 2018 Spending on debt servicing Household liabilities (right axis) Policy changes have softened housing demand… New Zealand house prices by region (index) 220 220 200 200 180 180 160 160 140 140 120 120 100 100 80 80 Jan-08 Jan-10 Jan-12 Jan-14 Jan-16 Jan-18 NZ ex Auckland and Canterbury Auckland Canterbury …and a period of subdued prices is expected New Zealand house prices (nationwide, %) 20 Forecast 20 15 15 10 10 5 5 0 0 -5 -5 -10 -10 -15 -15 2008 2010 2012 2014 2016 2018 2020

Appendix and Disclaimer

Appendix 1: Cash earnings adjustments Appendix and Disclaimer 142 2H17 $m 1H18 $m 2H18 $m Cash earnings adjustment Description Reported net profit 4,083 4,198 3,897 Net profit attributable to owners of Westpac Banking Corporation Identifiable intangible assets arising from business acquisitions are amortised over their useful lives, ranging between four and twenty years. This amortisation (excluding capitalised software) is a cash earnings adjustment because it is a non-cash flow item and does not affect cash distributions available to shareholders. The last of these intangible assets were fully amortised in December 2017 Amortisation of intangible assets 64 17 - Fair value on economic hedges (which do not qualify for hedge accounting under AAS) comprise: • The unrealised fair value (gain)/loss on foreign exchange hedges of future New Zealand earnings impacting non-interest income is reversed in deriving cash earnings as they may create a material timing difference on reported results but do not affect the Group’s cash earnings over the life of the hedge; and The unrealised fair value (gain)/loss on hedges of accrual accounted term funding transactions are reversed in deriving cash earnings as they may create a material timing difference on reported results but do not affect the Fair value (gain)/loss on economic hedges 62 37 (163) • Group’s cash earnings over the life of the hedge The unrealised (gain)/loss on ineffective hedges is reversed in deriving cash earnings because the gain or loss arising from the fair value movement in these hedges reverses over time and does not affect the Group’s profits over time Ineffective hedges 20 9 4 The Group recognised a gain, net of costs, associated with the partial sale of shares in Pendal Group Limited in Full Year 2017. In Full Year 2018, the Group marked to market its current holding of Pendal shares. Consistent with prior years these items have been treated as a cash earnings adjustment given its size and that it does not reflect ongoing operations. The Group has indicated that it may sell the remaining 10% shareholding in Pendal Group Limited at some future date. Any future gain or loss on this shareholding will similarly be excluded from the calculation of cash earnings Adjustments related to Pendal Group (formerly BTIM) (171) - 73 Under AAS, Westpac shares held by the Group in the managed funds and life businesses are deemed to be Treasury shares and the results of holding these shares can not be recognised in the reported results. In deriving cash earnings, these results are included to ensure there is no asymmetrical impact on the Group’s profits because the Treasury shares support policyholder liabilities and equity derivative transactions which are re-valued in determining income Treasury shares (13) (10) 3 Cash earnings 4,045 4,251 3,814 Westpac Group 2018 Full Year Results Presentation & Investor Discussion Pack
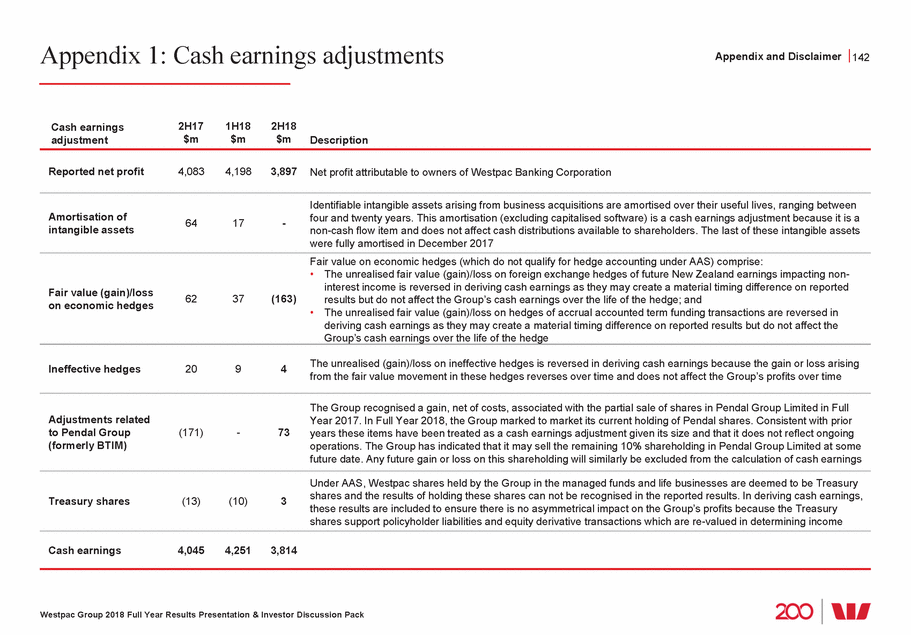
Appendix 2: Sustainability Appendix and Disclaimer 143 Bloomberg Gender Equality Index Network on Disability’s Inaugural at the 2017 Women in Finance 1 As at 30 September 2018. 2 Copyright ©2018 Sustainalytics Westpac Group 2018 Full Year Results Presentation & Investor Discussion Pack Inclusion and diversity recognition1 Included in the 2018 #1 Bank in Top 10 Australian Access and Inclusion Index Employer of Choice by The Workplace Gender Equality Agency for the 8th consecutive year Awarded Employer of the Year Awards Received highest accolade of Platinum status in the Australian Workplace Equality Index Awards in May 2018 Sustainability indexes1 A world leader and member of DJSI World, DJSI Asia Pacific, and DJSI Australia Indexes Leader score among peer group2 Member of the FTSE4Good Index, of which Westpac has been a member for over 10 years, announced in August 2018 Member of the MSCI Global ESG Leaders index Member of the STOXX 2017/2018 Global ESG Leaders Indices for the fifth consecutive year Industry awards1 Awarded Gold Class ranking in RobecoSAM’s 2018 Sustainability Yearbook Achieved highest “Leading” rating for the tenth consecutive year for disclosure of sustainability risks in 2017 Recognised in the 2017 CDP to achieve Leadership level for our response to climate change, announced in October 2017 Reconfirmed as a constituent of the Ethibel Sustainability Index (ESI) Excellence Global, announced September 2018 Achieved the highest QualityScore of 1 for the inaugural ESG survey by ISS in 2018
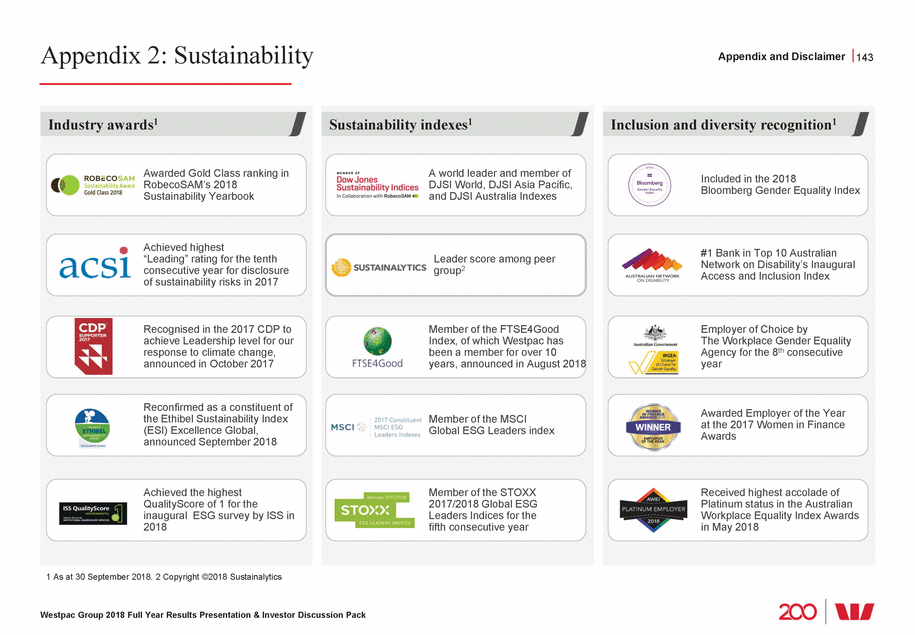
Appendix 2: Sustainability Appendix and Disclaimer 144 Force on Climate-related Financial Align with and support Principles for Responsible Banking the Draft Principles for Responsible Banking Supporter (2015) Finance Initiative Founding Adopter, Network Australia Founding Member Global Investor Coalition The Montreal Carbon Pledge Responsible Investment Banking Environment Initiative Signatory (2014) (for social enterprises) (for Indigenous owned businesses) (for women owned businesses) Since 2012 1 As at 30 September 2018. Westpac Group 2018 Full Year Results Presentation & Investor Discussion Pack Key commitments and partnerships1 Financial Stability Board’s Task Part of core group of 28 banks developing Paris Climate Agreement Disclosures The Equator Principles UN Environment Program UN Sustainable Development Goals United Nations Global Compact First Australian Bank (2003) Founding Member (1991) CEO Statement of Commitment (2015) Signatory (2002), Global Compact Principles for Founding signatory (since 2012) Signatory (2007) Statement on Climate Change Signatory (2014) Climate Bonds Initiative Carbon Markets Institute We Mean Business Coalition Climate Action 100+ Partner Corporate Member Signatory (2015) Signatory (2018) Carbon Neutral Certification Supply Nation WeConnect International Social Traders Founding member (since 2016) (since 2014) Member of Connect (since 2016)
Appendix 3: Definitions – Divisions Appendix and Disclaimer 145 Consumer Bank (CB) is responsible for sales and service to consumer customers in Australia under the Westpac, St.George, BankSA, Bank of Melbourne and RAMS brands. Activities are conducted through a dedicated team of specialist consumer relationship managers along with an extensive network of branches, call centres and ATMs. Customers are also supported by a range of internet and mobile banking solutions. CB also works in an integrated way with Business Bank, BTFG and WIB in the sales and service of certain financial services and products including in wealth and foreign exchange. The revenue from these products is mostly retained by the product originator Westpac Institutional Bank (WIB) delivers a broad range of financial products and services to commercial, corporate, institutional and government customers with connections to Australia and New Zealand. WIB operates through dedicated industry relationship and specialist product teams, with expert knowledge in financing, transactional banking, and financial and debt capital markets. Customers are supported throughout Australia as well as via branches and subsidiaries located in New Zealand, the US, UK and Asia. WIB is also responsible for Westpac Pacific currently providing a range of banking services in Fiji and PNG. WIB works in an integrated way with all the Group’s divisions in the provision of more complex financial needs including across foreign exchange and fixed interest solutions Consumer Bank WIB Business Bank (BB) is responsible for sales and service to SME and commercial business customers in Australia for facilities up to approximately $150 million. The division operates under the Westpac, St.George, BankSA and Bank of Melbourne brands. Customers are provided with a wide range of banking and financial products and services to support their borrowing, payments and transaction needs. In addition, specialist services are provided for cash flow finance, trade finance, automotive and equipment finance, and property finance. The division is also responsible for consumer customers with auto finance loans. BB works in an integrated way with Consumer Bank, BTFG and WIB in the sales and service of select financial services and products including corporate superannuation, foreign exchange and interest rate hedging. The revenue from these products is mostly retained by the product originator Westpac New Zealand is responsible for sales and service of banking, wealth and insurance products for consumers, business and institutional customers in New Zealand. Westpac conducts its New Zealand banking business through two banks in New Zealand: Westpac New Zealand Limited, which is incorporated in New Zealand and Westpac Banking Corporation (New Zealand Branch), which is incorporated in Australia. Westpac New Zealand operates via an extensive network of branches and ATMs across both the North and South Islands. Business and institutional customers are also served through relationship and specialist product teams. Banking products are provided under the Westpac brand while insurance and wealth products are provided under Westpac Life and BT brands, respectively. New Zealand also maintains its own infrastructure, including technology, operations and treasury Business Bank Westpac NZ BT Financial Group (Australia) (BTFG) is the Australian wealth management and insurance arm of the Westpac Group providing a broad range of associated services. BTFG’s funds management operations include the manufacturing and distribution of investment, superannuation and retirement products, wealth administration platforms, private wealth, margin lending and equities broking. BTFG’s insurance business covers the manufacturing and distribution of life, general and lenders mortgage insurance. The division also uses third parties to manufacture certain general insurance products. In managing risk across all insurance classes the division reinsures certain risks using external providers. In addition to the BT brand, BTFG operates a range of financial service brands along with the banking brands of Westpac, St.George, Bank of Melbourne and BankSA for Private Wealth and Insurance. This segment provides centralised Group functions including Treasury, Technology and Core Support (finance, human resources etc.). Costs are partially allocated to other divisions in the Group, with costs attributed to enterprise activity retained in Group Businesses. This segment also reflects Group items including: earnings on capital not allocated to divisions, earnings from non-core asset sales, earnings and costs associated with the Group’s fintech investments and certain other head office items such as centrally raised provisions BTFG Group Businesses or GBU Westpac Group 2018 Full Year Results Presentation & Investor Discussion Pack
Appendix 3: Definitions – Credit quality Appendix and Disclaimer 146 Includes facilities where: Includes exposures that have deteriorated to the point where full collection of interest and principal is in doubt, based on an assessment of the customer’s outlook, cashflow, and the net realisation of value of assets to which recourse is held and includes: • contractual payments of interest and / or principal are 90 or more calendar days overdue, including overdrafts or other revolving facilities that remain continuously outside approved limits by material amounts for 90 or more calendar days (including accounts for customers who have been granted hardship assistance); or an order has been sought for the customer’s bankruptcy or similar legal action has been instituted which may avoid or delay repayment of its credit obligations; and the estimated net realisable value of assets / security to which Westpac has recourse is sufficient to cover repayment of all principal and interest, or where there are otherwise reasonable grounds to expect payment in full and interest is being taken to profit on an accrual basis. • facilities 90 days or more past due, and full recovery is in doubt: exposures where contractual payments are 90 or more days in arrears and the net realisable value of assets to which recourse is held may not be sufficient to allow full collection of interest and principal, including overdrafts or other revolving facilities that remain continuously outside approved limits by material amounts for 90 or more calendar days; non-accrual assets: exposures with individually assessed impairment provisions held against them, excluding restructured loans; restructured assets: exposures where the original contractual terms have been formally modified to provide for concessions of interest or principal for reasons related to the financial difficulties of the customer; other assets acquired through security enforcement (includes other real estate owned): includes the value of any other assets acquired as full or partial settlement of outstanding obligations through the enforcement of security arrangements; and any other assets where the full collection of interest and principal is in doubt 90 days past due and not impaired • • Impaired assets • • These facilities, while in default, are not treated as impaired for accounting purposes • Loans not found to be individually impaired or significant will be collectively assessed in pools of similar assets with similar risk characteristics. The size of the provision is an estimate of the losses already incurred and will be estimated on the basis of historical loss experience for assets with credit characteristics similar to those in the collective pool. The historical loss experience will be adjusted based on current observable data. Included in the collectively assessed provision is an economic overlay provision which is calculated based on changes that occurred in sectors of the economy or in the economy as a whole • Collectively assessed provisions (CAP) Watchlist and substandard, 90 days past due and not impaired and impaired assets Stressed assets Represents the sum of the committed portion of direct lending (including funds placement overall and deposits placed), contingent and pre-settlement risk plus the committed portion of secondary market trading and Total committed exposures (TCE) Provisions raised for losses that have already been incurred on loans that are known to be impaired and are assessed on an individual basis. The estimated losses on these impaired loans is based on expected future cash flows discounted to their present value and, as this discount unwinds, interest will be recognised in the income statement underwriting risk Individually assessed provisions or IAPs Watchlist and substandard Loan facilities where customers are experiencing operating weakness and financial difficulty but are not expected to incur loss of interest or principal Westpac Group 2018 Full Year Results Presentation & Investor Discussion Pack
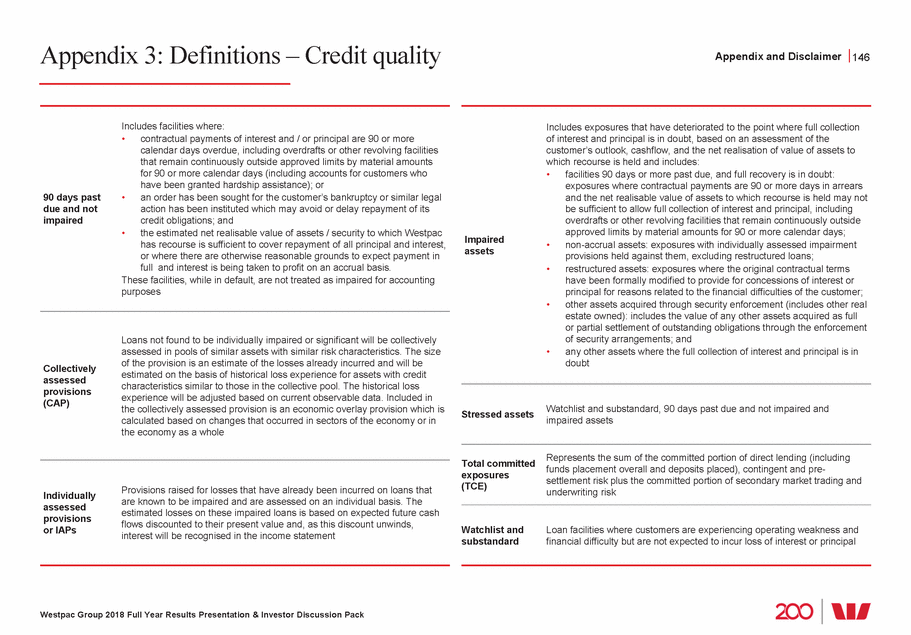
Appendix 3: Definitions – Earnings, capital and liquidity Appendix and Disclaimer 147 As defined by APRA (unless stated otherwise). Tier 1 capital divided by ‘exposure measure’ and expressed as a percentage. ‘Exposure measure’ is the sum of on-balance sheet exposures, derivative exposures, securities financing transaction exposures and other off-balance sheet exposures Average interest-earning assets (AIEA) The average balance of assets held by the Group that generate interest income. Where possible, daily balances are used to calculate the average balance for the period Leverage ratio Cash earnings divided by the weighted average ordinary shares (cash earnings basis) Cash earnings per ordinary share Assets (both on and off-balance sheet) are risk weighted according to each asset’s inherent potential for default and what the likely losses would be in case of default. In the case of non-asset-backed risks (ie. market and operational risk), RWA is determined by multiplying the capital requirements for those risks by 12.5 Risk weighted assets or RWA Core earnings Net operating income less operating expenses Full-time equivalent employees (FTE) A calculation based on the number of hours worked by full and part-time employees as part of their normal duties. The full-time equivalent of one FTE is 76 hours paid work per fortnight Committed liquidity facility (CLF) The RBA makes available to Australian Authorised Deposit-taking Institutions a CLF that, subject to qualifying conditions, can be accessed to meet LCR requirements under APS210 Liquidity Net interest margin (NIM) Calculated by dividing net interest income by average interest-earning assets High quality liquid assets (HQLA) Net tangible assets (total equity less goodwill and other intangible assets Assets which meet APRA’s criteria for inclusion as HQLA in the numerator of the LCR Net tangible assets less minority interests) divided by the number of ordinary shares on issue per ordinary share (reported) An APRA requirement to maintain an adequate level of unencumbered high quality liquid assets, to meet liquidity needs for a 30 calendar day period under an APRA-defined severe stress scenario. Absent a situation of financial stress, the value of the LCR must not be less than 100%, effective 1 January 2015. LCR is calculated as the percentage ratio of stock of HQLA and CLF over the total net cash out-flows in a modelled 30 day defined stressed scenario Weighted average ordinary shares (cash earnings) Weighted average number of fully paid ordinary shares listed on the ASX for the relevant period Liquidity coverage ratio (LCR) As defined by APRA (unless stated otherwise) Capital ratios The NSFR is defined as the ratio of the amount of available stable funding (ASF) to the amount of required stable funding (RSF) defined by APRA. The amount of ASF is the portion of an ADI’s capital and liabilities expected to be a reliable source of funds over a one year time horizon. The amount of RSF is a function of the liquidity characteristics and residual maturities of an ADI’s assets and off-balance sheet activities. ADI’s must maintain an NSFR of at least 100% Internationally comparable regulatory capital ratios are Westpac’s estimated ratios after adjusting the capital ratios determined under APRA Basel III regulations for various items. Analysis aligns with the APRA study titled “International capital comparison study” dated 13 July 2015 Net stable funding ratio (NSFR) Internationally comparable ratios Westpac Group 2018 Full Year Results Presentation & Investor Discussion Pack Capital Liquidity Earnings Drivers
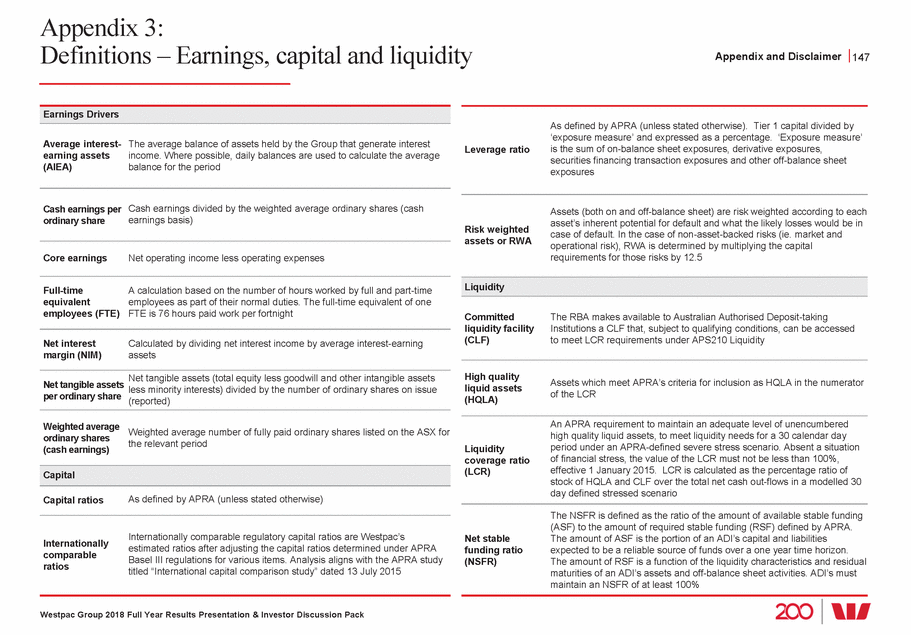
Appendix 3: Definitions – Other Appendix and Disclaimer 148 3 month rolling Retail Market Monitor data (survey conducted by Camorra Research). Main bank customers are asked to rate the overall level of service they receive from their main bank on a scale of 1 (poor) to 5 (excellent). Results represent the % of customers who rate the service as either 4 (very good) or 5 (excellent), excluding “don’t know” Data based on DBM Consultants, Respondents aged 18+ and 12 month rolling. Wealth penetration is defined as the proportion of Australians who have a Deposit Product, Lending Product or Credit/Debit Card with a Banking Group and also have Managed Funds, Superannuation or Insurance with the same Banking Group. Note: Westpac and St.George use Managed Funds, Superannuation or Insurance with Westpac Group. CSat (Westpac NZ) Australian customers with wealth products metrics provider Westpac includes Westpac and Challenge Bank. St.George includes St.George, BankSA, Bank of Melbourne, RAMS and Dragondirect. Westpac Group includes Westpac, Challenge Bank, St.George, BankSA, Bank of Melbourne, RAMS, Dragondirect, Advance Asset Management, Asgard, Bankers Trust, BT, Rothschild and Sealcorp. Peers includes: ANZ Group, CBA Group and NAB Group. Australian consumer and business customers who have had an authenticated session (including Quickzone) on Westpac Group digital banking platforms in the prior 90 days Digitally active Sales refers to digital sales of consumer core products only. Sales with a completed deposit or activation constitute a quality sale. Includes new American Express credit card sales Digital sales Branch transactions Branch transactions are typically withdrawals, deposits, transfers and payments The Customer Satisfaction score is an average of customer satisfaction ratings of the customer’s main financial institution for consumer or business banking on a scale of 0 to 10 (0 means ‘extremely dissatisfied’ and 10 means ‘extremely satisfied Digital transactions Customer satisfaction or CSat Digital transactions are typically payments and transfers CSat – overall Source: DBM Consultants Business Financial Services Monitor, September MFI share results are based on the number of customers who have a Main Financial Institution (MFI) relationship with an institution, as a proportion of the number of customers that have a MFI relationship with any institution business 2016 – September 2018, 6MMA. MFI customers, all businesses. MFI share CSat – overall consumer Source: DBM Consultants Consumer Atlas, September 2016 – September 2018, 6MMA. MFI customers Consumer MFI share Source: DBM Consultants Consumer Atlas, 6 months to September 2018, MFI customers Source: DBM Consultants Business Financial Services Monitor, September 2016 – September 2018, 6MMA. MFI customers, SME businesses. SME businesses are those organisations with annual turnover under $5 million (excluding Agribusinesses) CSat – SME Westpac Group 2018 Full Year Results Presentation & Investor Discussion Pack
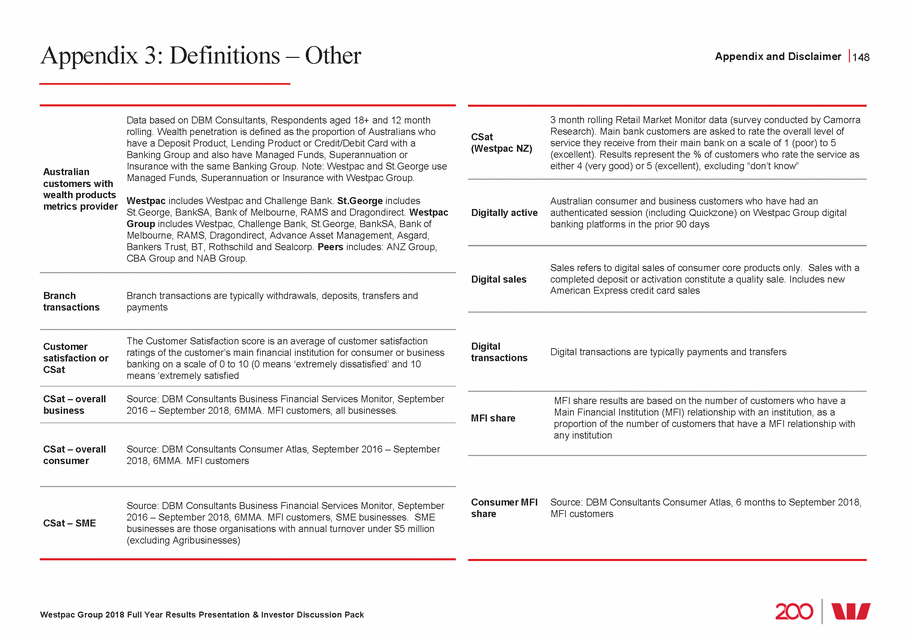
Appendix 3: Definitions – Other Appendix and Disclaimer 149 Source: DBM Consultants Business Financial Services Monitor, 12 months to September 2018, MFI customers, SME businesses. SME businesses are those organisations with annual turnover under $5 million (excluding Agribusinesses) Source: 3 month rolling Retail Market Monitor data (survey conducted by Camorra Research). Respondents are asked about likelihood to recommend their main bank to family and friends on a scale of 1 (extremely unlikely) to 10 (extremely likely). Net Promoter Score is represents % of Promoters (recommend score of 9 or 10) minus % of Detractors (recommend score of 1 to 6) SME MFI share NPS Consumer (Westpac NZ) Source: DBM Consultants Business Financial Services Monitor, 12 months to September 2018, MFI customers, Commercial businesses. Commercial businesses are those organisations with annual turnover $5 million to $100 million (excluding Agribusinesses) Commercial MFI share NPS – overall consumer Source: DBM Consultants Consumer Atlas, September 2016 – September 2018, 6MMA. MFI customers SGB Brands (Consumer): St.George Bank, Bank of Melbourne, BankSA, RAMS, Dragondirect Net Promoter Score measures the net likelihood of recommendation to others of the customer’s main financial institution. Net Promoter ScoreSM is a trademark of Bain & Co Inc., Satmetrix Systems, Inc., and Mr Frederick Reichheld. Using a scale of 0 to 10 (0 means ‘extremely unlikely’ and 10 means ‘extremely likely’), the 0-6 raters (detractors) are deducted from the 9-10 raters (promoters) SGB Brand Net Promoter Score or NPS SGB Brands (Business): St.George Bank, Bank of Melbourne and BankSA 6 month rolling Agri Market Monitor data (survey conducted by Key Research). Respondents are asked about likelihood to recommend their main business bank to business colleagues, friends or family on a scale of 1 (extremely unlikely) to 10 (extremely likely). Net Promoter Score is represents % of Promoters (recommend score of 9 or 10) minus % of Detractors (recommend score of 1 to 6) Westpac Group rank The ranking refers to Westpac Group’s position relative to the other three major Australian banking groups (ANZ Group, CBA Group and NAB Group) NPS Agri (Westpac NZ) Women in Leadership refers to the proportion of women (permanent and maximum term) in leadership roles across the Group. It includes the CEO, Group Executive, General Managers, senior leaders with significant influence on business outcomes,(direct reports to General Managers and their direct reports), large (3+) team people leaders three levels below general manager, and Bank and Assistant Bank Managers Source: 6 month rolling Business Finance Monitor data (survey conducted by Kantar TNS among businesses with an annual turnover of $5 to $150 million). Respondents are asked about likelihood to recommend their main business bank to business colleagues and associates on a scale of 1 (extremely unlikely) to 10 (extremely likely). Net Promoter Score is represents % of Promoters (recommend score of 9 or 10) minus % of Detractors (recommend score of 1 to 6) Women in Leadership NPS Business (Westpac NZ) Westpac Group 2018 Full Year Results Presentation & Investor Discussion Pack
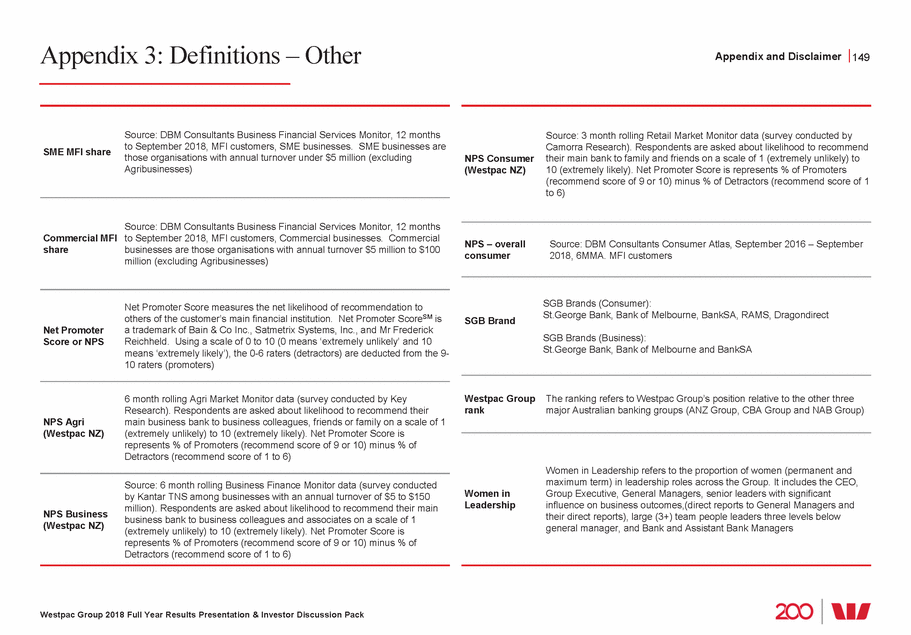
Investor Relations Team Contact us 150 www.westpac.com.au/investorcentre Head of Investor Relations Director Westpac Group 2018 Full Year Results Presentation & Investor Discussion Pack Equity Investor Relations Andrew BowdenNicole MehalskiAnnual reports Presentations and webcasts +61 2 8253 4008 +61 2 8253 1667 5 year financial summary [email protected] [email protected] Prior financial results Debt Investor Relations Jacqueline BoddyLouise Coughlan Director Director (Rating Agencies) +61 2 8253 3133 +61 2 8254 0549 [email protected] [email protected] Retail Shareholder Investor Relations Danielle StockRebecca Plackett Senior Manager Senior Manager +61 2 8253 0922 +61 2 8253 6556 [email protected] [email protected] Or email: [email protected]
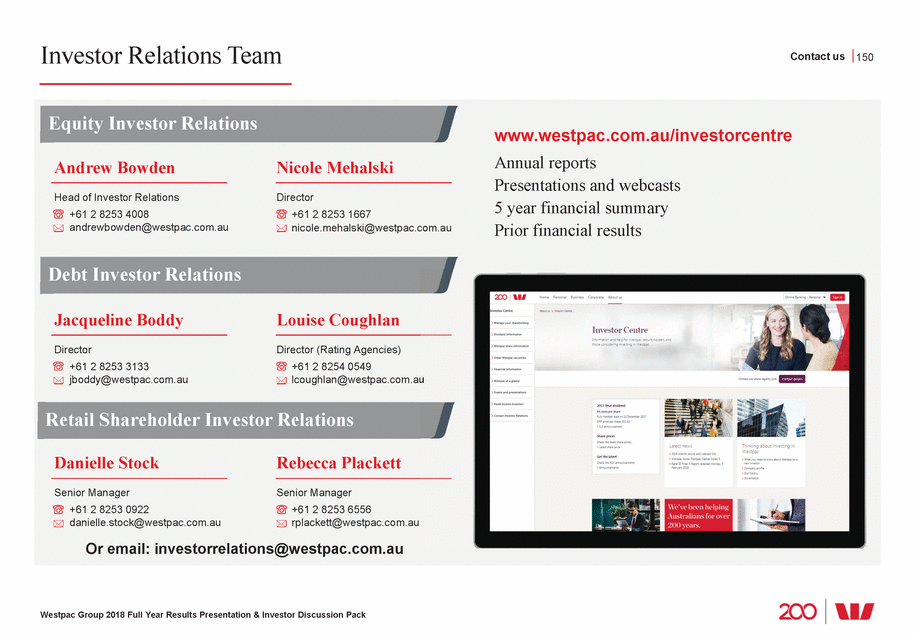
Disclaimer 151 The material contained in this presentation is intended to be general background information on Westpac Banking Corporation (Westpac) and its activities. The information is supplied in summary form and is therefore not necessarily complete. It is not intended that it be relied upon as advice to investors or potential investors, who should consider seeking independent professional advice depending upon their specific investment objectives, financial situation or particular needs. The material contained in this presentation may include information derived from publicly available sources that have not been independently verified. No representation or warranty is made as to the accuracy, completeness or reliability of the information. All amounts are in Australian dollars unless otherwise indicated. Unless otherwise noted, financial information in this presentation is presented on a cash earnings basis. Cash earnings is a non-GAAP measure. Refer to Westpac’s 2018 Full Year Financial Results (incorporating the requirements of Appendix 4E) for the twelve months ended 30 September 2018 available at www.westpac.com.au for details of the basis of preparation of cash earnings. Refer to page 41 for an explanation of cash earnings and Appendix 1 page 142 for a reconciliation of reported net profit to cash. This presentation contains statements that constitute “forward-looking statements” within the meaning of Section 21E of the US Securities Exchange Act of 1934. Forward-looking statements are statements about matters that are not historical facts. Forward-looking statements appear in a number of places in this presentation and include statements regarding our intent, belief or current expectations with respect to our business and operations, market conditions, results of operations and financial condition, including, without limitation, future loan loss provisions, financial support to certain borrowers, indicative drivers, forecasted economic indicators and performance metric outcomes. We use words such as ‘will’, ‘may’, ‘expect’, 'indicative', ‘intend’, ‘seek’, ‘would’, ‘should’, ‘could’, ‘continue’, ‘plan’, ‘probability’, ‘risk’, ‘forecast’, ‘likely’, ‘estimate’, ‘anticipate’, ‘believe’, ‘aim’, or other similar words to identify forward-looking statements. These forward-looking statements reflect our current views with respect to future events and are subject to change, certain risks, uncertainties and assumptions which are, in many instances, beyond our control, and have been made based upon management’s expectations and beliefs concerning future developments and their potential effect upon us. There can be no assurance that future developments will be in accordance with our expectations or that the effect of future developments on us will be those anticipated. Actual results could differ materially from those which we expect, depending on the outcome of various factors. Factors that may impact on the forward-looking statements made include, but are not limited to, those described in the section titled ‘Risk factors' in Westpac’s 2018 Full Year Financial Results (incorporating the requirements of Appendix 4E) for the twelve months ended 30 September 2018 (or Annual Report for the year ended 30 September 2017) available at www.westpac.com.au. When relying on forward-looking statements to make decisions with respect to us, investors and others should carefully consider such factors and other uncertainties and events. We are under no obligation to update any forward-looking statements contained in this presentation, whether as a result of new information, future events or otherwise, after the date of this presentation. Westpac Group 2018 Full Year Results Presentation & Investor Discussion Pack
Notification of dividend / distribution Notification of dividend / distribution Announcement Summary Entity name WESTPAC BANKING CORPORATION Security on which the Distribution will be paid WBC - ORDINARY FULLY PAID Announcement Type New announcement Date of this announcement Monday November 5, 2018 Distribution Amount AUD 0.94000000 Ex Date Tuesday November 13, 2018 Record Date Wednesday November 14, 2018 Payment Date Thursday December 20, 2018 DRP election date Thursday November 15, 2018 17:00:00 Refer to below for full details of the announcement Announcement Details Part 1 - Entity and announcement details 1.1 Name of +Entity WESTPAC BANKING CORPORATION Registration Number 1.2 Registered Number Type ABN 1.3 ASX issuer code WBC 1.4 The announcement is New announcement 1.5 Date of this announcement Monday November 5, 2018 Notification of dividend / distribution 1 / 5 33007457141

Notification of dividend / distribution 1.6 ASX +Security Code WBC ASX +Security Description ORDINARY FULLY PAID Part 2A - All dividends/distributions basic details 2A.1 Type of dividend/distribution Ordinary 2A.2 The Dividend/distribution: relates to a period of six months 2A.3 The dividend/distribution relates to the financial reporting or payment period ending ended/ending (date) Sunday September 30, 2018 2A.4 +Record Date Wednesday November 14, 2018 2A.5 Ex Date Tuesday November 13, 2018 2A.6 Payment Date Thursday December 20, 2018 2A.7 Are any of the below approvals required for the dividend/distribution before business day 0 of the timetable? Security holder approval Court approval Lodgement of court order with +ASIC ACCC approval FIRB approval Another approval/condition external to the entity required before business day 0 of the timetable for the dividend/distribution. No 2A.8 Currency in which the dividend/distribution is made ("primary currency") AUD - Australian Dollar 2A.9 Total dividend/distribution payment amount per +security (in primary currency) for all dividends/distributions notified in this form AUD 0.94000000 2A.10 Does the entity have arrangements relating to the currency in which the dividend/distribution is paid to securityholders that it wishes to disclose to the market? Yes Notification of dividend / distribution 2 / 5

Notification of dividend / distribution 2A.11 Does the entity have a securities plan for dividends/distributions on this +security? We have a Dividend/Distribution Reinvestment Plan (DRP) 2A.11a If the +entity has a DRP, is the DRP applicable to this dividend/distribution? Yes 2A.12 Does the +entity have tax component information apart from franking? Yes 2A.11a(i) DRP Status in respect of this dividend/distribution Full DRP Part 2B - Currency Information 2B.1 Does the entity default to payment in certain currencies dependent upon certain attributes such as the banking instruction or registered address of the +securityholder? (For example NZD to residents of New Zealand and/or USD to residents of the U.S.A.). Yes 2B.2 Please provide a description of your currency arrangements 2B.2a Other currency/currencies in which the dividend/distribution will be paid: GBP - Pound Sterling GBP NZD - New Zealand Dollar NZD 2B.2b Please provide the exchange rates used for non-primary currency payments 2B.2c If payment currency equivalent and exchange rates not known, date for information to be released Thursday December 20, 2018 Estimated or Actual? Actual 2B.3 Can the securityholder choose to receive a currency different to the currency they would receive under the default arrangements? No Part 3A - Ordinary dividend/distribution 3A.1 Is the ordinary dividend/distribution estimated at this time? No 3A.1b Ordinary Dividend/distribution amount per security AUD 0.94000000 3A.1a Ordinary dividend/distribution estimated amount per +security AUD Notification of dividend / distribution 3 / 5 Not known at date of this announcement. Details of dividend payment options for Westpac Ordinary Fully Paid Shares are available in Westpac's Investor Centre at http://www.westpac.com.au/about-westpac/investor-centre/dividend-information/dividend-payment/.
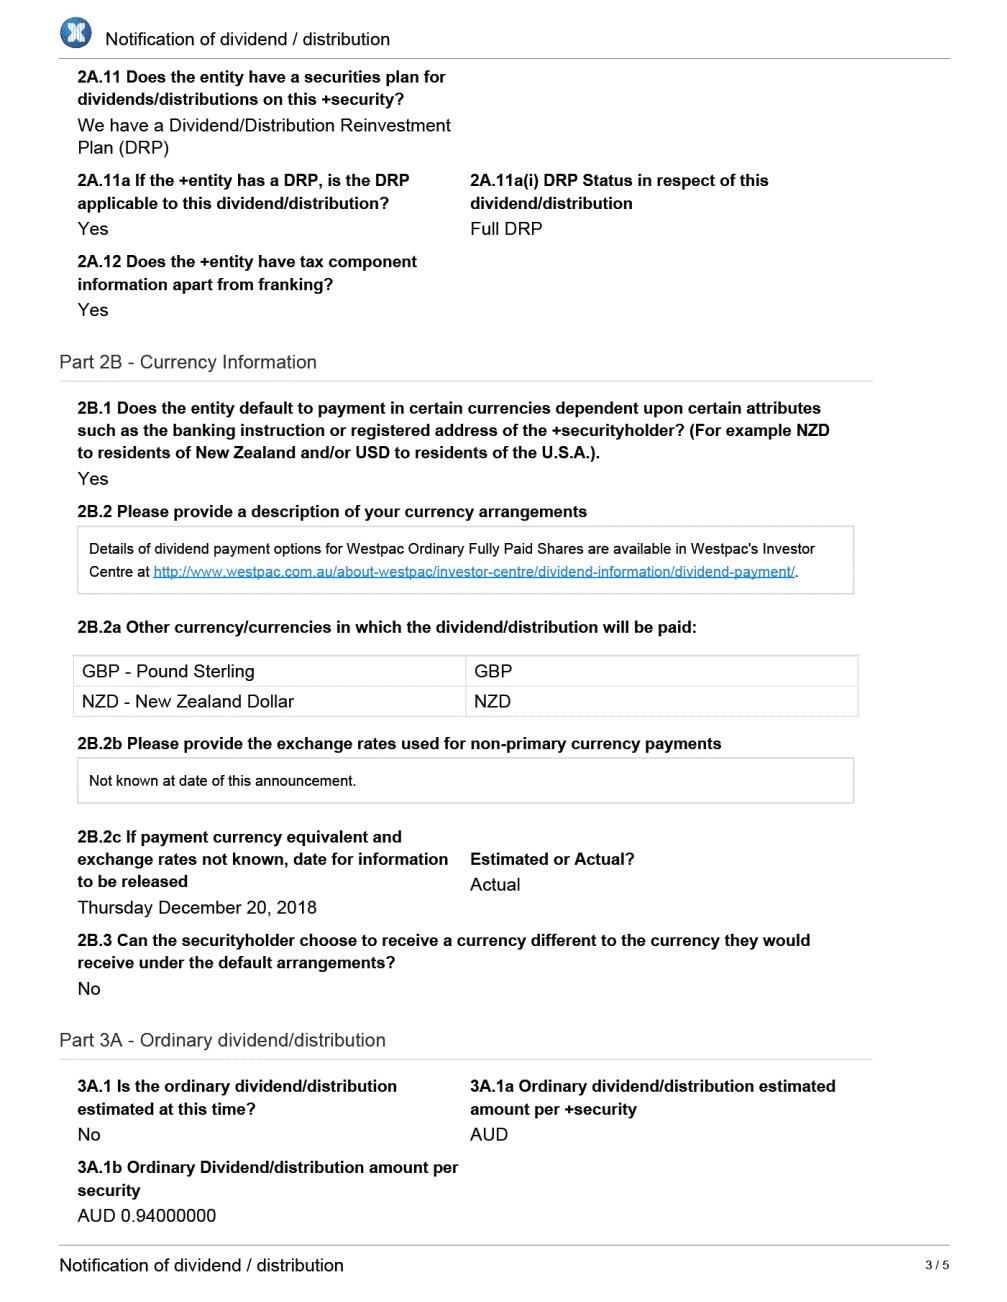
Notification of dividend / distribution 3A.2 Is the ordinary dividend/distribution franked? Yes 3A.3 Percentage of ordinary dividend/distribution that is franked 100.0000 % 3A.4 Ordinary dividend/distribution franked amount per +security AUD 0.94000000 3A.6 Ordinary dividend/distribution unfranked amount per +security excluding conduit foreign income amount AUD 0.00000000 3A.7 Ordinary dividend/distribution conduit foreign income amount per security AUD 0.00000000 3A.2a Is the ordinary dividend/distribution fully franked? Yes 3A.3a Applicable corporate tax rate for franking credit (%) 30.0000 % 3A.5 Percentage amount of dividend which is unfranked 0.0000 % Part 3E - Other - distribution components / tax 3E.1 Please indicate where and when information about tax components can be obtained (you may enter a url). Part 4A - +Dividend reinvestment plan (DRP) 4A.1 What is the default option if +security holders do not indicate whether they want to participate in the DRP? Do not participate in DRP (i.e. cash payment) 4A.2 Last date and time for lodgement of election notices to share registry under DRP Thursday November 15, 2018 17:00:00 4A.4 Period of calculation of reinvestment price 4A.3 DRP discount rate 0.0000 % Start Date Monday November 19, 2018 4A.5 DRP price calculation methodology End Date Friday November 30, 2018 4A.6 DRP Price (including any discount): AUD 4A.7 DRP +securities +issue date Thursday December 20, 2018 Notification of dividend / distribution 4 / 5 The average of the daily volume weighted average market price per Westpac Ordinary Fully Paid Share sold on the ASX and Chi-X during the 10 trading days commencing November 19 2018, with no discount. A New Zealand imputation credit of NZD 0.07 per Westpac Ordinary Fully Paid Share will attach to the dividend.
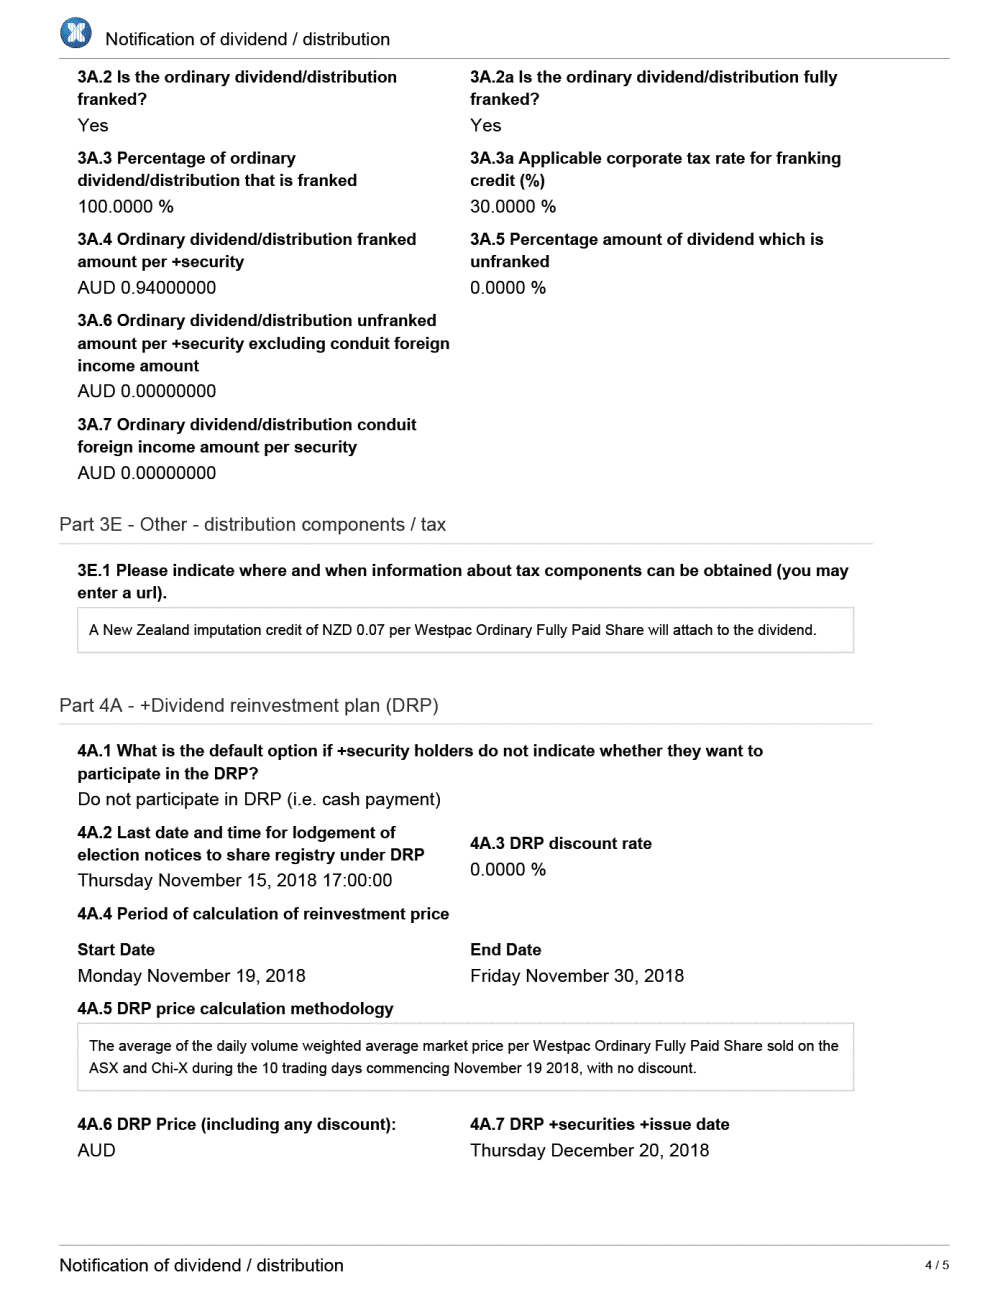
Notification of dividend / distribution 4A.8a Do DRP +securities rank pari passu from +issue date? Yes 4A.8 Will DRP +securities be a new issue? Yes 4A.9 Is there a minimum dollar amount or number of +securities required for DRP participation? No 4A.10 Is there a maximum dollar amount or number of +securities required for DRP participation? No 4A.11 Are there any other conditions applying to DRP participation? Yes 4A.11a Conditions for DRP participation 4A.12 Link to a copy of the DRP plan rules https://www.westpac.com.au/about-westpac/investor-centre/dividend-information/dividend-reinve stment-plan/ 4A.13 Further information about the DRP Part 5 - Further information 5.1 Please provide any further information applicable to this dividend/distribution 5.2 Additional information for inclusion in the Announcement Summary Notification of dividend / distribution 5 / 5 http://www.westpac.com.au/about-westpac/investor-centre/dividend-information/dividend-reinvestment-plan/ Participation in the DRP is restricted to shareholders who are resident in, and whose address on the register of shareholders is in, Australia or New Zealand.

Serious News for Serious Traders! Try StreetInsider.com Premium Free!
You May Also Be Interested In
- Falcon Oil & Gas - Shenandoah South-1H well IP90 Day Flow Rates of 2.9 MMcf/d (normalised to 5.8 MMcf/d)
- Bitcoin EDen Rich (BITBEDR) Is Now Available for Trading on LBank Exchange
- Medigene AG reports Financial Results and Business Update for Q1 2024
Create E-mail Alert Related Categories
SEC FilingsSign up for StreetInsider Free!
Receive full access to all new and archived articles, unlimited portfolio tracking, e-mail alerts, custom newswires and RSS feeds - and more!
