

Form 6-K TRANSALTA CORP For: Mar 31
 Tweet
Tweet Share
ShareFORM 6-K
SECURITIES AND EXCHANGE COMMISSION
Washington, D.C. 20549
SECURITIES AND EXCHANGE COMMISSION
Washington, D.C. 20549
REPORT OF FOREIGN PRIVATE ISSUER PURSUANT TO RULE 13a-16 OR 15d-16
UNDER THE SECURITIES EXCHANGE ACT OF 1934
UNDER THE SECURITIES EXCHANGE ACT OF 1934
For the month of May, 2018
Commission File Number 001-15214
Commission File Number 001-15214
TRANSALTA CORPORATION
(Translation of registrant’s name into English)
110 - 12th Avenue S.W., Box 1900, Station “M”, Calgary, Alberta, T2P 2M1
(Address of principal executive offices)
Indicate by check mark whether the registrant files or will file annual reports under cover Form 20-F or Form 40-F.
Form 20-F____ Form 40-F X
Indicate by check mark if the registrant is submitting the Form 6-K in paper as permitted by Regulation S-T Rule 101(b)(1): ____
Indicate by check mark if the registrant is submitting the Form 6-K in paper as permitted by Regulation S-T Rule 101(b)(7): ____
1
I
The documents listed below in this Section and filed as Exhibits 13.1 and 13.2 to this form 6-K are hereby filed with the Securities and Exchange Commission for the purpose of being and hereby are incorporated by reference into the following registration statements filed by TransAlta Corporation under the Securities Act of 1933, as amended:
Form | Registration No. |
S-8 | 333-72454 |
S-8 | 333-101470 |
F-10 | 333-215608 |
13.1 | Consolidated comparative interim unaudited financial statements of the registrant for the three month period ended March 31, 2018. |
13.2 | Management’s Discussion and Analysis of Financial Condition and Results of Operations of the registrant as at and for the period ended March 31, 2018. |
2
Signatures
Pursuant to the requirements of the Securities Exchange Act of 1934, the registrant has duly caused this report to be signed on its behalf by the undersigned, thereunto duly authorized.
TransAlta Corporation
By: | (signed) “Donald Tremblay” | |
Donald Tremblay | ||
Chief Financial Officer | ||
Date: May 8, 2018
3
EXHIBIT INDEX
13.1 | Consolidated comparative interim unaudited financial statements of the registrant for the three month period ended March 31, 2018. |
13.2 | Management’s Discussion and Analysis of Financial Condition and Results of Operations of the registrant as at and for the period ended March 31, 2018. |
31.1 | Certification of Chief Executive Officer pursuant to Section 302 of the Sarbanes-Oxley Act of 2002. |
31.2 | Certification of Chief Financial Officer pursuant to Section 302 of the Sarbanes-Oxley Act of 2002. |
32.1 | Certification of Chief Executive Officer regarding Periodic Report Containing Financial Statements. |
32.2 | Certification of Chief Financial Officer regarding Periodic Report Containing Financial Statements. |
4
TransAlta Corporation
Condensed Consolidated Statements of Earnings
(in millions of Canadian dollars except per share amounts)
3 months ended March 31 | ||||
Unaudited | 2018 | 2017 | ||
Revenues (Note 4) | 588 | 578 | ||
Fuel and purchased power | 277 | 250 | ||
Gross margin | 311 | 328 | ||
Operations, maintenance, and administration | 133 | 125 | ||
Depreciation and amortization | 130 | 143 | ||
Taxes, other than income taxes | 8 | 8 | ||
Net other operating income (Note 5) | (168 | ) | (10 | ) |
Operating income | 208 | 62 | ||
Finance lease income | 2 | 16 | ||
Net interest expense (Note 6) | (68 | ) | (62 | ) |
Foreign exchange loss | (2 | ) | (1 | ) |
Earnings before income taxes | 140 | 15 | ||
Income tax expense (recovery) (Note 7) | 37 | (17 | ) | |
Net earnings | 103 | 32 | ||
Net earnings attributable to: | ||||
TransAlta shareholders | 75 | — | ||
Non-controlling interests (Note 8) | 28 | 32 | ||
103 | 32 | |||
Net earnings attributable to TransAlta shareholders | 75 | — | ||
Preferred share dividends (Note 14) | 10 | — | ||
Net earnings attributable to common shareholders | 65 | — | ||
Weighted average number of common shares outstanding in the year (millions) | 288 | 288 | ||
Net earnings per share attributable to common shareholders, basic and diluted | 0.23 | — | ||
See accompanying notes.
TRANSALTA CORPORATION F1
TransAlta Corporation
Condensed Consolidated Statements of Comprehensive Income
(in millions of Canadian dollars)
3 months ended March 31 | ||||
Unaudited | 2018 | 2017 | ||
Net earnings | 103 | 32 | ||
Other comprehensive income (loss) | ||||
Net actuarial gains on defined benefit plans, net of tax(1) | 3 | 1 | ||
Gains on derivatives designated as cash flow hedges, net of tax(2) | 1 | — | ||
Total items that will not be reclassified subsequently to net earnings | 4 | 1 | ||
Gains (losses) on translating net assets of foreign operations, net of tax(3) | 33 | (6 | ) | |
Gains (losses) on financial instruments designated as hedges of foreign operations, net of tax(4) | (12 | ) | 13 | |
Gains on derivatives designated as cash flow hedges, net of tax(5) | 6 | 29 | ||
Reclassification of gains on derivatives designated as cash flow hedges to net earnings, net of tax(6) | (23 | ) | (6 | ) |
Total items that will be reclassified subsequently to net earnings | 4 | 30 | ||
Other comprehensive income | 8 | 31 | ||
Total comprehensive income | 111 | 63 | ||
Total comprehensive income attributable to: | ||||
TransAlta shareholders | 82 | 26 | ||
Non-controlling interests (Note 8) | 29 | 37 | ||
111 | 63 | |||
(1) Net of income tax expense of 1 for the three months ended March 31, 2018 (2017 - nil ).
(2) Net of income tax expense of nil for the three months ended March 31, 2018 (2017 - nil).
(3) Net of income tax expense of nil for the three months ended March 31, 2018 (2017 - 1 recovery).
(4) Net of income tax recovery of 1 for the year ended March 31, 2018 (2017 - 1 expense).
(5) Net of income tax expense of 1 for three months ended March 31, 2018 (2017 - 22 expense).
(6) Net of reclassification of income tax expense of 7 for the three months ended March 31, 2018 (2017 - 11 expense).
See accompanying notes.
F2 TRANSALTA CORPORATION
TransAlta Corporation
Condensed Consolidated Statements of Financial Position
(in millions of Canadian dollars)
Unaudited | March 31, 2018 | Dec. 31, 2017 | ||
Cash and cash equivalents | 329 | 314 | ||
Trade and other receivables | 671 | 933 | ||
Prepaid expenses | 33 | 24 | ||
Risk management assets (Notes 9 and 10) | 194 | 219 | ||
Inventory | 224 | 219 | ||
1,451 | 1,709 | |||
Restricted cash (Note 12) | 31 | 30 | ||
Long-term portion of finance lease receivables | 209 | 215 | ||
Property, plant, and equipment (Note 11) | ||||
Cost | 13,028 | 12,973 | ||
Accumulated depreciation | (6,559 | ) | (6,395 | ) |
6,469 | 6,578 | |||
Goodwill | 464 | 463 | ||
Intangible assets | 358 | 364 | ||
Deferred income tax assets | 25 | 24 | ||
Risk management assets (Notes 9 and 10) | 682 | 684 | ||
Other assets | 274 | 237 | ||
Total assets | 9,963 | 10,304 | ||
Accounts payable and accrued liabilities | 496 | 595 | ||
Current portion of decommissioning and other provisions | 75 | 67 | ||
Risk management liabilities (Notes 9 and 10) | 95 | 101 | ||
Income taxes payable | 66 | 64 | ||
Dividends payable (Note 13) | 34 | 34 | ||
Current portion of long-term debt and finance lease obligations (Note 12) | 140 | 747 | ||
906 | 1,608 | |||
Credit facilities, long-term debt, and finance lease obligations (Note 12) | 3,271 | 2,960 | ||
Decommissioning and other provisions | 398 | 403 | ||
Deferred income tax liabilities | 568 | 549 | ||
Risk management liabilities (Notes 9 and 10) | 34 | 40 | ||
Defined benefit obligation and other long-term liabilities | 367 | 359 | ||
Equity | ||||
Common shares (Note 13) | 3,090 | 3,094 | ||
Preferred shares (Note 14) | 942 | 942 | ||
Contributed surplus | 11 | 10 | ||
Deficit | (1,168 | ) | (1,209 | ) |
Accumulated other comprehensive income | 496 | 489 | ||
Equity attributable to shareholders | 3,371 | 3,326 | ||
Non-controlling interests (Note 8) | 1,048 | 1,059 | ||
Total equity | 4,419 | 4,385 | ||
Total liabilities and equity | 9,963 | 10,304 | ||
Commitments and contingencies (Note 15)
Subsequent events (Note 3)
See accompanying notes.
TRANSALTA CORPORATION F3
TransAlta Corporation
Condensed Consolidated Statements of Changes in Equity
(in millions of Canadian dollars)
Unaudited 3 months ended March 31, 2018 | Common shares | Preferred shares | Contributed surplus | Deficit | Accumulated other comprehensive income | Attributable to shareholders | Attributable to non-controlling interests | Total | ||||||||
Balance, Dec. 31, 2017 | 3,094 | 942 | 10 | (1,209 | ) | 489 | 3,326 | 1,059 | 4,385 | |||||||
Impact of changes in accounting policy (Note 2) | — | — | — | (14 | ) | — | (14 | ) | 1 | (13 | ) | |||||
Adjusted balance as at Jan. 1, 2018 | 3,094 | 942 | 10 | (1,223 | ) | 489 | 3,312 | 1,060 | 4,372 | |||||||
Net earnings | — | — | — | 75 | — | 75 | 28 | 103 | ||||||||
Other comprehensive income (loss): | ||||||||||||||||
Net gains on translating net assets of foreign operations, net of hedges and of tax | — | — | — | — | 21 | 21 | — | 21 | ||||||||
Net losses on derivatives designated as cash flow hedges, net of tax | — | — | — | — | (16 | ) | (16 | ) | — | (16 | ) | |||||
Net actuarial gains on defined benefits plans, net of tax | — | — | — | — | 3 | 3 | — | 3 | ||||||||
Intercompany fair value through OCI investments | — | — | — | — | (1 | ) | (1 | ) | 1 | — | ||||||
Total comprehensive income | 75 | 7 | 82 | 29 | 111 | |||||||||||
Common share dividends | — | — | — | (11 | ) | — | (11 | ) | — | (11 | ) | |||||
Preferred share dividends | — | — | — | (10 | ) | — | (10 | ) | — | (10 | ) | |||||
Shares purchased under NCIB (Note 13) | (4 | ) | — | — | 1 | — | (3 | ) | — | (3 | ) | |||||
Effect of share-based payment plans | — | — | 1 | — | — | 1 | — | 1 | ||||||||
Distributions paid, and payable, to non-controlling interests (Note 8) | — | — | — | — | — | — | (41 | ) | (41 | ) | ||||||
Balance, Mar 31, 2018 | 3,090 | 942 | 11 | (1,168 | ) | 496 | 3,371 | 1,048 | 4,419 | |||||||
See accompanying notes. | ||||||||||||||||
3 months ended March 31, 2017 | Common shares | Preferred shares | Contributed surplus | Deficit | Accumulated other comprehensive income | Attributable to shareholders | Attributable to non-controlling interests | Total | ||||||||
Balance, Dec. 31, 2016 | 3,094 | 942 | 9 | (933 | ) | 399 | 3,511 | 1,152 | 4,663 | |||||||
Net earnings | — | — | — | — | — | — | 32 | 32 | ||||||||
Other comprehensive income | ||||||||||||||||
Net gains on translating net assets of foreign operations, net of hedges and of tax | — | — | — | — | 7 | 7 | — | 7 | ||||||||
Net gains on derivatives designated as cash flow hedges, net of tax | — | — | — | — | 18 | 18 | 5 | 23 | ||||||||
Net actuarial gains on defined benefits plans, net of tax | — | — | — | — | 1 | 1 | — | 1 | ||||||||
Total comprehensive income | — | 26 | 26 | 37 | 63 | |||||||||||
Distributions paid, and payable, to non-controlling interests (Note 8) | — | — | — | — | — | — | (47 | ) | (47 | ) | ||||||
Balance, Mar 31, 2017 | 3,094 | 942 | 9 | (933 | ) | 425 | 3,537 | 1,142 | 4,679 | |||||||
See accompanying notes. | ||||||||||||||||
F4 TRANSALTA CORPORATION
TransAlta Corporation
Condensed Consolidated Statements of Cash Flows
(in millions of Canadian dollars)
3 months ended March 31 | ||||
Unaudited | 2018 | 2017 | ||
Operating activities | ||||
Net earnings | 103 | 32 | ||
Depreciation and amortization (Note 16) | 161 | 160 | ||
Accretion of provisions (Note 6) | 6 | 6 | ||
Decommissioning and restoration costs settled | (7 | ) | (4 | ) |
Deferred income tax expense (recovery) (Note 7) | 28 | (23 | ) | |
Unrealized (gain) loss from risk management activities | (21 | ) | (5 | ) |
Unrealized foreign exchange loss | 10 | 2 | ||
Provisions | 5 | — | ||
Other non-cash items | 17 | 18 | ||
Cash flow from operations before changes in working capital | 302 | 186 | ||
Change in non-cash operating working capital balances | 123 | 95 | ||
Cash flow from operating activities | 425 | 281 | ||
Investing activities | ||||
Additions to property, plant, and equipment (Note 11) | (23 | ) | (60 | ) |
Additions to intangibles | (5 | ) | (4 | ) |
Acquisition of renewable energy development projects (Note 3) | (30 | ) | — | |
Proceeds on sale of property, plant, and equipment | 1 | — | ||
Proceeds on sale of Wintering Hills facility | — | 61 | ||
Decrease in finance lease receivable | 15 | 15 | ||
Other | 1 | (2 | ) | |
Change in non-cash investing working capital balances | (12 | ) | (5 | ) |
Cash flow from (used in) investing activities | (53 | ) | 5 | |
Financing activities | ||||
Net increase in borrowings under credit facilities (Note 12) | 326 | — | ||
Repayment of long-term debt (Note 12) | (660 | ) | (14 | ) |
Dividends paid on common shares (Note 13) | (12 | ) | (12 | ) |
Dividends paid on preferred shares (Note 14) | (10 | ) | (10 | ) |
Funds paid to repurchase common shares under NCIB (Note 13) | (1 | ) | — | |
Realized gains on financial instruments | 50 | — | ||
Distributions paid to subsidiaries’ non-controlling interests (Note 8) | (41 | ) | (47 | ) |
Decrease in finance lease obligations (Note 12) | (4 | ) | (4 | ) |
Other | (5 | ) | (1 | ) |
Cash flow used in financing activities | (357 | ) | (88 | ) |
Cash flow from operating, investing, and financing activities | 15 | 198 | ||
Effect of translation on foreign currency cash | — | 1 | ||
Increase in cash and cash equivalents | 15 | 199 | ||
Cash and cash equivalents, beginning of period | 314 | 305 | ||
Cash and cash equivalents, end of period | 329 | 504 | ||
Cash income taxes paid | 12 | 2 | ||
Cash interest paid | 37 | 22 | ||
See accompanying notes.
TRANSALTA CORPORATION F5
Notes to Condensed Consolidated Financial Statements
(Unaudited)
(Tabular amounts in millions of Canadian dollars, except as otherwise noted)
1. Accounting Policies
A. Basis of Preparation
These unaudited interim condensed consolidated financial statements have been prepared in accordance with International Accounting Standard (“IAS”) 34 Interim Financial Reporting using the same accounting policies as those used in TransAlta Corporation’s (“TransAlta” or the “Corporation”) most recent annual consolidated financial statements, except as outlined in Note 2(A). These unaudited interim condensed consolidated financial statements do not include all of the disclosures included in the Corporation’s annual consolidated financial statements. Accordingly, they should be read in conjunction with the Corporation’s most recent annual consolidated financial statements which are available on SEDAR at www.sedar.com and on EDGAR at www.sec.gov.
The unaudited interim condensed consolidated financial statements include the accounts of the Corporation and the subsidiaries that it controls.
The unaudited interim condensed consolidated financial statements have been prepared on a historical cost basis, except for certain financial instruments, which are stated at fair value.
These unaudited interim condensed consolidated financial statements reflect all adjustments which consist of normal recurring adjustments and accruals that are, in the opinion of management, necessary for a fair presentation of results. TransAlta’s results are partly seasonal due to the nature of the electricity market and related fuel costs. Higher maintenance costs are ordinarily incurred in the second and third quarters when electricity prices are expected to be lower, as electricity prices generally increase in the winter months in the Canadian market.
These unaudited interim condensed consolidated financial statements were authorized for issue by the Audit and Risk Committee on behalf of the Board of Directors on May 7, 2018.
B. Use of Estimates and Significant Judgments
The preparation of these unaudited interim condensed consolidated financial statements in accordance with IAS 34 requires management to use judgment and make estimates and assumptions that affect the reported amounts of assets, liabilities, revenues and expenses, and disclosures of contingent assets and liabilities. These estimates are subject to uncertainty. Actual results could differ from these estimates due to factors such as fluctuations in interest rates, foreign exchange rates, inflation and commodity prices, and changes in economic conditions, legislation, and regulations. Refer to Note 2(Z) of the Corporation’s most recent annual consolidated financial statements and to Note 2 for information regarding judgments and estimates.
F6 TRANSALTA CORPORATION
2. Significant Accounting Policies
A. Current Accounting Changes
I. IFRS 15 Revenue from Contracts with Customers
The Corporation has adopted IFRS 15 Revenue from Contracts with Customers (IFRS 15) with an initial adoption date of Jan. 1, 2018. As a result, the Corporation has changed its accounting policy for revenue recognition, which is outlined below.
The Corporation has elected to adopt IFRS 15 retrospectively with the modified retrospective method of transition practical expedient and has elected to apply IFRS 15 only to contracts that are not completed contracts at the date of initial application. Comparative information has not been restated and is reported under IAS 18 Revenue (IAS 18). Refer to the Corporation's most recent annual report for information on its prior accounting policy.
The Corporation recognized the cumulative impact of the initial application of the standard in Deficit as at Jan. 1, 2018. Applying the significant financing component requirements to a specific contract resulted in an increase to the contract liability of $17 million, a decrease in deferred income tax liabilities of $4 million, and an increase to Deficit of $13 million. IFRS 15 requires that, in determining the transaction price, the promised amount of consideration is to be adjusted for the effects of the time value of money if the timing of payments specified in a contract provides either party with a significant benefit of financing the transfer of goods or services to the customer (“significant financing component”). The objective when adjusting the promised amount of consideration for a significant financing component is to recognize revenue at an amount that reflects the price that the customer would have paid, had they paid cash in the future when the goods or services are transferred to them. The application of the significant financing component requirements results in the recognition of interest expense over the financing period and a higher amount of revenue.
Additionally, the Corporation no longer recognizes revenue (or fuel costs) related to non-cash consideration for natural gas supplied by a customer at one of its gas plants , as it was determined under IFRS 15 that the Corporation does not obtain control of the customer-supplied natural gas.
Refer to the discussion below, and to Note 4 for a breakdown, of the Corporation's revenues from contracts with customers and revenues from other sources.
The following tables summarize the financial statement line items impacted by adopting IFRS 15 as at and for the three months ended March 31, 2018.
Condensed Consolidated Statement of Earnings
Three months ended March 31, 2018 | Reported in accordance with IAS 18 and IAS 11 | Adjustments | As reported under IFRS 15 | ||||
Revenues | 589 | (1 | ) | 588 | |||
Fuel and purchased power | (279 | ) | 2 | (277 | ) | ||
Net interest expense | (67 | ) | (1 | ) | (68 | ) | |
Net earnings impact | 103 | — | 103 | ||||
Condensed Consolidated Statements of Financial Position
As at March 31, 2018 | Reported in accordance with IAS 18 and IAS 11 | Adjustments | As reported under IFRS 15 | ||||
Deferred income tax liabilities | 572 | (4 | ) | 568 | |||
Defined benefit obligation and other long-term liabilities (contract liability) | 350 | 17 | 367 | ||||
Deficit | (1,155 | ) | 13 | (1,168 | ) | ||
There were no impacts to the statement of cash flows as a result of adopting IFRS 15.
TRANSALTA CORPORATION F7
i) Revenue from Contracts with Customers
The majority of the Corporation’s revenues from contracts with customers are derived from the sale of generation capacity, electricity, thermal energy, renewable attributes and byproducts of power generation. The Corporation evaluates whether the contracts it enters into meet the definition of a contract with a customer at the inception of the contract and on an ongoing basis if there is an indication of significant changes in facts and circumstances. Revenue is measured based on the transaction price specified in a contract with a customer. Revenue is recognized when control of the good or services is transferred to the customer. The Corporation excludes amounts collected on behalf of third parties from revenue.
Performance Obligations
The majority of the Corporation’s revenues from contracts with customers are derived from the sale of generation capacity, electricity, thermal energy, renewable attributes and byproducts of power generation. Each promised good or service is accounted for separately as a performance obligation if it is distinct. The Corporation’s contracts may contain more than one performance obligation.
Transaction Price
The Corporation allocates the transaction price in the contract to each performance obligation. Transaction price allocated to performance obligations may include variable consideration. Variable consideration is included in the transaction price for each performance obligation when it is highly probable that a significant reversal of the cumulative variable revenue will not occur. Variable consideration includes both variability in quantity and pricing. The consideration contained in some of the Corporation’s contracts with customers is primarily variable. Variable consideration is assessed at each reporting period to determine whether the constraint is lifted.
When multiple performance obligations are present in a contract, transaction price is allocated to each performance obligation in an amount that depicts the consideration the Corporation expects to be entitled to in exchange for transferring the good or service. The Corporation estimates the amount of the transaction price to allocate to individual performance obligations based on their relative standalone selling prices, which is primarily estimated based on the amounts that would be charged to customers under similar market conditions.
F8 TRANSALTA CORPORATION
Recognition
The nature, timing of recognition of satisfied performance obligations, and payment terms for the Corporation’s goods and services are described below:
Good or Service | Description |
Capacity | Capacity refers to the availability of an asset to deliver goods or services. Customers typically pay for capacity for each defined time period (i.e., monthly) in an amount representative of availability of the asset for the defined time period. Obligation to deliver capacity are satisfied over time and revenue is recognized using a time based measure. Contracts for capacity are typically long term in nature. Payments are typically received from customers on a monthly basis. |
Contract Power | The sale of contract power refers to the delivery of units of electricity to a customer under the terms of a contract. Customers pay a contractually specified price for the output at the end of predefined contractual periods (i.e., monthly). Obligations to deliver electricity are satisfied over time and revenue is recognized using a units based output measure (i.e., megawatt hours). Contracts for power are typically long term in nature and payments are typically received on a monthly basis. |
Thermal Energy | Thermal energy refers to the delivery of units of steam to a customer under the terms of a contract. Customers pay a contractually specified price for the output at the end of predefined contractual periods (i.e., monthly). Obligations to deliver steam are satisfied over time and revenue is recognized using a units based output measure (i.e., gigajoules). Contracts for thermal energy are typically long term in nature. Payments are typically received from customers on a monthly basis. |
Renewable Attributes | Renewable attributes refers to the delivery of renewable energy certificates, green attributes and other similar items. Customers may contract for renewable attributes in conjunction with the purchase of power in which case the customer pays for the attributes in the month subsequent to the delivery of the power. Alternatively, customers pay upon delivery of the renewable attributes. Obligations to deliver renewable attributes are satisfied at a point in time, generally upon delivery of the item. |
Generation byproducts | Generation byproducts refers to the sale of byproducts from the use of coal in the Corporation’s Canadian and US coal operations, and the sale of coal to third parties. Obligations to deliver byproducts are satisfied at a point in time, generally upon delivery of the item. Payments are received upon satisfaction of delivery of the byproducts. |
The Corporation recognizes a contract asset or contract liability for contracts where either party has performed. A contract liability is recorded when the Corporation receives consideration before the performance obligations have been satisfied. A contract asset is recorded when the Corporation has rights to consideration for the completion of a performance obligations before it has invoiced the customer. The Corporation recognizes unconditional rights to consideration separately as a receivable. Contract assets and receivables are evaluated at each reporting period to determine whether there is any objective evidence that they are impaired.
The Corporation recognizes a significant financing component where the timing of payment from the customer differs from the Corporation’s performance under the contract and where that difference is the result of the Corporation financing the transfer of goods and services.
Significant Judgments
Identification of performance obligations
Where contracts contain multiple promises for goods or services, management exercises judgement in determining whether goods or services constitute distinct goods or services or a series of distinct goods that are substantially the same and that have the same pattern of transfer to the customer. The determination of a performance obligation affects whether the transaction price is recognized at a point in time or over time. Management considers both the mechanics of the contract and the economic and operating environment of the contract in determining whether the goods or services in a contract are distinct.
Transaction price
In determining the transaction price and estimates of variable consideration, management considers past history of customer usage and capacity requirements, in estimating the goods and services to be provided to the customer. The Corporation also considers the historical production levels and operating conditions for its variable generating assets.
TRANSALTA CORPORATION F9
Allocation of transaction price to performance obligations
The Corporation’s contracts generally outline a specific amount to be invoiced to a customer associated with each performance obligation in the contract. Where contracts do not specify amounts for individual performance obligations, the Corporation estimates the amount of the transaction price to allocate to individual performance obligations based on their standalone selling price, which is primarily estimatded based on the amounts that would be charged to customers under similar market conditions.
Satisfaction of performance obligations
The satisfaction of performance obligations requires management to make judgment as to when control of the underlying good or service transfers to the customer. Determining when a performance obligation is satisfied affects the timing of revenue recognition. Management considers both customer acceptance of the good or service, and the impact of laws and regulations such as certification requirements, in determining when this transfer occurs. Management also applies judgment in determining whether the invoice practical expedient can be relied upon in measuring progress toward complete satisfaction of performance obligations. The invoice practical expedient permits recognition of revenue at the invoiced amount, if that invoiced amount corresponds directly with the entity's performance to date.
ii) Revenue from Other Sources
Lease revenue
In certain situations, a long-term electricity or thermal sales contract may contain, or be considered, a lease. Revenues associated with non-lease elements are recognized as goods or services revenues as outlined above. Revenues associated with leases are recognized as outlined in Note 2(R) of the Corporation's most recent annual report.
Revenue from derivatives
Commodity risk management activities involve the use of derivatives such as physical and financial swaps, forward sales contracts, futures contracts, and options, which are used to earn revenues and to gain market information. These derivatives are accounted for using fair value accounting. The initial recognition and subsequent changes in fair value affect reported net earnings in the period the change occurs and are presented on a net basis in revenue. The fair values of instruments that remain open at the end of the reporting period represent unrealized gains or losses and are presented on the condensed consolidated statements of financial position as risk management assets or liabilities. Some of the derivatives used by the Corporation in trading activities are not traded on an active exchange or have terms that extend beyond the time period for which exchange-based quotes are available. The fair values of these derivatives are determined using internal valuation techniques or models.
II. IFRS 9 Financial Instruments
Effective Jan. 1, 2018, the Corporation adopted IFRS 9, which introduces new requirements for:
1) The classification and measurement of financial assets and liabilities
2) The recognition and measurement of impairment of financial assets
3) General hedge accounting
In accordance with the transition provisions of the standard, the Corporation has elected to not restate prior periods. The impact of adopting IFRS 9 was recognized in Deficit at Jan. 1, 2018. While the Corporation had no direct impact of adopting IFRS 9, a $1 million increase in Deficit resulted from the increase in equity attributable to non-controlling interests due to IFRS 9 impacts at TransAlta Renewables Inc. ("TransAlta Renewables").
The Corporation's accounting policies under IFRS 9 are outlined below. For more information on the Corporation's accounting policies under IAS 39 for the period ended March 31, 2017, refer to Note 2 of the Corporation’s most recent annual consolidated financial statements.
a. Classification and Measurement
IFRS 9 introduces the requirement to classify and measure financial assets based on their contractual cash flow characteristics and the Corporation’s business model for the financial asset. All financial assets and financial liabilities, including derivatives, are recognized at fair value on the consolidated statements of financial position when the Corporation becomes party to the contractual provisions of a financial instrument or non-financial derivative contract. Financial assets must be classified and measured at either amortized cost, at fair value through profit or loss (“FVTPL”), or at fair value through other comprehensive income (“FVTOCI”).
F10 TRANSALTA CORPORATION
Financial assets with contractual cash flows arising on specified dates, consisting solely of principal and interest, and that are held within a business model whose objective is to collect the contractual cash flows are subsequently measured at amortized cost. Financial assets measured at FVTOCI are those which have contractual cash flows arising on specific dates, consisting solely of principal and interest, and that are held within a business model whose objective is to collect the contractual cash flows and to sell the financial asset. All other financial assets are subsequently measured at FVTPL.
Financial liabilities are classified as FVTPL when the financial liability is held for trading. All other financial liabilities are subsequently measured at amortized cost.
The Corporation enters into a variety of derivative financial instruments to manage its exposure to commodity price risk, interest rate risk, and foreign currency exchange risk, including fixed price financial swaps, long-term physical power sale contracts, foreign exchange forward contracts and designating foreign currency debt as a hedge of net investments in foreign operations.
Derivatives are initially recognized at fair value at the date the derivative contracts are entered into and are subsequently remeasured to their fair value at the end of each reporting period. The resulting gain or loss is recognized in net earnings immediately, unless the derivative is designated and effective as a hedging instrument, in which case the timing of the recognition in net earnings is dependent on the nature of the hedging relationship.
Derivatives embedded in non-derivative host contracts that are not financial assets within the scope of IFRS 9 (e.g. financial liabilities) are treated as separate derivatives when they meet the definition of a derivative, their risks and characteristics are not closely related to those of the host contracts and the host contracts are not measured at FVTPL. Derivatives embedded in hybrid contracts that contain financial asset hosts within the scope of IFRS 9 are not separated and the entire contract is measured at either FVTPL or amortized cost, as appropriate.
The Corporation’s management reviewed and assessed the classifications of its existing financial instruments as at Jan. 1, 2018, based on the facts and circumstances that existed at that date, as shown below. None of the reclassifications had a significant impact on the Corporation’s financial position, earnings (loss), other comprehensive income (loss) or total comprehensive income (loss) after the date of initial application.
Financial instrument | IAS 39 category | IFRS 9 classification |
Cash and cash equivalents | Loans and receivables | Amortized cost |
Restricted cash | Loans and receivables | Amortized cost |
Trade and other receivables | Loans and receivables | Amortized cost |
Long-term portion of finance lease receivables | Loans and receivables | Amortized cost |
Loan receivable (other assets) | Loans and receivables | Amortized cost |
Risk management assets (current and long-term) - derivatives held for trading | Held for trading | FVTPL |
Risk management assets (current and long-term) - derivatives designated as hedging instruments | Derivatives designated as hedging instruments | FVOCI |
Accounts payable and accrued liabilities | Other financial liabilities | Amortized cost |
Dividends payable | Other financial liabilities | Amortized cost |
Risk management liabilities (current and long-term) - derivatives held for trading | Held for trading | FVTPL |
Risk management liabilities (current and long-term) - derivatives designated as hedging instruments | Derivatives designated as hedging instruments | FVOCI |
Credit facilities and long-term debt | Other financial liabilities | Amortized cost |
TRANSALTA CORPORATION F11
b. Impairment of Financial Assets
IFRS 9 introduces a new impairment model for financial assets measured at amortized cost as well as certain other instruments. The expected credit loss model requires entities to account for expected credit losses on financial assets at the date of initial recognition, and to account for changes in expected credit losses at each reporting date to reflect changes in credit risk.
The loss allowance for a financial asset is measured at an amount equal to the lifetime expected credit loss if its credit risk has increased significantly since initial recognition, or if the financial asset is a purchased or originated credit-impaired financial asset.
If the credit risk on a financial asset has not increased significantly since initial recognition, its loss allowance is measured at an amount equal to the 12-month expected credit loss.
IFRS 9 permits a simplified approach for measuring the loss allowance for trade receivables, contract assets and lease receivables at an amount equal to lifetime expected credit losses under certain circumstances. The Corporation measures its trade receivables, contract assets recognized under IFRS 15 using the simplified approach. The Corporation uses the general approach to measure the expected credit loss for lease receivables.
The assessment of the expected credit loss is based on historical data, and adjusted by forward-looking information. Forward-looking information utilized includes third-party default rates over time, dependent on credit ratings.
The Corporation’s management reviewed and assessed its existing financial assets for impairment using reasonable and supportable information in accordance with the requirements of IFRS 9 to determine the credit risk of the respective items at the date they were initially recognized, and compared that to the credit risk as at Jan. 1, 2018. There were no significant increases in credit risk determined upon application of IFRS 9 and no loss allowance was recognized.
c. General Hedge Accounting
IFRS 9 retains the three types of hedges from IAS 39 (fair value hedges, cash flow hedges and hedges of a net investment in a foreign operation), but increases flexibility as to the types of transactions that are eligible for hedge accounting.
The effectiveness test of IAS 39 is replaced by the principle of an “economic relationship”, which requires that the hedging instrument and the hedged item have values that generally move in opposite direction because of the hedged risk. Additionally, retrospective hedge effectiveness testing is no longer required under IFRS 9.
In accordance with IFRS 9’s transition provisions for hedge accounting, the Corporation has applied the IFRS 9 hedge accounting requirements prospectively from the date of initial application on Jan. 1, 2018, and comparative figures have not been restated. The Corporation’s qualifying hedging relationships under IAS 39 in place as at Jan. 1, 2018 also qualified for hedge accounting in accordance with IFRS 9, and were therefore regarded as continuing hedging relationships. No rebalancing of any of the hedging relationships was necessary on Jan. 1, 2018. As the critical terms of the hedging instruments match those of their corresponding hedged items, all hedging relationships continue to be effective under IFRS 9’s effectiveness assessment. The Corporation has not designated any hedging relationships under IFRS 9 that would not have met the qualifying hedge accounting criteria under IAS 39. Further details of the Corporation's hedging activities are disclosed in Notes 9 and 10.
The Corporation’s risk management objective and strategy, including risk management instruments and their key terms, are detailed in Notes 9A and 9C.
In certain cases, the Corporation purchases non-financial items in a foreign currency, for which it may enter into forward contracts to hedge foreign currency risk on the anticipated purchases. Both IAS 39 and IFRS 9 require hedging gains and losses to be basis adjusted to the initial carrying amount of non-financial hedged items once recognized (such as PP&E), but under IFRS 9, these adjustments are no longer considered reclassification adjustments and do not affect other comprehensive income. Under IFRS 9, these amounts will be directly transferred to the asset and will be reflected in the statement of changes in equity as a reclassification from accumulated other comprehensive income.
The application of IFRS 9 hedge accounting requirements has no other impact on the results and financial position of the Corporation for the current or prior years.
F12 TRANSALTA CORPORATION
III. Change in Estimates - Useful Lives
As a result of the Off-Coal Agreement ("OCA") with the Government of Alberta described in Note 4(H) of our most recent annual consolidated financial statements, the Corporation has adjusted the useful lives of some of its Sunhills mine assets to align with the Corporation's coal-to-gas conversion plans. As a result, depreciation expense included in fuel and purchased power for the three months ended March 31, 2018 increased by approximately $10 million and the full year depreciation expense is expected to increase by approximately $38 million. The useful lives may be revised or extended in compliance with the Corporation's accounting policies, dependent upon future operating decisions and events.
B. Future Accounting Changes
Accounting standards that have been previously issued by the IASB but are not yet effective, and have not been applied by the Corporation, include IFRS 16 Leases. Refer to Note 3 of the Corporation’s most recent annual consolidated financial statements for information regarding the requirements of IFRS 16. The Corporation is in the process of completing an initial scoping assessment for IFRS 16 and has prepared a detailed project plan. The Corporation anticipates that most of the effort under the implementation plan will occur in mid-to-late 2018. It is not yet possible to make reliable estimates of the potential impact of IFRS 16 on our financial statements and disclosures.
C. Comparative Figures
Certain comparative figures have been reclassified to conform to the current period’s presentation. These reclassifications did not impact previously reported net earnings.
3. Significant Events
A. Normal Course Issuer Bid
On March 9, 2018 the Corporation announced that the Toronto Stock Exchange ("TSX") accepted the notice filed by the Corporation to implement a normal course issuer bid ("NCIB") for a portion of its common shares ("Common Shares"). Pursuant to the NCIB, the Corporation may repurchase up to a maximum of 14,000,000 Common Shares, representing approximately 4.86 per cent of issued and outstanding Common Shares as at March 2, 2018. Purchases under the NCIB may be made through open market transactions on the TSX and any alternative Canadian trading platforms on which the Common Shares are traded, based on the prevailing market price. Any Common Shares purchased under the NCIB will be cancelled.
The period during which TransAlta is authorized to make purchases under the NCIB commenced on March 14, 2018 and ends on March 13, 2019 or such earlier date on which the maximum number of Common Shares are purchased under the NCIB or the NCIB is terminated at the Company's election.
Under TSX rules, not more than 102,039 Common Shares (being 25 per cent of the average daily trading volume on the TSX of 408,156 Common Shares for the six months ended February 28, 2018) can be purchased on the TSX on any single trading day under the NCIB, with the exception that one block purchase in excess of the daily maximum is permitted per calendar week.
During the first quarter of 2018, the Corporation purchased and cancelled 374,900 Common Shares at an average price of $6.97 per Common Share. See Note 13 for further details.
Further transactions under the NCIB will depend on market conditions. The Corporation retains discretion whether to make purchases under the NCIB, and to determine the timing, amount and acceptable price of any such purchases, subject at all times to applicable TSX and other regulatory requirements.
B. Early Redemption of Senior Notes
On March 15, 2018, the Corporation early redeemed all of its outstanding 6.650 per cent US $500 million Senior Notes due May 15, 2018, for approximately $617 million (US$516 million). A $5 million early redemption premium was recognized in net interest expense for the three months ended March 31, 2018. See Note 12 for further details.
TRANSALTA CORPORATION F13
C. Balancing Pool Terminates the Alberta Sundance Power Purchase Arrangements
On Sept. 18, 2017, the Corporation received formal notice from the Balancing Pool for the termination of the Sundance B and C Power Purchase Arrangements ("PPAs") effective March 31, 2018. This announcement was expected and the Corporation took steps to re-take dispatch control for the units effective March 31, 2018. Pursuant to a written agreement, the Balancing Pool paid the Corporation approximately $157 million on March 29, 2018. The Corporation is disputing the termination payment it received. The Balancing Pool excludes certain mining assets that the Corporation believes should be included in the net book value calculation for an additional $56 million, which is subject to the PPA arbitration process.
D. Acquisition of Two US Wind Projects
On Feb. 20, 2018, TransAlta Renewables announced it had entered into an arrangement to acquire two construction-ready projects in the Northeastern United States. The wind development projects consist of: (i) a 90 MW project located in Pennsylvania that has a 15-year PPA, and (ii) a 29 MW project located in New Hampshire with two 20-year PPAs. All three counterparties have Standard & Poor's credit ratings of A+ or better. The commercial operation date for both projects is expected during the second half of 2019. A subsidiary of TransAlta (“US HoldCo”) acquired the 90 MW project on Feb. 20, 2018, whereas the acquisition of the 29 MW project remains subject to certain closing conditions, including the receipt of a favourable regulatory ruling.
On April 20, 2018, TransAlta Renewables acquired an economic interest in the US wind projects from the subsidiary of TransAlta (“TA Power”) pursuant to the arrangement entered into with TransAlta on Feb. 20, 2018. Pursuant to the arrangement, US HoldCo will own the US wind projects directly and TA Power will issue to TransAlta Renewables preferred shares that pay quarterly dividends based on the pre-tax net earnings of the US wind projects. The remaining construction and acquisition costs of the two US wind projects are to be funded by TransAlta Renewables and are estimated to be US$240 million. TransAlta Renewables will fund these costs either by acquiring additional preferred shares issued by TA Power or will subscribe for interest bearing notes issued by US HoldCo. The proceeds from the issuance of such preferred shares or notes shall be used exclusively in connection with the acquisition and construction of the US wind projects. TransAlta Renewables will fund these acquisition and construction costs using its existing liquidity and tax equity.
The acquisition is accounted for as an asset acquisition, not as a business combination.
4. Revenue from Contracts with Customers
Disaggregation of Revenue from Contracts with Customers
The majority of the Corporation's revenues are derived from the sale of physical power, capacity and green attributes, leasing of power facilities, and from energy marketing and trading activities, which the Corporation disaggregates into the following groups for the purpose of determining how economic factors affect the recognition of revenue.
3 months ended March 31, 2018 | Canadian Coal | US Coal | Canadian Gas | Australian Gas | Wind and Solar | Hydro | Energy Marketing | Corporate | Total | |||||||||
Revenues from contracts with customers | 204 | 2 | 56 | 23 | 65 | 24 | — | — | 374 | |||||||||
Revenue from leases | 17 | — | — | 17 | 8 | 1 | — | — | 43 | |||||||||
Revenue from derivatives | 11 | 64 | 6 | — | (3 | ) | — | 17 | — | 95 | ||||||||
Government incentives | — | — | — | — | 5 | — | — | — | 5 | |||||||||
Revenue from other(1) | 37 | 21 | — | 1 | 11 | 2 | — | (1 | ) | 71 | ||||||||
Total Revenue | 269 | 87 | 62 | 41 | 86 | 27 | 17 | (1 | ) | 588 | ||||||||
Revenues from contracts with customers | ||||||||||||||||||
Timing of revenue recognition | ||||||||||||||||||
At a point in time | 10 | 2 | — | — | 4 | — | — | — | 16 | |||||||||
Over time | 194 | — | 56 | 23 | 61 | 24 | — | — | 358 | |||||||||
Total Revenue | 204 | 2 | 56 | 23 | 65 | 24 | — | — | 374 | |||||||||
(1) Includes merchant revenue and other miscellaneous.
F14 TRANSALTA CORPORATION
5. Net Other Operating Income
Net other operating (income) losses are comprised of the following:
3 months ended March 31 | 2018 | 2017 | ||
Alberta Off-Coal Agreement | (10 | ) | (10 | ) |
Termination of Sundance B and C PPAs | (157 | ) | — | |
Insurance recoveries | (1 | ) | — | |
Net other operating income | (168 | ) | (10 | ) |
A. Alberta Off-Coal Agreement
The Corporation receives payments from the Government of Alberta for the cessation of coal-fired emissions from the Keephills 3, Genesee 3 and Sheerness coal-fired plants on or before Dec. 31, 2030.
Under the terms of the OCA, the Corporation receives annual cash payments on or before July 31 of approximately $40 million ($37.4 million, net to the Corporation), commencing Jan. 1, 2017, and terminating at the end of 2030. The Corporation recognizes the off-coal payments evenly throughout the year. Receipt of the payments is subject to certain terms and conditions. The OCA’s main condition is the cessation of all coal-fired emissions on or before Dec. 31, 2030. The affected plants are not, however, precluded from generating electricity at any time by any method, other than generation resulting in coal-fired emissions after Dec. 31, 2030.
B. Termination of Sundance B and C PPAs
On Sept. 18, 2017, the Corporation received formal notice from the Balancing Pool for the termination of the Sundance B and C PPAs effective March 31, 2018, and received $157 million during the first quarter of 2018. See Note 3 for further details.
6. Net Interest Expense
The components of net interest expense are as follows:
3 months ended March 31 | 2018 | 2017 | ||
Interest on debt | 53 | 56 | ||
Interest income | (3 | ) | (1 | ) |
Capitalized interest | — | (3 | ) | |
Loss on early redemption of US Senior Notes (Note 12) | 5 | — | ||
Interest on finance lease obligations | 1 | 1 | ||
Credit facility fees and bank charges | 3 | 4 | ||
Other interest | 3 | — | ||
Accretion of provisions | 6 | 5 | ||
Net interest expense | 68 | 62 | ||
TRANSALTA CORPORATION F15
7. Income Taxes
The components of income tax expense are as follows:
3 months ended March 31 | 2018 | 2017 | ||
Current income tax expense | 9 | 6 | ||
Deferred income tax expense related to the origination and reversal of temporary differences | 24 | (17 | ) | |
Deferred income tax expense (recovery) arising from the writedown (reversal of writedown) of deferred income tax assets(1) | 4 | (6 | ) | |
Income tax expense (recovery) | 37 | (17 | ) | |
3 months ended March 31 | 2018 | 2017 | ||
Current income tax expense | 9 | 6 | ||
Deferred income tax expense (recovery) | 28 | (23 | ) | |
Income tax expense | 37 | (17 | ) | |
(1) During the three months ended March 31, 2018 , the Corporation recorded a writedown of deferred income tax assets of $4 million (March 31, 2017 - $6 million reversal). The deferred income tax assets mainly relate to the tax benefits of losses associated with the Corporation’s directly owned US operations. The Corporation evaluates at each period end, whether it is probable that sufficient future taxable income would be available from the Corporation’s directly owned US operations to utilize the underlying tax losses. Recognized other comprehensive income during the period has given rise to taxable temporary differences, which forms the primary basis for utilization of some of the tax losses and the reversal of the writedown.
8. Non-Controlling Interests
The Corporation’s subsidiaries with significant non-controlling interests are TransAlta Renewables and TransAlta Cogeneration L.P. The net earnings, distributions, and equity attributable to TransAlta Renewables’ non-controlling interests include the 17 per cent non-controlling interest in the Kent Hills Wind LP, which owns the 150 MW Kent Hills wind farm and the 17.25 MW Kent Hills 3 expansion project located in New Brunswick.
The Corporation’s share of ownership and equity participation in TransAlta Renewables during the three months ended March 31, 2018 and 2017 is as follows:
Period | Ownership and voting rights percentage | Equity participation percentage(1) |
Jan. 6, 2016 to July 31, 2017 | 64.0 | 59.8 |
Aug. 1, 2017 and thereafter | 64.0 | 64.0 |
F16 TRANSALTA CORPORATION
Amounts attributable to non-controlling interests are as follows:
3 months ended March 31 | 2018 | 2017 | ||
Net earnings | ||||
TransAlta Cogeneration L.P. | 3 | 20 | ||
TransAlta Renewables | 25 | 12 | ||
28 | 32 | |||
Total comprehensive income | ||||
TransAlta Cogeneration L.P. | 3 | 19 | ||
TransAlta Renewables | 26 | 18 | ||
29 | 37 | |||
Distributions paid to non-controlling interests | ||||
TransAlta Cogeneration L.P. | 20 | 26 | ||
TransAlta Renewables | 21 | 21 | ||
41 | 47 | |||
As at | March 31, 2018 | Dec. 31, 2017 | ||
Equity attributable to non-controlling interests | ||||
TransAlta Cogeneration L.P. | 230 | 247 | ||
TransAlta Renewables | 818 | 812 | ||
1,048 | 1,059 | |||
Non-controlling interests per share (per cent) | ||||
TransAlta Cogeneration L.P. | 49.99 | 49.99 | ||
TransAlta Renewables | 36.0 | 36.0 | ||
9. Financial Instruments
A. Financial Assets and Liabilities – Measurement
Financial assets and financial liabilities are measured on an ongoing basis at cost, fair value, or amortized cost.
B. Fair Value of Financial Instruments
I. Level I, II, and III Fair Value Measurements
The Level I, II, and III classifications in the fair value hierarchy utilized by the Corporation are defined below. The fair value measurement of a financial instrument is included in only one of the three levels, the determination of which is based on the lowest level input that is significant to the derivation of the fair value.
a. Level I
Fair values are determined using inputs that are quoted prices (unadjusted) in active markets for identical assets or liabilities that the Corporation has the ability to access at the measurement date. In determining Level I fair values, the Corporation uses quoted prices for identically traded commodities obtained from active exchanges such as the New York Mercantile Exchange.
TRANSALTA CORPORATION F17
b. Level II
Fair values are determined, directly or indirectly, using inputs that are observable for the asset or liability.
Fair values falling within the Level II category are determined through the use of quoted prices in active markets, which in some cases are adjusted for factors specific to the asset or liability, such as basis, credit valuation, and location differentials.
The Corporation’s commodity risk management Level II financial instruments include over-the-counter derivatives with values based on observable commodity futures curves and derivatives with inputs validated by broker quotes or other publicly available market data providers. Level II fair values are also determined using valuation techniques, such as option pricing models and regression or extrapolation formulas, where the inputs are readily observable, including commodity prices for similar assets or liabilities in active markets, and implied volatilities for options.
In determining Level II fair values of other risk management assets and liabilities and long-term debt measured and carried at fair value, the Corporation uses observable inputs other than unadjusted quoted prices that are observable for the asset or liability, such as interest rate yield curves and currency rates. For certain financial instruments where insufficient trading volume or lack of recent trades exists, the Corporation relies on similar interest or currency rate inputs and other third-party information such as credit spreads.
c. Level III
Fair values are determined using inputs for the assets or liabilities that are not readily observable.
The Corporation may enter into commodity transactions for which market-observable data is not available. In these cases, Level III fair values are determined using valuation techniques such as the Black-Scholes, mark-to-forecast, and historical bootstrap models with inputs that are based on historical data such as unit availability, transmission congestion, demand profiles for individual non-standard deals and structured products, and/or volatilities and correlations between products derived from historical prices.
The Corporation also has various commodity contracts with terms that extend beyond a liquid trading period. As forward market prices are not available for the full period of these contracts, the value of these contracts is derived by reference to a forecast that is based on a combination of external and internal fundamental modelling, including discounting. As a result, these contracts are classified in Level III.
The Corporation has a Commodity Exposure Management Policy, which governs both the commodity transactions undertaken in its proprietary trading business and those undertaken to manage commodity price exposures in its generation business. This Policy defines and specifies the controls and management responsibilities associated with commodity trading activities, as well as the nature and frequency of required reporting of such activities.
Methodologies and procedures regarding commodity risk management Level III fair value measurements are determined by the Corporation’s risk management department. Level III fair values are calculated within the Corporation’s energy trading risk management system based on underlying contractual data as well as observable and non-observable inputs. Development of non-observable inputs requires the use of judgment. To ensure reasonability, system-generated Level III fair value measurements are reviewed and validated by the risk management and finance departments. Review occurs formally on a quarterly basis or more frequently if daily review and monitoring procedures identify unexpected changes to fair value or changes to key parameters.
Information on risk management contracts or groups of risk management contracts that are included in Level III measurements and the related unobservable inputs and sensitivities, is as follows, and excludes the effects on fair value of certain unobservable inputs such as liquidity and credit discount (described as “base fair values”), as well as inception gains or losses. Sensitivity ranges for the base fair values are determined using reasonably possible alternative assumptions for the key unobservable inputs, which may include forward commodity prices, commodity volatilities and correlations, delivery volumes, and shapes.
F18 TRANSALTA CORPORATION
As at | March 31, 2018 | Dec. 31, 2017 | |||||
Description | Base fair value | Sensitivity | Base fair value | Sensitivity | |||
Long-term power sale - US | 854 | +126 -126 | 853 | +130 -130 | |||
Unit contingent power purchases | 6 | +5 -5 | 44 | +7 -9 | |||
Structured products - Eastern US | 18 | +6 -6 | 17 | +8 -7 | |||
Hydro Slice products - Western US | (4 | ) | +4 -2 | (2 | ) | +3 -3 | |
Long-term wind energy sale - Eastern US | (20 | ) | +19 -19 | — | — | ||
Others | 5 | +5 -5 | 6 | +8 -8 | |||
i. Long-Term Power Sale - US
The Corporation has a long-term fixed price power sale contract in the US for delivery of power at the following capacity levels: 380 MW through Dec. 31, 2024, and 300 MW through Dec. 31, 2025. The contract is designated as an all-in-one cash flow hedge.
For periods beyond 2019, market forward power prices are not readily observable. For these periods, fundamental-based forecasts and market indications have been used to determine proxies for base, high, and low power price scenarios. The base price forecast has been developed by averaging external fundamental-based forecasts (providers are independent and widely accepted as industry experts for scenario and planning views). Forward power price ranges per MWh used in determining the Level III base fair value at March 31, 2018 are US$25 - US$34 (Dec. 31, 2017 - US$25 - US$34). The sensitivity analysis has been prepared using the Corporation’s assessment that a US$6 (Dec. 31, 2017 - US$6) price increase or decrease in the forward power prices is a reasonably possible change.
The contract is denominated in US dollars. With the weakening of the US dollar relative to the Canadian dollar from Dec. 31, 2017 to March 31, 2018, the base fair value and the sensitivity values have increased by approximately $21 million and $3 million, respectively.
ii. Unit Contingent Power Purchases
Under the unit contingent power purchase agreements, the Corporation has agreed to purchase power contingent upon the actual generation of specific units owned and operated by third parties. Under these types of agreements, the purchaser pays the supplier an agreed upon fixed price per MWh of output multiplied by the pro rata share of actual unit production (nil if a plant outage occurs). The contracts are accounted for as at fair value through profit and loss.
The key unobservable inputs used in the valuations are delivered volume expectations and hourly shapes of production. Hourly shaping of the production will result in realized prices that may be at a discount (or premium) relative to the average settled power price. Reasonably possible alternative inputs were used to determine sensitivity on the fair value measurements.
This analysis is based on historical production data of the generation units for available history. Price and volumetric discount ranges per MWh used in the Level III base fair value measurement at March 31, 2018, are nil (Dec. 31, 2017 - nil) and 2.20 per cent to 2.76 per cent (Dec. 31, 2017 – 2.20 per cent to 2.76 per cent), respectively. The sensitivity analysis has been prepared using the Corporation’s assessment of a reasonably possible change in price discount ranges of approximately 1.08 per cent to 1.91 per cent (Dec. 31, 2017 - 1.1 per cent to 1.94 per cent) and a change in volumetric discount rates of approximately 7.77 per cent to 10.33 per cent (Dec. 31, 2017 - 7.77 per cent to 10.46 per cent), which approximate one standard deviation for each input.
TRANSALTA CORPORATION F19
iii. Structured Products - Eastern US
The Corporation has fixed priced power and heat rate contracts in the eastern United States. Under the fixed priced power contracts, the Corporation has agreed to buy or sell power at non-liquid locations, or during non-standard hours. The Corporation has also bought and sold heat rate contracts at both liquid and non-liquid locations. Under a heat rate contract, the buyer has the right to purchase power at times when the market heat rate is higher than the contractual heat rate.
The key unobservable inputs in the valuation of the fixed priced power contracts are market forward spreads and non-standard shape factors. A historical regression analysis has been performed to model the spreads between non-liquid and liquid hubs. The non-standard shape factors have been determined using the historical data. Basis relationship and non-standard shape factors used in the Level III base fair value measurement at March 31, 2018, are 74 per cent to 153 per cent and 75 per cent to 121 per cent (Dec. 31, 2017 – 75 per cent to 159 per cent and 71 per cent to 88 per cent), respectively. The sensitivity analysis has been prepared using the Corporation’s assessment of a reasonably possible change in market forward spreads of approximately 5 per cent to 7 per cent (Dec. 31, 2017 - 7 per cent) and a change in non-standard shape factors of approximately 3 per cent to 5 per cent (Dec. 31, 2017 - 6 per cent), which approximate one standard deviation for each input.
The key unobservable inputs in the valuation of the heat rate contracts are implied volatilities and correlations. Implied volatilities and correlations used in the Level III base fair value measurement at March 31, 2018, are 16 per cent to 33 per cent and 70 per cent (Dec. 31, 2017 – 18 per cent to 54 per cent and 70 per cent), respectively. The sensitivity analysis has been prepared using the Corporation’s assessment of a reasonably possible change in implied volatilities ranges and correlations of approximately 18 per cent to 23 per cent and 10 per cent, respectively (Dec. 31, 2017 -27 per cent to 32 per cent and 10 per cent.
iv. Hydro Slice Products - Western US
The Corporation agreed to purchase power contingent upon the actual generation of specific hydro units owned and operated by third parties. Under these types of agreements, the purchaser pays the supplier an agreed upon fixed capacity payment. The contracts were accounted for as fair value through profit and loss.
The key unobservable inputs used in the March 31, 2018 valuations are delivered volume expectations. Reasonably possible alternative inputs were used to determine sensitivity on the fair value measurements. This analysis is based on historical production of the generation units for available history. For the Level III base fair value measurement at March 31, 2018, the volumes were assumed to be equal to the 50th percentile (Dec. 31, 2017 - 50th percentile) of the historical production. The Corporation's assessment of a reasonably possible change in delivered volumes is 24 per cent (Dec. 31, 2017 - 24 per cent).
v. Long-Term Wind Energy Sale - Eastern US
In relation to the acquisition of the US wind project (See Note 3 for further details), the Corporation has a long-term contract for differences whereby the Corporation receives a fixed price per MWh and pays the prevailing real-time energy market price per MWh as well as the physical delivery of Renewable energy credits based on proxy generation. Commercial operation of the facility is expected to begin in September of 2019, with the contract extending for 15 years after commercial commencement. The contract is accounted for at fair value through profit or loss.
The key unobservable inputs used in the valuation of the contract are expected proxy generation volumes and forward prices for power and RECs beyond 2023. Forward power and REC price ranges per MWh used in determining the Level III base fair value at March 31, 2018 are US$38-$59 and US$7 respectively. The sensitivity analysis has been prepared using the Corporation’s assessment that a change in expected proxy generation volumes of 10 per cent, a change in energy prices of US$6, and a change in REC prices of US$1 is a reasonably possible change.
II. Commodity Risk Management Assets and Liabilities
Commodity risk management assets and liabilities include risk management assets and liabilities that are used in the energy marketing and generation businesses in relation to trading activities and certain contracting activities. To the extent applicable, changes in net risk management assets and liabilities for non-hedge positions are reflected within earnings of these businesses.
F20 TRANSALTA CORPORATION
Commodity risk management assets and liabilities classified by fair value levels as at March 31, 2018, are as follows: Level I - $2 million net liability (Dec. 31, 2017 - $1 million net liability), Level II - $26 million net asset (Dec. 31, 2017 - $42 million net liability), Level III - $725 million net asset (Dec. 31, 2017 - $771 million net asset).
Significant changes in commodity net risk management assets (liabilities) during the 3 months ended March 31, 2018 are primarily attributable to the settlement of contracts, unfavourable market price changes on existing contracts, partially offset by favourable foreign exchange rates.
The following tables summarize the key factors impacting the fair value of the Level III commodity risk management assets and liabilities by classification level during the years ended Dec. 31, 2018 and 2017, respectively:
3 months ended March 31, 2018 | 3 months ended March 31, 2017 | ||||||||||||
Hedge | Non-hedge | Total | Hedge | Non-hedge | Total | ||||||||
Opening balance | 719 | 52 | 771 | 726 | 32 | 758 | |||||||
Changes attributable to: | |||||||||||||
Market price changes on existing contracts | 4 | (19 | ) | (15 | ) | 40 | 8 | 48 | |||||
Market price changes on new contracts | — | 1 | 1 | — | 8 | 8 | |||||||
Contracts settled | (22 | ) | (25 | ) | (47 | ) | (15 | ) | (3 | ) | (18 | ) | |
Change in foreign exchange rates | 18 | 1 | 19 | (12 | ) | — | (12 | ) | |||||
Transfers into Level III | — | (4 | ) | (4 | ) | — | — | — | |||||
Net risk management assets at end of period | 719 | 6 | 725 | 739 | 45 | 784 | |||||||
Additional Level III information: | |||||||||||||
Gains recognized in other comprehensive income | 22 | — | 22 | 28 | — | 28 | |||||||
Total gains (losses) included in earnings before income taxes | 22 | (17 | ) | 5 | 15 | 16 | 31 | ||||||
Unrealized gains (losses) included in earnings before income taxes relating to net assets held at period end | — | (42 | ) | (42 | ) | — | 13 | 13 | |||||
III. Other Risk Management Assets and Liabilities
Other risk management assets and liabilities primarily include risk management assets and liabilities that are used in managing exposures on non-energy marketing transactions such as interest rates, the net investment in foreign operations, and other foreign currency risks. Hedge accounting is not always applied.
Other risk management assets and liabilities with a total net liability fair value of $2 million as at March 31, 2018 (Dec. 31, 2017 - $34 million net asset) are classified as Level II fair value measurements. The significant changes in other net risk management assets during three months ended Dec. 31, 2018, are primarily attributable to the settlement of contracts.
IV. Other Financial Assets and Liabilities
The fair value of financial assets and liabilities measured at other than fair value is as follows:
Fair value | Total carrying | |||||||||
Level I | Level II | Level III | Total | value | ||||||
Long-term debt - March 31, 2018 | — | 3,358 | — | 3,358 | 3,345 | |||||
Long-term debt - Dec. 31, 2017 | — | 3,708 | — | 3,708 | 3,638 | |||||
The fair values of the Corporation’s debentures and senior notes are determined using prices observed in secondary markets. Non-recourse and other long-term debt fair values are determined by calculating an implied price based on a current assessment of the yield to maturity.
The carrying amount of other short-term financial assets and liabilities (cash and cash equivalents, trade accounts receivable, restricted cash, accounts payable and accrued liabilities, collateral received, and dividends payable) approximates fair value due to the liquid nature of the asset or liability. The fair values of the Corporation's loan receivable and the finance lease receivables approximate the carrying amounts.
TRANSALTA CORPORATION F21
C. Inception Gains and Losses
The majority of derivatives traded by the Corporation are based on adjusted quoted prices on an active exchange or extend beyond the time period for which exchange-based quotes are available. The fair values of these derivatives are determined using inputs that are not readily observable. Refer to section B of this note for fair value Level III valuation techniques used. In some instances, a difference may arise between the fair value of a financial instrument at initial recognition (the “transaction price”) and the amount calculated through a valuation model. This unrealized gain or loss at inception is recognized in net earnings (loss) only if the fair value of the instrument is evidenced by a quoted market price in an active market, observable current market transactions that are substantially the same, or a valuation technique that uses observable market inputs. Where these criteria are not met, the difference is deferred on the Condensed Consolidated Statements of Financial Position in risk management assets or liabilities, and is recognized in net earnings (loss) over the term of the related contract. The difference between the transaction price and the fair value determined using a valuation model, yet to be recognized in net earnings, and a reconciliation of changes is as follows:
3 months ended March 31 | 2018 | 2017 | ||
Unamortized net gain at beginning of period | 105 | 148 | ||
New inception gain (loss) | (16 | ) | 5 | |
Change in foreign exchange rates | 3 | (2 | ) | |
Amortization recorded in net earnings during the year | (8 | ) | (8 | ) |
Unamortized net gain at end of period | 84 | 143 | ||
10. Risk Management Activities
A. Risk Management Strategy
The Corporation is exposed to market risk from changes in commodity prices, foreign exchange rates, interest rates, credit risk and liquidity risk. These risks affect the Corporation’s earnings and the value of associated financial instruments that the Corporation holds. In certain cases, the Corporation seeks to minimize the effects of these risks by using derivatives to hedge its risk exposures. The Corporation’s risk management strategy, policies and controls are designed to ensure that the risks it assumes comply with the Corporation’s internal objectives and its risk tolerance.
The Corporation has two primary streams of risk management activities: (i) financial exposure management and (ii) commodity exposure management. Within these activities, risks identified for management include commodity risk, interest rate risk, liquidity risk, equity price risk, and foreign currency risk.
The Corporation seeks to minimize the effects of commodity risk, interest rate risk and foreign currency risk by using derivative financial instruments to hedge risk exposures. Of these derivatives, the Corporation applies hedge accounting to those hedging commodity price risk and foreign currency risk.
The use of financial derivatives is governed by the Corporation’s policies approved by the Board, which provide written principles on commodity risk, interest rate risk, liquidity risk, equity price risk and foreign currency risk, as well as the use of financial derivatives and non-derivative financial instruments.
Liquidity risk, credit risk and equity price risk are managed through means other than derivatives or hedge accounting.
The Corporation enters into various derivative transactions as well as other contracting activities that do not qualify for hedge accounting or where a choice was made not to apply hedge accounting. As a result, the related assets and liabilities are classified as derivatives at fair value through profit and loss . The net realized and unrealized gains or losses from changes in the fair value of these derivatives are reported in net earnings in the period the change occurs.
The Corporation designates certain derivatives as hedging instruments to hedge commodity price risk, foreign currency exchange risk in cash flow hedges and hedges of net investments in a foreign operations. Hedges of foreign exchange risk on firm commitments are accounted for as cash flow hedges.
F22 TRANSALTA CORPORATION
At the inception of the hedge relationship, the Corporation documents the relationship between the hedging instrument and the hedged item, along with its risk management objectives and its strategy for undertaking various hedge transactions. At the inception of the hedge and on an ongoing basis, the Corporation also documents whether the hedging instrument is effective in offsetting changes in fair values or cash flows of the hedged item attributable to the hedged risk, which is when the hedging relationships meet all of the following hedge effectiveness requirements:
▪ | There is an economic relationship between the hedged item and the hedging instrument; |
▪ | The effect of credit risk does not dominate the value changes that result from that economic relationship; and |
▪ | The hedge ratio of the hedging relationship is the same as that resulting from the quantity of the hedged item that the Corporation actually hedges and the quantity of the hedging instrument that the entity actually uses to hedge that quantity of hedged item. |
If a hedging relationship ceases to meet the hedge effectiveness requirement relating to the hedge ratio, but the risk management objective for that designated hedging relationship remains the same, the Corporation adjusts the hedge ratio of the hedging relationship so that it continues to meet the qualifying criteria.
B. Net Risk Management Assets and Liabilities
Aggregate net risk management assets and (liabilities) are as follows:
As at March 31, 2018 | ||||||
Cash flow hedges | Not designated as a hedge | Total | ||||
Commodity risk management | ||||||
Current | 81 | 17 | 98 | |||
Long-term | 621 | 30 | 651 | |||
Net commodity risk management assets | 702 | 47 | 749 | |||
Other | ||||||
Current | 2 | (1 | ) | 1 | ||
Long-term | (1 | ) | (2 | ) | (3 | ) |
Net other risk management assets (liabilities) | 1 | (3 | ) | (2 | ) | |
Total net risk management assets | 703 | 44 | 747 | |||
As at Dec. 31, 2017 | ||||||
Cash flow hedges | Not designated as a hedge | Total | ||||
Commodity risk management | ||||||
Current | 74 | 7 | 81 | |||
Long-term | 636 | 11 | 647 | |||
Net commodity risk management assets | 710 | 18 | 728 | |||
Other | ||||||
Current | — | 37 | 37 | |||
Long-term | — | (3 | ) | (3 | ) | |
Net other risk management assets (liabilities) | — | 34 | 34 | |||
Total net risk management assets (liabilities) | 710 | 52 | 762 | |||
TRANSALTA CORPORATION F23
C. Nature and Extent of Risks Arising from Financial Instruments
The following discussion is limited to the nature and extent of certain risks arising from financial instruments, which are also more fully discussed in Note 14(b) of the Corporation's most recent annual consolidated financial statements.
I. Market Risk
a. Commodity Price Risk
The Corporation has exposure to movements in certain commodity prices in both its electricity generation and proprietary trading businesses, including the market price of electricity and fuels used to produce electricity. Most of the Corporation’s electricity generation and related fuel supply contracts are considered to be contracts for delivery or receipt of a non-financial item in accordance with the Corporation’s expected own use requirements and are not considered to be financial instruments. As such, the discussion related to commodity price risk is limited to the Corporation’s proprietary trading business and commodity derivatives used in hedging relationships associated with the Corporation’s electricity generating activities.
i. Commodity Price Risk – Proprietary Trading
The Corporation’s Energy Marketing segment conducts proprietary trading activities and uses a variety of instruments to manage risk, earn trading revenue, and gain market information.
In compliance with the Commodity Exposure Management Policy, proprietary trading activities are subject to limits and controls, including Value at Risk (“VaR”) limits. The Board approves the limit for total VaR from proprietary trading activities. VaR is the most commonly used metric employed to track and manage the market risk associated with trading positions. A VaR measure gives, for a specific confidence level, an estimated maximum pre-tax loss that could be incurred over a specified period of time. VaR is used to determine the potential change in value of the Corporation’s proprietary trading portfolio, over a three-day period within a 95 per cent confidence level, resulting from normal market fluctuations. VaR is estimated using the historical variance/covariance approach.VaR is a measure that has certain inherent limitations. The use of historical information in the estimate assumes that price movements in the past will be indicative of future market risk. As such, it may only be meaningful under normal market conditions. Extreme market events are not addressed by this risk measure. In addition, the use of a three-day measurement period implies that positions can be unwound or hedged within three days, although this may not be possible if the market becomes illiquid.
Changes in market prices associated with proprietary trading activities affect net earnings in the period that the price changes occur. VaR at March 31, 2018, associated with the Corporation’s proprietary trading activities was $2 million (Dec. 31, 2017 - $5 million ).
ii. Commodity Price Risk - Generation
The generation segments utilize various commodity contracts to manage the commodity price risk associated with electricity generation, fuel purchases, emissions, and byproducts, as considered appropriate. A Commodity Exposure Management Policy is prepared and approved annually, which outlines the intended hedging strategies associated with the Corporation’s generation assets and related commodity price risks. Controls also include restrictions on authorized instruments, management reviews on individual portfolios, and approval of asset transactions that could add potential volatility to the Corporation’s reported net earnings.
TransAlta has entered into various contracts with other parties whereby the other parties have agreed to pay a fixed price for electricity to TransAlta. While not all of the contracts create an obligation for the physical delivery of electricity to other parties, the Corporation has the intention and believes it has sufficient electrical generation available to satisfy these contracts and, where able, has designated these as cash flow hedges for accounting purposes. As a result, changes in market prices associated with these cash flow hedges do not affect net earnings in the period in which the price change occurs. Instead, changes in fair value are deferred until settlement through AOCI, at which time the net gain or loss resulting from the combination of the hedging instrument and hedged item affects net earnings.
VaR at March 31, 2018, associated with the Corporation’s commodity derivative instruments used in generation hedging activities was $8 million (Dec. 31, 2017 - $16 million). For positions and economic hedges that do not meet hedge accounting requirements or for short-term optimization transactions such as buybacks entered into to offset existing hedge positions, these transactions are marked to the market value with changes in market prices associated with these transactions affecting net earnings in the period in which the price change occurs. VaR at March 31, 2018, associated with these transactions was $2 million (Dec. 31, 2017 - $5 million).
F24 TRANSALTA CORPORATION
b. Currency Rate Risk
The Corporation has exposure to various currencies, such as the US dollar, the Japanese yen, the euro and the Australian dollar (“AUD”), as a result of investments and operations in foreign jurisdictions, the net earnings from those operations, and the acquisition of equipment and services from foreign suppliers. Further discussion on Currency Rate Risk can be found in Note 14(B)(I)(c) of the Corporation's most recent annual consolidated financial statements.
II. Credit Risk
Credit risk is the risk that customers or counterparties will cause a financial loss for the Corporation by failing to discharge their obligations, and the risk to the Corporation associated with changes in creditworthiness of entities with which commercial exposures exist. The Corporation actively manages its exposure to credit risk by assessing the ability of counterparties to fulfil their obligations under the related contracts prior to entering into such contracts. The Corporation makes detailed assessments of the credit quality of all counterparties and, where appropriate, obtains corporate guarantees, cash collateral, third-party credit insurance, and/or letters of credit to support the ultimate collection of these receivables. For commodity trading and origination, the Corporation sets strict credit limits for each counterparty and monitors exposures on a daily basis. TransAlta uses standard agreements that allow for the netting of exposures and often include margining provisions. If credit limits are exceeded, TransAlta will request collateral from the counterparty or halt trading activities with the counterparty.
The Corporation uses external credit ratings, as well as internal ratings in circumstances where external ratings are not available, to establish credit limits for customers and counterparties. The following table outlines the Corporation’s maximum exposure to credit risk without taking into account collateral held, including the distribution of credit ratings, as at March 31, 2018:
Investment grade (Per cent) | Non-investment grade (Per cent) | Total (Per cent) | Total amount | |||||
Trade and other receivables(1) | 81 | 19 | 100 | 671 | ||||
Long-term finance lease receivables | 97 | 3 | 100 | 209 | ||||
Risk management assets(1) | 99 | 1 | 100 | 876 | ||||
Loan receivable(2) | — | 100 | 100 | 33 | ||||
Total | 1,789 | |||||||
(1) Letters of credit and cash and cash equivalents are the primary types of collateral held as security related to these amounts.
(2) The counterparty has no external credit rating. Excludes $5 million current portion classified in trade and other receivables.
The maximum credit exposure to any one customer for commodity trading operations and hedging, including the fair value of open trades, net of any collateral held, at March 31, 2018, was $16 million (Dec. 31, 2017 - $40 million).
III. Liquidity Risk
Liquidity risk relates to the Corporation’s ability to access capital to be used for proprietary trading activities, commodity hedging, capital projects, debt refinancing, and general corporate purposes. As at March 31, 2018, TransAlta maintains investment grade ratings from three credit rating agencies. TransAlta is focused on strengthening its financial position and maintaining investment grade credit ratings with these major rating agencies.
TRANSALTA CORPORATION F25
A maturity analysis of the Corporation’s financial liabilities is as follows:
2018 | 2019 | 2020 | 2021 | 2022 | 2023 and thereafter | Total | ||||||||
Accounts payable and accrued liabilities | 496 | — | — | — | — | — | 496 | |||||||
Long-term debt(1) | 117 | 467 | 472 | 399 | 594 | 1,322 | 3,371 | |||||||
Commodity risk management assets | 78 | 111 | 94 | 103 | 103 | 260 | 749 | |||||||
Other risk management (assets) liabilities | 1 | (3 | ) | (2 | ) | (1 | ) | 3 | — | (2 | ) | |||
Finance lease obligations | 13 | 15 | 12 | 7 | 4 | 15 | 66 | |||||||
Interest on long-term debt and finance lease obligations(2) | 161 | 153 | 124 | 103 | 97 | 702 | 1,340 | |||||||
Dividends payable | 34 | — | — | — | — | — | 34 | |||||||
Total | 900 | 743 | 700 | 611 | 801 | 2,299 | 6,054 | |||||||
(1) Excludes impact of hedge accounting.
(2) Not recognized as a financial liability on the Condensed Consolidated Statements of Financial Position.
D. Collateral and Contingent Features in Derivative Instruments
Collateral is posted in the normal course of business based on the Corporation’s senior unsecured credit rating as determined by certain major credit rating agencies. Certain of the Corporation’s derivative instruments contain financial assurance provisions that require collateral to be posted only if a material adverse credit-related event occurs. If a material adverse event resulted in the Corporation’s senior unsecured debt falling below investment grade, the counterparties to such derivative instruments could request ongoing full collateralization.
As at March 31, 2018, the Corporation had posted collateral of $149 million (Dec. 31, 2017 - $131 million) in the form of letters of credit on derivative instruments in a net liability position. Certain derivative agreements contain credit-risk-contingent features, which if triggered could result in the Corporation having to post an additional $69 million (Dec. 31, 2017 - $96 million) of collateral to its counterparties.
11. Property, Plant, and Equipment
A reconciliation of the changes in the carrying amount of PP&E is as follows:
Land | Coal generation | Gas generation | Renewable generation | Mining property and equipment | Assets under construction | Capital spares and other(1) | Total | |||||||||
As at As at Dec. 31, 2017 | 95 | 2,457 | 910 | 2,191 | 602 | 95 | 228 | 6,578 | ||||||||
Additions | — | — | — | — | — | 19 | 4 | 23 | ||||||||
Additions - finance lease | — | — | — | — | 1 | — | — | 1 | ||||||||
Acquisitions (Note 3) | — | — | — | — | — | 4 | — | 4 | ||||||||
Depreciation | — | (64 | ) | (20 | ) | (31 | ) | (28 | ) | — | (4 | ) | (147 | ) | ||
Revisions and additions to decommissioning and restoration costs | — | (6 | ) | (1 | ) | (1 | ) | (2 | ) | — | — | (10 | ) | |||
Retirement of assets and (disposals) | — | — | (1 | ) | — | (2 | ) | — | — | (3 | ) | |||||
Change in foreign exchange rates | 1 | 7 | 6 | 6 | 1 | — | 2 | 23 | ||||||||
Transfers | — | 14 | 1 | 2 | 4 | (24 | ) | 3 | — | |||||||
As at March 31, 2018 | 96 | 2,408 | 895 | 2,167 | 576 | 94 | 233 | 6,469 | ||||||||
(1) Includes major spare parts and stand-by equipment available, but not in service, and spare parts used for routine, preventive, or planned maintenance.
F26 TRANSALTA CORPORATION
12. Credit Facilities, Long-Term Debt, and Finance Lease Obligations
A. Credit Facilities, Debt and Letters of Credit
The amounts outstanding are as follows:
As at | March 31, 2018 | Dec. 31, 2017 | ||||||||||
Carrying value | Face value | Interest(1) | Carrying value | Face value | Interest(1) | |||||||
Credit facilities(2) | 325 | 325 | 3.3 | % | 27 | 27 | 2.8 | % | ||||
Debentures | 1,047 | 1,051 | 6.0 | % | 1,046 | 1,051 | 6.0 | % | ||||
Senior notes(3) | 891 | 903 | 5.4 | % | 1,499 | 1,510 | 6.0 | % | ||||
Non-recourse(4) | 1,010 | 1,021 | 4.3 | % | 1,022 | 1,032 | 4.3 | % | ||||
Other(5) | 72 | 71 | 7.1 | % | 44 | 44 | 9.2 | % | ||||
3,345 | 3,371 | 3,638 | 3,664 | |||||||||
Finance lease obligations | 66 | 69 | ||||||||||
3,411 | 3,707 | |||||||||||
Less: current portion of long-term debt | (123 | ) | (729 | ) | ||||||||
Less: current portion of finance lease obligations | (17 | ) | (18 | ) | ||||||||
Total current long-term debt and finance lease obligations | (140 | ) | (747 | ) | ||||||||
Total credit facilities, long-term debt, and finance lease obligations | 3,271 | 2,960 | ||||||||||
(1) Interest is an average rate weighted by principal amounts outstanding before the effect of hedging.
(2) Composed of bankers’ acceptances and other commercial borrowings under long-term committed credit facilities.
(3) US face value at March 31, 2018 - US$0.7 billion (Dec. 31, 2017 - US$1.2 billion).
(4) Includes US$25 million at March 31, 2018 (Dec. 31, 2017 - US$27 million).
(5) Includes US$23 million at March 31, 2018 (Dec. 31, 2017 - US$24 million) of tax equity financing.
On March 15, 2018, the Corporation early redeemed its outstanding 6.650 per cent US $500 million Senior Notes due May 15, 2018. The repayment was hedged with foreign exchange forwards and cross currency swaps. The redemption price for the notes was approximately $617 million (US$516 million), including a $5 million early redemption premium, recognized in net interest expense, and $14 million in accrued and unpaid interest to the redemption date.
As a result of the Corporation's repayment of its US$500 million Senior Notes the Corporation now has US$380 million (Dec. 31, 2017 - US$480 million) of US-dollar-denominated debt designated as hedges of its net investment in foreign operations.
The Corporation has a total of $2.0 billion (Dec. 31, 2017 - $2.0 billion) of committed credit facilities, comprised of the Corporation's $1.0 billion committed syndicated bank credit facility, TransAlta Renewables’ committed syndicated bank credit facility of $500 million (Dec. 31, 2017 - $500 million), and the Corporation's US$200 million and $240 million committed bilateral facilities. These facilities expire in 2021, 2021, 2020, and 2019 respectively. The $1.5 billion (Dec. 31, 2017 - $1.5 billion) committed syndicated bank facilities are the primary source for short-term liquidity after the cash flow generated from the Corporation's business.
In total, $1.1 billion (Dec. 31, 2017 - $1.4 billion) is not drawn. At March 31, 2018, the $0.9 billion (Dec. 31, 2017 - $0.6 billion) of credit utilized under these facilities was comprised of actual drawings of $0.3 billion (Dec. 31, 2017 - nil) and letters of credit of $0.6 billion (Dec. 31, 2017 - $0.6 billion). The Corporation is in compliance with the terms of the credit facilities and all undrawn amounts are fully available. In addition to the $1.1 billion available under the credit facilities, the Corporation also has $329 million of available cash and cash equivalents.
The Corporation's total outstanding letters of credit as at March 31, 2018 were $639 million (Dec. 31, 2017 - $677 million), including TransAlta Renewables outstanding letters of credit of $69 million (Dec. 31, 2017 - $69 million) with no (Dec. 31, 2017 - nil) amounts exercised by third parties under these arrangements. The Corporation and TransAlta Renewables both have an uncommitted $100 million demand letter of credit facility.
TRANSALTA CORPORATION F27
TransAlta’s debt has terms and conditions, including financial covenants, that are considered normal and customary. As at March 31, 2018, the Corporation was in compliance with all debt covenants.
B. Restrictions on Non-Recourse Debt
The Corporation's subsidiaries have issued non-recourse bonds of $1,010 million (Dec. 31, 2017 - $1,022 million) that are subject to customary financing conditions and covenants that may restrict the Corporation’s ability to access funds generated by the facilities’ operations. Upon meeting certain distribution tests, typically performed once per quarter, the funds are able to be distributed by the subsidiary entities to their respective parent entity. These conditions include meeting a debt service coverage ratio prior to distribution, which was met by these entities in the first quarter. However, funds in these entities that have accumulated since the first quarter test will remain there until the next debt service coverage ratio can be calculated in the second quarter of 2018. At March 31, 2018, $53 million (Dec. 31, 2017 -$35 million) of cash was subject to these financial restrictions.
Additionally, certain non-recourse bonds require that certain reserve accounts be established and funded through cash held on deposit and/or by providing letters of credit. The Corporation has elected to use letters of credit as at March 31, 2018. However, as at March 31, 2018, $1 million (Dec. 31, 2017 - $1 million) of cash was on deposit for certain reserve accounts that do not allow the use of letter of credits and was not available for general use.
C. Security
Non-recourse debts of $845 million in total (Dec. 31, 2017 - $848 million) are each secured by a first ranking charge over all of the respective assets of the Corporation’s subsidiaries that issued the bonds, which includes certain renewable generation facilities with total carrying amounts of $1,094 million at March 31, 2018 (Dec. 31, 2017 - $1,107 million). At March 31, 2018, a non-recourse bond of approximately $165 million (Dec. 31, 2017 - $174 million) is secured by a first ranking charge over the equity interests of the issuer that issued the non-recourse bond.
D. Restricted Cash
The Corporation has $31 million (Dec. 31, 2017 - $30 million) of restricted cash related to the Kent Hills project financing which is held in a construction reserve account. The proceeds will be released from the construction reserve account upon certain conditions being met, including commissioning of the Kent Hills 3 wind project.
F28 TRANSALTA CORPORATION
13. Common Shares
A. Issued and Outstanding
TransAlta is authorized to issue an unlimited number of voting common shares without nominal or par value.
3 months ended March 31 | 2018 | 2017 | ||||||
Common shares (millions) | Amount | Common shares (millions) | Amount | |||||
Issued and outstanding, beginning of period | 287.9 | 3,095 | 287.9 | 3,095 | ||||
Shares purchased and retired under NCIB | (0.4 | ) | (4 | ) | — | — | ||
287.5 | 3,091 | 287.9 | 3,095 | |||||
Amounts receivable under Employee Share Purchase Plan | — | (1 | ) | — | (1 | ) | ||
Issued and outstanding, end of period | 287.5 | 3,090 | 287.9 | 3,094 | ||||
B. NCIB Program
Shares purchased by the Corporation under the NCIB are recognized as a reduction to share capital equal to the average carrying value of the common shares. Any difference between the aggregate purchase price and the average carrying value of the common shares is recorded in retained earnings.
The following are the effects of the Corporation's purchase and cancellation of the common shares during the three months ended March 31, 2108:
As at | March 31, 2018 | Dec. 31, 2017 | |||||
Total shares purchased | 374,900 | — | |||||
Average purchase price per share | $ | 6.97 | — | ||||
Total cost | 3 | — | |||||
Weighted average book value of shares cancelled | 4 | — | |||||
Increase to retained earnings | (1 | ) | — | ||||
C. Dividends
On April 19, 2018, the Corporation declared a quarterly dividend of $0.04 per common share, payable on July 3, 2018.
There have been no other transactions involving common shares between the reporting date and the date of completion of these consolidated financial statements.
D. Stock Options
The stock options granted to executive officers of the Corporation during the three months ended March 31, 2018 and 2017 are as follows:
Grant month | Number of stock options granted (millions) | Exercise price | Vesting period (years) | Expiration length (years) | |||||
March 2018 | 0.7 | $ | 7.45 | 3 | 7 | ||||
March 2017 | 0.7 | $ | 7.25 | 3 | 7 | ||||
TRANSALTA CORPORATION F29
14. Preferred Shares
A. Issued and Outstanding
All preferred shares issued and outstanding are non-voting cumulative redeemable fixed rate first preferred shares, other than the Series B preferred shares which are non-voting cumulative redeemable floating rate first preferred shares.
As at March 31, 2018 and Dec. 31, 2017, the Corporation had 10.2 million Series A, 11.0 million Series C, 9.0 million Series E, 6.6 million Series G Cumulative Redeemable Rate Rest First Preferred Shares issued and outstanding and 1.8 million Series B Cumulative Redeemable Floating Rate First Preferred Shares issued and outstanding.
B. Dividends
The following summarizes the preferred share dividends declared within the three months ended March 31:
3 months ended March 31 | |||||
Series | Quarterly amounts per share | 2018 | 2017(1) | ||
A | 0.16931 | 2 | — | ||
B | 0.17889(2) | — | — | ||
C | 0.25169 | 3 | — | ||
E | 0.32463 | 3 | — | ||
G | 0.33125 | 2 | — | ||
Total for period | 10 | — | |||
(1) No dividends were declared in the first quarter of 2017 as on Dec. 19, 2016, the quarterly dividend related to the period covering the first quarter of 2017 was declared.
(2) Series B Preferred Shares pay quarterly dividends at a floating rate based on the 90-day Government of Canada Treasury Bill rate, plus 2.03 per cent, and represented approximately $300 thousand in dividends.
On April 19, 2018 the Corporation declared a quarterly dividend of $0.16931 per share on the Series A preferred shares, $0.19951 per share on the Series B preferred shares, $0.25169 per share on the Series C preferred shares, $0.32463 per share on the Series E preferred shares, and $0.33125 per share on the Series G preferred shares, all payable on July 3, 2018.
15. Commitments and Contingencies
A. Contingencies
TransAlta is occasionally named as a party in various claims and legal and regulatory proceedings that arise during the normal course of its business. TransAlta reviews each of these claims, including the nature of the claim, the amount in dispute or claimed, and the availability of insurance coverage. There can be no assurance that any particular claim will be resolved in the Corporation’s favour or that such claims may not have a material adverse effect on TransAlta. Inquiries from regulatory bodies may also arise in the normal course of business, to which the Corporation responds as required.
I. Line Loss Rule Proceeding
The Corporation has been participating in a line loss rule proceeding (the “LLRP”) before the Alberta Utilities Commission ("AUC"). The AUC determined that it has the ability to retroactively adjust line loss charges going back to 2006 and directed the Alberta Electric System Operator to, among other things, perform such retroactive calculations. The various decisions by the AUC are, however, subject to appeal and challenge. A recent decision by the AUC determined the methodology to be used retroactively and it is now possible to estimate the total potential retroactive exposure faced by the Corporation for its non-PPA MWs. The estimate of the maximum exposure is $15 million; however, if the Corporation and others are successful on the appeal of legal and jurisdictional questions regarding retroactivity, the amount owing will be nil. The Corporation has recorded a provision of $7.5 million as at March 31, 2018 and Dec. 31, 2017.
F30 TRANSALTA CORPORATION
II. FMG Disputes
The Corporation is currently engaged in two pieces of litigation with Fortescue Metals Group Ltd. ("FMG"). The first arose as a result of FMG’s purported termination of the South Hedland PPA. TransAlta has sued FMG, seeking payment of amounts invoiced and not paid under the PPA, as well as a declaration that the PPA is valid and in force. FMG, on the other hand, seeks a declaration that the PPA was lawfully terminated.
The second matter involves FMG’s claims against TransAlta related to the transfer of the Solomon Power Station to FMG. FMG claims certain amounts related to the condition of the facility while TransAlta claims certain outstanding costs that should be reimbursed.
III. Balancing Pool Dispute
Pursuant to a written agreement, the Balancing Pool paid the Corporation approximately $157 million on March 29, 2018. The Corporation is disputing the termination payment it received. The Balancing Pool excludes certain mining assets that the Corporation believes should be included in the net book value calculation for an additional $56 million, which is subject to the PPA arbitration process.
16. Segment Disclosures
A. Reported Segment Earnings
I. Earnings Information
3 months ended March 31, 2018 | Canadian Coal | US Coal | Canadian Gas | Australian Gas | Wind and Solar | Hydro | Energy Marketing | Corporate | Total | |||||||||
Revenues | 269 | 87 | 62 | 41 | 86 | 27 | 17 | (1 | ) | 588 | ||||||||
Fuel and purchased power | 196 | 44 | 29 | 2 | 6 | 1 | — | (1 | ) | 277 | ||||||||
Gross margin | 73 | 43 | 33 | 39 | 80 | 26 | 17 | — | 311 | |||||||||
Operations, maintenance, and administration | 47 | 15 | 13 | 9 | 13 | 8 | 8 | 20 | 133 | |||||||||
Depreciation and amortization | 50 | 16 | 11 | 12 | 27 | 8 | — | 6 | 130 | |||||||||
Taxes, other than income taxes | 3 | 1 | 1 | — | 2 | 1 | — | — | 8 | |||||||||
Net other operating income | (168 | ) | — | — | — | — | — | — | — | (168 | ) | |||||||
Operating income (loss) | 141 | 11 | 8 | 18 | 38 | 9 | 9 | (26 | ) | 208 | ||||||||
Finance lease income | — | — | 2 | — | — | — | — | — | 2 | |||||||||
Net interest expense | (68 | ) | ||||||||||||||||
Foreign exchange loss | (2 | ) | ||||||||||||||||
Earnings before income taxes | 140 | |||||||||||||||||
TRANSALTA CORPORATION F31
3 months ended March 31, 2017 | Canadian Coal | US Coal | Canadian Gas | Australian Gas | Wind and Solar | Hydro | Energy Marketing | Corporate | Total | |||||||||
Revenues | 250 | 88 | 102 | 26 | 87 | 24 | 1 | — | 578 | |||||||||
Fuel and purchased power | 139 | 64 | 39 | 2 | 5 | 1 | — | — | 250 | |||||||||
Gross margin | 111 | 24 | 63 | 24 | 82 | 23 | 1 | — | 328 | |||||||||
Operations, maintenance, and administration | 44 | 13 | 12 | 7 | 12 | 8 | 5 | 24 | 125 | |||||||||
Depreciation and amortization | 70 | 15 | 9 | 7 | 27 | 8 | — | 7 | 143 | |||||||||
Taxes, other than income taxes | 3 | 1 | 1 | — | 2 | 1 | — | — | 8 | |||||||||
Net other operating income | (10 | ) | — | — | — | — | — | — | — | (10 | ) | |||||||
Operating income (loss) | 4 | (5 | ) | 41 | 10 | 41 | 6 | (4 | ) | (31 | ) | 62 | ||||||
Finance lease income | — | — | 3 | 13 | — | — | — | — | 16 | |||||||||
Net interest expense | (62 | ) | ||||||||||||||||
Foreign exchange loss | (1 | ) | ||||||||||||||||
Earnings before income taxes | 15 | |||||||||||||||||
B. Depreciation and Amortization on the Condensed Consolidated Statements of Cash Flows
The reconciliation between depreciation and amortization reported on the Condensed Consolidated Statements of Earnings and the Condensed Consolidated Statements of Cash Flows is presented below:
3 months ended March 31 | 2018 | 2017 | ||
Depreciation and amortization expense on the Condensed Consolidated Statements of Earnings | 130 | 143 | ||
Depreciation included in fuel and purchased power | 31 | 17 | ||
Depreciation and amortization on the Condensed Consolidated Statements of Cash Flows | 161 | 160 | ||
F32 TRANSALTA CORPORATION
Exhibit 1
(Unaudited)
The information set out below is referred to as “unaudited” as a means of clarifying that it is not covered by the audit opinion of the independent registered public accounting firm that has audited and reported on the Condensed Consolidated Financial Statements.
To the Financial Statements of TransAlta Corporation
EARNINGS COVERAGE RATIO
The following selected financial ratio is calculated for the year ended March 31, 2018:
Earnings coverage on long-term debt supporting the Corporation’s Shelf Prospectus
1.16 times
Earnings coverage on long-term debt on a net earnings basis is equal to net earnings before interest expense and income taxes, divided by interest expense including capitalized interest.
TRANSALTA CORPORATION F33

Management's Discussion and Analysis
TRANSALTA CORPORATION
First Quarter Report for 2018
This Management’s Discussion and Analysis (“MD&A”) contains forward-looking statements. These statements are based on certain estimates and assumptions and involve risks and uncertainties. Actual results may differ materially. See the Forward-Looking Statements section of this MD&A for additional information.
This MD&A should be read in conjunction with the unaudited interim condensed consolidated financial statements of TransAlta Corporation as at and for the three months ended March 31, 2018 and 2017, and should also be read in conjunction with the audited annual consolidated financial statements and MD&A contained within our 2017 Annual Integrated Report. In this MD&A, unless the context otherwise requires, “we”, “our”, “us”, the “Corporation”, and “TransAlta” refers to TransAlta Corporation and its subsidiaries. Our condensed consolidated financial statements have been prepared in accordance with International Financial Reporting Standards (“IFRS”) International Accounting Standards (“IAS”) 34 Interim Financial Reporting for Canadian publicly accountable enterprises as issued by the International Accounting Standards Board (“IASB”) and in effect at March 31, 2018. All tabular amounts in the following discussion are in millions of Canadian dollars unless otherwise noted. This MD&A is dated May 7, 2018. Additional information respecting TransAlta, including its Annual Information Form, is available on SEDAR at www.sedar.com, on EDGAR at www.sec.gov, and on our website at www.transalta.com. Information on or connected to our website is not incorporated by reference herein.
Additional IFRS Measures and Non-IFRS Measures
An additional IFRS measure is a line item, heading, or subtotal that is relevant to an understanding of the financial statements but is not a minimum line item mandated under IFRS, or the presentation of a financial measure that is relevant to an understanding of the financial statements but is not presented elsewhere in the financial statements. We have included line items entitled gross margin and operating income in our Condensed Consolidated Statements of Earnings (Loss) for the three months ended March 31, 2018 and 2017. Presenting these line items provides management and investors with a measurement of ongoing operating performance that is readily comparable from period to period.
We evaluate our performance and the performance of our business segments using a variety of measures. Certain of the financial measures discussed in this MD&A are not defined under IFRS and, therefore, should not be considered in isolation or as an alternative to or to be more meaningful than net earnings attributable to common shareholders or cash flow from operating activities, as determined in accordance with IFRS, when assessing our financial performance or liquidity. These measures may not be comparable to similar measures presented by other issuers and should not be considered in isolation or as a substitute for measures prepared in accordance with IFRS. Comparable EBITDA, FFO, comparable FFO, FCF, and cash flow generated by the business are non-IFRS measures that are presented in this MD&A. See the Reconciliation of Non-IFRS Measures and Discussion of Segmented Comparable Results sections of this MD&A for additional information.
Forward-Looking Statements
This MD&A, the documents incorporated herein by reference, and other reports and filings made with securities regulatory authorities include forward-looking statements or information (collectively referred to herein as “forward-looking statements”) within the meaning of applicable securities legislation. Forward-looking statements are presented for general information purposes only and not as specific investment advice. All forward-looking statements are based on our beliefs as well as assumptions based on information available at the time the assumptions were made and on management’s experience and perception of historical trends, current conditions, and expected future developments, as well as other factors deemed appropriate in the circumstances. Forward-looking statements are not facts, but only predictions and generally can be identified by the use of statements that include phrases such as "may", "will", "believe", "expect", "anticipate", "intend", "plan", "project", "estimate", "forecast", "foresee", "potential", "enable", "continue", or other comparable terminology. These statements are not guarantees of our future performance and are subject to risks, uncertainties, and other important factors that could cause our actual performance to be materially different from that projected.
In particular, this MD&A contains forward-looking statements pertaining to: our business model and anticipated future financial performance; our success in executing on our growth projects; the timing of the construction and commissioning of projects under development, including the Brazeau Hydro pumped storage Project, the Kent Hills 3 Wind Project, the Pennsylvania and New Hampshire wind projects, and their attendant costs and sources of funding; the benefits of the Brazeau Hydro Pumped Storage project; the pre-tax savings to be delivered by Project Greenlight; spending on growth and sustaining capital and productivity projects, including in connection with Project Greenlight; expectations in terms of the cost of operations, capital spending, and maintenance, and the variability of those costs; purchases of shares under the Normal Course Issue Bid ("NCIB"); the regulatory developments, including the Federal Governments release of regulations for gas-fired generation; the ruling by the Alberta Utilities Commission ("AUC") in respect of line losses including our estimated maximum exposure; the section titled “2018 Financial Outlook”; expectations related to future earnings and cash flow from operating and contracting activities (including estimates of full-year 2018 comparable earnings
TRANSALTA CORPORATION M1
before interest, depreciation and amortization (“EBITDA”), funds from operations (“FFO”) and free cash flow (“FCF”), and expected sustaining capital expenditures; Canadian Coal Fleet availability and capacity factor; contributions to gross margin for Energy Marketing in 2018; significant planned major outages in 2018 and lost production; expected governmental regulatory regimes and legislation, including the Government of Alberta’s intended shift to a capacity market and the expected impacts on us and the timing of the implementation of such regimes and regulations, as well as the cost of complying with resulting regulations and laws; expectations in respect of generation availability, capacity, and production; power prices in Alberta, Ontario, and the Pacific Northwest; expected financing of our capital expenditures; the anticipated financial impact of increased carbon prices, including under the Carbon Competitiveness Incentive Regulation (“CCIR”) in Alberta; our trading strategies and the risk involved in these strategies; the estimated impact of changes in interest rates and the value of the Canadian dollar relative to the US dollar, the Australian dollar, and other currencies in which we do business; our exposure to liquidity risk; expectations in respect of the global economic environment; expected cost savings and payback periods following the implementation of Project Greenlight and productivity initiatives; expectations relating to the performance of TransAlta Renewables Inc.’s (“TransAlta Renewables”) assets; expectations regarding our continued ownership of common shares of TransAlta Renewables; the refinancing of our upcoming debt maturities over the next two years; expectations regarding our de-leveraging strategy; expectations in respect of our community initiatives; impacts of future IFRS standards and the timing of the implementation of such standards; and amendments or interpretations by accounting standard setters prior to initial adoption of those standards.
Factors that may adversely impact our forward-looking statements include risks relating to: fluctuations in market prices and our ability to contract our generation for prices that will provide expected returns; the regulatory and political environments in the jurisdictions in which we operate; increasingly stringent environmental requirements and changes in, or liabilities under, these requirements; ability to compete effectively in the anticipated Alberta capacity market; changes in general economic conditions, including interest rates; operational risks involving our facilities, including unplanned outages at such facilities; growth, whether through acquisition or greenfield development; unanticipated operating conditions; disruptions in the transmission and distribution of electricity; the effects of weather; disruptions in the source of fuels, water, sun, or wind required to operate our facilities; natural or man-made disasters; physical risks related to climate change; the threat of terrorism and cyberattacks and our ability to manage such attacks; equipment failure and our ability to carry out or have completed the repairs in a cost-effective or timely manner; commodity risk management; industry risk and competition; fluctuations in the value of foreign currencies and foreign political risks; the need for additional financing and the ability to access financing at a reasonable cost and on reasonable terms; our ability to fund our growth projects; our ability to maintain our investment grade credit ratings; structural subordination of securities; counterparty credit risk; our ability to recover our losses through our insurance coverage; our provision for income taxes; outcomes of legal, regulatory, and contractual proceedings involving the Corporation including those with Fortescue Metals Group LTd. ("FMG"); outcomes of investigations and disputes; reliance on key personnel; labour relations matters; risks associated with development projects and acquisitions, including delays or changes in costs in the construction and commissioning of our two new US wind projects and the Kent Hills 3 wind project; and the maintenance or adoption of enabling regulatory frameworks or the satisfactory receipt of applicable regulatory approvals for existing and proposed operations and growth initiatives, including as it pertains to coal-to-gas conversions.
The foregoing risk factors, among others, are described in further detail in the Governance and Risk Management section of our MD&A for our 2017 annual consolidated financial statements and under the heading “Risk Factors” in our 2018 Annual Information Form.
Readers are urged to consider these factors carefully in evaluating the forward-looking statements and are cautioned not to place undue reliance on these forward-looking statements. The forward-looking statements included in this document are made only as of the date hereof and we do not undertake to publicly update these forward-looking statements to reflect new information, future events, or otherwise, except as required by applicable laws. In light of these risks, uncertainties, and assumptions, the forward-looking events might occur to a different extent or at a different time than we have described, or might not occur. We cannot assure that projected results or events will be achieved.
M2 TRANSALTA CORPORATION
Highlights
3 months ended March 31 | 2018 | 2017 | ||
Revenues | 588 | 578 | ||
Net earnings (loss) attributable to common shareholders | 65 | — | ||
Cash flow from operating activities | 425 | 281 | ||
Comparable EBITDA(1, 2) | 416 | 274 | ||
FFO(1, 2) | 318 | 202 | ||
FCF(1, 2) | 238 | 96 | ||
Net earnings (loss) per share attributable to common shareholders, basic and diluted | 0.23 | — | ||
FFO per share(1, 2) | 1.10 | 0.70 | ||
FCF per share(1, 2) | 0.83 | 0.33 | ||
Dividends declared per common share | 0.04 | — | ||
As at | March 31, 2018 | Dec. 31, 2017 | ||
Total assets | 9,963 | 10,304 | ||
Total consolidated net debt(3) | 3,081 | 3,363 | ||
Total long-term liabilities | 4,638 | 4,311 | ||
(1) These items are not defined under IFRS. Presenting these items from period to period provides management and investors with the ability to evaluate earnings trends more readily in comparison with prior periods’ results. Refer to the Reconciliation of Non-IFRS Measures section of this MD&A for further discussion of these items, including, where applicable, reconciliations to measures calculated in accordance with IFRS.
(2) During the fourth quarter of 2017, we revised our approach to reporting adjustments to arrive at FFO, mainly to better represent FFO as a cash metric. Previously, FFO was adjusted to include, exclude, or to modify the timing of cash impacts related to adjustments made in arriving at comparable EBITDA. As a result, comparable EBITDA, FFO, and FCF for 2017 has been revised accordingly.
(3) Total consolidated net debt includes long-term debt including current portion, amounts due under credit facilities, tax equity, and finance lease obligations, net of available cash and the fair value of economic hedging instruments on debt. See the table in the Capital Structure section of this MD&A for more details on the composition of net debt.
Our performance during the first quarter was similar to last year after adjusting for the Sundance B and C PPA termination payment in 2018 and the settlement of a PPA indexation dispute with the Ontario Electrical Financial Corporation ("OEFC") in 2017. Availability from our coal generating assets in Alberta was solid during the quarter at 90.5 per cent compared to last year of 83.7 per cent. Prices in Alberta increased almost 60 per cent to $35/MWh to reflect the impact of carbon taxes paid by certain generators. During the first quarter of 2018, our results included $157 million relating to the early termination of the Sundance B and C PPA, to replace future capacity payments we would have received over the next 3 years. We are disputing the amount received from the Balancing Pool as we believe an additional $56 million is due to us under the terms of the PPAs. Last year's results included $17 million relating to our share of the settlement of a prior years indexation dispute with the OEFC. Excluding these unusual payments in 2018 and 2017, our FCF for the quarter would have been $81 million ($0.28 per share) and $79 million ($0.27 per share), respectively.
In January, we permanently shut down Sundance Unit 1 and mothballed Sundance Unit 2 following the scheduled expiry of the Power Purchase Arrangements with the Balancing Pool for these two units, reducing our installed capacity from our Canadian Coal segment by 560 MW or 14 per cent. Last year, comparable EBITDA generated by these two units totalled $12 million.
Net earnings attributable to common shares totalled $65 million during the quarter compared to nil last year, due mostly to the positive contribution of the $157 million ($115 million after-tax) Sundance B and C PPA termination payment.
Segmented Cash Flow Generated by the Business
3 months ended March 31 | 2018 | 2017 | ||||
Segmented cash inflow (outflow) | ||||||
Canadian Coal(1) | 208 | 56 | ||||
US Coal | 18 | 3 | ||||
Canadian Gas(2) | 60 | 83 | ||||
Australian Gas | 31 | 30 | ||||
Wind and Solar | 65 | 65 | ||||
Hydro | 16 | 12 | ||||
Generation cash inflow | 398 | 249 | ||||
Energy Marketing | (18 | ) | 5 | |||
Corporate | (25 | ) | (26 | ) | ||
Total comparable cash inflow | 355 | 228 | ||||
(1) Includes $157 million received from the Balancing Pool for the early termination of Sundance B and C PPAs in the first quarter of 2018.
(2) Includes $17 million (our share) from the OEFC to settle an relating to the settlement of a prior years indexation dispute.
TRANSALTA CORPORATION M3
Segmented cash flows generated by the business measures the net cash generated by each of our segments after sustaining and productivity capital expenditures, reclamation costs, and provisions. It also excludes non-cash mark-to-market gains or losses. This is the cash flows available to pay our interest and cash taxes, distributions to our non-controlling partners and dividends to our preferred shareholders, grow the business, pay down debt and return capital to our shareholders. Cash flow generated by the business totalled $355 million during the first quarter of 2018, up $127 million compared to the same quarter in 2017. Despite higher availability in the first quarter, and higher prices, Canadian Coal's cash flow, excluding the termination payment, was down $5 million from 2017 due to the shutdown of the Sundance 1 and 2 units and higher coal costs. US coal improved by $15 million over 2017 due to lower purchased power costs and better rail costs. Canadian Gas returned to normal cash flow levels as 2017 recorded a one time adjustment of $17 million (our share, net of non-controlling interests) due to a payment from the OEFC for prior periods. Hydro's cash flow was up by $4 million due primarily to stronger pricing of ancillary services. Energy Marketing's cashflows were $23 million below 2017 due to the settlement in the quarter, of contracts with unrealized losses at Dec. 31, 2017. Overall, after accounting for the OEFC payment in 2017 and the Sundance B and C termination payment in 2018, cash flows from the businesses were $4 million higher during the first quarter of 2018 compared to 2017.
Significant Events
Our strategic focus continues to be reducing our corporate debt, improving our operating performance, and progressing our transition to clean power generation. We made the following progress throughout the period:
▪ | On Feb. 2, 2018, TransAlta Renewables entered into an arrangement to acquire two construction-ready wind projects in the Northeast United States. The wind development projects consist of: (i) a 90 Megawatt ("MW") project located in Pennsylvania which has a 15-year PPA and (ii) a 29 MW project located in New Hampshire with two 20-year PPAs (the "US Wind Projects"). All three counterparties have Standard & Poor's credit ratings of A+ or better. See the Significant and Subsequent Events section of this MD&A for further details. |
▪ | On March 15, 2018, we early redeemed our outstanding 6.650 per cent US $500 million Senior Notes due May 15, 2018. The redemption price for the Notes was approximately $617 million (US$516 million). Repayment of the US Senior notes were funded by cash on hand and our credit facility. See the Significant and Subsequent Events section of this MD&A for further details. |
▪ | During the quarter, we purchased and cancelled 374,900 Common Shares at an average price of $6.97 per Common Share through our NCIB program. See the Significant and Subsequent Events section of this MD&A for further details. |
▪ | On March 31, 2018, we received approximately $157 million in compensation for the termination of the Sundance B and C PPAs from the Balancing Pool. See the Significant and Subsequent Events section of this MD&A for further details. |
▪ | We permanently shutdown Sundance Unit 1 and mothballed Sundance Unit 2 on Jan. 1, 2018. We mothballed Sundance Unit 3 and Sundance Unit 5 on April 1, 2018. |
▪ | Donald Tremblay, Chief Financial Officer ("CFO") has chosen to leave the Corporation effective May 9, 2018 and will be returning to eastern Canada to be closer to his family. TransAlta has commenced a recruitment process for a new CFO. Brett Gellner, Chief Investment Officer, will act as Interim CFO, in addition to his current role, during the interim period. |
Adjusted Availability and Production
Adjusted availability for the three months ended March 31, 2018 was 93.9 per cent compared to 88.5 per cent for the same period in 2017. Canadian Coal, US Coal, and Australian Gas were all up compared to last year. Lower unplanned outages at Canadian and US Coal were the main cause of the increase in those segments.
Production for the three months ended March 31, 2018 was 7,171 gigawatt hours ("GWh"), compared to 9,051 GWh for the same period in 2017, mainly due to lower production at Canadian Coal due to higher paid curtailments on contracted assets, the retirement of Sundance Unit 1, and mothballing of Sundance Unit 2.
Electricity Prices
The average spot electricity prices in Alberta for the three months ended March 31, 2018 increased approximately 60 per cent compared to 2017 due to higher environmental levies and compliance costs which have increased the marginal cost to producers and tighter supply in the market. Natural gas prices were lower in the Pacific Northwest compared to last year and there were lower electricity loads due to warmer temperatures, which depressed electricity prices in the Pacific Northwest.
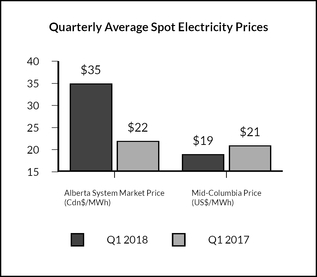
M4 TRANSALTA CORPORATION
Discussion of Consolidated Financial Results
We evaluate our performance and the performance of our business segments using a variety of measures. Comparable figures are not defined under IFRS. Those discussed below, and elsewhere in this MD&A, are not defined under IFRS and, therefore, should not be considered in isolation or as an alternative to or to be more meaningful than net earnings attributable to common shareholders or cash flow from operating activities, as determined in accordance with IFRS, when assessing our financial performance or liquidity. These measures are not necessarily comparable to a similarly titled measure of another company. Each business segment assumes responsibility for its operating results measured to comparable EBITDA and cash flows generated by the business. Gross margin is also a useful measure as it provides management and investors with a measurement of operating performance that is readily comparable from period to period.
Comparable EBITDA
EBITDA is a widely adopted valuation metric and an important metric for management that represents our core business profitability. Interest, taxes, and depreciation and amortization are not included, as differences in accounting treatments may distort our core business results. In addition, we reclassify certain transactions to facilitate the discussion on the performance of our business:
(i) | Certain assets we own in Canada and Australia are fully contracted and recorded as finance leases under IFRS. We believe it is more appropriate to reflect the payments we receive under the contracts as a capacity payment in our revenues instead of as finance lease income and a decrease in finance lease receivables. We depreciate these assets over their expected lives; |
(ii) | We also reclassify the depreciation on our mining equipment from fuel and purchased power to reflect the actual cash cost of our business in our comparable EBITDA; |
(iii) | In December 2016, we agreed to terminate our existing arrangement with the Independent Electricity System Operator (“IESO”) relating to our Mississauga cogeneration facility in Ontario and entered into a new Non-Utility Generator (“NUG”) Enhanced Dispatch Contract (the “NUG Contract”) effective Jan. 1, 2017. Under the new NUG Contract, we receive fixed monthly payments until Dec. 31, 2018 with no delivery obligations. Under IFRS, for our reported results in 2016, as a result of the NUG Contract, we recognized a receivable of $207 million (discounted), a pre-tax gain of approximately $191 million net of costs to mothball the units, and accelerated depreciation of $46 million. In 2017 and 2018, on a comparable basis, we record the payments we receive as revenues as a proxy for operating income, and continue to depreciate the facility until Dec. 31, 2018; and |
(iv) | On commissioning the South Hedland Power Station, we prepaid approximately $74 million of electricity transmission and distribution costs. Interest income is recorded on the prepaid funds. We reclassify this interest income as a reduction in the transmission and distribution costs expensed each period to reflect the net cost to the business. |
A reconciliation of net earnings (loss) attributable to common shareholders to comparable EBITDA results is set out below:
3 months ended March 31 | 2018 | 2017(1) | ||||
Net earnings attributable to common shareholders | 65 | — | ||||
Net earnings attributable to non-controlling interests | 28 | 32 | ||||
Preferred share dividends | 10 | — | ||||
Net earnings (loss) | 103 | 32 | ||||
Adjustments to reconcile net income to comparable EBITDA | ||||||
Depreciation and amortization | 130 | 143 | ||||
Foreign exchange loss | 2 | 1 | ||||
Net interest expense | 68 | 62 | ||||
Income tax expense (recovery) | 37 | (17 | ) | |||
Comparable reclassifications | ||||||
Decrease in finance lease receivables | 15 | 15 | ||||
Mine depreciation included in fuel cost | 31 | 17 | ||||
Australian interest income | 1 | — | ||||
Adjustments to earnings to arrive at comparable EBITDA | ||||||
Impacts associated with Mississauga recontracting(2) | 29 | 21 | ||||
Comparable EBITDA | 416 | 274 | ||||
(1) During the fourth quarter of 2017, we revised the way in which comparable EBITDA is reconciled to net earnings. Accordingly, 2017 results have been revised.
(2) Impacts associated with Mississauga recontracting for the three months ended March 31, 2018, are as follows: revenue $29 million (2017 - $27 million), fuel and purchased power and de-designated hedges nil (2017 - $4 million), and operations, maintenance, and administration nil (2017 - $2 million).
Net earnings and comparable EBITDA for the first quarter of 2018 include the $157 million ($115 million after-tax) Sundance B and C PPAs early termination payment from the Balancing Pool. Last year's net earnings and comparable EBITDA included the $34 million settlement with the OEFC ($12 million after-tax and non-controlling interests).
TRANSALTA CORPORATION M5
Funds from Operations and Free Cash Flow
FFO is an important metric as it provides a proxy for cash generated from operating activities before changes in working capital, and provides the ability to evaluate cash flow trends in comparison with results from prior periods. FCF is an important metric as it represents the amount of cash that is available to invest in growth initiatives, make scheduled principal repayments on debt, repay maturing debt, pay common share dividends, or repurchase common shares. Changes in working capital are excluded so FFO and FCF are not distorted by changes that we consider temporary in nature, reflecting, among other things, the impact of seasonal factors and timing of receipts and payments. FFO per share and FCF per share are calculated using the weighted average number of common shares outstanding during the period.
The table below reconciles our cash flow from operating activities to our FFO and FCF.
3 months ended March 31 | 2018 | 2017 | ||||
Cash flow from operating activities | 425 | 281 | ||||
Change in non-cash operating working capital balances | (123 | ) | (95 | ) | ||
Cash flow from operations before changes in working capital | 302 | 186 | ||||
Adjustment: | ||||||
Decrease in finance lease receivable | 15 | 15 | ||||
Other | 1 | 1 | ||||
FFO | 318 | 202 | ||||
Deduct: | ||||||
Sustaining capital | (24 | ) | (46 | ) | ||
Productivity capital | (4 | ) | (2 | ) | ||
Dividends paid on preferred shares | (10 | ) | (10 | ) | ||
Distributions paid to subsidiaries' non-controlling interests | (41 | ) | (47 | ) | ||
Other | (1 | ) | (1 | ) | ||
FCF | 238 | 96 | ||||
Weighted average number of common shares outstanding in the year | 288 | 288 | ||||
FFO per share | 1.10 | 0.70 | ||||
FCF per share | 0.83 | 0.33 | ||||
The increase in FCF was driven primarily by the Sundance B and C termination payment of $157 million and lower sustaining capital expenditures.
The table below bridges our comparable EBITDA to our FFO and FCF.
3 months ended March 31 | 2018 | 2017 | ||||
Comparable EBITDA | 416 | 274 | ||||
Interest expense | (53 | ) | (55 | ) | ||
Provisions | 5 | 1 | ||||
Unrealized gains (losses) from risk management activities | (31 | ) | 5 | |||
Current income tax expense | (9 | ) | (6 | ) | ||
Realized foreign exchange gain (loss) | 3 | 1 | ||||
Decommissioning and restoration costs settled | (7 | ) | (4 | ) | ||
Other cash and non-cash items | (6 | ) | (14 | ) | ||
FFO | 318 | 202 | ||||
Deduct: | ||||||
Sustaining capital | (24 | ) | (46 | ) | ||
Productivity capital | (4 | ) | (2 | ) | ||
Dividends paid on preferred shares | (10 | ) | (10 | ) | ||
Distributions paid to subsidiaries' non-controlling interests | (41 | ) | (47 | ) | ||
Other | (1 | ) | (1 | ) | ||
FCF | 238 | 96 | ||||
TRANSALTA CORPORATION M6
Segmented Comparable Results
Canadian Coal
3 months ended March 31 | 2018 | 2017 | ||
Availability (%) | 90.5 | 83.7 | ||
Contract production (GWh) | 3,300 | 4,971 | ||
Merchant production (GWh) | 909 | 1,003 | ||
Total production (GWh) | 4,209 | 5,974 | ||
Gross installed capacity (MW)(1) | 3,231 | 3,791 | ||
Revenues | 269 | 250 | ||
Fuel and purchased power | 165 | 122 | ||
Comparable gross margin | 104 | 128 | ||
Operations, maintenance, and administration | 47 | 44 | ||
Taxes, other than income taxes | 3 | 3 | ||
Net other operating income | (168 | ) | (10 | ) |
Comparable EBITDA | 222 | 91 | ||
Deduct: | ||||
Sustaining capital: | ||||
Routine capital | 4 | 5 | ||
Mine capital | 2 | 3 | ||
Finance leases | 3 | 4 | ||
Planned major maintenance | — | 17 | ||
Total sustaining capital expenditures | 9 | 29 | ||
Productivity capital | 1 | 1 | ||
Total sustaining and productivity capital expenditures | 10 | 30 | ||
Provisions | (3 | ) | (1 | ) |
Unrealized gains (losses) on risk management activities | 1 | 4 | ||
Decommissioning and restoration costs settled | 6 | 2 | ||
Canadian Coal cash flow | 208 | 56 | ||
(1) On Jan. 1, 2018, 560 MW Sundance Units 1 and 2 were shut down and mothballed, respectively.
Availability for the first quarter of 2018 improved compared to 2017 mainly due to no planned outages in the quarter compared to one planned outage in first quarter of 2017 relating to our Sundance Unit 6 and much lower levels of unplanned outages.
Production for the three months ended March 31, 2018 decreased 1,765 GWh compared to 2017, despite higher availability, due to the retirement of Sundance Unit 1 and the mothballing of Sundance Unit 2 as well as higher paid curtailments on units under PPAs.
Revenues and Fuel and purchased power both increased due to higher environmental compliance costs, which are mostly passed through to the PPA customer and higher mining costs. In both cases this was expected. The increase in revenues was due to higher pass through and the higher Alberta power prices due to increased environmental compliance costs.
Comparable EBITDA for the three months ended March 31, 2018 excluding the Sundance B and C PPA termination payment decreased $26 million compared to 2017. Gross margin was negatively impacted by the scheduled termination of the Sundance A PPA. The reduction of overall capacity due to the retirement of Sundance Unit 1 and the mothballing of Sundance Unit 2 and higher coal costs.
For the first quarter of 2018, sustaining and productivity capital expenditures decreased by $20 million compared to 2017, mainly due to lower planned outage expenditures. In 2017, one planned outage was performed on Sundance Unit 6, while during the first quarter of 2018 there were no planned major outages.
TRANSALTA CORPORATION M7
US Coal
3 months ended March 31 | 2018 | 2017 | ||
Availability (%) | 99.7 | 54.7 | ||
Adjusted availability (%)(1) | 99.7 | 86.7 | ||
Contract sales (GWh) | 821 | 905 | ||
Merchant sales (GWh) | 749 | 959 | ||
Purchased power (GWh) | (852 | ) | (1,052 | ) |
Total production (GWh) | 718 | 812 | ||
Gross installed capacity (MW) | 1,340 | 1,340 | ||
Revenues | 87 | 88 | ||
Fuel and purchased power | 44 | 64 | ||
Comparable gross margin | 43 | 24 | ||
Operations, maintenance, and administration | 15 | 13 | ||
Taxes, other than income taxes | 1 | 1 | ||
Comparable EBITDA | 27 | 10 | ||
Deduct: | ||||
Sustaining capital: | ||||
Finance leases | 1 | 1 | ||
Planned major maintenance | 5 | 5 | ||
Total sustaining capital expenditures | 6 | 6 | ||
Productivity capital | — | 1 | ||
Total sustaining and productivity capital expenditures | 6 | 7 | ||
Unrealized gains (losses) on risk management activities | 2 | (2 | ) | |
Decommissioning and restoration costs settled | 1 | 2 | ||
US Coal cash flow | 18 | 3 | ||
(1) Adjusted for economic dispatching.
Availability for the three months ended March 31, 2018 was up compared to 2017 as last year's performance was impacted by the forced outage on Unit 1 in January. In 2017 and 2018, both Units 1 and 2 commenced economic dispatching in February as a result of seasonally lower prices in the Pacific Northwest. This impacted our production for the quarter.
Contract sales are down compared to last year due to a 32 MW contract that ended in 2017.
Comparable EBITDA increased by $17 million compared to 2017, mainly due to purchasing power at lower power prices to fulfill our contract and hedge obligations and favourable impacts of mark-to-market on certain forward financial contracts that do not qualify for hedge accounting. Also positively impacting our comparable EBITDA is the reduction of our coal costs following renegotiation of our railway contracts with suppliers. Part of our fuel cost is now linked to natural gas prices, making the plant more competitive in a lower priced environment.
TRANSALTA CORPORATION M8
Canadian Gas
3 months ended March 31 | 2018 | 2017 | ||
Availability (%) | 98.7 | 100.0 | ||
Contract production (GWh) | 414 | 393 | ||
Merchant production (GWh) | 39 | 44 | ||
Total production (GWh) | 453 | 437 | ||
Gross installed capacity (MW) | 953 | 953 | ||
Revenues | 108 | 146 | ||
Fuel and purchased power | 29 | 43 | ||
Comparable gross margin | 79 | 103 | ||
Operations, maintenance, and administration | 13 | 14 | ||
Taxes, other than income taxes | 1 | 1 | ||
Comparable EBITDA | 65 | 88 | ||
Deduct: | ||||
Sustaining capital: | ||||
Routine capital | 1 | — | ||
Planned major maintenance | 1 | 3 | ||
Total sustaining capital expenditures | 2 | 3 | ||
Productivity capital | 1 | — | ||
Total sustaining and productivity capital expenditures | 3 | 3 | ||
Provisions | (2 | ) | 1 | |
Unrealized gains (losses) on risk management activities | 4 | 1 | ||
Canadian Gas cash flow | 60 | 83 | ||
Availability was down this quarter due to unplanned outages at Ottawa and seasonal and equipment derates at Sarnia.
Production for the first quarter of 2018 increased 16 GWh compared to 2017, mainly due to increased contract production at Fort Saskatchewan due to higher customer demand, partially offset by lower merchant production at Sarnia due to market conditions.
Comparable EBITDA for the first quarter of 2018 decreased by $23 million compared to 2017 despite the positive impact from the Mississauga recontracting and cost reduction initiatives, offset by the retroactive contract indexation dispute settlement received in 2017 ($34 million). The Mississauga, Ottawa, Windsor, and our 60 per cent share of Fort Saskatchewan, generating facilities are owned through our 51 per cent interest in TA Cogen.
Australian Gas
3 months ended March 31 | 2018 | 2017 | ||
Availability (%) | 91.7 | 89.9 | ||
Contract production (GWh) | 440 | 398 | ||
Gross installed capacity (MW) | 450 | 425 | ||
Revenues | 41 | 40 | ||
Fuel and purchased power | 1 | 2 | ||
Comparable gross margin | 40 | 38 | ||
Operations, maintenance, and administration | 9 | 7 | ||
Comparable EBITDA | 31 | 31 | ||
Deduct: | ||||
Sustaining capital: | ||||
Planned major maintenance | — | 1 | ||
Australian Gas cash flow | 31 | 30 | ||
TRANSALTA CORPORATION M9
Production for the first quarter of 2018 increased 42 GWh compared to 2017, due mostly to the commissioning of the South Hedland Power Station in July 2017, offset by the termination of the Solomon Power Station contract. Our contracts in Australia are capacity contracts, and our results are not directly impacted by generation.
Comparable EBITDA for the three months ended March 31, 2018 was in line with the same period in 2017. Gross margin from South Hedland was largely offset by the loss of gross margin from the Solomon Power Station contract.
Wind and Solar
3 months ended March 31 | 2018 | 2017 | ||
Availability (%) | 94.5 | 96.4 | ||
Contract production (GWh) | 749 | 742 | ||
Merchant production (GWh) | 279 | 313 | ||
Total production (GWh) | 1,028 | 1,055 | ||
Gross installed capacity (MW) | 1,363 | 1,363 | ||
Revenues | 86 | 87 | ||
Fuel and purchased power | 6 | 5 | ||
Comparable gross margin | 80 | 82 | ||
Operations, maintenance, and administration | 13 | 12 | ||
Taxes, other than income taxes | 2 | 2 | ||
Comparable EBITDA | 65 | 68 | ||
Deduct: | ||||
Sustaining capital: | ||||
Planned major maintenance | 3 | 3 | ||
Unrealized gains (losses) on risk management activities | (3 | ) | — | |
Wind and Solar cash flow | 65 | 65 | ||
Production for the first quarter of 2018 decreased by 27 GWh compared to 2017, mainly due to the sale of the Wintering Hills merchant facility on March 1, 2017. Wind generation in eastern Canada and in the US was in line with last year.
Comparable EBITDA for the first quarter of 2018 was down $3 million compared to 2017 mainly due to unrealized mark-to-market losses recognized this period.
TRANSALTA CORPORATION M10
Hydro
3 months ended March 31 | 2018 | 2017 | ||
Contract production (GWh) | 318 | 367 | ||
Merchant production (GWh) | 5 | 8 | ||
Total production (GWh) | 323 | 375 | ||
Gross installed capacity (MW) | 926 | 926 | ||
Revenues | 27 | 24 | ||
Fuel and purchased power | 1 | 1 | ||
Comparable gross margin | 26 | 23 | ||
Operations, maintenance, and administration | 8 | 8 | ||
Taxes, other than income taxes | 1 | 1 | ||
Comparable EBITDA | 17 | 14 | ||
Deduct: | ||||
Sustaining capital: | ||||
Routine capital | — | 1 | ||
Planned major maintenance | 1 | 1 | ||
Total sustaining capital expenditures | 1 | 2 | ||
Hydro cash flow | 16 | 12 | ||
Production for the first quarter of 2018 decreased by 52 GWh compared to 2017, primarily due to lower water resources.
Comparable EBITDA for the first quarter of 2018 increased by $3 million compared to 2017, primarily due to increase in revenues from higher pricing of Ancillary Services, which more than offset the lower generation.
Energy Marketing
3 months ended March 31 | 2018 | 2017 | ||
Revenues and gross margin | 17 | 1 | ||
Operations, maintenance, and administration | 8 | 5 | ||
Comparable EBITDA | 9 | (4 | ) | |
Deduct: | ||||
Provisions | — | (1 | ) | |
Unrealized gains (losses) on risk management activities | 27 | (8 | ) | |
Energy Marketing cash flow | (18 | ) | 5 | |
For the three months ended March 31, 2018, comparable EBITDA returned to a normal level and increased by $13 million compared to last year. Cashflows were $23 million below 2017 due to the settlement in the quarter, of contracts with unrealized losses at Dec. 31, 2017.
Corporate
Our Corporate overhead costs of $20 million were $4 million lower in the first quarter of 2018 compared to 2017 due to lower incentive payments.
Key Financial Ratios
The methodologies and ratios used by rating agencies to assess our credit ratings are not publicly disclosed. We have developed our own definitions of ratios and targets to help evaluate the strength of our financial position. These metrics and ratios are not defined under IFRS, and may not be comparable to those used by other entities or by rating agencies. We are focused on strengthening our financial position and flexibility and aim to meet all our target ranges by 2018.
TRANSALTA CORPORATION M11
FFO Before Interest to Adjusted Interest Coverage
As at | March 31, 2018(1) | Dec. 31, 2017 | |||
FFO | 920 | 804 | |||
Less: Early termination payment received on Sundance B and C PPAs | (157 | ) | — | ||
Add: Interest on debt and finance leases, net of interest income and capitalized interest | 203 | 205 | |||
FFO before interest | 966 | 1,009 | |||
Interest on debt and finance leases, net of interest income | 209 | 214 | |||
Add: 50 per cent of dividends paid on preferred shares | 20 | 20 | |||
Adjusted interest | 229 | 234 | |||
FFO before interest to adjusted interest coverage (times) | 4.2 | 4.3 | |||
(1) Last 12 months. Our target range for FFO in 2018 is $775 million to $850 million. See the 2018 Financial Outlook for further details.
The ratio was comparable to 2017. Our target for FFO before interest to adjusted interest coverage is four to five times, and we expect this metric to improve as we execute on our deleveraging plan.
Adjusted Funds from Operations to Adjusted Net Debt
As at | March 31, 2018 | Dec. 31, 2017 | |||
FFO(1,2) | 920 | 804 | |||
Less: Early termination payment received on Sundance B and C PPAs | (157 | ) | — | ||
Less: 50 per cent of dividends paid on preferred shares | (20 | ) | (20 | ) | |
Adjusted FFO | 743 | 784 | |||
Period-end long-term debt(3) | 3,411 | 3,707 | |||
Less: Cash and cash equivalents | (329 | ) | (314 | ) | |
Add: 50 per cent of issued preferred shares | 471 | 471 | |||
Fair value asset of hedging instruments on debt(4) | (1 | ) | (30 | ) | |
Adjusted net debt | 3,552 | 3,834 | |||
Adjusted FFO to adjusted net debt (%) | 20.9 | 20.4 | |||
(1) Last 12 months.
(2) Our target range for FFO in 2018 is $750 million to $800 million. See the 2018 Financial Outlook for further details.
(3) Includes finance lease obligations and tax equity financing.
(4) Included in risk management assets and/or liabilities on the condensed consolidated financial statements as at March 31, 2018 and Dec. 31, 2017.
Our adjusted FFO to adjusted net debt was comparable to 2017. We expect this metric to improve towards our targeted level of 20 to 25 per cent as we execute on our deleveraging plan.
Adjusted Net Debt to Comparable EBITDA
As at | March 31, 2018 | Dec. 31, 2017 | |||
Period-end long-term debt(1) | 3,411 | 3,707 | |||
Less: Cash and cash equivalents | (329 | ) | (314 | ) | |
Add: 50 per cent of issued preferred shares | 471 | 471 | |||
Fair value asset of hedging instruments on debt(2) | (1 | ) | (30 | ) | |
Adjusted net debt | 3,552 | 3,834 | |||
Comparable EBITDA(3) | 1,204 | 1,062 | |||
Less: Early termination payment received on Sundance B and C PPAs | (157 | ) | — | ||
Adjusted comparable EBITDA | 1,047 | 1,062 | |||
Adjusted net debt to comparable EBITDA (times) | 3.4 | 3.6 | |||
(1) Includes finance lease obligations and tax equity financing.
(2) Included in risk management assets and/or liabilities on the condensed consolidated financial statements as at March 31, 2018 and Dec. 31, 2017.
(3) Last 12 months.
Our adjusted net debt to comparable EBITDA ratio improved compared to 2017, mainly due to the significant reduction in our net debt during the quarter. Our target for adjusted net debt to comparable EBITDA is 3.0 to 3.5 times.
TRANSALTA CORPORATION M12
Strategic Growth and Corporate Transformation
Acquisition of Two US Wind Projects
On Feb. 20, 2018, TransAlta Renewables announced that it had entered into an arrangement to acquire two wind construction-ready projects in the United States. Construction on one of the two projects has started. The two projects are fully contracted with credit worthy counterparties. See the Significant and Subsequent Events section of this MD&A for further details.
Kent Hills Wind Project
During 2017, TransAlta Renewables entered into a long-term contract with the New Brunswick Power Corporation (“NB Power”) for the sale of all power generated by an additional 17.25 MW of capacity from the Kent Hills wind project. The additional 17.25 MW at Kent Hills is an expansion of our existing Kent Hills wind farms, increasing the total operating capacity of the Kent Hills wind farms to approximately 167 MW. We expect to begin the construction during the second quarter of 2018.
Brazeau Hydro Pumped Storage
The Brazeau Hydro Pumped Storage project will generate and support clean electricity in the Province of Alberta. It will store water that can be used to both generate power when it is needed and store excess power supply when demand is low. The Brazeau Hydro Pumped Storage project is a focus for us, as it has existing infrastructure that reduces the cost and environmental footprint of the project, is situated close to existing transmission infrastructure, and allows for increased renewables development by balancing intermittent generation from wind and solar.
We are currently working to secure a path that will advance our investment in the project and secure a long-term contract for the project. The Brazeau Hydro Pumped Storage project is expected to have new capacity ranging between 400 MW to 900 MW, bringing the total Brazeau facility to 755 to 1,255 MW, post-completion. We estimate an investment in the range of $1.5 billion to $2.7 billion and expect construction to begin upon receipt of a long-term contract and regulatory approvals, between 2020 and 2021, with operations to commence in 2025. During the first quarter of 2018, we invested approximately $1 million to advance the environmental study, work with stakeholders and execute geotechnical work to help further our design and construction phase.
Project Greenlight
Our transformation project is a top priority for us. Driven by engagement from all employees, the intent is to deliver ambitious improvements in every part of the Corporation. Initiatives include increasing revenue, improving generation, reducing operating and maintenance costs, reducing overhead costs and financing costs, and optimizing our capital spend. We expect Project Greenlight to deliver sustainable pre-tax savings of approximately $50 million to $70 million annually, in 2018. We are on track to achieve our expected annual savings targets. During the first quarter of 2018, we invested approximately $11 million in this program, the cost of the program was largely offset by the cost reductions and productivity gains. We expect to invest a further $9 million on this program throughout 2018 and also expect to spend $20 million to $30 million related to productivity capital in 2018.
The following table outlines our generation comparable OM&A, including greenlight costs:
3 months ended March 31 | 2018 | 2017 | |||
Generation comparable OM&A | 105 | 98 | |||
Greenlight transformation costs included in OM&A | |||||
Canadian Coal | (4 | ) | — | ||
US Coal | (1 | ) | — | ||
Gas and Renewables | (3 | ) | — | ||
Adjusted generation comparable OM&A | 97 | 98 | |||
Significant and Subsequent Events
A. TSX Acceptance of Normal Course Issuer Bid
In February we announced our intention to buy back up to a maximum of 14,000,000 Common Shares, representing approximately 4.86 per cent of issued and outstanding Common Shares as at March 2, 2018 through a NCIB. Purchases under the NCIB may be made through open market transactions on the TSX and any alternative Canadian trading platforms on which the Common Shares are traded, based on the prevailing market price. Any Common Shares purchased under the NCIB will be cancelled.
The period during which TransAlta is authorized to make purchases under the NCIB commenced on March 14, 2018 and ends on March 13, 2019 or such earlier date on which the maximum number of Common Shares are purchased under the NCIB or the NCIB is terminated at the Company's election.
Under TSX rules, not more than 102,039 Common Shares (being 25 per cent of the average daily trading volume on the TSX of 408,156 Common Shares for the six months ended February 28, 2018) can be purchased on the TSX on any single trading day under the NCIB, with the exception that one block purchase in excess of the daily maximum is permitted per calendar week.
TRANSALTA CORPORATION M13
During the first quarter of 2018, the Corporation purchased 374,900 Common Shares at an average price of $6.97 per Common Share. See Note 13 of the condensed consolidated financial statements for further details.
Further transactions under the NCIB will depend on market conditions. The Corporation retains discretion whether to make purchases under the NCIB, and to determine the timing, amount and acceptable price of any such purchases, subject at all times to applicable TSX and other regulatory requirements.
The NCIB provides us with a capital allocation alternative with a view to long-term shareholder value. We believe the market price of TransAlta’s Common Shares does not reflect the underlying value and purchases of Common Shares for cancellation under the NCIB may provide an opportunity to enhance shareholder value.
B. Early Redemption of Senior Notes
On March 15, 2018, the Corporation early redeemed all of its outstanding 6.650 per cent US Senior Notes due May 15, 2018. The Redemption price for the Notes was approximately $617 million (US$516 million), including $14 million of accrued interest. An early redemption premium was recognized in net interest expense for the three months ended March 31, 2018.
C. Balancing Pool Terminates the Alberta Sundance Power Purchase Arrangements
On Sept. 18, 2017, we received formal notice from the Balancing Pool for the termination of the Sundance B and C PPAs effective March 31, 2018. This announcement was expected and we took steps to re-take dispatch control for the units effective March 31, 2018.
Pursuant to a written agreement, the Balancing Pool paid us approximately $157 million on March 29, 2018. We are disputing the termination payment received. The Balancing Pool excluded certain mining assets that we believe should be included in the net book value calculation for an additional $56 million, which is now subject to the PPA arbitration process.
D. Acquisition of Two US Wind Projects
On Feb. 20, 2018, TransAlta Renewables announced it had entered into an arrangement to acquire two construction-ready projects in the Northeastern United States. The wind development projects consist of: (i) a 90 MW project located in Pennsylvania that has a 15-year PPA, and (ii) a 29 MW project located in New Hampshire with two 20-year PPAs. All three counterparties have Standard & Poor's credit ratings of A+ or better. The commercial operation date for both projects is expected during the second half of 2019. A subsidiary of TransAlta (“US HoldCo”) acquired the 90 MW project on Feb. 20, 2018 whereas the acquisition of the 29 MW project remains subject to certain closing conditions, including the receipt of a favourable regulatory ruling.
On April 20, 2018, TransAlta Renewables acquired an economic interest in the US wind projects from the subsidiary of TransAlta (“TA Power”) pursuant to the arrangement entered into with TransAlta on Feb. 20, 2018. Pursuant to the arrangement, US HoldCo will own the US wind projects directly and TA Power will issue to TransAlta Renewables preferred shares that pay quarterly dividends based on the pre-tax net earnings of the US wind projects. The remaining construction and acquisition costs of the two US wind projects are to be funded by TransAlta Renewables and are estimated to be US$240 million. TransAlta Renewables will fund these costs either by acquiring additional preferred shares issued by TA Power or will subscribe for interest bearing notes issued by US HoldCo. The proceeds from the issuance of such preferred shares or notes shall be used exclusively in connection with the acquisition and construction of the US wind projects. TransAlta Renewables will fund these acquisition and construction costs using its existing liquidity and tax equity.
E. Management Change
The Corporation hosted its Annual General Meeting on April 20, 2018, during which it was announced that Donald Tremblay, CFO, has chosen to leave the Corporation, effective May 9, 2018, and will be returning to eastern Canada to be closer to his family. The Corporation has commenced a recruitment process for a new CFO. Brett Gellner, Chief Investment Officer, will act as Interim CFO, in addition to his current role, during the interim period.
Regulatory Updates
Refer to the Regional Regulation and Compliance discussion in our 2017 annual MD&A for further details that supplement the recent developments as discussed below:
Canadian Federal Government
On Feb. 17, 2018, the Department of Environment and Climate Change Canada published the draft regulations for gas-fired electricity generation, which include specific rules for coal-to-gas converted units. Under the proposed regulations, TransAlta’s units are expected to receive an additional 75 years of operating life. Consultation on the draft regulations is expected to conclude in mid-2018 with finalized regulations expected by the end of 2018.
TRANSALTA CORPORATION M14
Alberta
On Jan. 1, 2018, the Alberta government transitioned from Specified Gas Emitters Regulation (“SGER”) to the Carbon Competitiveness Incentive Regulation (“CCIR”). Under the CCIR, the regulatory compliance moved from a facility-specific compliance standard to a product/sectoral performance compliance standard. The carbon price remains set at $30/tCO2e from 2018 to 2020 after which it is currently expected to follow the federal price increase to $40/tCO2e in 2021 and $50/tCO2e in 2022. The electricity sector performance standard was set at 0.37tCO2e/MWh but will decline over time. All renewable assets that received crediting under the SGER will continue to receive credits under CCIR on a one-to-one basis. All other renewable assets that did not receive credits under SGER will now be able to opt into the CCIR and get carbon crediting up to the electricity sector performance standard in perpetuity. Once the wind projects crediting standard under SGER ends, these renewable projects will also be able to opt into the CCIR and receive crediting.
Capital Structure and Liquidity
Our capital structure consists of the following components as shown below:
March 31, 2018 | Dec. 31, 2017 | ||||||||
As at | $ | % | $ | % | |||||
TransAlta Corporation | |||||||||
Recourse debt - CAD debentures | 1,047 | 14 | 1,046 | 14 | |||||
Recourse debt - US senior notes | 891 | 12 | 1,499 | 19 | |||||
Credit facilities | 325 | 4 | — | — | |||||
US tax equity financing | 30 | — | 31 | — | |||||
Other | 42 | 1 | 13 | — | |||||
Less: cash and cash equivalents | (270 | ) | (4 | ) | (294 | ) | (4 | ) | |
Less: fair value asset of economic hedging instruments on debt | (1 | ) | — | (30 | ) | — | |||
Net recourse debt | 2,064 | 27 | 2,265 | 29 | |||||
Non-recourse debt | 197 | 3 | 208 | 3 | |||||
Finance lease obligations | 66 | 1 | 69 | 1 | |||||
Total net debt - TransAlta Corporation | 2,327 | 31 | 2,542 | 33 | |||||
TransAlta Renewables | |||||||||
Credit facility | — | — | 27 | — | |||||
Less: cash and cash equivalents | (59 | ) | (1 | ) | (20 | ) | — | ||
Net recourse debt | (59 | ) | (1 | ) | 7 | — | |||
Non-recourse debt | 813 | 11 | 814 | 11 | |||||
Total net debt - TransAlta Renewables | 754 | 10 | 821 | 11 | |||||
Total consolidated net debt | 3,081 | 41 | 3,363 | 44 | |||||
Non-controlling interests | 1,048 | 14 | 1,059 | 14 | |||||
Equity attributable to shareholders | |||||||||
Common shares | 3,090 | 41 | 3,094 | 40 | |||||
Preferred shares | 942 | 13 | 942 | 12 | |||||
Contributed surplus, deficit, and accumulated other comprehensive income | (661 | ) | (9 | ) | (710 | ) | (9 | ) | |
Total capital | 7,500 | 100 | 7,748 | 100 | |||||
During the quarter we reduced our corporate debt by approximately $600 million and enhanced shareholder value by:
▪ | early redeeming our outstanding 6.650 per cent US$500 million Senior Notes due May 15, 2018, for approximately $617 million (US$516 million) using proceeds from the Sundance B and C PPAs termination payment and existing liquidity. |
▪ | purchased and cancelled 374,900 Common Shares at an average price of $6.97 under our NCIB program. We believe the market price of TransAlta's Common Shares does not reflect the underlying value and purchases of Common Shares for cancellation under the NCIB provides an opportunity to enhance shareholder value. See the Significant and Subsequent Events section of this MD&A for further details. |
Overall, our net debt was reduced by close to $300 million during the quarter.
TRANSALTA CORPORATION M15
During 2019 to 2020, we have approximately $941 million of debt maturing. We expect to refinance some of these upcoming debt maturities by raising $300 to $400 million of debt secured by our contracted cash flows. We also expect to continue our deleveraging strategy as a significant part of our free cash flow over the three years will be allocated to debt reduction.
Our credit facilities provide us with significant liquidity. We have a total of $2.0 billion (Dec. 31, 2017 - $2.0 billion) of committed credit facilities, comprised of our $1.0 billion committed syndicated bank credit facility, TransAlta Renewables’ committed syndicated bank credit facility of $500 million (Dec. 31, 2017 - $500 million) and our US$200 million and $240 million committed bilateral facilities. These facilities expire in 2021, 2021, 2020, and 2019 respectively. The $1.5 billion (Dec. 31, 2017 - $1.5 billion) committed syndicated bank facilities are the primary source for short-term liquidity after the cash flow generated from the Corporation's business.
In total, $1.1 billion (Dec. 31, 2017 - $1.4 billion) is not drawn. At March 31, 2018, the $0.9 billion (Dec. 31, 2017 - $0.6 billion) of credit utilized under these facilities was comprised of actual drawings of $0.3 billion (Dec. 31, 2017 - nil) and letters of credit of $0.6 billion (Dec. 31, 2017 - $0.6 billion). The Corporation is in compliance with the terms of the credit facilities and all undrawn amounts are fully available. In addition to the $1.1 billion available under the credit facilities, the Corporation also has $329 million of available cash and cash equivalents.
The Corporation's subsidiaries have issued non-recourse bonds of $1,010 million (Dec. 31, 2017 - $1,021 million) that are subject to customary financing conditions and covenants that may restrict our ability to access funds generated by the facilities’ operations. Upon meeting certain distribution tests, typically performed once per quarter, the funds are able to be distributed by the subsidiary entities to their respective parent entity. These conditions include meeting a debt service coverage ratio prior to distribution, which was met by these entities in the first quarter. However, funds in these entities that have accumulated since the first quarter test will remain there until the next debt service coverage ratio can be calculated in the second quarter of 2018. At March 31, 2018, $53 million (Dec. 31, 2017 -$35 million) of cash was subject to these financial restrictions. In addition, we have $31 million of resctricted cash related to the Kent Hills project financing that are being held in a construction reserve account, which will be released upon certain conditions, including commissioning, being met.
Additionally, certain non-recourse bonds require that certain reserve accounts be established and funded through cash held on deposit and/or by providing letters of credit. We have elected to use letters of credit as at March 31, 2018. However, as at March 31, 2018, $1 million of cash was on deposit for certain reserve accounts that do not allow the use of letters of credit and was not available for general use.
The strengthening of the US dollar has increased our long-term debt balances by $21 million in 2018. Almost all our US-denominated debt is hedged either through financial contracts or net investments in our US operations. During the period, these changes in our US-denominated debt were offset as follows:
As at Dec. 31 | March 31, 2018 | Dec. 31, 2017 | ||
Effects of foreign exchange on carrying amounts of US operations (net investment hedge) | 18 | (61 | ) | |
Foreign currency economic cash flow hedges on debt | 3 | (45 | ) | |
Economic hedges and other | — | (7 | ) | |
Total | 21 | (113 | ) | |
Share Capital
The following tables outline the common and preferred shares issued and outstanding:
As at | May 7, 2018 | March 31, 2018 | Dec. 31, 2017 | |||
Number of shares (millions) | ||||||
Common shares issued and outstanding, end of period | 287.5 | 287.9 | 287.9 | |||
Preferred shares | ||||||
Series A | 10.2 | 10.2 | 10.2 | |||
Series B | 1.8 | 1.8 | 1.8 | |||
Series C | 11.0 | 11.0 | 11.0 | |||
Series E | 9.0 | 9.0 | 9.0 | |||
Series G | 6.6 | 6.6 | 6.6 | |||
Preferred shares issued and outstanding, end of period | 38.6 | 38.6 | 38.6 | |||
M16 TRANSALTA CORPORATION
Non-Controlling Interests
As of March 31, 2018, we own 64.0 per cent (Dec. 31, 2017 – 64.0 per cent) of TransAlta Renewables. We remain committed to maintaining our position as the majority shareholder and sponsor of TransAlta Renewables with a stated goal of maintaining our interest between 60 to 80 per cent.
We also own 50.01 per cent of TransAlta Cogeneration L.P (“TA Cogen”), which owns, operates, or has an interest in four natural-gas-fired facilities (Mississauga, Ottawa, Windsor, and Fort Saskatchewan) and one coal-fired generating facility.
Reported earnings attributable to non-controlling interests for the first quarter of 2018 decreased to $28 million from $32 million in the first quarter of 2017, due to the settlement in 2017 of the contract indexation dispute with the OEFC relating to the Ottawa and Windsor facilities, partially offset by higher earnings at TransAlta Renewables resulting from a favourable reduction in unrealized foreign exchange losses on some of its financial interests in the Australian Assets.
Returns to Providers of Capital
Net Interest Expense
The components of net interest expense are shown below:
Three months ended March 31 | 2018 | 2017 | ||
Interest on debt | 53 | 56 | ||
Interest income | (3 | ) | (1 | ) |
Capitalized interest | — | (3 | ) | |
Loss on early redemption of US Senior Notes | 5 | — | ||
Interest on finance lease obligations | 1 | 1 | ||
Credit facility and bank charges | 3 | 4 | ||
Other interest | 3 | — | ||
Accretion of provisions | 6 | 5 | ||
Net interest expense | 68 | 62 | ||
Net interest expense was higher period-over-period due to the $5 million pre-payment premium relating to the early redemption of the US $500 million Senior Notes.
Dividends to Shareholders
On April 19, 2018, we declared a quarterly dividend of$0.04 per common share, payable on July 3, 2018. We also declared a quarterly dividend of$0.16931 on the Series A preferred shares, $0.19951 on the Series B preferred shares, $0.25169 on the Series C preferred shares, $0.32463 on the Series E preferred shares, and $0.33125 on the Series G preferred shares, all payable on July 3, 2018.
The following are the common and preferred shares dividends declared in the first quarter of 2018:
Common | Preferred Series dividends per share | |||||||||||
dividends | ||||||||||||
Declaration date | per share | A | B | C | E | G | ||||||
Feb. 2, 2018 | 0.04 | 0.1693 | 0.17889 | 0.2517 | 0.3246 | 0.33125 | ||||||
TRANSALTA CORPORATION M17
Financial Position
The following chart highlights significant changes in the Condensed Consolidated Statements of Financial Position from March 31, 2018, to Dec. 31, 2017:
Increase/ | ||||
Assets | (decrease) | Primary factors explaining change | ||
Cash and cash equivalents | 15 | Timing of receipts and payments | ||
Trade and other receivables | (262 | ) | Timing of customer receipts and seasonality of revenue | |
Property, plant, and equipment, net | (109 | ) | Depreciation for the period ($147 million), partially offset by favourable changes in foreign exchange rates ($23 million), and additions ($23 million) | |
Risk management assets (current and long term) | (27 | ) | Contract settlements, partially offset by favourable changes in foreign exchange rates, favourable changes in market price movements, and new contracts | |
Other assets | 37 | Project development costs related to the acquisition of two US Wind projects | ||
Others | 5 | |||
Total decrease in assets | (341 | ) | ||
Increase/ | ||||
Liabilities and equity | (decrease | Primary factors explaining change | ||
Accounts payable and accrued liabilities | (99 | ) | Timing of payments and accruals | |
Credit facilities, long term debt, and finance lease obligations (including current portion) | (296 | ) | Repayment of long-term debt ($660 million), partially offset by draw dawn on credit facility ($298 million), and unfavourable foreign exchange rate ($21 million) | |
Deferred income tax liabilities | 19 | Increase in taxable temporary differences | ||
Risk management liabilities (current and long term) | (12 | ) | Contract settlements, partially offset by favourable changes in foreign exchange rates, favourable changes in market price movements, and new contracts | |
Equity attributable to shareholders | 45 | Net earnings ($75 million), partially offset by common and preferred share dividends ($21 million), and the impact of changes in our accounting policies ($14 million) | ||
Others | 2 | |||
Total decrease in liabilities and equity | (341 | ) | ||
Cash Flows
The following chart highlights significant changes in the Condensed Consolidated Statements of Cash Flows for the three months ended March 31, 2018, compared to the same period March 31, 2017:
3 months ended March 31 | 2018 | 2017 | Primary factors explaining change | |||
Cash and cash equivalents, beginning of period | 314 | 305 | ||||
Provided by (used in): | ||||||
Operating activities | 425 | 281 | Higher cash earnings ($116 million) and favourable change in non-cash working capital ($28 million) | |||
Investing activities | (53 | ) | 5 | Lower proceeds on disposals ($60 million) and higher project development acquisitions ($36 million) | ||
Financing activities | (357 | ) | (88 | ) | Increase in repayment of long-term debt ($646 million), partially offset by increase in borrowings under credit facilities ($326 million) and realized gains on financial instruments ($50 million) | |
Translation of foreign currency cash | — | 1 | ||||
Cash and cash equivalents, end of period | 329 | 504 | ||||
M18 TRANSALTA CORPORATION
Other Consolidated Analysis
Unconsolidated Structured Entities or Arrangements
Disclosure is required of all unconsolidated structured entities or arrangements such as transactions, agreements, or contractual arrangements with unconsolidated entities, structured finance entities, special purpose entities, or variable interest entities that are reasonably likely to materially affect liquidity or the availability of, or requirements for, capital resources. We currently have no such unconsolidated structured entities or arrangements.
Guarantee Contracts
We have obligations to issue letters of credit and cash collateral to secure potential liabilities to certain parties, including those related to potential environmental obligations, commodity risk management and hedging activities, construction projects, and purchase obligations. At March 31, 2018, we provided letters of credit totalling $639 million (Dec. 31, 2017 - $677 million) and cash collateral of $51 million (Dec. 31, 2017 - $67 million). These letters of credit and cash collateral secure certain amounts included on our Consolidated Statements of Financial Position under risk management liabilities and decommissioning and other provisions.
Contingencies
I. Line Loss Rule Proceeding
TransAlta has been participating in a line loss rule proceeding (the “LLRP”) before the Alberta Utilities Commission ("AUC"). The AUC determined that it has the ability to retroactively adjust line loss charges going back to 2006 and directed the AESO to, among other things, perform such retroactive calculations. The various decisions by the AUC are, however, subject to appeal and challenge. A recent decision by the AUC determined the methodology to be used retroactively and it is now possible to estimate the total potential retroactive exposure faced by TransAlta for its non-PPA MWs. The estimate of the maximum exposure is $15 million; however, if TransAlta and others are successful on the appeal of legal and jurisdictional questions regarding retroactivity, the amount owing will be nil; TransAlta accordingly recorded an appropriate provision in 2017.
II. FMG Disputes
The Corporation is currently engaged in two pieces of litigation with FMG. The first arose as a result of FMG’s purported termination of the South Hedland PPA. TransAlta has sued FMG, seeking payment of amounts invoiced and not paid under the PPA, as well as a declaration that the PPA is valid and in force. FMG, on the other hand, seeks a declaration that the PPA was lawfully terminated.
The second matter involves FMG’s claims against TransAlta related to the transfer of the Solomon Power Station to FMG. FMG claims certain amounts related to the condition of the facility while TransAlta claims certain outstanding costs that should be reimbursed.
III. Balancing Pool Dispute
Pursuant to a written agreement, the Balancing Pool paid the Corporation approximately $157 million on March 29, 2018. The Corporation is disputing the termination payment it received. The Balancing Pool excludes certain mining assets that the Corporation believes should be included in the net book value calculation for an additional $56 million, which is subject to the PPA arbitration process.
Financial Instruments
Refer to Note 13 of the notes to the audited annual consolidated financial statements within our 2017 Annual Integrated Report and Note 8 of our unaudited interim condensed consolidated financial statements as at and for the three months ended March 31, 2018 for details on Financial Instruments. Refer to the Governance and Risk Management section of our 2017 Annual Integrated Report and Note 9 of our unaudited interim condensed consolidated financial statements for further details on our risks and how we manage them. Refer to the Accounting Changes section of this MD&A for further details on the adoption of IFRS 9 Financial Instruments effective Jan. 1, 2018. Our risk management profile and practices have not changed materially from Dec. 31, 2017.
We may enter into commodity transactions involving non-standard features for which observable market data is not available. These are defined under IFRS as Level III financial instruments. Level III financial instruments are not traded in an active market and fair value is, therefore, developed using valuation models based upon internally developed assumptions or inputs. Our Level III fair values are determined using data such as unit availability, transmission congestion, or demand profiles. Fair values are validated on a quarterly basis by using reasonably possible alternative assumptions as inputs to valuation techniques, and any material differences are disclosed in the notes to the financial statements.
As at March 31, 2018, total Level III financial instruments had a net asset carrying value of $725 million (Dec. 31, 2017 - $771 million net asset). The decrease during the period is primarily due to the settlement of contracts, market price changes in value of the long-term power sale contract designated as an all-in-one cash flow hedge for which changes in fair value are recognized in other comprehensive income, partially offset by favourable foreign exchange rates.
TRANSALTA CORPORATION M19
2018 Financial Outlook
The following table outlines our expectation on key financial targets for 2018:
Measure | Original Target | Revised Target |
Comparable EBITDA | $950 million to $1,050 million | $1,000 million to $1,050 million |
FFO | $725 million to $800 million | $750 million to $800 million |
FCF | $275 million to $350 million | $300 million to $350 million |
Canadian Coal capacity factor | 65 to 75 per cent | Unchanged |
Dividend | $0.16 per share annualized, 13 to 17 per cent payout of FCF | $0.16 per share annualized, 13 to 15 per cent payout of FCF |
As a result of our strong performance during our first quarter, we revised our targets as outlined in the above table.
Operations
Availability
Total availability of our Canadian coal fleet is expected to be in the range of 87 to 89 per cent in 2018. Availability of our other generating assets (gas, renewables) is expected to be in the range of 95 per cent in 2018. We will be accelerating our transition to gas and renewables generation, and have retired Sundance Unit 1 effective Jan. 1, 2018, and temporarily mothballed Sundance Unit 2 effective Jan. 1, 2018 and Sundance Unit 3 and Sundance Unit 5 effective April 1, 2018.
Market Hedging Strategy
The objective of our portfolio management strategy is to deliver a high confidence for annual FCF which also provides for positive exposure to price volatility in Alberta. Given our cash operating costs, we can be more or less hedged in a given period, and we expect to realize our annual FCF targets through a combination of forward hedging and selling generation into the spot market.
Fuel Costs
In Alberta, we expect our cash fuel costs per tonne to be higher compared to 2017 due to lower produced volumes.
In the Pacific Northwest, our US Coal mine, adjacent to our power plant, is in the reclamation stage. Fuel at US Coal has been purchased primarily from external suppliers in the Powder River Basin and delivered by rail. In 2017 we amended our fuel and rail contract such that our costs fluctuate partly with gas prices. This should allow us to generate more electricity and increase profits.
Most of our generation from gas is sold under contract with pass-through provisions for fuel. For gas generation with no pass-through provision, we purchase natural gas from outside companies coincident with production, thereby minimizing our risk to changes in prices.
We closely monitor the risks associated with changes in electricity and input fuel prices on our future operations and, where we consider it appropriate, use various physical and financial instruments to hedge our assets and operations from such price risks.
Energy Marketing
Comparable EBITDA from our Energy Marketing segment is affected by prices and volatility in the market, overall strategies adopted, and changes in regulation and legislation. We continuously monitor both the market and our exposure to maximize earnings while still maintaining an acceptable risk profile. Our 2018 objective for Energy Marketing is for the segment to contribute between $70 million to $80 million in gross margin for the year.
Exposure to Fluctuations in Foreign Currencies
Our strategy is to minimize the impact of fluctuations in the Canadian dollar against the US dollar, and Australian dollar by offsetting foreign-denominated assets with foreign-denominated liabilities and by entering into foreign exchange contracts. We also have foreign-denominated expenses, including interest charges, which largely offset our net foreign-denominated revenues.
We expect to spend approximately US$240 million to construct and commission the two US wind development projects. We anticipate using foreign exchange contracts to manage the foreign exchange exposure created by these projects. See the Significant and Subsequent Events section of this MD&A for further details.
Net Interest Expense
Net interest expense for 2018 is expected to be lower than in 2017 largely due to lower levels of debt. However, changes in interest rates and in the value of the Canadian dollar relative to the US dollar can affect the amount of net interest expense incurred.
Net Debt, Liquidity, and Capital Resources
We expect to maintain adequate available liquidity under our committed credit facilities. We currently have access to $1.1 billion in liquidity, as well as more than $300 million in cash. Our continued focus will be toward repositioning our capital structure and we expect to be well positioned to address the upcoming debt maturities in 2018 and 2019.
M20 TRANSALTA CORPORATION
Growth Expenditures
Our growth projects are focused on sustaining our current operations and supporting our growth strategy in our renewables platform.
A summary of the significant growth and major projects that are in progress is outlined below:
Total Project | 2018(2) | Target | ||||||||
Estimated spend | Spent to date(1) | Estimated spend | completion date | Details | ||||||
Project | ||||||||||
Kent Hills 3 Wind Expansion(3) | 36 | 9 | 27 | Q4 2018 | 17.25 MW expansion project on our existing Kent Hills wind farms | |||||
Pennsylvania wind development project(4) | 164 | 30 | 111 | Q3 2019 | 90 MW wind project with a 15-year PPA | |||||
New Hampshire wind development project(4, 5) | 76 | — | 40 | Q3 2019 | 29 MW wind project with two 20-year PPAs | |||||
Total | ||||||||||
(1) Represents amounts spent as of March 31, 2018.
(2) Remainder of year.
(3) Our 17 per cent partner on the existing Kent Hills facilities is participating in the expansion project and also owns a 17 per cent interest. They will be funding their share of the total project costs.
(4) Denominated in United States dollars. TransAlta Renewables will fund the acquisition and construction costs using its existing liquidity and tax equity.
(5) Project remains subject to certain closing conditions, including the receipt of a favourable regulatory ruling.
Sustaining and Productivity Capital Expenditures
A significant portion of our sustaining and productivity capital is planned major maintenance, which includes inspection, repair and maintenance of existing components, and the replacement of existing components. Planned major maintenance costs are capitalized as part of PP&E and are amortized on a straight-line basis over the term until the next major maintenance event. It excludes amounts for day-to-day routine maintenance, unplanned maintenance activities, and minor inspections and overhauls, which are expensed as incurred.
Our estimate for total sustaining and productivity capital is allocated among the following:
Category | Description | Spent to date (1) | Expected spend in 2018 | |
Routine capital | Capital required to maintain our existing generating capacity | 8 | 71 - 74 | |
Planned major maintenance | Regularly scheduled major maintenance | 10 | 71 - 74 | |
Mine capital | Capital related to mining equipment and land purchases | 2 | 32 - 34 | |
Finance leases | Payments on finance leases | 4 | 23 - 25 | |
Total sustaining capital | 24 | 195 - 205 | ||
Productivity capital | Projects to improve power production efficiency and corporate improvement initiatives | 4 | 20 - 30 | |
Total sustaining and productivity capital | 28 | 215 - 235 | ||
Significant planned major outages for 2018 include the following:
▪ | a major outage in our Canadian Coal segment during the fourth quarter to a unit operated by our partner; |
▪ | a major outage at our US Coal segment scheduled for the second quarter; |
▪ | a major outage in our Canadian Gas segment related to our Sarnia and Fort Saskatchewan facilities during the second quarter and fourth quarter, respectively; and |
▪ | distributed expenditures across our wind and hydro fleet. |
Lost production as a result of planned major maintenance, excluding planned major maintenance for US Coal, which is scheduled during a period of economic dispatching, is estimated as follows for 2018:
Canadian Coal | Gas and Renewables | Total | Lost to date | |
GWh lost | 130 - 170 | 400 - 600 | 530 - 770 | 35 |
(1) As at March 31, 2018.
Funding of Capital Expenditures
Funding for these planned capital expenditures is expected to be provided by cash flow from operating activities, existing liquidity, and capital raised from our contracted cash flows. We have access to approximately $1.1 billion in liquidity. The funds required for committed growth, sustaining capital, and productivity projects are not expected to be significantly impacted by the current economic environment.
TRANSALTA CORPORATION M21
Accounting Changes
A. Current Accounting Changes
I. IFRS 15 Revenue from Contracts with Customers
The Corporation has adopted IFRS 15 Revenue from Contracts with Customers (IFRS 15) with an initial adoption date of Jan. 1, 2018.
The Corporation has elected to adopt IFRS 15 retrospectively with the modified retrospective method of transition practical expedient. Under this method, the comparative period presented in the condensed consolidated financial statements as at and for the three months ended March 31, 2017 will not be restated and is reported under IAS 18 Revenue. Instead, the Corporation recognized the cumulative impact of the initial application of the standard in Deficit as at Jan. 1, 2018, as follows: Applying the significant financing component requirements to a specific contract resulted in an increase to the contract liability of $17 million, a decrease in deferred income tax liabilities of $4 million, and an increase to Deficit of $13 million.
IFRS 15 requires that, in determining the transaction price, the promised amount of consideration is to be adjusted for the effects of the time value of money if the timing of payments specified in a contract provides either party with a significant benefit of financing the transfer of goods or services to the customer (“significant financing component”). The objective when adjusting the promised amount of consideration for a significant financing component is to recognize revenue at an amount that reflects the price that the customer would have paid, had they paid cash in the future when the goods or services are transferred to them. The application of the significant financing component requirements results in the recognition of interest expense over the financing period and a higher amount of revenue.
Additionally, the Corporation no longer recognizes revenue (or fuel costs) related to non-cash consideration for natural gas supplied by a customer at one of its gas plants , as it was determined under IFRS 15 that the Corporation does not obtain control of the customer-supplied natural gas. This change had no impact on the cumulative impact of initial adoption as recognized in Deficit as Jan. 1, 2018.
Refer to Note 2 of the Corporation's condensed consolidated financial statements for a more detailed discussion of the Corporation's accounting policies under IFRS 15.
II. IFRS 9 Financial Instruments
Effective Jan. 1, 2018, the Corporation adopted IFRS 9, which introduces new requirements for:
1) The classification and measurement of financial assets and liabilities
2) The recognition and measurement of impairment of financial assets
3) General hedge accounting
In accordance with the transition provisions of the standard, the Corporation has elected to not restate prior periods.
Under the new classification and measurement requirements, financial assets must be classified and measured at either amortized cost, at fair value through profit or loss, or through OCI. The classification and measurement depends on the contractual cash flow characteristics of the financial asset and the entity’s business model for managing the financial asset. The classification requirements for financial liabilities are largely unchanged from IAS 39. While the Corporation had no direct impact of adopting the IFRS 9 classification and measurement requirements, a $1 million increase in deficit resulted from the increase in equity attributable to non-controlling interests due to IFRS 9 classification and measurement impacts at TransAlta Renewables.
IFRS 9 introduces a new impairment model for financial assets measured at amortized cost. The expected credit loss model requires entities to account for expected credit losses on financial assets at the date of initial recognition, and to account for changes in expected credit losses at each reporting date to reflect changes in credit risk. The loss allowance for a financial asset is measured at an amount equal to the lifetime expected credit loss if its credit risk has increased significantly since initial recognition. If the credit risk on a financial asset has not increased significantly since initial recognition, its loss allowance is measured at an amount equal to the 12-month expected credit loss. The Corporation’s management reviewed and assessed its existing financial assets for impairment using reasonable and supportable information in accordance with the requirements of IFRS 9 to determine the credit risk of the respective items at the date they were initially recognized, and compared that to the credit risk as at Jan. 1, 2018. There were no significant increases in credit risk determined upon application of IFRS 9.
The new general hedge accounting model is intended to be simpler and more closely focused on how an entity manages its risks, replaces the IAS 39 effectiveness testing requirements with the principle of an economic relationship, and eliminates the requirement for retrospective assessment of hedge effectiveness. The Corporation’s qualifying hedging relationships under IAS 39 in place as at Jan. 1, 2018 also qualified for hedge accounting in accordance with IFRS 9, and were therefore regarded as continuing hedging relationships. No rebalancing of any of the hedging relationships was necessary on Jan. 1, 2018.
Refer to Note 2 of the Corporation's condensed consolidated financial statements for a more detailed discussion of the Corporation's accounting policies under IFRS 9.
M22 TRANSALTA CORPORATION
III. Change in Estimates - Useful Lives
As a result of the Off-Coal Agreement ("OCA") with the Government of Alberta described in Note 4(H) of our most recent annual consolidated financial statements, the Corporation has adjusted the useful lives of some of its Sunhills mine assets to align with the Corporation's coal-to-gas conversion plans. As a result, depreciation expense included in fuel and purchased power for the three months ended March 31, 2018 increased by approximately $10 million and the full year depreciation expense is expected to increase be approximately $38 million. The useful lives may be revised or extended in compliance with the Corporation's accounting policies, dependent upon future operating decisions and events.
B. Future Accounting Changes
Accounting standards that have been previously issued by the IASB but are not yet effective, and have not been applied by the Corporation, include IFRS 16 Leases. Refer to Note 3 of the Corporation’s most recent annual consolidated financial statements for information regarding the requirements of IFRS 16. The Corporation is in the process of completing an initial scoping assessment for IFRS 16 and have prepared a detailed project plan. The Corporation anticipates that most of the effort under the implementation plan will occur in mid-to-late 2018. It is not yet possibleto make reliable estimates of the potential impact of IFRS 16 on our financial statements and disclosures.
Selected Quarterly Information
Our results are seasonal due to the nature of the electricity market and related fuel costs. Higher maintenance costs are usually incurred in the spring and fall when electricity prices are expected to be lower, as electricity prices generally increase in the peak winter and summer months in our main markets due to increased heating and cooling loads. Margins are also typically impacted in the second quarter due to the volume of hydro production resulting from spring runoff and rainfall in the Pacific Northwest, which impacts production at US Coal. Typically, hydro facilities generate most of their electricity and revenues during the spring months when melting snow starts feeding watersheds and rivers. Inversely, wind speeds are historically greater during the cold winter months and lower in the warm summer months.
Q2 2017 | Q3 2017 | Q4 2017 | Q1 2018 | |||||
Revenues | 503 | 588 | 638 | 588 | ||||
Comparable EBITDA | 268 | 245 | 275 | 416 | ||||
FFO | 187 | 196 | 219 | 318 | ||||
Net earnings (loss) attributable to common shareholders | (18 | ) | (27 | ) | (145 | ) | 65 | |
Net earnings (loss) per share attributable to common shareholders, basic and diluted(1) | (0.06 | ) | (0.09 | ) | (0.50 | ) | 0.23 | |
Q2 2016 | Q3 2016 | Q4 2016 | Q1 2017 | |||||
Revenues | 492 | 620 | 717 | 578 | ||||
Comparable EBITDA | 248 | 243 | 374 | 274 | ||||
FFO | 175 | 163 | 228 | 202 | ||||
Net earnings (loss) attributable to common shareholders | 6 | (12 | ) | 61 | — | |||
Net earnings (loss) per share attributable to common shareholders, basic and diluted(1) | 0.02 | (0.04 | ) | 0.21 | — | |||
(1) Basic and diluted earnings per share attributable to common shares are calculated each period using the weighted average number of common shares outstanding during the period. As a result, the sum of the earnings per share for the four quarters making up the calendar year may sometimes differ from the annual earnings per share.
Reported net earnings, comparable EBITDA and FFO are generally higher in the first and fourth quarters due to higher demand associated with winter cold in the markets in which we operate and lower planned outages.
Net earnings attributable to common shareholders has also been impacted by the following variations and events:
▪ | recognition of the $157 million early termination payment received regarding Sundance PPAs during the first quarter of 2018; |
▪ | a recovery of a writedown of deferred tax assets in the first and second quarters of 2016, and the second quarter of 2017; |
▪ | change in income tax rates in US in the fourth quarter of 2017; |
▪ | effects of non-comparable unrealized losses on intercompany financial instruments that are attributable only to the |
non-controlling interests in the first, second, and third quarters of 2016, and unrealized gains in the first quarter of 2017;
▪ | effects of the Keephills 1 outage provision in the fourth quarter of 2016; |
▪ | effects of the Wintering Hills impairment charge during the fourth quarter of 2016, and the Sundance Unit 1 impairment charge during the second quarter of 2017; |
▪ | effects of the Mississauga facility recontracting during the fourth quarter of 2016; |
▪ | effects of changes in useful lives of certain Canadian Coal assets during the first, second, and third quarters of 2017; and |
▪ | effects of an impairment of $137 million in 2017 on intercompany financial instruments that is attributable only to the non-controlling interests. |
TRANSALTA CORPORATION M23
Disclosure Controls and Procedures
Management has evaluated, with the participation of our Chief Executive Officer and Chief Financial Officer, the effectiveness of our disclosure controls and procedures as of the end of the period covered by this report. Disclosure controls and procedures refer to controls and other procedures designed to ensure that information required to be disclosed in the reports we file or submit under the Securities Exchange Act of 1934, as amended (“Exchange Act”) are recorded, processed, summarized, and reported within the time periods specified in the rules and forms of the U.S. Securities and Exchange Commission. Disclosure controls and procedures include, without limitation, controls and procedures designed to ensure that information required to be disclosed by us in our reports that we file or submit under the Exchange Act is accumulated and communicated to management, including our Chief Executive Officer and Chief Financial Officer, as appropriate to allow timely decisions regarding our required disclosure. In designing and evaluating our disclosure controls and procedures, management recognizes that any controls and procedures, no matter how well designed and operated, can provide only reasonable assurance of achieving the desired control objectives, and management is required to apply its judgment in evaluating and implementing possible controls and procedures.
There have been no other changes in our internal control over financial reporting during the period ended March 31, 2018, that have materially affected, or are reasonably likely to materially affect our internal control over financial reporting. Based on the foregoing evaluation, our Chief Executive Officer and Chief Financial Officer have concluded that, as at March 31, 2018, the end of the period covered by this report, our disclosure controls and procedures were effective.
Supplemental Information
March 31, 2018 | Dec. 31, 2017 | |||||
Closing market price (TSX) ($) | 6.98 | 7.45 | ||||
Price range for the last 12 months (TSX) ($) | High | 8.50 | 8.50 | |||
Low | 6.31 | 6.88 | ||||
FFO before interest to adjusted interest coverage(2)(times) | 4.2 | 4.3 | ||||
Adjusted FFO to adjusted net debt(2)(%) | 20.9 | 20.4 | ||||
Adjusted net debt to comparable EBITDA(1, 2) (times) | 3.4 | 3.6 | ||||
Adjusted net debt to invested capital(1) (%) | 47.4 | 49.5 | ||||
Return on equity attributable to common shareholders(2)(%) | (6.5 | ) | (10.0 | ) | ||
Return on capital employed(2)(%) | 3.9 | 2.1 | ||||
Earnings coverage(2)(times) | 1.2 | 0.6 | ||||
Dividend payout ratio based on FFO(1, 2)(%) | 5.0 | 4.3 | ||||
Dividend coverage(2)(times) | 17.3 | 14.1 | ||||
Dividend yield(2)(%) | 2.3 | 2.1 | ||||
(1) These ratios incorporate items that are not defined under IFRS. None of these measurements should be used in isolation or as a substitute for the Corporation’s reported financial performance or position as presented in accordance with IFRS. These ratios are useful complementary measurements for assessing the Corporation’s financial performance, efficiency, and liquidity and are common in the reports of other companies but may differ by definition and application. For a reconciliation of the non-IFRS measures used in these calculations, refer to the Discussion of Financial Results section of this MD&A.
(2) Last 12 months.
Ratio Formulas
FFO before interest to adjusted interest coverage = FFO + interest on debt and finance lease obligations - interest income - capitalized interest / interest on debt and finance lease obligations + 50 per cent dividends paid on preferred shares - interest income
Adjusted FFO to adjusted net debt = FFO - 50 per cent dividends paid on preferred shares / period end long-term debt and finance lease obligations including fair value (asset) liability of hedging instruments on debt + 50 per cent issued preferred shares - cash and cash equivalents
Adjusted net debt to comparable EBITDA = long-term debt and finance lease obligations including current portion and fair value (asset) liability of hedging instruments on debt + 50 per cent issued preferred shares - cash and cash equivalents / comparable EBITDA
Adjusted net debt to invested capital = long-term debt and finance lease obligations including current portion and fair value (asset) liability of hedging instruments on debt + 50 per cent issued preferred shares - cash and cash equivalents / adjusted net debt + non-controlling interests + equity attributable to shareholders - 50 per cent issued preferred shares
M24 TRANSALTA CORPORATION
Return on equity attributable to common shareholders = net earnings attributable to common shareholders / equity attributable to shareholders excluding AOCI - issued preferred shares
Return on capital employed = earnings before non-controlling interests and income taxes + net interest expense - earnings attributable to non-controlling interests + net interest expense / invested capital excluding AOCI
Earnings coverage = net earnings attributable to shareholders + income taxes + net interest expense / interest on debt and finance lease obligations + 50 per cent dividends paid on preferred shares - interest income
Dividend payout ratio = dividends declared on common shares / FFO - 50 per cent dividends paid on preferred shares
Dividend coverage ratio based on comparable FFO = FFO - 50 per cent dividends / cash dividends paid on common shares
Dividend yield = dividend paid per common share / current period’s closing market price
Glossary of Key Terms
Availability - A measure of the time, expressed as a percentage of continuous operation 24 hours a day, 365 days a year that a generating unit is capable of generating electricity, regardless of whether or not it is actually generating electricity.
Capacity - The rated continuous load-carrying ability, expressed in megawatts, of generation equipment.
Force Majeure - Literally means “greater force”. These clauses excuse a party from liability if some unforeseen event beyond the control of that party prevents it from performing its obligations under the contract.
Gigawatt - A measure of electric power equal to 1,000 megawatts.
Gigawatt Hour (GWh) - A measure of electricity consumption equivalent to the use of 1,000 megawatts of power over a period of one hour.
Greenhouse Gas (GHG) - Gases having potential to retain heat in the atmosphere, including water vapour, carbon dioxide, methane, nitrous oxide, hydrofluorocarbons, and perfluorocarbons.
Megawatt (MW) - A measure of electric power equal to 1,000,000 watts.
Megawatt Hour (MWh) - A measure of electricity consumption equivalent to the use of 1,000,000 watts of power over a period of one hour.
Power Purchase Arrangement (PPA) - A long-term arrangement established by regulation for the sale of electric energy from formerly regulated generating units to buyers.
Unplanned Outage - The shut-down of a generating unit due to an unanticipated breakdown.
TRANSALTA CORPORATION M25
TransAlta Corporation
110 - 12th Avenue S.W.
Box 1900, Station “M”
Calgary, Alberta Canada T2P 2M1
Phone
403.267.7110
Website
www.transalta.com
AST Trust Company (Canada)
P.O. Box 700 Station “B”
Montreal, Québec Canada H3B 3K3
Phone Toll-free in North America: 1.800.387.0825
Toronto or outside North America: 416.682.3860
Fax 514.985.8843
E-mail
Website www.canstockta.com
FOR MORE INFORMATION
Media and Investor Inquiries
Investor Relations
Phone1.800.387.3598 in Canada and United States
or 403.267.2520
Fax
403.267.7405
E-mail
TRANSALTA CORPORATION M26
Exhibit 31.1
Certifications
I, Dawn L. Farrell, certify that:
1. | I have reviewed this annual report on Form 6-K of TransAlta Corporation; |
2. | Based on my knowledge, this report does not contain any untrue statement of a material fact or omit to state a material fact necessary to make the statements made, in light of the circumstances under which such statements were made, not misleading with respect to the period covered by this report; |
3. | Based on my knowledge, the financial statements, and other financial information included in this report, fairly present in all material respects the financial condition, results of operations and cash flows of the registrant as of, and for, the periods presented in this report; |
4. | The registrant’s other certifying officer(s) and I are responsible for establishing and maintaining disclosure controls and procedures (as defined in Exchange Act Rules 13a-15(e) and 15d-15(e)) for the registrant and have: |
(a) | Designed such disclosure controls and procedures, or caused such disclosure controls and procedures to be designed under our supervision, to ensure that material information relating to the registrant, including its consolidated subsidiaries, is made known to us by others within those entities, particularly during the period in which this report is being prepared; |
(b) | Evaluated the effectiveness of the registrant’s disclosure controls and procedures and presented in this report our conclusions about the effectiveness of the disclosure controls and procedures, as of the end of the period covered by this report based on such evaluation; and |
(c) | Disclosed in this report any change in the registrant’s internal control over financial reporting that occurred during the registrant’s most recent fiscal quarter (the registrant’s fourth fiscal quarter in the case of an annual report) that has materially affected, or is reasonably likely to materially affect, the registrant’s internal control over financial reporting; and |
5. | The issuer’s other certifying officer(s) and I have disclosed, based on our most recent evaluation of internal control over financial reporting, to the issuer’s auditors and the audit committee of the issuer’s board of directors (or persons performing the equivalent functions): |
(a) | all significant deficiencies and material weaknesses in the design or operation of internal control over financial reporting which are reasonably likely to adversely affect the registrant’s ability to record, process, summarize and report financial information; and |
(b) | any fraud, whether or not material, that involves management or other employees who have a significant role in the registrant’s internal control over financial reporting. |
(signed) “Dawn L. Farrell” | |
Dated May 8, 2018 | Dawn L. Farrell |
President and Chief Executive Officer | |
Exhibit 31.2
Certifications
I, Donald Tremblay, certify that:
1. | I have reviewed this quarterly report on Form 6-K of TransAlta Corporation; |
2. | Based on my knowledge, this report does not contain any untrue statement of a material fact or omit to state a material fact necessary to make the statements made, in light of the circumstances under which such statements were made, not misleading with respect to the period covered by this report; |
3. | Based on my knowledge, the financial statements, and other financial information included in this report, fairly present in all material respects the financial condition, results of operations and cash flows of the registrant as of, and for, the periods presented in this report; |
4. | The registrant’s other certifying officer(s) and I are responsible for establishing and maintaining disclosure controls and procedures (as defined in Exchange Act Rules 13a-15(e) and 15d-15(e)) for the registrant and have: |
(a) | Designed such disclosure controls and procedures, or caused such disclosure controls and procedures to be designed under our supervision, to ensure that material information relating to the registrant, including its consolidated subsidiaries, is made known to us by others within those entities, particularly during the period in which this report is being prepared; |
(b) | Evaluated the effectiveness of the registrant’s disclosure controls and procedures and presented in this report our conclusions about the effectiveness of the disclosure controls and procedures, as of the end of the period covered by this report based on such evaluation; and |
(c) | Disclosed in this report any change in the registrant’s internal control over financial reporting that occurred during the registrant’s most recent fiscal quarter (the registrant’s fourth fiscal quarter in the case of an annual report) that has materially affected, or is reasonably likely to materially affect, the registrant’s internal control over financial reporting; and |
5. | The registrant’s other certifying officer(s) and I have disclosed, based on our most recent evaluation of internal control over financial reporting, to the registrant’s auditors and the audit committee of the registrant’s board of directors (or persons performing the equivalent functions): |
(a) | all significant deficiencies and material weaknesses in the design or operation of internal control over financial reporting which are reasonably likely to adversely affect the registrant’s ability to record, process, summarize and report financial information; and |
(b) | Any fraud, whether or not material, that involves management or other employees who have a significant role in the issuer’s internal control over financial reporting. |
(signed) “Donald Tremblay” | |
Dated May 8, 2018 | Donald Tremblay |
Chief Financial Officer | |
Exhibit 32.1
Certification of Chief Executive Officer
Pursuant to 18 U.S.C. § 1350, as created by Section 906 of the Sarbanes-Oxley Act of 2002, the undersigned officer of TransAlta Corporation (the “Company”) hereby certifies, to such officer’s knowledge, that:
(a) | the accompanying Report of Foreign Private Issuer on Form 6-K of the Company (the “Report”) fully complies with the requirements of Section 13(a) or Section 15(d), as applicable, of the Securities Exchange Act of 1934, as amended; and |
(ii) | the information contained in the Report fairly presents, in all material respects, the financial condition and results of operations of the Company. |
(signed) “Dawn L. Farrell” | |
Dated May 8, 2018 | Dawn L. Farrell |
President and Chief Executive Officer | |
Exhibit 32.2
Certification of Chief Financial Officer
Pursuant to 18 U.S.C. § 1350, as created by Section 906 of the Sarbanes-Oxley Act of 2002, the undersigned officer of TransAlta Corporation (the “Company”) hereby certifies, to such officer’s knowledge, that:
(i) | the accompanying Report of Foreign Private Issuer on Form 6-K of the Company (the “Report”) fully complies with the requirements of Section 13(a) or Section 15(d), as applicable, of the Securities Exchange Act of 1934, as amended; and |
(ii) | the information contained in the Report fairly presents, in all material respects, the financial condition and results of operations of the Company. |
(signed) “Donald Tremblay” | |
Dated May 8, 2018 | Donald Tremblay |
Chief Financial Officer | |
Serious News for Serious Traders! Try StreetInsider.com Premium Free!
You May Also Be Interested In
- Transalta (TAC) Achieves Commercial Operation of 300 MW White Rock Project
- Melco reaffirms commitment to sustainability in 2023 RISE to go Above & Beyond report
- Resolutions of Harvia Plc's Annual General Meeting on 26 April 2024
Create E-mail Alert Related Categories
SEC FilingsSign up for StreetInsider Free!
Receive full access to all new and archived articles, unlimited portfolio tracking, e-mail alerts, custom newswires and RSS feeds - and more!
