

Form 6-K Spark Networks SE For: Sep 04
 Tweet
Tweet Share
Share
UNITED STATES
SECURITIES AND EXCHANGE COMMISSION
Washington, D.C. 20549
FORM 6-K
REPORT OF FOREIGN PRIVATE ISSUER
PURSUANT TO RULE 13a-16 OR 15d-16 UNDER
THE SECURITIES EXCHANGE ACT OF 1934
For the month of September 2018.
Commission File Number: 001-38252
Spark Networks SE
(Translation of registrant's name into English)
Kohlfurter Straße 41/43
Berlin 10999
Germany
(Address of principal executive offices)
Indicate by check mark whether the registrant files or will file annual reports under cover Form 20-F or Form 40-F.
Form 20-F x Form 40-F ¨
Indicate by check mark if the registrant is submitting the Form 6-K in paper as permitted by Regulation S-T Rule 101(b)(1):________________
Indicate by check mark if the registrant is submitting the Form 6-K in paper as permitted by Regulation S-T Rule 101(b)(7):________________
Exhibit Index
| Exhibit No. | Description | |
| 99.1 | Spark Networks SE Presentation for Liolios Gateway Conference, September 5, 2018 |
SIGNATURES
Pursuant to the requirements of the Securities Exchange Act of 1934, the registrant has duly caused this report to be signed on its behalf by the undersigned hereunto duly authorized.
| SPARK NETWORKS SE | |||
| Date: September 4, 2018 | By: | /s/ Robert O’Hare | |
| Name: Robert O’Hare | |||
| Title: Chief Financial Officer | |||
Exhibit 99.1

1 September 2018

2 SAFE HARBOR STATEMENT

3 INTRODUCTION

4

5 EXPERIENCED MANAGEMENT TEAM Jeronimo Folgueira Managing Director, Chief Executive Officer & Director of the Board Since October 2015 Rob O’Hare Managing Director & Chief Financial Officer Since February 2015 Michael Schrezenmaier Managing Director & Chief Operating Officer Since September 2012 Benjamin Hoskins Chief Technology Officer Since January 2017

6 29 COUNTRIES, 15 LANGUAGES Note: Key Financial Metrics are based on mid - point of guidance ranges provided August 30, 2018 for 2018 Revenue and 2018 Adj. EBITDA Balance sheet positions shown are as of June 30, 2018. * Adj . EBITDA excludes stock - based compensation expense, transaction fees, executive severance and other one - time charges. Please see appendix for historical reconciliation from Net Income. SPARK NETWORKS SE OVERVIEW KEY FINANCIAL METRICS 2018 REVENUE €108.0 million 2018 ADJ. EBITDA €10.4 million CASH €8.1 million DEBT €14.0 million 500k monthly paying subs 250+ employees American Depositary Shares (ADSs) listed on NYSE American: LOV

7 OUR PORTFOLIO BRANDS

8 OUR KEY BRANDS Leading dating platform for successful, college - educated professionals. EliteSingles 30+ TARGET AUDIENCE: Leading Jewish dating platform in the world since 1997. Jdate & JSwipe ALL TARGET AUDIENCE: Leading Christian dating platform in the United States. Christian Mingle ALL TARGET AUDIENCE: Premium senior dating (launched in December 2017) SilverSingles 50+ TARGET AUDIENCE: 8

9 EVOLUTION FROM eDARLING TO TODAY’S EXPANSIVE PORTFOLIO 2010 2009 2012 2016 2015 2017 2011 2018 2013

10 10 Note: AttractiveWorld results consolidated beginning in Q4 2016 and Spark Inc. beginning in November 2017. Figures prior to 2015 are unaudited and presented in local GAAP. 2018 figures represent the mid - point of Revenue and Adj. EBITD A guidance ranges. HISTORICAL FINANCIAL PERFORMANCE CONSISTENT REVENUE AND PROFITABILITY GROWTH € 1 € 21 € 36 € 42 € 46 € 50 € 60 € 73 € 86 € 108 € (6) € (14) € (9) € (6) € (2) € 2 € 2 € 6 € 7 € 10 € (20) € - € 20 € 40 € 60 € 80 € 100 € 120 2009 2010 2011 2012 2013 2014 2015 2016 2017 2018E Revenue Adj. EBITDA EliteSingles launched in US Merger Acquisition Launched in United Kingdom, Australia & Canada International Expansion € in MM Launched 10

11 PLATFORM OF SCALE TRACK RECORD OF GROWTH KEY TAKEAWAYS COST ADVANTAGE • Large and growing market for online dating • One of the 5 largest players in the US Dating market in terms of subscription revenue • Differentiated portfolio of top brands • History of driving organic growth through both new brands and new market launches • Platform for executing accretive acquisitions • Lower - cost Berlin operating base allows for sustainable growth investments and strong cash flow generation • Premium subscription model that continues to drive strong retention and unit economics

12 THE SPARK PLATFORM

13 OUR PRODUCTS MATCHMAKING RELIGIOUS NICHES APP ONLY Drag & Drop Image

14 REVENUE BY BRAND Note: Based on H1 2018 Revenue in euros . REVENUE DISTRIBUTION REVENUE BY GEOGRAPHY North America International Other

15 15 Note: Market value as of August 30, 2018 . Excludes Parship Elite Group as they do not operate in North America and The Meet Group given the majority of their revenue comes from advertising instead of subscriptions. Match Group revenue is based on the mid - point of its guidance. TOP FIVE PLAYER IN THE US DATING MARKET 2018E REVENUE MARKET VALUE THE MATCH GROUP $1.7bn $16bn eHARMONY Private Private BADOO (+BUMBLE) Private Private ZOOSK Private Private SPARK NETWORKS ~$125m $160m We are one of only 5 companies with over $100M of subscription dating revenue operating in North America out of 4,500 dating players, and the only publicly listed company other than The Match Group to offer online dating subscriptions 15

16 16 OUR PLATFORM UNIQUE PORTFOLIO OF BRANDS WITH CLEAR COMPETITIVE DIFFERENTIATION The Match Group Spark Networks SE Premium Subscriptions Freemium Casual/Chat (high volume) Serious long - term relationships (low volume) Advertising The Meet Group Badoo Everything Subscriptions NEW 16

17 We are working to create a common, integrated technology platform to manage all of our brands This new shared platform will be strategically valuable in the following ways: • Facilitate fast and cost efficient roll - out of new features to all brands (ensuring all brands are state - of - the - art) • Facilitate fast and cost efficient creation of new brands and expansion to new countries • Enable future M&A and rapid integration • Ensure a very lean product and tech organization • Allow shared liquidity for certain products NEW UNIFIED TECHNOLOGY PLATFORM IN 2019 WILL DRIVE EFFICIENCIES

18 GROWTH DRIVERS

19 19 NEAR - TERM GROWTH STRATEGIES FOR SPARK NETWORKS • Market penetration remains low with significant opportunities for growth across niche verticals • Proven marketing playbook Increase Market Share More Brands • Launch and success of SilverSingles brand proves Spark has the blueprint for successfully rolling - out new brands in key niches • Shared liquidity a key asset More Geographies • Legacy brands can continue to grow in new markets • Opportunities to grow further in Asia and Latin America 1 2 3 19

20 20 Note: Aided brand awareness figures based on customer survey data from 2017. GROWTH POTENTIAL OF ELITESINGLES IN THE US In the US, we are leveraging a proven playbook for creating awareness and expanding market share that has been successful in numerous countries 63% 49% 48% 62% 17% 8% 5% 10% 10% 1% 0% 2% 4% 6% 8% 10% 12% 14% 16% 18% 0% 10% 20% 30% 40% 50% 60% 70% Launch Date May 2013 July 2013 December 2013 April 2014 September 2015 Aided Brand Awareness (%) Estimated Market Share (%) 20 Addressable Market Opportunity

21 21 MONTHLY PAYING SUBS SILVERSINGLES HAS TREMENDOUS POTENTIAL Launched on 12th December 2017 SilverSingles US is significantly exceeding the growth trajectory of the EliteSingles US launch Achieved 35k monthly paying subs after 6 months Contributed 8% of Total Revenue in June 2018 (6 months post launch) Revenue impact of ramp not yet reflected in financials, given revenue recognition over subscription life Invested €7m in marketing in H1’18 and have generated €3m in Revenue Expect SilverSingles to be cashflow positive in the second half of 2018 and EBITDA neutral in 2019 Month 1 Month 2 Month 3 Month 4 Month 5 Month 6 Month 7 Month 8 Silver Singles USA Elite Singles USA 21
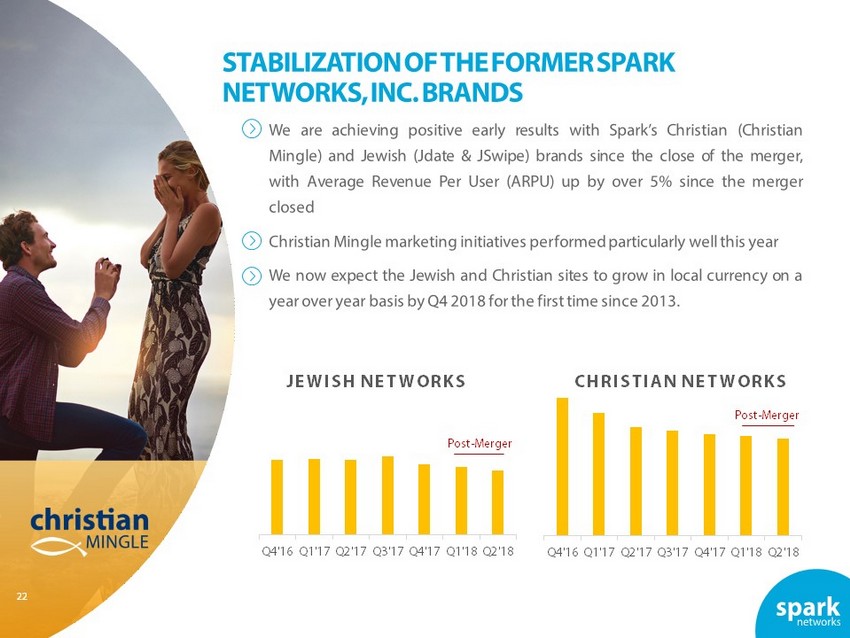
22 22 Q4'16 Q1'17 Q2'17 Q3'17 Q4'17 Q1'18 Q2'18 Q4'16 Q1'17 Q2'17 Q3'17 Q4'17 Q1'18 Q2'18 STABILIZATION OF THE FORMER SPARK NETWORKS, INC. BRANDS CHRISTIAN NETWORKS JEWISH NETWORKS Post - Merger Post - Merger 22

23 23 Note: Spark Networks, Inc. EBITDA figure based on management expectations for 2017 at the time of the deal announcement. M&A TRACK RECORD M&A ACTIVITY ALLOWS US TO SCALE AND GROW OUR BRAND PORTFOLIO IN A VALUE ACCRETIVE WAY DEAL VALUE EBITDA MULTIPLE COST SYNERGIES ACTUAL MULTIPLE €6.8M €1M 6.8x €1M 3.4x $32M $1M 32x $5M - 8M 4 - 5x Further consolidation will continue to be a key growth vector. 23

24 FINANCIALS

25 IDENTIFIED COST SYNERGIES * Figures exclude customer support and are fully burdened for benefits and bonuses. COST SYNERGIES FROM THE MERGER WITH SPARK NETWORKS, INC AVERAGE COST PER HEAD* Termination of the Management Services Agreement (MSA) with PEAK6 at the end of 2017 - DONE Termination of most Spark Networks Inc. executive employment agreements in Q4 2017 - DONE Closed the Los Angeles Office in Q1 2018 - DONE Other efficiencies (scale benefits, duplicated contracts, etc.) – Ongoing Average Los Angeles (Old Spark) Average Berlin (Affinitas GmbH) - 40%

26 26 Note: Pro Forma figures are unaudited. 2018E figures based on mid - point of ranges. Free Cash Flow is defined as Operating Cash F low minus CapEx. * Excludes transaction fees, merger integration costs, severance, deferred revenue write - offs, and other one - time charges. * These adjustments are tax - effected with a 40% tax rate within Net Income. CURRENT & LONG TERM TARGET MARGINS % OF REVENUE 2017 REPORTED 2017 PRO FORMA 2018E LONG TERM TARGET Revenue 100% 100% 100% Marketing Spend 62% 53% 40% - 45% Contribution Margin 38% 47% 55% - 60% Total Operating Expenses* 30% 39% 20% - 25% Adj. EBITDA Margin* 8% 8% 10% 30% - 40% Non - GAAP Net Income* 0% - 1% 20% - 30% Free Cash Flow* 0% 1% 15% - 25% Spark Networks SE was cash flow positive on a pro forma basis* in 2017 before the benefit of any post - merger synergies. With the cost synergies realized via the Spark Networks Inc. integration we expect the Group to generate significant free cash flow to fund acquisitions and other growth investments. 26

27 NEW CREDIT FACILITY DETAILS €25M €35M €15M

28 28 2018 & 2019 FINANCIAL OUTLOOK KEY DRIVERS FOR 2018 & 2019 METRIC 2018 2019 Revenue €106.5 – €109.5M Mid - to high single digit revenue growth rate Adj. EBITDA €8.9 – €11.9M 1 – 3 points of Adj. EBITDA margin expansion 28

29 APPENDIX

30 (1) The ownership positions of Mr. Brosseder and Mr. Khalil include their individual holdings in Affinitas Phantom Share GmbH of 871,190 ADSs each. SUMMARY OWNERSHIP & CAPITALIZATION Valuation Overview ($MMs except per share figures) 8/30/18 Enterprise Value Calculation: Share Price 12.39$ American Depository Shares (ADSs in MMs) 13.0 Market Capitalization 160.9$ Less: Cash (6/30/18)* 9.4 Plus: Debt (6/30/18)* 16.3 Enterprise Value 167.9$ Top Holders Detail (ADSs & $ in MMs) $ Value ADSs % of Total Rocket Internet SE 41.7$ 3.4 25.9% Mercutio GmbH 14.8 1.2 9.2% Holtzbrinck Ventures NM GmbH 13.3 1.1 8.3% PDV Inter-Media Venture GmbH 13.3 1.1 8.3% David Khalil (1) 11.4 0.9 7.1% Lukas Brosseder (1) 11.3 0.9 7.0% Total 5% Holders 105.7$ 8.5 65.7% Total ADSs Outstanding 160.9$ 13.0

31 12 Months Ended December 31, Growth Rates % 2017 2016 2015 2017 2016 # of Registrations North America 2,289,036 1,616,963 759,351 41.6% 112.9% International 6,162,597 5,280,686 5,081,606 16.7% 3.9% Total # of Registrations 8,451,633 6,897,649 5,840,957 22.5% 18.1% Average Paying Subscribers North America 83,870 46,453 15,240 80.5% 204.8% International 295,533 270,823 266,675 9.1% 1.6% Total Average Paying Subscribers 379,403 317,276 281,915 19.6% 12.5% Monthly ARPU North America € 24.42 € 28.71 € 28.81 (15.0%) (0.3%) International € 17.22 € 17.69 € 17.24 (2.7%) 2.6% Monthly ARPU € 18.81 € 19.30 € 17.87 (2.6%) 8.0% Total Net Revenue North America € 24,574 € 16,004 € 5,268 53.6% 203.8% International € 61,063 € 57,487 € 55,174 6.2% 4.2% Total Net Revenue € 85,637 € 73,491 € 60,442 16.5% 21.6% Direct Marketing North America € 17,980 € 15,059 € 8,355 19.4% 80.3% International € 35,489 € 33,311 € 34,234 6.5% (2.7%) Total Direct Marketing € 53,469 € 48,370 € 42,589 10.5% 13.6% Contribution North America € 6,594 € 944 (€ 3,087) 598.2% (130.6%) International € 25,574 € 24,177 € 20,940 5.8% 15.5% Total Contribution € 32,168 € 25,121 € 17,853 28.1% 40.7% METRICS | FULL YEAR 2015 TO 2017

32 METRICS | HALF YEAR RESULTS Six Months Ended Growth Rates % 6/30/2018 12/31/2017 6/30/2017 12/31/2016 1st Half 2018 vs. 1st Half 2018 2nd Half 2017 1st Half 2017 2nd Half 2016 2nd Half 2017 1st Half 2017 # of Registrations North America 2,133,705 1,233,455 1,055,581 878,756 73.0% 102.1% International 3,218,816 3,096,086 3,066,511 2,664,838 4.0% 5.0% Total # of Registrations 5,352,521 4,329,541 4,122,092 3,543,594 23.6% 29.8% Average Paying Subscribers North America 178,101 97,786 69,953 53,914 82.1% 154.6% International 310,923 296,193 294,872 273,075 5.0% 5.4% Total Average Paying Subscribers 489,024 393,979 364,825 326,989 24.1% 34.0% Monthly ARPU North America € 21.47 € 22.87 € 26.58 € 27.18 (6.1%) (19.2%) International € 16.12 € 16.94 € 17.50 € 17.74 (4.8%) (7.9%) Monthly ARPU € 18.07 € 18.41 € 19.24 € 19.29 (1.9%) (6.1%) Total Net Revenue North America € 22,939 € 13,419 € 11,155 € 8,793 70.9% 105.6% International € 30,075 € 30,102 € 30,961 € 29,061 (0.1%) (2.9%) Total Net Revenue € 53,014 € 43,521 € 42,116 € 37,854 21.8% 25.9% Direct Marketing North America € 14,585 € 8,585 € 9,395 € 7,631 69.9% 55.2% International € 18,000 € 17,394 € 18,095 € 15,569 3.5% (0.5%) Total Direct Marketing € 32,585 € 25,979 € 27,490 € 23,200 25.4% 18.5% Contribution North America € 8,354 € 4,834 € 1,760 € 1,162 72.8% 374.7% International € 12,075 € 12,708 € 12,866 € 13,492 (5.0%) (6.2%) Total Contribution € 20,429 € 17,542 € 14,626 € 14,654 16.5% 39.7%

33 RECONCILIATION OF FULL YEAR NET (LOSS)/PROFIT TO ADJ. EBITDA CONSOLIDATED STATEMENTS OF COMPREHENSIVE LOSS/INCOME (in € thousands) Years ended December 31, Pro Forma (in € thousands) 2017 2016 2015 2017 2016 Revenue 85,637 73,491 60,442 105,911 109,731 Cost of revenue (58,776) (51,202) (44,630) (63,937) (65,519) Gross profit 26,861 22,289 15,812 41,974 44,212 Other income 54 126 309 54 141 Other operating expenses (32,030) (19,742) (15,193) (39,844) (51,255) Sales and marketing expenses (5,540) (3,919) (3,036) (7,099) (10,914) Customer service expenses (3,971) (2,791) (2,357) (5,741) (5,523) Technical operations and development expenses (6,428) (3,305) (3,849) (9,987) (11,802) General and administrative expenses (16,091) (9,727) (5,951) (17,017) (23,016) Operating (loss)/profit (5,115) 2,673 928 2,184 (6,902) Interest income and similar income 239 157 30 591 172 Interest expense and similar charges (782) (425) (103) (852) (846) Net finance expenses (543) (268) (73) (261) (674) (Loss)/income before taxes (5,658) 2,405 855 1,923 (7,576) Income tax benefit (expense) 84 (1,082) (445) (5,057) 838 (Loss)/profit from continuing operations (5,574) 1,323 410 (3,134) (6,738) Discontinued operations Loss from discontinued operations, net of tax - (632) (959) - - Net (loss)/profit (5,574) 691 (549) (3,134) (6,738) Years ended December 31, Pro Forma (in € thousands) 2017 2016 2015 2017 2016 Net (loss)/profit (5,574) 691 (549) (3,134) (6,738) Discontinued operations - 632 959 - - Net finance expenses 543 268 73 261 674 Income tax (expense) benefit (84) 1,082 445 5,057 (838) Depreciation and amortization 3,084 1,278 140 4,266 6,164 Impairment of intangibles 25 - - 46 4,182 Stock-based compensation 488 991 600 1,175 1,878 Non-recurring costs 8,123 927 16 943 1,880 Adjusted EBITDA (1) 6,605 5,869 1,684 8,614 7,202 Years ended December 31, Pro Forma Summary of non-recurring costs 2017 2016 2015 2017 2016 Deferred revenue write-offs 603 - - 943 - Restructuring expenses - 642 - - 642 Transaction and advisory fees 3,995 162 - - 349 Merger integration costs 2,042 - - - - Other employee payments 1,053 - - - - Severance costs 430 123 16 - 889 Total adjustments 8,123 927 16 943 1,880

34 RECONCILIATION OF HALF YEAR NET (LOSS)/PROFIT TO ADJ. EBITDA CONSOLIDATED STATEMENTS OF COMPREHENSIVE LOSS/INCOME (in € thousands) Six Months Ended June 30, (in € thousands) 2018 2017 Revenue 53,014 42,116 Cost of revenue (37,350) (29,039) Gross profit 15,664 13,077 Other income 24 49 Other operating expenses (17,511) (15,100) Sales and marketing expenses (2,457) (2,765) Customer service expenses (2,348) (2,195) Technical operations and development expenses (3,374) (2,764) General and administrative expenses (9,332) (7,376) Operating (loss)/profit (1,823) (1,974) Interest income and similar income 214 73 Interest expense and similar charges (778) (419) Net finance expenses (564) (346) (Loss)/income before taxes (2,387) (2,320) Income tax benefit (expense) 1,240 616 (Loss)/profit from continuing operations (1,147) (1,704) Discontinued operations Loss from discontinued operations, net of tax - - Net (loss)/profit (1,147) (1,704) Six Months Ended June 30, (in € thousands) 2018 2017 Net (loss)/profit (1,147) (1,704) Discontinued operations - - Net finance expenses 564 346 Income tax (expense) benefit (1,240) (616) Depreciation and amortization 1,637 1,505 Impairment of intangibles - 25 Stock-based compensation 1,777 376 Non-recurring costs 841 2,438 Adjusted EBITDA (1) 2,432 2,370 Six Months Ended June 30, Summary of non-recurring costs 2018 2017 Deferred revenue write-offs 289 - Restructuring expenses - - Transaction and advisory fees 264 2,335 Merger integration costs 14 - Other employee payments - - Severance costs 274 103 Total adjustments 841 2,438

35
Serious News for Serious Traders! Try StreetInsider.com Premium Free!
You May Also Be Interested In
- Strategic Lithium Supply Chain Initiative Supports Long-Term Growth Vision
- The fourmula launches 'the reset' four-step skincare system with 25% welcome discount
- New to The Street to Broadcast Nationwide on Bloomberg Television Tonight at 6:30 PM ET Featuring RHINO Bitcoin, Marina Decisions, Medicus Pharma and Virtuix Holdings
Create E-mail Alert Related Categories
SEC FilingsSign up for StreetInsider Free!
Receive full access to all new and archived articles, unlimited portfolio tracking, e-mail alerts, custom newswires and RSS feeds - and more!