



Form 6-K STANTEC INC For: Aug 05
 Tweet
Tweet Share
Share E-mail
SECURITIES AND EXCHANGE COMMISSION
Washington, DC 20549
Form 6-K
Report of Foreign Private Issuer
Pursuant to Rule 13a-16 or 15d-16 of
the Securities Exchange Act of 1934
| For the Month of: August, 2015 | Commission File Number: 001-32562 |
STANTEC INC.
(Name of Registrant)
10160 – 112 Street
Edmonton, Alberta
Canada T5K 2L6
(Address of Principal Executive Offices)
Indicate by check mark whether the registrant files or will file annual reports under cover of Form 20-F or Form 40-F:
Form 20-F Form40-F X
Indicate by check mark if the registrant is submitting the Form 6-K in paper as permitted by Regulation S-T Rule 101(b)(1):
Indicate by check mark if the registrant is submitting the Form 6-K in paper as permitted by Regulation S-T Rule 101(b)(7):
SIGNATURES
Pursuant to the requirements of the Securities Exchange Act of 1934, the registrant has duly caused this report to be signed on its behalf by the undersigned, thereunto duly authorized.
| STANTEC INC. | ||||||||
| Date: August 5, 2015 | By: | /s/ Daniel J. Lefaivre | ||||||
| Name: Daniel J. Lefaivre | ||||||||
| Title: Executive Vice President and CFO | ||||||||
EXHIBIT INDEX
| Exhibit |
Description of Exhibit | |
| 99.1 | Stantec Inc. 2015 Second Quarter Report to Shareholders | |
| 99.2 | Certification of Interim Filings – President and CEO | |
| 99.3 | Certification of Interim Filings – Executive Vice President and CFO | |
Exhibit 99.1
Report to Shareholders
Second Quarter 2015
Today we announced that Stantec continued to perform well in the second quarter. With both our Buildings and Infrastructure businesses demonstrating strong performance, our diverse business model is providing a solid foundation for managing our Company through the economic factors impacting the oil and gas industry.
| · | Gross revenue increased 12.1% to $710.3 million in Q2 15 from $633.8 million in Q2 14 |
| · | Both our Buildings and Infrastructure business operating units had strong organic revenue growth in Q2 15, partly offsetting a retraction in our Energy & Resources business operating unit |
| · | EBITDA increased 5.1% to $82.2 million in Q2 15 from $78.2 million in Q2 14 |
| · | Net income decreased 2.7% to $43.1 million in Q2 15 from $44.3 million in Q2 14 |
| · | Diluted earnings per share decreased 2.1% to $0.46 in Q2 15 from $0.47 in Q2 14 |
| · | We declared a cash dividend of $0.105 per share |
| · | Subsequent to the quarter, we acquired 30-person VI Engineering, LLC, based in Houston, Texas |
We are pleased with our second quarter performance, especially given that we are comparing the results of our largest business operating unit — Energy & Resources— against the results of a very robust Q2 14. We thank our talented staff for once again demonstrating their resourcefulness and their commitment to working with our clients to design with community in mind.
On August 5, 2015, we declared a cash dividend of $0.105 per share, payable on October 15, 2015, to shareholders of record on September 30, 2015.
In July 2015, we closed the acquisition of VI Engineering, LLC, based in Houston, Texas. This 30-person firm’s strong background in the design of high-voltage electrical substations, transmission and distribution lines, and electric power systems adds to our platform to better serve our clients across all of our regions. This acquisition builds on the two companies we acquired in Q1 15 and the eight we acquired in 2014, further strengthening our ability to design with community in mind.
Our Buildings business operating unit achieved strong revenue growth in Q2 15. In the United States, gross revenue significantly increased due to acquisitions completed in 2014 and 2015. In Canada, Buildings benefited from strong activity in the healthcare market, continuing strength in its Education sector, and steady activity in its Commercial sector. For example, due to Dessau’s well-recognized position in the Quebec market, during the quarter, we secured work to provide the mechanical and electrical engineering services for building a mental health pavilion at Saint-Jérôme Regional Hospital and to expand the Montreal Sacré-Cœur Hospital to include an integrated tertiary trauma center.
i
The revenue retraction in our Oil & Gas sector results from the sharp decline in oil prices and corresponding market conditions year to date compared to the first two quarters of 2014. We are committed over the long term to this business, and our focus is on maintaining our expertise in this sector. We will continue to develop our position in the United States in the Oil &Gas sector to ensure we can take advantage of future market conditions.
Environmental Services’ organic revenue in sectors that are non-resource related remained stable in Canada and achieved overall strong growth in the United States year to date in 2015, in contrast to the slow start in 2014 caused by harsh winter conditions.
Our Infrastructure business operating unit achieved strong growth in Q2 15. Its Community Development, Transportation, and Water sectors all experienced strong organic gross revenue growth year to date compared to 2014.
In Transportation, a rebounding US economy and our North American strategic market position led to increased organic growth opportunities. To illustrate, during the quarter, we were selected as the independent engineer for the New Champlain Bridge Corridor design-build project in Montreal, Quebec.
Community Development achieved strong organic revenue growth in the United States and stable growth in Canada in Q2 15 compared to Q2 14. In the United States, we continued to secure major non-residential projects such as the design of streets, sidewalks, sewers, water mains, and streetscape and plaza areas to support the Coney Island redevelopment in Brooklyn, New York, in the area affected by Hurricane Sandy.
Our outlook for the remainder of 2015 is to end the year with a moderate increase in organic gross revenue growth. With a strong business model and market position, we will continue to execute our business strategy for long-term growth.
I thank our employees who deliver on our promise to design with community in mind, our clients who entrust us with their projects, and you, our shareholders, for your continued confidence in Stantec.
Bob Gomes
President & CEO
August 5, 2015
ii
Management’s Discussion and Analysis
August 5, 2015
This discussion and analysis of Stantec Inc.’s (Stantec or the Company) operations, financial position, and cash flows for the quarter ended June 30, 2015, dated August 5, 2015, should be read in conjunction with the Company’s unaudited interim condensed consolidated financial statements and related notes for the quarter ended June 30, 2015; the Management’s Discussion and Analysis and audited consolidated financial statements and related notes included in our 2014 Annual Report; and the Report to Shareholders contained in our 2015 Second Quarter Report. Our unaudited interim consolidated financial statements and related notes for the quarter ended June 30, 2015, are prepared in accordance with International Financial Reporting Standards (IFRS) as issued by the International Accounting Standards Board (IASB). We continue to use the same accounting policies and methods as we used in 2014.
All amounts shown in this report are in Canadian dollars unless otherwise indicated. All comparative share capital, earnings per share, dividends per share, and share-based payment transaction information have been adjusted for amounts previously reported for the two-for-one share split that occurred on November 14, 2014.
Additional information regarding our Company, including our Annual Information Form, is available on SEDAR at www.sedar.com and on EDGAR at www.sec.gov. Such additional information is not incorporated here by reference, unless otherwise specified, and should not be deemed to be made part of this Management’s Discussion and Analysis.
Core Business and Strategy
Our Company provides professional consulting services—in planning, engineering, architecture, interior design, landscape architecture, surveying, environmental sciences, project management, and project economics—for infrastructure and facilities projects. By integrating our expertise in these areas across North American and international locations, we are able to provide our clients with a vast number of project solutions. We believe this integrated approach enables us to execute our operating philosophy by maintaining a world-class level of expertise, which we supply to our clients through the strength of our local offices. Through multidiscipline service delivery, we also support clients throughout the project life cycle—from the initial conceptual planning to project completion and beyond.
Our business objective is to be a top 10 global design firm, and our focus is to provide professional services in the infrastructure and facilities market, principally on a fee-for-service basis, while participating in various models of alternative project delivery. To realize our business objective, we plan on achieving a compound average growth rate of 15% through a combination of organic and acquisition growth, while also providing dividend returns for our shareholders. Our core business and strategy and the key performance drivers and capabilities required to meet our business objective have not changed in the second quarter of 2015 from those described on pages M-3 to M-14 of our 2014 Annual Report and are incorporated here by reference.
| Management’s Discussion and Analysis | ||||
| (unaudited) | ||||
| June 30, 2015 | M-1 | Stantec Inc. |
Results
Overall Performance
Highlights for Q2 15
We continued to perform well in the second quarter of 2015, despite the challenging economic conditions in the oil and gas industry, which demonstrates the strength of our diversified business model. Comparing the second quarter in 2014 to the same period in 2015, our gross revenue increased 12.1%—from $633.8 to $710.3 million; EBITDA increased 5.1%—from $78.2 to $82.2 million; and diluted earnings per share decreased from $0.47 to $0.46.
Our results were positively impacted by an increase in revenue due to acquisitions completed in 2014 and 2015 and the impact of foreign exchange rates on revenue earned by our US subsidiaries. In Q2 15, we experienced strong organic revenue growth in our Buildings and Infrastructure business operating units compared to Q2 14. This growth was offset by a retraction in our Energy & Resources business operating unit in Q2 15 compared to Q2 14. The retraction, which impacted both our Canadian and US operations, resulted from the decline in the oil and gas industry.
Our gross margin decreased—from 54.7% in Q2 14 to 54.0% in Q2 15—due to downward pressure on margins in the oil and gas industry and lower margins from the Dessau acquisition. Our administrative and marketing expenses as a percentage of net revenue increased—from 39.9% in Q2 14 to 41.2% in Q2 15—mainly from lower utilization due to increased integration activity from recent acquisitions and a retraction in our Oil & Gas business. In addition, our net income was impacted by an increase in the amortization of intangible assets and net interest expense. These increases in expenses were partly offset by an increase in other income due to a gain on sale of land and buildings and investments held for self-insured liabilities.
| Management’s Discussion and Analysis | ||||
| (unaudited) | ||||
| June 30, 2015 | M-2 | Stantec Inc. |
The following table summarizes key financial data for Q2 15 and Q2 14 and the first two quarters of 2015 and 2014:
| Quarter Ended June 30 | Two Quarters Ended June 30 | |||||||||||||||||||||||||||||||
| (In millions of Canadian dollars, except per share amounts and %) |
2015 | 2014 | $ Change |
% Change |
2015 | 2014 | $ Change |
% Change |
||||||||||||||||||||||||
| Gross revenue (note 1) |
710.3 | 633.8 | 76.5 | 12.1% | 1,416.0 | 1,207.7 | 208.3 | 17.2% | ||||||||||||||||||||||||
| Net revenue (note 1) |
593.9 | 530.2 | 63.7 | 12.0% | 1,186.2 | 1,011.5 | 174.7 | 17.3% | ||||||||||||||||||||||||
| EBITDA (note 2) |
82.2 | 78.2 | 4.0 | 5.1% | 158.3 | 140.2 | 18.1 | 12.9% | ||||||||||||||||||||||||
| Net income |
43.1 | 44.3 | (1.2) | (2.7%) | 81.1 | 77.8 | 3.3 | 4.2% | ||||||||||||||||||||||||
| Earnings per share – basic |
0.46 | 0.47 | (0.01) | (2.1%) | 0.86 | 0.83 | 0.03 | 3.6% | ||||||||||||||||||||||||
| Earnings per share – diluted |
0.46 | 0.47 | (0.01) | (2.1%) | 0.86 | 0.83 | 0.03 | 3.6% | ||||||||||||||||||||||||
| Cash dividends declared per |
0.105 | 0.0925 | 0.0125 | 13.5% | 0.21 | 0.185 | 0.025 | 13.5% | ||||||||||||||||||||||||
| Cash flows |
||||||||||||||||||||||||||||||||
| From (used in) operating activities |
60.6 | 18.6 | 42.0 | n/m | (27.6) | 15.0 | (42.6) | n/m | ||||||||||||||||||||||||
| Used in investing activities |
(15.9) | (54.8) | 38.9 | n/m | (161.9) | (113.8) | (48.1) | n/m | ||||||||||||||||||||||||
| From (used in) financing activities |
(38.6) | 34.7 | (73.3) | n/m | 51.0 | 73.6 | (22.6) | n/m | ||||||||||||||||||||||||
|
n/m = not meaningful
note 1: Gross revenue and net revenue are additional IFRS measures as discussed in the Definition of Additional IFRS Measures and Non-IFRS Measures in the Critical Accounting Estimates, Developments, and Measures section (the “Definitions section”) of our 2014 Annual Report. The Definitions section is incorporated here by reference.
note 2: EBITDA is a non-IFRS measure and is calculated as income before income taxes, plus net interest expense, amortization of intangible assets, and depreciation of property and equipment, as further discussed in the Definitions section of our 2014 Annual Report.
note 3: All comparative earnings per share and dividends per share amounts have been adjusted from previously reported amounts for the two-for-one share split that occurred on November 14, 2014. |
| |||||||||||||||||||||||||||||||
The following highlights our key activities and initiatives undertaken in the quarter ended June 30, 2015:
| · | We had strong organic revenue growth in our Buildings and Infrastructure business operating units, particularly in our US Community Development, Water, and Transportation sectors and in our Canadian Buildings operations. This growth partly offsets the 25.6% organic revenue retraction in our Energy & Resources business operating unit during the quarter compared to the same period in 2014. The retraction was due to challenging economic conditions in our Oil & Gas sector. |
| · | We successfully completed integrating Dessau, acquired in Q1 15, to our enterprise management systems. |
| · | We declared and paid a cash dividend of $0.105 per share to shareholders of record on June 30, 2015, an increase of 13.5% from last year. Additionally, on August 5, 2015, we declared a dividend of $0.105 per share, payable on October 15, 2015, to shareholders of record on September 30, 2015. |
| Management’s Discussion and Analysis | ||||
| (unaudited) | ||||
| June 30, 2015 | M-3 | Stantec Inc. |
Results Compared to 2015 Targets
In the Management’s Discussion and Analysis in our 2014 Annual Report, we established various ranges of expected performance for fiscal year 2015. The following table indicates our progress toward these targets:
| Measure | 2015 Target Range | Actual Q2 15 YTD Results Achieved | ||||
| Gross margin as % of net revenue |
Between 54% and 56% | 54.6% ü | ||||
| Administrative and marketing expenses as % |
Between 40% and 42% | 41.9% ü | ||||
| EBITDA as % of net revenue (notes 1 and 4) |
Between 13% and 15% | 13.3% ü | ||||
| Net income as % of net revenue |
At or above 6% | 6.8% ü | ||||
| Return on equity (notes 2 and 4) |
At or above 14% | 15.4% ü | ||||
| Net debt to EBITDA (notes 1,3, and 4) |
Below 2.5 | 1.2 ü |
This table and the discussion paragraph below contain forward-looking statements. See the Caution Regarding Forward-Looking Statements section of this Management’s Discussion and Analysis.
note 1: EBITDA as a percentage of net revenue is calculated as EBITDA divided by net revenue. EBITDA is calculated as income before income taxes, plus net interest expense, amortization of intangible assets, and depreciation of property and equipment.
note 2: Return on equity is calculated as net income for the last four quarters, divided by the average shareholders’ equity over each of the last four quarters.
note 3: Net debt to EBITDA is calculated as the sum of (1) long-term debt, including current portion, plus bank indebtedness, less cash and deposits and cash in escrow, divided by (2) EBITDA for the last four quarters.
note 4: Return on equity, EBITDA as a percentage of net revenue, and net debt to EBITDA are non-IFRS measures (discussed in the Definitions section of our 2014 Annual Report).
ü Met or performed better than target.
X Did not meet target.
We met all targets at the end of Q2 15.
Results of Operations
Our Company operates in one reportable segment—Consulting Services. We provide knowledge-based solutions for infrastructure and facilities projects through value-added professional services, principally under fee-for-service agreements with clients.
| Management’s Discussion and Analysis | ||||
| (unaudited) | ||||
| June 30, 2015 | M-4 | Stantec Inc. |
The following table summarizes key operating results as a percentage of net revenue and the percentage increase or decrease in the dollar amount for each key operating result:
| Quarter Ended June 30 | Two Quarters Ended June 30 | |||||||||||||||||||||||
| Percentage of Net Revenue |
Percentage (Decrease) * |
Percentage of Net Revenue |
Percentage (Decrease) * |
|||||||||||||||||||||
| 2015 | 2014 | 2015 vs. 2014 | 2015 | 2014 | 2015 vs. 2014 | |||||||||||||||||||
| Gross revenue |
119.6% | 119.5% | 12.1% | 119.4% | 119.4% | 17.2% | ||||||||||||||||||
| Net revenue |
100.0% | 100.0% | 12.0% | 100.0% | 100.0% | 17.3% | ||||||||||||||||||
| Direct payroll costs |
46.0% | 45.3% | 13.7% | 45.4% | 45.5% | 17.1% | ||||||||||||||||||
| Gross margin |
54.0% | 54.7% | 10.5% | 54.6% | 54.5% | 17.4% | ||||||||||||||||||
| Administrative and marketing expenses |
41.2% | 39.9% | 15.6% | 41.9% | 40.7% | 20.6% | ||||||||||||||||||
| Depreciation of property and equipment |
1.9% | 1.7% | 21.7% | 1.9% | 1.8% | 22.2% | ||||||||||||||||||
| Amortization of intangible assets |
1.5% | 1.1% | 50.0% | 1.6% | 1.1% | 68.8% | ||||||||||||||||||
| Net interest expense |
0.5% | 0.4% | 27.3% | 0.5% | 0.4% | 48.6% | ||||||||||||||||||
| Other net finance expense |
0.1% | 0.2% | n/m | 0.1% | 0.1% | n/m | ||||||||||||||||||
| Share of income from joint ventures and associates |
(0.1%) | (0.1%) | 0.0% | (0.1%) | (0.2%) | (14.3%) | ||||||||||||||||||
| Foreign exchange loss |
0.0% | 0.0% | n/m | 0.0% | 0.0% | n/m | ||||||||||||||||||
| Other income |
(1.1%) | 0.0% | n/m | (0.6%) | 0.0% | n/m | ||||||||||||||||||
| Income before income taxes |
10.0% | 11.5% | (2.6%) | 9.4% | 10.6% | 4.2% | ||||||||||||||||||
| Income taxes |
2.8% | 3.1% | (2.4%) | 2.6% | 2.9% | 4.1% | ||||||||||||||||||
| Net income |
7.3% | 8.4% | (2.7%) | 6.8% | 7.7% | 4.2% | ||||||||||||||||||
n/m = not meaningful
* Percentage increase (decrease) calculated based on the dollar change from the comparable period.
The following sections outline specific factors that affected the results of our operations in the second quarter of 2015 and should be read in conjunction with our unaudited interim consolidated financial statements for the quarter ended June 30, 2015.
Gross and Net Revenue
While providing professional services, we incur certain direct costs for subconsultants, equipment, and other expenditures that are recoverable directly from our clients. Revenue associated with these direct costs is included in gross revenue. Because these direct costs and associated revenue can vary significantly from contract to contract, changes in gross revenue may not be indicative of our revenue trends. Accordingly, we also report net revenue (which is gross revenue less subconsultant and other direct expenses) and analyze results in relation to net revenue rather than gross revenue.
Revenue earned by acquired companies in the first 12 months following acquisition is initially reported as revenue from acquisitions and thereafter reported as organic revenue.
All business operating units generate a portion of gross revenue in the United States. The value of the Canadian dollar averaged US$0.81 in Q2 15 compared to US$0.92 in Q2 14, representing a 12.0% decrease. The weakening Canadian dollar had a positive effect on the revenue reported in Q2 15 compared to Q2 14. Fluctuations in other foreign currencies did not have a material impact on our revenue.
Our contract backlog grew from $1.8 billion at December 31, 2014, to $2.0 billion at the end of Q2 15. (Backlog is a non-IFRS measure further discussed in the Definitions section of our 2014 Annual Report.) This increase was the result of recent project wins, fluctuation in foreign exchange, and acquisitions completed in the first two quarters of 2015. We define backlog as the total value of secured work that has not yet been completed where we have an executed contract and a notice to proceed on the contract. Only approximately the first 12 to 18 months of the total value of secured work for a project is included in work backlog.
| Management’s Discussion and Analysis | ||||
| (unaudited) | ||||
| June 30, 2015 | M-5 | Stantec Inc. |
The following tables summarize the impact of acquisitions, organic growth, and foreign exchange on our gross and net revenue:
| Gross Revenue (In millions of Canadian dollars) |
Quarter Ended June 30 |
Two Quarters Ended June 30 | ||
| Increase (decrease) due to |
||||
| Acquisition growth |
93.8 | 184.7 | ||
| Organic retraction |
(53.6) | (44.1) | ||
| Impact of foreign exchange rates on revenue |
36.3 | 67.7 | ||
| Total net increase in gross revenue |
76.5 | 208.3 | ||
| Net Revenue (In millions of Canadian dollars) |
Quarter Ended 2015 vs . 2014 |
Two Quarters Ended 2015 vs . 2014 | ||
| Increase (decrease) due to |
||||
| Acquisition growth |
76.4 | 151.9 | ||
| Organic retraction |
(42.0) | (32.0) | ||
| Impact of foreign exchange rates on revenue |
29.3 | 54.8 | ||
| Total net increase in net revenue |
63.7 | 174.7 | ||
The increase in acquisition gross and net revenue in Q2 15 compared to Q2 14 resulted from revenue earned in Q2 15 that was attributed to the acquisitions listed in the Gross Revenue by Region and the Gross Revenue by Business Operating Unit sections that follow. We experienced increases in organic gross revenue in Q2 15 compared to Q2 14 in our Buildings and Infrastructure business operating units. These increases were offset by a retraction in organic gross revenue in our Energy & Resources business operating unit.
| Management’s Discussion and Analysis | ||||
| (unaudited) | ||||
| June 30, 2015 | M-6 | Stantec Inc. |
Gross Revenue by Region
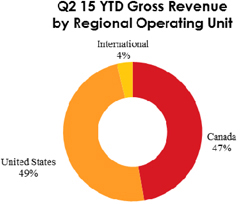
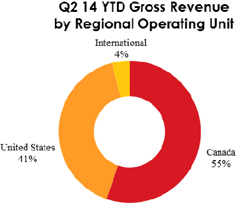
The following charts and tables summarize gross revenue and gross revenue growth in our three regional operating units—Canada, United States, and International:
|
|
| Gross Revenue by Regional Operating Unit | ||||||||||||||||||||||||
| (In millions of Canadian dollars) | Quarter Ended June 30, 2015 |
Quarter Ended June 30, 2014 |
Total Change |
Change Due to Acquisitions |
Change Due to Organic Growth (Retraction) |
Change Due to Foreign Exchange |
||||||||||||||||||
| Canada |
333.8 | 347.1 | (13.3) | 37.4 | (50.7) | n/a | ||||||||||||||||||
| United States |
351.5 | 263.0 | 88.5 | 56.4 | (1.5) | 33.6 | ||||||||||||||||||
| International |
25.0 | 23.7 | 1.3 | - | (1.4) | 2.7 | ||||||||||||||||||
| Total |
710.3 | 633.8 | 76.5 | 93.8 | (53.6) | 36.3 | ||||||||||||||||||
|
n/a = not applicable
|
||||||||||||||||||||||||
| Gross Revenue by Regional Operating Unit | ||||||||||||||||||||||||
| (In millions of Canadian dollars) | Two Quarters June 30, 2015 |
Two Quarters June 30, 2014 |
Total Change |
Change Due to Acquisitions |
Change Due to Organic (Retraction) |
Change Due to Foreign Exchange |
||||||||||||||||||
| Canada |
670.7 | 667.9 | 2.8 | 65.7 | (62.9) | n/a | ||||||||||||||||||
| United States |
694.8 | 491.2 | 203.6 | 119.0 | 21.9 | 62.7 | ||||||||||||||||||
| International |
50.5 | 48.6 | 1.9 | - | (3.1) | 5.0 | ||||||||||||||||||
| Total |
1,416.0 | 1,207.7 | 208.3 | 184.7 | (44.1) | 67.7 | ||||||||||||||||||
n/a = not applicable
Total gross revenue was positively impacted by the acquisitions completed in 2014 and 2015, and by the weakening Canadian dollar in Q2 15 compared to Q2 14, and was partly offset by organic revenue retraction, primarily in Canada.
| Management’s Discussion and Analysis | ||||
| (unaudited) | ||||
| June 30, 2015 | M-7 | Stantec Inc. |
Following are the acquisitions completed in 2014 and 2015 that impacted specific regions year to date:
| · | Canada |
| ¡ | Canadian engineering operations of Dessau Inc., 9073-4195 Quebec Inc., and Azimuth Services (Central) Inc. (collectively Dessau) (January 2015) |
| · | United States |
| ¡ | Williamsburg Environmental Group, Inc. and Cultural Resources, Inc. (WEG) (January 2014) |
| ¡ | Processes Unlimited International, Inc. (ProU) (March 2014) |
| ¡ | JBR Environmental Consultants, Inc. (JBR) (May 2014) |
| ¡ | Group Affiliates Inc. (SHW) (May 2014) |
| ¡ | Wiley Engineering, Inc. (Wiley) (June 2014) |
| ¡ | USKH Inc. (USKH) (June 2014) |
| ¡ | ADD Inc. (September 2014) |
| ¡ | Penfield & Smith Engineers, Inc. (Penfield & Smith) (October 2014) |
| ¡ | Sparling, Inc. (Sparling) (February 2015) |
Canada
Gross revenue from our Canadian operations decreased 3.8% in Q2 15 compared to Q2 14 and increased 0.4% year to date in 2015 compared to 2014. The $65.7 million in acquisition growth year to date that related to the Dessau acquisition was split between our three business operating units: approximately 27% in Buildings, 27% in Energy & Resources, and 46% in Infrastructure. Organic gross revenue retracted 14.6% in Q2 15 compared to Q2 14 and retracted 9.4% year to date in 2015 compared to 2014, mainly due to the continuing decline in the Oil & Gas sector within our Energy & Resources business operating unit. The retraction was partly offset by organic growth in our Buildings and Infrastructure business operating units.
We continued to see a significant retraction in the Energy & Resources business operating unit in Canada in the first two quarters of 2015 compared to the same period in 2014. The retraction was due to challenging economic conditions in our Oil & Gas sector. Retraction in Oil & Gas engineering and environmental services continued as many significant projects were substantially completed in 2014. Project delays, pricing pressures, and curtailed capital spending by Oil & Gas sector clients have also contributed to this reduced revenue generation. New project awards in the sector for engineering services continued to be slow and have been generally smaller in scale, and the sector attracted increased competition and pricing pressures. The downturn in market conditions has also affected our environmental services; however, the effect was less severe because approximately half of our environmental services work is outside of the oil and gas industry and therefore continues to be stable. Power has also retracted organically as a result of curtailed investments in thermal generation projects because of the uncertainty in long-term commodity input costs and a flattened demand for power. The Mining sector is continuing to experience challenges due to macroeconomic conditions, although we experienced year-to-date organic gross revenue growth due to the recognition of fees in Q1 15 for obtaining certain performance metrics on a major project.
All sectors in our Infrastructure business operating unit experienced organic gross revenue growth year to date with strong growth in Water. Our Water and Transportation sectors were supported by stable funding in the public sector, and activity in our Water sector continued to be driven by municipal investments in water and wastewater infrastructure as well as work associated with surface water resources and flood control, mitigation, and restoration. Community Development had organic revenue growth year to date across Canada, and in Q2 15, revenue was stable compared to Q2 14.
The public-private partnership (P3) model continued to be supported in Canada, particularly in Ontario and the western provinces. P3s continue to be considered at the municipal level.
| Management’s Discussion and Analysis | ||||
| (unaudited) | ||||
| June 30, 2015 | M-8 | Stantec Inc. |
United States
Gross revenue in our US operations increased 33.7% in Q2 15 compared to Q2 14 and 41.5% year to date in 2015 compared to 2014. These increases were due to strategic acquisition growth and the impact of foreign exchange due to the US dollar strengthening compared to the Canadian dollar. Organic revenue growth was stable in Q2 15 compared to Q2 14 as growth in the majority of our sectors was offset by a retraction in our Oil & Gas sector. Organic revenue grew 4.5% year to date in 2015 compared to 2014, and organic growth occurred in all business operating units and in all sectors except Oil & Gas.
Expanding our existing client relationships and our expertise in environmental mitigation resulted in strong growth in our US business year to date. Our Buildings business operating unit is supported by our expanded architectural presence and work in the healthcare sector, as well as by increased activity in the biopharmaceutical sector.
The public sector is still characterized by uncertainty in the political and regulatory environment, notably at the federal level. In response to fiscal constraints, opportunities have increased in design-build in the United States. Although a backlog of work exists within the transportation market, public sector budgets remain tight and uncertainty exists regarding the funding of the federal highway and transportation program. Despite this uncertainty, organic revenue increased in our Transportation sector in Q2 15 compared to Q2 14 and year to date in 2015 compared to 2014. Environmental Protection Agency (EPA) regulations have provided opportunities with our Power clients. Transmission and distribution opportunities still remain steady.
In the private sector, the housing market is continuing to show steady growth, specifically in the southern and western United States.
International
Gross revenue from our International operations increased 5.5% in Q2 15 compared to Q2 14 and 3.9% year to date in 2015 compared to 2014. This increase resulted from the strengthening of foreign currencies compared to the Canadian dollar and from organic growth in our Buildings business operating unit due primarily to healthcare projects secured in the Middle East. These year-to-date increases in 2015 compared to 2014 were partly offset by a retraction in organic gross revenue in our Mining sector as a result of global market conditions and a retraction in our Community Development sector.
| Management’s Discussion and Analysis | ||||
| (unaudited) | ||||
| June 30, 2015 | M-9 | Stantec Inc. |
Gross Revenue by Business Operating Unit
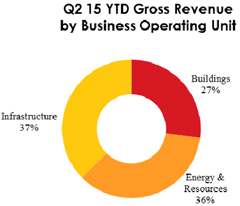
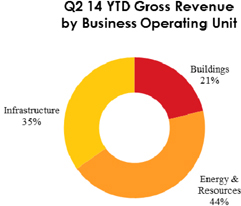
The following charts and tables summarize gross revenue and gross revenue growth in our three business operating units—Buildings, Energy & Resources, and Infrastructure:
|
|
| Gross Revenue by Business Operating Unit | Quarter Ended June 30 |
|||||||||||||||||||
| (In millions of Canadian dollars, except %) | 2015 | % of Consulting Services Gross Revenue |
2014 | % of Consulting Services Gross Revenue |
% Change in Gross Revenue 2015 vs. 2014 |
|||||||||||||||
| Buildings |
194.1 | 27.3% | 127.3 | 20.1% | 52.5% | |||||||||||||||
| Energy & Resources |
241.7 | 34.0% | 287.3 | 45.3% | (15.9%) | |||||||||||||||
| Infrastructure |
274.5 | 38.7% | 219.2 | 34.6% | 25.2% | |||||||||||||||
| Total |
710.3 | 100.0% | 633.8 | 100.0% | 12.1% | |||||||||||||||
|
Note: Comparative figures have been reclassified due to a realignment of several business lines between our Buildings, Energy & Resources, and Infrastructure business operating units.
|
| |||||||||||||||||||
| Two Quarters Ended June 30 |
||||||||||||||||||||
| (In millions of Canadian dollars, except %) | 2015 | % of Consulting Services Gross Revenue |
2014 | % of Consulting Services Gross Revenue |
% Change in Gross Revenue 2015 vs. 2014 |
|||||||||||||||
| Buildings |
382.9 | 27.0% | 255.2 | 21.1% | 50.0% | |||||||||||||||
| Energy & Resources |
504.0 | 35.6% | 531.7 | 44.0% | (5.2%) | |||||||||||||||
| Infrastructure |
529.1 | 37.4% | 420.8 | 34.9% | 25.7% | |||||||||||||||
| Total |
1416.0 | 100.0% | 1207.7 | 100.0% | 17.2% | |||||||||||||||
Note: Comparative figures have been reclassified due to a realignment of several business lines between our Buildings, Energy & Resources, and Infrastructure business operating units.
| Management’s Discussion and Analysis | ||||
| (unaudited) | ||||
| June 30, 2015 | M-10 | Stantec Inc. |
As indicated above, gross revenue growth was impacted by acquisitions, organic revenue retraction, and the effect of foreign exchange rates on revenue earned by our foreign subsidiaries. The impact that these factors had on gross revenue earned by each business operating unit is summarized in the following tables:
| Gross Revenue by Business Operating Unit | Quarter Ended June 30, 2015 vs. 2014 | |||||||||||||||
| (In millions of Canadian dollars) | Total Change | Change Due to Acquisitions |
Change Due to (Retraction) |
Change Due to Foreign Exchange |
||||||||||||
| Buildings |
66.8 | 51.9 | 7.3 | 7.6 | ||||||||||||
| Energy & Resources |
(45.6) | 16.5 | (73.5) | 11.4 | ||||||||||||
| Infrastructure |
55.3 | 25.4 | 12.6 | 17.3 | ||||||||||||
| Total |
76.5 | 93.8 | (53.6) | 36.3 | ||||||||||||
Note: Comparative figures have been reclassified due to a realignment of several business lines between our Buildings, Energy & Resources, and Infrastructure business operating units.
| Two Quarters Ended June 30, 2015 vs. 2014 | ||||||||||||||||
| (In millions of Canadian dollars) | Total Change | Change Due to Acquisitions |
Change Due to (Retraction) |
Change Due to Foreign Exchange |
||||||||||||
| Buildings |
127.7 | 96.3 | 16.7 | 14.7 | ||||||||||||
| Energy & Resources |
(27.7) | 41.0 | (88.2) | 19.5 | ||||||||||||
| Infrastructure |
108.3 | 47.4 | 27.4 | 33.5 | ||||||||||||
| Total |
208.3 | 184.7 | (44.1) | 67.7 | ||||||||||||
Note: Comparative figures have been reclassified due to a realignment of several business lines between our Buildings, Energy & Resources, and Infrastructure business operating units.
Following are the acquisitions completed in 2014 and 2015 that impacted specific business operating units year to date:
| • Buildings | • Energy & Resources | • Infrastructure | ||
| ¡ SHW (May 2014) ¡ USKH (June 2014) ¡ ADD Inc. (September 2014) ¡ Dessau (January 2015) ¡ Sparling (February 2015) |
¡ WEG (January 2014) ¡ ProU (March 2014) ¡ JBR (May 2014) ¡ Wiley (June 2014) ¡ Dessau (January 2015) |
¡ USKH (June 2014) ¡ Penfield & Smith (October 2014) ¡ Dessau (January 2015) |
Buildings
Gross revenue for our Buildings business operating unit increased 52.5% in Q2 15 compared to Q2 14 and 50.0% year to date in 2015 compared to 2014. Of the $127.7 million increase year to date, $96.3 million was due to acquisitions, $16.7 million was due to organic growth, and $14.7 million was due to foreign exchange. Organic revenue growth was 5.7% in Q2 15 compared to Q2 14 and 6.5% year to date in 2015 compared to 2014. Year to date, we experienced strong growth in our Canadian and International operations, while organic revenue growth was stable in the United States. Organic gross revenue growth in Canada is primarily due to our geographic mature presence and market sector focus. Compared to 2014, organic growth benefited from successful strategic pursuits and improved asset management in all regional operating units.
| Management’s Discussion and Analysis | ||||
| (unaudited) | ||||
| June 30, 2015 | M-11 | Stantec Inc. |
The majority of revenue for our Buildings business operating unit is generated from three key sectors: Healthcare, Commercial, and Education. Opportunities remain steady in all of our key geographies for these market sectors. In addition, we see strong growth in some of our smaller sectors such as Industrial Buildings due to increased opportunities in manufacturing, maintenance warehousing, and military infrastructure. We also continue to secure steady work in our Airports sector.
In Canada, we benefited from strong activity in the healthcare market, continuing strength in the Education sector, and steady activity in the Commercial sector. For example, because Dessau is well-recognized in the Quebec market, during the quarter, we secured a contract to provide the mechanical and electrical engineering services for building a 15,800-square-metre (170,000-square-foot) mental health pavilion at Saint-Jérôme Regional Hospital and to expand the Montreal Sacré-Cœur Hospital to include a 14,500-square-metre (156,000-square-foot) integrated tertiary trauma center. Plus, due to our P3 project expertise and strong partnerships, we are part of the ATCO Two Rivers Lodging Group, chosen as the preferred proponent to design, construct, operate, and maintain a 1,600-person workforce housing facility. This facility will be used by workers constructing the Site C Clean Energy Project on the Peace River in northeastern British Columbia.
In the United States, gross revenue has significantly increased due to the acquisitions completed in 2014 and 2015. We continue to see increasing opportunities in residential and hospitality work in US East and increased activity in our Education sector in Texas. In particular, we were recently awarded a project at the University of Texas at Dallas in Richardson, Texas. Our services include the planning and programming, architecture, engineering, landscape architecture, interior design, cost estimating, and construction administration of a new 175,000-square-foot (16,000-square-metre) multistory physical and mathematical sciences building.
Recently secured International projects continue to increase our Healthcare sector market position; these projects include new wins in the United Kingdom that also support our expertise in science and technology. To illustrate, during Q2 15, we were the successful proponent on a design-build project; our services will include planning, architecture, and interior design work for the Precision Cancer Medicine Institute, a clinical research facility at Oxford University in England.
Energy & Resources
Gross revenue for our Energy & Resources business operating unit decreased $45.6 million in Q2 15 compared to Q2 14 and $27.7 million year to date in 2015 compared to 2014. Revenue was positively impacted by strategic acquisitions completed in 2014 and 2015 and by foreign exchange due to the US dollar strengthening compared to the Canadian dollar. Organic gross revenue in our Energy & Resources business operating unit retracted 25.6% in Q2 15 compared to Q2 14 and 16.6% year to date in 2015 compared to 2014. The retraction in the Oil & Gas sector in both Canada and the United States impacted our engineering and environmental services. We also experienced an organic revenue retraction in our Power and Mining sectors. Management continues to monitor backlog and make adjustments to align staffing levels with workload and market conditions in our Energy & Resources business operating unit.
Our Oil & Gas sector consists of engineering and environmental services (approximately half each). The retraction in our Oil & Gas sector during the first two quarters of 2015 is attributable to the sharp decline in oil prices and corresponding market conditions. In our midstream business, many engineering projects were substantially completed in 2014. New project awards have slowed due to the impact of uncertain market conditions, increased competition, and pricing pressures. In the upstream sector, a smaller portion of our business, projects have been deferred or canceled as clients adapt to lower commodity prices and market supply and demand characteristics.
In sectors that are non-resource related, Environmental Services organic revenue remained stable in Canada and achieved overall strong growth in the United States year to date in 2015, which differs from the slow start in 2014 caused by harsh winter conditions.
| Management’s Discussion and Analysis | ||||
| (unaudited) | ||||
| June 30, 2015 | M-12 | Stantec Inc. |
In our Power sector, activity continued to meet environmental compliance requirements in the transmission and distribution market and in power replacement. Our Canadian Power operations were impacted by Oil & Gas clients deferring or canceling proposed gas generation projects. More generally, projects are slowing down due to uncertainty in long-term pricing outlooks.
Our Mining sector had organic growth year to date in 2015 compared to 2014, mainly assisted by the recognition of additional fees in Q1 15 that resulted from obtaining certain performance metrics on a major project. However, in Q2 15 compared to Q2 14, Mining retracted in our Canadian and International operations, primarily due to the winding down of major projects and the macroeconomic conditions in the mining industry.
Infrastructure
Gross revenue for our Infrastructure business operating unit increased 25.2% in Q2 15 compared to Q2 14 and 25.7% year to date in 2015 compared to 2014. Of the $108.3 million increase year to date, $47.4 million was due to acquisitions, $27.4 million was due to organic growth, and $33.5 million was due to foreign exchange. Organic revenue growth was 5.7% in Q2 15 compared to Q2 14 and 6.5% year to date in 2015 compared to 2014. Strong organic revenue growth occurred in our Transportation and Water sectors in Q2 15 compared to Q2 14, and Community Development remained stable. All sectors in Infrastructure achieved strong organic gross revenue growth year to date.
Organic gross revenue growth for our Community Development sector was strong year to date in 2015 compared to 2014; growth in Canada and the United States was partly offset by a retraction in our International operations. We perform approximately half of our Community Development work in Canada, half in the United States. In Q2 15 compared to Q2 14, growth was strong in the United States and stable in Canada. The strong US growth was due to the continual and general improvement in the US economy. Both countries experienced a continued demand for housing, a recovery of urban development and design markets, and an increase in mixed-use commercial projects. All regions had strong growth, and signs of improved housing markets continue. Moreover, we continue securing major nonresidential projects, which include designing streets, sidewalks, sewers, water mains, and streetscape and plaza areas to support the Coney Island redevelopment in Brooklyn, New York. These projects, in the area affected by Hurricane Sandy, are led by the New York City Economic Development Corporation. The construction of the new infrastructure will facilitate the development of City-owned parcels as affordable housing, community facilities, and retail.
Our Transportation sector experienced strong organic gross revenue growth year to date in 2015 compared to 2014. Over 70% of our Transportation revenue is generated in the United States. A rebounding US economy and our North American strategic market position led to an increased number of organic growth opportunities. For example, in Q2 15, we were selected as the independent engineer for the new Champlain Bridge Corridor P3 project in Montreal, Quebec. We are contracted to ensure that all the infrastructures related to the project are designed, built, operated, and maintained according to the contract and that they comply with Canadian and Quebec standards and regulations, as well as good industry practices. This ten-year assignment resulted from our increased presence in the Quebec market because of the Dessau acquisition, as well as our ability to cost effectively bring key resources from across North America to our team.
Our Water sector had strong organic gross revenue growth year to date in 2015 compared to 2014. This sector benefits from continued demand for our services resulting from the rehabilitation required on aging infrastructure and regulatory requirements, including the consent decrees in the United States that mandate municipalities to upgrade their water and wastewater facilities. Growth in Canada and the United States was partly due to the work we added in 2014 on the Bonnybrook wastewater treatment plant and the Springbank Off-Stream Storage Protection project near Calgary, Alberta. In addition, growth continues as we execute key projects such as the Regina wastewater treatment plant, ongoing work with the Tennessee Valley Authority, and the nationwide contract with the Federal Emergency Management Agency for the agency’s flood risk mapping and hazard mitigation programs.
| Management’s Discussion and Analysis | ||||
| (unaudited) | ||||
| June 30, 2015 | M-13 | Stantec Inc. |
Gross Margin
For a definition of gross margin, refer to the discussion in the Definitions section of our 2014 Annual Report, incorporated here by reference. Gross margin as a percentage of net revenue was 54.0% in Q2 15 compared to 54.7% in Q2 14. The year-to-date gross margin was 54.6% compared to 54.5% in 2014. Our gross margin was within the targeted range of 54% to 56% (set out in our 2014 Annual Report).
The following table summarizes gross margin percentages by regional operating unit:
| Gross Margin by Regional Operating Unit | Quarter Ended June 30 |
Two Quarters Ended June 30 |
||||||||||||||
| 2015 | 2014 | 2015 | 2014 | |||||||||||||
| Canada |
54.4% | 55.6% | 55.5% | 55.2% | ||||||||||||
| United States |
53.6% | 53.8% | 53.8% | 54.0% | ||||||||||||
| International |
52.9% | 49.8% | 52.3% | 49.8% | ||||||||||||
In general, gross margin fluctuations depend on the particular mix of projects in progress during any quarter and on our project execution. The fluctuations reflect our business model, which is based on diversifying operations across geographic locations, business operating units, and all phases of the infrastructure and facilities project life cycle.
In our Canadian operations, the decrease in gross margin in Q2 15 compared to Q2 14 resulted mostly from market conditions in the oil and gas industry, which placed downward pressure on rates, and from lower margins from the Dessau acquisition. The increase in margins in our International operations resulted mainly from the mix of projects.
The following table summarizes our gross margin percentages by business operating unit:
| Gross Margin by Business Operating Unit | Quarter Ended June 30 |
Two Quarters Ended June 30 |
||||||||||||||
| 2015 | 2014 | 2015 | 2014 | |||||||||||||
| Buildings |
55.2% | 55.2% | 55.2% | 55.2% | ||||||||||||
| Energy & Resources |
52.8% | 53.1% | 53.9% | 52.8% | ||||||||||||
| Infrastructure |
54.3% | 56.4% | 54.9% | 56.3% | ||||||||||||
Note: Comparative figures have been reclassified due to a realignment of several business lines between our Buildings, Energy & Resources, and Infrastructure business operating units.
Our Energy & Resources business operating unit experienced lower gross margin in Q2 15 than in Q2 14, primarily as a result of Oil & Gas sector clients placing downward pressure on billing rates. Also, margins in our Power sector were impacted by the nature and mix of work brought in from the Dessau acquisition. Year to date, the gross margin for our Energy & Resources business operating unit increased partly due to the recognition of fees in Q1 15 for obtaining certain performance metrics on major mining projects.
Our Infrastructure business operating unit had a lower gross margin in Q2 15 than in Q2 14 and year to date in 2015 compared to 2014, which was caused by the mix of projects and positive adjustments in 2014 to estimates to complete for certain transportation projects.
| Management’s Discussion and Analysis | ||||
| (unaudited) | ||||
| June 30, 2015 | M-14 | Stantec Inc. |
Administrative and Marketing Expenses
Administrative and marketing expenses as a percentage of net revenue was 41.2% in Q2 15 compared to 39.9% in Q2 14. Our year-to-date administrative and marketing expenses as a percentage of net revenue was 41.9% in 2015 compared to 40.7% in 2014, falling within the expected range of 40% to 42% (set out in our 2014 Annual Report).
Administrative and marketing expenses fluctuate from year to year because of the amount of staff time charged to marketing and administrative labor, which is influenced by the mix of projects in progress during the period as well as business development and acquisition integration activities.
Year-to-date administrative and marketing expenses as a percentage of net revenue was higher in 2015 compared to 2014 due to lower utilization, caused in part by an increase in integration activities. In the months after completing an acquisition, staff time charged to administration and marketing is generally higher because of integration activities, including orienting newly acquired staff. Our acquisitions of Dessau and Sparling in 2015 were larger than our 2014 acquisitions, and additional infrastructure and French language translation costs were incurred to properly prepare for the integration of the Dessau operations. Severance costs were incurred in 2015 to align staffing levels with workload in our Energy & Resources business operating unit. In addition, administrative and marketing expenses was higher in 2015 since 2014 was positively impacted by bad debt recoveries and reduced provisions for claims.
Amortization of Intangible Assets
The timing of completed acquisitions, size of acquisitions, and type of intangible assets acquired impact the amount of amortization of intangible assets in a period. Client relationships are amortized over estimated useful lives ranging from 10 to 15 years, and contract backlog is generally amortized over an estimated useful life of 1 to 2 years. Consequently, the impact of the amortization of contract backlog can be significant in the 4 to 8 quarters following an acquisition. Also included in intangible assets is purchased and internally generated computer software that is amortized over an estimated useful life ranging from 3 to 7 years.
The following table summarizes the amortization of identifiable intangible assets for Q2 15 and Q2 14 and year to date for 2015 and 2014:
| Amortization of Intangibles | Quarter Ended June 30 |
Two Quarters Ended June 30 |
||||||||||||||
|
|
|
|||||||||||||||
| (In thousands of Canadian dollars) | 2015 | 2014 | 2015 | 2014 | ||||||||||||
|
|
||||||||||||||||
| Client relationships |
2,651 | 2,036 | 7,023 | 3,950 | ||||||||||||
| Backlog (Note) |
2,360 | 1,031 | 4,618 | 1,736 | ||||||||||||
| Software |
3,114 | 2,732 | 6,277 | 5,655 | ||||||||||||
| Other |
901 | 535 | 1,511 | 104 | ||||||||||||
| Lease disadvantage |
(347) | (546) | (523) | (293) | ||||||||||||
|
|
||||||||||||||||
| Total amortization of intangible assets |
8,679 | 5,788 | 18,906 | 11,152 | ||||||||||||
|
|
||||||||||||||||
Note: Backlog is a non-IFRS measure that is further discussed in the Definitions section of our 2014 Annual Report.
The $2.9 million increase in intangible asset amortization from Q2 14 to Q2 15 resulted primarily from an increase in backlog and client relationships from the Dessau and Sparling acquisitions in Q1 15. The year-to-date increase of $7.8 million from 2014 to 2015 is a result of an increase in backlog and client relationships from the Dessau and Sparling acquisitions in 2015 and the ProU, JBR, SHW, ADD Inc., and Penfield & Smith acquisitions in 2014. Based on the unamortized intangible asset balance remaining at the end of Q2 15, we expect our amortization expense for intangible assets for the full year 2015 to be in the range of $36 to $38 million. The actual expense may be impacted by any new acquisitions completed after Q2 15.
| Management’s Discussion and Analysis | ||||
| (unaudited) | ||||
| June 30, 2015 | M-15 | Stantec Inc. |
Net Interest Expense
Net interest expense increased $0.7 million in Q2 15 compared to Q2 14 and $1.8 million year to date in 2015 compared to 2014, primarily due to an increase in interest expense on notes payable. In addition, interest expense on our revolving credit facility increased since the balance outstanding was $149.5 million at June 30, 2015, and $138.6 million at June 30, 2014. The average interest rate for our revolving credit facility and senior secured notes was approximately 2.81% at June 30, 2015, and approximately 2.85% at June 30, 2014. The revolving credit facility and senior secured notes are further described in the Liquidity and Capital Resources section of this report.
Based on our credit balance at June 30, 2015, we estimate that a 0.5% increase in interest rates, with all other variables held constant, would have decreased net income for the first two quarters of 2015 by $271,000 and decreased basic earnings per share by less than $0.01. If the interest rate was 0.5% lower, there would have been an equal and opposite impact on net income and basic earnings per share. We have the flexibility to partly mitigate our exposure to interest rate changes by maintaining a mix of both fixed- and floating-rate debt. Our senior secured notes have fixed interest rates; therefore, interest rate fluctuations have no impact on the senior secured notes interest payments.
Foreign Exchange Gains and Losses
We recorded a $0.1 million foreign exchange loss in Q2 15 compared to a $0.2 million gain in Q2 14. These foreign exchange gains and losses arose on the translation of the foreign-denominated assets and liabilities held in our Canadian companies and in our non-US-based foreign subsidiaries. We minimize our exposure to foreign exchange fluctuations by matching foreign currency assets with foreign currency liabilities and, when appropriate, by entering into forward contracts to buy or sell US dollars and British pounds in exchange for Canadian dollars. The foreign exchange loss reported during the quarter was caused by the volatility of daily foreign exchange rates and the timing of the recognition and relief of foreign-denominated assets and liabilities.
We recorded a $44.9 million gain on the translation of our foreign operations in other comprehensive income in the first two quarters of 2015 compared to a $0.6 million gain in the same period in 2014. These unrealized gains arose when translating our foreign operations into Canadian dollars. The gain during the first two quarters of 2015 was due to the weakening of the Canadian dollar—from US$0.86 at December 31, 2014, to US$0.80 at June 30, 2015.
We estimate that at June 30, 2015, a $0.01 decrease in foreign exchange rates, with all other variables held constant, would have decreased net income by $22,000 for the first two quarters of 2015 and decreased basic earnings per share by less than $0.01. If the exchange rates were $0.01 higher, there would have been an equal and opposite impact on net income and basic earnings per share.
Other Income
Other income was $6.7 million in Q2 15 compared to $0.02 million in Q2 14. Other income in Q2 15 was primarily from a gain on the sale of equities in our investments held for self-insured liabilities, which include bonds, equities, and term deposits. The risk associated with these bonds, equities, and term deposits is mitigated by the overall quality and mix of the investment portfolio. During Q2 15, we rebalanced the type of equities in the portfolio, which resulted in the realization of a $4.2 million gain in income. Also in Q2 15, we recognized a $2.5 million gain on the sale of land and buildings.
Income Taxes
Our effective income tax rate for the first two quarters of 2015 was 27.5% compared to 26.3% for the year ended December 31, 2014. The effective income tax rate of 27.5% is based on statutory rates in jurisdictions where we operate and on our estimated earnings in each of these jurisdictions. We review statutory rates and jurisdictional earnings quarterly and adjust our estimated income tax rate accordingly.
| Management’s Discussion and Analysis | ||||
| (unaudited) | ||||
| June 30, 2015 | M-16 | Stantec Inc. |
Summary of Quarterly Results
The following table presents selected data derived from our consolidated financial statements for each of the eight most recently completed quarters. This information should be read in conjunction with the applicable interim unaudited and annual audited consolidated financial statements and related notes.
Quarterly Unaudited Financial Information
| (In millions of Canadian dollars, except per share amounts) | Jun 30, 2015 | Mar 31, 2015 | Dec 31, 2014 | Sept 30, 2014* | ||||||||||||
| Gross revenue |
710.3 | 705.7 | 647.5 | 674.7 | ||||||||||||
| Net revenue |
593.9 | 592.3 | 519.6 | 544.2 | ||||||||||||
| Net income |
43.2 | 38.0 | 38.1 | 48.6 | ||||||||||||
| EPS – basic |
0.46 | 0.40 | 0.41 | 0.52 | ||||||||||||
| EPS – diluted |
0.46 | 0.40 | 0.40 | 0.51 | ||||||||||||
| Jun 30, 2014* | Mar 31, 2014* | Dec 31, 2013* | Sept 30, 2013* | |||||||||||||
| Gross revenue |
633.8 | 573.9 | 575.3 | 581.2 | ||||||||||||
| Net revenue |
530.2 | 481.3 | 451.3 | 484.8 | ||||||||||||
| Net income |
44.3 | 33.5 | 35.7 | 45.9 | ||||||||||||
| EPS – basic |
0.47 | 0.36 | 0.38 | 0.50 | ||||||||||||
| EPS – diluted |
0.47 | 0.36 | 0.38 | 0.49 | ||||||||||||
Quarterly earnings per share on a basic and diluted basis are not additive and may not equal the annual earnings per share reported. This is a result of the effect of shares issued on the weighted average number of shares. Diluted earnings per share on a quarterly and an annual basis are also affected by the change in the market price of our shares, since we do not include in dilution options when the exercise price of the option is not in the money.
*Earnings per share are adjusted from previously reported amounts for the two-for-one share split that occurred on November 14, 2014.
The table below compares quarters, summarizing the impact of acquisitions, organic growth, and foreign exchange on gross revenue:
Gross Revenue
| (In millions of Canadian dollars) | Q2 15 vs. Q2 14 |
Q1 15 vs. Q1 14 |
Q4 14 vs. Q4 13 |
Q3 14 vs. Q3 13 |
||||||||||||
| Increase (decrease) in gross revenue due to Acquisition growth |
93.8 | 90.9 | 53.1 | 48.6 | ||||||||||||
| Organic growth (retraction) |
(53.6 | ) | 9.5 | 1.4 | 34.1 | |||||||||||
| Impact of foreign exchange rates on revenue earned by foreign subsidiaries |
36.3 | 31.4 | 17.7 | 10.8 | ||||||||||||
| Total net increase in gross revenue |
76.5 | 131.8 | 72.2 | 93.5 | ||||||||||||
| Management’s Discussion and Analysis | ||||
| (unaudited) | ||||
| June 30, 2015 | M-17 | Stantec Inc. |
Q3 14 vs. Q3 13. During Q3 14, net income increased $2.7 million, or 5.9%, from Q3 13, and diluted earnings per share for Q3 14 increased $0.02, or 4.1%, compared to Q3 13. Net income for Q3 14 was positively impacted by an increase in revenue because of acquisitions completed in 2013 and 2014, and organic revenue growth in our Buildings and Infrastructure business operating units, while our Energy & Resources business operating unit had a reduced pace of growth due to a retraction in our Mining sector. Our US operations had strong organic growth of 10.4% in Q3 14 compared to Q3 13, resulting mainly from growth in our Power and Transportation sectors and in our Buildings business operating unit. Our results were also positively impacted by an increase in gross margin—from 54.3% in Q3 13 to 54.7% in Q3 14. This was offset by an increase in our administrative and marketing expenses as a percentage of net revenue—from 38.3% in Q3 13 to 39.3% in Q3 14—mainly from lower utilization due in part to increased integration activities from acquisitions.
Q4 14 vs. Q4 13. During Q4 14, net income increased $2.4 million, or 6.7%, from Q4 13, and diluted earnings per share for Q4 14 increased $0.02, or 5.3%, compared to Q4 13. Net income for Q4 14 was positively impacted by an increase in revenue because of foreign exchange, acquisitions completed in 2013 and 2014, and organic revenue growth in our Buildings and Infrastructure business operating units. The Energy & Resources business operating unit declined primarily because of certain terminal projects winding down in our Oil & Gas sector in Canada. Our Buildings business operating unit had strong organic growth of 8.4% in Q4 14 compared to Q4 13, caused mainly by improved project management and growth in the Healthcare sectors of our Canada and International operations. Organic gross revenue growth in our Infrastructure business operating unit resulted from growth in its Water and Community Development sectors, and even more, from growth in its Transportation sector in the United States. Our gross margin decreased—from 56.4% in Q4 13 to 55.6% in Q4 14—due to lower margins in our Oil & Gas sector, which has been a growing component of our US revenue, as well as the impact of project adjustments to estimated costs to complete in our Buildings business operating unit. Administrative and marketing expense as a percentage of net revenue decreased—from 43.7% in Q4 13 to 42.5% in Q4 14. The expense in Q4 13 was historically high due to additional charges for seasonal holidays and an increase in the fair value of restricted share units and deferred share units.
Q1 15 vs. Q1 14. During Q1 15, net income increased $4.5 million, or 13.4%, from Q1 14, and diluted earnings per share for Q1 15 increased $0.04, or 11.1%, compared to Q1 14. Net income for Q1 15 was positively impacted by foreign exchange, acquisitions completed in 2014 and 2015, and organic revenue growth in our Buildings and Infrastructure business operating units. This organic growth was partly offset by a retraction in our Energy & Resources business operating unit. Our US operations experienced strong organic gross revenue growth; however, organic gross revenue in our Canada and International operations retracted. Organic growth was particularly strong in our US Environmental Services and US Water and Community Development sectors. Also, Buildings experienced strong growth in all regional operating units. Net income was also positively impacted by an increase in gross margin—from 54.4% in Q1 14 to 55.2% in Q1 15. This was offset by an increase in our administrative and marketing expenses as a percentage of net revenue—from 41.5% in Q1 14 to 42.5% in Q1 15— mainly from lower utilization due to an increase in integration activity from recent acquisitions and a retraction in our Oil & Gas business. In addition, our bottom line was impacted by an increase in the amortization of intangible assets and net interest expense.
| Management’s Discussion and Analysis | ||||
| (unaudited) | ||||
| June 30, 2015 | M-18 |
Stantec Inc. |
Balance Sheet
The following table highlights the major changes to assets, liabilities, and equity since December 31, 2014:
| (In millions of Canadian dollars) | Jun 30, 2015 | Dec 31, 2014 | $ Change | % Change | ||||||||||||
| Total current assets |
894.3 | 844.4 | 49.9 | 5.9% | ||||||||||||
| Property and equipment |
157.0 | 152.7 | 4.3 | 2.8% | ||||||||||||
| Goodwill |
856.1 | 760.6 | 95.5 | 12.6% | ||||||||||||
| Intangible assets |
122.4 | 97.2 | 25.2 | 25.9% | ||||||||||||
| Other financial assets |
108.2 | 90.7 | 17.5 | 19.3% | ||||||||||||
| All other assets |
80.1 | 64.9 | 15.2 | 23.4% | ||||||||||||
| Total assets |
2,218.1 | 2,010.5 | 207.6 | 10.3% | ||||||||||||
| Current portion of long-term debt |
134.0 | 53.2 | 80.8 | 151.9% | ||||||||||||
| Provisions |
14.5 | 10.8 | 3.7 | 34.3% | ||||||||||||
| All other current liabilities |
392.0 | 411.1 | (19.1 | ) | (4.6%) | |||||||||||
| Total current liabilities |
540.5 | 475.1 | 65.4 | 13.8% | ||||||||||||
| Long-term debt |
259.3 | 256.1 | 3.2 | 1.2% | ||||||||||||
| Provisions |
59.4 | 51.6 | 7.8 | 15.1% | ||||||||||||
| Other liabilities |
66.5 | 64.3 | 2.2 | 3.4% | ||||||||||||
| All other liabilities |
94.9 | 77.2 | 17.7 | 22.9% | ||||||||||||
| Equity |
1,197.5 | 1,086.2 | 111.3 | 10.2% | ||||||||||||
| Total liabilities and equity |
2,218.1 | 2,010.5 | 207.6 | 10.3% | ||||||||||||
Refer to the Liquidity and Capital Resources section of this report for an explanation of the changes in current assets and current liabilities.
Property and equipment, goodwill, and intangible assets increased as a result of the Dessau and Sparling acquisitions. Intangible assets increased mostly because of customer relationships, backlog, and lease advantages acquired from these acquisitions and the renewal of Autodesk software in Q1 15. Total current and long-term other financial assets increased mainly due to an increase in investments held for self-insured liabilities and an amount owing from the sale of land and buildings.
Total current and long-term debt increased mainly as a result of an increase in our revolving credit facility and was partly offset by a reduction in our notes payable from acquisitions. In addition, our increase in finance lease obligations was primarily due to the renewal of Autodesk software in Q1 15. An increase in our provision for self-insured liabilities, as a result of the timing of the recognition of the liability and its ultimate settlement, in turn caused an increase in long-term provisions. Also, total current and long-term provisions increased due to provisions for project-related claims assumed from the Dessau acquisition. The increase in other liabilities resulted primarily from the increase in fair value of deferred share units outstanding at June 30, 2015.
Overall, the carrying amount of assets and liabilities for our US subsidiaries on our consolidated balance sheets increased due to the weakening Canadian dollar—from US$0.86 at December 31, 2014, to US$0.80 at June 30, 2015.
Our shareholders’ equity increased due to $81.1 million in net income earned in the first two quarters of 2015, $5.6 million in share options exercised for cash, and $2.6 million expensed for share-based compensation. As well, comprehensive income increased $41.6 million, resulting from the unrealized gain on the translation of our US subsidiaries and the unrealized gain on our investments held for self-insured liabilities. These increases were partly offset by the $19.7 million in dividends declared year to date.
| Management’s Discussion and Analysis | ||||
| (unaudited) | ||||
| June 30, 2015 | M-19 | Stantec Inc. |
Liquidity and Capital Resources
We are able to meet our liquidity needs through a variety of sources, including cash generated from operations, long- and short-term borrowings from our $350 million revolving credit facility, senior secured notes, and the issuance of common shares. We use funds primarily to pay operational expenses, complete acquisitions, sustain capital spending on property and on equipment and software, repay long-term debt, and pay dividend distributions to shareholders.
We believe that internally generated cash flows, supplemented by borrowings, if necessary, will be sufficient to cover our normal operating and capital expenditures. We also believe that the design of our business model (explained in the Management’s Discussion and Analysis in our 2014 Annual Report) reduces the impact of changing market conditions on operating cash flows. Consequently, we do not anticipate any immediate need to access additional capital by issuing additional equity. However, under certain favorable market conditions, we would consider issuing common shares to facilitate acquisition growth or to reduce borrowings under our credit facility.
We continue to limit our exposure to credit risk by placing our cash and cash equivalents in short-term deposits in—and, when appropriate, by entering into derivative agreements with—high-quality credit institutions. Investments held for self-insured liabilities include bonds, equities, and term deposits. We mitigate risk associated with these bonds, equities, and term deposits through the overall quality and mix of our investment portfolio.
Working Capital
The following table summarizes working capital information at June 30, 2015, compared to December 31, 2014:
| (In millions of Canadian dollars, except ratio) | June 30, 2015 | Dec 31, 2014 | $ Change | |||||||||
| Current assets |
894.3 | 844.4 | 49.9 | |||||||||
| Current liabilities |
(540.5) | (475.1) | (65.4) | |||||||||
| Working capital (note) |
353.8 | 369.3 | (15.5) | |||||||||
| Current ratio (note) |
1.65 | 1.78 | n/a | |||||||||
note: Working capital is calculated by subtracting current liabilities from current assets. Current ratio is calculated by dividing current assets by current liabilities. Both non-IFRS measures are further discussed in the Definitions section of our 2014 Annual Report.
Current assets increased primarily because of a $163.2 million increase in trade and other receivables and in unbilled revenue. Investment in trade and other receivables and in unbilled revenue increased to 101 days at June 30, 2015, from 86 days at December 31, 2014. This increase occurred mainly in our Buildings and Infrastructure business operating units. In addition, cash in escrow relating to the Dessau acquisition increased $6.0 million, prepaid expenses increased $2.6 million, and taxes recoverable increased $12.1 million due to the timing of income tax instalments for 2014 and 2015. These increases were partly offset by a decrease of $132.7 million in our cash and deposits (further explained in the Cash Flows section of this report).
Current liabilities increased primarily as a result of an increase in the current portion of long-term debt since $70 million of our senior secured notes come due May 10, 2016; notes payable from current acquisitions increased $8.9 million. In addition, bank indebtedness increased $3.7 million and the current portion of provisions increased $3.7 million due to the increase in our provisions for project-related claims assumed from the Dessau acquisition. These increases were partly offset by a $10.8 million decrease in trade and other payables due to the timing of payments for annual employee bonuses. Also, billings in excess of costs decreased $11.2 million.
| Management’s Discussion and Analysis | ||||
| (unaudited) | ||||
| June 30, 2015 | M-20 | Stantec Inc. |
Cash Flows
Our cash flows from and used in operating, investing, and financing activities are reflected in the consolidated statements of cash flows and summarized in the following table:
| Quarter Ended June 30 |
Two Quarters Ended June 30 |
|||||||||||||||||||||||
| (In millions of Canadian dollars) | 2015 | 2014 | Change | 2015 | 2014 | Change | ||||||||||||||||||
| Cash flows from (used in) operating activities |
60.6 | 18.6 | 42.0 | (27.6 | ) | 15.0 | (42.6 | ) | ||||||||||||||||
| Cash flows used in investing activities |
(15.9 | ) | (54.8 | ) | 38.9 | (161.9 | ) | (113.8 | ) | (48.1 | ) | |||||||||||||
| Cash flows from (used in) financing activities |
(38.6 | ) | 34.7 | (73.3 | ) | 51.0 | 73.6 | (22.6 | ) | |||||||||||||||
Cash Flows Used in Operating Activities
Cash flows used in operating activities are impacted by the timing of acquisitions, particularly the timing of payments for acquired trade and other payables, including annual employee bonuses. The $42.6 million increase in cash flows used in operating activities year to date in 2015 compared to 2014 resulted from an increase in cash paid to employees, which, in turn, was caused by an increase in the number of employees and bonuses paid. As well, cash paid to suppliers increased because of our acquisition and organic growth and the timing of various payments. Interest paid increased since more interest was paid on notes payable for acquisitions in 2015 compared to 2014. These increases in cash outflows were partly offset by an increase in cash receipts from clients due to our acquisitions and organic growth.
Cash Flows Used in Investing Activities
Cash flows used in investing activities increased year to date in 2015 compared to 2014 due to an increase in cash used for business acquisitions. We used $132.2 million to pay cash consideration for current year acquisitions and notes payable for prior year acquisitions in Q2 15 compared to $76.6 million in Q2 14. Also contributing to this increase in cash flows used was a $6.0 million deposit paid in escrow for the indemnification of potential claims on the Dessau acquisition. These increases in cash flows used in investing activities were partly offset by a $5.9 million decrease in investments held for self-insured liabilities and an $8.0 million decrease in the purchase of property and equipment.
As a professional services organization, we are not capital intensive. In the past, we made capital expenditures primarily for items such as leasehold improvements, computer equipment and software, furniture, and other office and field equipment. Property and equipment and software purchases totaled $6.5 million in Q2 15 compared to $14.9 million in Q2 14. We had higher purchases in 2014 due to an increase in leasehold improvements made to various office locations. For the remainder of 2015, we plan to continue investing in enhancements to our information technology infrastructure and enterprise systems; this will optimize and streamline business processes and prepare us for continued growth. During Q2 15, we financed property and equipment and software purchases through cash flows from operations.
Cash Flows from Financing Activities
Cash flows from financing activities decreased year to date in 2015 compared to 2014, mainly due to the net $14.6 million decrease in cash inflows from our revolving credit facility. In addition, cash outflows increased due to the payment of our Autodesk finance lease obligation and a $2.2 million increase in the payment of dividends year to date in 2015 compared to 2014.
| Management’s Discussion and Analysis | ||||
| (unaudited) | ||||
| June 30, 2015 | M-21 | Stantec Inc. |
Capital Management
We manage our capital structure according to the internal guideline established in our 2014 Annual Report by maintaining a net debt to EBITDA ratio of below 2.5. We calculate our net debt to EBITDA ratio, a non-IFRS measure, as the sum of (1) long-term debt, including current portion, plus bank indebtedness, less cash and deposits and cash in escrow, divided by (2) EBITDA, calculated as income before income taxes, plus net interest expense, amortization of intangible assets, and depreciation of property and equipment. At June 30, 2015, our net debt to EBITDA ratio was 1.18, calculated on a trailing four-quarter basis. Going forward, there may be occasions when we exceed our target by completing opportune acquisitions that increase our debt level for a period of time.
We have entered into an agreement for a $350 million revolving credit facility expiring August 31, 2018, that allows us to access an additional $150 million under the same terms and conditions on approval from our lenders. Our credit facility is available for acquisitions, working capital needs, and general corporate purposes. Depending on the form under which it is accessed and on certain financial covenant calculations, rates of interest may vary between Canadian prime, US base rate, or LIBOR or bankers’ acceptance rates, plus specified basis points. The specified basis points may vary, depending on our level of consolidated debt to EBITDA—from 20 to 125 for Canadian prime and US base rate loans and from 120 to 225 for bankers’ acceptances, LIBOR loans, and letters of credit. At June 30, 2015, $195.6 million was available in the revolving credit facility for future activities.
On May 13, 2011, we issued $70 million of 4.332% senior secured notes due May 10, 2016, and $55 million of 4.757% senior secured notes due May 10, 2018. These amounts were recorded net of transaction costs of $1.1 million. The senior secured notes were issued pursuant to an indenture dated May 13, 2011, between Stantec Inc., as issuer, and BNY Trust Company of Canada, as trustee and collateral agent. These notes are ranked equally with our existing revolving credit facility. Interest on the senior secured notes is payable semiannually in arrears on May 10 and November 10 each year until maturity or the earlier payment, redemption, or purchase in full of the notes. We may redeem them, in whole at any time or in part from time to time, at specified redemption prices and subject to certain conditions required by the indenture. The senior secured notes contain restrictive covenants. All of our assets are held as collateral under a general security agreement for the revolving credit facility and senior secured notes.
We are subject to financial and operating covenants related to our credit facility and senior secured notes. Failure to meet the terms of one or more of these covenants may constitute a default, potentially resulting in accelerated repayment of our debt obligation. In particular, at each quarter-end, we must satisfy the following at any time: (1) our consolidated EBITDAR to debt service ratio must not be less than 1.25 to 1.0 for the revolving credit facility and senior secured notes and (2) our consolidated debt to EBITDA ratio must not exceed 2.5 to 1.0 for the revolving credit facility and 2.75 to 1.0 for the senior secured notes, except in the case of a material acquisition when our consolidated debt to EBITDA ratio must not exceed 3.0 to 1.0 for the revolving credit facility and 3.25 to 1.0 for the senior secured notes for a period of two complete quarters following the acquisition. EBITDA and EBITDAR to debt service ratios are defined in the Definitions section of our 2014 Annual Report. We were in compliance with all of these covenants as at and throughout the period ended June 30, 2015.
We have a bid bond facility, expiring on August 31, 2018, in the amount of $15 million that allows us to access an additional $5 million under the same terms and conditions on approval from our lenders. This facility may be used to issue bid bonds, performance guarantees, letters of credit, and documentary credits in international currencies. At June 30, 2015, $9.8 million had been issued under this bid bond facility.
Shareholders’ Equity
Share options exercised generated $5.6 million in cash during the first two quarters of 2015 compared to $5.5 million in cash generated during the same period in 2014.
| Management’s Discussion and Analysis | ||||
| (unaudited) | ||||
| June 30, 2015 | M-22 | Stantec Inc. |
Other
Outstanding Share Data
At June 30, 2015, 94,186,720 common shares and 3,277,744 share options were outstanding. From June 30, 2015, to August 5, 2015, 71,764 share options were exercised and 512 share options were forfeited. At August 5, 2015, 94,258,484 common shares and 3,205,468 share options were outstanding.
Contractual Obligations
As part of our continuing operations, we enter into long-term contractual arrangements from time to time. The following table summarizes the contractual obligations due on our long-term debt, operating and finance lease commitments, purchase and service obligations, and other obligations at June 30, 2015, on a discounted basis:
| Payment Due by Period | ||||||||||||||||||||
| Less than | After | |||||||||||||||||||
| (In millions of Canadian dollars) | Total | 1 Year | 1–3 Years | 4–5 Years | 5 Years | |||||||||||||||
| Debt |
379.4 | 126.6 | 102.7 | 149.7 | 0.4 | |||||||||||||||
| Interest on debt |
21.6 | 10.4 | 10.8 | 0.4 | - | |||||||||||||||
| Operating leases |
908.2 | 135.6 | 231.2 | 162.7 | 378.7 | |||||||||||||||
| Finance lease obligation |
14.1 | 7.6 | 6.5 | - | - | |||||||||||||||
| Purchase and service obligations |
17.8 | 7.9 | 7.8 | 2.1 | - | |||||||||||||||
| Other obligations |
37.6 | 2.1 | 17.1 | 0.1 | 18.3 | |||||||||||||||
| Total contractual obligations |
1,378.7 | 290.2 | 376.1 | 315.0 | 397.4 | |||||||||||||||
For further information regarding the nature and repayment terms of our long-term debt and finance lease obligations, refer to the Cash Flows from Financing Activities and Capital Management sections of this report and notes 9 and 15 of our unaudited interim consolidated financial statements for the quarter ended June 30, 2015. Operating lease commitments include obligations under office space rental agreements. Purchase and service obligations include agreements to purchase future goods and services that are enforceable and legally binding. Other obligations include amounts payable under our deferred share unit and restricted share unit plans and amounts payable for performance share units issued under our long-term incentive program. Failure to meet the terms of our operating lease commitments may constitute a default, potentially resulting in a lease termination payment, accelerated payments, or a penalty as detailed in each lease agreement.
Off-Balance Sheet Arrangements
As of June 30, 2015, we had off-balance sheet financial arrangements relating to letters of credit in the amount of $1.2 million that expire at various dates before July 2016. These letters of credit were issued in the normal course of operations, including the guarantee of certain office rental obligations. We also provide indemnifications and, in very limited circumstances, surety bonds. These are often standard contractual terms and are provided to counterparties in transactions such as purchase and sale contracts for assets or shares, service agreements, and leasing. As part of the normal course of operations, our surety facility allows the issuance of bonds for certain types of project work. At June 30, 2015, $4.3 million in bonds was issued under this surety facility; the bonds expire at various dates before April 2020. At June 30, 2015, $9.8 million was issued under our bid bond facility, which allows us to issue bid bonds, performance guarantees, letters of credit, and documentary credits in international currencies; these expire at various dates before June 2016.
| Management’s Discussion and Analysis | ||||
| (unaudited) | ||||
| June 30, 2015 | M-23 | Stantec Inc. |
Financial Instruments and Market Risk
The nature and extent of our use of financial instruments, as well as the risks associated with these instruments, have not changed materially from those described in the Financial Instruments and Market Risk section of our 2014 Annual Report and are incorporated here by reference.
Related-Party Transactions
We have subsidiaries that are 100% owned and structured entities that are consolidated in our financial statements. From time to time, we enter into transactions with associated companies, joint ventures, and joint operations. These transactions involve providing or receiving services and are entered into in the normal course of business. Key management personnel—including the chief executive officer (CEO), chief financial officer (CFO), chief operating officer (COO), and executive vice presidents—have the authority and responsibility for planning, directing, and controlling the activities of the Company. We pay compensation to key management personnel and directors in the normal course of business.
From time to time, we guarantee the obligation of a subsidiary or structured entity regarding lease agreements. Also from time to time, we guarantee a subsidiary or structured entity’s obligations to a third party pursuant to an acquisition agreement. Transactions with subsidiaries, structured entities, associated companies, joint ventures, and key management personnel are further described in note 19 of our unaudited interim consolidated financial statements for the quarter ended June 30, 2015, and notes 13 and 30 of our audited consolidated financial statements, which are included in our 2014 Annual Report and incorporated here by reference.
Outlook
The outlook for fiscal 2015 is based on our expectations described in our 2014 Annual Report, which is incorporated by reference.
Outlook by Region
Our outlook for two of our regional operating units has changed during the first two quarters of 2015. Following is the outlook for all regional operating units:
| 2014 Annual Report |
Q1 15 | Q2 15 | ||||
| Canada |
Stable | Stable | Retraction | |||
| United States |
Moderate | Moderate | Moderate | |||
| International |
Moderate | Moderate | Stable | |||
Certain expectations are summarized below.
Canada
We believe our Canadian operations will end the year with a retraction in organic revenue in 2015 compared to 2014. In Q2 15, we revised our outlook from stable, as described in our 2014 Annual Report, due to the retraction that occurred in the first two quarters of 2015, most significantly in our Oil & Gas sector. However, we expect this reduction to slow and stabilize during the remainder of 2015. Organic revenues in the last half of the year will continue to be positively impacted by increased activity and growth in sectors and geographic regions that are linked to non-energy-related sectors.
| Management’s Discussion and Analysis | ||||
| (unaudited) | ||||
| June 30, 2015 | M-24 | Stantec Inc. |
United States
We believe our US operations will experience moderate organic revenue growth in 2015 compared to 2014. The US economy, driven by steady domestic economic fundamentals, continued to gain momentum in the quarter; this is expected to carry on throughout the rest of the year. We have maintained a moderate organic revenue growth outlook because we expect that continued growth in all our US sectors will be offset by a continued retraction in Oil & Gas. Even though growth did slowly improve in the public sector during 2014, we believe the outlook for the private sector is more favorable than for the public sector in 2015.
International
We believe our International operations will experience stable organic revenue in 2015 compared to 2014. In Q2 15, we revised our outlook described in our 2014 Annual Report due to the year-to-date retraction in organic gross revenue in our Mining sector as a result of challenging global market conditions and a retraction in our Community Development sector. Currently, our International operations—mainly within our Buildings business operating unit and Mining sector—make up a small percentage of our business. Economic conditions and business operations in our International region are mixed. Similar to other locations, we expect to leverage our local position to drive cross-selling opportunities with clients in the United Kingdom and the Middle East.
Outlook by Business Operating Unit
Our outlook for our business operating units for fiscal 2015 has changed during the first two quarters of 2015, as shown in the table below:
| 2014 Annual Report |
Q1 15 | Q2 15 | ||||
| Buildings |
Moderate | Moderate | Strong | |||
| Energy & Resources |
Stable | Retraction | Retraction | |||
| Infrastructure |
Moderate | Moderate | Strong | |||
Certain expectations are summarized below.
Buildings
We believe our Buildings business operating unit will experience strong organic growth in 2015 compared to 2014. In Q2 15, we revised our outlook to strong from moderate, as described in our 2014 Annual Report, due to better-than-anticipated growth in the first half of 2015 compared to the same period in 2014. This growth was assisted by strong account management and strategic pursuits that materialized into project wins. Overall, we anticipate that the buildings industry will recover from the levels of previous years, and because of our top-tier positioning and global expertise in healthcare, education, and airports, we believe we are well positioned to capitalize on this growth.
Energy & Resources
We believe our Energy & Resources business operating unit will end 2015 with a retraction in gross revenue compared to 2014. We believe Energy & Resources may retract at a slower pace and stabilize at these lower revenue levels in the second half of 2015. In Q1 15, we revised the outlook described in our 2014 Annual Report due to the greater-than-expected retraction in our Canadian and US Oil & Gas sector when compared to the robust growth experienced during the past few years. We expect our Mining and Power sectors to remain stable for the rest of the year.
Infrastructure
We expect strong organic gross revenue growth in our Infrastructure business operating unit in 2015 compared to 2014. In Q2 15, we revised our outlook to strong from moderate, as described in our 2014 Annual Report, because of better-than-anticipated growth in the first of half of 2015 compared to the same period in 2014. We expect that a gradual continuation of long-term trends—in particular, population growth, urbanization, and the need to rehabilitate aging infrastructure—will further drive the requirement for our water, community development, and transportation services.
| Management’s Discussion and Analysis | ||||
| (unaudited) | ||||
| June 30, 2015 | M-25 | Stantec Inc. |
Overall Outlook
We believe that our outlook is to end the year with a moderate increase in organic revenue growth in 2015 compared to 2014. We believe that our Buildings and Infrastructure business operating units will achieve strong organic gross revenue growth. However, compared to 2014, the 2015 organic gross revenue for our Energy & Resources business operating unit is expected to retract. In the second half of 2015, we expect that organic retraction either will be slower than in the first half of 2015 or will stabilize at these lower levels.
We operate in a highly diverse infrastructure and facilities market in North America and internationally that consists of many technical disciplines, market sectors, client types, and industries in both the private and public sectors. This gives us the flexibility to adapt to changing market conditions in a timely manner. Our results may fluctuate from quarter to quarter, depending on variables such as project mix, economic factors, and integration activities related to acquisitions in a quarter. In the first two quarters of 2015, we saw no significant changes in our industry’s environment; in particular, uncertainty remains in the oil and gas sector.
Our business model continues to focus on mitigating risk by diversifying operations across geographic locations, business operating units, and all phases of the infrastructure and facilities project life cycle. Our overall expectations remain consistent with those discussed in the Outlook by Region and Outlook by Business Operating Unit sections in this report and those generally described in the Outlook section of the Management’s Discussion and Analysis in our 2014 Annual Report.
Our overall outlook is based in part on an update of the underlying assumptions found in the Outlook section of the Management’s Discussion and Analysis in our 2014 Annual Report. The Caution Regarding Forward-Looking Statements section of this Management’s Discussion and Analysis outlines these updated assumptions.
Critical Accounting Estimates, Developments, and Measures
Critical Accounting Estimates
The preparation of consolidated financial statements in accordance with IFRS requires us to make various estimates and assumptions. However, future events may result in significant differences between estimates and actual results. There has been no significant change in our critical accounting estimates in Q2 15 from those described in our 2014 Annual Report under the heading Critical Accounting Estimates, Developments, and Measures and in note 5 of our December 31, 2014, audited consolidated financial statements, which are incorporated here by reference.
Definition of Additional IFRS Measures and Non-IFRS Measures
IFRS mandates certain minimum line items for financial statements and requires presentation of additional line items, headings, and subtotals when that presentation is relevant to an understanding of a company’s financial position and performance. This Management’s Discussion and Analysis includes additional IFRS measures, namely, gross revenue, net revenue, and gross margin. It also includes references to and uses measures and terms that are not specifically defined in IFRS and do not have any standardized meaning prescribed by IFRS. These measures and terms are working capital, current ratio, net debt to equity ratio, return on equity ratio, EBITDA, EBITDA as a percentage of net revenue, EBITDAR, debt to EBITDA ratio, net debt to EBITDA ratio, EBITDAR to debt service ratio, and backlog. These non-IFRS measures may not be comparable to similar measures presented by other companies.
For the first two quarters ended June 30, 2015, there has been no significant change in our description of additional IFRS measures and non-IFRS measures from that included in our 2014 Annual Report under the heading Critical Accounting Estimates, Developments, and Measures and incorporated here by reference. For additional information, refer to this discussion in our 2014 Annual Report.
| Management’s Discussion and Analysis | ||||
| (unaudited) | ||||
| June 30, 2015 | M-26 | Stantec Inc. |
Recent Accounting Pronouncements
Effective January 1, 2015, we adopted the following amendments, further described in note 6 of our December 31, 2014, annual consolidated financial statements and note 4 of our June 30, 2015, unaudited interim consolidated financial statements:
| · | Annual Improvements (2010–2012 Cycle) |
| · | Annual Improvements (2011–2013 Cycle) |
Adopting these amendments did not have an impact on our financial position or performance.
Future Adoptions
Standards, amendments, and interpretations that we reasonably expect to be applicable at a future date and intend to adopt when they become effective are described in note 4 of our June 30, 2015, unaudited interim consolidated financial statements and are incorporated here by reference.
Controls and Procedures
Evaluation of Disclosure Controls and Procedures. Our CEO and CFO evaluated our disclosure controls and procedures (defined in the US Securities Exchange Act Rules 13a–15(e) and 15d–15(e)) as of the end of the period covered by this quarterly report. Based on this evaluation, our CEO and CFO concluded that our disclosure controls and procedures were effective as of such date.
Changes in Internal Controls over Financial Reporting. There has been no change in our internal control over financial reporting during the last fiscal quarter covered by this quarterly report that has materially affected, or is reasonably likely to materially affect, our internal control over financial reporting.
Risk Factors
For the first two quarters of 2015, there has been no significant change in our risk factors from those described in our 2014 Annual Report; the risk factors are incorporated here by reference.
Subsequent Events
On July 10, 2015, we acquired certain assets and liabilities, and the business of VI Engineering, LLC (VI Engineering), adding 30 staff to our Company. Based in Houston, Texas, VI Engineering provides specialized engineering, design, analysis, and project management of high-voltage substations, transmission lines, and electric power systems.
On August 5, 2015, we declared a cash dividend of $0.105 per share payable on October 15, 2015, to shareholders of record on September 30, 2015.
| Management’s Discussion and Analysis | ||||
| (unaudited) | ||||
| June 30, 2015 | M-27 | Stantec Inc. |
Caution Regarding Forward-Looking Statements
Our public communications often include written or verbal forward-looking statements within the meaning of the US Private Securities Litigation Reform Act and Canadian securities laws. Forward-looking statements are disclosures regarding possible events, conditions, or results of operations that are based on assumptions about future economic conditions or courses of action and include future-oriented financial information.
Statements of this type are contained in this report, including the discussion of our goals in the Core Business and Strategy section and of our annual and long-term targets and expectations for our regional and business operating units in the Results and Outlook sections, and may be contained in filings with securities regulators or in other communications. Forward-looking statements may involve, but are not limited to, comments with respect to our objectives for 2015 and beyond, our strategies or future actions, our targets, our expectations for our financial condition or share price, or the results of or outlook for our operations.
We provide forward-looking information for our business in the following sections and subsections of this report:
| • | Core Business and Strategy |
| • | United States and Buildings subsections under Results—Gross and Net Revenue |
| • | Amortization of Intangible Assets subsection under Results |
| • | Liquidity and Capital Resources |
| • | Outlook |
These describe the management expectations and targets by which we measure our success and assist our shareholders in understanding our financial position as at and for the periods ended on the dates presented in this report. Readers are cautioned that this information may not be appropriate for other purposes.
By their nature, forward-looking statements require us to make assumptions and are subject to inherent risks and uncertainties. There is a significant risk that predictions, forecasts, conclusions, projections, and other forward-looking statements will not prove to be accurate. We caution readers of this report not to place undue reliance on our forward-looking statements since a number of factors could cause actual future results, conditions, actions, or events to differ materially from the targets, expectations, estimates, or intentions expressed in these forward-looking statements.
Future outcomes relating to forward-looking statements may be influenced by many factors and material risks.
Assumptions
In determining our forward-looking statements, we consider material factors, including assumptions about the performance of the Canadian, US, and various international economies in 2015 and their effect on our business. The assumptions we made at the time of publishing our annual targets and outlook for 2015 are listed in the Outlook section of our 2014 Annual Report. The following information updates and, therefore, supersedes those assumptions.
To establish our level of future cash flows, we assumed that the Canadian dollar would remain relatively stable during 2015. We also assumed that our average interest rate would remain relatively stable in 2015 compared to 2014. On June 30, 2015, the Canadian dollar closed at US$0.80 compared to US$0.86 on December 31, 2014. The average interest rate on our revolving credit facility was 1.38% at June 30, 2015, compared to 1.37% at December 31, 2014. The interest rates on our senior secured notes are fixed. To establish our effective income tax rate, we assumed the tax rate substantially enacted at the time of preparing our targets for 2015 for the countries in which we operate, primarily Canada and the United States. Our effective tax rate was 27.5% as at June 30, 2015, compared to 26.3% for the year ended December 31, 2014 (further explained on page M-17).
In our 2014 Annual Report, we noted that according to the National Association of Home Builders (NAHB) in the United States, seasonally adjusted annual rates of total housing starts in the United States were expected to increase to 1,169,000 units in 2015. This forecast has since been revised to 1,076,000 units in 2015.
In our 2014 Annual Report, the Bank of Canada forecasted GDP growth would be 2.1% in 2015 and the overnight target rate would be 0.75%. The GDP forecast for 2015 has since been revised to 1.1%; the overnight target rate has been decreased to 0.50%.
The Architecture Billings Index (ABI) from the American Institute of Architects rose from 51.7 in March to 55.9 in June. This is the highest the ABI has been since July 2007. In our 2014 Annual Report, we noted that the ABI had been consistently above 50.0, suggesting improving demand for design services.
| Management’s Discussion and Analysis | ||||
| (unaudited) | ||||
| June 30, 2015 | M-28 | Stantec Inc. |
The outlook for all three business operating units—Buildings, Energy & Resources, and Infrastructure—changed during the first two quarters of 2015 from that described in the Outlook section of our 2014 Annual Report. The organic growth outlooks have been revised from moderate to strong for Buildings and Infrastructure, and from stable to retraction for Energy & Resources. The outlooks for our Canadian and International regional operating units changed from that described in the Outlook section of our 2014 Annual Report. The organic growth outlook has been revised from stable to retraction for Canada and from moderate to stable for International. The outlook for the United States remains at moderate.
The assumptions and expectations used to establish these outlooks are discussed in the Outlook section in this Management’s Discussion and Analysis, as well as in the Outlook section of our 2014 Annual Report, incorporated here by reference.
The preceding list of assumptions is not exhaustive. Investors and the public should carefully consider these factors, other uncertainties, and potential events, as well as the inherent uncertainty of forward-looking statements, when relying on these statements to make decisions with respect to our Company. The forward-looking statements contained here represent our expectations as of August 5, 2015, and, accordingly, are subject to change after such date. Except as may be required by law, we do not undertake to update any forward-looking statement, whether written or verbal, that may be made from time to time. In the case of the ranges of expected performance for fiscal 2015, it is our current practice to evaluate and, where we deem appropriate, provide updates. However, subject to legal requirements, we may change this practice at any time at our sole discretion.
| Management’s Discussion and Analysis | ||||
| (unaudited) | ||||
| June 30, 2015 | M-29 | Stantec Inc. |
Consolidated Statements of Financial Position
(Unaudited)
| June 30 | December 31 | |||||||||||
| 2015 | 2014 | |||||||||||
| (In thousands of Canadian dollars) | Notes | $ | $ | |||||||||
| ASSETS |
9 | |||||||||||
| Current |
||||||||||||
| Cash and deposits |
6 | 20,973 | 153,704 | |||||||||
| Cash in escrow |
6 | 6,000 | - | |||||||||
| Trade and other receivables |
7 | 553,069 | 431,751 | |||||||||
| Unbilled revenue |
234,156 | 192,310 | ||||||||||
| Income taxes recoverable |
23,228 | 11,171 | ||||||||||
| Prepaid expenses |
25,983 | 23,425 | ||||||||||
| Other financial assets |
8 | 30,316 | 31,526 | |||||||||
| Other assets |
545 | 530 | ||||||||||
| Total current assets |
894,270 | 844,417 | ||||||||||
| Non-current |
||||||||||||
| Property and equipment |
157,028 | 152,707 | ||||||||||
| Goodwill |
856,066 | 760,631 | ||||||||||
| Intangible assets |
122,429 | 97,243 | ||||||||||
| Investments in joint ventures and associates |
5,141 | 4,975 | ||||||||||
| Deferred tax assets |
74,063 | 58,801 | ||||||||||
| Other financial assets |
8 | 108,241 | 90,667 | |||||||||
| Other assets |
836 | 1,029 | ||||||||||
| Total assets |
2,218,074 | 2,010,470 | ||||||||||
| LIABILITIES AND SHAREHOLDERS’ EQUITY |
||||||||||||
| Current |
||||||||||||
| Bank indebtedness |
6 | 3,677 | - | |||||||||
| Trade and other payables |
12 | 289,493 | 300,293 | |||||||||
| Billings in excess of costs |
84,854 | 96,082 | ||||||||||
| Current portion of long-term debt |
9 | 133,967 | 53,172 | |||||||||
| Provisions |
10 | 14,501 | 10,796 | |||||||||
| Other financial liabilities |
2,031 | 2,773 | ||||||||||
| Other liabilities |
11 | 11,953 | 11,953 | |||||||||
| Total current liabilities |
540,476 | 475,069 | ||||||||||
| Non-current |
||||||||||||
| Long-term debt |
9 | 259,266 | 256,093 | |||||||||
| Provisions |
10 | 59,415 | 51,596 | |||||||||
| Deferred tax liabilities |
92,610 | 74,602 | ||||||||||
| Other financial liabilities |
2,293 | 2,547 | ||||||||||
| Other liabilities |
11 | 66,543 | 64,318 | |||||||||
| Total liabilities |
1,020,603 | 924,225 | ||||||||||
| Shareholders’ equity |
||||||||||||
| Share capital |
12 | 284,086 | 276,698 | |||||||||
| Contributed surplus |
12 | 14,364 | 13,490 | |||||||||
| Retained earnings |
797,294 | 735,917 | ||||||||||
| Accumulated other comprehensive income |
101,727 | 60,140 | ||||||||||
| Total shareholders’ equity |
1,197,471 | 1,086,245 | ||||||||||
| Total liabilities and shareholders’ equity |
2,218,074 | 2,010,470 | ||||||||||
See accompanying notes
| F-1 | Stantec Inc. |
Consolidated Statements of Income
(Unaudited)
| For the quarter ended June 30 |
For the two quarters ended June 30 |
|||||||||||||||||||
|
2015 |
2014 |
2015 |
2014 | |||||||||||||||||
| (In thousands of Canadian dollars, except per share amounts)
|
Notes
|
$
|
$
|
$
|
$
|
|||||||||||||||
| Gross revenue |
710,254 | 633,819 | 1,415,977 | 1,207,712 | ||||||||||||||||
| Less subconsultant and other direct expenses |
116,336 | 103,568 | 229,775 | 196,206 | ||||||||||||||||
| Net revenue |
593,918 | 530,251 | 1,186,202 | 1,011,506 | ||||||||||||||||
| Direct payroll costs |
16 | 273,138 | 240,229 | 538,271 | 459,851 | |||||||||||||||
| Gross margin |
320,780 | 290,022 | 647,931 | 551,655 | ||||||||||||||||
| Administrative and marketing expenses |
5,12,16 | 244,968 | 211,803 | 496,426 | 411,715 | |||||||||||||||
| Depreciation of property and equipment |
11,162 | 9,175 | 22,004 | 17,999 | ||||||||||||||||
| Amortization of intangible assets |
8,679 | 5,788 | 18,906 | 11,152 | ||||||||||||||||
| Net interest expense |
2,863 | 2,172 | 5,529 | 3,697 | ||||||||||||||||
| Other net finance expense |
739 | 758 | 1,577 | 1,416 | ||||||||||||||||
| Share of income from joint ventures and associates |
(516) | (581) | (1,155) | (1,386) | ||||||||||||||||
| Foreign exchange loss (gain) |
94 | (179) | (34) | 89 | ||||||||||||||||
| Other income |
17 | (6,749) | (24) | (7,217) | (390) | |||||||||||||||
| Income before income taxes |
59,540 | 61,110 | 111,895 | 107,363 | ||||||||||||||||
| Income taxes |
||||||||||||||||||||
| Current |
17,103 | 17,495 | 31,204 | 27,821 | ||||||||||||||||
| Deferred |
(730) | (690) | (433) | 1,704 | ||||||||||||||||
| Total income taxes |
16,373 | 16,805 | 30,771 | 29,525 | ||||||||||||||||
| Net income for the period |
43,167 | 44,305 | 81,124 | 77,838 | ||||||||||||||||
| Weighted average number of shares outstanding – basic |
94,037,462 | 93,409,806 | 93,950,055 | 93,328,828 | ||||||||||||||||
| Weighted average number of shares outstanding – diluted |
94,645,377 | 94,303,814 | 94,495,416 | 94,272,502 | ||||||||||||||||
| Shares outstanding, end of the period |
94,186,720 | 93,504,332 | 94,186,720 | 93,504,332 | ||||||||||||||||
| Earnings per share |
||||||||||||||||||||
| Basic |
0.46 | 0.47 | 0.86 | 0.83 | ||||||||||||||||
| Diluted |
0.46 | 0.47 | 0.86 | 0.83 | ||||||||||||||||
See accompanying notes
Shares outstanding and earnings per share for 2014 have been adjusted for the November 14, 2014, two-for-one share split.
| F-2 | Stantec Inc. |
Consolidated Statements of Comprehensive Income
(Unaudited)
|
For the quarter ended |
For the two quarters ended | |||||||
|
2015 |
2014 |
2015 |
2014 | |||||
| (In thousands of Canadian dollars)
|
$
|
$
|
$
|
$
| ||||
| Net income for the period |
43,167 | 44,305 | 81,124 | 77,838 | ||||
| Other comprehensive income (All items may be reclassified to net income in subsequent periods) |
||||||||
| Exchange differences on translation of foreign operations |
(452) | (15,928) | 44,824 | 583 | ||||
| Net unrealized (loss) gain on available-for-sale financial assets |
(1,511) | 1,096 | 1,171 | 2,626 | ||||
| Net realized gain on available-for-sale financial assets |
(4,156) | (8) | (4,466) | (304) | ||||
| Income tax effect on available-for-sale financial assets |
100 | (19) | 58 | (41) | ||||
| Other comprehensive (loss) income for the period, net of tax |
(6,019) | (14,859) | 41,587 | 2,864 | ||||
| Total comprehensive income for the period, net of tax |
37,148 | 29,446 | 122,711 | 80,702 | ||||
See accompanying notes
| F-3 | Stantec Inc. |
Consolidated Statements of Shareholders’ Equity
(Unaudited)
| Shares Outstanding (note 12) |
Share Capital (note 12) |
Contributed Surplus (note 12) |
Retained Earnings |
Accumulated Other Comprehensive Income |
Total | |||||||||||||||||||
| (In thousands of Canadian dollars, except shares outstanding) |
# | $ | $ | $ | $ | $ | ||||||||||||||||||
| Balance, December 31, 2013 |
93,152,264 | 262,573 | 12,369 | 606,056 | 11,636 | 892,634 | ||||||||||||||||||
| Net income |
77,838 | 77,838 | ||||||||||||||||||||||
| Other comprehensive income |
2,864 | 2,864 | ||||||||||||||||||||||
| Total comprehensive income |
77,838 | 2,864 | 80,702 | |||||||||||||||||||||
| Share options exercised for cash |
352,068 | 5,515 | 5,515 | |||||||||||||||||||||
| Share-based compensation expense |
2,223 | 2,223 | ||||||||||||||||||||||
| Reclassification of fair value of share |
1,816 | (1,816 | ) | - | ||||||||||||||||||||
| Dividends declared (note 12) |
(17,281 | ) | (17,281 | ) | ||||||||||||||||||||
| Balance, June 30, 2014 |
93,504,332 | 269,904 | 12,776 | 666,613 | 14,500 | 963,793 | ||||||||||||||||||
| Balance, December 31, 2014 |
93,836,258 | 276,698 | 13,490 | 735,917 | 60,140 | 1,086,245 | ||||||||||||||||||
| Net income |
81,124 | 81,124 | ||||||||||||||||||||||
| Other comprehensive income |
41,587 | 41,587 | ||||||||||||||||||||||
| Total comprehensive income |
81,124 | 41,587 | 122,711 | |||||||||||||||||||||
| Share options exercised for cash |
350,462 | 5,649 | 5,649 | |||||||||||||||||||||
| Share-based compensation expense |
2,613 | 2,613 | ||||||||||||||||||||||
| Reclassification of fair value of share |
1,739 | (1,739 | ) | - | ||||||||||||||||||||
| Dividends declared (note 12) |
(19,747 | ) | (19,747 | ) | ||||||||||||||||||||
| Balance, June 30, 2015 |
94,186,720 | 284,086 | 14,364 | 797,294 | 101,727 | 1,197,471 | ||||||||||||||||||
See accompanying notes
| F-4 | Stantec Inc. |
Consolidated Statements of Cash Flows
(Unaudited)
| For the quarter ended | For the two quarters ended | |||||||||||||||||
| June 30 | June 30 | |||||||||||||||||
| 2015 | 2014 | 2015 | 2014 | |||||||||||||||
| (In thousands of Canadian dollars) | Notes | $ | $ | $ | $ | |||||||||||||
| CASH FLOWS FROM (USED IN) OPERATING ACTIVITIES |
||||||||||||||||||
| Cash receipts from clients |
707,840 | 613,938 | 1,334,017 | 1,180,116 | ||||||||||||||
| Cash paid to suppliers |
(239,643 | ) | (189,102 | ) | (479,314 | ) | (399,341 | ) | ||||||||||
| Cash paid to employees |
(379,246 | ) | (381,185 | ) | (834,743 | ) | (721,792 | ) | ||||||||||
| Interest received |
542 | 489 | 1,221 | 1,250 | ||||||||||||||
| Interest paid |
(5,437 | ) | (3,623 | ) | (6,477 | ) | (4,215 | ) | ||||||||||
| Finance costs paid |
(568 | ) | (631 | ) | (1,245 | ) | (1,240 | ) | ||||||||||
| Income taxes paid |
(23,515 | ) | (21,369 | ) | (42,640 | ) | (40,715 | ) | ||||||||||
| Income taxes recovered |
636 | 125 | 1,532 | 954 | ||||||||||||||
| Cash flows from (used in) operating activities |
18 | 60,609 | 18,642 | (27,649 | ) | 15,017 | ||||||||||||
| CASH FLOWS FROM (USED IN) INVESTING ACTIVITIES |
||||||||||||||||||
| Business acquisitions, net of cash acquired |
5 | (16,398 | ) | (38,518 | ) | (132,242 | ) | (76,604 | ) | |||||||||
| Cash held in escrow |
6 | - | - | (6,000 | ) | - | ||||||||||||
| Dividends from investments in joint ventures and associates |
289 | 1,658 | 1,299 | 1,755 | ||||||||||||||
| Proceeds (purchase) of investments held for self-insured liabilities |
2,076 | (4,529 | ) | (4,057 | ) | (9,951 | ) | |||||||||||
| Decrease (increase) in investments and other assets |
4,484 | (412 | ) | (318 | ) | (545 | ) | |||||||||||
| Proceeds from lease inducements |
74 | 1,849 | 560 | 1,849 | ||||||||||||||
| Purchase of intangible assets |
(383 | ) | - | (2,081 | ) | (2,934 | ) | |||||||||||
| Purchase of property and equipment |
(6,140 | ) | (14,861 | ) | (19,354 | ) | (27,403 | ) | ||||||||||
| Proceeds on disposition of property and equipment |
143 | 20 | 297 | 64 | ||||||||||||||
| Cash flows used in investing activities |
(15,855 | ) | (54,793 | ) | (161,896 | ) | (113,769 | ) | ||||||||||
| CASH FLOWS FROM (USED IN) FINANCING ACTIVITIES |
||||||||||||||||||
| Repayment of bank debt |
(32,344 | ) | (5,358 | ) | (36,841 | ) | (17,555 | ) | ||||||||||
| Proceeds from bank debt |
- | 46,968 | 110,311 | 105,661 | ||||||||||||||
| Payment of finance lease obligations |
(402 | ) | (748 | ) | (9,572 | ) | (3,697 | ) | ||||||||||
| Proceeds from issue of share capital |
4,024 | 2,477 | 5,649 | 5,515 | ||||||||||||||
| Payment of dividends to shareholders |
12 | (9,862 | ) | (8,634 | ) | (18,542 | ) | (16,318 | ) | |||||||||
| Cash flows (used in) from financing activities |
(38,584 | ) | 34,705 | 51,005 | 73,606 | |||||||||||||
| Foreign exchange gain (loss) on cash held in foreign currency |
18 | (1,392 | ) | 2,132 | (148 | ) | ||||||||||||
| Net increase (decrease) in cash and cash equivalents |
6,188 | (2,838 | ) | (136,408 | ) | (25,294 | ) | |||||||||||
| Cash and cash equivalents, beginning of the period |
11,108 | 120,574 | 153,704 | 143,030 | ||||||||||||||
| Cash and cash equivalents, end of the period |
6 | 17,296 | 117,736 | 17,296 | 117,736 | |||||||||||||
See accompanying notes
| F-5 | Stantec Inc. |
Notes to the Unaudited Interim Condensed
Consolidated Financial Statements
1. Corporate Information
The interim condensed consolidated financial statements (consolidated financial statements) of Stantec Inc. (the Company) for the quarter ended June 30, 2015, were authorized for issue in accordance with a resolution of the Company’s Audit and Risk Committee on August 5, 2015. The Company was incorporated under the Canada Business Corporations Act on March 23, 1984. Its shares are traded on the Toronto Stock Exchange (TSX) and New York Stock Exchange (NYSE) under the symbol STN. The Company’s registered office is located at 10160 – 112 Street, Edmonton, Alberta. The Company is domiciled in Canada.
The Company is a provider of comprehensive professional services in the area of infrastructure and facilities for clients in the public and private sectors. The Company’s services include planning, engineering, architecture, interior design, landscape architecture, surveying, environmental sciences, project management, and project economics for infrastructure and facilities projects.
2. Basis of Preparation
These consolidated financial statements for the quarter ended June 30, 2015, were prepared in accordance with International Accounting Standard (IAS) 34 Interim Financial Reporting. The consolidated financial statements do not include all information and disclosures required in the annual financial statements and should be read in conjunction with the Company’s December 31, 2014, annual consolidated financial statements.
The accounting policies adopted when preparing the Company’s consolidated financial statements are consistent with those followed when preparing the Company’s annual consolidated financial statements for the year ended December 31, 2014, except for the adoption of Annual Improvements (2010-2012 Cycle and 2011-2013 Cycle) (described in note 4). Taxes on income in the interim periods are accrued using the tax rate that would be applicable to expected total annual income.
The preparation of these consolidated financial statements requires management to make judgments, estimates, and assumptions that affect the application of accounting policies and the reported amounts of assets, liabilities, revenue, and expenses. Actual results may differ from these estimates. The significant judgments made by management in applying the Company’s accounting policies and the key sources of estimation uncertainty were the same as those that applied to the Company’s December 31, 2014, annual consolidated financial statements.
These consolidated financial statements are presented in Canadian dollars, unless otherwise indicated. All comparative share capital, earnings per share, dividend per share, and share-based payment transaction information have been adjusted from amounts reported before the two-for-one share split on November 14, 2014.
3. Basis of Consolidation
The consolidated financial statements include the accounts of the Company, its subsidiaries, and its structured entities as at June 30, 2015.
Subsidiaries and structured entities are fully consolidated from the date of acquisition, which is the date the Company obtains control, and continue to be consolidated until the date that such control ceases. The statements of financial position of the subsidiaries and structured entities are prepared as at June 30, 2015. All intercompany balances are eliminated.
Joint ventures are accounted for using the equity method, and joint operations are accounted for by the Company recognizing its share of assets, liabilities, revenue, and expenses of the joint operation.
| Notes to the Unaudited Interim Condensed Consolidated Financial Statements | ||||
| June 30, 2015 | F-6 | Stantec Inc. | ||
4. Recent Accounting Pronouncements and Changes to Accounting Policies
Recently adopted
The following amendments have been adopted by the Company effective January 1, 2015. The adoption of these amendments did not have an impact on the financial position or performance of the Company.
| · | In December 2013, the IASB issued Annual Improvements (2010-2012 Cycle) to make necessary but non-urgent amendments to IFRS 2 Share-based Payments; IFRS 3 Business Combinations (IFRS 3); IFRS 8 Operating Segments (IFRS 8); IFRS 13 Fair Value Measurement (IFRS 13); IAS 16 Property, Plant, and Equipment; IAS 24 Related Party Disclosures; and IAS 38 Intangible Assets. |
| · | In December 2013, the IASB issued Annual Improvements (2011-2013 Cycle) to make necessary but non-urgent amendments to IFRS 1 First-time Adoption of IFRS; IFRS 3; IFRS 13; and IAS 40 Investment Properties. |
Future adoptions
The standards, amendments, and interpretations issued before 2015 but not yet adopted by the Company have been disclosed in note 6 of the Company’s December 31, 2014, annual consolidated financial statements. No additional standards, amendments, and interpretations applicable to the Company were issued in the first two quarters of 2015.
5. Business Acquisitions
Acquisitions are accounted for under the acquisition method of accounting and the results of operations since the respective dates of acquisition are included in the consolidated statements of income. From time to time, as a result of the timing of acquisitions in relation to the Company’s reporting schedule, certain estimates of fair values of assets and liabilities acquired may not be finalized at the initial time of reporting. These estimates are completed after the vendors’ final financial statements and income tax returns have been prepared and accepted by the Company and when the valuation of intangible assets acquired is finalized. The preliminary fair values are based on management’s best estimates of the acquired identifiable assets and liabilities at the acquisition date. During a measurement period not to exceed one year, adjustments to the initial estimates may be required to finalize the fair value of assets and liabilities acquired. The Company will revise comparative information if these measurement period adjustments are material.
The consideration paid for acquisitions may be subject to price adjustment clauses included in the purchase agreements and may extend over a number of years. At each consolidated statement of financial position date, these price adjustment clauses are reviewed. This may result in an increase in or a reduction of the notes payable consideration (recorded on the acquisition date) to reflect either more or less non-cash working capital than was originally recorded. Since these adjustments are a result of facts and circumstances occurring after the acquisition date, they are not considered measurement period adjustments.
For some acquisitions, additional payments may be made to the employees of an acquired company that are based on the employees’ continued service over an agreed period of time. These additional payments are not included in the purchase price. They are expensed as compensation when services are provided by the employees.
Acquisitions in 2015
On January 16, 2015, the Company acquired certain assets and liabilities of Dessau Inc. and all the shares and business of 9073-4195 Quebec Inc. and Azimuth Services (Central) Inc. (collectively called Dessau) for cash consideration. The Company acquired the Canadian engineering operations of this Montreal-based firm, which has offices throughout Quebec and in Mississauga and Ottawa, Ontario. Dessau adds to the Company’s expertise in healthcare, water, power and energy, transportation, and community development, as well as introduces telecommunications and security services to its broader platform.
On February 28, 2015, the Company acquired all the shares and business of Sparling, Inc. (Sparling) for cash consideration and notes payable. Sparling is based in Seattle, Washington, and has additional offices in San Diego, California, and in Portland, Oregon. Sparling provides expertise in electrical engineering and architectural lighting design. This addition further enhances the Company’s West Coast presence in the United States.
| Notes to the Unaudited Interim Condensed Consolidated Financial Statements | ||||
| June 30, 2015 | F-7 | Stantec Inc. | ||
Aggregate consideration for assets acquired and liabilities assumed
Details of the aggregate consideration transferred and the fair value of the identifiable assets and liabilities acquired at the date of acquisition are as follows:
| (In thousands of Canadian dollars) | June 30 $ |
|||
|
|
||||
| Cash consideration |
113,800 | |||
| Notes payable |
15,537 | |||
|
|
||||
| Consideration |
129,337 | |||
|
|
||||
| Assets and liabilities acquired |
||||
| Cash acquired |
9,758 | |||
| Non-cash working capital |
49,626 | |||
| Property and equipment |
6,208 | |||
| Investments in associates |
262 | |||
| Intangible assets |
||||
| Client relationships |
10,813 | |||
| Contract backlog |
5,634 | |||
| Lease advantages |
6,358 | |||
| Other |
434 | |||
| Provisions |
(5,518) | |||
| Long-term debt |
(4,492) | |||
| Deferred income taxes |
(4,512) | |||
|
|
||||
| Total identifiable net assets at fair value |
74,571 | |||
| Goodwill arising on acquisitions |
54,766 | |||
|
|
||||
| Consideration |
129,337 | |||
|
|
||||
Trade receivables assumed from acquired companies are recognized at fair value at the time of acquisition. In the first two quarters of 2015, trade receivables acquired had a fair value of $51,932,000 and gross value of $54,459,000.
Goodwill consists of the value of expected synergies arising from an acquisition, the expertise and reputation of the assembled workforce acquired, and the geographic location of the acquiree. Of the goodwill and intangible assets resulting from acquisitions completed in 2015, $41,884,000 is deductible for income tax purposes.
As a result of the Dessau and Sparling acquisitions, the Company assumed commitments for operating leases of approximately $55,293,000, with remaining lease terms of up to nine years. Future sublease payments expected to be received under noncancellable sublease agreements are $9,507,000.
As part of the Dessau acquisition, the Company assumed interests in a number of individually and in aggregate immaterial joint operations. The Company provides services to these joint operations in the normal course of business and recognizes its share of assets, liabilities, revenue, and expenses in its consolidated financial statements. To support the activities of certain joint operations, the Company and the other investors in the joint operations have agreed to make additional contributions, in proportion to their interest, to make up any losses, if required. In addition, for certain joint operations, the profits will not be distributed until the parties to the arrangement provide consent for distribution.
| Notes to the Unaudited Interim Condensed Consolidated Financial Statements | ||||
| June 30, 2015 | F-8 | Stantec Inc. | ||
The fair value of provisions are determined at the acquisition date. These liabilities relate to claims that are subject to legal arbitration and onerous contracts. During the first two quarters of 2015, the Company assumed $4,098,000 in provisions for claims relating to the current period’s acquisitions (2014 – $535,000). At the reporting date, provisions for claims outstanding from current and prior acquisitions were reassessed and determined to be $6,486,000, based on their expected probable outcome. Certain of these claims are indemnified by the acquiree (note 8).
For business combinations that occurred in 2015, the Company estimates that gross revenue earned in 2015, since the acquired entities’ acquisition dates, is $76,401,000. The Company integrates the operations and systems of acquired entities shortly after the acquisition date; therefore, it is impracticable to disclose the acquiree’s earnings in its consolidated financial statements since the acquisition date.
If the business combinations that occurred in 2015 had taken place at the beginning of 2015, gross revenue from continuing operations for 2015 would have been $1,428,388,000 and the profit from continuing operations would have been $80,456,000.
In 2015, directly attributable acquisition-related costs of $465,000 have been expensed and are included in administrative and marketing expenses.
Consideration paid and outstanding
Details of the consideration paid for current and past acquisitions are as follows:
| For the quarter
|
For the two quarters
|
|||||||
|
|
|
|||||||
| (In thousands of Canadian dollars) | 2015 $ |
2015 $ |
||||||
|
|
||||||||
| Cash consideration (net of cash acquired) |
- | 104,042 | ||||||
| Payments on notes payable from previous acquisitions |
16,398 | 28,200 | ||||||
|
|
||||||||
| Total net cash paid |
16,398 | 132,242 | ||||||
|
|
||||||||
| Total notes payable and adjustments to these obligations are as follows: |
||||||
| (In thousands of Canadian dollars) | Notes Payable $ |
|||||
|
|
||||||
| December 31, 2014 |
108,928 | |||||
| Additions for acquisitions in the period |
15,537 | |||||
| Other adjustments |
(1,830 | ) | ||||
| Payments |
(28,200 | ) | ||||
| Interest |
857 | |||||
| Impact of foreign exchange |
7,273 | |||||
|
|
||||||
| June 30, 2015 |
102,565 | |||||
|
|
||||||
| Notes to the Unaudited Interim Condensed Consolidated Financial Statements | ||||
| June 30, 2015 | F-9 | Stantec Inc. | ||
6. Cash and Deposits
The Company’s policy is to invest cash in excess of operating requirements in highly liquid investments. For the purpose of the consolidated statements of cash flows, cash and deposits consist of the following:
| (In thousands of Canadian dollars) | June 30 $ |
June 30 2014 $ |
||||||
|
|
||||||||
| Cash |
19,873 | 115,361 | ||||||
| Unrestricted investments |
1,100 | 2,375 | ||||||
|
|
||||||||
| Cash and deposits |
20,973 | 117,736 | ||||||
| Bank indebtedness |
(3,677) | - | ||||||
|
|
||||||||
| Cash and cash equivalents |
17,296 | 117,736 | ||||||
|
|
||||||||
Unrestricted investments consist of short-term bank deposits with initial maturities of three months or less.
Pursuant to the Dessau acquisition agreement, $6,000,000 was placed in an escrow account to cover potential indemnification claims and will be settled in accordance to an escrow agreement. A corresponding obligation was also recorded on acquisition and is included in other notes payable.
7. Trade and Other Receivables
| (In thousands of Canadian dollars) | June 30 $ |
December 31 $ |
||||||
|
|
||||||||
| Trade receivables, net of allowance |
543,568 | 420,408 | ||||||
| Holdbacks, current |
3,215 | 4,351 | ||||||
| Other |
6,286 | 6,992 | ||||||
|
|
||||||||
| Trade and other receivables |
553,069 | 431,751 | ||||||
|
|
||||||||
The Company maintains an allowance for estimated losses on trade receivables. The estimate is based on the best assessment of the collectibility of the related receivable balance, which is determined in part based on the age of the outstanding receivables and the Company’s historical collection and loss experience.
The following table provides a reconciliation of changes to the Company’s allowance for doubtful accounts.
| (In thousands of Canadian dollars) | June 30 $ |
December 31 $ |
||||||
|
|
||||||||
| Balance, beginning of the period |
18,152 | 19,316 | ||||||
| Provision for doubtful accounts |
3,377 | 2,664 | ||||||
| Deductions |
(2,518) | (4,908) | ||||||
| Impact of foreign exchange |
927 | 1,080 | ||||||
|
|
||||||||
| Balance, end of the period |
19,938 | 18,152 | ||||||
|
|
||||||||
| Notes to the Unaudited Interim Condensed Consolidated Financial Statements | ||||
| June 30, 2015 | F-10 | Stantec Inc. | ||
The aging analysis of gross trade receivables is as follows:
| (In thousands of Canadian dollars) | Total $ |
1–30 $ |
31–60 $ |
61–90 $ |
91–120 $ |
121+ $ |
||||||||||||||||||
|
|
||||||||||||||||||||||||
| June 30, 2015 |
563,506 | 299,369 | 133,199 | 48,575 | 34,504 | 47,859 | ||||||||||||||||||
|
|
||||||||||||||||||||||||
| December 31, 2014 |
438,560 | 225,556 | 99,334 | 57,279 | 20,943 | 35,448 | ||||||||||||||||||
|
|
||||||||||||||||||||||||
8. Other Financial Assets
| (In thousands of Canadian dollars) | June 30 2015 $ |
December 31 $ |
||||||
|
|
||||||||
| Investments held for self-insured liabilities |
119,991 | 112,020 | ||||||
| Investments |
2,107 | 1,645 | ||||||
| Holdbacks on long-term contracts |
10,340 | 7,649 | ||||||
| Indemnifications |
108 | 442 | ||||||
| Other |
6,011 | 437 | ||||||
|
|
||||||||
| 138,557 | 122,193 | |||||||
| Less current portion |
30,316 | 31,526 | ||||||
|
|
||||||||
| Long-term portion |
108,241 | 90,667 | ||||||
|
|
||||||||
Investments held for self-insured liabilities
Investments held for self-insured liabilities consist of government and corporate bonds, equity securities, and term deposits. These investments are classified as available for sale and are stated at fair value with unrealized gains (losses) recorded in other comprehensive income. Their fair value and amortized cost are as follows:
| June 30
2015 $ |
December 31
2014 $ |
|||||||||||||||
| (In thousands of Canadian dollars) | Fair Value | Amortized Cost/Cost |
Fair Value | Amortized Cost/Cost |
||||||||||||
|
|
||||||||||||||||
| Bonds |
82,730 | 82,238 | 73,209 | 72,960 | ||||||||||||
| Equity securities |
36,087 | 31,846 | 35,113 | 27,299 | ||||||||||||
| Term deposits |
1,174 | 1,173 | 3,698 | 3,698 | ||||||||||||
|
|
||||||||||||||||
| Total |
119,991 | 115,257 | 112,020 | 103,957 | ||||||||||||
|
|
||||||||||||||||
The bonds bear interest at rates ranging from 0.50% to 5.10% per annum (December 31, 2014 – 0.50% to 5.10%).Term deposits mature at various dates before November 2015.
| Notes to the Unaudited Interim Condensed Consolidated Financial Statements | ||||
| June 30, 2015 | F-11 | Stantec Inc. | ||
The terms to maturity of the bond portfolio, stated at fair value, are as follows:
| (In thousands of Canadian dollars) | June 30 $ |
December 31 $ |
||||||
|
|
||||||||
| Within one year |
24,225 | 27,340 | ||||||
| After one year but not more than five years |
58,505 | 45,869 | ||||||
|
|
||||||||
| Total |
82,730 | 73,209 | ||||||
|
|
||||||||
Indemnifications
The Company’s indemnifications relate to certain legal claims (note 10). During 2015, the Company decreased provisions and indemnification assets relating to prior acquisitions by $370,000 (June 30, 2014 – $135,000) because of the settlement of certain claims and new information obtained in the period.
9. Long-Term Debt
| (In thousands of Canadian dollars) | June 30 $ |
December 31 $ |
||||||
|
|
||||||||
| Non-interest-bearing note payable |
296 | 282 | ||||||
| Other notes payable |
104,728 | 111,191 | ||||||
| Bank loan |
149,464 | 64,966 | ||||||
| Senior secured notes |
124,693 | 124,594 | ||||||
| Finance lease obligations |
14,052 | 8,232 | ||||||
|
|
||||||||
| 393,233 | 309,265 | |||||||
| Less current portion |
133,967 | 53,172 | ||||||
|
|
||||||||
| Long-term portion |
259,266 | 256,093 | ||||||
|
|
||||||||
Other notes payable
Other notes payable consists primarily of notes payable for acquisitions (note 5). The weighted average rate of interest on the other notes payable is 3.70% (December 31, 2014 – 3.65%). The notes may be supported by promissory notes and are due at various times from 2015 to 2018. The aggregate maturity value of the notes is $106,614,000 (December 31, 2014 – $113,726,000). At June 30, 2015, $88,943,000 (US$71,211,000) (December 31, 2014 –$100,207,000 (US$86,378,000)) of the notes’ carrying amount was payable in US funds.
Bank loan
The Company has entered into an agreement for a $350 million revolving credit facility expiring August 2018. This facility allows the Company access to an additional $150 million under the same terms and conditions on approval from its lenders. The facility is available for future acquisitions, working capital needs, and general corporate purposes. Depending on the form under which the credit facility is accessed, rates of interest will vary between Canadian prime, US base rate, and LIBOR or bankers’ acceptance rates, plus specified basis points. The specified basis points may vary, depending on the Company’s level of consolidated debt to EBITDA (a non-IFRS measure), from 20 to 125 for Canadian prime and US base rate loans, and from 120 to 225 for bankers’ acceptances, LIBOR loans, and letters of credit.
At June 30, 2015, $149,464,000 (US$119,667,000) of the bank loan was payable in US funds. At December 31, 2014, $64,966,000 (US$56,000,000) of the bank loan was payable in US funds. Loans may be repaid under the credit facility from time to time at the option of the Company. The credit facility contains restrictive covenants (note 15). The average interest rate applicable at June 30, 2015, was 1.39% (December 31, 2014 – 1.37%).
| Notes to the Unaudited Interim Condensed Consolidated Financial Statements | ||||
| June 30, 2015 | F-12 | Stantec Inc. | ||
The funds available under the revolving credit facility are reduced by any outstanding letters of credit issued pursuant to this facility agreement. At June 30, 2015, the Company had issued and outstanding letters of credit, expiring at various dates before July 2016, totaling $212,000 (December 31, 2014 – $2,287,000), payable in Canadian funds, and $1,007,000 (US$806,000) (December 31, 2014 – $872,000 (US$752,000)), payable in US funds. These letters of credit were issued in the normal course of operations, including the guarantee of certain office rental obligations. At June 30, 2015, $195,640,000 (December 31, 2014 – $281,875,000) was available in the revolving credit facility for future activities.
The Company has a surety facility to facilitate, as part of the normal course of operations, the issuance of bonds for certain types of project work. At June 30, 2015, the Company had issued bonds under this surety facility totaling $213,000 (December 31, 2014 – $36,000) in Canadian funds and $4,095,000 (US$3,279,000) (December 31, 2014 –$3,268,000 (US$2,817,000)) in US funds. These bonds expire at various dates before April 2020.
The Company has a bid bond facility expiring on August 31, 2018, in the amount of $15 million. This facility allows the Company access to an additional $5 million under the same terms and conditions upon approval from its lenders. This facility may be used for the issuance of bid bonds, performance guarantees, letters of credit, and documentary credits in international currencies. At June 30, 2015, $9,759,000 (December 31, 2014 – $8,525,000) was issued under this bid bond facility, is payable in various international currencies, and will expire at various dates before June 2016.
Senior secured notes
On May 13, 2011, the Company issued $70 million of 4.332% senior secured notes due May 10, 2016, and $55 million of 4.757% senior secured notes due May 10, 2018. These amounts were recorded net of transaction costs of $1,115,000. The senior secured notes were issued pursuant to an indenture dated May 13, 2011, between the Company, as issuer, and BNY Trust Company of Canada, as trustee and collateral agent. The senior secured notes are ranked pari passu with the Company’s existing revolving credit facility.
Interest on the senior secured notes is payable semi-annually in arrears on May 10 and November 10 until maturity or the earlier of payment, redemption, or purchase in full of the senior secured notes. The Company may redeem the senior secured notes, in whole at any time or in part from time to time, at specified redemption prices and subject to certain conditions required by the indenture. The Company may purchase its senior secured notes for cancellation at any time. The senior secured notes contain restrictive covenants (note 15). All Company assets are held as collateral under a general security agreement for the revolving credit facility and the senior secured notes.
Finance lease obligations
The Company has finance leases for software and for automotive and office equipment. At June 30, 2015, finance lease obligations included finance leases bearing interest at rates ranging from 0.66% to 12.98% (December 31, 2014 – 0.66% to 12.98%). These finance leases expire at various dates before August 2018.
Future minimum lease payments under finance leases and the present value of the net minimum lease payments are as follows:
| (In thousands of Canadian dollars) | June 30 $ |
December 31 $ |
||||||
|
|
||||||||
| Within one year |
7,719 | 5,888 | ||||||
| After one year but not more than five years |
6,547 | 2,604 | ||||||
|
|
||||||||
| Total minimum lease payments |
14,266 | 8,492 | ||||||
|
|
||||||||
| Present value of minimum lease payments |
14,052 | 8,232 | ||||||
|
|
||||||||
| Notes to the Unaudited Interim Condensed Consolidated Financial Statements | ||||
| June 30, 2015 | F-13 | Stantec Inc. | ||
10. Provisions
| (In thousands of Canadian dollars) | June 30 $ |
December 31 $ |
||||||
|
|
||||||||
| Provision for self-insured liabilities |
57,137 | 50,074 | ||||||
| Provisions for claims |
8,124 | 4,506 | ||||||
| Onerous contracts |
8,655 | 7,812 | ||||||
|
|
||||||||
| 73,916 | 62,392 | |||||||
| Less current portion |
14,501 | 10,796 | ||||||
|
|
||||||||
| Long-term portion |
59,415 | 51,596 | ||||||
|
|
||||||||
In the normal conduct of operations, various legal claims are pending against the Company, alleging, among other things, breaches of contract or negligence in connection with the performance of consulting services. The Company carries professional liability insurance, subject to certain deductibles and policy limits, and has a captive insurance company that provides insurance protection against such claims. Due to uncertainties in the nature of the Company’s legal claims, such as the range of possible outcomes and the progress of the litigation, provisions accrued involve estimates. The ultimate cost to resolve these claims may exceed or be less than those recorded in the consolidated financial statements. Management believes that the ultimate cost to resolve these claims will not materially exceed the insurance coverage or provisions accrued and, therefore, would not have a material adverse effect on the Company’s consolidated statements of income and financial position. Management regularly reviews the timing of the outflows of these provisions. Cash outflows for existing provisions are expected to occur within the next one to five years, although this is uncertain and depends on the development of the various claims. These outflows are not expected to have a material impact on the Company’s cash flows.
Provision for self-insured liabilities
| (In thousands of Canadian dollars) | June 30 $ |
December 31 $ |
||||||
|
|
||||||||
| Provision, beginning of the period |
50,074 | 47,628 | ||||||
| Current-period provision |
7,133 | 4,893 | ||||||
| Payment for claims settlement |
(2,681 | ) | (5,180 | ) | ||||
| Impact of foreign exchange |
2,611 | 2,733 | ||||||
|
|
||||||||
| Provision, end of the period |
57,137 | 50,074 | ||||||
|
|
||||||||
The current and long-term portions of provision for self-insured liabilities are determined based on an actuarial estimate. At June 30, 2015, the long-term portion was $54,022,000 (December 31, 2014 – $46,521,000).
Provisions for claims
| (In thousands of Canadian dollars) | June 30 2015 $ |
December 31 2014 $ |
||||||
|
|
||||||||
| Provisions, beginning of the period |
4,506 | 6,946 | ||||||
| Current-period provisions |
907 | 1,528 | ||||||
| Claims from acquisitions |
4,098 | 672 | ||||||
| Claims paid or otherwise settled |
(1,535 | ) | (4,810 | ) | ||||
| Impact of foreign exchange |
148 | 170 | ||||||
|
|
||||||||
| Provisions, end of the period |
8,124 | 4,506 | ||||||
|
|
||||||||
| Notes to the Unaudited Interim Condensed Consolidated Financial Statements | ||||
| June 30, 2015 | F-14 | Stantec Inc. | ||
Provisions for claims include an estimate for costs associated with legal claims covered by third-party insurance. Often, these legal claims are from prior acquisitions and may be indemnified by the acquiree (notes 5 and 8).
Onerous contracts
| (In thousands of Canadian dollars) | June 30 $ |
December 31 $ |
||||||
|
|
||||||||
| Liability, beginning of the period |
7,812 | 7,012 | ||||||
| Current-period provisions |
444 | 1,637 | ||||||
| Resulting from acquisitions |
1,420 | 816 | ||||||
| Costs paid or otherwise settled |
(1,497) | (2,098) | ||||||
| Impact of foreign exchange |
476 | 445 | ||||||
|
|
||||||||
| Liability, end of the period |
8,655 | 7,812 | ||||||
|
|
||||||||
Onerous contracts consist of lease exit liabilities and sublease losses. Payments for these onerous contracts will occur until December 2024.
11. Other Liabilities
| (In thousands of Canadian dollars) | Note | June 30 $ |
December 31 $ |
|||||||||
|
|
||||||||||||
| Deferred gain on sale leaseback |
2,148 | 2,506 | ||||||||||
| Lease inducement benefits |
43,603 | 44,411 | ||||||||||
| Lease disadvantages |
4,231 | 4,784 | ||||||||||
| Deferred share units payable |
12 | 16,131 | 13,157 | |||||||||
| Other cash-settled share-based compensation |
12 | 5,144 | 4,960 | |||||||||
| Liability for uncertain tax positions |
7,239 | 6,453 | ||||||||||
|
|
||||||||||||
| 78,496 | 76,271 | |||||||||||
| Less current portion |
11,953 | 11,953 | ||||||||||
|
|
||||||||||||
| Long-term portion |
66,543 | 64,318 | ||||||||||
|
|
||||||||||||
12. Share Capital
Authorized
| Unlimited | Common shares, with no par value | |
| Unlimited | Preferred shares issuable in series, with attributes designated by the board of directors |
Common shares
During the second quarter of 2015, the Company recognized a share-based compensation expense of $4,954,000 (June 30, 2014 – $2,187,000) in administrative and marketing expenses in the consolidated statements of income. Of the amount expensed, $1,230,000 (June 30, 2014 – $1,218,000) related to the fair value of options granted and $3,724,000 (June 30, 2014 – $969,000) related to cash-settled share-based compensation (deferred share units (DSUs), restricted share units (RSUs), and performance share units (PSUs)).
During the first two quarters of 2015, the Company recognized a share-based compensation expense of $7,418,000 (June 30, 2014 – $4,049,000) in administrative and marketing expenses in the consolidated statements of income. Of the amount expensed, $2,613,000 (June 30, 2014 – $2,223,000) related to the fair value of options granted and $4,805,000 (June 30, 2014 – $1,826,000) related to cash-settled share-based compensation (DSUs, RSUs, and PSUs).
| Notes to the Unaudited Interim Condensed Consolidated Financial Statements | ||||
| June 30, 2015 | F-15 | Stantec Inc. | ||
The fair value of options granted was reflected through contributed surplus, and the cash-settled share-based compensation was reflected through other liabilities. Upon the exercise of share options, for which a share-based compensation expense has been recognized, the cash paid, together with the related portion of contributed surplus, is credited to share capital.
Dividends
Holders of common shares are entitled to receive dividends when declared by the Company’s board of directors. The table below describes the dividends declared and recorded in the consolidated financial statements in 2015 and 2014. All dividend per share amounts have been adjusted for the share split that occurred on November 14, 2014.
| Date Declared | Record Date | Payment Date | Dividend per Share $ |
Paid $ |
||||||||
|
|
||||||||||||
| February 26, 2014 |
March 28, 2014 | April 17, 2014 | 0.0925 | 8,634,000 | ||||||||
| May 14, 2014 |
June 27, 2014 | July 17, 2014 | 0.0925 | 8,647,000 | ||||||||
| August 6, 2014 |
September 26, 2014 | October 16, 2014 | 0.0925 | 8,676,000 | ||||||||
| November 15, 2014 |
December 31, 2014 | January 15, 2015 | 0.0925 | 8,680,000 | ||||||||
| February 25, 2015 |
March 31, 2015 | April 16, 2015 | 0.1050 | 9,862,000 | ||||||||
| May 13, 2015 |
June 30, 2015 | July 16, 2015 | 0.1050 | - | ||||||||
|
|
||||||||||||
At June 30, 2015, trade and other payables included $9,885,000 related to the dividends declared on May 13, 2015.
Share-based payment transactions
In 2015, under the long-term incentive program, the Company granted share options and PSUs. The Company also has a DSU plan for the board of directors. All comparative share-based payment transaction information below has been adjusted from amounts reported before the two-for-one share split on November 14, 2014.
a) Share options
The Company has granted share options to officers and employees to purchase 3,277,744 shares at prices from $14.33 to $32.90 per share. These options expire on dates between August 18, 2015, and March 3, 2022.
| For the two quarters ended June 30 2015 |
For the year ended 2014 |
|||||||||||||||
|
|
|
|||||||||||||||
| Shares # |
Weighted $ |
Shares # |
Weighted Average Exercise Price $ |
|||||||||||||
|
|
||||||||||||||||
| Share options, beginning of the period |
2,676,568 | 21.82 | 2,610,830 | 16.80 | ||||||||||||
| Granted |
965,064 | 32.01 | 803,926 | 32.90 | ||||||||||||
| Exercised |
(350,462) | 16.12 | (683,994) | 15.48 | ||||||||||||
| Forfeited |
(13,426) | 30.24 | (54,194) | 24.61 | ||||||||||||
|
|
||||||||||||||||
| Share options, end of the period |
3,277,744 | 25.39 | 2,676,568 | 21.82 | ||||||||||||
|
|
||||||||||||||||
The fair value of options granted is determined at the date of grant using the Black-Scholes option-pricing model. The model was developed to use when estimating the fair value of traded options that have no vesting restrictions and are fully transferable. Option valuation models require the input of highly subjective assumptions, including expected share price volatility.
As at June 30, 2015, 1,517,992 (June 30, 2014 – 1,431,344) share options were exercisable at a weighted average price of $19.51 (June 30, 2014 – $15.71). As at June 30, 2015, and June 30, 2014, no share options were antidilutive.
| Notes to the Unaudited Interim Condensed Consolidated Financial Statements | ||||
| June 30, 2015 | F-16 | Stantec Inc. | ||
b) Restricted share units
Under the Company’s RSU plan, senior vice presidents (SVPs) may receive RSUs equal to one common share. The SVPs may be granted an allotment of these units annually; after two years, they receive a cash payment equivalent to the weighted-by-volume average of the closing price of the Company’s common shares for the last 10 trading days before the units’ release date. The RSUs vest on their grant date since the SVPs are not required to complete a specified period of service. The units are recorded at fair value. RSUs are adjusted for dividends as they arise, based on the number of units outstanding on the record date.
During the quarter, 110 RSUs were issued (June 30, 2014 – 246). At June 30, 2015, 38,195 RSUs were outstanding at the fair value of $1,375,000 (December 31, 2014 – 88,491 units were outstanding at the fair value of $2,774,000).
c) Performance share units
Under the Company’s long-term incentive plan, certain members of the senior leadership teams, including the chief executive officer (CEO), may be granted PSUs. These units are adjusted for dividends as they arise, based on the number of units held on the record date. PSUs vest upon completing a three-year service condition that starts on the date the units are granted. In addition, the number of units that vest is subject to a percentage that can range from 0% to 200%, depending on achieving two equally weighted three-year performance objectives based on net income growth and return on equity. For the units that vest, unit holders will receive a cash payment based on the closing price of the Company’s common shares on the third anniversary date of issue. The fair value of these units is expensed over their three-year vesting period.
During the quarter, 937 PSUs were issued (June 30, 2014 – 435). In addition, during the second quarter, 657 units were forfeited (June 30, 2014 – nil). At June 30, 2015, 350,248 PSUs were outstanding at the fair value of $12,758,000 (December 31, 2014 – 155,737 units were outstanding at the fair value of $7,795,000).
d) Deferred share units
The Company also has a DSU plan. Under this plan, directors of the board of the Company may receive DSUs equal to one common share. Before 2014, the CEO could also receive DSUs. These units vest on their grant date. They are paid in cash to the CEO and directors of the board on their death or retirement, or in the case of the CEO, in cash on termination. They are valued at the weighted-by-volume average of the closing market price of the Company’s common shares for the last 10 trading days of the month of death, retirement, or termination. These units are recorded at fair value. DSUs are adjusted for dividends as they arise, based on the number of units outstanding on the record date.
During the quarter, 14,086 DSUs were issued (June 30, 2014 – 13,895). At June 30, 2015, 448,063 DSUs were outstanding at the fair value of $16,131,000 (December 31, 2014 – 419,704 units were outstanding at the fair value of $13,157,000).
13. Fair Value Measurements
All financial instruments carried at fair value are categorized into one of the following three categories:
| • | Level 1 – quoted market prices |
| • | Level 2 – valuation techniques (market observable) |
| • | Level 3 – valuation techniques (non-market observable) |
When forming estimates, the Company uses the most observable inputs available for valuation purposes. If a fair value measurement reflects inputs of different levels within the hierarchy, the financial instrument is categorized based on the lowest level of significant input.
When determining fair value, the Company considers the principal or most advantageous market in which it would transact and the assumptions that market participants would use when pricing the asset or liability. The Company measures certain financial assets at fair value on a recurring basis. In 2015, no change has been made to the method of determining fair value.
| Notes to the Unaudited Interim Condensed Consolidated Financial Statements | ||||
| June 30, 2015 | F-17 | Stantec Inc. | ||
For financial instruments recognized at fair value on a recurring basis, the Company determines whether transfers have occurred between levels in the hierarchy by reassessing categorizations at the end of each reporting period. During the two quarters ended June 30, 2015, no transfers were made between levels 1 and 2 fair value measurements.
The following table summarizes the Company’s fair value hierarchy for those assets measured and adjusted to fair value on a recurring basis as at June 30, 2015:
| (In thousands of Canadian dollars)
|
Note | Carrying $ |
Quoted Prices in |
Significant $ |
Significant (Level 3) $ |
|||||||||||||||
|
|
||||||||||||||||||||
| Investments held for self-insured liabilities |
8 | 119,991 | - | 119,991 | - | |||||||||||||||
|
|
||||||||||||||||||||
Investments held for self-insured liabilities consist of government and corporate bonds, equity securities, and term deposits. Fair value of equities is determined using the reported net asset value per share of the investment funds. The funds derive their value from the observable quoted prices of the equities owned that are traded in an active market. Fair value of bonds is determined using observable prices of debt with characteristics and maturities that are similar to the bonds being valued.
The following table summarizes the Company’s fair value hierarchy for those liabilities that were not measured at fair value but were disclosed at fair value on a recurring basis as at June 30, 2015:
| (In thousands of Canadian dollars)
|
Note | Fair Value $ |
Quoted Prices in Active Markets for Identical Items (Level 1) $ |
Significant $ |
Significant (Level 3) $ |
|||||||||||||||
|
|
||||||||||||||||||||
| Other notes payable |
9 | 104,853 | - | 104,853 | - | |||||||||||||||
| Senior secured notes |
9 | 130,488 | - | 130,488 | - | |||||||||||||||
|
|
||||||||||||||||||||
| 235,341 | - | 235,341 | - | |||||||||||||||||
|
|
||||||||||||||||||||
The fair values of other notes payable and senior secured notes are determined by calculating the present value of future payments using observable benchmark interest rates and credit spreads for debt with similar characteristics and maturities.
| Notes to the Unaudited Interim Condensed Consolidated Financial Statements | ||||
| June 30, 2015 | F-18 | Stantec Inc. | ||
14. Financial Instruments
Credit risk
Credit risk is the risk of financial loss to the Company if a counterparty to a financial instrument fails to meet its contractual obligation. Financial instruments that subject the Company to credit risk consist primarily of cash and deposits, cash in escrow, other financial assets, and trade and other receivables.
The Company’s maximum amount of credit risk exposure is limited to the carrying amount of these financial instruments, which is $718,599,000 at June 30, 2015 (December 31, 2014 – $706,769,000).
The Company limits its exposure to credit risk by placing its cash and deposits in and entering into derivative agreements with high-quality credit institutions. Investments held for self-insured liabilities include bonds, equities, and term deposits. The risk associated with bonds, equities, and term deposits is mitigated by the overall quality and mix of the Company’s investment portfolio.
The Company mitigates the risk associated with trade and other receivables and holdbacks on long-term contracts by providing services to diverse clients in various industries and sectors of the economy. The Company does not concentrate its credit risk in any particular client, industry, or economic or geographic sector. In addition, management reviews trade and other receivables past due on an ongoing basis to identify matters that could potentially delay the collection of funds at an early stage. The Company monitors trade receivables to an internal target of days of revenue in trade receivables, which at June 30, 2015, was 71 days (December 31, 2014 –59 days).
Liquidity risk
Liquidity risk is the risk that the Company will not be able to meet obligations associated with its financial liabilities as they fall due. The Company meets its liquidity needs through a variety of sources, including cash generated from operations, long- and short-term borrowings from its $350 million revolving credit facility and senior secured notes, and the issuance of common shares. The unused capacity of the credit facility at June 30, 2015, was $195,640,000 (December 31, 2014 – $281,875,000). The Company believes that it has sufficient resources to meet its obligations associated with its financial liabilities. Liquidity risk is managed according to the Company’s internal guideline of maintaining a net debt to EBITDA ratio of less than 2.5 (note 15).
The timing of undiscounted cash outflows relating to financial liabilities is outlined in the table below:
| (In thousands of Canadian dollars) | Total $ |
Less than 1 Year $ |
1–3 Years $ |
After 3 Years $ |
||||||||||||
|
|
||||||||||||||||
| December 31, 2014 |
||||||||||||||||
| Trade and other payables |
300,293 | 300,293 | - | - | ||||||||||||
| Long-term debt |
327,385 | 58,533 | 267,647 | 1,205 | ||||||||||||
| Other financial liabilities |
5,320 | 2,773 | 356 | 2,191 | ||||||||||||
|
|
||||||||||||||||
| Total contractual obligations |
632,998 | 361,599 | 268,003 | 3,396 | ||||||||||||
|
|
||||||||||||||||
| June 30, 2015 |
||||||||||||||||
| Trade and other payables |
289,493 | 289,493 | - | - | ||||||||||||
| Long-term debt |
396,278 | 134,770 | 260,331 | 1,177 | ||||||||||||
| Other financial liabilities |
4,324 | 2,031 | 135 | 2,158 | ||||||||||||
|
|
||||||||||||||||
| Total contractual obligations |
690,095 | 426,294 | 260,466 | 3,335 | ||||||||||||
|
|
||||||||||||||||
In addition to the financial liabilities listed in the table, the Company will pay interest on the bank loan and senior secured notes outstanding in future periods. Further information on long-term debt is included in note 9.
| Notes to the Unaudited Interim Condensed Consolidated Financial Statements | ||||
| June 30, 2015 | F-19 | Stantec Inc. | ||
Interest rate risk
Interest rate risk is the risk that the fair value of the future cash flows of a financial instrument will fluctuate because of changes in market rates of interest. The Company is subject to interest rate cash flow risk to the extent that its revolving credit facility is based on floating rates of interest. The Company is also subject to interest rate pricing risk to the extent that its investments held for self-insured liabilities include fixed-rate government bonds, corporate bonds, and term deposits.
If the interest rate on the Company’s revolving credit facility balance at June 30, 2015, was 0.5% higher, with all other variables held constant, net income would have decreased by $271,000. If the interest rate was 0.5% lower, there would have been an equal and opposite impact on net income. The Company has the flexibility to partly mitigate its exposure to interest rate changes by maintaining a mix of both fixed- and floating-rate debt. The Company’s senior secured notes have fixed interest rates; therefore, interest rate fluctuations would have no impact on the interest payments for the senior secured notes.
Foreign exchange risk
Foreign exchange risk is the risk that the fair value of the future cash flows of a financial instrument will fluctuate because of changes in foreign exchange rates. Foreign exchange gains or losses in net income arise on the translation of foreign currency–denominated assets and liabilities (such as trade and other receivables, trade and other payables, and long-term debt) held in the Company’s Canadian operations and non-US-based foreign subsidiaries. The Company minimizes its exposure to foreign exchange fluctuations on these items by matching foreign currency assets with foreign currency liabilities and, when appropriate, by entering into forward contracts to buy or sell US dollars and British pounds in exchange for Canadian dollars.
If exchange rates were $0.01 lower at June 30, 2015, with all other variables held constant, net income would have decreased by $22,000. If the exchange rates were $0.01 higher, there would have been an equal and opposite impact on net income.
Foreign exchange fluctuations may also arise on the translation of the Company’s US-based subsidiaries or other foreign subsidiaries, where the functional currency is different from the Canadian dollar, and are recorded in other comprehensive income. The Company does not hedge for this foreign exchange risk.
Price risk
The Company’s investments held for self-insured liabilities are exposed to price risk arising from changes in the market values of the equity funds. This risk is mitigated to the extent that the portfolio of equity funds is monitored regularly and is relatively diversified. The effects of a 1.0% increase in equity prices would have increased the Company’s comprehensive income by $262,000. If equity prices declined by 1.0%, there would have been an equal and opposite impact on comprehensive income.
15. Capital Management
The Company’s objective when managing capital is to provide sufficient capacity to cover normal operating and capital expenditures, acquisition growth, and payment of dividends, while maintaining an adequate return for shareholders. The Company defines its capital as the aggregate of long-term debt (including the current portion) and shareholders’ equity.
The Company manages its capital structure to maintain the flexibility to adjust to changes in economic conditions and acquisition growth and to respond to interest rate, foreign exchange, credit, and other risks. To maintain or adjust its capital structure, the Company may purchase shares for cancellation pursuant to normal course issuer bids, issue new shares, or raise or retire debt.
| Notes to the Unaudited Interim Condensed Consolidated Financial Statements | ||||
| June 30, 2015 | F-20 | Stantec Inc. | ||
The Company periodically monitors capital by maintaining the following ratio targets:
| ● |
Net debt to EBITDA ratio below 2.5 | |
| ● |
Return on equity (ROE) at or above 14% |
These targets are established annually and monitored quarterly. Targets for 2015 are the same as for 2014.
Net debt to EBITDA ratio, a non-IFRS measure, is calculated as the sum of (1) long-term debt, including current portion, plus bank indebtedness, less cash and deposits and cash in escrow, divided by (2) EBITDA, calculated as income before income taxes, net interest expense, amortization of intangible assets, depreciation of property and equipment, and goodwill and intangible asset impairment. The Company’s net debt to EBITDA ratio was 1.18 at June 30, 2015 (December 31, 2014 – 0.53), calculated on a trailing four-quarter basis. Going forward, there may be occasions when the Company exceeds its target by completing acquisitions that increase its debt level above the target for a period of time.
ROE, a non-IFRS measure, is calculated as net income for the last four quarters, divided by average shareholders’ equity over each of those quarters. The Company’s ROE was 15.4% for the period ended June 30, 2015 (December 31, 2014 – 16.8%).
The Company is subject to restrictive covenants related to its $350 million revolving credit facility and its senior secured notes that are measured quarterly. These covenants include, but are not limited to, consolidated debt to EBITDA and EBITDAR to consolidated debt service ratio (non-IFRS measures). EBITDAR is calculated as EBITDA, plus building rental obligations net of common area costs, taxes, charges, and levies. Failure to meet the terms of one or more of these covenants may constitute a default, potentially resulting in accelerating the repayment of the debt obligation. The Company was in compliance with the covenants under these agreements as at and throughout the three months ended June 30, 2015.
16. Employee Costs
| For the quarter ended June 30 |
For the two quarters ended June 30 |
|||||||||||||||
|
|
|
|
|
|||||||||||||
| (In thousands of Canadian dollars) | 2015 $ |
2014 $ |
2015 $ |
2014 $ |
||||||||||||
|
|
||||||||||||||||
| Wages, salaries, and benefits |
403,816 | 354,714 | 807,296 | 678,596 | ||||||||||||
| Pension costs |
12,172 | 9,132 | 24,403 | 18,733 | ||||||||||||
| Share-based compensation |
4,954 | 2,187 | 7,418 | 4,049 | ||||||||||||
|
|
||||||||||||||||
| Total employee costs |
420,942 | 366,033 | 839,117 | 701,378 | ||||||||||||
|
|
||||||||||||||||
| Direct labor |
273,138 | 240,229 | 538,271 | 459,851 | ||||||||||||
| Indirect labor |
147,804 | 125,804 | 300,846 | 241,527 | ||||||||||||
|
|
||||||||||||||||
| Total employee costs |
420,942 | 366,033 | 839,117 | 701,378 | ||||||||||||
|
|
||||||||||||||||
Direct labor costs include salaries, wages, and related fringe benefits for labor hours directly associated with the completion of projects. Bonuses, share-based compensation, and salaries, wages, and related fringe benefits for labor hours not directly associated with the completion of projects are included in indirect labor costs. Indirect labor costs are included in administrative and marketing expenses in the consolidated statements of income.
| Notes to the Unaudited Interim Condensed Consolidated Financial Statements | ||||
| June 30, 2015 | F-21 | Stantec Inc. | ||
17. Other Income
| For the quarter ended June 30 |
For the two quarters ended June 30 |
|||||||||||||||
|
|
|
|
|
|||||||||||||
| (In thousands of Canadian dollars) | 2015 $ |
2014 $ |
2015 $ |
2014 $ |
||||||||||||
|
|
||||||||||||||||
| Gain on sale of property and equipment |
2,491 | - | 2,491 | - | ||||||||||||
| Realized gain on available-for-sale equity securities |
4,156 | 8 | 4,466 | 304 | ||||||||||||
| Other |
102 | 16 | 260 | 86 | ||||||||||||
|
|
||||||||||||||||
| Total other income |
6,749 | 24 | 7,217 | 390 | ||||||||||||
|
|
||||||||||||||||
18. Cash Flows from Operating Activities
Cash flows from operating activities determined by the indirect method are as follows:
| For the quarter ended June 30 |
For the two quarters ended June 30 |
|||||||||||||||
|
|
|
|
|
|||||||||||||
| (In thousands of Canadian dollars) | 2015 $ |
2014 $ |
2015 $ |
2014 $ |
||||||||||||
|
|
||||||||||||||||
| CASH FLOWS FROM (USED IN) OPERATING ACTIVITIES | ||||||||||||||||
| Net income for the period |
43,167 | 44,305 | 81,124 | 77,838 | ||||||||||||
| Add (deduct) items not affecting cash: |
||||||||||||||||
| Depreciation of property and equipment |
11,162 | 9,175 | 22,004 | 17,999 | ||||||||||||
| Amortization of intangible assets |
8,679 | 5,788 | 18,906 | 11,152 | ||||||||||||
| Deferred income taxes |
(730) | (690) | (433) | 1,704 | ||||||||||||
| (Gain) loss on dispositions of investments and other assets |
(2,730) | 329 | (2,491) | 1,021 | ||||||||||||
| Share-based compensation expense |
4,954 | 2,187 | 7,418 | 4,049 | ||||||||||||
| Provision for self-insured liabilities and claims |
4,080 | 608 | 8,040 | 4,653 | ||||||||||||
| Other non-cash items |
(8,203) | (857) | (9,941) | (2,683) | ||||||||||||
| Share of income from joint ventures and associates |
(516) | (581) | (1,155) | (1,386) | ||||||||||||
|
|
||||||||||||||||
| 59,863 | 60,264 | 123,472 | 114,347 | |||||||||||||
|
|
||||||||||||||||
| Trade and other receivables |
(27,249) | (20,602) | (61,293) | 5,359 | ||||||||||||
| Unbilled revenue |
4,271 | (15,722) | (19,632) | (65,496) | ||||||||||||
| Prepaid expenses |
983 | 6,407 | 732 | 3,734 | ||||||||||||
| Trade and other payables |
37,643 | (11,198) | (35,812) | (34,184) | ||||||||||||
| Billings in excess of costs |
(8,013) | 3,091 | (24,629) | 3,322 | ||||||||||||
| Income taxes recoverable |
(6,889) | (3,598) | (10,487) | (12,065) | ||||||||||||
|
|
||||||||||||||||
| 746 | (41,622) | (151,121) | (99,330) | |||||||||||||
|
|
||||||||||||||||
| Cash flows from (used in) operating activities |
60,609 | 18,642 | (27,649) | 15,017 | ||||||||||||
|
|
||||||||||||||||
19. Related-Party Disclosures
As at June 30, 2015, the Company has subsidiaries and structured entities that are controlled by the Company and consolidated in its financial statements. These are listed in the Company’s December 31, 2014, annual consolidated statements. In addition, the Company enters into related-party transactions through a number of individually immaterial joint ventures and associates. These transactions involve providing or receiving services, and during the quarter, they were entered into in the normal course of business. During the quarter, ENTRAN of Virginia, PLLC was dissolved.
| Notes to the Unaudited Interim Condensed Consolidated Financial Statements | ||||
| June 30, 2015 | F-22 | Stantec Inc. | ||
Compensation of key management personnel and directors of the Company
| For the quarter ended June 30 |
For the two quarters ended June 30 |
|||||||||||||||
|
|
|
|
|
|||||||||||||
| (In thousands of Canadian dollars) | 2015 $ |
2014 $ |
2015 $ |
2014 $ |
||||||||||||
|
|
||||||||||||||||
| Salaries and other short-term employment benefits |
2,057 | 2,499 | 4,471 | 4,931 | ||||||||||||
| Directors’ fees |
67 | 76 | 131 | 138 | ||||||||||||
| Share-based compensation |
3,489 | 878 | 4,482 | 1,748 | ||||||||||||
|
|
||||||||||||||||
| Total compensation |
5,613 | 3,453 | 9,084 | 6,817 | ||||||||||||
|
|
||||||||||||||||
20. Segmented Information
The Company provides comprehensive professional services in the area of infrastructure and facilities throughout North America and internationally. It considers the basis on which it is organized, including geographic areas and service offerings, to identify its reportable segments. Operating segments of the Company are defined as components of the Company for which separate financial information is available and are evaluated regularly by the chief operating decision maker when allocating resources and assessing performance. The chief operating decision maker is the CEO of the Company, and the Company’s operating segments are based on its regional geographic areas.
The Company has three operating segments—Canada, the United States, and International—which are aggregated into the consulting services reportable segment. Canada and the United States are combined into a single reportable segment because each segment provides comparable services and uses similar methods to provide the services. Also, these operating segments have similar long-term economic performance, nature and type of labor, customer industries, and nature of the regulatory environment. As well, these operating segments have similar economic characteristics such as historical and long-term gross margins and operating, financing, and underlying currency risks. The International operating segment does not meet the size quantitative thresholds of IFRS 8, and therefore is not reported separately. The International operating segment was combined into consulting services because it is not material.
Geographic information: Non-current assets
| (In thousands of Canadian dollars) | June 30 $ |
December 31 $ |
||||||
|
|
||||||||
| Canada |
498,147 | 431,055 | ||||||
| United States |
635,890 | 578,015 | ||||||
| International |
1,486 | 1,511 | ||||||
|
|
||||||||
| 1,135,523 | 1,010,581 | |||||||
|
|
||||||||
Non-current assets in the table above consist of property and equipment, goodwill, and intangible assets.
| Notes to the Unaudited Interim Condensed Consolidated Financial Statements | ||||
| June 30, 2015 | F-23 | Stantec Inc. | ||
Geographic information: Gross revenue
| For the quarter ended June 30 |
For the two quarters ended June 30 |
|||||||||||||||
|
|
|
|
|
|||||||||||||
| (In thousands of Canadian dollars) | 2015 $ |
2014 $ |
2015 $ |
2014 $ |
||||||||||||
|
|
||||||||||||||||
| Canada |
333,766 | 347,169 | 670,683 | 667,928 | ||||||||||||
| United States |
351,534 | 263,007 | 694,772 | 491,198 | ||||||||||||
| International |
24,954 | 23,643 | 50,522 | 48,586 | ||||||||||||
|
|
||||||||||||||||
| 710,254 | 633,819 | 1,415,977 | 1,207,712 | |||||||||||||
|
|
||||||||||||||||
Gross revenue is attributed to countries based on the location of the project.
Business operating unit information: Gross revenue
| For the quarter ended June 30 |
For the two quarters ended June 30 |
|||||||||||||||
|
|
|
|
|
|||||||||||||
| (In thousands of Canadian dollars) | 2015 $ |
2014 $ |
2015 $ |
2014 $ |
||||||||||||
|
|
||||||||||||||||
| Buildings |
194,094 | 127,322 | 382,900 | 255,199 | ||||||||||||
| Energy & Resources |
241,672 | 287,307 | 503,978 | 531,678 | ||||||||||||
| Infrastructure |
274,488 | 219,190 | 529,099 | 420,835 | ||||||||||||
|
|
||||||||||||||||
| 710,254 | 633,819 | 1,415,977 | 1,207,712 | |||||||||||||
|
|
||||||||||||||||
The allocation of gross revenue to business operating units has been reclassified for comparative figures due to a realignment of certain business lines between business operating units.
Customers
The Company has a large number of clients in various industries and sectors of the economy. Gross revenue is not concentrated in any particular client.
21. Events after the Reporting Period
On July 10, 2015, the Company acquired certain assets and liabilities, and the business of VI Engineering, LLC (VI Engineering) for cash consideration and promissory notes. Based in Houston, Texas, VI Engineering provides specialized engineering, design, analysis, and project management of high-voltage substations, transmission lines, and electric power systems. This addition will further enhance the Company’s power expertise.
On August 5, 2015, the Company declared a dividend of $0.105 per share, payable on October 15, 2015, to shareholders of record on September 30, 2015.
| Notes to the Unaudited Interim Condensed Consolidated Financial Statements | ||||
| June 30, 2015 | F-24 | Stantec Inc. | ||

Exhibit 99.2
CERTIFICATION OF INTERIM FILINGS
I, R.J. Gomes, certify the following:
| 1. | I have reviewed the quarterly report for the period ended June 30, 2015 (this “report”) of Stantec Inc. (the “issuer”); |
| 2. | Based on my knowledge, this report does not contain any untrue statement of a material fact or omit to state a material fact necessary to make the statements made, in light of the circumstances under which such statements were made, not misleading with respect to the period covered by this report; |
| 3. | Based on my knowledge, the financial statements, and other financial information included in this report, fairly present in all material respects the financial condition, results of operations and cash flows of the issuer as of, and for, the periods presented in this report; |
| 4. | The issuer’s other certifying officer and I are responsible for establishing and maintaining disclosure controls and procedures (as defined in Exchange Act Rules 13a-15(e) and 15d-15(e)) and internal control over financial reporting (as defined in Exchange Act Rules 13a-15(f) and 15d-15(f)) for the issuer and have: |
| a) | designed such disclosure controls and procedures, or caused such disclosure controls and procedures to be designed under our supervision, to ensure that material information relating to the issuer, including its consolidated subsidiaries, is made known to us by others within those entities, particularly during the period in which this report is being prepared; |
| b) | designed such internal control over financial reporting, or caused such internal control over financial reporting to be designed under our supervision, to provide reasonable assurance regarding the reliability of financial reporting and the preparation of financial statements for external purposes in accordance with generally accepted accounting principles; |
| c) | evaluated the effectiveness of the issuer’s disclosure controls and procedures and presented in this report our conclusions about the effectiveness of the disclosure controls and procedures, as of the end of the period covered by this report based on such evaluation; and |
| d) | disclosed in this report any change in the issuer’s internal control over financial reporting that occurred during the issuer’s most recent fiscal |
- 2 -
| quarter that has materially affected, or is reasonably likely to materially affect, the issuer’s internal control over financial reporting; and |
| 5. | The issuer’s other certifying officer and I have disclosed, based on our most recent evaluation of internal control over financial reporting, to the issuer’s auditors and the audit committee of the issuer’s board of directors (or persons performing the equivalent functions): |
| a) | all significant deficiencies and material weaknesses in the design or operation of internal control over financial reporting which are reasonably likely to adversely affect the issuer’s ability to record, process, summarize and report financial information; and |
| b) | any fraud, whether or not material, that involves management or other employees who have a significant role in the issuer’s internal control over financial reporting. |
Date: August 5, 2015
/s/ Robert J. Gomes
ROBERT J. GOMES, P. ENG
President & Chief Executive Officer
Exhibit 99.3
CERTIFICATION OF INTERIM FILINGS
I, D.J. Lefaivre, certify the following:
| 1. | I have reviewed the quarterly report for the period ended June 30, 2015 (this “report”) of Stantec Inc. (the “issuer”); |
| 2. | Based on my knowledge, this report does not contain any untrue statement of a material fact or omit to state a material fact necessary to make the statements made, in light of the circumstances under which such statements were made, not misleading with respect to the period covered by this report; |
| 3. | Based on my knowledge, the financial statements, and other financial information included in this report, fairly present in all material respects the financial condition, results of operations and cash flows of the issuer as of, and for, the periods presented in this report; |
| 4. | The issuer’s other certifying officer and I are responsible for establishing and maintaining disclosure controls and procedures (as defined in Exchange Act Rules 13a-15(e) and 15d-15(e)) and internal control over financial reporting (as defined in Exchange Act Rules 13a-15(f) and 15d-15(f)) for the issuer and have: |
| a) | designed such disclosure controls and procedures, or caused such disclosure controls and procedures to be designed under our supervision, to ensure that material information relating to the issuer, including its consolidated subsidiaries, is made known to us by others within those entities, particularly during the period in which this report is being prepared; |
| b) | designed such internal control over financial reporting, or caused such internal control over financial reporting to be designed under our supervision, to provide reasonable assurance regarding the reliability of financial reporting and the preparation of financial statements for external purposes in accordance with generally accepted accounting principles; |
| c) | evaluated the effectiveness of the issuer’s disclosure controls and procedures and presented in this report our conclusions about the effectiveness of the disclosure controls and procedures, as of the end of the period covered by this report based on such evaluation; and |
| d) | disclosed in this report any change in the issuer’s internal control over financial reporting that occurred during the issuer’s most recent fiscal |
- 2 -
| quarter that has materially affected, or is reasonably likely to materially affect, the issuer’s internal control over financial reporting; and |
| 5. | The issuer’s other certifying officer and I have disclosed, based on our most recent evaluation of internal control over financial reporting, to the issuer’s auditors and the audit committee of the issuer’s board of directors (or persons performing the equivalent functions): |
| a) | all significant deficiencies and material weaknesses in the design or operation of internal control over financial reporting which are reasonably likely to adversely affect the issuer’s ability to record, process, summarize and report financial information; and |
| b) | any fraud, whether or not material, that involves management or other employees who have a significant role in the issuer’s internal control over financial reporting. |
Date: August 5, 2015
/s/ Daniel J. Lefaivre
DANIEL J. LEFAIVRE
Executive Vice President & Chief Financial Officer
Serious News for Serious Traders! Try StreetInsider.com Premium Free!
You May Also Be Interested In
- Stantec (STN) Tops Q2 EPS by 47c
- Partners Value Investments Inc. Announces Q2 2026 Interim Results
- Healthy Extracts Q2 2026 Net Revenue Up 113% to Record $2.1 Million, Driving Adj. EBITDA of $290,000 or $0.02 per Share
Create E-mail Alert Related Categories
SEC FilingsSign up for StreetInsider Free!
Receive full access to all new and archived articles, unlimited portfolio tracking, e-mail alerts, custom newswires and RSS feeds - and more!
