

Form 6-K NOMURA HOLDINGS INC For: Dec 14
 Tweet
Tweet Share
ShareTable of Contents
FORM 6-K
U.S. SECURITIES AND EXCHANGE COMMISSION
Washington, D.C. 20549
Report of Foreign Private Issuer
Pursuant to Rule 13a-16 or 15d-16 of
the Securities Exchange Act of 1934
Commission File Number: 1-15270
For the month of December 2018
NOMURA HOLDINGS, INC.
(Translation of registrant’s name into English)
9-1, Nihonbashi 1-chome
Chuo-ku, Tokyo 103-8645
Japan
(Address of principal executive offices)
Indicate by check mark whether the registrant files or will file annual reports under cover Form 20-F or Form 40-F.
Form 20-F X Form 40-F
Indicate by check mark if the registrant is submitting the Form 6-K in paper as permitted by Regulation S-T Rule 101(b)(1):
Indicate by check mark if the registrant is submitting the Form 6-K in paper as permitted by Regulation S-T Rule 101(b)(7):
Table of Contents
Incorporation by Reference
The registrant hereby incorporates Exhibit 1 to this report on Form 6-K by reference in the prospectus that is part of the Registration Statement on Form F-3 (Registration No. 333-209596) of the registrant, filed with the SEC on February 19, 2016.
Information furnished on this form:
| Exhibit Number | ||||
| 1. | Nomura Holdings, Inc. Interim Operating and Financial Review | |||
| 15. | Acknowledgment Letter of Ernst & Young ShinNihon LLC | |||
| 101.INS | XBRL Instance Document | |||
| 101.SCH | XBRL Taxonomy Extension Schema | |||
| 101.CAL | XBRL Taxonomy Extension Calculation Linkbase | |||
| 101.DEF | XBRL Taxonomy Extension Definition Linkbase | |||
| 101.LAB | XBRL Taxonomy Extension Label Linkbase | |||
| 101.PRE | XBRL Taxonomy Extension Presentation Linkbase | |||
Table of Contents
SIGNATURES
Pursuant to the requirements of the Securities Exchange Act of 1934, the registrant has duly caused this report to be signed on its behalf by the undersigned, thereunto duly authorized.
| NOMURA HOLDINGS, INC. | ||||
| Date: December 14, 2018 | By: | /s/ Hajime Ikeda | ||
| Hajime Ikeda | ||||
| Senior Managing Director | ||||
Table of Contents
Exhibit 1
INTERIM OPERATING AND FINANCIAL REVIEW
Presentation of Financial and Other Information
As used in this Form 6-K, references to the “Company”, “Nomura”, “Nomura Group”, “we”, “us” and “our” are to Nomura Holdings, Inc. and, except as the context otherwise requires, its consolidated subsidiaries. As part of certain line items in Nomura’s financial statements and information included in this Form 6-K, references to “NHI” are to Nomura Holdings, Inc.
Unless otherwise stated, references in this Form 6-K to “yen” and “¥” are to the lawful currency of Japan and references to “U.S. dollars” and “$” are to the lawful currency of the United States of America (“U.S.”).
All ownership data with respect to us presented in this Form 6-K is presented based on the voting interest directly or indirectly held by us. Our voting interest is presented in accordance with Japanese reporting requirements, pursuant to which the amount presented with respect to each subsidiary is the percentage of voting rights of such subsidiary held directly by us or our subsidiaries. For example, wholly-owned subsidiaries of our subsidiaries are listed as 100%, regardless of the level of our direct interest in the intermediate subsidiaries.
Amounts shown within this Form 6-K have been rounded to the nearest indicated digit unless otherwise specified. In tables and graphs with rounded figures, sums may not add up due to rounding.
Except as otherwise indicated, all financial information with respect to us presented in this Form 6-K is presented on a consolidated basis. Our fiscal year ends on March 31 of each year. We prepare interim consolidated financial statements in accordance with U.S. generally accepted accounting principles (“U.S. GAAP”). Our interim consolidated financial statements, including the notes thereto, for the six months ended September 30, 2017 and 2018 are included elsewhere in this Form 6-K. The interim consolidated financial statements included in this Form 6-K have been reviewed in accordance with the standards of the Public Company Accounting Oversight Board (United States) by our independent auditors.
1
Table of Contents
Recent Developments in the Capital Adequacy Regulations. In December 2010, the Basel Committee on Banking Supervision (“Basel Committee”) issued the overall reform package on risk-based and leverage capital and liquidity from Basel II (“Basel III”) in order to promote a more resilient banking sector. The Basel Committee has been reviewing the Basel III package and has published various proposals. The Basel Committee has also finalized some of these proposals, and, in December 2017, the Basel Committee finalized additional reforms to Basel III. These reforms introduce an aggregate output floor comparing capital requirements under the Basel III standardized and internally modeled approaches, and they also revise the standards for credit risk, operational risk, the credit valuation adjustment framework and the leverage ratio. After the implementation of the Capital Adequacy Notice on Final Designated Parent Company, which was revised to be in line with Basel III, the Financial Services Agency of Japan (“FSA”) has been considering further revisions, taking into consideration the series of proposals published by the Basel Committee. In addition to Basel III, implementation of new regulations or strengthening of existing regulations have been determined or are under consideration by internal organizations such as the G-20, Financial Stability Board (“FSB”), International Organization of Securities Commissions (“IOSCO”) and Basel Committee, or governmental and self-regulatory organizations in Japan and in virtually all other jurisdictions in which we operate. The FSB and the Basel Committee at the Group of Twenty (“G-20”) summit in November 2011 identified global systemically important banks (“G-SIBs”) on which additional capital requirements will be imposed and they update the list of G-SIBs in November of each year. We have not been designated as a G-SIB in the past, and we were not designated as a G-SIB in November 2017. The Basel Committee published an updated assessment methodology and the higher loss absorbency requirement on G-SIBs, as well as disclosure requirements on G-SIBs evaluation indices, and such disclosure requirements were made effect by the FSA in March 2014. Also, the Basel Committee developed and published a set of principles on the assessment methodology and the higher loss absorbency requirement for domestic systemically important banks (“D-SIBs”), extending the framework for G-SIBs to D-SIBs. We have been designated as a D-SIB since December 2015 by the FSA.
Regulatory Developments in the U.S. and the U.K. Our overseas offices and subsidiaries are also subject to various laws, rules and regulations applicable in the countries where they conduct their operations, including, but not limited to those promulgated and enforced by the U.S. Securities and Exchange Commission (“SEC”), the Commodity Futures Trading Commission (“CFTC”), the U.S. Treasury, the Financial Stability Oversight Council, the New York Stock Exchange, the Financial Industry Regulatory Authority (“FINRA”) (a private organization with quasi-governmental authority and a regulator for all securities companies doing business in the U.S.), the National Futures Association (a self-regulatory organization for the U.S. derivatives industry) in the U.S.; and by the Prudential Regulation Authority (“U.K. PRA”), the Financial Conduct Authority (“U.K. FCA”), and the London Stock Exchange in the U.K. We are also subject to international money laundering and related regulations in various countries. For example, the USA PATRIOT Act of 2001 contains measures to prevent, detect and prosecute terrorism and international money laundering by imposing significant compliance and due diligence obligations and creating crimes and penalties. Failure to comply with such laws, rules or regulations could result in fines, suspension or expulsion, which could materially and adversely affect us.
In response to the financial markets crisis, governments and regulatory authorities in various jurisdictions have made and continue to make numerous proposals to reform the regulatory framework for, or impose a tax or levy upon, the financial services industry to enhance its resilience against future crises, contribute to the relevant economy generally or for other purposes. In July 2010, the U.S. enacted the Dodd-Frank Act, which is now the subject of a multi-agency rulemaking process. The rulemakings include the following: (i) create a tighter regulatory framework for OTC derivatives to promote transparency and impose conduct rules in that marketplace; (ii) establish a process for designating nonbank financial firms as Systemically Important Financial Institutions (“SIFIs”), subject to increased (and sometimes new) prudential oversight including early remediation, capital standards, resolution authority and new regulatory fees; (iii) prohibit material conflicts of interest between firms that package and sell asset-backed securities (“ABS”) and firms that invest in ABS; (iv) establish risk retention requirements for ABS; (v) establish rules related to the orderly liquidation of certain broker dealers; (vi) create annual stress tests; and (vii) set forth a number of executive compensation mandates, including rules to curtail incentive compensation that promotes excessive risk taking and listing standards for recovery of erroneously awarded compensation. The new regulatory framework for OTC derivatives includes mandates for clearing transactions with designated clearing organizations, exchange trading, new capital requirements, bilateral and variation margin for non-cleared derivatives, reporting and recordkeeping, and internal and external business conduct rules. Some U.S. derivatives and executive compensation rules may be applied extraterritorially and therefore impact some non-U.S. Nomura entities.
2
Table of Contents
Other aspects of the Dodd-Frank Act and related rulemakings include provisions that (i) prohibit deposit-taking banks and their affiliates from engaging in proprietary trading and limit their ability to make investments in hedge funds and private equity funds (the so-called “Volcker Rule”); (ii) empower regulators to liquidate failing nonbank financial companies that are systemically important; (iii) provide for new systemic risk oversight and increased capital requirements for both bank and non-bank SIFIs; (iv) provide for a broader regulatory oversight of hedge funds; and (v) establish new regulations regarding the role of credit rating agencies, investment advisors and others. The Economic Growth, Regulatory Relief, and Consumer Protection Act, which was enacted in May 2018, preserves the fundamental elements of the post-Dodd-Frank regulatory framework and, as to bank regulatory requirements, primarily focuses on revising certain aspects of the U.S. financial regulatory regime for small and medium-sized banking organizations. To facilitate the transition to the requirements of the Dodd-Frank Act, the Commodity Futures Trading Commission issued an exemptive order in July 2013 (“Exemptive Order”) that granted market participants temporary conditional relief from certain provisions of the Commodity Exchange Act, as amended by the Dodd-Frank Act. As the Exemptive Order expired on December 21, 2013 some U.S. derivatives rules are now being applied extraterritorially and are now therefore impacting some non-U.S. Nomura entities. The Dodd Frank Act requires the CFTC to promulgate regulations to establish factors with respect to the making of a determination to exempt from designation as a swap dealer an entity engaged in a de minimis quantity of swap dealing. On November 5, 2018, the CFTC adopted a final rule amending the de minimis exception within the swap dealer definition in the CFTC’s regulations by setting the aggregate gross notional amount threshold for the de minimis exception at $8 billion in swap dealing activity entered into by a person over the preceding twelve months. In addition, Title VII of the Dodd-Frank Act gives the SEC regulatory authority over “security-based swaps” which are defined under the act as swaps based on a single security or loan or a narrow-based group or index of securities. Security-based swaps are included within the definition of “security” under the U.S. Securities and Exchange Act of 1934 and the U.S. Securities Act of 1933. The SEC continues to issue final rules and interpretive guidance addressing cross-border security-based swap activities. On June 25, 2014, the SEC initially finalized a portion of its cross-border rules, namely key foundational definitions and registration calculations that will become operative once the SEC sets a timeframe for the security-based swap dealer registration process to begin. Since then, the SEC has issued a series of final rules that will apply certain Dodd-Frank Act requirements to security-based swaps between two non-U.S. person counterparties when the security-based swaps are arranged, negotiated or executed using personnel or personnel of agents located in the U.S. On February 10, 2016, the SEC issued final rules that require a non-U.S. person that uses personnel or personnel of agents located in the U.S. in connection with security-based swap dealing activity to include such security-based swaps in its security-based swap dealer registration de minimis calculation. On April 14, 2016, the SEC issued final rules that require a non-U.S. security-based swap dealer to comply with external business conduct standards rules when facing a non-U.S. person counterparty if the non-U.S. security-based swap dealer uses personnel or personnel of agents located in the U.S. to arrange, negotiate or execute the security-based swap. On July 14, 2016 the SEC issued final rules that subject a security-based swap between a non-U.S. security-based swap dealer and a non-U.S. person counterparty to public dissemination pursuant to SEC rules if the non-U.S. swap dealer uses personnel or personnel of agents located in the U.S. to arrange, negotiate or execute the security-based swap. On October 11, 2018, the SEC reopened the comment period on capital, margin and segregation requirements for security-based swap dealers and major security-based swap participants and capital requirements for broker-dealers. Once final and effective, these cross-border rules may impact some non-U.S. Nomura entities. The exact details of the Dodd-Frank Act implementation and ultimate impact on Nomura’s operations will depend on the form and substance of the final regulations adopted by various governmental agencies and oversight boards. In addition to the rulemakings required by the Dodd-Frank Act, the SEC is considering other rulemakings that will impact Nomura’s U.S. entities. While these rules have not been formally proposed, they have been publicly reported in the U.S. Office of Management and Budget’s (“OMB”) “Current Regulatory Plan and Unified Agenda of Regulatory and Deregulatory Actions.” The SEC’s Division of Trading and Markets is considering recommending that the SEC propose an amendment to its net capital rule that would prohibit a broker-dealer that carries customer accounts from having a ratio of total assets to regulatory capital in excess of a certain level. The SEC and the CFTC are also considering a number of changes to market structure rules. The SEC adopted Rule 613 to create a consolidated audit trail (“CAT”) intended to allow regulators to track all activity throughout the U.S. markets in National Markets Systems (“NMS”) securities. Self-regulatory organizations must jointly submit a NMS plan to create and implement the CAT, which will replace existing reporting systems OATS, TRACE and EBS. On June 15, 2016 the SEC approved amendments to FINRA Rule 4210, which require FINRA member broker-dealers to set risk limits on each counterparty transacting in specified forward-settling agency mortgage-backed securities (“covered agency transactions”) as of December 15, 2016, and to collect variation margin and/or maintenance margin from certain counterparties transacting in covered agency transactions as of June 25, 2018. A failure to collect required margin in a timely manner (T+1) results in an obligation for the FINRA member broker-dealer to take a capital charge, and ultimately (T+5) to liquidate the customer’s position in order to satisfy the margin deficiency. On April 20, 2018, FINRA filed a rule change with the SEC extending the effective date of the 4210 Margin requirements to March 25, 2019, citing the need to consider potential revisions to 4210 in consultation with market participants and other regulators.
3
Table of Contents
On February 3, 2017, U.S. President Donald J. Trump signed Executive Order 13772 outlining core principles to regulate the U.S. financial system. The order directed the Secretary of the Treasury to consult with heads of member agencies of the Financial Stability Oversight Council and report within 120 days of the date of the order (and periodically thereafter) on the extent to which existing laws, treaties, regulations, guidance, reporting and recordkeeping requirements and other government policies promote the core principles. U.S. regulatory agencies may change financial regulations through administrative procedures and rulemakings, supervisory guidance or no-action relief as the result of recommendations by the Treasury Secretary in accordance with the core principles of the executive order. These may have a material impact on Nomura’s business.
The core principles are as follows: (i) empower Americans to make independent financial decisions and informed choices in the marketplace, save for retirement, and build individual wealth; (ii) prevent taxpayer-funded bailouts; (iii) foster economic growth and vibrant financial markets through more rigorous regulatory impact analysis that addresses systemic risk and market failures, such as moral hazard and information asymmetry; (iv) enable American companies to be competitive with foreign firms in domestic and foreign markets; (v) advance American interests in international financial regulatory negotiations and meetings; (vi) make regulation efficient, effective, and appropriately tailored; and (vii) restore public accountability within Federal financial regulatory agencies and rationalize the Federal financial regulatory framework. The Treasury Department divided its review of the financial system into a series of reports. The reports cover the following subjects: (1) the depository system, covering banks, savings associations, and credit unions of all sizes, types and regulatory charters: (2) capital markets: covering debt, equity, commodities and derivatives markets, central clearing and other operational functions; (3) the asset management and insurance industries, and retail and institutional investment products and vehicles; and (4) non-bank financial institutions, financial technology and financial innovation. In addition, President Trump issued two Presidential Memoranda to the Secretary of the Treasury. One calls for a review of the Orderly Liquidation Authority (“OLA”) established under Title II of the Dodd-Frank Act, which the Treasury Department released in February 2018, recommending reforms to the OLA and amendments to the U.S. Bankruptcy Code to make a bankruptcy proceeding a more effective solution method for large financial institutions. The other calls for Treasury to review the process by which the Financial Stability Oversight Council determines that a nonbank financial company could pose a threat to the financial stability of the U.S., subjecting such an entity to supervision by the Federal Reserve and enhanced prudential standards and capital requirements.
On October 26, 2017, the Division of Investment Management and the Division of Trading and Markets of the SEC issued three related no-action letters to address certain issues raised by cross-border implementation of the European Union’s Markets in Financial Instruments Directive (“MiFID II”), which took effect on January 3, 2018. MiFID II will require the unbundling of execution and research payments made by investment managers to broker-dealers. Under the relief a broker-dealer may, without becoming subject to the Advisers Act, provide research services to an investment manager that is required, either directly or by contractual obligation, to pay for such research services with MiFID II-compliant research payments. The temporary relief will expire on July 3, 2020, 30 months from MiFID II’s implementation date.
The Foreign Account Tax Compliance Act (“FATCA”), which was enacted in 2010, requires foreign financial institutions (“FFIs”) to report to the U.S. Internal Revenue Service information about financial accounts held by U.S. taxpayers, or by foreign entities in which U.S. taxpayers hold a substantial ownership interest. As a result, Nomura is subject to certain reporting requirements consistent with a mutual agreement between Japanese governmental authorities and the U.S. Treasury Department.
In addition, the U.S. Treasury Department proposed new debt-equity rules in April 2016 that will give the Internal Revenue Service the authority to reclassify certain debt issued by a domestic corporation to related parties as equity for U.S. federal income tax purposes. This could reclassify deductible interest paid on debt from Nomura Holding America Inc. to NHI to non-deductible dividends.
On December 22, 2017, President Donald Trump signed the Tax Cuts and Jobs Act into law. Among other things, the legislation includes the Base Erosion and Anti-Abuse Tax (“BEAT”), effectively a minimum tax on large corporations applied by adding back to taxable income certain deductible payments made to related foreign persons. These tax law changes are complex and raise significant interpretive issues and therefore we anticipate future guidance on these rules to address the areas of uncertainty which could also have an adverse impact on the tax liabilities of our U.S. entities.
4
Table of Contents
On July 19, 2011, the Financial Stability Board published a consultative document to establish a global framework to improve authorities’ capacity to resolve failing SIFIs without systemic disruption and exposing taxpayers to the risk of loss. The proposed measures require Global SIFIs (“G-SIFIs”) to prepare and maintain recovery and resolution plans (“RRPs”) by December 2012. In light of such a global framework, the U.K. Financial Services Authority (“U.K. FSA”) (which has now been replaced by the U.K. PRA and FCA) published a consultation paper on August 9, 2011 containing its proposals for RRPs. The consultation paper covered a requirement for banks and large investment firms in the U.K. (including G-SIFIs) to prepare and maintain RRPs. In a separate discussion paper, the U.K. FSA explores matters relevant to resolving financial services firms, including the resolution of trading books, enhancing the resolution toolkit and bail-ins. In May 2012, the U.K. FSA published a feedback statement setting out its approach to ensure firms develop appropriate recovery plans and resolution packs and a further update was issued by the U.K. FSA in February 2013. In December 2013, the U.K. PRA published a policy statement setting out final rules which require banks, building societies and U.K. PRA-regulated investment firms to produce recovery plans (identification of options to recover financial strength in stress situations) and resolution packs (information to support resolution planning by the authorities).
These rules were amended in January 2015 as part of the U.K. implementation of the EU Bank Recovery and Resolution Directive (“BRRD”), which was published on June 12, 2014. The BRRD also aims to implement Financial Stability Board recommendations on recovery and resolution regimes for financial institutions and for U.K. purposes it will partially supersede the existing U.K. regime. The BRRD applies to banks and investment firms operating in EU member states, including EU branches and subsidiaries of third country firms. It includes requirements for the preparation of RRPs by institutions and regulators. It also creates various powers for EU regulators to intervene to resolve institutions at risk of failure, including the ability to sell or transfer all or part of an institution (similar to existing U.K. regulatory powers) and the introduction of a debt write down or bail-in tool. Amongst other things, relevant firms are required to include a contractual recognition of the bail-in clause in a wide range of non-EU law governed contracts governing liabilities created or materially amended after January 1, 2016 under which the creditor contractually recognizes and agrees that the liability may be subject to use of the bail-in tool. Specific provision is also made to facilitate cross-border crisis management and the recognition of third country recovery and resolution action in relation to third country banking and investment groups. As part of the bail-in rules, firms will be required to maintain capital resources sufficient to meet the stipulated minimum requirement for eligible liabilities (“MREL”). The MREL requirement overlaps with the global capital standards on total loss absorbing capacity (“TLAC”) for G-SIBs issued by the Financial Stability Board on November 9, 2015. The TLAC standard defines a minimum requirement for the instruments and liabilities that should be readily available for bail-in within resolution at G-SIBs, but does not limit authorities’ powers under the applicable resolution law to expose other liabilities to loss through bail-in or the application of other resolution tools. G-SIBs will be required to meet the TLAC requirement alongside the minimum regulatory requirements set out in the Basel III framework.
On August 18, 2016 the FSB published final guidance on resolution planning arrangements designed to support operational continuity in resolution (“FSB Guidance”) in order to assist authorities and firms subject to resolution planning requirements assess whether such firms have appropriate arrangements in place. On April 28, 2017, the U.K. PRA issued a policy statement to introduce rules implementing the FSB Guidance (“U.K. PRA Rules”). The U.K.PRA Rules will apply from January 1, 2019 to designated investment firms, certain U.K. banks and building societies. The U.K.PRA Rules largely reflect the FSB Guidance, but go beyond the FSB Guidance in some respects.
5
Table of Contents
There are a number of regulatory developments that impact capital requirements for U.K. regulated entities. Most significant of these is the Basel III framework, as adopted into EU law through the fourth Capital Requirements Directive and Capital Requirements Regulation (together, “CRD IV”), which became effective on January 1, 2014. The aim of CRD IV is to strengthen the resilience of the EU banking sector so it is better placed to absorb economic shocks while ensuring that banks continue to finance economic activity and growth. CRD IV sets out requirements for minimum capital requirements for banks and investment firms and also introduced new capital and liquidity buffers.
The framework also modifies treatment of financial institution exposures to central counterparties, resulting in increased capital charges, as well as qualifying conditions that must be met by central counterparties before institutions may benefit from preferential treatment. CRD IV introduces the concept of the leverage ratio and the net stable funding ratio (“NSFR”) and liquidity coverage ratio (“LCR”). The directive introduces corporate governance requirements with a more rigorous supervision of risks by directors as well as management or supervisory boards. The rules concern the composition of boards, their functioning and their role in risk oversight and strategy in order to improve the effectiveness of risk oversight by boards. The regulation requires financial institutions to make increased Pillar 3 disclosures about their corporate governance arrangements. CRD IV also sets out requirements in relation to remuneration policies imposing a 1:1 ratio on the basic salary relative to bonus for certain staff.
On November 23, 2016, the European Commission published the fifth Capital Requirements Directive (“CRD V”). CRD V is a legislative dossier implementing then-remaining parts of Basel III in the EU as well as addressing issues identified in the prudential requirements of CRD IV. The European Commission also introduced amendments to existing legislation in the form of the CRD V Capital Requirements Regulation (“CRR II”), Bank Recovery and Resolution Directive (“BRRD II”) and Single Resolution Mechanism Regulation (“SRMR”). As dossiers will need to pass through the EU legislative process, which usually takes about 18 months, the rules will enter into force in 2019 at the earliest.
On October 20, 2011, the European Commission published draft legislation for the Directive on markets in financial instruments repealing Directive 2004/39/EC of the European Parliament and of the Council. The legislation has been split into two parts: the Markets in Financial Instruments Directive (“MiFID”) and the Markets in Financial Instruments Regulation (“MiFIR”). On May 13, 2014, the Council of the European Union announced that it had adopted MiFID II (the revised MiFID) and MiFIR. MiFID II was published in the EU Official Journal on June 12, 2014 and entered into force on July 3, 2014. The majority of the new rules under MiFID II and MiFIR will take effect from January 3, 2018, with Member States required to implement MiFID II through national legislation by July 3, 2017. The legislation seeks to introduce wide-reaching changes to markets, including the extension of market transparency rules into non-equities and potentially reducing the size of the OTC derivative market by mandating the clearing of standardized OTC transactions through central clearing counterparties and their trading through regulated trading venues. The new framework introduces a market structure which seeks to close certain loopholes and ensures that trading, wherever appropriate, takes place on regulated platforms. It introduces rules on high frequency trading and aims to improve the transparency and oversight of financial markets. The revised MiFID also aims to strengthen the protection of investors by introducing more robust organizational and conduct requirements and by strengthening the role of management bodies. The new framework also increases the role and supervisory powers of regulators and establishes powers to prohibit or restrict the marketing and distribution of certain products in well-defined circumstances. A harmonized regime for granting firms from third countries access to EU professional markets, based on an equivalence assessment of third-country jurisdictions by the Commission, will also be introduced.
6
Table of Contents
Following a range of consultations and technical advice published by the European Securities and Markets Authority (“ESMA”), in April 2016 the European Commission adopted a MiFID Delegated Directive (“Directive”). The Directive contains provisions on investor protection, notably on safeguarding of clients. The Commission also adopted a delegated regulation supplementing MiFID II. This regulation aims at specifying, in particular, the rules relating to exemptions, the organizational requirements for investment firms, and conduct of business obligations in the provision of investment services. In May 2016, the Commission adopted a further delegated regulation supplementing MiFIR. This regulation aims at specifying, in particular, the rules relating to determining liquidity for equity instruments, the rules on the provision of market data on a reasonable commercial basis, the rules on publication, order execution and transparency obligations for systematic internalisers, and the rules on supervisory measures on product intervention by the ESMA, the European Banking Authority and national authorities, as well as on position management powers by the ESMA. The Commission also has adopted the majority of final technical standards. There is still ongoing work on the technical guidelines.
In the U.K., the U.K. FCA has also published various consultations on MiFID II, including a Discussion Paper in March 2015, which discussed the FCA’s approach to those areas of MiFID II for which the U.K. has discretion in relation to implementation. In March 2015, U.K. HM Treasury published a consultation on the Transposition of the MiFID II. The U.K. FCA published its first consultation paper on MiFID II implementation in December 2015. The paper focused on markets issues. The U.K. FCA published a second consultation in July 2016 on commodities, supervision and senior management issues and a third consultation in September 2016 on a range of business conduct issues including investment research and product governance. In December 2016, the U.K. FCA published a fourth consultation on specialist regimes, tied agents, market data and other miscellaneous changes to the FCA Handbook. In March 2017, the first of two policy statements was published, setting out the U.K. FCA’s near-final rules on most of the topics which were addressed in the first and second consultation papers. In February 2017, U.K. HM Treasury published responses to the feedback they received on their March 2015 paper. In July 2017, the U.K. FCA published the second policy statement, setting out the final rules on conduct issues, including research, inducements, client categorization, best execution, the appropriateness test, taping, client assets and perimeter guidance.
The European Market Infrastructure Regulation (“EMIR”) became effective on August 16, 2012, and applies to any entity established in the European Union that is a legal counterparty to a derivative contract, even when trading with non-EU firms. Although the majority of EMIR regulations have already been implemented, there were several important developments during the course of 2016 and 2017. On June 6, 2016, The ESMA and the CFTC established a memorandum of understanding (“MoU”) under EMIR which established the cooperation agreements regarding central clearing counterparties (“CCPs”) that are established in the U.S. and authorized or recognized by the CFTC and which have applied for EU recognition under EMIR.
On June 14, 2016, the ESMA updated its list of recognized third-country CCPs to include the Chicago Mercantile Exchange Inc. (“CME”), and in September 2016 the ESMA updated its list to also include ICE Clear Europe.
On July 1, 2016, the European Commission published an Implementing Decision in the EU Official Journal which granted equivalence to certain designated contract markets (“DCMs”) in the U.S. that operate under the regulatory oversight of the CFTC. The decision came into force on July 22, 2016. This equivalence decision was particularly relevant to EMIR, as products traded on equivalent third-country markets (in this case DCMs subject to CFTC regulatory oversight) no longer fall under the definition of an OTC derivative and are therefore no longer subject to the EMIR obligations relevant to OTC derivatives (such as inclusion within the calculation of the clearing threshold for non-financial counterparties). In February 2017, the U.K. FCA made a statement that it expected all firms to be in compliance with the variation margin requirements under EMIR for all in-scope transactions entered into from March 1, 2017.
7
Table of Contents
On January 12, 2016, the Securities Financing Transactions Regulation (“SFTR”), which forms part of the EU’s package of legislation targeted at reforming shadow banking and aims to improve transparency in the securities financing transactions (“SFTs”) market, came into force subject to a range of transitional provisions over a number of years. On March 31, 2017, the ESMA published their final technical standards under SFTR to the European Commission which has three months to decide whether to endorse them.
On July 3, 2016, the EU Market Abuse Regulation (“MAR”) came into force in all EU member states. The new rules on market abuse update and strengthen the existing framework to ensure greater market integrity and investor protection, replacing the existing Market Abuse Directive. The MAR strengthens the existing U.K. market abuse framework by extending its scope to new markets, new platforms and new behaviors. It contains prohibitions of insider dealing and market manipulation, as well as provisions designed to prevent and detect these behaviors, including the obligation to report suspicious orders and transactions. The MAR also introduced Investment Recommendations as a type of client communication requiring disclosures and tracking akin to investment research.
In June 2015, the European Parliament and Council to the EU members issued the final version of the Fourth Money Laundering Directive (“4MLD”). All EU member states, including the U.K., have two years in which to transpose the requirements of the directive into national law which will, where necessary, amend or replace the existing regulations or legislation. In February 2016, the EU Commission, in an effort to bolster the fight against terrorist financing, proposed amendment to the 4MLD that would enable the tracing of terrorists through financial movements and disrupt the sources of revenue for terrorist organizations by targeting their capacity to raise funds. These proposed amendments must still be agreed upon among all 28 Member States, but were included in a final version of the 4MLD issued by the EU Parliament in July 2016. In September 2017, additional legislation was implemented in the U.K. designed to combat financial crime including the Criminal Finances Act. The Act functions as an enhancement and extension of the Proceeds of Crime Act 2002 and, in addition to increasing the powers of authorities in investigating tax evasion, is also designed to make failure by a commercial organization to prevent the facilitation of tax evasion a punishable offence.
The Fifth Anti-Money Laundering Directive (5MLD), came into force on 26 April, 2018 and must be implemented by Member States by 10 January, 2020. The changes will impose additional obligations in the financial services sector. 5MLD amends 4MLD, and includes provisions that enhance the required level of transparency around beneficial ownership of corporates and trusts, tightens some controls relating to Politically-Exposed Persons and high risk third countries and also addresses risks associated with certain technological innovation, particularly virtual currencies.
The Alternative Investment Fund Managers Directive (“AIFMD”) became effective on July 21, 2011. The AIFMD was required to be implemented by Member States by July 22, 2013 (subject to a one-year transitional period). The AIFMD and its related implementing legislation establish a detailed framework for the management and marketing of alternative investment funds (or “AIFs”) within the EEA. As the concept of an “AIF” is broadly defined, the AIFMD captures the majority of non-UCITs funds, including hedge funds, private equity, debt and real estate funds.
Under the AIFMD regime, fund managers operating within the EEA are subject to extensive organizational requirements, including mandatory authorization by an EEA regulator, substantial ongoing compliance, conduct of business and disclosure requirements and the obligation to appoint an independent depositary with responsibility for an AIFMD organizational requirements, including mandatory authorization by an EEA regulator, substantial ongoing pose. Additional restrictions and disclosure obligations apply to managers of private equity firms which acquire material holdings in EEA companies. Non-EEA fund managers seeking to target EEA investors are also subject, at a minimum, to a sub-set of the compliance requirements for EEA managers, focusing mainly on disclosure. It is open to each Member State to introduce additional restrictions for third-country managers and some jurisdictions remain very restrictive in this respect. The possibility of a passporting regime for third-country managers is, however, provided for in the AIFMD and is still under consideration at the EU level, following positive feedback from the ESMA on a number of jurisdictions such as Canada, Guernsey, Japan, Jersey and Switzerland (further legislation would be required to introduce such a third-country passport). The AIFMD has material impact for Nomura insofar as certain group entities manage and/or market investment funds within the EEA (which attracts an enhanced compliance burden). Nomura also acts as depositary or “depo lite” to AIFs and is accordingly subject to separate compliance requirements and liability provisions in this capacity.
8
Table of Contents
On March 7, 2017, the Senior Managers and Certification Regime (“SMCR”) reached its one-year implementation anniversary and additional rules regarding regulatory references and broadening the application of conduct rules to all staff also came into force on the same day. On May 12, 2017, the U.K. PRA and U.K. FCA announced the final amendments to the SMCR which came into force on July 3, 2017. Amongst the key changes announced was a new power for U.K Regulators (the U.K. FCA and the U.K. PRA) to apply individual rules of conduct to all non-executive directors, irrespective of whether they perform a senior manager role or another controlled function, and clarification that this rule applies to a director (whether executive or non-executive) when they are acting as a member of the board, of the board of another controlled function. In addition, a further rule, the ‘Duty of Responsibility’ for senior managers, came into force on May 3, 2017. Under this ‘Duty of Responsibility’, the U.K. FCA and U.K. PRA will now be able to take enforcement action against senior managers if they are responsible for the management of any activities within their firm where their firm contravenes a regulatory requirement and the senior managers do not take ‘reasonably expected steps’ to avoid such a contravention from ‘occurring or continuing’. The Regime is currently being extended to cover all financial services firms in the U.K.
Over the past two to three years, the U.K. FCA has worked towards introducing a number of changes to the U.K. regulatory regime for the protection of client assets (“CASS”). These requirements are relevant to Nomura’s U.K. entities that hold client money and other assets on behalf of their clients (other than in the course of deposit-taking activity). The reforms made to the CASS regime have been driven in large part by concerns of the U.K. FCA regarding the shortcomings of the previous rules that were highlighted in the U.K. case law surrounding the collapse of Lehman Brothers International (Europe). The U.K. FCA commenced its review of the CASS regime in 2012 and published final rules in 2014, the last of which came into force on June 1, 2015. The reforms aim to improve the speed and efficiency with which client assets may be distributed following the insolvency of the holding firm and to minimize negative market impact. This has resulted in extensive changes to the rules, designed to strengthen the legal and operational requirements of holding firms for effective segregation of client money and to enhance controls over institutions with which client money is deposited and third parties to whom client money is transferred. The conditions attached to exclusions from the client money rules have also been clarified and enhanced. In addition, various changes have also been made to the rules to give effect to EMIR requirements regarding client money held in the course of derivatives clearing activity. The net effect of these various changes is generally to increase the operational and compliance burden on firms that hold client money and assets.
On July 29, 2016, the U.K. FCA released Consultation Paper 16/19: Markets in Financial Instruments Directive II Implementation (“CP 16/19”). CP16/19 provides for incremental changes to CASS. Many of the changes introduced by MiFID II are already part of the U.K. FCA rules. Although CASS will implement MiFID II using language closely mirroring that of MiFID II, such language will be adapted where appropriate to conform with U.K. law and practice. On November 9, 2015, the Financial Reporting Council published its Standard for audit firms on Providing Assurance on Client Assets to the U.K. FCA. The Reasonable Assurance Standard was implemented on January 1, 2016, and has helped to ensure that the strengthened CASS regime is underpinned by sound assurances.
Since 2012, the European Commission has been working on the EU Data Protection Reform to establish a modern and harmonized data protection framework across the EU to replace the existing Directive. On May 4, 2016, the official texts of the new Regulation were published in the EU Official Journal in all the official languages and it came into force on May 25, 2016. The Regulation took effect across the EU member states on May 25, 2018. The Regulation includes a number of important changes to existing data protection legislation including new obligations on data processors, restrictions on the transfer of personal data outside the EEA and the introduction of new concepts such as “accountability” (and related record-keeping), the “right to be forgotten” and a requirement for data breach notifications to the relevant Regulators. Enforcement of the Regulation will be carried out by both national regulators (for the U.K., the Information Commissioner) and the Commission, and the regulators will also now have the new power to impose greater fines for any breaches of the data protection requirements of up to 4% of a firm’s global turnover.
9
Table of Contents
The EU Benchmark Regulation entered into force on June 30, 2016 and has applied in the U.K. since January 1, 2018. Global regulators have imposed fines on firms following attempted manipulation of the LIBOR, gold and foreign exchange benchmarks, and have taken action against individuals for misconduct related to benchmarks. The objectives of the EU Benchmark Regulation include, but are not limited: (i) improving governance and controls over the benchmarking process to ensure that administrators avoid/manage conflicts of interest, (ii) improving the quality of input data and methodologies used by benchmark administrators, (iii) ensuring that contributors to benchmarks and the data they provide are subject to adequate controls, and (iv) protecting consumers and investors through greater transparency and adequate rights of redress.
In the U.K. as a follow up to the Fair and Effective Markets Review (established by the Chancellor of the Exchequer), the Fixed Income, Currencies and Commodities (“FICC”) Markets Standards Board (“FMSB”) was established in 2015 as a private sector response to the conduct problems revealed in global wholesale FICC markets after the financial crisis. The function of the FMSB is to help raise standards of conduct in global wholesale markets by producing voluntary Standards and other guidance in areas of uncertainty that are developed by the membership and designed to illustrate best practices to all market participants. These Standards are intended to reduce the continuing uncertainty about acceptable practices in opaque and unregulated areas, which is a hazard for FMSB members, as well as other market participants. The Standards published to date cover the new issue process, binary options for the commodities markets and reference price transactions for the fixed income markets. The published Standards do not have legal or regulatory force and do not replace existing legislation; rather, they are intended to supplement the rules already in place. The Standards are implemented by way of FMSB member firms making an adherence statement on an annual basis.
The U.K. is due to formally leave the European Union at the end of March 2019 following the Brexit referendum held in June 2016 and triggering of Article 50 of the Treaty on the Functioning of the European Union to start the formal exit process on March 29, 2017. In the meantime, the U.K. remains a full member of the EU, although its influence over rule-making is significantly reduced. In negotiating the terms of withdrawal, the UK and EU have agreed in principle draft plans for withdrawal, with proposed underpinnings of a future relationship and a “transition period” that would see the U.K. continue to be an EU member on current terms, without input into the rule-making process, until December 2020. The U.K. government must obtain UK parliamentary approval for this plan ahead of progressing any further negotiations with EU member states.
Regulatory authorities and legislators (both in the UK and EU) continue to make preparations for the possibility that agreement cannot be reached and the UK ends up leaving the EU in March 2019 without having reached final agreement with the EU on the terms of its withdrawal. UK regulatory consultations will continue into early 2019 on the necessary plans to mitigate damage to the financial system resulting from an abrupt exit in March 2019. The U.K. Government has proposed domestic legislation, the EU (Withdrawal) Bill, to repeal the European Communities Act 1972 that gives primacy to aspects of EU law and transposes current EU-derived law into U.K. legislation to provide continuity. The U.K. financial services sector currently relies on access to the EU single market to conduct business across borders within the EU. Both sides have emphasized the need for continued good access, but the terms of the future relationship still depend on the outcome of political dialogue.
On May 25, 2018, Nomura Financial Products Europe GmbH, a Nomura subsidiary domiciled in Germany, was granted a securities trading license by the German regulator (“BaFin”). Nomura’s plans are well advanced and the license represents a major step towards ensuring that all current client and counterparty relationships, and access to Nomura products and services, will continue without disruption after the U.K. leaves the EU.
10
Table of Contents
Set forth below are material changes from the risks as previously disclosed in Part I, Item 3.D “Risk Factors” of our annual report on Form 20-F for the year ended March 31, 2018. The following is to amend and update only the corresponding language of the disclosure in Part I, Item 3.D of such annual report.
You should read the following in conjunction with the risks factors otherwise disclosed in such annual report, including additional paragraphs from the relevant risk factors that we have not repeated below.
Our business is subject to substantial legal, regulatory and reputational risks
Extensive regulation of our businesses limits our activities and may subject us to significant penalties and losses
The financial services industry is subject to extensive regulation. We are subject to increasing regulation by governmental and self-regulatory organizations in Japan and in virtually all other jurisdictions in which we operate, and such governmental and regulatory scrutiny may increase as our operations expand or as laws change. In addition, while regulatory complexities increase, possibilities of extra-territorial application of a regulation in one jurisdiction to business activities outside of such jurisdiction may also increase. These regulations are broadly designed to ensure the stability of financial systems and the integrity of the financial markets and financial institutions, and to protect clients and other third parties who deal with us, and often limit our activities and/or affect our profitability, through net capital, client protection and market conduct requirements. In addition, on top of traditional finance-related legislation, the scope of laws and regulations applying to, and/or impacting on, our operations may become wider depending on the situation of the wider international political and economic environment or policy approaches taken by governmental authorities in respect of regulatory application or law enforcement. In particular, the number of investigations and proceedings against the financial services industry by governmental and self-regulatory organizations has increased substantially and the consequences of such investigations and proceedings have become more severe in recent years, and we are subject to face the risk of such investigations and proceedings. For example, the U.S. Department of Justice (the “DOJ”) conducted an investigation regarding residential mortgage-backed securities securitized by some of our U.S. subsidiaries prior to 2009. On October 15, 2018, the U.S. subsidiaries settled the investigation with the DOJ and agreed to pay USD 480 million. Although we have policies in place to prevent violations of such laws and regulations, we may not always be able to prevent violations, and we could be fined, prohibited from engaging in some of our business activities, ordered to improve our internal governance procedures or be subject to revocation of our license to conduct business. Our reputation could also suffer from the adverse publicity that any administrative or judicial sanction against us may create, which may negatively affect our business opportunities and ability to secure human resources. As a result of any such sanction, we may lose business opportunities for a period of time, even after the sanction is lifted, if and to the extent that our clients, especially public institutions, decide not to engage us for their financial transactions. In addition, certain market participants may refrain from investing in or entering into transactions with us if we engage in business activities in regions subject to international sanctions, even if our activities do not constitute violations of sanctions laws and regulations.
11
Table of Contents
Special Note Regarding Forward-Looking Statements
This report contains forward-looking statements that are based on our current expectations, assumptions, estimates and projections about our business, our industry and capital markets around the world. These forward-looking statements are subject to various risks and uncertainties. Generally, these forward-looking statements can be identified by the use of forward-looking terminology such as “may”, “will”, “expect”, “anticipate”, “estimate”, “plan” or similar words. These statements discuss future expectations, identify strategies, contain projections of our results of operations or financial condition, or state other forward-looking information.
Known and unknown risks, uncertainties and other factors may cause our actual results, performance, achievements or financial position to differ materially from any future results, performance, achievements or financial position expressed or implied by any forward-looking statements contained in this report. Such risks, uncertainties and other factors are set forth in “Risk Factors” above and in Item 3. D of our annual report on Form 20-F for the fiscal year ended March 31, 2018, as well as elsewhere in this Form 6-K.
12
Table of Contents
Operating and Financial Review and Prospects
Results of Operations—Six Months Ended September 30, 2017 and 2018
The interim consolidated financial statements included in this Form 6-K have not been audited but have been reviewed in accordance with the standards of the Public Company Accounting Oversight Board (United States) by our independent auditors. The unaudited interim consolidated financial statements are prepared on a basis substantially consistent with the audited consolidated financial statements included in our Form 20-F for the fiscal year ended March 31, 2018 filed on June 25, 2018.
Overview
The following table provides selected consolidated statements of income information for the six months ended September 30, 2017 and 2018.
| Millions of yen except percentages |
||||||||
| Six months ended September 30 | ||||||||
| 2017 | 2018 | |||||||
| Non-interest revenues: |
||||||||
| Commissions |
¥ | 176,292 | ¥ | 154,239 | ||||
| Fees from investment banking |
49,790 | 43,078 | ||||||
| Asset management and portfolio service fees |
119,555 | 125,721 | ||||||
| Net gain on trading |
208,858 | 147,639 | ||||||
| Gain (loss) on private equity investments |
29 | 874 | ||||||
| Gain (loss) on investments in equity securities |
3,122 | 988 | ||||||
| Other |
96,665 | 48,534 | ||||||
|
|
|
|
|
|||||
| Total non-interest revenues |
654,311 | 521,073 | ||||||
| Net interest revenue |
58,005 | 33,846 | ||||||
|
|
|
|
|
|||||
| Net revenue |
712,316 | 554,919 | ||||||
| Non-interest expenses |
551,834 | 540,809 | ||||||
|
|
|
|
|
|||||
| Income before income taxes |
160,482 | 14,110 | ||||||
| Income tax expense |
48,828 | 16,633 | ||||||
|
|
|
|
|
|||||
| Net income (loss) |
111,654 | (2,523 | ) | |||||
|
|
|
|
|
|||||
| Less: Net income attributable to noncontrolling interests |
2,948 | 3,487 | ||||||
|
|
|
|
|
|||||
| Net income (loss) attributable to NHI shareholders |
¥ | 108,706 | ¥ | (6,010 | ) | |||
|
|
|
|
|
|||||
| Return on shareholders’ equity (annualized)(1) |
7.7 | % | (0.4 | %) | ||||
| (1) | Calculated as Net income attributable to NHI shareholders divided by average Total NHI shareholders’ equity multiplied by two. |
Net revenue decreased by 22.1% from ¥712,316 million for the six months ended September 30, 2017 to ¥554,919 million for the six months ended September 30, 2018. Commissions decreased by 12.5%, primarily due to a decrease in commissions received in Japan due to deterioration of retail investors’ sentiment. Asset management and portfolio service fees increased by 5.2%, primarily due to an increase of assets under management driven by market factors. Net gain on trading decreased by 29.3%, primarily due to uncertain markets and turmoil in emerging markets which led to a tough environment for the trading business. Other revenue decreased by 49.8%, primarily due to the deconsolidation of Asahi Fire and Marine Insurance Co., Ltd. and the impact of gain and loss related to American Century Investments.
Net interest revenue was ¥58,005 million for the six months ended September 30, 2017 and ¥33,846 million for the six months ended September 30, 2018. Net interest revenue is a function of the level and the mix of total assets and liabilities, which includes trading assets and financing and lending transactions, and the level, term structure and volatility of interest rates. Net interest revenue is an integral component of our trading business. In assessing the profitability of our overall business and of our Wholesale operation in particular, we view Net interest revenue and Non-interest revenues in aggregate.
Non-interest expenses decreased by 2.0% from ¥551,834 million for the six months ended September 30, 2017 to ¥540,809 million for the six months ended September 30, 2018, which results from an increase in litigation costs and a decrease in Commissions and floor brokerage and Information processing and communications.
13
Table of Contents
We are subject to a number of different taxes in Japan and have adopted the consolidated tax filing system permitted under Japanese tax law. The consolidated tax filing system only imposes a national tax. Our foreign subsidiaries are subject to the income taxes of the countries in which they operate, which are generally lower than those in Japan. The Company’s effective statutory tax rate in any one year is therefore dependent on our geographic mix of profits and losses and also on the specific tax treatment applicable in each location.
For the six months ended September 30, 2017, the difference between the effective statutory tax rate of 31% and the effectivetax rate of 30.4% was mainly due to non-taxable revenue whereas non-deductible expenses increased the effective tax rate.
For the six months ended September 30, 2018, the difference between the effective statutory tax rate of 31% and the effectivetax rate of 117.9% was mainly due to non-deductible expenses whereas non-taxable revenue decreased the effective tax rate.
Net income attributable to NHI shareholders was ¥108,706 million for the six months ended September 30, 2017 and net loss attributable to NHI shareholders was ¥6,010 million for the six months ended September 30, 2018. Our annualized return on shareholder’s equity was 7.7% for the six months ended September 30, 2017 and negative 0.4% for the six months ended September 30, 2018.
Retail
In our Retail Division, our sales activities focus on providing consultation services and investment proposals to clients for which we receive commissions and fees. Additionally, we receive fees from asset management companies in connection with administration services we provide in connection with investment trust certificates that we distribute. We also receive agent commissions from insurance companies for the insurance products we sell as an agent.
| Millions of yen | ||||||||
| Six months ended September 30 | ||||||||
| 2017 | 2018 | |||||||
| Non-interest revenues |
¥ | 200,633 | ¥ | 174,522 | ||||
| Net interest revenue |
2,837 | 4,021 | ||||||
|
|
|
|
|
|||||
| Net revenue |
203,470 | 178,543 | ||||||
| Non-interest expenses |
153,031 | 146,403 | ||||||
|
|
|
|
|
|||||
| Income before income taxes |
¥ | 50,439 | ¥ | 32,140 | ||||
|
|
|
|
|
|||||
14
Table of Contents
Net revenue decreased by 12.3% from ¥203,470 million for the six months ended September 30, 2017 to ¥178,543 million for the six months ended September 30, 2018.
Non-interest expenses decreased by 4.3% from ¥153,031 million for the six months ended September 30, 2017 to ¥146,403 million for the six months ended September 30, 2018.
Income before income taxes decreased by 36.3% from ¥50,439 million for the six months ended September 30, 2017 to ¥32,140 million for the six months ended September 30, 2018.
The following table presents a breakdown of Retail non-interest revenues for the six months ended September 30, 2017 and 2018.
| Millions of yen | ||||||||
| Six months ended September 30 | ||||||||
| 2017 | 2018 | |||||||
| Commissions |
¥ | 91,037 | ¥ | 77,605 | ||||
| Brokerage commissions |
35,151 | 32,115 | ||||||
| Commissions for distribution of investment trusts |
44,982 | 34,131 | ||||||
| Other commissions |
10,904 | 11,359 | ||||||
| Net gain on trading |
50,203 | 34,405 | ||||||
| Fees from investment banking |
13,263 | 12,983 | ||||||
| Asset management fees |
45,377 | 48,370 | ||||||
| Others |
753 | 1,159 | ||||||
|
|
|
|
|
|||||
| Non-interest revenues |
¥ | 200,633 | ¥ | 174,522 | ||||
|
|
|
|
|
|||||
As shown above, Commissions decreased by 14.8% from ¥91,037 million for the six months ended September 30, 2017 to ¥77,605 million for the six months ended September 30, 2018, primarily due to deterioration of retail investors’ sentiment. Net gain on trading decreased by 31.5% from ¥50,203 million for the six months ended September 30, 2017 to ¥34,405 million for the six months ended September 30, 2018, primarily due to small transactions for the six months ended September 30, 2018. Fees from investment banking decreased by 2.1% from ¥13,263 million for the six months ended September 30, 2017 to ¥12,983 million for the six months ended September 30, 2018. Asset management fees increased by 6.6% from ¥45,377 million for the six months ended September 30, 2017 to ¥48,370 million for the six months ended September 30, 2018, primarily due to an increase in revenue from investment trusts and discretionary investments attributable to the increase of clients’ asset balances. Others increased by 53.9% from ¥753 million for the six months ended September 30, 2017 to ¥1,159 million for the six months ended September 30, 2018.
15
Table of Contents
Retail Client Assets
The following table presents the amounts and details of Retail client assets as of March 31, 2018 and September 30, 2018. Retail client assets consist of clients’ assets held in our custody and assets relating to variable annuity insurance products.
| Trillions of yen | ||||||||||||||||||||
| From March 31, 2018 to September 30, 2018 | ||||||||||||||||||||
| Balance at March 31, 2018 |
Gross inflows | Gross outflows | Market appreciation / (depreciation) |
Balance
at September 30, 2018 |
||||||||||||||||
| Equities |
¥ | 75.7 | ¥ | 6.4 | ¥ | (6.9 | ) | ¥ | 4.6 | ¥ | 79.8 | |||||||||
| Bonds |
17.9 | 14.0 | (12.6 | ) | (1.0 | ) | 18.3 | |||||||||||||
| Stock investment trusts |
9.1 | 1.6 | (1.5 | ) | (0.0 | ) | 9.2 | |||||||||||||
| Bond investment trusts |
7.1 | 0.3 | (0.2 | ) | (0.1 | ) | 7.1 | |||||||||||||
| Overseas mutual funds |
1.2 | — | (0.1 | ) | 0.1 | 1.2 | ||||||||||||||
| Others |
6.7 | 0.7 | (0.3 | ) | 0.1 | 7.2 | ||||||||||||||
|
|
|
|
|
|
|
|
|
|
|
|||||||||||
| Total |
¥ | 117.7 | ¥ | 23.0 | ¥ | (21.6 | ) | ¥ | 3.7 | ¥ | 122.8 | |||||||||
|
|
|
|
|
|
|
|
|
|
|
|||||||||||
Retail client assets increased by ¥ 5.1 trillion from ¥117.7 trillion as of March 31, 2018 to ¥122.8 trillion as of September 30, 2018. The balances of our clients’ equity and equity-related products increased by ¥ 4.1 trillion from ¥75.7 trillion as of March 31, 2018 to ¥79.8 trillion as of September 30, 2018, mainly due to market appreciation. The balances of our clients’ investment trusts and mutual funds increased by ¥ 0.1 trillion from ¥17.4 trillion as of March 31, 2018 to ¥17.5 trillion as of September 30, 2018.
Asset Management
Our Asset Management Division is conducted principally through Nomura Asset Management Co., Ltd. (“NAM”). We earn portfolio management fees through the development and management of investment trusts, which are distributed through Nomura Securities Co., Ltd. (“NSC”), other brokers, banks, Japan Post Bank Co., Ltd. and Japan Post Network Co., Ltd. We also provide investment advisory services for pension funds and other institutional clients. Net revenues generally consist of asset management and portfolio service fees that are attributable to Asset Management, and includes the impact related to American Century Investments.
| Millions of yen | ||||||||
| Six months ended September 30 | ||||||||
| 2017 | 2018 | |||||||
| Non-interest revenues |
¥ | 64,749 | ¥ | 52,302 | ||||
| Net interest revenue |
(1,234 | ) | (1,532 | ) | ||||
|
|
|
|
|
|||||
| Net revenue |
63,515 | 50,770 | ||||||
| Non-interest expenses |
29,477 | 31,574 | ||||||
|
|
|
|
|
|||||
| Income before income taxes |
¥ | 34,038 | ¥ | 19,196 | ||||
|
|
|
|
|
|||||
16
Table of Contents
Net revenue decreased by 20.1% from ¥63,515 million for the six months ended September 30, 2017 to ¥50,770 million for the six months ended September 30, 2018.
Non-interest expenses increased by 7.1% from ¥29,477 million for the six months ended September 30, 2017 to ¥31,574 million for the six months ended September 30, 2018.
Income before income taxes decreased by 43.6% from ¥34,038 million for the six months ended September 30, 2017 to ¥19,196 million for the six months ended September 30, 2018.
The following table presents assets under management of each principal Nomura entity within Asset Management Division as of March 31, 2018 and September 30, 2018.
| Billions of yen | ||||||||||||||||||||||||
| From March 31, 2018 to September 30, 2018 | ||||||||||||||||||||||||
| Balance at March 31, 2018 |
Adjustment of beginning balance(1) |
Gross inflows | Gross outflows | Market appreciation / (depreciation) |
Balance at September 30, 2018 |
|||||||||||||||||||
| Nomura Asset Management Co., Ltd. |
¥ | 52,381 | ¥ | — | ¥ | 12,167 | ¥ | (12,092 | ) | ¥ | 2,607 | ¥ | 55,063 | |||||||||||
| Nomura Funds Research and Technologies Co., Ltd. |
2,765 | (2,765 | ) | — | — | — | — | |||||||||||||||||
| Nomura Corporate Research and Asset Management Inc. |
2,684 | — | 393 | (330 | ) | 197 | 2,944 | |||||||||||||||||
|
|
|
|
|
|
|
|
|
|
|
|
|
|||||||||||||
| Combined total |
57,830 | (2,765 | ) | 12,560 | (12,422 | ) | 2,804 | 58,007 | ||||||||||||||||
| Shared across group companies |
(7,815 | ) | 2,649 | (541 | ) | 913 | (369 | ) | (5,163 | ) | ||||||||||||||
|
|
|
|
|
|
|
|
|
|
|
|
|
|||||||||||||
| Total |
¥ | 50,015 | ¥ | (116 | ) | ¥ | 12,019 | ¥ | (11,509 | ) | ¥ | 2,435 | ¥ | 52,844 | ||||||||||
|
|
|
|
|
|
|
|
|
|
|
|
|
|||||||||||||
| (1) | Nomura Funds Research and Technologies Co., Ltd. was reclassified to Other segment as a result of our organizational structure change in April 2018. |
Assets under management increased by 5.7% from ¥50.0 trillion as of March 31, 2018 to ¥52.8 trillion as of September 30, 2018, primarily due to inflows to our investment trust and investment advisory businesses and increases in the market value of assets.
Domestic publicly offered investment trust assets included in the assets under management by NAM were ¥31.8 trillion as of September 30, 2018, ¥4.0 trillion or 14.5% increase from September 30, 2017.
The following table shows NAM’s share, in terms of net asset value, in the Japanese asset management market as of September 30, 2017 and 2018.
| September 30 | ||||||||
| 2017 | 2018 | |||||||
| Total of publicly offered investment trusts |
26 | % | 27 | % | ||||
| Stock investment trusts |
24 | % | 25 | % | ||||
| Bond investment trusts |
42 | % | 44 | % | ||||
17
Table of Contents
Wholesale
In Wholesale, we are engaged in the sales and trading of debt securities and equity securities and currencies on a global basis to various institutions, providing investment banking services such as the underwriting of bonds and equities as well as mergers and acquisitions and financial advice and investing in private equity businesses with the goal of maximizing returns on these investments by increasing the corporate value of investee companies.
| Millions of yen | ||||||||
| Six months ended September 30 | ||||||||
| 2017 | 2018 | |||||||
| Non-interest revenues |
¥ | 270,461 | ¥ | 236,662 | ||||
| Net interest revenue |
67,818 | 48,288 | ||||||
|
|
|
|
|
|||||
| Net revenue |
338,279 | 284,950 | ||||||
| Non-interest expenses |
295,943 | 287,459 | ||||||
|
|
|
|
|
|||||
| Income before income taxes |
¥ | 42,336 | ¥ | (2,509 | ) | |||
|
|
|
|
|
|||||
Net revenue decreased by 15.8% from ¥338,279 million for the six months ended September 30, 2017 to ¥284,950 million for the six months ended September 30, 2018.
Non-interest expenses decreased by 2.9% from ¥295,943 million for the six months ended September 30, 2017 to ¥287,459 million for the six months ended September 30, 2018.
Loss before income taxes was ¥2,509 million for the six months ended September 30, 2018.
The following table presents a breakdown of net revenue for Wholesale for the six months ended September 30, 2017 and 2018.
| Millions of yen | ||||||||
| Six months ended September 30 | ||||||||
| 2017 | 2018 | |||||||
| Global Markets |
¥ | 285,590 | ¥ | 235,976 | ||||
| Investment Banking |
52,689 | 48,974 | ||||||
|
|
|
|
|
|||||
| Net revenue |
¥ | 338,279 | ¥ | 284,950 | ||||
|
|
|
|
|
|||||
Global Markets net revenue was ¥236.0 billion. Fixed Income net revenue decreased from ¥169.2 billion in the previous year to ¥127.2 billion because of uncertain markets and turmoil in emerging markets which led to a tough environment for the trading business. Equities net revenue decreased from ¥116.4 billion in the previous year to ¥108.7 billion due to a decrease in trading volume in the cash markets. Investment banking net revenue was ¥49.0 billion.
Nomura established Client Financing and Solutions (“CFS”) in April, 2018. In CFS, Global Markets and Investment Banking co-work and revenue generated from CFS is allocated to Global Markets and Investment Banking in a certain manner. Accordingly, we reclassified a part of net revenue which previously belonged to Global Markets to Investment Banking.
18
Table of Contents
Other Operating Results
Other operating results include net gain (loss) related to economic hedging transactions, realized gain (loss) on investments in equity securities held for operating purposes, equity in earnings of affiliates, corporate items, and other financial adjustments. See Note 16 “Segment and geographic information” in our interim consolidated financial statements.
Net revenue was ¥104,317 million for the six months ended September 30, 2017 and ¥39,720 million for the six months ended September 30, 2018. Non-interest expenses were ¥73,383 million for the six months ended September 30, 2017 and ¥75,373 million for the six months ended September 30, 2018. Income before income taxes in other operating results was ¥30,934 million for the six months ended September 30, 2017 and loss before income taxes in other operating results was ¥35,653 million for the six months ended September 30, 2018.
Other operating results for the six months ended September 30, 2018 include losses from changes in the fair value of derivative liabilities attributable to the change in its own creditworthiness of ¥0.8 billion and losses from changes in counterparty credit spreads of ¥0.2 billion.
Number of Employees
The following table presents the number of our employees as of September 30, 2017 and 2018.
| September 30 | ||||||||
| 2017 | 2018 | |||||||
| Japan |
16,706 | 16,296 | ||||||
| Europe |
3,047 | 3,020 | ||||||
| Americas |
2,348 | 2,390 | ||||||
| Asia and Oceania |
6,756 | 6,843 | ||||||
|
|
|
|
|
|||||
| Total |
28,857 | 28,549 | ||||||
|
|
|
|
|
|||||
19
Table of Contents
Summary of Regional Contributions
For a summary of our net revenue, income (loss) before income taxes and long-lived assets by geographic region, see Note 16 “Segment and geographic information” in our interim consolidated financial statements.
Regulatory Capital Requirements
Many of our business activities are subject to statutory capital requirements, including those of Japan, the U.S., the U.K. and certain other countries in which we operate.
Translation Exposure
A significant portion of our business is conducted in currencies other than Japanese Yen—most significantly, U.S. Dollars, British Pounds and Euros. We prepare financial statements of each of our consolidated subsidiaries in its functional currency, which is the currency of the primary economic environment in which the entity operates. Translation exposure is the risk arising from the effect of fluctuations in exchange rates on the net assets of our foreign subsidiaries. Translation exposure is not recognized in our consolidated statements of income unless and until we dispose of, or liquidate, the relevant foreign subsidiary.
Critical Accounting Policies and Estimates
Use of Estimates
In preparing our interim consolidated financial statements, management makes estimates regarding certain financial instrument and investment valuations, the outcome of litigation and tax examinations, the recovery of the carrying value of goodwill, the allowance for doubtful accounts, the realization of deferred tax assets and other matters that affect the reported amounts of assets and liabilities as well as the disclosures in these interim consolidated financial statements. Estimates, by their nature, are based on judgment and available information. Therefore, actual results may differ from estimates, which could have a material impact on the interim consolidated financial statements, and it is possible that such adjustments could occur in the near term.
Fair value for financial instruments
A significant amount of our financial instruments are carried at fair value, with changes in fair value recognized through the consolidated statements of income or the consolidated statements of comprehensive income on a recurring basis. Use of fair value is either specifically required under U.S. GAAP or we make an election to use fair value for certain eligible items under the fair value option.
Other financial assets and financial liabilities are carried at fair value on a nonrecurring basis, where the primary measurement basis is not fair value. Fair value is only used in specific circumstances after initial recognition, such as to measure impairment.
In accordance with Accounting Standard Codification (“ASC”) 820 “Fair Value Measurements and Disclosures”, all financial instruments measured at fair value have been categorized into a three-level hierarchy based on the transparency of inputs used to establish fair value.
Level 1:
Observable valuation inputs that reflect quoted prices (unadjusted) for identical financial instruments traded in active markets at the measurement date.
Level 2:
Valuation inputs other than quoted prices included within Level 1 that are either directly or indirectly observable for the financial instrument.
Level 3:
Unobservable valuation inputs which reflect Nomura assumptions and specific data.
20
Table of Contents
The availability of valuation inputs observable in the market varies by product and can be affected by a variety of factors. Significant factors include, but are not restricted to the prevalence of similar products in the market, especially for customized products, how established the product is in the market, for example, whether it is a new product or is relatively mature, and the reliability of information provided in the market which would depend, for example, on the frequency and volume of current data. A period of significant change in the market may reduce the availability of observable data. Under such circumstances, financial instruments may be reclassified into a lower level in the fair value hierarchy.
Significant judgments used in determining the classification of financial instruments include the nature of the market in which the product would be traded, the underlying risks, the type and liquidity of market data inputs and the nature of observed transactions for similar instruments.
Where valuation models include the use of parameters which are less observable or unobservable in the market, significant management judgment is used in establishing fair value. The valuations for Level 3 financial instruments, therefore, involve a greater degree of judgment than those valuations for Level 1 or Level 2 financial instruments.
Certain criteria management use to determine whether a market is active or inactive include the number of transactions, the frequency that pricing is updated by other market participants, the variability of price quotes among market participants, and the amount of publicly available information.
Level 3 financial assets as a proportion of total financial assets, carried at fair value on a recurring basis were 4% as of September 30, 2018 as listed below:
| Billions of yen | ||||||||||||||||||||
| September 30, 2018 | ||||||||||||||||||||
| Level 1 | Level 2 | Level 3 | Counterparty and Cash Collateral Netting |
Total | ||||||||||||||||
| Financial assets measured at fair value (Excluding derivative assets) |
¥ | 7,937 | ¥ | 9,019 | ¥ | 596 | ¥ | — | ¥ | 17,552 | ||||||||||
| Derivative assets |
15 | 15,911 | 158 | (15,035 | ) | 1,049 | ||||||||||||||
| Total |
¥ | 7,952 | ¥ | 24,930 | ¥ | 754 | ¥ | (15,035 | ) | ¥ | 18,601 | |||||||||
See Note 2 “Fair value measurements” in our interim consolidated financial statements.
21
Table of Contents
Assets and Liabilities Associated with Investment and Financial Services Business
Exposure to Certain Financial Instruments and Counterparties
Market conditions impact numerous products to which we have certain exposures. We also have exposures to Special Purpose Entities (“SPEs”) and others in the normal course of business.
Leveraged Finance
We provide loans to clients in connection with leveraged buy-outs and leveraged buy-ins. As this type of finance is usually initially provided through a commitment, we have both funded and unfunded exposures on these transactions.
The following table sets forth our exposure to leveraged finance by geographic location of the target company as of September 30, 2018.
| Millions of yen | ||||||||||||
| September 30, 2018 | ||||||||||||
| Funded | Unfunded | Total | ||||||||||
| Europe |
¥ | 11,527 | ¥ | 51,769 | ¥ | 63,296 | ||||||
| Americas |
17,052 | 189,391 | 206,443 | |||||||||
| Asia and Oceania |
656 | 553 | 1,209 | |||||||||
|
|
|
|
|
|
|
|||||||
| Total |
¥ | 29,235 | ¥ | 241,713 | ¥ | 270,948 | ||||||
|
|
|
|
|
|
|
|||||||
Special Purpose Entities (“SPEs”)
Our involvement with these entities includes structuring, underwriting, as well as, subject to prevailing market conditions, distributing and selling debt instruments and beneficial interests issued by these entities. In the normal course of securitization and equity derivative activities business, we also act as a transferor of financial assets to, and underwriter, distributor and seller of repackaged financial instruments issued by these entities. We retain, purchase and sell variable interests in SPEs in connection with our market-making, investing and structuring activities. Our other types of involvement with SPEs include guarantee agreements and derivative contracts.
For further discussion on Nomura’s involvement with variable interest entities (“VIEs”), see Note 7. “Securitizations and Variable Interest Entities” included in our interim consolidated financial statements.
Accounting Developments
See Note 1 “Summary of accounting policies: New accounting pronouncements recently adopted” in our interim consolidated financial statements.
22
Table of Contents
Deferred Tax Assets Information
Details of deferred tax assets and liabilities
The following table presents details of deferred tax assets and liabilities reported within Other assets—Other and Other liabilities, respectively, in the consolidated balance sheets as of September 30, 2018.
| Millions of yen | ||||
| September 30, 2018 | ||||
| Deferred tax assets |
||||
| Depreciation, amortization and valuation of fixed assets |
¥ | 20,401 | ||
| Investments in subsidiaries and affiliates |
28,078 | |||
| Valuation of financial instruments |
71,272 | |||
| Accrued pension and severance costs |
27,424 | |||
| Other accrued expenses and provisions |
50,156 | |||
| Operating losses |
379,899 | |||
| Other |
3,320 | |||
|
|
|
|||
| Gross deferred tax assets |
580,550 | |||
| Less—Valuation allowance |
(435,580 | ) | ||
|
|
|
|||
| Total deferred tax assets |
144,970 | |||
|
|
|
|||
| Deferred tax liabilities |
||||
| Investments in subsidiaries and affiliates |
146,213 | |||
| Valuation of financial instruments |
45,339 | |||
| Undistributed earnings of foreign subsidiaries |
1,857 | |||
| Valuation of fixed assets |
8,554 | |||
| Other |
2,212 | |||
|
|
|
|||
| Total deferred tax liabilities |
204,175 | |||
|
|
|
|||
| Net deferred tax assets (liabilities) |
¥ | (59,205 | ) | |
|
|
|
|||
Calculation method of deferred tax assets
In accordance with U. S. GAAP, we recognize deferred tax assets to the extent we believe that it is more likely than not that a benefit will be realized. A valuation allowance is provided for tax benefits available to us, which are not deemed more likely than not to be realized.
Legal Proceedings
For a discussion of our litigation and related matters, see Note 15 “Commitments, contingencies and guarantees” in our interim consolidated financial statements.
23
Table of Contents
Liquidity and Capital Resources
Funding and Liquidity Management
Overview
We define liquidity risk as the risk of loss arising from difficulty in securing the necessary funding or from a significantly higher cost of funding than normal levels due to deterioration of the Nomura Group’s creditworthiness or deterioration in market conditions. This risk could arise from Nomura-specific or market-wide events such as inability to access the secured or unsecured debt markets, a deterioration in our credit ratings, a failure to manage unplanned changes in funding requirements, a failure to liquidate assets quickly and with minimal loss in value, or changes in regulatory capital restrictions which may prevent the free flow of funds between different group entities. Our global liquidity risk management policy is based on liquidity risk appetite formulated by the Executive Management Board (“EMB”). Nomura’s liquidity risk management, under market-wide stress and in addition, under Nomura-specific stress, seeks to ensure enough continuous liquidity to meet all funding requirements and unsecured debt obligations across one year and 30-day periods, respectively, without raising funds through unsecured funding or through the liquidation of assets. We are required to meet regulatory notice on the liquidity coverage ratio issued by the FSA.
We have in place a number of liquidity risk management frameworks that enable us to achieve our primary liquidity objective. These frameworks include (1) Centralized Control of Residual Cash and Maintenance of Liquidity Portfolio; (2) Utilization of Unencumbered Assets as Part of Our Liquidity Portfolio; (3) Appropriate Funding and Diversification of Funding Sources and Maturities Commensurate with the Composition of Assets; (4) Management of Credit Lines to Nomura Group Entities; (5) Implementation of Liquidity Stress Tests; and (6) Contingency Funding Plan.
Our EMB has the authority to make decisions concerning group liquidity management. The Chief Financial Officer (“CFO”) has the operational authority and responsibility over our liquidity management based on decisions made by the EMB.
1.Centralized Control of Residual Cash and Maintenance of Liquidity Portfolio.
We centrally control residual cash held at Nomura Group entities for effective liquidity utilization purposes. As for the usage of funds, the CFO decides the maximum amount of available funds, provided without posting any collateral, for allocation within Nomura and the EMB allocates the funds to each business division. Global Treasury monitors usage by businesses and reports to the EMB.
In order to enable us to transfer funds smoothly between group entities, we limit the issuance of securities by regulated broker-dealers or banking entities within the Nomura Group and seek to raise unsecured funding primarily through the Company or through unregulated subsidiaries. The primary benefits of this strategy include cost minimization, wider investor name recognition and greater flexibility in providing funding to various subsidiaries across the Nomura Group.
To meet any potential liquidity requirement, we maintain a liquidity portfolio, managed by Global Treasury apart from other assets, in the form of cash and highly liquid, unencumbered securities that may be sold or pledged to provide liquidity. As of September 30, 2018, our liquidity portfolio was ¥4,953.4 billion which sufficiently met liquidity requirements under the stress scenarios.
24
Table of Contents
The following table presents a breakdown of our liquidity portfolio by type of financial assets as of March 31, 2018 and September 30, 2018 and averages maintained for the years ended March 31, 2018 and for six months ended September 30, 2018. Yearly and six months averages are calculated using month-end amounts.
| Billions of yen | ||||||||||||||||
| Average for year ended March 31, 2018 |
March 31, 2018 | Average for six months ended September 30, 2018 |
September 30, 2018 | |||||||||||||
| Cash, cash equivalents and time deposits(1) |
¥ | 2,116.6 | ¥ | 1,902.9 | ¥ | 2,325.9 | ¥ | 2,446.3 | ||||||||
| Government securities |
2,393.8 | 2,354.7 | 2,655.5 | 2,254.1 | ||||||||||||
| Others(2) |
237.1 | 370.8 | 310.3 | 253.0 | ||||||||||||
|
|
|
|
|
|
|
|
|
|||||||||
| Total liquidity portfolio |
¥ | 4,747.5 | ¥ | 4,628.4 | ¥ | 5,291.7 | ¥ | 4,953.4 | ||||||||
|
|
|
|
|
|
|
|
|
|||||||||
| (1) | Cash, cash equivalents, and time deposits include nostro balances and deposits with both central banks and market counterparties that are readily available to support the liquidity position of Nomura. |
| (2) | Others include other liquid financial assets such as money market funds and U.S. agency securities. |
The following table presents a breakdown of our liquidity portfolio by currency as of March 31, 2018 and September 30, 2018 and averages maintained for the years ended March 31, 2018 and for six months ended September 30, 2018. Yearly and six months averages are calculated using month-end amounts.
| Billions of yen | ||||||||||||||||
| Average for year ended March 31, 2018 |
March 31, 2018 | Average for six months ended September 30, 2018 |
September 30, 2018 | |||||||||||||
| Japanese Yen |
¥ | 1,498.8 | ¥ | 1,309.6 | ¥ | 1,839.8 | ¥ | 1,881.2 | ||||||||
| U.S. Dollar |
2,160.4 | 2,103.6 | 2,140.1 | 1,760.2 | ||||||||||||
| Euro |
629.7 | 690.4 | 795.8 | 804.5 | ||||||||||||
| British Pound |
308.4 | 379.9 | 367.6 | 360.3 | ||||||||||||
| Others(1) |
150.2 | 144.9 | 148.4 | 147.2 | ||||||||||||
|
|
|
|
|
|
|
|
|
|||||||||
| Total liquidity portfolio |
¥ | 4,747.5 | ¥ | 4,628.4 | ¥ | 5,291.7 | ¥ | 4,953.4 | ||||||||
|
|
|
|
|
|
|
|
|
|||||||||
| (1) | Includes other currencies such as the Australian dollar, the Canadian dollar and the Swiss franc. |
We assess our liquidity portfolio requirements globally as well as by each major operating entity in the Nomura Group. We primarily maintain our liquidity portfolio at Nomura Holdings, Inc. (“NHI”) and Nomura Securities Co. Ltd. (“NSC”), our other major broker-dealer subsidiaries, our bank subsidiaries, and other group entities. In determining the amounts and entities which hold this liquidity portfolio, we consider legal, regulatory and tax restrictions which may impact our ability to freely transfer liquidity across different entities in the Nomura Group.
25
Table of Contents
The following table presents a breakdown of our liquidity portfolio by entity as of March 31, 2018 and September 30, 2018.
| Billions of yen | ||||||||
| March 31, 2018 | September 30, 2018 | |||||||
| NHI and NSC(1) |
¥ | 901.3 | ¥ | 1,420.6 | ||||
| Major broker-dealer subsidiaries |
2,538.1 | 2,272.6 | ||||||
| Bank subsidiaries(2) |
719.4 | 808.5 | ||||||
| Other affiliates |
469.6 | 451.7 | ||||||
|
|
|
|
|
|||||
| Total liquidity portfolio |
¥ | 4,628.4 | ¥ | 4,953.4 | ||||
|
|
|
|
|
|||||
| (1) | NSC, a broker-dealer located in Japan, holds an account with the Bank of Japan (“BOJ”) and has direct access to the BOJ Lombard facility through which same day funding is available for our securities pool. Any liquidity surplus at NHI is lent to NSC via short-term intercompany loans, which can be unwound immediately when needed. |
| (2) | Includes Nomura Bank International plc (“NBI”), Nomura Singapore Limited and Nomura Bank Luxembourg S.A. |
2. Utilization of Unencumbered Assets as Part of Our Liquidity Portfolio.
In addition to our liquidity portfolio, we had ¥2,360.1 billion of other unencumbered assets comprising mainly of unpledged trading assets that can be used as an additional source of secured funding. Global Treasury monitors other unencumbered assets and can, under a liquidity stress event when the contingency funding plan has been invoked, monetize and utilize the cash generated as a result. The aggregate of our liquidity portfolio and other unencumbered assets as of September 30, 2018 was ¥7,313.5 billion, which represented 339.4% of our total unsecured debt maturing within one year.
| Billions of yen | ||||||||
| March 31, 2018 | September 30, 2018 | |||||||
| Net liquidity value of other unencumbered assets |
¥ | 2,167.9 | ¥ | 2,360.1 | ||||
| Liquidity portfolio |
4,628.4 | 4,953.4 | ||||||
|
|
|
|
|
|||||
| Total |
¥ | 6,796.3 | ¥ | 7,313.5 | ||||
|
|
|
|
|
|||||
3. Appropriate Funding and Diversification of Funding Sources and Maturities Commensurate with the Composition of Assets
We seek to maintain a surplus of long-term debt and equity above the cash capital requirements of our assets. We also seek to achieve diversification of our funding by market, instrument type, investors, currency, and staggered maturities in order to reduce unsecured refinancing risk.
We diversify funding by issuing various types of debt instruments—these include both structured loans and structured notes with returns linked to interest rates, currencies, equities, commodities, or related indices. We issue structured loans and structured notes in order to increase the diversity of our debt instruments. We typically hedge the returns we are obliged to pay with derivatives and/or the underlying assets to obtain funding equivalent to our unsecured long-term debt. The proportion of our non-Japanese Yen denominated long-term debt increased to 44.3% of total long-term debt outstanding as of September 30, 2018 from 43.3% as of March 31, 2018.
3.1 Short-Term Unsecured Debt
Our short-term unsecured debt consists of short-term bank borrowings (including long-term bank borrowings maturing within one year), other loans, commercial paper, deposit at banking entities, certificates of deposit and debt securities maturing within one year. Deposits at banking entities and certificates of deposit comprise customer deposits and certificates of deposit of our banking subsidiaries. Short-term unsecured debt includes the current portion of long-term unsecured debt.
26
Table of Contents
The following table presents an analysis of our short-term unsecured debt by type of financial liability as of March 31, 2018 and September 30, 2018.
| Billions of yen | ||||||||
| March 31, 2018 | September 30, 2018 | |||||||
| Short-term bank borrowings |
¥ | 143.6 | ¥ | 51.1 | ||||
| Other loans |
176.2 | 223.8 | ||||||
| Commercial paper |
179.3 | 380.0 | ||||||
| Deposits at banking entities |
925.8 | 943.6 | ||||||
| Certificates of deposit |
11.1 | 11.1 | ||||||
| Debt securities maturing within one year |
671.0 | 545.4 | ||||||
|
|
|
|
|
|||||
| Total short-term unsecured debt |
¥ | 2,107.0 | ¥ | 2,155.0 | ||||
|
|
|
|
|
|||||
3.2 Long-Term Unsecured Debt
We meet our long-term capital requirements and also achieve both cost-effective funding and an appropriate maturity profile by routinely funding through long-term debt and diversifying across various maturities and currencies.
Our long-term unsecured debt includes senior and subordinated debt issued through U.S. registered shelf offerings and our U.S. registered medium-term note programs, our Euro medium-term note programs, registered shelf offerings in Japan and various other debt programs.
As a globally competitive financial services group in Japan, we have access to multiple global markets and major funding centers. The Company, NSC, Nomura Europe Finance N.V., NBI, and Nomura International Funding Pte. Ltd. are the main group entities that borrow externally, issue debt instruments and engage in other funding activities. By raising funds to match the currencies and liquidities of our assets or by using foreign exchange swaps as necessary, we pursue optimization of our funding structures.
We use a wide range of products and currencies to ensure that our funding is efficient and well diversified across markets and investor types. Our unsecured senior debt is mostly issued without financial covenants, such as covenants related to adverse changes in our credit ratings, cash flows, results of operations or financial ratios, which could trigger an increase in our cost of financing or accelerate repayment of the debt.
The following table presents an analysis of our long-term unsecured debt by type of financial liability as of March 31, 2018 and September 30, 2018.
| Billions of yen | ||||||||
| March 31, 2018 | September 30, 2018 | |||||||
| Long-term deposits at banking entities |
¥ | 214.5 | ¥ | 227.9 | ||||
| Long-term bank borrowings |
2,567.6 | 2,792.9 | ||||||
| Other loans |
118.6 | 94.3 | ||||||
| Debt securities(1) |
2,318.2 | 3,511.2 | ||||||
|
|
|
|
|
|||||
| Total long-term unsecured debt |
¥ | 5,218.9 | ¥ | 6,626.3 | ||||
|
|
|
|
|
|||||
| (1) | Excludes long-term debt securities issued by consolidated special purpose entities and similar entities that meet the definition of variable interest entities under ASC 810 “Consolidation” and secured financing transactions recognized within Long-term borrowings as a result of transfers of financial assets that are accounted for as financings rather than sales in accordance with ASC 860 “Transfer and Servicing.” |
27
Table of Contents
3.3 Maturity Profile
We also seek to maintain an average maturity for our plain vanilla debt securities and borrowings greater than or equal to three years. The average maturity for our plain vanilla debt securities and borrowings with maturities longer than one year was 3.7 years as of September 30, 2018. A significant amount of our structured loans and structured notes are linked to interest rates, currencies, equities, commodities, or related indices. These maturities are evaluated based on internal models and monitored by Global Treasury. Where there is a possibility that these may be called prior to their scheduled maturity date, maturities are based on our internal stress option adjusted model. The model values the embedded optionality under stress market conditions in order to determine when the debt securities or borrowings are likely to be called. The graph below shows the distribution of maturities of our outstanding long-term debt securities and borrowings by the model.
On this basis, the average maturity of our structured loans and structured notes with maturities longer than one year was 7.5 years as of September 30, 2018. The average maturity of our entire long-term debt with maturities longer than one year including plain vanilla debt securities and borrowings was 7.4 years as of September 30, 2018.
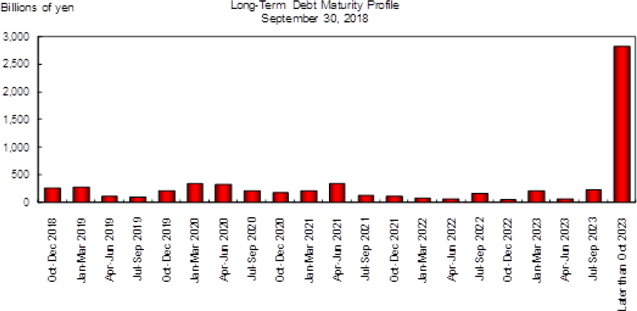
28
Table of Contents
3.4 Secured Funding
We typically fund our trading activities through secured borrowings, repurchase agreements and Japanese “Gensaki Repo” transactions. We believe such funding activities in the secured markets are more cost-efficient and less credit-rating sensitive than financing in the unsecured market. Our secured funding capabilities depend on the quality of the underlying collateral and market conditions. While we have shorter term secured financing for highly liquid assets, we seek longer terms for less liquid assets. We also seek to lower the refinancing risks of secured funding by transacting with a diverse group of global counterparties and delivering various types of securities collateral. In addition, we reserve an appropriate level of liquidity portfolio for the refinancing risks of secured funding maturing in the short term for less liquid assets. For more detail of secured borrowings and repurchase agreements, see Note 5 “Collateralized transactions” in our consolidated financial statements.
4. Management of Credit Lines to Nomura Group Entities
We maintain and expand credit lines to Nomura Group entities from other financial institutions to secure stable funding. We ensure that the maturity dates of borrowing agreements are distributed evenly throughout the year in order to prevent excessive maturities in any given period.
5. Implementation of Liquidity Stress Tests
We maintain our liquidity portfolio and monitor the sufficiency of our liquidity based on an internal model which simulates changes in cash outflow under specified stress scenarios to comply with our above mentioned liquidity management policy.
We assess the liquidity requirements of the Nomura Group under various stress scenarios with differing levels of severity over multiple time horizons. We evaluate these requirements under Nomura-specific and broad market-wide events, including potential credit rating downgrades at the Company and subsidiary levels. We call this risk analysis our Maximum Cumulative Outflow (“MCO”) framework.
The MCO framework is designed to incorporate the primary liquidity risks for Nomura and models the relevant future cash flows in the following two primary scenarios:
| • | Stressed scenario—To maintain adequate liquidity during a severe market-wide liquidity event without raising funds through unsecured financing or through the liquidation of assets for a year; and |
| • | Acute stress scenario—To maintain adequate liquidity during a severe market-wide liquidity event coupled with credit concerns regarding Nomura’s liquidity position, without raising funds through unsecured funding or through the liquidation of assets for 30 days. |
We assume that Nomura will not be able to liquidate assets or adjust its business model during the time horizons used in each of these scenarios. The MCO framework therefore defines the amount of liquidity required to be held in order to meet our expected liquidity needs in a stress event to a level we believe appropriate based on our liquidity risk appetite.
As of September 30, 2018, our liquidity portfolio exceeded net cash outflows under the stress scenarios described above.
29
Table of Contents
We constantly evaluate and modify our liquidity risk assumptions based on regulatory and market changes. The model we use in order to simulate the impact of stress scenarios includes the following assumptions:
| • | No liquidation of assets; |
| • | No ability to issue additional unsecured funding; |
| • | Upcoming maturities of unsecured debt (maturities less than one year); |
| • | Potential buybacks of our outstanding debt; |
| • | Loss of secured funding lines particularly for less liquid assets; |
| • | Fluctuation of funding needs under normal business circumstances; |
| • | Cash deposits and free collateral roll-off in a stress event; |
| • | Widening of haircuts on outstanding repo funding; |
| • | Additional collateralization requirements of clearing banks and depositories; |
| • | Drawdown on loan commitments; |
| • | Loss of liquidity from market losses; |
| • | Assuming a two-notch downgrade of our credit ratings, the aggregate fair value of assets that we would be required to post as additional collateral in connection with our derivative contracts; and |
| • | Legal and regulatory requirements that can restrict the flow of funds between entities in the Nomura Group. |
6. Contingency Funding Plan
We have developed a detailed contingency funding plan to integrate liquidity risk control into our comprehensive risk management strategy and to enhance the quantitative aspects of our liquidity risk control procedures. As a part of our Contingency Funding Plan (“CFP”), we have developed an approach for analyzing and quantifying the impact of any liquidity crisis. This allows us to estimate the likely impact of both Nomura-specific and market-wide events; and specifies the immediate action to be taken to mitigate any risk. The CFP lists details of key internal and external parties to be contacted and the processes by which information is to be disseminated. This has been developed at a legal entity level in order to capture specific cash requirements at the local level—it assumes that our parent company does not have access to cash that may be trapped at a subsidiary level due to regulatory, legal or tax constraints. We periodically test the effectiveness of our funding plans for different Nomura-specific and market-wide events. We also have access to central banks including, but not exclusively, the BOJ, which provide financing against various types of securities. These operations are accessed in the normal course of business and are an important tool in mitigating contingent risk from market disruptions.
Liquidity Regulatory Framework
In 2008, the Basel Committee published “Principles for Sound Liquidity Risk Management and Supervision.” To complement these principles, the Committee has further strengthened its liquidity framework by developing two minimum standards for funding liquidity. These standards have been developed to achieve two separate but complementary objectives.
The first objective is to promote short-term resilience of a financial institution’s liquidity risk profile by ensuring that it has sufficient high-quality liquid assets to survive a significant stress scenario lasting for 30 days. The Committee developed the Liquidity Coverage Ratio (“LCR”) to achieve this objective.
The second objective is to promote resilience over a longer time horizon by creating additional incentives for financial institutions to fund their activities with more stable sources of funding on an ongoing basis. The Net Stable Funding Ratio (“NSFR”) has a time horizon of one year and has been developed to provide a sustainable maturity structure of assets and liabilities.
These two standards are comprised mainly of specific parameters which are internationally “harmonized” with prescribed values. Certain parameters, however, contain elements of national discretion to reflect jurisdiction-specific conditions.
In Japan, the regulatory notice on the LCR, based on the international agreement issued by the Basel Committee with necessary national revisions, was published by Financial Services Agency (on October 31, 2014). The notices have been implemented since the end of March 2015 with phased-in minimum standards. Average of Nomura’s LCRs for the three months ended June 30, 2018 and September 30, 2018 were 184.8% and 191.1% respectively, and Nomura was compliant with requirements of the above notices. As for the NSFR, it is not yet implemented in Japan.
30
Table of Contents
Cash Flows
Nomura’s cash flows are primarily generated from operating activities undertaken in connection with our client flows and trading and from financing activities which are closely related to such activities. As a financial institution, growth in operations tends to result in cash outflows from operating activities as well as investing activities. For the six months ended September 2017, we recorded net cash outflows from operating activities and net cash inflows from investing activities. For the six months ended September 2018, we recorded net cash inflows from operating activities and net cash inflows from investing activities as discussed in the comparative analysis below.
The following table presents the summary information on our consolidated cash flows for the six months ended September 30, 2017 and 2018.
| Billions of yen | ||||||||
| Six months ended September 30 | ||||||||
| 2017 | 2018 | |||||||
| Net cash provided by (used in) operating activities |
¥ | (312.1 | ) | ¥ | 108.9 | |||
| Net income (loss) |
111.7 | (2.5 | ) | |||||
| Trading assets and private equity investments |
(1,088.5 | ) | (550.7 | ) | ||||
| Trading liabilities |
312.2 | 132.5 | ||||||
| Securities purchased under agreements to resell, net of securities sold under agreements to repurchase |
(1,155.9 | ) | (2,037.6 | ) | ||||
| Securities borrowed, net of securities loaned |
1,407.5 | 1,743.5 | ||||||
| Other, net |
101.0 | 823.8 | ||||||
| Net cash provided by investing activities |
74.7 | 28.4 | ||||||
| Net cash provided by financing activities |
359.0 | 414.5 | ||||||
| Long-term borrowings, net |
311.4 | 219.7 | ||||||
| Short-term borrowings, net |
85.5 | 216.4 | ||||||
| Other, net |
(37.9 | ) | (21.6 | ) | ||||
| Effect of exchange rate changes on cash, cash equivalents, restricted cash and restricted cash equivalents |
9.1 | 69.1 | ||||||
|
|
|
|
|
|||||
| Net increase in cash, cash equivalents, restricted cash and restricted cash equivalents |
130.7 | 621.0 | ||||||
| Cash, cash equivalents, restricted cash and restricted cash equivalents at beginning of year |
2,537.1 | 2,354.9 | ||||||
|
|
|
|
|
|||||
| Cash, cash equivalents, restricted cash and restricted cash equivalents at end of period |
¥ | 2,667.8 | ¥ | 2,975.9 | ||||
|
|
|
|
|
|||||
See the consolidated statements of cash flows in our interim consolidated financial statements for more detailed information.
For the six months ended September 30, 2018, our cash, cash equivalents, restricted cash and restricted cash equivalents increased by ¥621.0 billion to ¥2,975.9 billion. Net cash of ¥414.5 billion was provided by financing activities due to net cash inflows of ¥1,065.8 billion by increase in long-term borrowings, which is included in Long-term borrowings, net. As part of trading activities, while there were net cash outflows of ¥2,588.3 billion due to an increase in Trading assets and Private equity investments and a decrease in Securities purchased under agreements to resell, net of securities sold under agreements to repurchase, these cash outflows were offset by net cash inflows of ¥1,743.5 billion from cash inflow due to an increase in Securities borrowed, net of securities loaned. As a result, net cash of ¥108.9 billion was provided by operating activities.
Due to changes in accounting policy which Nomura adopted on April 1, 2018, certain reclassifications of amounts previously reported amounts have been made to conform to the current year presentation. See Note 1. “Summary of accounting policies: New accounting pronouncements recently adopted” for further details. Furthermore, in accordance with ASU 2016-18 “Restricted Cash” which Nomura adopted on April 1, 2018, certain reclassification of amounts previously reported as cash, cash equivalents, restricted cash and restricted cash equivalents for the six months ended September 30, 2017 have been made to conform to the current year presentation.
For the six months ended September 30, 2017, our cash, cash equivalents, restricted cash and restricted cash equivalents increased by ¥130.7 billion to ¥2,667.8 billion. Net cash of ¥359.0 billion was provided by financing activities due to net cash inflows of ¥1,318.4 billion by increase in long-term borrowings, which is included in Long-term borrowings, net. As part of trading activities, while there were net cash outflows of ¥2,244.4 billion due to an increase in Trading assets and Private equity investments and a decrease in Securities purchased under agreements to resell, net of securities sold under agreements to repurchase, these cash outflows were offset by net cash inflows of ¥1,407.5 billion from cash inflow due to an increase in Securities borrowed, net of securities loaned. As a result, net cash of ¥312.1 billion was used in operating activities.
31
Table of Contents
Balance Sheet and Financial Leverage
Total assets as of September 30, 2018, were ¥45,360.3 billion, an increase of ¥5,016.4 billion compared with ¥40,343.9 billion as of March 31, 2018, primarily due to an increase in Securities purchased under agreements to resell. Total liabilities as of September 30, 2018, were ¥42,514.3 billion, an increase of ¥4,970.2 billion compared with ¥37,544.1 billion as of March 31, 2018, primarily due to an increase in Securities sold under agreements to repurchase. NHI shareholders’ equity as of September 30, 2018, was ¥2,800.8 billion, an increase of ¥51.5 billion compared with ¥2,749.3 billion as of March 31, 2018, primarily due to an increase in Accumulated other comprehensive income.
Due to the changes in our accounting policy which Nomura adopted on April 1, 2018, certain reclassifications of previously reported amounts have been made to conform to the current year presentation. See Note 1. “Summary of accounting policies” in our interim consolidated financial statements for further details.
We seek to maintain sufficient capital at all times to withstand losses due to extreme market movements. The EMB is responsible for implementing and enforcing capital policies. This includes the determination of our balance sheet size and required capital levels. We continuously review our equity capital base to ensure that it can support the economic risk inherent in our business. There are also regulatory requirements for minimum capital of entities that operate in regulated securities or banking businesses.
As leverage ratios are commonly used by other financial institutions similar to us, we voluntarily provide a Leverage ratio and Adjusted leverage ratio primarily for benchmarking purposes so that users of our annual report can compare our leverage against other financial institutions. Adjusted leverage ratio is a non-GAAP financial measure that Nomura considers to be a useful supplemental measure of leverage.
The following table presents NHI shareholders’ equity, total assets, adjusted assets and leverage ratios as of March 31, 2018 and September 30, 2018.
| Billions of yen, except ratios | ||||||||
| March 31, 2018 | September 30, 2018 | |||||||
| NHI shareholders’ equity |
¥ | 2,749.3 | ¥ | 2,800.8 | ||||
| Total assets |
40,343.9 | 45,360.3 | ||||||
| Adjusted assets(1) |
24,106.2 | 25,437.9 | ||||||
| Leverage ratio (2) |
14.7 | x | 16.2 | x | ||||
| Adjusted leverage ratio(3) |
8.8 | x | 9.1 | x | ||||
| (1) | Represents total assets less Securities purchased under agreements to resell and Securities borrowed. Adjusted assets is a non-GAAP financial measure and is calculated as follows: |
| Billions of yen | ||||||||
| March 31, 2018 | September 30, 2018 | |||||||
| Total assets |
¥ | 40,343.9 | ¥ | 45,360.3 | ||||
| Less: |
||||||||
| Securities purchased under agreements to resell |
9,853.9 | 15,412.9 | ||||||
| Securities borrowed |
6,383.8 | 4,509.6 | ||||||
|
|
|
|
|
|||||
| Adjusted assets |
¥ | 24,106.2 | ¥ | 25,437.9 | ||||
|
|
|
|
|
|||||
| (2) | Equals total assets divided by NHI shareholders’ equity. |
| (3) | Equals adjusted assets divided by NHI shareholders’ equity. |
Total assets increased by 12.4% reflecting primarily an increase in Securities purchased under agreements to resell. NHI shareholders’ equity increased by 1.9% primarily due to an increase in Accumulated other comprehensive income. As a result, our leverage ratio rose from 14.7 times as of March 31, 2018 to 16.2 times as of September 30, 2018.
Adjusted assets increased primarily due to an increase in Trading assets. As a result, our adjusted leverage ratio rose from 8.8 times as of March 31, 2018 to 9.1 times as of September 30, 2018.
32
Table of Contents
Capital Management
Capital Management Policy
We seek to enhance shareholder value and to capture growing business opportunities by maintaining sufficient levels of capital. We will continue to review our levels of capital as appropriate, taking into consideration the economic risks inherent to operating our businesses, the regulatory requirements, and maintaining our ratings necessary to operate businesses globally.
Dividends
We believe that raising corporate value over the long term and paying dividends is essential to rewarding shareholders. We will strive to pay dividends using a consolidated pay-out ratio of 30 percent of each semi-annual consolidated earnings as a key indicator.
Dividend payments are determined taking into account a comprehensive range of factors such as the tightening of Basel regulations and other changes to the regulatory environment as well as the Company’s consolidated financial performance.
Dividends will in principle be paid on a semi-annual basis with record dates of September 30 and March 31.
Additionally we will aim for a total payout ratio, which includes dividends and share buybacks, of at least 50 percent.
With respect to retained earnings, in order to implement measures to adapt to regulatory changes and to increase shareholder value, we seek to efficiently invest in business areas where high profitability and growth may reasonably be expected, including the development and expansion of infrastructure.
Based on our Capital Management Policy described above, we paid a dividend of ¥3 per share to shareholders of record as of September 30, 2018.
The following table sets forth the amounts of dividends per share paid by us in respect of the periods indicated:
| Fiscal year ended or ending March 31, |
First Quarter | Second Quarter | Third Quarter | Fourth Quarter | Total | |||||||||||||||
| 2014 |
¥ | — | ¥ | 8.00 | ¥ | — | ¥ | 9.00 | ¥ | 17.00 | ||||||||||
| 2015 |
— | 6.00 | — | 13.00 | 19.00 | |||||||||||||||
| 2016 |
— | 10.00 | — | 3.00 | 13.00 | |||||||||||||||
| 2017 |
— | 9.00 | — | 11.00 | 20.00 | |||||||||||||||
| 2018 |
— | 9.00 | — | 11.00 | 20.00 | |||||||||||||||
| 2019 |
— | 3.00 | ||||||||||||||||||
Consolidated Regulatory Capital Requirements
The FSA established the “Guideline for Financial Conglomerates Supervision” (“Financial Conglomerates Guideline”) in June 2005 and set out the rules on consolidated regulatory capital. We started monitoring our consolidated capital adequacy ratio in accordance with the Financial Conglomerates Guideline from April 2005.
The Company has been assigned by the FSA as a Final Designated Parent Company who must calculate a consolidated capital adequacy ratio according to the Capital Adequacy Notice on Final Designated Parent Company in April 2011. Since then, we have been calculating our consolidated capital adequacy ratio according to the Capital Adequacy Notice on Final Designated Parent Company. The Capital Adequacy Notice on Final Designated Parent Company has been revised to be in line with Basel 2.5 and Basel III since then. We have calculated a Basel III-based consolidated capital adequacy ratio from the end of March 2013. Basel 2.5 includes significant change in calculation method of market risk and Basel III includes redefinition of capital items for the purpose of requiring higher quality of capital and expansion of the scope of credit risk-weighted assets calculation.
33
Table of Contents
In accordance with Article 2 of the Capital Adequacy Notice on Final Designated Parent Company, our consolidated capital adequacy ratio is currently calculated based on the amounts of common equity Tier 1 capital, Tier 1 capital (sum of common equity Tier 1 capital and additional Tier 1 capital), total capital (sum of Tier 1 capital and Tier 2 capital), credit risk-weighted assets, market risk and operational risk. As of September 30, 2018, our common equity Tier 1 capital ratio (common equity Tier 1 capital divided by risk-weighted assets) is 17.00%, Tier 1 capital ratio (Tier 1 capital divided by risk-weighted assets) is 18.11% and consolidated capital adequacy ratio (total capital divided by risk-weighted assets) is 18.52% and we were in compliance with the requirement for each ratio set out in the Capital Adequacy Notice on Final Designated Parent Company, etc. (required level including applicable minimum consolidated capital buffers as of September 30, 2018 is 6.79% for the common equity Tier 1 capital ratio, 8.29% for the Tier 1 capital ratio and 10.29% for the consolidated capital adequacy ratio).
The following table presents the Company’s consolidated capital adequacy ratios as of March 31, 2018 and September 30, 2018.
| Billions of yen, except ratios | ||||||||
| March 31, 2018 | September 30, 2018 | |||||||
| Common equity Tier 1 capital |
¥ | 2,500.0 | ¥ | 2,547.8 | ||||
| Tier 1 capital |
2,666.4 | 2,713.9 | ||||||
| Total capital |
2,732.5 | 2,775.0 | ||||||
| Risk-Weighted Assets |
||||||||
| Credit risk-weighted assets |
7,736.3 | 7,923.1 | ||||||
| Market risk equivalent assets |
4,748.3 | 4,525.4 | ||||||
| Operational risk equivalent assets |
2,637.7 | 2,532.8 | ||||||
|
|
|
|
|
|||||
| Total risk-weighted assets |
¥ | 15,122.3 | ¥ | 14,981.3 | ||||
|
|
|
|
|
|||||
| Consolidated Capital Adequacy Ratios |
||||||||
| Common equity Tier 1 capital ratio |
16.53 | % | 17.00 | % | ||||
| Tier 1 capital ratio |
17.63 | % | 18.11 | % | ||||
| Consolidated capital adequacy ratio |
18.06 | % | 18.52 | % | ||||
Since the end of March, 2011, we have been calculating credit risk-weighted assets and operational risk equivalent assets by using the foundation Internal Ratings-Based Approach and the Standardized Approach, respectively, with the approval of the FSA. Furthermore, Market risk equivalent assets are calculated by using the Internal Models Approach for market risk.
We provide consolidated capital adequacy ratios not only to demonstrate that we are in compliance with the requirements set out in the Capital Adequacy Notice on Final Designated Parent Company but also for benchmarking purposes so that users of our report can compare our capital position against those of other financial groups to which Basel III is applied. Management receives and reviews these capital ratios on a regular basis.
Consolidated Leverage Ratio Requirements
In March 2015, the FSA set out requirements for the calculation and disclosure of a consolidated leverage ratio, through amendments to revising “Specification of items which a final designated parent company should disclose on documents to show the status of its sound management” (2010 FSA Regulatory Notice No. 132; “Notice on Pillar 3 Disclosure”) and the publication of “Consolidated Leverage Ratio prescribed by Commissioner of Financial Services Agency in accordance with Article 3, paragraph 1 of Pillar 3 Notice” (2015 FSA Regulatory Notice No. 11; “Notice on Consolidated Leverage Ratio”). We started calculating and disclosing a consolidated leverage ratio from March 31, 2015 in accordance with the Notice on Pillar 3 Disclosure and Notice on Consolidated Leverage Ratio. Management receives and reviews this consolidated leverage ratio on a regular basis. As of September 30, 2018, our consolidated leverage ratio was 4.45%.
34
Table of Contents
Regulatory changes which affect us
The Basel Committee has issued a series of announcements regarding a Basel III program designed to strengthen the regulatory capital framework in light of weaknesses revealed by the financial crises. The following is a summary of the proposals which are most relevant to us.
On December 16, 2010, in an effort to promote a more resilient banking sector, the Basel Committee issued Basel III, that is, “International framework for liquidity risk measurement, standards and monitoring” and “A global regulatory framework for more resilient banks and banking systems.” They include raising the quality, consistency and transparency of the capital base; strengthening the risk coverage of the capital framework such as the implementation of a credit value adjustment (“CVA”) charge for OTC derivative trades; introducing a leverage ratio requirement as a supplemental measure to the risk-based framework; introducing a series of measures to address concerns over the “procyclicality” of the current framework; and introducing a minimum liquidity standard including a 30-day liquidity coverage ratio as well as a longer-term structural liquidity ratio. These standards were implemented from 2013, which includes transitional treatment, (i.e. they are phased in gradually from 2013). In addition, the Basel Committee has issued interim rules for the capitalization of bank exposures to central counterparties (“CCPs”) on July 25, 2012, which came into effect in 2013 as part of Basel III. Moreover, in addition to Basel III leverage ratio framework under which we started the calculation and disclosure of consolidated leverage ratio as above, a series of final standards on the regulatory frameworks such as capital requirements for banks’ equity investments in funds, the standardized approach for measuring counterparty credit risk exposures, capital requirements for bank exposures to CCPs, supervisory framework for measuring and controlling large exposures, Basel III: The Net Stable Funding Ratio and revisions to the securitization framework, and revised framework for market risk capital requirements have been published by the Basel Committee.
At the G-20 summit in November 2011, the Financial Stability Board (“FSB”) and the Basel Committee announced the list of global systemically important banks (“G-SIBs”) and the additional requirements to the G-SIBs including the recovery and resolution plan. The group of G-SIBs have been updated annually and published by the FSB each November. Since November 2011, we have not been designated as a G-SIBs. On the other hand, the FSB and the Basel Committee were asked to work on extending the framework for G-SIBs to domestic systemically important financial institutions (“D-SIBs”) and the Basel Committee developed and published a set of principles on the assessment methodology and the higher loss absorbency requirement for D-SIBs. In December 2015, the FSA identified us as a D-SIB and required additional capital charge of 0.5% after March 2016, with 3-year transitional arrangement.
In November 2015, the FSB issued the final TLAC standard for G-SIBs. The TLAC standard has been designed so that failing G-SIBs will have sufficient loss-absorbing and recapitalization capacity available in resolution for authorities to implement an orderly resolution. In response to the FSB’s publication of the TLAC standard, in April 2016, the FSA published its policy to develop the TLAC framework in Japan applicable to Japanese G-SIBs and, in April 2018, revised such policy to apply the TLAC requirements in Japan not only to Japanese G-SIBs but also to Japanese D-SIBs that are deemed (i) of particular need for a cross-border resolution arrangement and (ii) of particular systemic significance to Japanese financial system if they fail. In the revised policy, the Japanese G-SIBs and Nomura are collectively referred to as “4SIBs” which will be subject to the TLAC requirements in Japan. According to the revised policy, although Nomura is not identified as a G-SIB as of the date of this report, the 4SIBs, including Nomura, will be required to meet the TLAC requirement alongside the minimum regulatory requirements set out in the Basel III framework. Specifically, Nomura will be required to meet a minimum TLAC requirement of holding TLAC in an amount at least 16% of our consolidated risk-weighted assets as from March 31, 2021 and at least 18% as from March 31, 2024 as well as at least 6% of the applicable Basel III leverage ratio denominator from March 31, 2021 and at least 6.75% from March 31, 2024.
Furthermore, according to the FSA’s revised policy published in April 2018, which is subject to change based on future international discussions, the preferred resolution strategy for the 4SIBs is Single Point of Entry (“SPE”) resolution, in which resolution powers are applied to the top of a group by a single national resolution authority (i.e. the FSA), although the actual measures to be taken will be determined on a case-by-case basis considering the actual condition of the relevant the 4SIB in crisis.
To implement this SPE resolution strategy effectively, the FSA plans to require holding companies of the 4SIBs (“Domestic Resolution Entities”) to (i) meet the minimum external TLAC requirements and (ii) cause their material subsidiaries that are designated as systemically important by the FSA, including but not limited to certain material sub-groups as provided in the FSB’s TLAC standard, to maintain a certain level of capital and debt recognized by the FSA as having loss-absorbing and recapitalization capacity, or Internal TLAC.
In addition, under the FSA’s revised policy, the 4SIBs’ Domestic Resolution Entities will be allowed to count the amount equivalent to 2.5% of their consolidated risk-weighted assets from the implementation date of the TLAC requirements in Japan (March 31, 2021 for Nomura) and 3.5% of their consolidated risk-weighted assets from 3 years after the implementation date (March 31, 2024 for Nomura) as our external TLAC, considering the Japanese Deposit Insurance Fund Reserves.
It is likely that the FSA’s regulation and notice will be revised further to be in line with a series of rules and standards proposed by the Basel Committee, FSB or International Organization of Securities Commissions.
35
Table of Contents
Credit Ratings
The cost and availability of unsecured funding are generally dependent on credit ratings. Our short-term and long-term debt is rated by several recognized credit rating agencies. We believe that our credit ratings include the credit ratings agencies’ assessment of the general operating environment, our positions in the markets in which we operate, reputation, earnings structure, trend and volatility of our earnings, risk management framework, liquidity and capital management. An adverse change in any of these factors could result in a downgrade of our credit ratings, and that could, in turn, increase our borrowing costs and limit our access to the capital markets or require us to post additional collateral and permit counterparties to terminate transactions pursuant to certain contractual obligations. In addition, our credit ratings can have a significant impact on certain of our trading revenues, particularly in those businesses where longer term counterparty performance is critical, such as OTC derivative transactions.
As of November 30, 2018, the credit ratings of the Company and NSC were as follows:
| Nomura Holdings, Inc. |
Short-term Debt | Long-term Debt | ||
| Standard & Poor’s |
A-2 | A- | ||
| Moody’s Investors Service |
— | Baa1 | ||
| Fitch Ratings |
F1 | A- | ||
| Rating and Investment Information, Inc. |
a-1 | A+ | ||
| Japan Credit Rating Agency, Ltd. |
— | AA- | ||
| Nomura Securities Co., Ltd. |
Short-term Debt | Long-term Debt | ||
| Standard & Poor’s |
A-1 | A | ||
| Moody’s Investors Service |
P-2 | A3 | ||
| Fitch Ratings |
F1 | A- | ||
| Rating and Investment Information, Inc. |
a-1 | A+ | ||
| Japan Credit Rating Agency, Ltd. |
— | AA- | ||
Both Rating and Investment Information, Inc. and Japan Credit Rating Agency, Ltd. are credit rating agencies nationally recognized in Japan. We rely on, or utilize, credit ratings on our long-term and short-term debt provided by these Japanese credit rating agencies, as well as Standard & Poor’s, Moody’s Investors Service, and Fitch Ratings for unsecured funding and other financing purposes and also for our trading and other business activities.
There has been no change to the ratings in the above table since the date indicated.
36
Table of Contents
Off-Balance Sheet Arrangements
Off-balance sheet entities
In the normal course of business, we engage in a variety of off-balance sheet arrangements with off-balance sheet entities which may have an impact on Nomura’s future financial position and performance.
Off-balance sheet arrangements with off-balance sheet entities include where Nomura has:
| • | an obligation under a guarantee contract; |
| • | a retained or contingent interest in assets transferred to an off-balance sheet entity or similar arrangement that serves to provide credit, liquidity or market risk support to such entity; |
| • | any obligation, including a contingent obligation, under a contract that would be accounted for as a derivative instrument; or |
| • | any obligation, including a contingent obligation, arising out of a variable interest in an off-balance sheet entity that is held by, and material to, us, where such entity provides financing, liquidity, market risk or credit risk support to, or engages in leasing, hedging or research and development services with, us. |
Off-balance sheet entities may take the form of a corporation, partnership, fund, trust or other legal vehicle which is designed to fulfill a limited, specific purpose by its sponsor. We both create or sponsor these entities and also enter into arrangements with entities created or sponsored by others.
Our involvement with these entities includes structuring, underwriting, distributing and selling debt instruments and beneficial interests issued by these entities, subject to prevailing market conditions. In connection with our securitization and equity derivative activities, we also act as a transferor of financial assets to these entities, as well as, underwriter, distributor and seller of asset-repackaged financial instruments issued by these entities. We retain, purchase and sell variable interests in SPEs in connection with our market-making, investing and structuring activities. Our other types of off-balance sheet arrangements include guarantee agreements and derivative contracts. Significant involvement is assessed based on all of our arrangements with these entities, even if the probability of loss, as assessed at the balance sheet date, is remote.
For further information about transactions with VIEs, see Note 7 “Securitizations and Variable Interest Entities” in our interim consolidated financial statements.
Contractual Obligations
Since March 31, 2018, there have been no other material changes outside our ordinary course of business in connection with our standby letters of credit and other guarantees, long-term borrowings and contractual interest payments, operating lease commitments, capital lease commitments, purchase obligations, commitments to extend credit and commitments to invest in partnerships.
For further details on our commitments, contingencies and guarantees, see Note 15 “Commitments, contingencies and guarantees” in our interim consolidated financial statements.
37
Table of Contents
Quantitative and Qualitative Disclosures about Market Risk
Risk Management
Nomura defines risks as (i) the potential erosion of Nomura’s capital base due to unexpected losses arising from risks to which its business operations are exposed, such as market risk, credit risk, operational risk and model risk, (ii) liquidity risk, the potential lack of access to funds or higher cost of funding than normal levels due to a deterioration in Nomura’s creditworthiness or deterioration in market conditions, and (iii) business risk, the potential failure of revenues to cover costs due to a deterioration in the earnings environment or a deterioration in the efficiency or effectiveness of its business operations.
A fundamental principle established by Nomura is that all employees shall regard themselves as principals of risk management and appropriately manage these risks. Nomura seeks to promote a culture of proactive risk management throughout all levels of the organization and to limit risks to the confines of its risk appetite. The risk management framework that Nomura uses to manage these risks consists of its risk appetite, risk management governance and oversight, the management of financial resources, the management of all risk classes, and processes to measure and control risks. Each of these key components is explained in further detail below.
Risk Appetite
Nomura has determined the maximum level and types of risk that it is willing to assume in pursuit of its strategic objectives and business plan and has articulated this in its Risk Appetite Statement. This document is jointly submitted by the Chief Risk Officer (“CRO”) and the Chief Financial Officer (“CFO”) to the Executive Management Board (“EMB”) for approval.
The Risk Appetite Statement provides an aggregated view of risk and includes capital adequacy and balance sheet measures, liquidity risk, market and credit risk, operational risk, compliance risk and model risk. It is subject to regular monitoring and breach escalation as appropriate by the owner of the relevant risk appetite statement.
Nomura’s Risk Appetite Statement is required to be reviewed annually by the EMB but it is reviewed on an ad hoc basis if necessary, and must specifically be reviewed following any significant changes in Nomura’s strategy. Risk appetite underpins all additional aspects of Nomura’s risk management framework.
38
Table of Contents
Risk Management Governance and Oversight
Committee Governance
Nomura has established a committee structure to facilitate effective business operations and management of Nomura’s risks. The formal governance structure for risk management within Nomura is as follows:
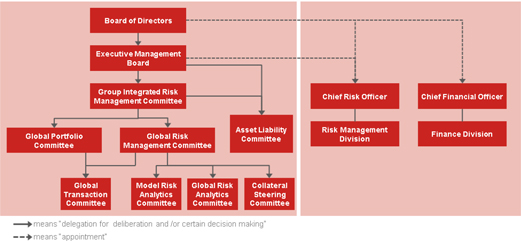
Board of Directors (“BoD”)
The BoD determines the policy for the execution of the business of Nomura and other matters prescribed in laws and regulations, supervises the execution of Directors’ and Executive Officers’ duties and has the authority to adopt, alter or abolish the regulations of the EMB.
Executive Management Board (“EMB”)
The EMB deliberates on and determines management strategy, the allocation of management resources and important management matters of Nomura, and seeks to increase shareholder value by promoting effective use of management resources and unified decision-making with regard to the execution of business. The EMB delegates responsibility for deliberation of matters concerning risk management to the Group Integrated Risk Management Committee (“GIRMC”). Key responsibilities of the EMB include the following:
| • | Resource Allocation—At the beginning of each financial year, the EMB determines the allocation of management resources and financial resources such as economic capital and unsecured funding to business units and establishes usage limits for these resources; |
| • | Business Plan—At the beginning of each financial year, the EMB approves the business plan and budget of Nomura. Introduction of significant new businesses, changes to business plans, the budget and the allocation of management resources during the year are also approved by the EMB; and |
| • | Reporting—The EMB reports the status of its deliberations to the BoD. |
Group Integrated Risk Management Committee (“GIRMC”)
Upon delegation from the EMB, the GIRMC deliberates on or determines important matters concerning integrated risk management of Nomura to assure the sound and effective management of its businesses. The GIRMC establishes Nomura’s risk appetite and a framework of integrated risk management consistent with Nomura’s risk appetite. The GIRMC supervises Nomura’s risk management by establishing and operating its risk management framework. The GIRMC reports the status of key risk management issues and any other matters deemed necessary by the committee chairman to the BoD and the EMB.
In addition, the GIRMC, upon delegation from the EMB, has established the Risk Management Policy, describing Nomura’s overall risk management framework including the fundamental risk management principles followed by Nomura.
39
Table of Contents
Global Risk Management Committee (“GRMC”)
Upon delegation from the GIRMC, the GRMC deliberates on or determines, based on strategic risk allocation and risk appetite determined by the GIRMC, important matters concerning market, credit, operational risk or reputational risk management of Nomura in order to assure the sound and effective management of Nomura’s businesses. The GRMC reports to the GIRMC the status of discussions at its meetings and any other matters as deemed necessary by the committee chairman.
Global Portfolio Committee (“GPC”)
Upon delegation from the GIRMC, the GPC deliberates on or determines all matters in relation to the management of a specific portfolio, for the purpose of achieving a risk profile consistent with the risk allocation and risk appetite of Nomura. The portfolio consists of businesses and products that fall within at least one of the three following categories: event financing, term financing and asset-based financing.
Asset Liability Committee (“ALCO”)
Upon delegation from the EMB and the GIRMC, the ALCO deliberates on, based on Nomura’s risk appetite determined by the GIRMC, balance sheet management, financial resource allocation, liquidity management and related matters. The ALCO reports to the GIRMC the status of discussions at its meetings and any other matters as deemed necessary by the committee chairman.
Global Risk Analytics Committee (“GRAC”) and Model Risk Analytics Committee (“MRAC”)
Upon delegation from the GRMC, the GRAC and the MRAC deliberate on or determine matters concerning the development, management and strategy of risk models and valuation models, respectively. The committees’ primary responsibility is to govern and provide oversight of model management, including the approval of new models and significant model changes. Both committees report all significant matters and material decisions taken to the GRMC, on a regular basis.
Global Transaction Committee (“GTC”)
Upon delegation from the GRMC and the GPC, the GTC deliberates on or determines individual transactions in line with Nomura’s risk appetite determined by GIRMC and thereby assures the sound and effective management of Nomura’s businesses.
Collateral Steering Committee (“CSC”)
Upon delegation from the GRMC, the CSC deliberates on or determines Nomura’s collateral risk management, including concentrations, liquidity, collateral re-use, limits and stress tests, provides direction on Nomura’s collateral strategy and ensures compliance with regulatory collateral requirements.
Chief Risk Officer (“CRO”)
The CRO is responsible for setting the overall strategy and direction of the Risk Management Division. The CRO is responsible for supervising the Risk Management Division and maintaining the effectiveness of the risk management framework independently from the business units within Nomura. The CRO regularly reports on the status of Nomura’s risk management to the GIRMC, and reports to and seeks the approval of the GIRMC on measures required for risk management.
Chief Financial Officer (“CFO”)
The CFO is responsible for overall financial strategy of Nomura, and has operational authority and responsibility over Nomura’s liquidity management based on decisions made by the EMB.
40
Table of Contents
Risk Management Division
The Risk Management Division comprises various departments or units in charge of risk management established independently from Nomura’s business units. The Risk Management Division is responsible for establishing and operating risk management processes, establishing and enforcing risk management policies and regulations, verifying the effectiveness of risk management methods, gathering reports from Nomura Group entities, reporting to Executive Officers/Senior Managing Directors and the GIRMC and others, as well as reporting to regulatory bodies and handling regulatory applications concerning risk management methods and other items as necessary. Important risk management issues are closely communicated between members of the Risk Management departments and the CRO. The CRO and/or co-CRO regularly attend the EMB and GIRMC meetings to report specific risk issues.
Risk Policy Framework
Policies and procedures are essential tools of governance used by the Risk Management Division. They define principles, rules and standards, and the specific processes that must be adhered to in order to effectively manage risk at Nomura. The Risk Management Division has established a risk policy framework to promote appropriate standards and consistency for risk policies and procedures and to articulate the principles and procedures conducive to effective risk management. All risk management policies and procedures are developed in line with this policy framework and a defined process is followed for any exceptions.
Monitoring, Reporting and Data Integrity
Development, consolidation, monitoring and reporting of risk management information (“risk MI”) are fundamental to the appropriate management of risk. The aim of all risk MI is to provide a basis for sound decision-making, action and escalation as required. The Risk Management Division and the Finance Division are responsible for producing regular risk MI, which reflects the position of Nomura relative to stated risk appetite. Risk MI includes information from across the risk classes defined in the risk management framework and reflect the use of the various risk tools used to identify and assess those risks. The Risk Management Division is responsible for implementing appropriate controls over data integrity for risk MI.
Management of Financial Resources
Nomura has established a framework for management of financial resources in order to adequately manage utilization of these resources. The EMB allocates financial resources to business units at the beginning of each financial year. These allocations are used to set revenue forecasts for each business units. Key components are set out below:
Risk-weighted assets
A key component used in the calculation of our consolidated capital adequacy ratios is risk-weighted assets. The EMB determines the risk appetite for our consolidated Tier 1 capital ratio on an annual basis and sets the limits for the usage of risk-weighted assets by each division and by additional lower levels of the division consistent with the risk appetite. In addition the EMB determines the risk appetite for the level of exposures under the leverage ratio framework which is a non-risk based measure to supplement risk-weighted assets. See Item 4.B. “Business Overview—Regulatory Capital Rules” of our annual report on Form 20-F for the fiscal year ended March 31, 2018, and “Consolidated Regulatory Capital Requirements” and “Consolidated Leverage Ratio Requirements” in this report for further information on our consolidated capital adequacy ratios and risk-weighted assets.
41
Table of Contents
Economic Capital
Nomura’s internal measure of the capital required to support its business is the Nomura Capital Allocation Target (“NCAT”). NCAT is measured as the amount of capital required to absorb maximum potential losses over a one-year time horizon, computed by the risk model at the 99.95th percentile, or the equivalent Expected Shortfall. NCAT consists of Portfolio NCAT and Non-Portfolio NCAT. Portfolio NCAT consists of market risk, credit risk, event risk, principal finance risk, private equity risk and investment securities risk. Non-Portfolio NCAT consists of business risk and operational risk. NCAT is aggregated by taking into account the correlation among its various components. Nomura’s NCAT limit is initially set by the EMB, and the EMB subsequently allocates it to each business division and additional lower levels of the organization.
Available Funds
The CFO decides the maximum amount of available funds, provided without posting of any collateral, for allocation within Nomura and the EMB approves the allocation of the funds to each business division. Global Treasury monitors the usage by businesses and reports to the EMB.
Classification and Definition of Risk
Nomura classifies and defines risks as follows and has established departments or units to manage each risk type.
| Risk Category |
Definition | |
| Market risk |
Risk of loss arising from fluctuations in values of financial assets and liabilities (including off-balance sheet items) due to fluctuations in market risk factors (interest rates, foreign exchange rates, prices of securities and others). | |
| Credit risk |
Risk of loss arising from an obligor’s default, insolvency or administrative proceeding which results in the obligor’s failure to meet its contractual obligations in accordance with agreed terms. This includes both on and off-balance sheet exposures. It is also the risk of loss arising through a credit valuation adjustment (“CVA”) associated with deterioration in the creditworthiness of a counterparty. | |
| Operational risk |
Risk of loss arising from inadequate or failed internal processes, people and systems or from external events. It excludes strategic risk (the risk of loss as a result of poor strategic business decisions), but includes the risk of breach of legal and regulatory requirements, and the risk of damage to Nomura’s reputation if caused by an operational risk. | |
| Model risk |
Risk of loss arising from model errors or incorrect or inappropriate model application with regard to valuation models and risk models. | |
| Funding and Liquidity risk |
Risk of loss arising from difficulty in securing the necessary funding or from a significantly higher cost of funding than normal levels due to deterioration of Nomura’s creditworthiness or deterioration in market conditions. | |
| Business risk |
Risk of failure of revenues to cover costs due to deterioration of the earnings environment or deterioration of the efficiency or effectiveness of business operations. Business risk is managed by the senior management at Nomura. | |
42
Table of Contents
Market Risk Management
Market risk is the risk of loss arising from fluctuations in values of financial assets and liabilities (including off-balance sheet items) due to fluctuations in market risk factors (interest rates, foreign exchange rates, prices of securities and others).
Market Risk Management Process
Effective management of market risk requires the ability to analyze a complex and evolving portfolio in a constantly changing global market environment, identify problematic trends and ensure that appropriate action is taken in a timely manner.
Nomura uses a variety of statistical risk measurement tools to assess and monitor market risk on an ongoing basis, including, but not limited to, Value at Risk (“VaR”), Stressed VaR (“SVaR”) and Incremental Risk Charge (“IRC”). In addition, Nomura uses sensitivity analysis and stress testing to measure and analyze its market risk. Sensitivities are measures used to show the potential changes to a portfolio due to standard moves in market risk factors. They are specific to each asset class and cannot usually be aggregated across risk factors. Stress testing enables the analysis of portfolio risks or tail risks, including non-linear behaviors and can be aggregated across risk factors at any level of the group hierarchy, from group level to business division, units or desk levels. Market risk is monitored against a set of approved limits, with daily reports and other management information provided to the business units and senior management.
Value at Risk
VaR is a measure of the potential loss due to adverse movements of market factors, such as equity prices, interest rates, credit, foreign exchange rates, and commodities with associated volatilities and correlations.
VaR Methodology Assumptions
Nomura uses a single VaR model which has been implemented globally in order to determine the total trading VaR. A historical simulation is implemented, where historical market moves over a two-year window are applied to current exposure in order to construct a profit and loss distribution. Potential losses can be estimated at required confidence levels or probabilities. A scenario weighting scheme is employed to ensure that the VaR model responds to changing market volatility. Nomura uses the same VaR model for both internal risk management purposes and for regulatory reporting. For internal risk management purposes, VaR is calculated across Nomura at a 99% confidence level and using a 1-day time horizon. For regulatory reporting purposes, Nomura uses the same confidence level but a 10-day time horizon, calculated using actual 10-day historical market moves. To complement VaR under Basel 2.5 regulations, Nomura also computes SVaR, which samples from a one-year window during a period of financial stress. The SVaR window is regularly calibrated and observations are equally weighted.
Nomura’s VaR model uses exact time series for each individual risk factor. However, if good quality data is not available, a ‘proxy logic’ maps the exposure to an appropriate time series. The level of proxying taking place is carefully monitored through internal risk management processes and there is a continual effort to source new time series to use in the VaR calculation.
VaR Backtesting
The performance of Nomura’s VaR model is constantly monitored to ensure that it remains fit for purpose. The main approach for validating VaR is to compare actual 1-day trading losses with the corresponding VaR estimate. Nomura’s VaR model is backtested at different hierarchy levels. Backtesting results are reviewed on a monthly basis by Nomura’s Risk Management Division. One-day trading losses exceeded the 99% VaR estimate at the Nomura Group level on one occasion for the twelve months ended September 30, 2018.
Limitations and Advantages of VaR
VaR aggregates risks from different asset classes in a transparent and intuitive way. However, there are limitations. VaR is a backward-looking measure: it implicitly assumes that distributions and correlations of recent factor moves are adequate to represent moves in the near future. VaR is appropriate for liquid markets and is not appropriate for risk factors that exhibit sudden jumps. Therefore it may understate the impact of severe events. Given these limitations, Nomura uses VaR only as one component of a diverse market risk management process.
43
Table of Contents
VaR metrics
The following graph shows the daily VaR over the last six quarters for substantially all of Nomura’s trading positions:
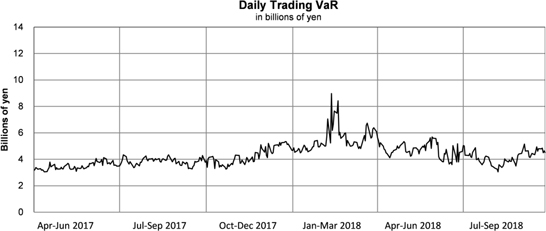
The following tables show the VaR as of each of the dates indicated for substantially all of Nomura’s trading positions:
| Billions of yen | ||||||||||||
| As of | ||||||||||||
| Mar. 31, 2017 |
Mar. 31, 2018 |
Sep. 30, 2018 |
||||||||||
| Equity |
¥ | 0.67 | ¥ | 1.21 | ¥ | 2.09 | ||||||
| Interest rate |
2.66 | 3.10 | 2.91 | |||||||||
| Foreign exchange |
1.67 | 3.20 | 2.22 | |||||||||
|
|
|
|
|
|
|
|||||||
| Subtotal |
4.99 | 7.52 | 7.22 | |||||||||
| Less: Diversification Benefit |
(1.66 | ) | (1.13 | ) | (2.71 | ) | ||||||
|
|
|
|
|
|
|
|||||||
| VaR |
¥ | 3.34 | ¥ | 6.38 | ¥ | 4.52 | ||||||
|
|
|
|
|
|
|
|||||||
| Billions of yen | ||||||||||||
| For the twelve months ended |
For the six months ended |
|||||||||||
| Mar. 31, 2017 |
Mar. 31, 2018 |
Sep. 30, 2018 |
||||||||||
| Maximum daily VaR(1) |
¥ | 6.71 | ¥ | 8.98 | ¥ | 6.08 | ||||||
| Average daily VaR(1) |
4.32 | 4.25 | 4.44 | |||||||||
| Minimum daily VaR(1) |
2.75 | 3.05 | 3.05 | |||||||||
| (1) | Represents the maximum, average and minimum VaR based on all daily calculations for the twelve months ended March 31, 2017, March 31, 2018, and six months ended September 30, 2018. |
44
Table of Contents
Total VaR decreased to ¥4.52 billion as of September 30, 2018 from ¥6.38 billion as of March 31, 2018. VaR relating to foreign exchange risk decreased to ¥2.22 billion as of September 30, 2018, compared to ¥3.20 billion as of March 31, 2018. VaR relating to equity risk increased to ¥2.09 billion as of September 30, 2018, compared to ¥1.21 billion as of March 31, 2018. VaR relating to interest rate risk decreased to ¥2.91 billion as of September 30, 2018, compared to ¥3.10 billion as of March 31, 2018.
Total VaR increased to ¥6.38 billion as of March 31, 2018 from ¥3.34 billion as of March 31, 2017. VaR relating to foreign exchange risk increased to ¥3.20 billion as of March 31, 2018, compared to ¥1.67 billion as of March 31, 2017. VaR relating to equity risk increased to ¥1.21 billion as of March 31, 2018, compared to ¥0.67 billion as of March 31, 2017. VaR relating to interest rate risk increased to ¥3.10 billion as of March 31, 2018, compared to ¥2.66 billion as of March 31, 2017.
Stress Testing
Nomura conducts market risk stress testing since VaR and sensitivity analysis have limited ability to capture all portfolio risks or tail risks. Stress testing for market risk is conducted regularly, using various scenarios based upon features of trading strategies. Nomura conducts stress testing not only at each desk level, but also at the Nomura Group level with a set of common global scenarios in order to capture the impact of market fluctuations on the entire Nomura Group.
Non-Trading Risk
A major market risk in Nomura’s non-trading portfolio relates to equity investments held for operating purposes and on a long-term basis. Equity investments held for operating purposes are minority stakes in the equity securities of unaffiliated Japanese financial institutions and corporations held in order to promote existing and potential business relationships. This non-trading portfolio is exposed mainly to volatility in the Japanese stock market. One method that can estimate the market risk in this portfolio is to analyze market sensitivity based on changes in the TOPIX, which is a leading index of prices of stocks on the First Section of the Tokyo Stock Exchange.
Nomura uses regression analysis covering the previous 90 days which tracks and compares fluctuations in the TOPIX and the fair value of Nomura’s equity investments held for operating purposes, which allows to determine a correlation factor. Based on this analysis for each 10% change in the TOPIX, the fair value of Nomura’s operating equity investments held for operating purposes can be expected to change by ¥11,717 million at the end of March 2018 and ¥11,757 million at the end of September 2018. The TOPIX closed at 1,716.30 points at the end of March 2018 and at 1,817.25 points at the end of September 2018. This simulation analyzes data for the entire portfolio of equity investments held for operating purposes at Nomura and therefore actual results may differ from Nomura’s expectations because of price fluctuations of individual equities.
Credit Risk Management
Credit risk is the risk of loss arising from an obligor’s default, insolvency or administrative proceeding which results in the obligor’s failure to meet its contractual obligations in accordance with agreed terms. This includes both on and off-balance sheet exposures. It is also the risk of loss arising through a CVA associated with deterioration in the creditworthiness of a counterparty.
Nomura manages credit risk on a global basis and on an individual Nomura legal entity basis.
Credit Risk Management Framework
The measurement, monitoring and management of credit risk at Nomura are governed by a set of global policies and procedures. Credit Risk Management (“CRM”), a global function within the Risk Management Division, is responsible for the implementation and maintenance of these policies and procedures. These policies are authorized by the GIRMC and/or Global Risk Strategic Committee (“GRSC”), prescribe the basic principles of credit risk management and set delegated authority limits, which enables CRM personnel to set credit limits.
Credit risk is managed by CRM together with various global and regional risk committees. This ensures transparency of material credit risks and compliance with established credit limits, the approval of material extensions of credit and the escalation of risk concentrations to appropriate senior management.
45
Table of Contents
Credit Risk Management Process
CRM operates as a credit risk control function within the Risk Management Division, reporting to the CRO. The process for managing credit risk at Nomura includes:
| • | Evaluation of likelihood that a counterparty defaults on its payments and obligations; |
| • | Assignment of internal ratings to all active counterparties; |
| • | Approval of extensions of credit and establishment of credit limits; |
| • | Measurement, monitoring and management of Nomura’s current and potential future credit exposures; |
| • | Setting credit terms in legal documentation; and |
| • | Use of appropriate credit risk mitigants including netting, collateral and hedging. |
The scope of credit risk management includes counterparty trading and various debt or equity instruments including loans, private equity investments, fund investments, investment securities and any other as deemed necessary from a credit risk management perspective. The evaluation of counterparties’ creditworthiness involves a thorough due diligence and analysis of the business environments in which they operate, their competitive positions, management and financial strength and flexibility. Credit analysts also take into account the corporate structure and any explicit or implicit credit support. CRM evaluates credit risk not only by counterparty, but also by counterparty group.
Following the credit analysis, CRM estimates the probability of default of a given counterparty or obligor through an alphanumeric ratings scale similar to that used by rating agencies and a corresponding numeric scale. Credit analysts are responsible for assigning and maintaining the internal ratings, ensuring that each rating is reviewed and approved at least annually.
Nomura’s internal rating system employs a range of ratings models to ensure global consistency and accuracy. These models are developed and maintained by the Risk Methodology Group. Internal ratings represent a critical component of Nomura’s approach to managing counterparty credit risk. They are used as key factors in:
| • | Establishing the amount of counterparty credit risk that Nomura is willing to take to an individual counterparty or counterparty group (setting of credit limits); |
| • | Determining the level of delegated authority for setting credit limits (including tenor); |
| • | The frequency of credit reviews (renewal of credit limits); |
| • | Reporting counterparty credit risk to senior management within Nomura; and |
| • | Reporting counterparty credit risk to stakeholders outside of Nomura. |
The Credit Risk Control Unit is a function within the Model Validation Group (“MVG”) which is independent of CRM. It ensures that Nomura’s internal rating system is properly reviewed and validated, reporting any breaks or issues to senior management for timely resolution. The unit is responsible for ensuring that the system remains accurate and predictive of risk and provides periodic reporting on the system to senior management.
For regulatory capital calculation purposes, Nomura has been applying the Foundation Internal Rating Based Approach in calculating credit risk weighted assets since the end of March 2011. The Standardized Approach is applied to certain business units or asset types, which are considered immaterial to the calculation of credit risk-weighted assets.
46
Table of Contents
Credit Limits and Risk Measures
Internal ratings form an integral part in the assignment of credit limits to counterparties. Nomura’s credit limit framework is designed to ensure that Nomura takes appropriate credit risk in a manner that is consistent with its overall risk appetite. Global Credit policies define the delegated authority matrices that establish the maximum aggregated limit amounts and tenors that may be set for any single counterparty group based on their internal rating.
Nomura’s main type of counterparty credit risk exposures arise from derivatives transactions or securities financing transactions. Credit exposures against counterparties are managed by means of setting credit limits based upon credit analysis of individual counterparty. Credit risk is managed daily through the monitoring of credit exposure against approved credit limits and the ongoing monitoring of the creditworthiness of Nomura’s counterparties. Any change in circumstance that alters Nomura’s risk appetite for any particular counterparty, sector, industry or country is reflected in changes to the internal rating and credit limit as appropriate.
Nomura’s global credit risk management systems record all credit limits and capture credit exposures to Nomura’s counterparties allowing CRM to measure, monitor and manage utilization of credit limits, ensure appropriate reporting and escalation of any limit breaches.
For derivatives and securities financing transactions, Nomura measures credit risk primarily by way of a Monte Carlo-based simulation model that determines a Potential Exposure profile at a specified confidence level. The exposure calculation model used for counterparty credit risk management has also been used for the Internal Model Method based exposure calculation for regulatory capital reporting purposes since the end of December 2012.
Loans and lending commitments are measured and monitored on both a funded and unfunded basis.
Wrong Way Risk
Wrong Way Risk (“WWR”) occurs when exposure to a counterparty is highly correlated with the deterioration of creditworthiness of that counterparty. Nomura has established global policies that govern the management of any WWR exposures. Stress testing is used to support the assessment of any WWR embedded within existing portfolios and adjustments are made to credit exposures and regulatory capital, as appropriate.
Stress Testing
Stress Testing is an integral part of Nomura’s management of credit risk. Regular stress tests are used to support the assessment of credit risks by counterparties, sectors and regions. The stress tests include potential concentrations that are highlighted as a result of applying shocks to risk factors, probabilities of default or rating migrations.
Risk Mitigation
Nomura utilizes financial instruments, agreements and practices to assist in the management of credit risk. Nomura enters into legal agreements, such as the International Swap and Derivatives Association, Inc. (“ISDA”) agreements or equivalent (referred to as “Master Netting Agreements”), with many of its counterparties. Master Netting Agreements allow netting of receivables and payables and reduce losses potentially incurred as a result of a counterparty default. Further reduction in credit risk is achieved through entering into collateral agreements that allow Nomura to obtain collateral from counterparties either upfront or contingent on exposure levels, changes in credit rating or other factors.
47
Table of Contents
Credit Risk to Counterparties in Derivatives Transaction
The credit exposures arising from Nomura’s trading-related derivatives as of March 31, 2018 are summarized in the table below, showing the positive fair value of derivative assets by counterparty credit rating and by remaining contractual maturity. The credit ratings are internally determined by Nomura’s CRM.
| Billions of yen | ||||||||||||||||||||||||||||||||||||
| Years to Maturity | ||||||||||||||||||||||||||||||||||||
| Credit Rating |
Less than 1 year |
1 to 3 years |
3 to 5 years |
5 to 7 years |
More than 7 years |
Cross-Maturity Netting(1) |
Total Fair Value |
Collateral obtained |
Replacement cost(3) |
|||||||||||||||||||||||||||
| (a) | (b) | (a)-(b) | ||||||||||||||||||||||||||||||||||
| AAA |
¥ | 39 | ¥ | 24 | ¥ | 27 | ¥ | 4 | ¥ | 86 | ¥ | (156 | ) | ¥ | 24 | ¥ | 10 | ¥ | 14 | |||||||||||||||||
| AA |
387 | 245 | 215 | 81 | 544 | (1,121 | ) | 351 | 69 | 282 | ||||||||||||||||||||||||||
| A |
957 | 569 | 333 | 291 | 839 | (2,776 | ) | 213 | 39 | 174 | ||||||||||||||||||||||||||
| BBB |
191 | 204 | 147 | 102 | 594 | (936 | ) | 302 | 49 | 253 | ||||||||||||||||||||||||||
| BB and lower |
67 | 53 | 64 | 28 | 49 | (136 | ) | 125 | 247 | 0 | ||||||||||||||||||||||||||
| Other(2) |
60 | 48 | 118 | 136 | 710 | (1,137 | ) | (65 | ) | 11 | 0 | |||||||||||||||||||||||||
|
|
|
|
|
|
|
|
|
|
|
|
|
|
|
|
|
|
|
|||||||||||||||||||
| Sub-total |
1,701 | 1,143 | 904 | 642 | 2,822 | (6,262 | ) | 950 | 425 | 723 | ||||||||||||||||||||||||||
| Listed |
105 | 174 | 6 | 1 | — | (207 | ) | 79 | 185 | (106 | ) | |||||||||||||||||||||||||
|
|
|
|
|
|
|
|
|
|
|
|
|
|
|
|
|
|
|
|||||||||||||||||||
| Total |
¥ | 1,806 | ¥ | 1,317 | ¥ | 910 | ¥ | 643 | ¥ | 2,822 | ¥ | (6,469 | ) | ¥ | 1,029 | ¥ | 610 | ¥ | 617 | |||||||||||||||||
|
|
|
|
|
|
|
|
|
|
|
|
|
|
|
|
|
|
|
|||||||||||||||||||
| (1) | Represents netting of derivative liabilities against derivatives assets entered into with the same counterparty across different maturity bands. Derivative assets and derivative liabilities with the same counterparty in the same maturity band are net within the relevant maturity band. Cash collateral netting against net derivative assets in accordance with ASC 210-20 “Balance Sheet—Offsetting” and ASC 815 “Derivatives and Hedging” is also included. |
| (2) | “Other” comprises unrated counterparties and certain portfolio level valuation adjustments not allocated to specific counterparties. |
| (3) | Zero balances represent instances where total collateral received is in excess of the total fair value; therefore, Nomura’s credit exposure is zero. |
48
Table of Contents
Country Risk
At Nomura, country risk is defined as the risk of loss arising from country-specific events (such as political, economic, legal and other events) that affect counterparties and/or issuers within that country, causing those counterparties and/or issuers to be unable to meet financial obligations. Nomura’s country risk framework acts as a complement to other risk management areas and encompasses a number of tools including, but no limited to, country limits, which restrict credit exposure concentration to any given country. Other tools to manage country risk include country ratings as well as country risk policies and procedures that describe responsibilities and delegation for decision-making.
Nomura’s credit portfolio remains well-diversified by country and concentrated towards highly-rated countries. Over 95% of the exposure was from investment-grade rated countries. The breakdown of top 10 country exposures is as follows:
| Top 10 Country Exposures(1) |
Billions of Yen | |||
| (As of September 30, 2018) | ||||
| Japan |
2,039 | |||
| United States |
1,701 | |||
| United Kingdom |
704 | |||
| Germany |
322 | |||
| India |
208 | |||
| Singapore |
167 | |||
| Luxembourg |
129 | |||
| France |
117 | |||
| Belgium |
116 | |||
| China |
99 | |||
| (1) | The table represents the Top 10 country exposures as of September 30, 2018 based on country of origin, combining counterparty and inventory exposures, offset by credit valuation adjustment hedges: |
| - | Counterparty exposures include cash and cash equivalents held at banks, margin balances placed at central clearing counterparties, the positive fair value, after collateral received, of derivative transactions and securities financing transactions, the fair value of funded loans and the notional amount of unfunded loans. |
| - | Inventory exposures include the positive fair value of debt and equity securities, equity and credit derivatives, using the net of long versus short positions. |
49
Table of Contents
Operational Risk Management
Operational risk is the risk of loss arising from inadequate or failed internal processes, people, and systems or from external events. It excludes strategic risk (the risk of loss as a result of poor strategic business decisions), but includes the risk of breach of legal and regulatory requirements, and the risk of damage to Nomura’s reputation if caused by an operational risk.
The Three Lines of Defense
Nomura adopts the industry standard “Three Lines of Defense” for the management of operational risk, comprising the following elements:
| 1) | 1st Line of Defense: The business which owns and manages its risks |
| 2) | 2nd Line of Defense: The Operational Risk Management (“ORM”) function, which defines and co-ordinates Nomura’s operational risk, framework and its implementation, and provides challenge to the 1st Line of Defense |
| 3) | 3rd Line of Defense: Internal Audit, who provide independent assurance |
Operational Risk Management Framework
An Operational Risk Management Framework has been established in order to allow Nomura to identify, assess, manage, monitor and report on operational risk. The GIRMC, with delegated authority from the EMB has formal oversight over the management of operational risk.
This framework is set out below:
Infrastructure of the framework
| • | Policy framework: Sets standards for managing operational risk and details how to monitor adherence to these standards. |
| • | Training and awareness: Action taken by ORM to improve business understanding of operational risk. |
Products and Services
| • | Event Reporting: This process is used to identify and report any event which resulted in or had the potential to result in a loss or gain or other impact associated with inadequate or failed internal processes, people and systems, or from external events. |
| • | Risk and Control Self-Assessment (“RCSA”): This process is used to identify the inherent risks the business faces, the key controls associated with those risks and relevant actions to mitigate the residual risks. Global ORM are responsible for developing the RCSA process and supporting the business in its implementation. |
| • | Key Risk Indicators (“KRI”): KRIs are metrics used to monitor the business’ exposure to operational risk and trigger appropriate responses as thresholds are breached. |
| • | Scenario Analysis: The process used to assess and quantify potential high impact, low likelihood operational risk events. During the process actions may be identified to enhance the control environment which are then tracked via the Operational Risk Management Framework. |
Outputs
| • | Analysis and reporting: A key aspect of ORM’s role is to analyze, report, and challenge operational risk information provided by business units, and work with business units to develop action plans to mitigate risks. |
| • | Operational risk capital calculation: Calculate operational risk capital as required under applicable Basel standards and local regulatory requirements. |
50
Table of Contents
Regulatory Capital Calculation for Operational Risk
Nomura uses the Standardized Approach for calculating regulatory capital for operational risk. This involves using a three-year average of gross income allocated to business lines, which is multiplied by a fixed percentage (“Beta Factor”) determined by the FSA, to establish the amount of required operational risk capital.
Nomura uses consolidated net revenue as gross income, however for certain consolidated subsidiaries, gross operating profit is used as gross income. Gross income allocation is performed by mapping the net revenue of each business segment as defined in Nomura’s management accounting data to each business line defined in the Standardized Approach as follows:
| Business Line |
Description |
Beta Factor | ||||
| Retail Banking |
Retail deposit and loan-related services | 12 | % | |||
| Commercial Banking |
Deposit and loan-related services except for Retail Banking business | 15 | % | |||
| Payment and Settlement |
Payment and settlement services for clients’ transactions | 18 | % | |||
| Retail Brokerage |
Securities-related services mainly for individuals | 12 | % | |||
| Trading and Sales |
Market-related business | 18 | % | |||
| Corporate Finance |
M&A, underwriting, secondary and private offerings, and other funding services for clients | 18 | % | |||
| Agency Services |
Agency services for clients such as custody | 15 | % | |||
| Asset Management |
Fund management services for clients | 12 | % | |||
Nomura calculates the required amount of operational risk capital for each business line by multiplying the allocated annual gross income amount by the appropriate Beta Factor defined above. The operational risk capital for any gross income amount not allocated to a specific business line is determined by multiplying such unallocated gross income amount by a fixed percentage of 18%.
The total operational risk capital for Nomura is calculated by aggregating the total amount of operational risk capital required for each business line and unallocated amount and by determining a three-year average. Where the aggregated amount for a given year is negative, then the total operational risk capital amount for that year will be calculated as zero.
In any given year, negative amounts in any business line are offset against positive amounts in other business lines. However, negative unallocated amounts are not offset against positive amounts in other business lines and are calculated as zero.
Operational risk capital is calculated at the end of September and March each year.
Model Risk Management
Model Risk is the risk of loss arising from Model errors or incorrect or inappropriate Model application with regard to Valuation Models and Risk Models.
Errors can occur at any point from model assumptions through to implementation. In addition, the quality of model outputs depends on the quality of model parameters and any input data. Even a fundamentally sound model producing accurate outputs consistent with the design objective of the model may exhibit high model risk if it is misapplied or misused.
To address these risks, Nomura has established its model risk appetite.
51
Table of Contents
Model Management Framework
The models within the model management framework are defined as either:
| • | valuation models, used for calculating prices and risk sensitivities of Nomura’s positions; or, |
| • | risk models, used for quantifying the risk of a portfolio by calculating the potential losses incurred from a specific type of risk, and used for regulatory or economic capital calculations, margin requirements for non-centrally cleared derivatives, limit monitoring, or management reporting. |
Before models are put into official use, the MVG is responsible for validating their integrity and comprehensiveness independently from those who design and build them. As part of this validation process, the MVG analyzes a number of factors to assess a model’s suitability, to quantify model risk which is then mitigated by applying model reserves and capital adjustments. Valuation models are developed and maintained by the business units and risk models by the Risk Methodology Group (“RMG”) within the Risk Management Division. Certain models may also be developed by third party providers. The RMG has primary responsibility for the ongoing refinement and improvement of risk models and methodologies within Nomura.
All models are also subject to an annual re-approval process by MVG to ensure they remain suitable. Upon delegation from the GRMC, the MRAC’s and GRAC’s primary responsibility is to govern and provide oversight of model management for valuation and risk models, respectively.
Changes to Valuation and Risk Models
Nomura has documented policies and procedures in place, approved by the GIRMC and/or GRSC, which define the process and validation requirements for implementing changes to valuation and risk models. In addition, a Model Performance Monitoring process has been established to identify and assess specific events, that can indicate that a model is not performing as it should or is potentially unsuitable and to determine what actions (for example, additional validation work) might be necessary. For changes with an impact above certain materiality thresholds, model approval is required. MVG defines these materiality thresholds in a formal procedure and operates a control process to identify where the procedure is not followed. For certain material changes to risk models, backtesting of the new model, parallel running of both models and stress-testing of the new model are required prior to the model being approved.
Funding and Liquidity Risk Management
For further information on funding and liquidity risk management, see “Liquidity and Capital Resources—Funding and Liquidity Management” in this report.
52
Table of Contents
Risk Measures and Controls
Limit Frameworks
The establishment of robust limit monitoring and management is central to appropriate monitoring and management of risk. The limit management frameworks incorporate clear escalation policies to ensure approval of limits at appropriate levels of seniority. The Risk Management Division is responsible for day-to-day operation of these limit frameworks including approval, monitoring, and reporting as required. Business units are responsible for complying with the agreed limits. Limits apply across a range of quantitative measures of risk and across market and credit risks.
New Business Risk Management
The new business approval process represents the starting point for new business in Nomura and exists to support management decision-making and ensure that risks associated with new products and transactions are identified and managed appropriately. The new business approval process consists of two components:
| 1) | Transaction committees are in place to provide formal governance over the review and decision-making process for individual transactions. |
| 2) | The new product approval process allows business unit sponsors to submit applications for new products and obtain approval from relevant departments prior to execution of the new products. The process is designed to capture and assess risks across various risk classes as a result of the new product or business. |
The new business approval process continues to seek assuring the sound and effective management to better meet the various changes observed in the market environment.
Stress Testing
Stress testing performed at the Nomura Group provides comprehensive coverage of risks across different hierarchical levels, and covers different time horizons, severities, plausibilities and stress testing methodologies. The results of stress tests are used in capital planning processes, capital adequacy assessments, liquidity adequacy assessments, recovery and resolution planning, assessments of whether risk appetite is appropriate, and in routine risk management.
Stress tests are run on a regular basis or on an ad hoc basis as needed, for example, in response to material changes in the external environment and/or in the Nomura Group risk profile. The results of stress tests with supporting detailed analysis are reported to senior management and other stakeholders as appropriate for the stress test being performed.
Stress testing is categorized either as sensitivity analysis or scenario analysis and may be performed on a Nomura Group-wide basis or at more granular levels.
| • | Sensitivity analysis is used to quantify the impact of a market move in one or two associated risk factors (for example, equity prices, equity volatilities) in order primarily to capture those risks which may not be readily identified by other risk models; |
| • | Scenario analysis is used to quantify the impact of a specified event across multiple asset classes and risk classes. This is a primary approach used in performing stress testing at the different hierarchical levels of the Nomura Group, and in reverse stress testing; |
| • | Group-wide stress to assess the capital adequacy of the Nomura Group under severe but plausible market scenarios is conducted on a quarterly basis at a minimum to calculate the Stressed Tier 1 Ratio; and |
| • | Reverse stress testing, a process of considering the vulnerabilities of the firm and hence how it may react to situations where it becomes difficult to continue its business and reviewing the results of that analysis, is conducted on an annual basis at a minimum. |
Stress testing is an integral part of the Nomura Group’s overall governance and is used as a tool for forward-looking risk management, decision-making and enhancing communication amongst the Risk Management Division, Front Office, and senior management.
53
Table of Contents
Interim Consolidated Financial Statements (UNAUDITED)
F-1
Table of Contents
Interim Consolidated Financial Statements
Consolidated Balance Sheets (UNAUDITED)
| Millions of yen | ||||||||
| March 31, 2018 | September 30, 2018 | |||||||
| ASSETS | ||||||||
| Cash and cash deposits: |
||||||||
| Cash and cash equivalents |
¥ | 2,354,639 | ¥ | 2,975,414 | ||||
| Time deposits |
315,445 | 194,827 | ||||||
| Deposits with stock exchanges and other segregated cash |
288,962 | 294,180 | ||||||
|
|
|
|
|
|||||
| Total cash and cash deposits |
2,959,046 | 3,464,421 | ||||||
|
|
|
|
|
|||||
| Loans and receivables: |
||||||||
| Loans receivable (including ¥554,137 million and ¥601,864 million measured at fair value by applying the fair value option as of March 31, 2018 and September 30, 2018, respectively) |
2,462,503 | 2,308,099 | ||||||
| Receivables from customers (including ¥13 million and ¥8,634 million measured at fair value by applying the fair value option as of March 31, 2018 and September 30, 2018, respectively) |
442,343 | 600,758 | ||||||
| Receivables from other than customers |
973,867 | 677,956 | ||||||
| Allowance for doubtful accounts |
(3,514 | ) | (3,964 | ) | ||||
|
|
|
|
|
|||||
| Total loans and receivables |
3,875,199 | 3,582,849 | ||||||
|
|
|
|
|
|||||
| Collateralized agreements: |
||||||||
| Securities purchased under agreements to resell (including ¥1,186,096 million and ¥800,535 million measured at fair value by applying the fair value option as of March 31, 2018 and September 30, 2018, respectively) |
9,853,898 | 15,412,852 | ||||||
| Securities borrowed |
6,383,845 | 4,509,602 | ||||||
|
|
|
|
|
|||||
| Total collateralized agreements |
16,237,743 | 19,922,454 | ||||||
|
|
|
|
|
|||||
| Trading assets and private equity investments: |
||||||||
| Trading assets (including securities pledged as collateral of ¥5,486,551 million and ¥5,350,002 million as of March 31, 2018 and September 30, 2018, respectively; including ¥7,047 million and ¥7,984 million measured at fair value by applying the fair value option as of March 31, 2018 and September 30, 2018, respectively) |
14,962,690 | 16,084,405 | ||||||
| Private equity investments (including ¥4,416 million and ¥4,772 million measured at fair value by applying the fair value option as of March 31, 2018 and September 30, 2018, respectively) |
17,466 | 18,055 | ||||||
|
|
|
|
|
|||||
| Total trading assets and private equity investments |
14,980,156 | 16,102,460 | ||||||
|
|
|
|
|
|||||
| Other assets: |
||||||||
| Office buildings, land, equipment and facilities (net of accumulated depreciation and amortization of ¥397,834 million and ¥423,552 million as of March 31, 2018 and September 30, 2018, respectively) |
338,984 | 323,938 | ||||||
| Non-trading debt securities |
485,891 | 451,875 | ||||||
| Investments in equity securities |
150,760 | 150,820 | ||||||
| Investments in and advances to affiliated companies |
408,034 | 418,330 | ||||||
| Other (including ¥176,029 million and ¥179,039 million measured at fair value by applying the fair value option as of March 31, 2018 and September 30, 2018, respectively) |
908,134 | 943,192 | ||||||
|
|
|
|
|
|||||
| Total other assets |
2,291,803 | 2,288,155 | ||||||
|
|
|
|
|
|||||
| Total assets |
¥ | 40,343,947 | ¥ | 45,360,339 | ||||
|
|
|
|
|
|||||
F-2
Table of Contents
Consolidated Balance Sheets—(Continued) (UNAUDITED)
| Millions of yen | ||||||||
| March 31, 2018 | September 30, 2018 | |||||||
| LIABILITIES AND EQUITY | ||||||||
| Short-term borrowings (including ¥372,188 million and ¥408,344 million measured at fair value by applying the fair value option as of March 31, 2018 and September 30, 2018, respectively) |
¥ | 743,497 | ¥ | 980,269 | ||||
| Payables and deposits: |
||||||||
| Payables to customers |
1,176,773 | 1,318,876 | ||||||
| Payables to other than customers |
1,239,540 | 1,422,757 | ||||||
| Deposits received at banks |
1,151,342 | 1,182,640 | ||||||
|
|
|
|
|
|||||
| Total payables and deposits |
3,567,655 | 3,924,273 | ||||||
|
|
|
|
|
|||||
| Collateralized financing: |
||||||||
| Securities sold under agreements to repurchase (including ¥435,905 million and ¥218,154 million measured at fair value by applying the fair value option as of March 31, 2018 and September 30, 2018, respectively) |
14,759,010 | 18,645,764 | ||||||
| Securities loaned (including ¥133,375 million and ¥136,454 million measured at fair value by applying the fair value option as of March 31, 2018 and September 30, 2018, respectively) |
1,524,363 | 1,371,260 | ||||||
| Other secured borrowings |
413,621 | 420,362 | ||||||
|
|
|
|
|
|||||
| Total collateralized financing |
16,696,994 | 20,437,386 | ||||||
|
|
|
|
|
|||||
| Trading liabilities |
8,202,936 | 8,600,314 | ||||||
| Other liabilities (including ¥25,482 million and ¥18,788 million measured at fair value by applying the fair value option as of March 31, 2018 and September 30, 2018, respectively) |
950,534 | 877,846 | ||||||
| Long-term borrowings (including ¥2,857,835 million and ¥3,140,801 million measured at fair value by applying the fair value option as of March 31, 2018 and September 30, 2018, respectively) |
7,382,507 | 7,694,241 | ||||||
|
|
|
|
|
|||||
| Total liabilities |
37,544,123 | 42,514,329 | ||||||
|
|
|
|
|
|||||
| Commitments and contingencies (Note 15) |
||||||||
| Equity: |
||||||||
| Nomura Holdings, Inc. (“NHI”) shareholders’ equity: |
||||||||
| Common stock |
||||||||
| No par value share |
||||||||
| Authorized—6,000,000,000 shares as of March 31, 2018 and September 30, 2018 |
||||||||
| Issued—3,643,562,601 shares as of March 31, 2018 and September 30, 2018 |
||||||||
| Outstanding—3,392,937,486 shares as of March 31, 2018 and 3,382,481,612 shares as of September 30, 2018 |
594,493 | 594,493 | ||||||
| Additional paid-in capital |
675,280 | 681,058 | ||||||
| Retained earnings |
1,696,890 | 1,681,445 | ||||||
| Accumulated other comprehensive income |
(59,356 | ) | 6,373 | |||||
|
|
|
|
|
|||||
| Total NHI shareholders’ equity before treasury stock |
2,907,307 | 2,963,369 | ||||||
| Common stock held in treasury, at cost—250,625,115 shares as of March 31, 2018 and 261,080,989 shares as of September 30, 2018 |
(157,987 | ) | (162,592 | ) | ||||
|
|
|
|
|
|||||
| Total NHI shareholders’ equity |
2,749,320 | 2,800,777 | ||||||
|
|
|
|
|
|||||
| Noncontrolling interests |
50,504 | 45,233 | ||||||
| Total equity |
2,799,824 | 2,846,010 | ||||||
|
|
|
|
|
|||||
| Total liabilities and equity |
¥ | 40,343,947 | ¥ | 45,360,339 | ||||
|
|
|
|
|
|||||
F-3
Table of Contents
Consolidated Balance Sheets—(Continued) (UNAUDITED)
The following table presents the classification of consolidated variable interest entities’ (“VIEs”) assets and liabilities included in the consolidated balance sheets above. The assets of a consolidated VIE may only be used to settle obligations of that VIE. Creditors do not typically have any recourse to Nomura beyond the assets held in the VIEs. See Note 7 “Securitizations and Variable Interest Entities” for further information.
| Billions of yen | ||||||||
| March 31, 2018 | September 30, 2018 | |||||||
| Cash and cash deposits |
¥ | 23 | ¥ | 18 | ||||
| Trading assets and private equity investments |
1,186 | 1,259 | ||||||
| Other assets |
91 | 77 | ||||||
|
|
|
|
|
|||||
| Total assets |
¥ | 1,300 | ¥ | 1,354 | ||||
|
|
|
|
|
|||||
| Trading liabilities |
¥ | 22 | ¥ | 21 | ||||
| Other liabilities |
2 | 2 | ||||||
| Borrowings |
953 | 953 | ||||||
|
|
|
|
|
|||||
| Total liabilities |
¥ | 977 | ¥ | 976 | ||||
|
|
|
|
|
|||||
The accompanying notes are an integral part of these consolidated financial statements.
F-4
Table of Contents
Consolidated Statements of Income (UNAUDITED)
| Millions of yen | ||||||||
| Six months ended September 30 | ||||||||
| 2017 | 2018 | |||||||
| Revenue: |
||||||||
| Commissions |
¥ | 176,292 | ¥ | 154,239 | ||||
| Fees from investment banking |
49,790 | 43,078 | ||||||
| Asset management and portfolio service fees |
119,555 | 125,721 | ||||||
| Net gain on trading |
208,858 | 147,639 | ||||||
| Gain on private equity investments |
29 | 874 | ||||||
| Interest and dividends |
276,004 | 358,293 | ||||||
| Gain on investments in equity securities |
3,122 | 988 | ||||||
| Other |
96,665 | 48,534 | ||||||
|
|
|
|
|
|||||
| Total revenue |
930,315 | 879,366 | ||||||
| Interest expense |
217,999 | 324,447 | ||||||
|
|
|
|
|
|||||
| Net revenue |
712,316 | 554,919 | ||||||
|
|
|
|
|
|||||
| Non-interest expenses: |
||||||||
| Compensation and benefits |
258,284 | 253,500 | ||||||
| Commissions and floor brokerage |
49,017 | 40,514 | ||||||
| Information processing and communications |
91,832 | 81,476 | ||||||
| Occupancy and related depreciation |
34,265 | 32,840 | ||||||
| Business development expenses |
16,232 | 18,233 | ||||||
| Other |
102,204 | 114,246 | ||||||
|
|
|
|
|
|||||
| Total non-interest expenses |
551,834 | 540,809 | ||||||
|
|
|
|
|
|||||
| Income before income taxes |
160,482 | 14,110 | ||||||
| Income tax expense |
48,828 | 16,633 | ||||||
|
|
|
|
|
|||||
| Net income (loss) |
¥ | 111,654 | ¥ | (2,523 | ) | |||
| Less: Net income attributable to noncontrolling interests |
2,948 | 3,487 | ||||||
|
|
|
|
|
|||||
| Net income (loss) attributable to NHI shareholders |
¥ | 108,706 | ¥ | (6,010 | ) | |||
|
|
|
|
|
|||||
| Yen | ||||||||
| Six months ended September 30 | ||||||||
| 2017 | 2018 | |||||||
| Per share of common stock: |
||||||||
| Basic— |
||||||||
| Net income (loss) attributable to NHI shareholders per share |
¥ | 30.79 | ¥ | (1.77 | ) | |||
| Diluted— |
||||||||
| Net income (loss) attributable to NHI shareholders per share |
¥ | 30.20 | ¥ | (1.78 | ) | |||
The accompanying notes are an integral part of these consolidated financial statements.
F-5
Table of Contents
Consolidated Statements of Income—(Continued) (UNAUDITED)
| Millions of yen | ||||||||
| Three months ended September 30 | ||||||||
| 2017 | 2018 | |||||||
| Revenue: |
||||||||
| Commissions |
¥ | 85,324 | ¥ | 74,783 | ||||
| Fees from investment banking |
27,083 | 19,119 | ||||||
| Asset management and portfolio service fees |
61,212 | 62,740 | ||||||
| Net gain on trading |
88,391 | 75,752 | ||||||
| Gain (loss) on private equity investments |
(330 | ) | 321 | |||||
| Interest and dividends |
141,612 | 188,703 | ||||||
| Gain (loss) on investments in equity securities |
3,060 | (1,104 | ) | |||||
| Other |
56,037 | 28,067 | ||||||
|
|
|
|
|
|||||
| Total revenue |
462,389 | 448,381 | ||||||
| Interest expense |
110,896 | 165,459 | ||||||
|
|
|
|
|
|||||
| Net revenue |
351,493 | 282,922 | ||||||
|
|
|
|
|
|||||
| Non-interest expenses: |
||||||||
| Compensation and benefits |
122,035 | 125,800 | ||||||
| Commissions and floor brokerage |
25,242 | 19,579 | ||||||
| Information processing and communications |
47,263 | 40,515 | ||||||
| Occupancy and related depreciation |
17,209 | 16,464 | ||||||
| Business development expenses |
7,823 | 9,337 | ||||||
| Other |
48,882 | 70,760 | ||||||
|
|
|
|
|
|||||
| Total non-interest expenses |
268,454 | 282,455 | ||||||
|
|
|
|
|
|||||
| Income before income taxes |
83,039 | 467 | ||||||
| Income tax expense |
29,423 | 9,703 | ||||||
|
|
|
|
|
|||||
| Net income (loss) |
¥ | 53,616 | ¥ | (9,236 | ) | |||
| Less: Net income attributable to noncontrolling interests |
1,766 | 1,997 | ||||||
|
|
|
|
|
|||||
| Net income (loss) attributable to NHI shareholders |
¥ | 51,850 | ¥ | (11,233 | ) | |||
|
|
|
|
|
|||||
| Yen | ||||||||
| Three months ended September 30 | ||||||||
| 2017 | 2018 | |||||||
| Per share of common stock: |
||||||||
| Basic— |
||||||||
| Net income (loss) attributable to NHI shareholders per share |
¥ | 14.70 | ¥ | (3.31 | ) | |||
| Diluted— |
||||||||
| Net income (loss) attributable to NHI shareholders per share |
¥ | 14.45 | ¥ | (3.32 | ) | |||
The accompanying notes are an integral part of these consolidated financial statements.
F-6
Table of Contents
Consolidated Statements of Comprehensive Income (UNAUDITED)
| Millions of yen | ||||||||
| Six months ended September 30 | ||||||||
| 2017 | 2018 | |||||||
| Net income (loss) |
¥ | 111,654 | ¥ | (2,523 | ) | |||
| Other comprehensive income: |
||||||||
| Cumulative translation adjustments: |
||||||||
| Cumulative translation adjustments |
10,636 | 64,297 | ||||||
| Deferred income taxes |
(801 | ) | (1,966 | ) | ||||
|
|
|
|
|
|||||
| Total |
9,835 | 62,331 | ||||||
| Defined benefit pension plans: |
||||||||
| Pension liability adjustment |
381 | 2,064 | ||||||
| Deferred income taxes |
(18 | ) | (807 | ) | ||||
|
|
|
|
|
|||||
| Total |
363 | 1,257 | ||||||
| Non-trading securities: |
||||||||
| Net unrealized gain on non-trading securities |
1,487 | — | ||||||
| Deferred income taxes |
(179 | ) | — | |||||
|
|
|
|
|
|||||
| Total |
1,308 | — | ||||||
|
|
|
|
|
|||||
| Own credit adjustments: |
||||||||
| Own credit adjustments |
(10,670 | ) | 4,720 | |||||
| Deferred income taxes |
1,331 | (1,380 | ) | |||||
|
|
|
|
|
|||||
| Total |
(9,339 | ) | 3,340 | |||||
|
|
|
|
|
|||||
| Total other comprehensive income |
2,167 | 66,928 | ||||||
|
|
|
|
|
|||||
| Comprehensive income |
¥ | 113,821 | ¥ | 64,405 | ||||
| Less: Comprehensive income attributable to noncontrolling interests |
3,182 | 4,686 | ||||||
|
|
|
|
|
|||||
| Comprehensive income attributable to NHI shareholders |
¥ | 110,639 | ¥ | 59,719 | ||||
|
|
|
|
|
|||||
| Millions of yen | ||||||||
| Three months ended September 30 | ||||||||
| 2017 | 2018 | |||||||
| Net income (loss) |
¥ | 53,616 | ¥ | (9,236 | ) | |||
| Other comprehensive income: |
||||||||
| Cumulative translation adjustments: |
||||||||
| Cumulative translation adjustments |
7,550 | 31,941 | ||||||
| Deferred income taxes |
(480 | ) | (2,218 | ) | ||||
|
|
|
|
|
|||||
| Total |
7,070 | 29,723 | ||||||
| Defined benefit pension plans: |
||||||||
| Pension liability adjustment |
2,090 | 1,018 | ||||||
| Deferred income taxes |
(121 | ) | (481 | ) | ||||
|
|
|
|
|
|||||
| Total |
1,969 | 537 | ||||||
| Non-trading securities: |
||||||||
| Net unrealized gain (loss) on non-trading securities |
(678 | ) | — | |||||
| Deferred income taxes |
295 | — | ||||||
|
|
|
|
|
|||||
| Total |
(383 | ) | — | |||||
|
|
|
|
|
|||||
| Own credit adjustments: |
||||||||
| Own credit adjustments |
(4,593 | ) | (532 | ) | ||||
| Deferred income taxes |
120 | (358 | ) | |||||
|
|
|
|
|
|||||
| Total |
(4,473 | ) | (890 | ) | ||||
|
|
|
|
|
|||||
| Total other comprehensive income |
4,183 | 29,370 | ||||||
|
|
|
|
|
|||||
| Comprehensive income |
¥ | 57,799 | ¥ | 20,134 | ||||
| Less: Comprehensive income attributable to noncontrolling interests |
1,452 | 2,447 | ||||||
|
|
|
|
|
|||||
| Comprehensive income attributable to NHI shareholders |
¥ | 56,347 | ¥ | 17,687 | ||||
|
|
|
|
|
|||||
The accompanying notes are an integral part of these consolidated financial statements.
F-7
Table of Contents
Consolidated Statements of Changes in Equity (UNAUDITED)
| Millions of yen | ||||||||
| Six months ended September 30 | ||||||||
| 2017 | 2018 | |||||||
| Common stock |
||||||||
| Balance at beginning of year |
¥ | 594,493 | ¥ | 594,493 | ||||
|
|
|
|
|
|||||
| Balance at end of period |
594,493 | 594,493 | ||||||
|
|
|
|
|
|||||
| Additional paid-in capital |
||||||||
| Balance at beginning of year |
681,329 | 675,280 | ||||||
| Stock-based compensation awards |
(3,883 | ) | 5,778 | |||||
|
|
|
|
|
|||||
| Balance at end of period |
677,446 | 681,058 | ||||||
|
|
|
|
|
|||||
| Retained earnings |
||||||||
| Balance at beginning of year |
1,663,234 | 1,696,890 | ||||||
| Cumulative effect of change in accounting principle(1) |
— | 1,564 | ||||||
| Net income (loss) attributable to NHI shareholders |
108,706 | (6,010 | ) | |||||
| Cash dividends(2) |
(31,375 | ) | (10,147 | ) | ||||
| Gain (loss) on sales of treasury stock |
(3,698 | ) | (852 | ) | ||||
|
|
|
|
|
|||||
| Balance at end of period |
1,736,867 | 1,681,445 | ||||||
|
|
|
|
|
|||||
| Accumulated other comprehensive income (loss) |
||||||||
| Cumulative translation adjustments |
||||||||
| Balance at beginning of year |
47,767 | (15,596 | ) | |||||
| Net change during the period |
9,834 | 61,132 | ||||||
|
|
|
|
|
|||||
| Balance at end of period |
57,601 | 45,536 | ||||||
|
|
|
|
|
|||||
| Defined benefit pension plans |
||||||||
| Balance at beginning of year |
(41,020 | ) | (47,837 | ) | ||||
| Pension liability adjustment |
363 | 1,257 | ||||||
|
|
|
|
|
|||||
| Balance at end of period |
(40,657 | ) | (46,580 | ) | ||||
|
|
|
|
|
|||||
| Non-trading securities |
||||||||
| Balance at beginning of year |
20,344 | — | ||||||
| Net unrealized gain on non-trading securities |
1,075 | — | ||||||
|
|
|
|
|
|||||
| Balance at end of period |
21,419 | — | ||||||
|
|
|
|
|
|||||
| Own credit adjustments |
||||||||
| Balance at beginning of year |
6,561 | 4,077 | ||||||
| Own credit adjustments |
(9,339 | ) | 3,340 | |||||
|
|
|
|
|
|||||
| Balance at end of period |
(2,778 | ) | 7,417 | |||||
|
|
|
|
|
|||||
| Balance at end of period |
35,585 | 6,373 | ||||||
|
|
|
|
|
|||||
| Common stock held in treasury |
||||||||
| Balance at beginning of year |
(182,792 | ) | (157,987 | ) | ||||
| Repurchases of common stock |
(39,305 | ) | (9,933 | ) | ||||
| Sales of common stock |
0 | 0 | ||||||
| Common stock issued to employees |
13,356 | 5,328 | ||||||
| Other net change in treasury stock |
562 | — | ||||||
|
|
|
|
|
|||||
| Balance at end of period |
(208,179 | ) | (162,592 | ) | ||||
|
|
|
|
|
|||||
| Total NHI shareholders’ equity |
||||||||
|
|
|
|
|
|||||
| Balance at end of period |
2,836,212 | 2,800,777 | ||||||
|
|
|
|
|
|||||
| Noncontrolling interests |
||||||||
| Balance at beginning of year |
53,875 | 50,504 | ||||||
| Cash dividends |
(1,898 | ) | (2,235 | ) | ||||
| Net income attributable to noncontrolling interests |
2,948 | 3,487 | ||||||
| Accumulated other comprehensive income attributable to noncontrolling interests |
234 | 1,199 | ||||||
| Purchase / sale of subsidiary shares, net |
180 | 415 | ||||||
| Other net change in noncontrolling interests |
856 | (8,137 | ) | |||||
|
|
|
|
|
|||||
| Balance at end of period |
56,195 | 45,233 | ||||||
|
|
|
|
|
|||||
| Total equity |
||||||||
| Balance at end of period |
¥ | 2,892,407 | ¥ | 2,846,010 | ||||
|
|
|
|
|
|||||
| (1) Represents the adjustment to initially apply Accounting Standards Update (“ASU”) 2014-09, “Revenue from Contracts with Customers.” |
| |||||||||||
| (2) Dividends per share |
Six months ended September 30, 2017 | ¥ | 9.00 | Three months ended September 30, 2017 | ¥ | 9.00 | ||||||
| Six months ended September 30, 2018 | ¥ | 3.00 | Three months ended September 30, 2018 | ¥ | 3.00 | |||||||
The accompanying notes are an integral part of these consolidated financial statements.
F-8
Table of Contents
Consolidated Statements of Cash Flows (UNAUDITED)
| Millions of yen | ||||||||
| Six months ended September 30 | ||||||||
| 2017 | 2018 | |||||||
| Cash flows from operating activities: |
||||||||
| Net income (loss) |
¥ | 111,654 | ¥ | (2,523 | ) | |||
| Adjustments to reconcile net income (loss) to net cash provided by (used in) operating activities: |
||||||||
| Depreciation and amortization |
35,940 | 28,725 | ||||||
| Gain on investments in equity securities |
(3,122 | ) | (988 | ) | ||||
| Deferred income taxes |
11,673 | 13,266 | ||||||
| Changes in operating assets and liabilities: |
||||||||
| Time deposits |
1,539 | 125,764 | ||||||
| Deposits with stock exchanges and other segregated cash(2) |
(20,167 | ) | 10,864 | |||||
| Trading assets and private equity investments(1) |
(1,088,549 | ) | (550,706 | ) | ||||
| Trading liabilities(1) |
312,184 | 132,477 | ||||||
| Securities purchased under agreements to resell, net of securities sold under agreements to repurchase |
(1,155,894 | ) | (2,037,613 | ) | ||||
| Securities borrowed, net of securities loaned |
1,407,536 | 1,743,470 | ||||||
| Other secured borrowings |
40,404 | 1,471 | ||||||
| Loans and receivables, net of allowance for doubtful accounts(1) |
(149,153 | ) | 453,972 | |||||
| Payables(1) |
196,468 | 267,740 | ||||||
| Bonus accrual |
(65,486 | ) | (76,482 | ) | ||||
| Accrued income taxes, net |
15,156 | (7,291 | ) | |||||
| Other, net |
37,739 | 6,730 | ||||||
|
|
|
|
|
|||||
| Net cash provided by (used in) operating activities(2) |
(312,078 | ) | 108,876 | |||||
|
|
|
|
|
|||||
| Cash flows from investing activities: |
||||||||
| Payments for purchases of office buildings, land, equipment and facilities |
(92,239 | ) | (139,702 | ) | ||||
| Proceeds from sales of office buildings, land, equipment and facilities |
75,375 | 143,245 | ||||||
| Payments for purchases of investments in equity securities |
(61 | ) | — | |||||
| Proceeds from sales of investments in equity securities |
466 | 183 | ||||||
| Decrease (increase) in loans receivable at banks, net |
277 | (14,137 | ) | |||||
| Decrease in non-trading debt securities, net |
49,119 | 38,103 | ||||||
| Other, net |
41,789 | 750 | ||||||
|
|
|
|
|
|||||
| Net cash provided by investing activities |
74,726 | 28,442 | ||||||
|
|
|
|
|
|||||
| Cash flows from financing activities: |
||||||||
| Increase in long-term borrowings |
1,318,432 | 1,065,772 | ||||||
| Decrease in long-term borrowings |
(1,007,078 | ) | (846,050 | ) | ||||
| Increase in short-term borrowings, net |
85,473 | 216,403 | ||||||
| Increase in deposits received at banks, net |
39,845 | 25,507 | ||||||
| Proceeds from sales of common stock held in treasury |
431 | 174 | ||||||
| Payments for repurchases of common stock held in treasury |
(39,305 | ) | (9,933 | ) | ||||
| Payments for cash dividends |
(38,821 | ) | (37,326 | ) | ||||
|
|
|
|
|
|||||
| Net cash provided by financing activities |
358,977 | 414,547 | ||||||
|
|
|
|
|
|||||
| Effect of exchange rate changes on cash, cash equivalents, restricted cash and restricted cash equivalents(2) |
9,065 | 69,126 | ||||||
|
|
|
|
|
|||||
| Net increase in cash, cash equivalents, restricted cash and restricted cash equivalents(2) |
130,690 | 620,991 | ||||||
| Cash, cash equivalents, restricted cash and restricted cash equivalents at beginning of year(2) |
2,537,066 | 2,354,868 | ||||||
|
|
|
|
|
|||||
| Cash, cash equivalents, restricted cash and restricted cash equivalents at end of period(2) |
¥ | 2,667,756 | ¥ | 2,975,859 | ||||
|
|
|
|
|
|||||
| Supplemental information: |
||||||||
| Cash paid during the period for— |
||||||||
| Interest |
¥ | 220,023 | ¥ | 311,046 | ||||
| Income tax payments, net |
¥ | 21,999 | ¥ | 10,659 | ||||
| (1) | Due to changes in accounting policy which Nomura adopted on April 1, 2018, certain reclassifications of amounts previously reported amounts have been made to conform to the current year presentation. See Note 1 “Summary of accounting policies: New accounting pronouncements recently adopted” in our interim consolidated financial statements for further details. |
| (2) | In accordance with ASU 2016-18 “Restricted Cash” which Nomura adopted on April 1, 2018, certain reclassification of amounts previously reported as cash, cash equivalents, restricted cash and restricted cash equivalents for the six months ended September 30, 2017 have been made to conform to the current year presentation. |
F-9
Table of Contents
Consolidated Statements of Cash Flows—(Continued) (UNAUDITED)
The following table presents a reconciliation of cash, cash equivalents, restricted cash and restricted cash equivalents as reported within the consolidated balance sheets to the total of the same such amounts shown in the statements of cash flows above. Restricted cash and restricted cash equivalents are amounts where access, withdrawal or usage by Nomura is substantively prohibited by a third party entity outside of the Nomura group.
| Millions of yen | ||||||||
| Six months ended September 30 | ||||||||
| 2017 | 2018 | |||||||
| Cash and cash equivalents reported in Cash and cash equivalents |
¥ | 2,667,593 | ¥ | 2,975,414 | ||||
| Restricted cash and restricted cash equivalents reported in Deposits with stock exchanges and other segregated cash |
¥ | 163 | ¥ | 445 | ||||
|
|
|
|
|
|||||
| Total cash, cash equivalent, restricted cash and restricted cash equivalents |
¥ | 2,667,756 | ¥ | 2,975,859 | ||||
|
|
|
|
|
|||||
The accompanying notes are an integral part of these consolidated financial statements.
F-10
Table of Contents
Notes to the Interim Consolidated Financial Statements (UNAUDITED)
1. Summary of accounting policies:
Description of business—
Nomura Holdings, Inc. (“Company”) and its broker-dealer, banking and other financial services subsidiaries provide investment, financing and related services to individual, institutional and government clients on a global basis. The Company and other entities in which it has a controlling financial interest are collectively referred to as “Nomura” within these consolidated financial statements.
Nomura operates its business through various divisions based upon the nature of specific products and services, its main client base and its management structure. Nomura reports operating results through three business segments: Retail, Asset Management and Wholesale.
In its Retail segment, Nomura provides investment consultation services mainly to individual clients in Japan. In its Asset Management segment, Nomura develops and manages investment trusts, and provides investment advisory services. In its Wholesale segment, Nomura engages in the sales and trading of debt and equity securities, derivatives, and currencies on a global basis, and provides investment banking services such as the underwriting of debt and equity securities as well as mergers and acquisitions and financial advice.
The accounting and financial reporting policies of Nomura conform to U. S. generally accepted accounting principles (“U. S. GAAP”) as applicable to broker dealers. A summary of the significant accounting policies applied by Nomura within these interim consolidated financial statements is provided within in the notes to the consolidated financial statements of Nomura’s annual report on Form 20-F for the year ended March 31, 2018 as filed on June 25, 2018.
F-11
Table of Contents
Notes to the Interim Consolidated Financial Statements—(Continued) (UNAUDITED)
New accounting pronouncements recently adopted—
No new accounting pronouncements relevant to Nomura were adopted during the three months ended September 30, 2018.
The following table presents a summary of new accounting pronouncements relevant to Nomura which have been adopted during the three months ended June 30, 2018:
| Pronouncement |
Summary of new guidance |
Actual adoption date and method of adoption |
Effect on these statements | |||
| ASU 2014-09, “Revenue from Contracts with Customers”(1) | • Replaces existing revenue recognition guidance in ASC 605 “Revenue Recognition” and certain industry-specific revenue recognition guidance with a new prescriptive model for recognition of revenue for services provided to customers.
• Introduces specific guidance for the treatment of variable consideration, non-cash consideration, significant financing arrangements and amounts payable to the customer.
• Revises existing guidance for principal-versus-agency determination.
• Requires revenue recognition and measurement principles to be applied to sales of nonfinancial and in substance nonfinancial assets to noncustomers.
• Specifies the accounting for costs to obtain or fulfill a customer contract.
• Requires extensive new footnote disclosures around nature and type of revenue from services provided to customers. |
Modified retrospective adoption from April 1, 2018. | ¥1,564 million adjustment to Retained earnings, ¥517 million adjustment to Payables to other than customers, ¥1,750 million adjustment to Other long-term assets, and ¥703 million to Deferred tax assets due to change in timing of recognition of revenues from sales of certain investment funds upon adoption on April 1, 2018. Other transitional changes were not significant.(2) |
F-12
Table of Contents
Notes to the Interim Consolidated Financial Statements—(Continued) (UNAUDITED)
| Pronouncement |
Summary of new guidance |
Actual adoption date and method of adoption |
Effect on these statements | |||
| ASU 2016-15, “Classification of Certain Cash Receipts and Cash Payments” and ASU 2016-18, “Restricted Cash” | • Amends the classification of certain cash receipts and cash payments in the statement of cash flows.
• Requires movements in restricted cash and restricted cash equivalents to be presented as part of cash and cash equivalents in the statement of cash flows.
• Requires new disclosures on the nature and amount of restricted cash and restricted cash equivalents. |
Full retrospective adoption from April 1, 2018. | ¥445 million of restricted cash and restricted cash equivalents are now presented with cash and cash equivalents in the statements of cash flows during the half year ended September 30, 2018 and similar reclassifications have been made in comparative periods presented. See the reconciliation table provided with the statements of cash flows for further details. |
F-13
Table of Contents
Notes to the Interim Consolidated Financial Statements—(Continued) (UNAUDITED)
| Pronouncement |
Summary of new guidance |
Expected adoption date and method of |
Effect on these statements | |||
| ASU 2017-07, “Improving the Presentation of Net Periodic Pension Cost and Net Periodic Postretirement Benefit Cost” |
• Clarifies the service cost component of net periodic pension cost to be reported in the same income statement line item as compensation costs arising from other services.
• Clarifies only the service cost component is eligible for capitalization as an asset when applicable. |
Full retrospective adoption from April 1, 2018. | ¥541 million reclassification from Compensation and benefits to Other expenses. Impacts on comparative periods presented were immaterial. |
| (1) | As subsequently amended by ASU 2015-14 “Revenue from Contracts with Customers—Deferral of the Effective Date”, ASU 2016-08 “Revenue from Contracts with Customers—Principal versus Agent Considerations”, ASU 2016-10 “Revenue from Contracts with Customers—Identifying Performance Obligations and Licensing” and certain other Accounting Standard Updates. |
| (2) | See Note 4 “Revenue from services provided to customers” for new disclosures of revenues from services have been made and for further details of the impact of adoption of the new guidance. |
In addition, Nomura changed its accounting policy for derivative transactions as follows.
Nomura collects and remits cash margin between institutional investors and central clearing houses in its execution and clearing services of exchange-traded derivative transactions. Cash margin remitted to central clearing houses was reflected on Nomura’s consolidated balance sheets. However, with effect from April 1, 2018, revisiting nature of the transactions, Nomura has revised its accounting policy for when such balances are recognized on Nomura’s consolidated group balance sheet and as a result, certain cash margin amounts as well as an equivalent amount reflecting the obligation to return such amounts to clients are no longer recognized on the balance sheet if certain criteria are met. Nomura has restated previously reported amounts of Receivables from other than customers decreased by ¥237.0 billion and Payables to other than customers decreased by ¥237.0 billion, respectively, to conform to the current presentation.
Daily variation margin for certain derivative transactions traded in Japan was reflected on Nomura’s consolidated balance sheets. However, from April 1, 2018, Nomura changed its accounting policy as a result of amendment of the rules of a specific central clearing house and daily variation margin and related derivative assets and liabilities are no longer recognized on the balance sheet. Nomura has restated previously reported amounts of Trading assets decreased by ¥4.9 billion, Receivables from other than customers decreased by ¥5.5 billion and Trading liabilities decreased by ¥10.4 billion respectively to conform to the current presentation.
F-14
Table of Contents
Notes to the Interim Consolidated Financial Statements—(Continued) (UNAUDITED)
Future accounting developments—
The following table presents a summary of new authoritative accounting pronouncements relevant to Nomura which will be adopted on or after April 1, 2019 and which may have a material impact on these financial statements:
| Pronouncement |
Summary of new guidance |
Expected adoption date and method of adoption |
Effect on these consolidated statements | |||
| ASU 2016-02, “Leases”(1) | • Replaces ASC 840 “Leases”, the current guidance on lease accounting, and revised the definition of a lease.
• Requires all lessees to recognize a right of use asset and corresponding lease liability on balance sheet.
• Lessor accounting is largely unchanged from current guidance.
• Simplifies the accounting for sale leaseback and “build-to-suit” leases.
• Requires extensive new qualitative and quantitative footnote disclosures on lease arrangements. |
Modified retrospective adoption from April 1, 2019.(2)(3) | Currently evaluating the potential impact however a gross up of Nomura’s balance sheet is expected on adoption date and in subsequent reporting periods. | |||
| ASU 2016-13, “Measurement of Credit Losses on Financial Instruments” | • Introduces a new model for recognition and measurement of credit losses against certain financial instruments such as loans, debt securities and receivables which are not carried at fair value with changes in fair value recognized through earnings. The model also applies to off balance sheet credit exposures such as written loan commitments, standby letters of credit and issued financial guarantees not accounted for as insurance, which are not carried at fair value through earnings.
• The new model based on lifetime current expected credit losses (CECL) measurement, to be recognized at the time an in-scope instrument is originated, acquired or issued.
• Replaces existing incurred credit losses model under current GAAP.
• Requires enhanced qualitative and quantitative disclosures around credit risk, the methodology used to estimate and monitor expected credit losses and changes in estimates of expected credit losses. |
Modified retrospective adoption from April 1, 2020.(3) | Currently evaluating the potential impact but an overall increase in allowances for credit losses are expected to be recognized which will impact earnings in subsequent reporting periods. | |||
| (1) | As subsequently amended by ASU 2018-01 “Land Easement Practical Expedient for Transition to Topic 842”, ASU 2018-10 “Codification Improvements to Topic 842, Leases”, and ASU 2018-11 “Leases (Topic 842): Targeted Improvements.” |
| (2) | Nomura plans to use certain practical expedients permitted by ASC 842 including adopting the new requirements through a cumulative-effect adjustment to retained earnings on adoption date. |
| (3) | Unless Nomura early adopts which is considered unlikely as of the date of these consolidated financial statements. |
F-15
Table of Contents
Notes to the Interim Consolidated Financial Statements—(Continued) (UNAUDITED)
2. Fair value measurements:
The fair value of financial instruments
A significant amount of Nomura’s financial instruments are measured at fair value. Financial assets measured at fair value on a recurring basis are reported in the consolidated balance sheets within Trading assets and private equity investments, Loans and receivables, Collateralized agreements and Other assets. Financial liabilities measured at fair value on a recurring basis are reported within Trading liabilities, Short-term borrowings, Payables and deposits, Collateralized financing, Long-term borrowings and Other liabilities.
Other financial assets and financial liabilities are measured at fair value on a nonrecurring basis, where the primary measurement basis is not fair value but where fair value is used in specific circumstances after initial recognition, such as to measure impairment.
In all cases, fair value is determined in accordance with ASC 820 “Fair Value Measurements and Disclosures” (“ASC 820”) which defines fair value as the amount that would be exchanged to sell a financial asset or transfer a financial liability in an orderly transaction between market participants at the measurement date. It assumes that the transaction occurs in the principal market for the relevant financial assets or financial liabilities, or in the absence of a principal market, the most advantageous market.
Fair value is usually determined on an individual financial instrument basis consistent with the unit of account of the financial instrument. However, certain financial instruments managed on a portfolio basis are valued as a portfolio, namely based on the price that would be received to sell a net long position (i.e., a net financial asset) or transfer a net short position (i.e., a net financial liability) consistent with how market participants would price the net risk exposure at the measurement date.
Financial assets measured at fair value also include investments in certain funds where, as a practical expedient, fair value is determined on the basis of net asset value per share (“NAV per share”) if the NAV per share is calculated in accordance with certain industry standard principles.
Increases and decreases in the fair value of assets and liabilities will significantly impact Nomura’s position, performance, liquidity and capital resources. As explained below, valuation techniques applied contain inherent uncertainties and Nomura is unable to predict the accurate impact of future developments in the market. Where appropriate, Nomura uses economic hedging strategies to mitigate its risk, although these hedges are also subject to unpredictable movements in the market.
Valuation methodology for financial instruments carried at fair value on a recurring basis
The fair value of financial instruments is based on quoted market prices including market indices, broker or dealer quotations or an estimation by management of the expected exit price under current market conditions. Various financial instruments, including cash instruments and over-the-counter (“OTC”) contracts, have bid and offer prices that are observable in the market. These are measured at the point within the bid-offer range which best represents Nomura’s estimate of fair value. Where quoted market prices or broker or dealer quotations are not available, prices for similar instruments or valuation pricing models are considered in the determination of fair value.
Where quoted prices are available in active markets, no valuation adjustments are taken to modify the fair value of assets or liabilities marked using such prices. Other instruments may be measured using valuation techniques, such as valuation pricing models incorporating observable valuation inputs, unobservable parameters or a combination of both. Valuation pricing models use valuation inputs which would be considered by market participants in valuing similar financial instruments.
Valuation pricing models and their underlying assumptions impact the amount and timing of unrealized and realized gains and losses recognized, and the use of different valuation pricing models or underlying assumptions could produce different financial results. Valuation uncertainty results from a variety of factors, including the valuation technique or model selected, the quantitative assumptions used within the valuation model, the inputs into the model, as well as other factors. Valuation adjustments are used to reflect the assessment of this uncertainty. Common valuation adjustments include model reserves, credit adjustments, close-out adjustments, and other appropriate instrument-specific adjustments, such as those to reflect transfer or sale restrictions.
F-16
Table of Contents
Notes to the Interim Consolidated Financial Statements—(Continued) (UNAUDITED)
The level of adjustments is largely judgmental and is based on an assessment of the factors that management believe other market participants would use in determining the fair value of similar financial instruments. The type of adjustments taken, the methodology for the calculation of these adjustments, and the valuation inputs for these calculations are reassessed periodically to reflect current market practice and the availability of new information.
For example, the fair value of certain financial instruments includes adjustments for credit risk; both with regards to counterparty credit risk on positions held and Nomura’s own creditworthiness on positions issued. Credit risk on financial assets is significantly mitigated by credit enhancements such as collateral and netting arrangements. Any net credit exposure is measured using available and applicable valuation inputs for the relevant counterparty. The same approach is used to measure the credit exposure on Nomura’s financial liabilities as is used to measure counterparty credit risk on Nomura’s financial assets.
Such valuation pricing models are calibrated to the market on a regular basis and inputs used are adjusted for current market conditions and risks. The Global Model Validation Group (“MVG”) within Nomura’s Risk Management Department reviews pricing models and assesses model appropriateness and consistency independently of the front office. The model reviews consider a number of factors about a model’s suitability for valuation and sensitivity of a particular product. Valuation models are calibrated to the market on a periodic basis by comparison to observable market pricing, comparison with alternative models and analysis of risk profiles.
As explained above, any changes in fixed income, equity, foreign exchange and commodity markets can impact Nomura’s estimates of fair value in the future, potentially affecting trading gains and losses. Where financial contracts have longer maturity dates, Nomura’s estimates of fair value may involve greater subjectivity due to the lack of transparent market data.
Fair value hierarchy
All financial instruments measured at fair value, including those measured at fair value using the fair value option, have been categorized into a three-level hierarchy (“fair value hierarchy”) based on the transparency of valuation inputs used by Nomura to estimate fair value. A financial instrument is classified in the fair value hierarchy based on the lowest level of input that is significant to the fair value measurement of the financial instrument. The three levels of the fair value hierarchy are defined as follows, with Level 1 representing the most transparent inputs and Level 3 representing the least transparent inputs:
Level 1:
Observable valuation inputs that reflect quoted prices (unadjusted) for identical financial instruments traded in active markets at the measurement date.
Level 2:
Valuation inputs other than quoted prices included within Level 1 that are either directly or indirectly observable for the financial instrument.
Level 3:
Unobservable valuation inputs which reflect Nomura assumptions and specific data.
The availability of valuation inputs observable in the market varies by product and can be affected by a variety of factors. Significant factors include, but are not restricted to the prevalence of similar products in the market, especially for customized products, how established the product is in the market, for example, whether it is a new product or is relatively mature, and the reliability of information provided in the market which would depend, for example, on the frequency and volume of current data. A period of significant change in the market may reduce the availability of observable data. Under such circumstances, financial instruments may be reclassified into a lower level in the fair value hierarchy.
Significant judgments used in determining the classification of financial instruments include the nature of the market in which the product would be traded, the underlying risks, the type and liquidity of market data inputs and the nature of observed transactions for similar instruments.
Where valuation models include the use of valuation inputs which are less observable or unobservable in the market, significant management judgment is used in establishing fair value. The valuations for Level 3 financial instruments, therefore, involve a greater degree of judgment than those valuations for Level 1 or Level 2 financial instruments.
Certain criteria management use to determine whether a market is active or inactive include the number of transactions, the frequency that pricing is updated by other market participants, the variability of price quotes among market participants, and the amount of publicly available information.
F-17
Table of Contents
Notes to the Interim Consolidated Financial Statements—(Continued) (UNAUDITED)
The following tables present the amounts of Nomura’s financial instruments measured at fair value on a recurring basis as of March 31, 2018 and September 30, 2018 within the fair value hierarchy.
| Billions of yen | ||||||||||||||||||||
| March 31, 2018 | ||||||||||||||||||||
| Level 1 | Level 2 | Level 3 | Counterparty and Cash Collateral Netting(1) |
Balance as of March 31, 2018 |
||||||||||||||||
| Assets: |
||||||||||||||||||||
| Trading assets and private equity investments(2) |
||||||||||||||||||||
| Equities(3) |
¥ | 1,741 | ¥ | 907 | ¥ | 21 | ¥ | — | ¥ | 2,669 | ||||||||||
| Private equity investments(3) |
— | 3 | 3 | — | 6 | |||||||||||||||
| Japanese government securities |
2,205 | — | — | — | 2,205 | |||||||||||||||
| Japanese agency and municipal securities |
— | 188 | 1 | — | 189 | |||||||||||||||
| Foreign government, agency and municipal securities |
2,980 | 1,234 | 6 | — | 4,220 | |||||||||||||||
| Bank and corporate debt securities and loans for trading purposes |
— | 1,186 | 139 | — | 1,325 | |||||||||||||||
| Commercial mortgage-backed securities (“CMBS”) |
— | 2 | 2 | — | 4 | |||||||||||||||
| Residential mortgage-backed securities (“RMBS”) |
— | 2,803 | 0 | — | 2,803 | |||||||||||||||
| Real estate-backed securities |
— | — | 63 | — | 63 | |||||||||||||||
| Collateralized debt obligations (“CDOs”) and other(4) |
— | 62 | 24 | — | 86 | |||||||||||||||
| Investment trust funds and other |
271 | 67 | 1 | — | 339 | |||||||||||||||
|
|
|
|
|
|
|
|
|
|
|
|||||||||||
| Total trading assets and private equity investments |
7,197 | 6,452 | 260 | — | 13,909 | |||||||||||||||
|
|
|
|
|
|
|
|
|
|
|
|||||||||||
| Derivative assets(5)(13) |
||||||||||||||||||||
| Equity contracts |
2 | 973 | 36 | — | 1,011 | |||||||||||||||
| Interest rate contracts |
16 | 8,009 | 71 | — | 8,096 | |||||||||||||||
| Credit contracts |
0 | 498 | 17 | — | 515 | |||||||||||||||
| Foreign exchange contracts |
0 | 5,447 | 48 | — | 5,495 | |||||||||||||||
| Commodity contracts |
1 | 0 | — | — | 1 | |||||||||||||||
| Netting |
— | — | — | (14,094 | ) | (14,094 | ) | |||||||||||||
|
|
|
|
|
|
|
|
|
|
|
|||||||||||
| Total derivative assets |
19 | 14,927 | 172 | (14,094 | ) | 1,024 | ||||||||||||||
|
|
|
|
|
|
|
|
|
|
|
|||||||||||
| Subtotal |
¥ | 7,216 | ¥ | 21,379 | ¥ | 432 | ¥ | (14,094 | ) | ¥ | 14,933 | |||||||||
|
|
|
|
|
|
|
|
|
|
|
|||||||||||
| Loans and receivables(6) |
— | 484 | 70 | — | 554 | |||||||||||||||
| Collateralized agreements(7) |
— | 1,181 | 5 | — | 1,186 | |||||||||||||||
| Other assets |
||||||||||||||||||||
| Non-trading debt securities |
133 | 353 | — | — | 486 | |||||||||||||||
| Other(2)(3) |
463 | 15 | 169 | — | 647 | |||||||||||||||
|
|
|
|
|
|
|
|
|
|
|
|||||||||||
| Total |
¥ | 7,812 | ¥ | 23,412 | ¥ | 676 | ¥ | (14,094 | ) | ¥ | 17,806 | |||||||||
|
|
|
|
|
|
|
|
|
|
|
|||||||||||
| Liabilities: |
||||||||||||||||||||
| Trading liabilities |
||||||||||||||||||||
| Equities |
¥ | 1,146 | ¥ | 191 | ¥ | 1 | ¥ | — | ¥ | 1,338 | ||||||||||
| Japanese government securities |
2,263 | — | — | — | 2,263 | |||||||||||||||
| Japanese agency and municipal securities |
— | 1 | — | — | 1 | |||||||||||||||
| Foreign government, agency and municipal securities |
2,786 | 590 | — | — | 3,376 | |||||||||||||||
| Bank and corporate debt securities |
— | 391 | 0 | — | 391 | |||||||||||||||
| Residential mortgage-backed securities (“RMBS”) |
— | 1 | — | — | 1 | |||||||||||||||
| Collateralized debt obligations (“CDOs”) and other(4) |
— | 3 | 0 | — | 3 | |||||||||||||||
| Investment trust funds and other |
71 | 25 | 0 | — | 96 | |||||||||||||||
|
|
|
|
|
|
|
|
|
|
|
|||||||||||
| Total trading liabilities |
6,266 | 1,202 | 1 | — | 7,469 | |||||||||||||||
|
|
|
|
|
|
|
|
|
|
|
|||||||||||
| Derivative liabilities(5)(13) |
||||||||||||||||||||
| Equity contracts |
1 | 1,080 | 37 | — | 1,118 | |||||||||||||||
| Interest rate contracts |
9 | 7,427 | 124 | — | 7,560 | |||||||||||||||
| Credit contracts |
0 | 410 | 15 | — | 425 | |||||||||||||||
| Foreign exchange contracts |
0 | 5,066 | 21 | — | 5,087 | |||||||||||||||
| Commodity contracts |
1 | 0 | — | — | 1 | |||||||||||||||
| Netting |
— | — | — | (13,457 | ) | (13,457 | ) | |||||||||||||
|
|
|
|
|
|
|
|
|
|
|
|||||||||||
| Total derivative liabilities |
11 | 13,983 | 197 | (13,457 | ) | 734 | ||||||||||||||
|
|
|
|
|
|
|
|
|
|
|
|||||||||||
| Subtotal |
¥ | 6,277 | ¥ | 15,185 | ¥ | 198 | ¥ | (13,457 | ) | ¥ | 8,203 | |||||||||
|
|
|
|
|
|
|
|
|
|
|
|||||||||||
| Short-term borrowings(8) |
— | 355 | 17 | — | 372 | |||||||||||||||
| Payables and deposits(9) |
— | 0 | (1 | ) | — | (1 | ) | |||||||||||||
| Collateralized financing(7) |
— | 566 | 3 | — | 569 | |||||||||||||||
| Long-term borrowings(8)(10)(11) |
18 | 2,403 | 429 | — | 2,850 | |||||||||||||||
| Other liabilities(12) |
293 | 33 | 1 | — | 327 | |||||||||||||||
|
|
|
|
|
|
|
|
|
|
|
|||||||||||
| Total |
¥ | 6,588 | ¥ | 18,542 | ¥ | 647 | ¥ | (13,457 | ) | ¥ | 12,320 | |||||||||
|
|
|
|
|
|
|
|
|
|
|
|||||||||||
F-18
Table of Contents
Notes to the Interim Consolidated Financial Statements—(Continued) (UNAUDITED)
| Billions of yen | ||||||||||||||||||||
| September 30, 2018 | ||||||||||||||||||||
| Level 1 | Level 2 | Level 3 | Counterparty and Cash Collateral Netting(1) |
Balance as of September 30, 2018 |
||||||||||||||||
| Assets: |
||||||||||||||||||||
| Trading assets and private equity investments(2) |
||||||||||||||||||||
| Equities(3) |
¥ | 1,669 | ¥ | 891 | ¥ | 20 | ¥ | — | ¥ | 2,580 | ||||||||||
| Private equity investments(3) |
— | 3 | 10 | — | 13 | |||||||||||||||
| Japanese government securities |
2,085 | — | — | — | 2,085 | |||||||||||||||
| Japanese agency and municipal securities |
— | 122 | 1 | — | 123 | |||||||||||||||
| Foreign government, agency and municipal securities |
3,109 | 1,389 | 3 | — | 4,501 | |||||||||||||||
| Bank and corporate debt securities and loans for trading purposes |
— | 1,117 | 154 | — | 1,271 | |||||||||||||||
| Commercial mortgage-backed securities (“CMBS”) |
— | 2 | 1 | — | 3 | |||||||||||||||
| Residential mortgage-backed securities (“RMBS”) |
— | 3,732 | 7 | — | 3,739 | |||||||||||||||
| Real estate-backed securities |
— | 2 | 91 | — | 93 | |||||||||||||||
| Collateralized debt obligations (“CDOs”) and other(4) |
— | 51 | 30 | — | 81 | |||||||||||||||
| Investment trust funds and other |
463 | 66 | 1 | — | 530 | |||||||||||||||
|
|
|
|
|
|
|
|
|
|
|
|||||||||||
| Total trading assets and private equity investments |
7,326 | 7,375 | 318 | — | 15,019 | |||||||||||||||
|
|
|
|
|
|
|
|
|
|
|
|||||||||||
| Derivative assets(5) |
||||||||||||||||||||
| Equity contracts |
0 | 1,116 | 43 | — | 1,159 | |||||||||||||||
| Interest rate contracts |
13 | 7,548 | 46 | — | 7,607 | |||||||||||||||
| Credit contracts |
1 | 564 | 24 | — | 589 | |||||||||||||||
| Foreign exchange contracts |
— | 6,683 | 45 | — | 6,728 | |||||||||||||||
| Commodity contracts |
1 | 0 | — | — | 1 | |||||||||||||||
| Netting |
— | — | — | (15,035 | ) | (15,035 | ) | |||||||||||||
|
|
|
|
|
|
|
|
|
|
|
|||||||||||
| Total derivative assets |
15 | 15,911 | 158 | (15,035 | ) | 1,049 | ||||||||||||||
|
|
|
|
|
|
|
|
|
|
|
|||||||||||
| Subtotal |
¥ | 7,341 | ¥ | 23,286 | ¥ | 476 | ¥ | (15,035 | ) | ¥ | 16,068 | |||||||||
|
|
|
|
|
|
|
|
|
|
|
|||||||||||
| Loans and receivables(6) |
— | 523 | 87 | — | 610 | |||||||||||||||
| Collateralized agreements(7) |
— | 790 | 11 | — | 801 | |||||||||||||||
| Other assets |
||||||||||||||||||||
| Non-trading debt securities |
135 | 317 | — | — | 452 | |||||||||||||||
| Other(2)(3) |
476 | 14 | 180 | — | 670 | |||||||||||||||
|
|
|
|
|
|
|
|
|
|
|
|||||||||||
| Total |
¥ | 7,952 | ¥ | 24,930 | ¥ | 754 | ¥ | (15,035 | ) | ¥ | 18,601 | |||||||||
|
|
|
|
|
|
|
|
|
|
|
|||||||||||
| Liabilities: |
||||||||||||||||||||
| Trading liabilities |
||||||||||||||||||||
| Equities |
¥ | 1,376 | ¥ | 193 | ¥ | 0 | ¥ | — | ¥ | 1,569 | ||||||||||
| Japanese government securities |
1,801 | — | — | — | 1,801 | |||||||||||||||
| Japanese agency and municipal securities |
— | 2 | — | — | 2 | |||||||||||||||
| Foreign government, agency and municipal securities |
3,078 | 811 | — | — | 3,889 | |||||||||||||||
| Bank and corporate debt securities |
— | 433 | 1 | — | 434 | |||||||||||||||
| Residential mortgage-backed securities (“RMBS”) |
— | 6 | — | — | 6 | |||||||||||||||
| Collateralized debt obligations (“CDOs”) and other(4) |
— | 0 | — | — | 0 | |||||||||||||||
| Investment trust funds and other |
68 | 0 | 0 | — | 68 | |||||||||||||||
|
|
|
|
|
|
|
|
|
|
|
|||||||||||
| Total trading liabilities |
6,323 | 1,445 | 1 | — | 7,769 | |||||||||||||||
|
|
|
|
|
|
|
|
|
|
|
|||||||||||
| Derivative liabilities(5) |
||||||||||||||||||||
| Equity contracts |
2 | 1,206 | 56 | — | 1,264 | |||||||||||||||
| Interest rate contracts |
7 | 6,969 | 99 | — | 7,075 | |||||||||||||||
| Credit contracts |
1 | 471 | 26 | — | 498 | |||||||||||||||
| Foreign exchange contracts |
2 | 6,452 | 20 | — | 6,474 | |||||||||||||||
| Commodity contracts |
1 | 0 | 0 | — | 1 | |||||||||||||||
| Netting |
— | — | — | (14,481 | ) | (14,481 | ) | |||||||||||||
|
|
|
|
|
|
|
|
|
|
|
|||||||||||
| Total derivative liabilities |
13 | 15,098 | 201 | (14,481 | ) | 831 | ||||||||||||||
|
|
|
|
|
|
|
|
|
|
|
|||||||||||
| Subtotal |
¥ | 6,336 | ¥ | 16,543 | ¥ | 202 | ¥ | (14,481 | ) | ¥ | 8,600 | |||||||||
|
|
|
|
|
|
|
|
|
|
|
|||||||||||
| Short-term borrowings(8) |
— | 366 | 42 | — | 408 | |||||||||||||||
| Payables and deposits(9) |
— | 0 | (1 | ) | — | (1 | ) | |||||||||||||
| Collateralized financing(7) |
— | 352 | 3 | — | 355 | |||||||||||||||
| Long-term borrowings(8)(10)(11) |
13 | 2,660 | 461 | — | 3,134 | |||||||||||||||
| Other liabilities(12) |
308 | 31 | 0 | — | 339 | |||||||||||||||
|
|
|
|
|
|
|
|
|
|
|
|||||||||||
| Total |
¥ | 6,657 | ¥ | 19,952 | ¥ | 707 | ¥ | (14,481 | ) | ¥ | 12,835 | |||||||||
|
|
|
|
|
|
|
|
|
|
|
|||||||||||
F-19
Table of Contents
Notes to the Interim Consolidated Financial Statements—(Continued) (UNAUDITED)
| (1) | Represents the amount offset under counterparty netting of derivative assets and liabilities as well as cash collateral netting against net derivatives. |
| (2) | Certain investments that are measured at fair value using net asset value per share as a practical expedient have not been classified in the fair value hierarchy. As of March 31, 2018 and September 30, 2018, the fair values of these investments which are included in Trading assets and private equity investments were ¥47 billion and ¥35 billion, respectively. As of March 31, 2018 and September 30, 2018, the fair values of these investments which are included in Other assets—Others were ¥2 billion and ¥2 billion, respectively. |
| (3) | Includes equity investments that would have been accounted for under the equity method had Nomura not chosen to elect the fair value option. |
| (4) | Includes collateralized loan obligations (“CLOs”) and asset-backed securities (“ABS”) such as those secured on credit card loans, auto loans and student loans. |
| (5) | Each derivative classification includes derivatives with multiple risk underlyings. For example, interest rate contracts include complex derivatives referencing interest rate risk as well as foreign exchange risk or other factors such as prepayment rates. Credit contracts include credit default swaps as well as derivatives referencing corporate and government debt securities. |
| (6) | Includes loans for which the fair value option has been elected. |
| (7) | Includes collateralized agreements or collateralized financing for which the fair value option has been elected. |
| (8) | Includes structured notes for which the fair value option has been elected. |
| (9) | Includes embedded derivatives bifurcated from deposits received at banks. If unrealized gains are greater than unrealized losses, deposits are reduced by the excess amount. |
| (10) | Includes embedded derivatives bifurcated from issued structured notes. If unrealized gains are greater than unrealized losses, borrowings are reduced by the excess amount. |
| (11) | Includes liabilities recognized from secured financing transactions that are accounted for as financings rather than sales. Nomura elected the fair value option for these liabilities. |
| (12) | Includes loan commitments for which the fair value option has been elected. |
| (13) | Due to the changes in our accounting policy which Nomura adopted on April 1, 2018, certain reclassifications of previously reported amounts have been made to conform to the current year presentation. Please refer to Note 1. “Summary of accounting policies: New accounting pronouncements recently adopted” for further details. |
F-20
Table of Contents
Notes to the Interim Consolidated Financial Statements—(Continued) (UNAUDITED)
Valuation techniques by major class of financial instrument
The valuation techniques used by Nomura to estimate fair value for major classes of financial instruments, together with the significant inputs which determine classification in the fair value hierarchy, are as follows.
Equities and equity securities reported within Other assets—Equities and equity securities reported within Other assets include direct holdings of both listed and unlisted equity securities, and fund investments. The fair value of listed equity securities is determined using quoted prices for identical securities from active markets where available. These valuations should be in line with market practice and therefore can be based on bid prices or mid-market prices. Nomura determines whether the market is active depending on the sufficiency and frequency of trading activity. Where these securities are classified in Level 1 of the fair value hierarchy, no valuation adjustments are made to fair value. Listed equity securities traded in inactive markets are also generally valued using the exchange price and are classified in Level 2. Whilst rare in practice, Nomura may apply a discount or liquidity adjustment to the exchange price of a listed equity security traded in an inactive market if the exchange price is not considered to be an appropriate representation of fair value. These adjustments are determined by individual security and are not determined or influenced by the size of holding. The amount of such adjustments made to listed equity securities traded in inactive markets was ¥nil as of March 31, 2018 and September 30, 2018, respectively. The fair value of unlisted equity securities is determined using the same methodology as private equity investments described below and are usually classified in Level 3 because significant valuation inputs such as liquidity discounts and credit spreads are unobservable. As a practical expedient, fund investments which do not have a readily determinable fair value are generally valued using NAV per share where available. Publicly traded mutual funds which are valued using a daily NAV per share are classified in Level 1. Fund investments where Nomura has the ability to redeem its investment with the investee at NAV per share as of the balance sheet date or within the near term are classified in Level 2. Fund investments where Nomura does not have the ability to redeem in the near term or does not know when it can redeem are classified in Level 3.
Private equity investments—The determination of fair value of unlisted private equity investments requires significant management judgment because the investments, by their nature, have little or no price transparency. Private equity investments are initially carried at cost as an approximation of fair value. Adjustments to carrying value are made if there is third-party evidence of a change in value. Adjustments are also made, in the absence of third-party transactions, if it is determined that the expected exit price of the investment is different from carrying value. In reaching that determination, Nomura primarily uses either a discounted cash flow (“DCF”) or market multiple valuation technique. A DCF valuation technique incorporates estimated future cash flows to be generated from the underlying investee, as adjusted for an appropriate growth rate discounted at a weighted average cost of capital (“WACC”). Market multiple valuation techniques include comparables such as Enterprise Value/earnings before interest, taxes, depreciation and amortization (“EV/EBITDA”) ratios, Price/Earnings (“PE”) ratios, Price/Book ratios, Price/Embedded Value ratios and other multiples based on relationships between numbers reported in the financial statements of the investee and the price of comparable companies. A liquidity discount may also be applied to either a DCF or market multiple valuation to reflect the specific characteristics of the investee. The liquidity discount includes considerations for various uncertainties in the model and inputs to valuation. Where possible these valuations are compared with the operating cash flows and financial performance of the investee or properties relative to budgets or projections, price/earnings data for similar quoted companies, trends within sectors and/or regions and any specific rights or terms associated with the investment, such as conversion features and liquidation preferences. Private equity investments are generally classified in Level 3 since the valuation inputs such as those mentioned above are usually unobservable.
Government, agency and municipal securities—The fair value of Japanese and other G7 government securities is primarily determined using quoted market prices, executable broker or dealer quotations, or alternative pricing sources. These securities are traded in active markets and therefore are classified within Level 1 of the fair value hierarchy. Non-G7 government securities, agency securities and municipal securities are valued using similar pricing sources but are generally classified in Level 2 as they are traded in inactive markets. Certain non-G7 securities may be classified in Level 1 because they are traded in active markets. Certain securities may be classified in Level 3 because they are traded infrequently and there is not sufficient information from comparable securities to classify them in Level 2. These are valued using DCF valuation techniques which include significant unobservable inputs such as credit spreads of the issuer.
F-21
Table of Contents
Notes to the Interim Consolidated Financial Statements—(Continued) (UNAUDITED)
Bank and corporate debt securities—The fair value of bank and corporate debt securities is primarily determined using DCF valuation techniques but also using broker or dealer quotations and recent market transactions of identical or similar debt securities, if available. Consideration is given to the nature of the broker and dealer quotations, namely whether these are indicative or executable, the number of available quotations and how these quotations compare to any available recent market activity or alternative pricing sources. The significant valuation inputs used for DCF valuations are yield curves, asset swap spreads, recovery rates and credit spreads of the issuer. Bank and corporate debt securities are generally classified in Level 2 of the fair value hierarchy because these valuation inputs are usually observable or market-corroborated. Certain bank and corporate debt securities will be classified in Level 3 because they are traded infrequently and there is insufficient information from comparable securities to classify them in Level 2, or credit spreads or recovery rates of the issuer used in DCF valuations are unobservable.
Commercial mortgage-backed securities (“CMBS”) and Residential mortgage-backed securities (“RMBS”)—The fair value of CMBS and RMBS is primarily determined using DCF valuation techniques but also using broker or dealer quotations and recent market transactions of identical or similar securities, if available. Consideration is given to the nature of the broker and dealer quotations, namely whether these are indicative or executable, the number of available quotations and how these quotations compare to any available recent market activity or alternative pricing sources. The significant valuation inputs include yields, prepayment rates, default probabilities and loss severities. CMBS and RMBS securities are generally classified in Level 2 because these valuation inputs are observable or market-corroborated. Certain CMBS and RMBS positions will be classified in Level 3 because they are traded infrequently and there is insufficient information from comparable securities to classify them in Level 2, or one or more of the significant valuation inputs used in DCF valuations are unobservable.
Real estate-backed securities—The fair value of real estate-backed securities is determined using broker or dealer quotations, recent market transactions or by reference to a comparable market index. Consideration is given to the nature of the broker and dealer quotations, namely whether these are indicative or executable, the number of available quotations and how these quotations compare to any available recent market activity or alternative pricing sources. Where all significant inputs are observable, the securities will be classified in Level 2. For certain securities, no direct pricing sources or comparable securities or indices may be available. These securities are valued using DCF or valuation techniques and are classified in Level 3 as the valuation includes significant unobservable valuation inputs such as yields or loss severities.
Collateralized debt obligations (“CDOs”) and other—The fair value of CDOs is primarily determined using DCF valuation techniques but also using broker or dealer quotations and recent market transactions of identical or similar securities, if available. Consideration is given to the nature of the broker and dealer quotations, namely whether these are indicative or executable, the number of available quotations and how these quotations compare to any available recent market activity or alternative pricing sources. The significant valuation inputs used include market spread data for each credit rating, yields, prepayment rates, default probabilities and loss severities. CDOs are generally classified in Level 2 of the fair value hierarchy because these valuation inputs are observable or market-corroborated. CDOs will be classified in Level 3 where one or more of the significant valuation inputs used in the DCF valuations are unobservable.
Investment trust funds and other—The fair value of investment trust funds is primarily determined using NAV per share. Publicly traded funds which are valued using a daily NAV per share are classified in Level 1 of the fair value hierarchy. For funds that are not publicly traded but Nomura has the ability to redeem its investment with the investee at NAV per share on the balance sheet date or within the near term, the investments are classified in Level 2. Investments where Nomura does not have the ability to redeem in the near term or does not know when it can redeem are classified in Level 3. The fair value of certain other investments reported within Investment trust funds and other is determined using DCF valuation techniques. These investments are classified in Level 3 as the valuation includes significant unobservable valuation inputs such as credit spreads of issuer and correlation.
F-22
Table of Contents
Notes to the Interim Consolidated Financial Statements—(Continued) (UNAUDITED)
Derivatives—Equity contracts—Nomura enters into both exchange-traded and OTC equity derivative transactions such as index and equity options, equity basket options and index and equity swaps. Where these derivatives are traded in active markets and the exchange price is representative of fair value, the fair value of exchange-traded equity derivatives is determined using an unadjusted exchange price and classified in Level 1 of the fair value hierarchy. The fair value of exchange-traded equity derivatives which are traded in inactive markets or where the exchange price is not representative of fair value is determined using a model price and are classified in Level 2. The fair value of OTC equity derivatives is determined through option models such as Black-Scholes and Monte Carlo simulation. The significant valuation inputs used include equity prices, dividend yields, volatilities and correlations. Valuation adjustments are also made to model valuations in order to reflect counterparty credit risk on derivative assets and Nomura‘s own creditworthiness on derivative liabilities. OTC equity derivatives are generally classified in Level 2 because all significant valuation inputs and adjustments are observable or market-corroborated. Certain less liquid vanilla or more complex equity derivatives are classified in Level 3 where dividend yield, volatility or correlation valuation inputs are significant and unobservable.
Derivatives—Interest rate contracts—Nomura enters into both exchange-traded and OTC interest rate derivative transactions such as interest rate swaps, currency swaps, interest rate options, forward rate agreements, swaptions, caps and floors. Where these derivatives are traded in active markets and the exchange price is representative of fair value, the fair value of exchange-traded interest rate derivatives is determined using an unadjusted exchange price and classified in Level 1 of the fair value hierarchy. The fair value of exchange-traded interest rate derivatives which are traded in inactive markets or where the exchange price is not representative of fair value is determined using a model price and are classified in Level 2. The fair value of OTC interest rate derivatives is determined through DCF valuation techniques as well as option models such as Black-Scholes and Monte Carlo simulation. The significant valuation inputs used include interest rates, forward foreign exchange (“FX”) rates, volatilities and correlations. Valuation adjustments are also made to model valuations in order to reflect counterparty credit risk on derivative assets and Nomura‘s own creditworthiness on derivative liabilities. OTC interest rate derivatives are generally classified in Level 2 because all significant valuation inputs and adjustments are observable or market-corroborated. Certain less liquid vanilla or more complex OTC interest rate derivatives are classified in Level 3 where interest rate, volatility or correlation valuation inputs are significant and unobservable.
Derivatives—Credit contracts—Nomura enters into OTC credit derivative transactions such as credit default swaps and credit options on single names, indices or baskets of assets. The fair value of OTC credit derivatives is determined through DCF valuation techniques as well as option models such as Black-Scholes and Monte Carlo simulation. The significant valuation inputs used include interest rates, credit spreads, recovery rates, default probabilities, volatilities and correlations. Valuation adjustments are also made to model valuations in order to reflect counterparty credit risk on derivative assets and Nomura’s own creditworthiness on derivative liabilities. OTC credit derivatives are generally classified in Level 2 of the fair value hierarchy because all significant valuation inputs and adjustments are observable or market-corroborated. Certain less liquid vanilla or more complex OTC credit derivatives are classified in Level 3 where credit spread, recovery rate, volatility or correlation valuation inputs are significant and unobservable.
Derivatives—Foreign exchange contracts—Nomura enters into both exchange-traded and OTC foreign exchange derivative transactions such as foreign exchange forwards and currency options. The fair value of exchange-traded foreign exchange derivatives which are traded in inactive markets or where the exchange price is not representative of fair value is determined using a model price and are classified in Level 2. The fair value of OTC foreign exchange derivatives is determined through DCF valuation techniques as well as option models such as Black-Scholes and Monte Carlo simulation. The significant valuation inputs used include interest rates, forward FX rates, spot FX rates and volatilities. Valuation adjustments are also made to model valuations in order to reflect counterparty credit risk on derivative assets and Nomura’s own creditworthiness on derivative liabilities. OTC foreign exchange derivatives are generally classified in Level 2 because all significant valuation inputs and adjustments are observable or market-corroborated. Certain foreign exchange derivatives are classified in Level 3 where interest rates, volatility or correlation valuation inputs are significant and unobservable.
Nomura includes valuation adjustments in its estimation of fair value of certain OTC derivatives relating to funding costs associated with these transactions to be consistent with how market participants in the principal market for these derivatives would determine fair value.
F-23
Table of Contents
Notes to the Interim Consolidated Financial Statements—(Continued) (UNAUDITED)
Loans—The fair value of loans carried at fair value either as trading assets or through election of the fair value option is primarily determined using DCF valuation techniques as quoted prices are typically not available. The significant valuation inputs used are similar to those used in the valuation of corporate debt securities described above. Loans are generally classified in Level 2 of the fair value hierarchy because all significant valuation inputs are observable. Certain loans, however, are classified in Level 3 because they are traded infrequently and there is not sufficient information from comparable securities to classify them in Level 2 or credit spreads of the issuer used in DCF valuations are significant and unobservable.
Collateralized agreements and Collateralized financing—The primary types of collateralized agreement and financing transactions carried at fair value are reverse repurchase and repurchase agreements elected for the fair value option. The fair value of these financial instruments is primarily determined using DCF valuation techniques. The significant valuation inputs used include interest rates and collateral funding spreads such as general collateral or special rates. Reverse repurchase and repurchase agreements are generally classified in Level 2 of the fair value hierarchy because these valuation inputs are usually observable.
Non-trading debt securities—These are debt securities held by certain non-trading subsidiaries in the group and are valued and classified in the fair value hierarchy using the same valuation techniques used for other debt securities classified as Government, agency and municipal securities and Bank and corporate debt securities described above.
Short-term and long-term borrowings (“Structured notes”)—Structured notes are debt securities issued by Nomura or by consolidated variable interest entities (“VIEs”) which contain embedded features that alter the return to the investor from simply receiving a fixed or floating rate of interest to a return that depends upon some other variables, such as an equity or equity index, commodity price, foreign exchange rate, credit rating of a third party or a more complex interest rate (i.e., an embedded derivative).
The fair value of structured notes is determined using a quoted price in an active market for the identical liability if available, and where not available, using a mixture of valuation techniques that use the quoted price of the identical liability when traded as an asset, quoted prices for similar liabilities, similar liabilities when traded as assets, or an internal model which combines DCF valuation techniques and option pricing models, depending on the nature of the embedded features within the structured note. Where an internal model is used, Nomura estimates the fair value of both the underlying debt instrument and the embedded derivative components. The significant valuation inputs used to estimate the fair value of the debt instrument component include yield curves, prepayment rates, default probabilities and loss severities. The significant valuation inputs used to estimate the fair value of the embedded derivative component are the same as those used for the relevant type of freestanding OTC derivative discussed above. A valuation adjustment is also made to the entire structured note in order to reflect Nomura’s own creditworthiness. This adjustment is determined based on recent observable secondary market transactions and executable broker quotes involving Nomura debt instruments and is therefore typically treated as a Level 2 valuation input. Structured notes are generally classified in Level 2 of the fair value hierarchy as all significant valuation inputs and adjustments are observable. Where any unobservable inputs are significant, such as yields, prepayment rates, default probabilities, loss severities, volatilities and correlations used to estimate the fair value of the embedded derivative component, structured notes are classified in Level 3.
Long-term borrowings (“Secured financing transactions”)—Secured financing transactions are liabilities recognized when a transfer of a financial asset does not meet the criteria for sales accounting under ASC 860 “Transfer and Servicing” (“ASC 860”) and therefore the transaction is accounted for as a secured borrowing. These liabilities are valued using the same valuation techniques that are applied to the transferred financial assets which remain on the consolidated balance sheets and are therefore classified in the same level in the fair value hierarchy as the transferred financial assets. These liabilities do not provide general recourse to Nomura and therefore no adjustment is made to reflect Nomura’s own creditworthiness.
F-24
Table of Contents
Notes to the Interim Consolidated Financial Statements—(Continued) (UNAUDITED)
Valuation processes
In order to ensure the appropriateness of any fair value measurement of a financial instrument used within these consolidated financial statements, including those classified in Level 3 within the fair value hierarchy, Nomura operates a governance framework which mandates determination or validation of a fair value measurement by control and support functions independent of the trading businesses assuming the risk of the financial instrument. Such functions within Nomura with direct responsibility for either defining, implementing or maintaining valuation policies and procedures are as follows:
| • | The Product Control Valuations Group (“PCVG”) within Nomura’s Finance Department has primary responsibility for determining and implementing valuation policies and procedures in connection with determination of fair value measurements. In particular, this group will ensure that valuation policies are documented for each type of financial instrument in accordance with U.S. GAAP. While it is the responsibility of market makers and investment professionals in our trading businesses to price our financial instruments, the PCVG are responsible for independently verifying or validating these prices. In the event of a difference in opinion or where the estimate of fair value requires significant judgment, the valuation used within these consolidated financial statements is reviewed by senior managers independent of the trading businesses. The PCVG group reports to the Global Head of Product Control and ultimately to the Chief Financial Officer (“CFO”); |
| • | The Accounting Policy Group within Nomura’s Finance Department defines the group’s accounting policies and procedures in accordance with U.S. GAAP, including those associated with determination of fair value under ASC 820 and other relevant U.S. GAAP pronouncements. This group reports to the Global Head of Accounting Policy and ultimately to the CFO; and |
| • | The MVG within Nomura’s Risk Management Department validates the appropriateness and consistency of pricing models used to determine fair value measurements independently of those who design and build the models. This group reports to the Chief Risk Officer. |
The fundamental components of this governance framework over valuation processes within Nomura particularly as it relates to Level 3 financial instruments are the procedures in place for independent price verification, pricing model validation and revenue substantiation.
Independent price verification processes
The key objective of the independent price verification processes within Nomura is to verify the appropriateness of fair value measurements applied to all financial instruments within Nomura. In applying these control processes, observable inputs are used whenever possible and when unobservable inputs are necessary, the processes seek to ensure the valuation technique and inputs are appropriate, reasonable and consistently applied.
The independent price verification processes aim to verify the fair value of all positions to external levels on a regular basis. The process will involve obtaining data such as trades, marks and prices from internal and external sources and examining the impact of marking the internal positions at the external prices. Margin disputes within the collateral process will also be investigated to determine if there is any impact on valuations.
Where third-party pricing information sourced from brokers, dealers and consensus pricing services is used as part of the price verification process, consideration is given as to whether that information reflects actual recent market transactions or prices at which transactions involving identical or similar financial instruments are currently executable. If such transactions or prices are not available, the financial instrument will generally be classified in Level 3.
Where there is a lack of observable market information around the inputs used in a fair value measurement, then the PCVG and the MVG will assess the inputs used for reasonableness considering available information including comparable products, surfaces, curves and past trades. Additional valuation adjustments may be taken for the uncertainty in the inputs used, such as correlation and where appropriate trading desks may be asked to execute trades to evidence market levels.
F-25
Table of Contents
Notes to the Interim Consolidated Financial Statements—(Continued) (UNAUDITED)
Model review and validation
For more complex financial instruments pricing models are used to determine fair value measurements. The MVG performs an independent model approval process which incorporates a review of the model assumptions across a diverse set of parameters. Considerations include:
| • | Scope of the model (different financial instruments may require different but consistent pricing approaches); |
| • | Mathematical and financial assumptions; |
| • | Full or partial independent benchmarking along with boundary and stability tests, numerical convergence, calibration quality and stability; |
| • | Model integration within Nomura’s trading and risk systems; |
| • | Calculation of risk numbers and risk reporting; and |
| • | Hedging strategies/practical use of the model. |
New models are reviewed and approved by the MVG. The frequency of subsequent MVG reviews (“Model Re-approvals”) is at least annually.
Revenue substantiation
Nomura’s Product Control function also ensures adherence to Nomura’s valuation policies through daily and periodic analytical review of net revenues. This process involves substantiating revenue amounts through explanations and attribution of revenue sources based on the underlying factors such as interest rates, credit spreads, volatilities, foreign exchange rates etc. In combination with the independent price verification processes, this daily, weekly, monthly and quarterly review substantiates the revenues made while helping to identify and resolve potential booking, pricing or risk quantification issues.
Level 3 financial instruments
As described above, the valuation of Level 3 financial assets and liabilities is dependent on certain significant valuation inputs which are unobservable. Common characteristics of an inactive market include a low number of transactions of the financial instrument, stale or non-current price quotes, price quotes that vary substantially either over time or among market makers, non-executable broker quotes or little publicly released information.
If corroborative evidence is not available to value Level 3 financial instruments, fair value may be measured using other equivalent products in the market. The level of correlation between the specific Level 3 financial instrument and the available benchmark instrument is considered as an unobservable valuation input. Other techniques for determining an appropriate value for unobservable input may consider information such as consensus pricing data among certain market participants, historical trends, extrapolation from observable market data and other information Nomura would expect market participants to use in valuing similar instruments.
Use of reasonably possible alternative valuation input assumptions to value Level 3 financial instruments will significantly influence fair value determination. Ultimately, the uncertainties described above about input assumptions imply that the fair value of Level 3 financial instruments is a judgmental estimate. The specific valuation for each instrument is based on management’s judgment of prevailing market conditions, in accordance with Nomura’s established valuation policies and procedures.
F-26
Table of Contents
Notes to the Interim Consolidated Financial Statements—(Continued) (UNAUDITED)
Quantitative and qualitative information regarding significant unobservable inputs
The following tables present quantitative and qualitative information about the significant unobservable valuation inputs used by Nomura to measure the fair value of financial instruments classified in Level 3 as of March 31, 2018 and September 30, 2018. These financial instruments will also typically include observable valuation inputs (i.e. Level 1 or Level 2 valuation inputs) which are not included in the table and are also often hedged using financial instruments which are classified in Level 1 or Level 2 of the fair value hierarchy. Changes in each of these significant unobservable valuation inputs used by Nomura will impact upon the fair value measurement of the financial instrument. The following tables also therefore qualitatively summarize the sensitivity of the fair value measurement for each type of financial instrument as a result of an increase in each unobservable valuation input and summarize the interrelationship between significant unobservable valuation inputs where more than one is used to measure fair value.
| March 31, 2018 | ||||||||||||||||||||
| Financial Instrument |
Fair value in billions of yen |
Valuation technique |
Significant unobservable valuation |
Range of valuation inputs(1) |
Weighted Average(2) |
Impact of |
Interrelationships between valuation inputs(5) | |||||||||||||
| Assets: |
||||||||||||||||||||
| Trading assets and private equity investments |
||||||||||||||||||||
| Equities |
¥ | 21 | DCF | Liquidity discounts | 27.5 – 75.0% | 68.3% | Lower fair value | Not applicable | ||||||||||||
|
|
|
|
|
|
|
|
|
|
| |||||||||||
| Foreign government, agency and municipal securities |
6 | DCF | Credit spreads | 0.0 – 6.7% | 0.8% | Lower fair value | Not applicable | |||||||||||||
|
|
|
|
|
|
|
|
|
|
| |||||||||||
| Bank and corporate debt securities and loans for trading purposes |
139 | DCF | Credit spreads Recovery rates |
|
0.1 – 19.6% 0.0 –98.0% |
|
|
4.1% 74.7% |
|
Lower fair value Higher fair value | No predictable interrelationship | |||||||||
|
|
|
|
|
|
|
|
|
|
| |||||||||||
| Commercial mortgage-backed securities (“CMBS”) |
2 | DCF | Yields | 6.6 – 8.9% | 7.7% | Lower fair value | Not applicable | |||||||||||||
|
|
|
|
|
|
|
|
|
|
| |||||||||||
| Real estate-backed securities |
63 | DCF | Yields Loss severities |
|
6.2 – 23.9% 0.0 –70.8% |
|
|
16.3% 8.1% |
|
Lower fair value Lower fair value | No predictable interrelationship | |||||||||
|
|
|
|
|
|
|
|
|
|
| |||||||||||
| Collateralized debt obligations (“CDOs”) and other |
24 | DCF | Yields Prepayment rates Default probabilities Loss severities |
|
6.0 – 24.0% 20.0% 1.0 – 2.0% 40.0 – 100.0% |
|
|
13.1% 20.0% 2.0% 91.6% |
|
Lower fair value Lower fair value Lower fair value Lower fair value | Change in default probabilities typically accompanied by directionally similar change in loss severities and opposite change in prepayment rates | |||||||||
|
|
|
|
|
|
|
|
|
|
| |||||||||||
F-27
Table of Contents
Notes to the Interim Consolidated Financial Statements—(Continued) (UNAUDITED)
| March 31, 2018 | ||||||||||||||||||||
| Financial Instrument |
Fair value in billions of yen |
Valuation technique |
Significant unobservable valuation |
Range of valuation inputs(1) |
Weighted Average(2) |
Impact of |
Interrelationships between valuation inputs(5) | |||||||||||||
| Derivatives, net: |
||||||||||||||||||||
| Equity contracts |
¥ | (1 | ) | Option models | Dividend yield Volatilities Correlations |
|
0.0 – 11.5% 7.3 – 64.0% (0.84) – 0.95 |
|
|
— — — |
|
Higher fair value Higher fair value Higher fair value | No predictable interrelationship | |||||||
|
|
|
|
|
|
|
|
|
|
| |||||||||||
| Interest rate contracts |
(53 | ) | DCF/ Option models |
Interest rates Volatilities Volatilities Correlations |
|
0.2 – 3.0% 11.2 – 15.7% 28.0 – 71.2 bp (0.67) – 0.98 |
|
|
— — — — |
|
Higher fair value Higher fair value Higher fair value Higher fair value | No predictable interrelationship | ||||||||
|
|
|
|
|
|
|
|
|
|
| |||||||||||
| Credit contracts |
2 | DCF/ Option models |
Credit spreads Recovery rates Volatilities Correlations |
|
0.0 – 122.1% 0.0 – 90.0% 35.0 – 83.0% 0.34 – 0.82 |
|
|
— — — — |
|
Higher fair value Higher fair value Higher fair value Higher fair value | No predictable interrelationship | |||||||||
|
|
|
|
|
|
|
|
|
|
| |||||||||||
| Foreign exchange contracts |
27 | DCF/ Option models |
Interest rates Volatilities Volatilities Correlations |
|
0.2 – 2.6% 2.4 – 23.7% 237.0 – 280.0 bp (0.25) – 0.80 |
|
|
— — — — |
|
Higher fair value Higher fair value Higher fair value Higher fair value | No predictable interrelationship | |||||||||
|
|
|
|
|
|
|
|
|
|
| |||||||||||
| Loans and receivables |
70 | DCF | Credit spreads | 0.0 – 9.5% | 4.0% | Lower fair value | Not applicable | |||||||||||||
|
|
|
|
|
|
|
|
|
|
| |||||||||||
| Collateralized agreements |
5 | DCF | Repo rate | 3.5% | 3.5% | Lower fair value | Not applicable | |||||||||||||
|
|
|
|
|
|
|
|
|
|
| |||||||||||
| Other assets |
||||||||||||||||||||
| Other(6) |
169 | DCF | WACC Growth rates Liquidity discounts |
|
11.4% 2.5% 10.0% |
|
|
11.4% 2.5% 10.0% |
|
Lower fair value Higher fair value Lower fair value | No predictable interrelationship | |||||||||
|
|
|
|
|
|
|
|
| |||||||||||||
| Market multiples | EV/EBITDA ratios PE ratios Price/Book ratios Liquidity discounts |
|
3.3 – 7.8 x 7.5 – 126.4 x 0.0 – 2.2 x 10.0 – 30.0% |
|
|
5.7 x 23.0 x 0.6 x 29.0% |
|
Higher fair value Higher fair value Higher fair value Lower fair value | Generally changes in multiples results in a corresponding similar directional change in a fair value measurement, assuming earnings levels remain constant. | |||||||||||
|
|
|
|
|
|
|
|
|
|
| |||||||||||
| Liabilities: |
||||||||||||||||||||
| Short-term borrowings |
17 | DCF/ Option models |
Volatilities Correlations |
|
7.3 – 50.9% (0.84) – 0.95 |
|
|
— — |
|
Higher fair value Higher fair value | No predictable interrelationship | |||||||||
|
|
|
|
|
|
|
|
|
|
| |||||||||||
| Collateralized financing |
3 | DCF | Repo rate | 3.5% | 3.5% | Lower fair value | Not applicable | |||||||||||||
|
|
|
|
|
|
|
|
|
|
| |||||||||||
| Long-term borrowings |
429 | DCF/ Option models |
Volatilities Volatilities Correlations |
|
7.3 – 50.9% 33.5 – 62.3 bp (0.84) – 0.98 |
|
|
— — — |
|
Higher fair value Higher fair value Higher fair value | No predictable interrelationship | |||||||||
|
|
|
|
|
|
|
|
|
|
| |||||||||||
F-28
Table of Contents
Notes to the Interim Consolidated Financial Statements—(Continued) (UNAUDITED)
| September 30, 2018 | ||||||||||||||||||||
| Financial Instrument |
Fair value in billions of yen |
Valuation technique |
Significant unobservable input |
Range of valuation inputs(1) |
Weighted Average(2) |
Impact of |
Interrelationships between valuation inputs(5) | |||||||||||||
| Assets: |
||||||||||||||||||||
| Trading assets and private equity investments |
||||||||||||||||||||
| Equities |
¥ | 20 | DCF | Liquidity discounts | 75.0% | 75.0% | Lower fair value | Not applicable | ||||||||||||
|
|
|
|
|
|
|
|
|
|
| |||||||||||
| Foreign government, agency and municipal securities |
3 | DCF | Credit spreads | 0.0 – 7.7% | 0.9% | Lower fair value | Not applicable | |||||||||||||
|
|
|
|
|
|
|
|
|
|
| |||||||||||
| Bank and corporate debt securities and loans for trading purposes |
154 | DCF | Credit spreads Recovery rates |
|
0.3 – 13.2% 0.0 – 99.1% |
|
|
4.5% 90.0% |
|
Lower fair value Higher fair value | No predictable interrelationship | |||||||||
|
|
|
|
|
|
|
|
|
|
| |||||||||||
| Residential mortgage-backed securities (“RMBS”) |
7 | DCF | Yields Prepayment rates Loss severities |
|
0.0 – 36.4% 6.5 – 15.0% 10.6 – 100.0% |
|
|
3.6% 7.3% 74.7% |
|
Lower fair value Lower fair value Lower fair value | No predictable interrelationship | |||||||||
|
|
|
|
|
|
|
|
|
|
| |||||||||||
| Real estate-backed securities |
91 | DCF | Yields Loss severities |
|
6.8 – 22.6% 0.0 – 55.0% |
|
|
13.7% 8.1% |
|
Lower fair value Lower fair value | No predictable interrelationship | |||||||||
|
|
|
|
|
|
|
|
|
|
| |||||||||||
| Collateralized debt obligations (“CDOs”) and other |
30 | DCF | Yields Prepayment rates Default probabilities Loss severities |
|
6.0 – 20.0% 20.0% 1.0 – 2.0% |
|
|
13.0% 20.0% 2.0% 89.0% |
|
Lower fair value Lower fair value Lower fair value Lower fair value | Change in default probabilities typically accompanied by directionally similar change in loss severities and opposite change in prepayment rates | |||||||||
|
|
|
|
|
|
|
|
|
|
| |||||||||||
F-29
Table of Contents
Notes to the Interim Consolidated Financial Statements—(Continued) (UNAUDITED)
| September 30, 2018 | ||||||||||||||||||||
| Financial Instrument |
Fair value in billions of yen |
Valuation technique |
Significant unobservable input |
Range of valuation inputs(1) |
Weighted Average(2) |
Impact of |
Interrelationships between valuation inputs(5) | |||||||||||||
| Derivatives, net: |
||||||||||||||||||||
| Equity contracts |
(13 | ) | Option models | Dividend yield Volatilities Correlations |
|
0.0 – 8.9% 12.1 – 70.0% |
|
|
— — — |
|
Higher fair value Higher fair value Higher fair value | No predictable interrelationship | ||||||||
|
|
|
|
|
|
|
|
|
|
| |||||||||||
| Interest rate contracts |
(53 | ) | DCF/ Option models |
Interest rates Volatilities Volatilities Correlations |
|
0.3 – 3.0% 11.2 – 15.1% 27.8 – 70.6 bp (1.00) – 1.00 |
|
|
— — — — |
|
Higher fair value Higher fair value Higher fair value Higher fair value | No predictable interrelationship | ||||||||
|
|
|
|
|
|
|
|
|
|
| |||||||||||
| Credit contracts |
(2 | ) | DCF/ Option models |
Credit spreads Recovery rates Volatilities Correlations |
|
0.0 – 188.5% 0.0 – 100.5% 16.2 – 83.0% 0.30 – 0.96 |
|
|
— — — — |
|
Higher fair value Higher fair value Higher fair value Higher fair value | No predictable interrelationship | ||||||||
|
|
|
|
|
|
|
|
|
|
| |||||||||||
| Foreign exchange contracts |
25 | Option models | Interest rates Volatilities Volatilities Correlations |
|
0.3 – 2.8% 1.8 –29.5% 310.0 –356.0 bp (0.25) – 0.80 |
|
|
— — — — |
|
Higher fair value Higher fair value Higher fair value Higher fair value | No predictable interrelationship | |||||||||
|
|
|
|
|
|
|
|
|
|
| |||||||||||
| Loans and receivables |
87 | DCF | Credit spreads | 0.0 – 10.9% | 4.0% | Lower fair value | Not applicable | |||||||||||||
|
|
|
|
|
|
|
|
|
|
| |||||||||||
| Collateralized agreements |
11 | DCF | Repo rate | 3.5 – 4.9% | 4.2% | Lower fair value | Not applicable | |||||||||||||
|
|
|
|
|
|
|
|
|
|
| |||||||||||
| Other assets |
||||||||||||||||||||
| Other(6) |
180 | DCF | WACC Growth rates Liquidity discounts |
|
11.2% 2.5% 10.0% |
|
|
11.2% 2.5% 10.0% |
|
Lower fair value Higher fair value Lower fair value | No predictable interrelationship | |||||||||
|
|
|
|
|
|
|
|
| |||||||||||||
| Market multiples | EV/EBITDA ratios PE Ratios Price/Book ratios Liquidity discounts |
|
4.2 – 14.4 x 9.9 – 31.1 x 0.4 – 2.5 x 10.0 – 50.0% |
|
|
7.9 x 17.4 x 0.7 x 30.7% |
|
Higher fair value Higher fair value Higher fair value Lower fair value | Generally changes in multiples results in a corresponding similar directional change in a fair value measurement, assuming earnings levels remain constant. | |||||||||||
|
|
|
|
|
|
|
|
|
|
| |||||||||||
| Liabilities: |
||||||||||||||||||||
| Short-term borrowings |
¥ | 42 | DCF/ Option models |
Volatilities Correlations |
|
12.9 – 58.7% (0.75) – 0.95 |
|
|
— — |
|
Higher fair value Higher fair value | No predictable interrelationship | ||||||||
|
|
|
|
|
|
|
|
|
|
| |||||||||||
| Collateralized financing |
3 | DCF | Repo rate | 3.5% | 3.5% | Lower fair value | Not applicable | |||||||||||||
|
|
|
|
|
|
|
|
|
|
| |||||||||||
| Long-term borrowings |
461 | DCF/ Option models |
Volatilities Volatilities Correlations |
|
11.2 – 58.7% 33.8 – 68.9 bp (1.00) – 0.98 |
|
|
— — — |
|
Higher fair value Higher fair value Higher fair value | No predictable interrelationship | |||||||||
|
|
|
|
|
|
|
|
|
|
| |||||||||||
| (1) | Range information is provided in percentages, coefficients and multiples and represents the highest and lowest level significant unobservable valuation input used to value that type of financial instrument. A wide dispersion in the range does not necessarily reflect increased uncertainty or subjectivity in the valuation input and is typically just a consequence of the different characteristics of the financial instruments themselves. |
| (2) | Weighted average information for non-derivative instruments is calculated by weighting each valuation input by the fair value of the financial instrument. |
| (3) | The above table only considers the impact of an increase in each significant unobservable valuation input on the fair value measurement of the financial instrument. However, a decrease in the significant unobservable valuation input would have the opposite effect on the fair value measurement of the financial instrument. For example, if an increase in a significant unobservable valuation input would result in a lower fair value measurement, a decrease in the significant unobservable valuation input would result in a higher fair value measurement. |
| (4) | The impact of an increase in the significant unobservable input on the fair value measurement for a derivative assumes Nomura is long risk to the input e.g., long volatility. Where Nomura is short such risk, the impact of an increase would have a converse effect on the fair value measurement of the derivative. |
| (5) | Consideration of the interrelationships between significant unobservable inputs is only relevant where more than one unobservable valuation input is used to determine the fair value measurement of the financial instrument. |
| (6) | Valuation technique(s) and unobservable valuation inputs in respect of equity securities reported within Other assets in the consolidated balance sheets. |
F-30
Table of Contents
Notes to the Interim Consolidated Financial Statements—(Continued) (UNAUDITED)
Qualitative discussion of the ranges of significant unobservable inputs
The following comments present qualitative discussion about the significant unobservable valuation inputs used by Nomura for financial instruments classified in Level 3.
Derivatives—Equity contracts—The significant unobservable inputs are dividend yield, volatilities and correlations. The range of dividend yields varies as some companies do not pay any dividends, for example due to a lack of profits or as a policy during a growth period, and hence have a zero dividend yield while others may pay high dividends for example to return money to investors. The range of volatilities is wide as the volatilities of shorter-dated equity derivatives or those based on single equity securities can be higher than those of longer-dated instruments or those based on indices. Correlations represent the relationships between one input and another (“pairs”) and can either be positive or negative amounts. The range of correlations moves from positive to negative because the movement of some pairs is very closely related and in the same direction causing highly positive correlations while others generally move in opposite directions causing highly negative correlations with pairs that have differing relationships throughout the range.
Derivatives—Interest rate contracts—The significant unobservable inputs are interest rates, volatilities and correlations. The range of interest rates is due to interest rates in different countries/currencies being at different levels with some countries having extremely low levels and others being at levels that while still relatively low are less so. The range of volatilities is wide as volatilities can be higher when interest rates are at extremely low levels, and also because volatilities of shorter-dated interest rate derivatives are typically higher than those of longer-dated instruments. The range of correlations moves from positive to negative because the movement of some pairs is very closely related and in the same direction causing highly positive correlations while others generally move in opposite directions causing highly negative correlations with pairs that have differing relationships through the range. All significant unobservable inputs are spread across the ranges.
Derivatives—Credit contracts—The significant unobservable inputs are credit spreads, recovery rates, volatilities and correlations. The range of credit spreads reflects the different risk of default present within the portfolio. At the low end of the range, underlying reference names have a very limited risk of default whereas at the high end of the range, underlying reference names have a much greater risk of default. The range of recovery rates varies primarily due to the seniority of the underlying exposure with senior exposures having a higher recovery than subordinated exposures. The range of volatilities is wide as the volatilities of shorter-dated credit contracts are typically higher than those of longer-dated instruments. The correlation range is positive since credit spread moves are generally in the same direction. Highly positive correlations are those for which the movement is very closely related and in the same direction, with correlation falling as the relationship becomes less strong.
Derivatives—Foreign exchange contracts—The significant unobservable inputs are interest rates, volatilities and correlations. The range of interest rates is due to interest rates in different countries/currencies being at different levels with some countries having extremely low levels and others being at levels that while still relatively low are less so. The range of volatilities is mainly due to the lower end of the range arising from currencies that trade in narrow ranges e.g. versus the U.S. Dollar while the higher end comes from currencies with a greater range of movement such as emerging market currencies. The range of correlations moves from positive to negative because the movement of some pairs is very closely related and in the same direction causing highly positive correlations while others generally move in opposite directions causing highly negative correlations with pairs that have differing relationships through the range.
Short-term borrowings and Long-term borrowings—The significant unobservable inputs are yields, prepayment rates, default probabilities, loss severities, volatilities and correlations. The range of volatilities is wide as the volatilities of shorter-dated instruments are typically higher than those in longer-dated instruments. The range of correlations moves from positive to negative because the movement of some pairs is very closely related and in the same direction causing highly positive correlations while others generally move in opposite directions causing highly negative correlations with pairs that have differing relationships through the range.
F-31
Table of Contents
Notes to the Interim Consolidated Financial Statements—(Continued) (UNAUDITED)
Movements in Level 3 financial instruments
The following tables present gains and losses as well as increases and decreases of financial instruments measured at fair value on a recurring basis which Nomura classified in Level 3 for the six and three months ended September 30, 2017 and 2018. Financial instruments classified in Level 3 are often hedged with instruments within Level 1 or Level 2 of the fair value hierarchy. The gains or losses presented below do not reflect the offsetting gains or losses for these hedging instruments. Level 3 financial instruments are also measured using both observable and unobservable valuation inputs. Fair value changes presented below, therefore, reflect realized and unrealized gains and losses resulting from movements in both observable and unobservable valuation inputs.
For the six months ended September 30, 2017 and 2018, gains and losses related to Level 3 assets and liabilities did not have a material impact on Nomura’s liquidity and capital resources management.
| Billions of yen | ||||||||||||||||||||||||||||||||||||||||
| Six months ended September 30, 2017 | ||||||||||||||||||||||||||||||||||||||||
| Beginning balance as of six months ended September 30, 2017 |
Total gains (losses) recognized in revenue(1) |
Total gains (losses) recognized in other comprehensive income |
Purchases / issues(2) |
Sales / redemptions(2) |
Settlements | Foreign exchange movements |
Transfers into Level 3(3) |
Transfers out of Level 3(3) |
Balance as of six months ended September 30, 2017 |
|||||||||||||||||||||||||||||||
| Assets: |
||||||||||||||||||||||||||||||||||||||||
| Trading assets and private equity investments |
||||||||||||||||||||||||||||||||||||||||
| Equities |
¥ | 34 | ¥ | 1 | ¥ | — | ¥ | 17 | ¥ | (6 | ) | ¥ | — | ¥ | 0 | ¥ | 1 | ¥ | (2 | ) | ¥ | 45 | ||||||||||||||||||
| Private equity investments |
13 | 1 | — | 0 | (9 | ) | — | 1 | 0 | (1 | ) | 5 | ||||||||||||||||||||||||||||
| Japanese agency and municipal securities |
1 | 0 | — | — | 0 | — | — | — | — | 1 | ||||||||||||||||||||||||||||||
| Foreign government, agency and municipal securities |
3 | 1 | — | 32 | (33 | ) | — | 0 | 4 | (1 | ) | 6 | ||||||||||||||||||||||||||||
| Bank and corporate debt securities and loans for trading purposes |
108 | 5 | — | 50 | (41 | ) | — | 1 | 9 | (4 | ) | 128 | ||||||||||||||||||||||||||||
| Commercial mortgage-backed securities (“CMBS”) |
1 | 0 | — | 4 | (2 | ) | — | 0 | — | (2 | ) | 1 | ||||||||||||||||||||||||||||
| Residential mortgage-backed securities (“RMBS”) |
0 | 0 | — | 1 | (1 | ) | — | 1 | — | — | 1 | |||||||||||||||||||||||||||||
| Real estate-backed securities |
41 | 0 | — | 22 | (26 | ) | — | 0 | — | — | 37 | |||||||||||||||||||||||||||||
| Collateralized debt obligations (“CDOs”) and other |
27 | (6 | ) | — | 25 | (28 | ) | — | 0 | 4 | (4 | ) | 18 | |||||||||||||||||||||||||||
| Investment trust funds and other |
0 | 0 | — | 1 | 0 | — | 0 | 0 | 0 | 1 | ||||||||||||||||||||||||||||||
|
|
|
|
|
|
|
|
|
|
|
|
|
|
|
|
|
|
|
|
|
|||||||||||||||||||||
| Total trading assets and private equity investments |
228 | 2 | — | 152 | (146 | ) | — | 3 | 18 | (14 | ) | 243 | ||||||||||||||||||||||||||||
|
|
|
|
|
|
|
|
|
|
|
|
|
|
|
|
|
|
|
|
|
|||||||||||||||||||||
| Derivatives, net(4) |
||||||||||||||||||||||||||||||||||||||||
| Equity contracts |
(6 | ) | (1 | ) | — | — | — | (3 | ) | (1 | ) | 5 | 5 | (1 | ) | |||||||||||||||||||||||||
| Interest rate contracts |
(22 | ) | 8 | — | — | — | 10 | 0 | 1 | (28 | ) | (31 | ) | |||||||||||||||||||||||||||
| Credit contracts |
(10 | ) | 3 | — | — | — | 1 | 1 | (2 | ) | 0 | (7 | ) | |||||||||||||||||||||||||||
| Foreign exchange contracts |
23 | (2 | ) | — | — | — | (3 | ) | 0 | 0 | 1 | 19 | ||||||||||||||||||||||||||||
|
|
|
|
|
|
|
|
|
|
|
|
|
|
|
|
|
|
|
|
|
|||||||||||||||||||||
| Total derivatives, net |
(15 | ) | 8 | — | — | — | 5 | 0 | 4 | (22 | ) | (20 | ) | |||||||||||||||||||||||||||
|
|
|
|
|
|
|
|
|
|
|
|
|
|
|
|
|
|
|
|
|
|||||||||||||||||||||
| Subtotal |
¥ | 213 | ¥ | 10 | ¥ | — | ¥ | 152 | ¥ | (146 | ) | ¥ | 5 | ¥ | 3 | ¥ | 22 | ¥ | (36 | ) | ¥ | 223 | ||||||||||||||||||
|
|
|
|
|
|
|
|
|
|
|
|
|
|
|
|
|
|
|
|
|
|||||||||||||||||||||
| Loans and receivables |
66 | 1 | — | 8 | (35 | ) | — | 0 | 0 | — | 40 | |||||||||||||||||||||||||||||
| Collateralized agreements |
5 | 0 | — | — | — | — | 0 | — | — | 5 | ||||||||||||||||||||||||||||||
| Other assets |
||||||||||||||||||||||||||||||||||||||||
| Other |
163 | 14 | 0 | 0 | (1 | ) | — | 1 | 1 | 0 | 178 | |||||||||||||||||||||||||||||
|
|
|
|
|
|
|
|
|
|
|
|
|
|
|
|
|
|
|
|
|
|||||||||||||||||||||
| Total |
¥ | 447 | ¥ | 25 | ¥ | 0 | ¥ | 160 | ¥ | (182 | ) | ¥ | 5 | ¥ | 4 | ¥ | 23 | ¥ | (36 | ) | ¥ | 446 | ||||||||||||||||||
|
|
|
|
|
|
|
|
|
|
|
|
|
|
|
|
|
|
|
|
|
|||||||||||||||||||||
| Liabilities: |
||||||||||||||||||||||||||||||||||||||||
| Trading liabilities |
||||||||||||||||||||||||||||||||||||||||
| Equities |
¥ | 1 | ¥ | 0 | ¥ | — | ¥ | 0 | ¥ | 0 | ¥ | — | ¥ | 0 | ¥ | 1 | ¥ | (1 | ) | ¥ | 1 | |||||||||||||||||||
| Bank and corporate debt securities |
0 | 0 | — | — | 0 | — | 0 | 0 | 0 | 0 | ||||||||||||||||||||||||||||||
| Collateralized debt obligations (“CDOs”) and other |
1 | 0 | — | 2 | (2 | ) | — | 0 | — | — | 1 | |||||||||||||||||||||||||||||
| Investment trust funds and other |
0 | 0 | — | 0 | — | — | — | — | 0 | — | ||||||||||||||||||||||||||||||
|
|
|
|
|
|
|
|
|
|
|
|
|
|
|
|
|
|
|
|
|
|||||||||||||||||||||
| Total trading liabilities |
¥ | 2 | ¥ | 0 | ¥ | — | ¥ | 2 | ¥ | (2 | ) | ¥ | — | ¥ | 0 | ¥ | 1 | ¥ | (1 | ) | ¥ | 2 | ||||||||||||||||||
|
|
|
|
|
|
|
|
|
|
|
|
|
|
|
|
|
|
|
|
|
|||||||||||||||||||||
| Short-term borrowings |
70 | (1 | ) | 0 | 69 | (38 | ) | — | 1 | 1 | (11 | ) | 93 | |||||||||||||||||||||||||||
| Payables and deposits |
0 | 0 | — | 0 | 0 | — | 0 | — | — | 0 | ||||||||||||||||||||||||||||||
| Collateralized financing |
3 | — | — | — | — | — | 0 | — | — | 3 | ||||||||||||||||||||||||||||||
| Long-term borrowings |
410 | (17 | ) | (1 | ) | 129 | (55 | ) | — | 0 | 27 | (72 | ) | 457 | ||||||||||||||||||||||||||
| Other liabilities |
1 | 1 | — | 0 | 0 | — | 0 | 0 | 0 | 0 | ||||||||||||||||||||||||||||||
|
|
|
|
|
|
|
|
|
|
|
|
|
|
|
|
|
|
|
|
|
|||||||||||||||||||||
| Total |
¥ | 486 | ¥ | (17 | ) | ¥ | (1 | ) | ¥ | 200 | ¥ | (95 | ) | ¥ | — | ¥ | 1 | ¥ | 29 | ¥ | (84 | ) | ¥ | 555 | ||||||||||||||||
|
|
|
|
|
|
|
|
|
|
|
|
|
|
|
|
|
|
|
|
|
|||||||||||||||||||||
F-32
Table of Contents
Notes to the Interim Consolidated Financial Statements—(Continued) (UNAUDITED)
| Billions of yen | ||||||||||||||||||||||||||||||||||||||||
| Six months ended September 30, 2018 | ||||||||||||||||||||||||||||||||||||||||
| Beginning balance as of six months ended September 30, 2018 |
Total gains (losses) recognized in revenue(1) |
Total gains (losses) recognized in other comprehensive income |
Purchases / issues(2) |
Sales / redemptions(2) |
Settlements | Foreign exchange movements |
Transfers into Level 3(3) |
Transfers out of Level 3(3) |
Balance as of six months ended September 30, 2018 |
|||||||||||||||||||||||||||||||
| Assets: |
||||||||||||||||||||||||||||||||||||||||
| Trading assets and private equity investments |
||||||||||||||||||||||||||||||||||||||||
| Equities |
¥ | 21 | ¥ | 0 | ¥ | — | ¥ | 2 | ¥ | (6 | ) | ¥ | — | ¥ | 1 | ¥ | 3 | ¥ | (1 | ) | ¥ | 20 | ||||||||||||||||||
| Private equity investments |
3 | 0 | — | 7 | 0 | — | 0 | — | — | 10 | ||||||||||||||||||||||||||||||
| Japanese agency and municipal securities |
1 | 0 | — | — | 0 | — | — | — | — | 1 | ||||||||||||||||||||||||||||||
| Foreign government, agency and municipal securities |
6 | 0 | — | 7 | (10 | ) | — | 0 | 0 | 0 | 3 | |||||||||||||||||||||||||||||
| Bank and corporate debt securities and loans for trading purposes |
139 | 4 | — | 50 | (30 | ) | — | 7 | 16 | (32 | ) | 154 | ||||||||||||||||||||||||||||
| Commercial mortgage-backed securities (“CMBS”) |
2 | 0 | — | 1 | (2 | ) | — | — | 0 | — | 1 | |||||||||||||||||||||||||||||
| Residential mortgage-backed securities (“RMBS”) |
0 | 0 | — | 7 | 0 | — | 0 | — | — | 7 | ||||||||||||||||||||||||||||||
| Real estate-backed securities |
63 | 0 | — | 90 | (66 | ) | — | 4 | — | — | 91 | |||||||||||||||||||||||||||||
| Collateralized debt obligations (“CDOs”) and other |
24 | 1 | — | 29 | (29 | ) | — | 2 | 5 | (2 | ) | 30 | ||||||||||||||||||||||||||||
| Investment trust funds and other |
1 | 0 | — | 3 | (3 | ) | — | 0 | — | — | 1 | |||||||||||||||||||||||||||||
|
|
|
|
|
|
|
|
|
|
|
|
|
|
|
|
|
|
|
|
|
|||||||||||||||||||||
| Total trading assets and private equity investments |
260 | 5 | — | 196 | (146 | ) | — | 14 | 24 | (35 | ) | 318 | ||||||||||||||||||||||||||||
|
|
|
|
|
|
|
|
|
|
|
|
|
|
|
|
|
|
|
|
|
|||||||||||||||||||||
| Derivatives, net(4) |
||||||||||||||||||||||||||||||||||||||||
| Equity contracts |
(1 | ) | (10 | ) | — | — | — | (4 | ) | (1 | ) | (3 | ) | 6 | (13 | ) | ||||||||||||||||||||||||
| Interest rate contracts |
(53 | ) | (11 | ) | — | — | — | (10 | ) | 1 | 6 | 14 | (53 | ) | ||||||||||||||||||||||||||
| Credit contracts |
2 | (2 | ) | — | — | — | (1 | ) | 0 | 0 | (1 | ) | (2 | ) | ||||||||||||||||||||||||||
| Foreign exchange contracts |
27 | (6 | ) | — | — | — | 1 | 2 | — | 1 | 25 | |||||||||||||||||||||||||||||
| Commodity contracts |
— | 0 | — | — | — | — | 0 | — | — | 0 | ||||||||||||||||||||||||||||||
|
|
|
|
|
|
|
|
|
|
|
|
|
|
|
|
|
|
|
|
|
|||||||||||||||||||||
| Total derivatives, net |
(25 | ) | (29 | ) | — | — | — | (14 | ) | 2 | 3 | 20 | (43 | ) | ||||||||||||||||||||||||||
|
|
|
|
|
|
|
|
|
|
|
|
|
|
|
|
|
|
|
|
|
|||||||||||||||||||||
| Subtotal |
¥ | 235 | ¥ | (24 | ) | ¥ | — | ¥ | 196 | ¥ | (146 | ) | ¥ | (14 | ) | ¥ | 16 | ¥ | 27 | ¥ | (15 | ) | ¥ | 275 | ||||||||||||||||
|
|
|
|
|
|
|
|
|
|
|
|
|
|
|
|
|
|
|
|
|
|||||||||||||||||||||
| Loans and receivables |
70 | 0 | — | 18 | (11 | ) | — | 5 | 5 | — | 87 | |||||||||||||||||||||||||||||
| Collateralized agreements |
5 | 0 | — | — | — | — | 0 | 6 | — | 11 | ||||||||||||||||||||||||||||||
| Other assets |
||||||||||||||||||||||||||||||||||||||||
| Other |
169 | 1 | — | 2 | 0 | — | 8 | 0 | — | 180 | ||||||||||||||||||||||||||||||
|
|
|
|
|
|
|
|
|
|
|
|
|
|
|
|
|
|
|
|
|
|||||||||||||||||||||
| Total |
¥ | 479 | ¥ | (23 | ) | ¥ | — | ¥ | 216 | ¥ | (157 | ) | ¥ | (14 | ) | ¥ | 29 | ¥ | 38 | ¥ | (15 | ) | ¥ | 553 | ||||||||||||||||
|
|
|
|
|
|
|
|
|
|
|
|
|
|
|
|
|
|
|
|
|
|||||||||||||||||||||
| Liabilities: |
||||||||||||||||||||||||||||||||||||||||
| Trading liabilities |
||||||||||||||||||||||||||||||||||||||||
| Equities |
¥ | 1 | ¥ | 0 | ¥ | — | ¥ | 19 | ¥ | (20 | ) | ¥ | — | ¥ | 0 | ¥ | 0 | ¥ | 0 | ¥ | 0 | |||||||||||||||||||
| Bank and corporate debt securities |
0 | 0 | — | 1 | 0 | — | 0 | — | 0 | 1 | ||||||||||||||||||||||||||||||
| Collateralized debt obligations (“CDOs”) and other |
0 | — | — | — | 0 | — | 0 | — | — | — | ||||||||||||||||||||||||||||||
| Investment trust funds and other |
0 | — | — | 0 | 0 | — | 0 | 0 | 0 | 0 | ||||||||||||||||||||||||||||||
|
|
|
|
|
|
|
|
|
|
|
|
|
|
|
|
|
|
|
|
|
|||||||||||||||||||||
| Total trading liabilities |
¥ | 1 | ¥ | 0 | ¥ | — | ¥ | 20 | ¥ | (20 | ) | ¥ | — | ¥ | 0 | ¥ | 0 | ¥ | 0 | ¥ | 1 | |||||||||||||||||||
|
|
|
|
|
|
|
|
|
|
|
|
|
|
|
|
|
|
|
|
|
|||||||||||||||||||||
| Short-term borrowings |
17 | (1 | ) | 0 | 28 | (9 | ) | — | 1 | 16 | (12 | ) | 42 | |||||||||||||||||||||||||||
| Payables and deposits |
(1 | ) | 0 | — | 0 | 0 | — | — | — | — | (1 | ) | ||||||||||||||||||||||||||||
| Collateralized financing |
3 | — | — | — | (1 | ) | — | 1 | — | — | 3 | |||||||||||||||||||||||||||||
| Long-term borrowings |
429 | (3 | ) | 1 | 100 | (46 | ) | — | 0 | 25 | (49 | ) | 461 | |||||||||||||||||||||||||||
| Other liabilities |
1 | 0 | — | 0 | (1 | ) | — | 0 | 0 | — | 0 | |||||||||||||||||||||||||||||
|
|
|
|
|
|
|
|
|
|
|
|
|
|
|
|
|
|
|
|
|
|||||||||||||||||||||
| Total |
¥ | 450 | ¥ | (4 | ) | ¥ | 1 | ¥ | 148 | ¥ | (77 | ) | ¥ | — | ¥ | 2 | ¥ | 41 | ¥ | (61 | ) | ¥ | 506 | |||||||||||||||||
|
|
|
|
|
|
|
|
|
|
|
|
|
|
|
|
|
|
|
|
|
|||||||||||||||||||||
F-33
Table of Contents
Notes to the Interim Consolidated Financial Statements—(Continued) (UNAUDITED)
| Billions of yen | ||||||||||||||||||||||||||||||||||||||||
| Three months ended September 30, 2017 | ||||||||||||||||||||||||||||||||||||||||
| Beginning balance as of three months ended September 30, 2017 |
Total gains (losses) recognized in revenue(1) |
Total gains (losses) recognized in other comprehensive income |
Purchases / issues(2) |
Sales / redemptions(2) |
Settlements | Foreign exchange movements |
Transfers into Level 3(3) |
Transfers out of Level 3(3) |
Balance as of three months ended September 30, 2017 |
|||||||||||||||||||||||||||||||
| Assets: |
||||||||||||||||||||||||||||||||||||||||
| Trading assets and private equity investments |
||||||||||||||||||||||||||||||||||||||||
| Equities |
¥ | 34 | ¥ | 1 | ¥ | — | ¥ | 16 | ¥ | (5 | ) | ¥ | — | ¥ | 0 | ¥ | 1 | ¥ | (2 | ) | ¥ | 45 | ||||||||||||||||||
| Private equity investments |
10 | 0 | — | — | (5 | ) | — | 1 | — | (1 | ) | 5 | ||||||||||||||||||||||||||||
| Japanese agency and municipal securities |
1 | 0 | — | — | 0 | — | — | — | — | 1 | ||||||||||||||||||||||||||||||
| Foreign government, agency and municipal securities |
5 | 0 | — | 5 | (5 | ) | — | 0 | 1 | 0 | 6 | |||||||||||||||||||||||||||||
| Bank and corporate debt securities and loans for trading purposes |
116 | 3 | — | 35 | (25 | ) | — | 1 | 0 | (2 | ) | 128 | ||||||||||||||||||||||||||||
| Commercial mortgage-backed securities (“CMBS”) |
5 | 0 | — | — | (2 | ) | — | 0 | — | (2 | ) | 1 | ||||||||||||||||||||||||||||
| Residential mortgage-backed securities (“RMBS”) |
0 | 0 | — | 1 | 0 | — | 0 | — | — | 1 | ||||||||||||||||||||||||||||||
| Real estate-backed securities |
40 | 0 | — | 10 | (13 | ) | — | 0 | — | — | 37 | |||||||||||||||||||||||||||||
| Collateralized debt obligations (“CDOs”) and other |
20 | (3 | ) | — | 9 | (9 | ) | — | 0 | 2 | (1 | ) | 18 | |||||||||||||||||||||||||||
| Investment trust funds and other |
0 | 0 | — | 1 | 0 | — | 0 | 0 | 0 | 1 | ||||||||||||||||||||||||||||||
|
|
|
|
|
|
|
|
|
|
|
|
|
|
|
|
|
|
|
|
|
|||||||||||||||||||||
| Total trading assets and private equity investments |
231 | 1 | — | 77 | (64 | ) | — | 2 | 4 | (8 | ) | 243 | ||||||||||||||||||||||||||||
|
|
|
|
|
|
|
|
|
|
|
|
|
|
|
|
|
|
|
|
|
|||||||||||||||||||||
| Derivatives, net(4) |
||||||||||||||||||||||||||||||||||||||||
| Equity contracts |
2 | (1 | ) | — | — | — | (3 | ) | 0 | 0 | 1 | (1 | ) | |||||||||||||||||||||||||||
| Interest rate contracts |
(11 | ) | 6 | — | — | — | (1 | ) | 0 | 1 | (26 | ) | (31 | ) | ||||||||||||||||||||||||||
| Credit contracts |
(6 | ) | 1 | — | — | — | 0 | 0 | (2 | ) | 0 | (7 | ) | |||||||||||||||||||||||||||
| Foreign exchange contracts |
20 | 3 | — | — | — | (4 | ) | 0 | — | 0 | 19 | |||||||||||||||||||||||||||||
|
|
|
|
|
|
|
|
|
|
|
|
|
|
|
|
|
|
|
|
|
|||||||||||||||||||||
| Total derivatives, net |
5 | 9 | — | — | — | (8 | ) | 0 | (1 | ) | (25 | ) | (20 | ) | ||||||||||||||||||||||||||
|
|
|
|
|
|
|
|
|
|
|
|
|
|
|
|
|
|
|
|
|
|||||||||||||||||||||
| Subtotal |
¥ | 236 | ¥ | 10 | ¥ | — | ¥ | 77 | ¥ | (64 | ) | ¥ | (8 | ) | ¥ | 2 | ¥ | 3 | ¥ | (33 | ) | ¥ | 223 | |||||||||||||||||
|
|
|
|
|
|
|
|
|
|
|
|
|
|
|
|
|
|
|
|
|
|||||||||||||||||||||
| Loans and receivables |
42 | 0 | — | 2 | (4 | ) | — | 0 | 0 | — | 40 | |||||||||||||||||||||||||||||
| Collateralized agreements |
5 | 0 | — | — | — | — | 0 | — | — | 5 | ||||||||||||||||||||||||||||||
| Other assets |
||||||||||||||||||||||||||||||||||||||||
| Other |
166 | 11 | 0 | 0 | 0 | — | 1 | 0 | — | 178 | ||||||||||||||||||||||||||||||
|
|
|
|
|
|
|
|
|
|
|
|
|
|
|
|
|
|
|
|
|
|||||||||||||||||||||
| Total |
¥ | 449 | ¥ | 21 | ¥ | 0 | ¥ | 79 | ¥ | (68 | ) | ¥ | (8 | ) | ¥ | 3 | ¥ | 3 | ¥ | (33 | ) | ¥ | 446 | |||||||||||||||||
|
|
|
|
|
|
|
|
|
|
|
|
|
|
|
|
|
|
|
|
|
|||||||||||||||||||||
| Liabilities: |
||||||||||||||||||||||||||||||||||||||||
| Trading liabilities |
||||||||||||||||||||||||||||||||||||||||
| Equities |
¥ | 1 | ¥ | (1 | ) | ¥ | — | ¥ | 0 | ¥ | 0 | ¥ | — | ¥ | 0 | ¥ | 0 | ¥ | (1 | ) | ¥ | 1 | ||||||||||||||||||
| Bank and corporate debt securities |
0 | 0 | — | — | — | — | 0 | — | 0 | 0 | ||||||||||||||||||||||||||||||
| Collateralized debt obligations (“CDOs”) and other |
0 | 0 | — | 1 | 0 | — | 0 | — | — | 1 | ||||||||||||||||||||||||||||||
| Investment trust funds and other |
0 | 0 | — | 0 | — | — | — | — | 0 | — | ||||||||||||||||||||||||||||||
|
|
|
|
|
|
|
|
|
|
|
|
|
|
|
|
|
|
|
|
|
|||||||||||||||||||||
| Total trading liabilities |
¥ | 1 | ¥ | (1 | ) | ¥ | — | ¥ | 1 | ¥ | 0 | ¥ | — | ¥ | 0 | ¥ | 0 | ¥ | (1 | ) | ¥ | 2 | ||||||||||||||||||
|
|
|
|
|
|
|
|
|
|
|
|
|
|
|
|
|
|
|
|
|
|||||||||||||||||||||
| Short-term borrowings |
97 | 0 | 0 | 16 | (14 | ) | — | 0 | 1 | (7 | ) | 93 | ||||||||||||||||||||||||||||
| Payables and deposits |
0 | 0 | — | 0 | 0 | — | — | — | — | 0 | ||||||||||||||||||||||||||||||
| Collateralized financing |
3 | — | — | — | — | — | 0 | — | — | 3 | ||||||||||||||||||||||||||||||
| Long-term borrowings |
445 | (7 | ) | 0 | 69 | (29 | ) | — | 0 | 14 | (49 | ) | 457 | |||||||||||||||||||||||||||
| Other liabilities |
0 | 0 | — | 0 | 0 | — | 0 | 0 | — | 0 | ||||||||||||||||||||||||||||||
|
|
|
|
|
|
|
|
|
|
|
|
|
|
|
|
|
|
|
|
|
|||||||||||||||||||||
| Total |
¥ | 546 | ¥ | (8 | ) | ¥ | 0 | ¥ | 86 | ¥ | (43 | ) | ¥ | — | ¥ | 0 | ¥ | 15 | ¥ | (57 | ) | ¥ | 555 | |||||||||||||||||
|
|
|
|
|
|
|
|
|
|
|
|
|
|
|
|
|
|
|
|
|
|||||||||||||||||||||
F-34
Table of Contents
Notes to the Interim Consolidated Financial Statements—(Continued) (UNAUDITED)
| Billions of yen | ||||||||||||||||||||||||||||||||||||||||
| Three months ended September 30, 2018 | ||||||||||||||||||||||||||||||||||||||||
| Beginning balance as of three months ended September 30, 2018 |
Total gains (losses) recognized in revenue(1) |
Total gains (losses) recognized in other comprehensive income |
Purchases / issues(2) |
Sales / redemptions(2) |
Settlements | Foreign exchange movements |
Transfers into Level 3(3) |
Transfers out of Level 3(3) |
Balance as of three months ended September 30, 2018 |
|||||||||||||||||||||||||||||||
| Assets: |
||||||||||||||||||||||||||||||||||||||||
| Trading assets and private equity investments |
||||||||||||||||||||||||||||||||||||||||
| Equities |
¥ | 21 | ¥ | 0 | ¥ | — | ¥ | 1 | ¥ | (3 | ) | ¥ | — | ¥ | 0 | ¥ | 2 | ¥ | (1 | ) | ¥ | 20 | ||||||||||||||||||
| Private equity investments |
9 | 0 | — | 1 | 0 | — | 0 | — | — | 10 | ||||||||||||||||||||||||||||||
| Japanese agency and municipal securities |
1 | 0 | — | — | 0 | — | — | — | — | 1 | ||||||||||||||||||||||||||||||
| Foreign government, agency and municipal securities |
5 | 0 | — | 2 | (4 | ) | — | 0 | 0 | 0 | 3 | |||||||||||||||||||||||||||||
| Bank and corporate debt securities and loans for trading purposes |
142 | 2 | — | 21 | (6 | ) | — | 4 | 8 | (17 | ) | 154 | ||||||||||||||||||||||||||||
| Commercial mortgage-backed securities (“CMBS”) |
3 | 0 | — | — | (2 | ) | — | — | 0 | — | 1 | |||||||||||||||||||||||||||||
| Residential mortgage-backed securities (“RMBS”) |
1 | 0 | — | 6 | 0 | — | 0 | — | — | 7 | ||||||||||||||||||||||||||||||
| Real estate-backed securities |
63 | 0 | — | 46 | (20 | ) | — | 2 | — | — | 91 | |||||||||||||||||||||||||||||
| Collateralized debt obligations (“CDOs”) and other |
22 | 2 | — | 20 | (18 | ) | — | 1 | 3 | 0 | 30 | |||||||||||||||||||||||||||||
| Investment trust funds and other |
1 | 0 | — | 3 | (3 | ) | — | 0 | — | — | 1 | |||||||||||||||||||||||||||||
|
|
|
|
|
|
|
|
|
|
|
|
|
|
|
|
|
|
|
|
|
|||||||||||||||||||||
| Total trading assets and private equity investments |
268 | 4 | — | 100 | (56 | ) | — | 7 | 13 | (18 | ) | 318 | ||||||||||||||||||||||||||||
|
|
|
|
|
|
|
|
|
|
|
|
|
|
|
|
|
|
|
|
|
|||||||||||||||||||||
| Derivatives, net(4) |
||||||||||||||||||||||||||||||||||||||||
| Equity contracts |
(3 | ) | (8 | ) | — | — | — | 1 | (1 | ) | (4 | ) | 2 | (13 | ) | |||||||||||||||||||||||||
| Interest rate contracts |
(64 | ) | (3 | ) | — | — | — | 4 | 0 | 6 | 4 | (53 | ) | |||||||||||||||||||||||||||
| Credit contracts |
3 | (3 | ) | — | — | — | (1 | ) | 0 | 0 | (1 | ) | (2 | ) | ||||||||||||||||||||||||||
| Foreign exchange contracts |
24 | (2 | ) | — | — | — | 1 | 1 | — | 1 | 25 | |||||||||||||||||||||||||||||
| Commodity contracts |
0 | 0 | — | — | — | — | 0 | — | — | 0 | ||||||||||||||||||||||||||||||
|
|
|
|
|
|
|
|
|
|
|
|
|
|
|
|
|
|
|
|
|
|||||||||||||||||||||
| Total derivatives, net |
(40 | ) | (16 | ) | — | — | — | 5 | 0 | 2 | 6 | (43 | ) | |||||||||||||||||||||||||||
|
|
|
|
|
|
|
|
|
|
|
|
|
|
|
|
|
|
|
|
|
|||||||||||||||||||||
| Subtotal |
¥ | 228 | ¥ | (12 | ) | ¥ | — | ¥ | 100 | ¥ | (56 | ) | ¥ | 5 | ¥ | 7 | ¥ | 15 | ¥ | (12 | ) | ¥ | 275 | |||||||||||||||||
|
|
|
|
|
|
|
|
|
|
|
|
|
|
|
|
|
|
|
|
|
|||||||||||||||||||||
| Loans and receivables |
87 | 1 | — | 9 | (12 | ) | — | 2 | — | — | 87 | |||||||||||||||||||||||||||||
| Collateralized agreements |
5 | 0 | — | — | — | — | 0 | 6 | — | 11 | ||||||||||||||||||||||||||||||
| Other assets |
||||||||||||||||||||||||||||||||||||||||
| Other |
177 | 0 | — | 0 | 0 | — | 3 | 0 | — | 180 | ||||||||||||||||||||||||||||||
|
|
|
|
|
|
|
|
|
|
|
|
|
|
|
|
|
|
|
|
|
|||||||||||||||||||||
| Total |
¥ | 497 | ¥ | (11 | ) | ¥ | — | ¥ | 109 | ¥ | (68 | ) | ¥ | 5 | ¥ | 12 | ¥ | 21 | ¥ | (12 | ) | ¥ | 553 | |||||||||||||||||
|
|
|
|
|
|
|
|
|
|
|
|
|
|
|
|
|
|
|
|
|
|||||||||||||||||||||
| Liabilities: |
||||||||||||||||||||||||||||||||||||||||
| Trading liabilities |
||||||||||||||||||||||||||||||||||||||||
| Equities |
¥ | 1 | ¥ | 0 | ¥ | — | ¥ | 9 | ¥ | (10 | ) | ¥ | — | ¥ | 0 | ¥ | 0 | ¥ | 0 | ¥ | 0 | |||||||||||||||||||
| Bank and corporate debt securities |
0 | 0 | — | 1 | 0 | — | 0 | — | 0 | 1 | ||||||||||||||||||||||||||||||
| Collateralized debt obligations (“CDOs”) and other |
— | — | — | — | — | — | — | — | — | — | ||||||||||||||||||||||||||||||
| Investment trust funds and other |
— | — | — | 0 | 0 | — | 0 | 0 | — | 0 | ||||||||||||||||||||||||||||||
|
|
|
|
|
|
|
|
|
|
|
|
|
|
|
|
|
|
|
|
|
|||||||||||||||||||||
| Total trading liabilities |
¥ | 1 | ¥ | 0 | ¥ | — | ¥ | 10 | ¥ | (10 | ) | ¥ | — | ¥ | 0 | ¥ | 0 | ¥ | 0 | ¥ | 1 | |||||||||||||||||||
|
|
|
|
|
|
|
|
|
|
|
|
|
|
|
|
|
|
|
|
|
|||||||||||||||||||||
| Short-term borrowings |
33 | 0 | 0 | 16 | (5 | ) | — | 0 | 8 | (10 | ) | 42 | ||||||||||||||||||||||||||||
| Payables and deposits |
0 | 0 | — | 0 | (1 | ) | — | — | — | — | (1 | ) | ||||||||||||||||||||||||||||
| Collateralized financing |
3 | — | — | — | (1 | ) | — | 1 | — | — | 3 | |||||||||||||||||||||||||||||
| Long-term borrowings |
461 | 2 | 1 | 61 | (30 | ) | — | 0 | 11 | (39 | ) | 461 | ||||||||||||||||||||||||||||
| Other liabilities |
0 | 0 | — | 0 | 0 | — | 0 | 0 | — | 0 | ||||||||||||||||||||||||||||||
|
|
|
|
|
|
|
|
|
|
|
|
|
|
|
|
|
|
|
|
|
|||||||||||||||||||||
| Total |
¥ | 498 | ¥ | 2 | ¥ | 1 | ¥ | 87 | ¥ | (47 | ) | ¥ | — | ¥ | 1 | ¥ | 19 | ¥ | (49 | ) | ¥ | 506 | ||||||||||||||||||
|
|
|
|
|
|
|
|
|
|
|
|
|
|
|
|
|
|
|
|
|
|||||||||||||||||||||
| (1) | Includes gains and losses reported primarily within Net gain on trading, Gain on private equity investments, and also within Gain on investments in equity securities, Revenue—Other and Non-interest expenses—Other, Interest and dividends and Interest expense in the consolidated statements of income. |
| (2) | Amounts reported in Purchases / issues include increases in trading liabilities while Sales / redemptions include decreases in trading liabilities. |
| (3) | If financial instruments move from Level 3 to another Level or move from another Level to Level 3, the amount reported in Transfers into Level 3 and Transfers out of Level 3 is the fair value as of the beginning of the quarter during which the movement occurs. Therefore if financial instruments move from another Level to Level 3, all gains/ (losses) during the quarter are included in the table and if financial instruments move from Level 3 to another Level, all gains/ (losses) during the year are excluded from the table. |
| (4) | Each derivative classification includes derivatives with multiple risk underlyings. For example, interest rate contracts include complex derivatives referencing interest rate risk as well as foreign exchange risk or other factors such as prepayment rates. Credit contracts include credit default swaps as well as derivatives referencing corporate and government debt securities. |
F-35
Table of Contents
Notes to the Interim Consolidated Financial Statements—(Continued) (UNAUDITED)
Unrealized gains and losses recognized for Level 3 financial instruments
The following table presents the amounts of unrealized gains (losses) for the six and three months ended September 30, 2017 and 2018, relating to those financial instruments which Nomura classified in Level 3 within the fair value hierarchy and that were still held by Nomura at the relevant consolidated balance sheet date.
| Billions of yen | ||||||||
| Six months ended September 30 | ||||||||
| 2017 | 2018 | |||||||
| Unrealized gains / (losses)(1) | ||||||||
| Assets: |
||||||||
| Trading assets and private equity investments |
||||||||
| Equities |
¥ | 1 | ¥ | (1 | ) | |||
| Private equity investments |
1 | 0 | ||||||
| Japanese agency and municipal securities |
0 | 0 | ||||||
| Foreign government, agency and municipal securities |
0 | 0 | ||||||
| Bank and corporate debt securities and loans for trading purposes |
2 | 0 | ||||||
| Commercial mortgage-backed securities (“CMBS”) |
0 | 0 | ||||||
| Residential mortgage-backed securities (“RMBS”) |
0 | 0 | ||||||
| Real estate-backed securities |
0 | 1 | ||||||
| Collateralized debt obligations (“CDOs”) and other |
(5 | ) | (5 | ) | ||||
| Investment trust funds and other |
0 | 0 | ||||||
|
|
|
|
|
|||||
| Total trading assets and private equity investments |
(1 | ) | (5 | ) | ||||
|
|
|
|
|
|||||
| Derivatives, net(2) |
||||||||
| Equity contracts |
0 | (15 | ) | |||||
| Interest rate contracts |
(1 | ) | (15 | ) | ||||
| Credit contracts |
2 | (1 | ) | |||||
| Foreign exchange contracts |
(2 | ) | (6 | ) | ||||
| Commodity contracts |
— | 0 | ||||||
|
|
|
|
|
|||||
| Total derivatives, net |
(1 | ) | (37 | ) | ||||
|
|
|
|
|
|||||
| Subtotal |
¥ | (2 | ) | ¥ | (42 | ) | ||
|
|
|
|
|
|||||
| Loans and receivables |
0 | 1 | ||||||
| Collateralized agreements |
0 | 0 | ||||||
| Other assets |
||||||||
| Other |
13 | 1 | ||||||
|
|
|
|
|
|||||
| Total |
¥ | 11 | ¥ | (40 | ) | |||
|
|
|
|
|
|||||
| Liabilities: |
||||||||
| Trading liabilities |
||||||||
| Equities |
¥ | 0 | ¥ | 0 | ||||
| Bank and corporate debt securities |
0 | 0 | ||||||
| Collateralized debt obligations (“CDOs”) and other |
0 | — | ||||||
|
|
|
|
|
|||||
| Total trading liabilities |
¥ | 0 | ¥ | 0 | ||||
|
|
|
|
|
|||||
| Short-term borrowings |
(1 | ) | 0 | |||||
| Payables and deposits |
0 | 0 | ||||||
| Long-term borrowings |
(1 | ) | 5 | |||||
| Other liabilities |
0 | 0 | ||||||
|
|
|
|
|
|||||
| Total |
¥ | (2 | ) | ¥ | 5 | |||
|
|
|
|
|
|||||
F-36
Table of Contents
Notes to the Interim Consolidated Financial Statements—(Continued) (UNAUDITED)
| Billions of yen | ||||||||
| Three months ended September 30 | ||||||||
| 2017 | 2018 | |||||||
| Unrealized gains / (losses)(1) | ||||||||
| Assets: |
||||||||
| Trading assets and private equity investments |
||||||||
| Equities |
¥ | 1 | ¥ | (1 | ) | |||
| Private equity investments |
0 | 0 | ||||||
| Japanese agency and municipal securities |
0 | 0 | ||||||
| Foreign government, agency and municipal securities |
0 | 0 | ||||||
| Bank and corporate debt securities and loans for trading purposes |
2 | 0 | ||||||
| Commercial mortgage-backed securities (“CMBS”) |
0 | 0 | ||||||
| Residential mortgage-backed securities (“RMBS”) |
0 | 0 | ||||||
| Real estate-backed securities |
0 | 1 | ||||||
| Collateralized debt obligations (“CDOs”) and other |
(2 | ) | 0 | |||||
| Investment trust funds and other |
0 | 0 | ||||||
|
|
|
|
|
|||||
| Total trading assets and private equity investments |
1 | 0 | ||||||
|
|
|
|
|
|||||
| Derivatives, net(2) |
||||||||
| Equity contracts |
0 | (8 | ) | |||||
| Interest rate contracts |
5 | (3 | ) | |||||
| Credit contracts |
0 | (2 | ) | |||||
| Foreign exchange contracts |
3 | (2 | ) | |||||
| Commodity contracts |
— | 0 | ||||||
|
|
|
|
|
|||||
| Total derivatives, net |
8 | (15 | ) | |||||
|
|
|
|
|
|||||
| Subtotal |
¥ | 9 | ¥ | (15 | ) | |||
|
|
|
|
|
|||||
| Loans and receivables |
0 | 0 | ||||||
| Collateralized agreements |
0 | 0 | ||||||
| Other assets |
||||||||
| Other |
9 | 0 | ||||||
|
|
|
|
|
|||||
| Total |
¥ | 18 | ¥ | (15 | ) | |||
|
|
|
|
|
|||||
| Liabilities: |
||||||||
| Trading liabilities |
||||||||
| Equities |
¥ | 0 | ¥ | 0 | ||||
| Bank and corporate debt securities |
0 | 0 | ||||||
| Collateralized debt obligations (“CDOs”) and other |
0 | — | ||||||
|
|
|
|
|
|||||
| Total trading liabilities |
¥ | 0 | ¥ | 0 | ||||
|
|
|
|
|
|||||
| Short-term borrowings |
0 | 0 | ||||||
| Payables and deposits |
0 | 0 | ||||||
| Long-term borrowings |
(1 | ) | 7 | |||||
| Other liabilities |
0 | 0 | ||||||
|
|
|
|
|
|||||
| Total |
¥ | (1 | ) | ¥ | 7 | |||
|
|
|
|
|
|||||
| (1) | Includes gains and losses reported within Net gain on trading, Gain on private equity investments, and also within Gain on investments in equity securities, Revenue—Other and Non-interest expenses—Other, Interest and dividends and Interest expense in the consolidated statements of income. |
| (2) | Each derivative classification includes derivatives with multiple risk underlyings. For example, interest rate contracts include complex derivatives referencing interest rate risk as well as foreign exchange risk or other factors such as prepayment rates. Credit contracts include credit default swaps as well as derivatives referencing corporate and government debt securities. |
F-37
Table of Contents
Notes to the Interim Consolidated Financial Statements—(Continued) (UNAUDITED)
Transfers between levels of the fair value hierarchy
Nomura assumes that all transfers of financial instruments from one level to another level within the fair value hierarchy occur at the beginning of the relevant quarter in which the transfer takes place. Amounts reported below therefore represent the fair value of the financial instruments at the beginning of the relevant quarter when the transfer was made.
Transfers between Level 1 and Level 2
During the six months ended September 30, 2017, a total of ¥32 billion of financial assets (excluding derivative assets) were transferred from Level 1 to Level 2. This comprised primarily ¥29 billion of equities reported within Trading assets and private equity investments—Equities which were transferred because the observable markets in which these instruments were traded became inactive. During the same period, the total amount of financial liabilities (excluding derivative liabilities) which were transferred from Level 1 to Level 2 was not significant.
During the six months ended September 30, 2018, a total of ¥16 billion of financial assets (excluding derivative assets) were transferred from Level 1 to Level 2. During the same period, the total amount of financial liabilities (excluding derivative liabilities) which were transferred from Level 1 to Level 2 was not significant.
During the three months ended September 30, 2017, the total amount of financial assets (excluding derivative assets) and financial liabilities (excluding derivative liabilities) which were transferred from Level 1 to Level 2 was not significant.
During the three months ended September 30, 2018, the total amount of financial assets (excluding derivative assets) and financial liabilities (excluding derivative liabilities) which were transferred from Level 1 to Level 2 was not significant.
During the six months ended September 30, 2017, a total of ¥98 billion of financial assets (excluding derivative assets) were transferred from Level 2 to Level 1. This comprised primarily ¥86 billion of equities reported within Trading assets and private equity investments—Equities which were transferred because the observable markets in which these instruments were traded became active. During the same period, a total of ¥124 billion of financial liabilities (excluding derivative liabilities) were transferred from Level 2 to Level 1. This comprised primarily ¥121 billion of short sales of equities reported within Trading liabilities which were transferred because the observable markets in which these instruments were traded became active.
During the six months ended September 30, 2018, a total of ¥30 billion of financial assets (excluding derivative assets) were transferred from Level 2 to Level 1. This comprised primarily ¥22 billion of equities reported within Trading assets and private equity investments—Equities which were transferred because the observable markets in which these instruments were traded became active. During the same period, a total of ¥15 billion of financial liabilities (excluding derivative liabilities) were transferred from Level 2 to Level 1. This comprised primarily ¥14 billion of short sales of equities reported within Trading liabilities which were transferred because the observable markets in which these instruments were traded became active.
During the three months ended September 30, 2017, the total amount of financial assets (excluding derivative assets) and financial liabilities (excluding derivative liabilities) which were transferred from Level 2 to Level 1 was not significant.
During the three months ended September 30, 2018, the total amount of financial assets (excluding derivative assets) and financial liabilities (excluding derivative liabilities) which were transferred from Level 2 to Level 1 was not significant.
Transfers out of Level 3
During the six months ended September 30, 2017, a total of ¥14 billion of financial assets (excluding derivative assets) were transferred out of Level 3. During the same period, a total of ¥84 billion of financial liabilities (excluding derivative liabilities) were transferred out of Level 3. This comprised primarily ¥72 billion of Long-term borrowings, principally structured notes, and ¥11 billion of Short-term borrowings, which were transferred because certain volatility and correlation valuation inputs became observable or less significant.
During the six months ended September 30, 2017, the total amount of ¥22 billion of net derivative assets were transferred out of Level 3. This comprised ¥28 billion of net interest rate derivative assets which were transferred because certain interest rate, volatility and correlation valuation inputs became observable or less significant.
F-38
Table of Contents
Notes to the Interim Consolidated Financial Statements—(Continued) (UNAUDITED)
During the six months ended September 30, 2018, a total of ¥35 billion of financial assets (excluding derivative assets) were transferred out of Level 3. This comprised primarily ¥32 billion of Bank and corporate debt securities and loans for trading purposes, principally debt securities, which were transferred because certain credit spread and recovery rate valuation inputs became observable or less significant. During the same period, a total of ¥61 billion of financial liabilities (excluding derivative liabilities) were transferred out of Level 3. This comprised primarily ¥49 billion of Long-term borrowings, principally structured notes, and ¥12 billion of Short-term borrowings, which were transferred because certain volatility and correlation valuation inputs became observable or less significant.
During the six months ended September 30, 2018, the total amount of ¥20 billion of net derivative liabilities were transferred out of Level 3. This comprised ¥14 billion of net interest rate derivative liabilities which were transferred because certain interest rate, volatility and correlation valuation inputs became observable or less significant.
During the three months ended September 30, 2017, the total amount of financial assets (excluding derivative assets) which were transferred out of Level 3 was not significant. During the same period, a total of ¥57 billion of financial liabilities (excluding derivative liabilities) were transferred out of Level 3. This comprised primarily ¥49 billion of Long-term borrowings, principally structured notes, which were transferred because certain volatility and correlation valuation inputs became observable or less significant.
During the three months ended September 30, 2017, the total amount of ¥25 billion of net derivative assets were transferred out of Level 3. This comprised ¥26 billion of net interest rate derivative assets which were transferred because certain interest rate, volatility and correlation valuation inputs became observable or less significant.
During the three months ended September 30, 2018, a total of ¥18 billion of financial assets (excluding derivative assets) were transferred out of Level 3. This comprised primarily ¥17 billion of Bank and corporate debt securities and loans for trading purposes, principally debt securities, which were transferred because certain credit spread and recovery rate valuation inputs became observable or less significant. During the same period, a total of ¥49 billion of financial liabilities (excluding derivative liabilities) were transferred out of Level 3. This comprised primarily ¥39 billion of Long-term borrowings, principally structured notes, and ¥10 billion of Short-term borrowings, which were transferred because certain volatility and correlation valuation inputs became observable or less significant.
During the three months ended September 30, 2018, the total amount of net derivative liabilities which were transferred out of Level 3 was not significant.
Transfers into Level 3
During the six months ended September 30, 2017, a total of ¥19 billion of financial assets (excluding derivative assets) were transferred into Level 3. The amount of gains and losses which were recognized in the quarter when the transfers into Level 3 occurred was not significant. During the same period, a total of ¥29 billion of financial liabilities (excluding derivative liabilities) were transferred into Level 3. This comprised primarily ¥27 billion of Long-term borrowings, principally structured notes, which were transferred because certain volatility and correlation valuation inputs became unobservable or more significant. The amount of gains and losses on these transfers reported in Long-term borrowings which were recognized in the quarter when the transfer into Level 3 occurred was not significant.
During the six months ended September 30, 2017, the total amount of net derivative assets which were transferred into Level 3 was not significant. The amount of gains and losses which were recognized in the period when the transfer into Level 3 occurred was also not significant.
F-39
Table of Contents
Notes to the Interim Consolidated Financial Statements—(Continued) (UNAUDITED)
During the six months ended September 30, 2018, a total of ¥35 billion of financial assets (excluding derivative assets) were transferred into Level 3. This comprised primarily ¥16 billion of Bank and corporate debt securities and loans for trading purposes, principally debt securities, which were transferred because certain credit spread and recovery rate valuation inputs became unobservable or more significant. The amount of gains and losses on these transfers reported in Bank and corporate debt securities and loans for trading purposes which were recognized in the quarter when the transfer into Level 3 occurred was not significant. During the same period, a total of ¥41 billion of financial liabilities (excluding derivative liabilities) were transferred into Level 3. This comprised primarily ¥25 billion of Long-term borrowings, principally structured notes, and ¥16 billion of Short-term borrowings which were transferred because certain volatility and correlation valuation inputs became unobservable or more significant. The amount of gains and losses on these transfers reported in Long-term borrowings and Short-term borrowings which were recognized in the quarter when the transfer into Level 3 occurred was not significant.
During the six months ended September 30, 2018, the total amount of net derivative assets which were transferred into Level 3 was not significant. The amount of gains and losses which were recognized in the period when the transfer into Level 3 occurred was also not significant.
During the three months ended September 30, 2017, the total amount of financial assets (excluding derivative assets) which were transferred into Level 3 was not significant. During the same period, a total of ¥15 billion of financial liabilities (excluding derivative liabilities) were transferred into Level 3. This comprised primarily ¥14 billion of Long-term borrowings, principally structured notes, which were transferred because certain volatility and correlation valuation inputs became unobservable or more significant. The amount of gains and losses on these transfers reported in Long-term borrowings which were recognized in the quarter when the transfer into Level 3 occurred was not significant.
During the three months ended September 30, 2017, the total amount of net derivative liabilities which were transferred into Level 3 was not significant. The amount of gains and losses which were recognized in the period when the transfer into Level 3 occurred was also not significant.
During the three months ended September 30, 2018, a total of ¥19 billion of financial assets (excluding derivative assets) were transferred into Level 3. The amount of gains and losses which were recognized in the quarter when the transfers into Level 3 occurred was not significant. During the same period, a total of ¥19 billion of financial liabilities (excluding derivative liabilities) were transferred into Level 3. This comprised primarily ¥11 billion of Long-term borrowings, principally structured notes, which were transferred because certain volatility and correlation valuation inputs became unobservable or more significant. The amount of gains and losses on these transfers reported in Long-term borrowings which were recognized in the quarter when the transfer into Level 3 occurred was not significant.
During the three months ended September 30, 2018, the total amount of net derivative assets which were transferred into Level 3 was not significant. The amount of gains and losses which were recognized in the period when the transfer into Level 3 occurred was also not significant.
F-40
Table of Contents
Notes to the Interim Consolidated Financial Statements—(Continued) (UNAUDITED)
Investments in investment funds that calculate NAV per share
In the normal course of business, Nomura invests in non-consolidated funds which meet the definition of investment companies or are similar in nature and which do not have readily determinable fair values. For certain of these investments, Nomura uses NAV per share as the basis for valuation as a practical expedient. Some of these investments are redeemable at different amounts from NAV per share.
The following tables present information on these investments where NAV per share is calculated or disclosed as of March 31, 2018 and September 30, 2018. Investments are presented by major category relevant to the nature of Nomura’s business and risks.
| Billions of yen | ||||||||||||
| March 31, 2018 | ||||||||||||
| Fair value | Unfunded commitments(1) |
Redemption frequency (if currently eligible)(2) |
Redemption notice(3) | |||||||||
| Hedge funds |
¥ | 25 | ¥ | — | Monthly | Same day-90 days | ||||||
| Venture capital funds |
1 | 2 | — | — | ||||||||
| Private equity funds |
22 | 11 | — | — | ||||||||
| Real estate funds |
1 | — | — | — | ||||||||
|
|
|
|
|
|||||||||
| Total |
¥ | 49 | ¥ | 13 | ||||||||
|
|
|
|
|
|||||||||
| Billions of yen | ||||||||||||
| September 30, 2018 | ||||||||||||
| Fair value | Unfunded commitments(1) |
Redemption frequency (if currently eligible)(2) |
Redemption notice(3) | |||||||||
| Hedge funds |
¥ | 16 | ¥ | — | Monthly | Same day-90 days | ||||||
| Venture capital funds |
2 | 2 | — | — | ||||||||
| Private equity funds |
18 | 10 | — | — | ||||||||
| Real estate funds |
1 | 2 | — | — | ||||||||
|
|
|
|
|
|||||||||
| Total |
¥ | 37 | ¥ | 14 | ||||||||
|
|
|
|
|
|||||||||
| (1) | The contractual amount of any unfunded commitments Nomura is required to make to the entities in which the investment is held. |
| (2) | The range in frequency with which Nomura can redeem investments. |
| (3) | The range in notice period required to be provided before redemption is possible. |
Hedge funds:
These investments include funds of funds that invest in multiple asset classes. The fair values of these investments are determined using NAV per share. Although most of these funds can be redeemed within six months, certain funds cannot be redeemed within six months due to contractual, liquidity or gating issues. The redemption period cannot be estimated for certain suspended or liquidating funds. Some of these investments contain restrictions against transfers of the investments to third parties.
Venture capital funds:
These investments include primarily start-up funds. The fair values of these investments are determined using NAV per share. Most of these funds cannot be redeemed within six months. The redemption period cannot be estimated for certain suspended or liquidating funds. Some of these investments contain restrictions against transfers of the investments to third parties.
Private equity funds:
These investments are made mainly in various sectors in Europe, U.S. and Japan. The fair values of these investments are determined using NAV per share. Redemption is restricted for most of these investments. Some of these investments contain restrictions against transfers of the investments to third parties.
Real estate funds:
These are investments in commercial and other types of real estate. The fair values of these investments are determined using NAV per share. Redemption is restricted for most of these investments. Some of these investments contain restrictions against transfers of the investments to third parties.
F-41
Table of Contents
Notes to the Interim Consolidated Financial Statements—(Continued) (UNAUDITED)
Fair value option for financial assets and financial liabilities
Nomura measures certain eligible financial assets and liabilities at fair value through the election of the fair value option permitted by ASC 815 “Derivatives and Hedging” (“ASC 815”) and ASC 825 “Financial Instruments” (“ASC 825”). When Nomura elects the fair value option for an eligible item, changes in that item’s fair value are recognized through earnings. Election of the fair value option is generally irrevocable unless an event occurs that gives rise to a new basis of accounting for that instrument.
The financial assets and financial liabilities primarily elected for the fair value option by Nomura, and the reasons for the election, are as follows:
| • | Equity method investments reported within Trading assets and private equity investments and Other assets held for capital appreciation or current income purposes which Nomura generally has an intention to exit rather than hold indefinitely. Nomura elects the fair value option to more appropriately represent the purpose of these investments in these consolidated financial statements. |
| • | Loans reported within Loans and receivables which are risk managed on a fair value basis and loan commitments related to loans receivable for which the fair value option will be elected upon funding. Nomura elects the fair value option to mitigate volatility through earnings caused by the difference in measurement basis that otherwise would arise between loans and the derivatives used to risk manage those instruments. |
| • | Reverse repurchase and repurchase agreements reported within Collateralized agreements and Collateralized financing which are risk managed on a fair value basis. Nomura elects the fair value option to mitigate volatility through earnings caused by the difference in measurement basis that otherwise would arise between the reverse repurchase and repurchase agreements and the derivatives used to risk manage those instruments. |
| • | All structured notes issued on or after April 1, 2008 reported within Short-term borrowings and Long-term borrowings. Nomura elects the fair value option for those structured notes primarily to mitigate the volatility through earnings caused by differences in the measurement basis for structured notes and the derivatives Nomura uses to risk manage those positions. Nomura also elects the fair value option for certain notes issued by consolidated VIEs for the same purpose and for certain structured notes issued prior to April 1, 2008. Certain subsidiaries elect the fair value option for structured loans and straight bonds issued on or after April 1, 2018. |
| • | Financial liabilities reported within Long-term borrowings recognized in transactions which are accounted for as secured financing transactions under ASC 860. Nomura elects the fair value option for these financial liabilities to mitigate volatility through earnings that otherwise would arise had this election not been made. Even though Nomura usually has little or no continuing economic exposure to the transferred financial assets, they remain on the consolidated balance sheets and continue to be carried at fair value, with changes in fair value recognized through earnings. |
Interest and dividends arising from financial instruments for which the fair value option has been elected are recognized within Interest and dividends, Interest expense or Net gain on trading.
F-42
Table of Contents
Notes to the Interim Consolidated Financial Statements—(Continued) (UNAUDITED)
The following table presents gains (losses) due to changes in fair value for financial instruments measured at fair value using the fair value option for the six and three months ended September 30, 2017 and 2018.
| Billions of yen | ||||||||
| Six months ended September 30 | ||||||||
| 2017 | 2018 | |||||||
| Gains / (Losses)(1) | ||||||||
| Assets: |
||||||||
| Trading assets and private equity investments(2) |
||||||||
| Trading assets |
¥ | 0 | ¥ | 0 | ||||
| Private equity investments |
2 | 1 | ||||||
| Loans and receivables |
0 | (1 | ) | |||||
| Collateralized agreements(3) |
16 | 0 | ||||||
| Other assets(2) |
12 | (1 | ) | |||||
|
|
|
|
|
|||||
| Total |
¥ | 30 | ¥ | (1 | ) | |||
|
|
|
|
|
|||||
| Liabilities: |
||||||||
| Short-term borrowings(4) |
¥ | (26 | ) | ¥ | 6 | |||
| Collateralized financing(3) |
(1 | ) | (1 | ) | ||||
| Long-term borrowings(4)(5) |
(59 | ) | 50 | |||||
| Other liabilities(6) |
(12 | ) | 9 | |||||
|
|
|
|
|
|||||
| Total |
¥ | (98 | ) | ¥ | 64 | |||
|
|
|
|
|
|||||
| Billions of yen | ||||||||
| Three months ended September 30 | ||||||||
| 2017 | 2018 | |||||||
| Gains / (Losses)(1) | ||||||||
| Assets: |
||||||||
| Trading assets and private equity investments(2) |
||||||||
| Trading assets |
¥ | 0 | ¥ | 0 | ||||
| Private equity investments |
2 | 1 | ||||||
| Loans and receivables |
0 | (1 | ) | |||||
| Collateralized agreements(3) |
8 | 0 | ||||||
| Other assets(2) |
5 | 3 | ||||||
|
|
|
|
|
|||||
| Total |
¥ | 15 | ¥ | 3 | ||||
|
|
|
|
|
|||||
| Liabilities: |
||||||||
| Short-term borrowings(4) |
¥ | (9 | ) | ¥ | 29 | |||
| Collateralized financing(3) |
(1 | ) | (1 | ) | ||||
| Long-term borrowings(4)(5) |
(75 | ) | 8 | |||||
| Other liabilities(6) |
(12 | ) | 4 | |||||
|
|
|
|
|
|||||
| Total |
¥ | (97 | ) | ¥ | 40 | |||
|
|
|
|
|
|||||
| (1) | Includes gains and losses reported primarily within Net gain on trading and Revenue—Other in the consolidated statements of income. |
| (2) | Includes equity investments that would have been accounted for under the equity method had Nomura not chosen to elect the fair value option. |
| (3) | Includes reverse repurchase and repurchase agreements. |
| (4) | Includes structured notes and other financial liabilities. |
| (5) | Includes secured financing transactions arising from transfers of financial assets which did not meet the criteria for sales accounting. |
| (6) | Includes unfunded written loan commitments. |
F-43
Table of Contents
Notes to the Interim Consolidated Financial Statements—(Continued) (UNAUDITED)
As of March 31, 2018 and September 30, 2018, Nomura held an economic interest of 40.14% and 40.52% in American Century Companies, Inc., respectively. The investment is measured at fair value on a recurring basis through election of the fair value option and is reported within Other assets—Other in the consolidated balance sheets.
There was no significant impact on financial assets for which the fair value option was elected attributable to instrument-specific credit risk.
Nomura calculates the impact of changes in its own creditworthiness on certain financial liabilities for which the fair value option is elected by DCF valuation techniques using a rate which incorporates observable changes in its credit spread.
The following table presents changes in the valuation adjustment for Nomura’s own credit worthiness applied to certain financial liabilities for which the fair value option has been elected recognized in other comprehensive income during the period and cumulatively, and amounts reclassified to earnings from accumulated other comprehensive income on early settlement of such financial liabilities during the period ended September 30, 2017 and 2018.
| Billions of Yen | ||||||||
| Six months period ended September 30 | ||||||||
| 2017 | 2018 | |||||||
| Changes recognized as a credit (debit) to other comprehensive income during the period |
¥ | (11 | ) | ¥ | 5 | |||
| Credit (debit) Amounts reclassified to earnings during the period |
0 | 0 | ||||||
| Cumulative credit (debit) balance recognized in accumulated other comprehensive income |
(1 | ) | 12 | |||||
| Billions of Yen | ||||||||
| Three months period ended September 30 | ||||||||
| 2017 | 2018 | |||||||
| Changes recognized as a credit (debit) to other comprehensive income during the period |
¥ | (5 | ) | ¥ | (1 | ) | ||
| Credit (debit) Amounts reclassified to earnings during the period |
0 | 0 | ||||||
As of March 31, 2018, the fair value of the aggregate unpaid principal balance (which is contractually principally protected) of loans and receivables for which the fair value option was elected was ¥0 billion more than the principal balance of such loans and receivables. The fair value of the aggregate unpaid principal balance (which is contractually principally protected) of long-term borrowings for which the fair value option was elected was ¥58 billion less than the principal balance of such long-term borrowings. There were no loans and receivables for which the fair value option was elected that were 90 days or more past due.
As of September 30, 2018, the fair value of the aggregate unpaid principal balance (which is contractually principally protected) of loans and receivables for which the fair value option was elected was ¥0 billion more than the principal balance of such loans and receivables. The fair value of the aggregate unpaid principal balance (which is contractually principally protected) of long-term borrowings for which the fair value option was elected was ¥89 billion less than the principal balance of such long-term borrowings. There were no loans and receivables for which the fair value option was elected that were 90 days or more past due.
Concentrations of credit risk
Concentrations of credit risk may arise from trading, securities financing transactions and underwriting activities, and may be impacted by changes in political or economic factors. Nomura has credit risk concentrations on bonds issued by the Japanese Government, U.S. Government, Governments within the European Union (“EU”), their states and municipalities, and their agencies. These concentrations generally arise from taking trading positions and are reported within Trading assets in the consolidated balance sheets. Government, agency and municipal securities, including Securities pledged as collateral, represented 16% of total assets as of March 31, 2018 and 15% as of September 30, 2018.
F-44
Table of Contents
Notes to the Interim Consolidated Financial Statements—(Continued) (UNAUDITED)
The following tables present geographic allocations of Nomura’s trading assets related to government, agency and municipal securities. See Note 3 “Derivative instruments and hedging activities” for further information regarding the concentration of credit risk for derivatives.
| Billions of yen | ||||||||||||||||||||
| March 31, 2018 | ||||||||||||||||||||
| Japan | U.S. | EU | Other | Total(1) | ||||||||||||||||
| Government, agency and municipal securities |
¥ | 2,394 | ¥ | 2,168 | ¥ | 1,512 | ¥ | 540 | ¥ | 6,614 | ||||||||||
| Billions of yen | ||||||||||||||||||||
| September 30, 2018 | ||||||||||||||||||||
| Japan | U.S. | EU | Other | Total(1) | ||||||||||||||||
| Government, agency and municipal securities |
¥ | 2,208 | ¥ | 2,136 | ¥ | 1,757 | ¥ | 608 | ¥ | 6,709 | ||||||||||
| (1) | Other than above, there were ¥344 billion and ¥305 billion of government, agency and municipal securities reported within Other assets—Non-trading debt securities in the consolidated balance sheets as of March 31, 2018 and September 30 2018, respectively. These securities are primarily Japanese government, agency and municipal securities. |
Estimated fair value of financial instruments not carried at fair value
Certain financial instruments are not carried at fair value on a recurring basis in the consolidated balance sheets since they are neither held for trading purposes nor are elected for the fair value option. These are typically carried at contractual amounts due or amortized cost.
The carrying value of the majority of the financial instruments detailed below will approximate fair value since they are short-term in nature and contain minimal credit risk. These financial instruments include financial assets reported within Cash and cash equivalents, Time deposits, Deposits with stock exchanges and other segregated cash, Receivables from customers, Receivables from other than customers, Securities purchased under agreements to resell and Securities borrowed and financial liabilities reported within Short-term borrowings, Payables to customers, Payables to other than customers, Deposits received at banks, Securities sold under agreements to repurchase, Securities loaned and Other secured borrowings in the consolidated balance sheets.
The estimated fair values of other financial instruments which are longer-term in nature or may contain more than minimal credit risk may be different to their carrying value. Financial assets of this type primarily include certain loans which are reported within Loans receivable while financial liabilities primarily include long-term borrowings which are reported within Long-term borrowings.
F-45
Table of Contents
Notes to the Interim Consolidated Financial Statements—(Continued) (UNAUDITED)
The following tables present carrying values, fair values and classification within the fair value hierarchy for certain classes of financial instrument of which a portion of the ending balance was carried at fair value as of March 31, 2018 and September 30 2018.
| Billions of yen | ||||||||||||||||||||
| March 31, 2018(1) | ||||||||||||||||||||
| Fair value by level | ||||||||||||||||||||
| Carrying value |
Fair value | Level 1 | Level 2 | Level 3 | ||||||||||||||||
| Assets: |
||||||||||||||||||||
| Cash and cash equivalents |
¥ | 2,355 | ¥ | 2,355 | ¥ | 2,355 | ¥ | — | ¥ | — | ||||||||||
| Time deposits |
315 | 315 | — | 315 | — | |||||||||||||||
| Deposits with stock exchanges and other segregated cash |
289 | 289 | — | 289 | — | |||||||||||||||
| Loans receivable(2) |
2,461 | 2,461 | — | 1,946 | 515 | |||||||||||||||
| Securities purchased under agreements to resell |
9,854 | 9,854 | — | 9,849 | 5 | |||||||||||||||
| Securities borrowed |
6,384 | 6,383 | — | 6,383 | — | |||||||||||||||
|
|
|
|
|
|
|
|
|
|
|
|||||||||||
| Total |
¥ | 21,658 | ¥ | 21,657 | ¥ | 2,355 | ¥ | 18,782 | ¥ | 520 | ||||||||||
|
|
|
|
|
|
|
|
|
|
|
|||||||||||
| Liabilities: |
||||||||||||||||||||
| Short-term borrowings |
¥ | 743 | ¥ | 743 | ¥ | — | ¥ | 726 | ¥ | 17 | ||||||||||
| Deposits received at banks |
1,151 | 1,151 | — | 1,151 | — | |||||||||||||||
| Securities sold under agreements to repurchase |
14,759 | 14,759 | — | 14,756 | 3 | |||||||||||||||
| Securities loaned |
1,524 | 1,524 | — | 1,524 | — | |||||||||||||||
| Long-term borrowings |
7,383 | 7,417 | 18 | 6,939 | 460 | |||||||||||||||
|
|
|
|
|
|
|
|
|
|
|
|||||||||||
| Total |
¥ | 25,560 | ¥ | 25,594 | ¥ | 18 | ¥ | 25,096 | ¥ | 480 | ||||||||||
|
|
|
|
|
|
|
|
|
|
|
|||||||||||
| Billions of yen | ||||||||||||||||||||
| September 30, 2018(1) | ||||||||||||||||||||
| Fair value by level | ||||||||||||||||||||
| Carrying value |
Fair value | Level 1 | Level 2 | Level 3 | ||||||||||||||||
| Assets: |
||||||||||||||||||||
| Cash and cash equivalents |
¥ | 2,975 | ¥ | 2,975 | ¥ | 2,975 | ¥ | — | ¥ | — | ||||||||||
| Time deposits |
195 | 195 | — | 195 | — | |||||||||||||||
| Deposits with stock exchanges and other segregated cash |
294 | 294 | — | 294 | — | |||||||||||||||
| Loans receivable(2) |
2,306 | 2,306 | — | 1,753 | 553 | |||||||||||||||
| Securities purchased under agreements to resell |
15,413 | 15,413 | — | 15,402 | 11 | |||||||||||||||
| Securities borrowed |
4,510 | 4,509 | — | 4,509 | — | |||||||||||||||
|
|
|
|
|
|
|
|
|
|
|
|||||||||||
| Total |
¥ | 25,693 | ¥ | 25,692 | ¥ | 2,975 | ¥ | 22,153 | ¥ | 564 | ||||||||||
|
|
|
|
|
|
|
|
|
|
|
|||||||||||
| Liabilities: |
||||||||||||||||||||
| Short-term borrowings |
¥ | 980 | ¥ | 980 | ¥ | — | ¥ | 939 | ¥ | 41 | ||||||||||
| Deposits received at banks |
1,183 | 1,183 | — | 1,183 | — | |||||||||||||||
| Securities sold under agreements to repurchase |
18,646 | 18,646 | — | 18,643 | 3 | |||||||||||||||
| Securities loaned |
1,371 | 1,371 | — | 1,371 | — | |||||||||||||||
| Long-term borrowings |
7,694 | 7,702 | 13 | 7,163 | 526 | |||||||||||||||
|
|
|
|
|
|
|
|
|
|
|
|||||||||||
| Total |
¥ | 29,874 | ¥ | 29,882 | ¥ | 13 | ¥ | 29,299 | ¥ | 570 | ||||||||||
|
|
|
|
|
|
|
|
|
|
|
|||||||||||
| (1) | Includes financial instruments which are carried at fair value on a recurring basis. |
| (2) | Carrying values are shown after deducting relevant allowances for credit losses. |
F-46
Table of Contents
Notes to the Interim Consolidated Financial Statements—(Continued) (UNAUDITED)
Assets and liabilities measured at fair value on a nonrecurring basis
In addition to financial instruments carried at fair value on a recurring basis, Nomura also measures other financial and non-financial assets and liabilities at fair value on a nonrecurring basis, where the primary measurement basis is not fair value. Fair value is only used in specific circumstances after initial recognition such as to measure impairment.
As of March 31, 2018 and September 30, 2018, there were no significant amount of assets and liabilities which were measured at fair value on a nonrecurring basis.
F-47
Table of Contents
Notes to the Interim Consolidated Financial Statements—(Continued) (UNAUDITED)
3. Derivative instruments and hedging activities:
Nomura uses a variety of derivative financial instruments, including futures, forwards, options and swaps, for both trading and non-trading purposes.
Derivatives used for trading purposes
In the normal course of business, Nomura enters into transactions involving derivative financial instruments to meet client needs, for trading purposes, and to reduce its own exposure to loss due to adverse fluctuations in interest rates, currency exchange rates and market prices of securities. These financial instruments include contractual agreements such as commitments to swap interest payment streams, exchange currencies or purchase or sell securities and other financial instruments on specific terms at specific future dates.
Nomura maintains active trading positions in a variety of derivative financial instruments. Most of Nomura’s trading activities are client oriented. Nomura utilizes a variety of derivative financial instruments as a means of bridging clients’ specific financial needs and investors’ demands in the securities markets. Nomura also actively trades securities and various derivatives to assist its clients in adjusting their risk profiles as markets change. In performing these activities, Nomura carries an inventory of capital markets instruments and maintains its access to market liquidity by quoting bid and offer prices to and trading with other market makers. These activities are essential to provide clients with securities and other capital market products at competitive prices.
Futures and forward contracts are commitments to either purchase or sell securities, foreign currency or other capital market instruments at a specific future date for a specified price and may be settled in cash or through delivery. Foreign exchange contracts include spot and forward contracts and involve the exchange of two currencies at a rate agreed by the contracting parties. Risks arise from the possible inability of counterparties to meet the terms of their contracts and from movements in market prices. Futures contracts are executed through regulated exchanges which clear and guarantee performance of counterparties. Accordingly, credit risk associated with futures contracts is considered minimal. In contrast, forward contracts are generally negotiated between two counterparties and, therefore, are subject to the performance of the related counterparties.
Options are contracts that grant the purchaser, for a premium payment, the right to either purchase or sell a financial instrument at a specified price within a specified period of time or on a specified date from or to the writer of the option. The writer of options receives premiums and bears the risk of unfavorable changes in the market price of the financial instruments underlying the options.
Swaps are contractual agreements in which two counterparties agree to exchange certain cash flows, at specified future dates, based on an agreed contract. Certain agreements may result in combined interest rate and foreign currency exposures. Entering into swap agreements may involve the risk of credit losses in the event of counterparty default.
To the extent these derivative financial instruments are economically hedging financial instruments or securities positions of Nomura, the overall risk of loss may be fully or partly mitigated by the hedged position.
Nomura seeks to minimize its exposure to market risk arising from its use of these derivative financial instruments through various control policies and procedures, including position limits, monitoring procedures and hedging strategies whereby Nomura enters into offsetting or other positions in a variety of financial instruments.
F-48
Table of Contents
Notes to the Interim Consolidated Financial Statements—(Continued) (UNAUDITED)
Derivatives used for non-trading purposes
Nomura’s principal objectives in using derivatives for non-trading purposes are to manage interest rate risk, to modify the interest rate characteristics of certain financial liabilities, to manage foreign exchange risk of certain foreign currency denominated debt securities, to manage net investment exposure to fluctuations in foreign exchange rates arising from certain foreign operations and to mitigate equity price risk arising from certain stock-based compensation awards given to employees.
Credit risk associated with derivatives utilized for non-trading purposes is controlled and managed in the same way as credit risk associated with derivatives utilized for trading purposes.
Nomura designates certain derivative financial instruments as fair value hedges of interest rate risk arising from specific financial liabilities and foreign currency risk arising from specific foreign currency denominated debt securities. These derivatives are effective in reducing the risk associated with the exposure being hedged and are highly correlated with changes in the fair value and foreign currency rates of the underlying hedged items, both at inception and throughout the life of the hedge contract. Changes in fair value of the hedging derivatives are reported together with those of the hedged assets and liabilities through the consolidated statements of income within Interest expense or Revenue—Other.
Derivative financial instruments designated as hedges of the net investment in foreign operations relate to specific subsidiaries with non-Japanese Yen functional currencies. When determining the effectiveness of net investment hedges, the effective portion of the change in fair value of the hedging derivative is determined by changes in spot exchange rates and is reported through NHI shareholders’ equity within Accumulated other comprehensive income (loss). Changes in fair value of the hedging derivatives attributable to changes in the difference between the forward rate and spot rate are excluded from the measure of hedge effectiveness and are reported in the consolidated statements of income within Revenue—Other.
Concentrations of credit risk for derivatives
The following tables present Nomura’s significant concentration of exposures to credit risk in OTC derivatives with financial institutions including transactions cleared through central counterparties. The gross fair value of derivative assets represents the maximum amount of loss due to credit risk that Nomura would incur if the counterparties of Nomura failed to perform in accordance with the terms of the instruments and any collateral or other security Nomura held in relation to those instruments proved to be of no value.
| Billions of yen | ||||||||||||||||
| March 31, 2018 | ||||||||||||||||
| Gross fair value of derivative assets |
Impact of master netting agreements |
Impact of collateral |
Net exposure to credit risk |
|||||||||||||
| Financial institutions |
¥ | 13,472 | ¥ | (11,467 | ) | ¥ | (1,653 | ) | ¥ | 352 | ||||||
| Billions of yen | ||||||||||||||||
| September 30, 2018 | ||||||||||||||||
| Gross fair value of derivative assets |
Impact of master netting agreements |
Impact of collateral |
Net exposure to credit risk |
|||||||||||||
| Financial institutions |
¥ | 14,399 | ¥ | (12,338 | ) | ¥ | (1,727 | ) | ¥ | 334 | ||||||
F-49
Table of Contents
Notes to the Interim Consolidated Financial Statements—(Continued) (UNAUDITED)
Derivative activities
The following tables quantify the volume of Nomura’s derivative activity through a disclosure of notional amounts, in comparison with the fair value of those derivatives. All amounts are disclosed on a gross basis, prior to counterparty netting of derivative assets and liabilities and cash collateral netting against net derivatives.
| Billions of yen | ||||||||||||
| March 31, 2018(4) | ||||||||||||
| Derivative assets | Derivative liabilities | |||||||||||
| Total Notional(1) | Fair value | Fair value(1) | ||||||||||
| Derivatives used for trading and non-trading purposes(2)(3): |
||||||||||||
| Equity contracts |
¥ | 39,203 | ¥ | 1,011 | ¥ | 1,118 | ||||||
| Interest rate contracts |
2,940,234 | 8,072 | 7,550 | |||||||||
| Credit contracts |
31,624 | 515 | 425 | |||||||||
| Foreign exchange contracts |
362,658 | 5,494 | 5,087 | |||||||||
| Commodity contracts |
60,883 | 1 | 1 | |||||||||
|
|
|
|
|
|
|
|||||||
| Total |
¥ | 3,434,602 | ¥ | 15,093 | ¥ | 14,181 | ||||||
|
|
|
|
|
|
|
|||||||
| Derivatives designated as hedging instruments: |
||||||||||||
| Interest rate contracts |
¥ | 1,184 | ¥ | 24 | ¥ | 1 | ||||||
| Foreign exchange contracts |
93 | 1 | — | |||||||||
|
|
|
|
|
|
|
|||||||
| Total |
¥ | 1,277 | ¥ | 25 | ¥ | 1 | ||||||
|
|
|
|
|
|
|
|||||||
| Total derivatives |
¥ | 3,435,879 | ¥ | 15,118 | ¥ | 14,182 | ||||||
|
|
|
|
|
|
|
|||||||
| Billions of yen | ||||||||||||
| September 30, 2018 | ||||||||||||
| Derivative assets | Derivative liabilities | |||||||||||
| Total Notional(1) | Fair value | Fair value(1) | ||||||||||
| Derivatives used for trading and non-trading purposes(2)(3): |
||||||||||||
| Equity contracts |
¥ | 37,310 | ¥ | 1,159 | ¥ | 1,264 | ||||||
| Interest rate contracts |
2,869,840 | 7,592 | 7,064 | |||||||||
| Credit contracts |
35,681 | 589 | 498 | |||||||||
| Foreign exchange contracts |
472,140 | 6,727 | 6,474 | |||||||||
| Commodity contracts |
494 | 1 | 1 | |||||||||
|
|
|
|
|
|
|
|||||||
| Total |
¥ | 3,415,465 | ¥ | 16,068 | ¥ | 15,301 | ||||||
|
|
|
|
|
|
|
|||||||
| Derivatives designated as hedging instruments: |
||||||||||||
| Interest rate contracts |
¥ | 974 | ¥ | 15 | ¥ | 1 | ||||||
| Foreign exchange contracts |
92 | 1 | — | |||||||||
|
|
|
|
|
|
|
|||||||
| Total |
¥ | 1,066 | ¥ | 16 | ¥ | 1 | ||||||
|
|
|
|
|
|
|
|||||||
| Total derivatives |
¥ | 3,416,531 | ¥ | 16,084 | ¥ | 15,302 | ||||||
|
|
|
|
|
|
|
|||||||
| (1) | Includes the amount of embedded derivatives bifurcated in accordance with ASC 815. |
| (2) | Each derivative classification includes derivatives referencing multiple risk components. For example, interest rate contracts include complex derivatives referencing interest rate risk as well as foreign exchange risk or other factors such as prepayment rates. Credit contracts include credit default swaps as well as derivatives referencing corporate and government securities. |
| (3) | As of March 31, 2018 and September 30, 2018, the amounts reported include derivatives used for non-trading purposes which are not designated as fair value or net investment hedges. These amounts have not been separately presented since such amounts were not significant. |
| (4) | Due to the changes in our accounting policy, certain reclassifications of previously reported amounts have been made to conform to the current year presentation. Please refer to Note 1. “Summary of accounting policies: New accounting pronouncements recently adopted” for further details. |
Changes in fair value are recognized either through earnings or other comprehensive income depending on the purpose for which the derivatives are used.
F-50
Table of Contents
Notes to the Interim Consolidated Financial Statements—(Continued) (UNAUDITED)
Offsetting of derivatives
Counterparty credit risk associated with derivative financial instruments is controlled by Nomura through credit approvals, limits and monitoring procedures. To reduce the risk of loss, Nomura requires collateral, principally cash collateral and government securities, for certain derivative transactions. In certain cases, Nomura may agree for such collateral to be posted to a third-party custodian under a control agreement that enables Nomura to take control of such collateral in the event of counterparty default. From an economic standpoint, Nomura evaluates default risk exposure net of related collateral. Furthermore, OTC derivative transactions are typically documented under industry standard master netting agreements which reduce Nomura’s credit exposure to counterparties as they permit the close-out and offset of transactions and collateral amounts in the event of default of the counterparty. For certain OTC centrally-cleared and exchange-traded derivatives, the clearing or membership agreements entered into by Nomura provide similar rights to Nomura in the event of default of the relevant central clearing party or exchange. In order to support the enforceability of the close-out and offsetting rights within these agreements, Nomura generally seeks to obtain an external legal opinion.
For certain types of counterparties and in certain jurisdictions, Nomura may enter into derivative transactions which are not documented under a master netting agreement. Similarly, even when derivatives are documented under such agreements, Nomura may not have yet sought evidence, or may not be able to obtain evidence to determine with sufficient certainty that close-out and offsetting rights are legally enforceable. This may be the case where relevant local laws specifically prohibit such close-out and offsetting rights, or where local laws are complex, ambiguous or silent on the enforceability of such rights. This may include derivative transactions executed with certain foreign governments, agencies, municipalities, central clearing counterparties, exchanges and pension funds.
Nomura considers the enforceability of a master netting agreement in determining how credit risk arising from transactions with a specific counterparty is hedged, how counterparty credit exposures are calculated and applied to credit limits and the extent and nature of collateral requirements from the counterparty.
Derivative assets and liabilities with the same counterparty documented under a master netting agreement are offset in the consolidated balance sheets where the specific criteria defined by ASC 210-20 “Balance Sheet—Offsetting” (“ASC210-20”) and ASC 815 are met. These criteria include requirements around the legal enforceability of such close-out and offset rights under the master netting agreement. In addition, fair value amounts recognized for the right to reclaim cash collateral (a receivable) and the obligation to return cash collateral (a payable) are also offset against net derivative liabilities and net derivative assets, respectively where certain additional criteria are met.
The following table presents information about offsetting of derivatives and related collateral amounts in the consolidated balance sheets by type of derivative contract, together with the extent to which master netting agreements entered into with counterparties, central clearing counterparties or exchanges permit additional offsetting of derivatives and collateral in the event of counterparty default. Derivative transactions which are not documented under a master netting agreement or are documented under a master netting agreement for which Nomura does not have sufficient evidence of enforceability are not offset in the following table.
F-51
Table of Contents
Notes to the Interim Consolidated Financial Statements—(Continued) (UNAUDITED)
| Billions of yen | Billions of yen | |||||||||||||||
| March 31, 2018(6) | September 30, 2018 | |||||||||||||||
| Derivative assets |
Derivative liabilities(1) |
Derivative assets |
Derivative liabilities(1) |
|||||||||||||
| Equity contracts |
||||||||||||||||
| OTC settled bilaterally |
¥ | 748 | ¥ | 769 | ¥ | 904 | ¥ | 864 | ||||||||
| Exchange-traded |
263 | 349 | 255 | 400 | ||||||||||||
| Interest rate contracts |
||||||||||||||||
| OTC settled bilaterally |
6,938 | 6,522 | 6,609 | 6,095 | ||||||||||||
| OTC centrally-cleared |
1,142 | 1,020 | 987 | 965 | ||||||||||||
| Exchange-traded |
16 | 9 | 11 | 5 | ||||||||||||
| Credit contracts |
||||||||||||||||
| OTC settled bilaterally |
390 | 300 | 406 | 309 | ||||||||||||
| OTC centrally-cleared |
125 | 125 | 182 | 188 | ||||||||||||
| Exchange-traded |
— | — | 1 | 1 | ||||||||||||
| Foreign exchange contracts |
||||||||||||||||
| OTC settled bilaterally |
5,495 | 5,087 | 6,728 | 6,474 | ||||||||||||
| OTC centrally-cleared |
— | — | — | — | ||||||||||||
| Commodity contracts |
||||||||||||||||
| OTC settled bilaterally |
— | — | 0 | 0 | ||||||||||||
| Exchange-traded |
1 | 1 | 1 | 1 | ||||||||||||
|
|
|
|
|
|
|
|
|
|||||||||
| Total gross derivative balances(2) |
¥ | 15,118 | ¥ | 14,182 | ¥ | 16,084 | ¥ | 15,302 | ||||||||
| Less: Amounts offset in the consolidated balance sheets(3) |
(14,094 | ) | (13,457 | ) | (15,035 | ) | (14,481 | ) | ||||||||
|
|
|
|
|
|
|
|
|
|||||||||
| Total net amounts reported on the face of the consolidated balance sheets(4) |
¥ | 1,024 | ¥ | 725 | ¥ | 1,049 | ¥ | 821 | ||||||||
| Less: Additional amounts not offset in the consolidated balance sheets(5) |
||||||||||||||||
| Financial instruments and non-cash collateral |
(228 | ) | (72 | ) | (227 | ) | (68 | ) | ||||||||
|
|
|
|
|
|
|
|
|
|||||||||
| Net amount |
¥ | 796 | ¥ | 653 | ¥ | 822 | ¥ | 753 | ||||||||
|
|
|
|
|
|
|
|
|
|||||||||
| (1) | Includes the amount of embedded derivatives bifurcated in accordance with ASC 815. |
| (2) | Includes all gross derivative asset and liability balances irrespective of whether they are transacted under a master netting agreement or whether Nomura has obtained sufficient evidence of enforceability of the master netting agreement. As of March 31, 2018, the gross balance of derivative assets and derivative liabilities which are not documented under master netting agreements or are documented under master netting agreements for which Nomura has not yet obtained sufficient evidence of enforceability was ¥150 billion and ¥276 billion, respectively. As of September 30, 2018, the gross balance of such derivative assets and derivative liabilities was ¥197 billion and ¥320 billion, respectively. |
| (3) | Represents amounts offset through counterparty netting of derivative assets and liabilities as well as cash collateral netting against net derivatives under master netting and similar agreements for which Nomura has obtained sufficient evidence of enforceability in accordance with ASC 815. As of March 31, 2018, Nomura offset a total of ¥1,201 billion of cash collateral receivables against net derivative liabilities and ¥1,838 billion of cash collateral payables against net derivative assets. As of September 30, 2018, Nomura offset a total of ¥1,314 billion of cash collateral receivables against net derivative liabilities and ¥1,868 billion of cash collateral payables against net derivative assets. |
| (4) | Net derivative assets and net derivative liabilities are generally reported within Trading assets and private equity investments—Trading assets and Trading liabilities, respectively in the consolidated balance sheet. Bifurcated embedded derivatives are reported within Short-term borrowings or Long-term borrowings depending on the maturity of the underlying host contract. |
F-52
Table of Contents
Notes to the Interim Consolidated Financial Statements—(Continued) (UNAUDITED)
| (5) | Represents amounts which are not permitted to be offset on the face of the consolidated balance sheets in accordance with ASC 210-20 and ASC 815 but which provide Nomura with a legally enforceable right of offset in the event of counterparty default. Amounts relating to derivative and collateral agreements where Nomura has not yet obtained sufficient evidence of enforceability of such offsetting rights are excluded. As of March 31, 2018, a total of ¥167 billion of cash collateral receivables and ¥391 billion of cash collateral payables, including amounts reported in the table, have not been offset against net derivatives. As of September 30, 2018, a total of ¥179 billion of cash collateral receivables and ¥486 billion of cash collateral payables, including amounts reported in the table, have not been offset against net derivatives. |
| (6) | During the year ended March 31, 2018, the rules of a specific central clearing house were amended such that daily variation margin payments and receipts against specific types of derivative now legally represent partial settlement of the derivative rather than margin. These payments and receipts are accounted for as partial settlement of the derivative rather than cash collateral. In addition, due to the changes in our accounting policy, certain reclassifications of previously reported amounts have been made to conform to the current year presentation. Please refer to Note 1. “Summary of accounting policies: New accounting pronouncements recently adopted” for further details. |
Derivatives used for trading purposes
Derivative financial instruments used for trading purposes, including bifurcated embedded derivatives, are carried at fair value with changes in fair value recognized through the consolidated statements of income within Revenue—Net gain on trading.
The following table presents amounts included in the consolidated statements of income related to derivatives used for trading and non-trading purposes by type of underlying derivative contract.
| Billions of yen | ||||||||
| Six months ended September 30 | ||||||||
| 2017 | 2018 | |||||||
| Derivatives used for trading and non-trading purposes(1)(2): |
||||||||
| Equity contracts |
¥ | 128 | ¥ | (38 | ) | |||
| Interest rate contracts |
(266 | ) | 40 | |||||
| Credit contracts |
128 | (64 | ) | |||||
| Foreign exchange contracts |
3 | (83 | ) | |||||
| Commodity contracts |
8 | 22 | ||||||
|
|
|
|
|
|||||
| Total |
¥ | 1 | ¥ | (123 | ) | |||
|
|
|
|
|
|||||
| Billions of yen | ||||||||
| Three months ended September 30 | ||||||||
| 2017 | 2018 | |||||||
| Derivatives used for trading and non-trading purposes(1)(2): |
||||||||
| Equity contracts |
¥ | 78 | ¥ | 59 | ||||
| Interest rate contracts |
(177 | ) | 86 | |||||
| Credit contracts |
48 | (17 | ) | |||||
| Foreign exchange contracts |
15 | (65 | ) | |||||
| Commodity contracts |
16 | 7 | ||||||
|
|
|
|
|
|||||
| Total |
¥ | (20 | ) | ¥ | 70 | |||
|
|
|
|
|
|||||
| (1) | Each derivative classification includes derivatives referencing multiple risk components. For example, interest rates contracts include complex derivatives referencing interest rate risk as well as foreign exchange risk or other factors such as prepayment rates. Credit contracts include credit default swaps as well as derivatives referencing corporate and government securities. |
| (2) | Includes net gains (losses) on derivatives used for non-trading purposes which are not designated as fair value or net investment hedges. For the six and three months ended September 30, 2017 and 2018, these amounts have not been separately presented as net gains (losses) for these non-trading derivatives were not significant. |
F-53
Table of Contents
Notes to the Interim Consolidated Financial Statements—(Continued) (UNAUDITED)
Fair value hedges
Nomura issues Japanese Yen and foreign currency denominated debt with both fixed and floating interest rates. Nomura generally enters into swap agreements to convert fixed rate interest payments on its debt obligations to a floating rate and applies fair value hedge accounting to these instruments.
Derivative financial instruments designated as fair value hedges are carried at fair value. Changes in fair value of the hedging derivatives are recognized together with those of the hedged liabilities and hedged debt securities in the consolidated statements of income within Interest expense and Revenue—Other, respectively.
The following table presents amounts included in the consolidated statements of income related to derivatives designated as fair value hedges by type of underlying derivative contract and the nature of the hedged item.
| Billions of yen | ||||||||
| Six months ended September 30 | ||||||||
| 2017 | 2018 | |||||||
| Derivatives designated as hedging instruments: |
||||||||
| Interest rate contracts |
¥ | 4 | ¥ | 0 | ||||
| Foreign exchange contracts |
2 | — | ||||||
|
|
|
|
|
|||||
| Total |
¥ | 6 | ¥ | 0 | ||||
|
|
|
|
|
|||||
| Hedged items: |
||||||||
| Long-term borrowings |
¥ | (4 | ) | ¥ | 0 | |||
| Non-trading debt securities |
(2 | ) | — | |||||
|
|
|
|
|
|||||
| Total |
¥ | (6 | ) | ¥ | 0 | |||
|
|
|
|
|
|||||
| Billions of yen | ||||||||
| Three months ended September 30 | ||||||||
| 2017 | 2018 | |||||||
| Derivatives designated as hedging instruments: |
||||||||
| Interest rate contracts |
¥ | 11 | ¥ | (1 | ) | |||
| Foreign exchange contracts |
1 | — | ||||||
|
|
|
|
|
|||||
| Total |
¥ | 12 | ¥ | (1 | ) | |||
|
|
|
|
|
|||||
| Hedged items: |
||||||||
| Long-term borrowings |
¥ | (11 | ) | ¥ | 1 | |||
| Non-trading debt securities |
(1 | ) | — | |||||
|
|
|
|
|
|||||
| Total |
¥ | (12 | ) | ¥ | 1 | |||
|
|
|
|
|
|||||
Net investment hedges
Nomura designates foreign currency forwards, etc., as hedges of certain subsidiaries with significant foreign exchange risks and applies hedge accounting to these instruments. Accordingly, the effective hedging portion of the foreign exchange gains (losses) arising from the derivative contracts and non-derivative financial products designated as hedges is recognized through the consolidated statements of comprehensive income within Other comprehensive income (loss)—Change in cumulative translation adjustments, net of tax. This is offset by the foreign exchange adjustments arising from consolidation of the relevant foreign subsidiaries.
The following table presents gains (losses) from derivatives and non-derivatives designated as net investment hedges included in the consolidated statements of comprehensive income.
F-54
Table of Contents
Notes to the Interim Consolidated Financial Statements—(Continued) (UNAUDITED)
| Billions of yen | ||||||||
| Six months ended September 30 | ||||||||
| 2017 | 2018 | |||||||
| Hedging instruments: |
||||||||
| Foreign exchange contracts |
¥ | 5 | ¥ | 3 | ||||
|
|
|
|
|
|||||
| Total |
¥ | 5 | ¥ | 3 | ||||
|
|
|
|
|
|||||
| Billions of yen | ||||||||
| Three months ended September 30 | ||||||||
| 2017 | 2018 | |||||||
| Hedging instruments: |
||||||||
| Foreign exchange contracts |
¥ | 11 | ¥ | 0 | ||||
|
|
|
|
|
|||||
| Total |
¥ | 11 | ¥ | 0 | ||||
|
|
|
|
|
|||||
| (1) | The portion of gains (losses) representing the amount of hedge ineffectiveness and the amount excluded from the assessment of hedge effectiveness are recognized within Revenue—Other in the consolidated statements of income. The amount of gains (losses) was not significant during the six months ended September 30, 2017 and 2018. The amount of gains (losses) was not significant during the three months ended September 30, 2017 and 2018. |
Derivatives containing credit risk related contingent features
Nomura enters into certain OTC derivatives and other agreements containing credit-risk-related contingent features. These features would require Nomura to post additional collateral or settle the instrument upon occurrence of a credit event, the most common of which would be a downgrade in the Company’s long-term credit rating.
The aggregate fair value of all derivative instruments with credit-risk-related contingent features that are in a liability position as of March 31, 2018 was ¥406 billion with related collateral pledged of ¥314 billion. In the event of a one-notch downgrade to Nomura’s long-term credit rating in effect as of March 31, 2018 the aggregate fair value of assets that would have been required to be posted as additional collateral or that would have been needed to settle the instruments immediately was ¥3 billion.
The aggregate fair value of all derivative instruments with credit-risk-related contingent features that are in a liability position as of September 30, 2018 was ¥455 billion with related collateral pledged of ¥352 billion. In the event of a one-notch downgrade to Nomura’s long-term credit rating in effect as of September 30, 2018 the aggregate fair value of assets that would have been required to be posted as additional collateral or that would have been needed to settle the instruments immediately was ¥8 billion.
Credit derivatives
Credit derivatives are derivative instruments in which one or more of their underlyings are related to the credit risk of a specified entity (or group of entities) or an index based on the credit risk of a group of entities that expose the seller of credit protection to potential loss from credit risk related events specified in the contract.
Written credit derivatives are instruments or embedded features where Nomura assumes third party credit risk, either as guarantor in a guarantee-type contract, or as the party that provides credit protection in an option-type contract, credit default swap, or any other credit derivative contract.
Nomura enters into credit derivatives as part of its normal trading activities as both purchaser and seller of protection for credit risk mitigation, proprietary trading positions and for client transactions.
The most significant type of credit derivatives used by Nomura are single-name credit default swaps where settlement of the derivative is based on the credit risk of a single third party. Nomura also writes credit derivatives linked to the performance of credit default indices and issues other credit risk related portfolio products.
Nomura would have to perform under a credit derivative contract if a credit event as defined in the respective contract occurs. Typical credit events include bankruptcy, failure to pay and restructuring of obligations of the reference asset.
F-55
Table of Contents
Notes to the Interim Consolidated Financial Statements—(Continued) (UNAUDITED)
Credit derivative contracts written by Nomura are either cash or physically settled. In cash-settled instruments, once payment is made upon an event of a default, the contract usually terminates with no further payments due. Nomura generally has no right to assume the reference assets of the counterparty in exchange for payment, nor does Nomura usually have any direct recourse to the actual issuers of the reference assets to recover the amount paid. In physically settled contracts, upon a default event, Nomura takes delivery of the reference asset in return for payment of the full notional amount of the contract.
Nomura actively monitors and manages its credit derivative exposures. Where protection is sold, risks may be mitigated by purchasing credit protection from other third parties either on identical underlying reference assets or on underlying reference assets with the same issuer which would be expected to behave in a correlated fashion. The most common form of recourse provision to enable Nomura to recover from third parties any amounts paid under a written credit derivative is therefore not through the derivative itself but rather through the separate purchase of credit derivatives with identical or correlated underlyings.
Nomura quantifies the value of these purchased contracts in the following tables in the column titled “Purchased Credit Protection.” These amounts represent purchased credit protection with identical underlyings to the written credit derivative contracts which act as a hedge against Nomura’s exposure. To the extent Nomura is required to pay out under the written credit derivative, a similar amount would generally become due to Nomura under the purchased hedge.
Credit derivatives have a stated notional amount which represents the maximum payment Nomura may be required to make under the contract. However, this is generally not a true representation of the amount Nomura will actually pay as in addition to purchased credit protection, other risk mitigating factors reduce the likelihood and amount of any payment, including:
The probability of default: Nomura values credit derivatives taking into account the probability that the underlying reference asset will default and that Nomura will be required to make payments under the contract. Based on historical experience and Nomura’s assessment of the market, Nomura believes that the probability that all reference assets on which Nomura provides protection will default in a single period is remote. The disclosed notional amount, therefore, significantly overstates Nomura’s realistic exposure on these contracts.
The recovery value on the underlying asset: In the case of a default, Nomura’s liability on a contract is limited to the difference between the notional amount and the recovery value of the underlying reference asset. While the recovery value on a defaulted asset may be minimal, this does reduce amounts paid on these contracts.
Nomura holds assets as collateral in relation to written credit derivatives. However, these amounts do not enable Nomura to recover any amounts paid under the credit derivative but rather mitigate the risk of economic loss arising from a counterparty defaulting against amounts due to Nomura under the contract. Collateral requirements are determined on a counterparty level rather than individual contract, and also generally cover all types of derivative contracts rather than just credit derivatives.
The following tables present information about Nomura’s written credit derivatives and purchased credit protection with identical underlyings as of March 31, 2018 and September 30, 2018.
| Billions of yen | ||||||||||||||||||||||||||||
| March 31, 2018 | ||||||||||||||||||||||||||||
| Maximum potential payout/Notional | Notional | |||||||||||||||||||||||||||
| Carrying value (Asset) / Liability(1) |
Total | Years to maturity | Purchased credit protection |
|||||||||||||||||||||||||
| Less than 1 year |
1 to 3 years |
3 to 5 years |
More than 5 years |
|||||||||||||||||||||||||
| Single-name credit default swaps |
¥ | (123 | ) | ¥ | 9,271 | ¥ | 2,106 | ¥ | 3,780 | ¥ | 2,262 | ¥ | 1,123 | ¥ | 6,975 | |||||||||||||
| Credit default indices |
(72 | ) | 4,842 | 864 | 1,300 | 2,045 | 633 | 3,052 | ||||||||||||||||||||
| Other credit risk related portfolio products |
3 | 306 | 230 | 52 | 17 | 7 | 200 | |||||||||||||||||||||
|
|
|
|
|
|
|
|
|
|
|
|
|
|
|
|||||||||||||||
| Total |
¥ | (192 | ) | ¥ | 14,419 | ¥ | 3,200 | ¥ | 5,132 | ¥ | 4,324 | ¥ | 1,763 | ¥ | 10,227 | |||||||||||||
|
|
|
|
|
|
|
|
|
|
|
|
|
|
|
|||||||||||||||
F-56
Table of Contents
Notes to the Interim Consolidated Financial Statements—(Continued) (UNAUDITED)
| Billions of yen | ||||||||||||||||||||||||||||
| September 30, 2018 | ||||||||||||||||||||||||||||
| Maximum potential payout/Notional | Notional | |||||||||||||||||||||||||||
| Carrying value (Asset) / Liability(1) |
Total | Years to maturity | Purchased credit protection |
|||||||||||||||||||||||||
| Less than 1 year |
1 to 3 years |
3 to 5 years |
More than 5 years |
|||||||||||||||||||||||||
| Single-name credit default swaps |
¥ | (64 | ) | ¥ | 8,740 | ¥ | 1,975 | ¥ | 3,365 | ¥ | 2,390 | ¥ | 1,010 | ¥ | 6,414 | |||||||||||||
| Credit default indices |
(107 | ) | 5,180 | 548 | 1,271 | 2,688 | 673 | 3,738 | ||||||||||||||||||||
| Other credit risk related portfolio products |
14 | 244 | 168 | 21 | 52 | 3 | 175 | |||||||||||||||||||||
|
|
|
|
|
|
|
|
|
|
|
|
|
|
|
|||||||||||||||
| Total |
¥ | (157 | ) | ¥ | 14,164 | ¥ | 2,691 | ¥ | 4,657 | ¥ | 5,130 | ¥ | 1,686 | ¥ | 10,327 | |||||||||||||
|
|
|
|
|
|
|
|
|
|
|
|
|
|
|
|||||||||||||||
| (1) | Carrying value amounts are shown on a gross basis prior to cash collateral or counterparty netting. Asset balances represent positive fair value amounts caused by tightening of credit spreads of underlyings since inception of the credit derivative contracts. |
The following tables present information about Nomura’s written credit derivatives by external credit rating of the underlying asset. Ratings are based on Standard & Poor’s Financial Services LLC (“S&P”), or if not rated by S&P, based on Moody’s Investors Service, Inc. If ratings from either of these agencies are not available, the ratings are based on Fitch Ratings Ltd. or Japan Credit Rating Agency, Ltd. For credit default indices, the rating is determined by taking the weighted average of the external credit ratings given for each of the underlying reference entities comprising the portfolio or index.
| Billions of yen | ||||||||||||||||||||||||||||
| March 31, 2018 | ||||||||||||||||||||||||||||
| Maximum potential payout/Notional | ||||||||||||||||||||||||||||
| AAA | AA | A | BBB | BB | Other(1) | Total | ||||||||||||||||||||||
| Single-name credit default swaps |
¥ | 466 | ¥ | 928 | ¥ | 2,763 | ¥ | 3,476 | ¥ | 1,369 | ¥ | 269 | ¥ | 9,271 | ||||||||||||||
| Credit default indices |
135 | 44 | 1,779 | 1,949 | 736 | 199 | 4,842 | |||||||||||||||||||||
| Other credit risk related portfolio products |
16 | — | 4 | 68 | 118 | 100 | 306 | |||||||||||||||||||||
|
|
|
|
|
|
|
|
|
|
|
|
|
|
|
|||||||||||||||
| Total |
¥ | 617 | ¥ | 972 | ¥ | 4,546 | ¥ | 5,493 | ¥ | 2,223 | ¥ | 568 | ¥ | 14,419 | ||||||||||||||
|
|
|
|
|
|
|
|
|
|
|
|
|
|
|
|||||||||||||||
| Billions of yen | ||||||||||||||||||||||||||||
| September 30, 2018 | ||||||||||||||||||||||||||||
| Maximum potential payout/Notional | ||||||||||||||||||||||||||||
| AAA | AA | A | BBB | BB | Other(1) | Total | ||||||||||||||||||||||
| Single-name credit default swaps |
¥ | 494 | ¥ | 903 | ¥ | 2,411 | ¥ | 3,283 | ¥ | 1,341 | ¥ | 308 | ¥ | 8,740 | ||||||||||||||
| Credit default indices |
22 | 33 | 1,697 | 2,237 | 945 | 246 | 5,180 | |||||||||||||||||||||
| Other credit risk related portfolio products |
— | — | 1 | 60 | 128 | 55 | 244 | |||||||||||||||||||||
|
|
|
|
|
|
|
|
|
|
|
|
|
|
|
|||||||||||||||
| Total |
¥ | 516 | ¥ | 936 | ¥ | 4,109 | ¥ | 5,580 | ¥ | 2,414 | ¥ | 609 | ¥ | 14,164 | ||||||||||||||
|
|
|
|
|
|
|
|
|
|
|
|
|
|
|
|||||||||||||||
| (1) | “Other” includes credit derivatives where the credit rating of the underlying reference asset is below investment grade or where a rating is unavailable. |
F-57
Table of Contents
Notes to the Interim Consolidated Financial Statements—(Continued) (UNAUDITED)
Derivatives entered into in contemplation of sales of financial assets
Nomura enters into transactions which involve both the transfer of financial assets to a third party counterparty and a separate agreement with the same counterparty entered into in contemplation of the initial transfer through which Nomura retains substantially all of the exposure to the economic return on the transferred financial assets throughout the term of the transaction. These transactions primarily include sales of securities with bilateral OTC total return swaps or other derivative agreements which are in-substance total return swaps. These transactions are accounted for as sales of the securities with the derivative accounted for separately if the criteria for derecognition of the securities under ASC 860 are met. Where the derecognition criteria are not met, the transfer and separate derivative are accounted for as a single collateralized financing transaction which is reported within Long-term borrowings—Trading balances of secured borrowings in the consolidated balance sheets.
As of March 31, 2018 and September 30, 2018, there were no outstanding sales with total return swap or in-substance total return swap transactions accounted for as sales rather than collateralized financing transactions.
F-58
Table of Contents
Notes to the Interim Consolidated Financial Statements—(Continued) (UNAUDITED)
4. Revenue from services provided to customers
Revenues by types of service
The following table presents revenue earned by Nomura from providing services to customers by relevant line item in Nomura’s consolidated statement of income for the six and three months ended September 30, 2018.
| Millions of yen | ||||
| Six months ended September 30 | ||||
| 2018 | ||||
| Commissions |
¥ | 154,239 | ||
| Fees from investment banking |
43,078 | |||
| Asset management and portfolio service fees |
125,721 | |||
| Other revenue |
29,008 | |||
|
|
|
|||
| Total |
¥ | 352,046 | ||
|
|
|
|||
| Millions of yen | ||||
| Three months ended September 30 | ||||
| 2018 | ||||
| Commissions |
¥ | 74,783 | ||
| Fees from investment banking |
19,119 | |||
| Asset management and portfolio service fees |
62,740 | |||
| Other revenue |
15,552 | |||
|
|
|
|||
| Total |
¥ | 172,194 | ||
|
|
|
|||
Amounts reported in Commissions is principally recognized from Trade execution and clearing services provided to the customers, and about half of which is reported in Retail Division and the remaining balance is mainly reported in Wholesale Division. Fees from investment banking is recognized from Financial advisory services as well as Underwriting and syndication services provided to the customers, and is predominantly reported in Wholesale Division and the remaining balance is mainly reported in Retail Division. Asset management and portfolio service fees is recognized from Asset management services provided to the customers, and is predominantly reported in Asset Management Division and the remaining balance is mainly reported in Retail Division. Other is primarily reported in Other segment.
The following table presents summary information regarding the key methodologies, assumptions and judgments used in recognizing revenue for each of the primary types of service provided to customers, including the nature of underlying performance obligations within each type of service and whether those performance obligations are satisfied at a point in time or over a period of time. For performance obligations recognized over time, information is also provided to explain the nature of the input or output method used to recognize revenue over time.
| Type of service provided to customers |
Overview of key services provided |
Key revenue recognition policies, assumptions and significant judgments | ||
| Trade execution and clearing services |
• Buying and selling of securities on behalf of customers
• Clearing of securities and derivatives on behalf of customers |
• Execution and clearing commissions recognized at a point in time, namely trade date.
• Commissions recognized net of soft dollar credits provided to customers where Nomura is acting as agent in providing investment research and similar services to the customer. |
F-59
Table of Contents
Notes to the Interim Consolidated Financial Statements—(Continued) (UNAUDITED)
| Type of service provided to customers |
Overview of key services provided |
Key revenue recognition policies, assumptions and | ||
| Financial advisory services | • Provision of financial advice to customers in connection with a specific forecasted transaction or transactions
• Provision of financial advice not in connection with a specific forecasted transaction or transactions such as general corporate intelligence and similar research
• Issuance of fairness opinions.
• Structuring complex financial instruments for customers |
• Fees contingent on the success of an underlying transaction are variable consideration recognized when the underlying transaction has been completed since only at such point is it probable that a significant reversal of revenue will not occur.
• Retainer and milestone fees are recognized either over the period to which they relate or are deferred until consummation of the underlying transaction depending on whether the underlying performance obligation is satisfied at a point in time or over time.
• Judgment is required to make this determination with factors influencing this determination including, but not limited to, whether the fee is in connection with an engagement designed to achieve a specific transaction or outcome for the customer (such as the purchase or sale of a business), the nature and extent of benefit to be provided to the customer prior to, and in addition to such specific transaction or outcome and the fee structure for the engagement.
• Retainer and milestone fees recognized over time are normally recognized on a straight-line basis over the term of the contract based on time elapsed.
| ||
| Asset management services | • Management of funds, investment trusts and other investment vehicles
• Provision of investment advisory services
• Distribution of fund units
• Providing custodial and administrative services to customers |
• Management fees earned by Nomura in connection with managing a fund, investment trust or other vehicle generally recognized on a straight-line basis based on time elapsed.
• Performance-based fees are variable consideration recognized when the performance metric has been determined since only at such point is it probable that a significant reversal of revenue will not occur.
• Distribution fees are recognized at a point in time when the fund units have been sold to third party investors.
• Custodial and administrative fees recognized on a straight-line basis over time based on time elapsed. | ||
| Underwriting and syndication services | • Underwriting of debt, equity and other financial instruments on behalf of customers
• Distributing securities on behalf of issuers
• Arranging loan financing for customers
• Syndicating loan financing on behalf of customers |
• Underwriting and syndication revenues recognized at a point in time when the underlying transaction is complete.
• Commitment fees where drawn down of the facility is deemed remote recognized on a straight-line basis over the life of the facility based on time elapsed.
• Underwriting and syndication costs recognized either as a reduction of revenue or on a gross basis depending on whether Nomura is acting as principal or agent for such amounts. | ||
Where revenue is recognized at a point on time, payments of fees are typically received at the same time as when the performance obligation is satisfied, or within several days or months after satisfying a performance obligation. In relation to revenue recognized over time, payments of fees are received are received every month, three months or six months.
F-60
Table of Contents
Notes to the Interim Consolidated Financial Statements—(Continued) (UNAUDITED)
The underlying contracts entered into by Nomura in order to provide the services described above typically do not have significant financing components within the contracts either provided to or from Nomura. If such components did exist in a contract, Nomura has made an accounting policy permitted by ASC 606 “Revenue from Contracts with Customers” (“ASC 606”) not to adjust for the effects of a significant financing component where the financing is effectively for a period of one year or less. Such contracts also typically do not contain rights of return or similar features for the customer.
Nomura adopted ASU 2014-09 “Revenue from Contracts with Customers” by modified retrospective adoption from April 1, 2018. As a result of revised principal-versus-agency guidance, Revenue – Commissions and Non-interest expenses—Commissions and floor brokerage were decreased by ¥8,640 million and ¥4,061 million as a change in the presentation of certain trade execution revenues and associated costs from a gross to a net basis in the consolidated statement of income for the six month ended September 30, 2018 and the three month ended September 30, 2018, respectively. Impact from earlier recognition of certain asset management distribution fees on adoption date is noted in Note 1. “Summary of accounting policies: New accounting pronouncements recently adopted” and no material impact in consolidated income statement for the six months ended September 30, 2018.
Other than above, there were no material impacts in our consolidated financial statements.
Customer contract balances
When Nomura or the customer performs in accordance with the terms of a customer contract, a customer contract asset, customer contract receivable or customer contract liability is recognized in Nomura’s consolidated balance sheet.
A customer contract asset represents accrued revenue recognized by Nomura for completing or partially completing a performance obligation, namely a right of Nomura to receive consideration for providing the service to the customer, which is conditioned on something other than the passage of time. A customer contract receivable is an unconditional right of Nomura to receive consideration in exchange for providing the service. Both customer contract assets and customer contract receivables are reported in Receivables from Customers within Nomura’s consolidated balance sheet. A customer contract liability is any liability recognized in connection with a customer contract, including obligations to provide refunds and obligations to provide a service in the future for which consideration has already been received or is due to be received. Customer contract liabilities are reported in Payables to Customers within Nomura’s consolidated balance sheet.
The following table presents the balances of customer contract receivables, customer contract assets and customer contract liabilities in scope of ASC 606 “Revenue from Contracts with Customers” as of April 1, 2018 and September 30, 2018. The amount of Customer contract assets as of April 1, 2018 and September 30, 2018 was immaterial.
| Millions of yen | ||||||||
| April 1, 2018 | September 30, 2018 | |||||||
| Customer contract receivables |
¥ | 68,927 | ¥ | 78,346 | ||||
| Customer contract liabilities(1) |
3,792 | 3,880 | ||||||
| (1) | Customer contract liabilities primarily represent rise from investment advisory services recognized in connection with the term of the contract based on time elapsed. |
The balance of contract liabilities as of April 1, 2018 were recognized as revenue for the six months ended September 30, 2018. Nomura recognized ¥1,053 million and ¥307 million of revenue from performance obligations satisfied in previous periods for the six month ended September 30, 2018 and the three month ended September 30, 2018, respectively.
Transaction price allocated to the remaining performance obligations
As permitted by ASC 606, Nomura has chosen not to disclose information about remaining performance obligations that have original expected durations of one year or less as of September 30, 2018.
Nomura retains no significant transactions for which individual estimated contract period exceeding one year. In addition, considerations arising from contracts with customers do not comprise any significant amount that is not included in transaction price.
Customer contract costs
As permitted by ASC 340 “Other Assets and Deferred Costs”, Nomura has elected to expense all costs to obtain customer contracts where such amounts would be otherwise be expensed within one year or less. As a result, the amount of deferred costs to obtain or fulfill customer contracts as of April 1, 2018 and September 30, 2018 were not significant.
F-61
Table of Contents
Notes to the Interim Consolidated Financial Statements—(Continued) (UNAUDITED)
5. Collateralized transactions:
Nomura enters into collateralized transactions, including reverse repurchase agreements, repurchase agreements, securities borrowing transactions, securities lending transactions, other secured borrowings and similar transactions mainly to meet clients’ needs, finance trading inventory positions and obtain securities for settlements.
Reverse repurchase agreements, repurchase agreements, securities borrowing transactions and securities lending transactions are typically documented under industry standard master netting agreements which reduce Nomura’s credit exposure to counterparties as they permit the close-out and offset of transactions and collateral amounts in the event of default of the counterparty. For certain centrally-cleared reverse repurchase and repurchase agreements, the clearing or membership agreements entered into by Nomura provide similar rights to Nomura in the event of default of the relevant central clearing counterparty. In order to support the enforceability of the close-out and offsetting rights within these agreements, Nomura generally seeks to obtain an external legal opinion.
For certain types of counterparty and in certain jurisdictions, Nomura may enter into reverse repurchase agreements, repurchase agreements, securities borrowing and securities lending transactions which are not documented under a master netting agreement. Similarly, even when these transactions are documented under such agreements, Nomura may not have yet sought evidence, or may not be able to obtain evidence to determine with sufficient certainty that the close-out and offsetting rights are legally enforceable. This may be the case where relevant local laws specifically prohibit such close-out and offsetting rights, or where local laws are complex, ambiguous or silent on the enforceability of such rights. This may include reverse repurchase agreements, repurchase agreements, securities borrowing and securities lending transactions executed with certain foreign governments, agencies, municipalities, central clearing counterparties, agent banks and pension funds.
Nomura considers the enforceability of a master netting agreement in determining how credit risk arising from transactions with a specific counterparty is hedged, how counterparty credit exposures are calculated and applied to credit limits and the extent and nature of collateral requirements from the counterparty.
In all of these transactions, Nomura either receives or provides collateral, including Japanese and non-Japanese government, agency, mortgage-backed, bank and corporate debt securities and equities. In most cases, Nomura is permitted to use the securities received to enter into repurchase agreements, enter into securities lending transactions or to cover short positions with counterparties. In repurchase and reverse repurchase agreements, the value of collateral typically exceeds the amount of cash transferred. Collateral is generally in the form of securities. Securities borrowing transactions generally require Nomura to provide the counterparty with collateral in the form of cash or other securities. For securities lending transactions, Nomura generally receives collateral in the form of cash or other securities. Nomura monitors the market value of the securities either received from or provided to the counterparty. Additional cash or securities are exchanged as necessary, to ensure that such transactions are adequately collateralized throughout the life of the transactions.
Offsetting of certain collateralized transactions
Reverse repurchase agreements and repurchase agreements, securities borrowing and lending transactions with the same counterparty documented under a master netting agreement are offset in the consolidated balance sheets where the specific criteria defined by ASC 210-20 are met. These criteria include requirements around the maturity of the transactions, the underlying systems on which the collateral is settled, associated banking arrangements and the legal enforceability of close-out and offsetting rights under the master netting agreement.
The following tables present information about offsetting of these transactions in the consolidated balance sheets, together with the extent to which master netting agreements entered into with counterparties and central clearing parties permit additional offsetting in the event of counterparty default. Transactions which are not documented under a master netting agreement or are documented under a master netting agreement for which Nomura does not have sufficient evidence of enforceability are not offset in the following tables.
F-62
Table of Contents
Notes to the Interim Consolidated Financial Statements—(Continued) (UNAUDITED)
| Billions of yen | ||||||||||||||||
| March 31, 2018 | ||||||||||||||||
| Assets | Liabilities | |||||||||||||||
| Reverse repurchase agreements |
Securities borrowing transactions |
Repurchase agreements |
Securities lending transactions |
|||||||||||||
| Total gross balance(1) |
¥ | 29,975 | ¥ | 6,681 | ¥ | 34,880 | ¥ | 2,130 | ||||||||
| Less: Amounts offset in the consolidated balance sheets(2) |
(20,121 | ) | (305 | ) | (20,121 | ) | (305 | ) | ||||||||
|
|
|
|
|
|
|
|
|
|||||||||
| Total net amounts of reported on the face of the consolidated balance sheets(3) |
¥ | 9,854 | ¥ | 6,376 | ¥ | 14,759 | ¥ | 1,825 | ||||||||
|
|
|
|
|
|
|
|
|
|||||||||
| Less: Additional amounts not offset in the consolidated balance sheets(4) |
||||||||||||||||
| Financial instruments and non-cash collateral |
(8,657 | ) | (5,247 | ) | (11,886 | ) | (674 | ) | ||||||||
| Cash collateral |
(33 | ) | — | 3 | — | |||||||||||
|
|
|
|
|
|
|
|
|
|||||||||
| Net amount |
¥ | 1,164 | ¥ | 1,129 | ¥ | 2,876 | ¥ | 1,151 | ||||||||
|
|
|
|
|
|
|
|
|
|||||||||
| Billions of yen | ||||||||||||||||
| September 30, 2018 | ||||||||||||||||
| Assets | Liabilities | |||||||||||||||
| Reverse repurchase agreements |
Securities borrowing transactions |
Repurchase agreements |
Securities lending transactions |
|||||||||||||
| Total gross balance(1) |
¥ | 34,128 | ¥ | 4,489 | ¥ | 37,361 | ¥ | 1,691 | ||||||||
| Less: Amounts offset in the consolidated balance sheets(2) |
(18,715 | ) | — | (18,715 | ) | — | ||||||||||
|
|
|
|
|
|
|
|
|
|||||||||
| Total net amounts of reported on the face of the consolidated balance sheets(3) |
¥ | 15,413 | ¥ | 4,489 | ¥ | 18,646 | ¥ | 1,691 | ||||||||
|
|
|
|
|
|
|
|
|
|||||||||
| Less: Additional amounts not offset in the consolidated balance sheets(4) |
||||||||||||||||
| Financial instruments and non-cash collateral |
(13,524 | ) | (3,515 | ) | (13,576 | ) | (1,522 | ) | ||||||||
| Cash collateral |
(4 | ) | — | — | — | |||||||||||
|
|
|
|
|
|
|
|
|
|||||||||
| Net amount |
¥ | 1,885 | ¥ | 974 | ¥ | 5,070 | ¥ | 169 | ||||||||
|
|
|
|
|
|
|
|
|
|||||||||
| (1) | Includes all recognized balances irrespective of whether they are transacted under a master netting agreement or whether Nomura has obtained sufficient evidence of enforceability of the master netting agreement. Amounts include transactions carried at fair value through election of the fair value option. As of March 31, 2018, the gross balance of reverse repurchase agreements and repurchase agreements which were not transacted under master netting agreements or are documented under master netting agreements for which Nomura has not yet obtained sufficient evidence of enforceability was ¥1,039 billion and ¥2,827 billion, respectively. As of March 31, 2018, the gross balance of securities borrowing transactions and securities lending transactions which were not transacted under master netting agreements or are documented under master netting agreements for which Nomura has not yet obtained sufficient evidence of enforceability was ¥1,049 billion and ¥177 billion, respectively. As of September 30, 2018, the gross balance of reverse repurchase agreements and repurchase agreements which were not transacted under master netting agreements or are documented under master netting agreements for which Nomura has not yet obtained sufficient evidence of enforceability was ¥923 billion and ¥4,133 billion, respectively. As of September 30, 2018, the gross balance of securities borrowing transactions and securities lending transactions which were not transacted under master netting agreements or are documented under master netting agreements for which Nomura has not yet obtained sufficient evidence of enforceability was ¥890 billion and ¥153 billion, respectively. |
| (2) | Represents amounts offset through counterparty netting under master netting and similar agreements for which Nomura has obtained sufficient evidence of enforceability in accordance with ASC 210-20. Amounts offset include transactions carried at fair value through election of the fair value option. |
F-63
Table of Contents
Notes to the Interim Consolidated Financial Statements—(Continued) (UNAUDITED)
| (3) | Reverse repurchase agreements and securities borrowing transactions are reported within Collateralized agreements—Securities purchased under agreements to resell and Collateralized agreements—Securities borrowed in the consolidated balance sheets, respectively. Repurchase agreements and securities lending transactions are reported within Collateralized financing—Securities sold under agreements to repurchase and Collateralized financing—Securities loaned in the consolidated balance sheets, respectively. Amounts reported under securities lending transactions also include transactions where Nomura lends securities and receives securities that can be sold or pledged as collateral. Nomura recognizes the securities received at fair value and a liability for the same amount, representing the obligation to return those securities. The liability is reported within Other liabilities in the consolidated balance sheets. |
| (4) | Represents amounts which are not permitted to be offset on the face of the balance sheet in accordance with ASC 210-20 but which provide Nomura with the right of offset in the event of counterparty default. Amounts relating to agreements where Nomura has not yet obtained sufficient evidence of enforceability of such offsetting rights are excluded. |
Maturity analysis of repurchase agreements and securities lending transactions
The following table presents an analysis of the total carrying value of liabilities recognized in the consolidated balance sheets for repurchase agreements and securities lending transactions by remaining contractual maturity of the agreement as of March 31, 2018 and September 30, 2018. Amounts reported are shown prior to counterparty netting in accordance with ASC 210-20.
| Billions of yen | ||||||||||||||||||||||||
| March 31, 2018 | ||||||||||||||||||||||||
| Overnight and open(1) |
Up to 30 days |
30 – 90 days |
90 days – 1 year |
Greater than 1 year |
Total | |||||||||||||||||||
| Repurchase agreements |
¥ | 13,237 | ¥ | 17,789 | ¥ | 2,099 | ¥ | 1,415 | ¥ | 340 | ¥ | 34,880 | ||||||||||||
| Securities lending transactions |
1,495 | 227 | 182 | 156 | 70 | 2,130 | ||||||||||||||||||
|
|
|
|
|
|
|
|
|
|
|
|
|
|||||||||||||
| Total gross recognized liabilities(2) |
¥ | 14,732 | ¥ | 18,016 | ¥ | 2,281 | ¥ | 1,571 | ¥ | 410 | ¥ | 37,010 | ||||||||||||
|
|
|
|
|
|
|
|
|
|
|
|
|
|||||||||||||
| Billions of yen | ||||||||||||||||||||||||
| September 30, 2018 | ||||||||||||||||||||||||
| Overnight and open(1) |
Up to 30 days |
30 – 90 days |
90 days – 1 year |
Greater than 1 year |
Total | |||||||||||||||||||
| Repurchase agreements |
¥ | 14,056 | ¥ | 18,495 | ¥ | 2,587 | ¥ | 1,880 | ¥ | 343 | ¥ | 37,361 | ||||||||||||
| Securities lending transactions |
1,086 | 212 | 145 | 178 | 70 | 1,691 | ||||||||||||||||||
|
|
|
|
|
|
|
|
|
|
|
|
|
|||||||||||||
| Total gross recognized liabilities(2) |
¥ | 15,142 | ¥ | 18,707 | ¥ | 2,732 | ¥ | 2,058 | ¥ | 413 | ¥ | 39,052 | ||||||||||||
|
|
|
|
|
|
|
|
|
|
|
|
|
|||||||||||||
| (1) | Open transactions do not have an explicit contractual maturity date and are terminable on demand by Nomura or the counterparty. |
| (2) | Repurchase agreements and securities lending transactions are reported within Collateralized financing—Securities sold under agreements to repurchase and Collateralized financing—Securities loaned in the consolidated balance sheets, respectively. Amounts reported for securities lending transactions also include transactions where Nomura lends securities and receives securities that can be sold or pledged as collateral. Nomura recognizes the securities received at fair value and a liability for the same amount, representing the obligation to return those securities. The liability is reported within Other liabilities in the consolidated balance sheets. The total gross recognized liabilities reported for repurchase agreements and securities lending transactions are consistent with the total gross balances reported in the offsetting disclosures above. |
F-64
Table of Contents
Notes to the Interim Consolidated Financial Statements—(Continued) (UNAUDITED)
Securities transferred in repurchase agreements and securities lending transactions
The following table presents an analysis of the total carrying value of liabilities recognized in the consolidated balance sheets for repurchase agreements and securities lending transactions by class of securities transferred by Nomura to counterparties as of March 31, 2018 and September 30, 2018. Amounts reported are shown prior to counterparty netting in accordance with ASC 210-20.
| Billions of yen | ||||||||||||
| March 31, 2018 | ||||||||||||
| Repurchase agreements |
Securities lending transactions |
Total | ||||||||||
| Equities and convertible securities |
¥ | 187 | ¥ | 1,556 | ¥ | 1,743 | ||||||
| Japanese government, agency and municipal securities |
980 | 306 | 1,286 | |||||||||
| Foreign government, agency and municipal securities |
27,818 | 135 | 27,953 | |||||||||
| Bank and corporate debt securities |
2,334 | 34 | 2,368 | |||||||||
| Commercial mortgage-backed securities (“CMBS”) |
2 | — | 2 | |||||||||
| Residential mortgage-backed securities (“RMBS”)(1) |
3,421 | — | 3,421 | |||||||||
| Collateralized debt obligations (“CDOs”) and other |
130 | — | 130 | |||||||||
| Investment trust funds and other |
8 | 99 | 107 | |||||||||
|
|
|
|
|
|
|
|||||||
| Total gross recognized liabilities(2) |
¥ | 34,880 | ¥ | 2,130 | ¥ | 37,010 | ||||||
|
|
|
|
|
|
|
|||||||
| Billions of yen | ||||||||||||
| September 30, 2018 | ||||||||||||
| Repurchase agreements |
Securities lending transactions |
Total | ||||||||||
| Equities and convertible securities |
¥ | 109 | ¥ | 1,369 | ¥ | 1,478 | ||||||
| Japanese government, agency and municipal securities |
1,407 | — | 1,407 | |||||||||
| Foreign government, agency and municipal securities |
28,389 | 34 | 28,423 | |||||||||
| Bank and corporate debt securities |
2,455 | 91 | 2,546 | |||||||||
| Commercial mortgage-backed securities (“CMBS”) |
14 | — | 14 | |||||||||
| Residential mortgage-backed securities (“RMBS”)(1) |
4,863 | — | 4,863 | |||||||||
| Collateralized debt obligations (“CDOs”) and other |
109 | — | 109 | |||||||||
| Investment trust funds and other |
15 | 197 | 212 | |||||||||
|
|
|
|
|
|
|
|||||||
| Total gross recognized liabilities(2) |
¥ | 37,361 | ¥ | 1,691 | ¥ | 39,052 | ||||||
|
|
|
|
|
|
|
|||||||
| (1) | Includes ¥3,351 billion as of March 31, 2018 and ¥4,752 billion as of September 30, 2018 of U.S. government sponsored agency mortgage pass-through securities and collateralized mortgage obligations. |
| (2) | Repurchase agreements and securities lending transactions are reported within Collateralized financing—Securities sold under agreements to repurchase and Collateralized financing—Securities loaned in the consolidated balance sheets, respectively. Amounts reported for securities lending transactions also include transactions where Nomura lends securities and receives securities that can be sold or pledged as collateral. Nomura recognizes the securities received at fair value and a liability for the same amount, representing the obligation to return those securities. The liability is reported within Other liabilities in the consolidated balance sheets. The total gross recognized liabilities reported for repurchase agreements and securities lending transactions are consistent with the total gross balances reported in the offsetting disclosures above. |
Collateral received by Nomura
The following table presents the fair value of securities received as collateral, securities borrowed with collateral and securities borrowed without collateral, which Nomura is permitted to sell or repledge, and the portion that has been sold or repledged as of March 31, 2018 and September 30, 2018.
F-65
Table of Contents
Notes to the Interim Consolidated Financial Statements—(Continued) (UNAUDITED)
| Billions of yen | ||||||||
| March 31, 2018 | September 30, 2018 | |||||||
| The fair value of securities received as collateral, securities borrowed as collateral and securities borrowed without collateral where Nomura is permitted by contract or custom to sell or repledge the securities |
¥ | 48,434 | ¥ | 49,097 | ||||
| The portion of the above that has been sold (reported within Trading liabilities in the consolidated balance sheets) or repledged |
40,420 | 39,742 | ||||||
Collateral pledged by Nomura
Nomura pledges firm-owned securities to collateralize repurchase transactions, other secured financings and derivative transactions. Pledged securities that can be sold or repledged by the transferee, including Gensaki Repo transactions, are reported in parentheses as Securities pledged as collateral within Trading assets in the consolidated balance sheets.
The following table presents the carrying amounts of financial assets recognized in the consolidated balance sheets which have been pledged as collateral, primarily to stock exchanges and clearing organizations, without allowing the secured party the right to sell or repledge them by type of asset as of March 31, 2018 and September 30, 2018.
| Millions of yen | ||||||||
| March 31, 2018 | September 30, 2018 | |||||||
| Trading assets: |
||||||||
| Equities and convertible securities |
¥ | 156,429 | ¥ | 155,946 | ||||
| Government and government agency securities |
956,089 | 1,258,903 | ||||||
| Bank and corporate debt securities |
65,864 | 94,324 | ||||||
| Commercial mortgage-backed securities (“CMBS”) |
1 | 1 | ||||||
| Residential mortgage-backed securities (“RMBS”) |
2,618,336 | 3,527,573 | ||||||
| Collateralized debt obligations (“CDO”) and other(1) |
30,497 | 7,175 | ||||||
| Investment trust funds and other |
7,689 | 13,544 | ||||||
|
|
|
|
|
|||||
| ¥ | 3,834,905 | ¥ | 5,057,466 | |||||
|
|
|
|
|
|||||
| Non-trading debt securities |
¥ | 23,566 | ¥ | 1,032 | ||||
| Investments in and advances to affiliated companies |
¥ | 12,042 | ¥ | 12,506 | ||||
| (1) | Includes CLOs and ABS such as those secured on credit card loans, auto loans and student loans. |
The following table presents the carrying amount of financial and non-financial assets recognized in the consolidated balance sheets, other than those disclosed above, which are subject to lien as of March 31, 2018 and September 30, 2018.
| Millions of yen | ||||||||
| March 31, 2018 | September 30, 2018 | |||||||
| Loans and receivables |
¥ | 15,573 | ¥ | 28,442 | ||||
| Trading assets |
1,456,140 | 1,451,973 | ||||||
| Office buildings, land, equipment and facilities |
5,585 | 144 | ||||||
| Non-trading debt securities |
192,046 | 142,277 | ||||||
| Other |
112 | 69 | ||||||
|
|
|
|
|
|||||
| ¥ | 1,669,456 | ¥ | 1,622,905 | |||||
|
|
|
|
|
|||||
Assets in the above table were primarily pledged for secured borrowings, including other secured borrowings, collateralized borrowings of consolidated VIEs, trading balances of secured borrowings, and derivative transactions.
F-66
Table of Contents
Notes to the Interim Consolidated Financial Statements—(Continued) (UNAUDITED)
6. Non-trading securities:
As Nomura disposed of the interest in its insurance subsidiary, there are no unrealized gains and losses of non-trading securities recognized in other comprehensive income as of March 31 and September 30, 2018.
For the six months ended September 30, 2017, non-trading securities of ¥14,398 million were disposed of resulting in ¥393 million of realized gains and ¥365 million of realized losses. Total proceeds received from these disposals were ¥14,426 million.
For the three months ended September 30, 2017, non-trading securities of ¥8,683 million were disposed of resulting in ¥274 million of realized gains and ¥365 million of realized losses. Total proceeds received from these disposals were ¥8,592 million.
Related gains and losses were computed using the average method. For the six months ended September 30, 2017 and September 30, 2018, there were no transfers of non-trading securities to trading assets.
Where the fair value of non-trading securities held by the insurance subsidiary has declined below amortized cost, these are assessed to determine whether the decline in fair value is other-than-temporary in nature. Nomura considers quantitative and qualitative factors including the length of time and extent to which fair value has been less than amortized cost, the financial condition and near-term prospects of the issuer and Nomura’s intent and ability to hold the securities for a period of time sufficient to allow for any anticipated recovery in fair value. If an other-than-temporary impairment loss exists, for equity securities, the security is written down to fair value, with the entire difference between fair value and amortized cost recognized within Revenue—Other in the consolidated statements of income. For debt securities, an other-than-temporary impairment loss is also recognized within Revenue—Other in the consolidated statements of income if Nomura intends to sell the debt security or it is more likely than not that Nomura will be required to sell the debt security before recovery of amortized cost. If Nomura does not intend to sell the debt security and it is not more likely than not that Nomura will be required to sell the debt security, only the credit loss component of an other-than-temporary impairment loss is recognized through earnings and any non-credit loss component recognized within Other comprehensive income (loss).
For the six and three months ended September 30, 2017, other-than-temporary impairment losses recognized for the certain non-trading equity securities were ¥19 million and ¥19 million. The amount of credit loss component of other-than-temporary impairment losses recognized for the certain non-trading debt securities were ¥29 million and ¥nil. Other-than-temporary impairment losses related to the non-credit loss component recognized for the certain non-trading debt securities within Other comprehensive income (loss) were not significant. Other gross unrealized losses of non-trading securities were considered temporary.
F-67
Table of Contents
Notes to the Interim Consolidated Financial Statements—(Continued) (UNAUDITED)
7. Securitizations and Variable Interest Entities:
Securitizations
Nomura utilizes special purpose entities (“SPEs”) to securitize commercial and residential mortgage loans, government agency and corporate securities and other types of financial assets. Those SPEs are incorporated as stock companies, Tokumei kumiai (silent partnerships), Cayman special purpose companies (“SPCs”) or trust accounts. Nomura’s involvement with SPEs includes structuring SPEs, underwriting, distributing and selling debt instruments and beneficial interests issued by SPEs to investors. Nomura accounts for the transfer of financial assets in accordance with ASC 860. This statement requires that Nomura accounts for the transfer of financial assets as a sale when Nomura relinquishes control over the assets. ASC 860 deems control to be relinquished when the following conditions are met: (a) the assets have been isolated from the transferor (even in bankruptcy or other receivership), (b) the transferee has the right to pledge or exchange the assets received, or if the transferee is an entity whose sole purpose is to engage in securitization or asset-backed financing activities, the holders of its beneficial interests have the right to pledge or exchange the beneficial interests, and (c) the transferor has not maintained effective control over the transferred assets. Nomura may retain an interest in the financial assets, including residual interests in the SPEs. Any such interests are accounted for at fair value and reported within Trading assets in Nomura’s consolidated balance sheets, with the change in fair value reported within Revenue—Net gain on trading. Fair value for retained interests in securitized financial assets is determined by using observable prices; or in cases where observable prices are not available for certain retained interests, Nomura estimates fair value based on the present value of expected future cash flows using its best estimates of the key assumptions, including forecasted credit losses, prepayment rates, forward yield curves and discount rates commensurate with the risks involved. Nomura may also enter into derivative transactions in relation to the assets transferred to an SPE.
As noted above, Nomura may have continuing involvement with SPEs to which Nomura transferred assets. For the six and three months ended September 30, 2017, Nomura received cash proceeds from SPEs in new securitizations of ¥56 billion and ¥24 billion, respectively, and the associated gain (loss) on sale was not significant. For the six and three months ended September 30, 2018, Nomura received cash proceeds from SPEs in new securitizations of ¥121 billion and ¥69 billion, respectively, and the associated gain (loss) on sale was not significant. For the six and three months ended September 30, 2017, Nomura received debt securities issued by these SPEs with an initial fair value of ¥842 billion and ¥433 billion, respectively, and cash inflows from third parties on the sale of those debt securities of ¥503 billion and ¥235 billion, respectively. For the six and three months ended September 30, 2018, Nomura received debt securities issued by these SPEs with an initial fair value of ¥846 billion and ¥368 billion, respectively, and cash inflows from third parties on the sale of those debt securities of ¥674 billion and ¥257 billion, respectively. The cumulative balance of financial assets transferred to SPEs with which Nomura has continuing involvement was ¥4,918 billion and ¥5,081 billion as of March 31, 2018 and September 30, 2018, respectively. Nomura’s retained interests were ¥288 billion and ¥260 billion, as of March 31, 2018 and September 30, 2018, respectively. For the six and three months ended September 30, 2017, Nomura received cash flows of ¥34 billion and ¥19 billion, respectively, from the SPEs on the retained interests held in the SPEs. For the six and three months ended September 30, 2018, Nomura received cash flows of ¥10 billion and ¥5 billion, respectively, from the SPEs on the retained interests held in the SPEs.
Nomura did not provide financial support to SPEs beyond its contractual obligations as of March 31, 2018 and September 30, 2018.
F-68
Table of Contents
Notes to the Interim Consolidated Financial Statements—(Continued) (UNAUDITED)
The following tables present the fair value of retained interests which Nomura has continuing involvement in SPEs and their classification in the fair value hierarchy, categorized by the type of transferred assets.
| Billions of yen | ||||||||||||||||||||||||
| March 31, 2018 | ||||||||||||||||||||||||
| Level 1 | Level 2 | Level 3 | Total | Investment grade |
Other | |||||||||||||||||||
| Government, agency and municipal securities |
¥ | — | ¥ | 288 | ¥ | — | ¥ | 288 | ¥ | 288 | ¥ | 0 | ||||||||||||
| Bank and corporate debt securities |
— | — | — | — | — | — | ||||||||||||||||||
| CMBS and RMBS |
— | — | 0 | 0 | 0 | 0 | ||||||||||||||||||
|
|
|
|
|
|
|
|
|
|
|
|
|
|||||||||||||
| Total |
¥ | — | ¥ | 288 | ¥ | 0 | ¥ | 288 | ¥ | 288 | ¥ | 0 | ||||||||||||
|
|
|
|
|
|
|
|
|
|
|
|
|
|||||||||||||
| Billions of yen | ||||||||||||||||||||||||
| September 30, 2018 | ||||||||||||||||||||||||
| Level 1 | Level 2 | Level 3 | Total | Investment grade |
Other | |||||||||||||||||||
| Government, agency and municipal securities |
¥ | — | ¥ | 260 | ¥ | — | ¥ | 260 | ¥ | 260 | ¥ | 0 | ||||||||||||
| Bank and corporate debt securities |
— | — | — | — | — | — | ||||||||||||||||||
| CMBS and RMBS |
— | — | 0 | 0 | 0 | 0 | ||||||||||||||||||
|
|
|
|
|
|
|
|
|
|
|
|
|
|||||||||||||
| Total |
¥ | — | ¥ | 260 | ¥ | 0 | ¥ | 260 | ¥ | 260 | ¥ | 0 | ||||||||||||
|
|
|
|
|
|
|
|
|
|
|
|
|
|||||||||||||
As of September 30, 2018, predominantly all of the retained interests held by Nomura were valued using observable prices.
The following table presents the type and carrying value of financial assets included within Trading assets which have been transferred to SPEs but which do not meet the criteria for derecognition under ASC 860. These transfers are accounted for as secured financing transactions and generally reported within Long-term borrowings. The assets are pledged as collateral of the associated liabilities and cannot be removed unilaterally by Nomura and the liabilities are non-recourse to Nomura.
| Billions of yen | ||||||||
| March 31, 2018 | September 30, 2018 | |||||||
| Assets |
||||||||
| Trading assets |
||||||||
| Equities |
¥ | 1 | ¥ | — | ||||
| Debt securities |
20 | 5 | ||||||
| CMBS and RMBS |
— | — | ||||||
| Loans |
1 | 14 | ||||||
|
|
|
|
|
|||||
| Total |
¥ | 22 | ¥ | 19 | ||||
|
|
|
|
|
|||||
| Liabilities |
||||||||
| Long-term borrowings |
¥ | 21 | ¥ | 19 | ||||
|
|
|
|
|
|||||
F-69
Table of Contents
Notes to the Interim Consolidated Financial Statements—(Continued) (UNAUDITED)
Variable Interest Entities
In the normal course of business, Nomura acts as a transferor of financial assets to VIEs, and underwriter, distributor, and seller of repackaged financial instruments issued by VIEs in connection with its securitization and equity derivative activities. Nomura retains, purchases and sells variable interests in VIEs in connection with its market-making, investing and structuring activities.
If Nomura has an interest in a VIE that provides Nomura with control over the most significant activities of the VIE and the right to receive benefits or the obligation to absorb losses that could be significant to the VIE, Nomura is the primary beneficiary of the VIE and must consolidate the entity, provided that Nomura does not meet separate tests confirming that it is acting as a fiduciary for other interest holders. Nomura’s consolidated VIEs include those that were created to market structured securities to investors by repackaging corporate convertible securities, mortgages and mortgage-backed securities. Certain VIEs used in connection with Nomura’s aircraft leasing business as well as other purposes are consolidated. Nomura also consolidates certain investment funds, which are VIEs, and for which Nomura is the primary beneficiary.
The power to make the most significant decisions may take a number of different forms in different types of VIEs. For transactions such as securitizations, investment funds, and CDOs, Nomura considers collateral management and servicing to represent the power to make the most significant decisions. Accordingly, Nomura does not consolidate such types of VIEs for which it does not act as collateral manager or servicer unless Nomura has the right to replace the collateral manager or servicer or to require liquidation of the entity.
For many transactions, such as where VIEs are used for re-securitizations of residential mortgage-backed securities, there are no significant economic decisions made on an ongoing basis and no single investor has the unilateral ability to liquidate the VIE. In these cases, Nomura focuses its analysis on decisions made prior to the initial closing of the transaction, and considers factors such as the nature of the underlying assets held by the VIE, the involvement of third party investors in the design of the VIE, the size of initial third party investment and the amount and level of any subordination of beneficial interests issued by the VIE which will be held by Nomura and third party investors. Nomura has sponsored numerous re-securitization transactions and in many cases has determined that it is not the primary beneficiary on the basis that control over the most significant decisions relating to these entities are shared with third party investors. In some cases, however, Nomura has consolidated such VIEs, for example, where it was determined that third party investors were not involved in the design of the VIEs, including where the size of third party investment was not significant at inception of the transaction.
F-70
Table of Contents
Notes to the Interim Consolidated Financial Statements—(Continued) (UNAUDITED)
The following table presents the classification of consolidated VIEs’ assets and liabilities in these consolidated financial statements. Most of these assets and liabilities are related to consolidated SPEs which securitize corporate convertible securities, mortgages and mortgage-backed securities. The assets of a consolidated VIE may only be used to settle obligations of that VIE. Creditors do not typically have any recourse to Nomura beyond the assets held in the VIEs.
| Billions of yen | ||||||||
| March 31, 2018 | September 30, 2018 | |||||||
| Consolidated VIE assets |
||||||||
| Cash and cash equivalents |
¥ | 23 | ¥ | 18 | ||||
| Trading assets |
||||||||
| Equities |
712 | 698 | ||||||
| Debt securities |
436 | 449 | ||||||
| CMBS and RMBS |
4 | 84 | ||||||
| Investment trust funds and other |
12 | 9 | ||||||
| Derivatives |
20 | 18 | ||||||
| Private equity investments |
2 | 1 | ||||||
| Office buildings, land, equipment and facilities |
25 | 15 | ||||||
| Other |
66 | 62 | ||||||
|
|
|
|
|
|||||
| Total |
¥ | 1,300 | ¥ | 1,354 | ||||
|
|
|
|
|
|||||
| Consolidated VIE liabilities |
||||||||
| Trading liabilities |
||||||||
| Derivatives |
¥ | 22 | ¥ | 21 | ||||
| Borrowings |
||||||||
| Short-term borrowings |
124 | 149 | ||||||
| Long-term borrowings |
829 | 804 | ||||||
| Other |
2 | 2 | ||||||
|
|
|
|
|
|||||
| Total |
¥ | 977 | ¥ | 976 | ||||
|
|
|
|
|
|||||
Nomura continuously reassesses its initial evaluation of whether it is the primary beneficiary of a VIE based on current facts and circumstances as long as it has any continuing involvement with the VIE. This determination is based upon an analysis of the design of the VIE, including the VIE’s structure and activities, the power to make significant economic decisions held by Nomura and by other parties, and the variable interests owned by Nomura and other parties.
Nomura also holds variable interests in VIEs where Nomura is not the primary beneficiary. Nomura’s variable interests in such VIEs include senior and subordinated debt, residual interests, and equity interests associated with commercial and residential mortgage-backed and other asset-backed securitizations and structured financings, equity interests in VIEs which were formed primarily to acquire high yield leveraged loans and other lower investment grade debt obligations, residual interests in operating leases for aircraft held by VIEs, and loans and investments in VIEs that acquire operating businesses.
F-71
Table of Contents
Notes to the Interim Consolidated Financial Statements—(Continued) (UNAUDITED)
The following tables present the carrying amount of variable interests of unconsolidated VIEs and maximum exposure to loss associated with these variable interests. Maximum exposure to loss does not reflect Nomura’s estimate of the actual losses that could result from adverse changes, nor does it reflect the economic hedges Nomura enters into to reduce its exposure. The risks associated with VIEs in which Nomura is involved are limited to the amount recorded in the consolidated balance sheets, the amount of commitments and financial guarantees and the notional amount of the derivative instruments. Nomura believes the notional amount of derivative instruments generally exceeds the amount of actual risk.
| Billions of yen | ||||||||||||
| March 31, 2018 | ||||||||||||
| Carrying amount of variable interests |
Maximum exposure to loss to unconsolidated VIEs |
|||||||||||
| Assets | Liabilities | |||||||||||
| Trading assets and liabilities |
||||||||||||
| Equities |
¥ | 35 | ¥ | — | ¥ | 35 | ||||||
| Debt securities |
110 | — | 110 | |||||||||
| CMBS and RMBS |
2,775 | — | 2,775 | |||||||||
| Investment trust funds and other |
174 | — | 174 | |||||||||
| Derivatives |
— | — | — | |||||||||
| Private equity investments |
13 | — | 13 | |||||||||
| Loans |
455 | — | 455 | |||||||||
| Other |
17 | — | 17 | |||||||||
| Commitments to extend credit and other guarantees |
— | — | 71 | |||||||||
|
|
|
|
|
|
|
|||||||
| Total |
¥ | 3,579 | ¥ | — | ¥ | 3,650 | ||||||
|
|
|
|
|
|
|
|||||||
| Billions of yen | ||||||||||||
| September 30, 2018 | ||||||||||||
| Carrying amount of variable interests |
Maximum exposure to loss to unconsolidated VIEs |
|||||||||||
| Assets | Liabilities | |||||||||||
| Trading assets and liabilities |
||||||||||||
| Equities |
¥ | 26 | ¥ | — | ¥ | 26 | ||||||
| Debt securities |
111 | — | 111 | |||||||||
| CMBS and RMBS |
3,617 | — | 3,617 | |||||||||
| Investment trust funds and other |
179 | — | 179 | |||||||||
| Derivatives |
— | — | — | |||||||||
| Private equity investments |
13 | — | 13 | |||||||||
| Loans |
513 | — | 513 | |||||||||
| Other |
13 | — | 13 | |||||||||
| Commitments to extend credit and other guarantees |
— | — | 109 | |||||||||
|
|
|
|
|
|
|
|||||||
| Total |
¥ | 4,472 | ¥ | — | ¥ | 4,581 | ||||||
|
|
|
|
|
|
|
|||||||
F-72
Table of Contents
Notes to the Interim Consolidated Financial Statements—(Continued) (UNAUDITED)
8. Financing receivables:
In the normal course of business, Nomura extends financing to clients primarily in the form of loans and collateralized agreements such as reverse repurchase agreements and securities borrowing transactions. These financing receivables are recognized as assets on Nomura’s consolidated balance sheets and provide a contractual right to receive money either on demand or on future fixed or determinable dates.
Collateralized agreements
Collateralized agreements consist of reverse repurchase agreements reported as Securities purchased under agreements to resell and securities borrowing transactions reported as Securities borrowed in the consolidated balance sheets, including those executed under Gensaki Repo agreements. Reverse repurchase agreements and securities borrowing transactions principally involve the buying of government and government agency securities from customers under agreements that also require Nomura to resell these securities to those customers, or borrowing these securities with cash collateral. Nomura monitors the value of the underlying securities on a daily basis to the related receivables, including accrued interest, and requests or returns additional collateral when appropriate. Reverse repurchase agreements are generally recognized in the consolidated balance sheets at the amount for which the securities were originally acquired with applicable accrued interest. Securities borrowing transactions are generally recognized in the consolidated balance sheets at the amount of cash collateral advanced. No allowance for credit losses is generally recognized against these transactions due to the strict collateralization requirements.
Loans receivable
The key types of loans receivable recognized by Nomura are loans at banks, short-term secured margin loans, inter-bank money market loans and corporate loans.
Loans at banks include both retail and commercial secured and unsecured loans extended by licensed banking entities within Nomura such as The Nomura Trust & Banking Co., Ltd. and Nomura Bank International plc. For both retail and commercial loans secured by real estate or securities, Nomura is exposed to the risk of a decline in the value of the underlying collateral. Loans at banks also include unsecured commercial loans provided to investment banking clients for relationship purposes. Nomura is exposed to risk of default of the counterparty, although these counterparties usually have high credit ratings. Where loans are secured by guarantees, Nomura is also exposed to the risk of default by the guarantor.
Short-term secured margin loans are loans provided to clients in connection with securities brokerage business. These loans provide funding for clients in order to purchase securities. Nomura requests initial margin in the form of acceptable collateral securities or deposits against these loans and holds the purchased securities as collateral through the life of the loans. If the value of the securities declines by more than specified amounts, Nomura can make additional margin calls in order to maintain a specified ratio of loan-to-value (“LTV”) ratio. For these reasons, the risk to Nomura of providing these loans is limited.
Inter-bank money market loans are loans to financial institutions in the inter-bank money market, where overnight and intra-day financings are traded through money market dealers. The risk to Nomura of making these loans is not significant as only qualified financial institutions can participate in these markets and these loans are usually overnight or short-term in nature.
Corporate loans are primarily commercial loans provided to corporate clients extended by non-licensed banking entities within Nomura. Corporate loans include loans secured by real estate or securities, as well as unsecured commercial loans provided to investment banking clients for relationship purposes. The risk to Nomura of making these loans is similar to those risks arising from commercial loans reported in loans at banks.
In addition to the loans above, Nomura has advances to affiliated companies which are loans provided to related parties of Nomura. As these loans are generally not secured, Nomura is exposed to the risk of default of the counterparty.
F-73
Table of Contents
Notes to the Interim Consolidated Financial Statements—(Continued) (UNAUDITED)
The following tables present a summary of loans receivable reported within Loans receivable or Investments in and advances to affiliated companies in the consolidated balance sheets by portfolio segment.
| Millions of yen | ||||||||||||
| March 31, 2018 | ||||||||||||
| Carried at amortized cost |
Carried at fair value(1) |
Total | ||||||||||
| Loans receivable |
||||||||||||
| Loans at banks |
¥ | 491,559 | ¥ | — | ¥ | 491,559 | ||||||
| Short-term secured margin loans |
429,075 | — | 429,075 | |||||||||
| Inter-bank money market loans |
1,385 | — | 1,385 | |||||||||
| Corporate loans |
986,347 | 554,137 | 1,540,484 | |||||||||
|
|
|
|
|
|
|
|||||||
| Total loans receivable |
¥ | 1,908,366 | ¥ | 554,137 | ¥ | 2,462,503 | ||||||
|
|
|
|
|
|
|
|||||||
| Advances to affiliated companies |
— | — | — | |||||||||
|
|
|
|
|
|
|
|||||||
| Total |
¥ | 1,908,366 | ¥ | 554,137 | ¥ | 2,462,503 | ||||||
|
|
|
|
|
|
|
|||||||
| Millions of yen | ||||||||||||
| September 30, 2018 | ||||||||||||
| Carried at amortized cost |
Carried at fair value(1) |
Total | ||||||||||
| Loans receivable |
||||||||||||
| Loans at banks |
¥ | 505,844 | ¥ | — | ¥ | 505,844 | ||||||
| Short-term secured margin loans |
335,607 | 5,210 | 340,817 | |||||||||
| Inter-bank money market loans |
2,048 | — | 2,048 | |||||||||
| Corporate loans |
862,736 | 596,654 | 1,459,390 | |||||||||
|
|
|
|
|
|
|
|||||||
| Total loans receivable |
¥ | 1,706,235 | ¥ | 601,864 | ¥ | 2,308,099 | ||||||
|
|
|
|
|
|
|
|||||||
| Advances to affiliated companies |
— | — | — | |||||||||
|
|
|
|
|
|
|
|||||||
| Total |
¥ | 1,706,235 | ¥ | 601,864 | ¥ | 2,308,099 | ||||||
|
|
|
|
|
|
|
|||||||
| (1) | Includes loans receivable and loan commitments carried at fair value through election of the fair value option. |
There were no significant purchases nor sales of loans receivable during the six and the three months ended September 30, 2017. During the same period, there were no significant reclassifications of loans receivable to trading assets.
There were no significant purchases nor sales of loans receivable during the six and the three months ended September 30, 2018. During the same period, there were no significant reclassifications of loans receivable to trading assets.
Allowance for credit losses
Management establishes an allowance for credit losses against loans carried at amortized cost which reflects management’s best estimate of probable losses incurred. The allowance for credit losses against loans, which is reported in the consolidated balance sheets within Allowance for doubtful accounts, comprises two components:
| • | A specific component for loans which have been individually evaluated for impairment; and |
| • | A general component for loans which, while not individually evaluated for impairment, have been collectively evaluated for impairment based on historical loss experience. |
The specific component of the allowance reflects probable losses incurred within loans which have been individually evaluated for impairment. A loan is defined as being impaired when, based on current information and events, it is probable that all amounts due according to the contractual terms of the loan agreement will not be collected. Factors considered by management in determining impairment include an assessment of the ability of borrowers to pay by considering various factors such as the nature of the loan, prior credit loss experience, current economic conditions, the current financial situation of the borrower and the fair value of any underlying collateral. Loans that experience insignificant payment delays or insignificant payment shortfalls are not classified as impaired. Impairment is measured on a loan by loan basis by adjusting the carrying value of the loan to either the present value of expected future cash flows discounted at the loan’s effective interest rate, the loan’s observable market price, or the fair value of the collateral if the loan is collateral dependent.
F-74
Table of Contents
Notes to the Interim Consolidated Financial Statements—(Continued) (UNAUDITED)
The general component of the allowance is for loans not individually evaluated for impairment and includes judgment about collectability based on available information at the balance sheet date and the uncertainties inherent in those underlying assumptions. The allowance is based on historical loss experience adjusted for qualitative factors such as current economic conditions.
While management has based its estimate of the allowance for credit losses against loans on the best information available, future adjustments to the allowance may be necessary as a result of changes in the economic environment or variances between actual results and original assumptions.
Loans are charged-off when Nomura determines that the loans are uncollectible. This determination is based on factors such as the occurrence of significant changes in the borrower’s financial position such that the borrower can no longer pay the obligation or that the proceeds from collateral will not be sufficient to pay the loans.
The following tables present changes in the total allowance for credit losses for the six and three months ended September 30, 2017 and 2018.
| Millions of yen | ||||||||||||||||||||||||||||||||
| Six months ended September 30, 2017 | ||||||||||||||||||||||||||||||||
| Allowance for credit losses against loans | Allowance for credit losses against receivables other than loans |
Total allowance for doubtful accounts |
||||||||||||||||||||||||||||||
| Loans at banks |
Short-term secured margin loans |
Inter-bank money market loans |
Corporate loans |
Advances to affiliated companies |
Subtotal | |||||||||||||||||||||||||||
| Opening balance |
¥ | 968 | ¥ | — | ¥ | — | ¥ | 473 | ¥ | 0 | ¥ | 1,441 | ¥ | 2,110 | ¥ | 3,551 | ||||||||||||||||
| Provision for credit losses |
101 | — | — | (26 | ) | — | 75 | 292 | 367 | |||||||||||||||||||||||
| Charge-offs |
— | — | — | — | 0 | 0 | — | 0 | ||||||||||||||||||||||||
| Other(1) |
— | — | — | 3 | — | 3 | (135 | ) | (132 | ) | ||||||||||||||||||||||
|
|
|
|
|
|
|
|
|
|
|
|
|
|
|
|
|
|||||||||||||||||
| Ending balance |
¥ | 1,069 | ¥ | — | ¥ | — | ¥ | 450 | ¥ | — | ¥ | 1,519 | ¥ | 2,267 | ¥ | 3,786 | ||||||||||||||||
|
|
|
|
|
|
|
|
|
|
|
|
|
|
|
|
|
|||||||||||||||||
| Millions of yen | ||||||||||||||||||||||||||||||||
| Six months ended September 30, 2018 | ||||||||||||||||||||||||||||||||
| Allowance for credit losses against loans | Allowance for credit losses against receivables other than loans |
Total allowance for doubtful accounts |
||||||||||||||||||||||||||||||
| Loans at banks |
Short-term secured margin loans |
Inter-bank money market loans |
Corporate loans |
Advances to affiliated companies |
Subtotal | |||||||||||||||||||||||||||
| Opening balance |
¥ | 1,140 | ¥ | — | ¥ | — | ¥ | 417 | ¥ | — | ¥ | 1,557 | ¥ | 1,957 | ¥ | 3,514 | ||||||||||||||||
| Provision for credit losses |
1 | 360 | — | — | — | 361 | 23 | 384 | ||||||||||||||||||||||||
| Charge-offs |
(94 | ) | — | — | 0 | — | (94 | ) | 118 | 24 | ||||||||||||||||||||||
| Other(1) |
0 | 12 | — | 28 | — | 40 | 2 | 42 | ||||||||||||||||||||||||
|
|
|
|
|
|
|
|
|
|
|
|
|
|
|
|
|
|||||||||||||||||
| Ending balance |
¥ | 1,047 | ¥ | 372 | ¥ | — | ¥ | 445 | ¥ | — | ¥ | 1,864 | ¥ | 2,100 | ¥ | 3,964 | ||||||||||||||||
|
|
|
|
|
|
|
|
|
|
|
|
|
|
|
|
|
|||||||||||||||||
| Millions of yen | ||||||||||||||||||||||||||||||||
| Three months ended September 30, 2017 | ||||||||||||||||||||||||||||||||
| Allowance for credit losses against loans | Allowance for credit losses against receivables other than loans |
Total allowance for doubtful accounts |
||||||||||||||||||||||||||||||
| Loans at banks |
Short-term secured margin loans |
Inter-bank money market loans |
Corporate loans |
Advances to affiliated companies |
Subtotal | |||||||||||||||||||||||||||
| Opening balance |
¥ | 969 | ¥ | — | ¥ | — | ¥ | 447 | ¥ | 0 | ¥ | 1,416 | ¥ | 2,190 | ¥ | 3,606 | ||||||||||||||||
| Provision for credit losses |
100 | — | — | 1 | — | 101 | 200 | 301 | ||||||||||||||||||||||||
| Charge-offs |
— | — | — | — | 0 | 0 | — | 0 | ||||||||||||||||||||||||
| Other(1) |
— | — | — | 2 | — | 2 | (123 | ) | (121 | ) | ||||||||||||||||||||||
|
|
|
|
|
|
|
|
|
|
|
|
|
|
|
|
|
|||||||||||||||||
| Ending balance |
¥ | 1,069 | ¥ | — | ¥ | — | ¥ | 450 | ¥ | — | ¥ | 1,519 | ¥ | 2,267 | ¥ | 3,786 | ||||||||||||||||
|
|
|
|
|
|
|
|
|
|
|
|
|
|
|
|
|
|||||||||||||||||
F-75
Table of Contents
Notes to the Interim Consolidated Financial Statements—(Continued) (UNAUDITED)
| Millions of yen | ||||||||||||||||||||||||||||||||
| Three months ended September 30, 2018 | ||||||||||||||||||||||||||||||||
| Allowance for credit losses against loans | Allowance for credit losses against receivables other than loans |
Total allowance for doubtful accounts |
||||||||||||||||||||||||||||||
| Loans at banks |
Short-term secured margin loans |
Inter-bank money market loans |
Corporate loans |
Advances to affiliated companies |
Subtotal | |||||||||||||||||||||||||||
| Opening balance |
¥ | 1,141 | ¥ | 218 | ¥ | — | ¥ | 434 | ¥ | — | ¥ | 1,793 | ¥ | 1,926 | ¥ | 3,719 | ||||||||||||||||
| Provision for credit losses |
— | 138 | — | 0 | — | 138 | 12 | 150 | ||||||||||||||||||||||||
| Charge-offs |
(94 | ) | — | — | 0 | — | (94 | ) | 159 | 65 | ||||||||||||||||||||||
| Other(1) |
0 | 16 | — | 11 | — | 27 | 3 | 30 | ||||||||||||||||||||||||
|
|
|
|
|
|
|
|
|
|
|
|
|
|
|
|
|
|||||||||||||||||
| Ending balance |
¥ | 1,047 | ¥ | 372 | ¥ | — | ¥ | 445 | ¥ | — | ¥ | 1,864 | ¥ | 2,100 | ¥ | 3,964 | ||||||||||||||||
|
|
|
|
|
|
|
|
|
|
|
|
|
|
|
|
|
|||||||||||||||||
| (1) | Includes the effect of foreign exchange movements. |
The following tables present the allowance for credit losses against loans and loans by impairment methodology and type of loans as of March 31, 2018 and September 30, 2018.
| Millions of yen | ||||||||||||||||||||
| March 31, 2018 | ||||||||||||||||||||
| Loans at banks |
Short-term secured margin loans |
Inter-bank money market loans |
Corporate loans |
Total | ||||||||||||||||
| Allowance by impairment methodology |
||||||||||||||||||||
| Evaluated individually |
¥ | — | ¥ | — | ¥ | — | ¥ | 417 | ¥ | 417 | ||||||||||
| Evaluated collectively |
1,140 | — | — | 0 | 1,140 | |||||||||||||||
|
|
|
|
|
|
|
|
|
|
|
|||||||||||
| Total allowance for credit losses |
¥ | 1,140 | ¥ | — | ¥ | — | ¥ | 417 | ¥ | 1,557 | ||||||||||
|
|
|
|
|
|
|
|
|
|
|
|||||||||||
| Loans by impairment methodology |
||||||||||||||||||||
| Evaluated individually |
¥ | 2,800 | ¥ | 162,017 | ¥ | 1,385 | ¥ | 978,501 | ¥ | 1,144,703 | ||||||||||
| Evaluated collectively |
488,759 | 267,058 | — | 7,846 | 763,663 | |||||||||||||||
|
|
|
|
|
|
|
|
|
|
|
|||||||||||
| Total loans |
¥ | 491,559 | ¥ | 429,075 | ¥ | 1,385 | ¥ | 986,347 | ¥ | 1,908,366 | ||||||||||
|
|
|
|
|
|
|
|
|
|
|
|||||||||||
| Millions of yen | ||||||||||||||||||||
| September 30, 2018 | ||||||||||||||||||||
| Loans at banks |
Short-term secured margin loans |
Inter-bank money market loans |
Corporate loans |
Total | ||||||||||||||||
| Allowance by impairment methodology |
||||||||||||||||||||
| Evaluated individually |
¥ | — | ¥ | 372 | ¥ | — | ¥ | 445 | ¥ | 817 | ||||||||||
| Evaluated collectively |
1,047 | — | — | — | 1,047 | |||||||||||||||
|
|
|
|
|
|
|
|
|
|
|
|||||||||||
| Total allowance for credit losses |
¥ | 1,047 | ¥ | 372 | ¥ | — | ¥ | 445 | ¥ | 1,864 | ||||||||||
|
|
|
|
|
|
|
|
|
|
|
|||||||||||
| Loans by impairment methodology |
||||||||||||||||||||
| Evaluated individually |
¥ | 4,311 | ¥ | 154,707 | ¥ | 2,048 | ¥ | 854,291 | ¥ | 1,015,357 | ||||||||||
| Evaluated collectively |
501,533 | 180,900 | — | 8,445 | 690,878 | |||||||||||||||
|
|
|
|
|
|
|
|
|
|
|
|||||||||||
| Total loans |
¥ | 505,844 | ¥ | 335,607 | ¥ | 2,048 | ¥ | 862,736 | ¥ | 1,706,235 | ||||||||||
|
|
|
|
|
|
|
|
|
|
|
|||||||||||
Nonaccrual and past due loans
Loans which are individually evaluated as impaired are assessed for nonaccrual status in accordance with Nomura’s policy. When it is determined to suspend interest accrual as a result of an assessment, any accrued but unpaid interest is reversed. Loans are generally only returned to an accrual status if the loan is brought contractually current, i.e. all overdue principal and interest amounts are paid. In limited circumstances, a loan which has not been brought contractually current will also be returned to an accrual status if all principal and interest amounts contractually due are reasonably assured of repayment within a reasonable period of time or there has been a sustained period of repayment performance by the borrower.
F-76
Table of Contents
Notes to the Interim Consolidated Financial Statements—(Continued) (UNAUDITED)
As of March 31, 2018, the amount of loans which were on a nonaccrual status was not significant. The amount of loans which were 90 days past due was not significant.
As of September 30, 2018, the amount of loans which were on a nonaccrual status was not significant. The amount of loans which were 90 days past due was not significant.
Once a loan is impaired and placed on a nonaccrual status, interest income is subsequently recognized using the cash basis method.
Loan impairment and troubled debt restructurings
In the ordinary course of business, Nomura may choose to recognize impairment and also restructure a loan classified as held for investment either because of financial difficulties of the borrower, or simply as a result of market conditions or relationship reasons. A troubled debt restructuring (“TDR”) occurs when Nomura (as lender) for economic or legal reasons related to the borrower’s financial difficulties grants a concession to the borrower that Nomura would not otherwise consider.
Any loan being restructured under a TDR will generally already be identified as impaired with an applicable allowance for credit losses recognized. If not (for example if the loan is collectively assessed for impairment with other loans), the restructuring of the loan under a TDR will immediately result in the loan as being classified as impaired. An impairment loss for a loan restructuring under a TDR which only involves modification of the loan’s terms (rather than receipt of assets in full or partial settlement) is calculated in the same way as any other impaired loan. Assets received in full or partial satisfaction of a loan in a TDR are recognized at fair value.
As of March 31, 2018, the amount of loans which were classified as impaired but against which no allowance for credit losses had been recognized was not significant. For impaired loans with a related allowance, the amount of recorded investment, the total unpaid principal balance and the related allowance was not significant.
As of September 30, 2018, the amount of loans which were classified as impaired but against which no allowance for credit losses had been recognized was not significant. For impaired loans with a related allowance, the amount of recorded investment, the total unpaid principal balance and the related allowance was not significant.
The amounts of TDRs which occurred during the six and three months ended September 30, 2017 and 2018 were not significant.
Credit quality indicators
Nomura is exposed to credit risks deriving from a decline in the value of loans or a default caused by deterioration of creditworthiness or bankruptcy of the obligor. Nomura’s risk management framework for such credit risks is based on a risk assessment through an internal rating process, in depth pre-financing credit analysis of each individual loan and continuous post-financing monitoring of obligor’s creditworthiness.
The following tables present an analysis of each class of loans not carried at fair value using Nomura’s internal ratings or equivalent credit quality indicators applied by subsidiaries as of March 31, 2018 and September 30, 2018.
| Millions of yen | ||||||||||||||||||||
| March 31, 2018 | ||||||||||||||||||||
| AAA-BBB | BB-CCC | CC-D | Others(1) | Total | ||||||||||||||||
| Secured loans at banks |
¥ | 152,137 | ¥ | 106,385 | ¥ | — | ¥ | 46,948 | ¥ | 305,470 | ||||||||||
| Unsecured loans at banks |
186,089 | — | — | — | 186,089 | |||||||||||||||
| Short-term secured margin loans |
— | — | — | 429,075 | 429,075 | |||||||||||||||
| Unsecured inter-bank money market loans |
1,385 | — | — | — | 1,385 | |||||||||||||||
| Secured corporate loans |
273,894 | 701,761 | — | 3,555 | 979,210 | |||||||||||||||
| Unsecured corporate loans |
— | — | — | 7,137 | 7,137 | |||||||||||||||
|
|
|
|
|
|
|
|
|
|
|
|||||||||||
| Total |
¥ | 613,505 | ¥ | 808,146 | ¥ | — | ¥ | 486,715 | ¥ | 1,908,366 | ||||||||||
|
|
|
|
|
|
|
|
|
|
|
|||||||||||
F-77
Table of Contents
Notes to the Interim Consolidated Financial Statements—(Continued) (UNAUDITED)
| Millions of yen | ||||||||||||||||||||
| September 30, 2018 | ||||||||||||||||||||
| AAA-BBB | BB-CCC | CC-D | Others(1) | Total | ||||||||||||||||
| Secured loans at banks |
¥ | 155,293 | ¥ | 116,569 | ¥ | — | ¥ | 49,043 | ¥ | 320,905 | ||||||||||
| Unsecured loans at banks |
182,067 | — | — | 2,872 | 184,939 | |||||||||||||||
| Short-term secured margin loans |
— | — | — | 335,607 | 335,607 | |||||||||||||||
| Unsecured inter-bank money market loans |
2,048 | — | — | — | 2,048 | |||||||||||||||
| Secured corporate loans |
330,969 | 521,554 | — | 3,961 | 856,484 | |||||||||||||||
| Unsecured corporate loans |
— | 659 | — | 5,593 | 6,252 | |||||||||||||||
|
|
|
|
|
|
|
|
|
|
|
|||||||||||
| Total |
¥ | 670,377 | ¥ | 638,782 | ¥ | — | ¥ | 397,076 | ¥ | 1,706,235 | ||||||||||
|
|
|
|
|
|
|
|
|
|
|
|||||||||||
| (1) | Relate to collateralized exposures where a specified ratio of LTV is maintained. |
The following table presents a definition of each of the internal ratings used in the Nomura Group.
| Rating Range |
Definition | |
| AAA |
Highest credit quality. An obligor or facility has extremely strong capacity to meet its financial commitments. ‘AAA range.’ is the highest credit rating assigned by Nomura. Extremely low probability of default. | |
| AA |
Very high credit quality category. An obligor or facility has very strong capacity to meet its financial commitments. Very low probability of default but above that of ‘AAA range.’ | |
| A |
High credit quality category. An obligor or facility has strong capacity to meet its financial commitments but is somewhat more susceptible to the adverse effects of changes in circumstances and economic conditions than those in higher-rated categories. Low probability of default but higher than that of ‘AA range.’ | |
| BBB |
Good credit quality category. An obligor or facility has adequate capacity to meet its financial commitments. However, adverse economic conditions or changing circumstances are more likely to lead to a weakened capacity to meet its financial commitments. Medium probability of default but higher than that of ‘A range.’ | |
| BB |
Speculative credit quality category. An obligor or facility is less vulnerable in the near term than other lower-ratings. However, it faces major ongoing uncertainties and exposure to adverse business, financial, or economic conditions which could lead to the inadequate capacity to meet its financial commitments. Medium to high probability of default but higher than that of ‘BBB range.’ | |
| B |
Highly speculative credit quality category. An obligor or facility is more vulnerable than those rated ‘BB range’, but the obligor currently has the capacity to meet its financial commitments. Adverse business, financial, or economic conditions will likely impair the issuer’s or obligor’s capacity or willingness to meet its financial commitments. High probability of default—more than that of ‘BB range.’ | |
| CCC |
Substantial credit risk. An obligor or facility is currently vulnerable, and is dependent upon favorable business, financial, and economic conditions to meet its financial commitments. Strong probability of default – more than that of ‘B range.’ | |
| CC |
An obligor or facility is currently highly vulnerable to nonpayment (default category). | |
| C |
An obligor or facility is currently extremely vulnerable to nonpayment (default category). | |
| D |
Failure of an obligor to make payments in full and on time of any financial obligations, markedly disadvantageous modification to a contractual term compared with the existing obligation, bankruptcy filings, administration, receivership, liquidation or other winding-up or cessation of business of an obligor or other similar situations. | |
Nomura reviews internal ratings at least once a year by using available credit information of obligors including financial statements and other information. Internal ratings are also reviewed more frequently for high-risk obligors or problematic exposures and any significant credit event of obligors will trigger an immediate credit review process.
F-78
Table of Contents
Notes to the Interim Consolidated Financial Statements—(Continued) (UNAUDITED)
9. Leases:
Nomura as lessor
Nomura leases office buildings and aircraft in Japan and overseas. These leases are classified as operating leases and the related assets are stated at cost, net of accumulated depreciation, except for land, which is stated at cost in the consolidated balance sheets and reported within Other assets—Office buildings, land, equipment and facilities.
The following table presents the types of assets which Nomura leases under operating leases as of March 31, 2018 and September 30, 2018.
| Millions of yen | ||||||||||||||||||||||||
| March 31, 2018 | September 30, 2018 | |||||||||||||||||||||||
| Cost | Accumulated depreciation |
Net carrying amount |
Cost | Accumulated depreciation |
Net carrying amount |
|||||||||||||||||||
| Real estate(1) |
¥ | 3,053 | ¥ | (1,657 | ) | ¥ | 1,396 | ¥ | 3,034 | ¥ | (1,694 | ) | ¥ | 1,340 | ||||||||||
| Aircraft |
24,989 | (54 | ) | 24,935 | 14,654 | (141 | ) | 14,513 | ||||||||||||||||
|
|
|
|
|
|
|
|
|
|
|
|
|
|||||||||||||
| Total |
¥ | 28,042 | ¥ | (1,711 | ) | ¥ | 26,331 | ¥ | 17,688 | ¥ | (1,835 | ) | ¥ | 15,853 | ||||||||||
|
|
|
|
|
|
|
|
|
|
|
|
|
|||||||||||||
| (1) | Cost, accumulated depreciation and net carrying amounts include amounts relating to real estate utilized by Nomura. |
Nomura recognized rental income of ¥957 million and ¥592 million for the six and three months ended September 30, 2017, respectively, and ¥1,285 million and ¥566 million for the six and three months ended September 30, 2018, respectively. These are included in the consolidated statements of income within Revenue—Other.
The future minimum lease payments to be received on non-cancellable operating leases as of September 30, 2018 were ¥15,055 million and these future minimum lease payments to be received are scheduled as below:
| Millions of yen | ||||||||||||||||||||||||||||
| Years of receipt | ||||||||||||||||||||||||||||
| Total | Less than 1 year |
1 to 2 years |
2 to 3 years |
3 to 4 years |
4 to 5 years |
More than 5 years |
||||||||||||||||||||||
| Minimum lease payments to be received |
¥ | 15,055 | ¥ | 1,412 | ¥ | 1,412 | ¥ | 1,412 | ¥ | 1,407 | ¥ | 1,347 | ¥ | 8,065 | ||||||||||||||
Nomura as lessee
Nomura leases its office space, certain employees’ residential facilities and other facilities in Japan and overseas primarily under cancellable operating lease agreements which are customarily renewed upon expiration. Nomura also leases certain equipment and facilities in Japan and overseas under non-cancellable operating lease agreements. Rental expenses, net of sublease rental income, for the six and three months ended September 30, 2017 were ¥22,550 million and ¥11,050 million, respectively, and for the six and three months ended September 30, 2018 were ¥22,387 million and ¥11,332 million, respectively.
The following table presents future minimum lease payments under non-cancellable operating leases with remaining terms exceeding one year as of September 30, 2018:
| Millions of yen | ||||
| September 30, 2018 | ||||
| Total minimum lease payments |
¥ | 118,902 | ||
| Less: Sublease rental income |
(11,466 | ) | ||
|
|
|
|||
| Net minimum lease payments |
¥ | 107,436 | ||
|
|
|
|||
The future minimum lease payments above are scheduled as below as of September 30, 2018:
| Millions of yen | ||||||||||||||||||||||||||||
| Years of payment | ||||||||||||||||||||||||||||
| Total | Less than 1 year |
1 to 2 years |
2 to 3 years |
3 to 4 years |
4 to 5 years |
More than 5 years |
||||||||||||||||||||||
| Minimum lease payments |
¥ | 118,902 | ¥ | 16,245 | ¥ | 15,312 | ¥ | 11,569 | ¥ | 8,735 | ¥ | 8,071 | ¥ | 58,970 | ||||||||||||||
F-79
Table of Contents
Notes to the Interim Consolidated Financial Statements—(Continued) (UNAUDITED)
Nomura leases certain equipment and facilities in Japan and overseas under capital lease agreements. If the lease is classified as a capital lease, Nomura recognizes it at the lower of the fair value or present value of minimum lease payments, which is reported within Other Assets—Office buildings, land, equipment and facilities in the consolidated balance sheets. The amount of capital lease assets as of March 31, 2018 and September 30, 2018 were ¥28,653 million and ¥27,247 million, respectively and accumulated depreciations on such capital lease assets as of March 31, 2018 and September 30, 2018 were ¥8,791 million and ¥7,971 million, respectively.
The following table presents future minimum lease payments under capital leases as of September 30, 2018:
| Millions of yen | ||||
| September 30, 2018 | ||||
| Total minimum lease payments |
¥ | 44,409 | ||
| Less: Amount representing interest |
(26,798 | ) | ||
|
|
|
|||
| Present value of net minimum lease payments |
¥ | 17,611 | ||
|
|
|
|||
The future minimum lease payments above are scheduled as below as of September 30, 2018:
| Millions of yen | ||||||||||||||||||||||||||||
| Years of payment | ||||||||||||||||||||||||||||
| Total | Less than 1 year |
1 to 2 years |
2 to 3 years |
3 to 4 years |
4 to 5 years |
More than 5 years |
||||||||||||||||||||||
| Minimum lease payments |
¥ | 44,409 | ¥ | 3,763 | ¥ | 3,849 | ¥ | 3,879 | ¥ | 3,877 | ¥ | 3,875 | ¥ | 25,166 | ||||||||||||||
Certain leases contain renewal options or escalation clauses providing for increased rental payments based upon maintenance, utilities and tax increases.
F-80
Table of Contents
Notes to the Interim Consolidated Financial Statements—(Continued) (UNAUDITED)
10. Other assets—Other / Other liabilities:
The following table presents components of Other assets—Other and Other liabilities in the consolidated balance sheets as of March 31, 2018 and as of September 30, 2018.
| Millions of yen | ||||||||
| March 31, 2018 | September 30, 2018 | |||||||
| Other assets—Other: |
||||||||
| Securities received as collateral |
¥ | 301,072 | ¥ | 319,939 | ||||
| Goodwill and other intangible assets |
99,455 | 104,285 | ||||||
| Deferred tax assets |
16,135 | 20,255 | ||||||
| Investments in equity securities for other than operating purposes |
192,819 | 200,028 | ||||||
| Prepaid expenses |
14,561 | 17,230 | ||||||
| Other |
284,092 | 281,455 | ||||||
|
|
|
|
|
|||||
| Total |
¥ | 908,134 | ¥ | 943,192 | ||||
|
|
|
|
|
|||||
| Other liabilities: |
||||||||
| Obligation to return securities received as collateral |
¥ | 301,072 | ¥ | 319,939 | ||||
| Accrued income taxes |
34,181 | 28,135 | ||||||
| Other accrued expenses and provisions |
448,423 | 366,829 | ||||||
| Other |
166,858 | 162,943 | ||||||
|
|
|
|
|
|||||
| Total |
¥ | 950,534 | ¥ | 877,846 | ||||
|
|
|
|
|
|||||
F-81
Table of Contents
Notes to the Interim Consolidated Financial Statements—(Continued) (UNAUDITED)
11. Earnings per share:
A reconciliation of the amounts and the numbers used in the calculation of net income attributable to NHI shareholders per share (basic and diluted) is as follows:
| Millions of yen except per share data presented in yen |
||||||||
| Six months ended September 30 | ||||||||
| 2017 | 2018 | |||||||
| Basic— |
||||||||
| Net income (loss) attributable to NHI shareholders |
¥ | 108,706 | ¥ | (6,010 | ) | |||
| Weighted average number of shares outstanding |
3,530,324,525 | 3,394,856,369 | ||||||
| Net income (loss) attributable to NHI shareholders per share |
¥ | 30.79 | ¥ | (1.77 | ) | |||
|
|
|
|
|
|||||
| Diluted— |
||||||||
| Net income (loss) attributable to NHI shareholders |
¥ | 108,664 | ¥ | (6,045 | ) | |||
| Weighted average number of shares outstanding |
3,598,185,304 | 3,390,540,890 | ||||||
| Net income (loss) attributable to NHI shareholders per share |
¥ | 30.20 | ¥ | (1.78 | ) | |||
|
|
|
|
|
|||||
| Millions of yen except per share data presented in yen |
||||||||
| Three months ended September 30 | ||||||||
| 2017 | 2018 | |||||||
| Basic— |
||||||||
| Net income (loss) attributable to NHI shareholders |
¥ | 51,850 | ¥ | (11,233 | ) | |||
| Weighted average number of shares outstanding |
3,526,321,204 | 3,394,584,313 | ||||||
| Net income (loss) attributable to NHI shareholders per share |
¥ | 14.70 | ¥ | (3.31 | ) | |||
|
|
|
|
|
|||||
| Diluted— |
||||||||
| Net income (loss) attributable to NHI shareholders |
¥ | 51,825 | ¥ | (11,251 | ) | |||
| Weighted average number of shares outstanding |
3,586,187,615 | 3,389,189,961 | ||||||
| Net income (loss) attributable to NHI shareholders per share |
¥ | 14.45 | ¥ | (3.32 | ) | |||
|
|
|
|
|
|||||
Net income (loss) attributable to NHI shareholders is adjusted to reflect the decline in Nomura’s equity share of earnings of subsidiaries and affiliates for the six and the three months ended September 30, 2017 and 2018, arising from options to purchase common shares issued by subsidiaries and affiliates.
The weighted average number of shares used in the calculation of diluted earnings per share (“EPS”) reflects the increase in potential issuance of common shares arising from stock-based compensation plans issued by the Company, which would have minimal impact on EPS for the six and the three months ended September 30, 2017.
The weighted average number of shares used in the calculation of diluted earnings per share (“EPS”) reflects the decrease in potential issuance of common shares arising from stock-based compensation plans issued by the Company, which would have minimal impact on EPS for the six and the three months ended September 30, 2018.
Antidilutive stock options to purchase 10,483,100 common shares were not included in the computation of diluted EPS for the six and the three months ended September 30, 2017, respectively. Antidilutive stock options to purchase 99,204,100 common shares were not included in the computation of diluted EPS for the six and the three months ended September 30, 2018, respectively.
F-82
Table of Contents
Notes to the Interim Consolidated Financial Statements—(Continued) (UNAUDITED)
12. Employee benefit plans:
Nomura provides various pension plans and other post-employment benefits which cover certain employees worldwide. In addition, Nomura provides health care benefits to certain active and retired employees through its Nomura Securities Health Insurance Society.
Net periodic benefit cost
The net periodic benefit cost of the defined benefit plans of Japanese entities’ includes the following components.
| Millions of yen | ||||||||
| Six months ended September 30 | ||||||||
| 2017 | 2018 | |||||||
| Service cost |
¥ | 5,018 | ¥ | 5,429 | ||||
| Interest cost |
1,129 | 1,090 | ||||||
| Expected return on plan assets |
(3,033 | ) | (3,034 | ) | ||||
| Amortization of net actuarial losses |
2,003 | 1,915 | ||||||
| Amortization of prior service cost |
(530 | ) | (530 | ) | ||||
|
|
|
|
|
|||||
| Net periodic benefit cost |
¥ | 4,587 | ¥ | 4,870 | ||||
|
|
|
|
|
|||||
| Millions of yen | ||||||||
| Three months ended September 30 | ||||||||
| 2017 | 2018 | |||||||
| Service cost |
¥ | 2,393 | ¥ | 2,702 | ||||
| Interest cost |
564 | 545 | ||||||
| Expected return on plan assets |
(1,517 | ) | (1,517 | ) | ||||
| Amortization of net actuarial losses |
1,001 | 957 | ||||||
| Amortization of prior service cost |
(265 | ) | (265 | ) | ||||
|
|
|
|
|
|||||
| Net periodic benefit cost |
¥ | 2,176 | ¥ | 2,422 | ||||
|
|
|
|
|
|||||
Nomura also recognized net periodic benefit cost of plans other than Japanese entities’ plans, which are not significant.
F-83
Table of Contents
Notes to the Interim Consolidated Financial Statements—(Continued) (UNAUDITED)
13. Income taxes:
For the six months ended September 30, 2017, the difference between the effective statutory tax rate of 31% and the effective tax rate of 30.4% was mainly due to non-taxable revenue whereas non-deductible expenses increased the effective tax rate.
For the three months ended September 30, 2017, the difference between the effective statutory tax rate of 31% and the effective tax rate of 35.4% was mainly due to non-taxable revenue whereas non-deductible expenses increased the effective tax rate.
For the six months ended September 30, 2018, the difference between the effective statutory tax rate of 31% and the effective tax rate of 117.9% was mainly due to non-deductible expenses whereas non-taxable revenue decreased the effective tax rate.
For the three months ended September 30, 2018, the difference between the effective statutory tax rate of 31% and the effective tax rate of 2,077.8% was mainly due to non-deductible expenses whereas non-taxable revenue decreased the effective tax rate.
14. Other comprehensive income (loss):
Changes in accumulated other comprehensive income (loss) are as follows:
| Millions of yen | ||||||||||||||||||||
| Six months ended September 30, 2017 | ||||||||||||||||||||
| Balance at beginning of year |
Other comprehensive income (loss) before reclassifications |
Reclassifications out of accumulated other comprehensive income (loss) (1) |
Net change during the period |
Balance at end of period |
||||||||||||||||
| Cumulative translation adjustments |
¥ | 47,767 | ¥ | 9,860 | ¥ | (26 | ) | ¥ | 9,834 | ¥ | 57,601 | |||||||||
| Pension liability adjustment |
(41,020 | ) | (712 | ) | 1,075 | 363 | (40,657 | ) | ||||||||||||
| Net unrealized gain on non-trading securities |
20,344 | 971 | 104 | 1,075 | 21,419 | |||||||||||||||
| Own credit adjustments |
6,561 | (9,270 | ) | (69 | ) | (9,339 | ) | (2,778 | ) | |||||||||||
|
|
|
|
|
|
|
|
|
|
|
|||||||||||
| Total |
¥ | 33,652 | ¥ | 849 | ¥ | 1,084 | ¥ | 1,933 | ¥ | 35,585 | ||||||||||
|
|
|
|
|
|
|
|
|
|
|
|||||||||||
| (1) | Reclassifications out of accumulated other comprehensive income (loss) were not significant. |
| Millions of yen | ||||||||||||||||||||
| Six months ended September 30, 2018 | ||||||||||||||||||||
| Balance at beginning of year |
Other comprehensive income (loss) before reclassifications |
Reclassifications out of accumulated other comprehensive income (loss) (1) |
Net change during the period |
Balance at end of period |
||||||||||||||||
| Cumulative translation adjustments |
¥ | (15,596 | ) | ¥ | 54,170 | ¥ | 6,962 | ¥ | 61,132 | ¥ | 45,536 | |||||||||
| Pension liability adjustment |
(47,837 | ) | 1,172 | 85 | 1,257 | (46,580 | ) | |||||||||||||
| Net unrealized gain on non-trading securities(2) |
— | — | — | — | — | |||||||||||||||
| Own credit adjustments |
4,077 | 3,319 | 21 | 3,340 | 7,417 | |||||||||||||||
|
|
|
|
|
|
|
|
|
|
|
|||||||||||
| Total |
¥ | (59,356 | ) | ¥ | 58,661 | ¥ | 7,068 | ¥ | 65,729 | ¥ | 6,373 | |||||||||
|
|
|
|
|
|
|
|
|
|
|
|||||||||||
| (1) | Change in cumulative translation adjustments, net of tax in other comprehensive income (loss) for six months ended September 30, 2018 includes reclassification adjustment of ¥6,956 million for loss due to substantially complete liquidation of an investment in a foreign entity. The adjustment is recognized in Non-interest expenses-Other. |
| (2) | See Note 6 “Non-trading securities” for further information. As Nomura disposed of the interest in its insurance subsidiary, there are no unrealized gains and losses of non-trading securities recognized in other comprehensive income as of March 31 and September 30, 2018. |
F-84
Table of Contents
Notes to the Interim Consolidated Financial Statements—(Continued) (UNAUDITED)
| Millions of yen | ||||||||||||||||||||
| Three months ended September 30, 2017 | ||||||||||||||||||||
| Balance at beginning of period |
Other comprehensive income (loss) before reclassifications |
Reclassifications out of accumulated other comprehensive income (loss)(1) |
Net change during the period |
Balance at end of period |
||||||||||||||||
| Cumulative translation adjustments |
¥ | 50,369 | ¥ | 7,258 | ¥ | (26 | ) | ¥ | 7,232 | ¥ | 57,601 | |||||||||
| Pension liability adjustment |
(42,626 | ) | 1,437 | 532 | 1,969 | (40,657 | ) | |||||||||||||
| Net unrealized gain on non-trading securities |
21,650 | (448 | ) | 217 | (231 | ) | 21,419 | |||||||||||||
| Own credit adjustments |
1,695 | (4,463 | ) | (10 | ) | (4,473 | ) | (2,778 | ) | |||||||||||
|
|
|
|
|
|
|
|
|
|
|
|||||||||||
| Total |
¥ | 31,088 | ¥ | 3,784 | ¥ | 713 | ¥ | 4,497 | ¥ | 35,585 | ||||||||||
|
|
|
|
|
|
|
|
|
|
|
|||||||||||
| (1) | Reclassifications out of accumulated other comprehensive income (loss) were not significant. |
| Millions of yen | ||||||||||||||||||||
| Three months ended September 30, 2018 | ||||||||||||||||||||
| Balance at beginning of period |
Other comprehensive income (loss) before reclassifications |
Reclassifications out of accumulated other comprehensive income (loss)(1) |
Net change during the period |
Balance at end of period |
||||||||||||||||
| Cumulative translation adjustments |
¥ | 16,263 | ¥ | 22,368 | ¥ | 6,905 | ¥ | 29,273 | ¥ | 45,536 | ||||||||||
| Pension liability adjustment |
(47,117 | ) | 494 | 43 | 537 | (46,580 | ) | |||||||||||||
| Net unrealized gain on non-trading securities(2) |
— | — | — | — | — | |||||||||||||||
| Own credit adjustments |
8,307 | (924 | ) | 34 | (890 | ) | 7,417 | |||||||||||||
|
|
|
|
|
|
|
|
|
|
|
|||||||||||
| Total |
¥ | (22,547 | ) | ¥ | 21,938 | ¥ | 6,982 | ¥ | 28,920 | ¥ | 6,373 | |||||||||
|
|
|
|
|
|
|
|
|
|
|
|||||||||||
| (1) | Change in cumulative translation adjustments, net of tax in other comprehensive income (loss) for three months ended September 30, 2018 includes reclassification adjustment of ¥6,956 million for loss due to substantially complete liquidation of an investment in a foreign entity. The adjustment is recognized in Non-interest expenses—Other. |
| (2) | See Note 6 “Non-trading securities” for further information. As Nomura disposed of the interest in its insurance subsidiary, there are no unrealized gains and losses of non-trading securities recognized in other comprehensive income as of March 31 and September 30, 2018. |
F-85
Table of Contents
Notes to the Interim Consolidated Financial Statements—(Continued) (UNAUDITED)
15. Commitments, contingencies and guarantees:
Commitments—
Credit and investment commitments
In connection with its banking and financing activities, Nomura provides commitments to extend credit which generally have fixed expiration dates. In connection with its investment banking activities, Nomura enters into agreements with clients under which Nomura commits to underwrite securities that may be issued by the clients. The outstanding commitments under these agreements are included below in commitments to extend credit.
Nomura has commitments to invest in various partnerships and other entities and also has commitments to provide financing for investments related to these partnerships. The outstanding commitments under these agreements are included below in commitments to invest.
The following table presents a summary of the key types of outstanding commitments provided by Nomura.
| Millions of yen | ||||||||
| March 31, 2018 | September 30, 2018 | |||||||
| Commitments to extend credit |
¥ | 965,942 | ¥ | 1,076,827 | ||||
| Commitments to invest |
13,273 | 15,336 | ||||||
As of September 30, 2018, these commitments had the following maturities:
| Millions of yen | ||||||||||||||||||||
| Years to Maturity | ||||||||||||||||||||
| Total contractual amount |
Less than 1 year |
1 to 3 years |
3 to 5 years |
More than 5 years |
||||||||||||||||
| Commitments to extend credit |
¥ | 1,076,827 | ¥ | 320,018 | ¥ | 142,428 | ¥ | 193,573 | ¥ | 420,808 | ||||||||||
| Commitments to invest |
15,336 | 1,799 | — | 373 | 13,164 | |||||||||||||||
The contractual amounts of these commitments to extend credit represent the amounts at risk but only if the contracts are fully drawn upon, should the counterparties default, and assuming the value of any existing collateral becomes worthless. The total contractual amount of these commitments may not represent future cash requirements since the commitments may expire without being drawn upon. The credit risk associated with these commitments varies depending on the clients’ creditworthiness and the value of collateral held. Nomura evaluates each client’s creditworthiness on a case-by-case basis. The amount of collateral obtained, if deemed necessary by Nomura upon extension of credit, is based on credit evaluation of the counterparty.
Contingencies—
Investigations, lawsuits and other legal proceedings
In the normal course of business as a global financial services entity, Nomura is involved in investigations, lawsuits and other legal proceedings and, as a result, may suffer loss from any fines, penalties or damages awarded against Nomura, any settlements Nomura chooses to make to resolve a matter, and legal and other advisory costs incurred to support and formulate a defense.
The ability to predict the outcome of these actions and proceedings is inherently difficult, particularly where claimants are seeking substantial or indeterminate damages, where investigations and legal proceedings are at an early stage, where the matters present novel legal theories or involve a large number of parties, or which take place in foreign jurisdictions with complex or unclear laws.
The Company regularly evaluates each legal proceeding and claim on a case-by-case basis in consultation with external legal counsel to assess whether an estimate of possible loss or range of loss can be made, if recognition of a liability is not appropriate. In accordance with ASC 450 “Contingencies” (“ASC 450”), the Company recognizes a liability for this risk of loss arising on each individual matter when a loss is probable and the amount of such loss or range of loss can be reasonably estimated. The amount recognized as a liability is reviewed at least quarterly and is revised when further information becomes available. If these criteria are not met for an individual matter, such as if an estimated loss is only reasonably possible rather than probable, no liability is recognized. However, where a material loss is reasonably possible, the Company will disclose details of the legal proceeding or claim below. Under ASC 450 an event is defined as reasonably possible if the chance of the loss to the Company is more than remote but less than probable.
The most significant actions and proceedings against Nomura are summarized below. The Company believes that, based on current information available as of the date of these consolidated financial statements, the ultimate resolution of these actions and proceedings will not be material to the Company’s financial condition. However, an adverse outcome in certain of these matters could have a material adverse effect on the consolidated statements of income or cash flows in a particular quarter or annual period.
F-86
Table of Contents
Notes to the Interim Consolidated Financial Statements—(Continued) (UNAUDITED)
For certain of the significant actions and proceedings described below, the Company is currently able to estimate the amount of reasonably possible loss, or range of reasonably possible losses, in excess of amounts recognized as a liability (if any) against such cases. These estimates are based on current information available as of the date of these consolidated financial statements and include, but are not limited to, the specific amount of damages or claims against Nomura in each case. As of December 14, 2018, for those cases where an estimate of the range of reasonably possible losses can be made, the Company estimates that the total aggregate reasonably possible maximum loss in excess of amounts recognized as a liability (if any) against these cases is approximately ¥35 billion.
For certain other significant actions and proceedings, the Company is unable to provide an estimate of the reasonably possible loss or range of reasonably possible losses because, among other reasons, (i) the proceedings are at such an early stage there is not enough information available to assess whether the stated grounds for the claim are viable; (ii) damages have not been identified by the claimant; (iii) damages are unsupported and/or exaggerated; (iv) there is uncertainty as to the outcome of pending appeals or motions; (v) there are significant legal issues to be resolved that may be dispositive, such as the applicability of statutes of limitations; and/or (vi) there are novel or unsettled legal theories underlying the claims.
Nomura will continue to cooperate with regulatory investigations and to vigorously defend its position in the ongoing actions and proceedings set out below, as appropriate.
In January 2008, Nomura International plc (“NIP”) was served with a tax notice issued by the tax authorities in Pescara, Italy alleging breaches by NIP of the U.K.-Italy Double Taxation Treaty of 1998 (“Tax Notice”). The alleged breaches relate to payments to NIP of tax credits on dividends on Italian shares. The Tax Notice not only denies certain payments to which NIP claims to be entitled but also seeks reimbursement of approximately EUR 33.8 million, plus interest, already refunded. NIP continues vigorously to challenge the Pescara Tax Court’s decisions in favor of the local tax authorities.
In October 2010 and June 2012, two actions were brought against NIP, seeking recovery of payments allegedly made to NIP by Fairfield Sentry Ltd. and Fairfield Sigma Ltd. (collectively, “Fairfield Funds”), which are now in liquidation and were feeder funds to Bernard L. Madoff Investment Securities LLC (in liquidation pursuant to the Securities Investor Protection Act in the U.S. since December 2008) (“BLMIS”). The first suit was brought by the liquidators of the Fairfield Funds. It was filed on October 5, 2010 in the Supreme Court of the State of New York, but was subsequently removed to the United States Bankruptcy Court for the Southern District of New York, where it is presently pending. The second suit was brought by the Trustee for the liquidation of BLMIS (“Madoff Trustee”). NIP was added as a defendant in June 2012 when the Madoff Trustee filed an amended complaint in the United States Bankruptcy Court for the Southern District of New York. In November 2016, the United States Bankruptcy Court granted a motion to dismiss the Madoff Trustee’s claim. The Madoff Trustee has appealed the decision to the United States Court of Appeals for the Second Circuit. Both actions seek to recover approximately $35 million.
In April 2011, the Federal Home Loan Bank of Boston (“FHLB-Boston”) commenced proceedings in the Superior Court of Massachusetts against numerous issuers, sponsors and underwriters of residential mortgage-backed securities (“RMBS”), and their controlling persons, including Nomura Asset Acceptance Corporation (“NAAC”), Nomura Credit & Capital, Inc. (“NCCI”), Nomura Securities International, Inc. (“NSI”) and Nomura Holding America Inc. (“NHA”). The action alleges that FHLB-Boston purchased RMBS issued by NAAC for which the offering materials contained untrue statements or omitted material facts concerning the underwriting standards used by the original lenders and the characteristics of the loans underlying the securities. FHLB-Boston seeks rescission of its purchases or compensatory damages pursuant to state law. FHLB-Boston alleges that it purchased certificates in four offerings issued by NAAC in the original principal amount of approximately $406 million.
In September 2011, the Federal Housing Finance Agency (“FHFA”), as conservator for the government sponsored enterprises, Federal National Mortgage Association and Federal Home Loan Mortgage Corporation (“GSEs”), commenced proceedings in the United States District Court for the Southern District of New York against numerous issuers, sponsors and underwriters of RMBS, and their controlling persons, including NAAC, Nomura Home Equity Loan Inc. (“NHEL”), NCCI, NSI and NHA (the Company’s U.S. subsidiaries). The action alleged that the GSEs purchased RMBS issued by NAAC and NHEL for which the offering materials contained untrue statements or omitted material facts concerning the underwriting standards used by the original lenders and the characteristics of the loans underlying the securities. FHFA alleged that the GSEs purchased certificates in seven offerings in the original principal amount of approximately $2,046 million and sought rescission of its purchases. The case was tried before the Court beginning March 16, 2015 and closing arguments were completed on April 9, 2015. On May 15, 2015, the Court issued a judgment and ordered the defendants to pay $806 million to the GSEs upon the GSEs’ delivery of the certificates at issue to the defendants. The Company’s U.S. subsidiaries appealed the decision to the United States Court of Appeals for the Second Circuit and agreed, subject to the outcome of the appeal, to a consent judgment for costs and attorneys’ fees recoverable under the blue sky statutes at issue in the maximum amount of $33 million. On September 28, 2017, the Second Circuit affirmed the judgment of the district court. On March 12, 2018, the Company’s U.S. subsidiaries filed a petition for certiorari to the U.S. Supreme Court. On June 25, 2018, the U.S. Supreme Court denied the petition for certiorari. The judgment has been satisfied and the proceedings have since been discontinued.
F-87
Table of Contents
Notes to the Interim Consolidated Financial Statements—(Continued) (UNAUDITED)
In November 2011, NIP was served with a claim filed by the Madoff Trustee in the United States Bankruptcy Court for the Southern District of New York. This is a clawback action similar to claims filed by the Madoff Trustee against numerous other institutions. The Madoff Trustee alleges that NIP received redemptions from the BLMIS feeder fund, Harley International (Cayman) Limited in the six years prior to December 11, 2008 (the date proceedings were commenced against BLMIS) and that these are avoidable and recoverable under the U.S. Bankruptcy Code and New York law. In November 2016, the United States Bankruptcy Court granted a motion to dismiss the Madoff Trustee’s claim. The Madoff Trustee has appealed the decision to the United States Court of Appeals for the Second Circuit. The amount that the Madoff Trustee is currently seeking to recover from NIP is approximately $21 million.
In March 2013, Banca Monte dei Paschi di Siena SpA (“MPS”) issued a claim in the Italian Courts against (1) two former directors of MPS and (2) NIP. MPS alleged that the former directors improperly caused MPS to enter into certain structured financial transactions with NIP in 2009 (“Transactions”) and that NIP acted fraudulently and was jointly liable for the unlawful conduct of MPS’s former directors. MPS claimed damages of not less than EUR 1.142 billion.
In March 2013, NIP commenced a claim against MPS in the English Courts. The claim was for declaratory relief confirming that the Transactions remained valid and contractually binding. MPS filed and served its defence and counterclaim to these proceedings in March 2014. MPS alleged in its counterclaim that NIP was liable to make restitution of a net amount of approximately EUR 1.5 billion, and sought declarations regarding the illegality and invalidity of the Transactions.
On September 23, 2015, NIP entered into a settlement agreement with MPS to terminate the Transactions. NIP believes that the Transactions were conducted legally and appropriately, and does not accept the allegations made against it or admit any wrongdoing. Taking into account the views of relevant European financial authorities and the advice provided by external experts, NIP considered it to be in its best interests to reach a settlement in relation to this matter. As part of the agreement, the Transactions were unwound at a discount of EUR 440 million in favour of MPS and the civil proceedings between MPS and NIP in Italy and England, respectively, will no longer be pursued. Pursuant to the settlement agreement MPS and NIP applied to the Italian Courts to discontinue the proceedings brought by MPS against NIP. These proceedings have since been discontinued.
In July 2013, a claim was also issued against the same former directors of MPS, and NIP, by the shareholder group Fondazione Monte dei Paschi di Siena (“FMPS”). The grounds of the FMPS claim are similar to those on which the MPS claim was founded. The level of damages sought by FMPS is not less than EUR 315.2 million.
In January 2018, a claim before the Italian Courts brought by two claimants, Alken Fund Sicav (on behalf of two Luxembourg investment funds Alken Fund European Opportunities and Alken Fund Absolute Return Europe) and Alken Luxembourg S.A (the funds’ management company) was served on NIP. The claim is made against NIP, MPS, four MPS former directors and a member of MPS’s internal audit board, and seeks monetary damages of approximately EUR 434 million on the basis of allegations similar to those made in the MPS and FMPS claims, as well as non-monetary damages in an amount left to be quantified by the Judge.
In April 2013, an investigation was commenced by the Public Prosecutor’s office in Siena, Italy, into various allegations against MPS and certain of its former directors, including in relation to the Transactions. The investigation was subsequently transferred to the Public Prosecutor of Milan. On April 3, 2015, the Public Prosecutor’s office in Milan issued a notice concluding its preliminary investigation. The Public Prosecutor was seeking to indict MPS, three individuals from MPS’s former management, NIP and two NIP individuals for, among others, the offences of false accounting and market manipulation in relation to MPS’s previous accounts. The preliminary hearing at which the court considered whether or not to grant the indictment concluded on October 1, 2016, the Judge ordering the trial of all individuals and banks involved except for MPS (which entered into a plea bargaining agreement with the Public Prosecutor). The trial commenced in December 2016 and is currently ongoing.
Additionally, NIP was served by the Commissione Nazionale per le Società e la Borsa (“CONSOB”, the Italian financial regulatory authority) with a notice commencing administrative sanction proceedings for market manipulation in connection with the Transactions. In relation to the Transactions, the notice named MPS, three individuals from MPS’s former management and two former NIP employees as defendants, whereas NIP was named only in its capacity as vicariously liable to pay any fines imposed on the former NIP employees. On May 22, 2018 CONSOB issued its decision in which it levied EUR 100,000 fines in relation to each of the two NIP former employees as well as revocations of the Italian law integrity requirement to perform certain corporate functions of three and six months respectively. NIP is vicariously liable to pay the fines imposed on its former employees. NIP has paid the fines and appealed the decision to the Milan Court of Appeal.
F-88
Table of Contents
Notes to the Interim Consolidated Financial Statements—(Continued) (UNAUDITED)
In January 2016, the Municipality of Civitavecchia in Italy (“Municipality”) commenced civil proceedings against NIP in the local courts in Civitavecchia. The Municipality’s claim related to derivatives transactions entered into by the Municipality between 2003 and 2005. The Municipality alleged that NIP failed to comply with its duties under an advisory agreement and sought to recover approximately EUR 35 million in damages. On December 20, 2017, NIP entered into a settlement agreement with the Municipality pursuant to which the Municipality withdrew its proceedings against NIP. The proceedings have since been discontinued.
In June 2016 and August 2016, Nomura International (Hong Kong) Limited (“NIHK”) and Nomura Special Investments Singapore Pte Limited (“NSIS”) were respectively served with a complaint filed in the Taipei District Court against NIHK, NSIS and certain individuals by Cathay United Bank, Co., Ltd., Taiwan Cooperative Bank Ltd., Chang Hwa Commercial Bank Ltd., Taiwan Business Bank Ltd., KGI Bank and Hwatai Bank Ltd. (collectively, “Syndicate Banks”). The Syndicate Banks’ complaint relates to a $60 million syndicated term loan to a subsidiary of Ultrasonic AG that was arranged by NIHK, and made by Syndicate Banks together with NSIS. The Syndicate Banks’ allegations in the complaint include allegations that NIHK failed to comply with its fiduciary duties to the lenders as the arranger of the loan and the Syndicate Banks seek to recover approximately $48 million in damages and interest.
In March 2017, certain subsidiaries of American International Group, Inc. (“AIG”) commenced proceedings in the District Court of Harris County, Texas against certain entities and individuals, including NSI, in connection with a 2012 offering of $750 million of certain project finance notes, of which $92 million allegedly were purchased by AIG. AIG alleges violations of the Texas Securities Act based on material misrepresentations and omissions in connection with the marketing, offering, issuance and sale of the notes and seeks rescission of the purchases or compensatory damages.
Various authorities continue to conduct investigations concerning the activities of NIP, other entities in the Nomura Group and other parties in respect of government, supranational, sub-sovereign and agency bonds. NIP and other entities in the Nomura Group are also defendants to a consolidated class action complaint filed in the United States District Court for the Southern District of New York alleging violations of U.S. antitrust law related to the alleged manipulation of the secondary trading market for supranational, sub-sovereign and agency bonds. The Company, NIP and NSI have been served with a similar class action complaint filed in the Toronto Registry Office of the Federal Court of Canada alleging violations of Canadian competition law.
In September 2017 and November 2017, NIHK and NSIS were respectively served with a complaint filed in the Taipei District Court against NIHK, NSIS, China Firstextile (Holdings) Limited (“FT”) and certain individuals by First Commercial Bank, Ltd., Land Bank of Taiwan Co., Ltd., Chang Hwa Commercial Bank Ltd, Taishin International Bank, E.Sun Commercial Bank, Ltd., CTBC Bank Co., Ltd., Hwatai Bank, Ltd. and Bank of Taiwan (collectively, “FT Syndicate Banks”). The FT Syndicated Banks’ complaint relates to a $100 million syndicated term loan facility to borrower FT that was arranged by NIHK, and made by the FT Syndicate Banks together with NSIS. The FT Syndicated Banks’ allegations in the complaint include tort claims under Taiwan law against the defendants. The FT Syndicated Banks seek to recover approximately $68 million in damages and interest.
In July 2018, a former Italian counterparty filed a claim against NIP in the Civil Court of Rome relating to a derivative transaction entered into by the parties in 2006, and terminated in 2009. The claim alleges that payments by the counterparty to NIP of approximately EUR 165 million were made in breach of Italian insolvency law, and seeks reimbursement of those payments.
Nomura Securities Co., Ltd. (“NSC”) is the leading securities firm in Japan with approximately 5.32 million client accounts. Accordingly, with a significant number of client transactions, NSC is from time to time party to various Japanese civil litigation and other dispute resolution proceedings with clients relating to investment losses. These include an action commenced in October 2014 by a corporate client concerning transactions conducted between 2006 and 2012, in which assertions such as the assertion that NSC was in breach of its duty of explanation at the time the trading contracts were entered into were made and compensation of damages in the amount of ¥2,143 million is being sought for damages such as the amount of losses.
On February 8, 2018, for an action commenced in April 2013 by a corporate client seeking ¥10,247 million in damages for losses on currency derivative transactions and the pre-maturity cash out or redemption of 11 series of equity-linked structured notes purchased from NSC between 2005 and 2011, NSC entered into a settlement agreement with such client. The proceedings have since been discontinued.
F-89
Table of Contents
Notes to the Interim Consolidated Financial Statements—(Continued) (UNAUDITED)
In February 2018, a determination was made that there would be an early redemption of the NEXT NOTES S&P500 VIX Short-Term Futures Inverse Daily Excess Return Index ETN (“Product”), and with respect to matters such as losses that occurred due to this early redemption for clients who purchased the Product, in terms of claims such as mediation procedures before the Non-Profit Organization, Financial Instruments Mediation Assistance Center (FINMAC) and lawsuits (“Claims”), where there has been an indication of a decision that NSC has a certain amount of responsibility, NSC has been carryings out compensation of losses on this basis. Currently, a considerable number of clients have filed Claims and it is expected that it will be necessary to continue to carry out compensation of losses on the basis of the Claim for the purpose of resolving this matter.
The United States Department of Justice (“DOJ”), led by the United States Attorney’s Office for the Eastern District of New York, informed NHA; NAAC; NCCI; NHEL; NSI; Nomura America Mortgage Finance, LLC; and Nomura Asset Capital Corporation; (the Company’s U.S. subsidiaries) that it was investigating possible civil claims against the Company’s U.S. subsidiaries under the Financial Institutions Reform, Recovery, and Enforcement Act of 1989 focusing on RMBS the Company’s U.S. subsidiaries sponsored, issued, underwrote, managed, or offered during 2006 and 2007. The Company’s U.S. subsidiaries cooperated with the investigation and on October 15, 2018, the Company’s U.S. subsidiaries reached a settlement with DOJ pursuant to which the U.S. subsidiaries paid $480 million to resolve the matter. On the consolidated statements of income for the Year Ending March 31, 2019, approximately ¥20 billion incurred by the settlement, was reserved at Non-interest expenses—Other.
The United States Securities and Exchange Commission (“SEC”) and the DOJ have been investigating past activities of several former employees of NSI in respect of the commercial and residential mortgage-backed securities transactions. The SEC has indicated it will institute proceedings focusing on NSI’s supervision of certain former employees and NSI intends, in connection with such proceedings, to agree to disgorgement and/or restitution relating to some of the transactions in issue.
Other mortgage-related contingencies in the U.S.
Certain of the Company’s subsidiaries in the U.S. securitized residential mortgage loans in the form of RMBS. These subsidiaries did not generally originate mortgage loans, but purchased mortgage loans from third-party loan originators (“originators”). In connection with such purchases, these subsidiaries received loan level representations from the originators. In connection with the securitizations, the relevant subsidiaries provided loan level representations and warranties of the type generally described below, which mirror the representations the subsidiaries received from the originators.
The loan level representations made in connection with the securitization of mortgage loans were generally detailed representations applicable to each loan and addressed characteristics of the borrowers and properties. The representations included, but were not limited to, information concerning the borrower’s credit status, the loan-to-value ratio, the owner occupancy status of the property, the lien position, the fact that the loan was originated in accordance with the originator’s guidelines, and the fact that the loan was originated in compliance with applicable laws. Certain of the RMBS issued by the subsidiaries were structured with credit protection provided to specified classes of certificates by monoline insurers.
The relevant subsidiaries have received claims demanding the repurchase of certain loans from trustees of various securitization trusts, made at the instance of one or more investors, or from certificate insurers. The total original principal amount of loans for which repurchase claims were received by the relevant subsidiaries within six years of each securitization is $3,203 million. The relevant subsidiaries summarily rejected any demand for repurchase received after the expiration of the statute of limitations applicable to breach of representation claims. For those claims received within six years, the relevant subsidiaries reviewed each claim received, and rejected those claims believed to be without merit or agreed to repurchase certain loans for those claims that the relevant subsidiaries determined to have merit. In several instances, following the rejection of repurchase demands, investors instituted actions through the trustee alleging breach of contract. The breach of contract claims that were brought within the six-year statute of limitations for breach of contract actions have survived motions to dismiss. These claims involve substantial legal, as well as factual, uncertainty and the Company cannot provide an estimate of reasonably possible loss at this time, in excess of the existing reserve.
Cyber security incident
In June 2018, a foreign Nomura subsidiary experienced a cyber incident that resulted in the unauthorized access to certain of its systems including client information. An internal investigation to assess and remediate the incident and inform the appropriate authorities of its occurrence was immediately launched and is currently ongoing. As a result of this incident, Nomura may suffer financial loss through reputational damage, legal liability and enforcement actions and through the cost of additional resources to both remediate this incident and also to enhance and strengthen cybersecurity of other Nomura group companies. As the extent and potential magnitude of this incident have yet to be determined, the Company cannot provide an estimate of the reasonably possible loss in respect of this matter.
F-90
Table of Contents
Notes to the Interim Consolidated Financial Statements—(Continued) (UNAUDITED)
Guarantees—
In the normal course of business, Nomura enters into various guarantee arrangements with counterparties in the form of standby letters of credit and other guarantees, which generally have a fixed expiration date.
In addition, Nomura enters into certain derivative contracts that meet the accounting definition of a guarantee, namely derivative contracts that contingently require a guarantor to make payment to a guaranteed party based on changes in an underlying that relate to an asset, liability or equity security held by a guaranteed party. Since Nomura does not track whether its clients enter into these derivative contracts for speculative or hedging purposes, Nomura has disclosed below information about derivative contracts that could meet the accounting definition of guarantees.
For information about the maximum potential amount of future payments that Nomura could be required to make under certain derivatives, the notional amount of contracts has been disclosed. However, the maximum potential payout for certain derivative contracts, such as written interest rate caps and written currency options, cannot be estimated, as increases in interest or foreign exchange rates in the future could be theoretically unlimited.
Nomura records all derivative contracts at fair value on its consolidated balance sheets. Nomura believes the notional amounts generally overstate its risk exposure. Since the derivative contracts are accounted for at fair value, carrying value is considered the best indication of payment and performance risk for individual contracts.
The following table presents information on Nomura’s derivative contracts that could meet the accounting definition of a guarantee and standby letters of credit and other guarantees.
| Millions of yen | ||||||||||||||||
| March 31, 2018 | September 30, 2018 | |||||||||||||||
| Carrying value |
Maximum potential payout/ Notional total |
Carrying value |
Maximum potential payout/ Notional total |
|||||||||||||
| Derivative contracts(1)(2) |
¥ | 4,023,893 | ¥ | 260,885,770 | ¥ | 4,396,614 | ¥ | 271,246,276 | ||||||||
| Standby letters of credit and other guarantees(3) |
92 | 5,189 | 90 | 5,823 | ||||||||||||
| (1) | Credit derivatives are disclosed in Note 3. “Derivative instruments and hedging activities” and are excluded from derivative contracts. |
| (2) | Derivative contracts primarily consist of equity, interest rate and foreign exchange contracts. |
| (3) | The amounts of collaterals held in connection with standby letters of credit and other guarantees are ¥2,559 million and ¥2,735 million as of March 31, 2018 and September 30, 2018, respectively. |
The following table presents maturity information on Nomura’s derivative contracts that could meet the accounting definition of a guarantee and standby letters of credit and other guarantees as of September 30, 2018.
| Millions of yen | ||||||||||||||||||||||||
| Maximum potential payout/Notional | ||||||||||||||||||||||||
| Years to Maturity | ||||||||||||||||||||||||
| Carrying value |
Total | Less than 1 year |
1 to 3 years |
3 to 5 years |
More than 5 years |
|||||||||||||||||||
| Derivative contracts |
¥ | 4,396,614 | ¥ | 271,246,276 | ¥ | 83,662,531 | ¥ | 79,164,073 | ¥ | 34,956,982 | ¥ | 73,462,690 | ||||||||||||
| Standby letters of credit and other guarantees |
90 | 5,823 | 2,004 | 3 | 3,815 | 1 | ||||||||||||||||||
F-91
Table of Contents
Notes to the Interim Consolidated Financial Statements—(Continued) (UNAUDITED)
16. Segment and geographic information:
Operating segments—
Nomura’s operating management and management reporting are prepared based on the Retail, the Asset Management, and the Wholesale segments. Nomura structures its business segments based upon the nature of its main products and services, its client base and its management structure.
The accounting policies for segment information follow U.S. GAAP, except for the impact of unrealized gains/losses on investments in equity securities held for operating purposes, which under U.S. GAAP are included in Income (loss) before income taxes, but excluded from segment information.
Revenues and expenses directly associated with each business segment are included in the operating results of each respective segment. Revenues and expenses that are not directly attributable to a particular segment are allocated to each respective business segment or included in “Other”, based upon Nomura’s allocation methodologies as used by management to assess each segment’s performance.
Business segments’ results are shown in the following tables. Net interest revenue is disclosed because management views interest revenue net of interest expense for its operating decisions. Business segments’ information on total assets is not disclosed because management does not utilize such information for its operating decisions and therefore, it is not reported to management.
| Millions of yen | ||||||||||||||||||||
| Retail | Asset Management |
Wholesale | Other (Incl. elimination) |
Total | ||||||||||||||||
| Six months ended September 30, 2017 |
||||||||||||||||||||
| Non-interest revenue |
¥ | 200,633 | ¥ | 64,749 | ¥ | 270,461 | ¥ | 115,733 | ¥ | 651,576 | ||||||||||
| Net interest revenue |
2,837 | (1,234 | ) | 67,818 | (11,416 | ) | 58,005 | |||||||||||||
|
|
|
|
|
|
|
|
|
|
|
|||||||||||
| Net revenue |
203,470 | 63,515 | 338,279 | 104,317 | 709,581 | |||||||||||||||
| Non-interest expenses |
153,031 | 29,477 | 295,943 | 73,383 | 551,834 | |||||||||||||||
|
|
|
|
|
|
|
|
|
|
|
|||||||||||
| Income (loss) before income taxes |
¥ | 50,439 | ¥ | 34,038 | ¥ | 42,336 | ¥ | 30,934 | ¥ | 157,747 | ||||||||||
|
|
|
|
|
|
|
|
|
|
|
|||||||||||
| Six months ended September 30, 2018 |
||||||||||||||||||||
| Non-interest revenue |
¥ | 174,522 | ¥ | 52,302 | ¥ | 236,662 | ¥ | 56,651 | ¥ | 520,137 | ||||||||||
| Net interest revenue |
4,021 | (1,532 | ) | 48,288 | (16,931 | ) | 33,846 | |||||||||||||
|
|
|
|
|
|
|
|
|
|
|
|||||||||||
| Net revenue |
178,543 | 50,770 | 284,950 | 39,720 | 553,983 | |||||||||||||||
| Non-interest expenses |
146,403 | 31,574 | 287,459 | 75,373 | 540,809 | |||||||||||||||
|
|
|
|
|
|
|
|
|
|
|
|||||||||||
| Income (loss) before income taxes |
¥ | 32,140 | ¥ | 19,196 | ¥ | (2,509 | ) | ¥ | (35,653 | ) | ¥ | 13,174 | ||||||||
|
|
|
|
|
|
|
|
|
|
|
|||||||||||
| Millions of yen | ||||||||||||||||||||
| Retail | Asset Management |
Wholesale | Other (Incl. elimination) |
Total | ||||||||||||||||
| Three months ended September 30, 2017 |
||||||||||||||||||||
| Non-interest revenue |
¥ | 100,360 | ¥ | 36,061 | ¥ | 123,126 | ¥ | 58,514 | ¥ | 318,061 | ||||||||||
| Net interest revenue |
1,426 | (643 | ) | 35,837 | (5,904 | ) | 30,716 | |||||||||||||
|
|
|
|
|
|
|
|
|
|
|
|||||||||||
| Net revenue |
101,786 | 35,418 | 158,963 | 52,610 | 348,777 | |||||||||||||||
| Non-interest expenses |
76,239 | 14,950 | 141,980 | 35,285 | 268,454 | |||||||||||||||
|
|
|
|
|
|
|
|
|
|
|
|||||||||||
| Income (loss) before income taxes |
¥ | 25,547 | ¥ | 20,468 | ¥ | 16,983 | ¥ | 17,325 | ¥ | 80,323 | ||||||||||
|
|
|
|
|
|
|
|
|
|
|
|||||||||||
| Three months ended September 30, 2018 |
||||||||||||||||||||
| Non-interest revenue |
¥ | 83,857 | ¥ | 25,455 | ¥ | 121,965 | ¥ | 29,514 | ¥ | 260,791 | ||||||||||
| Net interest revenue |
1,853 | (774 | ) | 25,695 | (3,532 | ) | 23,242 | |||||||||||||
|
|
|
|
|
|
|
|
|
|
|
|||||||||||
| Net revenue |
85,710 | 24,681 | 147,660 | 25,982 | 284,033 | |||||||||||||||
| Non-interest expenses |
73,494 | 15,768 | 142,745 | 50,448 | 282,455 | |||||||||||||||
|
|
|
|
|
|
|
|
|
|
|
|||||||||||
| Income (loss) before income taxes |
¥ | 12,216 | ¥ | 8,913 | ¥ | 4,915 | ¥ | (24,466 | ) | ¥ | 1,578 | |||||||||
|
|
|
|
|
|
|
|
|
|
|
|||||||||||
Transactions between operating segments are recorded within segment results on commercial terms and conditions and are eliminated in “Other.”
F-92
Table of Contents
Notes to the Interim Consolidated Financial Statements—(Continued) (UNAUDITED)
The following table presents the major components of Income (loss) before income taxes in “Other.”
| Millions of yen | ||||||||
| Six months ended September 30 | ||||||||
| 2017 | 2018 | |||||||
| Net gain (loss) related to economic hedging transactions |
¥ | (96 | ) | ¥ | (29,825 | ) | ||
| Realized gain (loss) on investments in equity securities held for operating purposes |
387 | 52 | ||||||
| Equity in earnings of affiliates |
15,430 | 15,155 | ||||||
| Corporate items |
1,751 | (26,201 | ) | |||||
| Other(1) |
13,462 | 5,166 | ||||||
|
|
|
|
|
|||||
| Total |
¥ | 30,934 | ¥ | (35,653 | ) | |||
|
|
|
|
|
|||||
| Millions of yen | ||||||||
| Three months ended September 30 | ||||||||
| 2017 | 2018 | |||||||
| Net gain (loss) related to economic hedging transactions |
¥ | 558 | ¥ | (16,018 | ) | |||
| Realized gain (loss) on investments in equity securities held for operating purposes |
344 | 7 | ||||||
| Equity in earnings of affiliates |
8,408 | 8,536 | ||||||
| Corporate items |
1,597 | (23,719 | ) | |||||
| Other(1) |
6,418 | 6,728 | ||||||
|
|
|
|
|
|||||
| Total |
¥ | 17,325 | ¥ | (24,466 | ) | |||
|
|
|
|
|
|||||
| (1) | Includes the impact of Nomura’s own creditworthiness. |
The table below presents reconciliations of the combined business segments’ results included in the preceding table to Nomura’s reported Net revenue, Non-interest expenses and Income before income taxes in the consolidated statements of income.
| Millions of yen | ||||||||
| Six months ended September 30 | ||||||||
| 2017 | 2018 | |||||||
| Net revenue |
¥ | 709,581 | ¥ | 553,983 | ||||
| Unrealized gain (loss) on investments in equity securities held for operating purposes |
2,735 | 936 | ||||||
|
|
|
|
|
|||||
| Consolidated net revenue |
¥ | 712,316 | ¥ | 554,919 | ||||
|
|
|
|
|
|||||
| Non-interest expenses |
¥ | 551,834 | ¥ | 540,809 | ||||
| Unrealized gain (loss) on investments in equity securities held for operating purposes |
— | — | ||||||
|
|
|
|
|
|||||
| Consolidated non-interest expenses |
¥ | 551,834 | ¥ | 540,809 | ||||
|
|
|
|
|
|||||
| Income before income taxes |
¥ | 157,747 | ¥ | 13,174 | ||||
| Unrealized gain (loss) on investments in equity securities held for operating purposes |
2,735 | 936 | ||||||
|
|
|
|
|
|||||
| Consolidated income before income taxes |
¥ | 160,482 | ¥ | 14,110 | ||||
|
|
|
|
|
|||||
| Millions of yen | ||||||||
| Three months ended September 30 | ||||||||
| 2017 | 2018 | |||||||
| Net revenue |
¥ | 348,777 | ¥ | 284,033 | ||||
| Unrealized gain (loss) on investments in equity securities held for operating purposes |
2,716 | (1,111 | ) | |||||
|
|
|
|
|
|||||
| Consolidated net revenue |
¥ | 351,493 | ¥ | 282,922 | ||||
|
|
|
|
|
|||||
| Non-interest expenses |
¥ | 268,454 | ¥ | 282,455 | ||||
| Unrealized gain (loss) on investments in equity securities held for operating purposes |
— | — | ||||||
|
|
|
|
|
|||||
| Consolidated non-interest expenses |
¥ | 268,454 | ¥ | 282,455 | ||||
|
|
|
|
|
|||||
| Income before income taxes |
¥ | 80,323 | ¥ | 1,578 | ||||
| Unrealized gain (loss) on investments in equity securities held for operating purposes |
2,716 | (1,111 | ) | |||||
|
|
|
|
|
|||||
| Consolidated income before income taxes |
¥ | 83,039 | ¥ | 467 | ||||
|
|
|
|
|
|||||
F-93
Table of Contents
Notes to the Interim Consolidated Financial Statements—(Continued) (UNAUDITED)
Geographic information—
Nomura’s identifiable assets, revenues and expenses are generally allocated based on the country of domicile of the legal entity providing the service. However, because of the integration of the global capital markets and the corresponding global nature of Nomura’s activities and services, it is not always possible to make a precise separation by location. As a result, various assumptions, which are consistent among years, have been made in presenting the following geographic data.
The table below presents a geographic allocation of Net revenue and Income (loss) before income taxes from operations by geographic areas, and long-lived assets associated with Nomura’s operations. Net revenue in “Americas” and “Europe” substantially represents Nomura’s operations in the U.S. and the U.K., respectively. Net revenue and Long-lived assets have been allocated based on transactions with external customers while Income (loss) before income taxes have been allocated based on the inclusion of intersegment transactions.
| Millions of yen | ||||||||
| Six months ended September 30 | ||||||||
| 2017 | 2018 | |||||||
| Net revenue(1): |
||||||||
| Americas |
¥ | 120,012 | ¥ | 95,033 | ||||
| Europe |
91,922 | 69,801 | ||||||
| Asia and Oceania |
32,344 | 19,916 | ||||||
|
|
|
|
|
|||||
| Subtotal |
244,278 | 184,750 | ||||||
| Japan |
468,038 | 370,169 | ||||||
|
|
|
|
|
|||||
| Consolidated |
¥ | 712,316 | ¥ | 554,919 | ||||
|
|
|
|
|
|||||
| Income (loss) before income taxes: |
||||||||
| Americas |
¥ | 6,414 | ¥ | (23,260 | ) | |||
| Europe |
891 | (16,799 | ) | |||||
| Asia and Oceania |
9,012 | 201 | ||||||
|
|
|
|
|
|||||
| Subtotal |
16,317 | (39,858 | ) | |||||
| Japan |
144,165 | 53,968 | ||||||
|
|
|
|
|
|||||
| Consolidated |
¥ | 160,482 | ¥ | 14,110 | ||||
|
|
|
|
|
|||||
| Millions of yen | ||||||||
| Three months ended September 30 | ||||||||
| 2017 | 2018 | |||||||
| Net revenue(1): |
||||||||
| Americas |
¥ | 54,250 | ¥ | 41,931 | ||||
| Europe |
47,991 | 34,181 | ||||||
| Asia and Oceania |
15,262 | 10,423 | ||||||
|
|
|
|
|
|||||
| Subtotal |
117,503 | 86,535 | ||||||
| Japan |
233,990 | 196,387 | ||||||
|
|
|
|
|
|||||
| Consolidated |
¥ | 351,493 | ¥ | 282,922 | ||||
|
|
|
|
|
|||||
| Income (loss) before income taxes: |
||||||||
| Americas |
¥ | (1,460 | ) | ¥ | (21,576 | ) | ||
| Europe |
(1,354 | ) | (11,634 | ) | ||||
| Asia and Oceania |
3,665 | 1,033 | ||||||
|
|
|
|
|
|||||
| Subtotal |
851 | (32,177 | ) | |||||
| Japan |
82,188 | 32,644 | ||||||
|
|
|
|
|
|||||
| Consolidated |
¥ | 83,039 | ¥ | 467 | ||||
|
|
|
|
|
|||||
| (1) | There is no revenue derived from transactions with a single major external customer. |
F-94
Table of Contents
Notes to the Interim Consolidated Financial Statements—(Continued) (UNAUDITED)
| Millions of yen | ||||||||
| March 31, 2018 | September 30, 2018 | |||||||
| Long-lived assets: |
||||||||
| Americas |
¥ | 117,323 | ¥ | 124,270 | ||||
| Europe |
67,010 | 68,250 | ||||||
| Asia and Oceania |
8,613 | 11,766 | ||||||
|
|
|
|
|
|||||
| Subtotal |
192,946 | 204,286 | ||||||
| Japan |
231,003 | 224,187 | ||||||
|
|
|
|
|
|||||
| Consolidated |
¥ | 423,949 | ¥ | 428,473 | ||||
|
|
|
|
|
|||||
17. Supplementary subsidiary guarantee information required under SEC rules:
The Company provides several guarantees of debt of its subsidiaries. The Company has fully and unconditionally guaranteed the securities issued by Nomura America Finance LLC, which is an indirect, wholly owned finance subsidiary of the Company.
18. Subsequent events:
On November 26, 2018, the Company’s Executive Management Board resolved to cancel a part of its own shares, pursuant to the company’s articles of incorporation set out in accordance with Article 178 of the Companies Act of Japan as follows:
(a) type of shares to be cancelled is the Company’s common shares, (b) total number of shares to be cancelled is 150,000,000 shares (4.1 percent of outstanding shares) and (c) the scheduled cancellation date is on December 17, 2018.
F-95
Table of Contents
Report of Independent Registered Public Accounting Firm
To the Shareholders and Board of Directors of
Nomura Holdings, Inc.
Results of Review of Interim Financial Statements
We have reviewed the accompanying consolidated balance sheet of Nomura Holdings, Inc. (the “Company”) as of September 30, 2018, the related consolidated statements of income and comprehensive income for the three and six-month periods ended September 30, 2018 and 2017, the consolidated statements of changes in equity and cash flows for the six-month periods ended September 30, 2018 and 2017, and the related notes. Based on our reviews, we are not aware of any material modifications that should be made to the consolidated interim financial statements for them to be in conformity with U.S. generally accepted accounting principles.
We have previously audited, in accordance with the standards of the Public Company Accounting Oversight Board (United States) (“PCAOB”), the consolidated balance sheet of the Company as of March 31, 2018, the related consolidated statements of income, comprehensive income, changes in equity and cash flows for the year then ended, and the related notes (not presented herein); and in our report dated June 25, 2018, we expressed an unqualified audit opinion on those consolidated financial statements. In our opinion, the information set forth in the accompanying consolidated balance sheet as of March 31, 2018, is fairly stated, in all material respects, in relation to the (consolidated) balance sheet from which it has been derived.
Basis for Review Results
These financial statements are the responsibility of the Company’s management. We are a public accounting firm registered with the PCAOB and are required to be independent with respect to the Company in accordance with the U.S. federal securities laws and the applicable rules and regulations of the SEC and the PCAOB. We conducted our review in accordance with the standards of the PCAOB. A review of interim financial statements consists principally of applying analytical procedures and making inquiries of persons responsible for financial and accounting matters. It is substantially less in scope than an audit conducted in accordance with the standards of the PCAOB, the objective of which is the expression of an opinion regarding the financial statements taken as a whole. Accordingly, we do not express such an opinion.
/s/ Ernst & Young ShinNihon LLC
Tokyo, Japan
December 14, 2018
F-96
Table of Contents
December 14, 2018
The Shareholders and Board of Directors of
Nomura Holdings, Inc.
We are aware of the incorporation by reference in the Registration Statements (Form F-3 No. 333-209596 and Form S-8 No. 333-187585, No. 333-195004, No. 333-203049, No. 333-210471, No. 333-214267, No. 333-221128, No. 333-228585 and No. 333-228586) and related Prospectus of Nomura Holdings, Inc. of our report dated December 14, 2018 relating to the unaudited interim consolidated financial statements of Nomura Holdings, Inc. as of September 30, 2018 and for the quarters ended September 30, 2018 that are included in its Form 6-K dated December 14, 2018.
/s/ Ernst & Young ShinNihon LLC
Serious News for Serious Traders! Try StreetInsider.com Premium Free!
You May Also Be Interested In
- Nova's Portfolio Selected by Gate-All-Around Manufacturers
- AZZ, Inc. (AZZ) Announces Proposed 4M Share Offering
Create E-mail Alert Related Categories
SEC FilingsRelated Entities
NomuraSign up for StreetInsider Free!
Receive full access to all new and archived articles, unlimited portfolio tracking, e-mail alerts, custom newswires and RSS feeds - and more!
