



Form 6-K Itau Unibanco Holding For: Nov 04
 Tweet
Tweet Share
Share E-mail
SECURITIES AND EXCHANGE COMMISSION
Washington, D.C. 20549
FORM 6-K
Report of Foreign Issuer
Pursuant to Rule 13a-16 or 15d-16 of
the Securities Exchange Act of 1934
For the month of November 2015
Commission File Number: 001-15276
Itaú Unibanco Holding S.A.
(Exact name of registrant as specified in its charter)
Itaú Unibanco Holding S.A.
(Translation of Registrant’s Name into English)
Praça Alfredo Egydio de Souza Aranha, 100-Torre Itaúsa
04344-902 São Paulo, SP, Brazil
(Address of principal executive offices)
Indicate by check mark whether the registrant files or will file annual reports under cover of Form 20-F or Form 40-F.
Form 20-F: x Form 40-F: o
Indicate by check mark if the registrant is submitting the Form 6-K in paper as permitted by Regulation S-T Rule 101(b)(1):
Yes: o No: x
Indicate by check mark if the registrant is submitting the Form 6-K in paper as permitted by Regulation S-T Rule 101(b)(7):
Yes: o No: x
Indicate by check mark whether by furnishing the information contained in this Form, the registrant is also thereby furnishing information to the Commission pursuant to Rule 12g3-2(b) under the Securities Exchange Act of 1934.
Yes: o No: x
If “Yes” is marked, indicate below the file number assigned to the registrant in connection with Rule 12g3-2(b):
82-___________________.
82-___________________.
SIGNATURES
Pursuant to the requirements of the Securities Exchange Act of 1934, the registrant has duly caused this report to be signed on its behalf by the undersigned, thereunto duly authorized.
|
Itaú Unibanco Holding S.A.
|
||||
| (Registrant) | ||||
| Date: November 4, 2015 | By: | /s/ Marcelo Kopel | ||
| Name: | Marcelo Kopel | |||
| Title: | Investor Relations Officer | |||
| By: | /s/ Eduardo Mazzilli de Vassimon | |||
| Name: | Eduardo Mazzilli de Vassimon | |||
| Title: | Chief Financial Officer | |||
EXHIBIT INDEX
|
99.1
|
Announcement to the Market – Itaú Unibanco Holding S.A. – 2015 Third Quarter Results
|
Subject: Itaú Unibanco Holding S.A.
3rd quarter of 2015 Results
Announcement to the Market
Itaú Unibanco Holding S.A. (“Company”) announces to its shareholders and the market at large that the Complete Financial Statements for the first nine months of fiscal year 2015 and the Management’s Discussion and Analysis for the 3rd Quarter 2015 are already available from the Investor Relations website (www.itau.com.br/investor‐relations).
Please find below the Executive Summary for the 3rd Quarter 2015.
A conference call will be held with research analysts on Wednesday, November 04, in Portuguese at 10:30 a.m. (Brasília time) and in English at 12:00 p.m. (Brasília time).
São Paulo – November 03, 2015
MARCELO KOPEL
Investor Relations Officer
|
Management Discussion & Analysis
|
Executive Summary
|
 |
Itaú Unibanco Holding S.A. (Itaú Unibanco) information and financial indicators are presented below.
Highlights
|
In R$ millions (except where indicated), end of period
|
3Q15
|
2Q15
|
3Q14
|
9M15
|
9M14
|
||
|
Recurring Net Income
|
6,117
|
6,134
|
5,457
|
18,059
|
14,959
|
||
|
Results
|
Net Income
|
5,945
|
5,984
|
5,404
|
17,662
|
14,722
|
|
|
Operating Revenues (1)
|
26,945
|
25,339
|
23,305
|
77,230
|
66,086
|
||
|
Managerial Financial Margin (2)
|
17,595
|
16,235
|
14,369
|
49,793
|
40,450
|
||
|
Recurring Net Income per share (R$)(3)
|
1.03
|
1.02
|
0.91
|
3.04
|
2.49
|
||
|
Net Income per share (R$)(3)
|
1.00
|
1.00
|
0.90
|
2.98
|
2.45
|
||
|
Number of Outstanding Shares at the end of period – in thousands(4)
|
5,950,089
|
5,994,053
|
6,023,456
|
5,950,089
|
6,023,456
|
||
|
Shares
|
Average price of non-voting share on the last trading day of the period (R$)(4)
|
26.21
|
31.15
|
30.92
|
26.21
|
30.92
|
|
|
Book Value per Share (R$)
|
17.37
|
16.80
|
15.07
|
17.37
|
15.07
|
||
|
Dividends and Interest on Own Capital net of taxes(5)
|
1,351
|
1,205
|
981
|
3,875
|
2,941
|
||
|
Dividends and Interest on Own Capital net of taxes (5) per share (R$)(*)
|
0.23
|
0.20
|
0.16
|
0.65
|
0.49
|
||
|
Market Capitalization(6)
|
155,952
|
186,742
|
186,234
|
155,952
|
186,234
|
||
|
Market Capitalization(6) (US$ millions)
|
39,254
|
60,181
|
75,983
|
39,254
|
75,983
|
||
|
Recurring Return on Average Equity – Annualized(7)
|
24.0%
|
24.8%
|
24.7%
|
24.5%
|
23.7%
|
||
|
Return on Average Equity – Annualized (7)
|
23.3%
|
24.2%
|
24.5%
|
23.9%
|
23.3%
|
||
|
Recurring Return on Average Assets – Annualized(8)
|
1.9%
|
1.9%
|
1.9%
|
1.9%
|
1.8%
|
||
|
Return on Average Assets – Annualized (8)
|
1.9%
|
1.9%
|
1.9%
|
1.9%
|
1.8%
|
||
|
Solvency Ratio - Prudential Conglomerate (BIS Ratio)(9)
|
16.1%
|
17.2%
|
16.6%
|
16.1%
|
16.6%
|
||
|
Common Equity Tier I
|
12.3%
|
13.2%
|
12.1%
|
12.3%
|
12.1%
|
||
|
Estimated BIS III (Common Equity Tier I) - Full Implementation of BIS III (10)
|
12.4%
|
12.7%
|
11.6%
|
12.4%
|
11.6%
|
||
|
Performance
|
Annualized Net Interest Margin of Spread-Sensitive Operations (11)
|
10.8%
|
10.8%
|
10.2%
|
10.7%
|
10.3%
|
|
|
Annualized Net Interest Margin with Clients (11)
|
10.9%
|
10.7%
|
10.3%
|
10.7%
|
10.3%
|
||
|
Annualized Net Interest Margin of Spread-Sensitive Operations after Provision for Credit Risk (11)
|
6.9%
|
7.1%
|
7.1%
|
6.9%
|
6.2%
|
||
|
Annualized Net Interest Margin with Clients after Provision for Credit Risk (11)
|
7.4%
|
7.4%
|
7.6%
|
7.3%
|
6.6%
|
||
|
Nonperforming Loans Index (NPL over 90 days)
|
3.3%
|
3.3%
|
3.2%
|
3.3%
|
3.2%
|
||
|
Nonperforming Loans Index (NPL 15 to 90 days)
|
3.0%
|
3.0%
|
2.6%
|
3.0%
|
2.6%
|
||
|
Coverage Ratio (Provision for Loan Losses/NPL over 90 days)
|
214%
|
187%
|
181%
|
214%
|
181%
|
||
|
Efficiency Ratio (ER) (12)
|
44.2%
|
42.9%
|
46.0%
|
43.5%
|
47.2%
|
||
|
Risk-Adjusted Efficiency Ratio (RAER) (12)
|
63.1%
|
61.8%
|
61.8%
|
62.5%
|
63.4%
|
||
|
Total Assets
|
1,322,693
|
1,230,510
|
1,157,557
|
||||
|
Total Loan Portfolio, including Sureties and Endorsements
|
552,342
|
531,706
|
503,345
|
||||
|
Loan Portfolio (A)
|
477,198
|
457,463
|
428,832
|
||||
|
Balance
|
Sureties, Endorsements and Guarantees
|
75,143
|
74,243
|
74,514
|
|||
|
Sheet
|
Deposits + Debentures + Securities + Borrowings and Onlending (B) (13)
|
618,839
|
562,775
|
560,207
|
|||
|
Loan Portfolio/Funding (A/B)
|
77.1%
|
81.3%
|
76.5%
|
||||
|
Stockholders’ Equity
|
103,353
|
100,711
|
90,776
|
||||
|
Assets Under Administration
|
749,755
|
709,111
|
646,247
|
||||
|
Total Number of Employees
|
91,437
|
91,968
|
94,164
|
||||
|
Other
|
Brazil
|
84,490
|
85,028
|
87,132
|
|||
|
Abroad
|
6,947
|
6,940
|
7,032
|
||||
|
Branches and CSBs – Client Service Branches
|
5,012
|
5,003
|
5,042
|
||||
|
ATM – Automated Teller Machines (14)
|
26,454
|
26,709
|
27,960
|
||||
|
EMBI Brazil Risk
|
447
|
302
|
239
|
447
|
239
|
||
|
CDI rate – In the Period (%)
|
3.4%
|
3.1%
|
2.7%
|
9.6%
|
7.8%
|
||
|
Dollar Exchange Rate – Quotation in R$
|
3.9729
|
3.1026
|
2.4510
|
3.9729
|
2.4510
|
||
|
Indicators
|
Dollar Exchange Rate – Change in the Period (%)
|
28.1%
|
-3.3%
|
11.3%
|
49.6%
|
4.6%
|
|
|
Euro Exchange Rate – Quotation in R$
|
4.4349
|
3.4603
|
3.0954
|
4.4349
|
3.0954
|
||
|
Euro Exchange Rate – Change in the Period (%)
|
28.2%
|
0.4%
|
2.7%
|
37.4%
|
-4.2%
|
||
|
IGP-M – In the Period (%)
|
1.9%
|
2.3%
|
-0.7%
|
6.3%
|
1.8%
|
||
(*) The number of outstanding shares was adjusted to reflect the share bonus of 10% granted on June 05, 2014 and July 17, 2015.
Note: (1) Operating Revenues are the sum of Managerial Financial Margin, Banking Service Fees and Income from Banking Charges, Other Operating Income and Result from Insurance, Pension Plan and Premium Bonds Operations Before Retained Claims and Selling Expenses; (2) Described on pages 15 to 17; (3) Calculated based on the weighted average number of outstanding shares; (4) The number of outstanding shares was adjusted to reflect the share bonus of 10% granted on June 05, 2014 and July 17, 2015; (5) IOC – Interest on Capital. Declared amounts paid/accrued; (6) Total number of outstanding shares (common and non-voting shares) multiplied by the average price of non-voting share on the last trading day in the period; (7) Annualized Return was calculated by dividing Net Income by Average Stockholders’ Equity. The quotient of this division was multiplied by the number of periods in the year to derive the annualized rate. The calculation bases of returns were adjusted by the amount of dividends that has not yet been approved at shareholders’ or Board meetings, proposed after the balance sheet closing date; (8) Return was calculated by dividing Net Income by Average Assets. The quotient of this division was multiplied by the number of periods in the year to derive the annualized rate; (9) Up to the fourth quarter of 2014, this ratio was calculated based on the financial conglomerate; (10) Takes into consideration the use of tax credit; (11) Does not include financial margin with the market. See details on page 17; (12) For further details on the calculation methodology of both Efficiency and Risk-Adjusted Efficiency ratios, please refer to page 34; (13) As described on page 38; (14) Includes ESBs (electronic service branches) and service points at third parties’ establishments.
|
Itaú Unibanco Holding S.A.
|
05
|
|
Management Discussion & Analysis
|
Executive Summary
|
|
Net Income and Recurring Net Income
Our recurring net income totaled R$6,117 million in the third quarter of 2015 as a result of the elimination of non-recurring events, which are presented in the table below, from net income of R$5,945 million for the period.
Non-Recurring Events Net of Tax Effects
|
In RS millions
|
3Q15
|
2Q15
|
3Q14
|
9M15
|
9M14
|
|
Recurring Net Income
|
6,117
|
6,134
|
5,457
|
18,059
|
14,959
|
|
Non-Recurring Events
|
(172)
|
(150)
|
(53)
|
(398)
|
(237)
|
|
Social Contribution Rate Increase (a)
|
3,988
|
-
|
-
|
3,988
|
¬
|
|
Complementary Provision for Loan Losses (b)
|
(2,793)
|
-
|
-
|
(2,793)
|
-
|
|
Financial Leasing Accounting Change (c )
|
(520)
|
-
|
-
|
(520)
|
-
|
|
Contingencies Provision (d)
|
(540)
|
(86)
|
(15)
|
(668)
|
(88)
|
|
Pension Fund (e)
|
(130)
|
-
|
-
|
(130)
|
-
|
|
Goodwill Amortization (f)
|
(34)
|
(35)
|
(38)
|
(130)
|
(123)
|
|
Program for Settlement or Installment Payment of Taxes (g)
|
(1)
|
14
|
37
|
41
|
37
|
|
Impairment (h)
|
-
|
(43)
|
-
|
(43)
|
-
|
|
Criteria Adjustment - Credicard (i)
|
-
|
-
|
(37)
|
-
|
(37)
|
|
Porto Seguro (j)
|
-
|
-
|
-
|
-
|
(60)
|
|
IRB (k)
|
-
|
-
|
-
|
-
|
33
|
|
Other
|
(143)
|
-
|
-
|
(143)
|
-
|
|
Net Income
|
5,945
|
5,984
|
5,404
|
17,662
|
14,722
|
Note: Impacts of the non-recurring events, described above, are net of tax effects – further details are presented in Note 22-K of the Financial Statements.
Non-Recurring Events
(a) Social Contribution Rate Increase: Effect on the balance of the social contribution tax credit resulting from the rate increase from 15% to 20% as established by Provisional Measure No. 675/15 of May 2015 (converted into Law No. 13,169/15 in October 2015).
(b) Complementary Provision for Loan Losses: Complementary provision for loan losses to the minimum required by Resolution No. 2,682/99 of the National Monetary Council mainly due to a more challenging economic environment.
(c) Financial Leasing Accounting Change: Regarding financial leasing contracts related to new Technology Center implementation.
(d) Contingencies Provision: Recognition of provisions for tax and social security lawsuits and losses arising from economic plans that were in effect in Brazil during the 1980’s.
(e) Pension Fund: Provision to settle the surplus of the defined contribution pension fund in accordance with the regulation.
(f) Goodwill Amortization: Effect of the goodwill amortization generated by acquisitions made by the Conglomerate.
(g) Program for the Settlement or Installment Payment of Taxes: Effects of our adherence to the Program for the Settlement or Installment Payment of Federal and Municipal Taxes.
(h) Impairment: Adjustment in the carrying amount of assets in order to reflect its fair value.
(i) Criteria Adjustment - Credicard: Criteria adjustment for provisions recognition for loan losses resulting from Credicard acquisition.
(j) Porto Seguro: Effect of the favorable decision, by the Federal Supreme Court (STF), on the legality of the COFINS tax on this type of operation in proportion to our equity in the company, in addition to the provision for losses on tax losses in the first quarter of 2014.
(k) IRB: In 2014, favorable decision effect on the increase of the PIS/COFINS calculation basis of IRB Brasil Resseguros S.A.
Managerial Income Statement
We apply consolidation criteria for the managerial results that affect only the breakdown of accounts and, therefore, do not affect net income. These effects are shown in the table on the following page (“Accounting and Managerial Statements Reconciliation”). Additionally, we adjusted the tax effects of the hedges of investments abroad - which were originally accounted for as tax expenses (PIS and COFINS) and income tax and social contribution on net income and were reclassified to the financial margin – and the non-recurring events.
Our strategy for the foreign exchange risk management of the capital invested abroad is aimed at mitigating, through financial instruments, the effects resulting from foreign exchange variations and takes into consideration the impact of all tax effects. In the third quarter of 2015, the Brazilian real depreciated 28.1% against the U.S. dollar and 28.2% against the Euro, compared with appreciation of 3.3% and depreciation of 0.4%, respectively, in the previous quarter.
|
Itaú Unibanco Holding S.A.
|
06
|
|
Management Discussion & Analysis
|
Executive Summary
|
|
Accounting and Managerial Income Statements reconciliation for the past two quarters is presented below.
Accounting and Managerial Statements Reconciliation | 3rd Quarter of 2015
|
In R$ millions
|
Accounting
|
Non-recurring
Events
|
Tax Effect of Hedge
|
Managerial
Reclassifications
|
Managerial
|
|
Operating Revenues
|
15,265
|
1,342
|
10,653
|
(315)
|
26,945
|
|
Managerial Financial Margin
|
5,545
|
1,342
|
10,653
|
55
|
17,595
|
|
Financial Margin with Clients
|
13,922
|
1,342
|
-
|
55
|
15,319
|
|
Financial Margin with the Market
|
(8,378)
|
-
|
10,653
|
-
|
2,276
|
|
Banking Services Fees and Income from Banking Charges
|
7,681
|
-
|
-
|
(599)
|
7,082
|
|
Result from Insurance, Pension Plan and Premium Bonds Operations Before Retained Claims and Selling Expenses
|
1,700
|
-
|
-
|
568
|
2,268
|
|
Other Operating Income
|
177
|
(1)
|
-
|
(176)
|
-
|
|
Equity in Earnings of Affiliates and Other Investments
|
153
|
-
|
-
|
(153)
|
-
|
|
Non-operating Income
|
9
|
1
|
-
|
(10)
|
-
|
|
Result from Loan Losses
|
(9,262)
|
4,629
|
-
|
(20)
|
(4,653)
|
|
Provision for Loan Losses
|
(10,357)
|
4,629
|
-
|
(20)
|
(5,747)
|
|
Recovery of Loans Written Off as Losses
|
1,094
|
-
|
-
|
-
|
1,094
|
|
Retained Claims
|
(437)
|
-
|
-
|
-
|
(437)
|
|
Other Operating Income/(Expenses)
|
(12,491)
|
544
|
(1,063)
|
263
|
(12,748)
|
|
Non-interest Expenses
|
(11,764)
|
556
|
-
|
302
|
(10,906)
|
|
Tax Expenses for ISS, PIS, Cofins and Other Taxes
|
(459)
|
(12)
|
(1,063)
|
(39)
|
(1,574)
|
|
Insurance Selling Expenses
|
(268)
|
-
|
-
|
-
|
(268)
|
|
Income before Tax and Profit Sharing
|
(6,926)
|
6,515
|
9,590
|
(72)
|
9,108
|
|
Income Tax and Social Contribution
|
13,010
|
(6,343)
|
(9,590)
|
12
|
(2,911)
|
|
Profit Sharing
|
(60)
|
-
|
-
|
60
|
-
|
|
Minority Interests
|
(79)
|
-
|
-
|
-
|
(79)
|
|
Net Income
|
5,945
|
172
|
-
|
-
|
6,117
|
Accounting and Managerial Statements Reconciliation | 2nd Quarter of 2015
|
In R$ millions
|
Accounting
|
Non-recurring
Events
|
Tax Effect of Hedge
|
Managerial
Reclassifications
|
Managerial
|
|
Operating Revenues
|
26,494
|
98
|
(889)
|
(364)
|
25,339
|
|
Managerial Financial Margin
|
17,002
|
122
|
(889)
|
0
|
16,235
|
|
Financial Margin with Clients
|
14,552
|
122
|
-
|
0
|
14,673
|
|
Financial Margin with the Market
|
2,451
|
-
|
(889)
|
-
|
1,561
|
|
Banking Services Fees and Income from Banking Charges
|
7,511
|
-
|
-
|
(604)
|
6,906
|
|
Result from Insurance, Pension Plan and Premium Bonds Operations Before Retained Claims and Selling Expenses
|
1,648
|
-
|
-
|
549
|
2,198
|
|
Other Operating Income
|
155
|
(24)
|
-
|
(131)
|
-
|
|
Equity in Earnings of Affiliates and Other Investments
|
165
|
-
|
-
|
(165)
|
-
|
|
Non-operating Income
|
13
|
-
|
-
|
(13)
|
-
|
|
Result from Loan Losses
|
(4,361)
|
-
|
-
|
(25)
|
(4,387)
|
|
Provision for Loan Losses
|
(5,494)
|
-
|
-
|
(25)
|
(5,520)
|
|
Recovery of Loans Written Off as Losses
|
1,133
|
-
|
-
|
-
|
1,133
|
|
Retained Claims
|
(385)
|
-
|
-
|
-
|
(385)
|
|
Other Operating Income/(Expenses)
|
(12,292)
|
122
|
170
|
307
|
(11,692)
|
|
Non-interest Expenses
|
(10,479)
|
122
|
-
|
377
|
(9,979)
|
|
Tax Expenses for ISS, PIS, Cofins and Other Taxes
|
(1,545)
|
-
|
170
|
(70)
|
(1,445)
|
|
Insurance Selling Expenses
|
(268)
|
-
|
-
|
-
|
(268)
|
|
Income before Tax and Profit Sharing
|
9,456
|
220
|
(719)
|
(83)
|
8,875
|
|
Income Tax and Social Contribution
|
(3,321)
|
(70)
|
719
|
11
|
(2,661)
|
|
Profit Sharing
|
(72)
|
-
|
-
|
72
|
-
|
|
Minority Interests
|
(79)
|
-
|
-
|
-
|
(79)
|
|
Net Income
|
5,984
|
150
|
-
|
-
|
6,134
|
|
Itaú Unibanco Holding S.A.
|
07
|
|
Management Discussion & Analysis
|
Executive Summary
|
|
We present below the income statement from a standpoint that highlights Operating Revenues, which are composed by the sum of the main accounts in which revenues from banking, insurance, pension plan and premium bonds operations are recorded.
Income Statement | Operating Revenues Perspective
|
In R$ millions
|
3Q15
|
2Q15
|
change
|
3Q14
|
change
|
9M15
|
9M14
|
change
|
|||
|
Operating Revenues
|
26,945
|
25,339
|
1,607
|
6.3%
|
23,305
|
3,640
|
15.6%
|
77,230
|
66,086
|
11,144
|
16.9%
|
|
Managerial Financial Margin
|
17,595
|
16,235
|
1,360
|
8.4%
|
14,369
|
3,226
|
22.4%
|
49,793
|
40,450
|
9,343
|
23.1%
|
|
Financial Margin with Clients
|
15,319
|
14,673
|
646
|
4.4%
|
13,287
|
2,033
|
15.3%
|
44,085
|
37,873
|
6,212
|
16.4%
|
|
Financial Margin with the Market
|
2,276
|
1,561
|
714
|
45.7%
|
1,083
|
1,193
|
110.2%
|
5,708
|
2,577
|
3,131
|
121.5%
|
|
Banking Services Fees and Income from Banking Charges
|
7,082
|
6,906
|
176
|
2.5%
|
6,558
|
525
|
8.0%
|
20,855
|
18,952
|
1,903
|
10.0%
|
|
Result from Insurance, Pension Plan and Premium Bonds Operations Before Retained Claims and Selling Expenses
|
2,268
|
2,198
|
71
|
3.2%
|
2,379
|
(110)
|
-4.6%
|
6,582
|
6,683
|
(101)
|
-1.5%
|
|
Result from Loan Losses
|
(4,653)
|
(4,387)
|
(266)
|
6.1%
|
(3,343)
|
(1,310)
|
39.2%
|
(13,495)
|
(9,739)
|
(3,756)
|
38.6%
|
|
Provision for Loan Losses
|
(5,747)
|
(5,520)
|
(227)
|
4.1%
|
(4,741)
|
(1,006)
|
21.2%
|
(16,782)
|
(13,457)
|
(3,325)
|
24.7%
|
|
Recovery of Loans Written Off as Losses
|
1,094
|
1,133
|
(39)
|
-3.4%
|
1,397
|
(303)
|
-21.7%
|
3,288
|
3,719
|
(431)
|
-11.6%
|
|
Retained Claims
|
(437)
|
(385)
|
(52)
|
13.5%
|
(559)
|
122
|
-21.8%
|
(1,191)
|
(1,526)
|
335
|
-22.0%
|
|
Operating Margin
|
21,855
|
20,567
|
1,288
|
6.3%
|
19,403
|
2,452
|
12.6%
|
62,545
|
54,822
|
7,723
|
14.1%
|
|
Other Operating Income/(Expenses)
|
(12,748)
|
(11,692)
|
(1,056)
|
9.0%
|
(11,292)
|
(1,456)
|
12.9%
|
(36,043)
|
(32,805)
|
(3,237)
|
9.9%
|
|
Non-interest Expenses
|
(10,906)
|
(9,979)
|
(927)
|
9.3%
|
(9,753)
|
(1,153)
|
11.8%
|
(30,767)
|
(28,369)
|
(2,397)
|
8.5%
|
|
Tax Expenses for ISS, PIS, Cofins and Other Taxes
|
(1,574)
|
(1,445)
|
(129)
|
8.9%
|
(1,254)
|
(319)
|
25.5%
|
(4,474)
|
(3,617)
|
(857)
|
23.7%
|
|
Insurance Selling Expenses
|
(268)
|
(268)
|
0
|
-0.1%
|
(284)
|
16
|
-5.7%
|
(802)
|
(819)
|
17
|
-2.1%
|
|
Income before Tax and Minority Interests
|
9,108
|
8,875
|
233
|
2.6%
|
8,112
|
996
|
12.3%
|
26,502
|
22,016
|
4,486
|
20.4%
|
|
Income Tax and Social Contribution
|
(2,911)
|
(2,661)
|
(250)
|
9.4%
|
(2,571)
|
(340)
|
13.2%
|
(8,179)
|
(6,832)
|
(1,348)
|
19.7%
|
|
Minority Interests in Subsidiaries
|
(79)
|
(79)
|
0
|
-0.4%
|
(84)
|
5
|
-5.7%
|
(264)
|
(226)
|
(38)
|
16.7%
|
|
Recurring Net Income
|
6,117
|
6,134
|
(17)
|
-0.3%
|
5,457
|
660
|
12.1%
|
18,059
|
14,959
|
3,101
|
20.7%
|
We present below the income statement from the standpoint that highlights the Managerial Financial Margin.
Income Statement | Managerial Financial Margin Perspective
|
In R$ millions
|
3Q15
|
2Q15
|
change
|
3Q14
|
change
|
9M15
|
9M14
|
change
|
|||
|
Managerial Financial Margin
|
17,595
|
16,235
|
1,360
|
8.4%
|
14,369
|
3,226
|
22.4%
|
49,793
|
40,450
|
9,343
|
23.1%
|
|
Financial Margin with Clients
|
15,319
|
14,673
|
646
|
4.4%
|
13,287
|
2,033
|
15.3%
|
44,085
|
37,873
|
6,212
|
16.4%
|
|
Financial Margin with the Market
|
2,276
|
1,561
|
714
|
45.7%
|
1,083
|
1,193
|
110.2%
|
5,708
|
2,577
|
3,131
|
121.5%
|
|
Result from Loan Losses
|
(4,653)
|
(4,387)
|
(266)
|
6.1%
|
(3,343)
|
(1,310)
|
39.2%
|
(13,495)
|
(9,739)
|
(3,756)
|
38.6%
|
|
Provision for Loan Losses
|
(5,747)
|
(5,520)
|
(227)
|
4.1%
|
(4,741)
|
(1,006)
|
21.2%
|
(16,782)
|
(13,457)
|
(3,325)
|
24.7%
|
|
Recovery of Loans Written Off as Losses
|
1,094
|
1,133
|
(39)
|
-3.4%
|
1,397
|
(303)
|
-21.7%
|
3,288
|
3,719
|
(431)
|
-11.6%
|
|
Net Result from Financial Operations
|
12,942
|
11,848
|
1,094
|
9.2%
|
11,026
|
1,916
|
17.4%
|
36,298
|
30,711
|
5,587
|
18.2%
|
|
Other Operating Income/(Expenses)
|
(3,835)
|
(2,973)
|
(861)
|
29.0%
|
(2,914)
|
(920)
|
31.6%
|
(9,796)
|
(8,695)
|
(1,101)
|
12.7%
|
|
Banking Services Fees and Income from Banking Charges
|
7,082
|
6,906
|
176
|
2.5%
|
6,558
|
525
|
8.0%
|
20,855
|
18,952
|
1,903
|
10.0%
|
|
Result from Insurance, Pension Plan and Premium Bonds Operations
|
1,563
|
1,544
|
19
|
1.2%
|
1,536
|
27
|
1.8%
|
4,590
|
4,339
|
251
|
5.8%
|
|
Non-interest Expenses
|
(10,906)
|
(9,979)
|
(927)
|
9.3%
|
(9,753)
|
(1,153)
|
11.8%
|
(30,767)
|
(28,369)
|
(2,397)
|
8.5%
|
|
Tax Expenses for ISS, PIS, Cofins and Other Taxes
|
(1,574)
|
(1,445)
|
(129)
|
8.9%
|
(1,254)
|
(319)
|
25.5%
|
(4,474)
|
(3,617)
|
(857)
|
23.7%
|
|
Income before Tax and Minority Interests
|
9,108
|
8,875
|
233
|
2.6%
|
8,112
|
996
|
12.3%
|
26,502
|
22,016
|
4,486
|
20.4%
|
|
Income Tax and Social Contribution
|
(2,911)
|
(2,661)
|
(250)
|
9.4%
|
(2,571)
|
(340)
|
13.2%
|
(8,179)
|
(6,832)
|
(1,348)
|
19.7%
|
|
Minority Interests in Subsidiaries
|
(79)
|
(79)
|
0
|
-0.4%
|
(84)
|
5
|
-5.7%
|
(264)
|
(226)
|
(38)
|
16.7%
|
|
Recurring Net Income
|
6,117
|
6,134
|
(17)
|
-0.3%
|
5,457
|
660
|
12.1%
|
18,059
|
14,959
|
3,101
|
20.7%
|
|
Itaú Unibanco Holding S.A.
|
08
|
|
Management Discussion & Analysis
|
Executive Summary
|
|
Net Income
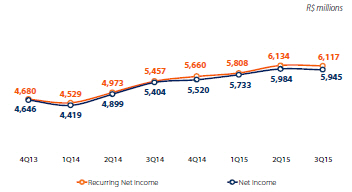
The recurring net income for the third quarter of 2015 amounted to R$6,117 million, representing a decrease of 0.3% compared to the previous quarter and an increase of 12.1% from the same period of the previous year. The recurring net income per share reached R$1.03, up 1.0% from the previous quarter due to the repurchase of 46,455,020 shares for treasury during the quarter, which reduced the number of outstanding shares.
Compared to the previous quarter, the highlights were the increases of 45.7% in the financial margin with the market, of 4.4% in our margin with clients and of 2.5% in banking service fees and banking charges. These increases were partially offset by the increase of 4.1% in our provision for loan losses and of 9.3% in non-interest expenses, particularly personnel expenses due to the adjustment of salaries and benefits related to the collective negotiation agreement.
In the first nine months of 2015, recurring net income was R$18,059 million, 20.7% higher when compared to the same period of 2014. The increase in net income was mainly due to an increase of 16.9% in operating revenues, partially offset by the increases of 24.7% in the provision for loan losses and of 8.5% in non-interest expenses.
Return on Average Equity
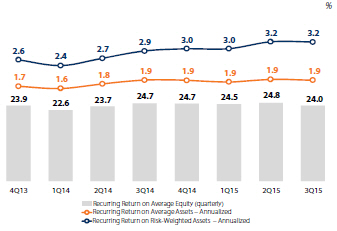
The annualized recurring return on average equity reached 24.0% in the third quarter of 2015. Stockholders’ equity reached R$103.3 billion, increasing 2.6% from the previous quarter and 13.9% from the same period of the previous year.
In the third quarter of 2015, the annualized recurring return on average assets reached 1.9%, unchanged when compared to the previous quarter. Annualized recurring return on risk-weighted assets reached 3.2%, also unchanged when compared to the previous quarter.
Operating Revenues
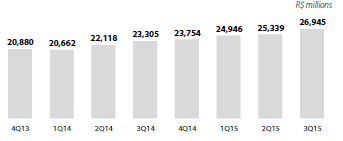
In the third quarter of 2015, operating revenues, representing revenues from banking, insurance, pension plan and premium bond operations, totaled R$26,945 million, 6.3% and 15.6% higher than in the previous quarter and in the same period of the previous year, respectively. The main components of operating revenues and other items of income statement are presented below.
Managerial Financial Margin
The managerial financial margin for the third quarter of 2015 totaled R$17,595 million, R$1,360 million higher when compared to the second quarter of 2015, mainly due to the increases of R$714 million in our financial margin with the market and of R$646 million in our financial margin with clients.
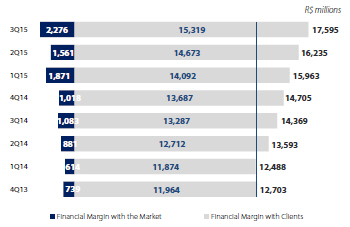
Our managerial financial margin increased R$9,343 million when compared to the first nine months of 2014. This growth is due to increases of R$6,212 million in the financial margin with clients and of R$3,131 million in the financial margin with the market.
Financial Margin of Spread-Sensitive Operations, net of the Provision from Loan Losses
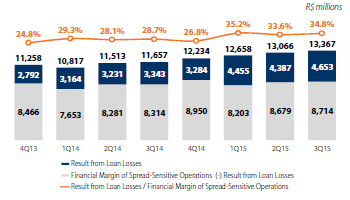
Our financial margin of spread-sensitive operations, net of the provision for loan losses and recovery of loans written off as a losses, increased 14.7% from the third quarter of 2014 and 2.3% when compared to the second quarter of 2015. The ratio of provision for loan losses, net of recovery of loans written off as losses, to the spread-sensitive operations financial margin reached 34.8% this quarter, 120 basis points higher when compared to the previous quarter.
|
Itaú Unibanco Holding S.A.
|
09
|
|
Management Discussion & Analysis
|
Executive Summary
|
|
Result from Loan Losses
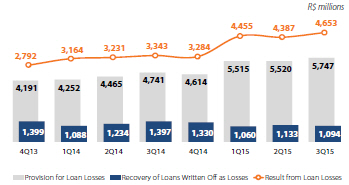
The result from loan losses grew 6.1% when compared to the previous quarter, totaling R$4,653 million in the third quarter of 2015. This increase was mainly due to an increase of 4.1% (R$227 million) in provision for loan losses and to lower revenues from recovery of loans written off as losses (R$39 million).
In the first nine months of 2015, the result from loan losses reached R$13,495 million, up 38.6% from the same period of the previous year.
Banking Services Fees and Income from Banking Charges
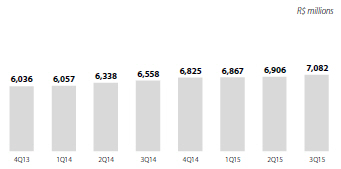
Banking service fees, including income from banking charges, increased R$176 million (2.5%) when compared to the previous quarter, totaling R$7,082 million. When compared to the first nine months of 2014, these revenues increased R$1,903 million (10.0%).
Result from Insurance, Pension Plan and Premium Bonds
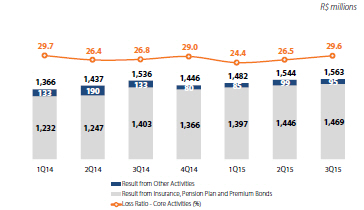
In the third quarter of 2015, result from insurance, pension plan and premium bonds from core activities, which consist of massmarket products related to life, property, credit, pension and premium bonds reached R$1,469 million, an increase of R$23 million from the previous quarter and of R$66 million from the third quarter of 2014. The loss ratio from core activities reached 29.6% this quarter.
Non-Interest Expenses
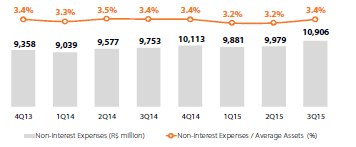
Non-interest expenses increased 9.3% in the third quarter of 2015 when compared to the second quarter of 2015. Personnel expenses increased R$662 million, mainly due to the effect of the collective negotiation agreement, whereas administrative expenses increased R$84 million in the third quarter of 2015 from the previous quarter, mainly due to higher data processing and telecommunications expenses.
When compared to the first nine months of 2014, non-interest expenses increased R$2,397 million, up 8.5% from the same period of the previous year. Excluding operations abroad expenses, the increase would have been 6.0% in the period.
Efficiency Ratio and Risk-Adjusted Efficiency Ratio (*)
(*) Calculation criteria are detailed on page 34.
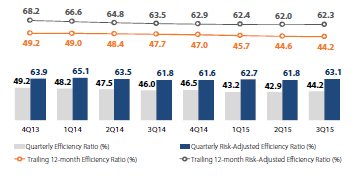
In the third quarter of 2015, efficiency ratio, according to the criteria that include all expenses except result from loan losses, reached 44.2%, an increase of 130 basis points when compared to the previous quarter, mainly due to the increase in non-interest expenses (9.3%). In the 12-month period, the efficiency ratio reached 44.2%, improving 40 basis points from the previous quarter and 350 basis points from the same period of the previous year.
In the third quarter of 2015, the risk-adjusted efficiency ratio, which also includes the result from loan losses, reached 63.1%, an increase of 130 basis points when compared to the previous quarter, due to the increase in provision for loan losses (4.1%) and the decrease in revenues from recovery of loans written off as losses (3.4%), in addition to the effects previously mentioned. In the 12-month period, the risk-adjusted efficiency ratio reached 62.3%.
|
Itaú Unibanco Holding S.A.
|
10
|
|
Management Discussion & Analysis
|
Executive Summary
|
|
Balance Sheet | Assets
|
In R$ millions, end of period
|
3Q15
|
2Q15
|
change
|
3Q14
|
change
|
|
Current and Long-term Assets
|
1,303,953
|
1,210,691
|
7.7%
|
1,139,030
|
14.5%
|
|
Cash and Cash Equivalents
|
18,138
|
18,005
|
0.7%
|
16,636
|
9.0%
|
|
Short-term Interbank Investments
|
229,677
|
192,433
|
19.4%
|
217,538
|
5.6%
|
|
Securities and Derivative Financial Instruments
|
345,844
|
334,727
|
3.3%
|
283,108
|
22.2%
|
|
Interbank and Interbranch Accounts
|
69,906
|
64,651
|
8.1%
|
68,044
|
2.7%
|
|
Loan, Lease and Other Loan Operations
|
477,198
|
457,463
|
4.3%
|
428,832
|
11.3%
|
|
(Allowance for Loan Losses)
|
(34,193)
|
(28,131)
|
21.5%
|
(25,258)
|
35.4%
|
|
Other Assets
|
197,382
|
171,543
|
15.1%
|
150,130
|
31.5%
|
|
Foreign Exchange Portfolio
|
64,209
|
65,875
|
-2.5%
|
41,047
|
56.4%
|
|
Other
|
133,173
|
105,669
|
26.0%
|
109,083
|
22.1%
|
|
Permanent Assets
|
18,740
|
19,819
|
-5.4%
|
18,527
|
1.1%
|
|
Investments
|
3,732
|
3,610
|
3.4%
|
3,434
|
8.7%
|
|
Real Estate in Use
|
7,244
|
7,379
|
-1.8%
|
7,412
|
-2.3%
|
|
Intangible Assets and Goodwill
|
7,763
|
8,831
|
-12.1%
|
7,681
|
1.1%
|
|
Total Assets
|
1,322,693
|
1,230,510
|
7.5%
|
1,157,557
|
14.3%
|
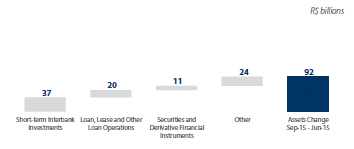
At the end of the third quarter of 2015, our assets totaled R$1.32 trillion, a growth of 7.5% (R$92.1 billion) when compared to the previous quarter. The main changes are presented below:
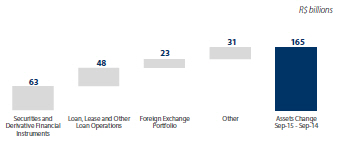
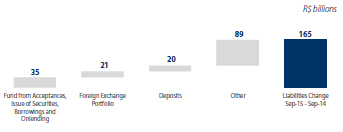
When compared to the previous year, the increase of 14.3% (R$165.1 billion) was mainly due to the increases in securities and derivative financial instruments and loan operations.
Balance Sheet | Liabilities and Equity
|
In R$ millions, end of period
|
3Q15
|
2Q15
|
change
|
3Q14
|
change
|
|
Current and Long-Term Liabilities
|
1,215,583
|
1,126,530
|
7.9%
|
1,063,139
|
14.3%
|
|
Deposits
|
300,729
|
280,443
|
7.2%
|
280,975
|
7.0%
|
|
Demand Deposits
|
57,388
|
50,540
|
13.5%
|
44,596
|
28.7%
|
|
Savings Deposits
|
111,451
|
113,974
|
-2.2%
|
113,676
|
-2.0%
|
|
Interbank Deposits
|
18,370
|
27,014
|
-32.0%
|
3,642
|
404.4%
|
|
Time Deposits
|
113,520
|
88,914
|
27.7%
|
119,062
|
-4.7%
|
|
Deposits Received under Securities Repurchase Agreements
|
317,914
|
305,300
|
4.1%
|
304,024
|
4.6%
|
|
Fund from Acceptances and Issue of Securities
|
59,478
|
52,175
|
14.0%
|
47,089
|
26.3%
|
|
Interbank and Interbranch Accounts
|
11,473
|
10,448
|
9.8%
|
9,606
|
19.4%
|
|
Borrowings and Onlendings
|
104,580
|
92,138
|
13.5%
|
81,659
|
28.1%
|
|
Derivative Financial Instruments
|
42,346
|
23,912
|
77.1%
|
16,203
|
161.3%
|
|
Technical Provisions for Insurance, Pension Plans and Premium Bonds
|
126,136
|
121,652
|
3.7%
|
112,973
|
11.7%
|
|
Other Liabilities
|
252,927
|
240,461
|
5.2%
|
210,609
|
20.1%
|
|
Subordinated Debt
|
65,910
|
59,228
|
11.3%
|
54,472
|
21.0%
|
|
Foreign Exchange Portfolio
|
63,140
|
66,429
|
-5.0%
|
41,855
|
50.9%
|
|
Other
|
123,877
|
114,804
|
7.9%
|
114,283
|
8.4%
|
|
Deferred Income
|
1,908
|
1,499
|
27.3%
|
1,318
|
44.8%
|
|
Minority Interest in Subsidiaries
|
1,849
|
1,770
|
4.4%
|
2,324
|
-20.4%
|
|
Stockholders’ Equity
|
103,353
|
100,711
|
2.6%
|
90,776
|
13.9%
|
|
Total Liabilities and Equity
|
1,322,693
|
1,230,510
|
7.5%
|
1,157,557
|
14.3%
|
The main changes in liabilities at the end of the third quarter of 2015, when compared to the previous quarter, are presented in the chart below:
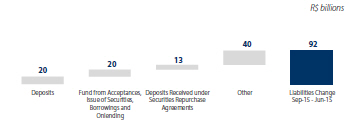
When compared to the previous quarter, the main changes are as follows:
|
Itaú Unibanco Holding S.A.
|
11
|
|
Management Discussion & Analysis
|
Executive Summary
|
|
Loan Portfolio with Endorsements, Sureties and Private Securities
At the end of the third quarter of 2015, our total loan portfolio (including sureties, endorsements and private securities) reached R$590,674 million, increasing 4.3% when compared to the previous quarter and increasing 10.1% from the same period of the previous year. Excluding the effect of the foreign exchange variation, our loan portfolio would have decreased 1.1% in the quarter and 0.4% in the 12-month period.
In the individuals segment, the highlight in the quarter was the growth of the mortgage loan portfolio (5.5%). In the 12-month period, the highlights were the payroll loan and mortgage loan, which increased 25.4% and 21.5%, respectively, whereas the vehicles portfolio decreased 9.1% in the quarter and 30.9% in the 12-month period.
The companies segment, excluding private securities, increased 3.7% in the quarter and 7.2% in the 12-month period. Corporate loans grew 4.6% from the previous quarter and 9.1% in the 12-month period, whereas the very small, small and middle market companies portfolio increased 1.5% from the second quarter of 2015 and 2.4% in the 12-month period. Excluding the effect of the foreign exchange variation, the corporate portfolio would have decreased 3.7% from the previous quarter and 7.4% in the 12-month period.
The balance of our operations in Latin America grew 22.2% in the quarter and 52.6% in the 12-month period. Excluding the effect of the foreign exchange variation, the growth of this portfolio would have been 3.6% compared to the previous quarter and 10.4% in the 12-month period.
The balance of endorsements and sureties reached R$75,143 million at the end of the third quarter of 2015, with an increase of 1.2% when compared to the previous quarter of 2015 and an increase of 0.8% in the past 12 months, mainly due to changes in the Latin America portfolio, which grew 29.2% from the previous quarter and 45.0% in the 12-month period.
|
In R$ millions, end of period
|
3Q15
|
2Q15
|
change
|
4Q14
|
change
|
3Q14
|
change
|
|
Individuals
|
186,128
|
187,318
|
-0.6%
|
186,212
|
0.0%
|
178,280
|
4.4%
|
|
Credit Card Loans
|
55,051
|
56,247
|
-2.1%
|
59,321
|
-7.2%
|
54,265
|
1.4%
|
|
Personal Loans
|
30,256
|
30,016
|
0.8%
|
28,541
|
6.0%
|
28,690
|
5.5%
|
|
Payroll Loans (1)
|
45,695
|
45,517
|
0.4%
|
40,525
|
12.8%
|
36,436
|
25.4%
|
|
Vehicle Loans
|
21,632
|
23,786
|
-9.1%
|
28,927
|
-25.2%
|
31,323
|
-30.9%
|
|
Mortgage Loans
|
33,493
|
31,753
|
5.5%
|
28,898
|
15.9%
|
27,566
|
21.5%
|
|
Companies
|
306,314
|
295,384
|
3.7%
|
295,366
|
3.7%
|
285,813
|
7.2%
|
|
Corporate Loans
|
221,574
|
211,905
|
4.6%
|
211,241
|
4.9%
|
203,042
|
9.1%
|
|
Very Small, Small and Middle Market Loans (2)
|
84,739
|
83,479
|
1.5%
|
84,125
|
0.7%
|
82,771
|
2.4%
|
|
Latin America (3)
|
59,900
|
49,004
|
22.2%
|
43,942
|
36.3%
|
39,252
|
52.6%
|
|
Total with Endorsements and Sureties
|
552,342
|
531,706
|
3.9%
|
525,519
|
5.1%
|
503,345
|
9.7%
|
|
Corporate - Private Securities (4)
|
38,332
|
34,850
|
10.0%
|
34,175
|
12.2%
|
32,942
|
16.4%
|
|
Total with Endorsements, Sureties and Private Securities
|
590,674
|
566,556
|
4.3%
|
559,694
|
5.5%
|
536,287
|
10.1%
|
|
Total with Endorsements, Sureties and Private Securities (5) (ex-foreign exchange rate variation)
|
590,674
|
597,204
|
-1.1%
|
608,249
|
-2.9%
|
593,261
|
-0.4%
|
|
Endorsements and Sureties
|
75,143
|
74,243
|
1.2%
|
73,759
|
1.9%
|
74,514
|
0.8%
|
|
Individuals
|
545
|
465
|
17.1%
|
552
|
-1.4%
|
531
|
2.5%
|
|
Corporate
|
67,331
|
67,125
|
0.3%
|
66,727
|
0.9%
|
67,677
|
-0.5%
|
|
Very Small, Small and Middle Market
|
4,092
|
4,195
|
-2.5%
|
4,213
|
-2.9%
|
4,117
|
-0.6%
|
|
Latin America (4)
|
3,175
|
2,457
|
29.2%
|
2,267
|
40.1%
|
2,189
|
45.0%
|
(1) Includes operations originated by the institution and acquired operations. (2) Includes Rural Loans to Individuals. (3) Includes Argentina, Chile, Colombia, Paraguay and Uruguay. (4) Includes Debentures, CRI, Commercial Paper and Financial Bills. (5) Calculated based on the conversion of the foreign currency portfolio (U.S. dollar and currencies of Latin America). Note: Mortgage and Rural Loan portfolios from the companies segment are allocated according to the client’s size. For further details, please refer to page 18.
Loan Portfolio – Currency Breakdown
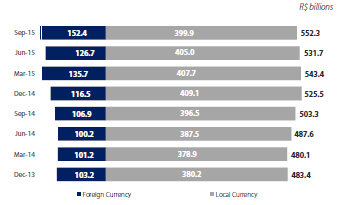
On September 30, 2015, R$152.4 billion of our total credit assets was denominated in or indexed to foreign currencies and increased 20.3% in the quarter, mainly due to the depreciation of the Brazilian real against the U.S. dollar and the currencies of other Latin American countries.
NPL Ratio (90 days overdue)
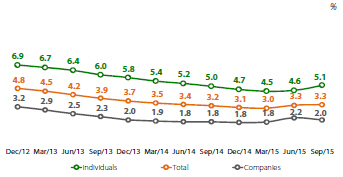
At the end of the third quarter of 2015, the NPL ratio for operations overdue for over 90 days (NPL 90) remained stable at 3.3% when compared to the previous quarter. However, in the individuals segment, this ratio grew 50 basis points and in the companies segment, it decreased 20 basis points when compared to the previous quarter.
|
Itaú Unibanco Holding S.A.
|
12
|
|
Management Discussion & Analysis
|
Executive Summary
|
|
2015 Outlook (*)
The previously disclosed expectations for 2015 are presented below:
|
p 3% to 7%
|
Total Loan Portfolio 1
|
||
|
p 14.5% to 17.5%
|
Managerial Financial Margin 2
|
||
|
Between
R$15 billion and
R$18 bilion
|
Provision for Loan Losses Net of Recovery of Loans Written Off as Losses
|
||
|
p 9.5% to 11.5%
|
Services Fees and Result from Insurance 3
|
||
|
p 7.0% to 10.0%
|
Non-Interest Expenses
|
||
|
(*)
|
Does not include the effect of CorpBanca´s transaction.
|
|
(1)
|
Includes endorsements, sureties and private securities;
|
|
(2)
|
Includes Financial Margin with Clients and Financial Margin with the Market;
|
|
(3)
|
Service Fees (+) Income from Insurance, Pension Plan and Premium Bonds Operations (-) Expenses for Claims (-) Insurance, Pension Plan and Premium Bonds Selling Expenses.
|
|
Although the growth plans and projections of results presented above are based on management assumptions and information available in the market to date, these expectations involve inaccuracies and risks that are difficult to anticipate and there may be, therefore, results or consequences that differ from those anticipated. This information is not a guarantee of future performance. The use of these expectations should take into consideration the risks and uncertainties that involve any activities and that are beyond our control. These risks and uncertainties include, but are not limited to, our ability to perceive the dimension of the synergies projected and their timing, political and economic changes, volatility in interest and foreign exchange rates, technological changes, inflation, financial disintermediation, competitive pressures on products, prices and changes in tax legislation, among others.
|
||
|
Itaú Unibanco Holding S.A.
|
13
|
Serious News for Serious Traders! Try StreetInsider.com Premium Free!
You May Also Be Interested In
- Codoxo Secures Higher Ranking on 2026 Inc. 5000 List of America's Fastest-Growing Private Companies
- Global Sales of Pokémon Pokopia for Nintendo Switch 2 Surpass 5 Million Units
- Innovative Food Holdings, Inc. Reports Financial Results for Second Quarter of 2026
Create E-mail Alert Related Categories
SEC FilingsSign up for StreetInsider Free!
Receive full access to all new and archived articles, unlimited portfolio tracking, e-mail alerts, custom newswires and RSS feeds - and more!
