



Form 6-K Intelsat S.A. For: Apr 30
 Tweet
Tweet Share
Share E-mail
UNITED STATES
SECURITIES AND EXCHANGE COMMISSION
Washington, D.C. 20549
FORM 6-K
REPORT OF FOREIGN PRIVATE ISSUER
PURSUANT TO RULE 13a-16 or 15d-16
UNDER THE SECURITIES EXCHANGE ACT OF 1934
For the month of April, 2015
001-35878
(Commission File Number)
Intelsat S.A.
(Translation of registrant’s name into English)
4 rue Albert Borschette
Luxembourg
Grand-Duchy of Luxembourg
L-1246
(Address of principal executive offices)
Indicate by check mark whether the registrant files or will file annual reports under cover of Form 20-F or Form 40-F.
Form 20-F x Form 40-F ¨
Indicate by check mark if the registrant is submitting the Form 6-K in paper as permitted by Regulation S-T Rule 101(b)(1): ¨
Indicate by check mark if the registrant is submitting the Form 6-K in paper as permitted by Regulation S-T Rule 101(b)(7): ¨
SIGNATURE
Pursuant to the requirements of the Securities Exchange Act of 1934, the registrant has duly caused this report to be signed on its behalf by the undersigned hereunto duly authorized.
| INTELSAT S.A. | ||||||
| Date: April 30, 2015 | By: | /s/ Michael McDonnell | ||||
| Name: | Michael McDonnell | |||||
| Title: | Executive Vice President and Chief Financial Officer | |||||
EXHIBIT INDEX
| Exhibit |
Description | |
| 99.1 | Press Release dated April 30, 2015 entitled “Intelsat Reports First Quarter 2015 Results” | |
| 99.2 | Quarterly Commentary by Stephen Spengler, Chief Executive Officer, and Michael McDonnell, Executive Vice President and Chief Financial Officer, made available on Intelsat’s public website on April 30, 2015 | |
Exhibit 99.1

News Release
2015-24
Contact
Dianne VanBeber
Vice President, Investor Relations and Corporate Communications
+1 703-559-7406
Intelsat Reports First Quarter 2015 Results
| • | First quarter revenue of $602.3 million |
| • | First quarter net income attributable to Intelsat S.A. of $54.7 million |
| • | Net income per diluted common share of $0.47; Adjusted net income per diluted common share of $0.69 |
| • | EBITDA of $460.5 million and Adjusted EBITDA of $470.5 million, or 78 percent of revenue |
| • | $9.7 billion contracted backlog provides visibility for future revenue and cash flow |
| • | Launch schedule for Intelsat EpicNG® program and other satellites unchanged |
| • | Intelsat reaffirms its 2015 financial outlook |
Luxembourg, 30 April 2015
Intelsat S.A. (NYSE: I), the world’s leading provider of satellite services, today reported total revenue of $602.3 million and net income attributable to Intelsat S.A. of $54.7 million, or $0.47 per common share on a diluted basis, for the three months ended March 31, 2015. The company reported adjusted net income per diluted common share1 of $0.69 for the three months ended March 31, 2015.
Intelsat S.A. reported EBITDA1, or earnings before net interest, taxes and depreciation and amortization, of $460.5 million, or 76 percent of revenue, and Adjusted EBITDA1 of $470.5 million, or 78 percent of revenue, for the three months ended March 31, 2015.
Intelsat CEO, Stephen Spengler, said, “Overall, with revenues of $602 million, our business is performing to our 2015 expectations, with each customer set making progress on long-term goals in the first quarter. Our network services business continues to capitalize on growth in the mobility sector, with new service starts in the period. Network services also signed a sizeable contract from an existing customer that will transition to our next generation Intelsat EpicNG platform. Our recently deployed Intelsat 30 satellite supported renewed growth in our media business. Lastly, our government business continued to earn its share of new and renewed contracts.
Spengler continued, “One of our top priorities in 2015 is delivering capacity for launch. Of our satellites expected to launch over the next 12 months, our Intelsat 34, Intelsat 29e and Intelsat 31 satellite programs remain on schedule. With solid progress on our other priorities, such as ecosystem development and the introduction of new services, we are executing on our plan to create long-term growth.”
First Quarter 2015 Business Highlights
Intelsat provides critical communications infrastructure to customers in the network services, media and government sectors. Our customers use our services for broadband connectivity to deliver fixed and mobile telecommunications, enterprise, video distribution and government applications.
Network Services comprised 46 percent of Intelsat’s total first quarter 2015 revenue, and at $276.6 million, decreased 5 percent as compared to the first quarter of 2014.
Media comprised 37 percent of the company’s revenue for the quarter ended March 31, 2015, and at $224.8 million, increased 1 percent as compared to the first quarter of 2014.
Government comprised 16 percent of our revenue for the quarter ended March 31, 2015, and at $94.8 million, decreased 13 percent as compared to the first quarter of 2014.
Average Fill Rate
Intelsat’s average fill rate on our approximately 2,200 station-kept transponders was 75 percent at March 31, 2015, as compared to 77 percent at the end of the first quarter of 2014. Units under contract declined primarily due to decreases in government and Africa customer usage.
Satellite Launches
We have had no material change in our launch plans since our last earnings report on February 18, 2015. The next scheduled launch is Intelsat 34, which is a replacement satellite for our 304.5°E video neighborhood. We expect it to launch in the third quarter of 2015 and be in service by early 2016.
Contracted Backlog
At March 31, 2015, Intelsat’s contracted backlog, representing expected future revenue under existing contracts with customers, was $9.7 billion, as compared to $10.0 billion at December 31, 2014.
Financial Results for the Three Months ended March 31, 2015
Effective first quarter 2015, on-network services are comprised primarily of services delivered on our owned network infrastructure, as well as commitments for third-party capacity, generally long-term in nature, that we integrate and market as part of our owned infrastructure. In the case of third-party services in support of government applications, the commitments for third-party capacity are shorter and matched to the government contracting period, and thus remain classified as off-network services. Off-network services can include transponder services and other satellite-based transmission services, such as mobile satellite services (“MSS”), which are sourced from other operators, often in frequencies not available on our network. Under the category Off-Network and Other Revenues, we also include revenues from consulting and other services. In addition, effective first quarter 2015, certain revenues have been reclassified between transponder services and managed services across our customer sets in order to better reflect the nature of the underlying business.
A supplemental schedule of historical revenues was prepared for the periods 2013-2014 by quarter and full year that reflects the above classification changes. The supplemental schedule is attached to our quarterly commentary issued this morning.
2
Total On-Network Revenue decreased by $22.2 million, or 4 percent, to $552.0 million, as compared to the three months ended March 31, 2014:
| • | Transponder services reported an aggregate decrease of $11.9 million, primarily due to a $10.4 million decrease in revenue from network services customers, mainly due to reductions related to the competitive environment, largely for services delivered in Africa and reductions in point-to-point and consumer broadband services. Transponder services also declined due to a $7.8 million reduction in revenue from capacity sold for government applications to customers primarily in the North America region. These decreases were partially offset by a $6.3 million net increase for direct-to-home (“DTH”) and distribution services sold to media customers mainly in the North America and Latin America regions. |
| • | Managed services reported an aggregate decrease of $6.4 million, largely due to a $3.5 million decline in revenue from capacity sold for government applications, and a $2.5 million decrease in revenue from media customers for occasional use services. |
| • | Channel reported an aggregate decrease of $3.8 million due to the continued migration of international point-to-point satellite traffic to fiber optic cable, a trend we expect to continue. |
Total Off-Network and Other Revenue decreased by $4.4 million, or 8 percent, to $50.3 million:
| • | Transponder, MSS and other off-network services reported an aggregate decrease of $2.9 million, primarily due to declines in services for government applications, largely related to reduced sales of third party off-network transponder services and MSS. |
| • | Satellite-related services reported an aggregate decrease of $1.5 million, primarily due to decreased revenue from flight operations support for third-party satellites and other services. |
For the three month period ended March 31, 2015, changes in operating expenses, interest expense, net, and other significant income statement items are described below.
Direct costs of revenue decreased by $0.3 million to $83.5 million, as compared to the three months ended March 31, 2014. The decline was mainly comprised of a decrease of $2.3 million in the cost of third-party capacity purchased related to lower sales of such services, offset by an increase of other direct costs of revenue.
Selling, general and administrative expenses increased by $7.8 million, or 17 percent, to $54.7 million, as compared to the three months ended March 31, 2014. This was primarily due to a $7.6 million increase in bad debt expense. Bad debt expense was $5.1 million in the first quarter of 2015, compared to a credit of $2.6 million in the first quarter of 2014, as a result of the recovery of previously reserved balances.
Depreciation and amortization expense increased by $1.8 million, or 1 percent, to $171.4 million, as compared to the three months ended March 31, 2014. This increase primarily resulted from higher depreciation due to a satellite placed in service in the fourth quarter of 2014; partially offset by certain satellites, ground equipment and other assets becoming fully depreciated and a decrease in amortization expense.
Interest expense, net consists of the gross interest expense we incur together with gains and losses on interest rate swaps (which reflects net interest accrued on the interest rate swaps as well as the change in their fair value), offset by interest income earned and the amount of interest we capitalize related to assets under construction. Interest expense, net decreased by $14.8 million, or 6 percent, to $226.0 million for the three months ended March 31, 2015, as compared to $240.8 million for the three months ended March 31, 2014.
3
The decrease in interest expense, net was principally due to the following:
| • | a net decrease of $11.2 million as a result of our debt redemption in 2014; and |
| • | a decrease of $3.6 million resulting from higher capitalized interest of $18.7 million for the three months ended March 31, 2015, as compared to $15.1 million for the three months ended March 31, 2014, resulting from increased levels of satellites and related assets under construction. |
The non-cash portion of interest expense, net was $5.0 million for the three months ended March 31, 2015. The non-cash interest expense consisted of the amortization of deferred financing fees incurred as a result of new or refinanced debt and the amortization and accretion of discounts and premiums.
Other expense, net was $3.6 million, as compared to other income, net of $0.4 million, for the three months ended March 31, 2014. The difference of $4.0 million was primarily due to an increase in exchange rate losses mainly related to our business conducted in Brazilian reais.
Provision for income taxes was $7.5 million, as compared to $5.4 million for the three months ended March 31, 2014. The difference was principally due to the recognition of certain previously unrecognized tax benefits in three months ended March 31, 2014 as a result of the conclusion of a U.S. Internal Revenue Service audit. Cash paid for income taxes, net of refunds, totaled $14.1 million for the three months ended March 31, 2015 compared to $15.5 million for the same period in 2014.
EBITDA, Adjusted EBITDA, Net Income, Net Income per Diluted Common Share and Adjusted Net Income per Diluted Common Share
EBITDA was $460.5 million for the three months ended March 31, 2015, as compared to $498.7 million for the same period in 2014. The decline was primarily due to lower revenue and an increase in exchange rate losses in 2015 noted above, as well as bad debt expense in 2015, compared to a credit in 2014.
Adjusted EBITDA was $470.5 million for the three months ended March 31, 2015, or 78 percent of revenue, compared to $505.8 million, or 80 percent of revenue, for the same period in 2014.
Net income attributable to Intelsat S.A. was $54.7 million for the three months ended March 31, 2015, compared to net income of $81.9 million for the same period in 2014, reflecting the various items discussed above.
Net income per diluted common share attributable to Intelsat S.A. was $0.47 for the three months ended March 31, 2015, compared to net income per diluted common share of $0.70 for the same period in 2014.
Adjusted net income per diluted common share attributable to Intelsat S.A. was $0.69 for the three months ended March 31, 2015, compared to $0.92 for the same period in 2014.
Intelsat management has reviewed the data pertaining to the use of the Intelsat network and is providing revenue information with respect to that use by customer set and service type in the following tables. Intelsat management believes this provides a useful perspective on the changes in revenue and customer trends over time.
4
| By Customer Set | ||||||||||||||||
| Three Months Ended March 31, |
Three Months Ended March 31, |
|||||||||||||||
| 2014 | 2015 | |||||||||||||||
| Network Services |
$ | 290,236 | 46 | % | $ | 276,638 | 46 | % | ||||||||
| Media |
221,800 | 36 | % | 224,776 | 37 | % | ||||||||||
| Government |
108,906 | 17 | % | 94,840 | 16 | % | ||||||||||
| Other |
7,948 | 1 | % | 6,052 | 1 | % | ||||||||||
|
|
|
|
|
|||||||||||||
| $ | 628,890 | 100 | % | $ | 602,306 | 100 | % | |||||||||
|
|
|
|
|
|||||||||||||
| By Service Type |
||||||||||||||||
| Three Months Ended March 31, |
Three Months Ended March 31, |
|||||||||||||||
| 2014 | 2015 | |||||||||||||||
| On-Network Revenues |
||||||||||||||||
| Transponder services |
$ | 453,115 | 72 | % | $ | 441,174 | 73 | % | ||||||||
| Managed services |
105,202 | 17 | % | 98,784 | 16 | % | ||||||||||
| Channel |
15,859 | 3 | % | 12,048 | 2 | % | ||||||||||
|
|
|
|
|
|||||||||||||
| Total on-network revenues |
574,176 | 91 | % | 552,006 | 92 | % | ||||||||||
| Off-Network and Other Revenues |
||||||||||||||||
| Transponder, MSS and other off-network services |
43,621 | 7 | % | 40,725 | 7 | % | ||||||||||
| Satellite-related services |
11,093 | 2 | % | 9,575 | 2 | % | ||||||||||
|
|
|
|
|
|||||||||||||
| Total off-network and other revenues |
54,714 | 9 | % | 50,300 | 8 | % | ||||||||||
|
|
|
|
|
|||||||||||||
| Total |
$ | 628,890 | 100 | % | $ | 602,306 | 100 | % | ||||||||
|
|
|
|
|
|||||||||||||
Free Cash Flow from Operations
Free cash flow from operations1 was $199.4 million during the three months ended March 31, 2015. Free cash flow from operations is defined as net cash provided by operating activities, less payments for satellites and other property and equipment (including capitalized interest).
Payments for satellites and other property and equipment during the three months ended March 31, 2015, totaled $187.0 million. Cash and cash equivalents at March 31, 2015 was $258.7 million.
5
Financial Outlook 2015
Today, Intelsat reaffirmed in all material respects its 2015 financial outlook previously provided in February 2015, in which the company expects the following:
Revenue: Intelsat forecasts full year 2015 revenue of $2.330 billion to $2.380 billion.
Adjusted EBITDA: Intelsat forecasts Adjusted EBITDA performance for the full year 2015 to be in a range of $1.81 billion to $1.86 billion.
Capital Expenditures: We expect capital expenditures ranges of:
| • | 2015: $775 million to $850 million; |
| • | 2016: $625 million to $700 million; and |
| • | 2017: $725 million to $825 million. |
Capital expenditure guidance assumes investment in twelve satellites in the concept, design or manufacturing phase for the three calendar year “Guidance Period” of 2015 through 2017. In addition, two custom payloads are being built for us on third-party satellites, which will not require capital expenditure. Of the twelve satellites in our capital expenditure guidance, we expect to launch one satellite in 2015, four satellites in 2016, and one satellite in 2017, and will continue work on the six remaining satellites for which construction will extend beyond the Guidance Period.
We expect to launch two of our new Intelsat EpicNG high-throughput satellites in 2016, increasing our total transmission capacity. By the conclusion of the Guidance Period in 2017, the net number of transponder equivalents will increase by a compound annual growth rate (CAGR) of 7.5 percent as a result of the satellites entering service during the Guidance Period. The growth also includes capacity from one of the customized payloads noted above which we expect will be launched in 2016.
Our capital expenditures guidance includes capitalized interest.
Prepayments: During the Guidance Period, we expect to receive significant customer prepayments under our existing customer service contracts.
We expect prepayment ranges of:
| • | 2015: $125 million to $150 million; |
| • | 2016: $0 million to $25 million; and |
| • | 2017: $0 million, as no prepayments are currently contracted for this period. |
The annual classification of capital expenditure and prepayments could be affected by the timing of achievement of contract, satellite manufacturing, launch and other milestones.
Prepayments during the three months ended March 31, 2015 totaled $42.9 million.
Debt Reduction: As was previously disclosed, Intelsat made a $49 million revolver repayment in early 2015. Based upon the guidance provided above, Intelsat expects no further material debt repayment in 2015.
Cash Taxes: Expected to be approximately 1.5 percent of revenue for each of the next several years.
| 1 | In this release, financial measures are presented both in accordance with GAAP and also on a non-GAAP basis. EBITDA, Adjusted EBITDA, free cash flow from operations, Adjusted net income per diluted common share attributable to Intelsat S.A. and related margins included in this release are non-GAAP financial measures. Please see the consolidated financial information below for information reconciling non-GAAP financial measures to comparable GAAP financial measures. |
6
Q1 2015 Quarterly Commentary
As previously announced, Intelsat is providing a detailed quarterly commentary on the company’s business trends and financial performance prior to the live earnings call. Please visit http://investors.intelsat.com for management’s commentary on the company’s progress against its long-term strategic priorities and outlook for 2015.
Conference Call Information
Intelsat management will hold a public conference call at 11:00 a.m. EDT on Thursday, April 30, 2015 to discuss the company’s financial results for the first quarter ended March 31, 2015. Access to the live conference call will also be available via the Internet at www.intelsat.com/investors. To participate on the live call, participants should dial +1 844-834-1428 from North America, and +1 920-663-6274 from all other locations. The participant pass code is 16502249.
Participants will have access to a replay of the webcast and conference call through May 7, 2015. The replay number for U.S.-based participants is +1 855-859-2056 and for non-U.S. participants is +1 404-537-3406. The participant code for the replay is 16502249.
About Intelsat
Intelsat S.A. (NYSE: I) is the world’s leading provider of satellite services, delivering high performance connectivity solutions for media, fixed and mobile broadband infrastructure, enterprise and government and military applications. Intelsat’s satellite, teleport and fiber infrastructure is unmatched in the industry, setting the standard for transmissions of video and broadband services. From the globalization of content and the proliferation of HD, to the expansion of cellular networks and mobile broadband access, Intelsat creates value for its customers through creative space-based solutions.
Envision…Connect…Transform…with Intelsat. For more information, visit www.intelsat.com.
Intelsat Safe Harbor Statement:
Statements in this news release and certain oral statements from time to time by representatives of the company constitute “forward-looking statements” that do not directly or exclusively relate to historical facts. When used in this earnings release, the words “may,” “will,” “might,” “should,” “expect,” “plan,” “anticipate,” “project,” “believe,” “estimate,” “predict,” “intend,” “potential,” “outlook,” and “continue,” and the negative of these terms, and other similar expressions are intended to identify forward-looking statements and information. Forward-looking statements include: our expectation that our media business will benefit in the near to mid-term from the launch of three satellites that serve our video neighborhoods; our plans for satellite launches in the near to mid-term; our guidance regarding our expectations for our revenue performance, including in our different customer sets, and Adjusted EBITDA performance in 2015; our capital expenditure and customer prepayment guidance for 2015 and the next several years; our expectations as to the increased number of transponder equivalents on
7
our fleet over the next several years; our expectations as to the level of our cash tax expenses over the next several years; our debt repayment guidance for 2015; and our belief that as we execute on our initiatives, we will build the inventory and service capabilities to allow us to capture future growth, including in emerging opportunities that we believe represent larger and more sustainable markets for our services.
The forward-looking statements reflect Intelsat’s intentions, plans, expectations, assumptions and beliefs about future events and are subject to risks, uncertainties and other factors, many of which are outside of Intelsat’s control. Important factors that could cause actual results to differ materially from the expectations expressed or implied in the forward-looking statements include known and unknown risks. Some of the factors that could cause actual results to differ from historical results or those anticipated or predicted by these forward-looking statements include: risks associated with operating our in-orbit satellites; satellite launch failures, satellite launch and construction delays and in-orbit failures or reduced performance; potential changes in the number of companies offering commercial satellite launch services and the number of commercial satellite launch opportunities available in any given time period that could impact our ability to timely schedule future launches and the prices we pay for such launches; our ability to obtain new satellite insurance policies with financially viable insurance carriers on commercially reasonable terms or at all, as well as the ability of our insurance carriers to fulfill their obligations; possible future losses on satellites that are not adequately covered by insurance; U.S. and other government regulation; changes in our contracted backlog or expected contracted backlog for future services; pricing pressure and overcapacity in the markets in which we compete; our ability to access capital markets for debt or equity; the competitive environment in which we operate; customer defaults on their obligations to us; our international operations and other uncertainties associated with doing business internationally; and litigation. Known risks include, among others, the risks described in Intelsat’s annual report on Form 20-F for the year ended December 31, 2014, and its other filings with the U.S. Securities and Exchange Commission, the political, economic and legal conditions in the markets we are targeting for communications services or in which we operate and other risks and uncertainties inherent in the telecommunications business in general and the satellite communications business in particular.
Because actual results could differ materially from Intelsat’s intentions, plans, expectations, assumptions and beliefs about the future, you are urged to view all forward-looking statements with caution. Intelsat does not undertake any obligation to update or revise any forward-looking statements, whether as a result of new information, future events or otherwise.
8
INTELSAT S.A.
UNAUDITED CONDENSED CONSOLIDATED STATEMENTS OF INCOME
($ in thousands, except per share amounts)
| Three Months Ended March 31, 2014 |
Three Months Ended March 31, 2015 |
|||||||
| Revenue |
$ | 628,890 | $ | 602,306 | ||||
| Operating expenses: |
||||||||
| Direct costs of revenue (excluding depreciation and amortization) |
83,759 | 83,467 | ||||||
| Selling, general and administrative |
46,846 | 54,672 | ||||||
| Depreciation and amortization |
169,585 | 171,405 | ||||||
|
|
|
|
|
|||||
| Total operating expenses |
300,190 | 309,544 | ||||||
|
|
|
|
|
|||||
| Income from operations |
328,700 | 292,762 | ||||||
| Interest expense, net |
240,801 | 225,974 | ||||||
| Other income (expense), net |
395 | (3,638 | ) | |||||
|
|
|
|
|
|||||
| Income before income taxes |
88,294 | 63,150 | ||||||
| Provision for income taxes |
5,398 | 7,485 | ||||||
|
|
|
|
|
|||||
| Net income |
82,896 | 55,665 | ||||||
| Net income attributable to noncontrolling interest |
(950 | ) | (948 | ) | ||||
|
|
|
|
|
|||||
| Net income attributable to Intelsat S.A. |
$ | 81,946 | $ | 54,717 | ||||
|
|
|
|
|
|||||
| Net income per common share attributable to Intelsat S.A.: |
||||||||
| Basic |
$ | 0.77 | $ | 0.51 | ||||
| Diluted |
$ | 0.70 | $ | 0.47 | ||||
9
INTELSAT S.A.
UNAUDITED RECONCILIATION OF NET INCOME TO EBITDA
($ in thousands)
| Three Months Ended March 31, 2014 |
Three Months Ended March 31, 2015 |
|||||||
| Net income |
$ | 82,896 | $ | 55,665 | ||||
| Add: |
||||||||
| Interest expense, net |
240,801 | 225,974 | ||||||
| Provision for income taxes |
5,398 | 7,485 | ||||||
| Depreciation and amortization |
169,585 | 171,405 | ||||||
|
|
|
|
|
|||||
| EBITDA |
$ | 498,680 | $ | 460,529 | ||||
|
|
|
|
|
|||||
| EBITDA Margin |
79 | % | 76 | % | ||||
Note:
Intelsat calculates a measure called EBITDA to assess the operating performance of Intelsat S.A. EBITDA consists of earnings before net interest, taxes and depreciation and amortization. Given our high level of leverage, refinancing activities are a frequent part of our efforts to manage our costs of borrowing. EBITDA is a measure commonly used in the FSS sector, and we present EBITDA to enhance the understanding of our operating performance. We use EBITDA as one criterion for evaluating our performance relative to that of our peers. We believe that EBITDA is an operating performance measure, and not a liquidity measure, that provides investors and analysts with a measure of operating results unaffected by differences in capital structures, capital investment cycles and ages of related assets among otherwise comparable companies. However, EBITDA is not a measure of financial performance under U.S. GAAP, and our EBITDA may not be comparable to similarly titled measures of other companies. EBITDA should not be considered as an alternative to operating income or net income, determined in accordance with U.S. GAAP, as an indicator of our operating performance, or as an alternative to cash flows from operating activities, determined in accordance with U.S. GAAP, as an indicator of cash flows, or as a measure of liquidity.
10
INTELSAT S.A.
UNAUDITED RECONCILIATION OF NET INCOME TO
ADJUSTED EBITDA
($ in thousands)
| Three Months Ended March 31, 2014 |
Three Months Ended March 31, 2015 |
|||||||
| Net income |
$ | 82,896 | $ | 55,665 | ||||
| Add: |
||||||||
| Interest expense, net |
240,801 | 225,974 | ||||||
| Provision for income taxes |
5,398 | 7,485 | ||||||
| Depreciation and amortization |
169,585 | 171,405 | ||||||
|
|
|
|
|
|||||
| EBITDA |
498,680 | 460,529 | ||||||
|
|
|
|
|
|||||
| Add: |
||||||||
| Compensation and benefits |
4,065 | 7,948 | ||||||
| Non-recurring and other non-cash items |
3,089 | 1,984 | ||||||
|
|
|
|
|
|||||
| Adjusted EBITDA |
$ | 505,834 | $ | 470,461 | ||||
|
|
|
|
|
|||||
| Adjusted EBITDA Margin |
80 | % | 78 | % | ||||
Note:
Intelsat calculates a measure called Adjusted EBITDA to assess the operating performance of Intelsat S.A. Adjusted EBITDA consists of EBITDA as adjusted to exclude or include certain unusual items, certain other operating expense items and certain other adjustments as described in the table above. Our management believes that the presentation of Adjusted EBITDA provides useful information to investors, lenders and financial analysts regarding our financial condition and results of operations, because it permits clearer comparability of our operating performance between periods. By excluding the potential volatility related to the timing and extent of non-operating activities, our management believes that Adjusted EBITDA provides a useful means of evaluating the success of our operating activities. We also use Adjusted EBITDA, together with other appropriate metrics, to set goals for and measure the operating performance of our business, and it is one of the principal measures we use to evaluate our management’s performance in determining compensation under our incentive compensation plans. Adjusted EBITDA measures have been used historically by investors, lenders and financial analysts to estimate the value of a company, to make informed investment decisions and to evaluate performance. Our management believes that the inclusion of Adjusted EBITDA facilitates comparison of our results with those of companies having different capital structures.
Adjusted EBITDA is not a measure of financial performance under U.S. GAAP and may not be comparable to similarly titled measures of other companies. Adjusted EBITDA should not be considered as an alternative to operating income or net income, determined in accordance with U.S. GAAP, as an indicator of our operating performance, or as an alternative to cash flows from operating activities, determined in accordance with U.S. GAAP, as an indicator of cash flows, or as a measure of liquidity.
11
INTELSAT S.A.
UNAUDITED ADJUSTED NET INCOME PER DILUTED COMMON SHARE
($ in thousands, except per share amounts)
| Three Months Ended March 31, 2014 |
Three Months Ended March 31, 2015 |
|||||||
| Numerator (in thousands): |
||||||||
| Net income attributable to Intelsat S.A. |
$ | 81,946 | $ | 54,517 | ||||
| Add (Subtract): |
||||||||
| Compensation and benefits (1) |
4,065 | 7,948 | ||||||
| Losses on derivative financial instruments (2) |
1,848 | 1,649 | ||||||
| Amortization (3) |
17,058 | 15,054 | ||||||
| Non-recurring and other non-cash items (4) |
3,089 | 1,984 | ||||||
| Income tax effect of adjustments above & other discrete tax items (5) |
(1,263 | ) | (186 | ) | ||||
|
|
|
|
|
|||||
| Adjusted net income attributable to Intelsat S.A. |
$ | 106,743 | $ | 80,966 | ||||
|
|
|
|
|
|||||
| Denominator (in millions): |
||||||||
| Basic weighted average shares outstanding |
106.2 | 106.9 | ||||||
| Weighted average dilutive shares outstanding: |
||||||||
| Preferred shares |
9.6 | 9.6 | ||||||
| Employee compensation related shares, including options and restricted share units |
0.8 | 0.8 | ||||||
|
|
|
|
|
|||||
| Adjusted diluted weighted average shares outstanding |
116.6 | 117.3 | ||||||
|
|
|
|
|
|||||
| Adjusted diluted net income per common share attributable to Intelsat S.A. |
$ | 0.92 | $ | 0.69 | ||||
Note:
Management evaluates financial performance in part based on adjusted net income per diluted common share attributable to common shareholders. This measure consists of net income per diluted common share attributable to common shareholders as reported, as adjusted to exclude or include certain unusual items, certain other operating expense items and certain other adjustments as described in the table and footnotes below. In addition, in calculating this measure we adjusted our common shares outstanding to reflect dilution when the calculation of the numerator moved from a net loss to net income. We believe investors’ understanding of our operating performance is enhanced by the disclosure of this measure. Adjusted net income per diluted common share attributable to common shareholders is not a recognized financial measure in accordance with U.S. GAAP and should not be considered a substitute for earnings per share or other financial measures as computed in accordance with U.S. GAAP and may not be comparable to similarly titled measures of other companies.
| (1) | Reflects non-cash expenses incurred relating to our equity compensation plans and a portion of the expenses related to our defined benefit retirement plan and other postretirement benefits. |
| (2) | Represents (i) the changes in the fair value of the undesignated interest rate swaps and (ii) the difference between the amount of floating rate interest we receive and the amount of fixed rate interest we pay under such swaps, both of which are recognized in interest expense, net. |
| (3) | Intangible assets are amortized based on the expected pattern of consumption. We recorded amortization expense related to our backlog and other and customer intangible assets. |
| (4) | Reflects certain non-recurring gains and losses and non-cash items, including the following: non-recurring litigation expenses; expenses associated with the relocation of Intelsat General Corporation to our U.S. administrative headquarters facility; non-cash expense related to the recognition of expense on a straight-line basis for certain office space leases; severance, retention and relocation payments; costs associated with development activities; and other various non-recurring expenses. These costs were partially offset by non-cash income related to the recognition of deferred revenue on a straight-line basis for certain prepaid capacity service contracts. |
| (5) | Represents the income tax impact of the various adjustments. |
12
INTELSAT S.A.
CONDENSED CONSOLIDATED BALANCE SHEETS
($ in thousands, except, per share amounts)
| As of December 31, 2014 |
As of March 31, 2015 |
|||||||
| (Unaudited) | ||||||||
| ASSETS |
||||||||
| Current assets: |
||||||||
| Cash and cash equivalents |
$ | 123,147 | $ | 258,726 | ||||
| Receivables, net of allowance of $35,174 in 2014 and $34,231 in 2015 |
220,458 | 217,290 | ||||||
| Deferred income taxes |
76,315 | 75,827 | ||||||
| Prepaid expenses and other current assets |
35,945 | 33,313 | ||||||
|
|
|
|
|
|||||
| Total current assets |
455,865 | 585,156 | ||||||
| Satellites and other property and equipment, net |
5,880,264 | 5,908,842 | ||||||
| Goodwill |
6,780,827 | 6,780,827 | ||||||
| Non-amortizable intangible assets |
2,458,100 | 2,458,100 | ||||||
| Amortizable intangible assets, net |
500,545 | 485,490 | ||||||
| Other assets |
393,754 | 392,964 | ||||||
|
|
|
|
|
|||||
| Total assets |
$ | 16,469,355 | $ | 16,611,379 | ||||
|
|
|
|
|
|||||
| LIABILITIES AND SHAREHOLDERS’ DEFICIT |
||||||||
| Current liabilities: |
||||||||
| Accounts payable and accrued liabilities |
$ | 151,793 | $ | 145,642 | ||||
| Taxes payable |
8,974 | 2,172 | ||||||
| Employee related liabilities |
44,815 | 25,053 | ||||||
| Accrued interest payable |
161,495 | 311,170 | ||||||
| Current portion of long-term debt |
49,000 | — | ||||||
| Deferred satellite performance incentives |
20,957 | 20,070 | ||||||
| Deferred revenue |
117,401 | 119,411 | ||||||
| Other current liabilities |
72,629 | 91,818 | ||||||
|
|
|
|
|
|||||
| Total current liabilities |
627,064 | 715,336 | ||||||
| Long-term debt, net of current portion |
14,762,142 | 14,761,161 | ||||||
| Deferred satellite performance incentives, net of current portion |
163,360 | 159,023 | ||||||
| Deferred revenue, net of current portion |
967,318 | 988,819 | ||||||
| Deferred income taxes |
211,680 | 221,869 | ||||||
| Accrued retirement benefits |
262,906 | 246,474 | ||||||
| Other long-term liabilities |
217,452 | 190,586 | ||||||
| Shareholders’ deficit: |
||||||||
| Common shares; nominal value $0.01 per share |
1,067 | 1,071 | ||||||
| 5.75% Series A mandatory convertible junior non-voting preferred shares; nominal value $0.01 per share; aggregate liquidation preference of $172,500 ($50 per share) |
35 | 35 | ||||||
| Paid-in capital |
2,117,898 | 2,125,723 | ||||||
| Accumulated deficit |
(2,782,741 | ) | (2,728,024 | ) | ||||
| Accumulated other comprehensive loss |
(112,527 | ) | (103,405 | ) | ||||
|
|
|
|
|
|||||
| Total Intelsat S.A. shareholders’ deficit |
(776,268 | ) | (704,600 | ) | ||||
| Noncontrolling interest |
33,701 | 32,711 | ||||||
|
|
|
|
|
|||||
| Total liabilities and shareholders’ deficit |
$ | 16,469,355 | $ | 16,611,379 | ||||
|
|
|
|
|
|||||
13
INTELSAT S.A.
UNAUDITED CONDENSED CONSOLIDATED STATEMENTS OF CASH FLOWS
($ in thousands)
| Three Months Ended March 31, 2014 |
Three Months Ended March 31, 2015 |
|||||||
| Cash flows from operating activities: |
||||||||
| Net income |
$ | 82,896 | $ | 55,665 | ||||
| Adjustments to reconcile net income to net cash provided by operating activities: |
||||||||
| Depreciation and amortization |
169,585 | 171,405 | ||||||
| Provision for doubtful accounts |
(2,563 | ) | 5,070 | |||||
| Foreign currency transaction loss |
223 | 5,205 | ||||||
| Share-based compensation |
3,958 | 7,831 | ||||||
| Deferred income taxes |
(1,398 | ) | 900 | |||||
| Amortization of discount, premium, issuance costs and related costs |
5,618 | 4,977 | ||||||
| Unrealized gains on derivative financial instruments |
(5,141 | ) | (5,321 | ) | ||||
| Amortization of actuarial loss and prior service credits for retirement benefits |
2,537 | 4,039 | ||||||
| Other non-cash items |
44 | (27 | ) | |||||
| Changes in operating assets and liabilities: |
||||||||
| Receivables |
(20,522 | ) | (1,902 | ) | ||||
| Prepaid expenses and other assets |
(192 | ) | (4,299 | ) | ||||
| Accounts payable and accrued liabilities |
(6,368 | ) | (25,967 | ) | ||||
| Accrued interest payable |
143,500 | 149,675 | ||||||
| Deferred revenue |
5,487 | 22,679 | ||||||
| Accrued retirement benefits |
(6,320 | ) | (6,118 | ) | ||||
| Other long-term liabilities |
(4,453 | ) | 2,541 | |||||
|
|
|
|
|
|||||
| Net cash provided by operating activities |
366,891 | 386,353 | ||||||
|
|
|
|
|
|||||
| Cash flows from investing activities: |
||||||||
| Payments for satellites and other property and equipment (including capitalized interest) |
(166,440 | ) | (186,992 | ) | ||||
| Other investing activities |
— | 5 | ||||||
|
|
|
|
|
|||||
| Net cash used in investing activities |
(166,440 | ) | (186,987 | ) | ||||
|
|
|
|
|
|||||
| Cash flows from financing activities: |
||||||||
| Repayments of long-term debt |
(12,209 | ) | (49,000 | ) | ||||
| Dividends paid to preferred shareholders |
(2,480 | ) | (2,480 | ) | ||||
| Capital contribution from noncontrolling interest |
6,105 | — | ||||||
| Dividends paid to noncontrolling interest |
(1,846 | ) | (1,938 | ) | ||||
| Principal payments on deferred satellite performance incentives |
(5,164 | ) | (5,260 | ) | ||||
| Other financing activities |
2,968 | 96 | ||||||
|
|
|
|
|
|||||
| Net cash used in financing activities |
(12,626 | ) | (58,582 | ) | ||||
|
|
|
|
|
|||||
| Effect of exchange rate changes on cash and cash equivalents |
(223 | ) | (5,205 | ) | ||||
|
|
|
|
|
|||||
| Net change in cash and cash equivalents |
187,602 | 135,579 | ||||||
| Cash and cash equivalents, beginning of period |
247,790 | 123,147 | ||||||
|
|
|
|
|
|||||
| Cash and cash equivalents, end of period |
$ | 435,392 | $ | 258,726 | ||||
|
|
|
|
|
|||||
| Supplemental cash flow information: |
||||||||
| Interest paid, net of amounts capitalized |
$ | 89,752 | $ | 76,758 | ||||
| Income taxes paid, net of refunds |
15,529 | 14,074 | ||||||
| Supplemental disclosure of non-cash investing activities: |
||||||||
| Accrued capital expenditures |
$ | 52,382 | $ | 73,014 | ||||
14
INTELSAT S.A.
UNAUDITED RECONCILIATION OF NET CASH PROVIDED BY OPERATING ACTIVITIES
TO FREE CASH FLOW FROM OPERATIONS
($ in thousands)
| Three Months Ended March 31, |
Three Months Ended March 31, |
|||||||
| 2014 | 2015 | |||||||
| Net cash provided by operating activities |
$ | 366,891 | $ | 386,353 | ||||
| Payments for satellites and other property and equipment (including capitalized interest) |
(166,440 | ) | (186,992 | ) | ||||
|
|
|
|
|
|||||
| Free cash flow from operations |
$ | 200,451 | $ | 199,361 | ||||
|
|
|
|
|
|||||
Note:
Free cash flow from operations consists of net cash provided by operating activities, less payments for satellites and other property and equipment (including capitalized interest). Free cash flow from operations excludes proceeds resulting from settlement of insurance claims, and is not a measurement of cash flow under GAAP. Intelsat believes free cash flow from operations is a useful measure of financial performance that shows a company’s ability to fund its operations. Free cash flow from operations is used by Intelsat in comparing its performance to that of its peers and is commonly used by analysts and investors in assessing performance. Free cash flow from operations does not give effect to cash used for debt service requirements and thus does not reflect funds available for investment or other discretionary uses. Free cash flow from operations is not a measure of financial performance under GAAP, and may not be comparable to similarly titled measures of other companies. You should not consider free cash flow from operations as an alternative to operating or net income, determined in accordance with GAAP, as an indicator of Intelsat’s operating performance, or as an alternative to cash flows from operating activities, determined in accordance with GAAP, as an indicator of cash flows or as a measure of liquidity.
15
Exhibit 99.2


Quarterly Commentary
Quarter Ended March 31, 2015
April 30, 2015
First Quarter 2015 Performance Summary
The results of Intelsat S.A. (“Intelsat” or the “company”) in the quarter reflect continued progress on our financial and operating priorities.
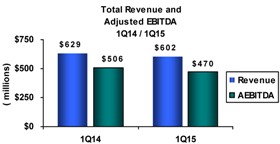
| Our first quarter performance was in line with our expectations, with revenue of $602 million, a 4 percent decline as compared to the first quarter of 2014. Net income attributable to Intelsat S.A. was $55 million, or $0.47 per diluted common share, in the first quarter. Adjusted net income per diluted common share1 was $0.69 for the same period. |
| |
|
Adjusted EBITDA1 for the period was $470 million, or 78 percent of revenue, as compared to $506 million, or 80 percent of revenue, in the first quarter of 2014. Our performance on this metric reflects reduced revenue and modestly increased expenses reflecting a return to more normalized bad debt experience, as compared to a credit in the like quarter of 2014, as well as an increase in foreign exchange expense primarily related to our revenues in Brazil. The solid Adjusted EBITDA performance, and lower cash interest payments given the timing of our debt service, contributed to strong free cash flow from operations1 of over $199 million. |
Launching and placing into service new inventory is essential to our return to top line growth. Our capital investment program is on track, with no change to our launch schedule since our last commentary. As we add new capacity to our fleet, we will be in position to generate organic growth.
Progress in growing applications was more than offset by the trends affecting our business that were detailed in our February 2015 Quarterly Commentary, such as limited inventory suited to growth opportunities, geopolitical conditions and the strengthening of the U.S. dollar. We have not experienced any meaningful changes to the trends since that time.
Contracted backlog at March 31, 2015 was $9.7 billion, compared to $10.0 billion at December 31, 2014. At 4.0 times trailing twelve months revenue, our backlog continues to provide our business with predictability and visibility into future cash flow.
Intelsat S.A.
Quarterly Commentary
1Q 2015
2015 Operational Priorities
Our operational focus in 2015 continues to be on the five areas outlined in our February 2015 Quarterly Commentary. Progress specific to our 2015 priorities to date is noted below:
| • | Maintain our design and manufacturing schedule for the next generation Intelsat EpicNG® fleet, and other satellites in our plan, to ensure availability of new inventory to drive revenue growth; |
| • | There have been no changes to our launch program. Manufacturing milestones and launch calendars remain within our expectations. We expect to launch three satellites over the next 12 months that will enter service over the course of 2016. |
| • | Drive innovation to create next generation solutions, including collaborating with ground technology manufacturers and other partners to ensure optimized performance, economics and ease of access for Intelsat EpicNG, for applications including broadband infrastructure, mobility, government and enterprise solutions; |
| • | We believe that innovation in terms of ground systems, such as antennas, will allow us to accelerate access to larger growth opportunities. Building upon our recent investments in innovative antenna technology and platforms, we announced that we will co-design and produce an ultra-thin, active phased array, Ku-band satellite antenna solution with Phasor Inc., a leading developer of high throughput, modular, electronically steerable antennas (ESAs). Intelsat’s investment is intended to produce a cost-effective, fuselage-mount, Ku-band antenna suitable for installation on civil and government small-jets, which represents an underserved segment of the fast-growing aviation broadband market. |
| • | Develop application specific capacity and new service offerings that support the growth objectives of our customers across our business in the media, network services and government sectors, including mobility applications, and invest in our video neighborhood orbital locations to support long-term growth goals; |
| • | Our media customers operate in an environment that requires delivering video content in multiple formats, with changing business models. In April, we introduced IntelsatOne® Prism, an IP content distribution platform and managed service that is fully integrated with Intelsat’s powerful global satellite fleet and IntelsatOne terrestrial network. The fully automated, converged IP-based platform allows media customers to conduct multiple content transmissions, such as linear video, file transfer, VoIP, Internet access and data exchange, on a single platform, increasing their flexibility and operational efficiency. |
| • | Maintain our leadership in government services, focusing on procurements that require end-to-end network responsibilities and complex network support, improving our value proposition to government customers seeking affordable solutions from trusted commercial providers; |
| • | Intelsat continues to position for what we perceive as long-term growth opportunities serving the U.S. military with commercial capacity and services. The United States Strategic Command’s (“U.S. Stratcom”) Joint Space Operations Center (“JSpOC”) recently confirmed that approximately 80 percent of the government’s satellite communications were conducted using commercial systems in recent years, and announced plans to create a Commercial Integration Cell (“CIC”) to function within the JSpOC by June 1, 2015, to enhance |
2
Intelsat S.A.
Quarterly Commentary
1Q 2015
| coordination and cooperation between the Department of Defense (“DoD”) and commercial satellite operators. The CIC will help coordinate operational issues between the parties and develop a process for the two-way exchange of critical operational data. Six companies will comprise the prototype commercial cell, of which our subsidiary, Intelsat General Corporation (“IGC”), is a member. |
| • | Optimize use of our spectrum rights and global presence to maximize market access and continuity, particularly in attractive regions, while maintaining investment discipline. |
As we execute on these initiatives, we will be building the inventory and service capabilities that will allow us to capture future growth. In addition to our existing sectors, we see emerging opportunities that we believe represent larger and more sustainable addressable markets for our services.
1Q 2015 Business Highlights and Customer Set Performance
All 2015 comparisons are to the same period in 2014 unless specifically noted otherwise.
| Network Services
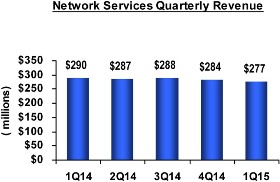
Network services generated revenue of $277 million in the first quarter of 2015, a $14 million, or 5 percent, decrease from the year-ago quarter. Declining revenues resulted from reduced point-to-point services such as channel and certain transponder services, the effects of the competitive environment, primarily for services in Africa, and reduced revenue from consumer broadband services in North America, all trends that were discussed in our fourth quarter 2014 commentary.
First Quarter Highlights and Business Trends: |
|
| • | Intelsat received a multi-year, multi-transponder renewal from Compania Anonima National Telefonos de Venezuela (“CANTV”), for services that will migrate from Intelsat 1R to the first satellite in our next generation Intelsat EpicNG platform, Intelsat 29e. Intelsat’s satellite services provide an essential part of the CANTV telecommunications infrastructure, supporting applications such as cellular backhaul, enterprise networks, oil and gas, and government. |
| • | Maritime broadband networks are forecasted to be a growing source of demand for commercial satellite capacity. Intelsat renewed an existing agreement for services on four satellites with the leading provider of maritime broadband services, Airbus Defense and Space, under which Airbus will migrate to our high performance Intelsat EpicNG capacity as it comes into service. |
On a global basis, growth opportunities for our network services business include increased demand for aeronautical and maritime mobility applications, and high throughput capacity for fixed and mobile broadband applications for telecommunications providers and enterprise networks. The launches of Intelsat 29e, Intelsat 34, Intelsat 32e and Intelsat 33e, expected to enter service over the course of 2016 and early 2017, are designed to provide necessary growth capacity for these applications.
3
Intelsat S.A.
Quarterly Commentary
1Q 2015
| Media
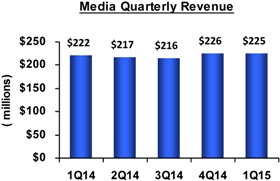
Our media business applications generated revenue of $225 million in the first quarter of 2015, a $3 million, or 1 percent, increase from the year-ago quarter. Revenue increases from the entry into service of Intelsat 30 were offset somewhat by the receipt of a non-recurring termination fee in the first quarter of 2014 for which there was no similar fee in 2015, reduced occasional use (“OU”) contribution services and the effects of currency fluctuations, primarily with respect to our revenue from Russia and Brazil.
First Quarter Highlights and Business Trends:
New business in the quarter was driven primarily by new and renewing contracts related to Intelsat’s media distribution neighborhoods in Africa and the Indian Ocean region.
|
| |
|
• Sentech, a South African provider of telecommunications and broadcasting services, increased its capacity and extended its commitments on the Intelsat 20 satellite, Intelsat’s leading direct-to-home (“DTH”) and video distribution neighborhood at 68.5º E. The capacity allows Sentech to continue to build its media and broadband infrastructure services at that orbital location.
• BT renewed and expanded services on five Intelsat satellites, including services spanning Asia, Latin America and Europe. Intelsat’s services are used by BT for media distribution and contribution, corporate networking and government services for end users operating on a global basis.
• In addition to satellite capacity, many of Intelsat’s media customers rely upon Intelsat to provide teleport services, allowing them to add resilience and cost efficiency to their broadcast distribution infrastructure. In the first quarter, Discovery Communications, LLC expanded its use of services from one of Intelsat’s North American teleport facilities. | ||
Given the high fill rates on our most popular video neighborhood satellites, the next growth catalyst for our media business is the launch of Intelsat 31, a satellite expected to launch in 2016 and enter service in the second quarter of 2016, with a customized Ku-band payload in support of DIRECTV® Latin America.
4
Intelsat S.A.
Quarterly Commentary
1Q 2015
| Government
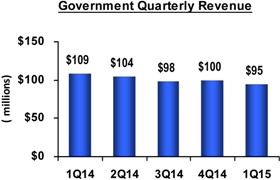
Sales to government customers generated revenue of $95 million in the first quarter of 2015, a $14 million, or 13 percent, decrease from the year-ago quarter. Overall, the decline reflects the effect of troop withdrawals, reduced U.S. government budget spend and consolidations of government customer requirements, resulting in fewer contract renewals or renewals with lower unit requirements. Revenue declines were heavily weighted to on-network services.
The current proportion of on-network services as a percentage of total government revenue is 57 percent, as compared to the first quarter of 2014, where the proportion was 61 percent. |
| |
First Quarter Highlights and Business Trends:
| • | A number of sizeable renewals were received in the first quarter, the largest being for services provided on third-party satellites. The overall volume of renewals is in line with our expectations for 2015. |
| • | IGC executed a three satellite, multi-transponder, multi-year agreement with a global provider of mobility services. The customer, benefiting from the reach of the Intelsat fleet, will incorporate the capacity into its global infrastructure to provide services to its users across two ocean regions and five continents. |
As we move forward in 2015, our current view is that our government business will continue to be affected by reduced defense spending as compared to prior years. Visibility remains limited, with the pace of RFP issuance and subsequent awards remaining slow.
Fleet and Operations Update
Station-kept transponders were relatively unchanged at 2,200 units at the end of the first quarter; utilization was at 75 percent. There were no significant fleet changes in the quarter.
Intelsat currently has twelve satellites in the concept, design and manufacturing stages.
At present, we expect to launch one satellite in 2015, Intelsat 34, a satellite supporting media applications in South America and mobility services over the North Atlantic, assigned to an Arianespace launcher; we expect this satellite to enter into service by early 2016. Intelsat 31, a second satellite to be used primarily by DIRECTV® Latin America, is currently expected to launch on a Proton launcher in the first quarter of 2016 and enter into service in the second quarter of 2016. The next generation Intelsat EpicNG program begins with the Intelsat 29e satellite, which is currently scheduled to launch on an Arianespace rocket in the first quarter of 2016 and expected to enter into service in mid-2016.
5
Intelsat S.A.
Quarterly Commentary
1Q 2015
Details related to our satellite programs in the concept, design and manufacturing stages are noted below and are subject to change. Please note that our disclosure now reflects our estimated launch date, as opposed to the previously provided earliest estimated launch date. In addition, we have added disclosure indicating the estimated in-service date, at which point in-orbit testing is complete and the satellite is ready to serve customers.
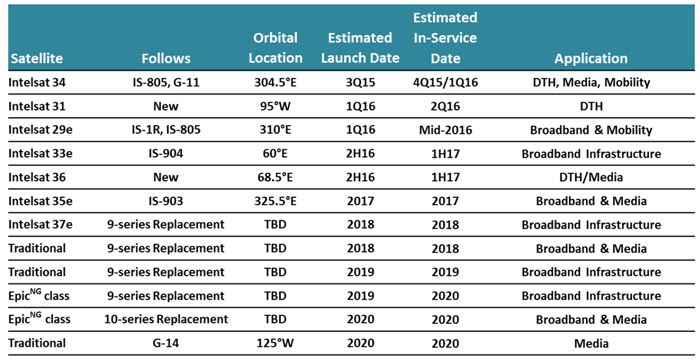
In addition to these planned satellites, Intelsat 32e and Intelsat 38 are custom payloads being built for us on third-party satellites and will not require capital expenditure. Intelsat 32e will be located at 43.1°W; the satellite is planned for launch in the first half of 2016. A launch date is not yet set for Intelsat 38, which will be located at 45ºE.
6
Intelsat S.A.
Quarterly Commentary
1Q 2015
First Quarter Financial Performance
Revenue
Effective first quarter 2015, on-network services are comprised primarily of services delivered on our owned network infrastructure, as well as commitments for third-party capacity, generally long-term in nature, that we integrate and market as part of our owned infrastructure. In the case of third-party services in support of government applications, the commitments for third-party capacity are shorter and matched to the government contracting period, and thus remain classified as off-network services. Off-network services can include transponder services and other satellite-based transmission services, such as mobile satellite services (“MSS”), which are sourced from other operators, often in frequencies not available on our network. Under the category Off-Network and Other Revenues, we also include revenues from consulting and other services. In addition, effective first quarter 2015, certain revenues have been reclassified between transponder services and managed services across our customer sets in order to better reflect the nature of the underlying business.
A supplemental schedule of historical revenues was prepared for the periods 2013-2014 by quarter and full year that reflects the above classification changes. The supplemental schedule is attached to this quarterly commentary.
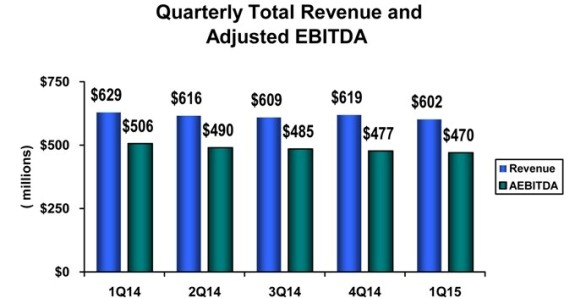
At $602 million, total company revenue declined $27 million, or 4 percent, as compared to the first quarter of 2014.
On-network services of $552 million decreased by $22 million, or 4 percent. Transponder services of $441 million declined by $12 million, or 3 percent, most of which was due to reduced services sold to network services customers in the North America, Europe and Africa regions. The decline in transponder services also reflects a decrease in revenue from capacity sold for government applications to customers primarily in the North America region. Managed services declined to $99 million, or 6 percent, largely due to lower sales of occasional use services to media customers and reduced capacity sold for government applications. Channel services declined by $4 million, to $12 million.
7
Intelsat S.A.
Quarterly Commentary
1Q 2015
Off-network and other revenues of $50 million declined by $4 million, or 8 percent. Transponder, Mobile Satellite Services (“MSS”) and other off-network services decreased by a total of $3 million, largely due to a decline in sales of third-party off-network transponder services and MSS capacity, both of which are primarily related to government applications. Satellite-related services declined by $2 million, primarily due to decreased revenue from flight operations professional services.
Expenses
Direct costs of revenue, excluding depreciation and amortization, was $84 million in the first quarter of 2015, constituting less than a one percent decline as compared to the prior year quarter. The decrease was mainly comprised of a $2 million reduction in the cost of third-party capacity purchased related to lower sales of such services for government applications, offset by an increase in other direct costs of revenue. At $55 million, selling, general and administrative expenses in the first quarter increased by $8 million as compared to the prior year period, primarily due to increased bad debt expense of $5 million in the first quarter of 2015, as compared to a $3 million credit in the first quarter of 2014 as a result of the recovery of previously reserved balances.
Interest expense, net, was $226 million in the first quarter of 2015, a decrease of $15 million, or 6 percent, as compared to the prior year period. The decline was primarily the result of debt reduction activities in 2014.
At $4 million, other expense, net for the first quarter of 2015, as compared to $0.4 million, other income, net for the three months ended March 31, 2014. The difference was primarily due to an increase in exchange rate losses mainly related to our business conducted in Brazilian reais.
Provision for income taxes was $8 million as compared to a benefit from income taxes of $5 million for the first quarter of 2014. The difference was principally due to the recognition of previously unrecognized tax benefits in the first quarter of 2014 as a result of the conclusion of a U.S. Internal Revenue Service audit.
Adjusted EBITDA
Adjusted EBITDA for the period was $470 million, or 78 percent of revenue, as compared to $506 million, or 80 percent of revenue, in the first quarter of 2014. Our performance on this metric reflects reduced revenue and modestly increased expenses reflecting a return to more normalized bad debt experience, as compared to a credit in the like quarter of 2014, as well as an increase in foreign exchange expense primarily related to our revenues in Brazil.
| Earnings
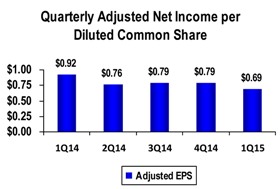
Net income attributable to Intelsat S.A. was $55 million, or $0.47 per diluted common share, for the first quarter. Adjusted net income attributable to Intelsat S.A.1 was $81 million for the first quarter of 2015, compared to $107 million in adjusted net income attributable to Intelsat S.A. for the same period in 2014. Adjusted diluted net income per common share1 was $0.69 for the first quarter of 2015, compared to $0.92 for the same period in 2014. |
|
8
Intelsat S.A.
Quarterly Commentary
1Q 2015
Cash Flows
During the first quarter of 2015, net cash provided by operating activities was $386 million. This included $43 million in customer prepayments received in the first quarter. Cash interest paid in the first quarter was $95 million, with relatively higher interest payments due in the second and fourth quarters of the year as compared to the first and third quarters; $19 million of interest was capitalized during the first quarter.
Capital expenditures were $187 million, resulting in free cash flow from operations of $199 million for the first quarter of 2015.
Our ending cash balance at March 31, 2015, was $259 million.
2015 Outlook
Intelsat reaffirmed its revenue and capital expenditures guidance issued in February 2015.
We continue to expect full year 2015 revenue of $2.330 billion to $2.380 billion and Adjusted EBITDA of $1.81 billion to $1.86 billion.
Capital Expenditure Guidance was unchanged:
| Guidance | FY 2015 | FY 2016 | FY 2017 | |||
| Capital Expenditures |
$775M - $850M | $625M - $700M | $725M - $825M | |||
| Customer Prepayments |
$125M - $150M | $0M - $25M | $0M |
Our capital expenditure guidance includes capitalized interest. Customer prepayments guidance reflects only that which is contracted at the quarter end. The annual classification of capital expenditure and prepayments could be affected by the timing of achievement of contract, satellite manufacturing, launch and other milestones.
The net number of transponder equivalents is expected to increase by a compound annual growth rate (CAGR) of 7.5 percent as a result of the satellites entering service between January 1, 2015 and December 31, 2017, with the growth weighted to later in the period. This aligns to the launches of the Intelsat EpicNG high throughput satellites, the first two of which enter service in mid-2016 and 2017.
Stephen Spengler, Chief Executive Officer, Intelsat S.A.
Michael McDonnell, Executive Vice President and Chief Financial Officer, Intelsat S.A.
| 1 | In this quarterly commentary document, financial measures are presented both in accordance with GAAP and also on a non-GAAP basis. EBITDA, Adjusted EBITDA (or AEBITDA), free cash flow from operations and related margins, adjusted net income and adjusted net income per diluted common share included in this commentary are non-GAAP financial measures. Please see the consolidated financial information found in our earnings release and available on our website for information reconciling non-GAAP financial measures to comparable GAAP financial measures. |
9
Intelsat S.A.
Quarterly Commentary
1Q 2015
Safe Harbor Statement
Statements in this quarterly commentary and certain oral statements made from time to time by our representatives constitute “forward-looking statements” that do not directly or exclusively relate to historical facts. When used in this quarterly commentary, the words “may,” “will,” “might,” “should,” “expect,” “plan,” “anticipate,” “project,” “believe,” “estimate,” “predict,” “intend,” “potential,” “outlook,” and “continue,” and the negative of these terms, and other similar expressions are intended to identify forward-looking statements and information. Forward-looking statements include: our expectation that our media business will benefit in the near to mid-term from the launch of three satellites that serve our video neighborhoods; our plans for satellite launches in the near to mid-term; our guidance regarding our expectations for our revenue performance, including in our different customer sets, and Adjusted EBITDA performance in 2015; our capital expenditure and customer prepayment guidance for 2015 and the next several years; our expectations as to the increased number of transponder equivalents on our fleet over the next several years; our expectations as to the level of our cash tax expenses over the next several years; our debt repayment guidance for 2015; and our belief that as we execute on our initiatives, we will build the inventory and service capabilities to allow us to capture future growth, including in emerging opportunities that we believe represent larger and more sustainable markets for our services.
Forward-looking statements reflect Intelsat’s intentions, plans, expectations, assumptions and beliefs about future events and are subject to risks, uncertainties and other factors, many of which are outside of Intelsat’s control. Important factors that could cause actual results to differ materially from the expectations expressed or implied in the forward-looking statements include known and unknown risks. Some of the factors that could cause actual results to differ from historical results or those anticipated or predicted by these forward-looking statements include: risks associated with operating our in-orbit satellites; satellite launch failures, satellite launch and construction delays and in-orbit failures or reduced performance; potential changes in the number of companies offering commercial satellite launch services and the number of commercial satellite launch opportunities available in any given time period that could impact our ability to timely schedule future launches and the prices we pay for such launches; our ability to obtain new satellite insurance policies with financially viable insurance carriers on commercially reasonable terms or at all, as well as the ability of our insurance carriers to fulfill their obligations; possible future losses on satellites that are not adequately covered by insurance; U.S. and other government regulation; changes in our contracted backlog or expected contracted backlog for future services; pricing pressure and overcapacity in the markets in which we compete; our ability to access capital markets for debt or equity; the competitive environment in which we operate; customer defaults on their obligations to us; our international operations and other uncertainties associated with doing business internationally; and litigation. Known risks include, among others, the risks described in Intelsat’s annual report on Form 20-F for the year ended December 31, 2014 and its other filings with the U.S. Securities and Exchange Commission, the political, economic and legal conditions in the markets we are targeting for communications services or in which we operate and other risks and uncertainties inherent in the telecommunications business in general and the satellite communications business in particular.
Because actual results could differ materially from Intelsat’s intentions, plans, expectations, assumptions and beliefs about the future, you are urged to view all forward-looking statements with caution. Intelsat does not undertake any obligation to update or revise any forward-looking statements, whether as a result of new information, future events or otherwise.
Contact
Dianne VanBeber
Vice President, Investor Relations and Corporate Communications
+1 703-559-7406
10
INTELSAT S.A.
Revenue by Service Type
(Unaudited)
(Adjusted to reflect classification changes to On- and Off-Network Revenue and Transponder Services and Managed Services)
(in thousands)
| Three Months Ended March 31, 2013 |
Three Months Ended June 30, 2013 |
Three Months Ended September 30, 2013 |
Three Months Ended December 31, 2013 |
Twelve Months Ended December 31, 2013 |
Three Months Ended March 31, 2014 |
Three Months Ended June 30, 2014 |
Three Months Ended September 30, 2014 |
Three Months Ended December 31, 2014 |
Twelve Months Ended December 31, 2014 |
|||||||||||||||||||||||||||||||
| On-Network Revenues |
||||||||||||||||||||||||||||||||||||||||
| Transponder services |
$ | 472,719 | $ | 469,249 | $ | 465,956 | $ | 465,268 | $ | 1,873,192 | $ | 453,115 | $ | 439,320 | $ | 439,861 | $ | 447,161 | $ | 1,779,457 | ||||||||||||||||||||
| Managed services |
100,380 | 103,363 | 104,936 | 102,447 | 411,126 | 105,202 | 105,787 | 102,600 | 101,680 | 415,269 | ||||||||||||||||||||||||||||||
| Channel |
19,165 | 18,654 | 17,471 | 16,833 | 72,123 | 15,859 | 15,142 | 14,523 | 13,146 | 58,670 | ||||||||||||||||||||||||||||||
|
|
|
|
|
|
|
|
|
|
|
|
|
|
|
|
|
|
|
|
|
|||||||||||||||||||||
| Total on-network revenues |
592,264 | 591,266 | 588,363 | 584,548 | 2,356,441 | 574,176 | 560,249 | 556,984 | 561,987 | 2,253,396 | ||||||||||||||||||||||||||||||
| Off-Network and Other Revenues |
||||||||||||||||||||||||||||||||||||||||
| Transponder, MSS and other off-network services |
50,452 | 52,270 | 51,901 | 46,659 | 201,282 | 43,621 | 43,761 | 40,984 | 43,271 | 171,637 | ||||||||||||||||||||||||||||||
| Satellite-related services |
12,411 | 10,267 | 11,580 | 11,642 | 45,900 | 11,093 | 11,739 | 10,657 | 13,864 | 47,353 | ||||||||||||||||||||||||||||||
|
|
|
|
|
|
|
|
|
|
|
|
|
|
|
|
|
|
|
|
|
|||||||||||||||||||||
| Total off-network and other revenues |
62,863 | 62,537 | 63,481 | 58,301 | 247,182 | 54,714 | 55,500 | 51,641 | 57,135 | 218,990 | ||||||||||||||||||||||||||||||
|
|
|
|
|
|
|
|
|
|
|
|
|
|
|
|
|
|
|
|
|
|||||||||||||||||||||
| Total |
$ | 655,127 | $ | 653,803 | $ | 651,844 | $ | 642,849 | $ | 2,603,623 | $ | 628,890 | $ | 615,749 | $ | 608,625 | $ | 619,122 | $ | 2,472,386 | ||||||||||||||||||||
|
|
|
|
|
|
|
|
|
|
|
|
|
|
|
|
|
|
|
|
|
|||||||||||||||||||||
(Certain totals may not add due to the effects of rounding)
11
Serious News for Serious Traders! Try StreetInsider.com Premium Free!
You May Also Be Interested In
- MDA SPACE SATELLITES FOR GLOBALSTAR SUCCESSFULLY LAUNCHED
- Globalstar Confirms Successful Launch of All 8 HIBLEO-4 Replacement Satellites
- HII’s Newport News Shipbuilding Completes Successful Acceptance Sea Trials of John F. Kennedy (CVN 79)
Create E-mail Alert Related Categories
SEC FilingsSign up for StreetInsider Free!
Receive full access to all new and archived articles, unlimited portfolio tracking, e-mail alerts, custom newswires and RSS feeds - and more!
