




Form 6-K Great Panther Silver For: Nov 04

FREE Breaking News Alerts from StreetInsider.com!
StreetInsider.com Top Tickers, 10/16/2026
- S&P 500 subdued as gains in banks offset AI jitters; Dow at one-month high
- Oil heads for weekly gain with focus on Middle East supply
- Stay risk-off as higher real yields and AI volatility threaten stocks: BofA
- Apple’s first foldable iPhone sells out within minutes as preorders begin
- CoreWeave bond rout tests market's math on AI buildout
 Tweet
Tweet Share
Share E-mail
UNITED STATES
SECURITIES AND EXCHANGE COMMISSION
Washington, D.C. 20549
FORM 6-K
REPORT OF FOREIGN PRIVATE ISSUER PURSUANT TO RULE 13a-16 OR 15d-16
UNDER THE SECURITIES EXCHANGE ACT OF 1934
For the month of November, 2015
Commission File Number: 001-35043
GREAT PANTHER SILVER LIMITED
(Translation of registrant's name into English)
1330 – 200 Granville Street
Vancouver, British Columbia, V6C 1S4, Canada
(Address of principal executive offices)
Indicate by check mark whether the registrant files or will file annual reports under cover Form 20-F or Form 40-F.
[ ] Form 20-F [X] Form 40-F
Indicate by check mark if the registrant is submitting the Form 6-K in paper as permitted by Regulation S-T Rule 101(b)(1): [ ]
Indicate by check mark if the registrant is submitting the Form 6-K in paper as permitted by Regulation S-T Rule 101(b)(7): [ ]
SUBMITTED HEREWITH
Exhibits
SIGNATURE
Pursuant to the requirements of the Securities Exchange Act of 1934, the registrant has duly caused this report to be signed on its behalf by the undersigned, thereunto duly authorized.
| GREAT PANTHER SILVER LIMITED | |
| /s/ Jim A. Zadra | |
| Jim A. Zadra | |
| Chief Financial Officer & Corporate Secretary | |
Date: November 4, 2015
Exhibit 99.1

GREAT PANTHER SILVER LIMITED
CONDENSED INTERIM CONSOLIDATED FINANCIAL STATEMENTS
FOR THE THREE AND NINE MONTHS ENDED
SEPTEMBER 30, 2015 and 2014
Expressed in Canadian Dollars
(Unaudited)
Great Panther Silver Limited
CONDENSED INTERIM CONSOLIDATED STATEMENTS OF FINANCIAL POSITION
(Expressed in thousands of Canadian dollars)
As at September 30, 2015 and December 31, 2014 (Unaudited)
| September 30, | December 31, | |||||||
| 2015 | 2014 | |||||||
| Assets | ||||||||
| Current assets: | ||||||||
| Cash and cash equivalents | $ | 18,685 | $ | 17,968 | ||||
| Trade and other receivables (note 5) | 13,357 | 10,697 | ||||||
| Income taxes recoverable | 37 | 170 | ||||||
| Inventories (note 6) | 7,511 | 8,928 | ||||||
| Other current assets | 1,377 | 750 | ||||||
| 40,967 | 38,513 | |||||||
| Non-current assets: | ||||||||
| Mineral properties, plant and equipment (note 7) | 20,033 | 29,770 | ||||||
| Exploration and evaluation assets (note 8) | 8,466 | 3,081 | ||||||
| Intangible assets | 171 | 366 | ||||||
| Deferred tax asset | 287 | 71 | ||||||
| $ | 69,924 | $ | 71,801 | |||||
| Liabilities and Shareholders’ Equity | ||||||||
| Current liabilities: | ||||||||
| Trade and other payables | $ | 6,242 | $ | 5,606 | ||||
| Non-current liabilities: | ||||||||
| Reclamation and remediation provision | 2,691 | 3,378 | ||||||
| Deferred tax liability | 4,080 | 4,088 | ||||||
| 13,013 | 13,072 | |||||||
| Shareholders’ equity: | ||||||||
| Share capital (note 9) | 125,646 | 124,178 | ||||||
| Reserves | 11,493 | 10,298 | ||||||
| Deficit | (80,228 | ) | (75,747 | ) | ||||
| 56,911 | 58,729 | |||||||
| $ | 69,924 | $ | 71,801 | |||||
See accompanying notes to the condensed interim consolidated financial statements.
Nature of operations (note 1)
Commitments and contingencies (note 12)
Approved by the Board of Directors
| “Robert W. Garnett” | “Jeffrey R. Mason” | |
| Robert W. Garnett, Director | Jeffrey R. Mason, Director |
1
Great Panther Silver Limited
CONDENSED INTERIM CONSOLIDATED STATEMENTS OF COMPREHENSIVE INCOME
(Expressed in thousands of Canadian dollars, except per share data)
For the three and nine months ended September 30, 2015 and 2014 (Unaudited)
For the three months ended September 30, | For the nine months ended September 30, | |||||||||||||||
| 2015 | 2014 | 2015 | 2014 | |||||||||||||
| Revenue | $ | 16,788 | $ | 12,801 | $ | 56,222 | $ | 40,146 | ||||||||
| Cost of sales | ||||||||||||||||
| Production costs | 11,025 | 9,883 | 37,093 | 31,530 | ||||||||||||
| Amortization and depletion | 5,397 | 4,296 | 16,408 | 11,841 | ||||||||||||
| Share-based compensation | 85 | 143 | 248 | 243 | ||||||||||||
| 16,507 | 14,322 | 53,749 | 43,614 | |||||||||||||
| Gross profit (loss) | 281 | (1,521 | ) | 2,473 | (3,468 | ) | ||||||||||
| General and administrative expenses | ||||||||||||||||
| Administrative expenses | 1,524 | 1,289 | 5,185 | 4,582 | ||||||||||||
| Amortization and depletion | 69 | 76 | 194 | 236 | ||||||||||||
| Share-based compensation | 120 | 111 | 334 | 209 | ||||||||||||
| 1,713 | 1,476 | 5,713 | 5,027 | |||||||||||||
| Exploration and evaluation, and development expenses | ||||||||||||||||
| Exploration and evaluation expenses | 1,006 | 445 | 2,210 | 1,227 | ||||||||||||
| Mine development costs (note 2) | 1,037 | 348 | 1,701 | 1,686 | ||||||||||||
| Share-based compensation | 79 | 71 | 224 | 103 | ||||||||||||
| 2,122 | 864 | 4,135 | 3,016 | |||||||||||||
| Finance and other income | ||||||||||||||||
| Interest income | 29 | 41 | 255 | 186 | ||||||||||||
| Finance costs | (71 | ) | (28 | ) | (138 | ) | (105 | ) | ||||||||
| Foreign exchange gain | 591 | 2,123 | 2,720 | 3,061 | ||||||||||||
| Other (expense) income | (41 | ) | 431 | 17 | (186 | ) | ||||||||||
| 508 | 2,567 | 2,854 | 2,956 | |||||||||||||
| Loss before income taxes | (3,046 | ) | (1,294 | ) | (4,521 | ) | (8,555 | ) | ||||||||
| Income tax expense (recovery) | ||||||||||||||||
| Current (recovery) expense | (5 | ) | (97 | ) | 220 | 84 | ||||||||||
| Deferred expense (recovery) | 307 | (227 | ) | (260 | ) | (2,573 | ) | |||||||||
| 302 | (324 | ) | (40 | ) | (2,489 | ) | ||||||||||
| Net loss for the period | $ | (3,348 | ) | $ | (970 | ) | $ | (4,481 | ) | $ | (6,066 | ) | ||||
| Other comprehensive income (loss), net of tax | ||||||||||||||||
| Items that are or may be reclassified subsequently to net income (loss): | ||||||||||||||||
| Foreign currency translation | 593 | (322 | ) | 386 | (288 | ) | ||||||||||
| Change in fair value of available-for-sale financial assets, net of tax | (2 | ) | (16 | ) | (2 | ) | (10 | ) | ||||||||
| 591 | (388 | ) | 384 | (298 | ) | |||||||||||
| Total comprehensive loss for the period | $ | (2,757 | ) | $ | (1,308 | ) | $ | (4,097 | ) | $ | (6,364 | ) | ||||
| Loss per share (note 9(d)) | ||||||||||||||||
| Basic and diluted | $ | (0.02 | ) | $ | (0.01 | ) | $ | (0.03 | ) | $ | (0.04 | ) | ||||
See accompanying notes to the condensed interim consolidated financial statements.
2
Great Panther Silver Limited
CONDENSED INTERIM CONSOLIDATED STATEMENTS OF CHANGES IN SHAREHOLDERS' EQUITY
(Expressed in thousands of Canadian dollars)
For the nine months ended September 30, 2015 and 2014 (Unaudited)
| Share Capital | Reserves | |||||||||||||||||||||||||||||||
| Number of shares (000’s) | Amount | Share options and warrants | Foreign currency translation | Fair value | Total reserves | Deficit | Total shareholders’ equity | |||||||||||||||||||||||||
| Balance at January 1, 2014 | 138,420 | $ | 123,022 | $ | 12,598 | $ | (3,851 | ) | $ | (215 | ) | $ | 8,532 | $ | (42,734 | ) | $ | 88,820 | ||||||||||||||
| Share options exercised | 1,121 | 1,135 | (392 | ) | - | - | (392 | ) | - | 743 | ||||||||||||||||||||||
| Share-based compensation | - | - | 555 | - | - | 555 | - | 555 | ||||||||||||||||||||||||
| Comprehensive income (loss) | - | - | - | (288 | ) | (10 | ) | (298 | ) | (6,066 | ) | (6,364 | ) | |||||||||||||||||||
| Balance at September 30, 2014 | 139,541 | $ | 124,157 | $ | 12,761 | $ | (4,139 | ) | $ | (225 | ) | $ | 8,397 | $ | (48,800 | ) | $ | 83,754 | ||||||||||||||
| Balance at January 1, 2015 | 139,562 | $ | 124,178 | $ | 13,056 | $ | (2,537 | ) | $ | (221 | ) | $ | 10,298 | $ | (75,747 | ) | $ | 58,729 | ||||||||||||||
| Cangold acquisition (note 3) | 2,139 | 1,455 | 9 | - | - | 9 | - | 1,464 | ||||||||||||||||||||||||
| Share options exercised | 12 | 13 | (4 | ) | - | - | (4 | ) | - | 9 | ||||||||||||||||||||||
| Share-based compensation | - | - | 806 | - | - | 806 | - | 806 | ||||||||||||||||||||||||
| Comprehensive income (loss) | - | - | - | 386 | (2 | ) | 384 | (4,481 | ) | (4,097 | ) | |||||||||||||||||||||
| Balance at September 30, 2015 | 141,713 | $ | 125,646 | $ | 13,867 | $ | (2,151 | ) | $ | (223 | ) | $ | 11,493 | $ | (80,228 | ) | $ | 56,911 | ||||||||||||||
See accompanying notes to the condensed interim consolidated financial statements.
3
Great Panther Silver Limited
CONDENSED INTERIM CONSOLIDATED STATEMENTS OF CASH FLOWS
(Expressed in thousands of Canadian dollars)
For the three and nine months ended September 30, 2015 and 2014 (Unaudited)
| Three months ended September 30, | Nine months ended September 30, | |||||||||||||||
| 2015 | 2014 | 2015 | 2014 | |||||||||||||
| Cash flows from operating activities | ||||||||||||||||
| Net loss for the period | $ | (3,348 | ) | $ | (970 | ) | $ | (4,481 | ) | $ | (6,066 | ) | ||||
| Items not involving cash: | ||||||||||||||||
| Amortization and depletion | 5,466 | 4,372 | 16,602 | 12,077 | ||||||||||||
| Unrealized foreign exchange gain | (1,154 | ) | (1,528 | ) | (2,557 | ) | (2,276 | ) | ||||||||
| Income tax expense (recovery) | 302 | (324 | ) | (40 | ) | (2,489 | ) | |||||||||
| Accretion on reclamation and remediation provision | 44 | 28 | 66 | 105 | ||||||||||||
| Share-based compensation | 284 | 325 | 806 | 555 | ||||||||||||
| Other (income) expense | (70 | ) | - | (250 | ) | - | ||||||||||
| Other non-cash items | - | 263 | - | 584 | ||||||||||||
| Interest received | 20 | 35 | 72 | 161 | ||||||||||||
| Income taxes recovered (paid) | 21 | (68 | ) | (257 | ) | (227 | ) | |||||||||
| 1,565 | 2,133 | 9,961 | 2,424 | |||||||||||||
| Changes in non-cash working capital: | ||||||||||||||||
| (Increase) decrease in trade and other receivables | (159 | ) | 3,439 | (1,981 | ) | 4,411 | ||||||||||
| (Increase) decrease in income taxes recoverable | (58 | ) | 128 | - | 457 | |||||||||||
| (Increase) decrease in inventories | (920 | ) | (2,349 | ) | 110 | (1,950 | ) | |||||||||
| (Increase) decrease in other current assets | (108 | ) | 61 | (585 | ) | (835 | ) | |||||||||
| Increase (decrease) in trade and other payables | 227 | 456 | 391 | (755 | ) | |||||||||||
| Net cash from operating activities | 547 | 3,868 | 7,896 | 3,752 | ||||||||||||
| Cash flows from investing activities: | ||||||||||||||||
| Additions to mineral properties, plant and equipment | (1,975 | ) | (2,230 | ) | (5,460 | ) | (6,383 | ) | ||||||||
| Acquisition of Cangold | (35 | ) | - | (1,029 | ) | - | ||||||||||
| Additions to exploration and evaluation assets – Coricancha Mine Complex | (34 | ) | - | (2,191 | ) | - | ||||||||||
| Additions to intangible assets | - | - | - | (18 | ) | |||||||||||
| Net cash used in investing activities | (2,044 | ) | (2,230 | ) | (8,680 | ) | (6,401 | ) | ||||||||
| Cash flows from financing activities: | ||||||||||||||||
| Proceeds from exercise of options | - | 304 | 9 | 742 | ||||||||||||
| Net cash from financing activities | - | 304 | 9 | 742 | ||||||||||||
| Effect of foreign currency translation on cash and cash equivalents | 750 | 382 | 1,492 | 516 | ||||||||||||
| (Decrease) increase in cash and cash equivalents | (747 | ) | 2,324 | 717 | (1,391 | ) | ||||||||||
| Cash and cash equivalents, beginning of period | 19,432 | 18,045 | 17,968 | 21,760 | ||||||||||||
| Cash and cash equivalents, end of period | $ | 18,685 | $ | 20,369 | $ | 18,685 | $ | 20,369 | ||||||||
Supplemental cash flow information (note 14)
See accompanying notes to the condensed interim consolidated financial statements.
4
Great Panther Silver Limited
NOTES TO THE CONDENSED INTERIM CONSOLIDATED FINANCIAL STATEMENTS
(Expressed in thousands of Canadian dollars, except share data)
For the three and nine months ended September 30, 2015 and 2014 (Unaudited)
| 1. | Nature of operations |
Great Panther Silver Limited (the “Company”) is a public company which is listed on the Toronto Stock Exchange and on the NYSE MKT and is incorporated and domiciled in Canada.
The Company’s current activities focus on the mining of precious metals from its operating mines in Mexico, as well as the acquisition, exploration and development of mineral properties within the Americas. The Company wholly owns two producing mining operations: the Topia Mine and the Guanajuato Mine Complex (“GMC”). The GMC comprises the Company’s Guanajuato Mine and Cata processing plant, as well as the San Ignacio satellite mine. The Company also has four other mineral property interests in the exploration stage, El Horcon, Santa Rosa, the Guadalupe de los Reyes gold-silver project in Mexico (the “GDLR Project”), and the Coricancha Mine Complex (“Coricancha”) located in the Central Andes of Peru.
| 2. | Basis of presentation |
These condensed interim consolidated financial statements have been prepared in accordance with International Accounting Standards 34, Interim Financial Reporting (“IAS 34”) using accounting policies consistent with International Financial Reporting Standards (“IFRS”) as issued by the International Accounting Standards Board (“IASB”) and interpretations of the International Financial Reporting Interpretations Committee (“IFRIC”). The accounting policies and critical estimates applied by the Company in these condensed interim consolidated financial statements are the same as those applied in the Company’s annual financial statements as at and for the year ended December 31, 2014. The Company clarified the treatment of mine development costs incurred at the GMC as follows:
In the event that that the Company does not have sufficient evidence to support the probability of generating positive economic returns in the future, mine development costs are expensed in the statement of comprehensive income. The Company has historically expensed mine development costs for the San Ignacio Mine. In September 2015, the Company commenced expensing mine development costs for the Guanajuato Mine when the Company mined and depleted the most recently published Measured and Indicated Resurces for the Guanajuato Mine. Mine development costs incurred at the GMC includes expenditure associated with accessing mineral resources and gaining further information regarding the ore body, whether by means of ramp development, drilling and/or sampling.
The condensed interim consolidated financial statements do not include all of the information required for full annual financial statements. Certain amounts in the prior period have been reclassified to conform to the presentation in the current period.
These condensed interim consolidated financial statements were approved by the Board of Directors on November 3, 2015.
New accounting standards, interpretations and amendments not yet effective
IFRS 15 Revenue from Contracts with Customers
The Company intends to adopt IFRS 15 Revenue from Contracts with Customers in its consolidated financial statements for the annual period beginning on January 1, 2018. The standard contains a single model that applies to contracts with customers and two approaches to recognizing revenue: at a point in time or over time. The model features a contract-based five-step analysis of transactions to determine whether, how much and when revenue is recognized. New estimates and judgmental thresholds have been introduced, which may affect the amount and/or timing of revenue recognized. The extent of the impact of adoption of the standard has not yet been determined.
IFRS 9 Financial Instruments
IFRS 9 Financial Instruments is a new standard that will replace IAS 39, Financial Instruments: Recognition and Measurement, effective for annual periods beginning January 1, 2018. IFRS 9 addresses classification and measurement of financial assets and financial liabilities as well as derecognition of financial instruments. IFRS 9 has two measurement categories for financial assets: amortized cost and fair value. All equity instruments are measured at fair value. A debt instrument is at amortized cost only if the entity is holding it to collect contractual cash flows and the cash flows represent principal and interest. Otherwise it is at fair value through profit or loss. The extent of the impact of adoption of the standard has not yet been determined.
IFRS 7 Financial Instruments: Disclosure
Amended to require additional disclosures on transition from IAS 39 to IFRS 9. The standard is effective on adoption of IFRS 9, which is effective for annual periods commencing on or after January 1, 2018. The Company is currently evaluating the impact these standards are expected to have on its consolidated financial statements.
IFRS 10 Consolidated Financial Statements
The main consequence of the amendments is that a full gain or loss is recognized when a transaction involves a business (whether it is housed in a subsidiary or not). A partial gain or loss is recognized when a transaction involves assets that do not constitute a business, even if the assets are housed in a subsidiary. Upon adoption, the amendments may impact the Company in respect of future sale or contribution of assets with any associates or joint ventures of the Company. The amendments are effective for transactions occurring in annual periods beginning on or after January 1, 2016. The Company is currently evaluating the impact these amendments are expected to have on its consolidated financial statements.
5
Great Panther Silver Limited
NOTES TO THE CONDENSED INTERIM CONSOLIDATED FINANCIAL STATEMENTS
(Expressed in thousands of Canadian dollars, except share data)
For the three and nine months ended September 30, 2015 and 2014 (Unaudited)
| 3. | Cangold acquisition |
On February 26, 2015, the Company announced that it had entered into a binding letter agreement to acquire all of the outstanding shares of Cangold Limited (“Cangold”) by way of a statutory plan of arrangement. As a result, the Company would acquire a 100% interest in Cangold and its wholly-owned subsidiary Coboro Minerales de Mexico, S.A. de C.V. (“Coboro”). Coboro holds an option to acquire the GDLR Project gold-silver project in Mexico and prior to the completion of the Cangold acquisition, Cangold was a related party (with directors in common). Prior to the completion of the Cangold acquisition, the Company, Cangold and a Mexican subsidiary of Cangold also entered into a suite of loan documents (the “Cangold Loan”) whereby the Company continued to provide technical, administrative and management services to Cangold, and discretionary credit advances.
The Cangold Loan included those amounts previously owing from Cangold (December 31, 2014 - $144) for technical, administrative and management services provided prior to the Cangold Loan and also included new credit advances made to Cangold subsequent to February 26, 2015. The Cangold Loan bore interest at 15% and was secured by a general security agreement, as well as a share pledge agreement. The Cangold Loan entitled the Company to receive bonus common shares in Cangold equivalent to 20% of all cash advances under the Cangold Loan, divided by the market price of Cangold’s common shares. Interest was receivable monthly while the outstanding principal amount was receivable from Cangold within 45 days of the Company making such demand.
On May 27, 2015, the Company completed the acquisition of all of the 42,780,600 common shares of Cangold issued and outstanding to third parties, in exchange for 2,138,898 common shares of Great Panther. The Company also issued 475,992 warrants (exercisable at prices ranging from $3.60 per share to $4.00 per share) and 124,250 stock options (exercisable at prices ranging from $2.00 per share to $3.00 per share), replacing warrants and stock options previously issued by Cangold. Of the warrants issued, 225,992 expired on June 12, 2015, while the balance of the issued warrants have an expiry date of December 31, 2015. The Cangold Loan and the Cangold bonus common shares were derecognized upon the completion of the Cangold acquisition. As of the date of the acquisition, the Company had advanced $1,152 to Cangold and had received a total of 3,957,680 bonus common shares (fair valued at $119) in Cangold. In exchange, the Company recognized the acquired interest in exploration and evaluation assets and its interest in the net working capital of Cangold and Coboro as follows:
| Consideration paid | ||||
| Fair value of common shares issued | $ | 1,455 | ||
| Fair value of options and warrants issued (note 9(c)) | 9 | |||
| Cangold Loan derecognized | 1,152 | |||
| Related party receivables derecognized | 197 | |||
| Cangold bonus shares derecognized | 119 | |||
| Professional fees incurred | 161 | |||
| $ | 3,093 | |||
| Amounts recognized | ||||
| Net working capital | $ | 78 | ||
| Furniture, fixtures and equipment | 9 | |||
| Exploration and evaluation assets (note 8) | 3,006 | |||
| $ | 3,093 | |||
The Company determined the fair value of the issued options using the Black Scholes option pricing model, applying the following weighted average assumptions:
| Risk-free interest rate | 0.68 | % | ||
| Expected life (years) | 2.7 | |||
| Annualized volatility | 65 | % | ||
| Forfeiture rate | 0 | % |
Under the terms of the option to acquire the GDLR Project, in order to acquire a 70% interest in the project, the Company has two remaining options payments to be made to Vista Gold Corp. ("Vista"). The first payment of US$1.5 million is due on January 15, 2016 and the second payment of US$2.5 million is due on January 15, 2017. The Company may then purchase the additional 30% by making a positive production decision by January 15, 2027 and paying to Vista US$3.0 million plus an escalator payment based upon the price of gold and the number of National Instrument 43-101 compliant Measured and Indicated gold equivalent ounces at the time of the decision to the extent that such resources exceed the estimate per March 2013 Preliminary Economic Assessment. The escalator payment is only payable if the price of gold is in excess of US$1,600 per ounce based on a formula which increases the amount of the escalator payment by the amount the spot price of gold exceeds US$1,600 per ounce at the time of a positive production decision.
Should the Company elect not to place the project into production, Vista will have the option to buy back the original 70% for US$5.0 million.
6
Great Panther Silver Limited
NOTES TO THE CONDENSED INTERIM CONSOLIDATED FINANCIAL STATEMENTS
(Expressed in thousands of Canadian dollars, except share data)
For the three and nine months ended September 30, 2015 and 2014 (Unaudited)
| 4. | Coricancha option agreement |
On May 19, 2015, the Company announced that it had entered into a two-year option agreement with wholly-owned subsidiaries of Nyrstar N.V. (“Nyrstar”) whereby the Company can acquire a 100% interest in Coricancha. Coricancha is a gold-silver-copper-lead-zinc mine, located in the Peruvian province of Huarochiri, approximately 90 kilometres east of Lima. Coricancha has a processing facility along with supporting mining infrastructure, and has been on care and maintenance since August 2013. Under the terms of the option agreement, the Company made an initial option payment of US$1.5 million and, should the Company choose to extend the option for a second year, a second option payment of US$1.5 million will be due on May 18, 2016. In the event that the Company exercises its option within two years, the Company would be required to make a cash payment of US$5.0 million to Nyrstar for 100% of the shares of Nyrstar Coricancha S.A. A further contingent payment of US$4.0 million may become payable to Nyrstar if certain conditions are met within three years following execution of the Coricancha option agreement. Alternatively (not in addition to the contingent payment), the Company may be obligated to reimburse Nyrstar for certain costs, to a maximum amount of US$6.6 million, under specific circumstances. The contingent payment or the reimbursement will only be made on or after the closing of the acquisition of the Nyrstar Coricancha S.A. shares. The contingent payment will not be payable if the conditions are not met within three years following closing, and no reimbursement will be made unless the costs are incurred by Nyrstar prior to closing. In addition to the cash and option payments to Nyrstar, the Company is required to incur exploration expenditure of US$2.0 million in the first year of the option agreement and US$3.0 million in the second year.
| 5. | Trade and other receivables |
| September 30, 2015 | December 31, 2014 | |||||||
| Trade accounts receivable | $ | 9,051 | $ | 8,074 | ||||
| Value added tax receivable (a) | 4,209 | 2,416 | ||||||
| Cangold Loan (note 3) | - | 144 | ||||||
| Other | 97 | 129 | ||||||
| 13,357 | 10,763 | |||||||
| Allowance for doubtful amounts | - | (66 | ) | |||||
| $ | 13,357 | $ | 10,697 | |||||
| (a) | The Company, through its Mexican subsidiaries, pays value added tax on the purchase and sale of goods and services at a rate of 16%. The net amount paid or payable is recoverable, but such recovery is subject to review and assessment by local tax authorities. |
| 6. | Inventories |
| September 30, 2015 | December 31, 2014 | |||||||
| Concentrate | $ | 4,017 | $ | 5,615 | ||||
| Ore stockpile | 650 | 461 | ||||||
| Materials and supplies | 2,760 | 2,760 | ||||||
| Silver bullion | 84 | 92 | ||||||
| $ | 7,511 | $ | 8,928 | |||||
The amount of inventory recognized as cost of sales for the three and nine months ended September 30, 2015 and 2014 includes production costs and amortization and depletion directly attributable to the inventory production process.
The amount of write-down of inventories to net realizable value for the nine-month period ended September 30, 2015 was $8 (2014 –$20).
7
Great Panther Silver Limited
NOTES TO THE CONDENSED INTERIM CONSOLIDATED FINANCIAL STATEMENTS
(Expressed in thousands of Canadian dollars, except share data)
For the three and nine months ended September 30, 2015 and 2014 (Unaudited)
| 7. | Mineral properties, plant and equipment |
The Company’s mineral properties, plant and equipment comprise the following:
| Mineral properties | Plant and equipment | Land and buildings | Furniture, fixtures and equipment | Total | ||||||||||||||||
| Cost | ||||||||||||||||||||
| Balance, January 1, 2014 | $ | 50,094 | $ | 37,780 | $ | 4,159 | $ | 3,260 | $ | 95,293 | ||||||||||
| Additions | 5,861 | 2,378 | 206 | 344 | 8,789 | |||||||||||||||
| Change in rehabilitation provision asset | 113 | - | - | - | 113 | |||||||||||||||
| Impairment charges | (5,681 | ) | (4,707 | ) | (976 | ) | (379 | ) | (11,743 | ) | ||||||||||
| Disposals | - | (95 | ) | (18 | ) | (3 | ) | (116 | ) | |||||||||||
| Foreign exchange | (1,884 | ) | (1,340 | ) | (140 | ) | (26 | ) | (3,390 | ) | ||||||||||
| Balance, December 31, 2014 | $ | 48,503 | $ | 34,016 | $ | 3,231 | $ | 3,196 | $ | 88,946 | ||||||||||
| Additions | 3,171 | 2,291 | - | 11 | 5,473 | |||||||||||||||
| Change in rehabilitation provision asset | (681 | ) | - | - | - | (681 | ) | |||||||||||||
| Disposals | - | - | - | (26 | ) | (26 | ) | |||||||||||||
| Foreign exchange | 318 | 229 | 25 | 14 | 586 | |||||||||||||||
| Balance, September 30, 2015 | $ | 51,311 | $ | 36,536 | $ | 3,256 | $ | 3,195 | $ | 94,298 | ||||||||||
| Accumulated depreciation | ||||||||||||||||||||
| Balance, January 1, 2014 | $ | 21,961 | $ | 18,010 | $ | 1,859 | $ | 2,187 | $ | 44,017 | ||||||||||
| Amortization and depletion | 11,355 | 5,534 | 126 | 490 | 17,505 | |||||||||||||||
| Disposals | - | (50 | ) | (17 | ) | - | (67 | ) | ||||||||||||
| Foreign exchange | (1,231 | ) | (907 | ) | (66 | ) | (75 | ) | (2,279 | ) | ||||||||||
| Balance, December 31, 2014 | $ | 32,085 | $ | 22,587 | $ | 1,902 | $ | 2,602 | $ | 59,176 | ||||||||||
| Amortization and depletion | 11,758 | 2,946 | 72 | 214 | 14,990 | |||||||||||||||
| Disposals | - | - | - | (20 | ) | (20 | ) | |||||||||||||
| Foreign exchange | (17 | ) | 112 | 13 | 11 | 119 | ||||||||||||||
| Balance, September 30, 2015 | $ | 43,826 | $ | 25,645 | $ | 1,987 | $ | 2,807 | $ | 74,265 | ||||||||||
| Net book value | ||||||||||||||||||||
| December 31, 2014 | $ | 16,418 | $ | 11,429 | $ | 1,329 | $ | 594 | $ | 29,770 | ||||||||||
| September 30, 2015 | $ | 7,485 | $ | 10,891 | $ | 1,269 | $ | 388 | $ | 20,033 | ||||||||||
Change in estimate - useful life of the Topia mineral property
Capitalized costs associated with the Topia mineral property are depleted on a straight line basis over the estimated remaining useful life of the mine. On July 9, 2015, the Company provided an update on the Mineral Resource at the Topia Mine, following which management reviewed the remaining useful life of the Topia mineral property. The estimate of the useful life of the mineral property was determined to be 11 years, an increase from the previous estimate of 6.5 years as at July 1, 2015. As a result, the depletion recorded during the current quarter was approximately $129 less than would have been recorded prior to the change in estimate. Based on the carrying value of the mineral property as at September 30, 2015, management estimated that the impact of the change in estimate on future periods, when compared to the amount that would have otherwise been recorded, is $516 per annum.
8
Great Panther Silver Limited
NOTES TO THE CONDENSED INTERIM CONSOLIDATED FINANCIAL STATEMENTS
(Expressed in thousands of Canadian dollars, except share data)
For the three and nine months ended September 30, 2015 and 2014 (Unaudited)
| 8. | Exploration and evaluation assets |
The Company’s exploration and evaluation assets comprise the following:
| Santa Rosa Property | El Horcon Property | Coricancha Mine Complex | GDLR Project | Total | ||||||||||||||||
| Cost | ||||||||||||||||||||
| Balance, January 1, 2014 | $ | 1,487 | $ | 1,694 | - | - | $ | 3,181 | ||||||||||||
| Foreign exchange | (47 | ) | (53 | ) | - | - | (100 | ) | ||||||||||||
| Balance, December 31, 2014 | $ | 1,440 | $ | 1,641 | $ | - | $ | - | $ | 3,081 | ||||||||||
| Acquisition costs | - | - | 2,191 | 3,006 | 5,231 | |||||||||||||||
| Foreign exchange | 12 | 13 | 163 | - | 154 | |||||||||||||||
| Balance, September 30, 2015 | $ | 1,452 | $ | 1,654 | $ | 2,354 | $ | 3,006 | $ | 8,466 | ||||||||||
| 9. | Share capital |
| (a) | Authorized: |
Unlimited number of common shares without par value
Unlimited number of Class A preferred shares without par value, issuable in series
Unlimited number of Class B preferred shares without par value, issuable in series
| (b) | Issued and fully paid: |
Common shares: 141,712,605 (December 31, 2014 – 139,562,040)
Preferred shares: nil (December 31, 2014 – nil)
| (c) | Share options |
The Company is authorized to grant incentive share options (“options”) to officers, directors, employees and consultants as incentive for their services, subject to limits with respect to insiders. Pursuant to the Company’s 2007 Amended and Restated Incentive Share Option Plan, options are non-transferable, subject to permitted transferees, and the aggregate may not exceed 10% of the outstanding shares at the time of an option grant and the aggregate to any one person may not exceed 5% of the outstanding shares. The exercise price of options is determined by the Board of Directors but shall not be less than the closing price of the common shares on the Toronto Stock Exchange on the last business day immediately preceding the date of grant. Grant date share price is the closing market price on the day the options were granted.
Options granted during the period vest over three years, while the options issued in relation to the Cangold acquisition (note 3) were fully vested. Options have expiry dates of no later than 5 years after the date of grant and will cease to be exercisable 30 days following the termination of the participant’s employment or engagement.
The continuity of share options for the nine-month period ended September 30, 2015 is follows:
| Options | Weighted average exercise price | |||||||
| Outstanding as at December 31, 2014 | 8,492,757 | $ | 1.46 | |||||
| Granted | 3,651,100 | 0.65 | ||||||
| Issued in relation to Cangold acquisition (note 3) | 124,250 | 2.55 | ||||||
| Exercised | (11,667 | ) | 0.75 | |||||
| Forfeited | (1,256,171 | ) | 1.40 | |||||
| Expired | (65,250 | ) | 0.94 | |||||
| Outstanding as at September 30, 2015 | 10,935,019 | $ | 1.21 | |||||
9
Great Panther Silver Limited
NOTES TO THE CONDENSED INTERIM CONSOLIDATED FINANCIAL STATEMENTS
(Expressed in thousands of Canadian dollars, except share data)
For the three and nine months ended September 30, 2015 and 2014 (Unaudited)
| 9. | Share capital - continued |
| (c) | Share options - continued |
The following table summarized information about the share options outstanding and exercisable as at September 30, 2015:
| Share options outstanding | Share options exercisable | |||||||||||||||
| Range of exercise price | Options outstanding | Weighted average remaining contractual life (years) | Options exercisable | Weighted average exercise price | ||||||||||||
| $0.45 to $0.90 | 5,040,768 | 3.7 | 1,120,000 | $ | 0.71 | |||||||||||
| $0.92 to $1.71 | 4,021,251 | 3.1 | 1,995,419 | 1.42 | ||||||||||||
| $1.76 to $1.78 | 135,000 | 2.1 | 135,000 | 1.78 | ||||||||||||
| $1.90 to $2.25 | 275,750 | 1.5 | 275,750 | 2.14 | ||||||||||||
| $2.40 to $3.00 | 1,462,250 | 1.2 | 1,462,250 | 2.43 | ||||||||||||
| 10,935,019 | 3.1 | 4,988,419 | $ | 1.61 | ||||||||||||
During the nine months ended September 30, 2015, the Company recorded share-based compensation expense of $806 (nine months ended September 2014 - $555) and capitalized $9 of share-based compensation associated with the Cangold acquisition.
The weighted average fair value per option granted during the nine-month period ended September 30, 2015 was $0.22 (nine-month period ended September 30, 2014 - $0.62). The fair value per option granted was determined using the following weighted average assumptions at the time of the grant using the Black Scholes option pricing model as follows:
| 2015 | 2014 | |||||||
| Risk-free interest rate | 0.64 | % | 1.36 | % | ||||
| Expected life (years) | 1.98 | 3.96 | ||||||
| Annualized volatility | 67 | % | 65 | % | ||||
| Forfeiture rate | 18 | % | 19 | % | ||||
The annualized volatility assumption is based on the historical and implied volatility of the Company’s Canadian dollar common share price on the Toronto Stock Exchange. The risk-free interest rate assumption is based on yield curves on Canadian government bonds with a remaining term equal to the expected life of the options.
| (d) | Earnings per share and diluted earnings per share: |
Earnings per share for the three and nine months ended September 30, 2015 were calculated based on the following:
| Three months ended September 30 | Nine months ended September 30 | |||||||||||||||
| 2015 | 2014 | 2015 | 2014 | |||||||||||||
| Net loss for the period | $ | (3,348 | ) | $ | (970 | ) | $ | (4,481 | ) | $ | (6,066 | ) | ||||
| Shares outstanding, beginning of period | 141,712,605 | 139,147,708 | 139,562,040 | 138,419,715 | ||||||||||||
| Effect of share options exercised | - | 184,473 | 10,470 | 595,486 | ||||||||||||
| Effect of Cangold acquisition (note 3) | - | - | 995,018 | - | ||||||||||||
| Basic weighted average number of shares outstanding | 141,712,605 | 139,332,181 | 140,567,529 | 139,015,201 | ||||||||||||
| Effect of dilutive share options | - | - | - | - | ||||||||||||
| Diluted weighted average number of shares outstanding | 141,712,605 | 139,332,181 | 140,567,529 | 139,015,201 | ||||||||||||
| Earnings (loss) per share | ||||||||||||||||
| Basic and diluted | $ | (0.02 | ) | $ | (0.01 | ) | $ | (0.03 | ) | $ | (0.04 | ) | ||||
10
Great Panther Silver Limited
NOTES TO THE CONDENSED INTERIM CONSOLIDATED FINANCIAL STATEMENTS
(Expressed in thousands of Canadian dollars, except share data)
For the three and nine months ended September 30, 2015 and 2014 (Unaudited)
| 10. | Fair value of financial instruments |
The Company’s financial instruments include cash and cash equivalents, short term investments, marketable securities, trade and other receivables, and trade and other payables. The carrying values of cash and cash equivalents, short term investments, trade and other receivables, and trade and other payables approximate their fair values due to the short-term nature of the items. The fair values of marketable securities are based on current bid prices at September 30, 2015. The embedded derivative in the trade account is recorded at fair value each period until final settlement occurs with changes in fair value classified as a component of revenue.
In evaluating fair value information, considerable judgment is required to interpret the market data used to develop the estimates. The use of different market assumptions and valuation techniques may have a material effect on the estimated fair value amounts. Accordingly, the estimates of fair value presented herein may not be indicative of the amounts that could be realized in a current market exchange.
IFRS requires disclosures about the inputs to fair value measurements, including their classification within a hierarchy that prioritizes the inputs to fair value measurement. The three levels of the fair value hierarchy are:
| · | Level 1 – Unadjusted quoted prices in active markets for identical assets or liabilities; |
| · | Level 2 – Inputs other than quoted prices that are observable for the asset or liability either directly or indirectly; and |
| · | Level 3 – Inputs that are not based on observable market data |
There have been no transfers between fair value levels during the reporting period.
The following table summarizes the Company’s financial instruments as at September 30, 2015:
| Available-for- sale financial assets | Loans and receivables | Financial liabilities at amortized cost | Total | Fair value hierarchy | ||||||||||||||||
| Financial assets | ||||||||||||||||||||
| Cash and cash equivalents | $ | - | $ | 18,685 | $ | - | $ | 18,685 | n/a | |||||||||||
| Marketable securities | 4 | - | - | 4 | Level 1 | |||||||||||||||
| Trade and other receivables | - | 13,357 | - | 13,357 | Level 2 | |||||||||||||||
| Financial liabilities | ||||||||||||||||||||
| Trade and other payables | - | - | (6,242 | ) | (6,242 | ) | n/a | |||||||||||||
At September 30, 2015 receivables of $Nil (December 31, 2014 - $66) were impaired and provided for.
| 11. | Related party transactions |
| Three months ended September 30 | Nine months ended September 30 | |||||||||||||||
| 2015 | 2014 | 2015 | 2014 | |||||||||||||
| Consulting fees paid or accrued to Platoro Resource Corp. | $ | - | $ | 127 | $ | - | $ | 336 | ||||||||
| Technical, administrative and management services provided to Cangold and its subsidiary prior to completion of the Cangold acquisition (note 3) | $ | - | $ | (58 | ) | $ | (224 | ) | $ | (118 | ) | |||||
| September 30, 2015 | December 31, 2014 | |||||||
| Receivable from Directors | $ | 8 | $ | - | ||||
| Payable to Platoro Resource Corp. | $ | - | $ | (36 | ) | |||
| Receivable from Cangold | $ | - | $ | 144 | ||||
| Receivable from Coboro | $ | - | $ | 17 | ||||
The amounts owing to Platoro Resource Corp. were included in trade and other payables. The amounts owing from Cangold and Coboro derecognized upon the completion of the Cangold acquisition (note 3).
The above transactions occurred in the normal course of operations and are measured at fair value.
11
Great Panther Silver Limited
NOTES TO THE CONDENSED INTERIM CONSOLIDATED FINANCIAL STATEMENTS
(Expressed in thousands of Canadian dollars, except share data)
For the three and nine months ended September 30, 2015 and 2014 (Unaudited)
| 11. | Related party transactions - continued |
Compensation of key management personnel
Key management includes the Company’s Directors, the President and Chief Executive Officer, the Chief Financial Officer, the Chief Operating Officer and the Company’s Vice Presidents. The amounts owing to key management personnel were included in trade and other payables. The Company is committed to making severance payments amounting to approximately $2,348 to certain officers and management in the event that there is a change of control of the Company. The remuneration of directors and other members of key management personnel during the three and nine months ended September 30, 2015 and 2014 was as follows:
| Three months ended September 30 | Nine months ended September 30 | |||||||||||||||
| 2015 | 2014 | 2015 | 2014 | |||||||||||||
| Salaries and benefits, consulting and management fees | $ | 415 | $ | 493 | $ | 1,468 | $ | 1,358 | ||||||||
| Directors fees paid or accrued | 77 | 90 | 247 | 219 | ||||||||||||
| Termination benefits | - | 61 | 48 | 61 | ||||||||||||
| Share-based compensation | 89 | 137 | 249 | 234 | ||||||||||||
| $ | 581 | $ | 781 | $ | 2,012 | $ | 1,872 | |||||||||
| 12. | Commitments and contingencies |
As of September 30, 2015, the Company had the following commitments:
| Total | 1 year | 2-3 years | 4-5 years | Thereafter | ||||||||||||||||
| Operating lease payments | $ | 2,230 | $ | 279 | $ | 641 | $ | 611 | $ | 699 | ||||||||||
| Drilling services | 84 | 84 | - | - | - | |||||||||||||||
| Total commitments | $ | 2,314 | $ | 363 | $ | 641 | $ | 611 | $ | 699 | ||||||||||
| 13. | Operating segments |
The Company’s operations are all within the mining sector, consisting of two operating segments both of which are located in Mexico, one exploration and one Corporate. Due to diversities in geography and production processes, the Company operates the GMC and the Topia Mine separately, with separate budgeting and evaluation of results of operations and exploration activities. The Corporate segment provides financial, human resources and technical support to the two mining operations and exploration activities. The GMC operations produce silver and gold, and the Topia operations produce silver, gold, lead and zinc.
| Operations | ||||||||||||||||||||
| GMC | Topia | Exploration(1)(2) | Corporate | Total | ||||||||||||||||
| Three months ended September 30, 2015 | ||||||||||||||||||||
| External mineral sales | $ | 11,921 | $ | 3,831 | $ | - | $ | 1,037 | $ | 16,788 | ||||||||||
| Intersegment revenue | 1,037 | - | - | (1,037 | ) | - | ||||||||||||||
| Intersegment elimination | (1,037 | ) | - | - | 1,037 | - | ||||||||||||||
| Income (loss) before income taxes | (2,258 | ) | (168 | ) | (366 | ) | (254 | ) | (3,046 | ) | ||||||||||
| Net income (loss) for the period | (2,171 | ) | (122 | ) | (366 | ) | (689 | ) | (3,348 | ) | ||||||||||
| Nine months ended September 30, 2015 | ||||||||||||||||||||
| External mineral sales | $ | 9,177 | $ | 11,763 | $ | - | $ | 35,281 | $ | 56,222 | ||||||||||
| Intersegment revenue | 35,281 | - | - | (35,281 | ) | - | ||||||||||||||
| Intersegment elimination | (35,281 | ) | - | - | 35,281 | - | ||||||||||||||
| Income (loss) before income taxes | (34,817 | ) | 9 | (1,335 | ) | 31,622 | (4,521 | ) | ||||||||||||
| Net income (loss) for the period | (34,785 | ) | 11 | (1,335 | ) | 31,628 | (4,481 | ) | ||||||||||||
| As at September 30, 2015 | ||||||||||||||||||||
| Total assets | $ | 19,570 | $ | 16,746 | $ | 9,337 | $ | 24,271 | $ | 69,924 | ||||||||||
| Total liabilities | $ | 6,191 | $ | 1,963 | $ | 86 | $ | 4,773 | $ | 13,013 | ||||||||||
| (1) | Includes the Company’s exploration and evaluation assets of Santa Rosa, El Horcon, Coricancha Mine Complex and the GDLR Project. |
| (2) | In May 2015, the Company expanded its geographic reach to Peru. As of September 30, 2015, the non-current assets associated with this geographic segment had a carrying value of $1,964 (December 31, 2014 - $Nil). |
12
Great Panther Silver Limited
NOTES TO THE CONDENSED INTERIM CONSOLIDATED FINANCIAL STATEMENTS
(Expressed in thousands of Canadian dollars, except share data)
For the three and nine months ended September 30, 2015 and 2014 (Unaudited)
| 13. | Operating segments - continued |
| Operations | ||||||||||||||||||||
| GMC | Topia | Exploration(1) | Corporate | Total | ||||||||||||||||
| Three months ended September 30, 2014 | ||||||||||||||||||||
| External mineral sales | $ | (819 | ) | $ | 2,965 | $ | - | $ | 10,655 | $ | 12,801 | |||||||||
| Intersegment revenue | 10,655 | - | - | (10,655 | ) | - | ||||||||||||||
| Intersegment elimination | (10,655 | ) | - | - | 10,655 | - | ||||||||||||||
| Income (loss) before income taxes | (10,832 | ) | (173 | ) | (168 | ) | 9,879 | (1,294 | ) | |||||||||||
| Net income (loss) for the period | (10,935 | ) | (220 | ) | (168 | ) | 10,353 | (970 | ) | |||||||||||
| Nine months ended September 30, 2014 | ||||||||||||||||||||
| External mineral sales | $ | (3,844 | ) | $ | 11,442 | $ | - | $ | 32,548 | $ | 40,146 | |||||||||
| Intersegment revenue | 32,548 | - | - | (32,548 | ) | - | ||||||||||||||
| Intersegment elimination | (32,548 | ) | - | - | 32,548 | - | ||||||||||||||
| Income (loss) before income taxes | (36,257 | ) | 209 | (373 | ) | 27,865 | (8,555 | ) | ||||||||||||
| Net income (loss) for the period | (36,396 | ) | 127 | (373 | ) | 30,576 | (6,066 | ) | ||||||||||||
| December 31, 2014 | ||||||||||||||||||||
| Total assets | $ | 22,033 | $ | 18,346 | $ | 3,081 | $ | 28,341 | $ | 71,801 | ||||||||||
| Total liabilities | $ | 4,952 | $ | 2,584 | $ | - | $ | 5,536 | $ | 13,072 | ||||||||||
| (1) | Includes the Company’s exploration and evaluation assets of Santa Rosa and El Horcon. |
| 14. | Supplemental cash flow information |
| a) | The non-cash investing and financing activities of the Company includes the following: |
| Three months ended September 30 | Nine months ended September 30 | |||||||||||||||
| 2015 | 2014 | 2015 | 2014 | |||||||||||||
| (Decrease) increase in accounts payable and accrued liabilities related to mineral properties, plant and equipment | $ | (72 | ) | $ | 61 | $ | 1 | $ | 142 | |||||||
| Change in rehabilitation provision asset | - | - | 597 | - | ||||||||||||
| Non-cash consideration related to Cangold Acquisition (note 3) | - | - | 1,977 | - | ||||||||||||
| b) | Undrawn credit facilities |
On June 10, 2015, the Company announced that it had obtained a US$10.0 million credit facility from Auramet International LLC. The facility has a term of one year and bears interest at a rate of LIBOR plus 5%. The Company has not drawn down any amounts on this credit facility.
13
Exhibit 99.2

GREAT PANTHER SILVER LIMITED
MANAGEMENT’S DISCUSSION AND ANALYSIS
FOR THE THREE AND NINE MONTHS ENDED SEPTEMBER 30, 2015
TABLE OF CONTENTS
| PROFILE AND STRATEGY | 3 |
| OVERALL PERFORMANCE - OPERATIONAL AND FINANCIAL HIGHLIGHTS | 4 |
| SIGNIFICANT EVENTS | 5 |
| MINING OPERATIONS | 6 |
| RESOURCE UPDATE | 13 |
| SUMMARY OF SELECTED QUARTERLY INFORMATION | 15 |
| RESULTS OF OPERATIONS | 16 |
| OUTLOOK | 23 |
| NON-IFRS MEASURES | 24 |
| LIQUIDITY AND CAPITAL RESOURCES | 29 |
| TRANSACTIONS WITH RELATED PARTIES | 31 |
| CRITICAL ACCOUNTING ESTIMATES | 32 |
| CHANGES IN ACCOUNTING POLICIES | 33 |
| FINANCIAL INSTRUMENTS | 34 |
| SECURITIES OUTSTANDING | 34 |
| QUALIFIED PERSON | 34 |
| INTERNAL CONTROLS OVER FINANCIAL REPORTING | 34 |
| DISCLOSURE CONTROLS AND PROCEDURES | 34 |
| CAUTIONARY STATEMENT ON FORWARD-LOOKING STATEMENTS | 34 |
| CAUTIONARY NOTE TO U.S. INVESTORS | 36 |
GREAT PANTHER SILVER LIMITED Management’s Discussion & Analysis | Page 2 |
This Management’s Discussion and Analysis (“MD&A”) should be read in conjunction with the unaudited condensed interim consolidated financial statements of Great Panther Silver Limited (“Great Panther” or the “Company”) for the three and nine-month periods ended September 30, 2015 and the notes related thereto, which are prepared in accordance with International Financial Reporting Standards (“IFRS”) as issued by the International Accounting Standards Board, as well as the annual audited consolidated financial statements for the year ended December 31, 2014, the related annual MD&A, and the annual Form 40–F/Annual Information Form (“AIF”) on file with the US Securities and Exchange Commission (“SEC”) and Canadian provincial securities regulatory authorities.
All information in this MD&A is current as at November 3, 2015, unless otherwise indicated. All dollar amounts are in Canadian dollars, unless otherwise noted.
This MD&A contains forward-looking statements and should be read in conjunction with the Cautionary Statement on Forward-Looking Statements section at the end of this MD&A.
This MD&A also makes reference to cash cost per payable silver ounce (“cash cost”), EBITDA, adjusted EBITDA, cost of sales before non-cash items, gross profit before non-cash items and all-in sustaining cost per payable silver ounce (“AISC”). These are considered non-IFRS measures. Please refer to the Non-IFRS Measures section of this MD&A for an explanation of these measures and reconciliations to the Company’s reported financial results.
PROFILE AND STRATEGY
Great Panther Silver Limited (“Great Panther” or the “Company”) is a primary silver mining and precious metals exploration company listed on the Toronto Stock Exchange (the “TSX”) trading under the symbol GPR, and on the NYSE MKT LLC (the “NYSE MKT”) trading under the symbol GPL. The Company’s wholly-owned mining operations in Mexico are the Topia Mine (or “Topia”), and the Guanajuato Mine Complex (the “GMC”) which comprises the Company’s Guanajuato Mine, Cata processing plant, and the San Ignacio Mine (or “San Ignacio”). The Company’s exploration projects in Mexico include El Horcón, Santa Rosa and an option to purchase up to a 100% interest in the advanced stage Guadalupe de los Reyes project (the “GDLR Project”), gained through the acquisition of Cangold Limited (“Cangold”) in the second quarter of 2015. The Company also entered into an option agreement in the second quarter of 2015 to acquire a 100% interest in the Coricancha Mine Complex (“Coricancha”), located in the central Andes of Peru. Significant exploration programs have been initiated at Coricancha and the GDLR Project, and the Company continues to evaluate additional mining opportunities in the Americas.
The GMC produces silver and gold and is located in central Mexico, approximately 380 kilometres north-west of Mexico City. The Topia Mine is located in the Sierra Madre Mountains in the state of Durango in northwestern Mexico and produces silver, gold, lead and zinc. The GMC and Topia Mine each have their own processing facility.
Coricancha is a gold-silver-copper-lead-zinc mine, located in the Peruvian province of Huarochiri, approximately 90 kilometres east of Lima, and has been on care and maintenance since August 2013. Coricancha has a fully-permitted and operational 600 tonne per day processing facility along with supporting mining infrastructure. The GDLR Project is a gold and silver project located in the foothills of the Sierra Madre Mountains in the state of Sinaloa in northwestern Mexico.
The Company’s Santa Rosa Project is located approximately 15 kilometres northeast of Guanajuato, and the El Horcón Project is located 100 kilometres by road northwest of Guanajuato.
The Topia Mine, the GMC, El Horcón and Santa Rosa are held through Minera Mexicana el Rosario, S.A. de C.V. (“MMR”), a wholly-owned subsidiary acquired in February 2004. In 2005, the Company incorporated Metálicos de Durango, S.A. de C.V. and Minera de Villa Seca, S.A. de C.V. These two operating subsidiaries of the Company are responsible for the day-to-day affairs and operations of the Topia Mine and the GMC, respectively, through service agreements with MMR. The option to acquire the GDLR Project is held by a wholly-owned Mexican subsidiary, Coboro Minerales de Mexico, S.A. de C.V. (“Coboro”), which was acquired as part of the acquisition of Cangold in May 2015. The option to acquire Coricancha is held by another wholly-owned subsidiary, Great Panther Silver Peru S.A.C.
GREAT PANTHER SILVER LIMITED Management’s Discussion & Analysis | Page 3 |
As part of the Cangold acquisition, the Company also acquired 100% interests in the Plomo property located in Sonora, Mexico and the Argosy property located in the Red Lake Mining District in Northwestern Ontario. There are no work commitments associated with these properties other than assessment work and payment of mining claims taxes and the Company is currently evaluating its future plans for these properties.
Additional information on the Company, including its AIF, can be found on SEDAR at www.sedar.com and EDGAR at www.sec.gov/edgar.shtml or on the Company’s website at www.greatpanther.com.
OVERALL PERFORMANCE - OPERATIONAL AND FINANCIAL HIGHLIGHTS
| (in CAD
000s except ounces, amounts per share and per ounce) | Q3 2015 | Q3 2014 | % change | Nine
months ended Sep 30, 2015 | Nine
months ended Sep 30, 2014 | % change | ||||||||||||||||||
| OPERATING | ||||||||||||||||||||||||
| Tonnes milled (excluding custom milling) | 93,730 | 89,030 | 5 | % | 280,458 | 242,625 | 16 | % | ||||||||||||||||
| Silver equivalent ounces (“Ag eq oz”) produced1 | 1,080,296 | 890,641 | 21 | % | 3,156,538 | 2,276,784 | 39 | % | ||||||||||||||||
| Silver ounce production | 586,918 | 565,965 | 4 | % | 1,832,839 | 1,356,634 | 35 | % | ||||||||||||||||
| Gold ounce production | 6,079 | 4,200 | 45 | % | 16,103 | 11,639 | 38 | % | ||||||||||||||||
| Payable silver ounces | 545,787 | 461,249 | 18 | % | 1,776,025 | 1,194,839 | 49 | % | ||||||||||||||||
| Cost per tonne milled (USD)2 | $ | 96 | $ | 122 | -21 | % | $ | 102 | $ | 123 | -17 | % | ||||||||||||
| Cash cost per payable silver ounce (USD)2 | $ | 6.50 | $ | 11.02 | -41 | % | $ | 7.32 | $ | 13.02 | -44 | % | ||||||||||||
| AISC per payable silver ounce (USD)2 | $ | 13.08 | $ | 19.25 | -32 | % | $ | 13.38 | $ | 22.35 | -40 | % | ||||||||||||
| FINANCIAL | ||||||||||||||||||||||||
| Revenue | $ | 16,788 | $ | 12,801 | 31 | % | $ | 56,222 | $ | 40,146 | 40 | % | ||||||||||||
| Gross profit before non-cash items2 | $ | 5,763 | $ | 2,918 | 97 | % | $ | 19,129 | $ | 8,616 | 122 | % | ||||||||||||
| Gross profit (loss) | $ | 281 | $ | (1,521 | ) | 118 | % | $ | 2,473 | $ | (3,468 | ) | 171 | % | ||||||||||
| Net income (loss) | $ | (3,348 | ) | $ | (970 | ) | -245 | % | $ | (4,481 | ) | $ | (6,066 | ) | 26 | % | ||||||||
| Adjusted EBITDA2 | $ | 2,155 | $ | 1,267 | 70 | % | $ | 10,050 | $ | 935 | 975 | % | ||||||||||||
| Cash flow from operating activities3 | $ | 1,565 | $ | 2,133 | -27 | % | $ | 9,961 | $ | 2,424 | 311 | % | ||||||||||||
| Cash at end of period | $ | 18,685 | $ | 20,369 | -8 | % | $ | 18,685 | $ | 20,369 | -8 | % | ||||||||||||
| Net working capital at end of period | $ | 34,725 | $ | 35,287 | -2 | % | $ | 34,725 | $ | 35,287 | -2 | % | ||||||||||||
| Average realized silver price (USD)4 | $ | 13.98 | $ | 16.69 | -16 | % | $ | 15.55 | $ | 19.40 | -20 | % | ||||||||||||
| PER SHARE AMOUNTS | ||||||||||||||||||||||||
| Loss per share – basic and diluted | $ | (0.02 | ) | $ | (0.01 | ) | -100 | % | $ | (0.03 | ) | $ | (0.04 | ) | 25 | % | ||||||||
| 1 | Silver equivalent ounces are referred to throughout this document. For 2015, Aq eq oz are calculated using a 65:1 Ag:Au ratio, and ratios of 1:0.050 and 1:0.056 for the price/ounce of silver to lead and zinc price/pound, and applied to the relevant metal content of the concentrates produced, expected to be produced, or sold from operations. Comparatively, in 2014 Aq eq oz was established using prices of US$18.50 per oz, US$1,110 per oz (60:1 ratio), US$0.90 per lb., and US$0.85 per lb. for silver, gold, lead and zinc, respectively. |
| 2 | The Company has included the non-IFRS performance measures cost per tonne milled, cash cost per silver payable ounce, all-in sustaining cost per silver payable ounce (“AISC”), gross profit before non-cash items, cost of sales before non-cash items and adjusted EBITDA throughout this document. Refer to the Non-IFRS Measures section of this MD&A for an explanation of these measures and reconciliation to the Company’s reported financial results in accordance with IFRS. As these are not standardized measures, they may not be directly comparable to similarly titled measures used by others. |
| 3 | Before changes in non-cash working capital. |
| 4 | Average realized silver price is prior to smelting and refining charges. |
GREAT PANTHER SILVER LIMITED Management’s Discussion & Analysis | Page 4 |
Highlights of the third quarter 2015 compared to third quarter 2014, unless otherwise noted:
| · | Metal production increased 21% to 1,080,296 Ag eq oz; |
| · | Silver production increased 4% to 586,918 silver ounces; |
| · | Record gold production of 6,079 gold ounces, an increase of 45%; |
| · | Cash cost per payable silver ounce decreased 41% to US$6.50 per ounce; |
| · | AISC decreased 32% to US$13.08 per payable silver ounce; |
| · | Revenues increased 31% to $16.8 million; |
| · | Adjusted EBITDA increased to $2.2 million compared to $1.3 million; |
| · | Net loss totalled $3.3 million, compared to a net loss of $1.0 million; |
| · | Cash flow from operating activities, before changes in non-cash net working capital (“NCWC”), amounted to $1.6 million, compared to $2.1 million; |
| · | Cash and cash equivalents were $18.7 million at September 30, 2015 compared to $18.0 million at December 31, 2014; and |
| · | Net working capital increased to $34.7 million at September 30, 2015 from $32.9 million at December 31, 2014. |
Highlights compared to second quarter 2015, unless otherwise noted:
| · | Metal production on a Ag eq oz basis remained largely unchanged; |
| · | Silver production decreased by 10% while gold production increased by 14%; |
| · | Cash cost per payable silver ounce decreased 2%; |
| · | AISC increased 4%; |
| · | Revenues decreased 12%; |
| · | Adjusted EBITDA decreased to $2.2 million from $4.2 million; and, |
| · | Cash flow from operating activities, before changes in NCWC, decreased by $2.0 million. |
SIGNIFICANT EVENTS
On July 9, 2015, the Company provided an update to the Mineral Resource at the Topia Mine, with an effective date of November 30, 2014. Measured and Indicated (“M&I”) Mineral Resources increased by 41% and Inferred Mineral Resources increased by 29% compared to the previous update, which had an effective date of November 30, 2013. The M&I category benefitted from improvements in the reconciliation between the Topia geological model and the actual mine output, while the increase in the Inferred category is attributed to improved modeling and successful in-vein development, which allowed for an expansion of resource block dimensions. This Mineral Resource Estimate reflects M&I Resources of 11,580,000 Ag eq oz and Inferred Mineral Resources of 11,050,000 Ag eq oz. See Resource Update in this MD&A for more details.
On October 14, 2015, the Company announced production results for the third quarter of 2015 and that it expects to exceed its 2015 production guidance of 3.8 to 3.9 million Ag eq oz. The Company also announced its expectation to achieve lower cash cost and AISC than guidance. Please refer to the Outlook section of this document for further details.
GREAT PANTHER SILVER LIMITED Management’s Discussion & Analysis | Page 5 |
MINING OPERATIONS
Consolidated operations
| 2015 | 2014 | 2013 | ||||||||||||||||||||||||||||||
| Q3 | Q2 | Q1 | Q4 | Q3 | Q2 | Q1 | Q4 | |||||||||||||||||||||||||
| Tonnes mined1 | 96,770 | 84,979 | 99,847 | 92,782 | 89,467 | 79,268 | 69,998 | 72,556 | ||||||||||||||||||||||||
| Tonnes milled | 93,730 | 87,476 | 99,252 | 92,574 | 89,030 | 80,964 | 72,631 | 69,601 | ||||||||||||||||||||||||
| Custom milling (tonnes) | 1,346 | 1,560 | 1,198 | 2,312 | 1,852 | 1,929 | 2,965 | 2,188 | ||||||||||||||||||||||||
| Total tonnes milled | 95,076 | 89,036 | 100,450 | 94,886 | 90,882 | 82,893 | 75,596 | 71,789 | ||||||||||||||||||||||||
| Production | ||||||||||||||||||||||||||||||||
| Silver (ounces) | 586,918 | 648,810 | 597,111 | 550,010 | 565,966 | 420,001 | 370,668 | 484,937 | ||||||||||||||||||||||||
| Gold (ounces) | 6,079 | 5,322 | 4,703 | 4,822 | 4,200 | 3,773 | 3,666 | 3,881 | ||||||||||||||||||||||||
| Lead (tonnes) | 341 | 300 | 279 | 285 | 259 | 302 | 308 | 286 | ||||||||||||||||||||||||
| Zinc (tonnes) | 493 | 491 | 441 | 406 | 443 | 395 | 431 | 402 | ||||||||||||||||||||||||
| Silver equivalent ounces | 1,080,296 | 1,088,355 | 987,887 | 911,048 | 890,641 | 718,794 | 667,349 | 763,881 | ||||||||||||||||||||||||
| Payable silver ounces | 545,787 | 607,898 | 622,339 | 534,664 | 461,249 | 381,302 | 352,288 | 508,801 | ||||||||||||||||||||||||
| Cost per tonne milled (USD) | $ | 96 | $ | 109 | $ | 102 | $ | 111 | $ | 122 | $ | 125 | $ | 121 | $ | 120 | ||||||||||||||||
| Metrics per payable silver ounce | ||||||||||||||||||||||||||||||||
| Cash cost (USD) | $ | 6.50 | $ | 6.63 | $ | 8.71 | $ | 12.23 | $ | 11.02 | $ | 15.03 | $ | 13.49 | $ | 8.85 | ||||||||||||||||
| AISC (USD) | $ | 13.08 | $ | 12.54 | $ | 14.47 | $ | 21.46 | $ | 19.25 | $ | 24.40 | $ | 24.18 | $ | 15.77 | ||||||||||||||||
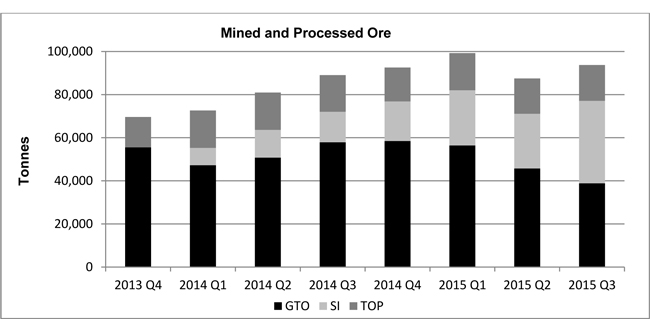
During the third quarter 2015, ore processed totaled 93,730 tonnes, a 5% increase compared to the third quarter of 2014, and a 7% increase compared to the prior quarter. The increases reflect the continued ramp-up in production at the San Ignacio Mine since commercial production commenced in June 2014. The pursuit of efficiencies and improved grade control, combined with an increase in throughput, enabled the Company to maintain its metal production at levels in excess of one million Ag eq oz for the third quarter of 2015.
| 1 | Excludes purchased ore. |
GREAT PANTHER SILVER LIMITED Management’s Discussion & Analysis | Page 6 |
The 21% increase in production compared to the third quarter of 2014 reflects the ramp-up in production at San Ignacio Mine and higher ore grades at all operations. The higher average grades were achieved through improvements in grade control, application of higher grade cut-offs at the Guanajuato Mine, and generally higher grade resources at San Ignacio. Production remained within 1% of the record metal production reported in the second quarter of 2015.
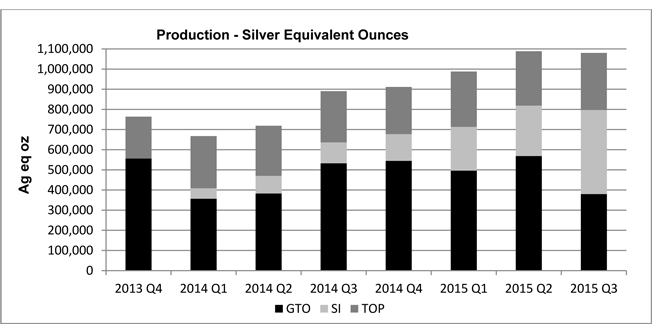
Cash cost was US$6.50 for the third quarter of 2015, a 41% decrease compared to US$11.02 for the third quarter of 2014. The decrease in cash cost was due to the increase in ore grades at all operations which contributed to an 18% increase in payable silver ounces and higher by-product credits. In addition, the strengthening of the US dollar compared to the Mexican peso reduced cash operating costs in US dollar terms.
Cash cost decreased compared to the US$6.63 realized in the second quarter of 2015 due to the strengthening of the US dollar against the Mexican peso, which reduced cash operating costs reported in US dollar terms. These factors were partially offset by lower by-product credits during the third quarter compared to the second quarter of 2015, due mainly to lower gold prices.
Cash cost and the associated by-product credits are computed based on sales during the period as opposed to production. As such, the amount of the by-product credit may not directly correlate to the production reported for the period. Similarly, the cost per tonne milled during the period may not directly correlate to the cash cost reported for the same period due to a lag between production and sales.
AISC for the third quarter of 2015 decreased to US$13.08 from US$19.25 in the third quarter of 2014. This 32% decrease is primarily due to the reduction in cash cost. In addition, there was a reduction in general and administrative (G&A), sustaining exploration and evaluation (“E&E”) and sustaining capital expenditures (all in US dollar terms) on a per payable ounce basis as a result of the increase in payable silver ounces noted above and the strengthening of the US dollar against the Canadian dollar and the Mexican peso.
Compared to the second quarter of 2015, AISC increased from US$12.54 to US$13.08, due to a 10% decrease in payable ounces in the third quarter of 2015.
GREAT PANTHER SILVER LIMITED Management’s Discussion & Analysis | Page 7 |
Guanajuato Mine Complex
| 2015 | 2014 | 2013 | ||||||||||||||||||||||||||||||
| GUANAJUATO MINE | Q3 | Q2 | Q1 | Q4 | Q3 | Q2 | Q1 | Q4 | ||||||||||||||||||||||||
| Tonnes milled | 38,854 | 45,734 | 56,417 | 58,467 | 57,887 | 50,766 | 47,243 | 55,547 | ||||||||||||||||||||||||
| Production | ||||||||||||||||||||||||||||||||
| Silver (ounces) | 245,845 | 382,132 | 324,482 | 331,884 | 341,329 | 216,393 | 178,385 | 330,949 | ||||||||||||||||||||||||
| Gold (ounces) | 2,061 | 2,870 | 2,638 | 3,548 | 3,189 | 2,775 | 2,968 | 3,750 | ||||||||||||||||||||||||
| Silver equivalent ounces | 379,821 | 568,714 | 495,942 | 544,722 | 532,659 | 382,884 | 356,495 | 555,933 | ||||||||||||||||||||||||
| Average ore grades | ||||||||||||||||||||||||||||||||
| Silver (g/t) | 217 | 282 | 196 | 193 | 200 | 148 | 133 | 202 | ||||||||||||||||||||||||
| Gold (g/t) | 1.79 | 2.08 | 1.57 | 2.02 | 1.84 | 1.85 | 2.14 | 2.26 | ||||||||||||||||||||||||
| Metal recoveries | ||||||||||||||||||||||||||||||||
| Silver | 90.7 | % | 92.1 | % | 91.2 | % | 91.4 | % | 91.9 | % | 86.5 | % | 88.6 | % | 91.7 | % | ||||||||||||||||
| Gold | 92.4 | % | 94.0 | % | 92.5 | % | 93.4 | % | 93.2 | % | 91.7 | % | 91.5 | % | 92.9 | % | ||||||||||||||||
| Concentrate grades | ||||||||||||||||||||||||||||||||
| Silver (g/t) | 10,121 | 12,837 | 12,048 | 11,070 | 10,862 | 9,584 | 8,948 | 11,216 | ||||||||||||||||||||||||
| Gold (g/t) | 85 | 96 | 98 | 116 | 101 | 123 | 149 | 127 | ||||||||||||||||||||||||
| 2015 | 2014 | 2013 | ||||||||||||||||||||||||||||||
| SAN IGNACIO MINE | Q3 | Q2 | Q1 | Q4 | Q3 | Q2 | Q1 | Q4 | ||||||||||||||||||||||||
| Tonnes milled | 38,282 | 25,397 | 25,609 | 18,372 | 14,160 | 12,880 | 8,037 | Nil | ||||||||||||||||||||||||
| Production | ||||||||||||||||||||||||||||||||
| Silver (ounces) | 167,239 | 100,419 | 93,288 | 64,400 | 50,650 | 35,294 | 20,674 | Nil | ||||||||||||||||||||||||
| Gold (ounces) | 3,847 | 2,303 | 1,910 | 1,136 | 887 | 873 | 530 | Nil | ||||||||||||||||||||||||
| Silver equivalent ounces | 417,298 | 250,127 | 217,429 | 132,594 | 103,897 | 87,705 | 52,447 | Nil | ||||||||||||||||||||||||
| Average ore grades | ||||||||||||||||||||||||||||||||
| Silver (g/t) | 159 | 145 | 134 | 130 | 131 | 104 | 103 | Nil | ||||||||||||||||||||||||
| Gold (g/t) | 3.51 | 3.22 | 2.68 | 2.21 | 2.26 | 2.55 | 2.47 | Nil | ||||||||||||||||||||||||
| Metal recoveries | ||||||||||||||||||||||||||||||||
| Silver | 85.6 | % | 85.1 | % | 84.7 | % | 84.0 | % | 84.7 | % | 81.8 | % | 77.6 | % | Nil | |||||||||||||||||
| Gold | 89.1 | % | 87.5 | % | 86.6 | % | 87.1 | % | 86.3 | % | 82.9 | % | 82.9 | % | Nil | |||||||||||||||||
| Concentrate grades | ||||||||||||||||||||||||||||||||
| Silver (g/t) | 9,053 | 12,727 | 9,840 | 9,325 | 7,684 | 7,414 | 10,419 | Nil | ||||||||||||||||||||||||
| Gold (g/t) | 208 | 292 | 201 | 165 | 135 | 183 | 267 | Nil | ||||||||||||||||||||||||
| GMC (Combined Guanajuato and | 2015 | 2014 | 2013 | |||||||||||||||||||||||||||||
| San Ignacio Mines) | Q3 | Q2 | Q1 | Q4 | Q3 | Q2 | Q1 | Q4 | ||||||||||||||||||||||||
| Tonnes milled | 77,136 | 71,131 | 82,026 | 76,839 | 72,047 | 63,646 | 55,280 | 55,547 | ||||||||||||||||||||||||
| Production | ||||||||||||||||||||||||||||||||
| Silver (ounces) | 413,084 | 482,551 | 417,770 | 396,284 | 391,979 | 251,687 | 199,059 | 330,949 | ||||||||||||||||||||||||
| Gold (ounces) | 5,908 | 5,173 | 4,548 | 4,684 | 4,076 | 3,648 | 3,498 | 3,750 | ||||||||||||||||||||||||
| Silver equivalent ounces | 797,119 | 818,841 | 713,371 | 677,316 | 636,556 | 470,589 | 408,942 | 555,933 | ||||||||||||||||||||||||
| Payable silver ounces | 387,860 | 460,956 | 465,416 | 340,851 | 338,689 | 235,409 | 202,420 | 352,238 | ||||||||||||||||||||||||
| Average ore grades | ||||||||||||||||||||||||||||||||
| Silver (g/t) | 188 | 233 | 177 | 178 | 186 | 139 | 128 | 202 | ||||||||||||||||||||||||
| Gold (g/t) | 2.64 | 2.49 | 1.92 | 2.07 | 1.92 | 1.99 | 2.19 | 2.26 | ||||||||||||||||||||||||
| Metal recoveries | ||||||||||||||||||||||||||||||||
| Silver | 88.5 | % | 90.5 | % | 89.7 | % | 90.1 | % | 90.9 | % | 88.4 | % | 87.3 | % | 91.7 | % | ||||||||||||||||
| Gold | 90.2 | % | 91.0 | % | 89.9 | % | 91.8 | % | 91.6 | % | 89.4 | % | 90.1 | % | 92.9 | % | ||||||||||||||||
| Concentrate grades | ||||||||||||||||||||||||||||||||
| Silver (g/t) | 9,660 | 12,814 | 11,473 | 10,698 | 10,311 | 9,206 | 9,081 | 11,216 | ||||||||||||||||||||||||
| Gold (g/t) | 138 | 137 | 125 | 126 | 107 | 133 | 160 | 127 | ||||||||||||||||||||||||
| Cost per tonne milled (USD) | $ | 86 | $ | 100 | $ | 91 | $ | 99 | $ | 108 | $ | 113 | $ | 110 | $ | 106 | ||||||||||||||||
| Metrics per payable silver ounce | ||||||||||||||||||||||||||||||||
| Cash cost (USD) | $ | 4.47 | $ | 4.88 | $ | 7.16 | $ | 10.05 | $ | 9.24 | $ | 14.49 | $ | 12.13 | $ | 5.34 | ||||||||||||||||
| AISC (USD) | $ | 9.87 | $ | 8.93 | $ | 10.51 | $ | 17.50 | $ | 14.64 | $ | 20.96 | $ | 21.29 | $ | 10.11 | ||||||||||||||||
GREAT PANTHER SILVER LIMITED Management’s Discussion & Analysis | Page 8 |
The GMC processed 77,136 tonnes in the third quarter of 2015, a 7% increase over the third quarter of 2014. The increase was primarily attributed to the ramp-up in production at the San Ignacio Mine which contributed 38,282 tonnes of ore in the third quarter of 2015, compared to 14,160 tonnes in the comparative period in 2014. This increase was partially offset by a reduction of tonnes processed from the Guanajuato Mine, reflecting the higher cut-off grades and the shift in focus to mining the higher grade San Ignacio Mine.
Production from San Ignacio will continue to account for the predominant portion of the production from the GMC in the fourth quarter and for the foreseeable future. At the end of the third quarter, production from San Ignacio had reached more than 500 tonnes per day, greater than the 450 tonnes per day originally targeted by the end of 2015. Continued development of the Southern Extension zones should see further production growth through the fourth quarter with a new year-end target of approximately 650 tonnes per day (refer to Outlook section).
Metal production at the GMC totaled 797,119 Ag eq oz for the third quarter of 2015, a 25% increase over the third quarter of 2014. The increase in Ag eq oz produced reflects the ongoing ramp up at San Ignacio, both in terms of mill throughput and higher ore grades, especially average gold grades. Since commencing commercial production in June 2014, ongoing development at San Ignacio has resulted in access to higher-grade areas of the resource. San Ignacio accounted for 52% of the overall metal production and 65% of the total gold production at the GMC for the third quarter of 2015.
Metal production from the GMC in the third quarter of 2015 remained within 3% of the record second quarter of 2015. Mill throughput increased over the second quarter of 2015 and average gold grades increased 6% as mining was focused on more gold rich zones, particularly from San Ignacio. These factors offset a decrease in silver grades quarter-over quarter, with the second quarter of 2015 having reflected the mining of high-grade pillars which increased silver grades in that quarter.
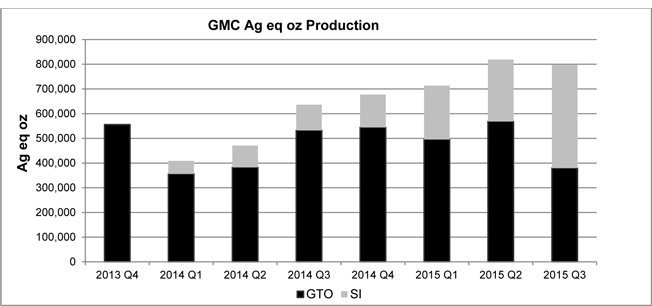
Cash cost for the GMC decreased to US$4.47 in the third quarter of 2015, from US$9.24 in the third quarter of 2014. This was due to higher average silver and gold ore grades which increased the yield of payable silver ounces and by-product credits, respectively. In addition, the strengthening of the US dollar relative to the Mexican peso reduced cash operating costs in US dollar terms as these are predominantly denominated in Mexican pesos.
Cash cost also decreased by 8% compared to the second quarter of 2015 cash cost of US$4.88, as the 7% strengthening of the US dollar relative to the Mexican peso more than offset the impact of lower by-product credits and 16% fewer payable silver ounces at a higher throughput.
GREAT PANTHER SILVER LIMITED Management’s Discussion & Analysis | Page 9 |
Cash cost and the associated by-product credits are computed based on sales during the period (rather than production). As such, the amount of the by-product credit may not directly correlate to the production reported for the period. Similarly, the cost per tonne milled during the period may not directly correlate to the cash cost reported for the same period due to a lag between production and sales.
AISC for the third quarter of 2015 decreased to US$9.87 from US$14.64 in the third quarter of 2014. This decrease is primarily a function of the decrease in cash cost as described above.
AISC increased 11% compared to the second quarter of 2015 primarily due to higher sustaining exploration and capital expenditures. There was a significant increase in mine development at San Ignacio in order to support the higher production targets noted above, as well an increase in mine development at the Guanajuato Mine. In addition, the 16% decrease in payable silver ounces increased these costs on a payable ounce basis. These factors were partially offset by the 8% decrease in cash cost relative to the second quarter of 2015.
GMC Development
A total of 3,655 metres of underground development were completed during the third quarter comprising 1,495 metres of mine development at the San Ignacio Mine and 2,160 metres at the Guanajuato Mine. A total of 7,151 metres of development were completed at the GMC for the nine months ended September 30, 2015.
The Company’s third quarter 2015 drill program at the Guanajuato Mine amounted to 5,086 metres for a total of 13,336 metres in the nine months ended September 30, 2015. The Company focused its underground drilling on the Valenciana and Cata zones.
Development at San Ignacio concentrated on infrastructure work including the preparation of loading bays, pumping stations and developing access levels to stopes. A 2015 surface drilling program of approximately 2,200 metres commenced in mid-October 2015. Please refer to the Outlook section of this document for further details.
GREAT PANTHER SILVER LIMITED Management’s Discussion & Analysis | Page 10 |
Topia Mine
| 2015 | 2014 | 2013 | ||||||||||||||||||||||||||||||
| TOPIA MINE | Q3 | Q2 | Q1 | Q4 | Q3 | Q2 | Q1 | Q4 | ||||||||||||||||||||||||
| Tonnes milled | 16,594 | 16,345 | 17,225 | 15,735 | 16,983 | 17,318 | 17,351 | 14,054 | ||||||||||||||||||||||||
| Custom milling (tonnes) | 1,346 | 1,560 | 1,198 | 2,312 | 1,852 | 1,929 | 2,965 | 2,188 | ||||||||||||||||||||||||
| Total tonnes milled | 17,940 | 17,905 | 18,423 | 18,047 | 18,835 | 19,247 | 20,316 | 16,242 | ||||||||||||||||||||||||
| Production | ||||||||||||||||||||||||||||||||
| Silver (ounces) | 173,834 | 166,258 | 179,341 | 153,726 | 173,986 | 168,314 | 171,609 | 153,988 | ||||||||||||||||||||||||
| Gold (ounces) | 170 | 149 | 155 | 138 | 124 | 125 | 168 | 131 | ||||||||||||||||||||||||
| Lead (tonnes) | 341 | 300 | 279 | 285 | 259 | 302 | 308 | 286 | ||||||||||||||||||||||||
| Zinc (tonnes) | 493 | 491 | 441 | 406 | 443 | 395 | 431 | 402 | ||||||||||||||||||||||||
| Silver equivalent ounces | 283,177 | 269,514 | 274,515 | 233,732 | 254,085 | 248,205 | 258,407 | 207,948 | ||||||||||||||||||||||||
| Payable silver ounces | 157,927 | 146,942 | 156,923 | 193,813 | 122,560 | 145,893 | 149,868 | 156,563 | ||||||||||||||||||||||||
| Average ore grade | ||||||||||||||||||||||||||||||||
| Silver (g/t) | 359 | 350 | 357 | 338 | 352 | 336 | 344 | 376 | ||||||||||||||||||||||||
| Gold (g/t) | 0.54 | 0.48 | 0.44 | 0.45 | 0.41 | 0.40 | 0.56 | 0.49 | ||||||||||||||||||||||||
| Lead (%) | 2.16 | 1.95 | 1.71 | 1.93 | 1.62 | 1.84 | 1.90 | 2.17 | ||||||||||||||||||||||||
| Zinc (%) | 3.13 | 3.17 | 2.73 | 2.76 | 2.83 | 2.49 | 2.70 | 3.07 | ||||||||||||||||||||||||
| Metal recoveries | ||||||||||||||||||||||||||||||||
| Silver | 90.8 | % | 90.5 | % | 90.8 | % | 89.9 | % | 90.5 | % | 89.8 | % | 89.4 | % | 90.6 | % | ||||||||||||||||
| Gold | 59.6 | % | 59.2 | % | 63.5 | % | 61.4 | % | 55.3 | % | 56.1 | % | 53.8 | % | 58.6 | % | ||||||||||||||||
| Lead | 94.9 | % | 94.3 | % | 94.5 | % | 93.8 | % | 94.4 | % | 94.7 | % | 93.4 | % | 93.8 | % | ||||||||||||||||
| Zinc | 94.9 | % | 94.6 | % | 93.8 | % | 93.6 | % | 92.1 | % | 91.6 | % | 91.9 | % | 93.2 | % | ||||||||||||||||
| Concentrate grades | ||||||||||||||||||||||||||||||||
| Lead | ||||||||||||||||||||||||||||||||
| Silver (g/t) | 7,433 | 8,539 | 9,321 | 8,149 | 10,024 | 9,083 | 8,730 | 8,031 | ||||||||||||||||||||||||
| Gold (g/t) | 6.28 | 6.54 | 6.79 | 6.35 | 6.29 | 5.77 | 7.39 | 5.98 | ||||||||||||||||||||||||
| Lead (%) | 49.60 | 53.25 | 49.39 | 51.06 | 50.69 | 55.05 | 52.94 | 50.20 | ||||||||||||||||||||||||
| Zinc (%) | 13.39 | 14.14 | 11.22 | 10.15 | 12.13 | 9.46 | 9.77 | 11.60 | ||||||||||||||||||||||||
| Zinc | ||||||||||||||||||||||||||||||||
| Silver (g/t) | 536 | 593 | 585 | 572 | 570 | 601 | 558 | 519 | ||||||||||||||||||||||||
| Gold (g/t) | 1.40 | 1.28 | 1.43 | 1.26 | 1.01 | 1.24 | 1.42 | 1.16 | ||||||||||||||||||||||||
| Lead (%) | 0.95 | 0.96 | 0.89 | 1.48 | 0.86 | 1.26 | 1.28 | 1.21 | ||||||||||||||||||||||||
| Zinc (%) | 52.31 | 51.52 | 50.72 | 50.42 | 53.76 | 52.99 | 51.26 | 52.11 | ||||||||||||||||||||||||
| Cost per tonne milled (USD) | $ | 140 | $ | 144 | $ | 153 | $ | 164 | $ | 173 | $ | 166 | $ | 153 | $ | 167 | ||||||||||||||||
| Metrics per payable silver ounce | ||||||||||||||||||||||||||||||||
| Cash cost (USD) | $ | 11.50 | $ | 12.14 | $ | 13.31 | $ | 16.06 | $ | 15.93 | $ | 15.89 | $ | 15.32 | $ | 16.76 | ||||||||||||||||
| AISC (USD) | $ | 12.25 | $ | 13.77 | $ | 14.15 | $ | 18.60 | $ | 19.96 | $ | 18.38 | $ | 17.90 | $ | 19.27 | ||||||||||||||||
Mill throughput for Topia in the third quarter of 2015 was 16,594 tonnes (excluding tonnes milled for third parties), a 2% decrease compared to the third quarter of 2014. The reductions in milling relative to comparative periods are attributed to fewer tonnes mined, reflecting ground conditions at the Argentina mine and to narrower veins encountered at several of the other mines. Topia’s throughput increased 2% compared to the second quarter of 2015.
Milling for third parties decreased 27% from the third quarter of 2014, and 14% from the second quarter of 2015. Custom milling does not typically account for more than 15% of Topia’s total milling and is dependent on ore availability from a third party and the availability of milling capacity, and is therefore subject to variability. Custom milling is undertaken at the Topia Mine to utilize spare mill capacity and to provide additional contribution margin to the operations.
Metal production in the third quarter of 2015 increased 11% to 283,177 Ag eq oz compared to the third quarter of 2014. This was achieved as a result of higher ore grades at various Topia mines and higher recoveries. The same factors were responsible for a 5% increase in metal production over the second quarter of 2015.
GREAT PANTHER SILVER LIMITED Management’s Discussion & Analysis | Page 11 |
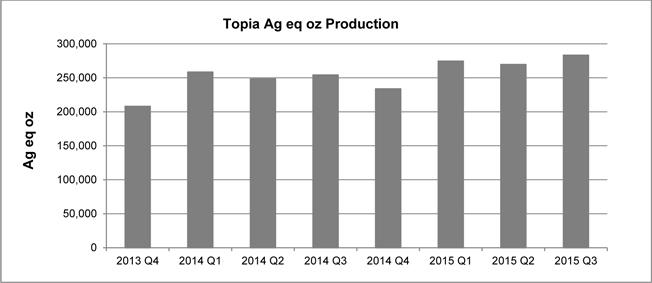
Cash cost for the third quarter of 2015 decreased to US$11.50 from US$15.93 in the third quarter of 2014. The decrease in cash cost is primarily driven by the 29% increase in payable silver ounces, higher by-product credits, and the strengthening of the US dollar against the Mexican peso which reduced costs in US dollar terms.
Cash cost decreased from US$12.14 in the second quarter of 2015, due to the US dollar strengthening relative to the Mexican peso, as well as the 7% increase in payable silver ounces. These factors were partly offset by lower by-product credits relative to the second quarter of 2015.
AISC for the third quarter of 2015 decreased to US$12.25 from US$19.96 in the third quarter of 2014 primarily due to the decrease in cash cost, as well as reductions in mine development and sustaining capital expenditures.
AISC decreased from US$13.77 in the second quarter of 2015 primarily due to a reduction in E&E expenditures and the above noted increase in payable silver ounces.
Topia Development
Underground development for the quarter ended September 30, 2015 was limited to 133 metres at the Argentina mine and the Socavon Victoria. For the nine months ended September 30, 2015, underground development totaled 514 metres at the Argentina mine and the Socavon Victoria.
GREAT PANTHER SILVER LIMITED Management’s Discussion & Analysis | Page 12 |
RESOURCE UPDATE
Topia Mine
On July 9, 2015, the Company provided an update to the Mineral Resource at the Topia Mine, with an effective date of November 30, 2014.
The updated Mineral Resource Estimate was as follows:
| Category | Tonnage | Ag g/t | Au g/t | Pb % | Zn % | |||||||||||||||
| Total Measured | 180,400 | 606 | 1.44 | 4.26 | 4.52 | |||||||||||||||
| Total Indicated | 165,800 | 644 | 1.17 | 4.75 | 3.82 | |||||||||||||||
| Total M&I | 346,200 | 624 | 1.31 | 4.50 | 4.19 | |||||||||||||||
| Total Inferred | 357,400 | 592 | 1.31 | 3.44 | 3.96 | |||||||||||||||
Notes:
| 1. | CIM Definitions were followed for Mineral Resources. |
| 2. | Mineral Resources are reported using different Net Smelter Return (NSR) cut-off values for the different mines as follows: US$167/t for the 1522 Mine, US$197/t for Argentina, US$153/t for Durangueno, US$189/t for Hormiguera, US$196/t for Recompensa, US$173/t for El Rosario, and US$204/t for La Prieta. |
| 3. | Area-specific bulk densities are as follows: Argentina - 3.06t/m3; 1522 - 3.26t/m3; Durangueno - 3.12t/m3; El Rosario - 3.00t/m3; Hormiguera - 2.56t/m3; La Prieta - 2.85t/m3; Recompensa - 3.30t/m3. |
| 4. | A minimum mining width of 0.30 metres was used. |
| 5. | Mineral Resources are estimated using metal prices of: US$1,200/oz Au, US$17.00/oz Ag, US$0.90/lb Pb, and US$0.95/lb Zn. Silver equivalent calculations used the same metal pricing and 2014 recoveries of 89.9% for Ag, 56.4% for Au, 94.0% for Pb and 92.3% for Zn. |
| 6. | Totals may not agree due to rounding. |
| 7. | Robert F. Brown, P. Eng. and Vice President of Exploration for Great Panther Silver and its wholly owned Mexican subsidiary, Minera Mexicana El Rosario, S.A. de C.V., is designated as the Qualified Person for the Topia Mine under the meaning of NI 43-101. |
The estimated metal contents were as follows:
| Category | Tonnage | Ag oz | Au oz | Pb lbs | Zn lbs | Ag eq oz | ||||||||||||||||||
| M&I Resource | 346,200 | 6,950,000 | 14,560 | 34,320,000 | 31,950,000 | 11,580,000 | ||||||||||||||||||
| Inferred Resource | 357,400 | 6,810,000 | 15,060 | 27,140,000 | 31,240,000 | 11,050,000 | ||||||||||||||||||
The Mineral Resource Estimate was classified according to the CIM Definition Standards on Mineral Resources and Mineral Reserves and, as such, is consistent with the requirements of NI 43-101. It replaced the previous estimate completed in 2013.
While most of the current resource base came from the Company's diamond drilling and underground development, the resource estimated for certain veins on the property (e.g. Argentina) came largely from the verification of sampling on levels that are planned for access in 2015 and later, and that are still intact.
In light of the updated Mineral Resource Estimate, management changed its estimate of the useful life of the Topia Mine to 11 years as at July 1, 2015, an increase from the previous estimate of 6.5 years.
Guanajuato Mine Complex
The most recent mineral resource update for the GMC was published on February 23, 2015 and is contained in the technical report entitled “NI 43-101 Technical Report on the Guanajuato Mine Complex Claims and Mineral Resource Estimations for the Guanajuato Mine, San Ignacio Mine, and El Horcón Project, dated February 25, 2015” and filed on SEDAR on February 25, 2015.
GREAT PANTHER SILVER LIMITED Management’s Discussion & Analysis | Page 13 |
In September 2015, the Company commenced expensing mine development cost associated with the Guanajuato Mine, having previously capitalized such costs. This change in presentation reflects the fact that the Company has mined and depleted the most recently published Measured and Indicated Resources for the Guanajuato Mine. However, the Company continues to mine from Inferred Resources and areas outside of defined resources. In addition, the Company is continuing the exploration and development of the mine with the objective of adding further resources and converting existing Inferred Resources to Measured and Indicated Resources.
El Horcón Project
The El Horcón Project resource estimate is contained in the GMC resource update referenced above, and was prepared based on the most recent surface drill program completed by the Company during 2013. No drilling is being undertaken on El Horcón in 2015.
On July 28, 2015, the Company had fully secured mineral property titles for all of its 7,909 hectares related to the El Horcón Project. Three of the Company’s mineral property title claims were previously cancelled due to an administrative error on the part of the government agency which manages mineral property titles in Mexico. All titles have now been restored.
Coricancha Mine Complex
During the third quarter of 2015, the Company commenced underground development and the construction of drill stations in order to expand the mineral resource above and below present historical limits on the Constancia vein. Underground drilling started in mid-October from a formerly established drill station near the Wellington vein. Community agreements are in place and applications have been made for surface drilling permits.
GDLR Project
The GDLR Project surface drill program commenced in mid-August, subsequent to the conclusion of community agreements. The focus of the drill program is both to further upgrade and expand, the mineral resource estimates in the various zones, with emphasis on higher grade portions that may be amenable to underground mining.
GREAT PANTHER SILVER LIMITED Management’s Discussion & Analysis | Page 14 |
SUMMARY OF SELECTED QUARTERLY INFORMATION
The following table sets out selected quarterly financial results which have been prepared in accordance with IFRS, except for cost of sales before non-cash items, gross profit before non-cash items, and adjusted EBITDA which are non-IFRS measures:
| (in CAD thousands, except per share amounts) | Q3 2015 | Q2 2015 | Q1 2015 | Q4 2014 | Q3 2014 | Q2 2014 | Q1 2014 | Q4 2013 | ||||||||||||||||||||||||
| Revenue | $ | 16,788 | $ | 19,183 | $ | 20,250 | $ | 14,244 | $ | 12,801 | $ | 14,465 | $ | 12,880 | $ | 15,837 | ||||||||||||||||
| Cost of sales before non-cash items1 | 11,025 | 12,470 | 13,598 | 12,085 | 9,883 | 12,038 | 9,609 | 10,118 | ||||||||||||||||||||||||
| Gross profit before non-cash items1 | 5,763 | 6,713 | 6,652 | 2,159 | 2,918 | 2,427 | 3,271 | 5,719 | ||||||||||||||||||||||||
| Gross profit (loss)2 | 281 | 1,668 | 524 | (2,693 | ) | (1,521 | ) | (1,529 | ) | (418 | ) | 1,523 | ||||||||||||||||||||
| Net income (loss) for the period | (3,348 | ) | (4,722 | ) | 3,588 | (26,948 | ) | (970 | ) | (4,492 | ) | (602 | ) | (7,359 | ) | |||||||||||||||||
| Basic and diluted earnings (loss) per share | (0.02 | ) | (0.03 | ) | 0.03 | (0.19 | ) | (0.01 | ) | (0.03 | ) | (0.00 | ) | (0.05 | ) | |||||||||||||||||
| Adjusted EBITDA1 | 2,155 | 4,205 | 3,688 | (1,211 | ) | 1,267 | 213 | (545 | ) | 4,101 | ||||||||||||||||||||||
Revenue varies based on the quantity of metal produced, metal prices, exchange rates and terms of sales agreements. The climate in Mexico allows mining and exploration activities to be conducted throughout the year, therefore, revenue and cost of sales generally do not exhibit variations due to seasonality.
In the following paragraphs, quarterly results are discussed relative to the preceding quarter’s results.
The third quarter of 2015 saw continued declines in metal prices, contributing to a 12% decline in the Company’s revenues relative to the second quarter of 2015. Despite the declines in revenue, the Company realized a gross profit of $0.3 million as cost of sales was reduced due to higher metal grades and the depreciation of the Mexican peso, which reduced cash cost per payable silver ounce. The strengthening of the US dollar relative to the Mexican peso and Canadian dollar further benefitted the Company as it recorded foreign exchange gains of $0.6 million. E&E expenditures increased significantly during the quarter as exploration work commenced at the GDLR Project and Coricancha and mine development costs increased. In September 2015, the Company commenced expensing mine development cost associated with the Guanajuato Mine, having previously capitalized such costs, and mine development expenditures for San Ignacio increased significantly compared to the preceding quarter.
During the second quarter of 2015, revenue decreased 5% from the preceding quarter, mainly due to declines in commodity prices. The second quarter of 2015 was notable for the increased grades and metal recoveries achieved at the GMC which, along with the impact of mining and processing fewer tonnes, resulted in the second consecutive quarter of gross profit improvement. The improvement in gross profit was more than offset by foreign exchange losses recognized on US-denominated intercompany debt as the US dollar strengthened against the Mexican peso, resulting in a $4.7 million net loss for the quarter.
The first quarter of 2015 was marked by increased production and the depreciation of the Canadian dollar against the US dollar which, along with increased production and metal sales, contributed to the increase in revenue reported. These were also the primary factors in the 209% increase in gross profit before non-cash items compared to the fourth quarter of 2014. In addition to the increases in revenue and gross profit discussed above, significant foreign exchange gains recognized by the Company’s subsidiaries on intercompany debt and net working capital contributed to a large increase in net income.
| 1 | The Company has included the non-IFRS performance measures, cost of sales before non-cash items, gross profit before non-cash items, and Adjusted EBITDA throughout this document. Refer to the Non-IFRS Measures section of this MD&A for an explanation of these measures and reconciliation to the Company’s reported financial results in accordance with IFRS. As these are not standardized measures, they may not be directly comparable to similarly titled measures used by others. |
| 2 | Also referred to as “Earnings from mining operations”. |
GREAT PANTHER SILVER LIMITED Management’s Discussion & Analysis | Page 15 |
In the fourth quarter of 2014, revenue increased by 11% mainly due to the 12% increase in Ag eq oz sales, which offset lower realized metal prices. Net loss increased primarily due to an $11.7 million non-cash pre-tax impairment charge, $4.6 million in income tax expense compared to an income tax recovery of $0.3 million in the previous quarter, the realization of a $4.4 million foreign exchange loss in the quarter compared to a foreign exchange gain of $2.1 million in the previous quarter, a $1.2 million increase in gross loss, a $0.6 million increase in G&A expenditures and a $0.2 million increase in E&E expenditures.
In the third quarter of 2014, revenue decreased by 12% mainly due to a 5% decrease in the average realized silver price. Net loss decreased primarily due to the realization of a $2.1 million foreign exchange gain in the quarter compared to a $2.8 million foreign exchange loss in the previous quarter. A decrease in G&A expenses of $0.4 million and the receipt of $0.5 million in insurance proceeds included in finance and other income also contributed to the decrease in net loss. These impacts were partially offset by a $0.3 million increase in E&E expenses and a $1.9 million reduction in income tax recovery.
In the second quarter of 2014, revenue increased due to an 18% increase in Ag eq oz metal sales. However, gross loss increased $1.1 million due to higher cost of sales. Net loss increased significantly as the Company realized a $2.8 million foreign exchange loss in the second quarter of 2014, compared to a $3.8 million gain in the prior quarter. The fluctuation was due primarily to the strengthening of the Canadian dollar against the Mexican peso. These impacts were partially offset by a $1.1 million decrease in G&A and E&E expenses and costs associated with the illegal occupation of the Cata plant and administration facilities incurred in the first quarter of 2014 which did not recur in the second quarter.
In the first quarter of 2014, revenue decreased due to the decrease in metal production and lower metal prices. Net loss decreased significantly in the first quarter of 2014 as the fourth quarter of 2013 reflected a non-recurring $12.0 million impairment charge. Net loss for the first quarter of 2014 reflected a $1.9 million decrease in gross profit due to lower sales volume as a result of lower metal production and lower metal prices, $1.2 million of San Ignacio development expenditures, and $0.7 million in costs associated with the illegal occupation of the Cata plant and administration facilities in March.
In the fourth quarter of 2013, revenue increased due to an increase in metal sales which offset a decline in metal prices. Net loss increased due primarily to a $12.0 million pre-tax non-cash impairment charge, and to a lesser extent, due to a decrease in gross profit. These factors were partly offset by decreases in G&A and E&E expenses, and realization of a $4.0 million foreign exchange gain in the quarter compared to a $3.5 million foreign exchange loss in the previous quarter.
RESULTS OF OPERATIONS
Three months ended September 30, 2015
Sales quantities by metal for the quarters ended September 30, 2015 and 2014 were as follows:
| Q3 2015 | Q3 2014 | |||||||||||||||||||||||
| GMC | Topia | Total | GMC | Topia | Total | |||||||||||||||||||
| Silver (ounces) | 387,860 | 157,927 | 545,787 | 342,321 | 119,639 | 461,960 | ||||||||||||||||||
| Gold (ounces) | 4,647 | 109 | 4,756 | 3,644 | 47 | 3,691 | ||||||||||||||||||
| Lead (tonnes) | - | 304 | 304 | - | 183 | 183 | ||||||||||||||||||
| Zinc (tonnes) | - | 340 | 340 | - | 230 | 230 | ||||||||||||||||||
| Silver equivalent ounces | 689,926 | 241,271 | 931,197 | 560,952 | 150,536 | 711,488 | ||||||||||||||||||
GREAT PANTHER SILVER LIMITED Management’s Discussion & Analysis | Page 16 |
Revenue related to contained metals in concentrates for the quarters ended September 30, 2015 and 2014 were as follows:
| (in CAD thousands) | Q3 2015 | Q3 2014 | ||||||||||||||||||||||
| GMC | Topia | Total | GMC | Topia | Total | |||||||||||||||||||
| Silver revenue | $ | 7,239 | $ | 2,979 | $ | 10,218 | $ | 6,080 | $ | 2,321 | $ | 8,401 | ||||||||||||
| Gold revenue | 6,723 | 156 | 6,879 | 4,647 | 60 | 4,707 | ||||||||||||||||||
| Lead revenue | - | 671 | 671 | - | 428 | 428 | ||||||||||||||||||
| Zinc revenue | - | 777 | 777 | - | 604 | 604 | ||||||||||||||||||
| Ore processing revenue and other | - | 139 | 139 | - | 133 | 133 | ||||||||||||||||||
| Smelting and refining charges | (1,004 | ) | (892 | ) | (1,896 | ) | (891 | ) | (581 | ) | (1,472 | ) | ||||||||||||
| Total revenue | $ | 12,958 | $ | 3,830 | $ | 16,788 | $ | 9,836 | $ | 2,965 | $ | 12,801 | ||||||||||||
The Company’s average realized metal prices and the average Canadian dollar exchange rates against the United States dollar and the Mexican peso for the quarters ended September 30, 2015 and 2014 were as follows:
| Q3 2015 | Q3 2014 | |||||||
| Silver (USD/oz) | $ | 13.98 | $ | 16.69 | ||||
| Gold (USD/oz) | $ | 1,069 | $ | 1,171 | ||||
| Lead (USD/lb) | $ | 0.77 | $ | 0.97 | ||||
| Zinc (USD/lb) | $ | 0.80 | $ | 1.07 | ||||
| USD/CAD | 0.764 | 0.892 | ||||||
| MXP/CAD | 12.56 | 12.05 | ||||||
For the third quarter of 2015, the Company earned revenue of $16.8 million, compared to $12.8 million for the third quarter of 2014. The $4.0 million increase in revenue is primarily attributable to a 31% increase in metal sales volume as a result of an increase in metal production. In addition, the 17% appreciation of the US dollar against the Canadian dollar had the effect of increasing revenue reported in Canadian dollars. These factors more than offset the impact of 16% and 9% decreases in average realized silver and gold prices in US dollars, respectively.
Compared to the second quarter of 2015, revenue decreased by $2.4 million primarily due to the decrease in average realized gold and silver prices in US dollars, as well as a reduction in metal sales volumes from 1,022,727 Ag eq oz sold in the second quarter of 2015 to 931,198 Ag eq oz in the third quarter of 2015 primarily due to timing of shipments.
GREAT PANTHER SILVER LIMITED Management’s Discussion & Analysis | Page 17 |
Revenue, Cost of Sales and Gross Profit (in CAD thousands) | Q3 2015 | Q3 2014 | % Change | Q2 2015 | % Change | |||||||||||||||
| Revenue | $ | 16,788 | $ | 12,801 | 31 | % | $ | 19,183 | (12 | )% | ||||||||||
| Cost of sales: | ||||||||||||||||||||
| Production costs (cost of sales before non-cash items)1 | 11,025 | 9,883 | 12 | % | 12,470 | (12 | )% | |||||||||||||
| Amortization and depletion | 5,397 | 4,296 | 26 | % | 5,010 | 8 | % | |||||||||||||
| Share-based compensation | 85 | 143 | (41 | )% | 35 | 143 | % | |||||||||||||
| Total cost of sales | $ | 16,507 | $ | 14,322 | (15 | )% | $ | 17,515 | (6 | )% | ||||||||||
| Gross profit (loss) | $ | 281 | $ | (1,521 | ) | 118 | % | $ | 1,668 | (83 | )% | |||||||||
| Gross profit (loss) (% of revenue) | 2 | % | (12 | )% | 9 | % | ||||||||||||||
| Add: | ||||||||||||||||||||
| Amortization and depletion | $ | 5,397 | $ | 4,296 | 26 | % | $ | 5,010 | 4 | % | ||||||||||
| Share-based compensation | 85 | 143 | (41 | )% | 35 | 143 | % | |||||||||||||
| Gross profit before non-cash items1 | $ | 5,763 | $ | 2,918 | 97 | % | $ | 6,713 | (14 | )% | ||||||||||
| Gross profit before non-cash items (% of revenue) | 34 | % | 23 | % | 35 | % | ||||||||||||||
Cost of sales before non-cash items increased 12% to $11.0 million for the third quarter of 2015, compared to $9.9 million in the third quarter of 2014. The increase in is predominantly attributable to the increase in metal sales volume. However, the increase was significantly less than the 31% increase in unit metal sales on an Ag eq oz basis, as higher ore grades at all of the Company’s mines enabled the production of significantly more metal ounces per tonne of ore mined and processed. This resulted in a significant decrease in cash cost and other unit cost measures.
Compared to the second quarter of 2015, cost of sales before non-cash items decreased 12%, consistent with the decrease in Ag eq oz sold during the third quarter of 2015.
Gross profit before non-cash items increased by $2.8 million in the third quarter of 2015 compared to the third quarter of 2014, as a result of the $4.0 million increase in revenues which exceeded the $1.1 million increase in cost of sales before non-cash items. The proportionately higher increase in revenue is attributable to the impact of the US dollar strengthening against the Canadian dollar, as well as the 18% increase in payable silver ounces sold at a significantly lower unit cash cost.
Gross profit before non-cash items decreased by $0.9 million in the third quarter of 2015 compared to the second quarter of 2015. This was primarily due to the $2.4 million decrease in revenue due to lower metal prices and unit metal sales. This, however, was partly offset by a $1.4 million decrease in cost of sales before non-cash items due to lower unit metal sales and cash cost.
Amortization and depletion of mineral properties, plant and equipment relating to cost of sales increased to $5.4 million in the third quarter of 2015 from $4.3 million in the third quarter of 2014. This was due to a reduction in the M&I resource at the Guanajuato Mine based on the updated Mineral Resource Estimate issued in February 2015. The reduction of the resource estimate has the effect of reducing the amortization base and therefore increasing the amortization expense per unit produced and sold. The previously-defined NI43-101-compliant Measured and Indicated Resource of the Guanajuato Mine was mined and depleted during the third quarter of 2015 (see Critical Accounting Estimates). In addition, there was a change in the estimate of the mine life of the Topia Mine during the third quarter of 2015, from 6.5 years to 11 years, which reduced amortization and depletion recorded during the quarter by approximately $0.1 million compared to the amount that would otherwise have been recorded.
| 1 | The Company has included the non-IFRS performance measures, cost of sales before non-cash items and gross profit before non-cash items, throughout this document. Refer to the Non-IFRS Measures section of this MD&A for an explanation of these measures and reconciliation to the Company’s reported financial results in accordance with IFRS. As these are not standardized measures, they may not be directly comparable to similarly titled measures used by others. |
GREAT PANTHER SILVER LIMITED Management’s Discussion & Analysis | Page 18 |
| (in CAD thousands) | Q3 2015 | Q3 2014 | % Change | Q2 2015 | % Change | |||||||||||||||
| General & administrative (G&A) expenses | $ | 1,713 | $ | 1,476 | 16 | % | $ | 1,763 | (3 | %) | ||||||||||
| Exploration, evaluation & development (E&E) expenses | $ | 2,122 | $ | 864 | 146 | % | $ | 1,041 | 104 | % | ||||||||||
| Finance and other expense ( income) | $ | (508 | ) | $ | (2,567 | ) | (80 | )% | $ | 3,765 | 113 | % | ||||||||
| Income tax expense (recovery) | $ | 302 | $ | (324 | ) | (193 | )% | $ | (179 | ) | (296 | )% | ||||||||
| Net income (loss) for the period | $ | (3,348 | ) | $ | (970 | ) | (245 | )% | $ | (4,722 | ) | 29 | % | |||||||
G&A expenses were $1.7 million for the third quarter of 2015 compared to $1.5 million for the same period in 2014. The prior year’s G&A expenses were lower, reflecting the timing of certain G&A expenditures in Mexico.
Compared to the second quarter of 2015, G&A expenses incurred in the third quarter of 2015 decreased slightly.
E&E expenses were $2.1 million for the third quarter of 2015 compared to $0.9 million for the same period in 2014. The increase is primarily the result of a $0.7 million increase in mine development costs for San Ignacio Mine and the Guanajuato Mine that do not meet the criteria for capitalization under IFRS. The Company also commenced exploration programs associated with the GDLR Project and Coricancha and spent $0.4 million and $0.2 million, respectively, on these projects during the third quarter of 2015.
E&E expenses increased by $1.1 million compared to the second quarter of 2015, primarily due to the above noted commencement of exploration programs at the GDLR Project and Coricancha. In addition, there was a $0.3 million increase in mine development costs associated with the Guanajuato Mine when the Company commenced expensing these to E&E in the third quarter of 2015 as the previously-defined NI43-101-compliant Measured and Indicated Resource was mined and depleted (see Critical Accounting Estimates). Mine development costs associated with the San Ignacio Mine also increased $0.2 million compared to the preceding quarter.
Finance and other income amounted to $0.5 million for the third quarter of 2015, compared to finance and other income of $2.6 million for the same period in 2014. The change is primarily associated with a $1.5 million decrease in foreign currency gains recognized in the third quarter of 2015, compared to the same period in 2014. In addition, Finance and other income for the third quarter of 2014 reflected proceeds from an insurance claim in the amount of $0.5 million. Foreign exchange gains and losses arise from the translation of foreign-denominated transactions and balances relative to the functional currency of the Company’s subsidiaries to the Company’s reporting currency. The Company’s Mexican subsidiaries use the Mexican peso as their functional currency. The Company has a significant US dollar intercompany loan owing by one of its Mexican subsidiaries and fluctuations in the Mexican peso create significant unrealized foreign exchange gains and losses in the accounts of the Mexican subsidiary. These unrealized gains and losses are recognized in the consolidated net income of the Company.
The $0.5 million in finance and other income in the third quarter of 2015 compares to $3.8 million in finance and other expense in the prior quarter. The change is primarily associated with a $0.6 million foreign currency gain recognized in the third quarter of 2015, compared to a foreign currency loss of $3.8 million in the second quarter of 2015. Please refer to the preceding paragraph for the nature of these foreign exchange gains and losses.
The Company recorded a net income tax expense of $0.3 million during the third quarter of 2015, predominantly as a result of an increase in the Company’s estimate of future special mining duties which are expected to become payable by its Mexican operations. The net income tax recovery in the third quarter of 2014 amounted to $0.3 million and is related to pre-tax losses by the Company’s operations in Mexico recognized in the comparative period.
GREAT PANTHER SILVER LIMITED Management’s Discussion & Analysis | Page 19 |
The net income tax expense for the third quarter of 2015 compares to a $0.2 million income tax recovery in the second quarter of 2015. The change is the result of an increase in the Company’s estimate of future special mining duties which are expected to become payable by its Mexican operations.
Net loss for the third quarter of 2015 was $3.3 million, compared to a net loss of $1.0 million for the same period in 2014. The increase in net loss is primarily attributable to a $1.5 million decrease in foreign exchange gains, as well as a $1.3 million increase in exploration expenditures attributed to the start of exploration activities at the Company’s new projects and the expensing of development expenditures associated with some of the Company’s operations. The increase in net loss is also reflective of a $0.6 million increase in income tax expense, a $0.5 million reduction in other income, as well as a $0.2 million increase in G&A expenses. These factors were partly offset by the $1.8 million increase in gross profit.
Net loss for the third quarter of 2015 saw a reduction from the net loss of $4.7 million incurred in the second quarter of 2015. The reduction is mostly attributable to the large foreign exchange losses incurred in the second quarter of 2015 when compared to a foreign exchange gain in the third quarter of 2015. This was partly offset by the $1.4 million lower gross profit, the $1.1 million higher E&E expenses, and $0.5 million higher tax expense recorded in the third quarter of 2015, when compared to the second quarter 2015.
Adjusted EBITDA was $2.2 million for the third quarter of 2015, compared to adjusted EBITDA of $1.3 million for the same period in 2014. The increase in adjusted EBITDA reflects the $2.8 million increase in gross profit before non-cash items. This was partly offset by the $1.3 million higher E&E expenses reported in the third quarter of 2015, a $0.2 million decrease in G&A expenses, as well as a $0.5 million reduction in other income.
Adjusted EBITDA decreased from $4.2 million in the second quarter of 2015 primarily due to the $0.9 million decrease in gross profit before non-cash items and the $1.1 million increase in E&E expenses during the third quarter of 2015, relative to the second quarter of 2015.
Nine months ended September 30, 2015
Sales quantities by metal for the nine months ended September 30, 2015 and 2014 are as follows:
| Nine months ended September 30, 2015 | Nine months ended September 30, 2014 | |||||||||||||||||||||||
| GMC | Topia | Total | GMC | Topia | Total | |||||||||||||||||||
| Silver (ounces) | 1,314,232 | 461,793 | 1,776,025 | 780,041 | 415,092 | 1,195,133 | ||||||||||||||||||
| Gold (ounces) | 14,727 | 278 | 15,005 | 10,434 | 228 | 10,662 | ||||||||||||||||||
| Lead (tonnes) | - | 814 | 814 | - | 715 | 715 | ||||||||||||||||||
| Zinc (tonnes) | - | 973 | 973 | - | 834 | 834 | ||||||||||||||||||
| Silver equivalent ounces | 2,271,570 | 690,361 | 2,961,931 | 1,406,075 | 532,430 | 1,938,505 | ||||||||||||||||||
Revenue related to contained metals in concentrates for the nine months ended September 30, 2015 and 2014 is as follows:
| (in CAD thousands) | Nine months ended September 30, 2015 | Nine months ended September 30, 2014 | ||||||||||||||||||||||
| GMC | Topia | Total | GMC | Topia | Total | |||||||||||||||||||
| Silver revenue | $ | 25,975 | $ | 9,158 | $ | 35,133 | $ | 16,394 | $ | 8,939 | $ | 25,333 | ||||||||||||
| Gold revenue | 21,655 | 407 | 22,062 | 14,387 | 328 | 14,715 | ||||||||||||||||||
| Lead revenue | - | 1,834 | 1,834 | - | 1,666 | 1,666 | ||||||||||||||||||
| Zinc revenue | - | 2,430 | 2,430 | - | 1,975 | 1,975 | ||||||||||||||||||
| Ore processing revenue and other | - | 411 | 411 | - | 558 | 558 | ||||||||||||||||||
| Smelting and refining charges | (3,171 | ) | (2,477 | ) | (5,648 | ) | (2,077 | ) | (2,024 | ) | (4,101 | ) | ||||||||||||
| Total revenue | $ | 44,459 | $ | 11,763 | $ | 56,222 | $ | 28,704 | $ | 11,442 | $ | 40,146 | ||||||||||||
GREAT PANTHER SILVER LIMITED Management’s Discussion & Analysis | Page 20 |
The Company’s average realized metal prices and the average Canadian exchange rates against the United States dollar and the Mexican peso for the nine month periods ended September 30, 2015 and 2014 are as follows:
| Nine months ended September 30, 2015 | Nine months ended September 30, 2014 | |||||||
| Silver (USD/oz) | $ | 15.55 | $ | 19.40 | ||||
| Gold (USD/oz) | $ | 1,153 | $ | 1,264 | ||||
| Lead (USD/lb) | $ | 0.81 | $ | 0.97 | ||||
| Zinc (USD/lb) | $ | 0.90 | $ | 0.98 | ||||
| USD/CAD | 0.794 | 0.914 | ||||||
| MXP/CAD | 12.35 | 11.98 | ||||||
For the nine months ended September 30, 2015, the Company earned revenues of $56.2 million, compared to $40.1 million for the comparative period in 2014, an increase of 40%. This increase is the result of a 53% increase in sales volume on a silver equivalent ounce basis (associated with the 39% increase in production and a drawdown of 2014 year-end inventory), and a 13% appreciation of the US dollar against the Canadian dollar which had the effect of increasing revenue reported in Canadian dollars. These factors more than offset the impact of 20% and 9% decreases in average realized silver and gold prices in US dollars, respectively, when compared to the commodity prices realized for the nine months ended September 30, 2014.
Revenue, Cost of Sales and Gross Profit (in CAD thousands) | Nine months ended September 30, 2015 | Nine months ended September 30, 2014 | % Change | |||||||||
| Revenue | $ | 56,222 | $ | 40,146 | 40 | % | ||||||
| Cost of sales: | ||||||||||||
| Production costs (cost of sales before non-cash items)1 | 37,093 | 31,530 | 18 | % | ||||||||
| Amortization and depletion | 16,408 | 11,841 | 38 | % | ||||||||
| Share-based compensation | 248 | 243 | 2 | % | ||||||||
| Total cost of sales | $ | 53,749 | $ | 43,614 | 23 | % | ||||||
| Gross profit (loss) | $ | 2,473 | $ | (3,468 | ) | (171 | )% | |||||
| Gross profit (loss) % | 4 | % | (9 | )% | ||||||||
| Add: | ||||||||||||
| Amortization and depletion | 16,408 | 11,841 | 38 | % | ||||||||
| Share-based compensation | 248 | 243 | 2 | % | ||||||||
| Gross profit before non-cash items1 | $ | 19,129 | $ | 8,616 | 122 | % | ||||||
| Gross profit before non-cash items % | 34 | % | 21 | % | ||||||||
Cost of sales before non-cash items increased 18% to $37.1 million for the nine months ended September 30, 2015, compared to $31.5 million in the same period of 2014. The increase was driven by the increase in unit metal sales, but was much less than the 53% increase in sales volume on a silver equivalent ounce basis due to much lower unit production costs as average ore grades improved significantly compared to the same period in the prior year.
| 1 | The Company has included the non-IFRS performance measures, cost of sales before non-cash items and gross profit before non-cash items, throughout this document. Refer to the Non-IFRS Measures section of this MD&A for an explanation of these measures and reconciliation to the Company’s reported financial results in accordance with IFRS. As these are not standardized measures, they may not be directly comparable to similarly titled measures used by others. |
GREAT PANTHER SILVER LIMITED Management’s Discussion & Analysis | Page 21 |
Gross profit before non-cash items increased by $10.5 million during the nine months ended September 30, 2015 as a result of the increase in revenues, combined with the above noted reduction in unit production costs.
Amortization and depletion of mineral properties, plant and equipment relating to cost of sales increased by $4.6 million for the nine months ended September 30, 2015. This was due to a reduction in the M&I Resource at the Guanajuato Mine based on the updated Mineral Resource Estimate issued in February 2015. The reduction of the Resource Estimate has the effect of reducing the amortization base and therefore increasing the amortization expense per unit produced and sold.
| (in CAD thousands) | Nine months ended September 30, 2015 | Nine months ended September 30, 2014 | % Change | |||||||||
| General & administrative (G&A) expenses | $ | 5,713 | $ | 5,027 | 14 | % | ||||||
| Exploration, evaluation & development (E&E) expenses | 4,135 | 3,016 | 37 | % | ||||||||
| Finance and other (income) expense | (2,854 | ) | (2,956 | ) | 3 | % | ||||||
| Income tax expense (recovery) | (40 | ) | (2,489 | ) | (98 | )% | ||||||
| Net income (loss) for the period | $ | (4,481 | ) | $ | (6,066 | ) | 26 | % | ||||
G&A expenses were $5.7 million for the nine months ended September 30, 2015 compared to $5.0 million for the comparative period in 2014. The increase reflects a shift in some executive salary and benefits expense from production costs to G&A due to a shift in roles and responsibilities. In addition, there were $0.2 million in one-time consulting charges in the areas of IT and accounting, and a $0.2 million increase in professional fees primarily due to timing of recognition of these costs.
E&E expenses increased by $1.1 million during the nine months ended September 30, 2015 compared to the same period in 2014. The increase is primarily a function of the commencement of exploration programs at the GDLR Project and Coricancha. These expenditures amounted to $0.5 million and $0.3 million, respectively in the period.
Finance and other income amounted to $2.9 million for the nine months ended September 30, 2015, and remained relatively unchanged from the same period in 2014.
The Company reported a nominal net income tax recovery during the nine months ended September 30, 2015, as $0.3 million of deferred income tax recovery was partially offset by $0.2 million in current income tax expense. The deferred income tax recovery recorded during the nine months ended September 30, 2015 related to a reduction in the Company’s estimate of future special mining duties which are expected to become payable by its Mexican operations. The current income tax expense relates to withholding taxes paid on the repatriation of intercompany interest income.
Net loss for the first nine months of 2015 was $4.5 million, compared to a net loss of $6.1 million for the same period in 2014. The Company benefitted from the $5.9 million improvement in gross profit. This was offset by a reduction in net income tax recovery of $2.5 million, a $0.7 million increase in G&A, and a $1.1 million increase in E&E expenses, when compared to the first nine months of 2014.
Adjusted EBITDA was $10.1 million for the first nine months of 2015, compared to adjusted EBITDA of $0.9 million for the comparative period of 2014. The increase in adjusted EBITDA is attributable to a $10.5 million increase in gross profit before non-cash items, as well as a $0.2 million decrease in other expenses. These factors were partly offset by an increase in cash exploration and evaluation expenses of $1.0 million and a $0.6 million increase in cash G&A expenses.
GREAT PANTHER SILVER LIMITED Management’s Discussion & Analysis | Page 22 |
OUTLOOK
On October 14, 2015, the Company released its third quarter 2015 production results and announced that it expects to exceed its 2015 production guidance of 3.8 to 3.9 million Ag eq oz which was increased in the second quarter of 2015 from a range of 3.5 to 3.6 million Ag eq oz. The Company expects to exceed its guidance range of 3.8 to 3.9 million Ag eq oz as production for the first nine months of the year totalled almost 3.2 million Ag eq oz. This will translate into at least 20% year-over-year growth in metal production.
Most importantly, the Company expects to achieve lower than guidance cash cost and AISC for 2015, and that AISC for the year is expected to be below the current silver price. However, fourth quarter 2015 AISC will be somewhat higher than levels in the third quarter due to greater capital expenditures and development planned for the fourth quarter.
| Production and cash cost guidance | FY 2014 Actual | Nine months ended September 30, 2015 | 2015 Guidance Range | |||||||||
| Total silver equivalent ounces1 | 3,187,832 | 3,156,537 | 3,800,000 – 3,900,000 | |||||||||
| Cash cost per payable silver ounce (USD)2 | $ | 12.78 | $ | 7.32 | $9.00 – $10.00 | |||||||
| AISC (USD) 2 | $ | 22.07 | $ | 13.38 | $15.00 – $17.00 | |||||||
Production from San Ignacio will continue to account for the predominant portion of the production from the GMC in the fourth quarter and for the foreseeable future. At the end of the third quarter, production from San Ignacio had reached more than 500 tonnes per day, greater than the 450 tonnes per day originally targeted for year end. Continued development of the Southern Extension zones should see further production growth through the fourth quarter with a new year-end target of approximately 650 tonnes per day.
Mine site exploration is continuing with a 2,200 metre surface drill program at San Ignacio. The objectives of the program are to extend the southerly strike extension of the ore zones with step-out holes and to upgrade the existing resource with in-fill drilling. Further underground drilling will also be conducted on several targets in the Guanajuato Mine.
Total planned drilling metres for 2015 remains unchanged at 29,700 metres. The 29,700 metres comprises drilling metres for the GMC, the GDLR Project and Coricancha. The Company is maintaining its guidance for $10 to $12 million in sustaining expenditures for 2015 comprising mine development and diamond drilling, and for the acquisition of new mining and plant equipment. Drilling related to the new projects is not included in this figure as they are considered non-sustaining expenditures.
Going into 2016, the Company expects production growth rates to generally level off as the production ramp up at San Ignacio over the last year will have been completed. In addition, the Company will focus more on maintaining and improving on the cost reductions and efficiency gains over the past year, and on more exploration and development at all mines. With this focus, the San Ignacio Mine will account for a greater proportion of production in 2016.
| 1 | Silver equivalent ounces are referred to throughout this document. For 2015, Aq eq oz are calculated using a 65:1 Ag:Au ratio, and ratios of 1:0.050 and 1:0.056 for the price/ounce of silver to lead and zinc price/pound, and applied to the relevant metal content of the concentrates produced, expected to be produced, or sold from operations. Comparatively, in 2014 Aq eq oz was established using prices of US$18.50 per oz, US$1,110 per oz (60:1 ratio), US$0.90 per lb., and US$0.85 per lb. for silver, gold, lead and zinc, respectively. |
| 2 | The Company has included the non-IFRS performance measures cost per tonne milled, cash cost per silver payable ounce, all-in cost per silver payable ounce (“AIC”), all-in sustaining cost per silver payable ounce (“AISC”), gross profit before non-cash items, cost of sales before non-cash items and adjusted EBITDA throughout this document. Refer to the Non-IFRS Measures section of this MD&A for an explanation of these measures and reconciliation to the Company’s reported financial results in accordance with IFRS. As these are not standardized measures, they may not be directly comparable to similarly titled measures used by others. |
GREAT PANTHER SILVER LIMITED Management’s Discussion & Analysis | Page 23 |
NON-IFRS MEASURES
The Company has included certain non-IFRS performance measures throughout this MD&A, including cost per tonne milled, cash cost, AISC, gross profit before non-cash items and cost of sales before non-cash items, each as defined in this section. The Company employs these measures internally to measure its operating and financial performance and to assist in business decision making. The Company believes that, in addition to conventional measures prepared in accordance with IFRS, certain investors and other stakeholders also use these non-IFRS measures as information to evaluate the Company’s operating and financial performance. As there are no standardized methods of calculating these non-IFRS measures, the Company’s methods may differ from those used by others and, accordingly, the use of these measures may not be directly comparable to similarly titled measures used by others. Accordingly, these non-IFRS measures are intended to provide additional information and should not be considered in isolation or as a substitute for measures of performance prepared in accordance with IFRS.
Cost per tonne milled
The Company uses the non-IFRS measure of cost per tonne milled to manage and evaluate operating performance at each of its mines. Cost per tonne milled is reported in US dollars and calculated based on the total production costs on a sales basis, adjusted for changes in inventory, to arrive at total production costs that relate to metal production during the period.
Management believes that the Company’s ability to control cost per tonne milled is one of its key performance indicators of results of operations. The Company believes this measure provides investors and analysts with useful information about its underlying cost of operations and how management controls those costs.
To facilitate a better understanding of this measure as calculated by the Company, a detailed reconciliation between cost per tonne milled and the Company’s cost of sales as reported in the Company’s consolidated statements of comprehensive income is provided below.
The following table reconciles cost per tonne milled to production costs, a component of cost of sales, for the three months ended September 30, 2015 and 2014:
| (in USD thousands,
except ounces and where noted otherwise) | GMC | Topia | Consolidated | |||||||||||||||||||||
| Q3 2015 | Q3 2014 | Q3 2015 | Q3 2014 | Q3 2015 | Q3 2014 | |||||||||||||||||||
| Production costs (sales basis) (CAD thousands) | $ | 7,793 | $ | 7,189 | $ | 3,232 | $ | 2,694 | $ | 11,025 | $ | 9,883 | ||||||||||||
| Production costs converted to USD (sales basis) | 5,957 | 6,580 | 2,469 | 2,479 | 8,426 | 9,059 | ||||||||||||||||||
| Change in concentrate inventory | 673 | 1,213 | 46 | 773 | 719 | 1,986 | ||||||||||||||||||
| Production costs (production basis) | $ | 6,630 | $ | 7,793 | $ | 2,515 | $ | 3,252 | $ | 9,145 | $ | 11,045 | ||||||||||||
| Tonnes milled, including custom milling | 77,136 | 72,047 | 17,940 | 18,835 | 95,076 | 90,882 | ||||||||||||||||||
| Cost per tonne milled (USD) | $ | 86 | $ | 108 | $ | 140 | $ | 173 | $ | 96 | $ | 122 |
| |||||||||||
GREAT PANTHER SILVER LIMITED Management’s Discussion & Analysis | Page 24 |
The following table reconciles cost per tonne milled to production costs, a component of cost of sales, for the nine months ended September 30, 2015 and 2014:
| (in USD thousands, except ounces and where noted otherwise) | GMC | Topia | Consolidated | |||||||||||||||||||||
| Sep 30, 2015 | Sep 30, 2014 | Sep 30, 2015 | Sep 30, 2014 | Sep 30, 2015 | Sep 30, 2014 | |||||||||||||||||||
| Production costs (sales basis) (CAD thousands) | $ | 27,328 | $ | 22,184 | $ | 9,765 | $ | 9,346 | $ | 37,093 | $ | 31,530 | ||||||||||||
| Production costs converted to USD (sales basis) | 21,803 | 20,273 | 7,753 | 8,544 | 29,556 | 28,818 | ||||||||||||||||||
| Change in concentrate inventory | (623 | ) | 779 | 157 | 1,010 | (466 | ) | 1,788 | ||||||||||||||||
| Production costs (production basis) | $ | 21,180 | $ | 21,052 | $ | 7,910 | $ | 9,554 | $ | 29,090 | $ | 30,606 | ||||||||||||
| Tonnes milled, including custom milling | 230,293 | 190,972 | 54,268 | 58,398 | 284,562 | 249,370 | ||||||||||||||||||
| Cost per tonne milled (USD) | $ | 92 | $ | 110 | $ | 146 | $ | 164 | $ | 102 | $ | 123 | ||||||||||||
Cash cost
The Company uses the non-IFRS measure of cash cost to manage and evaluate operating performance at each of its mines. It is a widely reported measure in the silver mining industry as a benchmark for performance, but does not have a standardized meaning. Cash cost is calculated based on the total cash operating costs with the deduction of revenues attributable to sales of by-product metals net of the respective smelting and refining charges. By-products consist of gold at the GMC, and gold, lead and zinc at Topia.
Management believes that the Company’s ability to control cash cost is one of the key performance indicators for its operations. Having low cash cost facilitates profitability even during times of declining commodity prices and provides more flexibility in responding to changing market conditions. In addition, a profitable operation results in the generation of positive cash flows, which then improves the Company’s financial condition. The Company believes these measures provide investors and analysts with useful information about its underlying cash cost of operations and the impact of by-product revenue on the Company’s cost structure and is a relevant metric used to understand the Company’s operating profitability and ability to generate cash flow.
The Company’s primary business is silver production and its future development and current operations focus on maximizing returns from silver production, with other metal production being incidental to the silver production process. Accordingly, gold, zinc and lead produced from operations are considered by-products. As a result, the Company’s non-IFRS cost performance measures are disclosed on a per payable silver ounce basis. When deriving the production costs associated with an ounce of silver, the Company includes by-product credits from gold, zinc and lead sales incidental to the silver production process, thereby allowing the Company’s management and other stakeholders to assess the net costs of silver production.
To facilitate a better understanding of this measure as calculated by the Company, a detailed reconciliation between the cash cost and the Company’s cost of sales as reported in the Company’s consolidated statements of comprehensive income is provided below. A breakdown is provided as to how the by-product revenues applied are attributed to the individual by-product metals.
GREAT PANTHER SILVER LIMITED Management’s Discussion & Analysis | Page 25 |
The following table reconciles cash cost to production costs for the three months ended September 30, 2015 and 2014, as reported in the Company’s condensed interim consolidated financial statements:
| (in USD thousands, except ounces and where noted otherwise) | GMC | Topia | Consolidated | |||||||||||||||||||||
| Q3 2015 | Q3 2014 | Q3 2015 | Q3 2014 | Q3 2015 | Q3 2014 | |||||||||||||||||||
| Production costs (CAD thousands) | $ | 7,793 | $ | 7,189 | $ | 3,232 | $ | 2,694 | $ | 11,025 | $ | 9,883 | ||||||||||||
| Production costs (as converted to USD) | 5,957 | 6,623 | 2,469 | 2,493 | 8,426 | 9,116 | ||||||||||||||||||
| Smelting and refining charges | 741 | 772 | 684 | 520 | 1,425 | 1,292 | ||||||||||||||||||
| Revenue from custom milling | - | - | (106 | ) | (55 | ) | (106 | ) | (55 | ) | ||||||||||||||
| Cash operating costs | $ | 6,698 | $ | 7,395 | $ | 3,047 | $ | 2,958 | $ | 9,745 | $ | 10,353 | ||||||||||||
| Gross by-product revenue1 | ||||||||||||||||||||||||
| Gold by-product revenue | (4,966 | ) | (4,266 | ) | (120 | ) | (56 | ) | (5,086 | ) | (4,322 | ) | ||||||||||||
| Lead by-product revenue | - | - | (515 | ) | (394 | ) | (515 | ) | (394 | ) | ||||||||||||||
| Zinc by-product revenue | - | - | (596 | ) | (556 | ) | (596 | ) | (556 | ) | ||||||||||||||
| Cash operating costs, net of by-product revenue | $ | 1,732 | $ | 3,129 | $ | 1,816 | $ | 1,952 | $ | 3,548 | $ | 5,081 | ||||||||||||
| Payable silver ounces sold | 387,860 | 338,689 | 157,927 | 122,560 | 545,787 | 461,249 | ||||||||||||||||||
| Cash cost per payable silver ounce (USD) | $ | 4.47 | $ | 9.24 | $ | 11.50 | $ | 15.93 | $ | 6.50 | $ | 11.02 | ||||||||||||
The following table reconciles cash cost to production costs for the nine months ended September 30, 2015 and 2014, as reported in the Company’s condensed interim consolidated financial statements:
| (in USD thousands, except ounces and where noted otherwise) | GMC | Topia | Consolidated | |||||||||||||||||||||
| Sep 30, 2015 | Sep 30, 2014 | Sep 30, 2015 | Sep 30, 2014 | Sep 30, 2015 | Sep 30, 2014 | |||||||||||||||||||
| Production costs (CAD thousands) | $ | 27,328 | $ | 22,184 | $ | 9,765 | $ | 9,346 | $ | 37,093 | $ | 31,530 | ||||||||||||
| Production costs (as converted to USD) | 21,803 | 20,396 | 7,753 | 8,594 | 29,556 | 28,990 | ||||||||||||||||||
| Smelting and refining charges | 2,486 | 1,775 | 1,960 | 1,801 | 4,446 | 3,576 | ||||||||||||||||||
| Revenue from custom milling | - | - | (327 | ) | (202 | ) | (327 | ) | (202 | ) | ||||||||||||||
| Cash operating costs | $ | 24,289 | $ | 22,171 | $ | 9,386 | $ | 10,193 | $ | 33,675 | $ | 32,364 | ||||||||||||
| Gross by-product revenue2 | ||||||||||||||||||||||||
| Gold by-product revenue | (16,977 | ) | (13,175 | ) | (322 | ) | (300 | ) | (17,299 | ) | (13,475 | ) | ||||||||||||
| Lead by-product revenue | - | - | (1,451 | ) | (1,522 | ) | (1,451 | ) | (1,522 | ) | ||||||||||||||
| Zinc by-product revenue | - | - | (1,923 | ) | (1,805 | ) | (1,923 | ) | (1,805 | ) | ||||||||||||||
| Cash operating costs, net of by-product revenue | $ | 7,312 | $ | 8,996 | $ | 5,690 | $ | 6,566 | $ | 13,002 | $ | 15,562 | ||||||||||||
| Payable silver ounces sold | 1,314,232 | 776,518 | 461,793 | 418,321 | 1,776,025 | 1,194,839 | ||||||||||||||||||
| Cash cost per payable silver ounce (USD) | $ | 5.56 | $ | 11.59 | $ | 12.32 | $ | 15.70 | $ | 7.32 | $ | 13.02 | ||||||||||||
| 1 | Gross by-product revenue is defined as revenue from the by-products of silver, specifically gold at GMC and gold, lead and zinc at Topia, net of the respective smelting and refining charges and net of mining duties calculated on the applicable gross revenue. The by-product revenues attributable to each by-product metal are included. |
| 2 | Gross by-product revenue is defined as revenue from the by-products of silver, specifically gold at GMC and gold, lead and zinc at Topia, net of the respective smelting and refining charges and net of mining duties calculated on the applicable gross revenue. The by-product revenues attributable to each by-product metal are included. |
GREAT PANTHER SILVER LIMITED Management’s Discussion & Analysis | Page 26 |
All-in sustaining cost (AISC)
AISC is a non-IFRS measure and has been calculated based on World Gold Council (“WGC”) guidance released in 2013. The WGC is not a regulatory organization and does not have the authority to develop accounting standards for disclosure requirements. The Company believes that the disclosure of this measure provides a broader measure of the cost of producing an ounce of silver at its operations as the measure includes sustaining capital and development expenditures, G&A costs, and other costs not commonly included in the cost of production and therefore not included in cash cost.
AISC starts with cash cost net of by-product revenues and adds G&A expenditures inclusive of share-based compensation, accretion of reclamation and remediation costs, sustaining E&E expenses, sustaining mine development costs and sustaining capital expenditures. Sustaining expenditures are those costs incurred to sustain and maintain existing assets at current productive capacity and constant planned levels of productive output. Excluded are non-sustaining capital expenditures which result in a material increase in the life of assets, materially increase resources or reserves, productive capacity, future earning potential, or result in significant improvements in recovery or grade.
The following table reconciles cash operating costs, net of by-product revenue, to AISC for the three months ended September 30, 2015 and 2014:
| (in USD thousands, except ounces) | GMC | Topia | Corporate | Consolidated | ||||||||||||||||||||||||||||
| Q3 2015 | Q3 2014 | Q3 2015 | Q2 2014 | Q3 2015 | Q3 2014 | Q3 2015 | Q3 2014 | |||||||||||||||||||||||||
| Cash operating costs, net of by-product revenue 1 | $ | 1,732 | $ | 3,129 | $ | 1,816 | $ | 1,951 | - | - | $ | 3,548 | $ | 5,080 | ||||||||||||||||||
| G&A costs inclusive of share-based compensation | - | - | - | - | 1,379 | 1,477 | 1,379 | 1,477 | ||||||||||||||||||||||||
| Accretion of reclamation and remediation costs | 10 | 8 | 19 | 17 | - | - | 29 | 25 | ||||||||||||||||||||||||
| Sustaining E&E costs | 1 002 | 564 | (40 | ) | 6 | - | - | 962 | 570 | |||||||||||||||||||||||
| Sustaining capitalized mine development and capital costs | 1,082 | 1,256 | 140 | 472 | - | - | 1,222 | 1,728 | ||||||||||||||||||||||||
| All-in sustaining costs | $ | 3,826 | $ | 4,957 | $ | 1,935 | $ | 2,446 | $ | 1,379 | $ | 1,479 | $ | 7,140 | $ | 8,880 | ||||||||||||||||
| Payable silver ounces sold | 387,860 | 338,689 | 157,927 | 122,560 | n/a | n/a | 545,787 | 461,249 | ||||||||||||||||||||||||
| AISC per payable silver ounce | $ | 9.87 | $ | 14.64 | $ | 12.25 | $ | 19.96 | n/a | n/a | $ | 13.08 | $ | 19.25 | ||||||||||||||||||
1 Cash operating costs, net of by-product revenue, are reconciled to the Company’s financial statements in the cash cost table.
GREAT PANTHER SILVER LIMITED Management’s Discussion & Analysis | Page 27 |
The following table reconciles cash operating costs, net of by-product revenue, to AISC for the nine months ended September 30, 2015 and 2014:
| (in USD thousands, except ounces) | GMC | Topia | Corporate | Consolidated | ||||||||||||||||||||||||||||
| Sep 30, 2015 | Sep 30, 2014 | Sep 30, 2015 | Sep 30, 2014 | Sep 30, 2015 | Sep 30, 2014 | Sep 30, 2015 | Sep 30, 2014 | |||||||||||||||||||||||||
| Cash operating costs, net of by-product revenue 1 | $ | 7,312 | $ | 8,996 | $ | 5,690 | $ | 6,566 | $ | - | $ | - | $ | 13,002 | $ | 15,562 | ||||||||||||||||
| G&A costs inclusive of share-based compensation | - | - | - | - | 4,756 | 4,692 | 4,756 | 4,692 | ||||||||||||||||||||||||
| Accretion of reclamation and remediation costs | 19 | 33 | 31 | 63 | - | - | 50 | 96 | ||||||||||||||||||||||||
| Sustaining E&E costs | 2,241 | 1,065 | 54 | 24 | - | - | 2,295 | 1,089 | ||||||||||||||||||||||||
| Sustaining capitalized mine development and capital costs | 3,261 | 4,107 | 407 | 1,158 | - | - | 3,668 | 5,265 | ||||||||||||||||||||||||
| All-in sustaining costs | $ | 12,834 | $ | 14,201 | $ | 6,182 | $ | 7,811 | $ | 4,756 | $ | 4,692 | $ | 23,771 | $ | 26,704 | ||||||||||||||||
| Payable silver ounces sold | 1,314,232 | 776,518 | 461,793 | 418,321 | na | na | 1,776,025 | 1,194,839 | ||||||||||||||||||||||||
| AISC per payable silver ounce | $ | 9.77 | $ | 18.29 | $ | 13.39 | $ | 18.67 | na | na | $ | 13.38 | $ | 22.35 | ||||||||||||||||||
The above costs are included in the Company’s condensed interim consolidated financial statements at September 30, 2015 as follows:
| Item | Source | |
| G&A costs inclusive of share-based compensation | Consolidated statements of comprehensive income | |
| Accretion of reclamation and remediation costs | Included in Finance and other income within the consolidated statements of comprehensive income | |
| Sustaining E&E costs | A subset of the total exploration and evaluation, and development expenses within the consolidated statements of comprehensive income | |
| Sustaining capitalized mine development and capital costs | Included within mineral properties, plant and equipment additions on the statement of financial position |
Management believes that the AISC measure represents the total sustainable costs of producing silver from current operations, and provides additional information of the Company’s operational performance and ability to generate cash flows.
In the above tables, development costs related to the Company’s San Ignacio property prior to it entering commercial production in June 2014 were considered non-sustaining as are any expenses incurred in respect of the Company’s El Horcón, Santa Rosa, the GDLR Project and Coricancha.
EBITDA and adjusted EBITDA
EBITDA is a non-IFRS measure that provides an indication of the Company’s continuing capacity to generate income from operations before taking into account management’s financing decisions and costs of amortizing capital assets. Accordingly, EBITDA comprises net income excluding interest expense, interest income, amortization and depletion, impairment charges, and income taxes.
Adjusted EBITDA is also a non-IFRS measure in which EBITDA is adjusted to exclude share-based compensation expense, foreign exchange gains or losses, and non-recurring items. Foreign exchange gains or losses may consist of both realized and unrealized losses. Under IFRS, entities must reflect in compensation expense the cost of share-based compensation. In the Company’s circumstances, share-based compensation can involve a significant accrual of amounts that will not be settled in cash but are settled by the issuance of shares in exchange. The Company discloses adjusted EBITDA to aid in understanding of the results of the Company and is meant to provide further information about the Company’s financial results to investors.
GREAT PANTHER SILVER LIMITED Management’s Discussion & Analysis | Page 28 |
The following table provides a reconciliation of EBITDA and adjusted EBITDA for the quarter and nine months ended September 30, 2015 and 2014 to the unaudited condensed interim consolidated financial statements:
| (in CAD thousands) | Q3 2015 | Q3 2014 | Nine months ended September 30, 2015 | Nine months ended September 30, 2014 | ||||||||||||
| Income (loss) for the period | $ | (3,348 | ) | $ | (970 | ) | $ | (4,481 | ) | $ | (6,066 | ) | ||||
| Income tax expense (recovery) | 302 | (324 | ) | (40 | ) | (2,489 | ) | |||||||||
| Interest income | (29 | ) | (41 | ) | (255 | ) | (186 | ) | ||||||||
| Interest expense | 71 | 28 | 138 | 105 | ||||||||||||
| Amortization and depletion | 5,466 | 4,372 | 16,602 | 12,077 | ||||||||||||
| EBITDA | $ | 2,462 | $ | 3,065 | $ | 11,964 | $ | 3,441 | ||||||||
| Foreign exchange loss (gain) | (591 | ) | (2,123 | ) | (2,720 | ) | (3,061 | ) | ||||||||
| Share-based compensation | 284 | 325 | 806 | 555 | ||||||||||||
| Adjusted EBITDA | $ | 2,155 | $ | 1,267 | $ | 10,050 | $ | 935 | ||||||||
Gross profit before non-cash items and cost of sales before non-cash items
Gross profit before non-cash items and cost of sales before non-cash items are non-IFRS measures that provide a measure of the Company’s cost of sales and gross profit on a cash basis. These measures are provided in order to better assess the cash generation ability of the Company’s operations, before G&A expenses and E&E expenses. A reconciliation of gross profit and cost of sales before non-cash items is provided in the Results of Operations section.
LIQUIDITY AND CAPITAL RESOURCES
Net working capital including cash and cash equivalents
| (in CAD thousands) | September 30, 2015 | December 31, 2014 | ||||||
| Cash and cash equivalents | $ | 18,685 | $ | 17,968 | ||||
| Net working capital | $ | 34,725 | $ | 32,907 | ||||
At September 30, 2015, the Company had cash and cash equivalents of $18.7 million compared to $18.0 million at December 31, 2014. Cash increased by $0.7 million in the first nine months of 2015 primarily due to cash flows from operating activities before changes in non-cash working capital of $10.0 million and a $1.5 million increase in cash and cash equivalents as the result of favorable foreign exchange fluctuations. These factors exceeded the $8.7 million invested in mineral properties, plant and equipment and exploration and evaluation assets (the GDLR Project and Coricancha) and the increase in non-cash working capital (primarily accounts receivable) of $2.1 million.
At September 30, 2015, the Company had net working capital of $34.7 million compared to $32.9 million at December 31, 2014. Net working capital increased by $1.8 million due to the $0.7 million increase in cash and a $2.7 million increase in trade and other receivables, net of the $1.4 million decrease in inventories during the first nine months of 2015.
GREAT PANTHER SILVER LIMITED Management’s Discussion & Analysis | Page 29 |
Operating activities
For the quarter ended September 30, 2015, cash flow provided by operating activities was $0.5 million compared to $3.9 million for the quarter ended September 30, 2014. The $3.3 million decrease in cash flow provided by operating activities is attributable to a $2.1 million increase in non-cash net working capital, a $1.3 million increase in E&E expenses, a $0.2 million increase in G&A expenses, as well as a $0.5 million reduction in other income. These factors were partly offset by the $0.8 million increase in gross profit before non-cash items during the quarter ended September 30, 2015.
Similarly, for the nine months ended September 30, 2015, cash flow provided by operating activities was $7.9 million, compared to $3.8 million in the comparative period in 2014. The $4.1 million increase in cash flow from operating activities was achieved due to the $10.5 million increase in gross profit before non-cash items achieved during the first nine months of 2015, partly offset by a $4.7 million increase in non-cash net working capital, $1.0 million increase in E&E expenses, as well as the $0.6 million increase in G&A expenses.
Investing activities
For the quarter ended September 30, 2015, the Company had net cash outflows from investing activities of $2.0 million, compared to $2.2 million during the comparative period in 2014. The decrease is related to amounts invested in mineral properties and plant and equipment related to the Company’s mining operations.
For the nine months ended September 30, 2015, the Company invested $8.7 million, compared to $6.4 million in the comparative nine months ended September 30, 2014. The increase is predominantly attributable to the Company’s $3.2 million in expenditures associated with the Coricancha option agreement and the Cangold acquisition, partly offset by a $0.9 million decrease in expenditures on mineral properties, plant and equipment related to the Company’s mining operations.
Financing activities
There were no cash flows provided by financing activities during the quarter ended September 30, 2015 compared to $0.3 million in the corresponding period in 2014, which related to proceeds received from the exercise of stock options during the period.
For the nine months ended September 30, 2015, there were no cash flows provided by financing activities, compared to $0.7 million in the corresponding period in 2014.
Trends in liquidity and capital resources
The Company generated $10.0 million in operating cash flows before changes in non-cash net working capital during the first nine months of 2015. As this exceeded cash used in investing activities, the Company increased both cash and cash equivalents and net working capital at the end of September 30, 2015 relative to December 31, 2014. In addition, foreign currency translation also contributed to the increase in cash and cash equivalents and net working capital.
The Company anticipates that cash flow generated from mining activities along with net working capital will be sufficient to fund the Company’s operations without requiring any additional capital to meet its planned growth and fund development and investment activities during 2015 and the foreseeable future. However, this is highly dependent on metal prices and the ability of the Company to maintain cost and grade control at its operations. Cash flow from operations for the nine months ended September 30, 2015 was well ahead of the Company’s expectation due to favorable exchange rates, higher than planned production rates and lower than planned cash cost. While these factors have lead the Company to increase its expectation for cash flow from operations for 2015, this is somewhat offset by plans to increase drilling expenditures related to new projects acquired in the third quarter of 2015. Sustaining expenditures for 2015 are expected to be in the range of $10 to $12 million. Refer to the Outlook section for a more complete discussion of the Company’s anticipated expenditures for 2015.
GREAT PANTHER SILVER LIMITED Management’s Discussion & Analysis | Page 30 |
The Company’s operating cash flows are very sensitive to the price of silver and gold, foreign exchange rate fluctuations, and grade fluctuations, and the operating cash flow forecast provided above can vary significantly. Capital spending plans may also be adjusted in response to changes in operating cash-flow expectations. An increase in average silver prices from current levels may result in an increase in planned expenditures and, conversely, weaker average silver prices could result in a reduction of planned expenditures.
The Company has no debt, other than trade and other payables. On June 10, 2015, the Company announced that it had obtained a US$10.0 million credit facility from Auramet International LLC. The facility has a term of one year and bears interest at a rate of LIBOR plus 5%. The Company has not drawn down any amounts on this credit facility. The Company may require access to additional capital in order to fund additional expansion or development plans, or to undertake an acquisition.
Contractual Obligations
As of September 30, 2015, the Company had the following contractual obligations:
| (in CAD thousands) | Total | 1 year | 2-3 years | 4-5 years | Thereafter | |||||||||||||||
| Operating lease payments | $ | 2,230 | $ | 279 | $ | 641 | $ | 611 | $ | 699 | ||||||||||
| Drilling services | 84 | 84 | - | - | - | |||||||||||||||
| Reclamation and remediation (undiscounted) | 3,777 | - | 1,461 | 340 | 1,976 | |||||||||||||||
| Total | $ | 6,091 | $ | 363 | $ | 2,102 | $ | 951 | $ | 2,675 | ||||||||||
Off-Balance sheet arrangements
At the date of this MD&A, the Company had no material off-balance sheet arrangements that have, or are reasonably likely to have, a current or future effect on the financial performance or financial condition of the Company.
TRANSACTIONS WITH RELATED PARTIES
Cangold was a related party of the Company, with directors and/or officers in common, up until completion of the acquisition of Cangold on May 27, 2015. Robert A. Archer and Ken Major served as board members of both companies. Robert Brown served as a board member of Cangold and served as an officer of both companies. Mr. Archer also served as Chief Executive Officer and President of both Great Panther and Cangold. The Company’s employees provided certain exploration and corporate secretarial services to Cangold and its subsidiary. In addition, the Company charged rent for shared office space. The Company, Cangold and a Mexican subsidiary of Cangold also entered into a suite of loan documents on February 26, 2015 (the “Cangold Loan”) whereby the Company would continue to provide technical, administrative and management services to Cangold, and discretionary credit advances.
The Cangold Loan included those amounts previously owing from Cangold (December 31, 2014 - $0.1 million) with regards to technical, administrative and management services historically provided. It also included new credit advances made to Cangold subsequent to February 26, 2015. The Cangold Loan bore interest at 15% and was secured by a general security agreement, as well as a share pledge agreement. The Cangold Loan entitled the Company to receive bonus common shares in Cangold equivalent to 20% of all cash advances under the Cangold Loan, divided by the market price of Cangold’s common shares. Interest was receivable monthly while the outstanding principal amount was receivable from Cangold within 45 days of the Company making such demand. The Cangold Loan and the Cangold bonus common shares were derecognized upon the completion of the Cangold acquisition. As of the date of the acquisition, the Company had advanced $1.2 million to Cangold and had received a total of 3,957,680 bonus common shares (fair valued at $0.1 million) of Cangold.
GREAT PANTHER SILVER LIMITED Management’s Discussion & Analysis | Page 31 |
Platoro Resource Corp. (“Platoro”) is a company controlled by Robert A. Archer through which Mr. Archer provided his services as President and CEO of the Company until December 31, 2014. The Company entered into an employment agreement with Mr. Archer effective January 1, 2015 that succeeded the consulting services agreement with Platoro. As at September 30, 2015, nil (December 31, 2014: $36,000) was payable to Platoro.
The Company’s key management includes the Company’s Directors, the President and CEO, the CFO, the COO and the Vice Presidents. The compensation paid or payable to key management for the third quarter of 2015 was $0.6 million (third quarter of 2014 - $0.8 million). The Company is committed to making severance payments amounting to approximately $2.3 million to certain officers and management in the event that there is a change in control of the Company.
During the quarter, the Company’s Directors travelled to some of the Company’s operations to review operations, safety, and progress on certain projects. As at September 30, 2015, $8,000 (December 31, 2014: nil) was receivable from certain Directors for personal expenditures associated with this travel.
CRITICAL ACCOUNTING ESTIMATES
The preparation of the consolidated financial statements in conformity IFRS requires management to make judgments, estimates and assumptions which affect the reported amounts of assets and liabilities, the disclosure of contingent assets and liabilities at the date of the consolidated financial statements and the reported amounts of revenues and expenses during the reporting period. Estimates are based on historical experience and other factors considered to be reasonable, and are reviewed on an ongoing basis. Actual results may differ from these estimates.
See Critical Accounting Estimates in the Company’s annual MD&A as well as note 4 of the 2014 annual audited financial statements for a detailed discussion of the areas in which critical accounting estimates are made and where actual results may differ from the estimates under different assumptions and conditions and may materially affect financial results of its statement of financial position reported in future periods.
Estimates and underlying assumptions are reviewed on an ongoing basis. Revisions to accounting estimates are recognized in the period in which the estimates are revised and in any future periods affected.
Capitalized costs associated with the Topia mineral property are depleted on a straight line basis. On July 9, 2015, the Company provided an update on the Mineral Resource at the Topia Mine, following which management reviewed the remaining useful life of the Topia mineral property. The estimate of the useful life of the mineral property was determined to be 11 years as at July 1, 2015, an increase from the previous estimate of 6.5 years. As a result, the depletion recorded during the current quarter was approximately $0.1 million less than would have been recorded prior to the change in estimate. Based on the carrying value of the mineral property as at September 30, 2015, management estimated that the impact of the change in estimate on future periods is $0.5 million per annum.
In September 2015, the Company commenced expensing mine development cost associated with the Guanajuato Mine through the statement of comprehensive income, having previously capitalized such costs. This change in presentation reflects the fact that the Company has mined and depleted the most recently published Measured and Indicated Resources for the Guanajuato Mine. However, the Company continues to mine from Inferred Resources and areas outside of defined resources. In addition, the Company is continuing the exploration and development of the mine with the objective of adding further resources and converting existing Inferred Resources to Measured and Indicated Resources.
GREAT PANTHER SILVER LIMITED Management’s Discussion & Analysis | Page 32 |
The Company did not identify any other areas where revisions to estimates and assumptions have resulted in material changes to the results or financial position of the Company.
CHANGES IN ACCOUNTING POLICIES
The Company has not adopted any new accounting standards for the year ending December 31, 2015, however, the following are accounting standards anticipated to be effective January 1, 2016 or later:
IFRS 9 Financial Instruments
In July 2014, the IASB issued the final version of IFRS 9 Financial Instruments which reflects all phases of the financial instruments project and replaces IAS 39 Financial Instruments: Recognition and Measurement, and all previous versions of IFRS 9. The standard introduces new requirements for classification and measurement, impairment, and hedge accounting. IFRS 9 is effective for annual periods beginning on or after 1 January 2018, with early application permitted. The Company is currently evaluating the impact these standards are expected to have on its consolidated financial statements.
IFRS 15 Revenue from Contracts with Customers
In May 2014, the IASB issued a new IFRS 15 Revenue from contracts with Customers. The standard contains a single model that applies to contracts with customers and two approaches to recognizing revenue: at a point in time or over time. The model features a contract-based five-step analysis of transactions to determine whether, how much and when revenue is recognized. New estimates and judgmental thresholds have been introduced, which may affect the amount and/or timing of revenue recognized. IFRS 15 is effective for annual periods beginning on January 1, 2018. The Company is currently evaluating the impact these standards are expected to have on its consolidated financial statements.
IFRS 7 Financial Instruments: Disclosure
Amended to require additional disclosures on transition from IAS 39 to IFRS 9. Effective on adoption of IFRS 9, which is effective for annual periods commencing on or after January 1, 2018. The Company is currently evaluating the impact these standards are expected to have on its consolidated financial statements.
IFRS 10 Consolidated Financial Statements
The main consequence of the amendments is that a full gain or loss is recognised when a transaction involves a business (whether it is housed in a subsidiary or not). A partial gain or loss is recognised when a transaction involves assets that do not constitute a business, even if the assets are housed in a subsidiary. Upon adoption, the amendments may impact the Company in respect of future sale or contribution of assets with its associates or joint ventures. The amendments are effective for transactions occurring in annual periods beginning on or after 1 January 2016. The Company is currently evaluating the impact these amendments are expected to have on its consolidated financial statements.
IAS 34 Interim Financial Reporting: Disclosure
Amended to require interim disclosures must either be in the interim financial statements or incorporated by cross-reference between the interim financial statements and wherever they are included within the greater interim financial report such as Management Discussion and Analysis. Other information within the interim financial report must be available to users on the same terms as the interim financial statements and at the same time. The Company is currently evaluating the impact these standards are expected to have on its consolidated financial statements.
GREAT PANTHER SILVER LIMITED Management’s Discussion & Analysis | Page 33 |
There are no other IFRS or IFRIC interpretations that are not yet effective that would be expected to have a material impact.
FINANCIAL INSTRUMENTS
| (In CAD thousands) | Fair value as at Sep 30, 2015 | Basis of measurement | Associated risks | |||||
| Cash and cash equivalents | $ | 18,685 | Amortized cost | Credit, currency, interest rate | ||||
| Marketable securities | $ | 4 | Fair value through other comprehensive income | Exchange | ||||
| Trade and other receivables | $ | 13,357 | Amortized cost | Credit, currency, commodity price | ||||
| Trade and other payables | $ | 6,242 | Amortized cost | Currency, liquidity | ||||
The Company is exposed in varying degrees to a number of risks from financial instruments. Management’s close involvement in the operations allows for the identification of risks and variances from expectations. The types of risk exposure and the way in which such exposures are managed by the Company are provided in note 18 of the annual audited consolidated financial statements for the year ended December 31, 2014.
SECURITIES OUTSTANDING
As of the date of this MD&A, the Company had 141,712,605 common shares issued, 250,000 share purchase warrants and 10,804,019 options outstanding.
QUALIFIED PERSON
Robert F. Brown, P. Eng., a Qualified Person as defined by National Instrument 43-101 and the Company's Vice President of Exploration, has reviewed and approved the technical disclosure contained in this MD&A.
INTERNAL CONTROLS OVER FINANCIAL REPORTING
The Company’s management is responsible for establishing and maintaining internal controls over financial reporting (“ICFR”) to provide reasonable assurance in respect of the reliability of financial reporting and the preparation of the financial statements for external purposes in accordance with IFRS. Other than changes in the Company’s ICFR associated with the Cangold acquisition, there have been no changes that occurred during the three months ended September 30, 2015, that have materially affected, or are reasonably likely to materially affect, internal controls over financial reporting. Any system of internal control over financial reporting, no matter how well designed, has inherent limitations. Therefore even those systems determined to be effective can provide only reasonable assurance with respect to financial preparation and presentation.
GREAT PANTHER SILVER LIMITED Management’s Discussion & Analysis | Page 34 |
DISCLOSURE CONTROLS AND PROCEDURES
The Company’s management is also responsible for the design and effectiveness of disclosure controls and procedures that are designed to provide reasonable assurance that material information related to the Company, including its consolidated subsidiaries, are made known to the Company’s certifying officers. Other than changes in the Company’s disclosure controls and procedures associated with the Cangold acquisition, there have been no changes that occurred during the three months ended September 30, 2015 that have materially affected, or are reasonably likely to affect the Company’s disclosure controls and procedures.
CAUTIONARY STATEMENT ON FORWARD-LOOKING STATEMENTS
Certain of the statements and information in this document constitute “forward-looking statements” within the meaning of the United States Private Securities Litigation Reform Act of 1995 and “forward-looking information” within Canadian securities laws (collectively, “forward-looking statements”). All statements, other than statements of historical fact, addressing activities, events or developments that the Company expects or anticipates will or may occur in the future are forward-looking statements. Forward-looking statements are often, but not always, identified by the words “anticipates”, “believes”, “expects”, “may”, “likely”, “plans”, “intends”, “expects”, “may”, “forecast”, “project”, “budgets”, “potential”, and “outlook”, or similar words, or statements that certain events or conditions “may”, “might”, “could”, “can”, “would”, or “will” occur. Forward-looking statements reflect the Company’s current expectations and assumptions, and are subject to a number of known and unknown risks, uncertainties and other factors which may cause the Company’s actual results, performance or achievements to be materially different from any anticipated future results, performance or achievements expressed or implied by the forward-looking statements.
In particular, this MD&A includes forward-looking statements, principally under the section titled Outlook, but also elsewhere in this document relating to estimates, forecasts, and statements as to management’s expectations, opinions and assumptions with respect to the future production of silver, gold, lead and zinc; profit, operating costs and cash flow; grade improvements; sales volume and selling prices of products; capital and exploration expenditures, plans, timing, progress, and expectations for the development of the Company’s mines and projects; the timing of production and the cash and total costs of production; sensitivity of earnings to changes in commodity prices and exchange rates; the impact of foreign currency exchange rates; expenditures to increase or determine reserves and resources; sufficiency of available capital resources; title to claims; expansion and acquisition plans; and the future plans and expectations for the Company’s properties and operations. Examples of specific information in this MD&A that may constitute forward looking statements are:
| · | Plans and targets for exploration and development drilling in 2015 and beyond for each of the Company’s properties; |
| · | Expectations for production from San Ignacio, including the year-end target of 650 tonnes per day; |
| · | Expectations of the Company’s silver equivalent ounce production for 2015; |
| · | Guidance for cash cost and AISC for 2015; |
| · | Expectations that cash flow from operations along with current net working capital will be sufficient to fund capital investment and development programs for 2015 and the foreseeable future; |
| · | Expectations for improvement in grade control and higher cut-off grades at all the Company’s mines; |
| · | Expected expenditures on investing activities for 2015; |
| · | Expectations regarding access to additional capital in order to fund additional expansion or development plans, or to undertake an acquisition; and |
| · | The Company’s objective to acquire additional mines or projects in the Americas. |
GREAT PANTHER SILVER LIMITED Management’s Discussion & Analysis | Page 35 |
These forward-looking statements are necessarily based on a number of factors and assumptions that, while considered reasonable by the Company as of the date of such statements, are inherently subject to significant business, economic and competitive uncertainties and contingencies, as described below. These assumptions made by the Company in preparing the forward looking information contained in this MD&A, which may prove to be incorrect, include, but are not limited to, general business and economic conditions; the supply and demand for, deliveries of, and the level and volatility of prices of, silver, gold, lead and zinc; expected Canadian dollar, Mexican peso and US dollar exchange rates; the timing of the receipt of regulatory and governmental approvals for development projects and other operations; costs of production, and production and productivity levels; estimated future capital expenditures and cash flows; the continuing availability of water and power resources for operations; the accuracy of the interpretation and assumptions used in calculating reserve and resource estimates (including with respect to size, grade and recoverability); the accuracy of the information included or implied in the various independently produced and published technical reports; the geological, operational and price assumptions on which these technical reports are based; conditions in the financial markets; the ability to attract and retain skilled staff; the ability to procure equipment and operating supplies and that there are no material unanticipated variations in the cost of energy or supplies; the ability to secure contracts for the sale of the Company’s products (metals concentrates); the execution and outcome of current or future exploration activities; that current financial resources will be sufficient for planned activities and to complete further exploration programs; the possibility of project delays and cost overruns, or unanticipated excessive operating costs and expenses; the Company’s ability to maintain adequate internal control over financial reporting, and disclosure controls and procedures; the ability of contractors to perform their contractual obligations; operations not being disrupted by issues such as mechanical failures, labour disturbances, illegal occupations and adverse weather conditions; that financial resources will be sufficient to fund new acquisitions, if any.
This list is not exhaustive of the factors that may affect any of the Company’s forward-looking statements or information. Forward-looking statements or information are statements about the future and are inherently uncertain, and actual achievements of the Company or other future events or conditions may differ materially from those reflected in the forward-looking statements or information due to a variety of risks, uncertainties and other factors, including, without limitation, changes in commodity prices; changes in foreign currency exchange rates; acts of foreign governments; political risk and social unrest; uncertainties related to title to the Company’s mineral properties and the surface rights thereon, including the Company’s ability to acquire, or economically acquire, the surface rights to certain of the Company’s exploration and development projects; unanticipated operational difficulties due to adverse weather conditions; failure of plant or mine equipment and unanticipated events related to health, safety, and environmental matters; failure of counterparties to perform their contractual obligations; and deterioration of general economic conditions.
The Company’s forward-looking statements and information are based on the assumptions, beliefs, expectations and opinions of management as of the date of this MD&A. The Company will update forward looking statements and information if and when, and to the extent required by applicable securities laws. Readers should not place undue reliance on forward-looking statements. The forward-looking statements contained herein are expressly qualified by this cautionary statement.
Further information can be found in the section entitled Description of the Business – Risk Factors in the most recent Form 40-F/AIF on file with the SEC and Canadian provincial securities regulatory authorities. Readers are advised to carefully review and consider the risk factors identified in the Form 40-F/AIF for a discussion of the factors that could cause the Company’s actual results, performance and achievements to be materially different from any anticipated future results, performance or achievements expressed or implied by the forward-looking statements. It is recommended that prospective investors consult the more complete discussion of the Company’s business, financial condition and prospects that is included in the Form 40-F/AIF.
CAUTIONARY NOTE TO U.S. INVESTORS
This MD&A has been prepared in accordance with Canada securities regulations, which differs from the securities regulations of the United States. The terms “Mineral Resource”, “Measured Mineral Resource”, “Indicated Mineral Resource” and “Inferred Mineral Resource” are used in accordance with Canadian NI 43-101, however, these terms are not defined terms under SEC Industry Guide 7 and are normally not permitted to be used in reports and registration statements filed with the SEC. Investors are cautioned not to assume that any part or all of the mineral deposits in these categories will ever be converted into reserves. “Inferred Mineral Resources” have a great amount of uncertainty as to their existence, and great uncertainty as to their economic and legal feasibility. It cannot be assumed that all or any part of an inferred mineral resource will ever be upgraded to a higher category. In accordance with Canadian rules, estimates of inferred mineral resources cannot form the basis of feasibility or other advanced economic studies. Investors are cautioned not to assume that all or any part of an inferred mineral resource exists or is economically or legally mineable.
GREAT PANTHER SILVER LIMITED Management’s Discussion & Analysis | Page 36 |
Exhibit 99.3
FORM 52-109F2
CERTIFICATION OF INTERIM FILINGS
FULL CERTIFICATE
I, Robert A. Archer, Chief Executive Officer of Great Panther Silver Limited, certify the following:
| 1. | Review: I have reviewed the interim financial report and interim MD&A (together, the “interim filings”) of Great Panther Silver Limited (the “Issuer”) for the interim period ended September 30, 2015. |
| 2. | No misrepresentations: Based on my knowledge, having exercised reasonable diligence, the interim filings do not contain any untrue statement of a material fact or omit to state a material fact required to be stated or that is necessary to make a statement not misleading in light of the circumstances under which it was made, for the period covered by the interim filings. |
| 3. | Fair presentation: Based on my knowledge, having exercised reasonable diligence, the interim financial report together with the other financial information included in the interim filings fairly present in all material respects the financial condition, financial performance and cash flows of the Issuer, as of the date of and for the periods presented in the interim filings. |
| 4. | Responsibility: The Issuer’s other certifying officer(s) and I are responsible for establishing and maintaining disclosure controls and procedures (DC&P) and internal control over financial reporting (ICFR), as those terms are defined in National Instrument 52-109 Certification of Disclosure in Issuers’ Annual and Interim Filings, for the Issuer. |
| 5. | Design: Subject to the limitations, if any, described in paragraphs 5.2 and 5.3, the Issuer’s other certifying officer(s) and I have, as at the end of the period covered by the interim filings |
| (a) | designed DC&P, or caused it to be designed under our supervision, to provide reasonable assurance that |
| (i) | material information relating to the Issuer is made known to us by others, particularly during the period in which the interim filings are being prepared; and |
| (ii) | information required to be disclosed by the Issuer in its annual filings, interim filings or other reports filed or submitted by it under securities legislation is recorded, processed, summarized and reported within the time periods specified in securities legislation; and |
| (b) | designed ICFR, or caused it to be designed under our supervision, to provide reasonable assurance regarding the reliability of financial reporting and the preparation of financial statements for external purposes in accordance with the Issuer’s GAAP. |
| 5.1 | Control framework: The control framework the Issuer’s other certifying officer(s) and I used to design the Issuer’s ICFR is Internal Control – Integrated Framework issued by the Committee of Sponsoring Organizations of the Treadway Commission (COSO). |
| 5.2 | N/A |
| 5.3 | N/A |
| 6. | Reporting changes in ICFR: The Issuer has disclosed in its interim MD&A any change in the Issuer’s ICFR that occurred during the period beginning on July 1, 2015 and ended on September 30, 2015 that has materially affected, or is reasonably likely to materially affect, the Issuer’s ICFR. |
| Date: November 4, 2015 | ||
| “Robert A. Archer” | ||
| Robert A. Archer | ||
| Chief Executive Officer |
Exhibit 99.4
FORM 52-109F2
CERTIFICATION OF INTERIM FILINGS
FULL CERTIFICATE
I, Jim A. Zadra, Chief Financial Officer of Great Panther Silver Limited, certify the following:
| 1. | Review: I have reviewed the interim financial report and interim MD&A (together, the “interim filings”) of Great Panther Silver Limited (the “Issuer”) for the interim period ended September 30, 2015. |
| 2. | No misrepresentations: Based on my knowledge, having exercised reasonable diligence, the interim filings do not contain any untrue statement of a material fact or omit to state a material fact required to be stated or that is necessary to make a statement not misleading in light of the circumstances under which it was made, for the period covered by the interim filings. |
| 3. | Fair presentation: Based on my knowledge, having exercised reasonable diligence, the interim financial report together with the other financial information included in the interim filings fairly present in all material respects the financial condition, financial performance and cash flows of the Issuer, as of the date of and for the periods presented in the interim filings. |
| 4. | Responsibility: The Issuer’s other certifying officer(s) and I are responsible for establishing and maintaining disclosure controls and procedures (DC&P) and internal control over financial reporting (ICFR), as those terms are defined in National Instrument 52-109 Certification of Disclosure in Issuers’ Annual and Interim Filings, for the Issuer. |
| 5. | Design: Subject to the limitations, if any, described in paragraphs 5.2 and 5.3, the Issuer’s other certifying officer(s) and I have, as at the end of the period covered by the interim filings |
| (a) | designed DC&P, or caused it to be designed under our supervision, to provide reasonable assurance that |
| (i) | material information relating to the Issuer is made known to us by others, particularly during the period in which the interim filings are being prepared; and |
| (ii) | information required to be disclosed by the Issuer in its annual filings, interim filings or other reports filed or submitted by it under securities legislation is recorded, processed, summarized and reported within the time periods specified in securities legislation; and |
| (b) | designed ICFR, or caused it to be designed under our supervision, to provide reasonable assurance regarding the reliability of financial reporting and the preparation of financial statements for external purposes in accordance with the Issuer’s GAAP. |
| 5.1 | Control framework: The control framework the Issuer’s other certifying officer(s) and I used to design the Issuer’s ICFR is Internal Control – Integrated Framework issued by the Committee of Sponsoring Organizations of the Treadway Commission (COSO). |
| 5.2 | N/A |
| 5.3 | N/A |
| 6. | Reporting changes in ICFR: The Issuer has disclosed in its interim MD&A any change in the Issuer’s ICFR that occurred during the period beginning on July 1, 2015 and ended on September 30, 2015 that has materially affected, or is reasonably likely to materially affect, the Issuer’s ICFR. |
| Date: November 4, 2015 | ||
| “Jim A. Zadra” | ||
| Jim A. Zadra | ||
| Chief Financial Officer & Corporate Secretary |
Exhibit 99.5

| November 4, 2015 | TSX: GPR |
| For Immediate Release | NYSE MKT: GPL |
NEWS RELEASE
GREAT PANTHER SILVER REPORTS
THIRD QUARTER 2015 FINANCIAL RESULTS
GREAT PANTHER SILVER LIMITED (TSX: GPR) (NYSE MKT: GPL) (“Great Panther”; the “Company”) today reported financial results for the Company’s three and nine months ended September 30, 2015. The full version of the Company’s unaudited condensed interim consolidated financial statements, and Management’s Discussion and Analysis (“MD&A”) can be viewed on the Company's website at www.greatpanther.com, or SEDAR at www.sedar.com. All financial information is prepared in accordance with IFRS and all dollar amounts are expressed in Canadian dollars unless otherwise indicated.
"Great Panther's third quarter 2015 financial results benefited from continued reductions in cash cost, all-in sustaining cost, and from production growth which helped mitigate further weakness in silver and gold prices," stated Robert Archer, President and CEO. “All-in sustaining cost for the third quarter was once again below current silver prices. Most significantly, although operating cash flow for the third quarter was dampened by weak metal prices, operating cash flow for the first nine months of the year exceeded both sustaining capital expenditures and exploration expenditures, even as we ramped up exploration and assessment activities on the Guadalupe de los Reyes Project and the Coricancha Mine. Finally, our outlook for the year remains strong, with 20% plus growth in production and significant year-over-year reductions in cash cost and AISC, and we continue to maintain a strong balance sheet with $35 million of net working capital and no debt."
Despite reductions in cash cost which enabled the Company to maintain good operating cash flow in the third quarter, the Company incurred a net loss of $3.3 million as further weakness in metal prices dampened cash margins, and accelerated amortization increased non-cash charges. In addition, Great Panther commenced exploration and assessment activities at its Guadalupe de los Reyes Project (the “GDLR Project”) and the Coricancha mine which materially increased exploration and evaluation expenditures. The Company’s adjusted EBITDA for the quarter, which adjusts for non-cash charges, totaled $2.2 million and exceeded capex (cash flows from investing activities) of $2.0 million.
Highlights of the third quarter 2015 compared to third quarter 2014, unless otherwise noted:
| · | Metal production increased by 21% to 1,080,296 silver equivalent ounces (“Ag eq oz”); |
| · | Silver production increased 4% to 586,918 silver ounces; |
| · | Record gold production of 6,079 gold ounces, an increase of 45%; |
| · | Cash cost per payable silver ounce decreased 41% to US$6.50; |
| · | All-in sustaining cost (“AISC”) decreased 32% to US$13.08 per payable silver ounce; |
| · | Revenues increased 31% to $16.8 million; |
| · | Adjusted EBITDA increased to $2.2 million compared to $1.3 million; |
| · | Net loss totalled $3.3 million, compared to a net loss of $1.0 million; |
| · | Cash flow from operating activities, before changes in non-cash net working capital, amounted to $1.6 million, compared to $2.1 million; |
| · | Cash and cash equivalents were $18.7 million at September 30, 2015 compared to $18.0 million at December 31, 2014; and |
| · | Net working capital increased to $34.7 million at September 30, 2015 from $32.9 million at December 31, 2014. |
OPERATING AND FINANCIAL RESULTS SUMMARY
| (in
CAD 000s except ounces, amounts per share and per ounce) | Q3 2015 | Q3 2014 | % change | Nine
months ended Sep 30, 2015 | Nine
months ended Sep 30, 2014 | % change | ||||||||||||||||||
| OPERATING | ||||||||||||||||||||||||
| Tonnes milled (excluding custom milling) | 93,730 | 89,030 | 5 | % | 280,458 | 242,625 | 16 | % | ||||||||||||||||
| Silver equivalent ounces (“Ag eq oz”) produced1 | 1,080,296 | 890,641 | 21 | % | 3,156,538 | 2,276,784 | 39 | % | ||||||||||||||||
| Silver ounce production | 586,918 | 565,965 | 4 | % | 1,832,839 | 1,356,634 | 35 | % | ||||||||||||||||
| Gold ounce production | 6,079 | 4,200 | 45 | % | 16,103 | 11,639 | 38 | % | ||||||||||||||||
| Payable silver ounces | 545,787 | 461,249 | 18 | % | 1,776,025 | 1,194,839 | 49 | % | ||||||||||||||||
| Cost per tonne milled (USD)2 | $ | 96 | $ | 122 | -21 | % | $ | 102 | $ | 123 | -17 | % | ||||||||||||
| Cash cost per payable silver ounce (USD)2 | $ | 6.50 | $ | 11.02 | -41 | % | $ | 7.32 | $ | 13.02 | -44 | % | ||||||||||||
| AISC per payable silver ounce (USD)2 | $ | 13.08 | $ | 19.25 | -32 | % | $ | 13.38 | $ | 22.35 | -40 | % | ||||||||||||
| FINANCIAL | ||||||||||||||||||||||||
| Revenue | $ | 16,788 | $ | 12,801 | 31 | % | $ | 56,222 | $ | 40,146 | 40 | % | ||||||||||||
| Gross profit before non-cash items2 | $ | 5,763 | $ | 2,918 | 97 | % | $ | 19,129 | $ | 8,616 | 122 | % | ||||||||||||
| Gross profit (loss) | $ | 281 | $ | (1,521 | ) | 118 | % | $ | 2,473 | $ | (3,468 | ) | 171 | % | ||||||||||
| Net income (loss) | $ | (3,348 | ) | $ | (970 | ) | -245 | % | $ | (4,481 | ) | $ | (6,066 | ) | 26 | % | ||||||||
| Adjusted EBITDA2 | $ | 2,155 | $ | 1,267 | 70 | % | $ | 10,050 | $ | 935 | 975 | % | ||||||||||||
| Cash flow from operating activities3 | $ | 1,565 | $ | 2,133 | -27 | % | $ | 9,961 | $ | 2,424 | 311 | % | ||||||||||||
| Cash at end of period | $ | 18,685 | $ | 20,369 | -8 | % | $ | 18,685 | $ | 20,369 | -8 | % | ||||||||||||
| Net working capital at end of period | $ | 34,725 | $ | 35,287 | -2 | % | $ | 34,725 | $ | 35,287 | -2 | % | ||||||||||||
| Average realized silver price (USD)4 | $ | 13.98 | $ | 16.69 | -16 | % | $ | 15.55 | $ | 19.40 | -20 | % | ||||||||||||
| PER SHARE AMOUNTS | ||||||||||||||||||||||||
| Loss per share – basic and diluted | $ | (0.02 | ) | $ | (0.01 | ) | -100 | % | $ | (0.03 | ) | $ | (0.04 | ) | 25 | % | ||||||||
| 1 | Silver equivalent ounces are referred to throughout this document. For 2015, Aq eq oz are calculated using a 65:1 Ag:Au ratio, and ratios of 1:0.050 and 1:0.056 for the price/ounce of silver to lead and zinc price/pound, and applied to the relevant metal content of the concentrates produced, expected to be produced, or sold from operations. Comparatively, in 2014 Aq eq oz was established using prices of US$18.50 per oz, US$1,110 per oz (60:1 ratio), US$0.90 per lb., and US$0.85 per lb. for silver, gold, lead and zinc, respectively. |
| 2 | The Company has included the non-IFRS performance measures cost per tonne milled, cash cost per silver payable ounce, all-in sustaining cost per silver payable ounce (“AISC”), gross profit before non-cash items, cost of sales before non-cash items and adjusted EBITDA throughout this document. Refer to the Non-IFRS Measures section of the Company’s MD&A for an explanation of these measures and reconciliation to the Company’s reported financial results in accordance with IFRS. As these are not standardized measures, they may not be directly comparable to similarly titled measures used by others. |
| 3 | Before changes in non-cash working capital. |
| 4 | Average realized silver price is prior to smelting and refining charges. |
DISCUSSION OF THIRD QUARTER 2015 FINANCIAL RESULTS
For the third quarter of 2015, the Company earned revenue of $16.8 million, compared to $12.8 million for the third quarter of 2014. The $4.0 million increase in revenue is primarily attributable to production growth which translated into a 31% increase in metal sales volume. In addition, the 17% appreciation of the US dollar against the Canadian dollar had the effect of increasing revenue reported in Canadian dollars. These factors more than offset the impact of 16% and 9% decreases in average realized silver and gold prices in US dollars, respectively.
Gross profit before non-cash items increased by $2.8 million in the third quarter of 2015 compared to the third quarter of 2014, as a result of the $4.0 million increase in revenues which exceeded a $1.1 million increase in cost of sales before non-cash items as the Company was able to achieve production increases at a significantly lower unit cash cost.
Amortization and depletion of mineral properties, plant and equipment relating to cost of sales increased to $5.4 million in the third quarter of 2015 from $4.3 million in the third quarter of 2014. This was due to a reduction in the Measured and Indicated resource at the Guanajuato Mine based on the updated Mineral Resource Estimate issued in February 2015. The reduction of the resource estimate has the effect of reducing the amortization base and therefore increasing the amortization expense per unit produced and sold. In addition, there was the offsetting impact of an increase in the estimate of the mine life of the Topia Mine during the third quarter of 2015, from 6.5 years to 11 years, which reduced amortization and depletion recorded during the quarter by approximately $0.1 million compared to the amount that would otherwise have been recorded.
General and administrative (“G&A”) expenses were $1.7 million for the third quarter of 2015 compared to $1.5 million for the same period in 2014. The prior year’s G&A expenses were lower, reflecting the timing of certain G&A expenditures in Mexico.
Exploration and evaluation (“E&E”) expenses were $2.1 million for the third quarter of 2015 compared to $0.9 million for the same period in 2014. The increase is primarily the result of a $0.7 million increase in mine development costs for San Ignacio Mine and the Guanajuato Mine that do not meet the criteria for capitalization under IFRS. The Company also commenced exploration programs associated with the GDLR Project and Coricancha Mine and spent $0.4 million and $0.2 million, respectively, on these projects during the third quarter of 2015.
Finance and other income amounted to $0.5 million for the third quarter of 2015, compared to finance and other income of $2.6 million for the same period in 2014. The change is primarily associated with a $1.5 million decrease in foreign currency gains recognized in the third quarter of 2015, compared to the same period in 2014. In addition, Finance and other income for the third quarter of 2014 reflected proceeds from an insurance claim in the amount of $0.5 million. Foreign exchange gains and losses arise from the translation of foreign-denominated transactions and balances relative to the functional currency of the Company’s subsidiaries to the Company’s reporting currency. The Company’s Mexican subsidiaries use the Mexican peso as their functional currency. The Company has a significant US dollar intercompany loan owing by one of its Mexican subsidiaries and fluctuations in the Mexican peso create significant unrealized foreign exchange gains and losses in the accounts of the Mexican subsidiary. These unrealized gains and losses are recognized in the consolidated net income of the Company.
The Company recorded a net income tax expense of $0.3 million during the third quarter of 2015, predominantly as a result of an increase in the Company’s estimate of future special mining duties which are expected to become payable by its Mexican operations. The net income tax recovery in the third quarter of 2014 amounted to $0.3 million and is related to pre-tax losses by the Company’s operations in Mexico recognized in the comparative period.
Net loss for the third quarter of 2015 was $3.3 million, compared to a net loss of $1.0 million for the same period in 2014. The increase in net loss is primarily attributable to a $1.5 million decrease in foreign exchange gains recognized, as well as a $1.3 million increase in exploration expenditures attributed to the start of exploration activities at the Company’s new projects and the expensing of development expenditures associated with some of the Company’s operations. The increase in net loss is also reflective of a $0.6 million increase in income tax expense, a $0.5 million reduction in other income, as well as a $0.2 million increase in G&A expenses. These factors were partly offset by the $1.8 million increase in gross profit.
Adjusted EBITDA was $2.2 million for the third quarter of 2015, compared to adjusted EBITDA of $1.3 million for the same period in 2014. The increase in adjusted EBITDA reflects the $2.8 million increase in gross profit before non-cash items. This was partly offset by the $1.3 million higher E&E expenses reported in the third quarter of 2015, a $0.2 million decrease in G&A expenses, as well as a $0.5 million reduction in other income.
CASH COST AND ALL-IN SUSTAINING COST
Cash cost was US$6.50 per payable silver ounce for the third quarter of 2015, a 41% decrease compared to US$11.02 for the third quarter of 2014. The decrease in cash cost was due to the increase in ore grades at all operations which contributed to an 18% increase in payable silver ounces and higher by-product credits. In addition, the strengthening of the US dollar compared to the Mexican peso reduced cash operating costs in US dollar terms.
AISC for the third quarter of 2015 decreased to US$13.08 per payable silver ounce from US$19.25 in the third quarter of 2014. This 32% decrease is primarily due to the reduction in cash cost. In addition, there was a reduction in G&A, sustaining E&E and sustaining capital expenditures (all in US dollar terms) on a per payable ounce basis as a result of the increase in payable silver ounces noted above and the strengthening of the US dollar against the Canadian dollar and the Mexican peso.
Please refer to the Company’s Management’s Discussion and Analysis for further discussion of cash cost and AISC, and for a reconciliation to the Company’s financial results as reported under IFRS.
CASH AND WORKING CAPITAL AT SEPTEMBER 30, 2015
At September 30, 2015, the Company had cash and cash equivalents of $18.7 million compared to $18.0 million at December 31, 2014. Cash increased by $0.7 million in the first nine months of 2015 primarily due to cash flows from operating activities before changes in non-cash working capital of $10.0 million, and a $1.5 million increase in cash and cash equivalents as the result of favorable foreign exchange fluctuations. These factors exceeded the $8.7 million invested in mineral properties, plant and equipment and exploration and evaluation assets (the GDLR Project and Coricancha Mine) and the increase in non-cash working capital (primarily accounts receivable) of $2.1 million.
At September 30, 2015, the Company had net working capital of $34.7 million compared to $32.9 million at December 31, 2014. Net working capital increased by $1.8 million due to the $0.7 million increase in cash and a $2.7 million increase in trade and other receivables, net of the $1.4 million decrease in inventories during the first nine months of 2015.
OUTLOOK
On October 14, 2015, the Company released its third quarter 2015 production results and announced that it expects to exceed its 2015 production guidance of 3.8 to 3.9 million Ag eq oz which was increased in the second quarter of 2015 from a range of 3.5 to 3.6 million Ag eq oz. The Company expects to exceed its guidance range of 3.8 to 3.9 million Ag eq oz as production for the first nine months of the year totalled almost 3.2 million Ag eq oz. This will translate into at least 20% year-over-year growth in metal production.
Most importantly, the Company expects to achieve lower than guidance cash cost and AISC for 2015, and that AISC for the year is expected to be below the current silver price. However, fourth quarter 2015 AISC will be somewhat higher than levels in the third quarter due to greater capital expenditures and development planned for the fourth quarter.
| Production and cash cost guidance | FY 2014 Actual | Nine months ended September 30, 2015 | 2015 Guidance Range | |||||||||
| Total silver equivalent ounces1 | 3,187,832 | 3,156,537 | 3,800,000 – 3,900,000 | |||||||||
| Cash cost per payable silver ounce (USD)2 | $ | 12.78 | $ | 7.32 | $9.00 – $10.00 | |||||||
| AISC (USD) 2 | $ | 22.07 | $ | 13.38 | $15.00 – $17.00 | |||||||
Production from San Ignacio will continue to account for the predominant portion of the production from the GMC in the fourth quarter and for the foreseeable future. At the end of the third quarter, production from San Ignacio had reached more than 500 tonnes per day, greater than the 450 tonnes per day originally targeted for year end. Continued development of the Southern Extension zones should see further production growth from San Ignacio through the fourth quarter with a new year-end target of approximately 650 tonnes per day.
Mine site exploration is continuing with a 2,200 metre surface drill program at San Ignacio. The objectives of the program are to extend the southerly strike extension of the ore zones with step-out holes and to upgrade the existing resource with in-fill drilling. Further underground drilling will also be conducted on several targets in the Guanajuato Mine.
Total planned drilling metres for 2015 remains unchanged at 29,700 metres. The 29,700 metres comprises drilling metres for the GMC, the GDLR Project and Coricancha Mine. The Company is maintaining its guidance for $10 to $12 million in sustaining expenditures for 2015 comprising mine development and diamond drilling, and for the acquisition of new mining and plant equipment. Drilling related to the new projects is not included in this figure as they are considered non-sustaining expenditures.
Going into 2016, the Company expects production growth rates to generally level off as the production ramp up at San Ignacio over the last year will have been completed. In addition, the Company will focus more on maintaining and improving on the cost reductions and efficiency gains over the past year, and on more exploration and development at all mines. With this focus, the San Ignacio Mine will account for a greater proportion of production in 2016.
| 1 | Silver equivalent ounces are referred to throughout this document. For 2015, Aq eq oz are calculated using a 65:1 Ag:Au ratio, and ratios of 1:0.050 and 1:0.056 for the price/ounce of silver to lead and zinc price/pound, and applied to the relevant metal content of the concentrates produced, expected to be produced, or sold from operations. Comparatively, in 2014 Aq eq oz was established using prices of US$18.50 per oz, US$1,110 per oz (60:1 ratio), US$0.90 per lb., and US$0.85 per lb. for silver, gold, lead and zinc, respectively |
| 2 | The Company has included the non-IFRS performance measures cost per tonne milled, cash cost per silver payable ounce, all-in cost per silver payable ounce (“AIC”), all-in sustaining cost per silver payable ounce (“AISC”), gross profit before non-cash items, cost of sales before non-cash items and adjusted EBITDA throughout this document. Refer to the “Non-IFRS Measures” section of the Company’s MD&A for an explanation of these measures and reconciliation to the Company’s reported financial results in accordance with IFRS. As these are not standardized measures, they may not be directly comparable to similarly titled measures used by others. |
WEBCAST AND CONFERENCE CALL TO DISCUSS THIRD QUARTER 2015 FINANCIAL RESULTS
A conference call and webcast will be held Thursday, November 5, 2015 at 11:00 a.m. Eastern Time (8:00 a.m. Pacific Time) to discuss the results. The call will be hosted by Mr. Robert Archer, President and CEO. Mr. Jim Zadra, CFO and Corporate Secretary, will not be available to attend this call due to a prior commitment.
Shareholders, analysts, investors and media are invited to join the live webcast and conference call by logging in or calling in five minutes prior to the start time.
| Live webcast and registration | www.greatpanther.com |
| U.S. & Canada Toll-Free: | 1 855 477 2487 |
| International Toll: | +1 919 825 3215 |
| Conference ID: | 50865304 |
A replay of the webcast will be available on the Investors section of the Company’s website approximately one hour after the conference call.
All shareholders have the option to receive a hard copy of the Company's financial statements free of charge upon request. Should you wish to receive Great Panther Silver's financial statements in hard copy, please contact us at the Company toll free at 1 888 355 1766 or +1 604 608 1766, or e-mail [email protected].
NON-IFRS MEASURES
The discussion of financial results in this press release includes reference to Gross profit before non-cash items, Adjusted EBITDA, Cash cost per payable silver ounce, and All-in sustaining cost per payable silver ounce which are non-IFRS measures. The Company provides these measures as additional information regarding the Company's financial results and performance. Please refer to the Company's MD&A for the three and nine months ended September 30, 2015, for definitions and reconciliations of these measures to the Company’s financial statements.
ABOUT GREAT PANTHER
Great Panther Silver Limited is a primary silver mining and exploration company listed on the Toronto Stock Exchange trading under the symbol GPR, and on the NYSE MKT trading under the symbol GPL. Great Panther's current activities are focused on the mining of precious metals from its two wholly-owned mining operations in Mexico: the Guanajuato Mine Complex, which includes the San Ignacio Mine, and the Topia Mine in Durango. The Company holds a two-year option agreement to acquire a 100% interest in the Coricancha Mine Complex in the central Andes of Peru and holds an option to acquire a 100% interest in the advanced stage Guadalupe de los Reyes Project in Mexico. Active exploration programs are underway at both projects.
Robert A. Archer President & CEO |
CAUTIONARY STATEMENT ON FORWARD-LOOKING STATEMENTS
This news release contains forward-looking statements within the meaning of the United States Private Securities Litigation Reform Act of 1995 and forward-looking information within the meaning of Canadian securities laws (together, "forward-looking statements"). Such forward-looking statements may include but are not limited to the Company's plans for production at its Guanajuato and Topia Mines in Mexico, exploring its other properties in Mexico, the overall economic potential of its properties, the availability of adequate financing and involve known and unknown risks, uncertainties and other factors which may cause the actual results, performance or achievements expressed or implied by such forward-looking statements to be materially different. Such factors include, among others, risks and uncertainties relating to potential political risks involving the Company's operations in a foreign jurisdiction, uncertainty of production and cost estimates and the potential for unexpected costs and expenses, physical risks inherent in mining operations, currency fluctuations, fluctuations in the price of silver, gold and base metals, completion of economic evaluations, changes in project parameters as plans continue to be refined, the inability or failure to obtain adequate financing on a timely basis, and other risks and uncertainties, including those described in the Company's Annual Information Form for the year ended December 31, 2014 and Material Change Reports filed with the Canadian Securities Administrators available at www.sedar.com and reports on Form 40-F and Form 6-K filed with the Securities and Exchange Commission and available at www.sec.gov.
For further information, please contact:
Spiros Cacos
Director, Investor Relations
Toll free: 1 888 355 1766
Tel: +1 604 638 8955
www.greatpanther.com
Great Panther Silver Limited
CONDENSED INTERIM CONSOLIDATED STATEMENTS OF FINANCIAL POSITION
(Expressed in thousands of Canadian dollars)
As at September 30, 2015 and December 31, 2014 (Unaudited)
| September 30, | December 31, | |||||||
| 2015 | 2014 | |||||||
| Assets | ||||||||
| Current assets: | ||||||||
| Cash and cash equivalents | $ | 18,685 | $ | 17,968 | ||||
| Trade and other receivables | 13,357 | 10,697 | ||||||
| Income taxes recoverable | 37 | 170 | ||||||
| Inventories | 7,511 | 8,928 | ||||||
| Other current assets | 1,377 | 750 | ||||||
| 40,967 | 38,513 | |||||||
| Non-current assets: | ||||||||
| Mineral properties, plant and equipment | 20,033 | 29,770 | ||||||
| Exploration and evaluation assets | 8,466 | 3,081 | ||||||
| Intangible assets | 171 | 366 | ||||||
| Deferred tax asset | 287 | 71 | ||||||
| $ | 69,924 | $ | 71,801 | |||||
| Liabilities and Shareholders’ Equity | ||||||||
| Current liabilities: | ||||||||
| Trade and other payables | $ | 6,242 | $ | 5,606 | ||||
| Non-current liabilities: | ||||||||
| Reclamation and remediation provision | 2,691 | 3,378 | ||||||
| Deferred tax liability | 4,080 | 4,088 | ||||||
| 13,013 | 13,072 | |||||||
| Shareholders’ equity: | ||||||||
| Share capital | 125,646 | 124,178 | ||||||
| Reserves | 11,493 | 10,298 | ||||||
| Deficit | (80,228 | ) | (75,747 | ) | ||||
| 56,911 | 58,729 | |||||||
| $ | 69,924 | $ | 71,801 | |||||
Great Panther Silver Limited
CONDENSED INTERIM CONSOLIDATED STATEMENTS OF COMPREHENSIVE INCOME
(Expressed in thousands of Canadian dollars, except per share data)
For the three and nine months ended September 30, 2015 and 2014 (Unaudited)
| For the three months ended September 30, | For the nine months ended September 30, | |||||||||||||||
| 2015 | 2014 | 2015 | 2014 | |||||||||||||
| Revenue | $ | 16,788 | $ | 12,801 | $ | 56,222 | $ | 40,146 | ||||||||
| Cost of sales | ||||||||||||||||
| Production costs | 11,025 | 9,883 | 37,093 | 31,530 | ||||||||||||
| Amortization and depletion | 5,397 | 4,296 | 16,408 | 11,841 | ||||||||||||
| Share-based compensation | 85 | 143 | 248 | 243 | ||||||||||||
| 16,507 | 14,322 | 53,749 | 43,614 | |||||||||||||
| Gross profit (loss) | 281 | (1,521 | ) | 2,473 | (3,468 | ) | ||||||||||
| General and administrative expenses | ||||||||||||||||
| Administrative expenses | 1,524 | 1,289 | 5,185 | 4,582 | ||||||||||||
| Amortization and depletion | 69 | 76 | 194 | 236 | ||||||||||||
| Share-based compensation | 120 | 111 | 334 | 209 | ||||||||||||
| 1,713 | 1,476 | 5,713 | 5,027 | |||||||||||||
| Exploration and evaluation, and development expenses | ||||||||||||||||
| Exploration and evaluation expenses | 1,006 | 445 | 2,210 | 1,227 | ||||||||||||
| Mine development costs | 1,037 | 348 | 1,701 | 1,686 | ||||||||||||
| Share-based compensation | 79 | 71 | 224 | 103 | ||||||||||||
| 2,122 | 864 | 4,135 | 3,016 | |||||||||||||
| Finance and other income | ||||||||||||||||
| Interest income | 29 | 41 | 255 | 186 | ||||||||||||
| Finance costs | (71 | ) | (28 | ) | (138 | ) | (105 | ) | ||||||||
| Foreign exchange gain | 591 | 2,123 | 2,720 | 3,061 | ||||||||||||
| Other (expense) income | (41 | ) | 431 | 17 | (186 | ) | ||||||||||
| 508 | 2,567 | 2,854 | 2,956 | |||||||||||||
| Loss before income taxes | (3,046 | ) | (1,294 | ) | (4,521 | ) | (8,555 | ) | ||||||||
| Income tax expense (recovery) | ||||||||||||||||
| Current (recovery) expense | (5 | ) | (97 | ) | 220 | 84 | ||||||||||
| Deferred expense (recovery) | 307 | (227 | ) | (260 | ) | (2,573 | ) | |||||||||
| 302 | (324 | ) | (40 | ) | (2,489 | ) | ||||||||||
| Net loss for the period | $ | (3,348 | ) | $ | (970 | ) | $ | (4,481 | ) | $ | (6,066 | ) | ||||
| Other comprehensive income (loss), net of tax | ||||||||||||||||
| Items that are or may be reclassified subsequently to net income (loss): | ||||||||||||||||
| Foreign currency translation | 593 | (322 | ) | 386 | (288 | ) | ||||||||||
| Change in fair value of available-for-sale financial assets, net of tax | (2 | ) | (16 | ) | (2 | ) | (10 | ) | ||||||||
| 591 | (388 | ) | 384 | (298 | ) | |||||||||||
| Total comprehensive loss for the period | $ | (2,757 | ) | $ | (1,308 | ) | $ | (4,097 | ) | $ | (6,364 | ) | ||||
| Loss per share | ||||||||||||||||
| Basic and diluted | $ | (0.02 | ) | $ | (0.01 | ) | $ | (0.03 | ) | $ | (0.04 | ) | ||||
Great Panther Silver Limited
CONDENSED INTERIM CONSOLIDATED STATEMENTS OF CASH FLOWS
(Expressed in thousands of Canadian dollars)
For the three and nine months ended September 30, 2015 and 2014 (Unaudited)
| Three months ended September 30, | Nine months ended September 30, | |||||||||||||||
| 2015 | 2014 | 2015 | 2014 | |||||||||||||
| Cash flows from operating activities | ||||||||||||||||
| Net loss for the period | $ | (3,348 | ) | $ | (970 | ) | $ | (4,481 | ) | $ | (6,066 | ) | ||||
| Items not involving cash: | ||||||||||||||||
| Amortization and depletion | 5,466 | 4,372 | 16,602 | 12,077 | ||||||||||||
| Unrealized foreign exchange gain | (1,154 | ) | (1,528 | ) | (2,557 | ) | (2,276 | ) | ||||||||
| Income tax expense (recovery) | 302 | (324 | ) | (40 | ) | (2,489 | ) | |||||||||
| Accretion on reclamation and remediation provision | 44 | 28 | 66 | 105 | ||||||||||||
| Share-based compensation | 284 | 325 | 806 | 555 | ||||||||||||
| Other (income) expense | (70 | ) | - | (250 | ) | - | ||||||||||
| Other non-cash items | - | 263 | - | 584 | ||||||||||||
| Interest received | 20 | 35 | 72 | 161 | ||||||||||||
| Income taxes recovered (paid) | 21 | (68 | ) | (257 | ) | (227 | ) | |||||||||
| 1,565 | 2,133 | 9,961 | 2,424 | |||||||||||||
| Changes in non-cash working capital: | ||||||||||||||||
| (Increase) decrease in trade and other receivables | (159 | ) | 3,439 | (1,981 | ) | 4,411 | ||||||||||
| (Increase) decrease in income taxes recoverable | (58 | ) | 128 | - | 457 | |||||||||||
| (Increase) decrease in inventories | (920 | ) | (2,349 | ) | 110 | (1,950 | ) | |||||||||
| (Increase) decrease in other current assets | (108 | ) | 61 | (585 | ) | (835 | ) | |||||||||
| Increase (decrease) in trade and other payables | 227 | 456 | 391 | (755 | ) | |||||||||||
| Net cash from operating activities | 547 | 3,868 | 7,896 | 3,752 | ||||||||||||
| Cash flows from investing activities: | ||||||||||||||||
| Additions to mineral properties, plant and equipment | (1,975 | ) | (2,230 | ) | (5,460 | ) | (6,383 | ) | ||||||||
| Acquisition of Cangold | (35 | ) | - | (1,029 | ) | - | ||||||||||
| Additions to exploration and evaluation assets – Coricancha Mine Complex | (34 | ) | - | (2,191 | ) | - | ||||||||||
| Additions to intangible assets | - | - | - | (18 | ) | |||||||||||
| Net cash used in investing activities | (2,044 | ) | (2,230 | ) | (8,680 | ) | (6,401 | ) | ||||||||
| Cash flows from financing activities: | ||||||||||||||||
| Proceeds from exercise of options | - | 304 | 9 | 742 | ||||||||||||
| Net cash from financing activities | - | 304 | 9 | 742 | ||||||||||||
| Effect of foreign currency translation on cash and cash equivalents | 750 | 382 | 1,492 | 516 | ||||||||||||
| (Decrease) increase in cash and cash equivalents | (747 | ) | 2,324 | 717 | (1,391 | ) | ||||||||||
| Cash and cash equivalents, beginning of period | 19,432 | 18,045 | 17,968 | 21,760 | ||||||||||||
| Cash and cash equivalents, end of period | $ | 18,685 | $ | 20,369 | $ | 18,685 | $ | 20,369 | ||||||||
Serious News for Serious Traders! Try StreetInsider.com Premium Free!
You May Also Be Interested In
- Meridian International Center Unveils Inaugural New Architects of American Influence Cohort
- ImmunityBio Reports Phase 3 Data Showing 84% Cystectomy Avoidance at Three Years and Complete Responses Beyond 53 Months with ANKTIVA® Plus BCG in BCG-Unresponsive NMIBC With CIS, With or Without Pap
- Purina and RedRover Mark Domestic Violence Awareness Month by Announcing 2026 Purple Leash Project Grant Recipients
Create E-mail Alert Related Categories
SEC FilingsSign up for StreetInsider Free!
Receive full access to all new and archived articles, unlimited portfolio tracking, e-mail alerts, custom newswires and RSS feeds - and more!
