

Form 6-K Fortis Inc. For: May 05
 Tweet
Tweet Share
ShareUNITED STATES
SECURITIES AND EXCHANGE COMMISSION
Washington, D.C. 20549
FORM 6-K
REPORT OF FOREIGN PRIVATE ISSUER
PURSUANT TO RULE 13a-16 OR 15d-16
OF THE SECURITIES EXCHANGE ACT OF 1934
For the month of May, 2021
Commission File Number: 001-37915
Fortis Inc.
Fortis Place, Suite 1100
5 Springdale Street
St. John's, Newfoundland and Labrador
Canada, A1E 0E4
(Address of Principal Executive Office)
Indicate by check mark whether the registrant files or will file annual reports under cover of Form 20-F or Form 40-F: Form 20-F ☐ Form 40-F ☒
Indicate by check mark if the registrant is submitting the Form 6-K in paper as permitted by Regulation S-T Rule 101(b)(1): ☐
Indicate by check mark if the registrant is submitting the Form 6-K in paper as permitted by Regulation S-T Rule 101(b)(7): ☐
EXHIBITS
| Exhibit | Description |
| 99.1 | Fortis Inc. Investor Presentation: Q1 2021 Earnings Conference Call, dated May 5, 2021. |
SIGNATURES
Pursuant to the requirements of the Securities Exchange Act of 1934, the registrant has duly caused this report to be signed on its behalf by the undersigned, thereunto duly authorized.
| Fortis Inc. | |||
| (Registrant) | |||
| Date: May 5, 2021 | /s/ James R. Reid | ||
| By: | James R. Reid | ||
| Title: | Executive Vice President, Chief Legal Officer and Corporate Secretary | ||
Exhibit 99.1

Q1 2021 EARNINGS CONFERENCE CALL MAY 5, 2021

FORWARD LOOKING INFORMATION Fortis includes forward - looking information in this presentation within the meaning of applicable Canadian securities laws and forward - looking statements within the meaning of the Private Securities Litigation Reform Act of 1995 (collectively referred to as "forward - looking information") . Forward - looking information reflects expectations of Fortis management regarding future growth, results of operations, performance and business prospects and opportunities . Wherever possible, words such as anticipates, believes, budgets, could, estimates, expects, forecasts, intends, may, might, plans, projects, schedule, should, target, will, would and the negative of these terms and other similar terminology or expressions have been used to identify the forward - looking information, which includes, without limitation : the 2035 carbon emissions reduction target ; forecast capital expenditures for 2021 and 2021 - 2025 ; TEP's carbon emissions reduction target and projected asset mix ; forecast rate base and rate base growth for 2025 ; the nature, timing, benefits and costs of certain capital projects including, without limitation, the Wataynikaneyap Transmission Power Project and additional opportunities beyond the capital plan, including the Lake Erie Connector Project and opportunities arising and impacts from proposed infrastructure and tax plans in the United States ; FortisBC's greenhouse gas emissions target ; targeted average annual dividend growth through 2025 ; and the expected timing, outcome and impacts of regulatory decisions . Forward looking information involves significant risks, uncertainties and assumptions . Certain material factors or assumptions have been applied in drawing the conclusions contained in the forward - looking information, including, without limitation : no material adverse effects from the COVID - 19 pandemic ; reasonable regulatory decisions and the expectation of regulatory stability ; the successful execution of the capital plan ; no material capital project or financing cost overrun ; sufficient human resources to deliver service and execute the capital plan ; no significant variability in interest rates ; and the Board exercising its discretion to declare dividends, taking into account the business performance and financial condition of the Corporation . Fortis cautions readers that a number of factors could cause actual results, performance or achievements to differ materially from the results discussed or implied in the forward - looking information . These factors should be considered carefully and undue reliance should not be placed on the forward - looking information . For additional information with respect to certain of these risks or factors, reference should be made to the continuous disclosure materials filed from time to time by the Corporation with Canadian securities regulatory authorities and the Securities and Exchange Commission . All forward - looking information herein is given as of the date of this presentation . Fortis disclaims any intention or obligation to update or revise any forward - looking information, whether as a result of new information, future events or otherwise . Unless otherwise specified, all financial information is in Canadian dollars and rate base refers to midyear rate base . 2

DAVID HUTCHENS PRESIDENT AND CEO
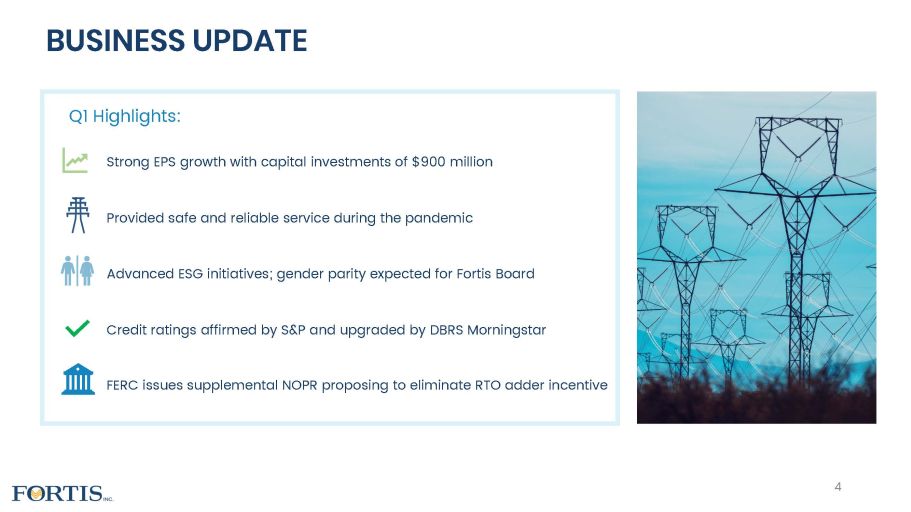
BUSINESS UPDATE 4 Q1 Highlights: Strong EPS growth with capital investments of $900 million Provided safe and reliable service during the pandemic Advanced ESG initiatives; gender parity expected for Fortis Board Credit ratings affirmed by S&P and upgraded by DBRS Morningstar FERC issues supplemental NOPR proposing to eliminate RTO adder incentive

2021 CAPITAL PLAN ON TRACK 5 $3.8B $0.9B Q1 2021 A 2021F • Committed to 2021 $3.8B capital plan • Higher forecast capital expenditures expected to offset a lower foreign exchange rate • Oso Grande Wind Project completed • Construction of Wataynikaneyap Transmission Power Project continues

30% 36% 6% 6% 5% 3% 6% 8% Distribution Transmission Transmission supporting clean energy RNG/LNG Clean Generation Traditional Generation Information Technology Other 2020A 2025F $40.3B $30.5B BALANCED CAPITAL PLAN SUPPORTS LOW - RISK GROWTH Rate Base Note: Rate base growth percentage calculated using constant exchange rate. (1) Other includes facilities, equipment, and vehicles. 6 2021 - 2025 Capital Plan $19.6 Billion (1)

UPDATE ON OPPORTUNITIES TO EXPAND & EXTEND GROWTH 7 • In March, MISO outlined a long - range transmission planning ( LRTP ) roadmap with a focus on system constraints and configuration options • Potential new, regional projects • Visibility on initial projects could be as early as this year
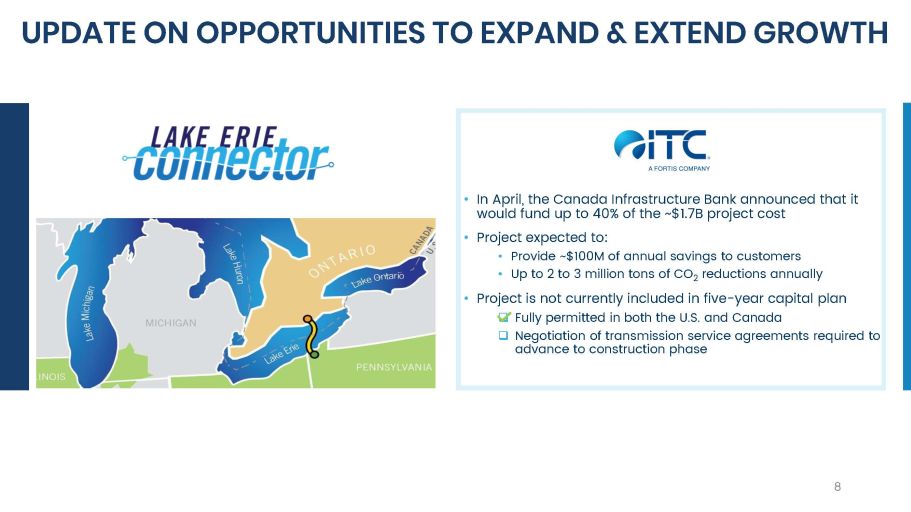
UPDATE ON OPPORTUNITIES TO EXPAND & EXTEND GROWTH 8 • In April, the Canada Infrastructure Bank announced that it would fund up to 40% of the ~$1.7B project cost • Project expected to: • Provide ~$100M of annual savings to customers • Up to 2 to 3 million tons of CO 2 reductions annually • Project is not currently included in five - year capital plan □ Fully permitted in both the U.S. and Canada □ Negotiation of transmission service agreements required to advance to construction phase

74 76 78 80 82 84 86 88 90 92 94 96 98 00 02 04 06 08 10 12 14 16 18 20 6% AVERAGE ANNUAL DIVIDEND GROWTH GUIDANCE TO 2025 47 Years of Consecutive Dividend Increases 9

JOCELYN PERRY EXECUTIVE VICE PRESIDENT AND CFO
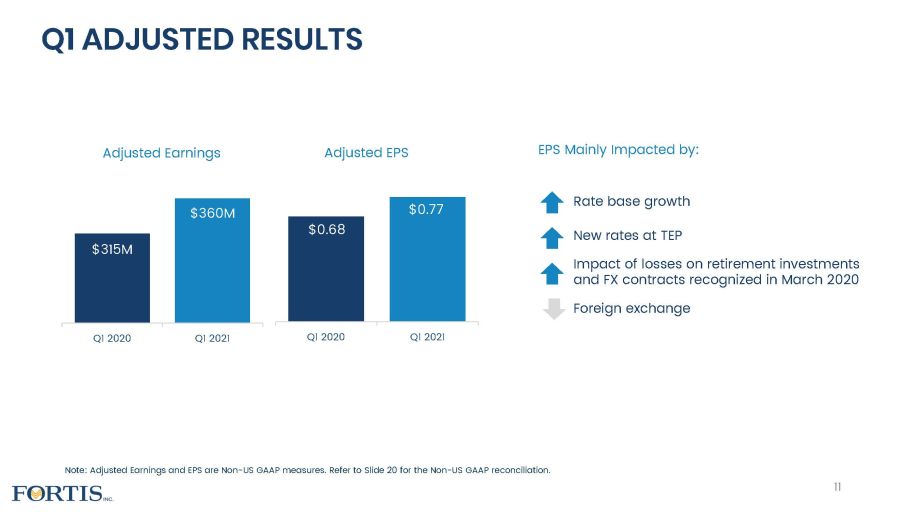
Rate base growth New rates at TEP Impact of losses on retirement investments and FX contracts recognized in March 2020 Foreign exchange $0.68 $0.77 Q1 2020 Q1 2021 $315M $360M Q1 2020 Q1 2021 Adjusted Earnings Q1 ADJUSTED RESULTS Note: Adjusted Earnings and EPS are Non - US GAAP measures. Refer to Slide 20 for the Non - US GAAP reconciliation. EPS Mainly Impacted by: Adjusted EPS 11
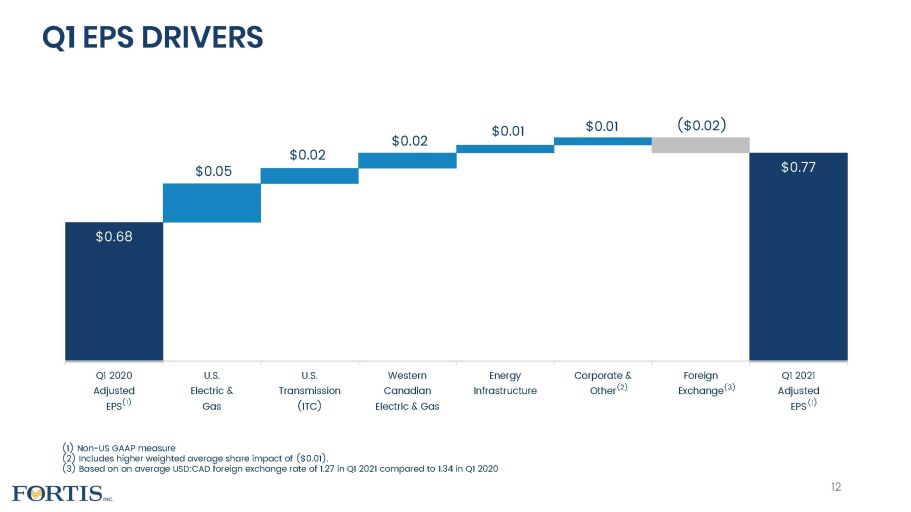
Q1 EPS DRIVERS (1) Non - US GAAP measure (2) Includes higher weighted average share impact of ($0.01). (3) Based on an average USD:CAD foreign exchange rate of 1.27 in Q1 2021 compared to 1.34 in Q1 2020 $0.68 $0.05 $0.02 $0.02 $0.01 $0.01 ( $0.02 ) $ 0.77 Q1 2020 Adjusted EPS U.S. Electric & Gas U.S. Transmission (ITC) Western Canadian Electric & Gas Energy Infrastructure Corporate & Other Foreign Exchange Q1 2021 Adjusted EPS (1) (1) (3) 12 (2)

1.5 1.3 4.0 4.3 Remaining Capacity Credit Facilities ($B) Mar. 31, 2021 CREDIT RATINGS AND LIQUIDITY Dec. 31, 2020 13 A - (1) A (low) Baa3 Credit Ratings (1) S&P rating reflects the issuer credit rating. Fortis’ unsecured debt rating is BBB+. Ratings were affirmed in April 2021 and out look revised to stable from negative. Utilized
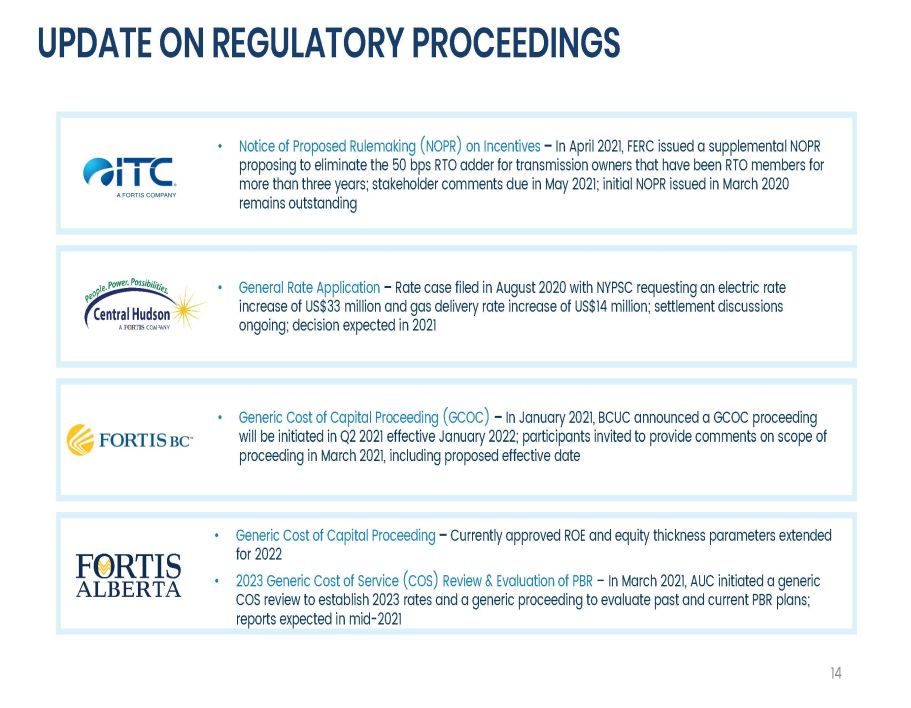
• Notice of Proposed Rulemaking (NOPR) on Incentives – In April 2021, FERC issued a supplemental NOPR proposing to eliminate the 50 bps RTO adder for transmission owners that have been RTO members for more than three years; stakeholder comments due in May 2021; initial NOPR issued in March 2020 remains outstanding • General Rate Application – Rate case filed in August 2020 with NYPSC requesting an electric rate increase of US$33 million and gas delivery rate increase of US$14 million; settlement discussions ongoing; decision expected in 2021 • Generic Cost of Capital Proceeding – Currently approved ROE and equity thickness parameters extended for 2022 • 2023 Generic Cost of Service (COS) Review & Evaluation of PBR – In March 2021, AUC initiated a generic COS review to establish 2023 rates and a generic proceeding to evaluate past and current PBR plans; reports expected in mid - 2021 • Generic Cost of Capital Proceeding (GCOC) – In January 2021, BCUC announced a GCOC proceeding will be initiated in Q2 2021 effective January 2022; participants invited to provide comments on scope of proceeding in March 2021, including proposed effective date UPDATE ON REGULATORY PROCEEDINGS 14

~US$400B identified for green infrastructure • US$100B electric grid resilience • US$174B electric vehicles Proposal aims to • Build a resilient grid • Lower energy bills for Americans • Create good jobs • Achieve 100% carbon - free electricity by 2035 PROPOSED TAX & INFRASTRUCTURE PLAN American Jobs Plan 15 Made in America Tax Plan Increase corporate tax rate to 28% from 21% • Expected to be EPS and cash flow positive • EPS impacts driven by higher tax rate on non - regulated interest deductions Transmission tax credits • EPS neutral and cash flow positive • Expected to encourage regional transmission projects Strong focus on transmission & grid resiliency
WHY INVEST IN FORTIS? Low - Risk Growth Profile Well - Run Businesses Virtually All Regulated Focused on Energy Delivery ESG Leader 6% Dividend Guidance Geographic & Regulatory Diversity Innovative 16

Q2 2021 July 29, 2021 Q3 2021 October 29, 2021 Expected Earnings Release Dates 17 2021 Annual Meeting May 6, 2021 Upcoming Events

Q1 2021 EARNINGS CONFERENCE CALL MAY 5, 2021
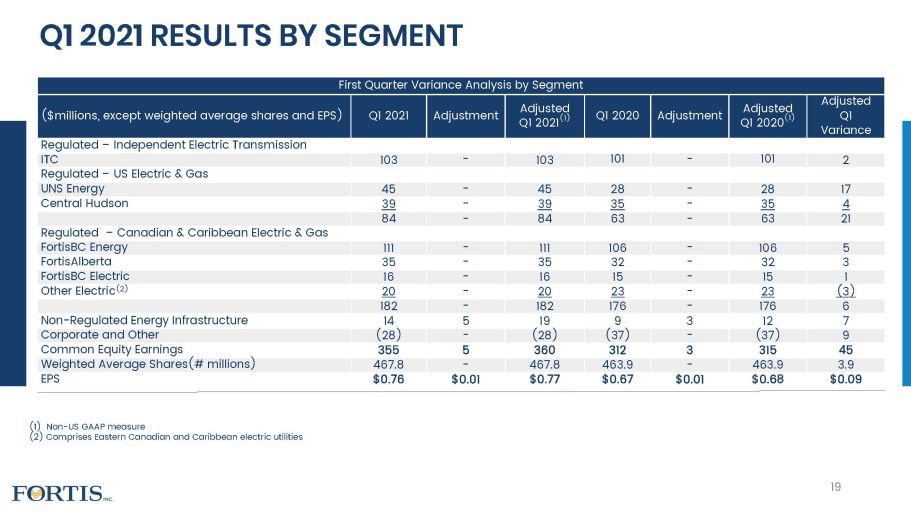
First Quarter Variance Analysis by Segment ($millions, except weighted average shares and EPS) Q1 2021 Adjustment Adjusted Q1 2021 (1) Q1 2020 Adjustment Adjusted Q1 2020 (1) Adjusted Q1 Variance Regulated – Independent Electric Transmission ITC 103 - 103 101 - 101 2 Regulated – US Electric & Gas UNS Energy 45 - 45 28 - 28 17 Central Hudson 39 - 39 35 - 35 4 84 - 84 63 - 63 21 Regulated – Canadian & Caribbean Electric & Gas FortisBC Energy 111 - 111 106 - 106 5 FortisAlberta 35 - 35 32 - 32 3 FortisBC Electric 16 - 16 15 - 15 1 Other Electric (2) 20 - 20 23 - 23 (3) 182 - 182 176 - 176 6 Non - Regulated Energy Infrastructure 14 5 19 9 3 12 7 Corporate and Other (28) - (28) (37) - (37) 9 Common Equity Earnings 355 5 360 312 3 315 45 Weighted Average Shares(# millions) 467.8 - 467.8 463.9 - 463.9 3.9 EPS $0.76 $0.01 $0.77 $0.67 $0.01 $0.68 $0.09 (1) Non - US GAAP measure (2) Comprises Eastern Canadian and Caribbean electric utilities Q1 2021 RESULTS BY SEGMENT 19
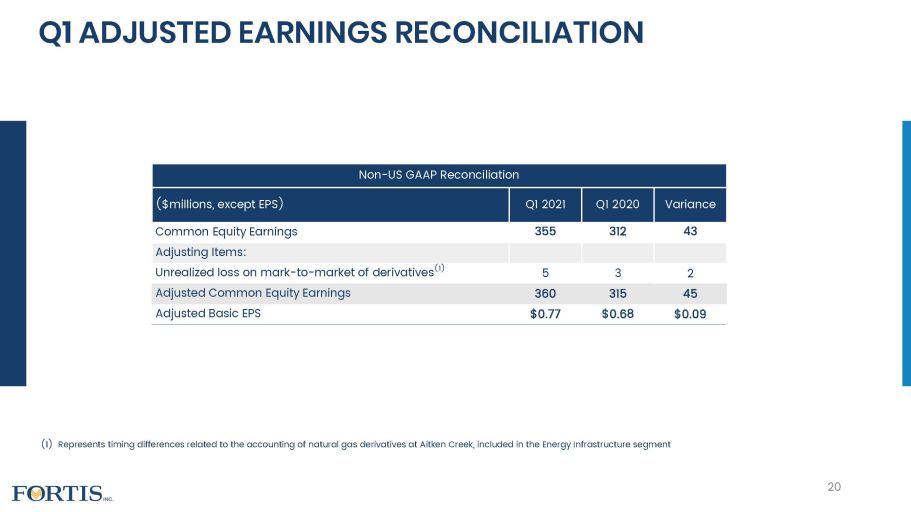
(1) Represents timing differences related to the accounting of natural gas derivatives at Aitken Creek, included in the Energy In f rastructure segment Non - US GAAP Reconciliation ($millions, except EPS) Q1 2021 Q1 2020 Variance Common Equity Earnings 355 312 43 Adjusting Items: Unrealized loss on mark - to - market of derivatives (1) 5 3 2 Adjusted Common Equity Earnings 360 315 45 Adjusted Basic EPS $0.77 $0.68 $0.09 Q1 ADJUSTED EARNINGS RECONCILIATION 20

Regulatory Mechanisms Protecting Changes in Sales Q1 2021 vs. Q1 2020 Sales Trends • Peak load flat; decrease in January peak load offset by increase in March peak load due to easing of pandemic restrictions • Electric sales up 4% due to higher residential consumption, due to work - from - home - practices and colder temperatures • Minimal exposure to commercial and industrial sales • In B.C., gas sales down 2% due to lower consumption by transportation customers, increase in residential sales due to work - from - home practices offset by warmer temperatures; electric sales up 2% due to residential customers • In Alberta, sales down 3%; ~85% of revenue based on fixed - billing determinants • Residential sales increased 3%; commercial and industrial decreased 3% • Overall retail sales decreased 1%; weather did not have a material impact on quarter over quarter sales • Other Electric s ales down 3%, reflecting a 6% decrease in commercial sales; residential sales decreased 1% • 7% decrease in the Caribbean, mainly reflecting a decrease in commercial sales driven by decline in tourism Q1 SALES AND LOAD TRENDS Western Canada Other Electric x x x x x 62% 21% 17% 83% From Residential Sales or Protected by Regulatory Mechanisms 2020 Revenues Revenues Protected by Regulatory Mechanisms Residential Revenues Not Protected by Regulatory Mechanisms Commercial and Industrial Revenues Not Protected by Regulatory Mechanisms 21
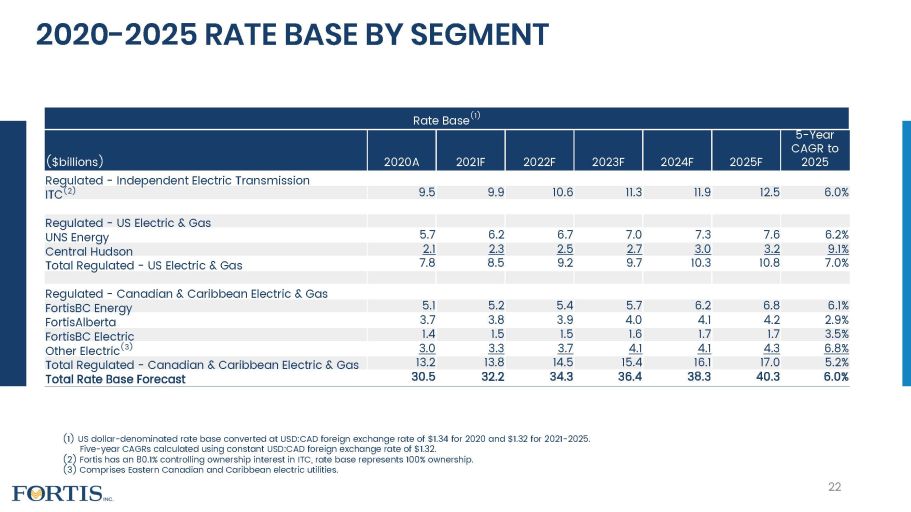
(1) US dollar - denominated rate base converted at USD:CAD foreign exchange rate of $1.34 for 2020 and $1.32 for 2021 - 2025. (2) Fortis has an 80.1% controlling ownership interest in ITC, rate base represents 100% ownership. (3) Comprises Eastern Canadian and Caribbean electric utilities. Rate Base (1) ($billions) 2020A 2021F 2022F 2023F 2024F 2025F 5 - Year CAGR to 2025 Regulated - Independent Electric Transmission ITC (2) 9.5 9.9 10.6 11.3 11.9 12.5 6.0% Regulated - US Electric & Gas UNS Energy 5.7 6.2 6.7 7.0 7.3 7.6 6.2% Central Hudson 2.1 2.3 2.5 2.7 3.0 3.2 9.1% Total Regulated - US Electric & Gas 7.8 8.5 9.2 9.7 10.3 10.8 7.0% Regulated - Canadian & Caribbean Electric & Gas FortisBC Energy 5.1 5.2 5.4 5.7 6.2 6.8 6.1% FortisAlberta 3.7 3.8 3.9 4.0 4.1 4.2 2.9% FortisBC Electric 1.4 1.5 1.5 1.6 1.7 1.7 3.5% Other Electric (3) 3.0 3.3 3.7 4.1 4.1 4.3 6.8% Total Regulated - Canadian & Caribbean Electric & Gas 13.2 13.8 14.5 15.4 16.1 17.0 5.2% Total Rate Base Forecast 30.5 32.2 34.3 36.4 38.3 40.3 6.0% 2020 - 2025 RATE BASE BY SEGMENT 22 Five - year CAGRs calculated using constant USD:CAD foreign exchange rate of $1.32.

Capital Plan (1) ($millions ) 2021F 2022F 2023F 2024F 2025F 2021 - 2025 TOTAL Regulated - Independent Electric Transmission ITC 1,000 1,007 993 1,107 993 5,100 Regulated - US Electric & Gas UNS Energy 749 781 840 853 547 3,770 Central Hudson 306 416 409 346 310 1,787 Total Regulated - US Electric & Gas 1,055 1,197 1,249 1,199 857 5,557 Regulated - Canadian & Caribbean Electric & Gas FortisBC Energy 467 569 671 788 1,238 3,733 FortisAlberta 346 367 413 438 468 2,032 FortisBC Electric 153 130 112 111 132 638 Other Electric (2) 721 560 453 368 307 2,409 Total Regulated - Canadian & Caribbean Electric & Gas 1,687 1,626 1,649 1,705 2,145 8,812 Non - Regulated 71 13 17 21 46 168 Total Capital Plan 3,813 3,843 3,908 4,032 4,041 19,637 (1) US dollar - denominated capital expenditures translated at a forecast USD:CAD foreign exchange rate of $1.32. (2) Comprises Eastern Canadian and Caribbean electric utilities. 2021 - 2025 CAPITAL PLAN BY SEGMENT 23

($ Millions) Total Incurred to the End of 2020 2021 - 2025 Plan (1) Expected Year of Completion ITC Multi - Value Regional Transmission Projects 642 (2) 261 2023 ITC 34.5 kV to 69 kV Transmission Conversion Project 445 148 Post - 2025 UNS Vail - to - Tortolita Project (3) - 244 2023 UNS Oso Grande Wind Project (4) 574 24 2021 FortisBC Eagle Mountain Woodfibre Gas line Project (5) - 350 2025 FortisBC Transmission Integrity Management Capabilities Project 21 441 Post - 2025 FortisBC Inland Gas Upgrades Project 59 230 2025 FortisBC Tilbury 1B 20 376 2025 FortisBC Tilbury LNG Resiliency Tank 10 209 Post - 2025 FortisBC Advanced Metering Infrastructure Project - 247 Post - 2025 Wataynikaneyap Transmission Power Project (6) 178 536 2023 Note: Major capital projects are defined as projects, other than ongoing maintenance projects, individually costing $200 mill ion or more. Total project costs include forecasted capitalized interest and non - cash equity component of allowance for funds used during construction, where applicable. Smaller Projects 85% (1) U.S. dollar - denominated capital expenditures converted at a forecast USD:CAD exchange rate of 1.32 for 2021 through 2025. (2) Reflects capital expenditures since date of acquisition of ITC on October 14, 2016. (3) The Vail - to - Tortolita transmission project was previously disclosed as a phase of the Southline Transmission Project. (4) Construction completed in May 2021. (5) Capital plan is net of customer contributions. (6) Represents Fortis’ 39% share of the estimated capital spending for the project, including deferred development costs. MAJOR CAPITAL PROJECTS 24 Major Capital Projects 15%

» Further develop Tilbury to position BC as a marine bunkering hub » Long - term contracted LNG export opportunities » Southern Crossing Gas Transmission Expansion for market expansion and resiliency » Target of 30% reduction in customer GHG emissions by 2030 » Renewable gas target of 15% by 2030 » Lake Erie Connector Project (~$1.7B) » Significant renewable capacity and battery storage in MISO and SPP queues (1) » MISO long - range transmission plan » Hardening of physical assets and fibre networks » 2020 Integrated Resource Plan (IRP) outlined TEP’s ambitious and realistic sustainability objectives including coal - free generation mix by 2032 » Caribbean Utilities: Achieve National Energy Policy goal of 70% renewable energy by 2037 through IRP. IRP calls for 170 to 200 MW of solar in addition to wind power, battery storage and conversion of diesel to natural gas. » FortisTCI: Resilient National Energy Transition Strategy finalized with Government in 2019. Latest IRP completed in 2019 targets 33% renewable energy generation by 2040. (1) 74 GW and 105 GW of additional renewable capacity in MISO and SPP queues; 4 GW and 10 GW of battery storage in MISO and SPP q ueu es as at April 1, 2021 and April 16, 2021, respectively. OPPORTUNITIES TO EXPAND & EXTEND GROWTH 25 Other Electric • Total opportunity of ~$4 - 6B

CARBON EMISSIONS REDUCTION TARGET OF 75% BY 2035 2019 Emissions Load Growth TEP GHG Reductions Other Utilities' GHG Reductions 2035 Projected Emissions Reduction in Scope 1 Emissions by 2035 Using a 2019 Base Year Achievable Target Largely Driven by TEP’s Integrated Resource Plan Adding Clean Energy 2 , 400 MW Wind and Solar 1 , 400 MW Battery Storage • Majority of investment expected 2026 - 2032 Coal Free by 2032 1,073 MW Coal Retirements • San Juan shuts down in 2022 • Seasonal operations of Springerville starting in 2023 Plan Improves Already Low Environmental Footprint Today Only 5% of Assets • Fossil - Fuel Generation By 2035 99% of Assets • Expected to be Energy Delivery or Carbon - Free Generation 26
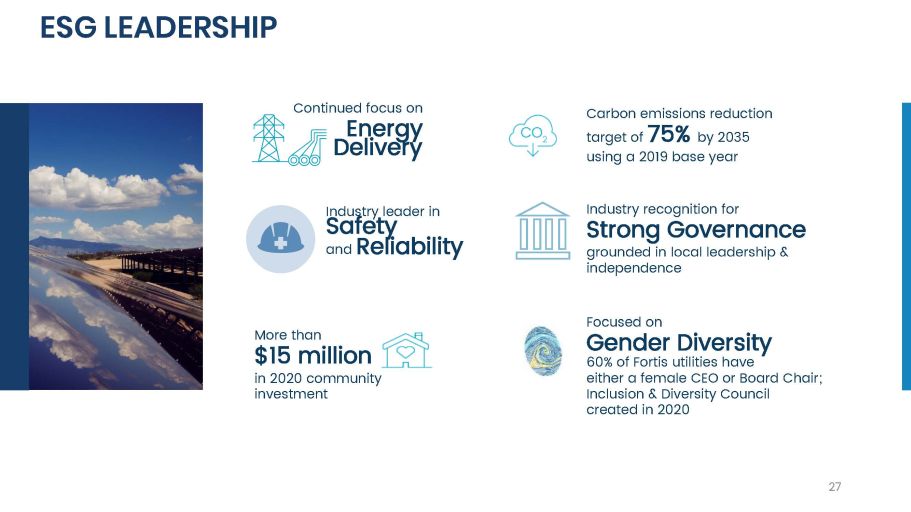
More than $15 million in 2020 community investment ESG LEADERSHIP Carbon emissions reduction target of 75% by 2035 using a 2019 base year Industry recognition for Strong Governance grounded in local leadership & independence Continued focus on Energy Industry leader in Safety and Reliability Focused on Gender Diversity 27 Delivery 27 60% of Fortis utilities have either a female CEO or Board Chair; Inclusion & Diversity Council created in 2020

Company Fortis Inc. A - (1) Baa3 A (low) ITC Holdings Corp. A - (1) Baa2 n/a ITC Regulated Subsidiaries A A1 n/a TEP A - A3 n/a Central Hudson A - A3 n/a FortisBC Energy n/a A3 A FortisBC Electric n/a Baa1 A (low) FortisAlberta A - Baa1 A (low) Newfoundland Power n/a A2 A (1) S&P credit ratings for Fortis Inc. and ITC Holdings Corp. reflect the issuer credit INVESTMENT - GRADE CREDIT RATINGS ratings. The unsecured debt rating for Fortis Inc. and ITC Holdings Corp. is BBB+. 28

- 0.5 1.0 1.5 2.0 2021F 2022F 2023F 2024F 2025F Fortis Fortis Subsidiaries Note: Debt as at March 31, 2021 and excludes any new debt issuances during the forecast period. Excludes repayments of financ e l eases along with the current portion of credit facilities, which are assumed to be extended by one - year annually. 5 - Year Average ~$0.9B $ billions MANAGEABLE DEBT MATURITIES 29
Serious News for Serious Traders! Try StreetInsider.com Premium Free!
You May Also Be Interested In
- Advisory: Fortis Inc. to Hold Teleconference on May 1 to Discuss First Quarter 2024 Results and Hold Annual and Special Meeting on May 2
- Proposals to the Annual General Meeting of Municipality Finance Plc
- Share repurchase programme
Create E-mail Alert Related Categories
SEC FilingsSign up for StreetInsider Free!
Receive full access to all new and archived articles, unlimited portfolio tracking, e-mail alerts, custom newswires and RSS feeds - and more!
