

Form 6-K EMERA INC For: Apr 13
 Tweet
Tweet Share
Share
UNITED STATES
SECURITIES AND EXCHANGE COMMISSION
Washington, D.C. 20549
FORM 6-K
REPORT OF FOREIGN PRIVATE ISSUER
PURSUANT TO RULE 13a-16 OR 15d-16
UNDER THE SECURITIES EXCHANGE ACT OF 1934
For the month of April, 2018
Commission File Number: 000-54516
Emera Incorporated
(Exact name of registrant as specified in its charter)
1223 Lower Water Street
Halifax NS B3J 3S8
Canada
(Address of principal executive offices)
Indicate by check mark whether the registrant files or will file annual reports under cover of Form 20-F or Form 40-F.
Form 20-F ☐ Form 40-F ☒
Indicate by check mark if the registrant is submitting the Form 6-K in paper as permitted by Regulation S-T Rule 101(b)(1): ☐
Indicate by check mark if the registrant is submitting the Form 6-K in paper as permitted by Regulation S-T Rule 101(b)(7): ☐
SIGNATURES
Pursuant to the requirements of the Securities Exchange Act of 1934, the registrant has duly caused this report to be signed on its behalf by the undersigned, thereunto duly authorized.
| EMERA INCORPORATED | ||||||
| Date: April 13, 2017 | By: | /s/ Stephen D. Aftanas | ||||
| Name: Stephen D. Aftanas | ||||||
| Title: Corporate Secretary | ||||||
EXHIBIT INDEX
| Exhibit No. |
Description | |
| 99.1 |
Emera Form of Proxy relating to Emera’s May 24, 2018 shareholders meeting. | |
| 99.2 |
Voting Instruction Form (VIF) relating to Emera’s May 24, 2018 shareholder meeting. | |
| 99.3 |
Notice of Meeting relating to Emera’s May 24, 2018 shareholder meeting. | |
| 99.4 |
Emera 2017 Annual Report | |
Exhibit 99.1
|
|

|

Form of Proxy - Emera Inc.
Annual Shareholders Meeting of May 24, 2018
Appointment of Proxyholder
I/We, being holder(s) of Emera Inc. (the “Company”) common shares, hereby appoint: M. Jacqueline Sheppard, or failing her, Scott C. Balfour, or failing him, Stephen D. Aftanas, OR
|
|
[Print the name of the person you are appointing if this person is someone other than the individuals listed above]
as proxy of the undersigned, to attend, act and vote on behalf of the undersigned in accordance with the below direction (or if no directions have been given, as the proxy sees fit) on all of the following matters and any other matter that may properly come before the Annual Meeting of Shareholders of the Company to be held at 2:00 p.m. Eastern Time on Thursday, May 24, 2018, in the Glenn Gould Studio, CBC Building, 250 Front Street West, Toronto, Ontario, Canada (the “Meeting”), and at any and all adjournments or postponements thereof in the same manner, to the same extent and with the same powers as if the undersigned were personally present, with full power of substitution.
Management recommends voting FOR Resolutions 1, 2, 3, and 4. Please use a dark black pencil or pen.
| 1. |
Election of Directors | FOR | WITHHOLD | FOR | WITHHOLD | |||||||
| 01. Scott C. Balfour |
☐ | ☐ | 07. B. Lynn Loewen |
☐ | ☐ | |||||||
| 02. Sylvia D. Chrominska |
☐ | ☐ | 08. Donald A. Pether |
☐ | ☐ | |||||||
| 03. Henry E. Demone |
☐ | ☐ | 09. John B. Ramil |
☐ | ☐ | |||||||
| 04. Allan L. Edgeworth |
☐ | ☐ | 10. Andrea S. Rosen |
☐ | ☐ | |||||||
| 05. James D. Eisenhauer |
☐ | ☐ | 11. Richard P. Sergel |
☐ | ☐ | |||||||
| 06. Kent M. Harvey |
☐ | ☐ | 12. M. Jacqueline Sheppard |
☐ | ☐ | |||||||
| 2. | Appointment of Auditors | FOR | WITHHOLD | |||||||||
| Appointment of Ernst & Young LLP as auditors |
☐ | ☐ | ||||||||||
| 3. | Auditors Fee | FOR | AGAINST | |||||||||
| Authorize Directors to establish the auditors’ fee as required pursuant to the Nova Scotia Companies Act |
☐ | ☐ | ||||||||||
| 4. | Advisory Vote on Executive Compensation | FOR | AGAINST | |||||||||
| Consider and approve, on an advisory basis, a resolution on Emera’s approach to executive compensation as disclosed in the Management Information Circular |
☐ | ☐ | ||||||||||
I/We authorize you to act in accordance with my/our instructions set out above. I/We hereby revoke any proxy previously given with respect to the Meeting.
If no voting instructions are indicated above, this Proxy will be voted FOR a matter by Management’s appointees or, if you appoint another proxyholder, as that other proxyholder sees fit. On any amendments or variations proposed or any new business properly submitted before the Meeting, I/We authorize you to vote as you see fit.
|
|
| |||
| Signature(s) |
Date |
Please sign exactly as your name(s) appear on this proxy. Please see reverse for instructions. All proxies must be received by 5:00 p.m. Eastern Time, Wednesday, May 23, 2018.
--------------------------------------------------------------
Under Canadian Securities Law, you are entitled to receive certain investor documents.
Electronic financial statements and MD&A are available at www.Emera.com and at www.SEDAR.com. If you wish paper copies, please tick the box below or go to the website https://ca.astfinancial.com/financialstatements and input code 1705a.
| ❑ | I would like to receive quarterly financial statements and MD&A in paper format |
| ❑ | I would like to receive annual financial statements and MD&A in paper format |
| A. Shareholder 320 Bay St., 3rd Floor Toronto, ON M5T 2A4 Line 6 Line 7 |
|
Form of Proxy - Emera Inc.
Annual Shareholders Meeting of May 24, 2018
Notes to Proxy
| 1. | This proxy must be signed by a holder or his or her attorney duly authorized in writing. If you are an individual, please sign exactly as your name appears on this proxy. If the holder is a corporation, a duly authorized officer or attorney of the corporation must sign this proxy, and if the corporation has a corporate seal, its corporate seal should be affixed. |
| 2. | If the securities are registered in the name of an executor, administrator or trustee, please sign exactly as your name appears on this proxy. If the securities are registered in the name of a deceased or other holder, the proxy must be signed by the legal representative with his or her name printed below his or her signature, and evidence of authority to sign on behalf of the deceased or other holder must be attached to this proxy. |
| 3. | Some holders may own securities as both a registered and a beneficial holder and will need to vote separately as a registered holder and as a beneficial holder. Beneficial holders may be forwarded either a form of proxy already signed by the intermediary or a voting instruction form to allow them to direct the voting of securities they beneficially own. Beneficial holders should follow instructions for voting conveyed to them by their intermediaries. |
| 4. | If a security is held by two or more individuals, any one of them present or represented by proxy at the Meeting may, in the absence of the other or others, vote at the Meeting. However, if one or more of them are present or represented by proxy, they must vote together the number of securities indicated on the proxy. |
| 5. | If this proxy is not dated, it will be deemed to bear the date on which it was mailed on behalf of management of the Company to you. |
All holders should refer to the Management Information Circular for further information regarding completion and use of this proxy and other information pertaining to the Meeting.
This proxy is solicited by and on behalf of Management of the Company.
Emera offers a number of ways to cast your vote.
|
• Go to www.astvotemyproxy.com • Follow the instructions on the screen • You will be required to enter the 13-digit control number located on the reverse • No need to return this proxy |
• Use any touch-tone telephone, call toll free in Canada and United States 1-888-489-5760 • Follow the voice instructions • When prompted, enter the 13-digit control number located on the reverse • No need to return this proxy |
To vote using your smartphone, please scan this QR Code
• No need to return this proxy
| ||
|
• Complete the reverse of this form • Return your signed proxy in the envelope provided or send to:
AST Trust Company (Canada) P.O. Box 721 Agincourt, ON M1S 0A1
|
• Complete the reverse of this form • Fax your signed proxy to 1-416-368-2502, or toll free in Canada and United States to 1-866-781-3111 |
• Complete the reverse of this form • Scan your signed proxy and email it to [email protected]. | ||
 INTERNET
 TELEPHONE
 SMARTPHONE
 MAIL
MAIL FAX
FAX EMAIL
EMAIL
All proxies must be received by 5:00 p.m. Eastern Time, Wednesday, May 23, 2018.
Exhibit 99.2
|
|

|

Voting Instruction Form (“VIF”) - Emera Inc.
Annual Shareholders Meeting of May 24, 2018
Appointee
I/We, being holder(s) of Emera Inc. (the “Company”) common shares, hereby appoint: M. Jacqueline Sheppard, or failing her, Scott C. Balfour, or failing him, Stephen D. Aftanas, OR
[To attend the meeting or to appoint someone to attend on your behalf, print that name here]
as proxy of the undersigned, to attend, act and vote on behalf of the undersigned in accordance with the below direction (or if no directions have been given, as the proxy sees fit) on all of the following matters and any other matter that may properly come before the Annual Meeting of Shareholders of the Company to be held at 2:00 p.m. Eastern Time on Thursday, May 24, 2018, in the Glenn Gould Studio, CBC Building, 250 Front Street West, Toronto, Ontario, Canada (the “Meeting”), and at any and all adjournments or postponements thereof in the same manner, to the same extent and with the same powers as if the undersigned were personally present, with full power of substitution.
Management recommends voting FOR Resolutions 1, 2, 3, and 4. Please use a dark black pencil or pen.
| 1. |
Election of Directors |
FOR | WITHHOLD | FOR | WITHHOLD | |||||||
| 01. Scott C. Balfour |
☐ | ☐ | 07. B. Lynn Loewen |
☐ | ☐ | |||||||
| 02. Sylvia D. Chrominska |
☐ | ☐ | 08. Donald A. Pether |
☐ | ☐ | |||||||
| 03. Henry E. Demone |
☐ | ☐ | 09. John B. Ramil |
☐ | ☐ | |||||||
| 04. Allan L. Edgeworth |
☐ | ☐ | 10. Andrea S. Rosen |
☐ | ☐ | |||||||
| 05. James D. Eisenhauer |
☐ | ☐ | 11. Richard P. Sergel |
☐ | ☐ | |||||||
| 06. Kent M. Harvey |
☐ | ☐ | 12. M. Jacqueline Sheppard |
☐ | ☐ | |||||||
| 2. |
Appointment of Auditors |
FOR | WITHHOLD | |||||||||
| Appointment of Ernst & Young LLP as auditors |
☐ | ☐ | ||||||||||
| 3. |
Auditors Fee |
FOR | AGAINST | |||||||||
| Authorize Directors to establish the auditors’ fee as required pursuant to the Nova Scotia Companies Act |
☐ | ☐ | ||||||||||
| 4. |
Advisory Vote on Executive Compensation |
FOR | AGAINST | |||||||||
| Consider and approve, on an advisory basis, a resolution on Emera’s approach to executive compensation as disclosed in the Management Information Circular |
☐ | ☐ | ||||||||||
I/We authorize you to act in accordance with my/our instructions set out above. I/We hereby revoke any proxy previously given with respect to the Meeting.
If no voting instructions are indicated above, this VIF will be voted FOR a matter by Management’s appointees or, if you appoint another person, as such other person sees fit. On any amendments or variations proposed or any new business properly submitted before the Meeting, I/We authorize you to vote as you see fit.
|
|
|
|||||
| Signature(s) |
Date |
Please sign exactly as your name(s) appear on this VIF. Please see reverse for instructions. All VIFs must be received by 5:00 p.m. Eastern Time, Wednesday, May 23, 2018.
--------------------------------------------------------------
Under Canadian Securities Law, you are entitled to receive certain investor documents.
Electronic financial statements and MD&A are available at www.Emera.com and at www.SEDAR.com. If you wish paper copies, please tick the box below or go to the website https://ca.astfinancial.com/financialstatements and input code 1705a.
| ❑ |
I would like to receive quarterly financial statements and MD&A in paper format |
| ❑ |
I would like to receive annual financial statements and MD&A in paper format |
| A. Shareholder 320 Bay St., 3rd Floor Toronto, ON M5T 2A4 Line 6 Line 7 |
|
Voting Instruction Form (“VIF”) - Emera Inc.
Annual Shareholders Meeting of May 24, 2018
| 1. |
We are sending to you the enclosed proxy-related materials that relate to a meeting of holders of Emera Inc.’s common shares. Unless you attend the Meeting and vote in person, your securities can be voted only by management, as appointee of the registered holder, in accordance with your instructions. |
| 2. |
We are prohibited from voting these securities on any of the matters to be acted upon at the Meeting without your specific voting instructions. In order for these securities to be voted at the Meeting, it will be necessary for us to have your specific voting instructions. Please complete and return the information requested in this VIF to provide your voting instructions to us promptly. |
| 3. |
If you want to attend the Meeting and vote in person, please write your name in the place provided for that purpose in this form. You can also write the name of someone else whom you wish to attend the Meeting and vote on your behalf. Unless prohibited by law, the person whose name is written in the space provided will have full authority to present matters to the Meeting and vote on all matters that are presented at the Meeting, even if those matters are not set out in this form or the Management Information Circular. Consult a legal advisor if you wish to modify the authority of that person in any way. If you require help, please contact the Registered Representative who services your account. |
| 4. |
This VIF should be signed by you in the exact manner as your name appears on the VIF. If these voting instructions are given on behalf of a body corporate, set out the full legal name of the body corporate, the name and position of the person giving voting instructions on behalf of the body corporate, and the address for service of the body corporate. |
| 5. |
If this VIF is not dated it will be deemed to bear the date on which it is mailed by management to you. |
| 6. |
When properly signed and delivered, securities represented by this VIF will be voted as directed by you, however, if such a direction is not made in respect of any matter, the VIF will direct the voting of the securities to be made as recommended in the documentation provided by Management for the Meeting. |
| 7. |
This VIF confers discretionary authority on the appointee to vote as the appointee sees fit in respect of amendments or variations to matters identified in the notice of meeting or other matters as may properly come before the Meeting or any adjournment thereof. |
| 8. |
Your voting instructions will be recorded on receipt of the VIF. |
| 9. |
By providing voting instructions as requested, you are acknowledging that you are the beneficial owner of, and are entitled to instruct us with respect to the voting of, these securities. |
| 10. |
If you have any questions regarding the enclosed documents, please contact the Registered Representative who services your account. |
| 11. |
This VIF should be read in conjunction with the Management Information Circular and other proxy materials provided by Management. |
All holders should refer to the Management Information Circular for further information regarding completion and use of this VIF and other information pertaining to the Meeting.
Emera offers a number of ways to cast your vote.
|
• Go to www.astvotemyproxy.com • Follow the instructions on the screen • You will be required to enter the 13-digit control number located on the reverse • No need to return this VIF |
• Use any touch-tone telephone, call toll free in Canada and United States 1-888-489-5760 • Follow the voice instructions • When prompted, enter the 13-digit control number located on the reverse • No need to return this VIF |
To vote using your smartphone, please scan this QR Code
• No need to return this VIF
| ||
|
• Complete the reverse of this form • Return your signed VIF in the envelope provided or send to:
AST Trust Company (Canada) P.O. Box 721 Agincourt, ON M1S 0A1
|
• Complete the reverse of this form • Fax your signed VIF to 1-416-368-2502, or toll free in Canada and United States to 1-866-781-3111 |
• Complete the reverse of this form • Scan your signed VIF and email it to [email protected]. | ||
All VIFs must be received by 5:00 p.m. Eastern Time, Wednesday, May 23, 2018.
Exhibit 99.3
Notice of Annual Meeting
| Thursday, May 24, 2018 2:00 p.m. Eastern Time |
Glenn Gould Studio 250 Front Street West, Toronto, Ontario, Canada |
Record Date Close of business March 28, 2018 |
Items of Business
| 1. | Electing Directors to serve until the next annual meeting of Shareholders; |
| 2. | Appointing Auditors; |
| 3. | Authorizing the Directors to establish the Auditors’ fee; |
| 4. | Considering an advisory resolution on the Company’s approach to executive compensation; and |
| 5. | Transacting such other business as may properly come before the meeting. |
As a shareholder, it is important that you vote. Common shareholders are encouraged to return their proxy or voting instruction form as soon as possible. A postage-paid, pre-addressed envelope is provided. As an alternative, shareholders may choose to vote by telephone or on the internet as provided for on the proxy or voting instruction form. Proxies must be received prior to 5:00 p.m. Eastern Time on Wednesday, May 23, 2018, or if the meeting is adjourned, at least 48 hours (not including Saturdays, Sundays, or statutory holidays in Nova Scotia) prior to the reconvened meeting.
Should you have questions or comments, please contact Emera Incorporated by writing to the Corporate Secretary, Emera Incorporated, P.O. Box 910, Halifax, Nova Scotia B3J 2W5 or by calling 1-800-358-1995 from anywhere in North America or (902) 428-6060 within the Halifax-Dartmouth area.

Stephen D. Aftanas
Corporate Secretary
Table of Contents
Exhibit 99.4
Table of Contents
Table of Contents
Letter from the Chair
| Fellow Shareholder,
We continued to execute on our strategy in 2017, delivering strong results for the business and our shareholders. |
||
| The Board remained focused on corporate strategy, risk identification and management, the balance sheet, capital spending, our operations and our people, including leadership development and organizational capacity across Emera.
Strategy Oversight
With Emera’s new scale and scope in 2017, the company and the Board renewed their focus on strategy at both the corporate and subsidiary level. We worked to strengthen the strategic focus areas and ready the organization for the disruptive forces and changing technology facing the industry.
The company continued to deliver on its strategy of delivering clean affordable energy to customers in 2017, making significant advances in integrating renewables and embracing innovation. Emera recently completed the largest acquisition ever made by the company (TECO Energy, Inc.) and successfully completed the Maritime Link Project on time and under budget. Emera cut the ribbon on a 23 MW solar facility at Big Bend in Florida and announced plans to build 600MW of solar generation – installing six million photovoltaic panels and resulting in what will be the highest penetration of solar in the generation mix of any utility in Florida. The team also introduced innovative new pilot projects in Nova Scotia and Barbados that will focus on the capture, use and storage of renewable energy. These initiatives and others will drive Emera’s continued growth in 2018 and beyond. |
Jackie Sheppard Chair, Board of Directors Emera Inc. | |

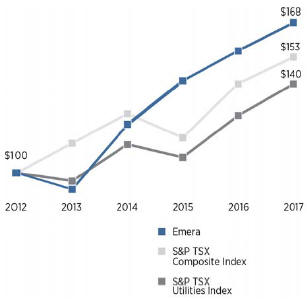
| Our strategic focus continues to emphasize the greening of our generation fleet in support of creating the grid of the future. These changes require a long-term commitment by the Board and management. Over the long term, Emera has consistently provided value to shareholders, delivering a total shareholder return (TSR) that exceeded the industry average. Over the past five years, Emera continued to be a leader in TSR, delivering annualized TSR of 11.0 per cent compared to 7.0 per cent delivered by the S&P/TSX Capped Utilities Index and 8.8 per cent delivered by the S&P/TSX Composite Index over the same period.
As the graph on the right indicates, $100 invested in Emera on December 31, 2012 was worth $168 on December 31, 2017, compared to $140 in the S&P/TSX Capped Utilities Index and $152 in the S&P/ TSX Composite Index.
Improving economic indicators and rising interest rates made the second half of 2017 and the beginning of 2018 challenging. US tax reform also impacted our business and the team continues to work through plans to mitigate impacts moving forward. We remain confident in our ability to deliver consistent value to our shareholders over the longer term. |
Cumulative Total Return on $100 Investment
December 31, 2012 to December 31, 2017
|
Emera Inc. — Annual Report 2017 1
Table of Contents
Our regulated asset base continues to be strong, offering more earnings diversity, capacity and quality. Over 90 per cent of our earnings currently come from our regulated businesses, exceeding our minimum target of 75 per cent.
Consistently delivering returns in a dynamic business environment requires strategy, planning and disciplined execution. In 2017, the team delivered despite many challenges, including extreme weather.
Unseasonably warm or cold temperatures affect our financial performance, while extreme weather events, such as a windstorm in Maine and Hurricanes Irma and Maria, presented critical challenges in 2017. That’s why the team is continuing to improve our ability to model weather to better understand system impacts and restore energy faster for customers. These improvements were evident in Tampa Electric’s response after Hurricane Irma. The team restored power to more than 425,000 customers, more than half of its customer base, in only seven days after the storm. Emera Maine restored 90,000 customers, over half of its customer base, in just seven days after a major windstorm in October.
Commitment to strong governance
| Every year, the Board completes an extensive governance review that sets out priorities and a rigorous action plan that is tracked throughout the year.
In the first full year of TECO integration into the Emera group of companies, we applied Emera’s subsidiary governance principles through the recruitment of new independent directors in both Florida and New Mexico. These Boards, with a complement of independent Directors, are well positioned to provide oversight and strategic direction for the businesses in these regions.
At the corporate level, Emera constituted a new Health, Safety and Environment (HSE) Committee in 2017. In response to Emera’s expanded size and diversity of operations, the Committee will focus on oversight of the safety, health and wellness of employees and advanced environmental monitoring and reporting. We aspire to be world class in all of these areas. The Committee monitors and evaluates HSE matters and emerging issues, reviews compliance, and identifies and oversees the management of risks in these areas that could adversely impact operations, strategy or reputation.
|
Emera’s new Health, Safety & Environment Committee is overseeing how employees take care of each other and the places we work. |
Given the tragic incidents that occurred in Florida and in Newfoundland and Labrador, the Committee spent significant time reviewing the company’s plans and actions to strengthen safety culture and safety programs across the business.
2 Emera Inc. — Annual Report 2017
Table of Contents
Letter from the Chair
Sustainability
| In 2017, Emera produced its first annual Sustainability Report. The report illustrates how we continue to advance Emera’s cleaner, affordable energy strategy and are creating value for our customers, our communities, and our environment. It highlights how we continue to invest in initiatives that promote stronger communities and growth; how our team members volunteer thousands of hours in support of local causes; and how we are investing in partnerships that build a culture of entrepreneurship and innovation in the communities in which we operate.
It is the first time all of Emera’s commitments have been presented in this way, demonstrating how sustainability is at the core of our business. It also highlights how we’ve been successfully applying our strategy for over a decade. We are committed to building a strong sustainability function at Emera that represents our strategy in action and ensures that all of our stakeholders understand our strategy, our commitments and our results beyond financial performance. |
We published Emera’s first Sustainability Report in 2017, showing how sustainability is core to who we are and what we do at www.emera.com/sustainability. |
Renewal and succession planning
As Emera continues to grow, the Board is committed to ensuring we have the right directors in place to guide the company today and into the future. Given the tenure of the Board, we are engaging in longer term succession planning that balances board renewal and the need for continuity and smooth transitions. We are continually striving for diversity of experience, thought and gender, focusing on Board and Committee effectiveness and instituting best practices.
Consistent with the Board renewal principles adopted in 2016, the Board welcomed new director Kent Harvey in 2017. Mr. Harvey is an accomplished executive with more than 30 years of experience in the energy industry in the United States.
I also want to extend a special thanks to my colleague and predecessor Chair of the Board, John McLennan, who will be retiring from the Board in May 2018. John joined the Board in 2005 and served as our Chair from May 2009 to May 2014. With his vast corporate experience John could always be counted on as a voice of rich insight and wisdom. I’d be remiss if I didn’t mention how much we all enjoyed, and will miss, his Cape Breton spirit and wit! On behalf of my fellow Board members, we wish John the very best.
I would like to take the opportunity to thank all of my colleagues on the Board for their ongoing commitment to Emera and to the highest standards of corporate governance.
Emera Inc. — Annual Report 2017 3
Table of Contents
CEO succession
In March 2017, we announced our CEO succession plans, providing a 12-month transition process that allowed for a seamless leadership transition.
On behalf of the Board of Directors, I’d like to thank Chris Huskilson for his remarkable contribution to the business and congratulate him on an outstanding legacy of growth and transformation at Emera.
Under Chris’ leadership, Emera’s assets have grown from $4 billion to approximately $29 billion, we’ve provided annual total shareholder return that outpaces our industry and increased the value of our shares to over twice what it was when he became President and CEO.
A big part of Chris’ legacy is the team and culture that he built at Emera. He believed in developing people by providing all employees equal opportunity to learn diverse skills across the business. The team is strong and ready for the future.
I would also like to thank Chris for working so constructively with the Board as we all focused on successfully transitioning the company for new leadership.
Scott Balfour became Emera’s new President and CEO on March 29, 2018. Scott’s proven leadership ability, financial acumen and business experience make him the natural choice to be the next CEO for Emera. We are confident that we have the right leader and the right team in place for Emera’s future growth.
Finally, Emera was recognized as one of Canada’s Best Employers by Forbes Magazine in 2017. I would like to thank the team across all the Emera companies for consistently delivering for our customers and our shareholders. Emera thrives because of the incredible work and commitment of the team.
Sincerely,
 ..
..
Jackie Sheppard
Chair, Emera Inc.
Board of Directors
4 Emera Inc. — Annual Report 2017
Table of Contents
Letter from the CEO
Letter from the CEO
Fellow Shareholder:
| In many ways, 2017 was a milestone year for Emera in both stability and growth.
We experienced the first full year of operations with Tampa Electric, Peoples Gas and New Mexico Gas. Integration has strengthened our team and ensured all of our companies are aligned with Emera’s strategy and positioned for growth. Of particular note, we completed the construction of the $1.56 billion Maritime Link project – on time and under budget, we announced a major solar initiative in Florida and invested in innovation for our customers. And the teams in the Caribbean, Florida, Maine and Nova Scotia each responded with exceptional restoration efforts to significant storm events.
Financial Highlights
In 2017, adjusted net income and earnings per share were $524 million and $2.46. When compared to 2016, and excluding the one-time impacts from that year, we saw a 28 per cent increase in our year-over-year adjusted earnings due to a full-year of contribution from Emera Florida and New Mexico in 2017. Adjusted earnings per share, excluding one-time impacts, increased by three per cent.
We experienced significant growth in our Florida utilities, a continuation of material and consistent earnings from our legacy utilities, increased our dividend eight per cent and completed a $700 million equity issuance to finance Emera’s continuing growth in 2018.
While maintaining some of the lowest customer rates for electricity and natural gas in the state, Tampa Electric and Peoples Gas had the largest net earnings in their companies’ history, an increase of over 10 per cent from 2016. The increase has been driven by customer and load growth and through increased rate base investments, including renewables.
Our legacy utilities, Nova Scotia Power, Emera Maine and the Caribbean all performed in line with expectations in 2017, providing stable earnings and cash generation. |
Scott Balfour President & CEO, Emera Inc. | |
| We continue to see the strength and potential in our regulated companies, which in 2017 made up more than 90 per cent of our business. To underline the confidence that we have in our regulated business and its growth potential, we’ve highlighted a minimum target of 75 per cent for regulated earnings, which also provides the foundational support in earnings and cash flow to support our dividend. |
||

| At present, our regulated operations contribute in excess of 95 per cent to our overall earnings and we believe these businesses also provide a stable platform for our future growth. The completion of the Maritime Link and the start of the 600MW Tampa solar project are notable examples of how we are growing our consolidated rate base, and Emera’s earnings and cash flow, both today and for the next several years.
In an effort to streamline Emera’s ownership structure in the Caribbean and in support of a more efficient capital structure for Emera’s investment in this region, Emera announced a transaction in 2017 for Emera Utilities Holdings Ltd. (“EUHL”), a wholly owned indirect subsidiary of Emera, to indirectly acquire all of the common
shares of ICDU that it did not already own. The transaction closed in January 2018. |
Maritime Link project team members celebrate achieving first energy exchange. |

Emera Inc. — Annual Report 2017 5
Table of Contents
Emera Energy’s results were in line with 2016 but below our expectations as a result of weak market conditions largely because of mild weather conditions. We expect strong results in 2018 as capacity prices in New England continue to increase.
| As a result of our 2017 financial performance and our outlook for 2018, in September we increased our annual common share dividend to $2.26, consistent with our targeted annual growth rate through to 2020.
In December, we successfully completed a bought deal offering of 14,614,000 common shares at $47.90 per common share for aggregate gross proceeds of approximately $700 million. These proceeds are being used to support Emera’s recently announced growth initiatives and for general corporate purposes, including to reduce indebtedness outstanding under the business’s credit facility and to fund other ordinary course capital expenses.
On December 22, 2017, the US Tax Cuts and Jobs Act of 2017, commonly referred to as US tax reform, was signed into legislation. There are a number of specific details that have yet to be clarified, but a number of provisions will impact our US business operations. This included a one-time non-cash valuation allowance on Emera’s |
Tampa Electric is significantly expanding its solar generation portfolio, which includes its 23 MW facility at Big Bend. |

consolidated US tax loss pool taken in 2017. We’ve also disclosed a conservative estimate of the possible near-term impacts on earnings and cash flow for 2018 and we’ve been working diligently to mitigate these impacts. Over the longer term, we see the impacts of US tax reform as being neutral to positive for our business.
The Journey to World Class Safety
While the team delivered in many ways and remained committed to our unwavering belief that safety is more important than any other business interest and our efforts to improve safety performance, we had two separate incidents resulting in six fatalities and one life altering injury in 2017.
These incidents deeply impacted all of us at Emera. As a result, we initiated numerous reviews, made significant enhancements to procedures, and improved processes to drive a positive shift in the safety culture across Emera to ensure these kinds of incidents never happen again. We are more focused than ever on safety and we are committed to an Emera where no one gets hurt.
Strategy in Action
| In 2017, we continued to lead the way on delivering our cleaner, affordable energy strategy with new developments in renewable generation, electricity transmission, and natural gas infrastructure expansion. After four years of construction, the Maritime Link was completed on time and under budget in late 2017 and began commercial operation on January, 2018. Connecting Newfoundland to the North American energy grid for the first time in history.
Tampa Electric received approval from its regulator for the construction and the recovery of revenue requirements for four phases of solar capacity totaling 600 MW between 2018 and 2021. Once complete, nearly seven per cent of Tampa Electric’s energy generation will come from the sun – a higher percentage of solar than any other Florida utility. |
Nova Scotia Power works with customers to test home-based energy storage. |

6 Emera Inc. — Annual Report 2017
Table of Contents
Letter from the ceo
Nova Scotia Power plans to spend approximately $1.8 billion in capital between 2018 and 2022. With these investments, Nova Scotia Power will optimize its existing clean generation assets and create greater efficiencies that will ultimately benefit customers.
Investing in Innovation
| Innovation is a part of how we do business, continually evolving to serve our customers better. Innovation inspires change, drives solutions, encourages collaboration and grows economies. We continue to work to understand rapidly changing technology so that we can create and shape opportunities that can be used to benefit customers.
In August, Nova Scotia Power received approval from the Nova Scotia Utilities and Review Board (NSUARB) on a pilot project to test battery storage technology from industry leaders Tesla and OpusOne Solutions. The $3.4 million project included the installation of 10 Tesla Powerwalls in customer’s homes and a grid-size Tesla Powerpack at a substation tied in with a local six MW capacity wind farm. The team is excited to test a number of use cases and assess the peak performance of the stored energy. Ultimately, by integrating new technologies and more renewable energy into the grid, we aim to provide better service and value for customers. |
Emera companies like Grand Bahama Power are advancing plans to use electric cars as part of the energy storage solution. |

We remain committed to investing in innovative, dependable storage and smarter, more reliable grids. Our operating companies in Maine and Barbados are partnering with Tesla to test the use of battery storage.
In October, Nova Scotia Power applied to the NSUARB for approval to launch the Advanced Metering Initiative (AMI), a $133 million project which would see the first smart meters rolled out in 2019 throughout the province. Over the next 20 years smart meters will result in $38 million in reduced costs to the electricity system. This cost reduction will help the company continue to provide rate stability for customers.
| We’re also investing in smart meters in Barbados, where we have installed 30,000 smart meters to date, and in Florida, where Tampa Electric has announced plans to roll out over 20,000 units in its own AMI pilot project.
By collaborating and cooperating on AMI and using the combined purchasing power of Nova Scotia Power, Tampa Electric and Emera Maine, we are able to find greater efficiency and negotiate with vendors to find the best technology, terms and pricing solutions that will ultimately benefit customers in each region where we operate.
In late 2017, we established Emera Technologies LLC., a small, dedicated and nimble organization that will focus on innovation, capitalize on business opportunities and develop new technologies to position Emera as a dominant player in an evolving energy landscape. |
Team members in Florida help the engineers of tomorrow learn about energy. |

At Emera, we embrace innovation as a key driver of how we continue to improve and grow as a business. It plays a critical role in getting us to a sustainable energy future that’s reliable and available to meet the needs of our customers anywhere, anytime. Emera believes in strategic investments that make our economy stronger and our communities smarter.
Emera Inc. — Annual Report 2017 7
Table of Contents
We invested in the IdeaHub at Dalhousie University in Nova Scotia. This will provide students and start- ups with mentorship and support to bring ideas for their technology-based products to the market.
In New Mexico, we invested in InnovateABQ, an entrepreneurial district in Albuquerque, where multi-purpose companies are working to create technological innovations and opportunities for expanded business growth throughout the state.
In September, we announced that Emera is a core investor in the Ocean Supercluster initiative. This industry-led network brings together industry, technology providers and researchers to accelerate the safe, financially and environmentally sustainable development of Canada’s ocean resources.
| We also invested in the Research Centre for Smart Grid Technologies at the University of New Brunswick, a state-of-the-art research facility that enables research and development, as well as industry partnerships for smart grid research.
Extreme Weather Events
As mentioned earlier, extreme weather was a significant factor in many of our operating regions in 2017. Weather always impacts our business and we are continuously improving how we model the system impacts of hurricanes and storms. This is essential for our customers, as it also means we are better prepared for these events and can improve power restoration times.
Unfortunately, some storms are catastrophic, as was the case when Hurricane Maria devastated the island of Dominica. As a result, all 36,000 of Domlec’s customers lost power. This impacted everyone, including our own team - many of whom lost their homes. Following the hurricane, our team immediately got to work to restore power to vital services like hospitals and airports and we continue to restore power to customers on the island.
Our People
Our successes would not have been possible without the team at Emera. I would like to take this opportunity to thank every Emera employee for their hard work and dedication. You have all been instrumental in growing Emera into what it is today. I am honoured and excited to lead such a talented and committed team. |
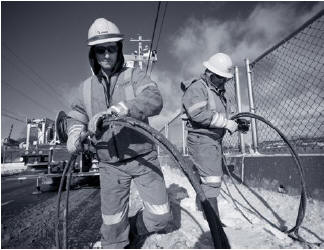
Grand Bahama Power team members work to restore customers following Hurricane Irma.
Team members in Florida support community members in need over the holiday season. |

In closing, I’d like to thank Chris for his leadership and vision. He has been a driving force behind the growth and success of Emera. Over his more than 13 years as President and CEO, Chris has shaped this organization and we certainly would not be in the position we are today without him. Along the way, he assembled and developed a strong team that has been inspired by his vision.
We are ready and excited to build on his legacy – delivering even more value for our customers and our shareholders.
Sincerely,

Scott Balfour
President and CEO
Emera Inc.
8 Emera Inc. — Annual Report 2017
Table of Contents
Management’s Discussion & Analysis
As at February 9, 2018
Management’s Discussion & Analysis (“MD&A”) provides a review of the results of operations of Emera Incorporated and its subsidiaries and investments (“Emera”) during the fourth quarter of 2017 relative to the same quarter in 2016; the full year of 2017 relative to 2016 and selected financial information for 2015; and its financial position as at December 31, 2017 relative to December 31, 2016. To enhance shareholders’ understanding, certain multi-year historical financial and statistical information is presented. Throughout this discussion, “Emera Incorporated”, “Emera” and “Company” refer to Emera Incorporated and all of its consolidated subsidiaries and investments. The Company’s activities are carried out through six business segments: Emera Florida and New Mexico, Nova Scotia Power Inc., Emera Maine, Emera Caribbean, Emera Energy and Corporate and Other.
This discussion and analysis should be read in conjunction with the Emera Incorporated annual audited consolidated financial statements and supporting notes as at and for the year ended December 31, 2017. Emera follows United States Generally Accepted Accounting Principles (“USGAAP” or “GAAP”).
The accounting policies used by Emera’s rate-regulated entities may differ from those used by Emera’s non-rate-regulated businesses with respect to the timing of recognition of certain assets, liabilities, revenues and expenses. Emera’s rate-regulated subsidiaries include:
| Emera Rate-Regulated Subsidiary or Equity Investment | Accounting Policies Approved/Examined By | |
| Subsidiary | ||
| Tampa Electric – Electric Division of Tampa Electric Company (“TEC”) | Florida Public Service Commission (“FPSC”) and the Federal Energy Regulatory Commission (“FERC”) | |
| Peoples Gas System (“PGS”) – Gas Division of TEC | FPSC | |
| New Mexico Gas Company, Inc. (“NMGC”) | New Mexico Public Regulation Commission (“NMPRC”) | |
| Nova Scotia Power Inc. (“NSPI”) | Nova Scotia Utility and Review Board (“UARB”) | |
| Emera Maine | Maine Public Utilities Commission (“MPUC”) and FERC | |
| Barbados Light & Power Company Limited (“BLPC”) | Fair Trading Commission, Barbados | |
| Grand Bahama Power Company Limited (“GBPC”) | The Grand Bahama Port Authority (“GBPA”) | |
| Dominica Electricity Services Ltd. (“Domlec”) | Independent Regulatory Commission, Dominica | |
| (“IRC”) Emera Brunswick Pipeline Company Limited (“Brunswick Pipeline”) | National Energy Board (“NEB”) | |
| Equity Investments | ||
| NSP Maritime Link Inc. (“NSPML”) | UARB | |
| Maritimes & Northeast Pipeline Limited Partnership and Maritimes & Northeast Pipeline LLC (“M&NP”) | NEB and FERC | |
| Labrador Island Link Limited Partnership (“LIL”) | Newfoundland and Labrador Board of Commissioners of Public Utilities (“NLPUB”) | |
| St. Lucia Electricity Services Limited (“Lucelec”) | National Utility Regulatory Commission (“NURC”) | |
All amounts are in Canadian dollars (“CAD”), except for the Emera Florida and New Mexico, Emera Maine and Emera Caribbean sections of the MD&A, which are reported in US dollars (“USD”), unless otherwise stated.
Additional information related to Emera, including the Company’s Annual Information Form, can be found on SEDAR at www.sedar.com.
Emera Inc. — Annual Report 2017 9
Table of Contents
This MD&A contains “forward-looking information” and statements which reflect the current view with respect to the Company’s expectations regarding future growth, results of operations, performance, business prospects and opportunities and may not be appropriate for other purposes within the meaning of applicable Canadian securities laws. All such information and statements are made pursuant to safe harbour provisions contained in applicable securities legislation. The words “anticipates”, “believes”, “could”, “estimates”, “expects”, “intends”, “may”, “plans”, “projects”, “schedule”, “should”, “budget”, “forecast”, “might”, “will”, “would”, “targets” and similar expressions are often intended to identify forward-looking information, although not all forward-looking information contains these identifying words. The forward-looking information reflects management’s current beliefs and is based on information currently available to Emera’s management and should not be read as guarantees of future events, performance or results, and will not necessarily be accurate indications of whether, or the time at which, such events, performance or results will be achieved.
The forward-looking information is based on reasonable assumptions and is subject to risks, uncertainties and other factors that could cause actual results to differ materially from historical results or results anticipated by the forward-looking information. Factors that could cause results or events to differ from current expectations are discussed in the Business Overview and Outlook section of the MD&A and may also include: regulatory risk; operating and maintenance risks; changes in economic conditions; commodity price and availability risk; capital market and liquidity risk; future dividend growth; timing and costs associated with certain capital projects; the expected impacts on Emera of challenges in the global economy; estimated energy consumption rates; maintenance of adequate insurance coverage; changes in customer energy usage patterns; developments in technology that could reduce demand for electricity; weather; commodity price risk; unanticipated maintenance and other expenditures; system operating and maintenance risk; derivative financial instruments and hedging; interest rate risk; credit risk; commercial relationship risk; disruption of fuel supply; country risks; environmental risks; foreign exchange; regulatory and government decisions, including changes to environmental, financial reporting and tax legislation; risks associated with pension plan performance and funding requirements; loss of service area; risk of failure of information technology infrastructure and cybersecurity risks; market energy sales prices; labour relations; and availability of labour and management resources.
Readers are cautioned not to place undue reliance on forward-looking information as actual results could differ materially from the plans, expectations, estimates or intentions and statements expressed in the forward-looking information. All forward-looking information in this MD&A is qualified in its entirety by the above cautionary statements and, except as required by law, Emera undertakes no obligation to revise or update any forward-looking information as a result of new information, future events or otherwise.
10 Emera Inc. — Annual Report 2017
Table of Contents
Management’s Discussion & Analysis
INTRODUCTION AND STRATEGIC OVERVIEW
Emera is a geographically diverse energy and services company. The Company has investments in electricity generation, transmission and distribution and gas transmission and distribution, predominantly within rate-regulated utilities which support strong, consistent earnings and cash flow. Emera seeks to provide its customers with reliable, cost-effective and sustainable energy products and services, and provides regional energy solutions by connecting its assets, markets and partners in Canada, the United States and the Caribbean.
For investors, Emera seeks to deliver consistent earnings, cash flow and long-term growth, and accordingly, the primary measures of performance are annual dividend growth, earnings per common share growth, adjusted earnings per common share growth (a non-GAAP measure described in the Non-GAAP Financial Measures section below) and total shareholder return. The Company targets eight per cent annual dividend growth through 2020. Emera targets achieving a minimum of 75 per cent of its adjusted net income from its rate-regulated utilities and an average dividend payout ratio of 70 to 75 per cent of adjusted net income.
| For the | Year ended December 31, 2017 | |||||||||||
| 1 year | 3 year | 5 year | ||||||||||
| Dividend per share compound annual growth rate |
6.5% | 12.9% | 9.4% | |||||||||
| Earnings per share compound annual growth rate |
(6.0%) | (23.9%) | (6.7%) | |||||||||
| Adjusted earnings per share compound annual growth rate (see Non-GAAP Financial Measures below) |
(11.2%) | 3.3% | 5.9% | |||||||||
| Emera annualized total shareholder return (1) |
8.3% | 11.2% | 11.0% | |||||||||
| S&P/TSX Capped Utilities Index annualized total shareholder return (2) |
10.7% | 7.6% | 7.0% | |||||||||
| (1) | Total shareholder return combines share price appreciation and dividends per common share paid during the fiscal year to show the total return to the shareholder expressed as an annualized percentage, assuming dividends are reinvested each time they are paid. |
| (2) | The S&P/TSX Capped Sector Indices provide liquid and tradable benchmarks for related derivative products of Canadian economic sectors. Constituents are selected from a stock pool of S&P/TSX Composite Index Stocks, and the relative weight of any single index constituent is capped at 25 per cent. The indices are based upon the Global Industry Classification Standards (GICS®). The S&P/TSX Capped Utilities Index imposes capped weights on the index constituents included in the S&P/TSX Composite that are classified in the GICS® utilities sector. |
Energy markets worldwide, in particular across North America, are undergoing foundational changes that have created significant investment opportunities for companies with Emera’s experience and capabilities. Key trends contributing to these investment opportunities include: aging infrastructure, lower-cost natural gas, growing demand for new electric heating and cooling solutions, the requirement for large-scale transmission projects to deliver new energy sources to customers, technological developments, and environmental concerns. These environmental concerns include a desire to reduce emissions of carbon dioxide and other greenhouse gases and the potential system impacts of climate change, including changes in global and regional weather patterns, changes in the frequency and intensity of extreme weather events, and rising sea levels. At the core of Emera’s utilities strategy is identifying opportunities to invest in the transition from higher-carbon methods of electricity generation to lower-carbon alternatives, and the related transmission and distribution infrastructure to deliver that energy to market.
The energy sector continues to be impacted by mandated and incented carbon reductions throughout eastern North America and in the Caribbean. It is unclear whether economic volatility, government policy and lower fossil fuel prices will slow the pace of this change in the industry. Investment in wind, solar, and hydro generation, natural gas and new transmission infrastructure is likely to continue across the sector despite any cost differential with more carbon-intensive generating options. The capital spending requirements related to these investments will need to be managed within the context of overall energy pricing.
In Florida, the Company is evaluating and investing in a number of initiatives, including solar generation, that would reduce carbon emissions. In Nova Scotia, the Company has invested in wind energy, biomass and hydroelectricity and is on track to meet a minimum 40 per cent renewable standard by 2020. In the Caribbean, Emera is similarly focused on introducing cleaner generation alternatives, with an emphasis on affordability and fuel cost stability for its customers.
Emera is investing in electricity transmission to deliver new renewable energy to market. Emera’s ownership in the Maritime Link and Labrador Island Link projects will contribute to the transformation of the electricity market in the Atlantic provinces, enabling growth in the availability of clean, renewable energy for the region. In addition, the Atlantic provinces will benefit from enhanced connection to the northeastern United States, providing potential for excess renewable energy to be delivered throughout that region.
Emera Energy is a physical energy marketing and trading business, complemented by a portfolio of competitive electricity generation facilities. A substantial portion of Emera Energy’s activities are in northeastern North America, and its market knowledge, focus on customer service and robust risk management are key success factors. Unlike the vast majority of Emera’s businesses, Emera Energy is not rate-regulated.
Emera’s ability to achieve its strategy is a result of its ability to apply a collaborative approach to strategic partnerships, ability to find creative solutions within and across multiple jurisdictions and its experience dealing with complex projects and investment structures. The Company will continue to make investments in its regulated utilities to benefit customers and focus on providing rate stability. From time to time, Emera will make acquisitions, both regulated and unregulated, where the business or asset acquired aligns with Emera’s strategic initiatives and delivers shareholder value.
Emera Inc. — Annual Report 2017 11
Table of Contents
To ensure stability in the utilities’ net income and cash flows, Emera employs operating and governance models that focus on safety and operational excellence, a customer focus through service reliability and rate stability, constructive regulatory approaches, and proactive stakeholder engagement.
Emera has grown its asset base to deliver on its strategic objectives. Over the last 10 years, Emera’s ability to raise the capital necessary to fund investments has been a strong enabler of the Company’s growth. In addition to access to debt and equity capital markets, cash flow from operations will continue to play a role in financing the Company’s future growth. Maintaining strong, investment grade credit ratings is an important component of Emera’s financing strategy.
The energy industry is seasonal in nature. Seasonal patterns and other weather events, including the number and severity of storms, can affect demand for energy and cost of service. Similarly, mark-to-market adjustments and foreign currency exchange can have a material impact on the financial results for a specific period. Results in any one quarter are not necessarily indicative of results in any other quarter, or for the year as a whole.
The effect of foreign currency exchange on Emera’s net income is noteworthy, as it is expected that approximately 70 per cent of Emera’s adjusted net income will be derived from subsidiaries with a US functional currency. Emera’s consolidated net income and cash flows will be impacted by movements in the US dollar relative to the Canadian dollar. In general, Emera benefits from a weakening Canadian dollar and is adversely impacted by a strengthening Canadian dollar.
12 Emera Inc. — Annual Report 2017
Table of Contents
Management’s Discussion & Analysis
Emera uses financial measures that do not have standardized meaning under USGAAP and may not be comparable to similar measures presented by other entities. Emera calculates the non-GAAP measures by adjusting certain GAAP measures for specific items the Company believes are significant, but not reflective of underlying operations in the period. These measures are discussed and reconciled below.
Adjusted Net Income
Emera calculates an adjusted net income measure by excluding the effect of MTM adjustments and the impact in 2017 of US tax reform, signed into legislation on December 22, 2017 in the US Tax Cuts and Jobs Act of 2017 (“the Act”) (refer to the “Developments” section for further details).
The MTM adjustments are a result of the following:
| • | the mark-to-market adjustments related to Emera’s held-for-trading (“HFT”) commodity derivative instruments, including adjustments related to the price differential between the point where natural gas is sourced and where it is delivered; |
| • | the mark-to-market adjustments included in Emera’s equity income related to the business activities of Bear Swamp Power Company LLC (“Bear Swamp”); |
| • | the amortization of transportation capacity recognized as a result of certain Emera Energy marketing and trading transactions; |
| • | the mark-to-market adjustments related to an interest rate swap in Brunswick Pipeline; and |
| • | the mark-to-market adjustments included in Emera’s other income in 2016 related to the effect of USD-denominated currency and forward contracts for the TECO Energy, Inc. (“TECO Energy”) acquisition. These contracts were put in place to economically hedge the anticipated proceeds from the 2015 sale of $2.185 billion four-per-cent convertible unsecured subordinated debentures represented by instalment receipts (“the Debenture Offering” or “Debentures” or “Convertible Debentures”). |
The US tax reform adjustment is a result of the estimated revaluation of US non-regulated net deferred income tax assets as a result of the US federal corporate income tax rate reduction from 35 per cent to 21 per cent that was enacted in December 2017.
For the mark-to-market valuation adjustments, management believes excluding from net income the effect of these valuations and changes thereto, until settlement, better aligns the intent and financial effect of these contracts with the underlying cash flows and the ongoing operations of the business, and allows investors to better understand and evaluate the business. Management and the Board of Directors exclude these mark-to-market adjustments for evaluation of performance and incentive compensation.
Mark-to-market adjustments are further discussed in the Consolidated Financial Review section, Emera Energy and Corporate and Other.
Due to the enactment of the US Tax Cuts and Jobs Act of 2017, the Company recorded a non-cash income tax expense resulting from the provisional revaluation of the existing US non-regulated net deferred income tax assets. This provisional revaluation of an existing asset is not the result of any operational or market driven event. Management therefore believes excluding from net income the effect of this provisional revaluation better distinguishes the ongoing operations of the business, and allows investors to better understand and evaluate the Company. The impact of US tax reform is further discussed in the “Developments” section.
The following reconciles reported net income attributable to common shareholders, to adjusted net income attributable to common shareholders; and reported earnings per common share – basic, to adjusted earnings per common share – basic:
| Three months ended | Year ended | |||||||||||||||||||
| For the | December 31 | December 31 | ||||||||||||||||||
| millions of Canadian dollars (except per share amounts) | 2017 | 2016 | 2017 | 2016 | 2015 | |||||||||||||||
| Net income (loss) attributable to common shareholders |
$ | (228 | ) | $ | 70 | $ | 266 | $ | 227 | $ | 397 | |||||||||
| Revaluation of US non-regulated deferred income taxes |
$ | (317 | ) | $ | — | $ | (317 | ) | $ | — | $ | — | ||||||||
| After-tax mark-to-market gain (loss) |
$ | (48 | ) | $ | (34 | ) | $ | 59 | $ | (248 | ) | $ | 67 | |||||||
| Adjusted net income attributable to common shareholders |
$ | 137 | $ | 104 | $ | 524 | $ | 475 | $ | 330 | ||||||||||
| Earnings per common share – basic |
$ | (1.06 | ) | $ | 0.34 | $ | 1.25 | $ | 1.33 | $ | 2.72 | |||||||||
| Adjusted earnings per common share – basic |
$ | 0.64 | $ | 0.51 | $ | 2.46 | $ | 2.77 | $ | 2.26 | ||||||||||
Emera Inc. — Annual Report 2017 13
Table of Contents
EBITDA and Adjusted EBITDA
Earnings before interest, income taxes, depreciation and amortization (“EBITDA”) is a non-GAAP financial measure used by Emera. EBITDA is used by numerous investors and lenders to better understand cash flows and credit quality. EBITDA is useful to assess Emera’s operating performance and indicates the Company’s ability to service or incur debt, invest in capital and finance working capital requirements.
Adjusted EBITDA is a non-GAAP financial measure used by Emera. Similar to adjusted net income calculations described above, this measure represents EBITDA absent the income effect of Emera’s mark-to-market adjustments.
The Company’s EBITDA and Adjusted EBITDA may not be comparable to the EBITDA measures of other companies but in management’s view appropriately reflects Emera’s specific operating performance. These measures are not intended to replace “Net income attributable to common shareholders” which, as determined in accordance with GAAP, is an indicator of operating performance.
EBITDA and Adjusted EBITDA are discussed further in the Consolidated Financial Review, Emera Florida and New Mexico, NSPI, Emera Maine, Emera Caribbean, Emera Energy, and Corporate and Other sections.
The following is a reconciliation of reported net income to EBITDA and Adjusted EBITDA.
| Three months ended | Year ended | |||||||||||||||||||
| For the | December 31 | December 31 | ||||||||||||||||||
| millions of Canadian dollars | 2017 | 2016 | 2017 | 2016 | 2015 | |||||||||||||||
| Net income(loss) (1) |
$ | (232 | ) | $ | 71 | $ | 299 | $ | 266 | $ | 452 | |||||||||
| Interest expense, net |
175 | 169 | 698 | 585 | 212 | |||||||||||||||
| Income tax expense (recovery) |
329 | (6 | ) | 520 | (22 | ) | 93 | |||||||||||||
| Depreciation and amortization |
212 | 212 | 856 | 588 | 340 | |||||||||||||||
| EBITDA |
484 | 446 | 2,373 | 1,417 | 1,097 | |||||||||||||||
|
Mark-to-market gain (loss), excluding income tax and interest |
(75 | ) | (52 | ) | 78 | (327 | ) | 66 | ||||||||||||
| Adjusted EBITDA |
$ | 559 | $ | 498 | $ | 2,295 | $ | 1,744 | $ | 1,031 | ||||||||||
| (1) | Net income (loss) is income before Non-controlling interest in subsidiaries and Preferred stock dividends. |
14 Emera Inc. — Annual Report 2017
Table of Contents
Management’s Discussion & Analysis
Significant Items Affecting Earnings
2017
US Tax Reform
On December 22, 2017, the Tax Cuts and Jobs Act of 2017 (the “Act”) was signed into legislation. As a result of this legislation being enacted during 2017, the Company is required to revalue its US deferred income tax assets and liabilities based on the new 21 per cent tax rate. The Company has recognized an estimated $317 million income tax expense in 2017 as a result of the provisional revaluation of its US non- regulated net deferred income tax assets. There was no impact to earnings on the revaluation of the utilities net deferred tax liabilities as the Act allows for an offsetting regulatory liability. Refer to the “Developments” section for further details.
Earnings Impact of After-Tax Mark-to-Market Gains and Losses
After-tax mark-to-market losses increased $14 million to $48 million in Q4 2017 compared to $34 million in Q4 2016 mainly due to changes in existing positions on contracts at Emera Energy. Year-to-date, after-tax mark-to-market increased $307 million to a $59 million gain in 2017 compared to a $248 million loss for the same period in 2016. 2016 year-to-date included a $116 million loss resulting from the reversal of 2015 gains on USD-denominated currency and forward contracts related to the financing of the TECO Energy acquisition. Other factors contributing to the increase include changes in existing positions on long-term contracts at Emera Energy, and the reversal of 2016 mark-to-market losses at Emera Energy.
2016
Acquisition Related Costs
Emera incurred after-tax costs of $166 million ($0.97 per common share) in 2016 related to its acquisition of TECO Energy. All acquisition costs were recognized in the Corporate and Other segment.
Investment in Algonquin Power and Utilities Corp.
On December 8, 2016, Emera completed the sale of 12.9 million common shares of Algonquin Power and Utilities Corp. (“APUC”), representing approximately 4.7 per cent of APUC’s issued and outstanding common shares, for gross proceeds of $142 million. This sale resulted in a pre-tax loss of $12 million or $0.07 per common share (after-tax loss of $10 million or $0.06 per common share), which was recorded in “Other income (expenses), net” in Q4 2016. Emera no longer holds any interest in APUC.
On June 30, 2016, Emera exchanged 12.9 million APUC subscription receipts and dividend equivalents into 12.9 million APUC common shares. This conversion resulted in a pre-tax gain of $63 million or $0.42 per common share (after-tax gain of $53 million or $0.35 per common share), which was recorded in “Other income (expenses), net” in Q2 2016.
On May 24, 2016, Emera completed the sale of 50.1 million common shares of APUC, representing approximately 19.3 per cent of APUC’s issued and outstanding common shares, for gross proceeds of $544 million. This sale resulted in a pre-tax gain of $172 million or $1.15 per common share (after-tax gain of $146 million or $0.97 per common share), which was recorded in “Other income (expenses), net” in Q2 2016.
Gain on BLPC Self-Insurance Fund Regulatory Liability
BLPC maintains a Self-Insurance Fund (“SIF”) for the purpose of building an insurance fund to cover risk against damage and consequential loss to certain of BLPC’s generating, transmission and distribution systems. Third-party risk advisors were engaged to support a detailed risk analysis, which was completed to quantify the prudent assessment of the risk to BLPC’s transmission and distribution system from natural catastrophes.
In June 2016, BLPC secured support from the Government of Barbados and the Trustees of the SIF to reduce the contingency funding in the SIF to $29 million ($22 million USD). As a result, Emera recorded a pre-tax gain of $53 million ($41 million USD) or $0.35 per common share and an after-tax gain of $43 million ($34 million USD) or $0.29 per common share in “Other income (expenses), net”. In Q3 2016, Emera received a distribution of $65 million ($50 million USD) from the fund.
Emera Energy Recognition of State Fuel Taxes
In Q2 2016, Emera Energy recorded a $20 million pre-tax or $0.13 per common share ($12 million after-tax or $0.08 per common share) liability for state tax on natural gas sales made from November 2013 through March 2016, including $4 million pre-tax ($2 million after-tax) related to Q1 2016. The recognition of this liability resulted in an increase to “Non-regulated fuel for generation and purchased power”.
Emera Inc. — Annual Report 2017 15
Table of Contents
Consolidated Financial Highlights
| For the millions of Canadian dollars (except per share amounts) |
Three months ended December 31 |
Year ended December 31 |
||||||||||||||||||
| Adjusted Net Income | 2017 | 2016 | 2017 | 2016 | 2015 | |||||||||||||||
| Emera Florida and New Mexico |
$ | 80 | $ | 63 | $ | 382 | $ | 172 | $ | — | ||||||||||
| NSPI |
23 | 34 | 129 | 130 | 130 | |||||||||||||||
| Emera Maine |
8 | 11 | 46 | 47 | 45 | |||||||||||||||
| Emera Caribbean |
1 | 8 | 31 | 100 | 41 | |||||||||||||||
| Emera Energy |
26 | 5 | 24 | 24 | 130 | |||||||||||||||
| Corporate and Other |
(1 | ) | (17 | ) | (88 | ) | 2 | (16 | ) | |||||||||||
| Adjusted net income attributable to common shareholders |
$ | 137 | $ | 104 | $ | 524 | $ | 475 | $ | 330 | ||||||||||
| Revaluation of US non-regulated deferred income taxes |
(317 | ) | — | (317 | ) | — | — | |||||||||||||
| After-tax mark-to-market gain (loss) |
(48 | ) | (34 | ) | 59 | (248 | ) | 67 | ||||||||||||
| Net income (loss) attributable to common shareholders |
$ | (228 | ) | $ | 70 | $ | 266 | $ | 227 | $ | 397 | |||||||||
| For the millions of Canadian dollars (except per share amounts) |
Three months ended December 31 |
Year ended December 31 |
||||||||||||||||||
| 2017 | 2016 | 2017 | 2016 | 2015 | ||||||||||||||||
| Operating revenues |
$ | 1,473 | $ | 1,513 | $ | 6,226 | $ | 4,277 | $ | 2,789 | ||||||||||
| Income from operations |
236 | 208 | 1,391 | 555 | 508 | |||||||||||||||
| Net income (loss) attributable to common shareholders |
(228 | ) | 70 | 266 | 227 | 397 | ||||||||||||||
| Revaluation of US non-regulated deferred income taxes |
(317 | ) | — | (317 | ) | — | — | |||||||||||||
| After-tax mark-to-market gain (loss) |
(48 | ) | (34 | ) | 59 | (248 | ) | 67 | ||||||||||||
| Adjusted net income attributable to common shareholders |
$ | 137 | $ | 104 | $ | 524 | $ | 475 | $ | 330 | ||||||||||
| Earnings per common share – basic |
$ | (1.06 | ) | $ | 0.34 | $ | 1.25 | $ | 1.33 | $ | 2.72 | |||||||||
| Earnings per common share – diluted |
$ | (1.06 | ) | $ | 0.34 | $ | 1.24 | $ | 1.32 | $ | 2.71 | |||||||||
| Adjusted earnings per common share – basic |
$ | 0.64 | $ | 0.51 | $ | 2.46 | $ | 2.77 | $ | 2.26 | ||||||||||
| Dividends per common share declared |
$ | — | $ | — | $ | 2.1325 | $ | 1.9950 | $ | 1.6625 | ||||||||||
| Adjusted EBITDA |
$ | 559 | $ | 498 | $ | 2,295 | $ | 1,744 | $ | 1,031 | ||||||||||
16 Emera Inc. — Annual Report 2017
Table of Contents
Management’s Discussion & Analysis
The following table highlights the significant changes in adjusted net income from 2016 to 2017:
| For the | Three months ended | Year ended | ||||||||||||||
| millions of Canadian dollars | December 31 | December 31 | ||||||||||||||
| Adjusted net income – 2016 |
$ | 104 | $ | 475 | ||||||||||||
| Emera Florida and New Mexico |
17 | 210 | ||||||||||||||
| 2016 acquisition and financing costs related to the acquisition of TECO Energy |
(13 | ) | 166 | |||||||||||||
| NSPML and LIL AFUDC earnings |
6 | 28 | ||||||||||||||
| 2016 Emera Energy’s recognition of fuel taxes for 2013 to March 2016 |
— | 12 | ||||||||||||||
| NSPI |
(11 | ) | (1 | ) | ||||||||||||
| Emera Energy |
21 | (12 | ) | |||||||||||||
| APUC equity earnings – sold in 2016 |
— | (18 | ) | |||||||||||||
| Emera Caribbean |
(7 | ) | (26 | ) | ||||||||||||
| 2016 gain on BLPC SIF regulatory liability |
— | (43 | ) | |||||||||||||
| 2016 gain on conversion of APUC subscription receipts and dividend equivalents to common shares of APUC |
— | (53 | ) | |||||||||||||
| TECO Energy post-acquisition financing costs |
— | (83 | ) | |||||||||||||
| 2016 gain/loss on sale of APUC common shares |
10 | (136 | ) | |||||||||||||
| Other |
10 | 5 | ||||||||||||||
| Adjusted net income – 2017 |
$ | 137 | $ | 524 | ||||||||||||
| For the | Year ended December 31 |
|||||||||||||||
| millions of Canadian dollars | 2017 | 2016 | 2015 | |||||||||||||
| Operating cash flow before changes in working capital |
$ | 1,297 | $ | 919 | $ | 776 | ||||||||||
| Change in working capital |
(104 | ) | 134 | (102 | ) | |||||||||||
| Operating cash flow |
$ | 1,193 | $ | 1,053 | $ | 674 | ||||||||||
| Investing cash flow (1) |
$ | (1,761 | ) | $ | (9,037 | ) | $ | (124 | ) | |||||||
| Financing cash flow |
$ | 593 | $ | 7,448 | $ | 221 | ||||||||||
|
(1) These financial statements contain certain reclassifications of prior period amounts to be consistent with the current period presentation, with no effect on net income. |
|
|||||||||||||||
| As at | December 31 | |||||||||||||||
| millions of Canadian dollars | 2017 | 2016 | 2015 | |||||||||||||
| Total assets |
$ | 28,771 | $ | 29,221 | $ | 12,039 | ||||||||||
| Total long-term debt (including current portion) |
$ | 13,881 | $ | 14,744 | $ | 4,009 | ||||||||||
Emera Inc. — Annual Report 2017 17
Table of Contents
Q4 Consolidated Income Statement Highlights
Operational Results
Income from operations increased $28 million to $236 million in Q4 2017 compared to $208 million in the same quarter in 2016. Absent mark-to-market losses of $23 million, income from operations increased $51 million due to increased contributions from Emera Florida and New Mexico and Emera Energy.
Details of operating revenues and operating expenses line item variances are described below:
Total operating revenues decreased $40 million to $1,473 million in Q4 2017 compared to $1,513 million in Q4 2016. Absent mark-to-market losses of $13 million, operating revenues decreased $27 million due to:
| • | $17 million decrease from Emera Florida and New Mexico reflecting the impact of a stronger CAD. This decrease was partially offset by increased revenues at Tampa Electric reflecting customer growth and higher base rates offset by lower clause-related revenues; |
| • | $10 million decrease from Emera Utility Services (“EUS”) reflecting decreased project activity. |
Total operating expenses decreased $68 million to $1,237 million in Q4 2017 compared to $1,305 million in Q4 2016. This is primarily due to the impact of a stronger CAD, lower operating, maintenance and general (“OM&G”) expense at Emera Florida and New Mexico reflecting lower generation outage and maintenance costs, lower fuel expense at Tampa Electric and decreased natural gas purchases at Bayside Power reflecting the renegotiation of the Bayside Power PPA for the winter of 2017/2018.
Income tax expense (recovery)
Income tax expense increased $335 million to a $329 million expense in Q4 2017 compared to a $6 million recovery for the same period in 2016 primarily due to the estimated impact of the enacted US federal corporate income tax rate reduction from US tax reform (refer to the “Developments” section for further details) and increased income before provision for income taxes.
18 Emera Inc. — Annual Report 2017
Table of Contents
Management’s Discussion & Analysis
2017 Consolidated Income Statement and Operating Cash Flow Highlights
Operational Results
Income from operations increased $836 million to $1,391 million for the year ended December 31, 2017 compared to $555 million in 2016. Absent mark-to-market increases of $267 million, income from operations increased $569 million mainly due to the contribution of Emera Florida and New Mexico for the full year of 2017 and the 2016 costs related to the acquisition of TECO Energy.
Details of operating revenues and operating expenses line item variances are described below:
Total operating revenues increased $1,949 million to $6,226 million for the year ended December 31, 2017 compared to $4,277 million in the same period in 2016. Absent mark-to-market increases of $285 million, operating revenues increased $1,664 million due to:
| • | $1,784 million increase from Emera Florida and New Mexico as 2017 includes a full year of revenues; |
| • | $115 million decrease at Emera Energy Generation (“EEG”) reflecting lower hedged power prices in Q1 2017 compared to Q1 2016, decreased sales volumes driven by an unplanned outage at the Bridgeport Facility and less favourable market conditions in 2017. This decrease was partially offset by higher capacity revenue that came into effect for New England Gas Generating Facilities (“NEGG”) in June 2017. |
Total operating expenses increased $1,113 million to $4,835 million for the year ended December 31, 2017 compared to $3,722 million in 2016, primarily due to:
| • | $1,285 million increase from Emera Florida and New Mexico as 2017 includes a full year of expenses; |
| • | $116 million decrease in fuel expense at EEG due to decreased sales volumes reflecting an unplanned outage at the Bridgeport Facility, lower hedged natural gas prices in Q1 2017 compared to Q1 2016, the recognition of prior period state fuel taxes in Q2 2016 and less favourable market conditions in 2017; |
| • | $99 million decrease related to the 2016 TECO Energy acquisition costs. |
Other income (expenses), net
Other income decreased $172 million to $2 million for the year ended December 31, 2017 compared to $174 million in the same period in 2016. This was due to a $160 million gain on the 2016 sale of APUC common shares, a $63 million gain on the 2016 conversion of APUC subscription receipts and dividend equivalents into common shares, and a $53 million gain on the BLPC SIF regulatory liability in 2016. These 2016 gains were partially offset by $134 million of mark-to-market losses in 2016 relating to the TECO Energy acquisition related USD-denominated currency and forward contracts.
Interest expense, net
Interest expense, net increased $113 million for the year ended December 31, 2017 to $698 million compared to $585 million in 2016. This was due to interest expense from Emera Florida and New Mexico and financing related to the TECO Energy acquisition, partially offset by the interest and Beneficial Conversion Feature costs associated with the TECO Energy acquisition related Debentures in Q3 2016.
Income tax expense (recovery)
Income tax expense increased $542 million to a $520 million expense for the year ended December 31, 2017 compared to a $22 million recovery in 2016 primarily due to the estimated impact of the enacted US federal corporate income tax rate reduction, increased income before provision for income taxes and the non-taxable portion of gains on 2016 APUC transactions. This was partially offset by the non-deductible portion of foreign exchange and mark-to-market adjustments related to the TECO Energy acquisition in 2016.
Net cash provided by operating activities
Net cash provided by operating activities in 2017 increased $140 million to $1,193 million compared to $1,053 million during the same period in 2016.
Cash from operations before changes in working capital increased $378 million mainly due to the full year contribution from Emera Florida and New Mexico and acquisition and financing costs related to the TECO Energy acquisition in 2016, partially offset by increased financing costs in 2017 and decreases from Emera Energy.
Changes in working capital decreased operating cash flows by $238 million. This decrease was due to higher receivables at TEC as a result of higher sales, unfavourable changes in inventory, accounts payable and other current liabilities at NSPI compared to 2016 and refunds to customers in 2017 for fuel clause over-recoveries collected in 2016 at TEC.
Emera Inc. — Annual Report 2017 19
Table of Contents
Effect of Foreign Currency Translation
Emera operates globally, including in Canada, the US and various Caribbean countries. As such, the Company generates revenues and incurs expenses denominated in local currencies which are translated into Canadian dollars for financial reporting. Changes in translation rates, particularly in the value of the US dollar against the Canadian dollar, can positively or adversely affect results.
Earnings from Emera’s foreign operations are translated into Canadian dollars. In general, Emera’s earnings benefit from a weakening Canadian dollar and are adversely impacted by a strengthening Canadian dollar. The impact of foreign exchange in any period is driven by rate changes, the timing of earnings from foreign operations during the period and the percentage of earnings from foreign operations in the period.
Results of operations from foreign operations are translated at the weighted average rate of exchange and assets and liabilities of foreign operations are translated at period end rates. The relevant CAD/US exchange rates for 2017 and 2016 are as follows:
| Three months ended | Year ended | |||||||||||||||
| December 31 | December 31 | |||||||||||||||
| 2017 | 2016 | 2017 | 2016 | |||||||||||||
| Weighted average CAD/USD exchange rate |
$ | 1.27 | $ | 1.32 | $ | 1.30 | $ | 1.32 | ||||||||
| Period end CAD/USD exchange rate |
$ | 1.25 | $ | 1.34 | $ | 1.25 | $ | 1.34 | ||||||||
Changes in foreign exchange, due primarily to the strengthening of the CAD, decreased losses by $11 million and decreased adjusted earnings by $5 million in Q4 2017 compared to Q4 2016. The strengthening of the CAD decreased earnings by $5 million and adjusted earnings by $10 million in 2017 compared to 2016.
Consistent with the Company’s risk management policies, Emera partially manages currency risks through matching US denominated debt to finance its US operations and uses short-term foreign currency derivative instruments to hedge specific transactions. Emera does not utilize derivative financial instruments for foreign currency trading or speculative purposes.
The table below includes Emera’s significant segments whose contributions to adjusted earnings are recorded in US dollar currency.
| Three months ended | Year ended | |||||||||||||||
| December 31 | December 31 | |||||||||||||||
| millions of Canadian dollars | 2017 | 2016 | 2017 | 2016 | ||||||||||||
| Emera Florida and New Mexico |
$ | 63 | $ | 47 | $ | 295 | $ | 131 | ||||||||
| Emera Maine |
7 | 9 | 36 | 36 | ||||||||||||
| Emera Caribbean |
1 | 6 | 24 | 77 | ||||||||||||
| Emera Energy (1) |
8 | 5 | 15 | 25 | ||||||||||||
| 79 | 67 | 370 | 269 | |||||||||||||
| Corporate and Other (2) |
(29 | ) | (29 | ) | (116 | ) | (59 | ) | ||||||||
| Total (3) |
$ | 50 | $ | 38 | $ | 254 | $ | 210 | ||||||||
| (1) | Includes Emera Energy’s US dollar adjusted net income from Emera Energy Services, NEGG and Bear Swamp. |
| (2) | Corporate and Other includes interest expense on US dollar denominated debt, net of interest income on an intercompany US dollar loan to Emera Energy. |
| (3) | Amounts above do not include the impact of marked-to-market or tax reform. |
20 Emera Inc. — Annual Report 2017
Table of Contents
Management’s Discussion & Analysis
Emera Florida and New Mexico includes the following:
| • | TECO Energy, the parent of the companies discussed below. |
| • | TEC, which consists of two divisions: |
| • | Tampa Electric, a vertically-integrated regulated electric utility engaged in the generation, transmission and distribution of electricity serving customers in West Central Florida; and |
| • | PGS, a regulated gas distribution utility engaged in the purchase, distribution and sale of natural gas for residential, commercial, industrial and electric power generation customers in Florida. |
| • | NMGC, a regulated gas distribution utility engaged in the purchase, transmission, distribution and sale of natural gas for residential, commercial and industrial customers in New Mexico. |
| • | TECO Finance, a financing subsidiary of TECO Energy. |
Tampa Electric
With nearly $7.2 billion USD of assets and approximately 750,000 customers at December 31, 2017, Tampa Electric owns 5,218 megawatts (“MW”) of generating capacity, of which 64 per cent is natural gas-fired, 31 per cent is conventional coal-fired, 4 per cent coal and petroleum coke (“petcoke”) and 1 per cent solar. Tampa Electric owns 2,140 kilometres of transmission facilities and 18,550 kilometres of distribution facilities.
Tampa Electric’s target regulated return on equity (“ROE”) range is 9.25 per cent to 11.25 per cent, on an allowed equity capital structure of 54 per cent. An ROE of 10.25 per cent is used for the calculation of the return on investments for clauses.
Peoples Gas System
With more than $1.2 billion USD of assets and approximately 375,000 customers, the PGS system includes approximately 20,380 kilometres of natural gas mains and 11,550 kilometres of service lines. Natural gas throughput (the amount of gas delivered to its customers, including transportation-only service) was 1.8 billion therms in 2017.
The allowed ROE range for PGS is 9.25 per cent to 11.75 per cent, on an allowed equity capital structure of 54.7 per cent. Absent any rate case filing, the bottom of the range will increase to 9.75 per cent in 2021. An ROE of 10.75 per cent is used for the calculation of return on investments for clauses.
New Mexico Gas Company, Inc.
With over $0.9 billion USD of assets and approximately 525,000 customers, NMGC serves about 60 per cent of the state’s population in 23 of New Mexico’s 33 counties. NMGC’s system includes approximately 2,650 kilometres of transmission lines and 16,670 kilometres of mains. Annual natural gas throughput is approximately 750 million therms.
The allowed ROE for NMGC is 10 per cent, on an allowed equity capital structure of 52 per cent. NMGC’s rates were established in a 2012 rate case settlement and were frozen until December 31, 2017 per the June 2016 NMPRC order ( the “Order”) approving Emera’s acquisition of TECO Energy. Under the Order, NMGC will also provide customer credits of $4 million USD annually through June 30, 2018. NMGC expects to file a rate case in 2018 with new rates effective approximately 12 months after filing, subject to NMPRC approval.
Emera Florida and New Mexico Outlook
Emera Florida and New Mexico earnings are most directly impacted by the rate of return on equity and the capital structures approved by the FPSC and NMPRC, the prudent management of operating costs, the approved recovery of regulatory deferrals, weather and its impact on energy demand and the timing and amount of capital expenditures.
The Florida utilities anticipate earning within their allowed ROE ranges in 2018 and expect rate base and earnings to be higher than prior years. Tampa Electric expects customer growth rates in 2018 to be in line with 2017, reflective of economic growth in Florida. PGS expects customer growth rates in 2018 to be higher than 2017, reflective of economic growth in Florida and the optimization of existing gas main opportunities. Assuming normal weather, sales volumes are expected to increase consistent with customer growth.
In September 2017, Tampa Electric announced its intention to invest approximately $850 million USD over four years in new utility-scale solar photovoltaic projects across its service territory. A settlement agreement was filed with the FPSC requesting a base rate adjustment that provides for the recovery, upon in-service, of up to 600 MW of investments in utility-scale solar projects that will be phased in from late 2018 through early 2021. On November 6, 2017, the FPSC approved the settlement agreement. On December 12, 2017 Tampa Electric filed its petition along with supporting tariffs demonstrating the cost-effectiveness of the September 1, 2018 solar base rate adjustment (“SoBRA”) representing 145 MW and $26 million in estimated revenue requirements. A decision by the FPSC to approve the tariffs on the first SoBRA filing is anticipated in the spring of 2018. Refer to the “Developments” for further details.
Emera Inc. — Annual Report 2017 21
Table of Contents
In September 2017, Tampa Electric was impacted by Hurricane Irma. The majority of Hurricane Irma restoration costs will be charged against Tampa Electric’s FPSC approved storm reserve, resulting in minimal impact on 2017 earnings. Estimated total restoration costs are $105 million USD with $93 million USD charged to the storm reserve, $8 million USD charged to capital expenditures and $4 million USD in OM&G expense. The increase in estimated storm costs from the $70 million estimated at the end of Q3 2017 is due to higher than expected mutual assistance and contractor costs. Tampa Electric petitioned the FPSC on December 28, 2017 for recovery of estimated restoration costs in excess of the reserve for several named storms including Hurricane Irma and to replenish the balance in the reserve to the $56 million USD level that existed as of October 31, 2013. An amended petition was filed with the FPSC on January 30, 2018.
On December 22, 2017, tax reform changes were signed into legislation. It is expected there will be no material change in Tampa Electric, PGS or NMGC earnings as the reduction in the federal income tax rate will be offset by lower customer rates over time and the revaluation of the existing net deferred tax liabilities, were offset with a regulatory liability, which will be returned to customers over time. The Tampa Electric solar settlement agreement provides for the impacts of tax reform to be offset by a reduction in base revenues through the adjustment of customer rates within 120 days of when tax reform became law. PGS and NMGC will address the impacts of tax reform through their normal regulatory process. On January 9, 2018, the Florida Office of Public Counsel (“OPC”) filed a petition with the FPSC requesting the FPSC to adjust rates for all utilities in Florida to reflect the reduction in the tax rate.
On January 30, 2018, Tampa Electric filed with the FPSC a settlement agreement which, if approved, will allow Tampa Electric to net the estimated amount of storm cost recovery against the utility’s estimated 2018 tax reform benefits. Any difference would be trued up and recovered from or returned to customers in 2019. Beginning in January 2019 Tampa Electric would reflect the full impact of tax reform on Tampa Electric’s base rates, provided that the FPSC’s determinations have been finalized. A decision is expected in March 2018.
NMGC expects earnings to be consistent with prior years. Customer growth rates are expected to be consistent with 2017, reflecting expectations for housing starts and new connections. NMGC plans to file a rate case in 2018.
In 2018, Emera Florida and New Mexico expects to invest approximately $1.3 billion USD, including allowance for funds used during construction (“AFUDC”), in capital projects compared to $700 million USD in 2017. Capital projects support normal system reliability and growth at the three utilities, including capital projects at Tampa Electric for transmission and distribution storm hardening. The increase over 2017 is primarily due to significant investment in the solar photovoltaic projects at Tampa Electric. PGS will make investments to expand its system and support customer growth, and continue with replacement of obsolete plastic, cast iron and bare steel pipe. NMGC will complete a project to relocate a portion of the gas pipeline feeding Taos, New Mexico, and will continue to invest in system improvements by replacing legacy pipe and making pipeline integrity management improvements.
22 Emera Inc. — Annual Report 2017
Table of Contents
Management’s Discussion & Analysis
NSPI is a fully-integrated regulated electric utility and is the primary electricity supplier in Nova Scotia, Canada. NSPI has $5.0 billion of assets and provides electricity generation, transmission and distribution services to approximately 515,000 customers. The Company owns 2,488 MW of generating capacity, of which approximately 43 per cent is coal-fired; 29 per cent is natural gas and/or oil; 19 per cent is hydro and wind;
7 per cent is petcoke and 2 per cent is biomass-fueled generation. In addition, NSPI has contracts to purchase renewable energy from independent power producers (“IPP”). These IPPs own 544 MW of capacity. This is expected to increase to 560 MW of capacity in 2018. IPP generation includes wind, tidal, biogas and biomass-fueled generation. NSPI owns approximately 5,000 kilometres of transmission facilities and 27,000 kilometres of distribution facilities.
NSPI’s earnings are most directly impacted by the range of ROE and capital structure approved by the UARB; the prudent management and approved recovery of operating costs, load demand, weather, the approved recovery of regulatory deferrals and the timing and amount of capital expenditures.
NSPI’s approved regulated ROE range is 8.75 per cent to 9.25 per cent, based on an actual five-quarter average regulated common equity component of up to 40 per cent. NSPI anticipates earning within its allowed ROE range in 2018 and expects modest rate base growth which will deliver a similar modest increase in earnings.
In December 2015, the Electricity Plan Act was enacted by the Province of Nova Scotia with a goal of providing rate stability and predictability for customers for the 2017 through 2019 period. NSPI is currently operating under a Rate Stability Plan for fuel costs for 2017 through 2019 which includes an average annual rate increase of 1.5 per cent for each of these three years.
Although the market in Nova Scotia is otherwise mature, the transformation of energy supply to lower emission sources has driven organic growth within NSPI as investments have been made in renewable generation and system reliability projects.
NSPI is subject to environmental regulations as set by both the Province of Nova Scotia and the Government of Canada. The Company continues to work with officials at both of these levels of government to comply with these regulations in an integrated way, maximizing efficiency of emission control measures. Over the past several years, the requirement to reduce Nova Scotia’s reliance upon higher carbon and greenhouse gas emitting sources of energy has resulted in NSPI making a significant investment in renewable energy sources and purchasing third party renewable energy.
In December 2016, the Government of Canada and eight provinces (including Nova Scotia) signed the Pan-Canadian Framework on Clean Growth and Climate Change. The Government of Canada has committed to ensuring that the provinces and territories have the flexibility to design their own policies and programs to meet emission-reduction targets, supported by federal investments in infrastructure, specific emission-reduction opportunities and clean technologies. Nova Scotia and the Government of Canada will establish a new equivalency agreement that will enable the province to move from fossil fuels to clean energy sources and enable NSPI’s coal-fired plants to operate at some capacity beyond 2030. NSPI anticipates that any costs prudently incurred to achieve the legislated reductions will be recoverable from customers under NSPI’s regulatory framework. The future earnings impact of the carbon emission reduction strategy being developed from the Pan-Canadian Framework on Clean Growth and Climate Change is unknown.
In October 2017, the Province of Nova Scotia passed amendments to the Environment Act to enable the development of a cap-and-trade program for carbon emissions. NSPI anticipates that any costs prudently incurred to achieve the legislated reductions will be recoverable from customers under NSPI’s regulatory framework. NSPI continues to work with the Province of Nova Scotia on details of the carbon emission reduction agreements and to advance solutions that are in the best interest of customers.
In September 2017, the UARB approved NSPI’s interim assessment payment to NSPML of the costs associated with the Maritime Link starting when the Maritime Link is in service. The Maritime Link completed commissioning and entered service on January 15, 2018. In response to the delayed timing of energy delivery from the Muskrat Falls project, the approved interim assessment payment reflects NSPML’s proposal to reduce the assessment by deferring $53 million in each of 2018 and 2019, related to depreciation and amortization expenses. As these amounts are included in NSPI’s 2017, 2018 and 2019 fuel rates and are being recovered from customers, NSPI will provide a one-time credit to customers, including interest, in 2018 of approximately $17 million, in 2019 of approximately $36 million and in 2020 of approximately $53 million of these recoveries from customers, as the payments from NSPI to NSPML are not required in those years.
NSPI is also required to hold back $10 million from the interim assessment payment to NSPML in each of 2018 and 2019. The release of such amounts is subject to providing evidence to the UARB that at least that amount of benefit from the Maritime Link has been realized for NSPI customers in that year. If the $10 million in benefits is realized, the UARB will direct NSPI to pay the $10 million to NSPML for that year. If not realized, then the UARB will direct NSPI to pay to NSPML only that portion that is realized and the balance will be refunded to customers through NSPI’s Fuel Adjustment Mechanism (“FAM”).
In 2018, NSPI expects to invest approximately $360 million, including AFUDC, in capital projects compared to $392 million in 2017. Capital will primarily be invested in projects which will support normal system reliability, with the decrease from 2017 driven by a reduction in spending on information technology and transmission projects.
Emera Inc. — Annual Report 2017 23
Table of Contents
Emera Maine is a transmission and distribution (“T&D”) electric utility with assets of approximately $1.2 billion serving approximately 158,000 customers in the State of Maine. Emera Maine owns and operates approximately 1,800 kilometres of transmission facilities and 15,000 kilometres of distribution facilities. Electricity generation is deregulated in Maine, and several suppliers compete to provide customers with the energy delivered through Emera Maine’s T&D networks.
Approximately 54 per cent of Emera Maine’s electric revenue represents distribution operations, 33 per cent is associated with local transmission operations and 13 per cent relates to stranded cost recoveries. The rates for each element are established in distinct regulatory proceedings.
Emera Maine’s earnings are most directly impacted by the range of rates of ROE and rate base approved by its regulators, the prudent management and approved recovery of operating costs, load (including the effects of weather), and the timing and amount of capital expenditures.
Emera Maine’s 2018 rate base is expected to grow modestly due to ongoing investment in transmission and distribution infrastructure, resulting in modest growth in earnings.
On December 22, 2017, tax reform changes were signed into legislation. It is expected there will be no material change in Emera Maine’s earnings as the reduction in the federal income tax rate will be offset by lower customer rates. The revaluation of the existing net deferred tax liabilities, at the new tax rate, were offset with a regulatory liability that will be returned to customers over time. Emera Maine will address the impacts of tax reform through their normal regulatory process.
There are currently four pending complaints filed with the FERC to challenge the ISO-New England (“ISO-NE”) Open Access Transmission Tariff-allowed based ROE. On June 19, 2014, in connection with the first complaint, the FERC set the base ROE at 10.57 per cent and capped the total ROE, including the effect of incentive adders, at 11.74 per cent. On April 14, 2017, the U.S. Court of Appeals for the District of Columbia Circuit vacated this order and remanded the case to the FERC for further proceedings. No changes in reserves have been made as a result of the Court of Appeals vacating the FERC Order, as the outcome is considered uncertain. A decision on the second and third complaints is expected in 2018. For further discussion on the complaints, see note 27 to the consolidated financial statements for the year ended December 31, 2017.
In 2018, Emera Maine expects to invest approximately $70 million USD (2017 – $61 million USD), primarily on transmission and distribution capital projects.
24 Emera Inc. — Annual Report 2017
Table of Contents
Management’s Discussion & Analysis
Emera Caribbean includes the following consolidated and non-consolidated investments:
Consolidated Investments
| • | 100.0 per cent investment in Emera (Caribbean) Inc. (“ECI”) and its wholly owned subsidiary BLPC, a vertically integrated utility that is the provider of electricity in Barbados. BLPC serves 129,000 customers. BLPC owns 239 MW of oil-fired generation, 150 kilometres of transmission facilities and 2,800 kilometres of distribution facilities. BLPC’s approved regulated return on rate base for 2017 is 10.0 per cent. |
| • | 50.0 per cent direct and 30.4 per cent indirect interest (through a 60.7 per cent interest in ICD Utilities Limited (“ICDU”)) in GBPC, a vertically integrated utility and the sole provider of electricity on Grand Bahama Island. GBPC serves 19,000 customers. GBPC owns 98 MW of oil-fired generation, 138 kilometres of transmission facilities and 860 kilometres of distribution facilities. In December 2017, the GBPA approved GBPC’s regulated return on rate base of 8.5 per cent for 2018. On November 8, 2017, the minority shareholders of ICD Utilities Limited approved Emera’s acquisition of their common shares for total consideration of approximately $35 million USD. The acquisition of the minority shareholder common shares was completed on January 15, 2018, increasing Emera’s ownership interest in GBPC to 100 per cent. |
| • | 51.9 per cent indirect controlling interest, through ECI, in Domlec, an integrated utility on the island of Dominica. Domlec serves 36,000 customers. Domlec owns 20 MW of oil-fired generation, 7 MW of hydro production, 497 kilometres of transmission facilities and 716 kilometres of distribution facilities. On September 19, 2017 Dominica took a direct hit from Hurricane Maria, a category 5 hurricane. Refer to the “Developments” section for further details. Domlec’s approved allowable regulated return on rate base for 2017 is 15.0 per cent. |
Equity Investment
| • | 19.1 per cent indirect interest, through ECI, in Lucelec, a vertically integrated regulated electric utility on the island of St. Lucia. The investment in Lucelec is accounted for on the equity basis. |
Earnings from Emera Caribbean are most directly impacted by the rates of return on rate base approved by their regulators, capital structure, prudent management and approved recovery of operating costs, sales volumes, and the timing and scale of capital expenditures.
With oil being the predominant fuel source for generation of electricity in the Caribbean, and with fuel costs directly passed through electricity rates to customers, any change in global fuel prices and resulting change in fuel costs will result in a similar change in customer rates and reported revenues. GBPC has implemented fuel hedging strategies to provide increased certainty to customers as to fuel costs and electricity rates. In support of reducing carbon emissions and exposure to carbon based fuel sources, BLPC commissioned a 10 megawatt solar facility in Barbados, which became operational in 2016. Additional renewable energy generation investments are being developed.
On May 30, 2017, the Minister of Finance in Barbados delivered a new budget. Key measures include an increase in the National Social Responsibility Levy (“NSRL”) from two per cent to 10 per cent and the introduction of a two per cent foreign exchange commission, both effective July 1, 2017. The NSRL is charged on all goods imported into Barbados and on domestically manufactured goods. The impact of these immaterial changes is incorporated into BLPC’s cost of service.
The 2017 Atlantic hurricane season was active. The island of Grand Bahama was impacted by Hurricane Irma, however there was minimal damage to the system as a result of the storm. The island of Dominica took a direct hit from Maria, a Category 5 hurricane. Emera’s total investment in Domlec is $7 million USD. The Company has implemented a restoration plan and expects to have all main circuits energized and the system ready to connect customers who are ready and certified to be connected in 2018. Refer to the “Developments” section for further details about Domlec and the impact of Hurricane Maria. Barbados was not affected by any hurricanes in 2017.
Overall, Emera Caribbean 2018 earnings are expected to increase over the prior year. Earnings from GBPC are expected to increase due to recovering load after the short term decline from Hurricane Matthew in 2016. Domlec is expecting a loss for 2018 consistent with 2017, as it continues to execute its restoration plan from Hurricane Maria. The increase at GBPC will be partially offset by lower earnings in 2018 from BLPC due to increased interest expense as the utility rebalances its capital structure.
Emera Caribbean plans to invest approximately $85 million USD in capital programs in 2018 (2017 – $54 million USD). This increase is due to spending on transmission, battery storage, renewable generation and LED street lighting projects.
Emera Inc. — Annual Report 2017 25
Table of Contents
Emera Energy includes the following:
| • | Emera Energy Services (“EES”), a wholly owned physical energy marketing and trading business. |
| • | Emera Energy Generation (“EEG”), a wholly owned portfolio of electricity generation facilities in New England and the Maritime provinces of Canada with 1,435 megawatts (“MW”) of total capacity. |
| • | Equity investment in a 50.0 per cent joint venture ownership of Bear Swamp, a 600 MW pumped storage hydroelectric facility in northwestern Massachusetts. The investment in Bear Swamp is accounted for on an equity basis. |
Emera Energy Services
Earnings from Emera Energy Services, Emera Energy’s marketing and trading business, are generally dependent on market conditions. In particular, volatility in electricity and natural gas markets, which can be influenced by weather, local supply constraints and other supply and demand factors, can provide higher levels of margin opportunity. The business is seasonal, with Q1 and Q4 generally providing the greatest opportunity for earnings.
Planned investment by the industry in gas transportation infrastructure within the northeast United States over the next few years could reduce the degree of volatility recently experienced in the market, all other things being equal.
In addition to capitalizing on volatility-driven market opportunities, Emera Energy Services expects to continue to grow organically by building market share through strong customer service and expanding its geographic reach to adjacent markets, including the Mid-Atlantic region and Florida.
The Energy Services business is generally expected to deliver net earnings of $15 to $30 million USD, with the opportunity for upside when market conditions present.
Emera Energy Generation
Earnings from Emera Energy Generation’s assets are largely dependent on market conditions, in particular, the relative pricing of electricity and natural gas and the absolute price of natural gas as the marginal fuel in the supply stack, and capacity pricing in ISO-NE for the NEGG Facilities. Efficient operations of the fleet to ensure unit availability, cost management and effective commercial performance are key success factors.
Adjusted earnings from Emera Energy’s generating assets in 2018 are expected to benefit from higher capacity prices and fewer outage days, all other things being equal.
Capacity Payment
In addition to energy margins and ancillary revenue, the NEGG Facilities and Bear Swamp earn revenue from capacity payments through the ISO-NE forward capacity market (“FCM”), the annual reconfiguration capacity market and the monthly reconfiguration capacity market. Prices for the FCM, the largest of the components, are determined through an auction process held annually, three years in advance, thus currently providing revenue visibility to 2022, presuming the facilities continue to be available to support their capacity obligations. Details of pricing and estimated revenues are outlined in the table below for the NEGG Facilities, and Emera Energy’s 50.0 per cent interest in Bear Swamp.
| Forward Capacity Auction (“FCA”) Year | Clearing Price in $/kW-month (in USD) | Approximate Estimated Annual Capacity Revenue (in USD) (1) | ||||||
| FCA 8 (June 2017 to May 2018) |
$7.03 | $100 million | ||||||
| FCA 9 (June 2018 to May 2019) |
$9.55 and $11.08 | (1) | $145 million | |||||
| FCA 10 (June 2019 to May 2020) |
$7.03 | $106 million | ||||||
| FCA 11 (June 2020 to May 2021) |
$5.30 | $80 million | ||||||
| FCA 12 (June 2021 to May 2022) |
$4.63 | $71 million | ||||||
| (1) | $11.08 was awarded for the Southeast Massachusetts/Rhode Island zone only and, as such, applies only to Tiverton. |
In 2018, Emera Energy expects to invest approximately $50 million (2017 – $47 million) in capital projects related to its generating assets to continue to improve reliability.
26 Emera Inc. — Annual Report 2017
Table of Contents
Management’s Discussion & Analysis
Corporate
Corporate encompasses certain corporate-wide functions including executive management, strategic planning, treasury services, legal, financial reporting, tax planning, corporate business development, corporate governance, internal audit, investor relations, risk management, insurance, acquisition related costs and corporate human resource activities. It also includes interest revenue on intercompany financings recorded in “Intercompany revenue” and costs associated with corporate activities that are not directly allocated to the operations of Emera’s subsidiaries and investments.
Other
Other includes the following consolidated and non-consolidated investments:
Consolidated Investments
| • | Brunswick Pipeline is an NEB-regulated, 145-kilometre pipeline that transports natural gas from Saint John, New Brunswick, to markets in the northeastern United States. The pipeline is contracted under a 25-year firm service agreement with Repsol Energy Canada that expires in 2034. The service agreement is accounted for as a direct financing lease. |
| • | Emera Reinsurance Limited is a captive insurance company providing insurance and reinsurance to Emera and certain of its affiliates, to enable more cost efficient management of risk and deductible levels across Emera. |
| • | Emera Utility Services (“EUS”) is a utility services contractor primarily operating in Atlantic Canada. |
| • | Emera US Holdings Inc. is a wholly owned holding company for certain of Emera’s assets located in the United States. |
| • | Emera US Finance LP is a wholly owned financing subsidiary of Emera. |
Non-consolidated Investments
| • | Emera’s 100 per cent investment in ENL which holds investments in the following: |
| • | Emera’s 100 per cent investment in NSPML, a $1.56 billion transmission project, including two 170-kilometre subsea cables, connecting the island of Newfoundland and Nova Scotia. The investment in NSPML is accounted for on the equity basis. This project completed commissioning and entered service on January 15, 2018. |
| • | Emera’s 49.5 per cent (December 31, 2016 – 62.7 per cent) investment in the partnership capital of LIL, a $3.7 billion electricity transmission project in Newfoundland and Labrador to enable the transmission of Muskrat Falls energy between Labrador and the island of Newfoundland. The investment in LIL is accounted for on the equity basis. Nalcor Energy has indicated that the project will be in service in Q2 2018. |
| • | Emera’s 12.9 per cent investment in M&NP. |
Corporate and Other includes corporate financing costs, AFUDC earnings as a result of the equity investment in Maritime Link and the Labrador Island Link, project based construction services activity by Emera Utility Services and capital lease accounting treatment of the Emera Brunswick Pipeline, which yields declining earnings over the life of the asset. The segment also includes corporate related costs that are dependent on the level of business development activity and acquisition related initiatives.
Corporate and Other’s contribution to consolidated adjusted net income is expected to be higher in 2018 primarily due to increased contributions from ENL as a result of increased equity investment in the Maritime Link which entered service on January 15, 2018 (see below for further discussion on Maritime Link and Labrador Island Link) and higher tax recoveries due to the non-cash tax expense recognized in 2017 as a result of US tax reform. This is partially offset by increased interest expense on higher short-term borrowing and lower income tax recoveries in 2018 as a result of the lower US tax rate. Refer to the “Developments” section for further details on US tax reform.
Corporate and Other, excluding ENL as discussed below, expects to spend approximately $40 million on property, plant and equipment in 2018 (2017 – $21 million).
ENL
NSP Maritime Link Inc. (“NSPML”)
Through its subsidiary, NSP Maritime Link Inc., ENL has invested $1.8 billion of equity, debt and working capital, including $209 million of AFUDC, in the development of the Maritime Link Project. Project to date, ENL has invested $510 million in equity, comprised of $420 million in equity contributed and $90 million of accumulated retained earnings, with the remaining being funded with working capital and debt. The project debt has been guaranteed by the Government of Canada.
Emera Inc. — Annual Report 2017 27
Table of Contents
Through the construction period, including 2017, earnings were derived through AFUDC on invested equity, capitalized at an annual rate of 9 per cent. In September 2017, the UARB approved NSPI’s interim assessment cash payment to NSPML of the costs associated with the Maritime Link starting when the Maritime Link is in service. The Maritime Link completed commissioning and entered service on January 15, 2018, enabling the transmission of electricity between Newfoundland and Labrador and Nova Scotia. In 2018, NSPML will begin operations and start earning revenue and collecting cash from NSPI. Refer to the “Developments” section for further details.
Future earnings contributions from the Maritime Link are dependent on the approved ROE and operational performance of NSPML. The approved ROE is currently 9 per cent. Earnings are expected to be higher in 2018 than in 2017 given increased equity investment.
In 2018, ENL expects to invest approximately $15 million in capital related to construction close out costs.
Labrador Island Link (“LIL”)
ENL is a limited partner with Nalcor Energy in LIL, with total project costs currently estimated at $3.7 billion. As at December 31, 2017, ENL has invested $492 million in LIL, comprised of $410 million in equity and $82 million of accumulated equity earnings. Equity earnings are recorded based on an annual ROE of 8.5 per cent of the equity invested. The ROE is approved by the NLPUB.
Future earnings from the LIL investment are dependent on the amount and timing of additional equity investments and the approved ROE. Emera’s total 2017 cash equity contributions were $55 million. The total equity contribution by Emera for the LIL is estimated to be approximately $600 million by the end of the project. No further equity contributions are forecasted until 2020.
Both the NSPML and LIL investments are recorded as equity investments – “Investments subject to significant influence” on Emera’s Consolidated Balance Sheets.
28 Emera Inc. — Annual Report 2017
Table of Contents
Management’s Discussion & Analysis
CONSOLIDATED BALANCE SHEET HIGHLIGHTS
Significant changes in the Consolidated Balance Sheets between December 31, 2016 and December 31, 2017 include:
| millions of Canadian dollars | |
Increase (Decrease) |
|
Explanation | ||
| Assets | ||||||
| Inventory | (54) | Decreased due to lower fuel inventory at NSPI as a result of lower volumes on hand and lower commodity pricing and the effect of a stronger CAD on the translation of Emera’s foreign subsidiaries. | ||||
| Regulatory assets (current and long-term) | 54 | Increased due to an increased deferred income tax regulatory asset at NSPI and the Tampa Electric storm reserve, partially offset by the effect of a stronger CAD on the translation of Emera’s foreign subsidiaries. | ||||
| Property, plant and equipment, net of accumulated depreciation | (295) | Decreased due to the effect of a stronger CAD on the translation of Emera’s foreign subsidiaries, and annual depreciation. This was partially offset by additions primarily at NSPI and Emera Florida and New Mexico. | ||||
| Investments subject to significant influence | 268 | Increased due to investment in NSPML and LIL. | ||||
| Goodwill | (408) | Decreased due to the effect of a stronger CAD on the translation of Emera’s foreign subsidiaries. | ||||
| Liabilities and Equity | ||||||
| Short-term debt and long-term debt (including current portion) | (583) | Decreased due to the effect of a stronger CAD on foreign currency debt. This was partially offset by changes in the balance of credit facilities, proceeds of long-term debt at GBPC, and increased short-term debt at Emera Florida and New Mexico. | ||||
| Accounts payable | (81) | Decreased due to the effect of a stronger CAD on the translation of Emera’s foreign subsidiaries and the timing of expenditures at TEC, partially offset by cash collateral positions on derivative instruments at NSPI, increased accruals at TEC for restoration costs after Hurricane Irma, and higher volumes and commodity prices at Emera Energy. | ||||
| Deferred income tax liabilities, net of deferred income tax assets | (674) | Decreased due to revaluation of US deferred income tax assets and liabilities resulting from the enacted US federal corporate income tax rate reduction and the effect of stronger CAD on the translation of Emera’s foreign subsidiaries. This was partially offset by increased tax deductions in excess of accounting depreciation related to property, plant and equipment. | ||||
| Derivative instruments (current and long-term) | (165) | Decreased due to the effect of stronger CAD on foreign currency derivative instruments, the reversal of 2016 Emera Energy asset management agreements MTM losses, and changes in existing positions on long term natural gas contracts at Emera Energy. | ||||
| Regulatory liabilities (current and long-term) | 829 | Increased due to the revaluation of net deferred income tax liabilities at Emera Florida and New Mexico and Emera Maine as a result of US tax reform and an increase in fuel adjustment mechanism (“FAM”) regulatory liabilities at NSPI. This was partially offset with lower deferral fuel clause, accumulated cost of removal and storm reserve for TEC. | ||||
| Pension and post-retirement liabilities | (110) | Decreased due to supplemental executive retirement plan and other post-retirement payments in Emera Florida and New Mexico and the effect of a stronger CAD on the translation of Emera’s foreign subsidiaries. | ||||
| Common stock | 863 | Increased due to issuance of common stock including issuance of shares as part of the dividend reinvestment program. | ||||
| Accumulated other comprehensive income | (294) | Decreased due to the effect of a stronger CAD on the translation of Emera’s foreign subsidiaries. | ||||
| Retained earnings | (185) | Decreased due to dividends paid in excess of net income. | ||||
Emera Inc. — Annual Report 2017 29
Table of Contents
Share Issuance
On December 28, 2017, Emera completed an offering of 14,614,000 common shares at $47.90 per common share. The aggregate gross and net proceeds from the offering were $700 million and $680 million, respectively. The proceeds of the offering will be used to support the Company’s recently announced growth initiatives and for general corporate purposes including to reduce indebtedness outstanding and to fund other ordinary course capital expenditures.
US Tax Reform
On December 22, 2017, the US Tax Cuts and Jobs Act of 2017 (“the Act”) was signed into legislation, however some of the specific details have yet to be clarified. Key provisions impacting Emera are as follows:
| • | US federal corporate income tax rate reduction from 35 per cent to 21 per cent effective January 1, 2018. |
| • | Interest deductibility is limited to 30 per cent of EBITDA from 2018 to 2021 and 30 per cent of EBIT after 2021. Previously, the Company was not subject to any interest deductibility limitations. |
| • | Regulated utilities have an exemption from this limitation allowing interest to remain deductible. |
| • | The Company believes that most of its US holding company interest can be properly allocable, in accordance with the Act, to its US regulated utilities and is therefore exempted from the interest deductibility limitations. |
| • | Immediate expensing of 100 per cent of the cost of new investments made in qualified depreciable assets after September 27, 2017. |
| • | US regulated utilities have an exemption from this immediate expensing. |
| • | The corporate alternative minimum tax (“AMT”) is eliminated effective January 1, 2018. Existing AMT credit carryforwards can be used to offset regular federal tax liabilities with the excess being refunded. AMT credit carryforwards are fully refundable by 2022. |
Impact on Emera’s December 31, 2017 financial results:
| • | A non-cash estimated income tax expense of $317 million resulting from the provisional revaluation of the existing US non-regulated net deferred income tax assets at the lower income tax rate. This revaluation was required at the time the Act was signed and has impacted Emera’s 2017 balance sheet and earnings. This adjustment has no effect on Emera’s future net earnings, cash flow, credit metrics or debt covenants. |
| • | A non-cash provisional revaluation of $1.1 billion on the existing US regulated net deferred income tax liabilities at the lower income tax rate. The Company has recorded an equivalent increase of a regulatory liability as the impact of lower US taxes is expected to be returned to customers over time as required by the Act or by order of the applicable regulator. As a result, the deferred tax adjustment for the US regulated utilities has an impact on the 2017 balance sheet of Emera but no impact on 2017 earnings. |
The Company is still analyzing certain aspects of the Act, which could potentially affect the measurement of these balances or potentially give rise to new deferred tax amounts. Further adjustments, if any, will be recorded by the Company during the measurement period in 2018 as permitted by SEC Staff Accounting Bulletin 118, Income tax Accounting Implications of the Tax Cuts and Jobs Act. The Act provides that the measurement period must be completed by December 22, 2018.
Future impacts:
| • | Emera will experience a higher consolidated net loss from US non-regulated businesses due to a lower income tax recovery as a result of the lower tax rate that is applicable to Emera’s non-regulated US businesses and its holding company interest expense. The overall impact to earnings per share is expected to be three to five per cent. |
| • | It is expected there will be no material changes in Emera’s US regulated utilities’ future net earnings as a lower income tax expense and amortization of the deferred tax revaluation regulatory liability is expected to be offset by lower customer rates at Tampa Electric. The remaining US utilities will address the impact of tax reform through normal regulatory process. |
| • | An estimated decrease in cash from operations of $50 million to $200 million annually in Emera’s US businesses primarily due to expected revenue reductions as a result of lower income tax expense and amortization of the deferred tax regulatory liability at the US regulated utilities. Emera currently pays minimal cash taxes as a result of existing tax loss carryforwards and therefore the reduction in cash revenues is not offset by lower cash tax payments over the near term. This decrease will be partially offset by cash refunds associated with AMT credit carryforwards beginning in 2019. In addition, Tampa Electric has filed to collect storm restoration costs in 2018, which if approved, would offset the decrease in cash associated with tax reform in 2018. |
| • | The Company believes that most of its US holding company interest can be properly allocable, in accordance with the Act, to its US regulated utilities and is therefore exempted from the interest deductibility limitations. As a result, there should be no impact to Emera’s future earnings, other than the impact of a lower effective tax rate. |
30 Emera Inc. — Annual Report 2017
Table of Contents
Management’s Discussion & Analysis
Maritime Link
On December 8, 2017, the first successful trial of the Maritime Link was achieved. The Maritime Link completed commissioning and entered service on January 15, 2018, enabling the transmission of electricity between Newfoundland and Labrador and Nova Scotia.
On September 11, 2017, the UARB approved NSPI’s interim assessment payment to NSPML of the costs associated with the Maritime Link commencing when it is in service. The approved annual interim assessment payments are $110 million in 2018 and $111 million in 2019. In response to the delayed timing of energy delivery from the Muskrat Falls project, the approved interim assessment reflects NSPML’s proposal to reduce the assessment by deferring the portion related to depreciation and amortization expense. Refer to the “Business Overview and Outlook”, “NSPI” section for further details.
Increase in Common Dividend
On September 29, 2017, Emera’s Board of Directors approved an increase in the annual common share dividend rate from $2.09 to $2.26. The first payment at the increased rate was effective November 15, 2017.
Hurricanes Irma and Maria
During the third quarter of 2017, operations in Florida and the Caribbean were impacted by Hurricanes Irma and Maria. Irma, a Category 5 hurricane at its height, impacted the Caribbean and Florida over the course of several days in September making landfall in Florida on September 10, 2017. Hurricane Maria made landfall in Dominica on September 19, 2017, as a Category 5 hurricane. There were no material impacts from these storms on St. Lucia, Grand Bahamas or Barbados.
TEC
As a result of Hurricane Irma, 57 per cent of Tampa Electric customers lost power. Power was restored to substantially all customers within seven days. There was minimal impact to earnings as a result of this storm. TEC incurred an estimated $105 million USD of storm restoration costs in 2017, of which $93 million USD are expected to be recoverable from the storm reserve, $8 million USD was charged to capital expenditures and $4 million USD to OM&G expenses. Tampa Electric petitioned the FPSC on December 28, 2017 for recovery of estimated storm costs in excess of the reserve for several named storms, including Hurricane Irma, and to replenish the balance in the reserve to the $56 million USD level that existed as of October 31, 2013. An amended petition was filed with the FPSC on January 30, 2018. Refer to the “Business Overview and Outlook”, “Emera Florida and New Mexico” section for further details.
On January 30, 2018, Tampa Electric filed with the FPSC a settlement agreement which, if approved, will allow Tampa Electric to net the estimated amount of storm cost recovery against the utility’s estimated 2018 tax reform benefits. Any difference would be trued up and recovered from or returned to customers in 2019. Beginning in January 2019 Tampa Electric would reflect the full impact of tax reform on Tampa Electric’s base rates, provided that the FPSC’s determinations have been finalized. A decision is expected in March 2018.
Domlec
Emera owns a controlling 51.9 per cent interest in Domlec, an integrated utility on the island of Dominica. The 48.1 per cent non-controlling interest is held by Dominica Social Security, the national pension scheme controlled by the Government, and other local investors. Emera’s total investment in Domlec is $7 million USD. On September 19, 2017, Dominica experienced unprecedented damage as a result of Hurricane Maria, facing sustained winds of over 175 miles per hour. All 36,000 of Domlec’s customers lost power following the storm.
The Company has implemented a restoration plan. All of Domlec’s $13 million USD of long-term debt is held by The National Bank of Dominica and the bank has agreed to defer payment of principal and interest on this debt through to at least April 2018.
While Domlec’s generating assets survived the storm with minimal damage, the Company’s transmission and distribution assets were significantly impacted. Domlec maintains insurance for its generation fleet and, as with most utilities, transmission and distribution networks are self-insured. Management has completed its damage assessment and an estimated impairment provision has been recorded at December 31, 2017. Emera’s portion of the estimated impairment provision is immaterial.
Emera Inc. — Annual Report 2017 31
Table of Contents
TEC Solar Investment and Solar Base Rate Adjustment (“SoBRA”)
On September 28, 2017, Tampa Electric announced its intention to invest approximately $850 million USD over four years in 600 MW of new solar projects across its service territory. The first phase, which includes two projects totaling 150 MW, is scheduled to be completed in September 2018. The second phase, which includes four projects totaling 250 MW, is scheduled to be completed by January 1, 2019. Two other phases are scheduled to be completed by January 1 of 2020 and 2021.
A settlement agreement was filed with the FPSC requesting a base rate adjustment that provides for the recovery, upon in service, of up to 600 MW of investments in utility-scale solar projects. The settlement agreement also extends the general base rate freeze included in the 2013 Agreement to January 1, 2022, limits fuel hedging and investments in natural gas reserves and includes certain customer protections related to potential changes in federal tax policy. On November 6, 2017, the FPSC approved the settlement agreement. On December 12, 2017, Tampa Electric filed its petition along with supporting tariffs demonstrating the cost-effectiveness of the September 1, 2018 SoBRA representing 145 MW and $26 million in estimated revenue requirements. A decision by the FPSC to approve the tariffs on the first SoBRA filing is anticipated in the spring of 2018.
Appointments
Board of Directors
Effective November 10, 2017, Kent M. Harvey joined the Emera Board of Directors. Mr. Harvey is the former Chief Financial Officer for PG&E Corporation, a Fortune 200 regulated electric and gas utility.
Executive
Effective March 31, 2018, Rick Janega will be appointed the Chief Operating Officer, Electric Utilities – Canada, US Northeast and Caribbean. In addition to this new role, Mr. Janega will continue as President and Chief Executive Officer for Emera Newfoundland & Labrador.
Effective March 29, 2018, Chris Huskilson will retire as President and Chief Executive Officer (“CEO”) and as a Director. Emera’s Board of Directors has appointed Scott Balfour, current Chief Operating Officer and former Chief Financial Officer, as President and CEO upon Mr. Huskilson’s retirement, and he will join the Board of Directors effective that date.
Effective December 1, 2017, Nancy Tower was appointed President and Chief Executive Officer of Tampa Electric. Gordon Gillette, Tampa Electric’s previous President and Chief Executive Officer, retired on November 30, 2017. Ms. Tower was most recently the Chief Corporate Development Officer for Emera.
| Common stock Issued and outstanding: |
millions of shares |
millions of Canadian dollars |
||||||
| Balance, December 31, 2015 |
147.21 | $ | 2,157 | |||||
| Conversion of Convertible Debentures |
51.99 | 2,115 | ||||||
| Issuance of common stock |
7.69 | 338 | ||||||
| Issued for cash under Purchase Plans at market rate |
2.51 | 115 | ||||||
| Discount on shares purchased under Dividend Reinvestment Plan |
— | (5 | ) | |||||
| Options exercised under senior management stock option plan |
0.62 | 17 | ||||||
| Employee Share Purchase Plan |
— | 1 | ||||||
| Balance, December 31, 2016 |
210.02 | $ | 4,738 | |||||
| Conversion of Convertible Debentures (1) |
0.15 | 6 | ||||||
| Issuance of common stock (2) |
14.61 | 680 | ||||||
| Issued for cash under Purchase Plans at market rate |
3.89 | 182 | ||||||
| Discount on shares purchased under Dividend Reinvestment Plan |
— | (9 | ) | |||||
| Options exercised under senior management stock option plan |
0.10 | 3 | ||||||
| Employee Share Purchase Plan |
— | 1 | ||||||
| Balance, December 31, 2017 |
228.77 | $ | 5,601 | |||||
| (1) | As at December 31, 2017, a total of 52.14 million common shares of the Company were issued, representing conversion into common shares of more than 99.9% of the Convertible Debentures. |
| (2) | On December 28, 2017, Emera completed an offering of 14.6 million common shares, at $47.90 per common share, for gross proceeds of approximately $700 million. The net proceeds were $680 million after $20 million of issuance costs, net of taxes. |
As at January 29, 2018, the amount of issued and outstanding common shares was 229.3 million.
The weighted average shares of common stock outstanding – basic, which includes both issued and outstanding common stock and outstanding deferred share units, for the three months ended December 31, 2017 was 215.3 million (2016 – 204.1 million). The weighted average shares of common stock outstanding – basic for the year ended December 31, 2017 was 213.4 million (2016 – 171.4 million).
32 Emera Inc. — Annual Report 2017
Table of Contents
Management’s Discussion & Analysis
Financial Highlights
All amounts are reported in USD, unless otherwise stated.
| For the | Three months ended December 31 |
Year ended December 31 |
||||||||||||||
| millions of US dollars (except per share amounts) | 2017 | 2016 | 2017 | 2016* | ||||||||||||
| Operating revenues – regulated electric |
$ | 470 | $ | 454 | $ | 2,048 | $ | 1,039 | ||||||||
| Operating revenues – regulated gas |
206 | 202 | 732 | 349 | ||||||||||||
| Operating revenues – non-regulated |
4 | 4 | 13 | 7 | ||||||||||||
| Total operating revenues |
680 | 660 | 2,793 | 1,395 | ||||||||||||
| Regulated fuel for generation and purchased power |
143 | 159 | 634 | 371 | ||||||||||||
| Regulated cost of natural gas |
84 | 80 | 292 | 133 | ||||||||||||
| Adjusted contribution to consolidated net income – USD |
$ | 63 | $ | 47 | $ | 295 | $ | 131 | ||||||||
| Adjusted contribution to consolidated net income – CAD |
$ | 80 | $ | 63 | $ | 382 | $ | 172 | ||||||||
| Revaluation of US non-regulated deferred income taxes |
$ | (221 | ) | $ | — | $ | (221 | ) | $ | — | ||||||
| Contribution to consolidated net income – USD |
$ | (158 | ) | $ | 47 | $ | 74 | $ | 131 | |||||||
| Contribution to consolidated net income – CAD |
$ | (203 | ) | $ | 63 | $ | 99 | $ | 172 | |||||||
| Adjusted contribution to consolidated earnings per common share – CAD |
$ | 0.37 | $ | 0.31 | $ | 1.79 | $ | 1.00 | ||||||||
| Contribution to consolidated earnings per common share – CAD |
$ | (0.94 | ) | $ | 0.31 | $ | 0.46 | $ | 1.00 | |||||||
| Net income weighted average foreign exchange rate – CAD/USD |
$ | 1.28 | $ | 1.34 | $ | 1.34 | $ | 1.31 | ||||||||
| EBITDA – USD |
$ | 252 | $ | 209 | $ | 1,060 | $ | 477 | ||||||||
| EBITDA – CAD |
$ | 320 | $ | 279 | $ | 1,374 | $ | 629 | ||||||||
* Financial results of Emera Florida and New Mexico are from July 1, 2016.
Revaluation of US Non-regulated Deferred Income Taxes
Due to the enactment of the US Tax Cuts and Jobs Act of 2017, Emera Florida and New Mexico recorded a non-cash income tax expense resulting from the provisional revaluation of the existing US non-regulated net deferred income tax assets. This provisional revaluation of an existing asset is not the result of any operational or market driven event and therefore management believes excluding from adjusted net income the effect of this provisional revaluation better distinguishes the ongoing operations of the business, and allows investors to better understand and evaluate the Company.
Emera Inc. — Annual Report 2017 33
Table of Contents
Net Income
Highlights of the net income changes are summarized in the following table:
| For the millions of US dollars |
Three months ended |
|||||||
| Contribution to consolidated net income – 2016 |
$ | 47 | ||||||
| Increased operating revenues – see Operating Revenues – Regulated Electric below |
16 | |||||||
| Increased operating revenues – see Operating Revenues – Regulated Gas below |
4 | |||||||
| Decreased fuel for generation and purchased power – see Regulated Fuel for Generation and Purchased Power below |
16 | |||||||
| Increased cost of natural gas sold – see Regulated Cost of Natural Gas below |
(4 | ) | ||||||
| Decreased OM&G expenses, primarily due to fewer planned outages and generation maintenance and timing of transmission and distribution line clearance, inspections and other maintenance activity |
20 | |||||||
| Increased depreciation and amortization due to increased property, plant and equipment; partially offset by decreases in depreciation rates related to PGS’s FPSC approved depreciation study |
(6 | ) | ||||||
| Decreased AFUDC due to Polk Power Station expansion going into service in January 2017 |
(9 | ) | ||||||
| Increased income tax expense, primarily due to increased income before provision for income taxes |
(18 | ) | ||||||
| Revaluation of US non-regulated deferred income taxes due to tax reform |
(221 | ) | ||||||
| Other |
(3 | ) | ||||||
| Contribution to consolidated net income – 2017 |
$ | (158 | ) | |||||
Emera Florida and New Mexico’s CAD adjusted contribution to consolidated net income increased $17 million to $80 million in Q4 2017 from $63 million during the same period in 2016. The impact of the change in the foreign exchange rate decreased CAD adjusted earnings by $4 million compared to Q4 2016.
Emera Florida and New Mexico’s adjusted contribution is summarized in the following table:
| For the | Three months ended December 31 |
Year ended December 31 |
||||||||||||||
| millions of US dollars | 2017 | 2016 | 2017 | 2016* | ||||||||||||
| Tampa Electric |
$ | 57 | $ | 38 | $ | 274 | $ | 126 | ||||||||
| PGS |
12 | 9 | 43 | 15 | ||||||||||||
| NMGC |
10 | 10 | 22 | 9 | ||||||||||||
| Other (1) |
(16 | ) | (10 | ) | (44 | ) | (19 | ) | ||||||||
| Adjusted contribution to consolidated net income |
$ | 63 | $ | 47 | $ | 295 | $ | 131 | ||||||||
| (1) Other includes TECO Finance and administration costs. * Financial results of Emera Florida and New Mexico are from July 1, 2016. |
||||||||||||||||
34 Emera Inc. — Annual Report 2017
Table of Contents
Management’s Discussion & Analysis
Emera’s 2016 results reflect six months of Emera Florida and New Mexico operations as the acquisition was completed on July 1, 2016. Prior year data discussed below reflects the full year of operation for comparison purposes only.
Tampa Electric’s 2017 adjusted net income increased $29 million to $274 million compared to $245 million in 2016 due primarily to higher base revenues related to the completion of the Polk Power Station expansion project and lower OM&G partially offset by increased depreciation and property tax expense, and lower AFUDC earnings. Unfavourable winter weather impacts on base revenues were offset by warmer spring weather and customer growth. OM&G was lower in 2017 due to decreased generation outages and other maintenance costs, and higher administrative overhead allocated to capital due to higher capital spending.
In September 2017, Tampa Electric was impacted by Hurricane Irma. The majority of Hurricane Irma restoration costs will be charged against Tampa Electric’s FPSC approved storm reserve resulting in minimal impact on earnings. Estimated total restoration costs are $105 million, with $93 million charged to the storm reserve, $8 million charged to capital expenditures and $4 million charged to OM&G. Tampa Electric petitioned the FPSC on December 28, 2017 for recovery of estimated storm costs in excess of the reserve for several named storms, including Hurricane Irma. An amended petition was filed with the FPSC on January 30, 2018.
On January 30, 2018, Tampa Electric filed with the FPSC a settlement agreement which, if approved, will allow Tampa Electric to net the estimated amount of storm cost recovery against the utility’s estimated 2018 tax reform benefits. Any difference would be trued up and recovered from or returned to customers in 2019. Beginning in January 2019 Tampa Electric would reflect the full impact of tax reform on Tampa Electric’s base rates, provided that the FPSC’s determinations have been finalized. A decision is expected in March 2018.
On June 29, 2017, a tragic accident occurred during work being conducted at Tampa Electric’s Big Bend Power Station Unit Two, resulting in employee and contractor fatalities. The financial impact to Tampa Electric is expected to be substantially covered by insurance.
PGS’s 2017 net income increased $8 million to $43 million compared to $35 million in 2016 primarily due to lower depreciation expense, slightly higher base revenue and an increase in return on investments related to the FPSC approved Cast Iron/Bare Steel Pipe Replacement clause. Base revenue was slightly higher as impacts from customer growth and the strong Florida economy were offset by unfavourable winter weather impacts earlier this year.
NMGC’s 2017 adjusted net income decreased $2 million to $22 million compared to $24 million in 2016.
2017 other adjusted net loss increased $8 million to $44 million compared to $36 million in 2016, primarily due to executive retirement compensation expense in 2017.
Electric and Gas Revenues
Electric and gas sales volumes are primarily driven by general economic conditions, population and weather. Residential and commercial electricity and gas sales are seasonal. In Florida, Q3 is the strongest period for electricity sales, reflecting warmer weather and cooling demand. In New Mexico and Florida, Q1 is the strongest period for gas sales due to colder weather and heating demand.
Emera Florida and New Mexico’s residential load generally comprises individual homes, apartments and condominiums. Commercial customers include small retail operations, large office and commercial complexes, universities and hospitals. Industrial customers include manufacturing facilities and other large volume operations. The gas utilities’ industrial customers include manufacturing facilities and other large volume operations. Other sales volumes consist primarily of off-system sales to other utilities and revenues from street lighting.
Emera Inc. — Annual Report 2017 35
Table of Contents
Operating Revenues – Regulated Electric
Electric revenues increased $16 million to $470 million in Q4 2017 compared to $454 million in Q4 2016, primarily due to $28 million of higher base revenues related to completion of the Polk Power Station expansion in January 2017. This increase was offset by lower clause-related revenues due to return of prior year fuel over-recoveries through current rates and higher sales volume due to customer growth. For the year ended December 31, 2017, electric revenues increased $87 million to $2,048 million compared to $1,961 million in 2016, primarily due to $112 million of higher base revenues related to the Polk Power Station expansion partially offset by lower sales volumes due to mild winter weather in the Q1 and lower clause-related revenues.
Electric revenues are summarized in the following charts by customer class:
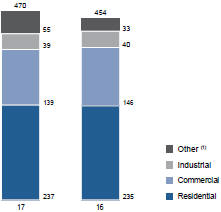
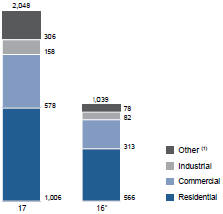
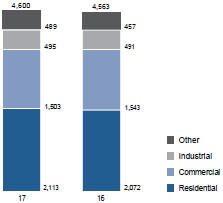
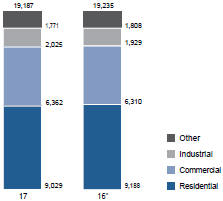
36 Emera Inc. — Annual Report 2017
Table of Contents
Management’s Discussion & Analysis
Operating Revenues – Regulated Gas
Gas revenues increased $4 million to $206 million in Q4 2017 compared to $202 million in Q4 2016, primarily due to the pass through of higher commodity costs and customer growth in Florida partially offset by lower NMGC sales volumes due to milder weather in Q4 2017. For the year ended December 31, 2017, gas revenues increased $7 million to $732 million compared to $725 million in 2016, primarily due to higher commodity costs and customer growth in Florida, partially offset by lower sales volumes due to unfavourable winter weather in Q1 2017 in both Florida and New Mexico in addition to the Q4 2017 weather impacts at NMGC.
Gas revenues are summarized in the following charts by customer class:
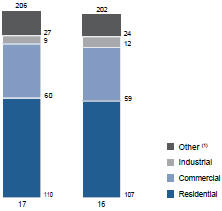
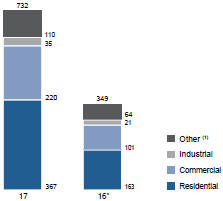
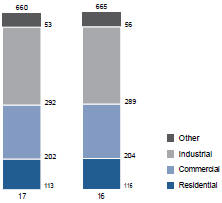
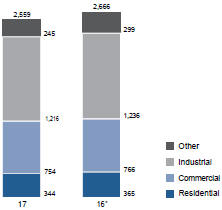
Emera Inc. — Annual Report 2017 37
Table of Contents
Regulated Fuel for Generation, Purchased Power and Cost of Natural Gas
Electric Capacity
Tampa Electric is required to maintain a generating capacity greater than firm peak demand. The total Tampa Electric-owned generation capacity is 5,218 MW, which is supplemented by 371 MW contracted with other regulated utilities and independent power producers in Florida. Tampa Electric meets the planning criteria for reserve capacity established by the FPSC, which is a 20 per cent reserve margin over firm peak demand.
Tampa Electric’s 460 MW Polk Power Station expansion project and 19 MW Big Bend Solar array went into commercial operation in January and February of 2017, respectively.
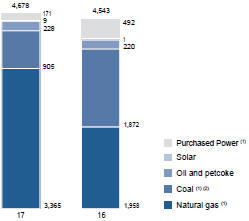
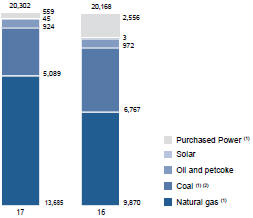
Q4 Average Fuel Costs
| US dollars | 2017 | 2016 | ||||||||
| Dollars per MWh |
$ | 31 | $ | 35 | ||||||
| Annual Average Fuel Costs*
US dollars |
2017 | 2016* | ||||||||
| Dollars per MWh |
$ | 31 | $ | 33 | ||||||
| * 2016 data is for comparison purposes only. TECO Energy was acquired on July 1, 2016. | ||||||||||
38 Emera Inc. — Annual Report 2017
Table of Contents
Management’s Discussion & Analysis
Q4 and annual average fuel cost per MWh was lower in 2017 than 2016 primarily due to lower purchased power and more natural gas production as a result of the new Polk Power Station expansion.
Tampa Electric’s fuel costs are affected by commodity prices and generation mix that is largely dependent on economic dispatch of the generating fleet, bringing the lowest cost options on stream first (after renewable energy from solar arrays), such that the incremental cost of production increases as sales volumes increase. Generation mix may also be affected by plant outages, plant performance, availability of lower priced short-term purchased power, availability of renewable solar generation, and compliance with environmental standards and regulations.
Regulated fuel for generation and purchased power decreased $16 million to $143 million in Q4 2017 compared to $159 million in Q4 2016. For the year ended December 31, 2017, it decreased $31 million to $634 million compared to $665 million for the same period in 2016. These decreases were primarily due to lower purchased power costs in 2017. In 2016, Tampa Electric was purchasing more power to cover outages related to the Polk Power Station expansion project.
Cost of Natural Gas
Emera Florida and New Mexico’s gas utilities, PGS and NMGC, purchase gas from various suppliers depending on the needs of their customers. In Florida, gas is delivered to the PGS distribution system through three interstate pipelines on which PGS has firm transportation capacity for delivery by PGS to its customers. NMGC’s service territory is situated between two large natural gas production basins (the San Juan Basin in northwest New Mexico and the Permian Basin in southeastern New Mexico). Natural gas is transported from these production basins on major interstate pipelines and NMGC’s intrastate transmission system to customers using NMGC’s distribution system.
In Florida, natural gas service is unbundled for non-residential customers and residential customers that use more than 1,999 therms annually that elect this option, affording these customers the opportunity to purchase gas from any provider. In New Mexico, NMGC is required to provide transportation-only services for all customer classes if requested. The net result of unbundling is a shift from bundled transportation and commodity sales to transportation-only sales. Because the commodity portion of bundled sales is included in operating revenues, at the cost of the gas on a pass-through basis, there is no net earnings effect when a customer shifts to transportation-only sales.
Regulated cost of natural gas increased $4 million to $84 million in Q4 2017 compared to $80 million in Q4 2016 primarily due to higher commodity costs. For the year ended December 31, 2017, regulated cost of natural gas increased $11 million to $292 million in 2017 compared to $281 million in 2017 primarily due to higher commodity costs partially offset by lower sales volumes due to unfavourable winter weather in Q1 2017.
Gas sales by type are summarized in the following tables:
| Q4 Gas Sales Volumes by Type
Therms (millions) |
2017 | 2016 | ||||||||
| System Supply |
194 | 198 | ||||||||
| Transportation |
466 | 467 | ||||||||
| Total |
660 | 665 | ||||||||
| Annual Gas Sales Volumes by Type
Therms (millions) |
2017 | 2016* | ||||||||
| System Supply |
671 | 744 | ||||||||
| Transportation |
1,888 | 1,922 | ||||||||
| Total |
2,559 | 2,666 | ||||||||
| * 2016 data is for comparative purposes only. TECO Energy was acquired on July 1, 2016. | ||||||||||
Gas sales volumes in Q4 2017 were lower than Q4 2016, primarily due to warmer weather in New Mexico partially offset by customer growth in Florida. For the year ended December 31, 2017, gas sales volumes decreased compared to in 2016, primarily due to unfavourable winter weather in Q1 2017 in both Florida and New Mexico.
Emera Inc. — Annual Report 2017 39
Table of Contents
Regulatory Recovery Mechanisms
Tampa Electric
Fuel Recovery Clause
Tampa Electric has a fuel recovery clause that is approved by the FPSC, allowing it the opportunity to recover fluctuating fuel expenses from customers through annual fuel rate adjustments. Differences between prudently incurred fuel costs and amounts recovered from customers through electricity rates in a year are deferred to a fuel clause regulatory asset or liability and recovered from or returned to customers in a subsequent year.
Other Cost Recovery Clauses
The FPSC annually approves cost-recovery rates for purchased power, capacity, environmental and conservation costs including a return on capital invested. Differences between the prudently incurred clause-recoverable costs and amounts recovered from customers through electricity rates in a year are deferred to a corresponding regulatory asset or liability and recovered from or returned to customers in a subsequent year. In October 2017, the FPSC approved the 2018 cost-recovery rates for fuel and purchased power, capacity, environmental and conservation costs.
Storm Reserve
The storm reserve is for hurricanes and other named storms that cause significant damage to Tampa Electric’s system. Tampa Electric can petition the FPSC to seek recovery of restoration costs over a 12-month period, or longer, as determined by the FPSC, as well as replenish the reserve.
PGS
Fuel Recovery Clause
PGS recovers the costs it pays for gas supply and interstate transportation for system supply through its purchased gas adjustment (“PGA”) clause. This clause is designed to recover the actual costs incurred by PGS for purchased gas, gas storage services, interstate pipeline capacity, and other related items associated with the purchase, distribution, and sale of natural gas to its customers. These charges may be adjusted monthly based on a cap approved annually by the FPSC.
Other Cost Recovery Clauses
The FPSC annually approves cost-recovery rates for conservation costs including a return on capital invested incurred in developing and implementing energy conservation programs. In 2012, the FPSC approved a new Cast Iron/Bare Steel Pipe Replacement clause to recover the cost of accelerating the replacement of cast iron and bare steel distribution lines in the PGS system. The FPSC approved a replacement program of approximately 5 per cent, or 800 kilometres, of the PGS system at a cost of approximately $80 million over a 10-year period. As part of the depreciation study settlement agreement approved by the FPSC in February 2017, the Cast Iron/Bare Steel clause was expanded to allow recovery of accelerated replacement of certain obsolete pipe.
NMGC
Fuel Recovery Clause
NMGC recovers gas supply costs through a purchased gas adjustment clause (“PGAC”). This clause recovers NMGC’s actual costs for purchased gas, gas storage services, interstate pipeline capacity, and other related items associated with the purchase, distribution, and sale of natural gas to its customers.
On a monthly basis, NMGC can adjust the charges based on next month’s expected cost of gas and any prior month under-recovery or over-recovery. The NMPRC requires that NMGC annually file a reconciliation of the PGAC period costs and recoveries. NMGC’s annual PGAC period runs from September 1 to August 31 and the reconciliation is filed in December. NMGC must file a PGAC Continuation Filing with the NMPRC every four years to establish that the continued use of the PGAC is reasonable and necessary. In December 2016, NMGC received approval of its PGAC Continuation Filing for the four-year period ending December 2020.
40 Emera Inc. — Annual Report 2017
Table of Contents
Management’s Discussion & Analysis
Financial Highlights
| For the | Three months ended December 31 |
Year ended December 31 |
||||||||||||||
| millions of Canadian dollars (except per share amounts) |
2017 | 2016 | 2017 | 2016 | ||||||||||||
| Operating revenues – regulated electric |
$ | 355 | $ | 352 | $ | 1,338 | $ | 1,356 | ||||||||
| Regulated fuel for generation and purchased power (1) |
141 | 136 | 477 | 490 | ||||||||||||
| Contribution to consolidated net income |
$ | 23 | $ | 34 | $ | 129 | $ | 130 | ||||||||
| Contribution to consolidated earnings per common share – basic |
$ | 0.11 | $ | 0.17 | $ | 0.60 | $ | 0.76 | ||||||||
| EBITDA |
$ | 104 | $ | 116 | $ | 466 | $ | 463 | ||||||||
| (1) | Regulated fuel for generation and purchased power includes the Fuel Adjustment Mechanism on the Consolidated Income Statement, however it is excluded in the segment overview. |
Net Income
Highlights of the changes are summarized in the following table:
| For the millions of Canadian dollars |
Three months ended December 31 |
Year ended December 31 |
||||||||||
| Contribution to consolidated net income – 2016 |
$ | 34 | $ | 130 | ||||||||
| Increased (decreased) operating revenues – see Operating Revenues – Regulated Electric below |
3 | (18 | ) | |||||||||
| (Increased) decreased fuel for generation and purchased power – see Regulated Fuel for Generation and Purchased Power below |
(5 | ) | 13 | |||||||||
| Increased OM&G expenses quarter-over-quarter, primarily due to higher costs for vegetation management and information technology partially offset by lower storm costs. Year-over-year decrease, primarily due to higher administrative overheads allocated to capital due to higher capital spending, decreased storm costs, lower pension expense and lower maintenance costs partially offset by increased costs for information technology and vegetation management |
(6 | ) | 7 | |||||||||
| Increased depreciation and amortization due to increased property, plant and equipment |
(3 | ) | (10 | ) | ||||||||
| Increased interest expense, net, primarily due to higher interest expense on the FAM regulatory liability and decreased interest income on the demand side management (“DSM”) regulatory asset which is no longer financed by NSPI |
(2 | ) | (6 | ) | ||||||||
| Decreased income tax expense, primarily due to increased tax deductions in excess of accounting depreciation related to property, plant and equipment and decreased income before provision for income taxes |
6 | 12 | ||||||||||
| Other |
(4 | ) | 1 | |||||||||
| Contribution to consolidated net income – 2017 |
$ | 23 | $ | 129 | ||||||||
NSPI’s contribution to consolidated net income decreased $11 million to $23 million in Q4 2017 compared to $34 million in Q4 2016. For the year ended December 31, 2017, NSPI’s contribution to consolidated net income was consistent with 2016.
Emera Inc. — Annual Report 2017 41
Table of Contents
Operating Revenues – Regulated Electric
Operating revenues increased $3 million to $355 million in Q4 2017 compared to $352 million in Q4 2016. Revenues increased as a result of an increase in fuel related electricity pricing in 2017 and an increase in sales volumes due to load growth. This was partially offset by a decrease in sales volume due to weather and due to the Maritime Link interim assessment decision.
For the year ended December 31, 2017, operating revenues decreased $18 million to $1,338 million compared to $1,356 million in 2016. Revenues decreased due to the one-time refund in 2017 of $36 million of prior year fuel related revenues and by $16 million due to the Maritime Link interim assessment decision. This was partially offset by a $24 million increase as a result of fuel related electricity pricing effective January 1, 2017 and an $8 million increase in sales volumes due to load growth.
Electric revenues are summarized in the following charts by customer class:
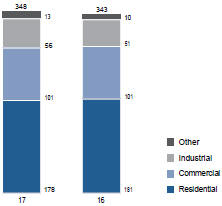
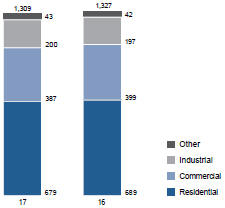
Electric sales volumes are summarized in the following charts by customer class:
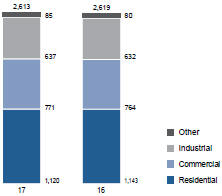
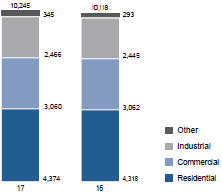
42 Emera Inc. — Annual Report 2017
Table of Contents
Management’s Discussion & Analysis
Regulated Fuel for Generation and Purchased Power
Regulated fuel for generation and purchased power increased $5 million to $141 million in Q4 2017 compared to $136 million in Q4 2016 due to changes in generation mix and plant performance, and decreased NSPI owned hydro and wind production, partially offset by decreased commodity prices. For the year ended December 31, 2017, regulated fuel for generation and purchased fuel power decreased $13 million to $477 million compared to $490 million in 2016 due to decreased commodity prices, partially offset by increased sales volumes.
NSPI’s FAM regulatory liability balance increased $83 million from $94 million at December 31, 2016 to $177 million at December 31, 2017 as a result of an over-recovery of current period fuel costs, including recovery of Maritime Link revenues that are to be refunded to customers as a result of the interim assessment decision, excess non-fuel revenues, interest on the FAM balance and the benefit of tax treatment on South Canoe and Sable wind farms. These were partially reduced by the refund to customers of prior years’ fuel costs.
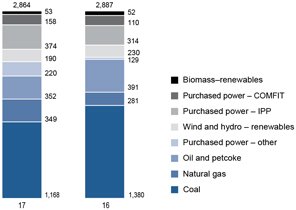
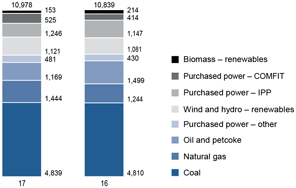
Emera Inc. — Annual Report 2017 43
Table of Contents
| Q4 Average Fuel Costs
|
2017 | 2016 | ||||||||
| Dollars per MWh produced |
$ | 49 | $ | 47 | ||||||
| Annual Average Fuel Costs
|
2017 | 2016 | ||||||||
| Dollars per MWh produced |
$ | 43 | $ | 45 | ||||||
Average unit fuel costs in Q4 2017 increased compared to Q4 2016 primarily due to unfavourable generation mix and decreased NSPI-owned hydro and wind generation, partially offset by favourable commodity pricing. Year-over-year, average unit fuel costs decreased in 2017 compared to 2016, primarily due to favourable solid fuel pricing, partially offset by unfavourable generation mix.
NSPI’s fuel costs are affected by commodity prices and generation mix, which is largely dependent on economic dispatch of the generating fleet, bringing the lowest cost options on stream first after renewable energy from IPPs including COMFIT participants, for which NSPI has power purchase agreements in place. This results in the incremental cost of production generally increasing as sales volumes increase.
Generation mix may also be affected by plant outages, availability of renewable generation, plant performance and compliance with environmental standards and regulations.
NSPI-owned hydro and wind have no fuel cost component. After hydro and wind, historically, petcoke and coal have the lowest per unit fuel cost, followed by natural gas. However, declines in natural gas prices and better overall thermal efficiencies have at times resulted in natural gas dispatching before petcoke and coal units. Oil, biomass and purchased power have the next lowest fuel cost, depending on the relative pricing of each.
The generation mix is transforming with the addition of new non-dispatchable renewable energy sources such as wind, including IPP and COMFIT, which typically have a higher cost per MWh than NSPI-owned generation or other purchased power sources.
Regulatory Recovery Mechanisms
NSPI is a public utility as defined in the Public Utilities Act of Nova Scotia (the “Public Utilities Act”) and is subject to regulation under the Public Utilities Act by the UARB. The Public Utilities Act gives the UARB supervisory powers over NSPI’s operations and expenditures. Electricity rates for NSPI’s customers are subject to UARB approval. NSPI is not subject to a general annual rate review process, but rather participates in hearings held from time to time at NSPI’s or the UARB’s request.
NSPI is regulated under a cost-of-service model, with rates set to recover prudently incurred costs of providing electricity service to customers, and provide an appropriate return to investors.
NSPI has a FAM, approved by the UARB, allowing NSPI to recover fluctuating fuel costs from customers through annual fuel rate adjustments. Differences between prudently incurred fuel costs and amounts recovered from customers through electricity rates in a year are deferred to a FAM regulatory asset or liability and recovered from or returned to customers in a subsequent year.
44 Emera Inc. — Annual Report 2017
Table of Contents
Management’s Discussion & Analysis
Financial Highlights
All amounts are reported in USD, unless otherwise stated.
| For the | Three months ended December 31 |
Year ended December 31 |
||||||||||||||
| millions of USD (except per share amounts) | 2017 | 2016 | 2017 | 2016 | ||||||||||||
| Operating revenues – regulated electric |
$ | 55 | $ | 55 | $ | 228 | $ | 223 | ||||||||
| Regulated fuel for generation and purchased power (1) |
17 | 12 | 64 | 54 | ||||||||||||
| Contribution to consolidated net income – USD |
$ | 7 | $ | 9 | $ | 36 | $ | 36 | ||||||||
| Contribution to consolidated net income – CAD |
$ | 8 | $ | 11 | $ | 46 | $ | 47 | ||||||||
| Contribution to consolidated earnings per common share – basic – CAD |
$ | 0.04 | $ | 0.05 | $ | 0.22 | $ | 0.27 | ||||||||
| Net income weighted average foreign exchange rate – CAD/USD |
$ | 1.27 | $ | 1.34 | $ | 1.30 | $ | 1.32 | ||||||||
| EBITDA – USD |
$ | 23 | $ | 28 | $ | 107 | $ | 107 | ||||||||
| EBITDA – CAD |
$ | 29 | $ | 37 | $ | 139 | $ | 141 | ||||||||
|
(1) “Regulated fuel for generation and purchased power” includes transmission pool expenses. |
| |||||||||||||||
| Net Income
|
||||||||||||
| Highlights of the net income changes are summarized in the following table:
|
||||||||||||
| For the millions of US dollars |
Three months ended |
Year ended December 31 |
||||||||||
| Contribution to consolidated net income – 2016 |
$ | 9 | $ | 36 | ||||||||
| Increased operating revenues – see Operating Revenues – Regulated Electric section below |
— | 5 | ||||||||||
| Increased regulated fuel for generation and purchased power – see Regulated Fuel for Generation and Purchased Power section below |
(5 | ) | (10 | ) | ||||||||
| Decreased OM&G year-over-year, primarily due to storm expenses incurred and losses recognized on disallowed and abandoned plant in 2016 partially offset by reduced capitalized construction overheads in 2017 |
(1 | ) | 3 | |||||||||
| Decreased depreciation and amortization due to lower regulatory amortization related to changes in stranded costs and purchased power |
3 | 3 | ||||||||||
| Increased income tax expense primarily due to decreased excess deferred income tax amortization and increased income before provision for income taxes |
— | (3 | ) | |||||||||
| Other |
1 | 2 | ||||||||||
| Contribution to consolidated net income – 2017 |
$ | 7 | $ | 36 | ||||||||
Emera Maine’s CAD contribution to consolidated net income decreased by $3 million to $8 million in Q4 2017 from $11 million in Q4 2016. For the year ended December 31, 2017, Emera Maine’s CAD contribution to consolidated net income decreased $1 million to $46 million, from $47 million in 2016. The foreign exchange rate had minimal impact for the three months and year ended December 31, 2017.
Emera Inc. — Annual Report 2017 45
Table of Contents
Operating Revenues – Regulated Electric
Emera Maine’s operating revenues – regulated electric include sales of electricity and other services as summarized in the following table:
Q4 Operating Revenues — Regulated Electric
| millions of US dollars |
2017 | 2016 | ||||||
| Electric revenues |
$ | 41 | $ | 40 | ||||
| Transmission pool revenues |
10 | 12 | ||||||
| Resale of purchased power |
4 | 3 | ||||||
| Operating revenues – regulated electric |
$ | 55 | $ | 55 | ||||
| Annual Operating Revenues – Regulated Electric
|
||||||||
| millions of US dollars | 2017 | 2016 | ||||||
| Electric revenues |
$ | 169 | $ | 160 | ||||
| Transmission pool revenues |
48 | 51 | ||||||
| Resale of purchased power |
11 | 12 | ||||||
| Operating revenues – regulated electric |
$ | 228 | $ | 223 | ||||
Electric revenues are summarized in the following charts by customer class:
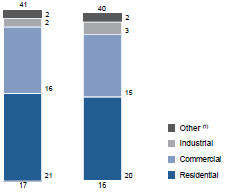
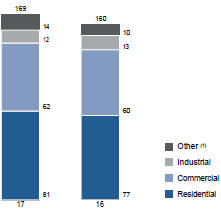
Electric revenues increased $1 million to $41 million in Q4 2017 compared to $40 million in Q4 2016. For the year ended December 31, 2017, electric revenues increased $9 million to $169 million in 2017 compared to $160 million in 2016 due to transmission and distribution rate changes.
46 Emera Inc. — Annual Report 2017
Table of Contents
Management’s Discussion & Analysis
Electric sales volume are summarized in the following charts by customer class:
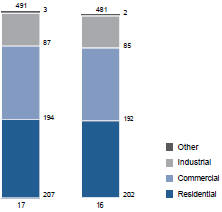
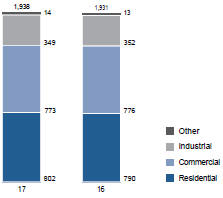
Regulated Fuel for Generation and Purchased Power
Emera Maine’s regulated fuel for generation and purchased power increased $5 million to $17 million in Q4 2017 compared to $12 million in Q4 2016. For the year ended December 31, 2017, regulated fuel for generation and purchased power increased $10 million to $64 million compared to $54 million in 2016. The increases were due to increased volumes and changes in market prices associated with long-term purchase power contracts. The power purchased under these arrangements is resold at market rates significantly below the contract rates. The difference between the cost of power purchased under these arrangements and the revenue collected is recovered through stranded costs rates under a full reconciliation rate mechanism.
Revaluation of US Regulated Deferred Income Taxes
Due to the enactment of US Tax Cuts and Jobs Act of 2017 Emera Maine recorded a non-cash provisional revaluation of the existing US regulated net deferred income tax liabilities. Emera Maine has recorded an equivalent increase of a regulatory liability as the impact of lower US taxes is expected to be returned to customers over time as required by the Act or by order of the regulator. As a result, the deferred tax adjustment for Emera Maine has an impact on the 2017 balance sheet but no impact on 2017 earnings.
Regulatory Recovery Mechanisms
Emera Maine’s distribution operations and stranded cost recoveries are regulated by the MPUC. The transmission operations are regulated by the FERC. The rates for these three elements are established in distinct regulatory proceedings.
Emera Maine’s distribution businesses operate under a traditional cost-of-service regulatory structure, and distribution rates are set by the MPUC. Emera Maine’s transmission businesses operate based on formulas utilizing prior year actual transmission investments and operating costs. Emera Maine collects revenue for its bulk transmission assets from ISO New England. Emera Maine is also required to contribute towards the total cost of the ISO New England pool transmission facilities on a ratable basis according to the proportion of the total New England load that their customers represent. For stranded cost recoveries, Emera Maine is permitted to recover all prudently incurred stranded costs resulting from the restructuring of the industry in 2000 that could not be mitigated or that arose as a result of rate and accounting orders issued by the MPUC.
Emera Inc. — Annual Report 2017 47
Table of Contents
Financial Highlights
All amounts are reported in USD, unless otherwise stated.
| For the | Three months ended December 31 |
Year ended December 31 |
||||||||||||||
| millions of USD (except per share amounts) | 2017 | 2016 | 2017 | 2016 | ||||||||||||
| Operating revenues – regulated electric |
$ | 84 | $ | 78 | $ | 334 | $ | 316 | ||||||||
| Regulated fuel for generation and purchased power |
41 | 36 | 152 | 130 | ||||||||||||
| Contribution to consolidated net income – USD |
$ | 1 | $ | 6 | $ | 24 | $ | 77 | ||||||||
| Contribution to consolidated net income – CAD |
$ | 1 | $ | 8 | $ | 31 | $ | 100 | ||||||||
| Contribution to consolidated earnings per common share – CAD |
$ | — | $ | 0.04 | $ | 0.15 | $ | 0.58 | ||||||||
| Net income weighted average foreign exchange rate – CAD/USD |
$ | 1.25 | $ | 1.34 | $ | 1.30 | $ | 1.31 | ||||||||
| EBITDA – USD |
$ | 11 | $ | 19 | $ | 87 | $ | 144 | ||||||||
| EBITDA – CAD |
$ | 14 | $ | 25 | $ | 113 | $ | 189 | ||||||||
| Net Income | ||||||||||||
| Highlights of the net income changes are summarized in the following table: | ||||||||||||
| For the millions of US dollars | Three months ended |
Year ended December 31 |
||||||||||
| Contribution to consolidated net income – 2016 |
$ | 6 | $ | 77 | ||||||||
| Increased operating revenues – see Operating Revenues – Regulated Electric below |
6 | 18 | ||||||||||
| Increased regulated fuel for generation – see Regulated Fuel for Generation and Purchased Power below |
(5 | ) | (22 | ) | ||||||||
| Decreased other income quarter-over-quarter mainly due to the pre-tax impairment charge as a result of damage to Domlec’s assets from Hurricane Maria. Year-over-year decrease mainly due to a pre-tax gain recognized on the BLPC SIF regulatory liability in 2016 |
(4 | ) | (48 | ) | ||||||||
| Increased interest expense reflecting interest charges on debt issued in Q4 2016 at ECI |
(2 | ) | (8 | ) | ||||||||
| Decreased income tax expense, primarily due to decreased income before provision for income taxes. Year-over-year decrease also due to a pre-tax gain recognized on the BLPC SIF regulatory liability in 2016 |
3 | 10 | ||||||||||
| Other |
(3 | ) | (3 | ) | ||||||||
| Contribution to consolidated net income – 2017 |
$ | 1 | $ | 24 | ||||||||
Emera Caribbean’s CAD contribution to consolidated net income decreased by $7 million to $1 million in Q4 2017 compared to $8 million in Q4 2016. For the year ended December 31, 2017, Emera Caribbean’s CAD contribution to consolidated net income decreased by $69 million to $31 million in 2017 compared to $100 million in 2016. The foreign exchange rate had minimal impact for the three months and year ended December 31, 2017.
48 Emera Inc. — Annual Report 2017
Table of Contents
Management’s Discussion & Analysis
Operating Revenues – Regulated Electric
Operating revenues increased $6 million to $84 million in Q4 2017 compared to $78 million in Q4 2016. This increase reflected an increase in fuel charge as a result of higher fuel prices in 2017 at BLPC, higher sales volumes at GBPC due to the partial recovery of the temporary decrease of load as a result of Hurricane Matthew lowering volumes in 2016, partially offset by lower sales volumes at Domlec due to the impact of Hurricane Maria.
For the year ended December 31, 2017, operating revenues increased $18 million to $334 million compared to $316 million in 2016 due to an increase in fuel charge as a result of higher fuel prices in 2017 at BLPC, partially offset by lower sales volumes at Domlec due to the impact of Hurricane Maria.
Electric revenues are summarized in the following charts by customer class:
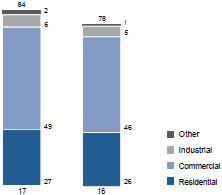

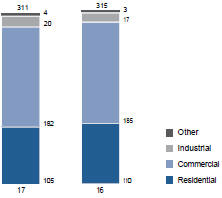
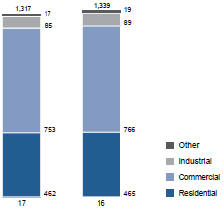
Emera Inc. — Annual Report 2017 49
Table of Contents
Regulated Fuel for Generation and Purchased Power
Regulated fuel for generation and purchased power increased $5 million to $41 million in Q4 2017 compared to $36 million in Q4 2016 and year-to-date and increased $22 million to $152 million compared to $130 million during the same period in 2016, primarily due to higher oil prices.
| Q4 Production Volumes |
||||||||||
| GWh | 2017 | 2016 | ||||||||
| Oil |
335 | 337 | ||||||||
| Hydro |
5 | 9 | ||||||||
| Solar |
1 | 4 | ||||||||
| Total |
341 | 350 | ||||||||
| Annual Production Volumes |
||||||||||
| GWh | 2017 | 2016 | ||||||||
| Oil |
1,386 | 1,417 | ||||||||
| Hydro |
30 | 36 | ||||||||
| Solar |
14 | 9 | ||||||||
| Total |
1,430 | 1,462 | ||||||||
| Q4 Average Fuel Costs |
||||||||||
| 2017 | 2016 | |||||||||
| Dollars per MWh |
$ | 120 | $ | 103 | ||||||
| Annual Average Fuel Costs |
||||||||||
| 2017 | 2016 | |||||||||
| Dollars per MWh |
$ | 106 | $ | 89 | ||||||
The change in the average fuel costs for the quarter and year was the result of higher oil prices.
Regulatory Recovery Mechanisms
BLPC
BLPC’s fuel costs flow through a fuel pass-through mechanism which provides the opportunity to recover all prudent fuel costs from customers in a timely manner. The Barbados Fair Trading Commission approves the calculation of the fuel charge, which is adjusted on a monthly basis.
GBPC
GBPC’s fuel costs flow through a fuel pass-through mechanism which provides the opportunity to recover all prudent fuel costs from customers in a timely manner. In December 2016, the GBPA approved holding the all-in (fuel and base) rates consistent with 2016 levels for five years (2017–2021).
As a component of its regulatory agreement GBPC has an Earnings Share Mechanism to allow for earnings on rate base to be deferred to a regulatory asset or liability at the rate of 50 per cent of amounts below a 7.8 per cent return on rate base and 50 per cent of amounts above 9.8 per cent return on rate base respectively.
As a result of Hurricane Matthew in 2016, a regulatory asset was established to recover associated restoration costs. In addition, the GBPA approved that over a five year period, 2017 to 2021, the all-in rate for electricity (fuel and base rates) will be held at 2016 levels. This is achievable as the company’s fuel costs over this period are forecasted to decrease. Fuel costs are managed through a fuel hedging program which allows predictability of these costs. Any over-recovery of fuel costs during this period will be applied to the Hurricane Matthew regulatory asset, until such time as the asset is recovered. Should GBPC recover funds in excess of the Hurricane Matthew regulatory asset, the excess will be placed in a new storm reserve. If the Hurricane Matthew deferral is not fully recovered at the end of five years, GBPC will have the opportunity to request recovery from customers in future rates.
Domlec
Substantially all of Domlec fuel costs flow through a fuel pass-through mechanism which provides the opportunity to recover prudent fuel costs from customers in a timely manner.
50 Emera Inc. — Annual Report 2017
Table of Contents
Management’s Discussion & Analysis
Financial Highlights
| Three months ended | Year ended | |||||||||||||||
| For the | December 31 | December 31 | ||||||||||||||
| millions of Canadian dollars (except per share amounts) | 2017 | 2016 | 2017 | 2016 | ||||||||||||
| Marketing and trading margin (1) (2) |
$ | 24 | $ | 23 | $ | 44 | $ | 58 | ||||||||
| Electricity sales (3) |
115 | 109 | 345 | 460 | ||||||||||||
| Total operating revenues – non-regulated |
139 | 132 | 389 | 518 | ||||||||||||
| Non-regulated fuel for generation and purchased power (4) |
65 | 84 | 214 | 334 | ||||||||||||
| Adjusted contribution to consolidated net income |
$ | 26 | $ | 5 | $ | 24 | $ | 24 | ||||||||
| Revaluation of US non-regulated deferred income taxes |
$ | 12 | $ | — | $ | 12 | $ | — | ||||||||
| After-tax derivative mark-to-market gain (loss) |
$ | (48 | ) | $ | (36 | ) | $ | 57 | $ | (134 | ) | |||||
| Contribution to consolidated net income |
$ | (10 | ) | $ | (31 | ) | $ | 93 | $ | (110 | ) | |||||
| Adjusted contribution to consolidated earnings per common share – basic |
$ | 0.12 | $ | 0.02 | $ | 0.11 | $ | 0.14 | ||||||||
| Contribution to consolidated earnings per common share – basic |
$ | (0.05 | ) | $ | (0.15 | ) | $ | 0.44 | $ | (0.64 | ) | |||||
| Adjusted EBITDA |
$ | 61 | $ | 25 | $ | 107 | $ | 99 | ||||||||
| (1) | Marketing and trading margin represents Emera Energy Service’s purchases and sales of natural gas and electricity, pipeline capacity costs and energy asset management services’ revenues. |
| (2) | Marketing and trading margin excludes a pre-tax mark-to-market loss of $37 million in Q4 2017 (2016 – $64 million loss) and a gain of $119 million for the year ended December 31, 2017 (2016 – $203 million loss). |
| (3) | Electricity sales exclude a pre-tax mark-to-market loss of $40 million in Q4 2017 (2016 – nil) and a loss of $43 million for the year ended December 31, 2017 (2016 – $7 million loss). |
| (4) | Non-regulated fuel for generation and purchased power excludes a pre-tax mark-to-market gain of $3 million in Q4 2017 (2016 – $13 million gain) and a loss of $1 million for the year ended December 31, 2017 (2016 – $18 million gain). |
Revaluation of US Non-regulated Deferred Income Taxes
Due to the enactment of US Tax Cuts and Jobs Act of 2017, Emera Energy recorded a non-cash income tax recovery resulting from the provisional revaluation of the existing US non-regulated net deferred income tax liabilities. This provisional revaluation of an existing liability is not the result of any operational or market driven event and therefore management believes excluding from adjusted net income the effect of this provisional revaluation better distinguishes the ongoing operations of the business, and allows investors to better understand and evaluate the Company.
Emera Inc. — Annual Report 2017 51
Table of Contents
Mark-to-Market Adjustments
Emera Energy’s “Marketing and trading margin”, “Electricity sales”, “Non-regulated fuel for generation and purchased power”, “Income from equity investments” and “Income tax expense (recovery)” are affected by mark-to-market (“MTM”) adjustments. Management believes excluding the effect of MTM valuations, and changes thereto, from income until settlement better matches the financial effect of these contracts with the underlying cash flows. Variance explanations of the MTM changes for this quarter and YTD are explained in the chart below.
Emera Energy has a number of asset management agreements (“AMA”) with counterparties, including local gas distribution utilities, power utilities, and natural gas producers in northeastern North America. The AMAs involve Emera Energy buying or selling gas for a specific term, and the corresponding release of the counterparties’ gas transportation/storage capacity to Emera Energy. MTM adjustments on these AMAs arise on the price differential between the point where gas is sourced and where it is delivered. At inception, the MTM adjustment is offset fully by the value of the corresponding gas transportation asset, which is amortized over the term of the AMA contract.
Subsequent changes in gas price differentials, to the extent they are not offset by the accounting amortization of the gas transportation asset, will result in MTM gains or losses recorded in income. MTM adjustments may be substantial during the term of the contract, especially in the winter months of a contract when delivered volumes and market volatility are usually at peak levels. As a contract is realized, and volumes reduce, MTM volatility is expected to decrease. Ultimately, the gas transportation asset and the MTM adjustment reduce to zero at the end of the contract term. As the business grows, and AMA volumes increase, MTM volatility resulting in gains and losses may also increase.
| Three months ended | Year ended | |||||||||||||
| For the | December 31 | December 31 | ||||||||||||
| millions of Canadian dollars | ||||||||||||||
| Contribution to consolidated net income – 2016 |
$ | (31 | ) | $ | (110 | ) | ||||||||
| Increased marketing and trading margin quarter-over-quarter and decreased marketing and trading margin year-over-year – see Marketing and Trading Margin section below |
1 | (14 | ) | |||||||||||
| Increased electricity sales quarter-over-quarter, primarily due to higher capacity revenue for NEGG, partially offset by decreased electricity sales at Bayside Power. Year-over-year decrease due to lower hedged power prices in Q1 2017 compared to Q1 2016, lower sales volumes as a result of an unplanned outage at the Bridgeport Facility in 2017 and less favourable market conditions in 2017, partially offset by the fourth quarter factors noted above |
6 | (115 | ) | |||||||||||
| Decreased non-regulated fuel for generation and purchased power quarter-over-quarter, primarily due to decreased natural gas purchases at Bayside Power. Year-over-year also due to decreased sales volumes as a result of an unplanned outage at the Bridgeport Facility in 2017, lower hedged natural gas prices in Q1 2017 compared to Q1 2016, recognition of prior period state fuel taxes in Q2 2016 and less favourable market conditions in 2017 |
19 | 120 | ||||||||||||
| Increased income tax expense, primarily due to increased income before provision for income taxes |
(12 | ) | (1 | ) | ||||||||||
| Decreased mark-to-market, net of tax quarter-over-quarter, primarily due to changes in existing positions. Year-over-year increase due to changes in existing positions on long-term natural gas contracts and the reversal of 2016 mark-to-market losses |
(12 | ) | 191 | |||||||||||
| Revaluation of US non-regulated deferred income taxes due to tax reform |
12 | 12 | ||||||||||||
| Other |
7 | 10 | ||||||||||||
| Contribution to consolidated net income – 2017 |
$ | (10 | ) | $ | 93 | |||||||||
A portion of earnings are exposed to foreign exchange fluctuations, thereby affecting adjusted CAD contribution to net earnings. The impact of the change in USD/CAD exchange rate quarter-over-quarter decreased the loss in CAD by $1 million in Q4 2017 compared to Q4 2016. Year- over-year the impact of the change in the foreign exchange rate decreased CAD adjusted earnings by $10 million in 2017 compared to 2016.
52 Emera Inc. — Annual Report 2017
Table of Contents
Management’s Discussion & Analysis
Energy Services
Emera Energy Services (“EES”) derives revenue and earnings from the wholesale marketing and trading of natural gas, electricity and other energy-related commodities and derivatives within the Company’s risk tolerances, including those related to value-at-risk (“VaR”) and credit exposure. EES purchases and sells physical natural gas and electricity, the related transportation and transmission capacity rights, and provides related energy asset management services. EES is also responsible for commercial management of electricity production and fuel procurement for Emera Energy Generation’s fleet. The primary market area for the natural gas and power marketing and trading business is northeastern North America, including the Marcellus shale gas region. EES also participates in the US Gulf Coast and Midwest/Central Canadian natural gas markets. Its counterparties include electric and gas utilities, natural gas producers, electricity generators and other marketing and trading entities. EES operates in a competitive environment, and the business relies on knowledge of the region’s energy markets, understanding of pipeline and transmission infrastructure, a network of counterparty relationships and a focus on customer service. EES manages its commodity risk by limiting open positions, utilizing financial products to hedge purchases and sales, and investing in transportation capacity rights to enable movement across its portfolio.
Adjusted EBITDA
Adjusted EBITDA for Emera Energy Services is summarized in the following table:
| Three months ended | Year ended | |||||||||||||||
| For the | December 31 | December 31 | ||||||||||||||
| millions of Canadian dollars | 2017 | 2016 | 2017 | 2016 | ||||||||||||
| Marketing and trading margin |
$ | 24 | $ | 23 | $ | 44 | $ | 58 | ||||||||
| OM&G |
5 | 7 | 19 | 22 | ||||||||||||
| Other income (expenses), net |
1 | 1 | — | (3 | ) | |||||||||||
| Adjusted EBITDA |
$ | 20 | $ | 17 | $ | 25 | $ | 33 | ||||||||
Marketing and Trading Margin
Marketing and trading margin increased $1 million to $24 million in Q4 2017 compared to $23 million in Q4 2016. For the year ended December 31, 2017, marketing and trading margin decreased $14 million to $44 million compared to $58 million in 2016. This reflected weaker market conditions in 2017 compared to 2016, specifically the impact of weather in Q1 and Q3 and increased gas transportation infrastructure in the northeastern United States that resulted in fewer optimization opportunities. This was partially offset by lower short-term fixed cost commitments for transportation and growth in the volume of business in 2017.
Emera Inc. — Annual Report 2017 53
Table of Contents
Generation
Emera Energy wholly owns and operates a portfolio of high efficiency, non-utility electricity generating facilities in northeast North America.
Information regarding Emera Energy’s wholly owned generation facilities is summarized in the following table:
| Wholly owned generation facilities |
Location | Capacity (MW) | Commissioning/ in-service date |
Fuel | Description | |||||||
| New England |
||||||||||||
| Bridgeport |
Connecticut | 560 | 1999 | Natural gas | Selling electricity and capacity to ISO-NE | |||||||
| Tiverton (1) |
Rhode Island | 290 | 2000 | Natural gas | Selling electricity and capacity to ISO-NE | |||||||
| Rumford |
Maine 265 | 2000 | Natural gas | Selling electricity and capacity to ISO-NE | ||||||||
| Total New England |
1,115 | |||||||||||
| Maritime Canada |
||||||||||||
| Bayside |
New Brunswick | 290 | 2001 | Natural gas | Long-term power purchase agreement (“PPA”) November – March; Selling electricity to Maritimes and ISO-NE for remainder of year; Selling capacity to ISO-NE | |||||||
| Brooklyn |
Nova Scotia | 30 | 1996 | Biomass | Long-term PPA | |||||||
| Total Maritime Canada |
320 | |||||||||||
| Total EEG |
1,435 | |||||||||||
| (1) | In Q4 2016, an upgrade at Tiverton increased its nameplate capacity from 265 MW to 290 MW. |
For the portion of output not committed under PPAs, Emera Energy’s generation facilities sell into price-based competitive markets and earn revenues through the physical delivery of power and ancillary services, such as load regulation. The NEGG Facilities also participate in the regional capacity market and are compensated for being available to provide power. The electricity generation business in the northeast is seasonal due largely to fuel prices and power demand. Winter and summer are generally the strongest periods, reflecting colder weather and fewer daylight hours in the winter season, and cooling load in the summer.
54 Emera Inc. — Annual Report 2017
Table of Contents
Management’s Discussion & Analysis
Emera Energy Generation
Adjusted EBITDA
Adjusted EBITDA is summarized in the following tables:
| For the | Three months ended December 31 | |||||||||||||||||||||||
| New England | Maritime Canada | Total | ||||||||||||||||||||||
| millions of Canadian dollars | 2017 | 2016 | 2017 | 2016 | 2017 | 2016 | ||||||||||||||||||
| Energy sales |
$ | 78 | $ | 70 | $ | 9 | $ | 29 | $ | 87 | $ | 99 | ||||||||||||
| Capacity and other |
27 | 10 | 1 | — | 28 | 10 | ||||||||||||||||||
| Electricity sales |
$ | 105 | $ | 80 | $ | 10 | $ | 29 | $ | 115 | $ | 109 | ||||||||||||
| Non-regulated fuel for generation and purchased power |
63 | 61 | 1 | 22 | 64 | 83 | ||||||||||||||||||
| Provincial, state and municipal taxes |
3 | 3 | — | 1 | 3 | 4 | ||||||||||||||||||
| OM&G |
11 | 11 | 4 | 4 | 15 | 15 | ||||||||||||||||||
| Other income (expenses), net |
1 | 1 | — | — | 1 | 1 | ||||||||||||||||||
| Adjusted EBITDA |
$ | 29 | $ | 6 | $ | 5 | $ | 2 | $ | 34 | $ | 8 | ||||||||||||
| For the | Year ended December 31 | |||||||||||||||||||||||
| New England | Maritime Canada | Total | ||||||||||||||||||||||
| millions of Canadian dollars | 2017 | 2016 | 2017 | 2016 | 2017 | 2016 | ||||||||||||||||||
| Energy sales |
$ | 210 | $ | 327 | $ | 53 | $ | 86 | $ | 263 | $ | 413 | ||||||||||||
| Capacity and other |
79 | 47 | 3 | — | 82 | 47 | ||||||||||||||||||
| Electricity sales |
$ | 289 | $ | 374 | $ | 56 | $ | 86 | $ | 345 | $ | 460 | ||||||||||||
| Non-regulated fuel for generation and purchased power |
175 | 261 | 35 | 65 | 210 | 326 | ||||||||||||||||||
| Provincial, state and municipal taxes |
11 | 8 | 1 | 1 | 12 | 9 | ||||||||||||||||||
| OM&G |
39 | 42 | 19 | 21 | 58 | 63 | ||||||||||||||||||
| Other income (expenses), net |
1 | 1 | — | 1 | 1 | 2 | ||||||||||||||||||
| Adjusted EBITDA |
$ | 65 | $ | 64 | $ | 1 | $ | — | $ | 66 | $ | 64 | ||||||||||||
Adjusted EBITDA increased $26 million to $34 million in Q4 2017 from $8 million in Q4 2016 mainly due to higher capacity prices that came into effect for NEGG in June 2017, more favourable market conditions in Q4 2017 and fewer planned outage hours at Tiverton Power in Q4 2017. The reduction in energy sales and non-regulated fuel for generation and purchased power in Maritime Canada in Q4 2017 reflects the renegotiation of the Bayside Power PPA for the winter of 2017/2018, providing the counterparty with increased dispatch flexibility, while maintaining the net revenue stream for the facility.
Adjusted EBITDA increased $2 million to $66 million in 2017 from $64 million in 2016. Absent the $20 million in prior period state fuel taxes at NEGG, adjusted EBITDA would have decreased $18 million in 2017 compared to 2016. This is mainly due to lower realized energy margins in NEGG in 2017, reflecting more favourable short-term energy hedges in Q1 2016 compared to Q1 2017, lower energy sales volumes due to the unplanned outage at the Bridgeport Facility and less favourable market conditions in Q1 and Q3 2017. These factors were partially offset by higher capacity prices that came into effect for NEGG in June 2017.
Emera Inc. — Annual Report 2017 55
Table of Contents
Operating Statistics
| For the | Three months ended December 31 | |||||||||||||||||||||||
| Sales volumes (GWh)(1) | Plant availability (%)(2) | Net capacity factor (%)(3) | ||||||||||||||||||||||
| 2017 | 2016 | 2017 | 2016 | 2017 | 2016 | |||||||||||||||||||
| New England |
1,413 | 1,264 | 94.9% | 88.5% | 57.4% | 51.7% | ||||||||||||||||||
| Maritime Canada |
40 | 420 | 77.8% | 85.5% | 5.6% | 61.0% | ||||||||||||||||||
| Total |
1,453 | 1,684 | 91.0% | 87.8% | 45.8% | 53.8% | ||||||||||||||||||
| For the | Year ended December 31 | |||||||||||||||||||||||
| Sales volumes (GWh)(1) | Plant availability (%)(2) | Net capacity factor (%)(3) | ||||||||||||||||||||||
| 2017 | 2016 | 2017 | 2016 | 2017 | 2016 | |||||||||||||||||||
| New England |
3,909 | 5,221 | 81.8% | 90.9% | 40.0% | 54.3% | ||||||||||||||||||
| Maritime Canada |
700 | 1,713 | 73.0% | 86.7% | 25.0% | 62.5% | ||||||||||||||||||
| Total |
4,609 | 6,934 | 79.9% | 90.0% | 36.7% | 56.1% | ||||||||||||||||||
| (1) | Sales volumes represent the actual electricity output of the plants. |
| (2) | Plant availability represents the percentage of time in the period that the plant was available to generate power regardless of whether it was running. Effectively, it represents 100% availability reduced by planned and unplanned outages. |
| (3) | Net capacity factor is the ratio of the utilization of an asset as compared to its maximum capability, within a particular time frame. It is generally a function of plant availability and plant economics vis-à-vis the market. |
NEGG sales volumes, plant availability and net capacity factor were higher quarter-over-quarter due to fewer planned outage hours at Tiverton Power in Q4 2017 compared to Q4 2016.
Maritime Canada sales volumes and net capacity factor were lower quarter-over-quarter reflecting negotiated changes to Bayside Power’s PPA for the 2017/2018 winter period. The decrease in plant availability reflects the timing of planned outages at Bayside Power quarter-over-quarter.
NEGG sales volumes, plant availability and net capacity factor were lower year-over-year due to the impact of an unplanned outage at the Bridgeport Facility from mid-March 2017 to mid-June 2017 and less favourable market conditions in 2017 compared to 2016, partially offset by fewer planned outage hours at Tiverton Power in 2017.
Maritime Canada sales volumes, plant availability and net capacity factor were lower year-over-year due to a planned outage at the Bayside Facility in Q2 2017, less favourable market conditions in 2017 compared to 2016 and the negotiated changes to Bayside Power’s PPA for the 2017/2018 winter period.
56 Emera Inc. — Annual Report 2017
Table of Contents
Management’s Discussion & Analysis
Financial Highlights
| For the | Three months ended December 31 |
Year ended December 31 | ||||||||||||||
| millions of Canadian dollars (except per share amounts) | 2017 | 2016 | 2017 | 2016 | ||||||||||||
| Operating revenues – regulated gas |
$ | 13 | $ | 12 | $ | 52 | $ | 38 | ||||||||
| Non-regulated operating revenue |
19 | 28 | 75 | 55 | ||||||||||||
| Total operating revenue |
$ | 32 | $ | 40 | $ | 127 | $ | 93 | ||||||||
| Intercompany revenue (1) |
10 | 10 | 39 | 39 | ||||||||||||
| Income from equity earnings |
26 | 20 | 96 | 86 | ||||||||||||
| Interest expense, net (2) |
76 | 76 | 293 | 328 | ||||||||||||
| Adjusted contribution to consolidated net income |
$ | (1 | ) | $ | (17 | ) | $ | (88 | ) | $ | 2 | |||||
| After-tax mark-to-market gain (loss) |
— | 2 | 2 | (114 | ) | |||||||||||
| Revaluation of US non-regulated deferred income taxes |
(46 | ) | — | (46 | ) | — | ||||||||||
| Contribution to consolidated net income (loss) |
$ | (47 | ) | $ | (15 | ) | $ | (132 | ) | $ | (112 | ) | ||||
| Adjusted contribution to consolidated earnings per common share – basic |
$ | — | $ | (0.08 | ) | $ | (0.41 | ) | $ | 0.01 | ||||||
| Contribution to consolidated earnings per common share – basic |
$ | (0.22 | ) | $ | (0.07 | ) | $ | (0.62 | ) | $ | (0.65 | ) | ||||
| Adjusted EBITDA |
$ | 45 | $ | 25 | $ | 136 | $ | 262 | ||||||||
| (1) | Intercompany revenue consists of interest from Brunswick Pipeline, M&NP and EEG. |
| (2) | Interest expense, net excludes a pre-tax mark-to-market gain of $3 million year-to-date 2017 (2016 – $ 2 million). |
Revaluation of US Non-regulated Deferred Income Taxes
Due to the enactment of US Tax Cuts and Jobs Act of 2017, Corporate recorded a non-cash income tax expense resulting from the provisional revaluation of the existing US non-regulated net deferred income tax assets. This provisional revaluation of an existing asset is not the result of any operational or market driven event and therefore management believes excluding from adjusted net income the effect of this provisional revaluation better distinguishes the ongoing operations of the business, and allows investors to better understand and evaluate the Company.
Emera Inc. — Annual Report 2017 57
Table of Contents
Net Income
Highlights of the income changes are summarized in the following table:
| For the |
Three months ended | Year ended | ||||||
| millions of Canadian dollars | December 31 | December 31 | ||||||
| Contribution to consolidated net income (loss) – 2016 |
$ | (15 | ) | $ | (112 | ) | ||
| (Decreased) increased operating revenue – see Operating Revenues below |
(8 | ) | 34 | |||||
| Increased OM&G quarter-over-quarter due to higher project spend. Decreased costs year-over-year, primarily due to 2016 costs related to the TECO Energy acquisition |
(3 | ) | 84 | |||||
| Income from equity investments – see Income from Equity Investments below |
6 | 10 | ||||||
| 2016 gain/loss on sale of APUC common shares, pre-tax |
12 | (160 | ) | |||||
| 2016 gain on conversion of APUC subscription receipts and dividend equivalents into APUC common shares, pre-tax |
— | (63 | ) | |||||
| Decreased other non-regulated direct costs quarter-over-quarter as a result of lower project activity at Emera Utility Services in Q4 2017. Increased other non-regulated direct costs year-over-year, primarily due to increased project activity at Emera Utility Services |
13 | (17 | ) | |||||
| Decreased interest expense – see Interest Expense below |
— | 35 | ||||||
| Revaluation of US non-regulated deferred income taxes due to tax reform |
(46 | ) | (46 | ) | ||||
| After-tax mark-to-market loss primarily related to the 2016 adjustments from forward contracts economically hedging the debenture offering and the translation of the USD cash balance |
(2 | ) | 116 | |||||
| Other |
(4 | ) | (13 | ) | ||||
| Contribution to consolidated net income (loss) – 2017 |
$ | (47 | ) | $ | (132 | ) | ||
Operating Revenues
Operating revenues decreased $8 million to $32 million in Q4 2017 compared to $40 million in Q4 2016 as a result of decreased project activity at Emera Utility Services. Operating revenues for the year ended December 31, 2017 increased $34 million to $127 million compared to $93 million in 2016. The increase was primarily due to increased project activity year-over-year at Emera Utility Services and funding commitments made to New Mexico related to the TECO Energy acquisition in Q3 2016.
Income from Equity Investments
Income from equity investments are summarized in the following table:
| For the | Three months ended December 31 |
Year ended December 31 |
||||||||||||||
| millions of Canadian dollars | 2017 | 2016 | 2017 | 2016 | ||||||||||||
| APUC – sold in 2016 |
$ | — | $ | — | $ | — | $ | 18 | ||||||||
| M&NP |
6 | 6 | 23 | 23 | ||||||||||||
| NSPML |
10 | 6 | 36 | 21 | ||||||||||||
| LIL |
10 | 8 | 37 | 24 | ||||||||||||
| Income from equity investments |
$ | 26 | $ | 20 | $ | 96 | $ | 86 | ||||||||
Income from equity investments increased $6 million to $26 million in Q4 2017 compared to $20 million in Q4 2016. For the year ended December 31, 2017, income from equity investments increased $10 million to $96 million compared to $86 million in 2016. These variances were a result of higher earnings from the increased equity investment in NSPML and LIL, partially offset by the sale of APUC in 2016.
Interest Expense
Interest expense for the three months ended December 31, 2017 remained unchanged compared to the same period in 2016. For the year ended December 31, 2017, interest expense decreased $35 million to $293 million compared to $328 million in 2016 as a result of the conversion of the TECO Energy acquisition related convertible debentures, partially offset by the permanent USD denominated debt related to the TECO Energy acquisition in 2016.
58 Emera Inc. — Annual Report 2017
Table of Contents
Management’s Discussion & Analysis
LIQUIDITY AND CAPITAL RESOURCES
The Company generates cash primarily through its investments in various regulated and non-regulated energy related entities and investments. Utility customer bases are diversified by both sales volumes and revenues among customer classes. Emera’s non-regulated businesses provide diverse revenue streams and counterparties to the business. Circumstances that could affect the Company’s ability to generate sufficient cash include general economic downturns in markets served by Emera, the loss of one or more large customers, regulatory decisions affecting customer rates and the recovery of regulatory assets and changes in environmental legislation. Emera’s subsidiaries maintain solid credit metrics and are generally in a financial position to contribute cash dividends to Emera provided they do not breach their debt covenants, where applicable, after giving effect to the dividend payment.
Consolidated Cash Flow Highlights
Significant changes in the statements of cash flows between the years ended December 31, 2017 and 2016 include:
| Year ended December 31 | 2017 | 2016 | $ Change | |||||||||
| millions of Canadian dollars | ||||||||||||
| Cash, cash equivalents and restricted cash, beginning of period |
$ | 491 | $ | 1,092 | $ | (601 | ) | |||||
| Provided by (used in): |
||||||||||||
| Operating cash flow before changes in working capital |
1,297 | 919 | 378 | |||||||||
| Change in working capital |
(104 | ) | 134 | (238 | ) | |||||||
| Operating activities |
1,193 | 1,053 | 140 | |||||||||
| Investing activities |
(1,761 | ) | (9,037 | ) | 7,276 | |||||||
| Financing activities |
593 | 7,448 | (6,855 | ) | ||||||||
| Effect of exchange rate changes on cash and cash equivalents |
(13 | ) | (65 | ) | 52 | |||||||
| Cash, cash equivalents and restricted cash, end of period |
$ | 503 | $ | 491 | $ | 12 | ||||||
Cash Flow from Operating Activities
Refer to Consolidated Income Statement and Operating Cash Flow highlights earlier in the document for details.
Cash Flow Used in Investing Activities
Net cash used in investing activities decreased $7,276 million to $1,761 million for the year ended December 31, 2017 compared to $9,037 million in 2016. The decrease was primarily due to the acquisition of TECO Energy in 2016. This was partially offset by an increase in capital spending and proceeds from the sale of APUC common shares in 2016.
Capital expenditures, including AFUDC and net of proceeds from disposal of assets, for the year ended December 31, 2017 were $1,537 million compared to $1,102 million in 2016. The increase was the result of the acquisition of TECO Energy, additional capital spending in NSPI and Corporate offset by a reduction in capital spending at Emera Caribbean. Details of the capital spend are shown below:
| • | $914 million at Emera Florida and New Mexico (2016 – $573 million); |
| • | $393 million at NSPI (2016 – $309 million); |
| • | $85 million at Emera Maine (2016 – $86 million); |
| • | $72 million at Emera Caribbean (2016 – $87 million); |
| • | $47 million at Emera Energy (2016 – $39 million); and |
| • | $26 million at Corporate and Other (2016 – $8 million). |
Cash Flow from Financing Activities
Net cash provided by financing activities decreased $6,855 million to $593 million for the year ended December 31, 2017 compared to $7,448 million in 2016. The decrease was due to the proceeds of the long-term debt issuance and convertible debentures related to the acquisition of TECO Energy in 2016 and proceeds from the long-term debt issuance at ECI in Q4 2016. This was reduced by increased 2017 borrowings under committed credit facilities, an increase in short term borrowings and an increase in equity issued by Emera in 2017.
Emera Inc. — Annual Report 2017 59
Table of Contents
Working Capital
As at December 31, 2017, Emera’s cash and cash equivalents were $438 million (2016 – $404 million) and Emera’s investment in non-cash working capital was $322 million (2016 – $301 million). Of the cash and cash equivalents held at December 31, 2017, $174 million was held by Emera’s foreign subsidiaries (2016 – $267 million). A portion of these funds are invested in countries that have certain exchange controls, required approvals, and processes for repatriation. Such funds remain available to fund local operating and capital requirements unless repatriated.
Emera’s future liquidity and capital needs will be predominately for working capital requirements and capital expenditures in support of growth throughout the businesses, as well as acquisitions, dividends and debt servicing. In addition to using cash generated from operating activities, Emera uses available cash and credit facility borrowings to support normal operations and capital requirements. Emera may reduce short-term borrowings with cash from operations, long-term borrowings, or equity contributions. Emera has credit facilities with varying maturities that cumulatively provide $3.2 billion of credit (see note 23 and note 25 to the consolidated financial statements for additional information regarding the credit facilities).
As a result of US tax reform, an estimated decrease in cash from operations of $50 million to $200 million annually in Emera’s US businesses is expected. This decrease is primarily due to expected revenue reductions as a result of lower income tax expense and amortization of the deferred tax regulatory liability at the US regulated utilities. Emera currently pays minimal cash taxes as a result of existing tax loss carryforwards and therefore the reduction in cash revenues is not offset by lower cash tax payments over the near term. This decrease will be partially offset by cash refunds associated with AMT credit carryforwards beginning in 2019. In addition, Tampa Electric has filed to collect storm restoration costs in 2018, which if approved, would offset the decrease in cash associated with tax reform in 2018.
Emera believes that its liquidity is adequate given its expected operating cash flows, capital expenditures, and related financing plans.
As at December 31, 2017, commitments for each of the next five years and in aggregate thereafter consisted of the following:
| millions of Canadian dollars | 2018 | 2019 | 2020 | 2021 | 2022 | Thereafter | Total | |||||||||||||||||||||
| Long-term debt principal |
$ | 741 | $ | 1,105 | $ | 646 | $ | 2,204 | $ | 469 | $ | 8,783 | $ | 13,948 | ||||||||||||||
| Interest payment obligations (1) |
537 | 598 | 543 | 496 | 451 | 5,538 | 8,163 | |||||||||||||||||||||
| Purchased power (2) |
234 | 216 | 212 | 209 | 206 | 2,148 | 3,225 | |||||||||||||||||||||
| Transportation (3) |
451 | 298 | 264 | 184 | 172 | 1,339 | 2,708 | |||||||||||||||||||||
| Pension and post-retirement obligations (4) |
112 | 38 | 38 | 39 | 39 | 751 | 1,017 | |||||||||||||||||||||
| Fuel and gas supply |
527 | 176 | 50 | 41 | — | — | 794 | |||||||||||||||||||||
| Capital projects |
413 | 88 | — | — | — | — | 501 | |||||||||||||||||||||
| Long-term service agreements (5) |
75 | 65 | 34 | 44 | 35 | 180 | 433 | |||||||||||||||||||||
| Asset retirement obligations |
2 | 1 | 1 | 42 | 1 | 382 | 429 | |||||||||||||||||||||
| Equity investment commitments (6) |
15 | 5 | 190 | — | — | — | 210 | |||||||||||||||||||||
| Leases and other (7) |
43 | 12 | 10 | 7 | 4 | 61 | 137 | |||||||||||||||||||||
| DSM |
63 | 28 | 18 | 18 | 18 | — | 145 | |||||||||||||||||||||
| Long-term payable |
4 | 4 | 5 | 5 | 5 | 5 | 28 | |||||||||||||||||||||
| Convertible debentures |
— | — | — | — | — | 3 | 3 | |||||||||||||||||||||
| $ | 3,217 | $ | 2,634 | $ | 2,011 | $ | 3,289 | $ | 1,400 | $ | 19,190 | $ | 31,741 | |||||||||||||||
| (1) | Future interest payments are calculated based on the assumption that all debt is outstanding until maturity. For debt instruments with variable rates, interest is calculated for all future periods using the rates in effect at December 31, 2017, including any expected required payment under associated swap agreements. |
| (2) | Annual requirement to purchase electricity production from independent power producers or other utilities over varying contract lengths. |
| (3) | Purchasing commitments for transportation of fuel and transportation capacity on various pipelines. |
| (4) | Defined benefit funding contractual obligations were determined based on funding requirements and assuming pension accruals cease as at December 31, 2017. Credited service and earnings are assumed to be crystallized as at December 31, 2017. The Company’s contractual obligations for post-retirement (non-pension) benefits assumes members must be age 55 or over (50 for TECO Energy) as at December 31, 2017 to be eligible. As the defined benefit pension plans currently undergoes regular reviews to revise contribution requirements and members are still accruing service under the plans, actual future contributions to the plans will differ from the amounts shown. |
| (5) | Maintenance of certain generating equipment, services related to a generation facility and wind operating agreements, outsourced management of computer and communication infrastructure and vegetation management. |
| (6) | Emera has a commitment in connection with the Federal Loan Guarantee (“FLG”) to complete construction of the Maritime Link. Thirty per cent of the financing of this project will come from Emera as equity. Emera also has a commitment to make equity contributions to LIL upon draw requests from the general partner. The amounts forecasted are a combination of equity investments for both projects and are subject to change in both timing and amount as the projects advance through construction. |
| (7) | Operating lease agreements for office space, land, plant fixtures and equipment, telecommunications services, rail cars and vehicles. |
NSPI has a contractual obligation to pay NSPML for the use of the Maritime Link over approximately 37 years. The UARB has approved NSPI to pay NSPML approximately $110 million and $111 million in 2018 and 2019, respectively. After 2019, the timing and amounts payable to NSPML will be subject to a regulatory filing with the UARB which will be filed no later than 2019 and closer to the timing of the Muskrat Falls project completion.
60 Emera Inc. — Annual Report 2017
Table of Contents
Management’s Discussion & Analysis
Forecasted Gross Consolidated Capital Expenditures
2018 forecasted gross consolidated capital expenditures are as follows:
| millions of Canadian dollars | Emera Florida and New Mexico |
NSPI | Emera Maine |
Emera Caribbean |
Emera Energy |
Corporate and Other |
Total | |||||||||||||||||||||
| Generation |
$ | 242 | $ | 120 | (1) | $ | — | $ | 44 | $ | 51 | $ | — | $ | 457 | |||||||||||||
| New renewable generation |
601 | — | — | 7 | — | — | 608 | |||||||||||||||||||||
| Transmission |
62 | 83 | 38 | 7 | — | — | 190 | |||||||||||||||||||||
| Distribution |
224 | 103 | 26 | 37 | — | — | 390 | |||||||||||||||||||||
| Gas transmission and distribution |
315 | — | — | — | — | — | 315 | |||||||||||||||||||||
| Facilities, equipment, vehicles, and other |
138 | 54 | 24 | 13 | — | 38 | 267 | |||||||||||||||||||||
| $ | 1,582 | $ | 360 | $ | 88 | $ | 108 | $ | 51 | $ | 38 | $ | 2,227 | |||||||||||||||
| (1) | Included within NSPI Generation is $55 million in hydro refurbishments. |
In addition to funds generated from operations, Emera and its subsidiaries have, in aggregate, access to approximately $3.2 billion committed syndicated revolving bank lines of credit in either CAD or USD per the table below.
| millions of dollars | Maturity | Revolving credit |
Utilized | Undrawn and |
||||||||||
| Emera – Operating and acquisition credit facility |
June 2020 – Revolver | $ | 900 | $ | 173 | $ | 727 | |||||||
| Emera Florida and New Mexico – in USD – credit facilities |
March 2018 – March 2022 | 1,600 | 991 | 609 | ||||||||||
| NSPI – Operating credit facility |
October 2021 – Revolver | 600 | 365 | 235 | ||||||||||
| Emera Maine – in USD – Operating credit facility |
September 2019 – Revolver | 80 | 43 | 37 | ||||||||||
| Other – in USD – Operating credit facilities |
Various | 32 | 5 | 27 | ||||||||||
Emera and its subsidiaries have certain financial and other covenants associated with their debt and credit facilities. Covenants are tested regularly and the Company is in compliance with covenant requirements as at December 31, 2017. Emera’s significant covenant is listed below:
| Financial covenant | Requirement | As at December 31, 2017 | ||||
| Emera |
||||||
| Syndicated credit facilities |
Debt to capital ratio | Less than or equal to 0.70 to 1 | 0.61:1 | |||
Emera’s future liquidity and capital needs will be predominately for working capital requirements and capital expenditures in support of growth throughout the businesses, potential new acquisitions, dividends and debt servicing. These liquidity and capital needs will be financed through internally generated cash flows, short-term credit facilities, and ongoing access to capital markets.
Emera Inc. — Annual Report 2017 61
Table of Contents
Emera and its subsidiaries’ recent financing activities are discussed below.
Emera
On December 12, 2017, Emera exercised its accordion option under its revolving credit facility to increase the facility from $700 million to $900 million with no other change to existing terms.
Emera Florida and New Mexico
On November 2, 2017, TEC entered into a $300 million USD non-revolving term loan with a maturity date of November 1, 2018. The loan contains customary representations and warranties, events of default, financial and other covenants and bears interest at LIBOR plus a margin.
On November 1, 2017, TECO Energy/Finance repaid a $300 million USD note upon maturity. The note was repaid using funds from existing credit facilities and cash on hand.
On March 22, 2017, TECO Energy/Finance extended the maturity date of its $300 million USD bank credit facility from December 17, 2018 to March 22, 2022 with no significant change in commercial terms from the prior agreement.
On March 22, 2017, TEC extended the maturity date of its $325 million USD bank credit facility from December 17, 2018 to March 22, 2022, and reduced the existing letter of credit facility to $50 million USD from $200 million USD. There were no other significant changes in commercial terms from the prior agreement.
On March 22, 2017, NMGC extended the maturity date of its $125 USD million bank credit facility from December 17, 2018 to March 22, 2022 with no significant change in commercial terms from the prior agreement.
On March 8, 2017, TECO Energy/Finance extended the maturity date of its $400 million USD term bank credit facility from March 14, 2017 to March 8, 2018 with no significant change in commercial terms from the prior agreement.
Emera Maine
On September 27, 2017 Emera Maine completed a 30-year $50 million USD senior unsecured notes issuance. The notes bear interest at a rate of 4.36 per cent and will mature on September 27, 2047. Proceeds were used to repay maturing notes and for general corporate purposes.
BLPC
On September 1, 2017, BLPC’s interest rate on their two $20 million BBD secured fixed rate senior notes maturing in 2020 and 2024 were reduced to 4.25 per cent and 5.875 per cent from 6.65 per cent and 6.875 per cent, respectively. Effective October 11, 2017, interest on their $12 million BBD demand loan facility was reduced to 4 per cent from 6.5 per cent.
EBP
On July 4, 2017, Emera Brunswick Pipeline amended its Credit Agreement to extend the maturity from February 2019 to February 2021 with no change to commercial terms from the prior agreement.
NSPI
On June 28, 2017, NSPI amended its operating credit facility to extend the maturity from October 2020 to October 2021 and the debt to capitalization ratio from 0.65:1 to 0.70:1. All other terms of the agreement are the same.
GBPC
On March 21, 2017, GBPC amended its loan agreement with the addition of two non-revolving term credit facilities. There were no significant changes in commercial terms from the prior agreement. The combined total of these new facilities is for up to $45 million USD. At December 31, 2017, the facilities were drawn in full.
62 Emera Inc. — Annual Report 2017
Table of Contents
Management’s Discussion & Analysis
Emera and its subsidiaries have been assigned the following senior unsecured debt ratings:
| S&P | Moody’s | DBRS | ||||
| Emera Inc. |
BBB (Stable) | Baa3 (Negative) | N/A | |||
| TECO Energy/TECO Finance |
BBB (Stable) | Baa2 (Stable) | N/A | |||
| TEC |
BBB+ (Stable) | A3 (Stable) | N/A | |||
| NMGC |
BBB+ (Stable) | N/A | N/A | |||
| NSPI |
BBB+ (Stable) | N/A | A (low) (Stable) | |||
On December 22, 2017, DBRS Limited affirmed NSPI’s A (low) issuer and issue rating with stable trends.
On December 21, 2017, Moody’s Investor Services affirmed Emera’s Baa3 issuer rating and Emera US Finance LP’s Baa3 guaranteed senior unsecured rating and changed their ratings outlook to negative from stable. At the same time, Moody’s affirmed the Baa2 senior unsecured ratings of TECO Energy/TECO Finance and the A3 issuer and senior unsecured ratings of Tampa Electric Company, with a stable outlook.
On December 4, 2017, S&P Global Ratings affirmed their BBB+ long term corporate credit rating on Emera, NSPI, TECO Energy/Finance, TEC and NMGC and revised their ratings outlook to stable from negative.
Emera
As at December 31, 2017, Emera had 228.77 million (2016 – 210.02 million) common shares issued and outstanding. For the year ended December 31, 2017, 18.6 million common shares were issued (2016 – 10.82 million) for net proceeds of $857 million (2016 – $466 million).
As at December 31, 2017, Emera had 29 million preferred shares issued and outstanding (2016 – 29 million).
Emera Inc. — Annual Report 2017 63
Table of Contents
For funding purposes, Emera determines required contributions to its largest defined benefit pension plans based on smoothed asset values. This reduces volatility in the cash funding requirement as the impact of investment gains and losses are recognized over a three-year period. The cash required in 2018 for defined benefit pension plans is expected to be $97 million (2017 – $109 million). All pension plan contributions are tax deductible and will be funded with cash from operations.
Emera’s defined benefit pension plans employ a long-term strategic approach with respect to asset allocation, real return and risk. The underlying objective is to earn an appropriate return, given the Company’s goal of preserving capital within an acceptable level of risk for the pension fund investments.
To achieve the overall long-term asset allocation, pension assets are managed by external investment managers per the pension plan’s investment policy and governance framework. The asset allocation includes investments in the assets of Canadian and global equities, domestic and global bonds and short-term investments. Emera reviews investment manager performance on a regular basis and adjusts the plans’ asset mixes as needed in accordance with the pension plans’ investment policy.
Emera’s projected contributions to defined contribution pension plans are $25 million for 2018 (2017 – $23 million actual).
Defined Benefit Pension Plan Summary
| in millions of Canadian dollars | As at December 31, 2017 | |||||||||||||||||||
| Plans by region | TECO Energy Pension Plans |
NSPI Pension Plans |
Emera Maine Pension Plans |
Caribbean Plans |
Total | |||||||||||||||
| Assets as at December 31, 2017 |
$ | 961 | $ | 1,263 | $ | 174 | $ | 10 | $ | 2,408 | ||||||||||
| Accounting obligation at December 31, 2017 |
1,019 | 1,446 | 205 | 13 | 2,683 | |||||||||||||||
| Accounting expense during fiscal 2017 |
$ | 22 | $ | 45 | $ | 5 | $ | 1 | $ | 73 | ||||||||||
64 Emera Inc. — Annual Report 2017
Table of Contents
Management’s Discussion & Analysis
OFF-BALANCE SHEET ARRANGEMENTS
Defeasance
Upon privatization of the former provincially owned Nova Scotia Power Corporation (“NSPC”) in 1992, NSPI became responsible for managing a portfolio of defeasance securities that provide principal and interest streams to match the related defeased debt, which at December 31, 2017 totalled $726 million (2016 – $753 million). The securities are held in trust for Nova Scotia Power Finance Corporation (“NSPFC”), an affiliate of the Province of Nova Scotia. Approximately 80 per cent of the defeasance portfolio consists of investments in the related debt, eliminating all risk associated with this portion of the portfolio; the remaining defeasance portfolio has a market value higher than the related debt, reducing the future risk of this portion of the portfolio.
Under the privatization agreements, NSPI administers the defeasance cash flows and obligations pursuant to a Management and Administration Agreement. The NSPFC bank accounts are included in NSPI’s pool of bank accounts under a mirror netting agreement and therefore, from time to time, if any cash accumulates in the NSPFC bank account it is available until that cash is required to service the defeased NSPC debt.
Guarantees and Letters of Credit
As at December 31, 2017, Emera had several significant guarantees and letters of credit on behalf of third parties outstanding. The following guarantees and letters of credit are not included within the Consolidated Balance Sheets as at December 31, 2017.
TECO Coal was sold on September 21, 2015 to Cambrian Coal Corporation (“Cambrian”). Pursuant to the sales agreement, Cambrian is obligated to file, in respect of each mining permit, applications in connection with the change of control with the appropriate governmental entities. As each application is approved, Cambrian is required to post a bond or other appropriate collateral in order to obtain the release of the corresponding bond secured by the TECO Energy indemnity for that permit. As at December 31, 2017, TECO Energy had remaining indemnified bonds totaling $6 million ($5 million USD).
The amounts outlined above represent the maximum theoretical amounts that TECO Energy would be required to pay to the surety companies.
The Company is working with Cambrian on the process to replace the remaining bonds. Pursuant to the securities purchase agreement, Cambrian has the obligation to indemnify and hold TECO Energy harmless from any losses incurred that arise out of the coal mining permits during the period commencing on the closing date through the date all permit approvals are obtained.
As at December 31, 2017, Emera has a standby letter of credit in the amount of $21 million for the benefit of NSP Maritime Link Inc. (“NSPML”) to guarantee the performance of the obligations of the EUS-Rokstad joint venture. Rokstad Power has issued a separate letter of credit for the benefit of Emera for their portion of the work to be performed under the contract. EUS-Rokstad is a joint venture between EUS and Rokstad Power, formed for the purpose of constructing the high voltage direct current components of NSPML’s transmission line. EUS and Rokstad Power are jointly and severally liable for completion of the project. Subsequent to year end, NSPML has drawn the full amount of the letter of credit, which was funded without recourse to Emera.
Emera has standby letters of credit in the amount of $28 million USD for the benefit of secured parties in connection with a refinancing of the Bear Swamp joint venture and also to third parties that have extended credit to Emera and its subsidiaries. These letters of credit typically have a one-year term and are renewed annually as required.
Emera Reinsurance Limited has issued a standby letter of credit to secure its obligations under reinsurance agreements. The letter of credit expires in December 2018 and is renewed annually. The amount committed as of December 31, 2017 was $6 million USD.
Emera Inc., on behalf of NSPI, has a standby letter of credit to secure obligations under an unfunded pension plan. The letter of credit expires in June 2018 and is renewed annually. The amount committed as at December 31, 2017 was $51 million.
Emera Inc. — Annual Report 2017 65
Table of Contents
Emera targets an average dividend payout ratio of 70 to 75 per cent of adjusted net income. Emera Incorporated’s common share dividends paid in 2017 were $2.1325 ($0.5225 in Q1, Q2 and Q3 and $0.5650 in Q4) per common share and $1.9950 ($0.4750 in Q1 and Q2, and $0.5225 in Q3 and Q4) per common share for 2016, representing a payout ratio of 89.6 per cent of adjusted net income in 2017 and 68.2 per cent for 2016.
On September 29, 2017, Emera’s Board of Directors approved an increase in the annual common share dividend rate from $2.09 to $2.26. The first payment at the increased rate was November 15, 2017. Emera has an eight per cent annual dividend growth target from 2019 to 2020.
ENTERPRISE RISK AND RISK MANAGEMENT
Emera has a business-wide risk management process, monitored by the Board of Directors, to ensure a consistent and coherent approach to risk management. Certain risk management activities for Emera are overseen by the Enterprise Risk Management Committee to ensure such risks are appropriately assessed, monitored and controlled within predetermined risk tolerances established through approved policies.
The Company’s risk management activities are focused on those areas that most significantly impact profitability, quality of income and cash flow. In this section, Emera describes these principal risks that management believes could materially affect its business, revenues, operating income, net income, net assets, liquidity or capital resources. The nature of risk is such that no list is comprehensive, and other risks may arise or risks not currently considered material may become material in the future.
Regulatory and Political Risk
The Company’s rate-regulated subsidiaries and certain investments subject to significant influence are subject to risk of the recovery of costs and investments. As cost-of-service utilities with an obligation to serve customers, Tampa Electric, PGS, NMGC, NSPI, ENL, Emera Maine, BLPC, GBPC, and Domlec must obtain regulatory approval to change electricity rates and/or riders from their respective regulators. Costs and investments can be recovered upon approval by the respective regulator as an adjustment to rates and/or riders, which normally requires a public hearing process or may be mandated by other governmental bodies. In addition, the commercial and regulatory frameworks under which Emera and its subsidiaries operate can be impacted by significant shifts in government policy (including shifts in policy which could occur as a result of climate change concerns) and changes in governments. Emera’s investments in entities in which it has significant influence and which are subject to regulatory risk include NSPML, LIL, M&NP and Lucelec.
During public hearing processes, consultants and customer representatives scrutinize the costs, actions and plans of these rate regulated companies, and their respective regulators determine whether to allow recovery and to adjust rates based upon the evidence and any contrary evidence from other parties. In some circumstances, other government bodies may influence the setting of rates. The subsidiaries manage this regulatory risk through transparent regulatory disclosure, ongoing stakeholder and government consultation and multi-party engagement on aspects such as utility operations, fuel-related audits, rate filings and capital plans. The subsidiaries employ a collaborative regulatory approach through technical conferences and, where appropriate, negotiated settlements.
Brunswick Pipeline has a 25-year firm service agreement, expiring in 2034, with Repsol Energy Canada (“REC”). This firm service agreement was filed with the NEB, and provides for predetermined toll increases after the fifth and fifteenth year of the contract. As a regulated Group II pipeline, the tolls of Brunswick Pipeline are regulated by the NEB on a complaint basis. Persons who cannot resolve traffic, toll and tariff issues with Brunswick Pipeline may file a complaint with the NEB. In the absence of a complaint, the NEB does not normally undertake a detailed examination of Brunswick Pipeline’s tolls.
In 2017, the US government initiated a renegotiation of NAFTA and the overall effects of the renegotiation are uncertain. It is possible that general economic conditions and the local economies in the provinces and states in which Emera operates might be impacted. Emera is monitoring the status of negotiations and is engaged in the matter through government and industry consultation and collaboration.
Weather and Climate Risk
Shifts in weather patterns affect energy sales and associated revenues and costs. Extreme weather events generally result in increased operating costs associated with restoring service to customers as a result of unplanned outages. Emera responds to outages which occur as a result of significant weather events according to each subsidiary’s respective emergency services restoration plan. For certain utilities, restoration costs associated with these significant weather events are recoverable through rates upon regulatory approval. BLPC maintains a Self-Insurance Fund (“SIF”) for the purpose of building an insurance fund to cover risk against damage and consequential loss to certain of BLPC’s generating, transmission and distribution systems.
66 Emera Inc. — Annual Report 2017
Table of Contents
Management’s Discussion & Analysis
Changes in Environmental Legislation
Emera is subject to regulation by federal, provincial, state, regional and local authorities with regard to environmental matters, primarily related to its utility operations. This includes laws setting greenhouse gases (“GHG”) emissions standards and air emissions standards. Emera is also subject to laws regarding waste management, wastewater discharges and aquatic and terrestrial habitats.
Emission reduction requirements are being established by the Government of Canada that will include a national price on carbon in 2018. In the United States, individual states continue to develop or administer GHG reduction initiatives. Changes to GHG emissions standards and air emissions standards could adversely affect Emera’s operations and financial performance. Stricter environmental laws and enforcement of such laws in the future could increase Emera’s exposure to additional liabilities and costs. These changes could also affect earnings and strategy by changing the nature and timing of capital investments.
In addition to imposing continuing compliance obligations, there are permit requirements, laws and regulations authorizing the imposition of penalties for non-compliance, including fines, injunctive relief and other sanctions. The cost of complying with current and future environmental requirements is, and may be, material to Emera. Failure to comply with environmental requirements or to recover environmental costs in a timely manner through rates could have a material adverse effect on Emera. In addition, Emera’s business could be materially affected by changes in government policy, utility regulation, and environmental and other legislation that could occur in response to environmental and climate change concerns.
Emera manages its environmental risk by operating in a manner that is respectful and protective of the environment and with the objective of complying with applicable legal requirements and Company policy. Emera has implemented this policy through the development and application of environmental management systems in its operating subsidiaries. Comprehensive audit programs are also in place to regularly test compliance.
Cybersecurity Risk
Emera’s reliance on information technology systems and network infrastructure to manage its business, including controls for interconnected systems of generation, distribution and transmission, exposes the Company to potential risks related to cybersecurity attack. Attacks can occur over the Internet, through malware, viruses, attachments to e-mails, through persons inside of the organization or through persons with access to systems outside of the organization. A cybersecurity attack could disrupt operations, cause loss of important data or compromise customer, employee-related or other critical information or systems, or otherwise adversely affect Emera’s business, reputation and financial results and condition.
Despite security measures in place, the Company’s systems, assets and information could experience security breaches that could cause system failures, disrupt operations, adversely affect safety, result in loss of service to customers and release of sensitive or confidential information. Should such cybersecurity risks materialize, the Company could suffer costs, losses and damage, all or some of which may not be recoverable through legal, regulatory or other processes. The Company seeks to manage this risk by maintaining a cybersecurity strategy, based on the National Institute of Standards and Technology Cyber Security Framework, to both comply with relevant regulation and sustain industry best-practice governance and capability. The Company provides training to employees regarding cyber risks, including phishing, malware and ransomware to increase awareness of the risks and protect against security breaches.
Energy Consumption Risk
Typical of utilities, Emera’s rate-regulated subsidiaries are affected by demand for energy in the areas in which it operates based upon fluctuations in general economic conditions, such as changes in employment levels, personal disposable income, energy prices and housing starts. Customers’ focus on energy efficiency also results in changes in energy consumption. Government policies promoting distributed generation and new technology developments enabling those policies, particularly with rooftop solar, have the potential to impact how electricity enters the system and how it is bought and sold. This could negatively impact operations, net earnings and cash flows.
Energy costs and clean energy options have increased demand for products enabling the consumers’ ability to self-generate. The Company’s rate-regulated subsidiaries are actively involved in all aspects of customer demand, energy efficiency and government policy to ensure that the impact of these activities benefits customers, are not detrimental to the reliability of the energy service the subsidiary provides, and are accommodated through regulations. Additionally, the Company is monitoring the evolution of distributed generation and technology through its strategic initiatives.
Emera Inc. — Annual Report 2017 67
Table of Contents
Foreign Exchange Risk
The Company is exposed to foreign currency exchange rate changes. Emera operates globally, with an increasing amount of the Company’s adjusted net income earned outside of Canada. As such, Emera is exposed to movements in exchange rates between the Canadian dollar and, particularly, the US dollar, which could positively or adversely affect results.
Consistent with the Company’s risk management policies, Emera manages currency risks through matching US denominated debt to finance its US operations and uses short-term foreign currency derivative instruments to hedge specific transactions. The Company enters into foreign exchange forward and swap contracts to limit exposure on certain foreign currency transactions such as fuel purchases, revenues streams, capital expenditures and projects. The regulatory framework for the Company’s rate-regulated subsidiaries permits the recovery of prudently incurred costs, including foreign exchange.
The Company does not utilize derivative financial instruments for foreign currency trading or speculative purposes or to hedge the value of its investments in foreign subsidiaries. Exchange gains and losses on net investments in foreign subsidiaries are included in accumulated other comprehensive income (loss) (“AOCI”).
Capital Market and Liquidity Risk
Emera’s operations and projects in development require significant capital investments in property, plant and equipment. Consequently, Emera is an active participant in the debt and equity markets. Any disruption in capital markets could have a material impact on Emera’s ability to fund its operations. Capital markets are global in nature and are affected by numerous events throughout the world economy. Capital market disruptions could prevent Emera from issuing new securities or cause the Company to issue securities with less than preferred terms and conditions.
Emera is subject to financial risk associated with changes in its credit ratings. There are a number of factors that rating agencies evaluate to determine credit ratings, including the Company’s business and regulatory framework, the ability to recover costs and earn returns, diversification, leverage, and liquidity. A change to a credit rating as a result of changes in any of these items could result in higher interest rates in future financings, increase borrowing costs under certain existing credit facilities, limit access to the commercial paper market or limit the availability of adequate credit support for subsidiary operations.
Liquidity risk relates to Emera’s ability to ensure sufficient funds are available to meet its financial obligations. Emera manages this risk by forecasting cash requirements on a continuous basis to determine whether sufficient funds are available. Liquidity and capital needs will be financed through internally generated cash flows, short-term credit facilities, and ongoing access to capital markets. The Company reasonably expects liquidity sources to exceed ordinary course capital needs.
Interest Rate Risk
Emera utilizes a combination of fixed and floating rate debt financing for operations and capital expenditures, resulting in an exposure to interest rate risk. Emera seeks to manage interest rate risk through a portfolio approach that includes the use of fixed and floating rate debt with staggered maturities. The Company will, from time to time, issue long-term debt or enter into interest rate hedging contracts to limit its exposure to fluctuations in floating interest rate debt.
For Emera’s regulated subsidiaries, the cost of debt is a component of rates and prudently incurred debt costs are recovered from customers. While regulatory ROE will generally follow the direction of interest rates, such that regulatory ROE’s are likely to fall in times of reducing interest rates and raise in times of increasing interest rates, albeit not directly and generally with a lag period reflecting the regulatory process. Rising interest rates may also negatively affect the economic viability of project development and acquisition initiatives.
Emera Energy Marketing and Trading
The majority of Emera’s portfolio of electricity and gas marketing and trading contracts, and in particular its natural gas asset management arrangements, are contracted on a back-to-back basis, avoiding any material long or short commodity positions. However, the portfolio is subject to commodity price risk, particularly with respect to basis point differentials between relevant markets, in the event of an operational issue or counterparty default.
To measure commodity price risk exposure, Emera employs a number of controls and process, including an estimated value-at-risk (“VaR”) analysis of its exposures. The VaR amount represents an estimate of the potential change in fair value that could occur from changes in market factors within a given confidence level, if an instrument or portfolio is held for a specified time period. The VaR calculation is used to quantify exposure to market risk associated with physical commodities, primarily natural gas and power positions. The Company’s commercial arrangements, including the combination of supply and purchase agreements, asset management agreements, pipeline transportation agreements and financial hedging instruments, as well as its credit policies, counterparty credit assessments, market and credit position reporting, and other risk management and reporting practices, are all used to manage and mitigate this risk.
68 Emera Inc. — Annual Report 2017
Table of Contents
Management’s Discussion & Analysis
Emera Energy Electricity Sales and Non-Regulated Fuel for Generation and Purchased Power
Emera Energy’s natural gas fired plants in the northeastern United States, operating as merchant facilities, are susceptible to the volatility of the New England electricity market and natural gas prices. Market electricity prices are dependent upon a number of factors, including the projected supply and demand of electricity, natural gas prices, the price of other materials used to generate electricity, the cost of complying with applicable environmental and other regulatory requirements and weather conditions. A material change in any one of these factors can materially affect the profitability of the facilities. The Company takes a strategic approach to hedging the volatility of pricing risk in these markets. When market prices are favourable, the Company will typically enter into hedging instruments that effectively fix the price of natural gas and electricity.
Credit Risk
The Company is exposed to credit risk with respect to amounts receivable from customers, energy marketing collateral deposits and derivative assets. Credit risk is the potential loss from a counterparty’s non-performance under an agreement. The Company manages credit risk with policies and procedures for counterparty analysis, exposure measurement, and exposure monitoring and mitigation. Credit assessments are conducted on all new customers and counterparties, and deposits or collateral are requested on any high risk accounts.
Country Risk
Operating revenues outside of Canada constituted 76 per cent (69 per cent from the US and 7 per cent from the Caribbean) of Emera’s total operating revenues in 2017 (2016 – 65 per cent, with 55 per cent from the US and 10 per cent from the Caribbean). Emera’s investments are currently in regions where the political and economic risk levels are considered by the Company to be acceptable. Emera’s operations in some countries may be subject to changes in the rate of economic growth, restrictions on the repatriation of income or capital exchange controls, inflation, the effect of global health, safety and environmental matters or economic conditions and market conditions, and change in financial policy and availability of credit. The Company mitigates this risk through a rigorous approval process for investment, and by forecasting cash requirements on a continuous basis to determine whether sufficient funds are available in all affiliates.
Commercial Relationships Risk
The Company is exposed to commercial relationships risk in respect of its reliance on certain key partners, suppliers and customers. The Company manages its commercial relationships risk by monitoring credit risk, as discussed above in Credit Risk, and monitoring of significant developments with its customers, partners and suppliers.
Commodity Price Risk
A large portion of the Company’s fuel supply comes from international suppliers and is subject to commodity price risk. The Company manages this risk through established processes and practices to identify, monitor, report and mitigate these risks. Fuel contracts may be exposed to broader global conditions, which may include impacts on delivery reliability and price, despite contracted terms. The Company seeks to manage this risk through the use of financial hedging instruments and physical contracts and through contractual protection with counterparties, where applicable. In addition, the adoption and implementation of fuel adjustment mechanisms in its rate-regulated subsidiaries has further helped manage this risk, as the regulatory framework for the Company’s rate-regulated subsidiaries permits the recovery of prudently incurred fuel costs.
Future Employee Benefit Plan Performance and Funding Risk
Certain Emera subsidiaries have both defined benefit and defined contribution employee benefit plans that cover their employees and retirees. All defined benefit plans are closed to new entrants, with the exception of the TECO Energy Group Retirement Plan. The cost of providing these benefit plans varies depending on the plan provisions, interest rates, investment performance and actuarial assumptions concerning the future. Actuarial assumptions include earnings on plan assets, discount rates (interest rates used to determine funding levels, contributions to the plans and the pension and post-retirement liabilities) and expectations around future salary growth, inflation and mortality. Two of the largest drivers of cost are investment performance and interest rates, which are affected by global financial and capital markets. Depending on future interest rates and actual versus expected investment performance, Emera could be required to make larger contributions in the future to fund these plans, which could affect Emera’s cash flows, financial condition and operations.
Each of Emera’s employee defined benefit pension plans are managed according to an approved investment policy and governance framework. Emera employs a long-term approach with respect to asset allocation and each investment policy outlines the level of risk which the Company is prepared to accept with respect to the investment of the pension funds in achieving both the Company’s fiduciary and financial objectives. Studies are routinely undertaken every 3 to 5 years with the objective that the plans’ asset allocations are appropriate for meeting Emera’s long term pension objectives.
Emera Inc. — Annual Report 2017 69
Table of Contents
Labour Risk
Certain Emera employees are subject to collective labour agreements. Approximately 38 per cent of the full-time and term employees within the Emera labour force are represented by unions.
As at December 31, 2017, approximately 10 per cent of the entire labour force is covered by collective labour agreements that will expire within the next 12 months. Emera seeks to manage this risk through ongoing discussions with local unions. The Company maintains contingency plans in each of its operations to manage and reduce the effect of any potential labour disruption.
Information Technology Risk
Emera relies on various information technology systems to manage operations. This subjects Emera to inherent costs and risks associated with maintaining, upgrading, replacing and changing these systems. This includes impairment of its information technology, potential disruption of internal control systems, substantial capital expenditures, demands on management time and other risks of delays, difficulties in upgrading existing systems, transitioning to new systems or integrating new systems into its current systems.
Emera manages this risk through regular IT asset lifecycle management, dedicated project teams, executive oversight and appropriate governance structures and strong project management practices. Employees with extensive subject matter expertise assist in planning, project management, implementation and training. Formal back up and critical incident response practices ensure that continuity is maintained in the event of any disruptions or incidents.
Income Tax Risk
The computation of the Company’s provision for income taxes is impacted by changes in tax legislation in Canada, the United States and the Caribbean. Any such changes could affect the Company’s future earnings, cash flows, and financial position. The value of Emera’s existing deferred tax assets and liabilities are determined by existing tax laws and could be negatively impacted by changes in laws. Although a reduction in the corporate income tax rate could result in lower future tax expense and tax payments, it would also reduce the value of the Company’s existing deferred tax assets and could result in a charge to earnings if written down. US tax reform legislation was enacted on December 22, 2017. Although some of the specific details have yet to be clarified, this legislation has had a negative impact on the Company’s 2017 financial results. Refer to the “Developments” section for further details. Emera monitors the status of existing tax laws to ensure that changes impacting the Company are appropriately reflected in the Company’s tax compliance filings and financial results.
System Operating and Maintenance Risks
The safe and reliable operation of electric generation and electric and natural gas transmission and distribution systems is critical to Emera’s operations. There are a variety of hazards and operational risks inherent in operating electric utilities and natural gas transmission and distribution pipelines. Electric generation, transmission and distribution operations can be impacted by risks such as mechanical failures, activities of third parties, damage to facilities and infrastructure caused by hurricanes, storms, falling trees, lightning strikes, floods, fires and other natural disasters. Natural gas pipeline operations can be impacted by risks such as leaks, explosions, mechanical failures, activities of third parties and damage to the pipelines facilities and equipment caused by hurricanes, storms, floods, fires and other natural disasters. Electric utility and natural gas transmission and distribution pipeline operation interruption could negatively affect revenue, earnings, and cash flows as well as customer and public confidence. Emera manages these risks by investing in a highly skilled workforce, operating prudently, preventative maintenance and making effective capital investments. Insurance, warranties, or recovery through regulatory mechanisms may not cover any or all of these losses, which could adversely affect the Company’s results of operations and cash flows.
Uninsured Risk
Emera and its subsidiaries maintain insurance to cover accidental loss suffered to its facilities and to provide indemnity in the event of liability to third parties. This is consistent with Emera’s risk management policies. There are certain elements of Emera’s operations which are not insured. These include a significant portion of its electric utilities’ transmission and distribution assets, as is customary in the industry. The cost of this coverage is not economically viable. In addition, Emera accepts deductibles and self-insured retentions under its various insurance policies. Insurance is subject to coverage limits as well as time sensitive claims discovery and reporting provisions and there can be no assurance that the types of liabilities or losses that may be incurred by the Company and its subsidiaries will be covered by insurance.
The occurrence of significant uninsured claims, claims in excess of the insurance coverage limits maintained by Emera and its subsidiaries, or claims that fall within a significant self-insured retention could have a material adverse effect on Emera’s results of operations, cash flows and financial position, if regulatory recovery is not available. A limited portion of Emera’s property and casualty insurance is placed with a wholly owned captive insurance company. If a loss is suffered by the captive insurer, it is not able to recover that loss other than through future premiums.
The Company mitigates its uninsured risk by ensuring that insurance limits align with risk exposures, and for uninsured assets and operations, that appropriate risk assessments and mitigation measures are in place. The regulatory framework for the Company’s rate-regulated subsidiaries permits the recovery of prudently incurred costs, including uninsured losses.
70 Emera Inc. — Annual Report 2017
Table of Contents
Management’s Discussion & Analysis
RISK MANAGEMENT INCLUDING FINANCIAL INSTRUMENTS
Emera’s risk management policies and procedures provide a framework through which management monitors various risk exposures. The risk management policies and practices are overseen by the Board of Directors. The Company has established a number of processes and practices to identify, monitor, report on and mitigate material risks to the Company. This includes establishment of the Enterprise Risk Management Committee, whose responsibilities include preparing and updating a “Risk Dashboard” for the Board of Directors on a quarterly basis. Furthermore, a corporate team independent from operations is responsible for tracking and reporting on market and credit risks.
The Company manages its exposure to normal operating and market risks relating to commodity prices, foreign exchange and interest rates through contractual protections with counterparties where practicable, as well as by using financial instruments consisting mainly of foreign exchange forwards and swaps, interest rate options and swaps, and coal, oil and gas futures, options, forwards and swaps. In addition, the Company has contracts for the physical purchase and sale of natural gas. Collectively, these contracts and financial instruments are considered “derivatives”.
The Company recognizes the fair value of all its derivatives on its balance sheet, except for non-financial derivatives that meet the normal purchases and normal sales (“NPNS”) exception. A physical contract generally qualifies for the NPNS exception if the transaction is reasonable in relation to the Company’s business needs, the counterparty owns or controls resources within the proximity to allow for physical delivery, the Company intends to receive physical delivery of the commodity, and the Company deems the counterparty creditworthy. The Company continually assesses contracts designated under the NPNS exception and will discontinue the treatment of these contracts under this exemption where the criteria are no longer met.
Derivatives qualify for hedge accounting if they meet stringent documentation requirements, and can be proven to effectively hedge the identified risk both at the inception and over the term of the instrument. Specifically, for cash flow hedges, the effective portion of the change in the fair value of derivatives is deferred to AOCI and recognized in income in the same period the related hedged item is realized. Any ineffective portion of the change in the fair value of the cash flow hedges is recognized in net income in the reporting period.
Where the documentation or effectiveness requirements are not met, the derivatives are recognized at fair value, with any changes in fair value recognized in net income in the reporting period, unless deferred as a result of regulatory accounting.
Derivatives entered into by Tampa Electric, PGS, NMGC, NSPI and GBPC that are documented as economic hedges, and for which the NPNS exception has not been taken, are subject to regulatory accounting treatment. These derivatives are recorded at fair value on the balance sheet as derivative assets or liabilities. The change in fair value of the derivatives is deferred to a regulatory asset or liability. The realized gain or loss is recognized when the hedged item settles in regulated fuel for generation and purchased power, inventory or property, plant and equipment, depending on the nature of the item being economically hedged. Management believes that any gains or losses resulting from settlement of these derivatives be refunded to or collected from customers in future rates.
Derivatives that do not meet any of the above criteria are designated as HFT and are recognized on the balance sheet at fair value. All gains or losses are recognized in net income of the period unless deferred as a result of regulatory accounting. The Company has not elected to designate any derivatives to be included in the HFT category when another accounting treatment applies.
Emera Inc. — Annual Report 2017 71
Table of Contents
Hedging Items Recognized on the Balance Sheets
The Company has the following categories on the balance sheet related to derivatives in valid hedging relationships:
| As at | December 31 | December 31 | ||||||
| millions of Canadian dollars | 2017 | 2016 | ||||||
| Derivative instrument assets (current and other assets) |
$ | 7 | $ | 10 | ||||
| Derivative instrument liabilities (current and long-term liabilities) |
(7 | ) | (27 | ) | ||||
| Net derivative instrument assets (liabilities) |
$ | — | $ | (17 | ) | |||
Hedging Impact Recognized in Net Income
The Company recognized gains (losses) related to the effective portion of hedging relationships under the following categories:
| For the | Year ended December 31 |
|||||||
| millions of Canadian dollars | 2017 | 2016 | ||||||
| Operating revenues – regulated |
$ | (10 | ) | $ | (12 | ) | ||
| Non-regulated fuel for generation and purchased power |
3 | 2 | ||||||
| Income from equity investments |
— | (1 | ) | |||||
| Effective net gains (losses) |
$ | (7 | ) | $ | (11 | ) | ||
The effective net gains (losses) reflected in the above table would be offset in net income by the hedged item realized in the period.
Regulatory Items Recognized on the Balance Sheets
The Company has the following categories on the balance sheet related to derivatives receiving regulatory deferral:
| As at | December 31 | December 31 | ||||||
| millions of Canadian dollars | 2017 | 2016 | ||||||
| Derivative instrument assets (current and other assets) |
$ | 181 | $ | 229 | ||||
| Regulatory assets (current and other assets) |
13 | 11 | ||||||
| Derivative instrument liabilities (current and long-term liabilities) |
(13 | ) | (12 | ) | ||||
| Regulatory liabilities (current and long-term liabilities) |
(183 | ) | (231 | ) | ||||
| Net asset (liability) |
$ | (2 | ) | $ | (3 | ) | ||
Regulatory Impact Recognized in Net Income
The Company recognized the following net gains (losses) related to derivatives receiving regulatory deferral as follows:
| For the | Year ended December 31 |
|||||||
| millions of Canadian dollars | 2017 | 2016 | ||||||
| Regulated fuel for generation and purchased power (1) |
$ | 17 | $ | 2 | ||||
| Net gains (losses) |
$ | 17 | $ | 2 | ||||
| (1) | Realized gains (losses)on derivative instruments settled and consumed in the period, hedging relationships that have been terminated or the hedged transaction is no longer probable. Realized gains (losses) recorded in inventory will be recognized in “Regulated fuel for generation and purchased power” when the hedged item is consumed. |
72 Emera Inc. — Annual Report 2017
Table of Contents
Management’s Discussion & Analysis
Held-for-trading (“HFT”) Items Recognized on the Balance Sheets
The Company has the following categories on the balance sheet related to HFT derivatives:
| As at | December 31 | December 31 | ||||||
| millions of Canadian dollars | 2017 | 2016 | ||||||
| Derivative instruments assets (current and other assets) |
$ | 63 | $ | 37 | ||||
| Derivative instruments liabilities (current and long-term liabilities) |
(290 | ) | (434 | ) | ||||
| Net derivative instrument assets (liabilities) |
$ | (227 | ) | $ | (397 | ) | ||
Held-for-trading Items Recognized in Net Income
The Company has recognized the following realized and unrealized gains (losses) with respect to HFT derivatives in net income:
| For the | Year ended December 31 |
|||||||
| millions of Canadian dollars | 2017 | 2016 | ||||||
| Non-regulated operating revenues |
$ | 408 | $ | 68 | ||||
| Non-regulated fuel for generation and purchased power |
12 | (7 | ) | |||||
| Other income (expenses), net |
— | (2 | ) | |||||
| Net gains (losses) |
$ | 420 | $ | 59 | ||||
Other Derivatives Recognized on the Balance Sheets
The Company has the following categories on the balance sheet related to other derivatives:
| As at | December 31 | December 31 | ||||||
| millions of Canadian dollars | 2017 | 2016 | ||||||
| Derivative instrument assets (current and other assets) |
$ | 2 | $ | — | ||||
| Derivative instrument liabilities (current and long-term liabilities) |
— | (2 | ) | |||||
| Net derivative instrument assets (liabilities) |
$ | 2 | $ | (2 | ) | |||
Other Derivatives Recognized in Net Income
The Company recognized in net income the following gains (losses) related to other derivatives:
| For the | Year ended December 31 |
|||||||
| millions of Canadian dollars | 2017 | 2016 | ||||||
| Other income (expense) |
$ | — | $ | (87 | ) | |||
| Interest expense, net |
2 | 2 | ||||||
| Total gains (losses) |
$ | 2 | $ | (85 | ) | |||
Emera Inc. — Annual Report 2017 73
Table of Contents
DISCLOSURE AND INTERNAL CONTROLS
Management is responsible for establishing and maintaining adequate disclosure controls and procedures (“DC&P”) and internal control over financial reporting (“ICFR”), as defined in National Instrument 52-109 Certification of Disclosure in Issuers’ Annual and Interim Filings (“NI 52-109”). The Company’s internal control framework is based on the criteria published in the Internal Control – Integrated Framework (2013), a report issued by the Committee of Sponsoring Organizations (“COSO”) of the Treadway Commission. Management, including the Chief Executive Officer and Chief Financial Officer, evaluated the design and effectiveness of the Company’s DC&P and ICFR as at December 31, 2017 to provide reasonable assurance regarding the reliability of financial reporting in accordance with USGAAP.
Change in ICFR
In August 2017, Emera upgraded its Enterprise Resource Planning (“ERP”) system and other associated financial systems in the Company’s Canadian operating entities. This upgrade, which resulted in a material change to the internal controls over financial reporting, was designed to automate certain manual processes and standardize business processes and reporting across the impacted entities. Emera and its affiliates have made appropriate changes to internal controls and procedures, as is expected with a major system implementation, and have concluded that none of the changes resulting from the implementation materially alter the effectiveness of the ICFR.
There were no other changes in the Company’s ICFR during the quarter ended December 31, 2017, that have materially affected, or are reasonably likely to materially affect, the Company’s internal control over financial reporting.
The preparation of consolidated financial statements in accordance with generally accepted accounting principles requires management to make estimates and assumptions that affect the reported amounts of assets and liabilities at the date of the financial statements, and the reported amounts of revenues and expenses during the reporting periods. Management evaluates the Company’s estimates on an ongoing basis based upon historical experience, current conditions and assumptions believed to be reasonable at the time the assumption is made.
Significant areas requiring the use of management estimates relate to rate-regulated assets and liabilities, pension and post-retirement benefits, unbilled revenue, useful lives for depreciable assets, goodwill and long-lived assets impairment assessments, income taxes, asset retirement obligations, capitalized overhead and valuation of financial instruments. Actual results may differ significantly from these estimates.
Rate Regulation
The rate-regulated accounting policies of Tampa Electric, PGS, NMGC, NSPI, Emera Maine, BLPC, GBPC, Domlec, NSPML and Brunswick Pipeline may differ from accounting policies for non-rate-regulated companies, which are subject to examination and approval by their respective regulators. These accounting policy differences occur when the regulators render their decisions on rate applications or other matters, and generally involve a difference in the timing of revenue and expense recognition. The accounting for these items is based on the expectation of the future actions of the regulators. The assumptions and judgments used by regulatory authorities continue to have an impact on the recovery of costs, the rate earned on invested capital and the timing and amount of assets to be recovered. The application of regulatory accounting guidance is a critical accounting policy since a change in these assumptions may result in a material impact on reported assets, liabilities and the results of operations.
Emera has recorded $1,376 million (2016 – $1,322 million) of regulatory assets and $2,468 million (2016 – $1,639 million) of regulatory liabilities as at December 31, 2017.
Accumulated Reserve – Cost of Removal
Tampa Electric, PGS, NMGC and NSPI recognize non-asset retirement obligation costs of removal as regulatory liabilities. These costs of removal represent estimated funds received from customers through depreciation rates to cover future non-legally required cost of removal of property, plant and equipment upon retirement. The companies accrue for removal costs over the life of the related assets based on depreciation studies approved by their respective regulators. The costs are estimated based on historical experience and future expectations, including expected timing and estimated future cash outlays. The balance of the Accumulated reserve – cost of removal within regulatory liabilities is $894 million at December 31, 2017 (2016 – $990 million).
Pension and Other Post-Retirement Employee Benefits
The Company provides post-retirement benefits to employees, including defined benefit pension plans. The cost of providing these benefits is dependent upon many factors that result from actual plan experience and assumptions of future experience.
74 Emera Inc. — Annual Report 2017
Table of Contents
Management’s Discussion & Analysis
The accounting related to employee post-retirement benefits is a critical accounting estimate. Changes in the estimated benefit obligation, affected by employee demographics, including age, compensation levels, employment periods, contribution levels and earnings could have a material impact on reported assets, liabilities, accumulated other comprehensive income and results of operations. Changes in key actuarial assumptions, including anticipated rates of return on plan assets and discount rates used in determining the accrued benefit obligation and benefit costs could change the annual pension funding requirements. This could have a significant impact on the Company’s annual cash requirements.
The pension plan assets are comprised primarily of equity and fixed income investments. Fluctuations in actual equity market returns and changes in interest rates may result in changes to pension costs in future periods.
Emera’s accounting policy is to amortize the net actuarial gain or loss, that exceeds 10 per cent of the greater of the projected benefit obligation / accumulated post-retirement benefit obligation (“PBO”) and the market-related value of assets, over active plan members’ average remaining service period (currently 8.1 years). Emera’s use of smoothed asset values reduces the volatility related to the amortization of actuarial investment experience. As a result, the main cause of volatility in reported pension cost is the discount rate used to determine the PBO.
The discount rate used to determine benefit costs is based on the yield of high quality long-term corporate bonds in each operating entity’s country and is determined with reference to bonds which have the same duration as the PBO as at January 1 of the fiscal year. The following table shows the discount rate for benefit cost purposes and the expected return on plan assets for each plan:
| 2017 | 2016 | |||||||||||||||
| Discount rate for cost |
Expected return on plan |
Discount rate for |
Expected return on plan |
|||||||||||||
| TECO Energy Group Retirement Plan |
4.16% | 7.00% | 3.72% | 7.00% | ||||||||||||
| TECO Energy Group Supplemental Executive Retirement Plan |
3.37%/3.25% | N/A | 2.64% | N/A | ||||||||||||
| TECO Energy Group Benefit Restoration Plan |
3.64% | N/A | 3.12% | N/A | ||||||||||||
| TECO Energy Post-retirement Health and Welfare Plan |
4.28% | N/A | 3.85% | N/A | ||||||||||||
| New Mexico Gas Company Retiree Medical Plan |
4.28% | 7.00% | 3.85% | 5.75% | ||||||||||||
| NSPI |
3.84% | 5.75% | 4.00% | 5.75% | ||||||||||||
| Bangor Hydro (1) |
4.04% | 6.55% | 4.25% | 6.75% | ||||||||||||
| MPS (1) |
3.91% | 6.55% | 4.10% | 6.75% | ||||||||||||
| GBPC |
4.25% | 6.00% | 4.75% | 6.00% | ||||||||||||
| (1) | Effective January 1, 2014, Bangor Hydro Electric Company and Maine Public Service Company merged to become Emera Maine. |
Based on management’s estimate, the reported benefit cost for defined benefit and defined contribution plans is $105 million in 2017 (2016 – $90 million). The reported benefit cost is impacted by numerous assumptions, including the discount rate and asset return assumptions. A 0.25 per cent change in the discount rate and asset return assumptions would have had +/- impact on the 2017 benefit cost of $9 million and $6 million respectively (2016 – $7 million and $4 million).
Unbilled Revenue
Electric revenues are billed on a systematic basis over a one- or two-month period for NSPI and a one-month period for Tampa Electric, PGS, NMGC, Emera Maine, BLPC, GBPC and Domlec. At the end of each month, the Company must make an estimate of energy delivered to customers since the date their meter was last read and of related revenues earned but not yet billed. The unbilled revenue is estimated based on several factors, including current month’s generation, estimated customer usage by class, weather, line losses and applicable customer rates. Based on the extent of the estimates included in the determination of unbilled revenue, actual results may differ from the estimate. At December 31, 2017, unbilled revenues totalled $278 million (2016 – $270 million) on total annual operating revenues of $6,226 million (2016 – $4,277 million).
Property, Plant and Equipment
Property, plant and equipment represents 59 per cent of total assets on the Company’s balance sheet. Included in “Property, plant and equipment” are the generation, transmission and distribution and other assets of the Company. Due to the magnitude of the Company’s property, plant and equipment, changes in estimated depreciation rates can have a material impact on depreciation expense.
Depreciation is determined by the straight-line method, based on the estimated remaining service lives of the depreciable assets in each category. The service lives of regulated property, plant and equipment are determined based on formal depreciation studies and require the appropriate regulatory approval.
Depreciation expense was $833 million for the year ended December 31, 2017 (2016 – $560 million).
Emera Inc. — Annual Report 2017 75
Table of Contents
Goodwill Impairment Assessments
Goodwill is subject to an annual assessment for impairment at the reporting unit level. Reporting units are generally determined at the operating segment level or one level below the operating segment level. Reporting units with similar characteristics are grouped for the purpose of determining impairment, if any, of goodwill. Entities assessing goodwill for impairment have the option of first performing a qualitative assessment to determine whether a quantitative assessment is necessary. If an entity performs the qualitative assessment, but determines that it is more likely than not that its fair value is less than its carrying amount or if an entity chooses to bypass the qualitative assessment, a quantitative test is performed. The quantitative test compares the fair value of the reporting unit to its carrying amount, including goodwill. If the carrying amount of the reporting unit exceeds its fair value, an impairment loss is recorded as a reduction to goodwill and a charge to operating expense.
Application of the goodwill impairment test requires management judgment. Significant assumptions used in these fair value analyses include discount and growth rates, rate case assumptions, valuation of net operating losses, utility sector market performance and transactions, projected operating and capital cash flows for the relevant business and the fair value of debt.
At December 31, 2017, the Company had goodwill with a total carrying amount of $5,805 million (December 31, 2016 – $6,213 million). The change in the carrying value from 2016 to 2017 is a result of the strengthening Canadian dollar on the goodwill balances. This goodwill represents the excess of the acquisition purchase price for TECO Energy (Tampa Electric, PGS and NMGI reporting units), Emera Maine and GBPC over the fair values assigned to individual assets acquired and liabilities assumed.
Determining the fair market value of goodwill is susceptible to changes from period to period as assumptions about future cash flows are required. Adverse regulatory actions, such as significant reductions in the allowed ROE at Tampa Electric, PGS, NMGC, Emera Maine or GBPC could negatively impact goodwill in the future. In addition, changes in significant assumptions, including growth rates, utility sector market performance and transactions, projected operating and capital cash flows from the affiliates businesses, could also negatively impact goodwill in the future.
No impairment provisions with respect to goodwill were required for either 2017 or 2016.
Long-Lived Assets Impairment Assessments
In accordance with accounting guidance for long-lived assets, the Company assesses whether there has been an impairment of long-lived assets and intangibles when such indicators exist. The Company reviews all long-lived assets in the last quarter of each year to ensure that any gradual change over the year and the seasonality of the markets are considered when determining which assets require an impairment analysis. In the case of a triggering event, such as a significant market disruption or sale of a business, the values of related long-lived assets are reviewed outside of this annual analysis.
The Company believes accounting estimates related to asset impairments are critical estimates for the following reasons: 1) the estimates are highly susceptible to change, as management is required to make assumptions based on expectations of the results of operations for significant/indefinite future periods and/or the current market conditions in such periods; 2) markets can experience significant uncertainties; 3) the estimates are based on the ongoing expectations of management regarding probable future uses and holding periods of assets; and 4) the impact of an impairment on reported assets and earnings could be material. The Company’s assumptions relating to future results of operations or other recoverable amounts are based on a combination of historical experience, fundamental economic analysis, observable market activity and independent market studies. The Company’s expectations regarding uses and holding periods of assets are based on internal long-term budgets and projections, which give consideration to external factors and market forces, as of the end of each reporting period. The assumptions made are consistent with generally accepted industry approaches and assumptions used for valuation and pricing activities.
In 2017 an estimated impairment provision was taken on assets in Domlec. Emera’s portion of this provision is immaterial. See “Developments – Domlec” for further details. No impairment provisions with respect to long-lived assets were required for 2016.
Income Taxes
Income taxes are determined based on the expected tax treatment of transactions recorded in the consolidated financial statements. In determining income taxes, tax legislation is interpreted in a variety of jurisdictions, the likelihood that deferred tax assets will be recovered from future taxable income is assessed and assumptions about the expected timing of the reversal of deferred tax assets and liabilities are made. Uncertainty associated with the application of tax statutes and regulations and the outcomes of tax audits and appeals requires judgments and estimates be made in the accrual process and in the calculation of effective tax rates. Only income tax benefits that meet the “more likely than not” threshold may be recognized or continue to be recognized. Unrecognized tax benefits are re-evaluated quarterly and changes are recorded based on new information, including the issuance of relevant guidance by the courts or tax authorities and developments occurring in the examinations of the Company’s tax returns.
76 Emera Inc. — Annual Report 2017
Table of Contents
Management’s Discussion & Analysis
The Company believes that the accounting estimate related to income taxes is a critical estimate for the following reasons: 1) realization of deferred tax assets is dependent upon the generation of sufficient taxable income, both operating and capital, in future periods; 2) a change in the estimated valuation allowance could have a material impact on reported assets and results of operations; and 3) administrative actions of the tax authorities’ changes in tax law or regulation, and the uncertainty associated with the application of tax statutes and regulations could change our estimate of income taxes, including the potential for elimination or reduction of our ability to realize tax benefits and to utilize deferred tax assets.
In response to the enactment of Tax Cuts and Jobs Act on December 22, 2017, Emera recorded a material revaluation of the Company’s US deferred tax assets and liabilities at December 31, 2017. Some of the specific details of the Act have yet to be clarified and therefore, management has estimated the implications of the Act based on the best information available. Any change in assumptions could have a material impact on the results of Emera. See “Developments – US Tax Reform” for further details.
Asset Retirement Obligations
The measurement of the fair value of AROs requires the Company to make reasonable estimates concerning the method and timing of settlement associated with the legally obligated costs. There are uncertainties in estimating future asset-retirement costs due to potential events, such as changing legislation or regulations and advances in remediation technologies. Emera has AROs associated with the remediation of thermal assets, hydro assets, wind assets, combustion turbines, transmission and distribution assets, and pipeline assets.
An ARO represents the fair value of the estimated cash flows necessary to discharge the future obligation using the Company’s credit-adjusted risk free rate. The amounts are reduced by actual expenditures incurred. Estimated future cash flows are based on completed depreciation studies, remediation reports, prior experience, estimated useful lives and governmental regulatory requirements. The present value of the liability is recorded and the carrying amount of the related long-lived asset is correspondingly increased. The amount capitalized at inception is depreciated in the same manner as the related long-lived asset. Over time, the liability is accreted to its estimated future value. Accretion expense is included as part of “Depreciation and amortization”. Any accretion expense not yet approved by the regulator is recorded in “Property, plant and equipment” and included in the next depreciation study. Accordingly, changes to the ARO or cost recognition attributable to changes in the factors discussed above, should not impact the results of operations of the Company.
As at December 31, 2017, the AROs recorded on the balance sheet were $172 million (2016 – $170 million). The Company estimates the undiscounted amount of cash flow required to settle the obligations is approximately $438 million, which will be incurred between 2018 and 2061. The majority of these costs will be incurred between 2028 and 2050.
Capitalized Overhead
As required by their respective regulators, Tampa Electric, PGS, NMGC, NSPI, Emera Maine, BLPC, GBPC, Domlec and NSPML capitalize overhead costs that are not directly attributable to specific utility assets, but to the overall capital expenditure program. The methodology for the calculation of capitalized overhead is approved by their respective regulator. For the year ended December 31, 2017, $156 million of overhead costs (2016 – $111 million) were capitalized to capital assets. Any change in the methodology for the calculation and allocation of overhead costs could have a material impact on the amounts recognized as expenses versus assets.
Financial Instruments
Emera is required to determine the fair value of all derivatives except those which qualify for the normal purchase, normal sale exception. Fair value is the price that would be received for the sale of an asset or paid to transfer a liability in an orderly arms-length transaction between market participants at the measurement date. Fair value measurements are required to reflect the assumptions that market participants would use in pricing an asset or liability based on the best available information, including the risks inherent in a particular valuation technique, such as a pricing model, and the risks inherent in the inputs to the model.
Level Determinations and Classifications
Emera uses the Level 1, 2, 3 and NAV classifications in the fair value hierarchy. The fair value measurement of a financial instrument is included in only one of the three levels and is based on the lowest level input significant to the derivation of the fair value. Fair values are determined, directly or indirectly, using inputs that are unobservable for the asset or liability. Only in limited circumstances does Emera enter into commodity transactions involving non-standard features where market observable data is not available, or contracts in which the terms extend beyond five years.
Emera Inc. — Annual Report 2017 77
Table of Contents
CHANGES IN ACCOUNTING POLICIES AND PRACTICES
The new USGAAP accounting policies that are applicable to, and adopted by, the Company in 2017 are described as follows:
Classification of Certain Cash Receipts and Cash Payments on the Statement of Cash Flows
In August 2016, the FASB issued ASU 2016-15, Classification of Certain Cash Receipts and Cash Payments on the Statement of Cash Flows. The standard provides guidance regarding the classification of certain cash receipts and cash payments on the statement of cash flows, where specific guidance is provided for issues not previously addressed. This guidance is effective for annual reporting periods, including interim reporting within those periods, beginning after December 15, 2017, with early adoption permitted, and is required to be applied on a retrospective approach. The Company has early adopted the standard with no impact on the consolidated financial statements as a result of implementation of this standard.
Restricted Cash on the Statement of Cash Flows
In November 2016, the FASB issued ASU 2016-18, Restricted Cash on the Statement of Cash Flows. The standard requires the Company to show the changes in total cash, cash equivalents, restricted cash and restricted cash equivalents in the statement of cash flows. Transfers between cash and cash equivalents and restricted cash and restricted cash equivalents are no longer presented in the statement of cash flows. This guidance is effective for annual reporting periods, including interim reporting within those periods, beginning after December 15, 2017, with early adoption permitted, and is required to be applied on a retrospective approach. The Company has early adopted this standard. This change in accounting policy has increased net cash used in investing activities by $22 million for the year ended December 31, 2017 (2016 – a decrease of $68 million) within the Consolidated Statement of Cash Flows. Changes in restricted cash are now disclosed within the Consolidated Statement of Cash Flows for all years presented. Restricted cash was $65 million at December 31, 2017 (2016 – $87 million).
Simplifying the Test for Goodwill Impairment
In January 2017, the FASB issued ASU 2017-04, Simplifying the Test for Goodwill Impairment. The standard provides guidance to simplify the subsequent measurement of goodwill by eliminating the second step of the quantitative test. The new guidance does not amend the optional qualitative assessment of goodwill impairment. This guidance is effective for annual reporting periods, including interim reporting within those periods, beginning after December 15, 2019, with early adoption permitted and is required to be applied prospectively. The Company has early adopted the standard with no impact on the consolidated financial statements as a result of implementation of this standard.
78 Emera Inc. — Annual Report 2017
Table of Contents
Management’s Discussion & Analysis
Future Accounting Pronouncements
The Company considers the applicability and impact of all ASUs issued by FASB. The following updates have been issued by FASB, but have not yet been adopted by Emera. Any ASUs not included below were assessed and determined to be either not applicable to the Company or have insignificant impact on the consolidated financial statements.
Revenue from Contracts with Customers
In May 2014, the FASB issued ASU 2014-09, Revenue from Contracts with Customers, which creates a new, principle-based revenue recognition framework, codified as Accounting Standards Codification (“ASC”) Topic 606. The FASB issued amendments to ASC Topic 606 during 2016 to clarify certain implementation guidance and to reflect scope improvements and practical expedients. The guidance will require additional disclosures regarding the nature, amount, timing and uncertainty of revenue and related cash flows arising from contracts with customers. This guidance will be effective for annual reporting periods, including interim reporting within those periods, beginning after December 15, 2017 and will allow for either full retrospective adoption or modified retrospective adoption. The Company will adopt this guidance effective January 1, 2018, using the modified retrospective approach.
The Company implemented a revenue recognition project plan in 2016. In Q1 2017, the Company concluded that the accounting for contributions in aid of construction will be out of the scope of the new standard. In Q2 2017, the Company completed an analysis of material regulated revenue streams and collectability risk and concluded that there will be no material changes on adoption of this standard. In Q3 2017, the Company completed an analysis of material unregulated revenue streams and concluded that there will be no material changes on adoption of this standard. The Company also evaluated the disclosure requirements and determined that the disaggregation of revenue information required by the new standard will not have a significant impact on the Company’s information gathering processes and procedures as the revenue information required by the standard is consistent with historical revenue information gathered by the Company for financial reporting purposes. The Company continues to monitor the assessment of ASC Topic 606 by the AICPA Power and Utilities Revenue Recognition Task Force for developments.
Recognition and Measurement of Financial Assets and Financial Liabilities
In January 2016, the FASB issued ASU 2016-01, Financial Instruments – Recognition and Measurement of Financial Assets and Financial Liabilities. The standard provides guidance for the recognition, measurement, presentation and disclosure of financial assets and liabilities. This guidance will be effective for annual reporting periods, including interim reporting within those periods, beginning after December 15, 2017.
The standard requires investments in equity securities, except those accounted for under the equity method of accounting or those that result in consolidation, to be measured at fair value. The Company will elect to measure equity securities that do not have a readily determinable fair value, at cost minus impairment (if any), plus or minus observable price changes resulting from transactions for the identical or a similar investment of the same issuer. The standard eliminates the available-for-sale classification for equity investments that recognized changes in the fair value as a component of other comprehensive income, resulting in all changes in fair value being recognized in net income. The increase in volatility of Other income (expense), net as a result of the remeasurement of equity investments is not expected to be significant. The Company will adopt this guidance effective January 1, 2018 with a cumulative-effect adjustment of approximately $3 million to retained earnings in the Consolidated Balance Sheet.
Leases
In February 2016, the FASB issued ASU 2016-02, Leases. The standard, codified as ASC Topic 842, increases transparency and comparability among organizations by recognizing lease assets and liabilities on the balance sheet for leases with terms of more than 12 months. Under the existing guidance, operating leases are not recorded as assets and liabilities on the balance sheet. The effect of leases on the Consolidated Statements of Income and the Consolidated Statements of Cash Flows is largely unchanged. The guidance will require additional disclosures regarding key information about leasing arrangements. This guidance is effective for annual reporting periods, including interim reporting within those periods, beginning after December 15, 2018. Early adoption is permitted, and is required to be applied using a modified retrospective approach.
In January 2018, the FASB issued an amendment to ASC Topic 842 which permits companies to elect an optional transition practical expedient to not evaluate existing land easements under the new standard if the land easements were not previously accounted for under existing lease guidance. In November 2017, the FASB voted to amend ASC Topic 842 to allow companies to elect not to restate their comparative periods in the period of adoption when transitioning to the standard. The amendment is expected to be finalized in Q1 2018.
The Company is in the process of evaluating the impact of adoption of this standard on its financial statements and disclosures. In Q3 2017, the Company implemented a project plan. In Q4 2017, the Company began execution of the project plan, including training sessions with key stakeholders throughout the organization and gathering detailed information on existing lease arrangements. This includes evaluating the available practical expedients, calculating the lease asset and liability balances associated with individual contractual arrangements and assessing the disclosure requirements. The Company continues to monitor FASB amendments to ASC Topic 842.
Emera Inc. — Annual Report 2017 79
Table of Contents
Measurement of Credit Losses on Financial Instruments
In June 2016, the FASB issued ASU 2016-13, Measurement of Credit Losses on Financial Instruments. The standard provides guidance regarding the measurement of credit losses for financial assets and certain other instruments that are not accounted for at fair value through net income, including trade and other receivables, debt securities, net investment in leases, and off-balance sheet credit exposures. The new guidance requires companies to replace the current incurred loss impairment methodology with a methodology that measures all expected credit losses for financial assets based on historical experience, current conditions, and reasonable and supportable forecasts. The guidance expands the disclosure requirements regarding credit losses, including the credit loss methodology and credit quality indicators. This guidance will be effective for annual reporting periods, including interim reporting within those periods, beginning after December 15, 2019. Early adoption is permitted for annual reporting periods, including interim periods after December 15, 2018 and will be applied using a modified retrospective approach. The Company is currently evaluating the impact of adoption of this standard on its consolidated financial statements.
Clarifying the Definition of a Business
In January 2017, the FASB issued ASU 2017-01, Clarifying the Definition of a Business. The standard provides guidance to assist entities with evaluating when a set of transferred assets and activities is a business. This guidance will be effective for annual reporting periods, including interim reporting within those periods, beginning after December 15, 2017, with early adoption permitted and is required to be applied prospectively. The adoption of this standard will not have an impact on the Company’s consolidated financial statements.
Improving the Presentation of Net Periodic Pension Cost and Net Periodic Postretirement Benefit Cost
In March 2017, the FASB issued ASU 2017-07, Compensation – Retirement Benefits (Topic 715): Improving the Presentation of Net Periodic Pension Cost and Net Periodic Postretirement Benefit Cost. The guidance requires the service cost component of defined benefit pension or other postretirement benefit plans to be reported in the same line items as other compensation costs. The other components of net benefit cost are required to be presented in the Consolidated Statements of Income outside of income from operations. Only the service cost component will be eligible for capitalization as property, plant and equipment under this guidance. This guidance will be effective for annual reporting periods, including interim reporting within those periods, beginning after December 15, 2017. The guidance is required to be applied retrospectively for presentation in the Consolidated Statements of Income and prospectively for the guidance limiting capitalization. In Q4, 2017 the Company completed an analysis of the impact of the adoption of this standard on the consolidated financial statements and concluded that the impact on the balance sheet will be minimal. The other components of net benefit cost that will be required to be presented outside of income from operations in the Consolidated Statements of Income on adoption are $28 million for the year ended December 31, 2017. The Company will adopt this guidance effective January 1, 2018.
Targeted Improvements to Accounting for Hedging Activities
In August 2017, the FASB issued ASU 2017-12, Targeted Improvements to Accounting for Hedging Activities, which amends the hedge accounting recognition and presentation requirements in ASC Topic 815. This standard improves the transparency and understandability of information about an entity’s risk management activities by better aligning the entity’s financial reporting for hedging relationships with those risk management activities and simplifies the application of hedge accounting. The standard will make more financial and nonfinancial hedging strategies eligible for hedge accounting, amends the presentation and disclosure requirements for hedging activities and changes how entities assess hedge effectiveness. This guidance will be effective for annual reporting periods, including interim reporting within those periods, beginning after December 15, 2018, with early adoption permitted, and is required to be applied using a modified retrospective approach. The Company is currently evaluating the impact of the adoption of this standard on the consolidated financial statements.
80 Emera Inc. — Annual Report 2017
Table of Contents
Management’s Discussion & Analysis
| For the quarter ended millions of dollars (except per share amounts) |
Q4 2017 |
Q3 2017 |
Q2 2017 |
Q1 2017 |
Q4 2016 |
Q3 2016 |
Q2 2016 |
Q1 2016 |
||||||||||||||||||||||||
| Operating revenues |
$ | 1,473 | $ | 1,427 | $ | 1,469 | $ | 1,857 | $ | 1,513 | $ | 1,387 | $ | 499 | $ | 877 | ||||||||||||||||
| Net income (loss) attributable to common shareholders |
(228 | ) | 81 | 101 | 312 | 70 | (95 | ) | 208 | 44 | ||||||||||||||||||||||
| Adjusted net income attributable to common shareholders |
137 | 118 | 117 | 152 | 104 | 14 | 238 | 120 | ||||||||||||||||||||||||
| Earnings per common share – basic |
(1.06 | ) | 0.38 | 0.47 | 1.48 | 0.34 | (0.52 | ) | 1.39 | 0.30 | ||||||||||||||||||||||
| Earnings per common share – diluted |
(1.06 | ) | 0.38 | 0.47 | 1.47 | 0.34 | (0.52 | ) | 1.38 | 0.30 | ||||||||||||||||||||||
| Adjusted earnings per common share – basic |
0.64 | 0.55 | 0.55 | 0.72 | 0.51 | 0.08 | 1.59 | 0.81 | ||||||||||||||||||||||||
Quarterly operating revenues and adjusted net income attributable to common shareholders are affected by seasonality. Historically, the first quarter has generally been the strongest because a significant portion of the Company’s operations are in northeastern North America, where winter is the peak electricity usage season. However, with the addition of Emera Florida and New Mexico, the third quarter has provided stronger earnings contributions due to summer being the heaviest electric consumption season in Florida. Seasonal and other weather patterns, as well as the number and severity of storms, can affect the demand for energy and the cost of service. Quarterly results could also be affected by items outlined in the Significant Items Affecting Earnings section and mark-to-market adjustments.
Emera Inc. — Annual Report 2017 81
Table of Contents
Management’s Responsibility for Financial Reporting
The accompanying consolidated financial statements of Emera Incorporated and the information in this annual report are the responsibility of management and have been approved by the Board of Directors (“Board”).
The consolidated financial statements have been prepared by management in accordance with United States Generally Accepted Accounting Principles. When alternative accounting methods exist, management has chosen those it considers most appropriate in the circumstances. In preparation of these consolidated financial statements, estimates are sometimes necessary when transactions affecting the current accounting period cannot be finalized with certainty until future periods. Management represents that such estimates, which have been properly reflected in the accompanying consolidated financial statements, are based on careful judgments and are within reasonable limits of materiality. Management has determined such amounts on a reasonable basis in order to ensure that the consolidated financial statements are presented fairly in all material respects. Management has prepared the financial information presented elsewhere in the annual report and has ensured that it is consistent with that in the consolidated financial statements.
Emera Incorporated maintains effective systems of internal accounting and administrative controls, consistent with reasonable cost. Such systems are designed to provide reasonable assurance that the financial information is reliable and accurate, and that Emera Incorporated’s assets are appropriately accounted for and adequately safeguarded.
The Board is responsible for ensuring that management fulfils its responsibilities for financial reporting and is ultimately responsible for reviewing and approving the consolidated financial statements. The Board carries out this responsibility principally through its Audit Committee.
The Audit Committee is appointed by the Board, and its members are directors who are not officers or employees of Emera Incorporated. The Audit Committee meets periodically with management, as well as with the internal auditors and with the external auditors, to discuss internal controls over the financial reporting process, auditing matters and financial reporting issues, to satisfy itself that each party is properly discharging its responsibilities, and to review the annual report, the consolidated financial statements and the external auditors’ report. The Audit Committee reports its findings to the Board for consideration when approving the consolidated financial statements for issuance to the shareholders. The Audit Committee also considers, for review by the Board and approval by the shareholders, the appointment of the external auditors.
The consolidated financial statements have been audited by Ernst & Young LLP, the external auditors, in accordance with Canadian Generally Accepted Auditing Standards. Ernst & Young LLP has full and free access to the Audit Committee.
February 9, 2018

|

| |
| Christopher Huskilson | Gregory Blunden | |
| President and Chief Executive Officer | Chief Financial Officer |
82 Emera Inc. — Annual Report 2017
Table of Contents
To the Shareholders of Emera Incorporated
We have audited the accompanying consolidated financial statements of Emera Incorporated, which comprise the consolidated balance sheets as at December 31, 2017 and 2016, and the consolidated statements of income, comprehensive income, cash flows and changes in equity for the years then ended, and a summary of significant accounting policies and other explanatory information.
Management’s Responsibility for the Consolidated Financial Statements
Management is responsible for the preparation and fair presentation of these consolidated financial statements in accordance with United States generally accepted accounting principles, and for such internal control as management determines is necessary to enable the preparation of consolidated financial statements that are free from material misstatement, whether due to fraud or error.
Auditors’ Responsibility
Our responsibility is to express an opinion on these consolidated financial statements based on our audits. We conducted our audits in accordance with Canadian generally accepted auditing standards. Those standards require that we comply with ethical requirements and plan and perform the audit to obtain reasonable assurance about whether the consolidated financial statements are free from material misstatement.
An audit involves performing procedures to obtain audit evidence about the amounts and disclosures in the consolidated financial statements. The procedures selected depend on the auditors’ judgment, including the assessment of the risks of material misstatement of the consolidated financial statements, whether due to fraud or error. In making those risk assessments, the auditors consider internal control relevant to the entity’s preparation and fair presentation of the consolidated financial statements in order to design audit procedures that are appropriate in the circumstances, but not for the purpose of expressing an opinion on the effectiveness of the entity’s internal control. An audit also includes evaluating the appropriateness of accounting policies used and the reasonableness of accounting estimates made by management, as well as evaluating the overall presentation of the consolidated financial statements.
We believe that the audit evidence we have obtained in our audits is sufficient and appropriate to provide a basis for our audit opinion.
Opinion
In our opinion, the consolidated financial statements present fairly, in all material respects, the financial position of Emera Incorporated as at December 31, 2017 and 2016, and its financial performance and its cash flows for the years then ended in accordance with United States generally accepted accounting principles.
Halifax, Canada
February 9, 2018

Ernst & Young LLP
Chartered Professional Accountants
Licenced Public Accountants
Emera Inc. — Annual Report 2017 83
Table of Contents
Consolidated Statements of Income
Emera Incorporated
| For the | Year ended December 31 | |||||||
| millions of Canadian dollars (except per share amounts) | 2017 | 2016 | ||||||
| Operating revenues |
||||||||
| Regulated electric |
$ | 4,721 | $ 3,437 | |||||
| Regulated gas |
1,002 | 499 | ||||||
| Non-regulated |
503 | 341 | ||||||
| Total operating revenues |
6,226 | 4,277 | ||||||
| Operating expenses |
||||||||
| Regulated fuel for generation and purchased power |
1,638 | 1,283 | ||||||
| Regulated cost of natural gas |
379 | 177 | ||||||
| Non-regulated fuel for generation and purchased power |
209 | 313 | ||||||
| Non-regulated direct costs |
28 | 29 | ||||||
| Operating, maintenance and general |
1,399 | 1,137 | ||||||
| Provincial, state, and municipal taxes |
326 | 195 | ||||||
| Depreciation and amortization |
856 | 588 | ||||||
| Total operating expenses |
4,835 | 3,722 | ||||||
| Income from operations |
1,391 | 555 | ||||||
| Income from equity investments (note 6) |
124 | 100 | ||||||
| Other income (expenses), net (note 7) |
2 | 174 | ||||||
| Interest expense, net (note 8) |
698 | 585 | ||||||
| Income before provision for income taxes |
819 | 244 | ||||||
| Income tax expense (recovery) (note 9) |
520 | (22 | ) | |||||
| Net income |
299 | 266 | ||||||
| Non-controlling interest in subsidiaries |
5 | 11 | ||||||
| Preferred stock dividends |
28 | 28 | ||||||
| Net income attributable to common shareholders |
$ | 266 | $ 227 | |||||
| Weighted average shares of common stock outstanding (in millions) (note 11) |
||||||||
| Basic |
213 | 171 | ||||||
| Diluted |
214 | 172 | ||||||
| Earnings per common share (note 11) |
||||||||
| Basic |
$ | 1.25 | $ 1.33 | |||||
| Diluted |
$ | 1.24 | $ 1.32 | |||||
| Dividends per common share declared |
$ | 2.1325 | $ 1.9950 | |||||
The accompanying notes are an integral part of these consolidated financial statements.
84 Emera Inc. — Annual Report 2017
Table of Contents
Consolidated Statements of
Comprehensive Income
Emera Incorporated
| For the | Year ended December 31 | |||||||
| millions of Canadian dollars | 2017 | 2016 | ||||||
| Net income |
$ | 299 | $ 266 | |||||
| Other comprehensive income (loss), net of tax |
||||||||
| Foreign currency translation adjustment (1) |
(462 | ) | 32 | |||||
| Unrealized gains (losses) on net investment hedges (2) (3) |
97 | (49 | ) | |||||
| Cash flow hedges |
||||||||
| Net derivative gains (losses) |
10 | 11 | ||||||
| Less: reclassification adjustment for losses (gains) included in income (4) |
8 | 11 | ||||||
| Net effects of cash flow hedges |
18 | 22 | ||||||
| Unrealized gains on available-for-sale investment |
||||||||
| Unrealized gain (loss) arising during the period |
5 | 3 | ||||||
| Less: reclassification adjustment for (gains) recognized in income |
(1 | ) | (4 | ) | ||||
| Net unrealized holding gains (losses) |
4 | (1 | ) | |||||
| Net change in unrecognized pension and post-retirement benefit obligation (5) |
44 | 12 | ||||||
| Other equity method reclassification adjustment (6) |
— | (46 | ) | |||||
| Other comprehensive income (loss) (7) |
(299 | ) | (30 | ) | ||||
| Comprehensive income (loss) |
— | 236 | ||||||
| Comprehensive income (loss) attributable to non-controlling interest |
— | 8 | ||||||
| Comprehensive Income of Emera Incorporated |
$ | — | $ 228 | |||||
The accompanying notes are an integral part of these consolidated financial statements.
| (1) | Net of tax recovery of nil (2016 – $3 million tax recovery) for the year ended December 31, 2017. |
| (2) | The Company has designated $1.2 billion United States dollar denominated Hybrid Notes as a hedge of the foreign currency exposure of its net investment in United States dollar denominated operations. |
| (3) | Net of tax expense of $9 million (2016 – nil) for the year ended December 31, 2017. |
| (4) | Net of tax recovery of $1 million (2016 – nil) for the year ended December 31, 2017. |
| (5) | Net of tax recovery of $1 million (2016 – $3 million tax expense) for the year ended December 31, 2017. |
| (6) | Net of tax recovery of nil (2016 – $9 million tax recovery) for the year ended December 31, 2017. |
| (7) | Net of tax expense of $7 million (2016 – $9 million tax recovery) for the year ended December 31, 2017. |
Emera Inc. — Annual Report 2017 85
Table of Contents
Consolidated Balance Sheets
Emera Incorporated
| As at | December 31 | |||||||
| millions of Canadian dollars | 2017 | 2016 | ||||||
| Assets |
||||||||
| Current assets |
||||||||
| Cash and cash equivalents |
$ | 438 | $ | 404 | ||||
| Restricted cash (note 1) |
65 | 87 | ||||||
| Inventory (note 13) |
418 | 472 | ||||||
| Derivative instruments (notes 14 and 15) |
141 | 145 | ||||||
| Regulatory assets (note 16) |
138 | 80 | ||||||
| Receivables and other current assets (note 18) |
1,326 | 1,323 | ||||||
| 2,526 | 2,511 | |||||||
| Property, plant and equipment, net of accumulated depreciation and amortization of $7,824 and $7,787, respectively (note 19) |
16,995 | 17,290 | ||||||
| Other assets |
||||||||
| Deferred income taxes (note 9) |
138 | 125 | ||||||
| Derivative instruments (notes 14 and 15) |
112 | 131 | ||||||
| Regulatory assets (note 16) |
1,238 | 1,242 | ||||||
| Net investment in direct financing lease (note 21) |
481 | 488 | ||||||
| Investments subject to significant influence (note 6) |
1,215 | 947 | ||||||
| Goodwill (note 22) |
5,805 | 6,213 | ||||||
| Other long-term assets |
261 | 274 | ||||||
| 9,250 | 9,420 | |||||||
| Total assets |
$ | 28,771 | $ | 29,221 | ||||
| Liabilities and Equity |
||||||||
| Current liabilities |
||||||||
| Short-term debt (note 23) |
$ | 1,241 | $ | 961 | ||||
| Current portion of long-term debt (note 25) |
741 | 476 | ||||||
| Accounts payable |
1,161 | 1,242 | ||||||
| Derivative instruments (notes 14 and 15) |
227 | 325 | ||||||
| Regulatory liabilities (note 16) |
226 | 362 | ||||||
| Other current liabilities (note 24) |
350 | 358 | ||||||
| 3,946 | 3,724 | |||||||
| Long-term liabilities |
||||||||
| Long-term debt (note 25) |
13,140 | 14,268 | ||||||
| Deferred income taxes (note 9) |
1,011 | 1,672 | ||||||
| Derivative instruments (notes 14 and 15) |
83 | 150 | ||||||
| Regulatory liabilities (note 16) |
2,242 | 1,277 | ||||||
| Pension and post-retirement liabilities (note 20) |
559 | 669 | ||||||
| Other long-term liabilities (note 6 and 26) |
609 | 645 | ||||||
| 17,644 | 18,681 | |||||||
| Equity |
||||||||
| Common stock (note 10) |
5,601 | 4,738 | ||||||
| Cumulative preferred stock (note 28) |
709 | 709 | ||||||
| Contributed surplus |
76 | 75 | ||||||
| Accumulated other comprehensive income (loss) (note 12) |
(188 | ) | 106 | |||||
| Retained earnings |
891 | 1,076 | ||||||
| Total Emera Incorporated equity |
7,089 | 6,704 | ||||||
| Non-controlling interest in subsidiaries (note 29) |
92 | 112 | ||||||
| Total equity |
7,181 | 6,816 | ||||||
| Total liabilities and equity |
$ | 28,771 | $ | 29,221 | ||||
| Commitments and contingencies (note 27) | Approved on behalf of the Board of Directors | |||

|

| |||
| The accompanying notes are an integral part | M. Jacqueline Sheppard | Christopher G. Huskilson | ||
| of these consolidated financial statements. | Chair of the Board | President and Chief Executive Officer | ||
86 Emera Inc. — Annual Report 2017
Table of Contents
Consolidated Statements of Cash Flows
Emera Incorporated
| For the | Year ended December 31 | |||||||
| millions of Canadian dollars | 2017 | 2016 | ||||||
| Operating activities |
||||||||
| Net income |
$ | 299 | $ 266 | |||||
| Adjustments to reconcile net income to net cash provided by operating activities: |
||||||||
| Depreciation and amortization |
851 | 593 | ||||||
| Income from equity investments, net of dividends |
(90 | ) | (59 | ) | ||||
| Allowance for equity funds used during construction |
(9 | ) | (22 | ) | ||||
| Deferred income taxes, net (1) |
469 | (67 | ) | |||||
| Net change in pension and post-retirement liabilities |
(12 | ) | 13 | |||||
| Regulated fuel adjustment mechanism and fixed cost deferrals |
68 | 63 | ||||||
| Net change in fair value of derivative instruments |
(157 | ) | 258 | |||||
| Net change in regulatory assets and liabilities (2) |
(237 | ) | (25 | ) | ||||
| Net change in capitalized transportation capacity |
84 | 33 | ||||||
| Foreign exchange (gain) loss |
(1 | ) | 43 | |||||
| Gain on APUC sale of common shares and conversion of subscription receipts (note 7) |
— | (223 | ) | |||||
| Other operating activities, net |
32 | 46 | ||||||
| Changes in non-cash working capital (note 30) |
(104 | ) | 134 | |||||
| Net cash provided by operating activities |
1,193 | 1,053 | ||||||
| Investing activities |
||||||||
| Acquisition, net of cash acquired (note 4) |
— | (8,409 | ) | |||||
| Additions to property, plant and equipment |
(1,529 | ) | (1,080 | ) | ||||
| Net purchase of investments subject to significant influence |
(213 | ) | (276 | ) | ||||
| Net proceeds on sale of investment (note 6) |
— | 665 | ||||||
| Other investing activities |
(19 | ) | 63 | |||||
| Net cash used in investing activities |
(1,761 | ) | (9,037 | ) | ||||
| Financing activities |
||||||||
| Change in short-term debt, net |
(31 | ) | 118 | |||||
| Proceeds from short-term debt with maturities greater than 90 days |
383 | — | ||||||
| Proceeds from long-term debt, net of issuance costs |
129 | 6,423 | ||||||
| Proceeds from convertible debentures, net of issuance costs (note 10) |
— | 1,413 | ||||||
| Retirement of long-term debt |
(453 | ) | (273 | ) | ||||
| Net borrowings (repayments) under committed credit facilities |
230 | (315 | ) | |||||
| Issuance of common stock, net of issuance costs |
682 | 354 | ||||||
| Dividends on common stock |
(287 | ) | (221 | ) | ||||
| Dividends on preferred stock |
(28 | ) | (28 | ) | ||||
| Dividends paid by subsidiaries to non-controlling interest |
(6 | ) | (5 | ) | ||||
| Other financing activities |
(26 | ) | (18 | ) | ||||
| Net cash provided by financing activities |
593 | 7,448 | ||||||
| Effect of exchange rate changes on cash, cash equivalents, and restricted cash |
(13 | ) | (65 | ) | ||||
| Net increase (decrease) in cash, cash equivalents, and restricted cash |
12 | (601 | ) | |||||
| Cash, cash equivalents, and restricted cash, beginning of year |
491 | 1,092 | ||||||
| Cash, cash equivalents and restricted cash, end of year |
503 | 491 | ||||||
| Cash, cash equivalents, and restricted cash consists of: |
||||||||
| Cash |
216 | 221 | ||||||
| Short-term investments |
222 | 183 | ||||||
| Restricted cash |
65 | 87 | ||||||
| Cash, cash equivalents, and restricted cash |
503 | 491 | ||||||
| (1) | 2017 includes the estimated $317 million revaluation of US non—regulated net deferred income tax assets as a result of tax reform. |
| (2) | 2017 includes the net impact of the change in deferred taxes as a result of tax reform with an offset to a regulatory liability of $1.1 billion. |
Supplementary Information to Consolidated Statements of Cash Flows (note 30)
The accompanying notes are an integral part of these consolidated financial statements.
Emera Inc. — Annual Report 2017 87
Table of Contents
Consolidated Statements of
Changes in Equity
Emera Incorporated
| Common stock |
Preferred stock |
Contributed surplus |
Accumulated rehensive |
Retained earnings |
Non- controlling interest |
Total equity | ||||||||||||||||||||||
| millions of Canadian dollars |
||||||||||||||||||||||||||||
| Balance, December 31, 2016 |
$ | 4,738 | $ | 709 | $ | 75 | $ | 106 | $ | 1,076 | $ | 112 | $ | 6,816 | ||||||||||||||
| Net income of Emera Incorporated |
— | — | — | — | 294 | 5 | 299 | |||||||||||||||||||||
| Other comprehensive income (loss), net of tax expense of $7 million |
— | — | — | (294 | ) | — | (5 | ) | (299 | ) | ||||||||||||||||||
| Issuance of common stock, net of after-tax issuance costs |
686 | — | — | — | — | — | 686 | |||||||||||||||||||||
| Dividends declared on preferred stock (note 28) |
— | — | — | — | (28 | ) | — | (28 | ) | |||||||||||||||||||
| Dividends declared on common stock ($2.1325/share) |
— | — | — | — | (451 | ) | — | (451 | ) | |||||||||||||||||||
| Common stock issued under purchase plan |
173 | — | — | — | — | — | 173 | |||||||||||||||||||||
| Stock-based compensation |
3 | — | 1 | — | — | — | 4 | |||||||||||||||||||||
| Repurchase of preferred shares of GBPC (note 29) |
— | — | — | — | — | (14 | ) | (14 | ) | |||||||||||||||||||
| Other |
1 | — | — | — | — | (6 | ) | (5 | ) | |||||||||||||||||||
| Balance, December 31, 2017 |
$ | 5,601 | $ | 709 | $ | 76 | $ | (188 | ) | $ | 891 | $ | 92 | $ | 7,181 | |||||||||||||
| Balance, December 31, 2015 |
$ | 2,157 | $ | 709 | $ | 29 | $ | 137 | $ | 1,168 | $ | 134 | $ | 4,334 | ||||||||||||||
| Net income of Emera Incorporated |
— | — | — | — | 255 | 11 | 266 | |||||||||||||||||||||
| Other comprehensive income (loss), net of tax recovery of $9 million |
— | — | — | (27 | ) | — | (3 | ) | (30 | ) | ||||||||||||||||||
| Issuance of common stock, net of after-tax issuance costs |
2,450 | — | — | — | — | — | 2,450 | |||||||||||||||||||||
| Dividends declared on preferred stock (note 28) |
— | — | — | — | (28 | ) | — | (28 | ) | |||||||||||||||||||
| Dividends declared on common stock ($1.9950/share) |
— | — | — | — | (324 | ) | — | (324 | ) | |||||||||||||||||||
| Common stock issued under purchase plan |
110 | — | — | — | — | — | 110 | |||||||||||||||||||||
| Stock-based compensation |
18 | — | 1 | — | — | — | 19 | |||||||||||||||||||||
| Beneficial conversion feature, net of tax (note 8) |
— | — | 43 | — | — | — | 43 | |||||||||||||||||||||
| Acquisition of non-controlling interest of ECI |
3 | — | 7 | — | — | (25 | ) | (15 | ) | |||||||||||||||||||
| Other |
— | — | (5 | ) | (4 | ) | 5 | (5 | ) | (9 | ) | |||||||||||||||||
| Balance, December 31, 2016 |
$ | 4,738 | $ | 709 | $ | 75 | $ | 106 | $ | 1,076 | $ | 112 | $ | 6,816 | ||||||||||||||
The accompanying notes are an integral part of these consolidated financial statements.
88 Emera Inc. — Annual Report 2017
Table of Contents
Financial Statements
As at December 31, 2017 and 2016
| 1. | Summary of Significant Accounting Policies |
Nature of Operations
Emera Incorporated (“Emera” or the “Company”) is an energy and services company which invests in electricity generation, transmission and distribution and gas transmission and distribution.
Emera’s primary rate-regulated subsidiaries and investments at December 31, 2017 included the following:
| • | Emera Florida and New Mexico represents TECO Energy, Inc. (“TECO Energy”), a holding company with regulated electric and gas utilities in Florida and New Mexico which was acquired on July 1, 2016. TECO Energy’s holdings include: |
| • | Tampa Electric Company (“TEC”), which holds the Tampa Electric Division (“Tampa Electric”), an integrated regulated electric utility, serving approximately 750,000 customers in West Central Florida and Peoples Gas System Division, (“PGS”) a regulated gas distribution utility, serving approximately 375,000 customers across Florida; |
| • | New Mexico Gas Company, Inc. (“NMGC”), a regulated gas distribution utility, serving approximately 525,000 customers across New Mexico; and |
| • | TECO Finance, Inc. (“TECO Finance”), a wholly owned financing subsidiary of TECO Energy. |
| • | Nova Scotia Power Inc. (“NSPI”), a fully integrated electric utility and the primary electricity supplier in Nova Scotia, serving approximately 515,000 customers; |
| • | Emera Maine, an electric transmission and distribution utility, serving approximately 158,000 customers in Maine; |
| • | Emera Caribbean represents Emera (Caribbean) Incorporated (“ECI”), a holding company that includes: |
| • | The Barbados Light & Power Company Limited (“BLPC”), a vertically integrated utility and sole provider of electricity on the island of Barbados, serving approximately 129,000 customers; |
| • | a 50.0 per cent direct and 30.4 per cent indirect interest (through a 60.7 per cent interest in ICD Utilities Limited) in Grand Bahama Power Company Limited (“GBPC”), a vertically integrated utility and sole provider of electricity on Grand Bahama Island, serving approximately 19,000 customers. On November 8, 2017, the minority shareholders of ICDU approved Emera’s acquisition of their common shares for total consideration of approximately $35 million USD. The acquisition of the minority shareholder common shares was completed on January 15, 2018, increasing Emera’s indirect ownership interest in GBPC to 100 per cent; |
| • | a 51.9 per cent interest in Dominica Electricity Services Ltd. (“Domlec”), an integrated utility on the island of Dominica, serving approximately 36,000 customers. On September 19, 2017 Dominica took a direct hit from Hurricane Maria, causing extensive damage across the island. Refer to note 16 for additional information; and |
| • | a 19.1 per cent indirect interest in St. Lucia Electricity Services Limited (“Lucelec”), a vertically integrated regulated electric utility on the island of St. Lucia. |
| • | Emera Brunswick Pipeline Company Limited (“Brunswick Pipeline”), a 145-kilometre pipeline delivering re-gasified liquefied natural gas from Saint John, New Brunswick to the United States border under a 25-year firm service agreement with Repsol Energy Canada, which expires in 2034; |
| • | Emera Newfoundland & Labrador Holdings Inc. (“ENL”), focused on two transmission investments related to the development of an 824 megawatt (“MW”) hydroelectric generating facility at Muskrat Falls on the Lower Churchill River in Labrador, scheduled to be generating first power in 2019 and full power in 2020. ENL’s two investments are: |
| • | a 100 per cent investment in NSP Maritime Link Inc. (“NSPML”), which developed the Maritime Link Project, a $1.56 billion transmission project, including two 170-kilometre sub-sea cables, connecting the island of Newfoundland and Nova Scotia. This project completed commissioning and entered service on January 15, 2018; and |
| • | a 49.5 per cent investment in the partnership capital of Labrador-Island Link Limited Partnership (“LIL”), a $3.7 billion electricity transmission project in Newfoundland and Labrador to enable the transmission of Muskrat Falls energy between Labrador and the island of Newfoundland. Nalcor Energy has indicated that the LIL will be in service in Q2 2018. |
| • | a 12.9 per cent interest in Maritimes & Northeast Pipeline (“M&NP”), a 1,400-kilometre pipeline, which transports natural gas from offshore Nova Scotia to markets in Atlantic Canada and the northeastern United States. |
Emera Inc. — Annual Report 2017 89
Table of Contents
Emera also owns investments in other energy-related non-regulated companies, including:
| • | Emera Energy, consists of: |
| • | Emera Energy Services, a physical energy business that purchases and sells natural gas and electricity and provides related energy asset management services; |
| • | Bridgeport Energy, Tiverton Power and Rumford Power (“New England Gas Generating Facilities” or “NEGG”), 1,115 MW of combined-cycle gas-fired electricity generating capacity in the northeastern United States; |
| • | Bayside Power Limited Partnership (“Bayside Power”), a 290 MW gas-fired combined cycle power plant in Saint John, New Brunswick; |
| • | Brooklyn Power Corporation (“Brooklyn Energy”), a 30 MW biomass co-generation electricity facility in Brooklyn, Nova Scotia. Brooklyn Energy has a long-term purchase power agreement with NSPI; and |
| • | a 50.0 per cent joint venture interest in Bear Swamp Power Company LLC (“Bear Swamp”), a 600 MW pumped storage hydroelectric facility in northwestern Massachusetts. |
| • | Emera Reinsurance Limited, a captive insurance company providing insurance and reinsurance to Emera and certain affiliates, to enable more cost efficient management of risk and deductible levels across Emera; |
| • | Emera US Finance LP, a wholly owned financing subsidiary of Emera; |
| • | Emera US Holdings Inc., a wholly owned holding company for certain of Emera’s assets located in the United States; |
| • | Emera Utility Services Inc., a utility services contractor primarily operating in Atlantic Canada; and |
| • | other investments. |
Basis of Presentation
These consolidated financial statements are prepared and presented in accordance with United States Generally Accepted Accounting Principles (“USGAAP”). In the opinion of management, these consolidated financial statements include all adjustments that are of a recurring nature and necessary to fairly state the financial position of Emera.
All dollar amounts are presented in Canadian dollars, unless otherwise indicated.
Principles of Consolidation
The consolidated financial statements of Emera include the accounts of Emera Incorporated, its majority-owned subsidiaries, and a variable interest entity (“VIE”) in which Emera is the primary beneficiary. Emera uses the equity method of accounting to record investments in which the Company has the ability to exercise significant influence, and for variable interest entities in which Emera is not the primary beneficiary. The consolidated financial statements include TECO Energy from the July 1, 2016 acquisition date through December 31, 2017.
The Company performs ongoing analysis to assess whether it holds any VIEs. To identify potential VIEs, management reviews contracts under leases, long-term purchase power agreements, tolling contracts and jointly owned facilities.
VIEs of which the Company is deemed the primary beneficiary must be consolidated. The primary beneficiary of a VIE has both the power to direct the activities of the entity that most significantly impact its economic performance and the obligation to absorb losses of the entity that could potentially be significant to the entity. In circumstances where Emera is not deemed the primary beneficiary, the VIE is accounted for using the equity method.
Intercompany balances and intercompany transactions have been eliminated on consolidation, except for the net profit on certain transactions between certain non-regulated and regulated entities in accordance with accounting standards for rate-regulated entities. The net profit on these transactions, which would be eliminated in the absence of the accounting standards for rate-regulated entities, is recorded in non- regulated operating revenues. An offset is recorded to property, plant and equipment, regulatory assets, regulated fuel for generation and purchased power, or operating, maintenance and general, depending on the nature of the transaction.
Use of Management Estimates
The preparation of consolidated financial statements in accordance with USGAAP requires management to make estimates and assumptions. These may affect the reported amounts of assets and liabilities at the date of the financial statements, and reported amounts of revenues and expenses during the reporting periods. Management evaluates the Company’s estimates on an ongoing basis based upon historical experience, current conditions and assumptions believed to be reasonable at the time the assumption is made, with any adjustments recognized in income in the year they arise. Actual results may differ significantly from these estimates.
Regulatory Matters
Regulatory accounting applies where rates are established by, or subject to approval by, an independent third-party regulator. The rates are designed to recover the costs of providing the regulated products or services and provide a reasonable rate of return on the equity invested or assets as applicable (refer to note 16 for additional details).
90 Emera Inc. — Annual Report 2017
Table of Contents
Notes to the Consolidated Financial Statements
Foreign Currency Translation
Monetary assets and liabilities, denominated in foreign currencies, are converted to Canadian dollars at the rates of exchange prevailing at the balance sheet date. The resulting differences between the translation at the original transaction date and the balance sheet date are included in income.
Assets and liabilities of foreign operations whose functional currency is not the Canadian dollar are translated using the exchange rates in effect at the balance sheet date and the results of operations at the average exchange rate in effect for the period. The resulting exchange gains and losses on the assets and liabilities are deferred on the balance sheet in AOCI.
The Company designates certain US dollar denominated debt held in Canadian functional currency companies as hedges of net investments in United States dollar denominated foreign operations. The change in the carrying amount of these investments, measured at the exchange rates in effect at the balance sheet date, and the effective portion of the hedge, is recorded in Other Comprehensive Income (“OCI”). Any ineffectiveness is reflected in current period earnings.
Revenue Recognition
Operating revenues are recognized when electricity or gas is delivered to customers or when products are delivered and services are rendered. Regulated revenues are recognized on an accrual basis and include billed and unbilled revenues. Revenues related to the sale of electricity or gas is recognized at rates approved by the respective regulator and recorded based on meter readings and estimates, which occur on a systematic basis. At the end of each month, the electricity or gas delivered to customers, but not billed, is estimated and the corresponding unbilled revenue is recognized. The accuracy of the unbilled revenue estimate is affected by energy demand, weather, line losses and changes in the composition of customer classes.
Non-regulated revenues are recorded when products have been delivered or services have been performed, the amount of revenue can be reliably measured and collectability is reasonably assured.
Revenues for energy marketing and trading operations are presented on a net basis, reflecting the nature of the contractual relationships with customers and suppliers.
The Company records the net investment in a lease under the direct finance method for Emera Brunswick Pipeline, which consists of the sum of the minimum lease payments and residual value net of estimated executory costs and unearned income. The difference between the gross investment and the cost of the leased item for a direct financing lease is recorded as unearned income at the inception of the lease. The unearned income is recognized in income over the life of the lease using a constant rate of interest equal to the internal rate of return on the lease and is recorded as “Operating revenues – regulated gas” on the Consolidated Statements of Income.
Other revenues are recognized when services are performed or goods delivered.
Property, Plant and Equipment
Property, plant and equipment are recorded at original cost, including allowance for funds used during construction (“AFUDC”) or capitalized interest, net of contributions received in aid of construction.
The cost of additions, including betterments and replacements of units of property, plant and equipment are included in “Property, plant and equipment”. When units of regulated property, plant and equipment are replaced, renewed or retired, their cost plus removal or disposal costs, less salvage proceeds, is charged to accumulated depreciation, with no gain or loss reflected in income. Where a disposition of non-regulated property, plant and equipment occurs, gains and losses are included in income as the dispositions occur.
The cost of property, plant and equipment represents the original cost of materials, contracted services, direct labour, AFUDC for regulated property or interest for non-regulated property, asset retirement obligations (“ARO”) and overhead attributable to the capital project.
Overhead includes corporate costs such as finance, information technology and executive, along with other costs related to support functions, employee benefits, insurance, procurement, and fleet operating and maintenance. Expenditures for project development are capitalized if they are expected to have a future economic benefit.
Normal maintenance projects are expensed as incurred. Planned major maintenance projects that do not increase the overall life of the related assets are expensed. When a major maintenance project increases the life or value of the underlying asset, the cost is capitalized.
Depreciation is determined by the straight-line method, based on the estimated remaining service lives of the depreciable assets in each functional class of depreciable property. For some of Emera’s rate regulated subsidiaries depreciation is calculated using the group remaining life method which is applied to the average investment, adjusted for anticipated costs of removal less salvage, in functional classes of depreciable property. The service lives of regulated assets require the appropriate regulatory approval.
Intangible assets consist primarily of computer software, land rights and naming rights with definite lives. Amortization is determined by the straight-line method, based on the estimated remaining service lives of the asset in each category. For some of Emera’s rate regulated subsidiaries amortization is calculated using the amortizable life method which is applied to the net book value to date over the remaining life of those assets not classified as depreciable property above. The service lives of regulated intangible assets require the appropriate regulatory approval.
Emera Inc. — Annual Report 2017 91
Table of Contents
Goodwill
Goodwill is calculated as the excess of the purchase price of an acquired entity over the estimated fair values of assets acquired and liabilities assumed at the acquisition date. Goodwill is carried at initial cost less any write-down for impairment. Under the applicable accounting guidance, goodwill is subject to an annual assessment for impairment at the reporting unit level. Refer to note 22 for further detail.
Income Taxes and Investment Tax Credits
Emera recognizes deferred income tax assets and liabilities for the future tax consequences of events that have been included in the financial statements or income tax returns. Deferred income tax assets and liabilities are determined based on the difference between the carrying value of assets and liabilities on the Consolidated Balance Sheets and their respective tax bases using enacted tax rates in effect for the year in which the differences are expected to reverse. Emera recognizes the effect of income tax positions only when it is more likely than not that they will be realized. Management reviews all readily available current and historical information, including forward-looking information, and the likelihood that deferred tax assets will be recovered from future taxable income is assessed and assumptions about the expected timing of the reversal of deferred tax assets and liabilities are made. If management subsequently determines that it is likely that some or all of a deferred income tax asset will not be realized, then a valuation allowance is recorded to report the balance at the amount expected to be realized.
Generally, investment tax credits are recorded as a reduction to income tax expense in the current or future periods to the extent that realization of such benefit is more likely than not. Investment tax credits earned by TECO Energy and Emera Maine on regulated assets are deferred and amortized over the estimated service lives of the related properties, as required by state regulatory practices.
Emera’s rate-regulated subsidiaries recognize regulatory assets or liabilities where the deferred income taxes are expected to be recovered from or returned to customers in future rates, unless specifically directed by a regulator to flow deferred income taxes through earnings. These regulated assets or liabilities are grossed up using the respective income tax rate to reflect the income tax associated with future revenues that are required to fund these deferred income tax liabilities, and the income tax benefits associated with reduced revenues resulting from the realization of deferred income tax assets.
Emera classifies interest and penalties associated with unrecognized tax benefits as interest and operating expense, respectively. Refer to note 9 for further details.
Derivatives and Hedging Activities
The Company manages its exposure to normal operating and market risks relating to commodity prices, foreign exchange and interest rates through contractual protections with counterparties where practicable, and by using financial instruments consisting mainly of foreign exchange forwards and swaps, interest rate options and swaps, and coal, oil and gas futures, options, forwards and swaps. In addition, the Company has contracts for the physical purchase and sale of natural gas. These physical and financial contracts are classified as held-for-trading (“HFT”). Collectively, these contracts are considered derivatives.
The Company recognizes the fair value of all its derivatives on its balance sheet, except for non-financial derivatives that meet the normal purchases and normal sales (“NPNS”) exception. A physical contract generally qualifies for the NPNS exception if the transaction is reasonable in relation to the Company’s business needs, the counterparty owns or controls resources within the proximity to allow for physical delivery, the Company intends to receive physical delivery of the commodity, and the Company deems the counterparty creditworthy. Emera continually assesses contracts designated under the NPNS exception and will discontinue the treatment of these contracts under this exemption where the criteria are no longer met.
Derivatives qualify for hedge accounting if they meet stringent documentation requirements, and can be proven to effectively hedge the identified risk both at the inception and over the term of the instrument. Specifically, for cash flow hedges, the effective portion of the change in the fair value of derivatives is deferred to AOCI and recognized in income in the same period the related hedged item is realized. Any ineffective portion of the change in the fair value of the cash flow hedges is recognized in net income in the reporting period. Where the documentation or effectiveness requirements are not met any changes in fair value are recognized in net income in the reporting period, unless deferred as a result of regulatory accounting.
Derivatives entered into by Tampa Electric, PGS, NMGC, NSPI and GBPC that are documented as economic hedges, and for which the NPNS exception has not been taken, are subject to regulatory accounting treatment. The change in fair value of the derivatives is deferred to a regulatory asset or liability. The gain or loss is recognized in the hedged item when the hedged item is settled. Management believes that any gains or losses resulting from settlement of these derivatives related to fuel for generation and purchased power will be refunded to or collected from customers in future rates.
Derivatives that do not meet any of the above criteria are designated as HFT, with changes in fair value normally recorded in net income of the period, unless deferred as a result of regulatory accounting. The Company has not elected to designate any derivatives to be included in the HFT category where another accounting treatment would apply.
92 Emera Inc. — Annual Report 2017
Table of Contents
Notes to the Consolidated Financial Statements
Emera classifies gains and losses on derivatives as a component of fuel for generation and purchased power, other expenses, inventory and property, plant and equipment, depending on the nature of the item being economically hedged. Transportation capacity arising as a result of marketing and trading transactions is recognized as an asset in “Other” and amortized over the period of the transportation contract term.
Cash flows from derivative activities are presented in the same category as the item being hedged within operating or investing activities on the Consolidated Statements of Cash Flows. Non-hedged derivatives are included in operating cash flows on the Consolidated Statements of Cash Flows.
Derivatives, as reflected on the Consolidated Balance Sheets, are not offset by the fair value amounts of cash collateral with the same counterparty. Rights to reclaim cash collateral are recognized in “Receivables and other current assets” and obligations to return cash collateral are recognized in “Accounts payable”.
Cash, Cash Equivalents and Restricted Cash
Cash equivalents consist of highly liquid short-term investments with original maturities of three months or less at acquisition. Total short-term investments of $222 million have an effective interest rate of 1.4 per cent at December 31, 2017 (2016 – $183 million with an effective interest rate of 0.6 per cent).
Amounts included in restricted cash represent funds required to be set aside for the BLPC Self-Insurance Fund (notes 6 and 32).
Receivables and Allowance for Doubtful Accounts
Customer receivables are recorded at the invoiced amount and do not bear interest. Standard payment terms for electricity and gas sales are approximately 30 days. A late payment fee may be assessed on account balances after the due date.
The Company is exposed to credit risk with respect to amounts receivable from customers. Credit risk assessments are conducted on all new customers and deposits are requested on any high risk accounts. The Company also maintains provisions for potential credit losses, which are assessed on a regular basis.
Management estimates uncollectible accounts receivable after considering historical loss experience, customer deposits, current events and the characteristics of existing accounts. Provisions for losses on receivables are expensed to maintain the allowance at a level considered adequate to cover expected losses. Receivables are written off against the allowance when they are deemed uncollectible.
Inventory
Fuel and materials inventories are valued using the weighted-average cost method. These inventories are carried at the lower of weighted-average cost or net realizable value, unless evidence indicates that the weighted-average cost will be recovered in future customer rates.
Emission credits inventory are measured using the first-in-first-out method. Emission credits inventory is recognized in inventory when purchased, or allocated by the respective government agency.
Asset Impairment
Goodwill
Goodwill is not amortized, but is subject to an annual assessment for impairment at the reporting unit level. Reporting units are generally determined at the operating segment level or one level below the operating segment level. Reporting units with similar characteristics are grouped for the purpose of determining impairment, if any, of goodwill. Entities assessing goodwill for impairment have the option of first performing a qualitative assessment to determine whether a quantitative assessment is necessary. If an entity performs the qualitative assessment, but determines that it is more likely than not that its fair value is less than its carrying amount or if an entity chooses to bypass the qualitative assessment, a quantitative test is performed. The quantitative test compares the fair value of the reporting unit to its carrying amount, including goodwill. If the carrying amount of the reporting unit exceeds its fair value, an impairment loss is recorded as a reduction to goodwill and a charge to operating expense. Emera reviews recorded goodwill at least annually (during the fourth quarter) for each reporting unit, with interim impairment tests performed when impairment indicators are present. Refer to note 22 for further detail.
Cost and Equity Method Investments
The carrying value of investments accounted for under the cost and equity methods are assessed for impairment by comparing the fair values of these investments to their carrying values, if a fair value assessment was completed, or by reviewing for the presence of impairment indicators. If an impairment exists and it is determined to be other-than-temporary, a charge is recognized in earnings equal to the amount the carrying value exceeds the investment’s fair value.
Emera Inc. — Annual Report 2017 93
Table of Contents
Financial Assets
The Company assesses at each balance sheet date whether there is objective evidence that a financial asset or a group of financial assets is impaired. In the case of equity securities classified as available-for-sale, an other than temporary decline in the fair value of the security below its cost is considered as an indicator that the securities are impaired. In the case of debt securities classified as available-for-sale, a breach of contract, such as default or delinquency in interest or principal payments, or evidence of significant financial difficulty of the issuer is considered an indicator of impairment. If any such evidence exists for available-for-sale financial assets, the cumulative loss, measured as the difference between the acquisition cost and the current fair value, less any impairment loss on that financial asset previously recognized in income, is removed from AOCI and recognized in the Consolidated Statements of Income.
Asset Retirement Obligations
An ARO is recognized if a legal obligation exists in connection with the future disposal or removal costs resulting from the permanent retirement, abandonment or sale of a long-lived asset. A legal obligation may exist under an existing or enacted law or statute, written or oral contract, or by legal construction under the doctrine of promissory estoppel.
An ARO represents the fair value of the estimated cash flows necessary to discharge the future obligation using the Company’s credit adjusted risk-free rate. The amounts are reduced by actual expenditures incurred. Estimated future cash flows are based on completed depreciation studies, remediation reports, prior experience, estimated useful lives and governmental regulatory requirements. The present value of the liability is recorded and the carrying amount of the related long-lived asset is correspondingly increased. The amount capitalized at inception is depreciated in the same manner as the related long-lived asset. Over time, the liability is accreted to its estimated future value. Accretion expense is included as part of “Depreciation and amortization”. Any regulated accretion expense not yet approved by the regulator is recorded in “Property, plant and equipment” and included in the next depreciation study.
Some transmission and distribution assets may have conditional AROs, which are required to be estimated and recorded as a liability. A conditional ARO refers to a legal obligation to perform an asset retirement activity in which the timing and/or method of settlement are conditional on a future event that may or may not be within the control of the entity. Management monitors these obligations and a liability is recognized at fair value when an amount can be determined.
Cost of Removal
Tampa Electric, PGS, NMGC and NSPI recognize non-ARO costs of removal as regulatory liabilities. The non-ARO costs of removal represent estimated funds received from customers through depreciation rates to cover future non-legally required cost of removal of property, plant and equipment upon retirement. The companies accrue for removal costs over the life of the related assets based on depreciation studies approved by their respective regulators. The costs are estimated based on historical experience and future expectations, including expected timing and estimated future cash outlays.
Franchise Fees and Gross Receipts
Tampa Electric and PGS are allowed to recover from customers certain costs incurred, on a dollar-for-dollar basis, through prices approved by the Florida Public Service Commission (“FPSC”). The amounts included in customers’ bills for franchise fees and gross receipt taxes are included as revenues in the Consolidated Statements of Income. Franchise fees and gross receipt taxes payable by Tampa Electric and PGS are included as an expense on the Consolidated Statements of Income in “Provincial, state and municipal taxes”.
NMGC is an agent in the collection and payment of franchise fees and gross receipt taxes and is not required by a tariff to present the amounts on a gross basis. Therefore, NMGC’s franchise fees and gross receipt taxes are presented net with no line item impact on the Consolidated Statement of Income.
Stock-Based Compensation
The Company has several stock-based compensation plans: a common share option plan for senior management; an employee common share purchase plan; a deferred share unit (“DSU”) plan; and a performance share unit (“PSU”) plan. The Company accounts for its plans in accordance with the fair value based method of accounting for stock-based compensation. Stock-based compensation cost is measured at the grant date, based on the calculated fair value of the award, and is recognized as an expense over the employee’s or director’s requisite service period using the graded vesting method. Stock-based compensation plans recognized as liabilities are measured at fair value and re-measured at fair value at each reporting date with the change in liability recognized in income.
94 Emera Inc. — Annual Report 2017
Table of Contents
Notes to the Consolidated Financial Statements
Employee Benefits
The costs of the Company’s pension and other post-retirement benefit programs for employees are expensed over the periods during which employees render service. The Company recognizes the funded status of its defined-benefit and other post-retirement plans on the balance sheet and recognizes changes in funded status in the year the change occurs. The Company recognizes the unamortized gains and losses and past service costs in AOCI or regulatory assets.
| 2. | Change in Accounting Policy |
The new USGAAP accounting policies that are applicable to, and adopted by the Company in 2017, are described as follows:
Classification of Certain Cash Receipts and Cash Payments on the Statement of Cash Flows
In August 2016, the FASB issued ASU 2016-15, Classification of Certain Cash Receipts and Cash Payments on the Statement of Cash Flows. The standard provides guidance regarding the classification of certain cash receipts and cash payments on the statement of cash flows, where specific guidance is provided for issues not previously addressed. This guidance is effective for annual reporting periods, including interim reporting within those periods, beginning after December 15, 2017, with early adoption permitted, and is required to be applied on a retrospective approach. The Company has early adopted the standard with no impact on the consolidated financial statements as a result of implementation of this standard.
Restricted Cash on the Statement of Cash Flows
In November 2016, the FASB issued ASU 2016-18, Restricted Cash on the Statement of Cash Flows. The standard requires the Company to show the changes in total cash, cash equivalents, restricted cash and restricted cash equivalents in the statement of cash flows. Transfers between cash and cash equivalents and restricted cash and restricted cash equivalents are no longer presented in the statement of cash flows. This guidance is effective for annual reporting periods, including interim reporting within those periods, beginning after December 15, 2017, with early adoption permitted, and is required to be applied on a retrospective approach. The Company has early adopted this standard. This change in accounting policy has increased net cash used in investing activities by $22 million for the year ended December 31, 2017 (2016 – a decrease of $68 million) within the Consolidated Statement of Cash Flows. Changes in restricted cash are now disclosed within the Consolidated Statement of Cash Flows for all years presented. Restricted cash was $65 million at December 31, 2017 (2016 – $87 million).
Simplifying the Test for Goodwill Impairment
In January 2017, the FASB issued ASU 2017-04, Simplifying the Test for Goodwill Impairment. The standard provides guidance to simplify the subsequent measurement of goodwill by eliminating the second step of the quantitative test. The new guidance does not amend the optional qualitative assessment of goodwill impairment. This guidance is effective for annual reporting periods, including interim reporting within those periods, beginning after December 15, 2019, with early adoption permitted and is required to be applied prospectively. The Company has early adopted the standard with no impact on the consolidated financial statements as a result of implementation of this standard.
| 3. | Future Accounting Pronouncements |
The Company considers the applicability and impact of all ASUs issued by FASB. The following updates have been issued by FASB, but have not yet been adopted by Emera. Any ASUs not included below were assessed and determined to be either not applicable to the Company or have insignificant impact on the consolidated financial statements.
Revenue from Contracts with Customers
In May 2014, the FASB issued ASU 2014-09, Revenue from Contracts with Customers, which creates a new, principle-based revenue recognition framework, codified as Accounting Standards Codification (“ASC”) Topic 606. The FASB issued amendments to ASC Topic 606 during 2016 to clarify certain implementation guidance and to reflect scope improvements and practical expedients. The guidance will require additional disclosures regarding the nature, amount, timing and uncertainty of revenue and related cash flows arising from contracts with customers. This guidance will be effective for annual reporting periods, including interim reporting within those periods, beginning after December 15, 2017 and will allow for either full retrospective adoption or modified retrospective adoption. The Company will adopt this guidance effective January 1, 2018, using the modified retrospective approach.
The Company implemented a revenue recognition project plan in 2016. In Q1 2017, the Company concluded that the accounting for contributions in aid of construction will be out of the scope of the new standard. In Q2 2017, the Company completed an analysis of material regulated revenue streams and collectability risk and concluded that there will be no material changes on adoption of this standard. In Q3 2017, the Company completed an analysis of material unregulated revenue streams and concluded that there will be no material changes on adoption of this standard. The Company also evaluated the disclosure requirements and determined that the disaggregation of revenue information required by the new standard will not have a significant impact on the Company’s information gathering processes and procedures as the revenue information required by the standard is consistent with historical revenue information gathered by the Company for financial reporting purposes. The Company continues to monitor the assessment of ASC Topic 606 by the AICPA Power and Utilities Revenue Recognition Task Force for developments.
Emera Inc. — Annual Report 2017 95
Table of Contents
Recognition and Measurement of Financial Assets and Financial Liabilities
In January 2016, the FASB issued ASU 2016-01, Financial Instruments – Recognition and Measurement of Financial Assets and Financial Liabilities. The standard provides guidance for the recognition, measurement, presentation and disclosure of financial assets and liabilities. This guidance will be effective for annual reporting periods, including interim reporting within those periods, beginning after December 15, 2017.
The standard requires investments in equity securities, except those accounted for under the equity method of accounting or those that result in consolidation, to be measured at fair value. The Company will elect to measure equity securities that do not have a readily determinable fair value, at cost minus impairment (if any), plus or minus observable price changes resulting from transactions for the identical or a similar investment of the same issuer. The standard eliminates the available-for-sale classification for equity investments that recognized changes in the fair value as a component of other comprehensive income, resulting in all changes in fair value being recognized in net income. The increase in volatility of Other income (expense), net as a result of the remeasurement of equity investments is not expected to be significant. The Company will adopt this guidance effective January 1, 2018 with a cumulative-effect adjustment of approximately $3 million to retained earnings in the Consolidated Balance Sheet.
Leases
In February 2016, the FASB issued ASU 2016-02, Leases. The standard, codified as ASC Topic 842, increases transparency and comparability among organizations by recognizing lease assets and liabilities on the balance sheet for leases with terms of more than 12 months. Under the existing guidance, operating leases are not recorded as assets and liabilities on the balance sheet. The effect of leases on the Consolidated Statements of Income and the Consolidated Statements of Cash Flows is largely unchanged. The guidance will require additional disclosures regarding key information about leasing arrangements. This guidance is effective for annual reporting periods, including interim reporting within those periods, beginning after December 15, 2018. Early adoption is permitted, and is required to be applied using a modified retrospective approach.
In January 2018, the FASB issued an amendment to ASC Topic 842 which permits companies to elect an optional transition practical expedient to not evaluate existing land easements under the new standard if the land easements were not previously accounted for under existing lease guidance. In November 2017, the FASB voted to amend ASC Topic 842 to allow companies to elect not to restate their comparative periods in the period of adoption when transitioning to the standard. The amendment is expected to be finalized in Q1 2018.
The Company is in the process of evaluating the impact of adoption of this standard on its financial statements and disclosures. In Q3 2017, the Company implemented a project plan. In Q4 2017, the Company began execution of the project plan, including training sessions with key stakeholders throughout the organization and gathering detailed information on existing lease arrangements. This includes evaluating the available practical expedients, calculating the lease asset and liability balances associated with individual contractual arrangements and assessing the disclosure requirements. The Company continues to monitor FASB amendments to ASC Topic 842.
Measurement of Credit Losses on Financial Instruments
In June 2016, the FASB issued ASU 2016-13, Measurement of Credit Losses on Financial Instruments. The standard provides guidance regarding the measurement of credit losses for financial assets and certain other instruments that are not accounted for at fair value through net income, including trade and other receivables, debt securities, net investment in leases, and off-balance sheet credit exposures. The new guidance requires companies to replace the current incurred loss impairment methodology with a methodology that measures all expected credit losses for financial assets based on historical experience, current conditions, and reasonable and supportable forecasts. The guidance expands the disclosure requirements regarding credit losses, including the credit loss methodology and credit quality indicators.
This guidance will be effective for annual reporting periods, including interim reporting within those periods, beginning after December 15, 2019. Early adoption is permitted for annual reporting periods, including interim periods after December 15, 2018 and will be applied using a modified retrospective approach. The Company is currently evaluating the impact of adoption of this standard on its consolidated financial statements.
Clarifying the Definition of a Business
In January 2017, the FASB issued ASU 2017-01, Clarifying the Definition of a Business. The standard provides guidance to assist entities with evaluating when a set of transferred assets and activities is a business. This guidance will be effective for annual reporting periods, including interim reporting within those periods, beginning after December 15, 2017, with early adoption permitted and is required to be applied prospectively. The adoption of this standard will not have an impact on the Company’s consolidated financial statements.
Improving the Presentation of Net Periodic Pension Cost and Net Periodic Postretirement Benefit Cost
In March 2017, the FASB issued ASU 2017-07, Compensation – Retirement Benefits (Topic 715): Improving the Presentation of Net Periodic Pension Cost and Net Periodic Postretirement Benefit Cost. The guidance requires the service cost component of defined benefit pension or other postretirement benefit plans to be reported in the same line items as other compensation costs. The other components of net benefit cost are required to be presented in the Consolidated Statements of Income outside of income from operations. Only the service cost component will be eligible for capitalization as property, plant and equipment under this guidance. This guidance will be effective for annual reporting periods, including interim reporting within those periods, beginning after December 15, 2017. The guidance is required to be applied retrospectively for presentation in the Consolidated Statements of Income and prospectively for the guidance limiting capitalization. In Q4, 2017 the Company completed an analysis of the impact of the adoption of this standard on the consolidated financial statements and concluded that the impact on the balance sheet will be minimal. The other components of net benefit cost that will be required to be presented outside of income from operations in the Consolidated Statements of Income on adoption are $28 million for the year ended December 31, 2017. The Company will adopt this guidance effective January 1, 2018.
96 Emera Inc. — Annual Report 2017
Table of Contents
Notes to the Consolidated Financial Statements
Targeted Improvements to Accounting for Hedging Activities
In August 2017, the FASB issued ASU 2017-12, Targeted Improvements to Accounting for Hedging Activities, which amends the hedge accounting recognition and presentation requirements in ASC Topic 815. This standard improves the transparency and understandability of information about an entity’s risk management activities by better aligning the entity’s financial reporting for hedging relationships with those risk management activities and simplifies the application of hedge accounting. The standard will make more financial and nonfinancial hedging strategies eligible for hedge accounting, amends the presentation and disclosure requirements for hedging activities and changes how entities assess hedge effectiveness. This guidance will be effective for annual reporting periods, including interim reporting within those periods, beginning after December 15, 2018, with early adoption permitted, and is required to be applied using a modified retrospective approach. The Company is currently evaluating the impact of the adoption of this standard on the consolidated financial statements.
| 4. | Acquisition |
TECO Energy Inc.
On July 1, 2016, Emera acquired all of the outstanding common shares of TECO Energy for $27.55 US dollars (“USD”) per common share. The net cash purchase price totalled $8.4 billion ($6.5 billion USD), with an aggregate purchase price of $13.9 billion ($10.7 billion USD), including the assumption of $5.5 billion ($4.2 billion USD) in US debt on closing.
The majority of TECO Energy’s operations are subject to the rate-setting authority of the Federal Energy Regulatory Commission (“FERC”), FPSC, and New Mexico Public Regulation Commission (“NMPRC”), and are accounted for pursuant to USGAAP, including the accounting guidance for regulated operations. Except for unregulated long-term debt acquired and deferred taxes, fair values of tangible and intangible assets and liabilities subject to these rate-setting provisions approximate their carrying values due to the fact that a market participant would not expect to recover any more or less than their net carrying value. Accordingly, assets acquired and liabilities assumed and pro-forma financial information do not reflect any adjustments related to these amounts.
The acquisition is accounted for in accordance with the acquisition method of accounting. The excess of purchase price over estimated fair values of assets acquired and liabilities assumed has been recognized as goodwill at the acquisition date of July 1, 2016. The goodwill reflects the value paid for access to regulated assets, net income and cash flows in growth markets, opportunities for adjacency growth, long-term potential for enhanced access to capital as a result of increased scale and business diversity, and an improved earnings risk profile. The goodwill recognized as part of this transaction is not deductible for income tax purposes, and as such, no deferred taxes have been recorded related to this goodwill.
Emera Inc. — Annual Report 2017 97
Table of Contents
The following table summarizes the final allocation of the purchase consideration to the assets and liabilities acquired as at July 1, 2016 based on their fair values, using the July 1, 2016 exchange rate of $1.00 USD = $1.3009 CAD.
| millions of Canadian dollars | ||||
| Purchase Consideration |
$ 8,447 | |||
| Fair value assigned to net assets: |
||||
| Current assets (1) |
$ 619 | |||
| Regulatory assets (including current portion) |
624 | |||
| Property, plant and equipment, net |
10,023 | |||
| Other long-term assets |
71 | |||
| Current liabilities |
(747 | ) | ||
| Assumed long-term debt (including current portion) |
(5,409 | ) | ||
| Regulatory liabilities (including current portion) |
(1,117 | ) | ||
| Deferred income taxes |
(800 | ) | ||
| Pension and post-retirement liabilities (including current portion) |
(480 | ) | ||
| Other long-term liabilities |
(146 | ) | ||
| $ 2,638 | ||||
| Cash and cash equivalents |
38 | |||
| Fair value of net assets acquired |
$ 2,676 | |||
| Goodwill |
$ 5,771 | |||
| (1) | Includes accounts receivables with fair value of $334 million comprised of gross contract value of $337 million, and $3 million of contractual receivables not expected to be collected. |
Goodwill has been allocated to the TECO Energy reporting units as follows:
| millions of Canadian dollars | Goodwill | |||
| Reporting Unit |
||||
| Tampa Electric |
$ | 4,552 | ||
| PGS |
744 | |||
| New Mexico Gas |
475 | |||
| Goodwill |
$ | 5,771 | ||
Goodwill is subject to an annual assessment for impairment at the reporting unit level. Adverse changes in assumptions could result in a material impairment of Emera’s goodwill (refer to note 22).
Acquisition Related Expenses
There were no acquisition related expenses incurred for the year ended December 31, 2017. Acquisition related expenses totalled $250 million ($166 million after tax) for the year ended December 31, 2016. These acquisition related expenses were included in Interest expense, net and Operating, maintenance and general on the Consolidated Statements of Income.
Supplemental Pro Forma Data
The unaudited pro forma financial information below gives effect to the acquisition of TECO Energy as if the transaction had occurred at the beginning of 2016. This pro forma data is presented for information purposes only, and does not purport to be indicative of the results that would have occurred had the acquisition taken place at the beginning of 2016, nor is it indicative of the results that may be expected in future periods.
Pro forma net income attributable to common shareholders excludes all non-recurring acquisition-related expenses incurred by TECO Energy and Emera and includes adjustments for pro forma financing costs associated with the acquisition. Total after-tax adjustments increased pro forma net income attributable to common shareholders by $53 million for the year ended December 31, 2016.
| For the millions of Canadian dollars |
Year ended December 31, 2016 | |||
| Pro forma operating revenues |
$ 6,034 | |||
| Pro forma net income attributable to common shareholders |
$ 386 | |||
98 Emera Inc. — Annual Report 2017
Table of Contents
Notes to the Consolidated Financial Statements
| 5. | Segment Information |
Emera manages its reportable segments separately due in part to their different geographical, operating and regulatory environments. Segments are reported based on each subsidiary’s contribution of revenues, net income attributable to common shareholders and total assets as reported to the Company’s chief operating decision maker. Emera’s six reportable segments are Emera Florida and New Mexico, NSPI, Emera Maine, Emera Caribbean, Emera Energy and Corporate and Other (includes Emera Utility Services, ENL, Emera Brunswick Pipeline, Corporate, other strategic investments and holding companies).
| Emera Florida and New |
NSPI | Emera Maine |
Emera Caribbean |
Emera Energy |
Corporate and Other |
Inter- segment eliminations |
Total | |||||||||||||||||||||||||
| millions of Canadian dollars | ||||||||||||||||||||||||||||||||
| For the year ended December 31, 2017 |
||||||||||||||||||||||||||||||||
| Operating revenues from external |
$ | 3,623 | $ | 1,335 | $ | 297 | $ | 434 | $ | 451 | $ | 86 | $ | — | $ | 6,226 | ||||||||||||||||
| Inter-segment revenues (1) |
— | 3 | — | — | 14 | 41 | (58 | ) | — | |||||||||||||||||||||||
| Total operating revenues |
3,623 | 1,338 | 297 | 434 | 465 | 127 | (58 | ) | 6,226 | |||||||||||||||||||||||
| Allowance for funds used during construction – debt and equity |
5 | 8 | 3 | — | — | — | — | 16 | ||||||||||||||||||||||||
| Regulated fuel and fixed cost deferral adjustments |
— | 59 | — | — | — | — | — | 59 | ||||||||||||||||||||||||
| Depreciation and amortization |
500 | 207 | 47 | 51 | 48 | 3 | — | 856 | ||||||||||||||||||||||||
| Interest expense (2) |
248 | 134 | 20 | 25 | 2 | 276 | — | 705 | ||||||||||||||||||||||||
| Internally allocated interest(3) |
— | — | — | — | (24 | ) | 24 | — | — | |||||||||||||||||||||||
| Income from equity investments |
— | — | 1 | 3 | 24 | 96 | — | 124 | ||||||||||||||||||||||||
| Income tax expense (recovery) |
529 | — | 27 | — | 18 | (54 | ) | — | 520 | |||||||||||||||||||||||
| Net income attributable to common shareholders |
99 | 129 | 46 | 31 | 93 | (132 | ) | — | 266 | |||||||||||||||||||||||
| Capital expenditures |
910 | 385 | 82 | 72 | 47 | 26 | — | 1,522 | ||||||||||||||||||||||||
| As at December 31, 2017 |
||||||||||||||||||||||||||||||||
| Total assets |
17,216 | 4,979 | 1,505 | 1,251 | 1,575 | 2,331 | (86 | ) | 28,771 | |||||||||||||||||||||||
| Investments subject to significant influence |
— | — | 13 | 39 | — | 1,163 | — | 1,215 | ||||||||||||||||||||||||
| Goodwill |
5,566 | — | 143 | 96 | — | — | — | 5,805 | ||||||||||||||||||||||||
| (1) | All significant intercompany balances and intercompany transactions have been eliminated on consolidation except for certain transactions between non-regulated and regulated entities that have not been eliminated because management believes that the elimination of these transactions would understate property, plant and equipment, operating, maintenance and general expenses, or regulated fuel for generation and purchased power. Intercompany transactions which have not been eliminated are measured at the amount of consideration established and agreed to by the related parties. Eliminated transactions are included in determining reportable segments. |
| (2) | Interest expense net of interest revenue. Corporate and Other Interest expense has also been reduced by amortization of $24 million related to the unregulated long-term debt fair market value adjustment recognized on the acquisition of TECO Energy. |
| (3) | Segment net income is reported on a basis that includes internally allocated financing costs. |
Emera Inc. — Annual Report 2017 99
Table of Contents
| |
Emera Florida and New |
|
NSPI | |
Emera Maine |
|
|
Emera Caribbean |
|
|
Emera Energy |
|
|
Corporate and Other |
|
|
Inter- segment eliminations |
|
Total | |||||||||||||
| For the year ended December 31, 2016 |
||||||||||||||||||||||||||||||||
| Operating revenues from external customers (1) |
$ | 1,839 | $ | 1,354 | $ | 297 | $ | 419 | $ | 298 | $ | 69 | $ | — | $ | 4,276 | ||||||||||||||||
| Inter-segment revenues (1) |
— | 2 | — | — | 11 | 24 | (36 | ) | 1 | |||||||||||||||||||||||
| Total operating revenues |
1,839 | 1,356 | 297 | 419 | 309 | 93 | (36 | ) | 4,277 | |||||||||||||||||||||||
| Allowance for funds used during construction – debt and equity |
28 | 6 | 1 | — | — | — | — | 35 | ||||||||||||||||||||||||
| Regulated fuel and fixed cost deferral adjustments |
— | 61 | — | — | — | — | — | 61 | ||||||||||||||||||||||||
| Depreciation and amortization |
243 | 197 | 51 | 48 | 45 | 4 | — | 588 | ||||||||||||||||||||||||
| Interest expense (3) |
125 | 127 | 19 | 15 | 1 | 311 | — | 598 | ||||||||||||||||||||||||
| Internally allocated interest (4) |
— | — | — | — | (24 | ) | 24 | — | — | |||||||||||||||||||||||
| Income from equity investments |
— | — | — | 3 | 11 | 86 | — | 100 | ||||||||||||||||||||||||
| Income tax expense (recovery) |
100 | 12 | 23 | 14 | (53 | ) | (118 | ) | — | (22 | ) | |||||||||||||||||||||
| Net income attributable to common shareholders |
172 | 130 | 47 | 100 | (110 | ) | (112 | ) | — | 227 | ||||||||||||||||||||||
| Capital expenditures |
547 | 304 | 85 | 87 | 39 | 7 | — | 1,069 | ||||||||||||||||||||||||
| As at December 31, 2016 |
||||||||||||||||||||||||||||||||
| Total assets |
18,016 | 4,776 | 1,543 | 1,331 | 1,702 | 1,966 | (113 | ) | 29,221 | |||||||||||||||||||||||
| Investments subject to significant influence |
— | — | 13 | 39 | — | 895 | — | 947 | ||||||||||||||||||||||||
| Goodwill |
5,957 | — | 154 | 102 | — | — | — | 6,213 | ||||||||||||||||||||||||
| (1) | All significant intercompany balances and intercompany transactions have been eliminated on consolidation except for certain transactions between non-regulated and regulated entities that have not been eliminated because management believes that the elimination of these transactions would understate property, plant and equipment, operating, maintenance and general expenses, or regulated fuel for generation and purchased power. Intercompany transactions which have not been eliminated are measured at the amount of consideration established and agreed to by the related parties. Eliminated transactions are included in determining reportable segments. |
| (2) | Financial results of Emera Florida and New Mexico are from July 1, 2016, the date of the acquisition. |
| (3) | Interest expense net of interest revenue. Corporate and Other Interest expense has also been reduced by amortization of $13 million related to the unregulated long-term debt fair market value adjustment recognized on the acquisition of TECO Energy. |
| (4) | Segment net income is reported on a basis that includes internally allocated financing costs. |
100 Emera Inc. — Annual Report 2017
Table of Contents
Notes to the Consolidated Financial Statements
Geographical Information
Revenues: (1)
| For the | Year ended December 31 | |||||||
| millions of Canadian dollars | 2017 | 2016 | ||||||
| Canada |
$ | 1,464 | $ 1,510 | |||||
| United States |
4,328 | 2,348 | ||||||
| Barbados |
280 | 254 | ||||||
| The Bahamas |
119 | 121 | ||||||
| Dominica |
35 | 44 | ||||||
| $ | 6,226 | $ 4,277 | ||||||
| (1) | Revenues are based on country of origin of the product or service sold. |
Property Plant and Equipment:
| As at | December 31 | December 31 | ||||||
| millions of Canadian dollars | 2017 | 2016 | ||||||
| Canada |
$ | 3,995 | $ 3,791 | |||||
| United States |
12,257 | 12,724 | ||||||
| Barbados |
408 | 416 | ||||||
| The Bahamas |
276 | 295 | ||||||
| Dominica |
59 | 64 | ||||||
| $ | 16,995 | $ 17,290 | ||||||
Emera Inc. — Annual Report 2017 101
Table of Contents
| 6. | Investments Subject to Significant Influence and Equity Income |
Investments subject to significant influence consisted of the following:
| Carrying value as at December 31 |
Equity income for the year ended |
Percentage of ownership |
||||||||||||||||||
| millions of Canadian dollars | 2017 | 2016 | 2017 | 2016 | 2017 | |||||||||||||||
| NSPML |
$ | 510 | $ | 315 | $ | 36 | $ | 21 | 100.0 | |||||||||||
| LIL (1) |
492 | 400 | 37 | 24 | 49.5 | |||||||||||||||
| M&NP (2) |
156 | 175 | 23 | 23 | 12.9 | |||||||||||||||
| Lucelec (2) |
39 | 39 | 3 | 3 | 19.1 | |||||||||||||||
| Bear Swamp (3) |
— | — | 23 | 11 | 50.0 | |||||||||||||||
| APUC (4) |
— | — | — | 18 | — | |||||||||||||||
| Other Investments |
18 | 18 | 2 | — | ||||||||||||||||
| $ | 1,215 | $ | 947 | $ | 124 | $ | 100 | |||||||||||||
| (1) | Emera indirectly owns 100 per cent of the Class B units, which comprises 24.9 per cent of the total units issued. Emera’s percentage ownership in LIL is subject to change, based on the balance of capital investments required from Emera and Nalcor Energy to complete construction of the LIL. Emera’s ultimate percentage investment in LIL will be determined upon completion of the LIL and final costing of all transmission projects related to the Muskrat Falls development, including the LIL, Labrador Transmission Assets and Maritime Link Projects, such that Emera’s total investment in the Maritime Link and LIL will equal 49 per cent of the cost of all of these transmission developments. |
| (2) | Although Emera’s ownership percentage of these entities is relatively low, it is considered to have significant influence over the operating and financial decisions of these companies through Board representation. Therefore, Emera records its investment in these entities using the equity method. |
| (3) | The investment balance in Bear Swamp is in a credit position, primarily a result of a $179 million distribution received in Q4 2015. Bear Swamp’s credit investment balance of $188 million (2016 – $217 million) is recorded in “Other long-term liabilities” on the Consolidated Balance Sheets. |
| (4) | In two separate transactions in 2016, Emera sold a total of 63 million common shares in APUC. Emera no longer holds any interest in APUC. |
Equity investments include a $13 million difference between the cost and the underlying fair value of the investees’ assets as at the date of acquisition. The excess is attributable to goodwill.
Emera accounts for its variable interest investment in NSPML as an equity investment (note 32). NSPML’s consolidated summarized balance sheets are illustrated as follows:
| As at | December 31 | |||||||
| millions of Canadian dollars | 2017 | 2016 | ||||||
| Balance Sheets |
||||||||
| Current assets |
$ | 225 | $ | 439 | ||||
| Property, plant and equipment |
1,720 | 1,132 | ||||||
| Non-current assets |
74 | 276 | ||||||
| Total assets |
$ | 2,019 | $ | 1,847 | ||||
| Current liabilities |
$ | 180 | $ | 219 | ||||
| Long-term debt |
1,287 | 1,288 | ||||||
| Non-current liabilities |
42 | 25 | ||||||
| Equity |
510 | 315 | ||||||
| Total liabilities and equity |
$ | 2,019 | $ | 1,847 | ||||
102 Emera Inc. — Annual Report 2017
Table of Contents
Notes to the Consolidated Financial Statements
| 7. | Other Income (Expenses), Net |
Other income (expenses), net consisted of the following:
| For the | Year ended December 31 | |||||||
| millions of Canadian dollars | 2017 | 2016 | ||||||
| Gain on sale of APUC common shares (note 6) |
$ | — | $ 160 | |||||
| Gain on conversion of APUC subscription receipts and dividend equivalents to common shares of APUC (note 6) |
— | 63 | ||||||
| Gain on BLPC Self-Insurance Fund (“SIF”) regulatory liability (1) |
— | 53 | ||||||
| Foreign exchange (losses) gains and mark-to-market adjustments related to the TECO Energy acquisition (2) |
— | (135 | ) | |||||
| Other |
2 | 33 | ||||||
| $ | 2 | $ 174 | ||||||
| (1) | In June 2016, BLPC secured support from the Government of Barbados and the Trustees of the SIF to reduce the contingency funding in the SIF to $22 million USD. As a result, Emera reduced the SIF regulatory liability to $30 million ($22 million USD) and recorded a pre-tax gain of $53 million (after-tax gain of $43 million). |
| (2) | Mark-to-market adjustments included in Emera’s other income related to the effect of TECO Energy convertible debenture related USD-denominated currency and forward contracts. These contracts were put in place to economically hedge the anticipated proceeds from the 2015 sale of $2.185 billion 4 per cent convertible unsecured subordinated debentures represented by instalment receipts (“the Debenture Offering” or “Debentures” or “Convertible Debentures”) for the TECO Energy acquisition. |
| 8. | Interest Expense, Net |
Interest expense, net consisted of the following:
| For the | Year ended December 31 | |||||||
| millions of Canadian dollars | 2017 | 2016 | ||||||
| Interest on debt |
$ | 663 | $ 443 | |||||
| Beneficial conversion feature (note 10) |
— | 62 | ||||||
| Interest on Convertible Debentures (note 10) |
— | 65 | ||||||
| Interest on acquisition credit facility related to the TECO Energy acquisition (note 4) |
— | 11 | ||||||
| Allowance for borrowed funds used during construction |
(7 | ) | (13 | ) | ||||
| Other |
42 | 17 | ||||||
| $ | 698 | $ 585 | ||||||
Emera Inc. — Annual Report 2017 103
Table of Contents
| 9. | Income Taxes |
The income tax provision, for the years ended December 31, differs from that computed using the statutory income tax rate for the following reasons:
| millions of Canadian dollars | 2017 | 2016 | ||||||
| Income before provision for income taxes |
$ | 819 | $ | 244 | ||||
| Statutory income tax rate |
31 | % | 31 | % | ||||
| Income taxes, at statutory income tax rate |
254 | 76 | ||||||
| Revaluation of US non-regulated deferred income taxes |
317 | — | ||||||
| Deferred income taxes on regulated income recorded as regulatory assets and regulatory liabilities |
(54 | ) | (47 | ) | ||||
| Foreign tax rate variance |
36 | (5 | ) | |||||
| Financing deductions |
(17 | ) | (17 | ) | ||||
| Tax effect of equity earnings |
(12 | ) | (10 | ) | ||||
| Manufacturing and investment allowances |
(8 | ) | (7 | ) | ||||
| Non-taxable portion of gains on APUC transactions |
— | (34 | ) | |||||
| Non-deductible portion of foreign exchange and mark-to-market adjustments related to the |
||||||||
| TECO Energy acquisition |
— | 21 | ||||||
| Other |
4 | 1 | ||||||
| Income tax expense (recovery) |
$ | 520 | $ | (22 | ) | |||
| Effective income tax rate |
63 | % | (9 | )% | ||||
The statutory income tax rate of 31 per cent represents the combined Canadian federal and Nova Scotia and New Brunswick provincial corporate income tax rates, which are the relevant tax jurisdictions for Emera.
On December 22, 2017, the US Tax Cuts and Jobs Act of 2017 (“the Act”) was signed into legislation. The Act includes a broad range of legislative changes including a reduction of the US federal corporate income tax rate from 35 per cent to 21 per cent effective January 1, 2018, limitations on the deductibility of interest and 100 per cent expensing of qualified property. The Act provides an exemption to regulated electric and gas utilities from the limitations on the deductibility of interest and the 100 per cent expensing of qualified property.
As a result of the Act being enacted during 2017, the Company is required to revalue its United States deferred income tax assets and liabilities based on the new 21 per cent tax rate. The Company has recognized an estimated $317 million income tax expense in 2017 as a result of the revaluation of its US non-regulated net deferred income tax assets. The Company has also reduced its US regulated net deferred income tax liabilities by an estimated $1.1 billion and recorded an equivalent regulatory liability since the benefit of lower US taxes is expected to be returned to customers over time as required by the Act or by order of the applicable regulator.
As discussed above, the Company has provisionally revalued all of its US deferred tax assets and liabilities based on the rates they are expected to reverse at in the future, which is generally 21 per cent for US federal tax purposes. The December 31, 2017 balances of deferred tax assets and deferred tax liabilities that have been revalued are $1.3 billion and $1.8 billion, respectively. The Company is still analyzing certain aspects of the Act, which could potentially affect the measurement of these balances or potentially give rise to new deferred tax amounts. Further adjustments, if any, will be recorded by the Company during the measurement period in 2018 as permitted by SEC Staff Accounting Bulletin 118, Income tax Accounting Implications of the Tax Cuts and Jobs Act.
104 Emera Inc. — Annual Report 2017
Table of Contents
Notes to the Consolidated Financial Statements
The following reflects the composition of taxes on income from continuing operations presented in the Consolidated Statements of Income for the years ended December 31:
| millions of Canadian dollars | 2017 | 2016 | ||||||
| Current income taxes |
||||||||
| Canada |
$ | 24 | $ | 13 | ||||
| United States |
24 | 18 | ||||||
| Other |
3 | 15 | ||||||
| Deferred income taxes |
||||||||
| Canada |
3 | (113 | ) | |||||
| United States |
384 | 151 | ||||||
| Other |
(1 | ) | — | |||||
| Operating loss carryforwards |
||||||||
| Canada |
(40 | ) | (2 | ) | ||||
| United States |
(194 | ) | (104 | ) | ||||
| Revaluation of US non-regulated deferred income taxes |
||||||||
| United States |
317 | — | ||||||
| Income tax expense (recovery) |
$ | 520 | $ | (22 | ) | |||
The following reflects the composition of income before provision for income taxes presented in the Consolidated Statements of Income for the years ended December 31:
| millions of Canadian dollars | 2017 | 2016 | ||||||
| Canada |
$ | 88 | $ | 71 | ||||
| United States |
693 | 44 | ||||||
| Other |
38 | 129 | ||||||
| Income before provision for income taxes |
$ | 819 | $ | 244 | ||||
Emera Inc. — Annual Report 2017 105
Table of Contents
The deferred income tax assets and liabilities presented in the Consolidated Balance Sheets as at December 31 consisted of the following:
| millions of Canadian dollars | 2017 | 2016 | ||||||
| Deferred income tax assets: |
||||||||
| Tax loss carryforwards |
$ | 853 | $ | 1,036 | ||||
| Tax credit carryforwards |
314 | 318 | ||||||
| Regulatory liabilities – cost of removal |
208 | 388 | ||||||
| Pension and post-retirement liabilities |
124 | 153 | ||||||
| Derivative instruments |
107 | 150 | ||||||
| Other |
394 | 490 | ||||||
| Total deferred income tax assets before valuation allowance |
2,000 | 2,535 | ||||||
| Valuation allowance |
(105 | ) | (58 | ) | ||||
| Total deferred income tax assets after valuation allowance |
$ | 1,895 | $ | 2,477 | ||||
| Deferred income tax (liabilities): |
||||||||
| Property, plant and equipment |
$ | (2,321 | ) | $ | (3,553 | ) | ||
| Derivative instruments |
(155 | ) | (202 | ) | ||||
| Other |
(292 | ) | (269 | ) | ||||
| Total deferred income tax liabilities |
$ | (2,768 | ) | $ | (4,024 | ) | ||
| Consolidated Balance Sheets presentation: |
||||||||
| Long-term deferred income tax assets |
$ | 138 | $ | 125 | ||||
| Long-term deferred income tax liabilities |
(1,011 | ) | (1,672 | ) | ||||
| Net deferred income tax liabilities |
$ | (873 | ) | $ | (1,547 | ) | ||
For regulated entities, to the extent deferred income taxes are expected to be recovered from or returned to customers in future rates, a regulatory asset or liability is recognized, unless specifically directed otherwise by a regulator. These amounts include a gross up to reflect the income tax associated with future revenues required to fund these deferred income tax liabilities, and the income tax benefits associated with reduced revenues resulting from the realization of deferred income tax assets.
Emera’s gross net operating loss (“NOL”) carryforwards, capital loss carryforwards and tax credit carryforwards as at December 31, consisted of the following:
| millions of Canadian dollars | 2017 | 2016 | ||||||
| Canada |
||||||||
| NOL |
$ | 532 | $ | 199 | ||||
| Capital loss |
77 | 77 | ||||||
| United States |
||||||||
| Federal NOL |
$ | 2,926 | $ | 2,595 | ||||
| State NOL |
1,271 | 1,183 | ||||||
| Capital loss |
13 | 14 | ||||||
| Tax credit |
314 | 318 | ||||||
| Other |
||||||||
| NOL |
$ | 29 | $ | 22 | ||||
106 Emera Inc. — Annual Report 2017
Table of Contents
Notes to the Consolidated Financial Statements
The following table summarizes as at December 31, 2017 the deferred tax assets associated with NOL, capital loss and tax credit carryforwards and the associated expiration periods, and the valuation allowances for amounts which Emera has determined that realization is uncertain:
| millions of Canadian dollars | Deferred tax asset |
Valuation allowance |
Net deferred tax asset |
Expiration period |
||||||||||||
| Canada |
||||||||||||||||
| NOL |
$ | 164 | $ | (80 | ) | $ | 84 | 2027–2037 | ||||||||
| Capital loss |
16 | (16 | ) | — | Indefinite | |||||||||||
| United States |
||||||||||||||||
| Federal NOL |
$ | 602 | $ | — | $ | 602 | 2024–2037 | |||||||||
| State NOL |
65 | (2 | ) | 63 | 2024–2037 | |||||||||||
| Capital loss |
2 | (2 | ) | — | 2018–2019 | |||||||||||
| Tax credit |
314 | — | 314 | 2019–Indefinite | ||||||||||||
| Other |
||||||||||||||||
| NOL |
$ | 4 | $ | (4 | ) | $ | — | 2018–2024 | ||||||||
Considering all evidence regarding the utilization of the Company’s deferred income tax assets, it has been determined that Emera is more likely than not to realize all recorded deferred income tax assets, except for the loss carryforwards noted above and unrealized capital losses on certain investments. A valuation allowance of $105 million has been recorded as at December 31, 2017 (2016 – $58 million) related to the loss carryforwards and investments.
The following table provides details of the change in unrecognized tax benefits for the years ended December 31 as follows:
| millions of Canadian dollars | 2017 | 2016 | ||||||||||
| Balance, January 1 |
$ | 18 | $ | 6 | ||||||||
| Increases due to tax positions related to current year |
1 | 12 | ||||||||||
| Balance, December 31 |
$ | 19 | $ | 18 | ||||||||
The total amount of unrecognized tax benefits as at December 31, 2017 was $19 million (2016 – $18 million), which would affect the effective tax rate if recognized. The total amount of accrued interest with respect to unrecognized tax benefits was $1 million (2016 – $1 million). No penalties have been accrued. The balance of unrecognized tax benefits could change in the next 12 months as a result of resolving Canada Revenue Agency (“CRA”) and Internal Revenue Service audits. A reasonable estimate of any change cannot be made at this time.
The Company intends to indefinitely reinvest earnings from certain foreign operations. Accordingly, US and non-US income and withholding taxes for which deferred taxes might otherwise be required have not been provided for on a cumulative amount of temporary differences related to investments in foreign subsidiaries of approximately $822 million as at December 31, 2017 (2016 – $667 million). It is impractical to estimate the amount of income and withholding tax that might be payable if a reversal of temporary differences occurred.
Emera files a Canadian federal income tax return, which includes its Nova Scotia and New Brunswick provincial income tax. Emera’s subsidiaries file Canadian, US, Barbados, St. Lucia and Dominica income tax returns. As at December 31, 2017, the Company’s tax years still open to examination by taxing authorities include 2005 and subsequent years.
NSPI and the CRA are currently in a dispute with respect to the timing of certain tax deductions for NSPI’s 2006 through 2010 taxation years. The ultimate permissibility of the tax deductions is not in dispute; rather, it is the timing of those deductions. The cumulative net amount in dispute to date is $62 million, including interest. NSPI has prepaid $23 million of the amount in dispute, as required by CRA.
Should NSPI be successful in defending its position, all payments including applicable interest will be refunded. If NSPI is unsuccessful in defending any portion of its position, the resulting taxes and applicable interest will be deducted from amounts previously paid, with the excess, if any, owing to CRA. The related tax deductions will be available in subsequent years. Should NSPI receive similar notices of reassessment for years not currently in dispute, further payments will be required; however, the ultimate permissibility of these deductions would be similarly not in dispute.
NSPI and its advisors believe NSPI has reported its tax position appropriately and NSPI is disputing the reassessments through the CRA Appeal process. NSPI continues to assess its options to resolving the dispute however the outcome of the Appeal process is not determinable at this time.
Emera Inc. — Annual Report 2017 107
Table of Contents
| 10. | Common Stock |
Authorized: Unlimited number of non-par value common shares.
| 2017 | 2016 | |||||||||||||||
| Issued and outstanding: | millions of shares |
millions of Canadian |
millions of shares |
millions of Canadian |
||||||||||||
| Balance, December 31, 2016 |
210.02 | $ | 4,738 | 147.21 | $ | 2,157 | ||||||||||
| Conversion of Convertible Debentures (1) |
0.15 | 6 | 51.99 | 2,115 | ||||||||||||
| Issuance of common stock (2) |
14.61 | 680 | 7.69 | 338 | ||||||||||||
| Issued for cash under Purchase Plans at market rate |
3.89 | 182 | 2.51 | 115 | ||||||||||||
| Discount on shares purchased under Dividend Reinvestment Plan |
— | (9 | ) | — | (5 | ) | ||||||||||
| Options exercised under senior management share option plan |
0.10 | 3 | 0.62 | 17 | ||||||||||||
| Employee share purchase plan |
— | 1 | — | 1 | ||||||||||||
| Balance, December 31 2017 |
228.77 | $ | 5,601 | 210.02 | $ | 4,738 | ||||||||||
| (1) | As at December 31, 2017, a total of 52.14 million common shares of the Company were issued, representing conversion into common shares of more than 99.9% of the Convertible Debentures. |
| (2) | On December 28, 2017, Emera completed an offering of 14.6 million common shares, at $47.90 per common share, for gross proceeds of approximately $700 million. The net proceeds were $680 million after $20 million of issuance costs, net of taxes. |
As at December 31, 2017, there were the following common shares reserved for issuance: 6.5 million (2016 – 6.6 million) under the senior management stock option plan, 1.3 million (2016 – 1.5 million) under the employee common share purchase plan and 4.2 million (2016 – 7.9 million) under the dividend reinvestment plan.
The issuance of common shares under the common share compensation arrangements does not allow the plans to exceed 10 per cent of Emera’s outstanding common shares. As at December 31, 2017, Emera is in compliance with this requirement.
Convertible Debentures
In 2015, to finance a portion of the acquisition of TECO Energy, Emera completed the sale of $2.185 billion aggregate principal amount of 4 per cent convertible unsecured subordinated debentures, represented by instalment receipts. The Debentures were sold on an instalment basis at a price of $1,000 per Debenture, maturing on September 29, 2025. As of August 2, 2016, the Final Instalment Date, the Debentures bear interest at 0 per cent. At maturity, Emera has the right to pay the principal amount due in common shares to the debenture holders that have not converted, which will be valued at 95 per cent of the weighted average trading price on the TSX for the 20 consecutive trading days ending five trading days preceding the maturity date.
As at December 31, 2017, a total of 52.14 million common shares of the Company were issued, representing conversion into common shares of more than 99.9 per cent of the Convertible Debentures.
108 Emera Inc. — Annual Report 2017
Table of Contents
Notes to the Consolidated Financial Statements
| 11. | Earnings Per Share |
Basic earnings per share (“EPS”) is determined by dividing net income attributable to common shareholders by the weighted average number of common shares and DSUs outstanding during the period. Diluted EPS is computed by dividing net income attributable to common shareholders by the weighted average number of common shares and DSUs outstanding during the period, adjusted for the exercise and/or conversion of all potentially dilutive securities. Such dilutive items include Company contributions to the senior management stock option plan, convertible debentures and shares issued under the dividend reinvestment plan.
The following table reconciles the computation of basic and diluted earnings per share:
| For the | Year ended December 31 | |||||||
| millions of Canadian dollars (except per share amounts) | 2017 | 2016 | ||||||
| Numerator |
||||||||
| Net income attributable to common shareholders |
$ | 266.1 | $ 227.2 | |||||
| Convertible Debentures |
— | 0.2 | ||||||
| Diluted numerator |
266.1 | 227.4 | ||||||
| Denominator Weighted average shares of common stock outstanding |
212.3 | 170.4 | ||||||
| Weighted average deferred share units outstanding |
1.1 | 1.0 | ||||||
| Weighted average shares of common stock outstanding – basic |
213.4 | 171.4 | ||||||
| Stock-based compensation |
0.6 | 0.6 | ||||||
| Convertible Debentures |
0.1 | 0.2 | ||||||
| Weighted average shares of common stock outstanding – diluted |
214.1 | 172.2 | ||||||
| Earnings per common share |
||||||||
| Basic |
$ | 1.25 | $ 1.33 | |||||
| Diluted |
$ | 1.24 | $ 1.32 | |||||
Emera Inc. — Annual Report 2017 109
Table of Contents
| 12. | Accumulated Other Comprehensive Income (Loss) |
The components of accumulated other comprehensive income are as follows:
| For the | Year ended December 31, 2017 | |||||||||||||||||||||||
| millions of Canadian dollars | Unrealized (loss) gain on translation of self-sustaining foreign operations |
Net change in net investment hedges |
(Losses) gains on derivatives recognized as cash flow hedges |
Net change on on available- for-sale investments |
Net change in unrecognized pension and post-retirement benefit costs |
Total AOCI | ||||||||||||||||||
| Balance, January 1, 2017 |
$ | 486 | $ | (49 | ) | $ | (21 | ) | $ | (1 | ) | $ | (309 | ) | $ | 106 | ||||||||
| Other comprehensive income (loss) before reclassifications |
(457 | ) | 97 | 10 | 5 | — | (345 | ) | ||||||||||||||||
| Amounts reclassified from accumulated other comprehensive income loss |
— | — | 8 | (1 | ) | 44 | 51 | |||||||||||||||||
| Net current period other comprehensive income (loss) |
(457 | ) | 97 | 18 | 4 | 44 | (294 | ) | ||||||||||||||||
| Other |
— | — | — | — | — | — | ||||||||||||||||||
| Balance, December 31, 2017 |
$ | 29 | $ | 48 | $ | (3 | ) | $ | 3 | $ |
(265 |
) |
$ | (188 | ) | |||||||||
| For the | Year ended December 31, 2016 | |||||||||||||||||||||||
| millions of Canadian dollars | Unrealized (loss) gain on translation of self-sustaining foreign operations |
Net change in net investment hedges |
(Losses) gains on derivatives recognized as cash flow hedges |
Net change on on available- for-sale investments |
Net change in unrecognized pension and post-retirement benefit costs |
Total AOCI | ||||||||||||||||||
| Balance, January 1, 2016 |
$ | 490 | $ | — | $ | (35 | ) | $ | — | $ | (318 | ) | $ | 137 | ||||||||||
| Other comprehensive income (loss) before reclassifications |
35 | (49 | ) | 11 | 3 | — | — | |||||||||||||||||
| Amounts reclassified from accumulated other comprehensive income loss (gain) |
— | — | 11 | (4 | ) | 12 | 19 | |||||||||||||||||
| Equity method reclassification adjustments |
(35 | ) | — | (8 | ) | — | (3 | ) | (46 | ) | ||||||||||||||
| Net current period other comprehensive income (loss) |
— | (49 | ) | 14 | (1 | ) | 9 | (27 | ) | |||||||||||||||
| Other |
(4 | ) | — | — | — | — | (4 | ) | ||||||||||||||||
| Balance, December 31, 2016 |
$ | 486 | $ | (49 | ) | $ | (21) | $ | (1 | ) | $ | (309) | $ | 106 | ||||||||||
110 Emera Inc. — Annual Report 2017
Table of Contents
Notes to the Consolidated Financial Statements
The reclassifications out of accumulated other comprehensive income (loss) are as follows:
| For the | Year ended December 31 | |||||||||
| 2017 | 2016 | |||||||||
| millions of Canadian dollars | Affected line item in the Consolidated Financial Statements |
Amounts reclassified from AOCI | ||||||||
| Equity method reclassification adjustments |
||||||||||
| Investments subject to significant influence | $ | — | $ | 54 | ||||||
| Total before tax |
— | 54 | ||||||||
| Deferred income taxes | — | (8 | ) | |||||||
| Total net of tax |
$ | — | $ | 46 | ||||||
| Losses (gain) on derivatives recognized as cash flow hedges |
||||||||||
| Power and gas swaps |
Non-regulated fuel for generation and purchased power | $ | (3 | ) | $ | (2 | ) | |||
| Interest rate swaps |
Income from equity investments | — | 1 | |||||||
| Foreign exchange forwards |
Operating revenue – regulated | 10 | 12 | |||||||
| Total before tax |
7 | 11 | ||||||||
| Income tax recovery (expense) | 1 | — | ||||||||
| Total net of tax |
$ | 8 | $ | 11 | ||||||
| Net change in available-for-sale investments |
||||||||||
| Other income (expenses), net | $ | (1 | ) | $ | (4 | ) | ||||
| Total before tax |
(1 | ) | (4 | ) | ||||||
| Income tax recovery (expense) | — | — | ||||||||
| Total net of tax |
$ | (1 | ) | $ | (4 | ) | ||||
| Net change in unrecognized pension and post-retirement benefit costs |
||||||||||
| Actuarial losses (gains) |
Operating, maintenance and general (“OM&G”) | $ | 40 | $ | 41 | |||||
| Past service costs (gains) |
OM&G | (8 | ) | (9 | ) | |||||
| Amounts reclassified into obligations |
Pension and post-retirement benefits | 11 | (17 | ) | ||||||
| Total before tax |
43 | 15 | ||||||||
| Income tax recovery (expense) | 1 | (3 | ) | |||||||
| Total net of tax |
$ | 44 | $ | 12 | ||||||
| Total reclassifications out of AOCI, net of tax, for the period |
$ | 51 | $ | 65 | ||||||
| 13. | Inventory |
Inventory consisted of the following:
| As at | December 31 | December 31 | ||||||||||
| millions of Canadian dollars | 2017 | 2016 | ||||||||||
| Fuel |
$ | 180 | $ | 235 | ||||||||
| Materials |
216 | 215 | ||||||||||
| Emission credits (1) |
22 | 22 | ||||||||||
| $ | 418 | $ | 472 | |||||||||
| (1) | The NEGG Facilities are subject to the Acid Rain Program for sulphur dioxide emissions and the Regional Greenhouse Gas Initiative for carbon dioxide emissions. The emissions credits inventory balance represents the credits purchased to offset the other current liabilities and other long-term liabilities associated with these programs. |
Emera Inc. — Annual Report 2017 111
Table of Contents
| 14. | Derivative Instruments |
Derivative assets and liabilities relating to the foregoing categories consisted of the following:
| Derivative assets | Derivative liabilities | |||||||||||||||
| As at | December 31 | December 31 | ||||||||||||||
| millions of Canadian dollars | 2017 | 2016 | 2017 | 2016 | ||||||||||||
| Cash flow hedges |
||||||||||||||||
| Power swaps |
$ | 5 | $ | 10 | $ | 2 | $ | 5 | ||||||||
| Foreign exchange forwards |
2 | — | 5 | 22 | ||||||||||||
| 7 | 10 | 7 | 27 | |||||||||||||
| Regulatory deferral |
||||||||||||||||
| Commodity swaps and forwards |
||||||||||||||||
| Coal purchases |
137 | 83 | 10 | 9 | ||||||||||||
| Power purchases |
5 | 7 | 3 | 4 | ||||||||||||
| Natural gas purchases and sales |
6 | 33 | 7 | 2 | ||||||||||||
| Heavy fuel oil purchases |
15 | 10 | 4 | 7 | ||||||||||||
| Foreign exchange forwards |
32 | 106 | 4 | — | ||||||||||||
| 195 | 239 | 28 | 22 | |||||||||||||
| HFT derivatives |
||||||||||||||||
| Power swaps and physical contracts |
125 | 47 | 162 | 71 | ||||||||||||
| Natural gas swaps, futures, forwards, physical contracts |
105 | 111 | 294 | 484 | ||||||||||||
| 230 | 158 | 456 | 555 | |||||||||||||
| Other derivatives |
||||||||||||||||
| Interest rate swap |
2 | — | — | 1 | ||||||||||||
| Foreign exchange forwards |
— | — | — | 1 | ||||||||||||
| 2 | — | — | 2 | |||||||||||||
| Total gross current derivatives |
434 | 407 | 491 | 606 | ||||||||||||
| Impact of master netting agreements with intent to settle net or simultaneously |
(181 | ) | (131 | ) | (181 | ) | (131 | ) | ||||||||
| 253 | 276 | 310 | 475 | |||||||||||||
| Current |
141 | 145 | 227 | 325 | ||||||||||||
| Long-term |
112 | 131 | 83 | 150 | ||||||||||||
| Total derivatives |
$ | 253 | $ | 276 | $ | 310 | $ | 475 | ||||||||
Derivative assets and liabilities are classified as current or long-term based upon the maturities of the underlying contracts.
112 Emera Inc. — Annual Report 2017
Table of Contents
Notes to the Consolidated Financial Statements
Details of master netting agreements, shown net on the Consolidated Balance Sheets, are summarized in the following table:
| Derivative assets | Derivative liabilities | |||||||||||||||
| As at | December 31 | December 31 | ||||||||||||||
| millions of Canadian dollars | 2017 | 2016 | 2017 | 2016 | ||||||||||||
| Regulatory deferral |
$ | 14 | $ | 10 | $ | 14 | $ | 10 | ||||||||
| HFT derivatives |
167 | 121 | 167 | 121 | ||||||||||||
| Total impact of master netting agreements with |
$ | 181 | $ | 131 | $ | 181 | $ | 131 | ||||||||
Cash Flow Hedges
The Company enters into various derivatives designated as cash flow hedges. Emera enters into power swaps to limit Bear Swamp’s exposure to purchased power prices. The Company also enters into foreign exchange forwards to hedge the currency risk for revenue streams denominated in foreign currency for Brunswick Pipeline.
The amounts related to cash flow hedges recorded in income and AOCI consisted of the following:
| For the | Year ended December 31 | |||||||||||||||||||||||
| millions of Canadian dollars | 2017 | 2016 | ||||||||||||||||||||||
| Power swaps |
Interest rate swaps |
Foreign exchange forwards |
Power swaps |
Interest rate swaps |
Foreign exchange forwards |
|||||||||||||||||||
| Realized gain (loss) in non-regulated fuel for generation and purchased power |
3 | — | — | 2 | — | — | ||||||||||||||||||
| Realized gain (loss) in operating revenue – Regulated |
— | — | (10 | ) | — | — | (12 | ) | ||||||||||||||||
| Realized gain (loss) in income from equity investments |
— | — | — | — | (1 | ) | — | |||||||||||||||||
| Total gains (losses) in Net income |
$ | 3 | $ | — | $ | (10 | ) | $ | 2 | $ | (1 | ) | $ | (12 | ) | |||||||||
| As at | December 31 | |||||||||||||||||||||||
| millions of Canadian dollars | 2017 | 2016 | ||||||||||||||||||||||
| Power swaps |
Interest rate swaps |
Foreign exchange forwards |
Power swaps |
Interest rate swaps |
Foreign exchange forwards |
|||||||||||||||||||
| Total unrealized gain (loss) in AOCI – effective portion, net of tax |
$ | — | $ | — | $ | (3 | ) | $ | 2 | $ | — | $ | (22 | ) | ||||||||||
The Company expects $5 million of unrealized losses currently in AOCI to be reclassified into net income within the next 12 months, as the underlying hedged transactions settle.
As at December 31, 2017, the Company had the following notional volumes of outstanding derivatives designated as cash flow hedges that are expected to settle as outlined below:
| millions | 2018 | 2019 | 2020 | 2021 | 2022 | |||||||||||||||
| Foreign exchange forwards (USD) sales |
$ | 45 | $ | 30 | $ | 30 | $ | — | $ | — | ||||||||||
Emera Inc. — Annual Report 2017 113
Table of Contents
Regulatory Deferral
The Company has recorded the following changes in realized and unrealized gains (losses) with respect to derivatives receiving regulatory deferral:
| For the | Year ended December 31 | |||||||||||||||||||||||
| millions of Canadian dollars | 2017 | 2016 | ||||||||||||||||||||||
| Commodity swaps and forwards |
Physical natural gas purchases and sales |
Foreign exchange forwards |
Commodity swaps and forwards |
Physical natural gas purchases and sales |
Foreign exchange forwards |
|||||||||||||||||||
| Unrealized gain (loss) in regulatory assets |
$ | (33 | ) | $ | (1 | ) | $ | (4 | ) | $ | 40 | $ | — | $ | (2 | ) | ||||||||
| Unrealized gain (loss) in regulatory liabilities |
83 | 1 | (30 | ) | 101 | (1 | ) | (30 | ) | |||||||||||||||
| Realized (gain) loss in regulatory assets |
— | — | — | — | — | 12 | ||||||||||||||||||
| Realized (gain) loss in regulatory liabilities |
(2 | ) | — | — | — | — | (8 | ) | ||||||||||||||||
| Realized (gain) loss in inventory (1) |
(17 | ) | — | (30 | ) | 5 | — | (44 | ) | |||||||||||||||
| Realized (gain) loss in regulated fuel for generation and purchased power (2) |
(3 | ) | — | (14 | ) | 17 | (1 | ) | (18 | ) | ||||||||||||||
| Total change derivative instruments |
$ | 28 | $ | — | $ | (78 | ) | $ | 163 | $ | (2 | ) | $ | (90 | ) | |||||||||
| (1) | Realized (gains) losses will be recognized in fuel for generation and purchased power when the hedged item is consumed. |
| (2) | Realized (gains) losses on derivative instruments settled and consumed in the period; hedging relationships that have been terminated or the hedged transaction is no longer probable. |
Commodity Swaps and Forwards
As at December 31, 2017, the Company had the following notional volumes of commodity swaps and forward contracts designated for regulatory deferral that are expected to settle as outlined below:
| 2018 | 2019–2021 | |||||||||||
| millions | Purchases | Purchases | ||||||||||
| Coal (metric tonnes) |
1 | 1 | ||||||||||
| Natural Gas (Mmbtu) |
30 | 14 | ||||||||||
| Heavy fuel oil (bbls) |
— | 1 | ||||||||||
Foreign Exchange Swaps and Forwards
As at December 31, 2017, the Company had the following notional volumes of foreign exchange swaps and forward contracts related to commodity contracts that are expected to settle as outlined below:
| 2018 | 2019–2020 | |||||||||||
| Foreign exchange contracts (millions of US dollars) |
$ | 144 | $ | 156 | ||||||||
| Weighted average rate |
1.1061 | 1.2001 | ||||||||||
| % of USD requirements |
79% | 40% | ||||||||||
The Company reassesses foreign exchange forecasted periodically and will enter into additional hedges or unwind existing hedges, as required.
114 Emera Inc. — Annual Report 2017
Table of Contents
Notes to the Consolidated Financial Statements
Held-for-Trading Derivatives
In the ordinary course of its business, Emera enters into physical contracts for the purchase and sale of natural gas, as well as power and natural gas swaps, forwards and futures, to economically hedge those physical contracts. These derivatives are all considered held for trading (“HFT”).
The Company has recognized the following realized and unrealized gains (losses) with respect to HFT derivatives:
| For the | Year ended December 31 | |||||||
| millions of Canadian dollars | 2017 | 2016 | ||||||
| Power swaps and physical contracts in non-regulated operating revenues |
$ | 7 | $ | (1 | ) | |||
| Natural gas swaps, forwards, futures and physical contracts in non-regulated operating revenues |
401 | 69 | ||||||
| Natural gas swaps, forwards, futures and physical contracts in non-regulated fuel for generation and purchased power |
10 | (7 | ) | |||||
| Power swaps, forwards, futures and physical contracts in non-regulated fuel for generation and purchased power |
2 | — | ||||||
| Foreign exchange options in other income (expenses), net |
— | (2 | ) | |||||
| $ | 420 | $ | 59 | |||||
As at December 31, 2017, the Company had the following notional volumes of outstanding HFT derivatives that are expected to settle as outlined below:
| millions | 2018 | 2019 | 2020 | 2021 | 2022 | |||||||||||||||
| Natural gas purchases (Mmbtu) |
325 | 134 | 62 | 44 | 41 | |||||||||||||||
| Natural gas sales (Mmbtu) |
250 | 56 | 21 | 8 | 2 | |||||||||||||||
| Power purchases (MWh) |
7 | 2 | — | — | — | |||||||||||||||
| Power sales (MWh) |
8 | 1 | — | — | — | |||||||||||||||
| Foreign exchange options (USD) |
$ | 2 | $ | 4 | $ | — | $ | — | $ | — | ||||||||||
Other Derivatives
The Company has recognized the following realized and unrealized gains (losses) with respect to cash flow hedges which documentation requirements have not been met:
| For the | Year ended December 31 | |||||||||||||||
| millions of Canadian dollars | 2017 | 2016 | ||||||||||||||
| Interest rate |
Foreign exchange forwards |
Interest rate |
Foreign exchange forwards |
|||||||||||||
| Realized gain (loss) in other income (expense) |
$ | — | $ | — | $ | — | $ | (87 | ) | |||||||
| Unrealized gain (loss) in interest expense, net |
2 | — | 2 | — | ||||||||||||
| Total gains (losses) in net income |
$ | 2 | $ | — | $ | 2 | $ | (87 | ) | |||||||
As at December 31, 2017, the Company had interest rate swaps in place for the $250 million non-revolving term credit facility in Brunswick Pipeline for interest payments until the debt matures in 2019.
Emera Inc. — Annual Report 2017 115
Table of Contents
Credit Risk
The Company is exposed to credit risk with respect to amounts receivable from customers, energy marketing collateral deposits and derivative assets. Credit risk is the potential loss from a counterparty’s non-performance under an agreement. The Company manages credit risk with policies and procedures for counterparty analysis, exposure measurement, and exposure monitoring and mitigation. Credit assessments are conducted on all new customers and counterparties, and deposits or collateral are requested on any high risk accounts.
The Company assesses the potential for credit losses on a regular basis, and where appropriate, maintains provisions. With respect to counterparties, the Company has implemented procedures to monitor the creditworthiness and credit exposure of counterparties and to consider default probability in valuing the counterparty positions. The Company monitors counterparties’ credit standing, including those that are experiencing financial problems, have significant swings in default probability rates, have credit rating changes by external rating agencies, or have changes in ownership. Net liability positions are adjusted based on the Company’s current default probability. Net asset positions are adjusted based on the counterparty’s current default probability. The Company assesses credit risk internally for counterparties that are not rated.
As at December 31, 2017, the maximum exposure the Company has to credit risk is $1,148 million (2016 – $1,019 million), which includes accounts receivable net of collateral/deposits and assets related to derivatives.
It is possible that volatility in commodity prices could cause the Company to have material credit risk exposures with one or more counterparties. If such counterparties fail to perform their obligations under one or more agreements, the Company could suffer a material financial loss. The Company transacts with counterparties as part of its risk management strategy for managing commodity price, foreign exchange and interest rate risk. Counterparties that exceed established credit limits can provide a cash deposit or letter of credit to the Company for the value in excess of the credit limit where contractually required. The total cash deposits/collateral on hand as at December 31, 2017 was $247 million (2016 – $271 million), which mitigates the Company’s maximum credit risk exposure. The Company uses the cash as payment for the amount receivable or returns the deposit/collateral to the customer/counterparty where it is no longer required by the Company.
The Company enters into commodity master arrangements with its counterparties to manage certain risks, including credit risk to these counterparties. The Company generally enters into International Swaps and Derivatives Association agreements (“ISDA”), North American Energy Standards Board agreements (“NAESB”) and, or Edison Electric Institute agreements. The Company believes that entering into such agreements offers protection by creating contractual rights relating to creditworthiness, collateral, non-performance and default.
As at December 31, 2017, the Company had $90 million (2016 – $104 million) in financial assets, considered to be past due, which have been outstanding for an average 69 days. The fair value of these financial assets is $78 million (2016 – $91 million), the difference of which is included in the allowance for doubtful accounts. These assets primarily relate to accounts receivable from electric and gas revenue.
116 Emera Inc. — Annual Report 2017
Table of Contents
Notes to the Consolidated Financial Statements
Concentration Risk
The Company’s concentrations of risk consisted of the following:
| As at | December 31, 2017 | December 31, 2016 | ||||||||||||||
| millions of Canadian |
% of total exposure |
millions of Canadian dollars |
% of total exposure |
|||||||||||||
| Receivables, net |
||||||||||||||||
| Regulated utilities |
||||||||||||||||
| Residential |
$ | 326 | 23% | $ | 315 | 24% | ||||||||||
| Commercial |
161 | 11% | 170 | 13% | ||||||||||||
| Industrial |
46 | 3% | 38 | 3% | ||||||||||||
| Other |
96 | 7% | 69 | 5% | ||||||||||||
| 629 | 44% | 592 | 45% | |||||||||||||
| Trading group |
||||||||||||||||
| Credit rating of A- or above |
55 | 4% | 52 | 4% | ||||||||||||
| Credit rating of BBB- to BBB+ |
61 | 4% | 60 | 5% | ||||||||||||
| Not rated |
96 | 7% | 57 | 4% | ||||||||||||
| 212 | 15% | 169 | 13% | |||||||||||||
| Other accounts receivable |
300 | 22% | 253 | 20% | ||||||||||||
| 1,141 | 81% | 1,014 | 78% | |||||||||||||
| Derivative Instruments (current and long-term) Credit rating of A- or above |
207 | 15% | 252 | 20% | ||||||||||||
| Credit rating of BBB- to BBB+ |
10 | 1% | 1 | 0% | ||||||||||||
| Not rated |
36 | 3% | 23 | 2% | ||||||||||||
| 253 | 19% | 276 | 22% | |||||||||||||
| $ | 1,394 | 100% | $ | 1,290 | 100% | |||||||||||
| Cash Collateral
|
||||||||||||||||
| The Company’s cash collateral positions consisted of the following: |
||||||||||||||||
| As at | December 31 | December 31 | ||||||||||||||
| millions of Canadian dollars | 2017 | 2016 | ||||||||||||||
| Cash collateral provided to others |
$ | 119 | $ | 91 | ||||||||||||
| Cash collateral received from others |
99 | 52 | ||||||||||||||
Collateral is posted in the normal course of business based on the Company’s creditworthiness, including its senior unsecured credit rating as determined by certain major credit rating agencies. Certain derivatives contain financial assurance provisions that require collateral to be posted if a material adverse credit-related event occurs. If a material adverse event resulted in the senior unsecured debt falling below investment grade, the counterparties to such derivatives could request ongoing full collateralization.
As at December 31, 2017, the total fair value of these derivatives, in a liability position, was $310 million (December 31, 2016 – $475 million). If the credit ratings of the Company were reduced below investment grade the full value of the net liability position could be required to be posted as collateral for these derivatives.
Emera Inc. — Annual Report 2017 117
Table of Contents
| 15. | Fair Value Measurements |
The Company is required to determine the fair value of all derivatives except those which qualify for the NPNS exemption (refer to note 1), and uses a market approach to do so. The three levels of the fair value hierarchy are defined as follows:
Level 1 – Where possible, the Company bases the fair valuation of its financial assets and liabilities on quoted prices in active markets (“quoted prices”) for identical assets and liabilities.
Level 2 – Where quoted prices for identical assets and liabilities are not available, the valuation of certain contracts must be based on quoted prices for similar assets and liabilities with an adjustment related to location differences. Also, certain derivatives are valued using quotes from over-the-counter clearing houses.
Level 3 – Where the information required for a Level 1 or Level 2 valuation is not available, derivatives must be valued using unobservable or internally-developed inputs. The primary reasons for a Level 3 classification are as follows:
| • | While valuations were based on quoted prices, significant assumptions were necessary to reflect seasonal or monthly shaping and locational basis differentials. |
| • | The term of certain transactions extends beyond the period when quoted prices are available, and accordingly, assumptions were made to extrapolate prices from the last quoted period through the end of the transaction term. |
| • | The valuations of certain transactions were based on internal models, although quoted prices were utilized in the valuations. |
Derivative assets and liabilities are classified in their entirety based on the lowest level of input that is significant to the fair value measurement.
118 Emera Inc. — Annual Report 2017
Table of Contents
Notes to the Consolidated Financial Statements
The following tables set out the classification of the methodology used by the Company to fair value its derivatives:
| As at | December 31, 2017 | |||||||||||||||
| millions of Canadian dollars | Level 1 | Level 2 | Level 3 | Total | ||||||||||||
| Assets |
||||||||||||||||
| Cash flow hedges |
||||||||||||||||
| Power swaps |
$ | 5 | $ | — | $ | — | $ | 5 | ||||||||
| Foreign exchange forwards |
— | 2 | — | 2 | ||||||||||||
| 5 | 2 | — | 7 | |||||||||||||
| Regulatory deferral |
||||||||||||||||
| Commodity swaps and forwards |
||||||||||||||||
| Coal purchases |
— | 127 | — | 127 | ||||||||||||
| Power purchases |
5 | — | — | 5 | ||||||||||||
| Natural gas purchases and sales |
— | 5 | — | 5 | ||||||||||||
| Heavy fuel oil purchases |
4 | 8 | — | 12 | ||||||||||||
| Foreign exchange forwards |
— | 32 | — | 32 | ||||||||||||
| 9 | 172 | — | 181 | |||||||||||||
| HFT derivatives |
||||||||||||||||
| Power swaps and physical contracts |
— | 3 | 9 | 12 | ||||||||||||
| Natural gas swaps, futures, forwards, physical contracts and related transportation |
— | 26 | 25 | 51 | ||||||||||||
| — | 29 | 34 | 63 | |||||||||||||
| Other derivatives |
||||||||||||||||
| Interest rate swap |
— | 2 | — | 2 | ||||||||||||
| — | 2 | — | 2 | |||||||||||||
| Total assets |
14 | 205 | 34 | 253 | ||||||||||||
| Liabilities |
||||||||||||||||
| Cash flow hedges |
||||||||||||||||
| Power swaps |
2 | — | — | 2 | ||||||||||||
| Foreign exchange forwards |
— | 5 | — | 5 | ||||||||||||
| 2 | 5 | — | 7 | |||||||||||||
| Regulatory deferral |
||||||||||||||||
| Commodity swaps and forwards |
||||||||||||||||
| Power purchases |
3 | — | — | 3 | ||||||||||||
| Natural gas purchases and sales |
5 | 1 | — | 6 | ||||||||||||
| Foreign exchange forwards |
— | 4 | — | 4 | ||||||||||||
| 8 | 5 | — | 13 | |||||||||||||
| HFT derivatives |
||||||||||||||||
| Power swaps and physical contracts |
49 | 5 | (4 | ) | 50 | |||||||||||
| Natural gas swaps, futures, forwards and physical contracts |
6 | 47 | 187 | 240 | ||||||||||||
| 55 | 52 | 183 | 290 | |||||||||||||
| Total liabilities |
65 | 62 | 183 | 310 | ||||||||||||
| Net assets (liabilities) |
$ | (51 | ) | $ | 143 | $ | (149 | ) | $ | (57 | ) | |||||
Emera Inc. — Annual Report 2017 119
Table of Contents
| As at | December 31, 2016 | |||||||||||||||
| millions of Canadian dollars | Level 1 | Level 2 | Level 3 | Total | ||||||||||||
| Assets |
||||||||||||||||
| Cash flow hedges |
||||||||||||||||
| Power swaps |
$ | 10 | $ | — | $ | — | $ | 10 | ||||||||
| 10 | — | — | 10 | |||||||||||||
| Regulatory deferral |
||||||||||||||||
| Commodity swaps and forwards |
||||||||||||||||
| Coal purchases |
— | 74 | — | 74 | ||||||||||||
| Power purchases |
7 | — | — | 7 | ||||||||||||
| Natural gas purchases and sales |
8 | 25 | — | 33 | ||||||||||||
| Heavy fuel oil purchases |
3 | 5 | 1 | 9 | ||||||||||||
| Foreign exchange forwards |
— | 106 | — | 106 | ||||||||||||
| 18 | 210 | 1 | 229 | |||||||||||||
| HFT derivatives |
||||||||||||||||
| Power swaps and physical contracts |
(7 | ) | 1 | — | (6 | ) | ||||||||||
| Natural gas swaps, futures, forwards, physical contracts and related transportation |
— | 4 | 39 | 43 | ||||||||||||
| (7 | ) | 5 | 39 | 37 | ||||||||||||
| Total assets |
21 | 215 | 40 | 276 | ||||||||||||
| Liabilities |
||||||||||||||||
| Cash flow hedges |
||||||||||||||||
| Power swaps |
4 | — | — | 4 | ||||||||||||
| Foreign exchange forwards |
— | 23 | — | 23 | ||||||||||||
| 4 | 23 | — | 27 | |||||||||||||
| Regulatory deferral |
||||||||||||||||
| Power purchases |
4 | — | — | 4 | ||||||||||||
| Heavy fuel oil purchases |
— | 6 | — | 6 | ||||||||||||
| Natural gas purchases and sales |
1 | 1 | — | 2 | ||||||||||||
| 5 | 7 | — | 12 | |||||||||||||
| HFT derivatives |
||||||||||||||||
| Power swaps and physical contracts |
12 | 5 | — | 17 | ||||||||||||
| Natural gas swaps, futures, forwards and physical contracts |
4 | 24 | 389 | 417 | ||||||||||||
| 16 | 29 | 389 | 434 | |||||||||||||
| Other derivatives |
||||||||||||||||
| Foreign exchange forwards |
— | 1 | — | 1 | ||||||||||||
| Interest rate swaps |
— | 1 | — | 1 | ||||||||||||
| — | 2 | — | 2 | |||||||||||||
| Total liabilities |
25 | 61 | 389 | 475 | ||||||||||||
| Net assets (liabilities) |
$ | (4 | ) | $ | 154 | $ | (349 | ) | $ | (199 | ) | |||||
120 Emera Inc. — Annual Report 2017
Table of Contents
Notes to the Consolidated Financial Statements
The change in the fair value of the Level 3 financial assets for the year ended December 31, 2017 was as follows:
| Regulatory deferral | HFT derivatives | |||||||||||||||||||
| millions of Canadian dollars | Oil financial derivatives |
Physical natural gas purchases and sales |
Power | Natural gas |
Total | |||||||||||||||
| Balance, January 1, 2017 |
$ | 1 | $ | — | $ | — | $ | 39 | $ | 40 | ||||||||||
| Increase (reduction) in benefit included in regulated fuel for generation and purchased power |
— | (1 | ) | — | — | (1 | ) | |||||||||||||
| Unrealized gains (losses) included in regulatory assets or liabilities |
(1 | ) | 1 | — | — | — | ||||||||||||||
| Total realized and unrealized gains (losses) included in non-regulated operating revenues |
— | — | 9 | 1 | 10 | |||||||||||||||
| Net transfers out of Level 3 |
— | — | — | (15 | ) | (15 | ) | |||||||||||||
| Balance, December 31, 2017 |
$ | — | $ | — | $ | 9 | $ | 25 | $ | 34 | ||||||||||
The change in the fair value of the Level 3 financial liabilities for the year ended December 31, 2017 was as follows:
| Regulatory deferral | HFT derivatives | |||||||||||||||||||
| millions of Canadian dollars | Oil financial derivatives |
Physical natural gas purchases and sales |
Power | Natural gas |
Total | |||||||||||||||
| Balance, January 1, 2017 |
$ | — | $ | — | $ | — | $ | 389 | $ | 389 | ||||||||||
| Increase (reduction) in benefit included in regulated fuel for generation and purchased power |
— | (1 | ) | — | — | (1 | ) | |||||||||||||
| Increase (reduction) in benefit included in non-regulated fuel for generation and purchased power |
— | 1 | — | — | 1 | |||||||||||||||
| Total realized and unrealized gains (losses) included in non-regulated operating revenues |
— | — | (5 | ) | (206 | ) | (211 | ) | ||||||||||||
| Net transfers into Level 3 |
— | — | 1 | 4 | 5 | |||||||||||||||
| Balance, December 31, 2017 |
$ | — | $ | — | $ | (4 | ) | $ | 187 | $ | 183 | |||||||||
The Company evaluates the observable inputs of market data on a quarterly basis in order to determine if transfers between levels is appropriate. For the year ended December 31, 2017, transfers out of Level 3 were a result of an increase in observable inputs. For the year ended December 31, 2017, transfers into Level 3 were a result of a decrease in observable inputs.
Significant unobservable inputs used in the fair value measurement of Emera’s natural gas and power derivatives include third-party-sourced pricing for instruments based on illiquid markets; internally developed correlation factors and basis differentials; own credit risk; and discount rates. Internally developed correlations and basis differentials are reviewed on a quarterly basis based on statistical analysis of the spot markets in the various illiquid term markets. Where possible, Emera also sources multiple broker prices in an effort to evaluate and substantiate these unobservable inputs. Discount rates may include a risk premium for those long-term forward contracts with illiquid future price points to incorporate the inherent uncertainty of these points. Any risk premiums for long-term contracts are evaluated by observing similar industry practices and in discussion with industry peers. Significant increases (decreases) in any of these inputs in isolation would result in a significantly lower (higher) fair value measurement.
Emera Inc. — Annual Report 2017 121
Table of Contents
The following table outlines quantitative information about the significant unobservable inputs used in the fair value measurements categorized within Level 3 of the fair value hierarchy:
| As at | December 31, 2017 | |||||||||||||||
| millions of Canadian dollars | Fair value | Valuation technique | Unobservable input | Range | Weighted average |
|||||||||||
| Assets |
||||||||||||||||
| HFT derivatives – |
$ | 1 | Modelled pricing | Third-party pricing | $24.88 – $117.90 | $92.93 | ||||||||||
| Power swaps and |
Probability of default | 0.00% – 0.01 | % | 0.00 | % | |||||||||||
| physical contracts |
Discount rate | 0.00% – 0.13 | % | 0.00 | % | |||||||||||
| 8 | Modelled pricing | Third-party pricing | $63.48 – $117.00 | $102.68 | ||||||||||||
| Correlation factor | 0.94% – 0.99 | % | 0.96 | % | ||||||||||||
| Probability of default | 0.00% – 0.00 | % | 0.00 | % | ||||||||||||
| Discount rate | 0.00% – 0.00 | % | 0.00 | % | ||||||||||||
| HFT derivatives – |
18 | Modelled pricing | Third-party pricing | $2.06 – $8.24 | $3.61 | |||||||||||
| Natural gas swaps, futures, |
Probability of default | 0.00% – 0.05 | % | 0.00 | % | |||||||||||
| forwards, physical contracts |
Discount rate | 0.00% – 0.29 | % | 0.06 | % | |||||||||||
| and related transportation |
7 | Modelled pricing | Third-party pricing | $2.04 – $12.52 | $6.42 | |||||||||||
| Basis adjustment | 0.08% – 0.71 | % | 0.52 | % | ||||||||||||
| Probability of default | 0.00% – 0.00 | % | 0.00 | % | ||||||||||||
| Discount rate | 0.00% – 0.09 | % | 0.01 | % | ||||||||||||
| Total assets |
$ | 34 | ||||||||||||||
| Liabilities |
||||||||||||||||
| HFT derivatives – |
$ | (6 | ) | Modelled pricing | Third-party pricing | $24.88 – $117.90 | $95.46 | |||||||||
| Power swaps and |
Own credit risk | 0.00% – 0.01 | % | 0.00 | % | |||||||||||
| physical contracts |
Discount rate | 0.00% – 0.13 | % | 0.00 | % | |||||||||||
| 2 | Modelled pricing | Third-party pricing | $94.5 – $117.00 | $105.52 | ||||||||||||
| Correlation factor | 0.94% – 0.99 | % | 0.96 | % | ||||||||||||
| Probability of default | 0.00% – 0.00 | % | 0.00 | % | ||||||||||||
| Discount rate | 0.00% – 0.00 | % | 0.00 | % | ||||||||||||
| HFT derivatives – |
172 | Modelled pricing | Third-party pricing | $1.89 – $11.81 | $4.64 | |||||||||||
| Natural gas swaps, futures, |
Own credit risk | 0.00% – 0.00 | % | 0.00 | % | |||||||||||
| forwards and physical contracts |
Discount rate | 0.00% – 0.12 | % | 0.02 | % | |||||||||||
| 15 | Modelled pricing | Third-party pricing | $2.15 – $12.52 | $8.94 | ||||||||||||
| Basis adjustment | 0.08% – 0.71 | % | 0.53 | % | ||||||||||||
| Own credit risk | 0.00% – 0.00 | % | 0.00 | % | ||||||||||||
| Discount rate | 0.00% – 0.08 | % | 0.01 | % | ||||||||||||
| Total liabilities |
$ | 183 | ||||||||||||||
| Net assets (liabilities) |
$ | (149 | ) | |||||||||||||
122 Emera Inc. — Annual Report 2017
Table of Contents
Notes to the Consolidated Financial Statements
| As at | December 31, 2016 | |||||||||||||||
| millions of Canadian dollars | Fair value | Valuation technique | Unobservable input | Range | Weighted average |
|||||||||||
| Assets |
||||||||||||||||
| Regulatory deferral – Financial |
$ | 1 | Modelled pricing | Third-party pricing | $69.64 | $69.64 | ||||||||||
| oil derivatives |
Probability of default | 0.80 | % | 0.80 | % | |||||||||||
| HFT derivatives – |
27 | Modelled pricing | Third-party pricing | $1.41 – $11.87 | $3.87 | |||||||||||
| Natural gas swaps, |
Probability of default | 0.00%–0.07 | % | 0.01 | % | |||||||||||
| futures, forwards, |
Discount rate | 0.00% – 0.32 | % | 0.05 | % | |||||||||||
| physical contracts |
12 | Modelled pricing | Third-party pricing | $1.83 – $11.87 | $6.16 | |||||||||||
| and related transportation |
Basis adjustment | (0.11)% – 0.64 | % | 0.39 | % | |||||||||||
| Probability of default | 0.00%–0.05 | % | 0.00 | % | ||||||||||||
| Discount rate | 0.00% – 0.10 | % | 0.00 | % | ||||||||||||
| Total assets |
$ | 40 | ||||||||||||||
| Liabilities |
||||||||||||||||
| HFT derivatives – |
$ | 386 | Modelled pricing | Third-party pricing | $1.55 – $11.87 | $6.26 | ||||||||||
| Natural gas swaps, futures, |
Own credit risk | 0.00%–0.07 | % | 0.00 | % | |||||||||||
| forwards and physical contracts |
Discount rate | 0.00%–0.14 | % | 0.02 | % | |||||||||||
| 3 | Modelled pricing | Third-party pricing | $1.83 – $11.87 | $5.93 | ||||||||||||
| Basis adjustment | (0.11)% – 0.64 | % | 0.27 | % | ||||||||||||
| Own credit risk | 0.00%–0.05 | % | 0.01 | % | ||||||||||||
| Discount rate | 0.00% – 0.10 | % | 0.01 | % | ||||||||||||
| Total liabilities |
389 | |||||||||||||||
| Net assets (liabilities) |
$ | (349 | ) | |||||||||||||
The financial assets and liabilities included on the Consolidated Balance Sheets that are not measured at fair value consisted of the following:
| As at millions of Canadian dollars | Carrying amount |
Fair value |
Level 1 | Level 2 | Level 3 | Total | ||||||||||||||||||
| December 31, 2017 |
$ | 13,881 | $ | 15,217 | $ | 69 | $ | 14,346 | $ | 802 | $ | 15,217 | ||||||||||||
| December 31, 2016 |
$ | 14,744 | $ | 15,723 | $ | 78 | $ | 14,843 | $ | 802 | $ | 15,723 | ||||||||||||
The fair value of long-term debt instruments, classified as Level 1 in the fair value hierarchy, are valued using unadjusted quoted closing market prices that are traded in active markets.
Those classified as Level 2 are valued either by using recent quoted market prices for the instrument where the instrument is not frequently traded, by using quoted closing market prices for similar issues that are frequently traded in an active market or by using quoted market prices and applying estimated credit spreads, provided by third-party pricing services, to the par value of the security.
Those classified as Level 3 are valued by discounting the future cash flows of the specific debt instrument at an estimated yield to maturity equivalent to benchmark government bonds with similar terms to maturity, plus a credit risk premium equal to that of issuers of similar credit quality.
The Company has designated $1.2 billion United States dollar denominated Hybrid Notes as a hedge of the foreign currency exposure of its net investment in United States dollar denominated operations. An after-tax foreign currency gain of $97 million was recorded in Other Comprehensive Income for the year ended December 31, 2017 (2016 – $49 million loss after-tax). There was no ineffectiveness for the year ended December 31, 2017 (2016 – nil).
All other financial assets and liabilities, such as cash and cash equivalents, restricted cash, accounts receivable, short-term debt and accounts payable, are carried at cost. The carrying value approximates fair value due to the short-term nature of these financial instruments.
Emera Inc. — Annual Report 2017 123
Table of Contents
| 16. | Regulatory Assets and Liabilities |
Regulatory assets represent incurred costs that have been deferred because it is probable that they will be recovered through future rates or tolls collected from customers. Management believes that existing regulatory assets are probable for recovery either because the Company received specific approval from the appropriate regulator, or due to regulatory precedent established for similar circumstances. If management no longer considers it probable that an asset will be recovered, the deferred costs are charged to income.
Regulatory liabilities represent obligations to make refunds to customers or to reduce future revenues for previous collections. If management no longer considers it probable that a liability will be settled, the related amount is recognized in income.
For regulatory assets and liabilities that are amortized, the amortization is as approved by the respective regulator.
Regulatory Assets and Liabilities
Regulatory assets and liabilities consisted of the following:
| As at | December 31 | December 31 | ||||||
| millions of Canadian dollars | 2017 | 2016 | ||||||
| Regulatory assets |
||||||||
| Deferred income tax regulatory assets |
$ | 667 | $ | 632 | ||||
| Pension and post-retirement medical plan |
345 | 373 | ||||||
| Storm reserve |
59 | — | ||||||
| Environmental remediations |
41 | 49 | ||||||
| Unamortized defeasance costs |
32 | 39 | ||||||
| 2015 demand side management (“DSM”) deferral |
28 | 32 | ||||||
| GBPC Hurricane Matthew restoration |
28 | 28 | ||||||
| Stranded cost recovery |
25 | 27 | ||||||
| Cost-recovery clauses |
17 | 12 | ||||||
| Deferrals related to derivative instruments |
15 | 15 | ||||||
| Debt basis adjustment |
13 | 19 | ||||||
| Deferred bond refinancing costs |
7 | 9 | ||||||
| Other |
99 | 87 | ||||||
| $ | 1,376 | $ | 1,322 | |||||
| Current |
$ | 138 | $ | 80 | ||||
| Long-term |
1,238 | 1,242 | ||||||
| Total regulatory assets |
$ | 1,376 | $ | 1,322 | ||||
| Regulatory liabilities Deferred income tax regulatory liabilities |
1,116 | 26 | ||||||
| Accumulated reserve – cost of removal |
894 | 990 | ||||||
| Deferrals related to derivative instruments |
182 | 230 | ||||||
| Regulated fuel adjustment mechanism |
177 | 94 | ||||||
| Cost-recovery clauses |
51 | 153 | ||||||
| Self-insurance fund (notes 7 and 32) |
28 | 30 | ||||||
| Bill reduction credit |
4 | 10 | ||||||
| Storm reserve |
— | 75 | ||||||
| Other |
16 | 31 | ||||||
| $ | 2,468 | $ | 1,639 | |||||
| Current |
$ | 226 | $ | 362 | ||||
| Long-term |
2,242 | 1,277 | ||||||
| Total regulatory liabilities |
$ | 2,468 | $ | 1,639 | ||||
124 Emera Inc. — Annual Report 2017
Table of Contents
Notes to the Consolidated Financial Statements
Deferred Income Tax Regulatory Asset and Liability
To the extent deferred income taxes are expected to be recovered from or returned to customers in future rates, a regulatory asset or liability is recognized, unless specifically directed otherwise by a regulator.
As a result of the US Tax Cuts and Jobs Act of 2017 (“the Act”) being enacted during 2017, the Company has provisionally revalued its United States deferred income tax assets and liabilities based on the new 21 per cent tax rate. The Company has reduced its US regulated net deferred income tax liabilities by $1.1 billion and recorded an equivalent regulatory liability since the benefit of lower US taxes is expected to be returned to customers over time as required by the Act or by order of the applicable regulator. The Company is still analyzing certain aspects of the Act, which could potentially affect the measurement of these balances or potentially give rise to new deferred tax amounts. Further adjustments, if any, will be recorded by the Company during the measurement period in 2018 as permitted by SEC Staff Accounting Bulletin 118, Income tax Accounting Implications of the Tax Cuts and Jobs Act.
Pension and Post-Retirement Medical Plan
This asset is primarily related to the deferred costs of pension and post-retirement benefits at Emera Florida and New Mexico. It is included in rate base and earns a rate of return as permitted by the FPSC or NMPRC, as applicable. It is amortized over the remaining service life of plan participants.
Storm Reserve
The storm reserve is for hurricanes and other named storms that cause significant damage to Tampa Electric’s system. Tampa Electric can petition the FPSC to seek recovery of restoration costs over a 12-month period, or longer, as determined by the FPSC, as well as replenish the reserve. As a result of several named storms including Tropical Storm Colin, Hurricane Hermine and Hurricane Matthew, Tampa Electric incurred $10 million USD of storm costs in 2016. In the first quarter of 2017, Tampa Electric applied the $10 million USD of storm costs to the storm reserve, reducing the balance in the storm reserve to $46 million USD.
On September 10, 2017, Tampa Electric was impacted by Hurricane Irma. The estimated cost of restoration is $105 million USD, of which $93 million USD was charged to the storm reserve, $8 million USD was charged to capital expenditures and $4 million USD was charged to OM&G. The $93 million USD charged to the storm reserve exceeded the $46 million USD balance by $47 million USD, which has been recorded as a regulatory asset on the balance sheet. This regulated asset is included in rate base. Based on an FPSC order, if the charges to the storm reserve exceed the account balance, the excess is to be carried as a regulatory asset. Tampa Electric petitioned the FPSC on December 28, 2017 for the recovery of the estimated storm costs in excess of the reserve for several named storms, including Hurricane Irma, and to replenish the balance in the reserve to the $56 million USD level that existed as of October 31, 2013. An amended petition was filed with the FPSC on January 30, 2018.
Environmental Remediations
This asset is primarily related to PGS costs associated with the environmental remediation at manufactured gas plant sites. The balance is included in rate base, partially offsetting the related liability, and earns a rate of return as permitted by the FPSC. The timing of recovery is based on a settlement agreement approved by the FPSC.
Unamortized Defeasance Costs
Upon privatization in 1992, NSPI became responsible for managing a portfolio of defeasance securities held in trust that provide the principal and interest streams to match the related defeased debt, which as at December 31, 2017, totalled $0.7 billion (2016 – $0.8 billion). The excess of the cost of defeasance investments over the face value of the related debt is deferred on the balance sheet and amortized over the life of the defeased debt as approved by the UARB.
2015 DSM Deferral
Effective January 1, 2015, NSPI must purchase electricity efficiency and conservation activities (“Program Costs”) from EfficiencyOne, the provincially appointed franchisee to deliver energy efficiency programs to Nova Scotians. 2015 Program Costs were deferred to a regulatory asset and are recoverable from customers over an eight-year period which began in 2016. The UARB directed EfficiencyOne to review the financing options through which they would borrow the 2015 deferral amount from a commercial lender in order to repay NSPI the amount it expended on behalf of its customers in 2015. In December 2016, EfficiencyOne secured the financing and advanced funds to NSPI to finance the 2015 DSM deferral. This was set up as a payable on the Consolidated Balance Sheets, included in current and long-term other liabilities. As NSPI collects the associated amounts from customers over the next six years, it will repay the balance to EfficiencyOne thereby reducing the liability.
Emera Inc. — Annual Report 2017 125
Table of Contents
Hurricane Matthew Restoration
This asset represents restoration costs incurred by GBPC in 2016 associated with Hurricane Matthew. The asset is being amortized over five years and is included in rate base. The Grand Bahama Port Authority (“GBPA”) has approved full recovery of these storm restoration costs.
Stranded Cost Recovery
Due to the decommissioning of a GBPC steam turbine during 2012, the GBPA approved the recovery of a $21 million USD stranded cost through electricity rates; it is included in rate base for 2016 to 2018.
Cost Recovery Clauses
These assets and liabilities are related to TEC and NMGC clauses and riders. They are recovered or refunded through cost-recovery mechanisms approved by FPSC or NMPRC, as applicable, on a dollar-for-dollar basis in the next year.
Debt Basis Adjustment
This asset represents the difference between the fair value and pre-merger carrying amounts for NMGC’s long-term debt on the date TECO Energy acquired NMGC. In accordance with purchase accounting standards, NMGC’s long-term debt was valued at fair value on the Consolidated Balance Sheets. In accordance with the stipulation agreement with the NMPRC, an offsetting regulatory asset was recorded in order to eliminate the effects of purchase accounting on rate payers. The asset does not earn a return and is not included in the regulatory capital structure. It is amortized over the term of the related debt instrument.
Deferrals Related to Derivative Instruments
Tampa Electric, PGS, NMGC, NSPI and GBPC defer changes in fair value of derivatives that are documented as economic hedges or that do not qualify for NPNS exemption, as a regulatory asset or liability. The realized gain or loss is recognized when the hedged item settles in fuel for generation and purchased power, inventory or property, plant and equipment, depending on the nature of the item being economically hedged. Tampa Electric deferrals related to derivative instruments are recovered through cost-recovery mechanisms on a dollar-for-dollar basis in the year following the settlement of the derivative position.
Deferred Bond Refinancing Costs
This asset represents Tampa Electric and NMGC costs associated with refinancing debt. It does not earn a return but is instead included in the capital structure, which is used in the calculation of the weighted average cost of capital used to determine revenue requirements. It is amortized over the term of the related debt instruments.
Accumulated Reserve – Cost of Removal
This regulatory liability represents the non-ARO Cost of Removal (“COR”) reserve in Tampa Electric and NSPI. AROs are costs for legally required removal of property, plant and equipment. Non-ARO COR represent estimated funds received from customers through depreciation rates to cover future non-legally required cost of removal of property, plant and equipment, net of salvage value upon retirement, which reduces rate base for ratemaking purposes. This liability is reduced as COR are incurred and increased as depreciation is recorded for existing assets and as new assets are put into service.
Fuel Adjustment Mechanism
Differences between actual fuel costs and amounts recovered from NSPI customers through electricity rates in a given year are deferred to a fuel adjustment mechanism (“FAM”) regulatory asset or liability and recovered from or returned to customers in a subsequent year. For the years 2017 to 2019, differences between actual fuel costs and fuel revenues recovered from customers will be recovered or returned to customers after 2019, as required under the Electricity Plan Act.
Bill Reduction Credit
This regulatory liability represents NMGC’s stipulation agreement commitment to provide an annual bill reduction credit to customers of $4 million USD per year through June 30, 2018, as part of Emera’s acquisition of TECO Energy.
126 Emera Inc. — Annual Report 2017
Table of Contents
Notes to the Consolidated Financial Statements
Regulatory Environments
Emera Florida and New Mexico
Tampa Electric and PGS are regulated separately by the FPSC. Tampa Electric is also subject to regulation by the FERC. In general, the FPSC sets rates at a level that allows utilities such as Tampa Electric and PGS to collect total revenues or revenue requirements equal to their cost of providing service, plus an appropriate return on invested capital.
NMGC is subject to regulation by the NMPRC. The NMPRC sets rates at a level that allows NMGC to collect total revenues equal to their cost of providing service, plus an appropriate return on invested capital.
Base Rates – Tampa Electric
Tampa Electric’s target regulated return on equity (“ROE”) range is 9.25 per cent to 11.25 per cent. Based on a Stipulation and Settlement Agreement in 2013 Tampa Electric received a revenue increase of $110 million USD effective January 17, 2017, the date Tampa Electric’s Polk Power Station went into service. The agreement also provided that Tampa Electric could not file for additional rate increases until 2017 (to be effective no sooner than January 1, 2018), unless its earned ROE fell below 9.25 per cent before that time. If its earned ROE rose above 11.25 per cent any party to the agreement other than Tampa Electric could seek a review of its base rates. Under the agreement, the allowed equity in the capital structure is 54 per cent from investor sources of capital.
In September 2017, Tampa Electric announced its intention to invest approximately $850 million USD over four years in new utility-scale solar photovoltaic projects across its service territory. A settlement agreement was filed with the FPSC requesting a solar base rate adjustment (“SoBRA”) that provides for the recovery, upon in-service, of up to 600 MW of investments in utility-scale solar projects that will be phased in from late 2018 through early 2021. The Tampa Electric settlement agreement contains a provision whereby the impacts of tax reform will be offset by a reduction in base rates within 120 days of when tax reform becomes law. On November 6, 2017, the FPSC approved the settlement agreement that replaced the existing 2013 agreement and extended it another four year years through 2021. On December 12, 2017, TEC filed its petition along with supporting tariffs demonstrating the cost-effectiveness of the September 1, 2018 SoBRA representing 145 MW and $26 million USD in estimated revenue requirements. A decision by the FPSC to approve the tariffs on the first SoBRA filing is anticipated in the spring of 2018.
On January 30, 2018, Tampa Electric filed with the FPSC a settlement agreement which, if approved, will allow Tampa Electric to net the estimated amount of storm cost recovery against the utility’s estimated 2018 tax reform benefits. Any difference would be trued up and recovered from or returned to customers in 2019. Beginning in January 2019 Tampa Electric would reflect the full impact of tax reform on Tampa Electric’s base rates, provided that the FPSC’s determinations have been finalized. A decision is expected in March 2018.
Base Rates – PGS
Prior to 2016, PGS’s base rates were based upon an ROE of 10.75 per cent, with a range between 9.75 per cent and 11.75 per cent.
In December 2016, PGS entered into a settlement agreement with the Office of Public Counsel (“OPC”) regarding its filed depreciation study. The settlement agreement resulted in new depreciation rates that reduce annual depreciation by $16 million USD in 2016 and accelerated the amortization of the regulated asset related to the Manufactured Gas Plant (“MGP”) environmental remediation costs. In addition, the bottom of the ROE range was decreased from 9.75 per cent to 9.25 per cent. The new bottom of the range will remain until the earlier of new base rates established in PGS’s next general rate proceeding or December 31, 2020. The top of the range will continue to be 11.75 per cent and the ROE of 10.75 per cent will continue to be used for the calculation of return on investment for clauses. On February 7, 2017 the FPSC approved the settlement agreement. No change in customer rates resulted from this agreement.
As part of the settlement, PGS and OPC agreed that at least $32 million USD of PGS’s regulatory asset associated with the environmental liability for current and future remediation costs related to former MGP sites will be amortized over the period 2016 through 2020. At least $21 million USD will be amortized over a two year recovery period beginning in 2016. In 2017 and 2016, PGS recorded $5 million and $16 million, respectively, of this amortization expense.
The PGS settlement does not contain a provision for US tax reform. On January 9, 2018, the OPC filed a generic docket requesting the FPSC to address tax reform benefits for all utilities in Florida without an existing tax reform settlement provision, including PGS.
Base Rates – NMGC
NMGC’s base rates were established in 2012 through a settlement agreement. As a condition of the 2016 NMPRC order (the “Order”) approving the acquisition of TECO Energy, NMGC will not seek an increase in base rates to be effective prior to December 31, 2017, and NMGC will continue to provide an annual bill reduction credit of $4 million USD through June 30, 2018. NMGC plans to file a rate case in 2018.
Emera Inc. — Annual Report 2017 127
Table of Contents
NSPI
NSPI is a public utility as defined in the Public Utilities Act of Nova Scotia (the “Public Utilities Act”) and is subject to regulation under the Public Utilities Act by the UARB. The Public Utilities Act gives the UARB supervisory powers over NSPI’s operations and expenditures. Electricity rates for NSPI’s customers are also subject to UARB approval. NSPI is not subject to a general annual rate review process, but rather participates in hearings held from time to time at NSPI’s or the UARB’s request.
NSPI is regulated under a cost-of-service model, with rates set to recover prudently incurred costs of providing electricity service to customers, and provide an appropriate return to investors. NSPI’s target regulated ROE range for 2017 and 2016 was 8.75 per cent to 9.25 per cent based on an actual five quarter average regulated common equity component of up to 40 per cent. NSPI has a FAM, which enables it to seek recovery of fuel costs through regularly scheduled rate adjustments. Differences between actual fuel costs and amounts recovered from customers through electricity rates in a year are deferred to a FAM regulatory asset or liability and recovered from or returned to customers in a subsequent year.
In December 2015, the Province enacted the Electricity Plan Implementation (2015) Act, (“Electricity Plan Act”), which required NSPI to file a three-year stability plan for fuel costs and a General Rate Application (“GRA”) for non-fuel costs if required. In July 2016, the UARB approved a Consensus Agreement between NSPI and customer representatives related to the Rate Stability Plan for fuel costs for 2017 through 2019 which resulted in an average annual increase of 1.1 per cent for each of these three years. Subsequently, certain customer representatives requested changes resulting in amended rates that were approved by the UARB in November 2016 and result in an average annual rate increase of 1.5 per cent for each of these three years.
In December 2016, the UARB approved NSPI’s application to refund over-recovered fuel costs from 2016 to customers. The over-recovered 2016 fuel costs of $36 million were refunded to customers through a one-time credit on their bills in 2017 and allocated to customers based on their individual electricity usage in 2016. The amount refunded to customers includes 2016 excess non-fuel revenues of $5 million.
On September 11, 2017, the UARB approved NSPI’s interim assessment payment to NSPML of the costs associated with the Maritime Link starting when the Maritime Link is in service. The Maritime Link completed commissioning and entered service on January 15, 2018. In response to the delayed timing of energy delivery from the Muskrat Falls project, the approved interim assessment payment reflects NSPML’s proposal to reduce the assessment by deferring $53 million in each of 2018 and 2019, related to depreciation and amortization expenses. As these amounts are included in NSPI’s 2017, 2018 and 2019 fuel rates and are being recovered from customers, NSPI will provide a one-time credit to customers, including interest, in 2018 of approximately $17 million, 2019 of approximately $36 million and 2020 of approximately $53 million, as the payments from NSPI to NSPML are not required.
NSPI is also required to hold back $10 million from the interim assessment payment to NSPML in 2018 and 2019. The release of such amounts is subject to providing evidence to the UARB that at least that amount of benefit from the Maritime Link has been realized for NSPI customers in that year. If the $10 million in benefits is realized, the UARB will direct NSPI to pay the $10 million to NSPML for that year. If not realized, then the UARB will direct NSPI to pay to NSPML only that portion that is realized and the balance will be refunded to customers through NSPI’s FAM.
Emera Maine
Emera Maine’s distribution operations and stranded cost recoveries are regulated by the Maine Public Utilities Commission (“MPUC”). The transmission operations are regulated by the FERC. The rates for these three elements are established in distinct regulatory proceedings.
Distribution Operations
Emera Maine’s distribution businesses operate under a traditional cost-of-service regulatory structure, and distribution rates are set by the MPUC. On December 21, 2016, Emera Maine’s distribution rates increased by 3.75 per cent, including the recovery, over five years, of approximately $4 million USD of costs associated with a major storm in Maine in 2014. Also, effective December 21, 2016, the allowed ROE was reduced by 0.55 per cent to 9.00 per cent on a common equity component of 49 per cent.
Transmission Operations
Emera Maine’s transmission operations are split between two districts; Bangor Hydro District and Maine Public Service (“MPS”). Bangor Hydro District local transmission rates are regulated by the FERC and set annually on June 1, based on a formula utilizing prior year actual transmission investments, adjusted for current year forecasted transmission investments. The allowed ROE for Bangor Hydro District local transmission operations for 2017 and 2016 is 10.57 per cent. Bangor Hydro District’s bulk transmission assets are managed by ISO-New England (“ISO-NE”) as part of a region-wide pool of assets. The allowed ROE range for Bangor Hydro bulk transmission assets is 11.07 to 11.74 per cent for 2017 and 2016.
MPS District local transmission rates are regulated by the FERC and are set annually on June 1 for wholesale and July 1 for retail customers based on a formula utilizing prior year actual transmission investments and expenses. The current allowed ROE for transmission operations is 9.6 per cent (2016 – 10.2 per cent).
Stranded Cost Recoveries
Stranded cost recoveries in Maine are set by the MPUC. Electric utilities are permitted to recover all prudently incurred stranded costs resulting from the restructuring of the industry in 2000 that could not be mitigated or that arose as a result of rate and accounting orders issued by the MPUC.
128 Emera Inc. — Annual Report 2017
Table of Contents
Notes to the Consolidated Financial Statements
The Barbados Light & Power Company Limited
BLPC is a vertically integrated utility and provider of electricity on the island of Barbados.
BLPC is subject to regulation under the Utilities Regulation (Procedural) Rules 2003 by the Fair Trading Commission (“The Rules”), Barbados, an independent regulator. The Rules give the Fair Trading Commission, Barbados utility regulation functions. The government of Barbados has granted BLPC a franchise to generate, transmit and distribute electricity on the island until 2028.
BLPC is regulated under a cost-of-service model, with rates set to recover prudently incurred costs of providing electricity service to customers, and provide an appropriate return to investors. BLPC’s approved regulated return on rate base was 10 per cent for 2017 and 2016.
All BLPC fuel costs are passed to customers through the fuel pass-through mechanism which provides the opportunity to recover all fuel costs in a timely manner. The Fair Trading Commission, Barbados has approved the calculation of the fuel charge, which is adjusted on a monthly basis.
Grand Bahama Power Company Limited
GBPC is a vertically integrated utility and sole provider of electricity on Grand Bahama Island. The GBPA regulates the utility and has granted GBPC a licensed, regulated and exclusive franchise to produce, transmit and distribute electricity on the island until 2054. There is a fuel pass- through mechanism and flexible tariff adjustment policy to ensure that fuel costs are recovered and a reasonable return earned. GBPC’s approved regulated return on rate base was 8.8 per cent for 2017 and 2016. In December 2017 the GBPA approved GBPC’s regulated return on rate base of 8.5 per cent for 2018.
In December 2016, the GBPA approved that over a five-year period, 2017 to 2021, the all-in rate for electricity (fuel and base rates) will be held at 2016 levels. Any over-recovery of fuel costs during this period will be applied to the Hurricane Matthew regulatory deferral, until such time as the deferral is recovered. Should GBPC recover funds in excess of the Hurricane Matthew regulatory deferral, the excess will be placed in a new storm reserve. If balances remain within the Hurricane Matthew deferral at the end of five years, GBPC will have the opportunity to request recovery from customers in future rates.
Dominica Electricity Services Ltd.
Domlec is an integrated utility on the island of Dominica and is regulated by the Independent Regulatory Commission, Dominica.
On October 7, 2013, the Independent Regulatory Commission, Dominica issued a Transmission, Distribution & Supply License and a Generation License, both of which came into effect on January 1, 2014, for a period of 25 years. Domlec’s approved allowable regulated return on rate base was 15 per cent for 2017 and 2016.
Domlec fuel costs are passed to customers through a fuel pass-through mechanism which provides the opportunity to recover substantially all fuel costs in a timely manner.
On September 19, 2017, Dominica experienced unprecedented damage as a result of Hurricane Maria, facing sustained winds of over 175 miles per hour. All 36,000 of Domlec’s customers lost power following the storm as the Company’s transmission and distribution assets were significantly impacted. Domlec has implemented a restoration plan. Domlec maintains insurance for its generation fleet and, as with most utilities, transmission and distribution networks are self-insured. Management has completed its damage assessment and an estimated impairment provision has been recorded at December 31, 2017. Emera’s portion of the estimated impairment provision is immaterial.
Brunswick Pipeline
Brunswick Pipeline is a 145-kilometre pipeline delivering natural gas from the Canaport™ re-gasified liquefied natural gas (“LNG”) import terminal near Saint John, New Brunswick to markets in the northeastern United States. Brunswick Pipeline entered into a 25-year firm service agreement commencing in July 2009 with Repsol Energy Canada. The pipeline is considered a Group II pipeline regulated by the National Energy Board (“NEB”). The NEB Gas Transportation Tariff is filed by Brunswick Pipeline in compliance with the requirements of the NEB Act and sets forth the terms and conditions of the transportation rendered by Brunswick Pipeline.
Emera Inc. — Annual Report 2017 129
Table of Contents
| 17. | Related Party Transactions |
In the ordinary course of business, Emera provides energy, construction and other services and enters into transactions with its subsidiaries, associates and other related companies on terms similar to those offered to non-related parties. Intercompany balances and intercompany transactions have been eliminated on consolidation, except for the net profit on certain transactions between non-regulated and regulated entities in accordance with accounting standards for rate-regulated entities, as discussed in note 1. All material amounts are under normal interest and credit terms.
Significant transactions between Emera and its associated companies are:
| • | Natural gas transportation capacity revenues from M&NP reported in the Consolidated Statements of Income. Revenues from M&NP, reported in Operating revenue – non-regulated, totalled $28 million for the year ended December 31, 2017 (2016 – $29 million). |
| • | Transmission construction revenues from NSPML reported in the Consolidated Statements of Income. Revenues from NSPML, reported in Operating revenues, Non-regulated, totalled $17 million for the year ended December 31, 2017 (2016 – $18 million). |
There are no significant receivables or payables between Emera and its associated companies reported on Emera’s Consolidated Balance Sheets as at December 31, 2017 and December 31, 2016.
| 18. | Receivables and Other Current Assets |
Receivables and other current assets consisted of the following:
| As at | December 31 | December 31 | ||||||||
| millions of Canadian dollars | 2017 | 2016 | ||||||||
| Customer accounts receivable – billed |
$ | 805 | $ | 715 | ||||||
| Customer accounts receivable – unbilled |
278 | 270 | ||||||||
| Allowance for doubtful accounts |
(12 | ) | (13 | ) | ||||||
| Other receivables |
70 | 42 | ||||||||
| Capitalized transportation capacity (1) |
89 | 190 | ||||||||
| Prepaid expenses |
59 | 57 | ||||||||
| Due from related parties |
5 | 16 | ||||||||
| Net investment in direct financing lease |
8 | 8 | ||||||||
| Income tax receivable |
24 | 33 | ||||||||
| Other |
— | 5 | ||||||||
| $ | 1,326 | $ | 1,323 | |||||||
|
(1) Capitalized transportation capacity represents the value of transportation/storage received by EES on asset management agreements at the inception of the contracts. The asset is amortized over the term of each contract.
19. Property, Plant and Equipment
| ||||||
| Property, plant and equipment consisted of the following regulated and non-regulated assets:
| ||||||
| As at | December 31 | December 31 | ||||||||
| millions of Canadian dollars | Estimated useful life | 2017 | 2016 | |||||||
| Generation |
3 to 131 | $ | 11,010 | $ | 10,553 | |||||
| Transmission |
15 to 80 | 2,786 | 2,799 | |||||||
| Distribution |
4 to 80 | 5,660 | 5,715 | |||||||
| Gas transmission and distribution |
7 to 85 | 2,867 | 2,895 | |||||||
| General plant and other |
3 to 60 | 1,874 | 1,711 | |||||||
| Total cost |
24,197 | 23,673 | ||||||||
| Less: Accumulated depreciation |
(7,824 | ) | (7,787 | ) | ||||||
| 16,373 | 15,886 | |||||||||
| Construction work in progress |
622 | 1,404 | ||||||||
| Net book value |
$ | 16,995 | $ | 17,290 | ||||||
130 Emera Inc. — Annual Report 2017
Table of Contents
Notes to the Consolidated Financial Statements
| 20. | Employee Benefit Plans |
Emera maintains a number of contributory defined-benefit and defined-contribution pension plans, which cover substantially all of its employees. In addition, the Company provides non-pension benefits for its retirees. These plans cover employees in Nova Scotia, New Brunswick, Newfoundland and Labrador, Florida, Maine, Connecticut, Massachusetts, Rhode Island, New Mexico, Barbados, Dominica and Grand Bahama Island.
Benefit Obligation and Plan Assets
The changes in benefit obligation and plan assets, and the funded status for all plans were as follows:
| For the | Year ended December 31 | |||||||||||||||
| millions of Canadian dollars | 2017 | 2016 | ||||||||||||||
| Change in Projected Benefit Obligation (“PBO”) and Accumulated Post-retirement Benefit Obligation (“APBO”) |
Defined benefit pension plans |
Non- pension benefit plans |
Defined benefit pension plans |
Non- pension benefit plans |
||||||||||||
| Balance, January 1 |
$ | 2,607 | $ | 358 | $ | 1,520 | $ | 88 | ||||||||
| Addition of TECO Energy, July 1, 2016 |
— | — | 1,035 | 277 | ||||||||||||
| Service cost |
49 | 5 | 35 | 4 | ||||||||||||
| Plan participant contributions |
8 | 4 | 8 | — | ||||||||||||
| Interest cost |
99 | 14 | 79 | 9 | ||||||||||||
| Plan amendments |
— | — | — | 2 | ||||||||||||
| Benefits paid |
(129 | ) | (27 | ) | (94 | ) | (16 | ) | ||||||||
| Actuarial losses |
171 | 25 | (2 | ) | (12 | ) | ||||||||||
| Special termination |
(35 | ) | — | — | — | |||||||||||
| Foreign currency translation adjustment |
(87 | ) | (23 | ) | 26 | 6 | ||||||||||
| Balance, December 31 |
2,683 | 356 | 2,607 | 358 | ||||||||||||
| Change in plan assets |
||||||||||||||||
| Balance, January 1 |
2,208 | 39 | 1,300 | 6 | ||||||||||||
| Addition of TECO Energy, July 1, 2016 |
— | — | 830 | 29 | ||||||||||||
| Employer contributions |
109 | 27 | 49 | 17 | ||||||||||||
| Plan participant contributions |
8 | 4 | 8 | — | ||||||||||||
| Benefits paid |
(129 | ) | (27 | ) | (94 | ) | (16 | ) | ||||||||
| Actual return on assets, net of expenses |
313 | 5 | 93 | 2 | ||||||||||||
| Special termination |
(34 | ) | — | — | — | |||||||||||
| Foreign currency translation adjustment |
(67 | ) | (3 | ) | 22 | 1 | ||||||||||
| Balance, December 31 |
2,408 | 45 | 2,208 | 39 | ||||||||||||
| Funded status, end of year |
$ | (275 | ) | $ | (311 | ) | $ | (399 | ) | $ | (319 | ) | ||||
Emera Inc. — Annual Report 2017 131
Table of Contents
Plans with PBO/APBO in Excess of Plan Assets
The aggregate financial position for all pension plans where the PBO or, for post-retirement benefit plans, the APBO exceeds the plan assets for the years ended December 31 is as follows:
| 2017 | 2016 | |||||||||||||||
| millions of Canadian dollars | Defined benefit pension plans |
Non- pension benefit plans |
Defined benefit pension plans |
Non- pension benefit plans |
||||||||||||
| PBO/APBO |
$ | 2,655 | $ | 325 | $ | 2,579 | $ | 358 | ||||||||
| Fair value of plan assets |
2,370 | 6 | 2,171 | 39 | ||||||||||||
| Funded status |
$ | (285 | ) | $ | (319 | ) | $ | (408 | ) | $ | (319 | ) | ||||
Plans with Accumulated Benefit Obligation (“ABO”) in Excess of Plan Assets
The ABO for the defined benefit pension plans was $2,561 million as at December 31, 2017 (2016 – $2,489 million). The aggregate financial position for those plans with an ABO in excess of the plan assets for the years ended December 31 is as follows:
| 2017 | 2016 | |||||||||||
| millions of Canadian dollars | Defined benefit pension plans |
Defined benefit pension plans |
||||||||||
| ABO |
$ | 1,608 | $ | 2,462 | ||||||||
| Fair value of plan assets |
1,409 | 2,171 | ||||||||||
| Funded status |
$ | (199 | ) | $ | (291 | ) | ||||||
Balance Sheet
The amounts recognized in the Consolidated Balance Sheets consisted of the following:
| December 31 | December 31 | |||||||||||||||
| As at | 2017 | 2016 | ||||||||||||||
| millions of Canadian dollars | Defined benefit pension plans |
Non- pension benefit plans |
Defined benefit pension plans |
Non- pension benefit plans |
||||||||||||
| Current liabilities |
$ | (23 | ) | $ | (18 | ) | $ | (41 | ) | $ | (17 | ) | ||||
| Long-term liabilities |
(264 | ) | (295 | ) | (367 | ) | (302 | ) | ||||||||
| Other asset (non-current) |
10 | — | 9 | — | ||||||||||||
| Amount included in deferred tax asset |
15 | 1 | 16 | (1 | ) | |||||||||||
| AOCL (AOCI) and regulatory assets after-tax adjustment |
548 | 73 | 620 | 45 | ||||||||||||
| Net amount recognized at end of year |
$ | 286 | $ | (239 | ) | $ | 237 | $ | (275 | ) | ||||||
132 Emera Inc. — Annual Report 2017
Table of Contents
Notes to the Consolidated Financial Statements
Amounts Recognized in AOCI and Regulatory Assets
Unamortized gains and losses and past service costs arising on post-retirement benefits are recorded in AOCI or regulatory assets. Unamortized net losses and past service costs as at the acquisition date for TECO Energy’s regulated companies were recorded as regulatory assets. The following table summarizes the change in AOCI and regulatory assets:
| millions of Canadian dollars | Regulatory assets |
Actuarial losses (gains) |
Past service (gains) costs |
|||||||||||||
| Defined Benefit Pension Plans |
||||||||||||||||
| Balance, January 1, 2017 |
$ | 309 | $ | 330 | $ | (3 | ) | |||||||||
| Amortized in current period |
(17 | ) | (38 | ) | — | |||||||||||
| Current year addition to AOCL or regulatory assets |
(10 | ) | (8 | ) | — | |||||||||||
| Balance, December 31, 2017 |
$ | 282 | $ | 284 | $ | (3 | ) | |||||||||
| Non-pension benefits plans |
||||||||||||||||
| Balance, January 1, 2017 |
$ | 48 | $ | 15 | $ | (19 | ) | |||||||||
| Amortized in current period |
1 | (2 | ) | 8 | ||||||||||||
| Current year addition to AOCL (AOCI) or regulatory assets |
25 | (2 | ) | — | ||||||||||||
| Balance, December 31, 2017 |
$ | 74 | $ | 11 | $ | (11 | ) | |||||||||
| 2017 | 2016 | |||||||||||||||
| Defined benefit pension plans |
Non- pension benefit plans |
Defined benefit pension plans |
Non- pension benefit plans |
|||||||||||||
| Actuarial losses |
$ | 284 | $ | 11 | $ | 330 | $ | 15 | ||||||||
| Past service (gains) |
(3 | ) | (11 | ) | (3 | ) | (19 | ) | ||||||||
| Regulatory assets |
282 | 74 | 309 | 48 | ||||||||||||
| Total AOCL (AOCI) and regulatory assets on a pre-tax basis |
563 | 74 | 636 | 44 | ||||||||||||
| Amount included in deferred tax asset |
(15 | ) | (1 | ) | (16 | ) | 1 | |||||||||
| Net amount in AOCL (AOCI) and regulatory assets after-tax adjustment |
$ | 548 | $ | 73 | $ | 620 | $ | 45 | ||||||||
Emera Inc. — Annual Report 2017 133
Table of Contents
Benefit Cost Components
Emera’s net periodic benefit cost included the following:
| As at | Year ended December 31 | |||||||||||||||
| millions of Canadian dollars | 2017 | 2016 | ||||||||||||||
| Defined benefit pension plans |
Non- pension benefit plans |
Defined benefit pension plans |
Non- pension benefit plans |
|||||||||||||
| Service cost |
$ | 49 | $ | 5 | $ | 35 | $ | 4 | ||||||||
| Interest cost |
99 | 14 | 79 | 9 | ||||||||||||
| Expected return on plan assets |
(129 | ) | (3 | ) | (97 | ) | (1 | ) | ||||||||
| Current year amortization of: |
||||||||||||||||
| Actuarial losses |
38 | 2 | 42 | 2 | ||||||||||||
| Past service costs (gains) |
— | (8 | ) | (1 | ) | (8 | ) | |||||||||
| Regulatory assets (liability) |
17 | (1 | ) | 9 | — | |||||||||||
| Settlement, curtailments |
(1 | ) | — | — | — | |||||||||||
| Total |
$ | 73 | $ | 9 | $ | 67 | $ | 6 | ||||||||
The expected return on plan assets is determined based on the market-related value of plan assets of $2,153 million as at January 1, 2017 (2016 – $1,180 million), adjusted for interest on certain cash flows during the year. The market-related value of assets is based on a five-year smoothed asset value. Any investment gains (or losses) in excess of (or less than) the expected return on plan assets are recognized on a straight-line basis into the market-related value of assets over a five-year period.
Pension Plan Asset Allocations
Emera’s investment policy includes discussion regarding the investment philosophy, the level of risk which the Company is prepared to accept with respect to the investment of the Pension Funds, and the basis for measuring the performance of the assets. Central to the policy is the target asset allocation by major asset categories. The objective of the target asset allocation is to diversify risk and to achieve asset returns that meet or exceed the plan’s actuarial assumptions. The diversification of assets reduces the inherent risk in financial markets by requiring that assets be spread out amongst various asset classes. Within each asset class, a further diversification is undertaken through the investment in a broad basket of investment and non-investment grade securities. Emera’s target asset allocation is as follows:
Canadian Pension Plans
| Asset class | Target range at market | |||
| Short-term securities |
0% to 5% | |||
| Fixed income |
35% to 50% | |||
| Equities: |
||||
| Canadian |
12% to 22% | |||
| Non-Canadian |
30% to 55% | |||
| Non-Canadian Pension Plans | ||||
| Asset class | Target range at market weighted average |
|||
| Short-term securities |
47% to 52% | |||
| Equities |
48% to 53% | |||
Pension Plan assets are overseen by the respective Management Pension Committees in the sponsoring companies. All pension investments are in accordance with policies approved by the respective Board of Directors of each sponsoring company.
134 Emera Inc. — Annual Report 2017
Table of Contents
Notes to the Consolidated Financial Statements
The following tables set out the classification of the methodology used by the Company to fair value its investments:
| December 31, 2017 | ||||||||||||||||||||
| millions of Canadian dollars | NAV | Level 1 | Level 2 | Total | Percentage | |||||||||||||||
| Cash and cash equivalents |
— | $ | 32 | — | $ | 32 | 1% | |||||||||||||
| Net in-transits |
— | (36 | ) | — | (36 | ) | (1)% | |||||||||||||
| Equity Securities: |
||||||||||||||||||||
| Canadian equity |
214 | 214 | 9% | |||||||||||||||||
| US equity |
— | 390 | — | 390 | 16% | |||||||||||||||
| Other equity |
— | 197 | 197 | 8% | ||||||||||||||||
| Fixed income securities: |
||||||||||||||||||||
| Government |
— | — | $ | 72 | 72 | 3% | ||||||||||||||
| Corporate |
— | — | 56 | 56 | 2% | |||||||||||||||
| Other |
— | 5 | — | 5 | —% | |||||||||||||||
| Other |
4 | 4 | —% | |||||||||||||||||
| Open-ended investments measured at NAV (1) |
$ | 1,065 | — | 1,065 | 44% | |||||||||||||||
| Common collective trusts measured at NAV (2) |
409 | — | — | 409 | 18% | |||||||||||||||
| Total |
$ | 1,474 | $ | 802 | $ | 132 | $ | 2,408 | 100% | |||||||||||
| (1) | NAV investments are open-ended registered and non-registered mutual funds, collective investment trusts, or pooled funds. NAVs are calculated daily and the funds honour subscription and redemption activity regularly. |
| (2) | The common collective trusts are private funds valued at NAV. The NAVs are calculated based on bid prices of the underlying securities. Since the prices are not published to external sources, NAV is used as a practical expedient. Certain funds invest primarily in equity securities of domestic and foreign issuers while others invest in long duration US investment grade fixed income assets and seeks to increase return through active management of interest rate and credit risks. The funds honour subscription and redemption activity regularly. |
| As at | December 31, 2016 | |||||||||||||||||||
| millions of Canadian dollars | NAV | Level 1 | Level 2 | Total | Percentage | |||||||||||||||
| Cash and cash equivalents |
— | $ | 31 | $ | — | 31 | 1% | |||||||||||||
| Net in-transits |
— | (42 | ) | — | (42 | ) | (2)% | |||||||||||||
| Equity securities: |
||||||||||||||||||||
| Canadian equity |
— | 192 | — | 192 | 9% | |||||||||||||||
| US equity |
— | 303 | — | 303 | 14% | |||||||||||||||
| Other equity |
— | 243 | — | 243 | 11% | |||||||||||||||
| Fixed Income securities: |
||||||||||||||||||||
| Government |
— | — | 47 | 47 | 2% | |||||||||||||||
| Corporate |
— | — | 53 | 53 | 2% | |||||||||||||||
| Other |
— | 5 | 14 | 19 | 1% | |||||||||||||||
| Open-ended investments measured at NAV (1) |
$ | 1,132 | — | — | 1,132 | 51% | ||||||||||||||
| Common collective trusts measured at NAV (2) |
230 | — | — | 230 | 11% | |||||||||||||||
| Total |
$ | 1,362 | $ | 732 | $ | 114 | 2,208 | 100% | ||||||||||||
| (1) | NAV investments are open-ended registered and non-registered mutual funds, collective investment trusts, or pooled funds. NAVs are calculated daily and the funds honour subscription and redemption activity regularly. |
| (2) | The common collective trusts are private funds valued at NAV. The NAVs are calculated based on bid prices of the underlying securities. Since the prices are not published to external sources, NAV is used as a practical expedient. Certain funds invest primarily in equity securities of domestic and foreign issuers while others invest in long duration US investment grade fixed income assets and seeks to increase return through active management of interest rate and credit risks. The funds honour subscription and redemption activity regularly. |
Refer to note 15 for more information on the fair value hierarchy and inputs used to measure fair value.
Emera Inc. — Annual Report 2017 135
Table of Contents
Canadian Post-Retirement Benefit Plans
There are no assets set aside to pay for the Canadian post-retirement benefit plans. As is common in Canada, post-retirement health benefits are paid from general accounts as required.
US Post-Retirement Benefit Plans
Emera’s US subsidiaries currently provide certain post-retirement health care and life insurance benefits for employees retiring after age 50 who meet eligibility requirements. Post-retirement benefit levels are substantially unrelated to salary. The Company reserves the right to terminate or modify plans in whole or in part at any time.
Emera Maine provides retiree medical benefits to certain groups of employees. The Company’s retiree medical expenses are incorporated into rate filings with its regulators and are recovered through its electric rates to customers.
TECO Energy and NMGC offers retirees under age 65 and their dependents a self-funded HRA medical plan identical to that offered to active TECO Energy employees. TECO Energy retirees over the age of 65 are enrolled in a Medicare Advantage plan. NMGC retirees over age 65 and their dependents receive a fixed subsidy with which they can purchase additional coverage through a medical supplement program. NMGC also provides dental benefits to retirees and spouses.
The fair values of investments as at December 31, 2017, for all Post-Retirement Benefit Plans by asset category, are as follows:
| December 31, 2017 | ||||||||||||||||||||
| millions of Canadian dollars | NAV | Level 1 | Level 2 | Total | Percentage | |||||||||||||||
| Cash and cash equivalents |
— | $ | 1 | $ | — | $ | 1 | 2% | ||||||||||||
| Life insurance policies (1) |
— | — | 39 | 39 | 87% | |||||||||||||||
| Other investments measured at NAV |
$ | 5 | — | — | 5 | 11% | ||||||||||||||
| Total |
$ | 5 | $ | 1 | $ | 39 | $ | 45 | 100% | |||||||||||
| (1) | For valuation purposes, the life insurance policies held for the NMGC retiree medical plan are valued at the cash surrender value and are considered Level 2 assets. |
| December 31, 2016 | ||||||||||||||||||||
| millions of Canadian dollars | NAV | Level 1 | Level 2 | Total | Percentage | |||||||||||||||
| Cash and cash equivalents |
— | $ | 1 | $ | — | $ | 1 | 3% | ||||||||||||
| Life insurance policies (1) |
— | — | 33 | 33 | 85% | |||||||||||||||
| Other investments measured at NAV |
$ | 5 | — | — | 5 | 12% | ||||||||||||||
| Total |
$ | 5 | $ | 1 | $ | 33 | $ | 39 | 100% | |||||||||||
| (1) | For valuation purposes, the life insurance policies held for the NMGC retiree medical plan are valued at the cash surrender value and are considered Level 2 assets. |
Refer to note 15 for more information on the fair value hierarchy and inputs used to measure fair value.
Investments in Emera
As at December 31, 2017 and 2016, the assets related to the pension funds and post-retirement benefit plans do not hold any material investments in Emera or its subsidiaries securities. However, as a significant portion of assets for the benefit plan are held in pooled assets, there may be indirect investments in these securities.
136 Emera Inc. — Annual Report 2017
Table of Contents
Notes to the Consolidated Financial Statements
Cash Flows
The following table shows the expected cash flows for defined benefit pension and other post-retirement benefit plans:
| millions of Canadian dollars | Defined benefit pension plans |
Non- pension benefit plans |
||||||
| Expected employer contributions |
||||||||
| 2018 |
$ | 97 | $ | 25 | ||||
| Expected benefit payments |
||||||||
| 2018 |
147 | 22 | ||||||
| 2019 |
143 | 23 | ||||||
| 2020 |
148 | 23 | ||||||
| 2021 |
157 | 23 | ||||||
| 2022 |
165 | 24 | ||||||
| 2023 – 2027 |
912 | 124 | ||||||
Assumptions
The following table shows the assumptions that have been used in accounting for defined benefit pension and other post-retirement benefit plans:
| 2017 | 2016 | |||||||||||||||||
| (weighted average assumptions) | Defined benefit pension plans |
Non- pension benefit plans |
Defined benefit pension plans |
Non- pension benefit plans |
||||||||||||||
| Benefit obligation – December 31: |
||||||||||||||||||
| Discount rate |
3.55% | 3.65% | 3.96% | 4.18% | ||||||||||||||
| Rate of compensation increase |
3.12% | 3.28% | 2.82% | 2.54% | ||||||||||||||
| Health care trend |
– initial (next year) | — | 6.65% | — | 6.78% | |||||||||||||
| – ultimate | — | 4.45% | — | 4.45% | ||||||||||||||
| – year ultimate reached | — | 2036 | — | 2035 | ||||||||||||||
| Benefit cost for year ended December 31: |
||||||||||||||||||
| Discount rate |
3.96% | 4.18% | 3.79% | 3.88% | ||||||||||||||
| Expected long-term return on plan assets |
6.29% | 6.08% | 6.33% | 4.43% | ||||||||||||||
| Rate of compensation increase |
2.82% | 2.54% | 2.88% | 2.56% | ||||||||||||||
| Health care trend |
– initial (current year) | — | 6.78% | — | 6.76% | |||||||||||||
| – ultimate | — | 4.45% | — | 4.45% | ||||||||||||||
| – year ultimate reached | — | 2035 | — | 2020 | ||||||||||||||
Figures shown are weighted averages. Actual assumptions used differ by plan.
The expected long-term rate of return on plan assets is based on historical and projected real rates of return for the plan’s current asset allocation, and assumed inflation. A real rate of return is determined for each asset class. Based on the asset allocation, an overall expected real rate of return for all assets is determined. The asset return assumption is equal to the overall real rate of return assumption added to the inflation assumption, adjusted for assumed expenses to be paid from the plan.
The discount rate is based on high-quality long-term corporate bonds, with maturities matching the estimated cash flows from the pension plan.
Emera Inc. — Annual Report 2017 137
Table of Contents
Sensitivity Analysis for Non-Pension Benefits Plans
The health care cost trend significantly influences the amounts presented for health care plans. An increase or decrease of one percentage point of the assumed health care cost trend would have had the following impact in 2017:
| millions of Canadian dollars | Increase | Decrease | ||||||
| Service cost and interest cost |
$ | 1 | $ | (1 | ) | |||
| Accumulated post-retirement benefit obligation, December 31 |
19 | (16 | ) | |||||
Sensitivity Analysis for Defined Benefit Pension Plans
The impact on the 2017 benefit cost of a 25 basis point change in the discount rate and asset return assumptions is as follows:
| millions of Canadian dollars | Increase | Decrease | ||||||
| Discount rate assumption |
$ | (9 | ) | $ | 9 | |||
| Asset rate assumption |
(6 | ) | 6 | |||||
Amounts to be Amortized in the Next Fiscal Year
The following table shows the amounts from the AOCL and regulatory assets, which are expected to be recognized as part of the net periodic benefit cost in fiscal 2018:
| 2018 | ||||||||
| millions of Canadian dollars | Defined benefit pension plans |
Non-pension benefit plans |
||||||
| Actuarial gains (losses) |
$ | (36 | ) | $ | (2 | ) | ||
| Past service gains |
1 | 6 | ||||||
| Regulatory assets |
(21 | ) | (2 | ) | ||||
| Total |
$ | (56 | ) | $ | 2 | |||
Defined Contribution Plan
Emera also provides a defined contribution pension plan for certain employees. The Company’s contribution for the year ended December 31, 2017 was $23 million (2016 – $17 million), with the increase due to TECO Energy contributions being included for the full year.
138 Emera Inc. — Annual Report 2017
Table of Contents
Notes to the Consolidated Financial Statements
| 21. | Net Investment In Direct Financing Lease |
Emera’s net investment in direct financing lease primarily relates to Brunswick Pipeline. The agreement meets the definition of a direct financing capital lease for accounting purposes. The net investment in direct financing lease consists of the sum of the minimum lease payments and residual value net of estimated executory costs and unearned income. The unearned income is recognized in income over the life of the lease using a constant rate of interest equal to the internal rate of return on the lease. Net investment in direct financing lease consists of the following:
| As at | December 31 | December 31 | ||||||||||
| millions of Canadian dollars | 2017 | 2016 | ||||||||||
| Total minimum lease payments to be received |
$ | 1,126 | $ | 1,194 | ||||||||
| Less: amounts representing estimated executory costs |
(211 | ) | (223 | ) | ||||||||
| Minimum lease payments receivable |
$ | 915 | $ | 971 | ||||||||
| Estimated residual value of leased property (unguaranteed) |
183 | 183 | ||||||||||
| Less: unearned finance lease income |
(609 | ) | (658 | ) | ||||||||
| Net investment in direct financing lease |
$ | 489 | $ | 496 | ||||||||
| Principal due within one year (included in “Receivables and other current assets”) |
8 | 8 | ||||||||||
| Net investment in direct financing lease – long-term |
$ | 481 | $ | 488 | ||||||||
Future minimum lease payments to be received for the next five years:
| For the | Year ended December 31 | |||||||||||||||||||
| millions of Canadian dollars | 2018 | 2019 | 2020 | 2021 | 2022 | |||||||||||||||
| Minimum lease payments to be received |
$ | 64 | $ | 64 | $ | 64 | $ | 65 | $ | 64 | ||||||||||
| Less: amounts representing estimated executory costs |
(11 | ) | (11 | ) | (11 | ) | (12 | ) | (12 | ) | ||||||||||
| Minimum lease payments receivable |
$ | 53 | $ | 53 | $ | 53 | $ | 53 | $ | 52 | ||||||||||
Emera Inc. — Annual Report 2017 139
Table of Contents
| 22. | Goodwill |
The change in goodwill for the year ended December 31 is due to the following:
| millions of Canadian dollars | 2017 | 2016 | ||||||||||
| Balance, January 1 |
$ | 6,213 | $ | 264 | ||||||||
| Acquisition of TECO Energy as at July 1, 2016 (note 4) |
— | 5,771 | ||||||||||
| Change in foreign exchange rate |
(408 | ) | 178 | |||||||||
| Balance, December 31 |
$ | 5,805 | $ | 6,213 | ||||||||
Goodwill on Emera’s Consolidated Balance Sheets relates to the acquisitions of TECO Energy (refer to note 4), Emera Maine and GBPC. Goodwill is subject to an annual assessment for impairment at the reporting unit level. Emera’s reporting units with goodwill are Tampa Electric, PGS, New Mexico Gas, Emera Maine and GBPC.
A qualitative assessment was performed for Tampa Electric, PGS, New Mexico Gas, and GBPC, concluding that the fair value of the reporting units exceeded their carrying value, and as such, no quantitative assessment was performed.
Emera elected to bypass the qualitative assessment for Emera Maine and used a discounted cash flow analysis to determine the fair value of the reporting unit. The discounted cash flow analysis relies on management’s best estimate of the reporting units’ projected cash flows. It includes an estimate of terminal values based on these expected cash flows using a methodology which derives a valuation using an assumed perpetual annuity based on the entity’s residual cash flows. The discount rate is a market participant rate based on a peer group of publicly traded comparable companies and represents the weighted average cost of capital of comparable companies.
The Company determined the fair value of reporting units exceed their book value and related goodwill carrying amounts at December 31, 2017 and December 31, 2016, resulting in no impairment charge. Significant assumptions used in estimating the fair value include discount and growth rates, valuation of NOLs, utility sector market performance and transactions, projected operating and capital cash flows and the calculation of the terminal value. Adverse changes in assumptions described above could result in a future material impairment of the goodwill assigned to Tampa Electric, PGS, New Mexico Gas, Emera Maine or GBPC.
140 Emera Inc. — Annual Report 2017
Table of Contents
Notes to the Consolidated Financial Statements
| 23. | Short-Term Debt |
Emera’s short-term borrowings consist of commercial paper issuances, advances on revolving and non-revolving credit facilities and short-term notes. Short-term debt and the related weighted-average interest rates as at December 31 consisted of the following:
| millions of Canadian dollars | 2017 | Weighted- average interest rate |
2016 | Weighted- average interest rate |
||||||||||||
| TECO Energy/TECO Finance |
||||||||||||||||
| Advances on revolving credit and term facilities |
$ | 820 | 2.58% | $ | 685 | 1.74% | ||||||||||
| Tampa Electric Company |
||||||||||||||||
| Advances on accounts receivable and revolving credit facilities |
382 | 2.07% | 228 | 1.49% | ||||||||||||
| NMGC |
||||||||||||||||
| Advances on revolving credit facilities |
38 | 2.47% | 35 | 1.71% | ||||||||||||
| NSPI |
||||||||||||||||
| Bank indebtedness |
1 | —% | 1 | —% | ||||||||||||
| GBPC |
||||||||||||||||
| Advances on revolving credit facilities |
— | —% | 12 | 5.75% | ||||||||||||
| Short-term debt |
$ | 1,241 | $ | 961 | ||||||||||||
The Company’s total short-term revolving and non-revolving credit facilities, outstanding borrowings and available capacity as at December 31 were as follows:
| millions of Canadian dollars | Maturity | 2017 | 2016 | |||||||||
| TECO Energy/TECO Finance – term credit facility |
2018 | $ | 502 | $ | 537 | |||||||
| TECO Energy/TECO Finance – revolving credit facility |
2022 | 376 | 403 | |||||||||
| Tampa Electric Company – revolving credit facility |
2022 | 408 | 436 | |||||||||
| Tampa Electric Company – accounts receivable revolving credit facility |
2018 | 188 | 201 | |||||||||
| Tampa Electric Company – term loan |
2018 | 377 | — | |||||||||
| NMGC – revolving credit facility |
2022 | 157 | 168 | |||||||||
| GBPC – revolving credit facility |
Various | 16 | 17 | |||||||||
| Total |
2,024 | 1,762 | ||||||||||
| Less: |
||||||||||||
| Advances under revolving credit and term facilities |
1,241 | 960 | ||||||||||
| Letters of credit issued within the credit facilities |
3 | 3 | ||||||||||
| Total advances under available facilities |
1,244 | 963 | ||||||||||
| Available capacity under existing agreements |
$ | 780 | $ | 799 | ||||||||
The weighted average interest rate on outstanding short-term debt at December 31, 2017 was 2.42 per cent (2016 – 1.73 per cent).
Emera Inc. — Annual Report 2017 141
Table of Contents
Recent Financing Activities
TEC Non-revolving term loan
On November 2, 2017, TEC entered into a $300 million USD non-revolving term loan with a maturity date of November 1, 2018. The loan contains customary representations and warranties, events of default, financial and other covenants and bears interest at LIBOR plus a margin.
TECO Energy/TECO Finance Revolving Credit Facility
On March 22, 2017, TECO Energy/Finance extended the maturity date of its $300 million USD bank credit facility from December 17, 2018 to March 22, 2022 with no significant change in commercial terms from the prior agreement.
TEC Credit Facility
On March 22, 2017, TEC extended the maturity date of its $325 million USD bank credit facility from December 17, 2018 to March 22, 2022, and reduced the existing letter of credit facility to $50 million USD from $200 million USD. There were no other significant changes in commercial terms from the prior agreement.
NMGC Credit Agreement
On March 22, 2017, NMGC extended the maturity date of its $125 million USD bank credit facility from December 17, 2018 to March 22, 2022 with no significant change in commercial terms from the prior agreement.
TECO Energy/TECO Finance Term Credit Facility
On March 8, 2017, TECO Energy/Finance extended the maturity date of its $400 million USD term bank credit facility from March 14, 2017 to March 8, 2018 with no significant change in commercial terms from the prior agreement.
| 24. | Other Current Liabilities |
Other current liabilities consisted of the following:
| As at | December 31 | December 31 | ||||||||||
| millions of Canadian dollars | 2017 | 2016 | ||||||||||
| Accrued charges |
$ | 134 | $ | 137 | ||||||||
| Accrued interest on long-term debt |
78 | 96 | ||||||||||
| Income tax payable |
1 | 19 | ||||||||||
| Accrued pension liability |
41 | 58 | ||||||||||
| Sales and other taxes payable |
11 | 16 | ||||||||||
| Emission credits obligations (1) |
21 | 10 | ||||||||||
| Other |
64 | 22 | ||||||||||
| $ | 350 | $ | 358 | |||||||||
| (1) | Throughout the three-year compliance period associated with the Regional Greenhouse Gas Initiative for carbon dioxide emissions, an obligation is recognized as gas is burned, measured at the cost to acquire credits for the related emissions. Emission credits are capitalized to inventory (note 13) when purchased and subsequently applied against the emission liabilities at the end of each compliance period. |
142 Emera Inc. — Annual Report 2017
Table of Contents
Notes to the Consolidated Financial Statements
| 25. | Long-Term Debt |
Bonds, notes and debentures are at fixed interest rates and are unsecured unless noted below. Included are certain bankers’ acceptances and commercial paper where the Company has the intention and the unencumbered ability to refinance the obligations for a period greater than one year.
Long-term debt as at December 31, 2017, consisted of the following:
| millions of Canadian dollars | |
Weighted average interest rate 2017 |
(1) |
|
Weighted average interest rate 2016 |
(1) |
Maturity | 2017 | 2016 | |||||||||||
| Emera |
||||||||||||||||||||
| Bankers’ acceptances, LIBOR loans |
Variable | Variable | 2020 | $ | 133 | $ | 30 | |||||||||||||
| Unsecured fixed rate notes |
3.50% | 3.50% | 2019–2023 | 725 | 725 | |||||||||||||||
| Fixed to floating subordinated notes (USD) |
6.75% | 6.75% | 2076 | 1,505 | 1,611 | |||||||||||||||
| $ | 2,363 | $ | 2,366 | |||||||||||||||||
| Emera US Finance LP |
||||||||||||||||||||
| Unsecured senior notes (USD) |
3.60% | 3.60% | 2019–2046 | $ | 4,077 | $ | 4,364 | |||||||||||||
| TECO Finance (2) |
||||||||||||||||||||
| Variable rate notes (USD) |
Variable | Variable | 2018 | $ | 314 | $ | 336 | |||||||||||||
| Fixed rate notes and bonds (USD) |
5.15% | 5.86% | 2020 | 376 | 805 | |||||||||||||||
| $ | 690 | $ | 1,141 | |||||||||||||||||
| Tampa Electric (3) |
||||||||||||||||||||
| Fixed rate notes and bonds (USD) |
4.75% | 4.90% | 2018–2045 | $ | 2,410 | $ | 2,579 | |||||||||||||
| PGS |
||||||||||||||||||||
| Fixed rate notes and bonds (USD) |
5.06% | 5.06% | 2018–2045 | $ | 328 | $ | 351 | |||||||||||||
| NMGC |
||||||||||||||||||||
| Fixed rate notes and bonds (USD) |
4.53% | 4.53% | 2021–2026 | $ | 339 | $ | 363 | |||||||||||||
| NMGI |
||||||||||||||||||||
| Fixed rate notes and bonds (USD) |
3.41% | 3.41% | 2019–2024 | $ | 251 | $ | 269 | |||||||||||||
| NSPI |
||||||||||||||||||||
| Commercial paper |
Variable | Variable | 2021 | $ | 364 | $ | 264 | |||||||||||||
| Medium term fixed rate notes |
5.73% | 5.73% | 2019–2097 | 1,965 | 1,965 | |||||||||||||||
| Fixed rate debenture |
9.75% | 9.75% | 2019 | 95 | 95 | |||||||||||||||
| $ | 2,424 | $ | 2,324 | |||||||||||||||||
| Emera Maine |
||||||||||||||||||||
| LIBOR loans and demand loans |
Variable | Variable | 2019 | $ | 51 | $ | 32 | |||||||||||||
| Secured fixed rate mortgage bonds (USD) |
9.74% | 9.74% | 2020–2022 | 63 | 67 | |||||||||||||||
| Unsecured senior fixed rate notes (USD) |
4.15% | 4.28% | 2018–2047 | 294 | 281 | |||||||||||||||
| $ | 408 | $ | 380 | |||||||||||||||||
Emera Inc. — Annual Report 2017 143
Table of Contents
| (continued)
millions of Canadian dollars |
|
Weighted average interest rate 2017 |
(1) |
|
Weighted average interest rate 2016 |
(1) |
Maturity | 2017 | 2016 | |||||||||||
| EBP |
||||||||||||||||||||
| Senior secured credit facility |
3.08% | 3.08% | 2021 | $ | 248 | $ | 248 | |||||||||||||
| GBPC |
||||||||||||||||||||
| Amortizing fixed rate notes (USD) |
3.77% | 3.62% | 2021–2022 | $ | 78 | $ | 63 | |||||||||||||
| Senior notes (USD) |
7.07% | 7.07% | 2020–2023 | 88 | 67 | |||||||||||||||
| $ | 166 | $ | 130 | |||||||||||||||||
| BLPC & ECI |
||||||||||||||||||||
| Secured senior notes (USD) |
Variable | Variable | 2021 | 168 | 201 | |||||||||||||||
| Secured fixed rate senior notes (4) |
5.06% | 5.65% | 2020–2028 | $ | 76 | $ | 81 | |||||||||||||
| $ | 244 | $ | 282 | |||||||||||||||||
| Adjustments |
||||||||||||||||||||
| Fair market value adjustment – TECO Energy acquisition (5) |
$ | 31 | $ | 58 | ||||||||||||||||
| Debt issuance costs |
(98 | ) | (111 | ) | ||||||||||||||||
| Amount due within one year |
(741 | ) | (476 | ) | ||||||||||||||||
| $ | (808 | ) | $ | (529 | ) | |||||||||||||||
| Long-Term Debt |
$ | 13,140 | $ | 14,268 | ||||||||||||||||
| (1) | Weighted average interest rate of fixed rate long-term debt. |
| (2) | TECO Energy is a full and unconditional guarantor of TECO Finance’s securities, and no subsidiaries of TECO Energy guarantee TECO Finance’s securities. |
| (3) | A substantial part of Tampa Electric’s tangible assets are pledged as collateral to secure its first mortgage bonds. There are currently no bonds outstanding under Tampa Electric’s first mortgage bond indenture. |
| (4) | Notes are issued and payable in either USD, BBD or East Caribbean Dollar (XCD). |
| (5) | On acquisition of TECO Energy, Emera recorded a fair market value adjustment on the unregulated long-term debt acquired. The fair market value adjustment is amortized over the remaining term of the debt. |
144 Emera Inc. — Annual Report 2017
Table of Contents
Notes to the Consolidated Financial Statements
The Company’s total long-term revolving credit facilities, outstanding borrowings and available capacity as at December 31 were as follows:
| millions of Canadian dollars | Maturity | 2017 | 2016 | |||||||||
| Emera – revolving credit facility (1) |
June 2020 | $ | 900 | $ | 700 | |||||||
| NSPI – revolving credit facility (1) |
October 2021 | 600 | 600 | |||||||||
| Emera Maine – revolving credit facility |
September 2019 | 100 | 107 | |||||||||
| BLPC – revolving credit facility |
2018–2021 | 24 | 26 | |||||||||
| Total |
1,624 | 1,433 | ||||||||||
| Less: |
||||||||||||
| Borrowings under credit facilities |
598 | 326 | ||||||||||
| Letters of credit issued inside credit facilities |
44 | 37 | ||||||||||
| Use of available facilities |
642 | 363 | ||||||||||
| Available capacity under existing agreements |
$ | 982 | $ | 1,070 | ||||||||
| (1) | Advances on the revolving credit facility can be made by way of overdraft on accounts up to $50 million. |
Debt Covenants
Emera and its subsidiaries have debt covenants associated with their credit facilities. Covenants are tested regularly and the Company is in compliance with covenant requirements. Emera’s significant covenants are listed below:
| Financial Covenant | Requirement | As at December 31, 2017 |
||||||||
| Emera |
||||||||||
| Syndicated credit facilities |
Debt to capital ratio | Less than or equal to 0.70 to 1 | 0.61:1 | |||||||
Recent Financing Activity
Emera
On December 12, 2017, Emera exercised its accordion option under its revolving credit facility to increase the facility from $700 million to $900 million with no other change to existing terms.
TECO Energy/TECO Finance
On November 1, 2017, TECO Energy/Finance repaid a $300 million USD note upon maturity. The note was repaid using funds from existing credit facilities and cash on hand.
Emera Maine
On September 27, 2017 Emera Maine completed a 30-year $50 million USD senior unsecured notes issuance. The notes bear interest at a rate of 4.36 per cent and will mature on September 27, 2047. Proceeds were used to repay maturing notes and for general corporate purposes.
BLPC
On September 1, 2017, BLPC’s interest rate on two $20 million BBD secured fixed rate senior notes maturing in 2020 and 2024 was reduced to 4.25 per cent and 5.875 per cent from 6.65 per cent and 6.875 per cent, respectively. Effective October 11, 2017, interest on their $12 million BBD demand loan facility was reduced to 4 per cent from 6.5 per cent.
Emera Brunswick Pipeline
On July 4, 2017, Emera Brunswick Pipeline amended its credit agreement to extend the maturity from February 2019 to February 2021 with no change to commercial terms from the prior agreement.
NSPI
On June 28, 2017, NSPI amended its operating credit facility to extend the maturity from October 2020 to October 2021 and the debt to capitalization ratio from 0.65:1 to 0.70:1. All other terms of the agreement are the same.
GBPC
On March 21, 2017, GBPC amended its loan agreement with the addition of two non-revolving term credit facilities. There were no significant changes in commercial terms from the prior agreement. The combined total of these new facilities is for up to $45 million USD. At December 31, 2017 the facilities were drawn in full.
Emera Inc. — Annual Report 2017 145
Table of Contents
Long-Term Debt Maturities
As at December 31, long-term debt maturities, including capital lease obligations, for each of the next five years and in aggregate thereafter are as follows:
| millions of Canadian dollars | 2018 | 2019 | 2020 | 2021 | 2022 | Thereafter | Total | |||||||||||||||||||||
| Emera |
$ | — | $ | 225 | $ | 133 | $ | — | $ | — | $ | 2,005 | $ | 2,363 | ||||||||||||||
| Emera US Finance LP |
— | 627 | — | 941 | — | 2,509 | 4,077 | |||||||||||||||||||||
| TECO Finance |
314 | — | 376 | — | — | — | 690 | |||||||||||||||||||||
| Tampa Electric |
319 | — | — | 291 | 282 | 1,518 | 2,410 | |||||||||||||||||||||
| PGS |
62 | — | — | 59 | 31 | 176 | 328 | |||||||||||||||||||||
| NMGC |
— | — | — | 251 | — | 88 | 339 | |||||||||||||||||||||
| NMGI |
— | 63 | — | — | — | 188 | 251 | |||||||||||||||||||||
| NSPI |
— | 95 | — | 364 | — | 1,965 | 2,424 | |||||||||||||||||||||
| Emera Maine |
6 | 51 | 37 | — | 113 | 201 | 408 | |||||||||||||||||||||
| EBP |
— | — | — | 248 | — | — | 248 | |||||||||||||||||||||
| GBPC |
12 | 15 | 45 | 22 | 31 | 41 | 166 | |||||||||||||||||||||
| BLPC and ECI |
28 | 29 | 55 | 28 | 11 | 93 | 244 | |||||||||||||||||||||
| Total |
$ | 741 | $ | 1,105 | $ | 646 | $ | 2,204 | $ | 468 | $ | 8,784 | $ | 13,948 | ||||||||||||||
146 Emera Inc. — Annual Report 2017
Table of Contents
Notes to the Consolidated Financial Statements
| 26. | Asset Retirement Obligations |
AROs mostly relate to the reclamation of land at the thermal, hydro and combustion turbine sites; and the disposal of polychlorinated biphenyls in transmission and distribution equipment and a pipeline site. Certain hydro, transmission and distribution assets may have additional AROs that cannot be measured as these assets are expected to be used for an indefinite period and, as a result, a reasonable estimate of the fair value of any related ARO cannot be made.
The change in ARO for the years ended December 31 is as follows:
| millions of Canadian dollars | 2017 | 2016 | ||||||||||
| Balance, January 1 |
$ | 170 | $ | 109 | ||||||||
| Additions (1) |
2 | 48 | ||||||||||
| Additions due to acquisition |
— | 9 | ||||||||||
| Liabilities settled |
(3 | ) | (2 | ) | ||||||||
| Accretion included in depreciation expense |
6 | 7 | ||||||||||
| Accretion deferred to regulatory asset (included in property, plant and equipment) |
— | (2 | ) | |||||||||
| Other |
1 | 1 | ||||||||||
| Change in foreign exchange rate |
(4 | ) | — | |||||||||
| Balance, December 31 |
$ | 172 | $ | 170 | ||||||||
| (1) | Tampa Electric produces ash and other by-products, collectively known as CCRs, at its Big Bend and Polk power stations. The 2016 additions to ARO are to achieve compliance with the EPA’s CCR rule, which contains design and operating standards for CCR management units. In 2016, the FPSC approved Tampa Electric’s proposed CCR compliance program for cost recovery through the ECRC. However, additional petitions will be submitted for recovery of future project expense based on engineering studies currently being performed. |
As at December 31, 2017 and 2016, some of the Company’s transmission and distribution assets may have additional conditional ARO which are not recognized in the consolidated financial statements as the fair value of these obligations could not be reasonably estimated, given there is insufficient information to do so. Management will continue to monitor these obligations and a liability will be recognized in the period in which an amount becomes determinable. AROs are included in “Other long-term liabilities” in the Consolidated Balance Sheets.
Emera Inc. — Annual Report 2017 147
Table of Contents
| 27. | Commitments and Contingencies |
| A. | Commitments |
As at December 31, 2017, contractual commitments (excluding pensions and other post-retirement obligations, convertible debentures, long-term debt and AROs) for each of the next five years and in aggregate thereafter consisted of the following:
| millions of Canadian dollars | 2018 | 2019 | 2020 | 2021 | 2022 | Thereafter | Total | |||||||||||||||||||||
| Purchased power (1) |
$ | 234 | $ | 216 | $ | 212 | $ | 209 | $ | 206 | $ | 2,148 | $ | 3,225 | ||||||||||||||
| Transportation (2) |
451 | 298 | 264 | 184 | 172 | 1,339 | 2,708 | |||||||||||||||||||||
| Fuel and gas supply |
527 | 176 | 50 | 41 | — | — | 794 | |||||||||||||||||||||
| Capital projects |
413 | 88 | — | — | — | — | 501 | |||||||||||||||||||||
| Long-term service agreements (3) |
75 | 65 | 34 | 44 | 35 | 180 | 433 | |||||||||||||||||||||
| Equity investment commitments (4) |
15 | 5 | 190 | — | — | — | 210 | |||||||||||||||||||||
| DSM |
63 | 28 | 18 | 18 | 18 | — | 145 | |||||||||||||||||||||
| Leases and other (5) |
43 | 12 | 10 | 7 | 4 | 61 | 137 | |||||||||||||||||||||
| $ | 1,821 | $ | 888 | $ | 778 | $ | 503 | $ | 435 | $ | 3,728 | $ | 8,153 | |||||||||||||||
| (1) | Annual requirement to purchase electricity production from independent power producers or other utilities over varying contract lengths. |
| (2) | Purchasing commitments for transportation of fuel and transportation capacity on various pipelines. |
| (3) | Maintenance of certain generating equipment, services related to a generation facility and wind operating agreements, outsourced management of computer and communication infrastructure and vegetation management. |
| (4) | Emera has a commitment in connection with the Federal Loan Guarantee to complete construction of the Maritime Link. Thirty per cent of the financing of this project will come from Emera as equity. Emera also has a commitment to make equity contributions to the Labrador Island Link Limited Partnership upon draw requests from the general partner. The amounts forecasted are a combination of equity investments for both projects and are subject to change in both timing and amounts as the projects advance through construction. |
| (5) | Operating lease agreements for office space, land, plant fixtures and equipment, telecommunications services, rail cars and vehicles. |
NSPI has a contractual obligation to pay NSPML for the use of the Maritime Link over approximately 37 years. The UARB has approved NSPI to pay NSPML approximately $110 million and $111 million in 2018 and 2019, respectively. After 2019, the timing and amounts payable to NSPML will be subject to a regulatory filing with the UARB which will be filed no later than 2019 and closer to the timing of the Muskrat Falls project completion.
| B. | Legal Proceedings |
Emera Florida and New Mexico
TECO Coal
TECO Coal was sold by TECO Energy on September 21, 2015 to Cambrian Coal Corporation (“Cambrian”), prior to Emera’s acquisition of TECO Energy. On March 18, 2016, Cambrian delivered a notice of a purported claim to TECO Diversified. The claim asserted breach of certain representations, and fraud and willful misconduct in connection therewith, of the Securities Purchase Agreement dated September 21, 2015 by and between TECO Diversified and Cambrian related to the purchase of TECO Coal by Cambrian. While the outcome of such matter is uncertain, management does not believe its ultimate resolution will have a material adverse effect on the Company’s results of operations, financial condition or cash flows.
TECO Guatemala Holdings (“TGH”)
In 2013, the International Centre for the Settlement of Investment Disputes (“ICSID”) Tribunal hearing the arbitration claim of TGH, a wholly owned subsidiary of TECO Energy, against the Republic of Guatemala (Guatemala) under the Dominican Republic Central America – United States Free Trade Agreement, issued an award in the case (“the Award”). The ICSID Tribunal unanimously found in favour of TGH and awarded damages to TGH of approximately $21 million USD, plus interest from October 21, 2010 at a rate equal to the US prime rate plus two per cent. This award was upheld in subsequent annulment proceedings in 2016 and, in addition, TGH’s application for partial annulment of the award was granted, and Guatemala was ordered to pay certain costs relating to the annulment proceedings. As a result, TGH had the right to resubmit its arbitration claim against Guatemala to seek additional damages (in addition to the previously awarded $21 million USD), as well as additional interest on the $21 million USD, and its full costs relating to the original arbitration and the new arbitration proceeding.
On September 23, 2016, TGH filed a request for resubmission to arbitration. On October 3, 2016, ICSID issued a notice of registration for TGH’s request for resubmission. A new tribunal has been constituted and it issued its first procedural order. TGH’s memorial was filed on September 1, 2017. Guatemala’s counter-memorial was filed on February 2, 2018. In addition, TGH has sued Guatemala in Washington, D.C. court to enforce the $21 million USD due and owing. Results to date do not reflect any benefit.
148 Emera Inc. — Annual Report 2017
Table of Contents
Notes to the Consolidated Financial Statements
Superfund and Former Manufactured Gas Plant Sites
TEC, through its Tampa Electric and PGS divisions, is a potentially responsible party (“PRP”) for certain superfund sites and, through its PGS division, for certain former manufactured gas plant sites. While the joint and several liability associated with these sites presents the potential for significant response costs, as at December 31, 2017, TEC has estimated its ultimate financial liability to be $38 million ($30 million USD), primarily at PGS. This amount has been accrued and is primarily reflected in the long-term liability section under “Other long-term liabilities” on the Consolidated Balance Sheets. The environmental remediation costs associated with these sites are expected to be paid over many years.
The estimated amounts represent only the portion of the cleanup costs attributable to TEC. The estimates to perform the work are based on TEC’s experience with similar work, adjusted for site-specific conditions and agreements with the respective governmental agencies. The estimates are made in current dollars, are not discounted and do not assume any insurance recoveries.
In instances where other PRPs are involved, most of those PRPs are creditworthy and are likely to continue to be creditworthy for the duration of the remediation work. However, in those instances that they are not, TEC could be liable for more than TEC’s actual percentage of the remediation costs. Factors that could impact these estimates include the ability of other PRPs to pay their pro-rata portion of the cleanup costs, additional testing and investigation which could expand the scope of the cleanup activities, additional liability that might arise from the cleanup activities themselves or changes in laws or regulations that could require additional remediation. Under current regulations, these costs are recoverable through customer rates established in subsequent base rate proceedings. The FPSC has approved, as part of the PGS depreciation settlement, an agreement to accelerate the amortization of the regulated asset associated with this reserve.
Emera Maine
From 2011 to 2016, four separate complaints have been filed with the FERC to challenge the ISO-New England Open Access Transmission Tariff-allowed based ROE. The first complaint, filed by a group including the Attorney General of Massachusetts, New England utilities commissions, state public advocates and end users, has been remanded to the FERC by the US Court of Appeals for further proceedings. A decision by FERC on the second and third complaints, brought by a group of consumer advocates and by a group of state commissions, state public advocates and end users respectively (“the ENE and MA AG II Cases”), is expected in 2018. The fourth complaint was filed by the Eastern Massachusetts Consumer-Owned Systems (“EMCOS”). Emera Maine has recorded a reserve of $4 million USD for the ENE and MA AG II Cases. These reserves have been recorded as “Regulatory liabilities” on the Consolidated Balance Sheets and as a reduction to “Operating revenues – regulated electric” on the Consolidated Statements of Income. The reserve was calculated based on Emera Maine’s best estimate of the probable outcome. No reserve has been made in relation to the first complaint or the EMCOS complaint due to the uncertainty of the outcomes.
Other Legal Proceedings
Emera and its subsidiaries may, from time to time, be involved in other legal proceedings, claims and litigation that arise in the ordinary course of business which the Company believes would not reasonably be expected to have a material adverse effect on the financial condition of the Company.
| C. | Principal Financial Risks and Uncertainties |
In this section, Emera describes some of the principal financial risks management believes could materially affect the Company in the normal course of business. Risks associated with derivative instruments and fair value measurements are discussed further in note 14 and note 15.
Sound risk management is an essential discipline for running the business efficiently and pursuing the Company’s strategy successfully. Emera has a business-wide risk management process, monitored by the Board of Directors, to ensure a consistent and coherent approach to risk management.
Foreign Exchange Risk
The Company is exposed to foreign currency exchange rate changes. Emera operates globally, with an increasing amount of the Company’s adjusted net income earned outside of Canada. As such, Emera is exposed to movements in exchange rates between the Canadian dollar and, particularly, the US dollar, which could positively or adversely affect results.
Consistent with the Company’s risk management policies, Emera manages currency risks through matching US denominated debt to finance its US operations and uses short-term foreign currency derivative instruments to hedge specific transactions. The Company enters into foreign exchange forward and swap contracts to limit exposure on certain foreign currency transactions such as fuel purchases, revenues streams, capital expenditures and projects. The regulatory framework for the Company’s rate-regulated subsidiaries permits the recovery of prudently incurred costs, including foreign exchange.
The Company does not utilize derivative financial instruments for foreign currency trading or speculative purposes, or to hedge the value of its investments in foreign subsidiaries. Exchange gains and losses on net investments in foreign subsidiaries are included in AOCI.
Emera Inc. — Annual Report 2017 149
Table of Contents
Capital Market and Liquidity Risk
Emera’s operations and projects in development require significant capital investments in property, plant and equipment. Consequently, Emera is an active participant in the debt and equity markets. Any disruption in capital markets could have a material impact on Emera’s ability to fund its operations. Capital markets are global in nature and are affected by numerous events throughout the world economy. Capital market disruptions could prevent Emera from issuing new securities or cause the Company to issue securities with less than preferred terms and conditions.
Emera is subject to financial risk associated with changes in its credit ratings. There are a number of factors that rating agencies evaluate to determine credit ratings, including the Company’s business and regulatory framework, the ability to recover costs and earn returns, diversification, leverage, and liquidity. A change to a credit rating as a result of changes in any of these items could result in higher interest rates in future financings, increase borrowing costs under certain existing credit facilities, limit access to the commercial paper market or limit the availability of adequate credit support for subsidiary operations.
Liquidity risk relates to Emera’s ability to ensure sufficient funds are available to meet its financial obligations. Emera manages this risk by forecasting cash requirements on a continuous basis to determine whether sufficient funds are available. Liquidity and capital needs will be financed through internally generated cash flows, short-term credit facilities, and ongoing access to capital markets. The Company reasonably expects liquidity sources to exceed ordinary course capital needs.
Interest Rate Risk
Emera utilizes a combination of fixed and floating rate debt financing for operations and capital expenditures, resulting in an exposure to interest rate risk. Emera seeks to manage interest rate risk through a portfolio approach that includes the use of fixed and floating rate debt with staggered maturities. The Company will, from time to time, issue long-term debt or enter into interest rate hedging contracts to limit its exposure to fluctuations in floating interest rate debt.
For Emera’s regulated subsidiaries, the cost of debt is a component of rates and prudently incurred debt costs are recovered from customers. While regulatory ROE will generally follow the direction of interest rates, such that regulatory ROE’s are likely to fall in times of reducing interest rates and rise in times of increasing interest rates, albeit not directly and generally with a lag period reflecting the regulatory process. Rising interest rates may also negatively affect the economic viability of project development and acquisition initiatives.
Commodity Price Risk
A large portion of the Company’s fuel supply comes from international suppliers and is subject to commodity price risk. The Company manages this risk through established processes and practices to identify, monitor, report and mitigate these risks. Fuel contracts may be exposed to broader global conditions, which may include impacts on delivery reliability and price, despite contracted terms. The Company seeks to manage this risk through the use of financial hedging instruments and physical contracts and through contractual protection with counterparties, where applicable. In addition, the adoption and implementation of fuel adjustment mechanisms in its rate-regulated subsidiaries has further helped manage this risk, as the regulatory framework for the Company’s rate-regulated subsidiaries permits the recovery of prudently incurred fuel costs.
Income Tax Risk
The computation of the Company’s provision for income taxes is impacted by changes in tax legislation in Canada, the United States and the Caribbean. Any such changes could affect the Company’s future earnings, cash flows, and financial position. The value of Emera’s existing deferred tax assets and liabilities are determined by existing tax laws and could be negatively impacted by changes in laws. Although a reduction in the corporate income tax rate could result in lower future tax expense and tax payments, it would also reduce the value of the Company’s existing deferred tax assets and could result in a charge to earnings if written down. US tax reform legislation was enacted on December 22, 2017. Although some of the specific details have yet to be clarified, this legislation has had a negative impact on the Company’s 2017 financial results. Refer to the note 9 for further details. Emera monitors the status of existing tax laws to ensure that changes impacting the Company are appropriately reflected in the Company’s tax compliance filings and financial results.
150 Emera Inc. — Annual Report 2017
Table of Contents
Notes to the Consolidated Financial Statements
| D. | Guarantees and Letters of Credit |
As at December 31, 2017, Emera had several significant guarantees and letters of credit on behalf of third parties outstanding. The following guarantees and letters of credit are not included within the Consolidated Balance Sheets as at December 31, 2017.
TECO Coal was sold on September 21, 2015 to Cambrian Coal Corporation (“Cambrian”). Pursuant to the sales agreement, Cambrian is obligated to file, in respect of each mining permit, applications in connection with the change of control with the appropriate governmental entities. As each application is approved, Cambrian is required to post a bond or other appropriate collateral in order to obtain the release of the corresponding bond secured by the TECO Energy indemnity for that permit. As at December 31, 2017, TECO Energy had remaining indemnified bonds totalling $6 million ($5 million USD).
The amounts outlined above represent the maximum theoretical amounts that TECO Energy would be required to pay to the surety companies.
The Company is working with Cambrian on the process to replace the remaining bonds. Pursuant to the securities purchase agreement, Cambrian has the obligation to indemnify and hold TECO Energy harmless from any losses incurred that arise out of the coal mining permits during the period commencing on the closing date through the date all permit approvals are obtained.
As at December 31, 2017, Emera has a standby letter of credit in the amount of $21 million for the benefit of NSP Maritime Link Inc. (“NSPML”) to guarantee the performance of the obligations of the EUS-Rokstad joint venture. Rokstad Power has issued a separate letter of credit for the benefit of Emera for their portion of the work to be performed under the contract. EUS-Rokstad is a joint venture between EUS and Rokstad Power, formed for the purpose of constructing the high voltage direct current components of NSPML’s transmission line. EUS and Rokstad Power are jointly and severally liable for completion of the project. Subsequent to year end, NSPML has drawn the full amount of the letter of credit, which was funded without recourse to Emera.
Emera has standby letters of credit in the amount of $28 million USD for the benefit of secured parties in connection with a refinancing of the Bear Swamp joint venture and also to third parties that have extended credit to Emera and its subsidiaries. These letters of credit typically have a one-year term and are renewed annually as required.
Emera Reinsurance Limited has issued a standby letter of credit to secure its obligations under reinsurance agreements. The letter of credit expires in December 2018 and is renewed annually. The amount committed as of December 31, 2017 was $6 million USD.
Emera Inc., on behalf of NSPI, has a standby letter of credit to secure obligations under an unfunded pension plan. The letter of credit expires in June 2018 and is renewed annually. The amount committed as at December 31, 2017 was $51 million.
Collaborative Arrangements
For the years ended December 31, 2017 and 2016, the Company has identified the following material collaborative arrangements:
Through NSPI, the Company is a participant in three wind energy projects in Nova Scotia. The percentage ownership of the wind project assets is based on the relative value of each party’s project assets by the total project assets. NSPI has power purchase arrangements to purchase the entire net output of the projects and, therefore, NSPI’s portion of the revenues are recorded net within regulated fuel for generation and purchased power. NSPI’s portion of operating expenses is recorded in OM&G expenses. In 2017, NSPI recognized $18 million net expense (2016 – $18 million) in “Regulated fuel for generation and purchased power” and $3 million (2016 – $5 million) in OM&G.
Emera Inc. — Annual Report 2017 151
Table of Contents
| 28. | Cumulative Preferred Stock |
Authorized:
Unlimited number of First Preferred shares, issuable in series.
Unlimited number of Second Preferred shares, issuable in series.
| December 31, 2017 | December 31, 2016 | |||||||||||||||||||||||
| Redemption | ||||||||||||||||||||||||
| Annual dividend per share |
price per share |
Issued and outstanding |
Net proceeds |
Issued and outstanding |
Net proceeds |
|||||||||||||||||||
| Series A |
$ | 0.6388 | $ | 25.00 | 3,864,636 | $ | 95 | 3,864,636 | $ | 95 | ||||||||||||||
| Series B |
Floating | $ | 25.00 | 2,135,364 | $ | 52 | 2,135,364 | $ | 52 | |||||||||||||||
| Series C |
$ | 1.0250 | $ | 25.00 | 10,000,000 | $ | 245 | 10,000,000 | $ | 245 | ||||||||||||||
| Series E |
$ | 1.1250 | $ | 26.00 | 5,000,000 | $ | 122 | 5,000,000 | $ | 122 | ||||||||||||||
| Series F |
$ | 1.0625 | $ | 25.00 | 8,000,000 | $ | 195 | 8,000,000 | $ | 195 | ||||||||||||||
| Total |
29,000,000 | $ | 709 | 29,000,000 | $ | 709 | ||||||||||||||||||
The First Preferred Shares, Series A, C and F are entitled to receive fixed cumulative cash dividends as and when declared by the Board of Directors of the Corporation in the amounts of $0.6388, $1.025 and $1.0625 per share per annum, respectively for each year up to and excluding August 15, 2020, August 15, 2018, and February 15, 2020, respectively. As at August 15, 2020, August 15, 2018, and February 15, 2020, the holders of the First Preferred Shares Series A, C and F, respectively, are entitled to receive reset fixed cumulative cash dividends. The reset annual dividend per share will be determined by multiplying $25.00 per share by the annual fixed dividend rate of the First Preferred Shares, Series A, C and F, respectively, which is the sum of the five-year Government of Canada Bond-Yield on the application reset date plus 1.84 per cent, 2.65 per cent, and 2.63 per cent, respectively.
The First Preferred Shares, Series B, are entitled to receive floating rate cumulative cash dividends, as and when declared by the Board of Directors of the Corporation in the amount determined by multiplying $25.00 by the three month Government of Canada Treasury Bill rate plus 1.84 per cent. The 2017 dividends for the Series B shares were $0.6032 per share (2016 – $0.5724).
The First Preferred Shares, Series E, are entitled to receive fixed rate cumulative cash dividends, as and when declared by the Board of Directors of the Corporation in the amount $1.1250 per share per annum.
The holders of First Preferred Shares, Series A, C and F will have the right, at their option, to convert their shares into an equal number of Cumulative Floating Rate First Preferred Shares, Series B, D, and G, of the Company, respectively, on August 15, 2020, August 15, 2018, and February 15, 2020, respectively, and every five years thereafter.
The holders of the First Preferred Shares, Series B will have the right, at their option, to convert their shares into an equal number of Series A shares of the Company on August 15, 2020 and every five years thereafter.
The Company has the right to redeem the outstanding Preferred Shares, Series A, C, and F shares without the consent of the holder on August 15, 2020, August 15, 2018, and February 15, 2020 respectively and on August 15, August 15 and February 15 respectively every five years thereafter for cash, in whole or in part at a price of $25.00 per share plus all accrued and unpaid dividends up to but excluding the date fixed for redemption.
The Company has the right to redeem the outstanding Preferred Shares, Series B, Series D and Series G shares without the consent of the holder on August 15, 2020, August 15, 2023 and February 15, 2025 respectively and on August 15, August 15 and February 15 every five years thereafter for cash, in whole or in part at a price of $25.00 per share plus all accrued and unpaid dividends up to but excluding the date fixed for redemption and $25.50 per share plus all accrued and unpaid dividends up to but excluding the date fixed for redemption in the case of redemptions on any other date after August 15, 2015, August 15, 2018 and February 15, 2020, respectively.
The Company has the right to redeem the outstanding First Preferred Shares, Series E on or after August 15, 2018 in whole or in part, at the Company’s option, by the payment in cash of $26.00 per Series E Preferred Share if redeemed prior to August 15, 2019; at $25.75 per Series E Preferred Share if redeemed on or after August 15, 2019, but prior to August 15, 2020; at $25.50 per Series E Preferred Share if redeemed on or after August 15, 2020, but prior to August 15, 2021; at $25.25 per Series E Preferred Share if redeemed on or after August 15, 2021, but prior to August 15, 2022; and at $25.00 per Series E Preferred Share if redeemed on or after August 15, 2022, in each case together with all accrued and unpaid dividends up to but excluding the date fixed for redemption.
As the First Preferred Shares, Series A, B, C, E and F are neither redeemable at the option of the shareholder nor have a mandatory redemption date, they are classified as equity and the associated dividends will be deducted on the Consolidated Statements of Income immediately before arriving at “Net earnings attributable to common shareholders” and will be shown on the Consolidated Statement of Equity as a deduction from retained earnings.
152 Emera Inc. — Annual Report 2017
Table of Contents
Notes to the Consolidated Financial Statements
The First Preferred Shares of each series rank on a parity with the First Preferred Shares of every other series and are entitled to a preference over the Second Preferred Shares, the Common Shares, and any other shares ranking junior to the First Preferred Shares with respect to the payment of dividends and the distribution of the remaining property and assets or return of capital of the Company in the liquidation, dissolution or wind-up, whether voluntary or involuntary.
In the event the Company fails to pay, in aggregate, eight quarterly dividends on any series of the First Preferred Shares, the holders of the First Preferred Shares, for only so long as the dividends remain in arrears, will be entitled to attend any meeting of shareholders of the Company at which directors are to be elected and to vote for the election of two directors out of the total number of directors elected at any such meeting.
| 29. | Non-Controlling Interest In Subsidiaries |
Non-controlling interest in subsidiaries consisted of the following:
| As at | December 31 | December 31 | ||||||
| millions of Canadian dollars | 2017 | 2016 | ||||||
| ICDU |
$ | 52 | $ | 53 | ||||
| Preferred shares of GBPC |
19 | 34 | ||||||
| Domlec |
21 | 25 | ||||||
| $ | 92 | $ | 112 | |||||
Preferred shares of GBPC:
Authorized:
35,000 non-voting cumulative redeemable variable perpetual preferred shares.
| 2017 | 2016 | |||||||||||||||
| Issued and outstanding: | number of shares |
millions of dollars |
number of shares |
millions of dollars |
||||||||||||
| Outstanding as at December 31 |
20,000 | $ | 19 | 35,000 | $ | 34 | ||||||||||
GBPC Non–Voting Cumulative Variable Perpetual Preferred Stock:
On December 12, 2017, GBPC redeemed 15,000 perpetual preferred shares at $1,000 Bahamian per share.
The Preferred Stock is redeemable by GBPC, in whole at any time or in part from time to time, at $1,000 Bahamian per share plus accrued and unpaid dividends.
The Preferred Stock is entitled to a 7.25 per cent per annum fixed cumulative preferential dividend for years 2013 through 2016, 8.50 per cent per annum fixed cumulative preferential dividend for years 2017 through 2019 and 10.00 per cent per annum fixed cumulative preferential dividend after 2020, as and when declared by the Board of Directors, accruing from the date of issue.
The Preferred Shares rank behind all of GBPC’s current and future secured and unsecured debt with any of GBPC’s future preferred stock and ahead of all of GBPC’s current and future common stock.
Emera Inc. — Annual Report 2017 153
Table of Contents
| 30. | Supplementary Information to Consolidated Statements of Cash Flows |
| For the | Year ended December 31 | |||||||||||
| millions of Canadian dollars | 2017 | 2016 | ||||||||||
| Changes in non-cash working capital: |
||||||||||||
| Receivables, net |
$ | (176 | ) | $ | (104 | ) | ||||||
| Income taxes receivable |
8 | (23 | ) | |||||||||
| Inventory |
31 | 88 | ||||||||||
| Prepayments and other current assets |
14 | (18 | ) | |||||||||
| Accounts payable |
3 | 162 | ||||||||||
| Income taxes payable |
(17 | ) | 14 | |||||||||
| Other current liabilities |
33 | 15 | ||||||||||
| Total non-cash working capital |
$ | (104 | ) | $ | 134 | |||||||
| Supplemental disclosure of cash paid: |
||||||||||||
| Interest |
$ | 689 | $ | 480 | ||||||||
| Income taxes |
$ | 63 | $ | 57 | ||||||||
| Supplemental disclosure of non-cash activities: |
||||||||||||
| Common share dividends reinvested |
$ | 166 | $ | 103 | ||||||||
| Beneficial Conversion Feature of the convertible debentures |
$ | — | $ | 43 | ||||||||
154 Emera Inc. — Annual Report 2017
Table of Contents
Notes to the Consolidated Financial Statements
| 31. | Stock-Based Compensation |
Employee Common Share Purchase Plan and Common Shareholders Dividend Reinvestment and Share Purchase Plan
Eligible employees may participate in Emera’s Employee Common Share Purchase Plan to which employees make cash contributions of a minimum of $25 to a maximum of $8,000 per year for the purpose of purchasing common shares of Emera. The Company also contributes to the plan a percentage of the employees’ contributions. If an employee contributes any amount up to $3,000 to employees plan account, the Company will contribute 20 per cent of that amount. When an employee contributes any amount over $3,000, up to the $8,000 maximum, the Company will contribute 10 per cent of that amount.
The plan allows the reinvestment of dividends. The maximum aggregate number of Emera common shares reserved for issuance under this plan is 4 million common shares.
The Company also has a Common Shareholders Dividend Reinvestment and Share Purchase Plan (“Dividend Reinvestment Plan”), which provides an opportunity for shareholders to reinvest dividends and for the purpose of purchasing common shares. This plan provides for a discount of up to 5 per cent from the average market price of Emera’s common shares for common shares purchased in connection with the reinvestment of cash dividend.
Compensation cost for shares issued by Emera for the year ended December 31, 2017 under the Employee Common Share Purchase Plan was $1 million (2016 – $1 million) and is included in “Operating, maintenance and general” on the Consolidated Statements of Income.
Stock-Based Compensation Plans
Stock Option Plan
The Company has a stock option plan that grants options to senior management of the Company for a maximum term of 10 years. The option price of the stock options is the closing market price of the stocks on the day before the option is granted. The maximum aggregate number of shares issuable under this plan is 11.7 million shares.
All options granted to date are exercisable on a graduated basis with up to 25 per cent of options exercisable on the first anniversary date and further 25 per cent increments on each of the second, third and fourth anniversaries of the grant. If an option is not exercised within 10 years, it expires and the optionee loses all rights thereunder. The holder of the option has no rights as a shareholder until the option is exercised and shares have been issued. The total number of stocks to be optioned to any optionee shall not exceed five per cent of the issued and outstanding common stocks on the date the option is granted.
If, before the expiry of an option in accordance with its terms, the optionee ceases to be an eligible person due to retirement or termination for other than just cause, such option may, subject to the terms thereof and any other terms of the plan, be exercised at any time within the 24 months following the date the optionee retires, but in any case prior to the expiry of the option in accordance with its terms.
If, before the expiry of an option in accordance with its terms, the optionee ceases to be an eligible person due to employment termination for just cause, resignation or death, such option may, subject to the terms thereof and any other terms of the plan, be exercised at any time within the six months following the date the optionee is terminated, resigns or dies, as applicable, but in any case prior to the expiry of the option in accordance with its terms.
The Company uses the fair value based method to measure the compensation expense related to its stock-based compensation and recognizes the expense over the vesting period on a straight-line basis. The fair value of stock option awards granted was estimated on the date of grant using a Black-Scholes valuation model. The expected term of the option awards is calculated based on historical exercise behaviour and represents the period of time that options are expected to be outstanding. The risk-free interest rate is based on the Bank of Canada five-year government bond yields. The expected dividend yield incorporates current dividend rates as well as historical dividend increase patterns. Emera’s expected stock price volatility was estimated using its five-year historical volatility.
The following table shows the weighted average fair values per stock option along with the assumptions incorporated into the valuation models for options granted:
| For the year ended December 31 | 2017 | 2016 | ||||||||||
| Weighted average fair value per option |
$ | 2.37 | $ | 2.80 | ||||||||
| Expected term |
5 years | 5 years | ||||||||||
| Risk-free interest rate |
1.22% | 0.66% | ||||||||||
| Expected dividend yield |
4.60% | 4.08% | ||||||||||
| Expected volatility |
14.41% | 15.45% | ||||||||||
Emera Inc. — Annual Report 2017 155
Table of Contents
The following table summarizes information related to the stock options for 2017:
| Total options | Non-vested options (1) | |||||||||||||||
| Number of options |
Weighted average exercise price per share |
Number of options |
Weighted average grant date fair value |
|||||||||||||
| Outstanding as at December 31, 2016 |
2,920,000 | $ | 37.42 | 1,520,125 | $ | 2.69 | ||||||||||
| Granted |
827,400 | 45.16 | 827,400 | 2.37 | ||||||||||||
| Exercised |
(103,825 | ) | 28.91 | N/A | N/A | |||||||||||
| Forfeited |
— | — | (607,875 | ) | 2.73 | |||||||||||
| Options outstanding December 31, 2017 |
3,643,575 | $ | 39.42 | 1,739,650 | $ | 2.52 | ||||||||||
| Options exercisable December 31, 2017 (2)(3) |
1,903,925 | $ | 35.37 | |||||||||||||
| (1) | As at December 31, 2017 there was $3 million of unrecognized compensation related to stock options not yet vested which is expected to be recognized over a weighted average period of approximately 2.5 years (2016 – $3 million, 2.4 years). |
| (2) | As at December 31, 2017, the weighted average remaining term of vested options was 5.4 years with an aggregate intrinsic value of $22 million (2016 – 5.7 years, $17 million). |
| (3) | As at December 31, 2017 the fair value of options that vested in the year was $2 million (2016 – $2 million). |
Compensation cost recognized for stock options for the year ended December 31, 2017 was $2 million (2016 – $2 million), which is included in “Operating, maintenance and general” on the Consolidated Statements of Income.
As at December 31, 2017, cash received from option exercises was $3 million (2016 – $16 million). The total intrinsic value of options exercised for the year ended December 31, 2017 was $2 million (2016 – $13 million). The range of exercise prices for the options outstanding as at December 31, 2017 was $21.58 to $46.19 (2016 – $20.42 to $46.19).
Share Unit Plans
The Company has deferred share unit (“DSU”) and performance share unit (“PSU”) plans. The DSU and PSU liabilities are marked-to-market at the end of each period based on the common share price at the end of the period.
Deferred Share Unit Plans
Under the Directors’ DSU plan, Directors of the Company may elect to receive all or any portion of their compensation in DSUs in lieu of cash compensation, subject to requirements to receive a minimum portion of their annual retainer in DSUs. Directors’ fees are paid on a quarterly basis and, at the time of each payment of fees, the applicable amount is converted to DSUs. A DSU has a value equal to one Emera common share. When a dividend is paid on Emera’s common shares, referred to as the Dividend Reinvestment Plan (“DRIP”), the Director’s DSU account is credited with additional DSUs. DSUs cannot be redeemed for cash until the Director retires, resigns or otherwise leaves the Board. The cash redemption value of a DSU equals the market value of a common share at the time of redemption, pursuant to the plan. Following retirement or resignation from the Board, the value of the DSUs credited to the participant’s account is calculated by multiplying the number of DSUs in the participant’s account by the average of Emera’s stock closing price during the 10 trading days ending on the tenth trading day prior to the payment date.
Under the executive and senior management DSU plan, each participant may elect to defer all or a percentage of their annual incentive award in the form of DSUs with the understanding, for participants who are subject to executive share ownership guidelines, a minimum of 50% of the value of their actual annual incentive award (25% in the first year of the program) will be payable in DSUs until the applicable guidelines are met.
When incentive awards are determined, the amount elected is converted to DSUs, which have a value equal to the market price of an Emera common share. When a dividend is paid on Emera’s common shares, each participant’s DSU account is allocated additional DSUs equal in value to the dividends paid on an equivalent number of Emera common shares. Following termination of employment or retirement, and by December 15 of the calendar year after termination or retirement, the value of the DSUs credited to the participant’s account is calculated by multiplying the number of DSUs in the participant’s account by the average of Emera’s stock closing price for the 50 trading days prior to a given calculation date. Payments are usually made in cash. At the sole discretion of the Management Resources and Compensation Committee (“MRCC”), payments may be made in the form of actual shares.
In addition, special DSU awards may be made from time to time by the MRCC to selected executives and senior management to recognize singular achievements or to achieve certain corporate objectives.
156 Emera Inc. — Annual Report 2017
Table of Contents
Notes to the Consolidated Financial Statements
A summary of the activity related to employee and director DSUs for the year ended December 31, 2017 is presented in the following table:
| Employee DSU |
Weighted average grant date fair value |
Director DSU |
Weighted average grant date fair value |
|||||||||||||
| Outstanding as at December 31, 2016 |
680,931 | $ | 27.50 | 395,798 | $ | 33.88 | ||||||||||
| Granted including DRIP |
73,185 | 37.74 | 86,281 | 42.96 | ||||||||||||
| Exercised |
(2,482 | ) | 46.58 | (9,486 | ) | 44.00 | ||||||||||
| Forfeited |
(34 | ) | 46.58 | (108 | ) | 45.39 | ||||||||||
| Outstanding and exercisable as at December 31, 2017 |
751,600 | $ | 28.44 | 472,485 | $ | 35.33 | ||||||||||
Compensation cost recognized for employee and director DSU for the year ended December 31, 2017 was $7 million (2016 – $8 million). Tax benefits related to this compensation cost for share units realized for the year ended December 31, 2017 were $2 million (2016 – $3 million).
Performance Share Unit Plan
Under the PSU plan, executive and senior employees are eligible for long-term incentives payable through the PSU plan. PSUs are granted annually for three-year overlapping performance cycles. PSUs are granted based on the average of Emera’s stock closing price for the 50 trading days prior to a given calculation date. Dividend equivalents are awarded and are used to purchase additional PSUs, also referred to as DRIP. The PSU value varies according to the Emera common share market price and corporate performance.
PSUs vest at the end of the three-year cycle and will be calculated and approved by the MRCC early in the following year. The value of the payout considers actual service over the performance cycle and will be pro-rated in the case of retirement, disability or death.
A summary of the activity related to employee PSUs for the year ended December 31, 2017 is presented in the following table:
| Employee PSUs |
Weighted average grant date fair value |
Aggregate intrinsic value |
||||||||||
| Outstanding as at December 31, 2016 |
560,880 | $ | 37.55 | $ | 25.5 | |||||||
| Granted including DRIP |
519,789 | 44.35 | ||||||||||
| Exercised |
(220,075 | ) | 30.67 | |||||||||
| Forfeited |
(30,596 | ) | 43.66 | |||||||||
| Outstanding as at December 31, 2017 |
829,998 | $ | 43.41 | $ | 41.1 | |||||||
Compensation cost recognized for the PSU plan for the year ended December 31, 2017 was $14 million (2016 – $11 million). Tax benefits related to this compensation cost for share units realized for the year ended December 31, 2017 were $4 million (2016 – $4 million).
Emera Inc. — Annual Report 2017 157
Table of Contents
| 32. | Variable Interest Entities |
The Company performs ongoing analysis to assess whether it holds any Variable Interest Entities (“VIE”). To identify potential VIEs, management reviews contracts under leases, long-term purchase power agreements, tolling contracts and jointly owned facilities.
VIEs of which the Company is deemed the primary beneficiary must be consolidated. The primary beneficiary of a VIE has both the power to direct the activities of the entity that most significantly impact its economic performance and the obligation to absorb losses of the entity that could potentially be significant to the entity. In circumstances where Emera is not deemed the primary beneficiary, the VIE is accounted for using the equity method.
For the years ended, December 31, 2017 and 2016, the Company has identified the following material VIEs:
Emera holds a variable interest in NSPML, a VIE for which it was determined that Emera is not the primary beneficiary since it does not have the controlling financial interest of NSPML. In Q2 2014, when the critical milestones were achieved, Nalcor Energy was deemed the beneficiary of the asset for financial reporting purposes as they have authority over the majority of the direct activities that are expected to most significantly impact the economic performance of the Maritime Link Project. Thus, Emera began recording the Maritime Link Project as an equity investment.
BLPC has established a SIF, primarily for the purpose of building a fund to cover risk against damage and consequential loss to certain generating, transmission and distribution systems. ECI holds a variable interest in the SIF for which it was determined that ECI was the primary beneficiary and, accordingly, the SIF must be consolidated by ECI. In its determination that ECI controls the SIF, management considered that, in substance, the activities of the SIF are being conducted on behalf of ECI’s subsidiary BLPC and BLPC, alone, obtains the benefits from the SIF’s operations. Additionally, because ECI, through BLPC, has rights to all the benefits of the SIF, it is also exposed to the risks related to the activities of the SIF. Any withdrawal of SIF fund assets by the Company would be subject to existing regulations. Emera’s consolidated VIE in the SIF is recorded as an “Investment securities”, “Restricted cash” and “Regulatory liabilities” on the Consolidated Balance Sheets. Amounts included in restricted cash represent the cash portion of funds required to be set aside for the BLPC SIF.
The Company has identified certain long-term purchase power agreements that meet the definition of variable interests as the Company has to purchase all or a majority of the electricity generation at a fixed price. However, it was determined that the Company was not the primary beneficiary since it lacked the power to direct the activities of the entity, including the ability to operate the generating facilities and make management decisions.
The following table provides information about Emera’s portion of material unconsolidated VIEs:
| As at | December 31, 2017 | December 31, 2016 | ||||||||||||||
| millions of Canadian dollars | Total assets |
Maximum exposure to loss |
Total assets |
Maximum exposure to loss |
||||||||||||
| Unconsolidated VIEs in which Emera has variable interests |
||||||||||||||||
| NSPML (equity accounted) |
$ | 510 | $ | 67 | $ | 315 | $ | 577 | ||||||||
| 33. | Comparative Information |
These financial statements contain certain reclassifications of prior period amounts to be consistent with the current period presentation, with no effect on net income.
| 34. | Subsequent Events |
These financial statements and notes reflect the Company’s evaluation of events occurring subsequent to the balance sheet date through February 9, 2018, the date the financial statements were issued.
| 35. | Supplemental Financial Information |
On June 16, 2016, Emera US Finance LP, (in such capacity, the “Issuer”), issued $3.25 billion USD senior unsecured notes (“US Notes”). The US Notes are fully and unconditionally guaranteed, on a joint and several basis, by Emera (in such capacity, the “Parent Company”) and EUSHI (in such capacity, the “Guarantor Subsidiaries”). Emera owns, directly or indirectly, all of the limited and general partnership interests in Emera US Finance LP.
The following condensed consolidated financial statements present the results of operations, financial position and cash flows of the Parent Company, Subsidiary Issuer, Guarantor Subsidiaries and all other Non-guarantor Subsidiaries independently and on a consolidated basis.
Our guarantors were not determined using geographic, service line or other similar criteria, and as a result, the “Parent”, “Subsidiary Issuer”, “Guarantor Subsidiaries” and “Non-guarantor Subsidiaries” columns each include portions of our domestic and international operations. Accordingly, this basis of presentation is not intended to present our financial condition, results of operations or cash flows for any purpose other than to comply with the specific requirements for guarantor reporting.
158 Emera Inc. — Annual Report 2017
Table of Contents
Condensed Consolidated Statements of Income
Emera Incorporated
| For the | Year ended December 31, 2017 | |||||||||||||||||||||||
| millions of Canadian dollars | Parent | Subsidiary Issuer |
Guarantor Subsidiaries |
Non-guarantor Subsidiaries |
Eliminations | Consolidated | ||||||||||||||||||
| Operating revenues |
$ | — | $ | — | $ | 4,165 | $ | 2,118 | $ | (57 | ) | $ | 6,226 | |||||||||||
| Operating expenses |
41 | — | 3,241 | 1,610 | (57 | ) | 4,835 | |||||||||||||||||
| Income (loss) from operations |
(41 | ) | — | 924 | 508 | — | 1,391 | |||||||||||||||||
| Income (loss) from equity investments in subsidiaries |
336 | — | — | — | (336 | ) | — | |||||||||||||||||
| Income from equity investments |
1 | — | 1 | 122 | — | 124 | ||||||||||||||||||
| Intercompany income (expenses), net |
92 | 195 | (204 | ) | (45 | ) | (38 | ) | — | |||||||||||||||
| Other income (expenses), net |
— | — | 16 | (19 | ) | 5 | 2 | |||||||||||||||||
| Interest expense, net |
138 | 155 | 242 | 163 | — | 698 | ||||||||||||||||||
| Income (loss) before provision for income taxes |
250 | 40 | 495 | 403 | (369 | ) | 819 | |||||||||||||||||
| Income tax expense (recovery) |
(44 | ) | 17 | 511 | 36 | — | 520 | |||||||||||||||||
| Net income (loss) |
294 | 23 | (16 | ) | 367 | (369 | ) | 299 | ||||||||||||||||
| Non-controlling interest in subsidiaries |
— | — | — | 1 | 4 | 5 | ||||||||||||||||||
| Preferred stock dividends |
28 | — | 29 | 13 | (42 | ) | 28 | |||||||||||||||||
| Net income (loss) attributable to common shareholders |
$ | 266 | $ | 23 | $ | (45 | ) | $ | 353 | $ | (331 | ) | $ | 266 | ||||||||||
| Comprehensive income (loss) of Emera Incorporated |
$ | — | $ | 3 | $ | (392 | ) | $ | 372 | $ | 17 | $ | — | |||||||||||
Emera Inc. — Annual Report 2017 159
Table of Contents
Condensed Consolidated Statements of Income
Emera Incorporated
| For the | Year ended December 31, 2016 | |||||||||||||||||||||||
| millions of Canadian dollars | Parent | Subsidiary Issuer |
Guarantor Subsidiaries |
Non-guarantor Subsidiaries |
Eliminations | Consolidated | ||||||||||||||||||
| Operating revenues |
$ | — | $ | — | $ | 2,494 | $ | 1,818 | $ | (35 | ) | $ | 4,277 | |||||||||||
| Operating expenses |
39 | — | 2,127 | 1,591 | (35 | ) | 3,722 | |||||||||||||||||
| Income (loss) from operations |
(39 | ) | — | 367 | 227 | — | 555 | |||||||||||||||||
| Income (loss) from equity investments in subsidiaries |
150 | — | — | — | (150 | ) | — | |||||||||||||||||
| Income from equity investments |
18 | — | — | 82 | — | 100 | ||||||||||||||||||
| Intercompany income (expenses), net |
203 | 101 | (107 | ) | (151 | ) | (46 | ) | — | |||||||||||||||
| Other income (expenses), net |
135 | — | 24 | 15 | — | 174 | ||||||||||||||||||
| Interest expense, net |
226 | 85 | 127 | 147 | — | 585 | ||||||||||||||||||
| Income (loss) before provision for income taxes |
241 | 16 | 157 | 26 | (196 | ) | 244 | |||||||||||||||||
| Income tax expense (recovery) |
(14 | ) | 7 | 48 | (63 | ) | — | (22 | ) | |||||||||||||||
| Net income (loss) |
255 | 9 | 109 | 89 | (196 | ) | 266 | |||||||||||||||||
| Non-controlling interest in subsidiaries |
— | — | — | 7 | 4 | 11 | ||||||||||||||||||
| Preferred stock dividends |
28 | — | 31 | 19 | (50 | ) | 28 | |||||||||||||||||
| Net income (loss) attributable to common shareholders |
$ | 227 | $ | 9 | $ | 78 | $ | 63 | $ | (150 | ) | $ | 227 | |||||||||||
| Comprehensive income (loss) of Emera Incorporated |
$ | 228 | $ | 19 | $ | 205 | $ | 59 | $ | (283 | ) | $ | 228 | |||||||||||
160 Emera Inc. — Annual Report 2017
Table of Contents
Condensed Consolidated Balance Sheets
Emera Incorporated
| As at | December 31, 2017 | |||||||||||||||||||||||
| millions of Canadian dollars | Parent | Subsidiary Issuer |
Guarantor Subsidiaries |
Non-guarantor Subsidiaries |
Eliminations | Consolidated | ||||||||||||||||||
| Assets |
||||||||||||||||||||||||
| Current assets |
||||||||||||||||||||||||
| Cash and cash equivalents |
$ | 276 | $ | 21 | $ | 47 | $ | 94 | $ | — | $ | 438 | ||||||||||||
| Restricted cash |
— | — | 1 | 64 | — | 65 | ||||||||||||||||||
| Inventory |
— | — | 243 | 175 | — | 418 | ||||||||||||||||||
| Derivative instruments |
5 | — | 11 | 131 | (6 | ) | 141 | |||||||||||||||||
| Regulatory assets |
— | — | 114 | 24 | — | 138 | ||||||||||||||||||
| Intercompany receivables |
74 | 9 | 4 | 108 | (195 | ) | — | |||||||||||||||||
| Receivables and other current assets |
3 | — | 546 | 777 | — | 1,326 | ||||||||||||||||||
| Total current assets |
358 | 30 | 966 | 1,373 | (201 | ) | 2,526 | |||||||||||||||||
| Property, plant and equipment, |
17 | — | 12,258 | 4,720 | — | 16,995 | ||||||||||||||||||
| Other assets |
||||||||||||||||||||||||
| Deferred income taxes |
70 | — | (10 | ) | 71 | 7 | 138 | |||||||||||||||||
| Derivative instruments |
4 | — | 2 | 110 | (4 | ) | 112 | |||||||||||||||||
| Regulatory assets |
— | — | 552 | 686 | — | 1,238 | ||||||||||||||||||
| Net investment in direct financing lease |
— | — | 12 | 469 | — | 481 | ||||||||||||||||||
| Investments in subsidiaries accounted for using the equity method |
8,490 | — | — | — | (8,490 | ) | — | |||||||||||||||||
| Investments subject to significant influence |
5 | — | 13 | 1,197 | — | 1,215 | ||||||||||||||||||
| Goodwill |
— | — | 5,709 | 96 | — | 5,805 | ||||||||||||||||||
| Intercompany notes receivable |
1,140 | 4,285 | 1 | 955 | (6,381 | ) | — | |||||||||||||||||
| Other investments – intercompany |
— | — | — | 70 | (70 | ) | — | |||||||||||||||||
| Other long-term assets |
29 | — | 68 | 184 | (20 | ) | 261 | |||||||||||||||||
| Total other assets |
9,738 | 4,285 | 6,347 | 3,838 | (14,958 | ) | 9,250 | |||||||||||||||||
| Total assets |
$ | 10,113 | $ | 4,315 | $ | 19,571 | $ | 9,931 | $ | (15,159 | ) | $ | 28,771 | |||||||||||
Emera Inc. — Annual Report 2017 161
Table of Contents
Condensed Consolidated Balance Sheets (continued)
Emera Incorporated
| As at | December 31, 2017 | |||||||||||||||||||||||
| millions of Canadian dollars | Parent | Subsidiary Issuer |
Guarantor Subsidiaries |
Non-guarantor Subsidiaries |
Eliminations | Consolidated | ||||||||||||||||||
| Liabilities and Equity |
||||||||||||||||||||||||
| Current liabilities |
||||||||||||||||||||||||
| Short-term debt |
$ | — | $ | — | $ | 1,241 | $ | — | $ | — | $ | 1,241 | ||||||||||||
| Current portion of long-term debt |
— | — | 701 | 40 | — | 741 | ||||||||||||||||||
| Accounts payable |
9 | — | 620 | 532 | — | 1,161 | ||||||||||||||||||
| Intercompany payable |
55 | 6 | 90 | 74 | (225 | ) | — | |||||||||||||||||
| Derivative instruments |
5 | — | 52 | 175 | (5 | ) | 227 | |||||||||||||||||
| Regulatory liabilities |
— | — | 91 | 136 | (1 | ) | 226 | |||||||||||||||||
| Other current liabilities |
60 | 6 | 137 | 147 | — | 350 | ||||||||||||||||||
| Total current liabilities |
129 | 12 | 2,932 | 1,104 | (231 | ) | 3,946 | |||||||||||||||||
| Long-term liabilities Long-term debt |
2,205 | 4,034 | 3,741 | 3,160 | — | 13,140 | ||||||||||||||||||
| Intercompany long-term debt |
656 | — | 4,582 | 1,139 | (6,377 | ) | — | |||||||||||||||||
| Deferred income taxes |
— | 4 | 435 | 565 | 7 | 1,011 | ||||||||||||||||||
| Derivative instruments |
4 | — | 4 | 79 | (4 | ) | 83 | |||||||||||||||||
| Regulatory liabilities |
— | — | 1,889 | 353 | — | 2,242 | ||||||||||||||||||
| Pension and post-retirement liabilities |
21 | — | 341 | 197 | — | 559 | ||||||||||||||||||
| Other long-term liabilities |
9 | — | 267 | 352 | (19 | ) | 609 | |||||||||||||||||
| Total long-term liabilities |
2,895 | 4,038 | 11,259 | 5,845 | (6,393 | ) | 17,644 | |||||||||||||||||
| Equity |
||||||||||||||||||||||||
| Common stock |
5,601 | 242 | 4,311 | 2,136 | (6,689 | ) | 5,601 | |||||||||||||||||
| Cumulative preferred stock |
709 | — | 620 | 76 | (696 | ) | 709 | |||||||||||||||||
| Contributed surplus |
76 | — | 110 | 148 | (258 | ) | 76 | |||||||||||||||||
| Accumulated other comprehensive income (loss) |
(188 | ) | (9 | ) | (36 | ) | (185 | ) | 230 | (188 | ) | |||||||||||||
| Retained earnings |
891 | 32 | 375 | 735 | (1,142 | ) | 891 | |||||||||||||||||
| Total Emera Incorporated equity |
7,089 | 265 | 5,380 | 2,910 | (8,555 | ) | 7,089 | |||||||||||||||||
| Non-controlling interest in subsidiaries |
— | — | — | 72 | 20 | 92 | ||||||||||||||||||
| Total equity |
7,089 | 265 | 5,380 | 2,982 | (8,535 | ) | 7,181 | |||||||||||||||||
| Total liabilities and equity |
$ | 10,113 | $ | 4,315 | $ | 19,571 | $ | 9,931 | $ | (15,159 | ) | $ | 28,771 | |||||||||||
162 Emera Inc. — Annual Report 2017
Table of Contents
| As at | December 31, 2016 | |||||||||||||||||||||||
| millions of Canadian dollars | Parent | Subsidiary Issuer |
Guarantor Subsidiaries |
Non-guarantor Subsidiaries |
Eliminations | Consolidated | ||||||||||||||||||
| Assets |
||||||||||||||||||||||||
| Current assets |
||||||||||||||||||||||||
| Cash and cash equivalents |
$ | 200 | $ | 28 | $ | 48 | $ | 128 | $ | — | $ | 404 | ||||||||||||
| Restricted cash |
— | — | 1 | 86 | — | 87 | ||||||||||||||||||
| Inventory |
— | — | 273 | 199 | — | 472 | ||||||||||||||||||
| Derivative instruments |
13 | — | 33 | 112 | (13 | ) | 145 | |||||||||||||||||
| Regulatory assets |
— | — | 54 | 26 | — | 80 | ||||||||||||||||||
| Intercompany receivable |
57 | 9 | 11 | 569 | (646 | ) | — | |||||||||||||||||
| Prepayments and other current assets |
3 | — | 478 | 842 | — | 1,323 | ||||||||||||||||||
| Total current assets |
273 | 37 | 898 | 1,962 | (659 | ) | 2,511 | |||||||||||||||||
| Property, plant and equipment, net of accumulated depreciation |
14 | — | 12,724 | 4,552 | — | 17,290 | ||||||||||||||||||
| Other assets |
||||||||||||||||||||||||
| Deferred income taxes |
31 | — | 18 | 114 | (38 | ) | 125 | |||||||||||||||||
| Derivative instruments |
12 | — | 2 | 129 | (12 | ) | 131 | |||||||||||||||||
| Regulatory assets |
— | — | 647 | 595 | — | 1,242 | ||||||||||||||||||
| Net investment in direct financing lease |
— | — | 13 | 475 | — | 488 | ||||||||||||||||||
| Investments in subsidiaries accounted for using the equity method |
8,349 | — | — | — | (8,349 | ) | — | |||||||||||||||||
| Investments subject to significant influence |
5 | — | 13 | 929 | — | 947 | ||||||||||||||||||
| Goodwill |
— | — | 6,110 | 103 | — | 6,213 | ||||||||||||||||||
| Intercompany notes receivable |
1,341 | 4,558 | 16 | 589 | (6,504 | ) | — | |||||||||||||||||
| Other investments – intercompany |
— | — | — | 2,270 | (2,270 | ) | — | |||||||||||||||||
| Other long-term assets |
33 | — | 85 | 175 | (19 | ) | 274 | |||||||||||||||||
| Total other assets |
9,771 | 4,558 | 6,904 | 5,379 | (17,192 | ) | 9,420 | |||||||||||||||||
| Total assets |
$ | 10,058 | $ | 4,595 | $ | 20,526 | $ | 11,893 | $ | (17,851 | ) | $ | 29,221 | |||||||||||
Emera Inc. — Annual Report 2017 163
Table of Contents
| As at | December 31, 2016 | |||||||||||||||||||||||
| millions of Canadian dollars | Parent | Subsidiary Issuer |
Guarantor Subsidiaries |
Non-guarantor Subsidiaries |
Eliminations | Consolidated | ||||||||||||||||||
| Liabilities and Equity |
||||||||||||||||||||||||
| Current liabilities |
||||||||||||||||||||||||
| Short-term debt |
$ | — | $ | — | $ | 948 | $ | 13 | $ | — | $ | 961 | ||||||||||||
| Current portion of long-term debt |
— | — | 436 | 40 | — | 476 | ||||||||||||||||||
| Accounts payable |
6 | — | 756 | 480 | — | 1,242 | ||||||||||||||||||
| Intercompany payable |
534 | 6 | 81 | 25 | (646 | ) | — | |||||||||||||||||
| Derivative instruments |
14 | — | 10 | 314 | (13 | ) | 325 | |||||||||||||||||
| Regulatory liabilities |
— | — | 225 | 137 | — | 362 | ||||||||||||||||||
| Other current liabilities |
54 | 13 | 130 | 161 | — | 358 | ||||||||||||||||||
| Total current liabilities |
608 | 19 | 2,586 | 1,170 | (659 | ) | 3,724 | |||||||||||||||||
| Long-term liabilities |
||||||||||||||||||||||||
| Long-term debt |
2,338 | 4,314 | 4,687 | 2,929 | — | 14,268 | ||||||||||||||||||
| Intercompany long-term debt |
366 | — | 4,778 | 1,357 | (6,501 | ) | — | |||||||||||||||||
| Deferred income taxes |
— | 1 | 1,193 | 516 | (38 | ) | 1,672 | |||||||||||||||||
| Derivative instruments |
12 | — | — | 150 | (12 | ) | 150 | |||||||||||||||||
| Regulatory liabilities |
— | — | 973 | 304 | — | 1,277 | ||||||||||||||||||
| Pension and post-retirement liabilities |
17 | — | 433 | 219 | — | 669 | ||||||||||||||||||
| Other long-term liabilities |
13 | — | 274 | 377 | (19 | ) | 645 | |||||||||||||||||
| Total long-term liabilities |
2,746 | 4,315 | 12,338 | 5,852 | (6,570 | ) | 18,681 | |||||||||||||||||
| Equity |
||||||||||||||||||||||||
| Common stock |
4,738 | 242 | 4,177 | 3,997 | (8,416 | ) | 4,738 | |||||||||||||||||
| Cumulative preferred stock |
709 | — | 620 | 271 | (891 | ) | 709 | |||||||||||||||||
| Contributed surplus |
75 | — | 45 | 106 | (151 | ) | 75 | |||||||||||||||||
| Accumulated other comprehensive income (loss) |
106 | 10 | 340 | (191 | ) | (159 | ) | 106 | ||||||||||||||||
| Retained earnings |
1,076 | 9 | 420 | 610 | (1,039 | ) | 1,076 | |||||||||||||||||
| Total Emera Incorporated equity |
6,704 | 261 | 5,602 | 4,793 | (10,656 | ) | 6,704 | |||||||||||||||||
| Non-controlling interest in subsidiaries |
— | — | — | 78 | 34 | 112 | ||||||||||||||||||
| Total equity |
6,704 | 261 | 5,602 | 4,871 | (10,622 | ) | 6,816 | |||||||||||||||||
| Total liabilities and equity |
$ | 10,058 | $ | 4,595 | $ | 20,526 | $ | 11,893 | $ | (17,851 | ) | $ | 29,221 | |||||||||||
164 Emera Inc. — Annual Report 2017
Table of Contents
Condensed Consolidated Statements of Cash Flows
Emera Incorporated
| For the | Year ended December 31, 2017 | |||||||||||||||||||||||
| millions of Canadian dollars | Parent | Subsidiary Issuer |
Guarantor Subsidiaries |
Non-guarantor Subsidiaries |
Eliminations | Consolidated | ||||||||||||||||||
| Net cash provided by (used in) operating activities |
$ | 195 | $ | 22 | $ | 712 | $ | 1,125 | $ | (861 | ) | $ | 1,193 | |||||||||||
| Investing activities |
||||||||||||||||||||||||
| Additions to property, plant and equipment |
(5 | ) | — | (1,031 | ) | (480 | ) | (13 | ) | (1,529 | ) | |||||||||||||
| Net purchase of investments subject to significant influence, inclusive of acquisition costs |
— | — | — | (213 | ) | — | (213 | ) | ||||||||||||||||
| Other intercompany investing activities |
(708 | ) | (26 | ) | 15 | 1,818 | (1,099 | ) | — | |||||||||||||||
| Other investing activities |
(34 | ) | — | (20 | ) | 32 | 3 | (19 | ) | |||||||||||||||
| Net cash provided by (used in) investing activities |
(747 | ) | (26 | ) | (1,036 | ) | 1,157 | (1,109 | ) | (1,761 | ) | |||||||||||||
| Financing activities |
||||||||||||||||||||||||
| Change in short-term debt, net |
— | — | 365 | (13 | ) | — | 352 | |||||||||||||||||
| Proceeds from long-term debt, net of issuance costs |
— | — | 147 | (131 | ) | 113 | 129 | |||||||||||||||||
| Retirement of long-term debt |
— | — | (413 | ) | (55 | ) | 15 | (453 | ) | |||||||||||||||
| Net borrowings (repayments) under committed credit facilities |
(30 | ) | — | 21 | 233 | 6 | 230 | |||||||||||||||||
| Issuance of common stock, net of issuance costs |
682 | — | 134 | (1,837 | ) | 1,703 | 682 | |||||||||||||||||
| Issuance of preferred stock, net of issuance costs |
— | — | — | (195 | ) | 195 | — | |||||||||||||||||
| Dividends on common stock |
(287 | ) | — | — | (272 | ) | 272 | (287 | ) | |||||||||||||||
| Dividends on preferred stock |
(28 | ) | — | (29 | ) | (13 | ) | 42 | (28 | ) | ||||||||||||||
| Dividends paid by subsidiaries to non-controlling interest |
— | — | — | (2 | ) | (4 | ) | (6 | ) | |||||||||||||||
| Other financing activities |
290 | — | 96 | (40 | ) | (372 | ) | (26 | ) | |||||||||||||||
| Net cash provided by (used in) financing activities |
627 | — | 321 | (2,325 | ) | 1,970 | 593 | |||||||||||||||||
| Effect of exchange rate changes on cash and cash equivalents |
1 | (3 | ) | 2 | (13 | ) | — | (13 | ) | |||||||||||||||
| Net increase (decrease) in cash and cash equivalents |
76 | (7 | ) | (1 | ) | (56 | ) | — | 12 | |||||||||||||||
| Cash, cash equivalents and restricted cash, beginning of year |
200 | 28 | 49 | 214 | — | 491 | ||||||||||||||||||
| Cash, cash equivalents and restricted cash, end of year |
$ | 276 | $ | 21 | $ | 48 | $ | 158 | $ | — | $ | 503 | ||||||||||||
Emera Inc. — Annual Report 2017 165
Table of Contents
Condensed Consolidated Statements of Cash Flows
Emera Incorporated
| For the | Year ended December 31, 2016 | |||||||||||||||||||||||
| millions of Canadian dollars | Parent | Subsidiary Issuer |
Guarantor Subsidiaries |
Non-guarantor Subsidiaries |
Eliminations | Consolidated | ||||||||||||||||||
| Net cash provided by (used in) operating activities |
$ | 265 | $ | 29 | $ | 481 | $ | 107 | $ | 171 | $ | 1,053 | ||||||||||||
| Investing activities |
||||||||||||||||||||||||
| Acquisitions, net of cash acquired |
— | — | (8,409 | ) | — | — | (8,409 | ) | ||||||||||||||||
| Additions to property, plant and equipment |
(2 | ) | — | (673 | ) | (405 | ) | — | (1,080 | ) | ||||||||||||||
| Net purchase of investments subject to significant influence, inclusive of acquisition costs |
— | — | — | (276 | ) | — | (276 | ) | ||||||||||||||||
| Net proceeds on sale of investment subject to significant influence and held-for-trading common shares |
665 | — | — | — | — | 665 | ||||||||||||||||||
| Other intercompany investing activities |
(2,348 | ) | (4,416 | ) | (18 | ) | (2,397 | ) | 9,179 | — | ||||||||||||||
| Other investing activities |
— | — | (3 | ) | 66 | — | 63 | |||||||||||||||||
| Net cash provided by (used in) investing activities |
(1,685 | ) | (4,416 | ) | (9,103 | ) | (3,012 | ) | 9,179 | (9,037 | ) | |||||||||||||
| Financing activities |
||||||||||||||||||||||||
| Change in short-term debt, net |
(14 | ) | — | 122 | (4 | ) | 14 | 118 | ||||||||||||||||
| Proceeds from long-term debt, net of issuance costs |
2,037 | 4,187 | 4,516 | 764 | (5,081 | ) | 6,423 | |||||||||||||||||
| Proceeds from convertible debentures represented by instalment receipts, net of issuance costs |
(44 | ) | — | — | 1,457 | — | 1,413 | |||||||||||||||||
| Retirement of long-term debt |
(250 | ) | — | (6 | ) | (36 | ) | 19 | (273 | ) | ||||||||||||||
| Net borrowings (repayments) under committed credit facilities |
(210 | ) | — | — | (99 | ) | (6 | ) | (315 | ) | ||||||||||||||
| Issuance of common stock, net of issuance costs |
354 | 242 | 3,865 | 95 | (4,202 | ) | 354 | |||||||||||||||||
| Issuance of preferred stock, net of issuance costs |
— | — | 195 | — | (195 | ) | — | |||||||||||||||||
| Dividends on common stock |
(221 | ) | — | — | (254 | ) | 254 | (221 | ) | |||||||||||||||
| Dividends on preferred stock |
(28 | ) | — | (31 | ) | (18 | ) | 49 | (28 | ) | ||||||||||||||
| Dividends paid by subsidiaries to non-controlling interest |
— | — | — | (2 | ) | (3 | ) | (5 | ) | |||||||||||||||
| Other financing activities |
— | — | (18 | ) | 185 | (185 | ) | (18 | ) | |||||||||||||||
| Net cash provided by (used in) financing activities |
1,624 | 4,429 | 8,643 | 2,088 | (9,336 | ) | 7,448 | |||||||||||||||||
| Effect of exchange rate changes on cash and cash equivalents |
(4 | ) | (14 | ) | 7 | (54 | ) | — | (65 | ) | ||||||||||||||
| Net increase (decrease) in cash and cash equivalents |
200 | 28 | 28 | (871 | ) | 14 | (601 | ) | ||||||||||||||||
| Cash, cash equivalents and restricted cash, beginning of year |
— | — | 21 | 1,085 | (14 | ) | 1,092 | |||||||||||||||||
| Cash, cash equivalents and restricted cash, end of year |
$ | 200 | $ | 28 | $ | 49 | $ | 214 | $ | — | $ | 491 | ||||||||||||
166 Emera Inc. — Annual Report 2017
Table of Contents

|
Chris Huskilson, our former President and CEO, retired on March 29, 2018. The Emera Leadership Team, Board of Directors and employees from across our operating companies wish Chris all the best in his future endeavours. | |||
Emera Inc. — Annual Report 2017 167
Table of Contents
SHAREHOLDER INFORMATION
168 Emera Inc. — Annual Report 2017
Table of Contents
| Printed on Rolland Opaque, an FSC® Mix certified paper,
which contains 30% de-inked post-consumer fibre and is manufactured in Canada with biogas (an alternative green energy source that reduces greenhouse gas emissions that cause global warming). | ||
Table of Contents

|
www.emera.com | |
Serious News for Serious Traders! Try StreetInsider.com Premium Free!
You May Also Be Interested In
- Company announcement no 9/2024 Annual account 2023
- Flash News: OKX Adds BETH to its Dual Investment Product
- Flash News: OKX Wallet Users Can Now Access CoreX Via Web Extension
Create E-mail Alert Related Categories
SEC FilingsSign up for StreetInsider Free!
Receive full access to all new and archived articles, unlimited portfolio tracking, e-mail alerts, custom newswires and RSS feeds - and more!
