

Form 6-K CEMEX SAB DE CV For: Mar 11
 Tweet
Tweet Share
Share
UNITED STATES
SECURITIES AND EXCHANGE COMMISSION
Washington, D.C. 20549
FORM 6-K
REPORT OF FOREIGN PRIVATE ISSUER
PURSUANT TO RULE 13a-16 or 15d-16
UNDER THE SECURITIES EXCHANGE ACT OF 1934
For the month of March, 2019
Commission File Number: 001-14946
CEMEX, S.A.B. de C.V.
(Translation of Registrant’s name into English)
Avenida Ricardo Margáin Zozaya #325, Colonia Valle del Campestre
San Pedro Garza García, Nuevo León, C.P. 66265, México
(Address of principal executive office)
Indicate by check mark whether the registrant files or will file annual reports under cover Form 20-F or Form 40-F.
Form 20-F ☒ Form 40-F ☐
Indicate by check mark if the registrant is submitting the Form 6-K in paper as permitted by Regulation S-T Rule 101(b)(1): ☐
Indicate by check mark if the registrant is submitting the Form 6-K in paper as permitted by Regulation S-T Rule 101(b)(7): ☐
CONTENTS
We anticipate disclosing to prospective investors certain information that has not been previously publicly reported. This report is neither an offer to purchase nor a solicitation of an offer to sell any securities. We have elected to provide the information in this report for informational purposes.
This report contains forward-looking statements within the meaning of the U.S. federal securities laws. We intend these forward-looking statements to be covered by the safe harbor provisions for forward-looking statements in the U.S. federal securities laws. In some cases, these statements can be identified by the use of forward-looking words such as “may,” “assume,” “might,” “should,” “could,” “continue,” “would,” “can,” “consider,” “anticipate,” “estimate,” “expect,” “plan,” “believe,” “foresee,” “predict,” “potential,” “target,” “strategy,” “intend” or other similar words. These forward-looking statements reflect our current expectations and projections about future events based on our knowledge of present facts and circumstances and assumptions about future events. These statements necessarily involve risks and uncertainties that could cause actual results to differ materially from our expectations. Some of the risks, uncertainties and other important factors that could cause results to differ, or that otherwise could have an impact on us or our subsidiaries, include:
| ● | the cyclical activity of the construction sector; |
| ● | our exposure to other sectors that impact our business, such as but not limited to the energy sector; |
| ● | competition; |
| ● | availability of raw materials and related fluctuating prices; |
| ● | general political, social, economic and business conditions in the markets in which we operate or that affect our operations and any significant economic, political or social developments in those markets, as well as any inherent risks to international operations; |
| ● | the regulatory environment, including environmental, tax, antitrust, and acquisition-related rules and regulations; |
| ● | our ability to satisfy our obligations under our material debt agreements, the indentures that govern our senior secured notes and our other debt instruments; |
| ● | the availability of short-term credit lines, assisting in connection with market cycles; |
| ● | the impact of our below investment grade debt rating on our cost of capital; |
| ● | loss of reputation of our brands; |
| ● | our ability to consummate asset sales, fully integrate newly acquired businesses, achieve cost-savings from our cost-reduction initiatives and implement our global pricing initiatives for our products; |
| ● | the increasing reliance on information technology infrastructure for our sales invoicing, procurement, financial statements and other processes that can adversely affect our sales and operations in the event that the infrastructure does not work as intended, experiences technical difficulties or is subjected to cyber-attacks; |
| ● | changes in the economy that affect demand for consumer goods, consequently affecting demand for our products; |
| ● | weather conditions, including disasters such as earthquakes and floods; |
| ● | trade barriers, including tariffs or import taxes and changes in existing trade policies or changes to, or withdrawals from, free trade agreements, including the United States-Mexico-Canada Agreement (USMCA), if it comes into effect, and the North American Free Trade Agreement (NAFTA), both of which Mexico is a party to; |
| ● | terrorist and organized criminal activities as well as geopolitical events; |
| ● | declarations of insolvency or bankruptcy, or becoming subject to similar proceedings; |
| ● | natural disasters and other unforeseen events; and |
| ● | other risks and uncertainties described under “Item 3—Key Information—Risk Factors” of our 2017 annual report and under “Risk Factors” in this report. |
Readers are urged to read this report and carefully consider the risks, uncertainties and other factors that affect our business. The information contained in this report is subject to change without notice, and we are not obligated to publicly update or revise forward-looking statements after the date hereof or to reflect the occurrence of anticipated or unanticipated events or circumstances. Readers should review future reports filed by us with the U.S. Securities and Exchange Commission.
SIGNATURE
Pursuant to the requirements of the Securities Exchange Act of 1934, CEMEX, S.A.B. de C.V. has duly caused this report to be signed on its behalf by the undersigned, thereunto duly authorized.
| CEMEX, S.A.B. de C.V. | ||||||
| (Registrant) | ||||||
| Date: March 11, 2019 |
By: | /s/ Rafael Garza Lozano | ||||
| Name: Rafael Garza Lozano | ||||||
| Title: Chief Comptroller | ||||||
EXHIBIT INDEX
| EXHIBIT NO. |
DESCRIPTION | |
| 1. |
Certain information with respect to CEMEX, S.A.B. de C.V. (NYSE: CX) and its direct and indirect subsidiaries. | |
Exhibit 1
The following summarizes certain information, including financial information, that we may disclose to prospective investors. The disclosure set forth below updates the information contained in our annual report on Form 20-F for the year ended December 31, 2017 (the “2017 Annual Report”), filed with the U.S. Securities and Exchange Commission (the “SEC”) on April 30, 2018, our report on Form 6-K, filed with the SEC on February 28, 2019, which includes our 2018 audited consolidated financial statements (the “February 28 6-K”) and any other documents that we have filed or furnished with the SEC, and should be read in conjunction therewith. Except as the context otherwise may require, references in this report to “CEMEX,” “we,” “us” or “our” refer to CEMEX, S.A.B. de C.V. and its consolidated entities. See “Management’s Discussion and Analysis of Financial Condition and Results of Operations— Critical Accounting Policies” in this report and note 2 to our 2018 audited consolidated financial statements included in the February 28 6-K for a description of our significant accounting policies including our principles of consolidation. References in this report to “U.S.$” and “Dollars” are to U.S. Dollars, references to “€” are to Euros, references to “£” and “Pounds” are to British Pounds, and, unless otherwise indicated, references to “Ps,” “Mexican Pesos” and “Pesos” are to Mexican Pesos. References in this report to “CPOs” are to CEMEX, S.A.B. de C.V.’s Certificados de Participación Ordinarios. References in this report to the “February 28 6-K” refer only to Exhibit 99.1 (CEMEX, S.A.B. de C.V. and subsidiaries—Consolidated Financial Statements) thereto.
CAUTIONARY STATEMENT REGARDING FORWARD-LOOKING STATEMENTS
This report contains forward-looking statements within the meaning of the U.S. federal securities laws. We intend these forward-looking statements to be covered by the safe harbor provisions for forward-looking statements in the U.S. federal securities laws. In some cases, these statements can be identified by the use of forward-looking words such as “may,” “assume,” “might,” “should,” “could,” “continue,” “would,” “can,” “consider,” “anticipate,” “estimate,” “expect,” “plan,” “believe,” “foresee,” “predict,” “potential,” “target,” “strategy,” “intend” or other similar words. These forward-looking statements reflect our current expectations and projections about future events based on our knowledge of present facts and circumstances and assumptions about future events. These statements necessarily involve risks and uncertainties that could cause actual results to differ materially from our expectations. Some of the risks, uncertainties and other important factors that could cause results to differ, or that otherwise could have an impact on us or our subsidiaries, include:
| ● | the cyclical activity of the construction sector; |
| ● | our exposure to other sectors that impact our business, such as, but not limited, to the energy sector; |
| ● | competition; |
| ● | availability of raw materials and related fluctuating prices; |
| ● | general political, social, economic and business conditions in the markets in which we operate or that affect our operations and any significant economic, political or social developments in those markets, as well as any inherent risks to international operations; |
| ● | the regulatory environment, including environmental, tax, antitrust and acquisition-related rules and regulations; |
| ● | our ability to satisfy our obligations under our material debt agreements, the indentures that govern our Senior Secured Notes (as defined below) and our other debt instruments; |
| ● | the availability of short-term credit lines, existing in connection with market prices; |
| ● | the impact of our below investment grade debt rating on our cost of capital; |
| ● | loss of reputation of our brands; |
| ● | our ability to consummate asset sales, fully integrate newly acquired businesses, achieve cost-savings from our cost-reduction initiatives and implement our global pricing initiatives for our products; |
| ● | the increasing reliance on information technology infrastructure for our sales invoicing, procurement, financial statements and other processes that can adversely affect our sales and operations in the event that the infrastructure does not work as intended, experiences technical difficulties or is subjected to cyber-attacks; |
| ● | changes in the economy that affect demand for consumer goods, consequently affecting demand for our products; |
| ● | weather conditions, including disasters such as earthquakes and floods; |
| ● | trade barriers, including tariffs or import taxes and changes in existing trade policies or changes to, or withdrawals from, free trade agreements, including the United States-Mexico-Canada Agreement (“USMCA”), if it comes into effect, and the North American Free Trade Agreement (“NAFTA”), both of which Mexico is a party to; |
| ● | terrorist and organized criminal activities as well as geopolitical events; |
| ● | declarations of insolvency or bankruptcy, or becoming subject to similar proceedings; |
| ● | natural disasters and other unforeseen events; and |
| ● | other risks and uncertainties described under “Item 3—Key Information—Risk Factors” of our 2017 Annual Report and under “Risk Factors” below. |
Readers are urged to read this report and carefully consider the risks, uncertainties and other factors that affect our business. The information contained in this report is subject to change without notice, and we are not obligated to publicly update or revise forward-looking statements after the date hereof or to reflect the occurrence of anticipated or unanticipated events or circumstances. Readers should review future reports filed by us with the SEC.
CERTAIN TECHNICAL TERMS
When used herein, the terms set forth below mean the following:
| ● | Aggregates are sand and gravel, which are mined from quarries. They give ready-mix concrete its necessary volume and add to its overall strength. Under normal circumstances, one cubic meter of fresh concrete contains two metric tons of gravel and sand. |
| ● | Clinker is an intermediate cement product made by sintering limestone, clay, and iron oxide in a kiln at around 1,450 degrees Celsius. One metric ton of clinker is used to make approximately 1.1 metric tons of gray portland cement. |
| ● | Gray portland cement, used for construction purposes, is a hydraulic binding agent with a composition by weight of at least approximately 95% clinker and up to 5% of a minor component (usually calcium sulfate) which, when mixed with sand, stone or other aggregates and water, produces either concrete or mortar. |
| ● | Petroleum coke (pet coke) is a by-product of the oil refining coking process. |
| ● | Ready-mix concrete is a mixture of cement, aggregates, and water. |
| ● | Tons means metric tons. One metric ton equals 1.102 short tons. |
| ● | White cement is a specialty cement used primarily for decorative purposes. |
SUMMARY
This summary highlights information contained elsewhere in this report. Unless the context otherwise requires, references in this report to our sales and assets, including percentages, for a country or region are calculated before eliminations resulting from consolidation, and thus include intercompany balances between countries and regions. These intercompany balances are eliminated when calculated on a consolidated basis.
We also refer in various places within this report to non-International Financial Reporting Standards (“IFRS”) measures, including “Operating EBITDA.” “Operating EBITDA” equals operating earnings before other expenses, net, plus amortization and depreciation expenses, as more fully explained under “Selected Consolidated Financial Information” in this report. The presentation of these non-IFRS measures is not meant to be considered in isolation or as a substitute for operating earnings or other profitability metrics in our 2018 audited consolidated financial statements prepared in accordance with IFRS as issued by the International Accounting Standards Board (“IASB”).
2
We have approximated certain numbers in this report to their closest round numbers or a given number of decimal places. Due to rounding, figures shown as totals in tables may not be arithmetic aggregations of the figures preceding them.
CEMEX
CEMEX is one of the largest cement companies in the world, based on annual installed cement production capacity as of December 31, 2018, of approximately 92.6 million tons and 2018 cement sales volumes of 69.4 million tons. After the merger of Lafarge, S.A. (“Lafarge”) with Holcim Ltd. (“Holcim”) during 2015, which resulted in the company LafargeHolcim Ltd. (“LafargeHolcim”), we estimate we are the next largest ready-mix concrete company in the world with annual sales volumes of approximately 53.3 million cubic meters and one of the largest aggregates companies in the world with annual sales volumes of approximately 149.8 million tons, in each case, based on our annual sales volumes in 2018. We are also one of the world’s largest traders of cement and clinker, having traded approximately 10 million tons of cement and clinker in 2018. This information does not include discontinued operations. For information on our discontinued operations, see note 4.2 to our 2018 audited consolidated financial statements included in the February 28 6-K. CEMEX, S.A.B. de C.V. is an operating and holding company engaged, directly or indirectly, through its subsidiaries, primarily in the production, distribution, marketing and sale of cement, ready-mix concrete, aggregates, clinker and other construction materials throughout the world. We provide reliable construction-related services to customers and communities and maintains business relationships, in more than 50 countries throughout the world.
We operate globally, with operations in Mexico, the United States, Europe, South America, Central America, the Caribbean, Asia, the Middle East and Africa. We had total assets of Ps552,628 million (U.S.$28,124 million) as of December 31, 2018, and an equity market capitalization of approximately Ps135,298 million (U.S.$6,942 million) as of March 8, 2019.
As of December 31, 2018, our cement production facilities were located in Mexico, the United States, the United Kingdom, Germany, Spain, Poland, Latvia, the Czech Republic, Croatia, Colombia, Panama, Costa Rica, the Dominican Republic, Puerto Rico, Nicaragua, Trinidad and Tobago, Jamaica, Barbados, Egypt, and the Philippines. As of December 31, 2018, our assets (after eliminations), cement plants and installed capacity, on an unconsolidated basis by region, were as set forth below. Installed capacity, which refers to theoretical annual production capacity, represents gray portland cement and white cement capacity and includes installed capacity of cement plants that have been temporarily closed.
| As of December 31, 2018 | ||||||||||||
| Assets After Eliminations (in Billions of Mexican Pesos) |
Number of Cement Plants |
Installed Cement Production Capacity (Millions of Tons Per Annum) |
||||||||||
| Mexico(1) |
Ps | 69 | 15 | 29.5 | ||||||||
| United States(2) |
269 | 11 | 15.4 | |||||||||
| Europe |
||||||||||||
| United Kingdom |
32 | 2 | 2.4 | |||||||||
| France |
17 | — | — | |||||||||
| Germany |
8 | 1 | 2.4 | |||||||||
| Spain |
25 | 7 | 10.4 | |||||||||
| Poland |
6 | 2 | 3.0 | |||||||||
| Czech Republic |
4 | 1 | 1.0 | |||||||||
| Rest of Europe(3) |
11 | 4 | 4.7 | |||||||||
| South, Central America and the Caribbean |
||||||||||||
| Colombia |
25 | 2 | 4.0 | |||||||||
| Panama |
7 | 1 | 2.1 | |||||||||
| Costa Rica |
2 | 1 | 0.9 | |||||||||
| Caribbean TCL(4) |
11 | 3 | 2.5 | |||||||||
| Dominican Republic |
4 | 1 | 2.6 | |||||||||
| Rest of South, Central America and the Caribbean(5) |
7 | 2 | 1.8 | |||||||||
| Asia, Middle East and Africa |
||||||||||||
| Philippines |
12 | 2 | 4.5 | |||||||||
| Egypt |
5 | 1 | 5.4 | |||||||||
| Israel |
10 | — | — | |||||||||
| Rest of Asia, Middle East and Africa(6) |
4 | — | — | |||||||||
| Corporate and Other Operations |
23 | — | — | |||||||||
|
|
|
|
|
|
|
|||||||
| Continuing Operations |
551 | — | — | |||||||||
| Assets held for sale |
2 | — | — | |||||||||
|
|
|
|
|
|
|
|||||||
| Total |
Ps | 553 | 56 | 92.6 | ||||||||
|
|
|
|
|
|
|
|||||||
3
“—” = Not Applicable
The above table includes our proportional interest in the installed capacity of companies in which we hold a non-controlling interest and reflects our organizational structure as of December 31, 2018.
| (1) | “Number of cement plants” and “installed cement production capacity” includes two cement plants that were temporarily inactive with an aggregate annual installed capacity of 2.8 million tons of cement. “Installed cement production capacity” includes 0.5 million tons of cement representing our proportional interests through associates in three other cement plants. |
| (2) | “Number of cement plants” and “installed cement production capacity” includes two cement plants that were temporarily inactive with an aggregate annual installed capacity of 2.1 million tons of cement. “Installed cement production capacity” includes 0.8 million tons of cement representing our proportional interests through associates in seven other cement plants. |
| (3) | “Rest of Europe” refers mainly to our operations in Croatia, Latvia, Scandinavia and Finland. “Installed cement production capacity” includes 0.7 million tons of cement representing our proportional interest in a Lithuanian cement producer that operated one other cement plant. |
| (4) | “Caribbean TCL” refers to Trinidad Cement Limited’s (“TCL”) operations mainly in Trinidad and Tobago, Jamaica, Guyana and Barbados. |
| (5) | “Rest of South, Central America and the Caribbean” refers mainly to our operations in Puerto Rico, Nicaragua, Jamaica, the Caribbean, Guatemala and El Salvador, excluding the acquired operations of Caribbean TCL. |
| (6) | “Rest of Asia, Middle East and Africa” includes our operations in the United Arab Emirates (“UAE”). |
Geographic Breakdown of Revenues for the Year Ended December 31, 2018
The following chart indicates the geographic breakdown of our revenues, before eliminations resulting from consolidation, for the year ended December 31, 2018:

4
Breakdown of Revenues by Product for the Year Ended December 31, 2018
The following chart indicates the breakdown of our revenues by product, after eliminations resulting from consolidation, for the year ended December 31, 2018:

Ratio of Operating EBITDA to Interest Expense
| For the Year Ended December 31, | ||||||||||||
| 2016 | 2017 | 2018 | ||||||||||
| Ratio of Operating EBITDA to interest expense(1) |
2.4 | 2.5 | 3.9 | |||||||||
| (1) | Operating EBITDA equals operating earnings before other expenses, net, plus amortization and depreciation expenses. Operating EBITDA is calculated and presented because we believe that it is widely accepted as a financial indicator of our ability to internally fund capital expenditures and service or incur debt, and the consolidated ratio of Operating EBITDA to interest expense is calculated and presented because it is used to measure our performance under certain of our financing agreements. Operating EBITDA and such ratio are non-IFRS measures and should not be considered as indicators of our financial performance as alternatives to cash flow, as measures of liquidity or as being comparable to other similarly titled measures of other companies. Under IFRS, while there are line items that are customarily included in income statements prepared pursuant to IFRS, such as revenues, operating costs and expenses and financial revenues and expenses, among others, the inclusion of certain subtotals, such as operating earnings before other expenses, net, and the display of such income statement varies significantly by industry and company according to specific needs. Our Operating EBITDA may not be comparable to similarly titled measures reported by other companies due to potential differences in the method of calculation. Operating EBITDA is reconciled below to operating earnings before other expenses, net, as reported in the income statements, and to net cash flows provided by operating activities before financial expense, coupons on Perpetual Debentures (as defined below) and income taxes, as reported in the statement of cash flows. Financial expense under IFRS does not include coupon payments of the Perpetual Debentures issued by consolidated entities of Ps507 million in 2016, Ps482 million in 2017 and Ps553 million in 2018, as described in note 20.4 to our audited consolidated financial statements included in the February 28 6-K. |
5
| For the Year Ended December 31, | ||||||||||||
| 2016 | 2017 | 2018 | ||||||||||
| (in millions of Mexican Pesos) | ||||||||||||
| Reconciliation of Operating EBITDA to net cash flows provided by operations activities from continuing operations before financial expense, coupons on Perpetual Debentures and income taxes |
||||||||||||
| Operating EBITDA |
Ps | 51,605 | Ps | 48,600 | Ps | 49,266 | ||||||
| Less: |
||||||||||||
| Depreciation and amortization expense |
15,987 | 15,988 | 16,070 | |||||||||
|
|
|
|
|
|
|
|
|
| ||||
| Operating earnings before other expenses, net |
35,618 | 32,612 | 33,196 | |||||||||
|
|
|
|
|
|
|
|
|
| ||||
| Plus/minus: |
||||||||||||
| Changes in working capital excluding income taxes |
11,017 | 8,039 | (1,062 | ) | ||||||||
| Depreciation and amortization expense |
15,987 | 15,988 | 16,070 | |||||||||
| Other items, net |
(1,280 | ) | (5,219 | ) | (4,888 | ) | ||||||
|
|
|
|
|
|
|
|
|
| ||||
| Net cash flow provided by operations activities from continuing operations before financial expense, coupons on Perpetual Debentures and income taxes |
Ps | 61,342 | Ps | 51,420 | Ps | 43,316 | ||||||
|
|
|
|
|
|
|
|
|
| ||||
RECENT DEVELOPMENTS
Recent Developments Relating to Our Assets Divestiture Plans
On February 20, 2019, CEMEX, S.A.B. de C.V. announced that it had signed an agreement for the sale of assets in the Baltics and Nordics to the German building materials group SCHWENK, for approximately €340 million. As of the date of this report, we expect for this transaction to close prior to March 31, 2019.
Recent Developments Relating to Our Shareholders
CEMEX, S.A.B. de C.V. to hold its Ordinary and Extraordinary General Shareholders’ Meeting on March 28, 2019
On February 28, 2019, CEMEX, S.A.B. de C.V. announced that it will hold its ordinary general shareholders’ meeting followed by its extraordinary general shareholders’ meeting on March 28, 2019. The agenda for the ordinary general shareholders’ meeting includes the approvals of (i) the Chairman of the Board of Directors’ report; (ii) the Chief Executive Officer’s report; (iii) the Board of Directors’ report; (iv) the Board of Directors’ opinion to the Chief Executive Officer’s report; (v) the audit committee’s report; (vi) the corporate practices and finance committee’s report; (vii) the accounting policies and guidelines report; (viii) the report on the revision of the tax situation; (ix) the proposal for allocation of profits (which includes the proposal to have CEMEX, S.A.B. de C.V. declare a cash dividend of U.S.$150 million payable in two equal installments in June and December of 2019); (x) the report to the Board of Directors on the procedures and agreements in which the repurchase program was instructed; (xi) the proposal for reserve for acquisition of shares (which includes the proposal to set the amount of U.S.$500 million, or its equivalent in Mexican Pesos, as the maximum amount of resources for the fiscal year of 2019 (and until the next general ordinary shareholders meeting of CEMEX, S.A.B. de C.V. is held) that CEMEX, S.A.B. de C.V. can use to purchase its own shares or securities that represent such shares); (xii) the proposal for changes in capital stock; (xiii) the proposal for composition of the Board of Directors and its committees (which includes the proposal to have Isabel Maria Aguilera Navarro appointed to CEMEX, S.A.B. de C.V.’s Board of Directors), as well as their compensation; and (xiv) the proposal for president, secretary and alternate secretary of the Board of Directors and its committees. The agenda for the extraordinary general shareholders’ meeting includes the approvals of (i) the proposal for CEMEX, S.A.B. de C.V. to enter into a merger deed as the surviving company in the context of mergers among our subsidiaries, including CEMEX México, S.A. de C.V. (“CEMEX México”); and (ii) the proposal to amend Articles 2 and 28 of CEMEX, S.A.B. de C.V.’s by-laws (which includes the proposal to restate the by-laws).
Recent Developments Relating to Our Board of Directors and Senior Management
Effective February 1, 2019, (i) Juan Romero Torres, then President of CEMEX México, was appointed Executive Vice President of Global Commercial Development; (ii) Ricardo Naya Barba, then President of CEMEX Colombia, S.A. (“CEMEX Colombia”), was appointed President of CEMEX México; (iii) Jaime Gerardo Elizondo Chapa, then President of CEMEX Europe, was appointed Executive Vice President of Global Supply Chain Development; and (iv) Sergio Mauricio Menendez Medina, then Distribution Channel Vice President for CEMEX México, was appointed President of CEMEX Europe.
6
Recent Development Relating to the 2017 Credit Agreement
We are currently seeking to amend the 2017 Credit Agreement (as defined below) in order to, among other things, (i) extend each of the July 2020 and January 2021 repayment installments by three years; (ii) delay the scheduled tightening of the consolidated financial leverage ratio limit by one year; and (iii) make adjustments for the implementation of IFRS 16 – Leases. As of the date of this report, the implementation of IFRS 16 does not breach the 2017 Credit Agreement. Although we believe we have good relations with our lenders and have successfully sought amendments in the past, we cannot assure you that the lenders under the 2017 Credit Agreement will consent to these or any other amendments, or as to what the final terms of any such amendments will be.
Recent Developments relating to our Regulatory Matters and Legal Proceedings
In connection with the ongoing proceedings related to the rejection by the Colombian Tax Authority of certain deductions taken by CEMEX Colombia in its 2012 year-end income tax return, CEMEX Colombia has appealed the Colombian Tax Authority’s decision. The Colombian Tax Authority has a year to respond to this appeal. See “Regulatory Matters and Legal Proceedings—Tax Matters—Colombia.”
In connection with the ongoing matters related to the IPPC Permit (as defined below) for part of our operations in Croatia, on February 6, 2019, CEMEX Croatia was provided with the High Administrative Courts’ decision, dated as of December 13, 2018, on a previously filed appeal. The High Administrative Court ruled in favor of CEMEX Croatia, whereby it (i) overruled the annulment of the IPPC Permit (restating the IPPC Permit); and (ii) rejected the claim of the City of Kastela. The High Administrative Court’s decision is final. See “Regulatory Matters and Legal Proceedings—Environmental Matters—Croatia.”
As of March 9, 2019, with respect to tariffs on imports of cement, clinker, slag cement and granulated slag into the United States from China and the increase of the existing tariffs that was scheduled to take place in early March of 2019, the decision to increase the tariffs has been delayed by the U.S. Government and no increase has been announced.
RISK FACTORS
We are subject to various risks mainly resulting from changing economic, environmental, political, industry, business, regulatory, financial and climate conditions, as well as risks related to ongoing legal proceedings and investigations. The following risk factors are not the only risks we face, and any of the risk factors described below could significantly and adversely affect our business, results of operations or financial condition.
Risks Relating to Our Business
Economic conditions in some of the countries where we operate and in other regions or countries may adversely affect our business, financial condition and results of operations.
The economic conditions in some of the countries where we operate have had and may continue to have a material adverse effect on our business, financial condition and results throughout our operations worldwide. Our results of operations are highly dependent on the results of our business. Accordingly, the economic conditions in some of the countries where we operate have had and may continue to have a material adverse effect on our business, financial condition and results throughout our operations worldwide.
As of December 31, 2018, we mostly had operations in Mexico, the United States, the United Kingdom, France, Germany, Spain, the Czech Republic, the Rest of Europe, Colombia, Panama, Costa Rica, Caribbean TCL, the Dominican Republic, the Rest of South, Central America and the Caribbean, the Philippines, Egypt, Israel and the Rest of Asia, Middle East and Africa (as described in “Business” below).
For a geographic breakdown of our revenues for the year ended December 31, 2018, see “CEMEX—Geographic Breakdown of Revenues for the Year Ended December 31, 2018.”
7
While upside and downside risks to the short-term global economic growth outlook seem to be broadly balanced, we believe the scenario is not risk free. We believe that as of the date of this report, the possible main downside concerns include risks of slowing global economic growth, particularly due to a shift toward protectionist policies in a context of growing trade tensions between the United States and China; a possibly sharp tightening of financial conditions and its impact on the global economy, highly indebted European countries, emerging markets, risk aversion, foreign exchange markets, volatility and financial markets; economic vulnerability of emerging market economies; elections in some Latin American countries and the newly formed governments; economic and political uncertainties in Europe; China’s economic performance; political uncertainty in the United States; and geopolitical risks in the Middle East and other regions experiencing political turmoil, including the current situation in Syria. The materialization of any of these concerns may have a material adverse effect on our business, financial condition and results of operations worldwide.
The cycle of trade restrictions and retaliation between the United States and China has weakened global trade and created global economic uncertainty and financial volatility. A worsening of trade conditions resulting from negotiations between the United States and China and the imposition of broader barriers to cross-border trade could not only have a direct impact on trade and investment but also on global economic growth and financial conditions.
The equity market correction in March 2018 following the U.S. tariff announcement on steel and aluminum and a range of Chinese products, as well as the announcement by China of retaliatory tariffs on imports from the U.S., are examples showing that asset prices can correct rapidly and trigger potentially disruptive portfolio adjustments. Financial conditions that exist of the date of this report could tighten sharply and expose vulnerabilities that have accumulated over the years, with potential adverse repercussions for economic growth. High asset valuations, both in emerging and advanced economies, and very compressed term premiums raise the possibility of a financial market correction, which could dampen growth and confidence.
The U.S. Federal Reserve System has increased short-term interest rates at a measured pace since December 2015. There is a risk that further interest rate hikes could cause Dollar appreciation, a manufacturing slowdown and economic deceleration on the back of a slower housing investment. However, a slower than warranted pace of increase in interest rates could result in inflation acceleration and the disanchoring of inflation expectations, possibly leading to swift monetary policy tightening and a potential recession in the U.S. The recently legislated tax code overhaul could further increase the persistent fiscal deficits and unsustainable debt dynamics over the next five years. Also, the current account deficit could increase given the projected impact of the fiscal stimulus on domestic demand in the U.S. High fiscal and current account deficits could affect both economic activity and exchange rates. The U.S. housing sector supply constraints, associated in part with labor shortages, could result in a slower pace of growth in housing starts in the U.S.
In the U.S., renewed federal budget disputes could lead to lesser than Fast Act-authorization spending levels for highways and streets. Global market volatility and uncertainty surrounding U.S. trade, such as imposing tariffs on Chinese products coming into the U.S., geopolitical concerns and immigration policy, could undermine consumer confidence and investment prospects in the U.S. In all, these uncertainties can have a material adverse impact not only on our financial condition, business and results of operations in the U.S., but also on our operations worldwide.
Many emerging market economies have gone through bouts of financial volatility over the past few years. Some large commodity exporters and other stressed economies also weathered substantial exchange rate movements. Though it proved short-lived for most countries, many countries in this group remain vulnerable to sudden shifts in global market sentiment. There is a risk of new episodes of market volatility, increased risk aversion and capital outflows from emerging markets, which could cause emerging markets currencies to further depreciate. The high level of U.S. Dollar denominated corporate indebtedness in emerging markets constitutes an additional source of instability. Emerging markets would face higher global risk premiums and substantial capital outflows, putting particular pressure on economies with domestic debt imbalances. The risk of contagion effect across emerging markets could be significant and have an adverse effect to our business.
In Mexico, the Mexican Central Bank recently cautioned about slowing economic growth for 2019 and for the first quarter of 2019. Slower economic growth in Mexico can have an adverse effect on demand for our products. Also, any deterioration in the growth perspectives of the U.S. or in the global financial conditions and risk perception could negatively affect Mexico. The USMCA, which is the result of the renegotiation of NAFTA, and
8
which is intended to supersede NAFTA, has already been executed but not ratified by all signatories, which is the reason why it is not yet in full force and effect. A failure to ratify the USMCA has the potential to erode Mexico’s access to the United States’ domestic market and could negatively affect investment, development and growth, foreign exchange rates and confidence in Mexico. Other risks that could negatively affect Mexico, include the inflation rate’s failure to decelerate towards the Central Bank of Mexico’s target range, continued decline in oil production in Mexico, manufacturing production not reacting positively to a global manufacturing boost, a contraction of the construction industry and higher than expected domestic demand deceleration for products in our industry.
As a result of a general election in Mexico that took place in 2018, a new federal government and chambers of the Mexican National Congress has been installed. As is the case in any change in administration, there is uncertainty regarding the impact of this new government’s economic and public policies and the impact any policies could have on the economy of Mexico, including on the Mexican Peso on the foreign exchange markets and in attracting or maintaining foreign investment in Mexico, which could affect our overall operations in Mexico and our results of operations, liquidity and financial position.
In China, the reliance on stimulus measures to maintain high rates of growth continues. External triggers, such as a shift toward protectionism in advanced economies or domestic shocks, could lead to a broader tightening of financial conditions in China, possibly exacerbated by capital outflow pressures, with an adverse impact on demand and output. Regulators in China have also taken important measures to reduce shadow banking and bring financial activity back onto bank balance sheets; however, when taking into consideration that total credit growth, particularly in the private sector, remains high, efforts to reform the financial sector are likely to stagnate until trade disputes are resolved. The consequences for emerging market economies of weaker economic performance and increased policy uncertainty in China could be significant and could affect our results of operations, liquidity and financial position.
In Colombia, the correction of macroeconomic imbalances, such as inflation, is making progress, but still needs to advance further and could be pressured by recent minimum wage increases. Consumer and producer expectations are gradually recovering. Supported by increased oil prices, economic activity is expected to improve slightly from the low levels seen in recent years; however, a reduction may affect future growth, which in turn could affect our results of operations in Colombia. Civil works investment, mainly with private financing, could be lower than anticipated, especially if additional sources of financing are not secured. The new government has also passed a fiscal reform plan that is expected to reduce the fiscal deficit; however, this too could be affected if oil prices fall. Migrant inflows coming from Venezuela are also likely to present challenges for the government.
In Nicaragua, what started as protests against social security reform in April 2018 has turned into calls for President Daniel Ortega’s ousting. Continued anti-government protests have resulted in regular outbreaks of violence, which have had and may continue to have a major negative impact on the economic activity of Nicaragua. In December of 2018, the President of the United States signed the Nicaragua Investment Conditionality Act (NICA), which could place conditions on foreign aid and financing to Nicaragua. In the same month, the Organization of American States (OAS) activated a legal proceeding that could lead to imposing sanctions on Nicaragua or suspending the country from the OAS. Prolonged social instability and political crisis in Nicaragua could cause a severe economic downturn and negatively affect our operations and results of operations in Nicaragua.
In Europe, the environment of negative deposit rates is distorting financial markets and creates uncertain consequences for the banking sector. There is a risk that negative rates would erode bank profitability and curb lending across Eurozone borders, creating other systemic risks to European economies. The economic activity in the Eurozone European Central Bank (ECB) is expected to continue decelerating after its peak in 2017. There is a risk that the European Central Bank will finish its easing policy too early. Uncertainty about the Euro’s performance remains, which could affect our operations in European Union member states, which could adversely affect our results of operations, liquidity and financial position.
The Eurozone’s economic growth and European integration are challenged by a number of uncertainties, including, but not limited to, delays in implementing the needed structural reforms in some European countries; uncertainty regarding the profitability of the European banking system in general and the Italian banking sector in
9
particular; the process of United Kingdom’s exit from the EU and Poland’s conflict with EU institutions due to its judicial reform. Further, the renewed popularity of nationalistic policies in Europe is another aftereffect of the financial crisis and its prolonged aftermath. All these factors could impact market confidence and could limit the benefit of the economic tailwinds and monetary policy stimulus for Europe and possibly worldwide, which in turn could adversely affect our results of operations, liquidity and financial position.
The United Kingdom’s expected departure from the European Union, and the uncertainty surrounding this process and the future relationship between them, is already having an impact on economic activity and financial conditions. The economy exhibited signals of a deceleration at the end of 2018, with business investment, consumer confidence and fixed investment growth showing signs of pessimism. A UK departure from the EU without a clear agreement governing their economic relationship not only has the potential to significantly disrupt trade relations and border management but also to affect the operations of broad sections of the UK economy, such as financial services companies, manufacturing and their supply chains, and aviation. The overall economic impact of the process surrounding the UK’s departure from the EU, which could increase in severity in the absence of a clear framework detailing the future relationship between the two, has the potential to impact our business conditions and the results of our operations in the United Kingdom.
In Spain, the Catalan region conflict resulted in social unrest, and although it seems to have a transitory impact in the local economy, an escalation of the conflict could affect the Spanish economy and performance of the construction sector. Alternatively, given that the Spanish national government is led by a minority in the parliament, depending on smaller parties, policy stagnation is likely to continue until the next election is held; although early elections cannot be ruled out. These factors could adversely affect our operations and results of operations in Spain.
Significant trade links with Western Europe render some of the Eastern European countries susceptible to economic and political pressures from Western Europe. Labor shortages in Central European countries are expected to become more acute, which could undercut competitiveness in the region. Additionally, Central European countries might experience a reduction in the proceeds they receive from the European Union’s structural funds over the coming years, which could hinder infrastructure investment in such countries and adversely affect our European operations and results of operations.
In the Middle East, political risk could impact economic growth and adversely affect construction investments. The U.S.’s recognition of Jerusalem as Israel’s capital has increased tensions between Israelis and Palestinians. The conflict between Israel and Palestine continues to generate instability and the overall situation in Syria could worsen. Any escalation of this conflict or social unrest in this region may affect our operations and results of operations in the region.
In Egypt, we cannot be certain if the new government that was elected in 2018 will continue to successfully implement the reforms needed to bring political and economic stability to the country. Any premature easing of monetary policy before inflation expectations are fully anchored, or opposition to reforms by vested interests, could undermine stabilization efforts in Egypt. External risks relate to a worsening of the security situation that could slow the recovery of tourism, a sustained rise of global oil prices, lower growth in Egypt’s main trading partners, or unexpected tightening of global financial conditions cannot be ruled out. If any materialize, it could adversely affect our operations and results of operations in Egypt.
In the Philippines, there are some factors, such as increased inflation over the past year, which has prompted interest rate increases, or a potential worsening of the security situation in Mindanao, that could adversely affect the country’s economy. The current government’s foreign policy and the potential change in the constitution towards federalism could have a negative political effect on the country. Such a change could jeopardize the country’s infrastructure development plan and eventually affect its economic growth, which would adversely affect our business and results of operations in the country.
In general, demand for our products and services is strongly related to construction levels and depends, in large part, on residential and commercial construction activity, as well as private and public infrastructure spending in almost all of the countries where we operate. Public and private infrastructure spending in countries dependent on revenue generated by the energy sector is exposed to decreases in energy prices. Therefore, decreases in energy prices could affect public and private infrastructure spending which, in turn, could affect the construction industry.
10
Declines in the construction industry are usually correlated with declines in general economic conditions. As a result, deterioration in economic conditions in the countries where we operate could have a material adverse effect on our business, financial condition and results of operations. In addition, we cannot assure you that growth in the gross domestic product of the countries where we operate will translate into a correlated increase in demand for our products.
We are subject to the effects of general global economic and market conditions that are beyond our control. If these conditions remain challenging or deteriorating, our business, financial condition and results of operations could be adversely affected. Possible consequences from macroeconomic global challenges could have an adverse impact on our business, financial condition and results of operations.
Political and social events and possible changes in governmental policies in some of the countries where we operate could have a material adverse effect on our business, financial condition and results of operations.
In recent years, some of the governments in the countries where we operate, such as in the United States, have implemented and may continue to implement significant changes in laws, public policy or regulations that could affect the political, economic and social conditions in the countries where we operate, as well as in other countries. Any such changes may have a material adverse effect on our business, financial condition and results of operations.
Furthermore, presidential, legislative, state and local elections have taken place or are scheduled to take place in 2019 in several of the countries where we operate, including El Salvador, Panama, the Philippines, Guatemala, Israel and Poland, as well as the elections for the European Parliament. For these countries, as is mostly the case when there is a change in governments, a change in federal government and the political party in control of the legislature could result in sharp changes to the countries’ economic, political or social conditions, and in changes in laws, regulations and public policies, which may contribute to economic uncertainty and could also materially impact our business, financial condition and results of operations. Similarly, if no political party wins a clear majority in the legislative bodies of these countries, legislative gridlock and political and economic uncertainty may occur.
We cannot assure you that political or social developments in the countries where we operate or elsewhere, such as the election of new administrations, changes in laws, public policy or regulations, political disagreements, civil disturbances and the rise in violence and perception of violence, will not have a corresponding material adverse effect on global financial markets, or on our business, financial condition and results of operations.
The 2017 Credit Agreement contains several restrictions and covenants. Our failure to comply with such restrictions and covenants could have a material adverse effect on our business and financial conditions.
The 2017 Credit Agreement requires us to comply with several financial ratios and tests, including (i) a minimum consolidated coverage ratio of EBITDA to interest expense (including interest accrued on Perpetual Debentures and cash payments on preferred stock) and (ii) a maximum consolidated leverage ratio of total debt (including Perpetual Debentures and guarantees, excluding convertible/exchangeable obligations, the principal amount of subordinated optional convertible securities and finance leases and plus or minus the mark-to-market amount of derivative financial instruments, among other adjustments) to EBITDA (in each case, as described in the 2017 Credit Agreement). The calculation and formulation of EBITDA, interest expense, total debt, the consolidated coverage ratio and the consolidated leverage ratio are set out in the 2017 Credit Agreement and may differ from the calculation and/or formulation of analogous terms in this report. Our ability to comply with these ratios may be affected by economic conditions and volatility in foreign exchange rates, by overall conditions in the financial and capital markets and the construction sector, and by any monetary penalties or fines we may have to pay as a result of any administrative or legal proceedings to which we may be exposed to. See “Regulatory Matters and Legal Proceedings” for more information on our regulatory matters and legal proceedings. The 2017 Credit Agreement requires us to comply with a minimum consolidated coverage ratio of EBITDA to interest expense (including interest accrued on Perpetual Debentures and cash payments on preferred stock), for the following periods, measured quarterly, of not less than (i) 2.50:1 for each 12-month period ending on December 31, 2018, March 31, 2019, June 30, 2019, September 30, 2019, December 31, 2019 and March 31, 2020 and (ii) 2.75:1 for the 12-month period ending on June 30, 2020 and on each subsequent quarterly date. In addition, the 2017 Credit Agreement
11
requires us to comply with a maximum consolidated leverage ratio of total debt (including Perpetual Debentures and guarantees, excluding convertible / exchangeable obligations, the principal amount of subordinated optional convertible securities and finance leases and plus or minus the fair value of derivative financial instruments, among other adjustments) to EBITDA for the following periods, measured quarterly, not to exceed (i) 4.75:1 for the 12-month period ending December 31, 2018 and the 12-month period ending March 31, 2019, (ii) 4.50:1 for each 12-month period ending June 30, 2019, September 30, 2019, December 31, 2019 and March 31, 2020 and (iii) 4.25:1 for the 12-month period ending June 30, 2020 and on each subsequent quarterly date. For the period ended December 31, 2018, we reported to the lenders under the 2017 Credit Agreement a consolidated coverage ratio of 4.41 and a consolidated leverage ratio of 3.84, each as calculated pursuant to the 2017 Credit Agreement. See “Results of Operations—Liquidity and Capital Resources—Our Indebtedness.”
Pursuant to the 2017 Credit Agreement, we are limited in relation to making aggregate annual capital expenditures in excess of U.S.$1 billion in any financial year (excluding certain capital expenditures, joint venture investments and acquisitions to be made by each of CEMEX Latam Holdings, S.A. (“CLH”) and/or CEMEX Holdings Philippines, Inc. (“CHP”) and their respective subsidiaries, and those funded by Relevant Proceeds (as defined in the 2017 Credit Agreement)), which capital expenditures, joint venture investments and acquisitions at any time then incurred are subject to a separate aggregate limit of (a) U.S.$500 million (or its equivalent) for CLH and its subsidiaries and (b) U.S. $500 million (or its equivalent) for CHP and its subsidiaries. In addition, in each case, the amounts of which we and our subsidiaries are allowed for permitted acquisitions and investments in joint ventures cannot exceed certain thresholds as set out in the 2017 Credit Agreement.
We are also subject to a number of negative covenants under the 2017 Credit Agreement that, among other things, restrict or limit (subject to certain exceptions) our ability and the ability of each obligor (as defined in the 2017 Credit Agreement) to: (i) create liens, (ii) incur additional debt, (iii) change our business or the business of any obligor (as defined in the 2017 Credit Agreement, taken as a whole), (iv) enter into mergers, (v) enter into agreements that restrict our subsidiaries’ ability to pay dividends or repay intercompany debt, (vi) acquire assets, (vii) enter into or invest in joint venture agreements, (viii) dispose of certain assets, (ix) grant additional guarantees or indemnities, (x) declare or pay cash dividends or make share redemptions, and (xi) enter into certain derivatives transactions.
The 2017 Credit Agreement also contains a number of affirmative covenants that, among other things, require us to provide periodic financial information to our creditors. Pursuant to the 2017 Credit Agreement, a number of covenants and restrictions will, if CEMEX so elects, cease to apply (including the capital expenditure limitations mentioned above) or become less restrictive if (i) our consolidated leverage ratio for the two most recently completed quarterly testing periods is less than 3.75:1; or, for the three most recently completed quarterly testing periods, our consolidated leverage ratio for the first and third of those quarterly testing periods is 3.75:1 or less and in the second quarterly testing period would have been 3.75:1 or less but for the proceeds of certain permitted financial indebtedness being included in the calculation of debt and (ii) no default under the 2017 Credit Agreement is continuing. At that point, the existing consolidated coverage ratio and consolidated leverage ratio tests will be replaced by a requirement that the consolidated leverage ratio must not exceed 4.25:1 and consolidated coverage ratio must not be less than 2.75:1. However, we cannot assure you that we will be able to meet the conditions for these restrictions to cease to apply prior to the final maturity date under the 2017 Credit Agreement.
The 2017 Credit Agreement contains events of default, some of which may occur and are outside of our control. Such events of default include defaults (subject to certain exceptions) and grace periods, based on (i) non-payment, (ii) material inaccuracy of representations and warranties, (iii) breach of covenants, (iv) bankruptcy (quiebra) or insolvency (concurso mercantil) of CEMEX, S.A.B. de C.V., any other obligor under the 2017 Credit Agreement or any other of our material subsidiaries (as defined in the 2017 Credit Agreement), (v) inability to pay debts as they fall due or by reason of actual financial difficulties, suspension or threatened suspension of payments on debts exceeding U.S.$50 million or commencement of negotiations to reschedule debt exceeding U.S.$50 million, (vi) a cross-default in relation to financial indebtedness in excess of U.S.$50 million, (vii) certain changes to the ownership of any of the obligors under the 2017 Credit Agreement, (viii) enforcement of any security against an obligor or material subsidiary, (ix) any attachment, distress or execution affects any asset of an obligor or material subsidiary which is reasonably likely to cause a material adverse effect, (x) restrictions not in effect on July 19, 2017 are imposed that limit the ability of obligors to transfer foreign exchange for purposes of performing material obligations under the 2017 Credit Agreement, (xi) any material adverse change arising in the financial
12
condition of CEMEX, which creditors representing two thirds or more of the total commitments under the 2017 Credit Agreement determine would result in our failure, taken as a whole, to perform payment obligations under the 2017 Credit Agreement, and (xii) it becomes unlawful for us to comply with our obligations under the 2017 Credit Agreement where non-performance is reasonably likely to cause a material adverse effect. If an event of default occurs and is continuing, upon the authorization of creditors representing two thirds or more of the total commitments under the 2017 Credit Agreement, the agent has the ability to accelerate all outstanding amounts due under the 2017 Credit Agreement. Acceleration is automatic in the case of insolvency.
We cannot assure you that in the future we will be able to comply with the restrictive covenants and limitations contained in the 2017 Credit Agreement. Our failure to comply with such covenants and limitations could result in an event of default, which could materially and adversely affect our business, financial condition and results of operations.
Changes to, or Replacement of the LIBOR Benchmark Interest Rate, Could Adversely Affect Our Business, Financial Condition and Results of Operations.
In July 2017, the United Kingdom’s Financial Conduct Authority (“FCA”), a regulator of financial services firms and financial markets in the U.K., stated that they will plan for a phase out of regulatory oversight of LIBOR interest rate indices. The FCA has indicated they will support the LIBOR indices through 2021 to allow for an orderly transition to an alternative reference rate. LIBOR indices, in particular the U.S. Dollar LIBOR, are commonly used as a benchmark for our financing agreements and derivatives, which systematically catalogue relevant LIBOR provisions, including uniform trigger provisions intended to identify a test for when LIBOR no longer governs the agreement and/or uniform fallback provisions intended to identify an alternative reference rate, or there may be vast, or slight, differences in those provisions. It is uncertain at this time whether LIBOR will change or cease to exist or the extent to which those entering into financial agreements will transition to any other particular benchmark. Other benchmarks may perform differently than LIBOR or have other consequences that cannot currently be anticipated. A transition away from and/or changes to LIBOR benchmark interest rate could adversely affect our business, financial condition, and results of operations.
We pledged the capital stock of some of our subsidiaries that represent substantially all of our business as collateral to secure our payment obligations under the 2017 Credit Agreement, the indentures governing our outstanding Senior Secured Notes and other financing arrangements.
In connection with the 2017 Credit Agreement, we pledged under pledge agreements or transferred to trustees under a security trust, substantially all the shares of CEMEX México, Cemex Operaciones México, S.A. de C.V. (“Cemex Operaciones México”), CEMEX TRADEMARKS HOLDING Ltd. (“CTH”), New Sunward Holding B.V. (“New Sunward”) and CEMEX España, S.A. (“CEMEX España”), as collateral (together, the “Collateral”), and all proceeds of the Collateral, to secure our obligations under the 2017 Credit Agreement, our 4.375% Senior Secured Notes due 2023 (the “March 2023 Euro Notes”), 6.000% U.S. Dollar-Denominated Senior Secured Notes due 2024 (the “April 2024 U.S. Dollar Notes”), 4.625% Senior Secured Notes due 2024 denominated in Euros (the “June 2024 Euro Notes”), 5.700% Senior Secured Notes due 2025 (the “January 2025 U.S. Dollar Notes”), 6.125% Senior Secured Notes due 2025 (the “May 2025 U.S. Dollar Notes”), 7.75% Senior Secured Notes due 2026 (the “April 2026 U.S. Dollar Notes”) and 2.750% Euro-Denominated Senior Secured Notes due 2024 (the “December 2024 Euro Notes”) (collectively and including other series of senior secured notes issued by CEMEX, S.A.B. de C.V. or CEMEX Finance LLC (“CEMEX Finance”) outstanding at a given time, the “Senior Secured Notes”) and under a number of other financing arrangements for the benefit of the creditors and holders of debt and other obligations that benefit from provisions in their agreements or instruments requiring that their obligations be equally and ratably secured.
As of December 31, 2018, the Collateral and all proceeds of such Collateral secured (i) Ps172,617 million (U.S.$8,785 million) (principal amount Ps173,948 million (U.S.$8,852 million)) aggregate principal amount of debt under the 2017 Credit Agreement, our Senior Secured Notes and other financing arrangements and (ii) Ps8,729 million (U.S.$444 million) aggregate principal amount of Perpetual Debentures. These subsidiaries whose shares are part of the Collateral collectively own, directly or indirectly, substantially all of our operations worldwide. Provided that no default has occurred which is continuing under the 2017 Credit Agreement, the Collateral will be released automatically if we meet specified financial covenant targets in accordance with the terms
13
of the intercreditor agreement, dated September 17, 2012 among CEMEX, S.A.B. de C.V. and certain of its subsidiaries named therein, Citibank Europe PLC, UK Branch (formerly Citibank International plc), as facility agent, the financial institutions, noteholders and other entities named therein and Wilmington Trust (London) Limited, as security agent, as amended by an amendment agreement, dated October 31, 2014, and as amended and restated by an amendment and restatement agreement dated on or about July 23, 2015 and an amendment and restatement agreement dated July 19, 2017 (the “Intercreditor Agreement”).
We have a substantial amount of debt and other financial obligations maturing in the next several years. If we are unable to secure refinancing on favorable terms or at all, we may not be able to comply with our upcoming payment obligations. Our ability to comply with our principal maturities and financial covenants may depend on us implementing certain initiatives, which may include making asset sales, and there is no assurance that we will be able to implement any such initiatives or execute such sales, if needed, on terms favorable to us or at all.
As of December 31, 2018, our total debt plus other financial obligations were Ps 207,724 million (U.S.$10,571 million) (principal amount Ps209,153 million (U.S.$10,664 million)), which does not include Ps8,729 million (U.S.$444 million), which represents the nominal amount of Perpetual Debentures. Of such total debt plus other financial obligations amount, Ps 13,623 million (U.S.$ 693 million) (principal amount Ps13,605 million (U.S.$692 million)) matures during 2019; Ps22,530 million (U.S.$1,147 million) (principal amount Ps22,672 million (U.S.$1,154 million)) matures during 2020; Ps24,254 million (U.S.$1,234 million) (principal amount Ps24,254 million (U.S.$1,234 million)) matures during 2021; Ps30,524 million (U.S.$1,553 million) (principal amount Ps31,104 million (U.S.$1,583 million)) matures during 2022; and Ps116,794 million (U.S.$5,944 million) (principal amount Ps117,518 million (U.S.$5,981 million)) matures after 2022.
If we are unable to comply with our principal maturities under certain of our indebtedness, or refinance or extend maturities of certain of our indebtedness, substantially all of our debt could be accelerated. Acceleration of our debt would have a material adverse effect on our business, financial condition and results of operations. As a result of the restrictions under the 2017 Credit Agreement, the indentures that govern our outstanding Senior Secured Notes and other debt instruments, the current global economic environment and uncertain market conditions, we may not be able to, if we need to do so to repay our indebtedness, complete asset sales on terms that we find economically attractive or at all. Volatility in the credit and capital markets could significantly affect us due to its effect on the availability of funds to potential acquiring parties, including industry peers. In addition, high levels of consolidation in our industry in some jurisdictions may further limit potential assets sales to interested parties due to antitrust considerations. If we need to sell assets to repay our indebtedness but are unable to complete asset sales and our cash flow or capital resources prove inadequate, we could face liquidity problems and may not be able to comply with financial covenants and payment obligations under our indebtedness, which would have a material adverse effect on our business, financial condition and results of operations.
In addition, our levels of debt, contractual restrictions and our need to deleverage may limit our planning flexibility and our ability to react to changes in our business and the industry, and may place us at a competitive disadvantage compared to competitors who may have no need to deleverage or who may have lower leverage ratios and fewer contractual restrictions. There can also be no assurance that, because of our leverage ratio and contractual restrictions, we will be able to maintain our operating margins and deliver financial results comparable to the results obtained in the past under similar economic conditions. Also, there can be no assurance that we will be able to implement our business strategy and improve our results and sales, which could affect our ability to comply with our payment obligations under our debt agreements and instruments.
We may not be able to generate sufficient cash to service all of our indebtedness or satisfy our short-term liquidity needs, and we may be forced to take other actions to satisfy our obligations under our indebtedness and our short-term liquidity needs, which may not be successful.
Historically, we have addressed our liquidity needs, including funds required to make scheduled principal and interest payments, refinance debt, and fund working capital and planned capital expenditures, with operating cash flow, borrowings under credit facilities and receivables and inventory financing facilities, proceeds of debt and equity offerings and proceeds from asset sales.
14
As of December 31, 2018, we had U.S.$599 million funded under our securitization programs in Mexico, the United States, France and the United Kingdom. We cannot assure you that, going forward, we will be able to, if needed, roll over or renew these programs, which could adversely affect our liquidity.
The weakness of the global economic environment and its adverse effects on our operating results may negatively affect our credit rating and the market value of CEMEX, S.A.B. de C.V.’s CPOs and American Depositary Shares (“ADSs”). If current economic pressures continue or worsen, we may be dependent on the issuance of equity as a source to repay our existing indebtedness. Although we have been able to raise debt, equity and equity-linked capital in the recent past, conditions in the capital markets could be such that traditional sources of capital may not be available to us on reasonable terms or at all. As a result, we cannot assure you that we will be able to successfully raise additional debt and/or equity capital on terms that are favorable to us or at all.
We have historically, when needed, sought and obtained waivers and amendments to several of our debt instruments relating to a number of financial ratios. Our ability to comply with these ratios could be affected by global economic conditions and volatility in foreign exchange rates and the financial and capital markets, among other factors. If necessary, we may need to seek waivers or amendments to one or more of our debt agreement or debt instruments in the future. However, we cannot assure you that any future waivers or amendments, if requested, will be obtained. If we are unable to comply with the provisions of our debt agreements or debt instruments, and are unable to obtain a waiver or amendment, the indebtedness outstanding under such debt agreement and/or instruments could be accelerated. Acceleration of these debt agreements and/or instruments would have a material adverse effect on our business and financial condition.
If the global economic environment deteriorates and our operating results worsen significantly, if we are unable to complete debt or equity offerings or, if needed, any divestitures and/or our cash flow or capital resources prove inadequate, we could face liquidity problems and may not be able to comply with our principal payments under our indebtedness or refinance our indebtedness.
The indentures governing our outstanding Senior Secured Notes and the terms of our other indebtedness impose significant operating and financial restrictions, which may prevent us from capitalizing on business opportunities and may impede our ability to refinance our debt and the debt of our subsidiaries.
As of December 31, 2018, there were U.S.$3,779 million and €1,600 million aggregate principal amount of then-outstanding Senior Secured Notes outstanding under the indentures governing such notes. Mostly all of the indentures governing our outstanding Senior Secured Notes and the other instruments governing our consolidated indebtedness impose significant operating and financial restrictions on us. These restrictions will limit our ability, among other things, to: (i) incur debt; (ii) pay dividends on stock; (iii) redeem stock or redeem subordinated debt; (iv) make investments; (v) sell assets, including capital stock of subsidiaries; (vi) guarantee indebtedness; (vii) enter into agreements that restrict dividends or other distributions from restricted subsidiaries; (viii) enter into transactions with affiliates; (ix) create or assume liens; (x) engage in mergers or consolidations; and (xi) enter into a sale of all or substantially all of our assets.
These restrictions could limit our ability to seize attractive growth opportunities for our businesses that are currently unforeseeable, particularly if we are unable to incur financing or make investments to take advantage of these opportunities.
These restrictions may significantly impede our ability to develop and implement refinancing plans in respect of our debt.
Most of the covenants are subject to a number of important exceptions and qualifications. The breach of any of these covenants could result in a default under the indentures governing our outstanding Senior Secured Notes, as well as certain other existing debt obligations, as a result of the cross-default provisions contained in the instruments governing such debt obligations. In the event of a default under any of the indentures governing our outstanding Senior Secured Notes, holders of our outstanding Senior Secured Notes could seek to declare all amounts outstanding under such Senior Secured Notes, together with accrued and unpaid interest, if any, to be immediately due and payable. If the indebtedness under our outstanding Senior Secured Notes, or certain other existing debt obligations were to be accelerated, we cannot assure you that our assets would be sufficient to repay in full such accelerated indebtedness or our other indebtedness.
15
Furthermore, upon the occurrence of any event of default under the 2017 Credit Agreement, the indentures governing our outstanding Senior Secured Notes or any of our other debt, the lenders could elect to declare all amounts outstanding thereunder, together with accrued interest, to be immediately due and payable. If the lenders accelerate payment of those amounts, we cannot assure you that our assets would be sufficient to repay in full those amounts or to satisfy our other liabilities.
In addition, in connection with the entry into new financings or amendments to existing financing arrangements and while our debt rating remains below investment grade, our financial and operational flexibility may be further reduced as a result of more restrictive covenants, requirements for security and other terms that are often imposed on sub-investment grade entities.
CEMEX, S.A.B. de C.V.’s ability to repay debt and pay dividends depends on our subsidiaries’ ability to transfer income and dividends to us.
Aside from operating certain assets in Mexico, CEMEX, S.A.B. de C.V. is a holding company that owns the stock of its direct subsidiaries and is the beneficial owner of the equity interests of its indirect subsidiaries and has holdings of cash and marketable securities. In general, CEMEX, S.A.B. de C.V.’s ability to repay debt and pay dividends, as well as to generally make other payments, depends on the continued transfer to it of dividends and other income and funds from its wholly-owned and non-wholly-owned subsidiaries. Even though our debt agreements and instruments restrict us from entering into any agreement or arrangement that limits the ability of any subsidiary of CEMEX, S.A.B. de C.V. to declare or pay dividends or repay or capitalize intercompany indebtedness, the ability of CEMEX, S.A.B. de C.V.’s subsidiaries to pay dividends and make other transfers to it is subject to various regulatory, contractual and legal constraints of the countries in which we operate, including the need to create legal reserves prior to transferring funds. The 2017 Credit Agreement restricts CEMEX, S.A.B. de C.V.’s ability to declare or pay cash dividends. In addition, the indentures governing our outstanding Senior Secured Notes also limit CEMEX, S.A.B. de C.V.’s ability to pay dividends.
The ability of CEMEX, S.A.B. de C.V.’s direct and indirect subsidiaries to pay dividends and make loans and other transfers to it is generally subject to various regulatory, legal and economic limitations. Depending on the jurisdiction of organization of the relevant subsidiary, such limitations may include solvency and legal reserve requirements, dividend payment restrictions based on interim financial results or minimum net worth and withholding taxes on loan interest payments. For example, our subsidiaries in Mexico are subject to Mexican legal requirements, which provide that a corporation may declare and pay dividends only out of the profits reflected in the year-end financial statements that are or have been approved by its stockholders. In addition, such payment can be approved by a subsidiary’s stockholders only after the creation of a required legal reserve (equal to one fifth of the relevant company’s capital) and compensation or absorption of losses, if any, incurred by such subsidiary in previous fiscal years.
CEMEX, S.A.B. de C.V. may also be subject to exchange controls on remittances by its subsidiaries from time to time in a number of jurisdictions. In addition, CEMEX, S.A.B. de C.V.’s ability to receive funds from these subsidiaries may be restricted by covenants in the debt instruments and other contractual obligations of those entities.
As of the date of this report, CEMEX, S.A.B. de C.V. does not expect that existing regulatory, legal and economic restrictions on its existing direct and indirect subsidiaries’ ability to pay dividends and make loans and other transfers to it will negatively affect its ability to meet its cash obligations. However, the jurisdictions of organization of CEMEX, S.A.B. de C.V.’s current direct or indirect subsidiaries, or of any future subsidiary, may impose additional and more restrictive regulatory, legal and/or economic limitations. In addition, CEMEX, S.A.B. de C.V.’s subsidiaries may not be able to generate sufficient income to pay dividends or make loans or other transfers to it in the future, or may not have access to Dollars in their respective countries, which, as of the date of this report, would be the preferred currency to be received by CEMEX, S.A.B. de C.V. to service the majority of its debt payments. Any material additional future limitations on our subsidiaries could adversely affect CEMEX, S.A.B. de C.V.’s ability to service our debt and meet its other cash obligations.
16
We are subject to restrictions due to non-controlling interests in our consolidated subsidiaries.
We conduct our business through subsidiaries. In some cases, third-party shareholders hold non-controlling interests in these subsidiaries, such as in the case of CLH, CHP, TCL and Caribbean Cement Company Limited (“CCCL”), among others. Various disadvantages may result from the participation of non-controlling shareholders whose interests may not always be aligned with ours. Some of these disadvantages may, among other things, result in our inability to implement organizational efficiencies and transfer cash and assets from one subsidiary to another in order to allocate assets most effectively.
We have to service our debt and other financial obligations denominated in Dollars with revenues generated in Mexican Pesos or other currencies, as we do not generate sufficient revenue in Dollars from our operations to service all our debt and other financial obligations denominated in Dollars. This could adversely affect our ability to service our obligations in the event of a devaluation or depreciation in the value of the Mexican Peso, or any of the other currencies of the countries in which we operate, compared to the U.S. Dollar. In addition, our consolidated reported results and outstanding indebtedness are significantly affected by fluctuations in exchange rates between the Mexican Peso and other currencies.
A substantial portion of our total debt plus other financial obligations is denominated in Dollars. As of December 31, 2018, our debt plus other financial obligations denominated in Dollars represented 64% of our total debt plus other financial obligations, which does not include U.S.$371 million of Dollar-denominated Perpetual Debentures. Our Dollar-denominated debt must be serviced with funds generated by CEMEX, S.A.B. de C.V.’s direct and indirect subsidiaries. Although we have substantial operations in the U.S., we continue to strongly rely on our non-U.S. assets to generate revenues to service our Dollar-denominated debt. Consequently, we have to use revenues generated in Mexican Pesos, Euros or other currencies to service our Dollar-denominated obligations. See “Results of Operations—Quantitative and Qualitative Market Disclosure—Interest Rate Risk, Foreign Currency Risk and Equity Risk—Foreign Currency Risk.” A devaluation or depreciation in the value of the Mexican Peso, Euro, British Pound, Colombian Peso, Philippine Peso or any of the other currencies of the countries in which we operate, compared to the U.S. Dollar, could adversely affect our ability to service our Dollar-denominated debt. In 2018, our operations in Mexico, the United Kingdom, France, Germany, Spain, Poland, the Czech Republic, the Rest of Europe (as described in “Business” below), Colombia, Costa Rica, Caribbean TCL, the Dominican Republic, Rest of South, Central America and the Caribbean (as described in “Business” below), the Philippines, Egypt, Israel, the Rest of Asia, Middle East and Africa (as described in “Business” below), which are our main non-Dollar-denominated operations, together generated 66% of our total revenues in Mexican Peso terms (21%, 7%, 6%, 4%, 3%, 2%, 1%, 2%, 3%, 1%, 2%, 1%, 3%, 3%, 2%, 4% and 1%, respectively) before eliminations resulting from consolidation. In 2018, 26% of our revenues in Mexican Peso terms were generated from our operations in the United States.
During 2018, the Mexican Peso remained flat against the U.S. Dollar, the Euro depreciated 4.5% against the U.S. Dollar and the British Pound depreciated 5.6% against the U.S. Dollar. Currency hedges that we may be a party to or may enter in the future may not be effective in covering all our currency-related risks. Our consolidated reported results for any period and our outstanding indebtedness as of any date are significantly affected by fluctuations in exchange rates between the Mexican Peso and other currencies, as those fluctuations influence the amount of our indebtedness when translated into Mexican Pesos and also result in foreign exchange gains and losses as well as gains and losses on derivative contracts, including those entered into to hedge our exchange rate exposure. For a description of these restrictions, see “—Our use of derivative instruments has negatively affected, and any new derivative financial instruments could negatively affect, our operations, especially in volatile and uncertain markets.”
In addition, as of December 31, 2018, our Euro-denominated total debt plus other financial obligations represented 26% of our total debt plus other financial obligations, which does not include the €64 million aggregate principal amount of Euro-denominated Perpetual Debentures.
17
Our use of derivative financial instruments has negatively affected, and any new derivative financial instruments could negatively affect, our operations, especially in volatile and uncertain markets.
We have used, and may continue to use, derivative financial instruments to manage the risk profile associated with interest rates and currency exposure of our debt, to reduce our financing costs, to access alternative sources of financing and to hedge some of our financial and operating risks. However, we cannot assure you that our use of such instruments will allow us to achieve these objectives due to the inherent risks in any derivatives transaction.
As of December 31, 2018, our derivative financial instruments consisted of equity forwards on third party shares, foreign exchange forward contracts, interest rate derivatives related to energy projects fuel price hedging and interest-rate swap instruments related to bank loans, which had an impact on our financial position. The fair value changes of our derivative financial instruments are reflected in our income statement, which could introduce volatility in our controlling interest net income and our related ratios. For the years ended December 31, 2017 and 2018, the recognition of changes in the fair value of derivative financial instruments during the applicable period represented net gains of Ps161 million (U.S.$9 million) and net gains of Ps760 million (U.S.$39 million), respectively.
For the majority of the last ten years, CEMEX has significantly decreased its use of derivatives instruments related to debt, both currency and interest rate derivatives, thereby reducing the risk of cash margin calls. However, with respect to our existing financial derivatives, we may incur net losses and be subject to margin calls that do not require a substantial amount of cash to cover such margin calls. If we enter into new derivative financial instruments, we may incur net losses and be subject to margin calls in which the cash required to cover margin calls may be substantial and may reduce the funds available to us for our operations or other capital needs. In addition, as with any derivative position, CEMEX assumes the creditworthiness risk of the counterparty, including the risk that the counterparty may not honor its obligations to us.
We are subject to the laws and regulations of the countries where we operate and any material changes in such laws and regulations and/or any significant delays in our assessing the impact and/or adapting to such changes may have an adverse effect on our business, financial condition and results of operations.
Our operations are subject to the laws and regulations of the countries where we operate and such laws and regulations, and/or governmental interpretations of such laws and regulations, may change. Any such change may have a material adverse effect on our business, financial condition and results of operations. Furthermore, changes in laws and regulations and/or governmental interpretations of such laws and regulations in the countries where we operate may require us to devote a significant amount of time and resources to assess and, if required, to adjust our operations to any such changes, which could have a material adverse effect on our business, financial condition and results of operations. In addition, any significant delays in assessing the impact and/or, if required, in adapting to changes in laws and regulations and/or governmental interpretations of such laws and regulations may also have a material adverse effect on our business, financial condition, results of operations and prospects.
We may fail to obtain or renew or may experience material delays in obtaining requisite governmental or other approvals, licenses and permits for the conduct of our business.
We require various approvals, licenses, permits and certificates in the conduct of our business. We cannot assure you that we will not encounter significant problems in obtaining new or renewing existing approvals, licenses, permits and certificates required in the conduct of our business, or that we will continue to satisfy the conditions to which such approvals, licenses, permits and certificates that we currently have or may be granted in the future. There may also be delays on the part of regulatory and administrative bodies in reviewing our applications and granting approvals. If previously obtained approvals, licenses, permits and certificates are revoked and/or if we fail to obtain and/or maintain the necessary approvals, licenses, permits and certificates required for the conduct of our business, we may be required to incur substantial costs or temporarily suspend or alter the operation of one or more of our operating units, production facilities, mineral extraction locations or of any relevant component of them, which could affect the general production of these units, facilities or locations, which in turn could have a material adverse effect on our business, financial condition, results of operations and prospects.
18
We may fail to secure certain materials required to run our business.
We increasingly use in most of our business certain by-products of industrial processes produced by third parties, such as pet coke, fly-ash, slag and synthetic gypsum. While we are not dependent on our suppliers and while we try to secure the supply of the required materials through long-term renewable contracts and framework agreements, which allow us to better manage supplies, short-term contracts are however entered into in certain countries where we operate. Should existing suppliers cease operations or reduce or eliminate production of these by-products, or should laws and/or regulations in any region or country limit the access to these materials, sourcing costs for these materials could increase significantly or require us to find alternative sources for these materials, which could have a material adverse effect on our business, financial condition, results of operations and prospects. Additionally, scarcity and quality of natural resources (such as water and aggregates reserves) in some of the countries where we operate could have a material adverse effect on our operations, costs and results of operations.
We may not be able to realize the expected benefits from acquisitions or joint ventures, some of which may have a material impact on our business, financial condition and results of operations.
Even though we have not made any major acquisitions in recent years or entered into significant joint ventures, our ability to realize the expected benefits from acquisitions or joint ventures depends, in large part, on our ability to integrate acquired operations with our existing operations in a timely and effective manner. These efforts may not be successful. Although we have had disposed of assets in the past and may continue to do so to reduce our overall leverage and rebalance our portfolio, the 2017 Credit Agreement and other debt instruments restrict our ability to acquire assets and enter into joint ventures, and we may in the future acquire new operations or enter into joint ventures and integrate such operations into our existing operations, and some of such acquisitions may have a material impact on our business, financial condition and results of operations. We cannot assure you that we will be successful in identifying or acquiring suitable assets in the future, or that the terms under which we may acquire any assets or enter into joint ventures in the future would be favorable to us. If we fail to achieve the anticipated cost savings from any acquisitions or joint ventures, our business, financial condition and results of operations could be materially and adversely affected.
High energy and fuel costs may have a material adverse effect on our operating results.
Electric energy and fuel costs represent an important part of our overall cost structure. The price and availability of electric energy and fuel are generally subject to market volatility and, therefore, may have an adverse impact on our costs and operating results. Furthermore, if third party suppliers fail to provide to us the required amounts of energy or fuel under existing agreements, we may need to acquire energy or fuel at an increased cost from other suppliers to fulfill certain contractual commitments. In addition, governments in several of the countries where we operate are working to reduce energy subsidies, introduce clean energy obligations or impose new excise taxes, which could further increase energy costs and have a material adverse effect on our business, financial condition and results of operations.
Furthermore, if our efforts to increase our use of alternative fuels are unsuccessful, due to their limited availability, price volatility or otherwise, we would be required to use traditional fuels, which may increase our energy and fuel costs and could have a material adverse effect on our business, financial condition and results of operations.
The introduction of substitutes for cement, concrete or aggregates into the market and the development of new construction techniques and technologies could have a material adverse effect on our business, financial condition and results of operations.
Materials such as plastic, aluminum, ceramics, glass, wood and steel can be used in construction as a substitute for cement, concrete or aggregates. In addition, other construction techniques, such as the use of dry wall, and the integration of new technologies in the construction industry, such as 3-D printing, mini-mills and mobile plants, and changes in housing preferences could adversely impact the demand and price for cement, concrete and/or aggregates. Furthermore, research aimed at developing new construction techniques and modern materials and digitalizing the construction industry may introduce new products and technologies in the future that could reduce the demand and prices for our products.
19
We operate in highly competitive markets and if we do not compete effectively, our results of operations will be harmed.
The markets in which we operate are highly competitive and are served by a variety of established companies with recognized brand names, as well as new market entrants and increasing imports. Companies in these markets compete based on a variety of factors, often employing aggressive pricing strategies to gain market share. Our ability to increase our revenues depends, in part, on our ability to compete effectively. We compete with different types of companies and based on different factors in each market. For example, in the relatively consolidated cement and ready-mix concrete industries, we generally compete based on quality and value proposition available to our clients. In the more fragmented market for aggregates, we generally compete based on capacity and price for our products. In certain areas of the markets in which we compete, some of our competitors may be more established, benefit from greater brand recognition or have greater manufacturing and distribution channels and other resources than we do. In addition, if our competitors were to combine, they may be able to compete more effectively with us and they may dispose of assets, which could lead to new market entrants that increase competition in our markets. For example, Lafarge and Holcim finalized their merger in 2015, and Ireland’s CRH plc (“CRH”) acquired the vast majority of the assets disposed by Lafarge and Holcim pursuant to the requirements of regulators. Another example is HeidelbergCement AG’s (“Heidelberg”) acquisition of Italcementi S.p.A., which was completed in July 2016. Also, as of the date of this report, some of our major competitors have announced they intend to divest assets in different parts of the world (Southeast Asia for example), which may lead to increased competition in the markets in which we operate.
If we are not able to compete effectively, we may lose substantial market share, our revenues could decline or grow at a slower rate and our business and results of operations would be harmed, which could have a material adverse effect on our business, financial condition and results of operations.
A substantial amount of our total assets consists of intangible assets, including goodwill. We have recognized charges for goodwill impairment in the past, and if market or industry conditions deteriorate further, additional impairment charges may be recognized.
Our 2018 audited consolidated financial statements included in the February 28 6-K, have been prepared in accordance with IFRS as issued by the IASB, under which goodwill is not amortized and is tested for impairment when impairment indicators exist or at least once a year during the fourth quarter of each year, by determining the recoverable amount of the groups of cash-generating units to which goodwill balances have been allocated, which consists of the higher of such groups of cash-generating units fair value, less cost to sell, and their corresponding value in use, represented by the discounted amount of estimated future cash flows expected to be generated by such groups of cash-generating units to which goodwill has been allocated. An impairment loss is recognized under IFRS if the recoverable amount is lower than the net book value of the groups of cash-generating units to which goodwill has been allocated within other expenses, net. We determine the discounted amount of estimated future cash flows over periods of five years. In specific circumstances, when, according to our experience, actual results for a given cash-generating unit do not fairly reflect historical performance and most external economic variables provide us with confidence that a reasonably determinable improvement in the mid-term is expected in their operating results, management uses cash flow projections over a period of up to ten years, to the point in which future expected average performance resembles the historical average performance and to the extent we have detailed, explicit and reliable financial forecasts and is confident and can demonstrate its ability, based on past experience, to forecast cash flows accurately over that longer period. If the value in use of a group of cash-generating units to which goodwill has been allocated is lower than its corresponding carrying amount, we determine its corresponding fair value using methodologies generally accepted in the markets to determine the value of entities, such as multiples of Operating EBITDA and/or by reference to other market transactions, among others. Impairment tests are significantly sensitive to, among other factors, the estimation of future prices of our products, trends in operating expenses, local and international economic trends in the construction industry, the long-term growth expectations in the different markets, as well as the discount rates and the growth rates in perpetuity applied, among others. We use specific pre-tax discount rates for each group of cash-generating units to which goodwill is allocated, which are applied to pre-tax cash flows. The amounts of estimated undiscounted cash flows are significantly sensitive to the growth rates in perpetuity applied. Likewise, the amounts of discounted future cash flows are significantly sensitive to the weight average cost of capital (discount rate) applied. The higher the growth rate in perpetuity applied, the higher the amount of undiscounted future cash flows by group of cash-generating units obtained. Conversely, the
20
higher the discount rate applied, the lower the amount of discounted estimated future cash flows by group of cash-generating units obtained. During the last quarters of each of 2016, 2017 and 2018, we performed our annual goodwill impairment test. For the year ended as of December 31, 2016, we did not determine any goodwill impairments. During 2017, in connection with our operating segment in Spain and considering the uncertainty over the improvement indicators affecting the country’s construction industry (and consequently the expected consumption of cement, ready-mix concrete and aggregates), partially a result of the country’s complex prevailing political environment, which results in limited expenditure in infrastructure projects, as well as the uncertainty in the expected price recovery and the effects of increased competition and imports, our management considered a future reduction of the related cash flows projections from 10 to five years and determined that the net book value of our operating segment in Spain exceeded the amount of the net present value of projected cash flows by Ps1,920 million (U.S.$98 million). As a result, we recognized a goodwill impairment in the aforementioned amount as part of “Other expenses, net” in the income statement against the related goodwill balance. For the year ended as of December 31, 2018, we did not determine any goodwill impairments. See note 15.2 to our 2018 audited consolidated financial statements included in the February 28 6-K.
Considering the important role that economic factors play in testing goodwill for impairment, we cannot assure that an eventual downturn in the economies where we operate will not necessitate further impairment tests and a possible downward readjustment of our goodwill for impairment under IFRS. Such an impairment test could result in impairment charges which could be material to our financial statements, which could have a material adverse effect on our financial condition.
We are subject to litigation proceedings, including a federal securities class action, government investigations relating to corruption related matters and antitrust proceedings, that could harm our business if an unfavorable ruling were to occur.
From time to time, we are and may become involved in litigation and other legal or administrative proceedings relating to claims arising from our operations, either in the normal course of business or not. As described in, but not limited to, “Regulatory Matters and Legal Proceedings,” we are currently subject to a number of significant legal proceedings, including, but not limited to, a federal securities class action alleging false and misleading statements in connection with alleged misconduct relating to the Maceo Project (as defined below) and the potential regulatory or criminal actions that might arise as a result, those relating to an SEC investigation concerning a new cement plant being built by CEMEX Colombia in the Antioquia department of the Municipality of Maceo, Colombia, as well as an investigation from the U.S. Department of Justice (the “DOJ”) mainly relating to our operations in Colombia and other jurisdictions, and antitrust investigations in countries in which we operate, including by the DOJ in the territorial United States. In addition, our main operating subsidiary in Egypt, Assiut Cement Company (“ACC”), is involved in certain Egyptian legal proceedings relating to the acquisition of ACC. Investigations and litigation, and in general any legal or administrative proceeding, are subject to inherent uncertainties, and unfavorable rulings may occur. We cannot assure you that these or any of our other regulatory matters and legal proceedings will not materially affect our ability to conduct our business in the manner that we expect or otherwise materially adversely affect us should an unfavorable ruling occur, which could have a material adverse effect on our business, financial condition and results of operations.
We have concluded that our internal control over financial reporting was not effective as of December 31, 2017, and our remediation efforts are ongoing. As a result, our ability to report our results of operations accurately, including our ability to make required filings with government authorities, may be adversely affected if our remediation efforts are not adequate. In addition, the trading price of our securities may be adversely affected by a related negative market reaction.
We have identified a material weakness in our internal control over financial reporting. Our management, including CEMEX, S.A.B. de C.V.’s Chief Executive Officer and Executive Vice President of Finance and Chief Financial Officer, has concluded that our disclosure controls and procedures were not effective as of December 31, 2017 to achieve their intended objectives. We have identified the following material weakness in our internal control over financial reporting: our risk assessment process did not operate effectively to implement controls that would prevent, or detect and correct, misstatements resulting from apparent collusion or management override of controls in relation to significant unusual transactions. In addition, we did not design and operate effective monitoring controls to detect non-compliance with our policies related to the financial reporting of significant unusual transactions. This material weakness relates, in part, to the previously disclosed irregular payments to a non-governmental individual made in connection with the construction by CEMEX Colombia of a new integrated cement plant in the Antioquia department near the municipality of Maceo, Colombia (the “Maceo Project”). As of
21
December 31, 2017, the implementation of our remediation plan to address this material weakness was not far enough advanced to provide a sufficient level of assurance that such circumvention or override of controls and misuse of funds by management would be prevented. As of the date of this report, we are finalizing the validation of the remedial measures related to the material weakness. For more information, see “Item 15—Controls and Procedures” of our 2017 Annual Report. If our efforts to remediate this material weakness are not successful, we may be unable to report our results of operations accurately and make our required filings with government authorities, including the SEC. Furthermore, our business and operating results and the price of our securities may be adversely affected by related negative market reactions. We cannot be certain that in the future additional material weaknesses will not exist or otherwise be discovered.
Our operations are subject to environmental laws and regulations.
Our operations are subject to a broad range of environmental laws and regulations in each of the jurisdictions in which we operate. These laws and regulations impose stringent environmental protection standards regarding, among other things, air emissions, wastewater discharges, the use and handling of hazardous waste or materials, waste disposal practices and the remediation of environmental damage or contamination. These laws and regulations expose us to the risk of substantial environmental costs and liabilities, including fines and other sanctions, the payment of compensation to third parties, remediation costs and damage to reputation. Moreover, the enactment of stricter laws and regulations, stricter interpretation of existing laws or regulations, or new enforcement initiatives, may impose new risks or costs on us or result in the need for additional investments in pollution control equipment, which could result in a material decline in our profitability.
In late 2010, the U.S. Environmental Protection Agency (“EPA”) issued the final Portland Cement National Emission Standard (“Portland Cement NESHAP”) for Hazardous Air Pollutants under the federal Clean Air Act (“CAA”). This rule required Portland cement plants to limit mercury emissions, total hydrocarbons, hydrochloric acid and particulate matter by September 2013. The rule was challenged in federal court, and in December 2011, the D.C. Circuit Court of Appeals remanded the Portland Cement NESHAP to EPA and directed the agency to recompute the standards. In February 2013, EPA issued a revised final Portland Cement NESHAP rule that relaxed emissions limits for particulate matter and moved the compliance deadline to September 2015. In April 2013, environmental groups again challenged the revised Portland Cement NESHAP rule in federal court. In April 2014, the D.C. Circuit issued a ruling upholding both the revised particulate matter emission limits and the September 2015 compliance deadline. As of the day of this report, Portland Cement NESHAP compliance-related work continues in several of our plants. While we expect to meet all emissions standards imposed by the Portland Cement NESHAP, failure to do so could have a material adverse impact on our business operations, liquidity and financial condition; however, we expect that such impact would be consistent with the impact on the cement industry as a whole.
In February 2013, EPA issued revised final emissions standards under the CAA for commercial and industrial solid waste incinerators (“CISWI”). Under the CISWI rule, if a material being used in a cement kiln as an alternative fuel is classified as a solid waste, the plant must comply with CISWI standards. The CISWI rule covers nine pollutants, and imposes potentially more stringent emissions limits on certain pollutants that also are regulated under the Portland Cement NESHAP. EPA received petitions to further reconsider certain provisions of the 2013 CISWI rule. EPA granted reconsideration on four specific issues and finalized the reconsideration of the CISWI rule in June 2016. The 2013 CISWI rule was also challenged by both industrial and environmental groups in federal court. In July 2016, the D.C. Circuit issued a ruling upholding most of the rule and remanding several portions to EPA for further consideration. EPA has not issued a revised final rule after remand but the portions of the rule upheld on appeal are final and in effect. The final CISWI rule established a compliance date of February 2018, which was not impacted by the appeal. If kilns at CEMEX plants in the U.S. are determined to be CISWI kilns due to the use of certain alternative fuels, the emissions standards imposed by the CISWI rule could have a material impact on our business operations.
Under certain environmental laws and regulations, liability associated with investigation or remediation of hazardous substances can arise at a broad range of properties, including properties currently or formerly owned or operated by CEMEX, as well as facilities to which we sent hazardous substances or wastes for treatment, storage or disposal, or any areas affected while we transported any hazardous substances or wastes. Such laws and regulations may apply without regard to causation or knowledge of contamination. We occasionally evaluate various
22
alternatives with respect to our facilities, including possible dispositions or closures. Investigations undertaken in connection with these activities (or ongoing operational or construction activities) may lead to hazardous substance releases or discoveries of historical contamination that must be remediated, and closures of facilities may trigger compliance requirements that are not applicable to operating facilities. While compliance with these laws and regulations has not materially adversely affected our operations in the past, we cannot assure you that these requirements will not change and that compliance will not adversely affect our operations in the future. Furthermore, we cannot assure you that existing or future circumstances or developments with respect to contamination will not require us to make significant remediation or restoration expenditures, which could have a material adverse effect on our business, financial condition and results of operations.
The cement manufacturing process requires the combustion of large amounts of fuel and creates carbon dioxide (“CO2”) as a by-product of the calcination process. Therefore, efforts to address climate change through federal, state, regional, EU and international laws and regulations requiring reductions in emissions of greenhouse gases (“GHGs”) can create economic risks and uncertainties for our business. Such risks could include the cost of purchasing allowances or credits to meet GHG emission caps, the cost of installing equipment to reduce emissions to comply with GHG limits or required technological standards, decreased profits or losses arising from decreased demand for our goods and higher production costs resulting directly or indirectly from the imposition of legislative or regulatory controls. To the extent that financial markets view climate change and GHG emissions as a financial risk, this could have a material adverse effect on our cost of and access to capital. Given the uncertain nature of the actual or potential statutory and regulatory requirements for GHG emissions at the federal, state, regional, EU and international levels, we cannot predict the impact on our operations or financial condition or make a reasonable estimate of the potential costs to us that may result from such requirements. However, the impact of any such requirements, whether individually or cumulatively, could have a material economic impact on our operations in the United States and in other countries. For more information on certain laws and regulations addressing climate change that we are, or could become, subject to, and the impacts to our operations arising therefrom, see “Regulatory Matters and Legal Proceedings—Environmental Matters.”
Cement production raises a number of health and safety issues. As is the case with other companies in our industry, some of our aggregate products contain varying amounts of crystalline silica, a common mineral. Also, some of our construction and material processing operations release, as dust, crystalline silica that is in the materials being handled. Excessive, prolonged inhalation of very small-sized particles of crystalline silica has allegedly been associated with respiratory disease (including silicosis). As part of our annual due diligence, we work with our stakeholders to verify that certain health and safety protocols are in place as regards the management of silica and its health effects, as well as in relations to other substances and products. Nonetheless, under various laws we may be subject to future claims related to exposure to these or other substances or products.
Other health and safety issues related to our business include: burns arising from contact with hot cement kiln dust or dust on preheater systems; air borne hazards related to our aggregates mining activities; noise, including from chutes and hoppers, milling plants, exhaust fans and blowers; the potential for dioxin formation if chlorine-containing alternative fuels are introduced into kilns; plant cleaning and maintenance activities involving working at height or in confined or other awkward locations, and the storage and handling of coal, pet coke and certain alternative fuels, which, in their finely ground state, can pose a risk of fire or explosion; and health hazards associated with operating ready-mix concrete trucks. While we actively seek to minimize the risk posed by these issues, personal injury claims may be made, and substantial damages awarded, against us. We may also be required to change our operational practices, involving material capital expenditure.
As part of our insurance-risk governance approach, from time to time we evaluate the need to address the financial consequences of environmental laws and regulations through the purchase of insurance. As a result, we do arrange certain types of environmental impairment insurance policies for both site-specific, as well as multi-site locations. We also organize non-specific environmental impairment insurance as part of the provision of a broader corporate insurance strategy. These latter insurance policies are designed to offer some assistance to our financial flexibility to the extent that the specifics of an environmental incident could give rise to a financial liability. However, we cannot assure you that a given environmental incident will be covered by the environmental insurance we have in place, or that the amount of such insurance will be sufficient to offset the liability arising from the incident. Any such liability may be deemed to be material to us and could have a material adverse effect on our business, financial condition and results of operations.
23
We are an international company and are exposed to risks in the countries in which we have operations or interests.
We are dependent, in large part, on the economies of the countries in which we market our products and services. The economies of these countries are in different stages of socioeconomic and political development. Consequently, like many other companies with significant international operations, we are exposed to risks from changes in economic growth, foreign currency exchange rates, interest rates, inflation, trade policy, government spending, regulatory framework, social instability and other political, economic or social developments that may materially affect our business, financial condition and results of operations.
As of December 31, 2018, we mostly had operations in Mexico, the United States, the United Kingdom, France, Germany, Spain, the Czech Republic, the Rest of Europe, Colombia, Panama, Costa Rica, Caribbean TCL, the Dominican Republic, the Rest of South, Central America and the Caribbean, the Philippines, Egypt, Israel and the Rest of Asia, Middle East and Africa (as described in “Business” below).
For a geographic breakdown of our revenues for the year ended December 31, 2018, see “CEMEX—Geographic Breakdown of Revenues for the Year Ended December 31, 2018.”
In recent years, concerns over global economic conditions, protectionist trade policies, energy costs, geopolitical issues, political uncertainty, social instability, the availability and cost of credit and the international financial markets have contributed to economic uncertainty and reduced expectations for the global economy.
Our operations in Egypt, the UAE and Israel have experienced instability as a result of, among other things, civil unrest, terrorism, extremism, deterioration of general diplomatic relations and changes in the geopolitical dynamics in the region. There can be no assurances that political turbulence in Egypt, Iran, Iraq, Syria, Libya, Yemen and other countries in Africa, the Middle East and Asia will abate in the near future or that neighboring countries will not be drawn into conflict or experience instability. In addition, some of our operations are or may be subject to political risks, such as confiscation, expropriation and/or nationalization, as for example was the case of our past operations in Venezuela and is currently the case in Egypt. See “Regulatory Matters and Legal Proceedings—Other Legal Proceedings—Egypt Share Purchase Agreement.”
Our operations in Egypt have since 2011 been exposed political and social turmoil in the country. In March 2018, Egypt held a new presidential election and President Abdel Fattah el-Sisi was re-elected for a second term (2018 – 2022). CEMEX’s operations in Egypt have been adversely affected by the turbulence in Egypt and CEMEX continues with its cement production, dispatch and sales activities as of the date of this report. We cannot assure you that the reelected regime will be able to avoid further political and social turbulence. Risks to CEMEX’s operations in Egypt include a potential reduction in overall economic activity, exchange rate volatility, increased cost of energy, cement oversupply and threat of terrorist attacks which could have a material adverse effect on our operations in the country.
Our operations are also exposed to the Israeli-Palestinian conflict. Confrontations between Israeli Defense Force and Palestinians in the Gaza have continued generating sporadic events of violence in the region. Progress on peace is stalled, as neither side has shown intentions for making concessions. If the conflicts escalate, it could have a negative impact on the geopolitics and economy in the region, which in turn could adversely affect our operations, financial condition and results of operations.
Military activities in Ukraine and on its borders, including Russia effectively taking control of Crimea, followed by Crimea’s independence vote and absorption by Russia, have combined with Ukraine’s weak economic conditions to create uncertainty in Ukraine and the global markets. In response to the annexation of the Crimean region of Ukraine by Russia and in response to Russia’s intervention in the conflicts in Syria, Russia has been subject to sanctions from other countries, including the U.S., which may continue to impose economic sanctions on Russia. While not directly impacting territories in which we had operations as of December 31, 2018, this dispute could negatively affect the economies of the countries in which we operate and their access to Russian energy supplies, and could negatively impact the global economy. Furthermore, potential responses by Russia to those sanctions could adversely affect European economic conditions, which could have a material adverse effect on our operations mainly in Europe. If conflicts with Russia escalate to military conflict, it could also have a material adverse effect on our business, financial condition and results of operations.
24
In the Middle East region, during 2017, the Gulf Cooperation Council split in a way not seen since its foundation in 1981, after Saudi Arabia, the UAE and Bahrain launched a boycott of Qatar in June 2017, alleging Qatar’s support to Islamist groups. The end of the conflict does not appear to be imminent, as Qatar refuses to accept demands from Gulf Cooperation Council countries. The Qatar-Gulf crisis may have a negative economic impact on the region. Additionally, as previously mentioned, the civil war in Syria could escalate tensions between the U.S. and Russia, Israel and Iran, and their corresponding allies. Increased tensions among these countries could lead to a risk of a military action that could potentially have a material adverse effect on our business, financial condition and results of operations.
In Asia, there is geopolitical tension related to Taiwan’s status in relation to China and in South Korea related to its disputes with North Korea, which also include the disputes between the U.S. and North Korea. Similarly, mutually exclusive territorial disputes among several Southeast Asian countries in the South China Sea amplify the potential for an outbreak of hostilities. A major outbreak of hostilities or other political upheaval in China, Taiwan, North Korea or South Korea could adversely affect the global economy, which could have a material adverse effect on our business, financial condition or results of operations. A potential sharp and unexpected reduction of economic growth in China, or an economic contraction of this country, could affect the global economy to an extent that could have a material adverse effect on our business, financial condition and results of operations.
Other regions are also exposed to political turmoil, including the continued political unrest in Venezuela and Nicaragua, which may similarly affect the results of our operations in those regions.
There have been terrorist attacks and ongoing threats of future terrorist attacks in countries in which we maintain operations. We cannot assure you that there will not be other attacks or threats that will cause any damage to our operating units and facilities or locations, or harm any of our employees, including members of CEMEX, S.A.B. de C.V.’s board of directors or senior management, or lead to an economic contraction or erection of material barriers to trade in any of our markets. An economic contraction in any of our major markets could affect domestic demand for cement, which could have a material adverse effect on our business, financial condition and results of operations.
As part of our risk governance approach, from time to time we evaluate the need to address the financial consequences of political or social risk through the purchase of insurance. As a result, we purchase certain types of political risk insurance policies for selected countries where we operate and which are exposed to political turmoil, geopolitical issues or political uncertainty. These insurance policies are designed to offer some assistance to our financial flexibility to the extent that the specifics of a political incident could give rise to a financial liability. However, we cannot assure you that a given social or political event and possible changes in government policies will be covered by the political risk insurance policies we have in place, or that the amount of such insurance will be sufficient to offset the liability arising from such applicable events. Any such liability could have a material adverse effect on our business, financial condition and results of operation.
Our operations can be affected by adverse weather conditions and natural disasters.
Construction activity, and thus demand for our products, decreases substantially during periods of cold weather, when it snows or when heavy or sustained rainfalls occur, or in general any rainy and snowy weather. Consequently, demand for our products is significantly lower during the winter or raining and snowing seasons in temperate countries and during the rainy season in tropical countries. Generally, winter weather in our European and North American operations significantly reduces our first quarter sales volumes, and to a lesser extent our fourth quarter sales volumes. Sales volumes in these and similar markets generally increase during the second and third quarters because of normally better weather conditions. However, high levels of rainfall and/or snow can adversely affect our operations during these periods as well, such as was the case in 2018 for our operations in the Philippines. Natural disasters, like the earthquake in Mexico and Hurricanes Harvey and Irma in the United States in 2017, could also have a negative impact on our sales volumes, which could also be material. This decrease in sales volumes is usually compensated by the increase in the demand of our products during the reconstruction phase, unless any of our operating units or facilities are impacted because of the natural disaster. Such adverse weather conditions and natural disasters can have a material adverse effect on our business, financial condition and results of operations if they occur with unusual intensity, during abnormal periods, or last longer than usual in our major markets, especially during peak construction periods.
25
We will be adversely affected by any significant or prolonged disruption to our production facilities.
Any prolonged and/or significant disruption to our production facilities, whether due to repair, maintenance or servicing, governmental actions, regulatory issues, industrial accidents, unavailability of raw materials such as energy, mechanical equipment failure, human error, natural disaster or otherwise, will disrupt and adversely affect our operations. Additionally, any major or sustained disruptions in the supply of utilities such as water or electricity or any fire, flood or other natural calamities or communal unrest or acts of terrorism may disrupt our operations or damage our production facilities or inventories and could have a material adverse effect on our business, financial condition and results of operations.
We typically shut down our facilities to undertake maintenance and repair work at scheduled intervals. Although we schedule shut downs such that not all our facilities are shut down at the same time, the unexpected shut down or closure of any facility may nevertheless materially affect our business, financial condition and results of operations from one period to another.
We are increasingly dependent on information technology and our systems and infrastructure, as well as those provided by third-party service providers, face certain risks, including cyber security risks.
We increasingly rely on a variety of information technology and automated operating systems to manage and support our operations, as well as to offer our products to our customers. The proper functioning of this technology and these systems is critical to the efficient operation and management of our business, as well as for the sales generated by our business. Our systems and technologies may require modifications or upgrades as a result of technological changes, growth in our business and to enhance our business security. These changes may be costly and disruptive to our operations, and could impose substantial demands on our systems and increase system outage time. Our systems and technology, as well as those provided by our third-party service providers, may be vulnerable to damage, disruption or intrusion caused by circumstances beyond our control, such as physical or electronic break-ins, catastrophic events, power outages, natural disasters, computer system or network failures, viruses or malware, unauthorized access and cyber-attacks. For example, our digital solutions to improve sales, customer experience, enhance our operations and increase our business efficiencies could be impeded by such damages, disruptions or intrusions. To try to minimize such risks, we safeguard our systems and electronic information through a set of cybersecurity controls, processes and a proactive monitoring service to attend potential breaches. In addition, we also have disaster recovery plans in case of incidents that could cause major disruptions to our business. However, these measures may not be sufficient, and our systems have in the past been subject to certain minor intrusions. As of December 31, 2018, we have not detected, and our third-party service providers have not informed us of, any relevant event that has materially damaged, disrupted or resulted in an intrusion of our systems. Any significant information leakages or theft of information, or any unlawful processing of personal data, could affect our compliance with data privacy laws and make us subject to regulatory action, including substantial fines, and private litigation with potentially large costs, as well as damage our relationship with our employees, customers and suppliers, which could have a material adverse impact on our business, financial condition and results of operations. As of December 31, 2018, our insurance did not cover any risk associated with cybersecurity risks. Nevertheless, our insurance has limited coverage for physical loss or damage to insured property, data or equipment such as: introduction of malware to destroy data, Distributed Denial of Service (DDOS) attack against network and attacks on an industrial control system resulting in damage to equipment and/or property. In addition, any significant disruption to our systems could have a material adverse effect on our business, financial condition and results of operations.
Activities in our business can be hazardous and can cause injury to people or damage to property in certain circumstances.
Most of our production facilities and units, as well as mineral extractions locations, require individuals to work with chemicals, equipment and other materials that have the potential to cause harm and injury when used without due care. An accident or injury that occurs at our facilities could result in disruptions to our business and operations and have legal and regulatory consequences and we may be required to compensate such individuals or incur other costs and liabilities, any and all of which could have a material adverse impact on our reputation, business, financial condition, results of operations and prospects.
26
Labor activism and unrest, or failure to maintain satisfactory labor relations, could adversely affect our results of operations.
Labor activism and unrest may adversely affect our operations and thereby adversely affect our business, financial condition, results of operations and prospects. Although most of our significant operations have not been affected by any significant labor dispute in the past, we cannot assure you that we will not experience labor unrest, activism, disputes or actions in the future, some of which may be significant and could adversely affect our business, financial condition, results of operations and prospects. The activity of labor unions in Mexico is expected to increase, as a result of law that permits unions to actively seek sponsorship of collective bargaining agreements.
Increases in liabilities related to our pension plans could adversely affect our results of operations.
We have obligations under defined benefit pension and other benefit plans in certain countries in which we operate, mainly in North America and Europe. Our actual funding obligations will depend on benefit plan changes, government regulations and other factors, including changes in longevity and mortality statistics. Due to the large number of variables and assumptions that determine pension liabilities and funding requirements, which are difficult to predict because they change continuously as demographics evolve despite the fact that we support our projections with studies by external actuaries, our net projected liability recognized in the statement of financial position of Ps18,937 million (U.S.$964 million) as of December 31, 2018 and the future cash funding requirements for our defined benefit pension plans and other postemployment benefit plans could significantly differ from the amounts estimated as of December 31, 2018. If so, these funding requirements, as well as our possible inability to properly fund such pension plans if we are unable to deliver the cash or equivalent funding requirements, could have a material adverse effect on our business, financial condition, results of operations and prospects.
Our insurance coverage may not cover all the risks to which we may be exposed.
We face the risks of loss and damage to our products, injury to our employees, property and machinery due to, among others, fire, theft and natural disasters such as floods, and also face risks related to cyber security related matters. Such events may cause a disruption to or cessation of our operations and business. While we believe that we have adequate and sufficient coverage, in line with industry practices, in some instances our insurance coverage may not be sufficient to cover all of our potential unforeseen losses and liabilities. In addition, our insurance coverage may not cover all the risks to which we may be exposed, such as cyber security risks. If our losses exceed our insurance coverage, or if we are not covered by the insurance policies we have taken up, we may be liable to cover any shortfall or losses. Our insurance premiums may also increase substantially because of such claims. In such circumstances, our financial results may be materially adversely affected.
Our success depends on the leadership of CEMEX, S.A.B. de C.V.’s board of directors and on key members of our management.
Our success depends largely on the efforts and strategic vision of CEMEX, S.A.B. de C.V.’s board of directors and of our executive management team. The loss of the services of some or all of the members of CEMEX, S.A.B. de C.V.’s board of directors or our executive management could have a material adverse effect on our business, financial condition and results of operations.
The execution of our business strategy also depends on our ongoing ability to attract and retain additional qualified employees. For a variety of reasons, particularly with respect to the competitive environment and the availability of skilled labor, we may not be successful in attracting and retaining the personnel we require. If we are unable to hire, train and retain qualified employees at a reasonable cost, we may be unable to successfully operate our business or capitalize on growth opportunities and, as a result, our business, financial condition and results of operations could be adversely affected.
27
We are subject to anti-corruption, anti-bribery, anti-money laundering and antitrust laws and regulations in the countries in which we operate. Any violation of any such laws or regulations could have a material adverse impact on our reputation and results of operations and financial condition.
We are subject to anti-corruption, anti-bribery, anti-money laundering, antitrust and other international laws and regulations and are required to comply with the applicable laws and regulations of the countries in which we operate. In addition, we are subject to regulations on economic sanctions that restrict our dealings with certain sanctioned countries, individuals and entities. Given the large number of contracts that we are a party to around the world, the geographic distribution of our operations and the great variety of actors that we interact within the course of business, we are subject to the risk that our affiliates, employees, directors, officers, partners, agents and service providers may misappropriate our assets, manipulate our assets or information, make improper payments or engage in corruption, bribery, money laundering or other illegal activity, for such person’s personal or business advantage.
There can be no assurance that our internal policies and procedures will be sufficient to prevent or detect all inappropriate practices, fraud or violations of law by our affiliates, employees, directors, officers, partners, agents and service providers or that any such persons will not take actions in violation of our policies and procedures. If we fail to fully comply with applicable laws and regulations, the relevant government authorities of the countries where we operate have the power and authority to impose fines and other penalties. Any violations by us of anti-bribery and anti-corruption laws or sanctions regulations could have a material adverse effect on our business, reputation, results of operations and financial condition.
For further information regarding our ongoing proceedings with respect to anti-corruption laws, see “—We are subject to litigation proceedings, including a federal securities class action, government investigations relating to corruption related matters and antitrust proceedings, that could harm our business if an unfavorable ruling were to occur” and “Regulatory Matters and Legal Proceedings.”
Certain tax matters may have an adverse effect on our cash flow, financial condition and net income.
We are subject to certain tax matters, mainly in Mexico, Colombia and Spain, that, if adversely resolved, may have a material adverse effect on our cash flow, financial condition and net income. See notes 2.13 and 19.4 to our 2018 audited consolidated financial statements included in the February 28 6-K, “Regulatory Matters and Legal Proceedings—Tax Matters—Mexico,” “Regulatory Matters and Legal Proceedings—Tax Matters—Colombia,” and “Regulatory Matters and Legal Proceedings—Tax Matters—Spain” for a description of the legal proceedings regarding these Mexican, Colombian and Spanish tax matters, all included elsewhere in this report.
It may be difficult to enforce civil liabilities against us or the members of CEMEX, S.A.B. de C.V.’s board of directors, our executive officers and controlling persons.
CEMEX, S.A.B. de C.V. is a publicly traded variable stock corporation (sociedad anónima bursátil de capital variable) organized under the laws of Mexico. Substantially all members of CEMEX, S.A.B. de C.V.’s board of directors and the majority of the members of our senior management reside in Mexico, and all or a significant portion of the assets of those persons may be, and the majority of our assets are, located outside the United States. As a result, it may not be possible for you to effect service of process within the United States upon such persons or to enforce against them or against us in U.S. courts judgments predicated upon the civil liability provisions of the federal securities laws of the United States. We have been advised by our General Counsel, Roger Saldaña Madero, that there is doubt as to the enforceability in Mexico, either in original actions or in actions for enforcement of judgments of U.S. courts, of civil liabilities predicated on the U.S. federal securities laws.
The protections afforded to non-controlling shareholders in Mexico are different from those in the United States and may be more difficult to enforce.
Under Mexican law, the protections afforded to non-controlling shareholders are different from those in the United States and countries in continental Europe. In particular, the legal framework and case law pertaining to directors’ duties and disputes between shareholders and us, the members of CEMEX, S.A.B. de C.V.’s board of directors, our officers or CEMEX, S.A.B. de C.V.’s controlling shareholders, are less developed under Mexican law
28
than under U.S. and continental European law. Mexican law only permits shareholder derivative suits (i.e., suits for our benefit as opposed to the direct benefit of our shareholders) and there are procedural requirements for bringing shareholder derivative lawsuits, such as minimum holdings, which differ from those in effect in other jurisdictions. There is also a substantially less active plaintiffs’ bar dedicated to the enforcement of shareholders’ rights in Mexico than in the United States. As a result, in practice it may be more difficult for our non-controlling shareholders to initiate an action against us or our directors or controlling shareholders or obtain direct remedies than it would be for shareholders of a U.S. company.
SELECTED CONSOLIDATED FINANCIAL INFORMATION
The financial data set forth below as of and for each of the five years ended December 31, 2018 have been derived from our audited consolidated financial statements. The financial data set forth below as of December 31, 2017 and 2018 and for each of the three years ended December 31, 2016, 2017 and 2018 have been derived from, and should be read in conjunction with, and are qualified in their entirety by reference to, our 2018 audited consolidated financial statements included in the February 28 6-K. Our 2018 audited consolidated financial statements prepared under IFRS for the year ended December 31, 2018 remain subject to the approval of our shareholders at the ordinary general shareholders’ meeting to be held on March 28, 2019. See “Recent Developments—Recent Developments Relating to Our Shareholders—CEMEX, S.A.B. de C.V. to hold its Ordinary and Extraordinary General Shareholders’ Meeting on March 28, 2019.”
The operating results of newly acquired businesses are consolidated in our financial statements beginning on the acquisition date. Therefore, all periods presented do not include operating results corresponding to newly acquired businesses before we assumed control. As a result, the financial data for the years ended December 31, 2016, 2017 and 2018 may not be comparable to that of prior periods.
Our 2018 audited consolidated financial statements included in the February 28 6-K, have been prepared in accordance with IFRS, which differ in significant respects from U.S. GAAP. The regulations of the SEC do not require foreign private issuers that prepare their financial statements on the basis of IFRS (as published by the IASB) to reconcile such financial statements to U.S. GAAP.
Non-Mexican Peso amounts included in the consolidated financial statements are first translated into Dollar amounts, in each case at a commercially available or an official government exchange rate for the relevant period or date, as applicable, and those Dollar amounts are then translated into Mexican Peso amounts at the exchange rate that we use for accounting purposes (the “CEMEX accounting rate”). The CEMEX accounting rate on any given date is determined based on the closing exchange rate reported by certain sources, such as Reuters. For any given date, the CEMEX accounting rate may differ from the noon buying rate for Mexican Pesos in New York City published by the U.S. Federal Reserve Bank of New York.
The Dollar amounts provided below, unless otherwise indicated elsewhere in this report, are translations of Mexican Peso amounts at an exchange rate of Ps19.65 to U.S.$1.00, the CEMEX accounting rate as of December 31, 2018. However, in the case of transactions conducted in Dollars, we have presented the U.S. Dollar amount of the transaction and the corresponding Mexican Peso amount that is presented in our 2018 audited consolidated financial statements included in the February 28 6-K. These translations have been prepared solely for the convenience of the reader and should not be construed as representations that the Mexican Peso amounts actually represent those Dollar amounts or could be converted into Dollars at the rate indicated. The noon buying rate for Mexican Pesos on December 31, 2018 was Ps19.64 to U.S.$1.00. Between January 1, 2019 and March 11, 2019, the Mexican Peso appreciated by approximately 2% against the U.S. Dollar, based on the noon buying rate for Mexican Pesos.
29
CEMEX, S.A.B. DE C.V. AND SUBSIDIARIES
Selected Consolidated Financial Information
| As of and For the Year Ended December 31, | ||||||||||||||||||||
| 2014 | 2015 | 2016 | 2017 | 2018 | ||||||||||||||||
| (in millions of Mexican Pesos, except ratios and share and per share amounts) | ||||||||||||||||||||
| Income Statement Information: |
||||||||||||||||||||
| Revenues |
Ps | 199,942 | Ps | 219,299 | Ps | 249,477 | Ps | 257,437 | Ps | 276,855 | ||||||||||
| Cost of sales(1) |
(134,742 | ) | (144,513 | ) | (159,946 | ) | (168,858 | ) | (182,965 | ) | ||||||||||
| Gross profit |
65,200 | 74,786 | 89,531 | 88,579 | 93,890 | |||||||||||||||
| Operating expenses |
(43,347 | ) | (47,910 | ) | (53,913 | ) | (55,967 | ) | (60,694 | ) | ||||||||||
| Operating earnings before other expenses, net(2) |
21,853 | 26,876 | 35,618 | 32,612 | 33,196 | |||||||||||||||
| Other, net |
(5,045 | ) | (3,032 | ) | (1,670 | ) | (3,815 | ) | (5,837 | ) | ||||||||||
| Operating earnings(2) |
16,808 | 23,844 | 33,948 | 28,797 | 27,359 | |||||||||||||||
| Financial items(3) |
(18,952 | ) | (21,117 | ) | (17,020 | ) | (15,685 | ) | (12,501 | ) | ||||||||||
| Share of profit of equity accounted investees |
294 | 737 | 688 | 588 | 653 | |||||||||||||||
| Earnings (loss) before income tax |
(1,850 | ) | 3,464 | 17,616 | 13,700 | 15,511 | ||||||||||||||
| Discontinued operations(4)(5) |
90 | 1,028 | 713 | 3,461 | 212 | |||||||||||||||
| Non-controlling interest net income |
1,103 | 923 | 1,173 | 1,417 | 789 | |||||||||||||||
| Controlling interest net income (loss) |
(6,783 | ) | 1,201 | 14,031 | 15,224 | 10,467 | ||||||||||||||
| Basic earnings (loss) per share(6)(7) |
(0.16 | ) | 0.03 | 0.32 | 0.34 | 0.22 | ||||||||||||||
| Diluted earnings (loss) per share(6)(7) |
(0.16 | ) | 0.03 | 0.32 | 0.34 | 0.22 | ||||||||||||||
| Basic earnings (loss) per share from continuing operations(6)(7) |
(0.16 | ) | 0.01 | 0.30 | 0.26 | 0.22 | ||||||||||||||
| Diluted earnings (loss) per share from continuing operations(6)(7) |
(0.16 | ) | 0.01 | 0.30 | 0.26 | 0.22 | ||||||||||||||
| Number of shares outstanding(6)(8)(9) |
37,370 | 49,124 | 48,668 | 48,439 | 48,015 | |||||||||||||||
| Statement of Financial Position Information: |
||||||||||||||||||||
| Cash and cash equivalents |
12,589 | 15,322 | 11,616 | 13,741 | 6,068 | |||||||||||||||
| Assets held for sale(4)(5) |
— | 1,945 | 21,029 | 1,378 | 2,100 | |||||||||||||||
| Property, machinery and equipment, net |
202,928 | 216,694 | 230,134 | 232,160 | 224,440 | |||||||||||||||
| Total assets |
514,961 | 542,264 | 599,728 | 567,691 | 552,628 | |||||||||||||||
| Short-term debt |
14,507 | 223 | 1,222 | 16,973 | 883 | |||||||||||||||
| Long-term debt |
191,327 | 229,125 | 235,016 | 177,022 | 182,074 | |||||||||||||||
| Liabilities directly related to assets held for sale |
— | — | 815 | — | 314 | |||||||||||||||
| Non-controlling interest and Perpetual Debentures(10) |
17,068 | 20,289 | 28,951 | 30,879 | 30,883 | |||||||||||||||
| Total controlling interest |
131,103 | 143,479 | 167,774 | 179,540 | 188,650 | |||||||||||||||
| Other Financial Information: |
||||||||||||||||||||
| Net working capital(11) |
20,757 | 16,806 | 7,920 | 3,012 | 650 | |||||||||||||||
| Book value per share(6)(9)(12) |
3.51 | 2.92 | 3.45 | 3.71 | 3.93 | |||||||||||||||
| Operating margin before other expense, net |
10.9% | 12.3% | 14.2% | 12.6% | 11.9% | |||||||||||||||
| Operating EBITDA from continuing operations(13) |
35,556 | 41,534 | 51,605 | 48,600 | 49,266 | |||||||||||||||
| Ratio of Operating EBITDA to interest expense(13) |
1.7 | 2.1 | 2.4 | 2.5 | 3.9 | |||||||||||||||
| Capital expenditures |
9,486 | 12,313 | 13,279 | 12,419 | 12,969 | |||||||||||||||
| Depreciation and amortization |
13,703 | 14,658 | 15,987 | 15,988 | 16,070 | |||||||||||||||
| Net cash flow provided by operating activities from continuing operations before financial expense, coupons on Perpetual Debentures and income taxes |
35,445 | 43,441 | 61,342 | 51,420 | 43,316 | |||||||||||||||
| Basic earnings (loss) per CPO of continuing operations(6)(7) |
(0.48 | ) | 0.03 | 0.90 | 0.78 | 0.66 | ||||||||||||||
| Basic earnings (loss) per CPO(6)(7) |
(0.48 | ) | 0.09 | 0.96 | 1.02 | 0.66 | ||||||||||||||
| Total debt plus other financial obligations |
244,429 | 268,203 | 273,868 | 226,216 | 207,724 | |||||||||||||||
| (1) | Cost of sales includes depreciation, amortization and depletion of assets involved in production, expenses related to storage in production plants, freight expenses of raw materials in plants and delivery expenses of our ready-mix concrete business. Our cost of sales excludes (i) expenses related to personnel and equipment comprising our selling network and those expenses related to warehousing at the points of sale and (ii) freight expenses of finished products from our producing plants to our points of sale and from our points of sale to our customers’ locations, which are all included as part of the line item titled “Operating expenses.” |
| (2) | In the income statements, CEMEX includes the line item titled “Operating earnings before other expenses, net” considering that is a relevant measure for CEMEX’s management as explained in note 2.1 to our 2018 audited consolidated financial statements included in the February 28 6-K. Under IFRS, while there are line items that are customarily included in the income statements, such as revenues, operating costs and expenses and financial revenues and expenses, among others, the inclusion of certain subtotals such as “Operating earnings before other expenses, net” and the display of such income statements varies significantly by industry and company according to specific needs. |
| (3) | Financial items include financial expenses and our financial income and other items, net, which includes our results in the sale of associates and remeasurement of previously held interest before change in control of associates, financial income, results from financial instruments, net (derivatives, fixed-income investments and other securities), foreign exchange results and effects of net present value on assets and liabilities and others, net. See notes 7 and 16 to our 2018 audited consolidated financial statements included in the February 28 6-K. |
30
| (4) | On October 31, 2015, after all agreed upon conditions precedent were satisfied, we completed the sale of our operations in Austria and Hungary to the Rohrdorfer Group for €165 million (U.S.$179 million or Ps3,090 million) after final adjustments for changes in cash and working capital balances as of the transfer date. Our combined operations in Austria and Hungary consisted of 29 aggregates quarries and 68 ready-mix plants. The operations in Austria and Hungary for the ten-month period ended October 31, 2015, included in our consolidated income statements, were reclassified to the single line item “Discontinued operations.” As per IFRS, our statement of financial position as of December 31, 2014 was not restated as a result of the sale of our operations in Austria and Hungary. On May 26, 2016, we closed the sale of our operations in Bangladesh and Thailand to Siam City Cement Public Company Ltd. (“SIAM Cement”) for U.S.$70 million. As per IFRS, our statement of financial position as of December 31, 2015 was not restated as a result of the sale of our operations in Thailand and Bangladesh. The operations in Bangladesh and Thailand for the period from January 1, 2016 to May 26, 2016 and the year 2015, included in our consolidated statement of operations, were reclassified to the single line item “Discontinued operations”. In addition, as of December 31, 2016, the Concrete Pipe Business was reclassified to assets held for sale and directly related liabilities on our consolidated statement of financial position, including U.S.$260 million (Ps5,369 million) of goodwill associated with the reporting segment in the United States that was proportionally allocated to these net assets based on their relative fair values. On January 31, 2017, one of CEMEX, S.A.B. de C.V.’s subsidiaries in the U.S. closed the sale of our U.S. Reinforced Concrete Pipe Manufacturing Business (the “Concrete Pipe Business”) to Quikrete Holdings, Inc. (“Quikrete”) for U.S.$500 million plus an additional U.S.$40 million contingent consideration based on future performance. Considering that we disposed of our entire concrete pipe division, the operations of the Concrete Pipe Business, as included in our consolidated income statements for the years ended December 31, 2015 and 2016 and for the one-month period ended January 31, 2017, were reclassified to the single line item “Discontinued Operations.” On June 30, 2017, one of our subsidiaries in the U.S. closed the divestment of its Pacific Northwest Materials Business (the “Pacific Northwest Materials Business”), consisting of aggregates, asphalt and ready-mix concrete operations in Oregon and Washington to Cadman Materials, Inc. (“Cadman Materials”), a Lehigh Hanson Inc. company and a subsidiary of HeidelbergCement Group, for U.S.$150 million. Considering the disposal of our Pacific Northwest Materials Business, these operations, as included in our consolidated income statements for the years ended December 31, 2015, 2016 and 2017, were reclassified to the single line item “Discontinued Operations.” On September 27, 2018, we concluded the sale of our construction materials operations in Brazil (the “Brazilian Operations”) through the sale to Votorantim Cimentos N/NE S.A. of all shares of our Brazilian subsidiary Cimento Vencemos Do Amazonas Ltda, consisting of a fluvial cement distribution terminal located in Manaus, Amazonas province, as well as the related operating license. The sale price was U.S.$31 million (Ps54 million). Our Brazilian Operations for the period from January 1 to September 27, 2018 and the years 2017 and 2016 were reclassified to the single line item “Discontinued Operations.” See note 4.2 to our 2018 audited consolidated financial statements included in the February 28 6-K. The information related to our consolidated income statement for the year ended December 31, 2015 has not been reclassified to present the financial result of that year of our Brazilian Operations in a single line item as discontinued operations. Also, the information related to our consolidated income statement for the year ended December 31, 2014 has not been reclassified to present the financial result of that year of our Brazilian Operations and the Pacific Northwest Materials Business in a single line item as discontinued operations. |
| (5) | On August 12, 2015, we entered into an agreement for the sale of our operations in Croatia, including assets in Bosnia and Herzegovina, Montenegro and Serbia, to Duna-Dráva Cement Kft. for €231 million (U.S.$243 million or Ps5,032 million). Those operations mainly consist of three cement plants with aggregate annual production capacity of approximately 2.4 million tons of cement, two aggregates quarries and seven ready-mix plants. On April 5, 2017, we announced that the European Commission issued a decision that restricted completion of the sale. Therefore, the sale of our operations in Croatia did not close, and we maintained our operations in Croatia, including assets in Bosnia and Herzegovina, Montenegro and Serbia (our “Croatian Operations”). As of December 31, 2016 and 2017 and for the years ended December 31, 2017, 2016 and 2015, the Croatian Operations are consolidated line-by-line in the financial statements. The information related to our consolidated financial statements for the year ended December 31, 2014 in which we previously reported the Croatian Operations as “Discontinued Operations” and “Assets held for sale,” has not been reclassified to present the Croatian Operations as part of continuing operations in our consolidated income statements or line-by-line in our consolidated statements of financial position. We believe that the effects are not significant. See note 4.2 to our 2018 audited consolidated financial statements included in the February 28 6-K. |
| (6) | CEMEX, S.A.B. de C.V.’s capital stock consists of Series A shares and Series B shares. Each CPO represents two Series A shares and one Series B share. As of December 31, 2018, approximately 99.1% of CEMEX, S.A.B. de C.V.’s outstanding share capital was represented by CPOs. Each ADS represents ten CPOs. |
| (7) | Earnings (loss) per share is calculated based upon the weighted average number of shares outstanding during the year, as described in note 22 to our 2018 audited consolidated financial statements included in the February 28 6-K. Basic earnings (loss) per CPO is determined by multiplying the basic earnings (loss) per share for each period by three (the number of shares underlying each CPO). Basic earnings (loss) per CPO is presented solely for the convenience of the reader and does not represent a measure under IFRS. As shown in notes 4.2 and 22 to our 2018 audited consolidated financial statements included in the February 28 6-K, and in connection with the sale of our operations in Austria, Hungary, Thailand, Bangladesh and the sales of Concrete Pipe Business and Pacific Northwest Materials Business, and the sale of our Brazilian Operations, for the year ended December 31, 2016, “Basic earnings per share” includes Ps0.30 from “Continuing operations,” for the year ended December 31, 2017, “Basic earnings per share” includes Ps0.26 from “Continuing operations” and for the year ended December 31, 2018, “Basic earnings per share” includes Ps0.22 from “Continuing operations.” In addition, for the years ended December 31, 2016 and 2017, “Basic earnings per share” includes Ps0.02 and Ps0.08, respectively, from “Discontinued operations.” Likewise, for the year ended December 31, 2016, “Diluted earnings per share” includes Ps0.30 from “Continuing operations,” for the year ended December 31, 2017, “Diluted earnings per share” includes Ps0.26 from “Continuing operations” and for the year ended December 31, 2018, “Diluted earnings per share” includes Ps0.22 from “Continuing operations.” In addition, for the years ended December 31, 2016, and 2017, “Diluted earnings per share” includes Ps0.02 and Ps0.08, respectively, from “Discontinued operations.” See note 22 to our 2018 audited consolidated financial statements included in the February 28 6-K. 1 |
| 1 | NTD: CX to confirm that disclosure as of year-end 2016 and 2017 is sufficient and that disclosure as of December 31, 2018 is not relevant in this paragraph. |
31
| (8) | CEMEX, S.A.B. de C.V. did not declare a dividend for fiscal years 2014, 2015, 2016 and 2017. For the fiscal year 2018, CEMEX, S.A.B. de C.V. has proposed that a cash dividend be authorized at CEMEX, S.A.B. de C.V.’s general ordinary shareholders meeting to be held on March 28, 2019. At each of CEMEX, S.A.B. de C.V.’s 2014, 2015, 2016 and 2017 annual general ordinary shareholders’ meetings, held on March 26, 2015, March 31, 2016, March 30, 2017 and April 5, 2018, respectively, CEMEX, S.A.B. de C.V.’s shareholders approved a recapitalization of retained earnings. New CPOs issued pursuant to each such recapitalization were allocated to shareholders on a pro-rata basis. As a result, shares equivalent to approximately 500 million CPOs, approximately 539 million CPOs, approximately 562 million CPOs and approximately 250 million were allocated to shareholders on a pro-rata basis in connection with the 2014, 2015, 2016 and 2017 recapitalizations, respectively. In each case, CPO holders received one new CPO for each 25 CPOs held and ADS holders received one new ADS for each 25 ADSs held. There was no cash distribution and no entitlement to fractional shares. |
| (9) | Based upon the total number of shares outstanding at the end of each period, expressed in millions of shares, and includes shares subject to financial derivative transactions, but does not include shares held by our subsidiaries. |
| (10) | As of December 31, 2014, 2015, 2016, 2017 and 2018, non-controlling interest includes U.S.$466 million (Ps6,869 million), U.S.$440 million (Ps7,581 million), U.S.$438 million (Ps9,075 million), U.S.$447 million (Ps8,784 million) and U.S.$444 million (Ps8,729 million), respectively, that represents the nominal amount of Perpetual Debentures, denominated in Dollars and Euros, issued by consolidated entities. In accordance with IFRS, these securities qualify as equity due to their perpetual nature and the option to defer the coupons. |
| (11) | Net working capital equals trade receivables, less allowance for doubtful accounts plus inventories, net, less trade payables. |
| (12) | Book value per share is calculated by dividing the total controlling interest by the number of shares outstanding. |
| (13) | Operating EBITDA equals operating earnings before other expenses, net, plus amortization and depreciation expenses. Operating EBITDA is calculated and presented because we believe that it is widely accepted as a financial indicator of our ability to internally fund capital expenditures and service or incur debt, and the consolidated ratio of Operating EBITDA to interest expense is calculated and presented because it is used to measure our performance under certain of our financing agreements. Operating EBITDA and such ratio are non-IFRS measures and should not be considered as indicators of our financial performance as alternatives to cash flow, as measures of liquidity or as being comparable to other similarly titled measures of other companies. Under IFRS, while there are line items that are customarily included in income statements prepared pursuant to IFRS, such as revenues, operating costs and expenses and financial revenues and expenses, among others, the inclusion of certain subtotals, such as operating earnings before other expenses, net, and the display of such income statement varies significantly by industry and company according to specific needs. Our Operating EBITDA may not be comparable to similarly titled measures reported by other companies due to potential differences in the method of calculation. Operating EBITDA is reconciled below to operating earnings before other expenses, net, as reported in the income statements, and to net cash flows provided by operating activities before financial expense, coupons on Perpetual Debentures and income taxes, as reported in the statement of cash flows. Financial expense under IFRS does not include coupon payments of the Perpetual Debentures issued by consolidated entities of Ps420 million in 2014, Ps432 million in 2015, Ps507 million in 2016, Ps482 million in 2017 and approximately Ps553 million in 2018, as described in note 20.4 to our 2018 audited consolidated financial statements included in the February 28 6-K. |
| For the Year Ended December 31, | ||||||||||||||||||||
| 2014 | 2015 | 2016 | 2017 | 2018 | ||||||||||||||||
| (in millions of Mexican Pesos) | ||||||||||||||||||||
| Reconciliation of Operating EBITDA to net cash flows provided by operations activities from continuing operations before financial expense, coupons on Perpetual Debentures and income taxes |
||||||||||||||||||||
| Operating EBITDA |
Ps | 35,556 | Ps | 41,534 | Ps | 51,605 | Ps | 48,600 | Ps | 49,266 | ||||||||||
| Less: |
||||||||||||||||||||
| Depreciation and amortization expense |
13,703 | 14,658 | 15,987 | 15,988 | 16,070 | |||||||||||||||
|
|
|
|
|
|
|
|
|
|
|
|
|
|
|
| ||||||
| Operating earnings before other expenses, net |
21,853 | 26,876 | 35,618 | 32,612 | 33,196 | |||||||||||||||
|
|
|
|
|
|
|
|
|
|
|
|
|
|
|
| ||||||
| Plus/minus: |
||||||||||||||||||||
| Changes in working capital excluding income taxes |
1,475 | 3,596 | 11,017 | 8,039 | (1,062 | ) | ||||||||||||||
| Depreciation and amortization expense |
13,703 | 14,658 | 15,987 | 15,988 | 16,070 | |||||||||||||||
| Other items, net |
(1,586 | ) | (1,689 | ) | (1,280 | ) | (5,219 | ) | (4,888 | ) | ||||||||||
|
|
|
|
|
|
|
|
|
|
|
|
|
|
|
| ||||||
| Net cash flow provided by operations activities from continuing operations before financial expense, coupons on Perpetual Debentures and income taxes |
Ps | 35,445 | Ps | 43,441 | Ps | 61,342 | Ps | 51,420 | Ps | 43,316 | ||||||||||
|
|
|
|
|
|
|
|
|
|
|
|
|
|
|
| ||||||
32
MANAGEMENT’S DISCUSSION AND ANALYSIS OF FINANCIAL CONDITION
AND RESULTS OF OPERATIONS
Overview
The following discussion and analysis should be read in conjunction with, and are qualified in their entirety by reference to, our audited consolidated financial statements for the years ended as of December 31, 2017 and 2018, and for each of the three years ended December 31, 2016, 2017 and 2018, included in the February 28 6-K.
The regulations of the SEC do not require foreign private issuers that prepare their financial statements based on IFRS (as published by IASB) to reconcile such financial statements to U.S. GAAP.
The percentage changes in cement sales volumes described in this report for our operations in a particular country or region include the number of tons of cement and/or the number of cubic meters of ready-mix concrete sold to our operations in other countries and regions. Likewise, unless otherwise indicated, the financial information of revenues presented in this report for our operations in each country or region includes the Mexican Peso amount of sales derived from sales of cement and ready-mix concrete to our operations in other countries and regions, which have been eliminated in the preparation of our 2018 audited consolidated financial statements included in the February 28 6-K.
Newly-Issued IFRS Adopted as of December 31, 2018
IFRS 9, Financial Instruments: classification and measurement (“IFRS 9”)
Effective January 1, 2018, IFRS 9 sets forth the guidance relating to the classification and measurement of financial assets and financial liabilities, the accounting for expected credit losses of financial assets and commitments to extend credits, as well as the requirements for hedge accounting; IFRS 9 replaced IAS 39, Financial instruments: recognition and measurement (“IAS 39”). We applied IFRS 9 prospectively. The accounting policies were changed to comply with IFRS 9. The changes required by IFRS 9 are described as follows:
Among other aspects, IFRS 9 changed the classification categories for financial assets under IAS 39 and replaced them with categories that more closely reflect the measurement method, the contractual cash flow characteristics and the entity’s business model for managing the financial asset:
| ● | Cash and cash equivalents, trade and other accounts receivable and other financial assets, which were classified as “Loans and receivables” and measured at amortized cost under IAS 39, are now classified as “Held to collect” under IFRS 9 and continue to be measured at amortized cost. |
| ● | Investments and non-current accounts receivable that were classified as “Held to maturity” and measured at amortized cost under IAS 39, are now classified as “Held to collect” under IFRS 9 and continue to be measured at amortized cost. |
| ● | Investments that were classified as “Held for trading” and measured at fair value through profit or loss under IAS 39, are now classified as “Other investments” under IFRS 9 and are measured at fair value through profit or loss. |
| ● | Certain investments that were classified as “Held for sale” and measured at fair value through other comprehensive income under IAS 39, are now considered as strategic investments under IFRS 9 and continue to be measured at fair value through other comprehensive income. |
Debt instruments and other financial obligations continue to be classified as “Loans” and measured at amortized cost under IFRS 9 and derivative financial instruments continue to be measured at fair value through profit or loss under IFRS 9.
33
We assessed which business models applied to our financial assets and liabilities as of the date of initial application of IFRS 9 and classified our financial instruments into the appropriate IFRS 9 categories. As of January 1, 2018, the changes due to the classification and measurement requirements under IFRS 9 did not impact either the measurement or carrying amount of financial assets and liabilities and there was no effect on our retained earnings.
In addition, under the new impairment model under IFRS 9 based on expected credit losses, impairment losses for the entire lifetime of financial assets, including trade accounts receivable, are recognized on initial recognition, and at each subsequent reporting period, even in the absence of a credit event or if a loss has not yet been incurred, accounting for their measurement, past events and current conditions, as well as reasonable and supportable forecasts affecting collectability. We developed an expected credit loss model applicable to our trade accounts receivable that considers the historical performance and economic environment, as well as the credit risk and expected developments for each group of customers and applied the simplified approach upon adoption of IFRS 9. The effects of the adoption of IFRS 9 on January 1, 2018, related to the expected credit loss model represented an increase in our allowance for expected credit losses of Ps570 million recognized against retained earnings, net of a deferred income tax asset of Ps154 million. The balances of such allowance and deferred tax assets increased from the reported amounts as of December 31, 2017, of Ps2,145 million and Ps14,817 million, respectively, to Ps2,715 million and Ps14,971 million as of January 1, 2018, respectively, after the adoption effects.
In connection with hedge accounting under IFRS 9, among other changes, there is a relief for entities in performing: a) the retrospective effectiveness test at inception of the hedging relationship and b) the requirement to maintain a prospective effectiveness ratio between 0.8 and 1.25 at each reporting date for purposes of sustaining the hedging designation, both requirements of IAS 39. Under IFRS 9, a hedging relationship can be established to the extent the entity considers, based on the analysis of the overall characteristics of the hedging and hedged items, that the hedge will be highly effective in the future and the hedge relationship at inception is aligned with the entity’s reported risk management strategy. IFRS 9 maintains the same hedge accounting categories of cash flow hedge, fair value hedge and hedge of a net investment established in IAS 39, as well as the requirement of recognizing the ineffective portion of a cash flow hedge immediately in the income statement. We performed an analysis of our derivative financial instruments upon adoption of IFRS 9 on January 1, 2018 and determined that the changes in hedge accounting described above did not impact either the measurement or carrying amount of the assets and liabilities related to our derivative financial instruments and there was no effect on our retained earnings.
IFRS 15, Revenues from contracts with customers (“IFRS 15”)
Under IFRS 15, an entity recognizes revenue to depict the transfer of promised goods or services to customers in an amount that reflects the consideration to which the entity expects to be entitled in exchange for those goods or services, following a five-step model: Step 1: Identify the contract(s) with a customer (agreement that creates enforceable rights and obligations); Step 2: Identify the different performance obligations (promises) in the contract and account for those separately; Step 3: Determine the transaction price (amount of consideration to which an entity expects to be entitled in exchange for transferring promised goods or services); Step 4: Allocate the transaction price to each performance obligation based on the relative stand-alone selling prices of each distinct good or service; and Step 5: Recognize revenue when (or as) the entity satisfies a performance obligation by transferring control of a promised good or service to the customer. A performance obligation may be satisfied at a point in time (typically for the sale of goods) or over time (typically for the sale of services and construction contracts). IFRS 15 also includes disclosure requirements to provide comprehensive information about the nature, amount, timing and uncertainty of revenue and cash flows arising from the entity’s contracts with customers. IFRS 15 became effective on January 1, 2018 and supersedes all existing guidance on revenue recognition.
After an extensive analysis of our contracts with customers, business practices and operating systems for all the reported periods in all the countries in which we operate in order to review the different performance obligations and other promises (discounts, loyalty programs, rebates, etc.) included in such contracts, aimed to determine the differences in the accounting recognition of revenue with respect to prior IFRS, we adopted IFRS 15 on January 1, 2018, using the retrospective approach, without any significant effects on our operating results and financial situation, and restated our previously reported amounts of revenues for 2017 and 2016, resulting in an initial reclassification of other provisions to contract liabilities of Ps660 million as of January 1, 2016, and a subsequent net decrease in revenue of Ps2 million in 2016 and a net decrease in revenue of Ps8 million in 2017 related to IFRS 15. See note 3 to our 2018 audited consolidated financial statements included in the February 28 6-K. These changes in revenues refer to certain discounts and rebates included in certain contracts and were recognized against deferred revenue as contract liabilities in the statement of financial position after IFRS 15 effects. See note 17 to our 2018 audited consolidated financial statements included in the February 28 6-K. Changes in equity upon adoption were not significant.
34
Critical Accounting Policies
The preparation of financial statements in accordance with IFRS requires management to make estimates and assumptions that affect the reported amounts of assets and liabilities and the disclosure of contingent assets and liabilities at the date of the financial statements, as well as the reported amounts of revenues and expenses during the period. These assumptions are reviewed on an ongoing basis using available information. Actual results could differ from these estimates.
The main items subject to estimates and assumptions by management include impairment tests of long-lived assets, recognition of deferred income tax assets, as well as the measurement of financial instruments at fair value and assets, liabilities related to employee benefits and revenue recognition. Significant judgment by management is required to appropriately assess the amounts of these assets and liabilities.
As of December 31, 2017 and 2018 and for the years ended December 31, 2016, 2017 and 2018, identified below are the accounting policies we have applied under IFRS that are critical to understanding our overall financial reporting.
Income Taxes
Our operations are subject to taxation in many different jurisdictions throughout the world. The effects reflected in the income statement for income taxes include the amounts incurred during the period and the amounts of deferred income taxes, determined according to the income tax law applicable to each subsidiary. Consolidated deferred income taxes represent the addition of the amounts determined in each subsidiary by applying the enacted statutory income tax rate to the total temporary differences resulting from comparing the book and taxable values of assets and liabilities, considering tax loss carryforwards as well as other recoverable tax credits, to the extent that it is probable that future taxable profits will be available against which they can be utilized. The measurement of deferred income taxes at the reporting period reflects the tax consequences that follow the manner in which CEMEX expects to recover or settle the carrying amount of its assets and liabilities. Deferred income taxes for the period represent the difference between balances of deferred income taxes at the beginning and the end of the period. Deferred income tax assets and liabilities relating to different tax jurisdictions are not offset. According to IFRS, all items charged or credited directly in stockholders’ equity or as part of other comprehensive income or loss for the period are recognized net of their current and deferred income tax effects. The effect of a change in enacted statutory tax rates is recognized in the period in which the change is officially enacted. Our worldwide tax position is highly complex and subject to numerous laws that require interpretation and application and that are not consistent among the countries in which we operate. Significant judgment is required to appropriately assess the amounts of tax assets and liabilities.
Deferred tax assets, mainly related to tax loss carryforwards, are reviewed at each reporting date and are reduced when it is not deemed probable that the related tax benefit will be realized, considering the aggregate amount of self-determined tax loss carryforwards that we believe will not be rejected by the tax authorities based on available evidence and the likelihood of recovering them prior to their expiration through an analysis of estimated future taxable income. If it is probable that the tax authorities would reject a self-determined deferred tax asset, we would decrease such asset. When it is considered that a deferred tax asset will not be recovered before its expiration, we would not recognize such deferred tax asset. Both situations would result in additional income tax expense for the period in which such determination is made. In order to determine whether it is probable that deferred tax assets will ultimately be recovered, we take into consideration all available positive and negative evidence, including factors such as market conditions, industry analysis, expansion plans, projected taxable income, carryforward periods, current tax structure, potential changes or adjustments in tax structure, tax planning strategies, future reversals of existing temporary differences. Likewise, we analyze our actual results versus our estimates, and adjust, as necessary, our tax asset valuations. If actual results vary from our estimates, the deferred tax asset and/or valuations may be affected, and necessary adjustments will be made based on relevant information in our income statement for such period.
35
The income tax effects from an uncertain tax position are recognized when it is probable that the position will be sustained based on its technical merits and assuming that the tax authorities will examine each position and have full knowledge of all relevant information, and they are measured using a cumulative probability model. Each position has been considered on its own, regardless of its relation to any other broader tax settlement. The probability threshold represents a positive assertion by management that we are entitled to the economic benefits of a tax position. If it is improbable for a tax position to be sustained, no benefits of the position are recognized. Our policy is to recognize interest and penalties related to unrecognized tax benefits as part of the income tax in the consolidated income statements.
Our overall tax strategy is to structure our worldwide operations to reduce or defer the payment of income taxes on a consolidated basis. Many of the activities we undertake in pursuing this tax reduction strategy are highly complex and involve interpretations of tax laws and regulations in multiple jurisdictions and are subject to review by the relevant taxing authorities. It is possible that the taxing authorities could challenge our application of these regulations to our operations and transactions. The taxing authorities have in the past challenged interpretations that we have made and have assessed additional taxes. Although we have, from time to time, paid some of these additional assessments, in general, we believe that these assessments have not been material and that we have been successful in sustaining our positions. No assurance can be given, however, that we will continue to be as successful as we have been in the past or that pending appeals of current tax assessments will be judged in our favor.
Our effective income tax rate is determined by dividing the line item “Income tax” in our consolidated income statements into the line item “Earnings before income tax.” This effective tax rate is further reconciled to our statutory tax rate applicable in Mexico and is presented in note 19.3 to our 2018 audited consolidated financial statements included in the February 28 6-K. A significant effect on our effective tax rate, and consequently in the reconciliation of our effective tax rate, relates to the difference between the statutory income tax rate in Mexico of 30% against the applicable income tax rates of each country where we operate. For the years ended December 31, 2016, 2017 and 2018, the statutory tax rates in our main operations were as follows:
| Country |
2016 | 2017 | 2018 | |||||||||
| Mexico |
30.0 | % | 30.0 | % | 30.0 | % | ||||||
| United States |
35.0 | % | 35.0 | % | 21.0 | % | ||||||
| United Kingdom |
20.0 | % | 19.3 | % | 19.3 | % | ||||||
| France |
34.4 | % | 34.4 | % | 34.4 | % | ||||||
| Germany |
28.2 | % | 28.2 | % | 28.2 | % | ||||||
| Spain |
25.0 | % | 25.0 | % | 25.0 | % | ||||||
| Philippines |
30.0 | % | 30.0 | % | 30.0 | % | ||||||
| Colombia |
40.0 | % | 40.0 | % | 37.0 | % | ||||||
| Egypt |
22.5 | % | 22.5 | % | 22.5 | % | ||||||
| Others |
7.8% - 39.0% | 7.8% - 39.0% | 7.8% - 39.0% | |||||||||
Our current and deferred income tax amounts included in our consolidated income statements are highly variable, and are subject, among other factors, to the amounts of taxable income determined in each jurisdiction in which we operate. Such amounts of taxable income depend on factors such as sale volumes and prices, costs and expenses, exchange rates fluctuations and interest on debt, among others, as well as on the estimated tax assets at the end of the period due to the expected future generation of taxable gains in each jurisdiction. See our discussion of operations included elsewhere in this “Management’s Discussion and Analysis of Financial Condition and Results of Operations.”
Derivative financial instruments
In compliance with the guidelines established by our Risk Management Committee, the restrictions in our debt agreements and our hedging strategy, we use derivative financial instruments with the objectives of: (a) changing the risk profile or setting a fixed the price of fuels and electric energy; (b) foreign exchange hedging; (c) hedging forecasted transactions; and (d) accomplishing other corporate objectives.
36
Derivative financial instruments are recognized as assets or liabilities in the balance sheet at their estimated fair values, and changes in such fair values are recognized in the income statements within “Financial income and other items, net” for the period in which they occur, except for changes in the fair value of derivative instruments associated with cash flow hedges, in which case, such changes in fair value are recognized in stockholders’ equity, and are reclassified to earnings as the interest expense of the related debt is accrued, in the case of interest rate swaps, or when the underlying products are consumed in the case of contracts on the price of raw materials, fuel and commodities. Likewise, in hedges of the net investment in foreign subsidiaries, changes in fair value are recognized in stockholders’ equity as part of the foreign currency translation result, which reversal to earnings would take place upon disposal of the foreign investment. During the reported periods, we have not designated any derivative instruments in fair value hedges. Derivative instruments are negotiated with institutions with significant financial capacity; therefore, we believe the risk of non-performance of the obligations agreed to by such counterparties to be minimal. See note 16.4 to our 2018 audited consolidated financial statements included in the February 28 6-K.
The estimated fair value under IFRS represents the price that would be received to sell an asset or paid to transfer a liability in an orderly transaction between market participants at the measurement date, considering the counterparty’s credit risk in the valuation, that is, an exit price or a market-based measurement.
The concept of exit value is premised on the existence of a market and market participants for the specific asset or liability. When there is no market and/or market participants willing to make a market, IFRS establishes a fair value hierarchy that prioritizes the inputs to valuation techniques used to measure fair value. The hierarchy gives the highest priority to unadjusted quoted prices in active markets for identical assets or liabilities (Level 1 measurements) and the lowest priority to measurements involving significant unobservable inputs (Level 3 measurements). The three levels of the fair value hierarchy are as follows:
| ● | Level 1—It represents quoted prices (unadjusted) in active markets for identical assets or liabilities that we have the ability to access at the measurement date. A quoted price in an active market provides the most reliable evidence of fair value and is used without adjustment to measure fair value whenever available. |
| ● | Level 2—These are inputs other than quoted prices in active markets that are observable for the asset or liability, either directly or indirectly, and are used mainly to determine the fair value of securities, investments or loans that are not actively traded. Level 2 inputs included equity prices, certain interest rates and yield curves, implied volatility, credit spreads and other market corroborated inputs, including inputs extrapolated from other observable inputs. In the absence of Level 1 inputs, we determined fair values by iteration of the applicable Level 2 inputs, the number of securities and/or the other relevant terms of the contract, as applicable. |
| ● | Level 3—These are unobservable inputs for the asset or liability. We use unobservable inputs to determine fair values, to the extent there are no Level 1 or Level 2 inputs, in valuation models such as Black-Scholes, binomial, discounted cash flows or multiples of Operating EBITDA, including risk assumptions consistent with what market participants would use to arrive at fair value. |
Significant judgment and estimates by management are required to appropriately identify the corresponding level of fair value applicable to each derivative financing transaction, as well as to assess the amounts of the resulting assets and liabilities, mainly in respect of Level 2 and Level 3 fair values, in order to account for the effects of derivative financial instruments in the financial statements. See note 16.4 to our 2018 audited consolidated financial statements included in the February 28 6-K.
Impairment of financial assets
Impairment losses of financial assets, including trade accounts receivable, are recognized using the expected credit loss model for the entire lifetime of such financial assets on initial recognition, and at each subsequent reporting period, even in the absence of a credit event or if a loss has not yet been incurred, considering for their measurement past events and current conditions, as well as reasonable and supportable forecasts affecting collectability.
Allowances for credit losses were established until December 31, 2017 based on incurred loss analyses over delinquent accounts considering aging of balances, the credit history and risk profile of each customer and legal processes to recover accounts receivable. Beginning in 2018, such allowances are determined and recognized upon origination of the trade accounts receivable based on a model that calculates the expected credit loss (“ECL”) of the trade accounts receivable. See note 2.1 to our 2018 audited consolidated financial statements included in the February 28 6-K.
37
Under this ECL model, we segment our accounts receivable in a matrix by country, type of client or homogeneous credit risk and days past due and determine for each segment an average rate of ECL, considering actual credit loss experience over the last 24 months and analyses of future delinquency, that is applied to the balance of accounts receivable. The average ECL rate increases in each segment of days past due until the rate is 100% for the segment of 365 days or more past due. See note 9 to our 2018 audited consolidated financial statements included in the February 28 6-K. Significant judgment and estimates by management are required to appropriately assess expected credit losses under IFRS 9.
Impairment of long-lived assets
Our statement of financial position reflects significant amounts of long-lived assets (including property, machinery and equipment, goodwill, intangible assets of definite life and other investments) associated with our operations throughout the world. Many of these amounts have resulted from past acquisitions, which have required us to reflect these assets at their fair market values at the dates of acquisition. According to their characteristics and the specific accounting rules related to them, we assess the recoverability of our long-lived assets at least once a year, normally during the fourth quarter, as is the case for goodwill, or whenever events or circumstances arise that we believe trigger a requirement to review such carrying values, as is the case with property, machinery and equipment and intangible assets of definite life.
Property, machinery and equipment, intangible assets of definite life and other investments are tested for impairment upon the occurrence of factors such as the occurrence of a significant adverse event, changes in our operating environment, changes in projected use or in technology, as well as expectations of lower operating results for each cash generating unit, in order to determine whether their carrying amounts may not be recovered. In such cases, an impairment loss is recorded in the income statements for the period when such determination is made within “Other expenses, net.” The impairment loss of an asset results from the excess of the asset’s carrying amount over its recoverable amount, corresponding to the higher of the fair value of the asset, less costs to sell such asset, and the asset’s value in use, the latter represented by the net present value of estimated cash flows related to the use and eventual disposal of the asset.
We do not have intangible assets of indefinite life other than goodwill. As mentioned above, goodwill is tested for impairment when required due to significant adverse changes or at least once a year, during the last quarter of such year, by determining the recoverable amount of the group of cash-generating units (“CGUs”) to which goodwill balances have been allocated, which consists of the higher of such group of CGUs fair value, less cost to sell and its value in use, represented by the discounted amount of estimated future cash flows to be generated by such CGUs to which goodwill has been allocated. Other intangible assets of indefinite life may be tested at the CGU or group of CGUs level, depending on their allocation. We determine discounted cash flows generally over periods of five years. In specific circumstances, when, according to our experience, actual results for a given cash-generating unit do not fairly reflect historical performance and most external economic variables provide us with confidence that a reasonably determinable improvement in the mid-term is expected in their operating results, management uses cash flow projections over a period of up to ten years, to the point in which future expected average performance resembles the historical average performance and to the extent we have detailed, explicit and reliable financial forecasts and is confident and can demonstrate its ability, based on past experience, to forecast cash flows accurately over that longer period. If the value in use of a group of CGUs to which goodwill has been allocated is lower than its corresponding carrying amount, we determine the fair value of our reporting units using methodologies generally accepted in the market to determine the value of entities, such as multiples of Operating EBITDA and by reference to other market transactions, among others. An impairment loss under IFRS is recognized within other expenses, net, if the recoverable amount is lower than the net book value of the group of CGUs to which goodwill has been allocated. Impairment charges recognized on goodwill are not reversed in subsequent periods.
38
For the years ended December 31, 2016, 2017 and 2018, the reportable segments we presented in note 4.4 to our 2018 audited consolidated financial statements included in the February 28 6-K represent our groups of CGUs to which goodwill has been allocated for purposes of testing goodwill for impairment. In arriving at this conclusion, we considered: (a) that after the acquisition, goodwill was allocated at the level of the reportable operating segment; (b) that the operating components that comprise the reported segment have similar economic characteristics; (c) that the reported segments are used by us to organize and evaluate its activities in its internal information system; (d) the homogenous nature of the items produced and traded in each operative component, which are all used by the construction industry; (e) the vertical integration in the value chain of the products comprising each component; (f) the type of clients, which are substantially similar in all components; (g) the operative integration among components; and (h) whether the compensation system of the specific country is based on the consolidated results of the reportable segment and not on the particular results of the components. In addition, the country level represents the lowest level within us at which goodwill is monitored for internal management purposes.
Significant judgment by management is required to appropriately assess the fair values and values in use of these assets. Impairment tests are significantly sensitive to, among other factors, the estimation of future prices of our products, the development of operating expenses, local and international economic trends in the construction industry, the long-term growth expectations in the different markets as well as the discount rates and the growth rates in perpetuity applied. For purposes of estimating future prices, we use, to the extent available, historical data plus the expected increase or decrease according to information issued by trusted external sources, such as national construction or cement producer chambers and/or in governmental economic expectations. Operating expenses are normally measured as a constant proportion of revenues, following past experience. However, such operating expenses are also reviewed considering external information sources in respect to inputs that behave according to international prices, such as gas and oil. We use specific pre-tax discount rates for each group of CGUs to which goodwill is allocated, which are applied to pre-tax cash flows. The amounts of estimated undiscounted cash flows are significantly sensitive to the growth rate in perpetuity applied. Likewise, the amounts of discounted estimated future cash flows are significantly sensitive to the weighted average cost of capital (discount rate) applied. The higher the growth rate in perpetuity applied, the higher the amount obtained of undiscounted future cash flows by group of CGUs obtained. Conversely, the higher the discount rate applied, the lower the amount obtained of discounted estimated future cash flows by group of CGUs obtained. Additionally, we monitor the useful lives assigned to these long-lived assets for purposes of depreciation and amortization, when applicable. This determination is subjective and is integral to the determination of whether impairment has occurred.
During the last quarter of each of 2016, 2017 and 2018, we performed our annual goodwill impairment test. Based on these analyses, during 2017, in connection with the operating segment in Spain, considering the uncertainty over the improvement indicators affecting the country’s construction industry, and consequently in the expected consumption of cement, ready-mix concrete and aggregates, partially a result of the country’s complex prevailing political environment, which has limited expenditure in infrastructure projects, as well as the uncertainty in the expected price recovery and the effects of increased competition and imports, our management determined that the net book value of such operating segment in Spain exceeded the amount of the net present value of projected cash flows by Ps1,920 million (U.S.$98 million). As a result, we recognized an impairment loss of goodwill in 2017 for the aforementioned amount as part of “Other expenses, net” in the income statement against the related goodwill balance. During 2018 and 2016, we did not determine impairment losses of goodwill. See note 15.2 to our 2018 audited consolidated financial statements included in the February 28 6-K.
Pretax discount rates and long-term growth rates used to determine the discounted cash flows in the group of CGUs with the main goodwill balances in 2016, 2017 and 2018 are as follows:
| Discount rates | Growth rates | |||||||||||||||||||||||
| Operating segments |
2016 | 2017 | 2018 | 2016 | 2017 | 2018 | ||||||||||||||||||
| United States |
8.6 | % | 8.8 | % | 8.5 | % | 2.5 | % | 2.5 | % | 2.5 | % | ||||||||||||
| Spain |
9.5 | % | 9.5 | % | 8.8 | % | 1.6 | % | 1.7 | % | 1.7 | % | ||||||||||||
| Mexico |
9.8 | % | 10.2 | % | 9.4 | % | 2.9 | % | 2.7 | % | 3.0 | % | ||||||||||||
| Colombia |
10.0 | % | 10.5 | % | 9.5 | % | 4.0 | % | 3.7 | % | 3.6 | % | ||||||||||||
| France |
9.1 | % | 9.0 | % | 8.4 | % | 1.8 | % | 1.8 | % | 1.6 | % | ||||||||||||
| United Arab Emirates |
10.2 | % | 10.4 | % | 11.0 | % | 3.4 | % | 3.1 | % | 2.9 | % | ||||||||||||
| United Kingdom |
8.8 | % | 9.0 | % | 8.4 | % | 1.9 | % | 1.7 | % | 1.6 | % | ||||||||||||
| Egypt |
11.4 | % | 11.8 | % | 10.8 | % | 6.0 | % | 6.0 | % | 6.0 | % | ||||||||||||
| Range of discount rates in other countries |
9.1% - 12.8% | 9.1% - 11.7% | 8.5% - 13.3% | 2.2% - 7.0% | 2.3% - 6.8% | 2.5% - 6.9% | ||||||||||||||||||
39
As of December 31, 2018, the discount rates we used in our cash flows projections in the countries with the most significant goodwill balances decreased slightly, in most cases, within the range of 0.3% up to 1 percentage point, except for the United Arab Emirates and the Caribbean, as compared to the values determined in 2017. This reduction was mainly attributable to a decrease in CEMEX, S.A.B. de C.V.’s stock volatility (beta) and general decreases in the country-specific sovereign yields in the majority of the countries where we operate and the weighing of debt in the calculation effects that were partially offset for increases during 2018 in the funding cost observed in the industry that changed from 6.1% in 2017 to 7.3% in 2018 and the risk free rate associated with us which increased from 2.8% in 2017 to 2.9% in 2018. As of December 31, 2017, the discount rates we used in our cash flow projections increased slightly in countries with the most significant goodwill balances as compared to the values determined in 2016. During the year, the funding cost observed in the industry decreased from 6.2% in 2016 to 6.1% in 2017, and the risk multiple attributed to us also decreased from approximately 1.29 in 2016 to 1.26 in 2017. Nonetheless, these decreases were offset by an increase in the risk-free rate from 2.70% in 2016 to 2.76% in 2017, as well as by overall increases in the sovereign risk rates of certain major countries. As of December 31, 2016, the discount rates remained almost flat in most cases as compared to the values determined in 2015. Among other factors, the funding cost observed in the industry decreased from 6.9% in 2015 to 6.2% in 2016, and the risk-free rate also decreased from approximately 3.2% in 2015 to 2.7% in 2016. Nonetheless, these increases were offset by reductions in 2016 in the country-specific sovereign yields for the majority of the countries where CEMEX operates. With respect to long-term growth rates, following general practice under IFRS, CEMEX uses country-specific rates, which are mainly obtained from the Consensus Economics, a compilation of analysts’ forecasts worldwide, or from the International Monetary Fund when the first are not available for a specific country.
In connection with our assumptions included in the table above, we performed sensitivity analyses to changes in assumptions, affecting the value in use of all groups of cash-generating units with an independent reasonably possible increase of 1% in the pre-tax discount rate and an independent possible decrease of 1% in the long-term growth rate. In addition, we performed cross-check analyses for reasonableness of our results using multiples of Operating EBITDA. In order to arrive at these multiples, which represent a reasonableness check of our discounted cash flow models; we determined a weighted average of multiples of Operating EBITDA to enterprise value observed in the industry and/or in recent mergers and acquisitions in the industry. The average multiple was then applied to a stabilized amount of Operating EBITDA and the result was compared to the corresponding carrying amount for each group of cash-generating units to which goodwill has been allocated. We considered an industry weighted average Operating EBITDA multiple of 9.0 times for each of 2016 and 2017 and 11.1 times for 2018. The lowest multiple observed in our benchmark as of December 31, 2016, 2017 and 2018, was 5.9 times, 6.5 times and 6.7 times, respectively, and the highest was 18.3 times, 18.9 times and 14.9 times, respectively.
As of December 31, 2016, 2017 and 2018, except for our operating segment in Spain described above, in which we determined an impairment loss of goodwill in 2017, none of our sensitivity analyses resulted in a potential impairment risk in our operating segments. Nonetheless, we continually monitor the evolution of the specific cash-generating units to which goodwill has been allocated and, in the event that the relevant economic variables and the related cash flows projections would be negatively affected, it may result in a goodwill impairment loss in the future.
As of December 31, 2017 and 2018, goodwill allocated to the United States accounted in both years for 78% of our total amount of consolidated goodwill. In connection with our determination of value in use relative to our groups of CGUs in the United States in the reported periods, we have considered several factors, such as the historical performance of such operating segment, including operating results in recent years, the long-term nature of our investment, the recent signs of recovery in the construction industry, the significant economic barriers for new potential competitors considering the high investment required and the lack of susceptibility of the industry to technology improvements or alternate construction products, among other factors. We have also considered recent developments in our operations in the United States, such as the decrease in ready-mix concrete volumes of approximately 1% in 2017, affected by the hurricanes occurred in Texas and Florida during the year, and the increase of 1% in 2016, and the increases in ready-mix concrete prices of approximately 2% in 2018, 1% in 2017 and 1% in 2016, which are key drivers for cement consumption and our profitability, and which trends are expected to continue over the next few years, as anticipated in our cash flow projections.
40
As a result of impairment tests conducted on several cash-generating units considering certain triggering events, mainly: a) the closing and/or reduction of operations of cement and ready-mix concrete plants resulting from adjusting our supply to current demand conditions, such as the situation in Puerto Rico in the last quarter of 2016 due to the adverse outlook and the overall uncertain economic conditions in such country, b) the transferring of installed capacity to more efficient plants, such as the change in operating model of a cement mill to distribution center in Colombia and c) the recoverability of certain investments in Colombia, we recognized impairment losses on property, plant and equipment, for an aggregate amount of Ps1,899 million (U.S.$101 million), Ps984 million (U.S.$52 million) and Ps445 million (U.S.$23 million) in 2016, 2017 and 2018, respectively, and adjusted the related fixed assets to their estimated value in use in those circumstances in which the assets would continue in operation based on estimated cash flows during their remaining useful life, or to their realizable value, in case of permanent shut down.
During 2016, 2017 and 2018, the breakdown of impairment losses of fixed assets by country was as follows:
| For the Year Ended December 31, | ||||||||||||
| 2016 | 2017 | 2018 | ||||||||||
| (in millions of Mexican Pesos) | ||||||||||||
| United States |
Ps277 | Ps153 | Ps252 | |||||||||
| Poland |
— | — | 94 | |||||||||
| Colombia |
454 | — | 37 | |||||||||
| Spain |
— | 452 | 35 | |||||||||
| Mexico |
46 | 45 | 25 | |||||||||
| Czech Republic |
— | 157 | — | |||||||||
| Panama |
— | 56 | — | |||||||||
| France |
— | 50 | — | |||||||||
| Latvia |
— | 46 | — | |||||||||
| Puerto Rico |
1,087 | — | — | |||||||||
| Others |
25 | 25 | 2 | |||||||||
|
|
|
|
|
|
|
|||||||
| Ps 1,899 | Ps 984 | Ps 445 | ||||||||||
See note 14 to our 2018 audited consolidated financial statements included in the February 28 6-K.
Assets and liabilities related to employee benefits
The costs associated with our employees’ benefits for: (a) defined benefit pension plans and (b) other post-employment benefits, primarily comprised of health care benefits, life insurance and seniority premiums, granted by us and/or pursuant to applicable law, are recognized as services rendered, based on actuarial estimations of the benefits’ present value with the advice of external actuaries. For certain pension plans, we have created irrevocable trust funds to cover future benefit payments (“plan assets”). These plan assets are valued at their estimated fair value at the statement of financial position date. The actuarial assumptions and accounting policy consider: (a) the use of nominal rates; (b) a single rate is used for the determination of the expected return on plan assets and the discount of the benefits obligation to present value; (c) a net interest is recognized on the net defined benefit liability (liability minus plan assets); and (d) all actuarial gains and losses for the period, related to differences between the projected and real actuarial assumptions at the end of the period, as well as the difference between the expected and real return on plan assets, are recognized as part of “Other items of comprehensive income, net” within stockholders’ equity.
The service cost, corresponding to the increase in the obligation for additional benefits earned by employees during the period, is recognized within operating costs and expenses. The net interest cost, resulting from the increase in obligations for changes in net present value (NPV) and the change during the period in the estimated fair value of plan assets, is recognized within “Financial income and other items, net.”
The effects from modifications to the pension plans that affect the cost of past services are recognized within operating costs and expenses over the period in which such modifications become effective to the employees or without delay if changes are effective immediately. Likewise, the effects from curtailments and/or settlements of obligations occurring during the period, associated with events that significantly reduce the cost of future services and/or reduce significantly the population subject to pension benefits, respectively, are recognized within operating costs and expenses.
41
Revenue Recognition
As previously mentioned, we adopted IFRS 15 on January 1, 2018, using the retrospective approach. Our policies under IFRS 15 are as follows:
Revenue is recognized at a point in time or over time in the amount of the price, before tax on sales, expected to be received by our subsidiaries for goods and services supplied as a result of their ordinary activities, as contractual performance obligations are fulfilled, and control of goods and services passes to the customer. Revenues are decreased by any trade discounts or volume rebates granted to customers. Transactions between related parties are eliminated in consolidation.
We recognize variable consideration when it is highly probable that a significant reversal in the amount of cumulative revenue recognized for the contract will not occur and is measured using the expected value or the most likely amount method, whichever is expected to better predict the amount based on the terms and conditions of the contract.
Revenue from trading activities, in which we acquire finished goods from a third party and subsequently sell the goods to another third-party, are recognized on a gross basis, considering that we assume the total risk on the goods purchased, not acting as agent or broker.
When revenue is earned over time as contractual performance obligations are satisfied, which is the case of construction contracts, we apply the stage of completion method to measure revenue, which represents: (i) the proportion that contract costs incurred for work performed to date bear to the estimated total contract costs; (ii) the surveys of work performed; or (iii) the physical proportion of the contract work completed, whichever better reflects the percentage of completion under the specific circumstances. Revenue and costs related to construction contracts are recognized in the period in which the work is performed by reference to the contract’s stage of completion at the end of the period, considering that the following have been defined: (a) each party’s enforceable rights regarding the asset under construction; (b) the consideration to be exchanged; (c) the manner and terms of settlement; (d) actual costs incurred and contract costs required to complete the asset are effectively controlled; and (e) it is probable that the economic benefits associated with the contract will flow to the entity. Progress payments and advances received from customers do not reflect the work performed and are recognized as a short or long-term advanced payments, as appropriate.
Newly-Issued IFRS not Adopted as of December 31, 2018
There are a number of IFRS that were issued but not adopted as of December 31, 2018.
IFRS 16, Leases (“IFRS 16”)
IFRS 16 defines leases as any contract or part of a contract that conveys to the lessee the right to use an asset for a period of time in exchange for consideration and the lessee directs the use of the identified asset throughout that period. In summary, IFRS 16 introduces a single lessee accounting model, and requires a lessee to recognize, for all leases, allowing exemptions in case of the leases with a term of less than 12 months or when the underlying asset is of low value, assets for the right-of-use the underlying asset against a corresponding financial liability, representing the net present value of estimated lease payments under the contract, with a single income statement model in which a lessee recognizes amortization of the right-of-use asset and interest on the lease liability. A lessee shall present either in the statement of financial position, or disclose in the notes, right-of-use assets separately from other assets, as well as lease liabilities separately from other liabilities. IFRS 16 became effective as of January 1, 2019 and supersedes all their current standards and interpretations related to lease accounting.
As of December 31, 2018, by means of analyses of our outstanding lease contracts and other contracts that may have embedded the use of an asset and the assessment of the most relevant characteristics of such contracts (types of assets, committed payments, maturity dates, renewal clauses, etc.), we had substantially concluded the inventory and measurement of our leases for purposes of adopting IFRS 16 that is in our final review. Moreover, we defined our accounting policy under IFRS 16 and will apply the recognition exception for short-term leases and low-
42
value assets, as well as the practical expedient to not separate the non-lease component from the lease component included in the same contract. We adopted IFRS 16 effective January 1, 2019 using the full retrospective approach pursuant to which prior periods will be restated. Upon adoption of IFRS 16, we estimated a range for our opening statement of financial position effects as of January 1, 2017, as follows:
| As of January 1, 2017 | ||||||||
| Low | High | |||||||
| (in millions of U.S. dollars) | ||||||||
| Assets for the right-of-use |
$ | 920 | $ | 942 | ||||
| Financial liabilities |
(1,030) | (1,060) | ||||||
| Retained earnings1 |
$ | (110) | $ | (118) | ||||
| (1) | The effect refers to a timing difference between depreciation expense of the assets calculated under the straight-line method and the interest expense from the liability determined under the effective interest rate method since the beginning of the contracts. This difference will reverse over the remaining life of the contracts. |
In addition to IFRS 16, there are several amendments or new IFRS that were issued but not yet effective as of December 31, 2018. See note 2.20 to our audited consolidated financial statements included in the February 28 6-K.
RESULTS OF OPERATIONS
Consolidation of Our Results of Operations
Our 2018 audited consolidated financial statements included in the February 28 6-K include those subsidiaries in which we hold a controlling interest or which we otherwise control. Control exists when we have the power, directly or indirectly, to govern the administrative, financial and operating policies of an entity in order to obtain benefits from its activities.
Investments in associates are accounted for by the equity method, when we have significant influence, which is generally presumed with a minimum equity interest of 20% unless it is proven that we have significant influence with a lower percentage. Under the equity method, after acquisition, the investment’s original cost is adjusted for the proportional interest of the holding company in the associate’s equity and earnings, considering the effects of inflation.
All balances and transactions between the group subsidiaries have been eliminated in consolidation.
Discontinued operations
Considering the disposal of entire reportable operating segments, our income statements present in the single line item of “Discontinued operations,” the results of: (a) our construction materials operations in Brazil sold on September 27, 2018, for the years 2016, 2017 and the period from January 1 to September 27, 2018; (b) our Pacific Northwest Materials Business operations in the United States sold on June 30, 2017, for the year 2016 and the six-months ended June 30, 2017; (c) our Concrete Pipe Business operations in the United States sold on January 31, 2017, for the year 2016 and the one-month ended January 31, 2017; and (d) our operations in Bangladesh and Thailand sold on May 26, 2016, for the period from January 1 to May 26, 2016. Discontinued operations are presented net of income tax. See note 4.2 to our 2018 audited consolidated financial statements included in the February 28 6-K.
43
Significant transactions
For the years ended December 31, 2016, 2017 and 2018, our consolidated results reflect the following transactions:
| ● | In August 2018, a subsidiary of CEMEX, S.A.B. de C.V. in the United Kingdom acquired the shares of the ready-mix producer Procon Readymix Ltd (“Procon”) for an amount in Pounds Sterling equivalent to U.S.$22 million, considering the Pound Sterling to Dollar exchange rate as of August 31, 2018. See note 4.1 to our 2018 audited consolidated financial statements included in the February 28 6-K. |
| ● | On September 27, 2018, a subsidiary of CEMEX, S.A.B. de C.V. concluded the sale of our Brazilian Operations through the sale to Votorantim Cimentos N/NE S.A. of all the shares of our Brazilian subsidiary Cimento Vencemos Do Amazonas Ltda, consisting of a fluvial cement distribution terminal located in Manaus, Amazonas province, as well as the related operating license. The sale price was U.S.$31 million (Ps54 million). See note 4.2 to our 2018 audited consolidated financial statements included in the February 28 6-K. |
| ● | On September 29, 2017, one of our subsidiaries in the U.S. closed the divestment of the Block USA Materials Business, consisting of concrete block, architectural block, concrete pavers, retaining walls and building material operations in Alabama, Georgia, Mississippi and Florida, to Oldcastle APG South, Inc. (“Oldcastle”) for U.S.$38 million. The proceeds obtained from this sale were used mainly for debt reduction and general corporate purposes. |
| ● | On September 28, 2017, CEMEX, S.A.B. de C.V. sold its then remaining direct interest in Grupo Cementos de Chihuahua, S.A.B. de C.V. (“GCC”), consisting of 31,483,332 shares of common stock of GCC, representing 9.47% of the equity capital of GCC for U.S.$168 million (Ps3,012 million), which was used for debt reduction and general corporate purposes. Following this sale of shares, we no longer held a direct interest in GCC but continued to hold an indirect share of 20% in GCC through our minority interest in CAMCEM, S.A. de C.V. (“CAMCEM”). |
| ● | On June 30, 2017, one of our subsidiaries in the U.S. closed the divestment of the Pacific Northwest Materials Business, consisting of aggregates, asphalt and ready-mix concrete operations in Oregon and Washington to Cadman Materials for U.S.$150 million. The proceeds obtained from this sale were used mainly for debt reduction and general corporate purposes. |
| ● | On February 15, 2017, we sold 45,000,000 shares of common stock of GCC, representing 13.53% of the equity capital of GCC, at a price of Ps95 per share in a public offering to investors in Mexico authorized by the Comisión Nacional Bancaria y de Valores (Mexican National Banking and Securities Commission) (the “CNBV”) and in a concurrent private placement to eligible investors outside of Mexico. Prior to the offerings, CEMEX, S.A.B. de C.V. owned a 23% direct interest in GCC and a minority interest in CAMCEM, an entity which owns a majority interest in GCC. After the GCC offerings, CEMEX, S.A.B. de C.V. owned a 9.47% direct interest in GCC and a minority interest in CAMCEM. Proceeds from the sale were Ps4,094 million (U.S.$210 million). The proceeds from the GCC shares offerings were used for general corporate purposes. |
| ● | On February 10, 2017, one of our subsidiaries in the United States sold its Fairborn, Ohio cement plant and cement terminal in Columbus, Ohio to Eagle Materials for U.S.$400 million. The proceeds obtained from this transaction were used mainly for debt reduction and for general corporate purposes. |
| ● | On January 31, 2017, one of CEMEX, S.A.B. de C.V.’s subsidiaries in the U.S. closed the sale of the Concrete Pipe Business to Quikrete for U.S.$500 million plus an additional U.S.$40 million contingent consideration based on future performance. |
| ● | On December 5, 2016, Sierra Trading (“Sierra”), one of CEMEX, S.A.B. de C.V.’s indirect subsidiaries, presented the Offer to all shareholders of TCL, a company then publicly listed in Trinidad and Tobago, Jamaica and Barbados, to acquire up to 132,616,942 ordinary shares in TCL, pursuant to which Sierra offered the Offer Price payable, at the option of shareholders of TCL except for shareholders of TCL in Barbados, in either TT$ or U.S.$ in Trinidad, and Jamaican Dollars or U.S.$ in Jamaica TCL. The Offer Price represented a premium of 50% over the December 1, 2016 closing price of TCL’s shares on the Trinidad and Tobago Stock Exchange. The total number of TCL shares tendered and accepted in response to the Offer was 113,629,723 which, together with Sierra’s pre-existing shareholding in TCL (147,994,188 shares), represent 69.83% of the outstanding TCL shares. The total cash payment by Sierra for the tendered shares was U.S.$86 million. CEMEX started consolidating TCL for financial reporting purposes on February 1, 2017. In March 2017, TCL de-listed from the Jamaica and Barbados stock exchanges. TCL’s subsidiaries include, but are not limited to CCCL, a publicly listed company in Jamaica, and Arawak, which, as of December 31, 2018, owned cement plants in Jamaica and Barbados, respectively; |
44
| ● | On December 2, 2016, we agreed to the sale of our assets and operations related to our ready-mix concrete pumping business in Mexico to Mexico of Pumping Team S.L.L. (“Pumping Team”), a specialist in the supply of ready-mix concrete pumping services based in Spain, for Ps1,649 million. This agreement included the sale of fixed assets upon closing of the transaction for Ps309 million plus administrative and client and market development services. Under this agreement, we will also lease facilities in Mexico to Pumping Team over a period of ten years with the possibility to extend for three additional years, for an aggregate initial amount of Ps1,340 million, plus a contingent revenue subject to results for up to Ps557 million linked to annual metrics beginning in the first year and up to the fifth year of the agreement. On April 28, 2017, after receiving the approval by the Mexican authorities, we concluded the sale. |
| ● | On November 18, 2016, after all conditions precedent were satisfied, CEMEX, S.A.B. de C.V. announced that it had closed the sale of certain assets in the U.S. to GCC for U.S.$306 million (Ps6,340 million). The assets were sold by an affiliate of CEMEX to an affiliate of GCC in the U.S., and mainly consisted of CEMEX’s cement plant in Odessa, Texas, two cement terminals and the building materials business in El Paso, Texas and Las Cruces, New Mexico. |
| ● | On July 18, 2016, CHP closed its initial public offering of 45% of its common shares in the Philippines, and 100% of CHP’s common shares started trading on the Philippine Stock Exchange under the ticker “CHP.” As of December 31, 2017, CASE, an indirect subsidiary of CEMEX, S.A.B. de C.V., directly owned 55% of CHP’s outstanding common shares. The net proceeds to CHP from its initial public offering were U.S.$507 million after deducting estimated underwriting discounts and commissions, and other estimated offering expenses payable by CHP. CHP used the net proceeds from the initial public offering to repay existing indebtedness owed to BDO Unibank and to an indirect subsidiary of CEMEX, S.A.B. de C.V. |
| ● | On May 26, 2016, we closed the sale of our operations in Bangladesh and Thailand to SIAM Cement for U.S.$70 million. The proceeds from this transaction were used mainly for debt reduction and for general corporate purposes. See note 4.2 to our 2018 audited consolidated financial statements included in the February 28 6-K. |
Selected Consolidated Income Statements Data
The following table sets forth our selected consolidated income statements data for each of the three years ended December 31, 2016, 2017 and 2018, expressed as a percentage of revenues.
| Year Ended December 31, | ||||||||||||
| 2016 | 2017 | 2018 | ||||||||||
| Revenues |
100% | 100% | 100% | |||||||||
| Cost of sales |
(64.1) | (65.6) | (66.1) | |||||||||
| Gross profit |
35.9 | 34.4 | 33.9 | |||||||||
| Operating expenses |
(21.6) | (21.7) | (21.9) | |||||||||
| Operating earnings before other expenses, net |
14.3 | 12.7 | 12.0 | |||||||||
| Other expenses, net |
(0.7) | (1.5) | (2.1) | |||||||||
| Operating earnings |
13.6 | 11.2 | 9.9 | |||||||||
| Financial expense |
(8.6) | (7.5) | (4.6) | |||||||||
| Financial income and other items, net |
1.8 | 1.4 | 0.03 | |||||||||
| Share of profit on equity accounted investees |
0.3 | 0.2 | 0.3 | |||||||||
| Earnings before income tax |
7.1 | 5.3 | 5.6 | |||||||||
| Income tax |
(1.3) | (0.2) | (1.6) | |||||||||
| Net income from continuing operations |
5.8 | 5.1 | 4.0 | |||||||||
| Discontinued operations |
0.3 | 1.4 | 0.1 | |||||||||
| Consolidated net income |
6.1 | 6.5 | 4.1 | |||||||||
| Non-controlling interest net income |
0.5 | 0.6 | 0.3 | |||||||||
| Controlling interest net income |
5.6 | 5.9 | 3.8 | |||||||||
45
Year Ended December 31, 2017 Compared to Year Ended December 31, 2018
Summarized in the table below are the percentage (%) increases (+) and decreases (-) for the year ended December 31, 2018, compared to the year ended December 31, 2017, in our domestic cement and ready-mix concrete sales volumes, as well as export sales volumes of cement and domestic cement and ready-mix concrete average sales prices for each of our reportable segments.
Reportable segments represent the components of CEMEX that engage in business activities from which we may earn revenues and incur expenses, whose operating results are regularly reviewed by the entity’s top management to make decisions about resources to be allocated to the segments and assess their performance, and for which discrete financial information is available. We operate geographically and by line of business on a regional basis. For the reported periods, our operations were organized in five geographical regions, each under the supervision of a regional president, as follows: 1) Mexico, 2) United States, 3) Europe, 4) South, Central America and the Caribbean (“SCA&C”) and 5) Asia, Middle East and Africa. The accounting policies applied to determine the financial information by reportable segment are consistent with those described in note 2 to our 2018 audited consolidated financial statements included in the February 28 6-K.
Considering similar regional and economic characteristics and/or materiality, certain countries have been aggregated and presented as single line items as follows: (a) “Rest of Europe” refers mainly to our operations and activities in Croatia, Latvia, Scandinavia and Finland; (b) “Rest of South, Central America and the Caribbean” refers mainly to our operations and activities in Puerto Rico, Nicaragua, Jamaica, the Caribbean, Guatemala and El Salvador, excluding the acquired operations of the Caribbean TCL; (c) “Caribbean TCL” refers to TCL’s operations mainly in Trinidad and Tobago, Jamaica, Guyana and Barbados; and (d) “Rest of Asia, Middle East and Africa” refers mainly to our operations in the United Arab Emirates. The segment “Others” refers to: (1) cement trade maritime operations, (2) Neoris N.V., our subsidiary involved in the business of information technology solutions, (3) CEMEX, S.A.B. de C.V., other corporate entities and finance subsidiaries and (4) other minor subsidiaries with different lines of business.
The table below and the other volume data presented by reportable segment in this “—Year Ended December 31, 2018 Compared to Year Ended December 31, 2017” section are presented before eliminations resulting from consolidation (including those shown in note 4.4 to our 2018 audited consolidated financial statements included in the February 28 6-K).
| Domestic Sales Volumes | Export Sales Volumes |
Average Domestic Sales Prices in Local Currency(1) | ||||||||||||||||||
| Reportable Segment |
Cement | Ready-Mix Concrete |
Cement | Cement | Ready-Mix Concrete | |||||||||||||||
| Mexico |
+1% | +10% | +51% | +3% | +8% | |||||||||||||||
| United States |
+5% | +8% | — | +3% | +2% | |||||||||||||||
| Europe |
||||||||||||||||||||
| United Kingdom |
-4% | -5% | — | -1% | Flat | |||||||||||||||
| France |
— | Flat | — | — | +4% | |||||||||||||||
| Germany |
-1% | -9% | -24% | +2% | +6% | |||||||||||||||
| Spain |
+4% | +34% | -30% | +5% | +2% | |||||||||||||||
| Poland |
+7% | +4% | -60% | +6% | +10% | |||||||||||||||
| Czech Republic |
+6% | -1% | -5% | +3% | +4% | |||||||||||||||
| Rest of Europe |
-4% | -9% | -1% | +1% | +3% | |||||||||||||||
| South, Central America and the Caribbean |
||||||||||||||||||||
| Colombia |
-6% | -11% | — | +2% | Flat | |||||||||||||||
| Panama |
-18% | -15% | — | -1% | -7% | |||||||||||||||
| Costa Rica |
+1% | +6% | -19% | +3% | +5% | |||||||||||||||
| Caribbean TCL |
+6% | +10% | +22% | +2% | -11% | |||||||||||||||
| Dominican Republic |
-1% | -8% | -10% | +11% | +4% | |||||||||||||||
| Rest of South, Central America and the Caribbean |
+3% | -21% | -84% | Flat | -3% | |||||||||||||||
| Asia, Middle East and Africa |
||||||||||||||||||||
| Philippines |
+7% | Flat | +4% | +1% | Flat | |||||||||||||||
| Egypt |
Flat | -21% | — | +18% | +33% | |||||||||||||||
| Israel |
— | +4% | — | — | +2% | |||||||||||||||
| Rest of Asia, Middle East and Africa |
-20% | +4% | -28% | Flat | -1% | |||||||||||||||
46
“—” = Not Applicable
(1) Represents the average change in domestic cement and ready-mix concrete prices in local currency terms. For purposes of a reportable segment consisting of a region, the average prices in local currency terms for each individual country within the region are first translated into Dollar terms (except for the Rest of Europe, in which they are translated first into Euros) at the exchange rates in effect as of the end of the reporting period. Variations for a region represent the weighted average change of prices in Dollar terms (except for the Rest of Europe, in which they represent the weighted average change of prices in Euros) based on total sales volumes in the region.
On a consolidated basis, our cement sales volumes increased 2%, from 68.2 million tons in 2017 to 69.4 million tons in 2018, and our ready-mix concrete sales volumes increased 3%, from 51.7 million cubic meters in 2017 to 53.3 cubic meters in 2018. Our revenues increased 8%, from Ps257,437 million in 2017 to Ps276,855 million in 2018, and our operating earnings before other expenses, net increased 2%, from Ps32,612 million in 2017 to Ps33,196 million in 2018.
The following tables present selected financial information of revenues and operating earnings before other expenses, net for each of our reportable segments for the years ended December 31, 2017 and 2018. The information of revenues in the table below is presented before eliminations resulting from consolidation (including those shown in note 4.4 to our 2018 audited consolidated financial statements included in the February 28 6-K). Variations in revenues determined on the basis of Mexican Pesos include the appreciation or depreciation which occurred during the period between the local currencies of the countries in the regions vis-à-vis the Mexican Peso; therefore, such variations differ substantially from those based solely on the countries’ local currencies:
| Reportable Segment |
Variation in Local Currency(1) |
Approximate Currency Fluctuations |
Variation in Mexican Pesos |
Revenues For the Year Ended | ||||||||||||||||
| 2017 | 2018 | |||||||||||||||||||
| (in millions of Mexican Pesos) | ||||||||||||||||||||
| Mexico |
+9% | — | +9% | Ps 58,442 | Ps 63,543 | |||||||||||||||
| United States |
+8% | +2% | +10% | 65,536 | 72,345 | |||||||||||||||
| Europe |
||||||||||||||||||||
| United Kingdom |
-4% | +5% | +1% | 20,179 | 20,431 | |||||||||||||||
| France |
+7% | +6% | +13% | 16,162 | 18,308 | |||||||||||||||
| Germany |
+1% | +7% | +8% | 10,056 | 10,836 | |||||||||||||||
| Spain |
+4% | +7% | +11% | 6,870 | 7,627 | |||||||||||||||
| Poland |
+20% | +6% | +26% | 5,552 | 6,989 | |||||||||||||||
| Czech Republic |
+1% | +9% | +10% | 3,450 | 3,796 | |||||||||||||||
| Rest of Europe |
+4% | +2% | +6% | 5,989 | 6,365 | |||||||||||||||
| South, Central America and the Caribbean |
||||||||||||||||||||
| Colombia |
-7% | +1% | -6% | 10,685 | 10,088 | |||||||||||||||
| Panama |
-17% | +5% | -12% | 5,112 | 4,490 | |||||||||||||||
| Costa Rica |
-5% | — | -5% | 2,805 | 2,674 | |||||||||||||||
| Caribbean TCL |
+10% | +3% | +13% | 4,332 | 4,893 | |||||||||||||||
| Dominican Republic |
+10% | -2% | +8% | 3,913 | 4,218 | |||||||||||||||
| Rest of South, Central America and the Caribbean |
-1% | +1% | — | 7,803 | 7,781 | |||||||||||||||
| Asia, Middle East and Africa |
||||||||||||||||||||
| Philippines |
+6% | -2% | +4% | 8,296 | 8,612 | |||||||||||||||
| Egypt |
+17% | +2% | +19% | 3,862 | 4,586 | |||||||||||||||
| Israel |
+5% | +2% | +7% | 11,377 | 12,128 | |||||||||||||||
| Rest of Asia, Middle East and Africa |
+4% | +2% | +6% | 2,139 | 2,263 | |||||||||||||||
| Others |
+13% | — | +13% | 21,820 | 24,667 | |||||||||||||||
| Revenues from continuing operations before eliminations resulting from consolidation |
+8% | Ps 274,380 | Ps 296,640 | |||||||||||||||||
|
|
|
|
|
|
| |||||||||||||||
| Eliminations resulting from consolidation |
(16,943) | (19,785) | ||||||||||||||||||
|
|
|
|
|
|
| |||||||||||||||
| Revenues from continuing operations |
+8% | Ps 257,437 | Ps 276,855 | |||||||||||||||||
|
|
|
|
|
|
| |||||||||||||||
47
| Variation in Local Currency(1) |
Approximate Currency Fluctuations |
Variation in Mexican Pesos |
Operating Earnings Before Other Expenses, Net For the Year Ended December 31, | |||||||||||||||||
| 2017 | 2018 | |||||||||||||||||||
| Reportable Segment |
(in millions of Mexican Pesos) | |||||||||||||||||||
| Mexico |
+5% | — | +5% | Ps 18,969 | Ps 20,006 | |||||||||||||||
| United States |
+30% | +8% | +38% | 4,452 | 6,152 | |||||||||||||||
| Europe |
||||||||||||||||||||
| United Kingdom |
-47% | +4% | -43% | 1,766 | 1,007 | |||||||||||||||
| France |
+105% | +22% | +127% | 306 | 695 | |||||||||||||||
| Germany |
-20% | +13% | -7% | 234 | 217 | |||||||||||||||
| Spain |
+20% | +30% | +50% | (294) | (442) | |||||||||||||||
| Poland |
+37% | — | +37% | 286 | 393 | |||||||||||||||
| Czech Republic |
+10% | +8% | +18% | 482 | 567 | |||||||||||||||
| Rest of Europe |
+19% | +8% | +27% | 293 | 372 | |||||||||||||||
| South, Central America and the Caribbean |
||||||||||||||||||||
| Colombia |
-21% | — | -21% | 1,659 | 1,312 | |||||||||||||||
| Panama |
-47% | +2% | -45% | 1,688 | 921 | |||||||||||||||
| Costa Rica |
-14% | +1% | -13% | 901 | 782 | |||||||||||||||
| Caribbean TCL |
-2% | +59% | +57% | 449 | 705 | |||||||||||||||
| Dominican Republic |
+14% | -4% | +10% | 882 | 973 | |||||||||||||||
| Rest of South, Central America and the Caribbean |
-4% | +3% | -1% | 1,271 | 1,257 | |||||||||||||||
| Asia, Middle East and Africa |
||||||||||||||||||||
| Philippines |
-21% | -3% | -24% | 866 | 660 | |||||||||||||||
| Egypt |
-24% | +1% | -23% | 295 | 226 | |||||||||||||||
| Israel |
+5% | +1% | +6% | 1,182 | 1,256 | |||||||||||||||
| Rest of Asia, Middle East and Africa |
-15% | — | -15% | 310 | 264 | |||||||||||||||
| Others |
+5% | +17% | +22% | (3,385) | (4,127) | |||||||||||||||
|
|
|
|
|
|
| |||||||||||||||
| Operating earnings before other expenses, net from continuing operations |
+2% | Ps 32,612 | Ps 33,196 | |||||||||||||||||
|
|
|
|
|
|
| |||||||||||||||
“—” = Not Applicable
| (1) | Represents the variation in local currency terms. For purposes of a reportable segment consisting of a region, the variation in local currency terms for each individual country within the region are first translated into Dollar terms (except for the Rest of Europe, in which they are translated first into Euros) at the exchange rates in effect as of the end of the reporting period. Variations for a region represent the change in Dollar terms (except for the Rest of Europe region, in which they represent the change in Euros), net, in the region. |
Revenues. Our consolidated revenues increased 8%, from Ps257,437 million in 2017 to Ps276,855 million in 2018. The increase was due to higher local currency prices for our products in all of our regions, as well as higher volumes mainly in the ready-mix and aggregates businesses in Mexico and the U.S. and higher cement volumes in the United States. Set forth below is a quantitative and qualitative analysis of the various factors affecting our revenues on a reportable segment basis. The discussion of volume data and revenues information below is presented before eliminations resulting from consolidation as described in note 4.4 to our 2018 audited consolidated financial statements included in the February 28 6-K.
Mexico
Our domestic cement sales volumes from our operations in Mexico increased 1% in 2018 compared to 2017, and ready-mix concrete sales volumes increased 10% over the same period. Our revenues from our operations in Mexico represented 21% of our total revenues for the year ended December 31, 2018, in Mexican Peso terms, before eliminations resulting from consolidation. Cement volumes during the year were supported by increased demand from the formal residential and industrial-and-commercial sector mitigated by lower infrastructure activity. In the formal residential sector, investment in mortgages for new home acquisitions continued to grow as INFONAVIT surpassed its 2018 target. In the industrial-and-commercial sector, favorable dynamics continued in tourism, office-space and manufacturing-related construction. Our cement export volumes from our operations in Mexico, which represented 6% of our Mexican cement sales volumes for the year ended December 31, 2018, increased 51% in 2018 compared to 2017. Of our total cement export volumes from our operations in Mexico during 2018, 63% was shipped to the United States, 1% to Costa Rica and 36% to our Rest of South, Central America and the Caribbean region. Our average sales price of domestic cement from our operations in Mexico increased 3%, in Mexican Peso terms, in 2018 compared to 2017, and our average sales price of ready-mix concrete increased 8%, in Mexican Peso terms, over the same period. For the year ended December 31, 2018, cement represented 57%, ready-mix concrete 22% and our aggregates and other businesses 21% of our revenues in Mexican Peso terms from our operations in Mexico before intra-sector eliminations within the segment and before eliminations resulting from consolidation, as applicable.
48
As a result of increases in domestic cement and ready-mix concrete sales prices and domestic cement and ready-mix concrete sales volumes, our revenues in Mexico, in Mexican Peso terms, increased 9% in 2018 compared to 2017.
United States
Our domestic cement sales volumes from our operations in the United States increased 5% in 2018 compared to 2017, and ready-mix concrete sales volumes increased 8% over the same period. Residential and infrastructure activity were the main drivers of volume growth. In the industrial-and-commercial sector, construction spending was driven by offices, lodging and commercial activity. Regarding infrastructure, street-and-highway spending continued to grow in 2018. Contract awards in our key states are growing in the double-digits and in excess of the national average, driven by specific state infrastructure funding initiatives. Our operations in the United States represented 24% of our total revenues for the year ended December 31, 2018, in Mexican Peso terms, before eliminations resulting from consolidation. Our average domestic cement sales prices of our operations in the United States increased 3%, in Dollar terms, in 2018 compared to 2017, and our average ready-mix concrete sales price increased 2%, in Dollar terms, over the same period. For the year ended December 31, 2018, cement represented 32%, ready-mix concrete 42% and our aggregates and other businesses 26% of revenues in Mexican Peso terms from our operations in the United States before intra-sector eliminations within the segment and before eliminations resulting from consolidation, as applicable.
As a result of the increases in domestic cement and ready-mix concrete sales volumes and domestic cement and ready-mix concrete sales prices, revenues from our operations in the United States, in Dollar terms, increased 8% in 2018 compared to 2017.
Europe
In 2018, our operations in the Europe region consisted of our operations in the United Kingdom, France, Germany, Spain, Poland and the Czech Republic, which represent the most significant operations in this region, in addition to the Rest of Europe, which refers primarily to operations in Croatia, Latvia, Scandinavia and Finland. Our revenues from our operations in the Europe region represented 25% of our total revenues for the year ended December 31, 2018, in Mexican Peso terms, before eliminations resulting from consolidation. As of December 31, 2018, our operations in the Europe region represented 20% of our total assets. Set forth below is a quantitative and qualitative analysis of the effects of the various factors affecting our revenues for our main operations in the Europe region.
United Kingdom
Our domestic cement sales volumes from our operations in the United Kingdom decreased 4% in 2018 compared to 2017, and ready-mix concrete sales volumes decreased 5% over the same period. The decreases in domestic cement and ready-mix concrete sales volumes reflect continued uncertainty around Brexit. Our operations in the United Kingdom represented 7% of our total revenues for the year ended December 31, 2018, in Mexican Peso terms, before eliminations resulting from consolidation. Our average sales price of domestic cement from our operations in the United Kingdom decreased 1%, in Pound terms, in 2018 compared to 2017, and our average sales price of ready-mix concrete remained flat, in Pound terms, over the same period. For the year ended December 31, 2018, cement represented 17%, ready-mix concrete 26% and our aggregates and other businesses 57% of revenues in Mexican Peso terms from our operations in the United Kingdom before intra-sector eliminations within the segment and before eliminations resulting from consolidation, as applicable.
As a result of decreases in domestic cement and ready-mix concrete sales volumes and domestic cement sales prices, revenues from our operations in the United Kingdom, in Pound terms, decreased 4% in 2018 compared to 2017.
49
France
Our ready-mix concrete sales volumes from our operations in France remained flat in 2018 compared to 2017. Infrastructure activity was the main driver of volume, including the “Grand Paris” project, as well as demand from the industrial-and-commercial sector. Our operations in France represented 6% of our total revenues for the year ended December 31, 2018, in Mexican Peso terms, before eliminations resulting from consolidation. Our average sales price of ready-mix concrete of our operations in France increased 4%, in Euro terms, in 2018 compared to 2017. For the year ended December 31, 2018, ready-mix concrete represented 67% and our aggregates and other businesses 33% of revenues in Mexican Peso terms from our operations in France before intra-sector eliminations within the segment and before eliminations resulting from consolidation, as applicable.
As a result of the increases in ready-mix concrete sales prices, revenues from our operations in France, in Euro terms, increased 7% in 2018 compared to 2017.
Germany
Our domestic cement sales volumes from our operations in Germany decreased 1% in 2018 compared to 2017, and ready-mix concrete sales volumes decreased 9% over the same period. The decrease in ready-mix concrete volumes reflected, in part, continued supply constraints in the construction industry. This also resulted in lower domestic cement volumes supplied to our ready-mix concrete operations. Our operations in Germany represented 4% of our total revenues for the year ended December 31, 2018, in Mexican Peso terms, before eliminations resulting from consolidation. Our cement export volumes from our operations in Germany, which represented 25% of our Germany cement sales volumes for the year ended December 31, 2018, decreased 24% in 2018 compared to 2017. Of our total cement export volumes from our operations in Germany during 2018, 21% were to Poland, 2% were to the Czech Republic and 77% were to our Rest of Europe region. Our average sales price of domestic cement from our operations in Germany increased 2%, in Euro terms, in 2018 compared to 2017, and our average sales price of ready-mix concrete increased 6%, in Euro terms, over the same period. For the year ended December 31, 2018, cement represented 27%, ready-mix concrete 36% and our aggregates and other businesses 37% of revenues in Mexican Peso terms from our operations in Germany before intra-sector eliminations within the segment and before eliminations resulting from consolidation, as applicable.
As a result of the increases in domestic cement and ready-mix concrete sales prices, partially offset by decreases in domestic cement and ready-mix concrete sales volumes, revenues from our operations in Germany, in Euro terms, increased 1% in 2018 compared to 2017.
Spain
Our domestic cement sales volumes from our operations in Spain increased 4% in 2018 compared to 2017, while ready-mix concrete sales volumes increased 34% over the same period. The increase in domestic cement and ready-mix concrete volumes reflected in part the introduction of ten new ready-mix concrete plants and three new aggregates quarries. Activity from the residential and industrial-and-commercial sectors continued to be favorable. The residential sector continued to benefit from favorable credit conditions, low interest rates, positive income perspectives and pent-up housing demand, with double-digit growth in both housing permits and mortgages. Our operations in Spain represented 3% of our total revenues for the year ended December 31, 2018, in Mexican Peso terms, before eliminations resulting from consolidation. Our cement export volumes from our operations in Spain, which represented 38% of our Spain cement sales volumes for the year ended December 31, 2018, decreased 30% in 2018 compared to 2017. Of our total cement export volumes from our operations in Spain during 2018, 9% were to the South, Central America and the Caribbean region, 24% were to the United States, 25% were to the United Kingdom, 3% were to Poland, 10% were to the Rest of Europe region and 29% were to the Rest of Asia, Middle East and Africa region. Our average sales price of domestic cement of our operations in Spain increased 5%, in Euro terms, in 2018 compared to 2017, and our average sales price of ready-mix concrete increased 2%, in Euro terms, over the same period. For the year ended December 31, 2018, cement represented 72%, ready-mix concrete 16% and our aggregates and other businesses 12% of revenues in Mexican Peso terms from our operations in Spain before intra-sector eliminations within the segment and before eliminations resulting from consolidation, as applicable.
50
As a result of increases in domestic cement and ready-mix concrete sales volumes and sales prices, revenues from our operations in Spain, in Euro terms, increased 4% in 2018 compared to 2017.
Poland
Our domestic cement sales volumes from our operations in Poland increased 7% in 2018 compared to 2017, while ready-mix concrete sales volumes increased 4% over the same period. The increases in domestic cement volumes during the year were mainly due to our participation in large infrastructure projects including the S-17 expressway and solid residential activity. Our operations in Poland represented 2% of our total revenues for the year ended December 31, 2018, in Mexican Peso terms, before eliminations resulting from consolidation. Our cement export volumes from our operations in Poland, which represented less than 1% of our Poland cement sales volumes for the year ended December 31, 2018, decreased 60% in 2018 compared to 2017. Of our total cement export volumes from our operations in Poland during 2018, all were to our Rest of Europe region. Our average sales price of domestic cement of our operations in Poland increased 6%, in Polish Zloty terms, in 2018 compared to 2017, and our average sales price of ready-mix concrete increased 10%, in Polish Zloty terms, over the same period. For the year ended December 31, 2018, cement represented 47%, ready-mix concrete 37% and our aggregates and other businesses 16% of revenues in Mexican Peso terms from our operations in Poland before intra-sector eliminations within the segment and before eliminations resulting from consolidation, as applicable.
As a result of increases in domestic cement and ready-mix concrete sales volumes and sales prices, revenues from our operations in Poland, in Polish Zloty terms, increased 20% in 2018 compared to 2017.
Czech Republic
Our domestic cement sales volumes from our operations in the Czech Republic increased 6% in 2018 compared to 2017, while ready-mix concrete sales volumes decreased 1% over the same period. Our operations in the Czech Republic represented 1% of our total revenues for the year ended December 31, 2018, in Mexican Peso terms, before eliminations resulting from consolidation. Our cement export volumes from our operations in the Czech Republic, which represented 3% of our Czech Republic cement sales volumes for the year ended December 31, 2018, decreased 5% in 2018 compared to 2017. Of our total cement export volumes from our operations in the Czech Republic during 2018, 14% were to Germany, 62% were to Poland and 24% were to our Rest of Europe region. Our average sales price of domestic cement from our operations in the Czech Republic increased 3%, in Czech Koruna terms, in 2018 compared to 2017, and our average sales price of ready-mix concrete increased 4%, in Czech Koruna terms, over the same period. For the year ended December 31, 2018, our operations in the Czech Republic cement represented 30%, ready-mix concrete 46% and our aggregates and other businesses 24% of revenues in Mexican Peso terms from our operations in the Czech Republic before intra-sector eliminations within the segment and before eliminations resulting from consolidation, as applicable.
As a result of increases in domestic cement sales volumes and sales prices, and ready-mix concrete sales prices, partially offset by decreases in ready-mix concrete sales volumes, revenues from our operations in the Czech Republic, in Czech Koruna terms, increased 1% in 2018 compared to 2017.
Rest of Europe
Our domestic cement sales volumes from our operations in the Rest of Europe decreased 4% in 2018 compared to 2017, and ready-mix concrete sales volumes decreased 9% over the same period. Our cement export volumes from our operations in the Rest of Europe segment, which represented 36% of our Rest of Europe cement sales volumes for the year ended December 31, 2018, decreased 1% in 2018 compared to 2017. Of our total cement export volumes from our operations in Rest of Europe during 2018, 21% were to Germany, 5% were to Poland, 60% were within the region, 12% were to the Asia, Middle East and Africa region and 2% were to our Rest of South, Central America and the Caribbean region. Our revenues from our operations in the Rest of Europe represented 2% of our total revenues for the year ended December 31, 2018, in Mexican Peso terms, before eliminations resulting from consolidation. Our average sales price of domestic cement from our operations in the Rest of Europe increased 1%, in Euro terms, in 2018 compared to 2017, and our average sales price of ready-mix concrete increased 3%, in Euro terms, over the same period. For the year ended December 31, 2018, cement represented 87%, ready-mix concrete 9% and our aggregates and other businesses 4% of revenues in Mexican Peso terms from our operations in the Rest of Europe before intra-sector eliminations within the segment and before eliminations resulting from consolidation, as applicable.
51
As a result of increases in domestic cement and ready-mix concrete sales prices, partially offset by decreases in domestic cement and ready-mix concrete sales volumes, revenues in the Rest of Europe, in Euro terms, increased 4% in 2018 compared to 2017.
South, Central America and the Caribbean
In 2018, our operations in the South, Central America and the Caribbean region consisted of our operations in Colombia, Panama, Costa Rica, the Dominican Republic, as well as our Caribbean TCL operations, which refers to TCL’s operations mainly in Trinidad and Tobago, Jamaica, Guyana and Barbados, which represent our most significant operations in this region, and the Rest of South, Central America and the Caribbean, which refers primarily to operations in Puerto Rico, Nicaragua, Jamaica, the Caribbean, Guatemala and El Salvador, excluding the acquired operations of the Caribbean TCL. Our revenues from our operations in the South, Central America and the Caribbean region represented 12% of our total revenues in Mexican Peso terms for the year ended December 31, 2018, before eliminations resulting from consolidation. As of December 31, 2018, our operations in the South, Central America and the Caribbean region represented 9% of our total assets. Set forth below is a quantitative and qualitative analysis of the effects of the various factors affecting our revenues for our main operations in the South, Central America and the Caribbean region.
Colombia
Our domestic cement sales volumes from our operations in Colombia decreased 6% in 2018 compared to 2017, and ready-mix concrete sales volumes decreased 11% over the same period. The decreases in domestic cement sales volumes and in ready-mix concrete sales volumes were primarily due to a general industry downturn and an aggressive pricing strategy carried out by our competitors. Our revenues from our operations in Colombia represented approximately 3% of our total revenues for the year ended December 31, 2018, in Mexican Peso terms, before eliminations resulting from consolidation. Our average sales price of domestic cement from our operations in Colombia increased 2%, in Colombian Peso terms, in 2018 compared to 2017, and our average sales price of ready-mix concrete remained flat, in Colombian Peso terms, over the same period. For the year ended December 31, 2018, cement represented 51%, ready-mix concrete 27% and our aggregates and other businesses 22% of our revenues in Mexican Peso terms from our operations in Colombia before intra-sector eliminations within the segment and before eliminations resulting from consolidation, as applicable.
As a result of decreases in domestic cement and ready-mix concrete sales volumes, partially offset by an increase in domestic cement sales prices, revenues of our operations in Colombia, in Colombian Peso terms, decreased 7% in 2018 compared to 2017.
Panama
Our domestic cement sales volumes from our operations in Panama decreased 18% in 2018 compared to 2017, and ready-mix concrete sales volumes decreased 15% over the same period. The decreases in domestic cement and ready-mix concrete sales volumes reflected the market slowdown and slow execution of infrastructure projects. Our revenues from our operations in Panama represented 2% of our total revenues for the year ended December 31, 2018, in Mexican Peso terms, before eliminations resulting from consolidation. Our average sales price of domestic cement from our operations in Panama decreased 1% in Dollar terms, in 2018 compared to 2017, and our average sales price of ready-mix concrete decreased 7%, in Dollar terms, over the same period. For the year ended December 31, 2018, cement represented 60%, ready-mix concrete 25% and our aggregates and other businesses 15% of our revenues in Mexican Peso terms from our operations in Panama before intra-sector eliminations within the segment and before eliminations resulting from consolidation, as applicable.
As a result of decreases in domestic cement and ready-mix concrete sales volumes and sales prices, revenues of our operations in Panama, in Dollar terms, decreased 17% in 2018 compared to 2017.
52
Costa Rica
Our domestic cement sales volumes from our operations in Costa Rica increased 1% in 2018 compared to 2017, and ready-mix concrete sales volumes increased 6% over the same period. The increases in domestic cement and ready-mix concrete sales volumes were mainly due to our participation in commercial projects. Our cement export volumes from our operations in Costa Rica, which represented 22% of cement sales volumes from our operations in Costa Rica for the year ended December 31, 2018, decreased 19% in 2018 compared to 2017. All of our total cement exports from our operations in Costa Rica during 2018 were to the Rest of South, Central America and the Caribbean region. Our revenues from our operations in Costa Rica represented approximately 1% of our total revenues for the year ended December 31, 2018, in Mexican Peso terms, before eliminations resulting from consolidation. Our average sales price of domestic cement from our operations in Costa Rica increased 3%, in Costa Rican Colones terms, in 2018 compared to 2017, and our average sales price of ready-mix concrete increased 5%, in Costa Rican Colones terms, over the same period. For the year ended December 31, 2018, cement represented 76%, ready-mix concrete 15% and our aggregates and other businesses 9% of our revenues from our operations in Mexican Peso terms before intra-sector eliminations within the segment and before eliminations resulting from consolidation, as applicable.
As a result of decreases in exports sales volumes partially offset by increases in domestic cement and ready-mix concrete sales volumes and sales prices, revenues of our operations in Costa Rica, in Costa Rican Colones terms, decreased 5% in 2018 compared to 2017.
Caribbean TCL
Our domestic cement sales volumes from our operations in Caribbean TCL increased 6% in 2018 compared to 2017, while ready-mix concrete sales volumes increased 10% over the same period. As mentioned in note 4.1 to our 2018 audited consolidated financial statements included in the February 28 6-K, CEMEX acquired a controlling interest in Caribbean TCL in February 2017. Our revenues from our operations in Caribbean TCL represented 2% of our total revenues for the year ended December 31, 2018, in Mexican Peso terms, before eliminations resulting from consolidation. Our cement export volumes from our operations in Caribbean TCL segment represented 19% of our Caribbean TCL cement sales volumes for the year ended December 31, 2018, increased 22% in 2018 compared to 2017. All of our total cement exports from our operations in Caribbean TCL during 2018 were to the Rest of South, Central America and the Caribbean region. Our average sales price of domestic cement of our operations in Caribbean TCL increased 2%, in Trinidad and Tobago Dollar terms, in 2018 compared to 2017, and our average sales price of ready-mix concrete decreased 11%, in Trinidad and Tobago Dollar terms, over the same period. For the year ended December 31, 2018, cement represented 70%, ready-mix concrete 3% and our other businesses 27% of revenues in Mexican Peso terms from our operations in Caribbean TCL before intra-sector eliminations within the segment and before eliminations resulting from consolidation, as applicable.
As a result of increases in domestic cement and ready-mix concrete sales volumes and domestic cement sales prices, partially offset by decreases in ready-mix concrete sales prices, revenues of our operations in Caribbean TCL, in Trinidad and Tobago Dollar terms, increased 10% in 2018 compared to 2017.
Dominican Republic
Our domestic cement sales volumes from our operations in the Dominican Republic decreased 1% in 2018 compared to 2017, while ready-mix concrete sales volumes decreased 8% over the same period. The decreases in our domestic cement and ready-mix concrete sales volumes in our Dominican Republic region were mainly driven by lower consumption from the private sector, fewer government projects and delays of state permits to initiate. Our operations in the Dominican Republic represented 1% of our total revenues for the year ended December 31, 2018, in Mexican Peso terms, before eliminations resulting from consolidation. Our cement export volumes from our operations in the Dominican Republic, which represented 14% of our Dominican Republic cement sales volumes for the year ended December 31, 2018, decreased 10% in 2018 compared to 2017. Of our total cement export volumes from our operations in the Dominican Republic during 2018, all were to our Rest of South, Central America and the Caribbean region. Our average sales price of domestic cement of our operations in the Dominican Republic increased 11%, in Dominican Peso terms, in 2018 compared to 2017, and our average sales price of ready-mix concrete increased 4%, in Dominican Peso terms, over the same period. For the year ended December 31, 2018, in
53
our operations in the Dominican Republic cement represented 75%, ready-mix concrete 11% and our aggregates and other businesses 14% of revenues in Mexican Peso terms from our operations in the Dominican Republic before intra-sector eliminations within the segment and before eliminations resulting from consolidation, as applicable.
As a result of increases in domestic cement and ready-mix concrete sales prices, partially offset by decreases in domestic cement and ready-mix concrete sales volumes, revenues from our operations in the Dominican Republic, in Dominican Peso terms, increased 10% in 2018 compared to 2017.
Rest of South, Central America and the Caribbean
Our domestic cement volumes from our operations in the Rest of South, Central America and the Caribbean increased 3% in 2018 compared to 2017, and ready-mix concrete sales volumes decreased 21% over the same period. Our cement export volumes from our operations in the Rest of South, Central America and the Caribbean segment, which represented less than 1% of our Rest of South, Central America and the Caribbean cement sales volumes for the year ended December 31, 2018, decreased 84% in 2018 compared to 2017. Of our total cement export volumes from our operations in Rest of South, Central America and the Caribbean during 2018, 96% were within the same region and 4% were to the Rest of Europe region. Our revenues from our operations in the Rest of South, Central America and the Caribbean represented 3% of our total revenues for the year ended December 31, 2018, in Mexican Peso terms, before eliminations resulting from consolidation. Our average sales price of domestic cement from our operations in the Rest of South, Central America and the Caribbean remained flat in Dollar terms, in 2018 compared to 2017, and our average sales price of ready-mix concrete decreased 3%, in Dollar terms, over the same period. For the year ended December 31, 2018, cement represented 88%, ready-mix concrete 9% and our other businesses 3% of revenues in Mexican Peso terms from our operations in the Rest of South, Central America and the Caribbean before intra-sector eliminations within the segment and before eliminations resulting from consolidation, as applicable.
As a result of decreases in ready-mix concrete sales volumes and sales prices, partially offset by an increase in domestic cement sales volumes, revenues of our operations in the Rest of South, Central America and the Caribbean, in Dollar terms, decreased 1% in 2018 compared to 2017.
Asia, Middle East and Africa
For the year ended December 31, 2018, our operations in the Asia, Middle East and Africa region consisted of our operations in the Philippines, Egypt and Israel, which represent the most significant operations in this region, in addition to the Rest of Asia, Middle East and Africa, which refers primarily to operations in the UAE. Our revenues from our operations in the Asia, Middle East and Africa region represented 10% of our total revenues for the year ended December 31, 2018, in Mexican Peso terms, before eliminations resulting from consolidation. As of December 31, 2018, our operations in the Asia, Middle East and Africa region represented 6% of our total assets. Set forth below is a quantitative and qualitative analysis of the effects of the various factors affecting our revenues for our main operations in the Asia, Middle East and Africa region.
The Philippines
Our domestic cement sales volumes from our operations in the Philippines increased 7% in 2018 compared to 2017, and ready-mix concrete sales volumes remained flat over the same period. The increase in domestic cement volumes were supported by the infrastructure and residential sectors, coupled with operational and logistics debottlenecking efforts. Our cement export volumes from our operations in the Philippines, which represented less than 1% of our Philippines cement sales volumes for the year ended December 31, 2018, increased 4% in 2018 compared to 2017. All of our total cement exports from our operations in Philippines during 2018 were to the Rest of Asia, Middle East and Africa region. Our revenues from our operations in the Philippines represented 3% of our total revenues for the year ended December 31, 2018, in Mexican Peso terms, before eliminations resulting from consolidation. Our average sales price of domestic cement from our operations in the Philippines increased 1% in Philippine Peso terms, in 2018 compared to 2017 and our average sales price of ready-mix concrete remained flat, in Philippine Peso terms, over the same period. For the year ended December 31, 2018, cement represented 99% and our ready-mix concrete and other businesses 1% of our revenues in Mexican Peso terms from our operations in the Philippines before intra-sector eliminations within the segment and before eliminations resulting from consolidation, as applicable.
54
As a result of increases in domestic cement sales volumes and sales prices, revenues of our operations in the Philippines, in Philippine Peso terms, increased 6% in 2018 compared to 2017.
Egypt
Our domestic cement sales volumes from our operations in Egypt remained flat in 2018 compared to 2017, while ready-mix concrete sales volumes decreased 21% over the same period. The ready-mix concrete sales volume decline was mainly due to weaker market demand and our focus on our most profitable markets. Our revenues from our operations in Egypt represented 2% of our total revenues for the year ended December 31, 2018, in Mexican Peso terms, before eliminations resulting from consolidation. Our average sales price of domestic cement increased 18%, in Egyptian Pound terms, in 2018 compared to 2017, and our average sales price of ready-mix concrete increased 33%, in Egyptian Pound terms, over the same period. For the year ended December 31, 2018, cement represented 84%, ready-mix concrete 11% and our aggregates and other businesses 5% of revenues in Mexican Peso terms from our operations in Egypt before intra-sector eliminations within the segment and before eliminations resulting from consolidation, as applicable.
As a result of the increase in domestic cement and ready-mix concrete sales prices, partially offset by a decrease in ready-mix concrete sales volumes, our revenues in Egypt, in Egyptian Pound terms, increased 17% in 2018 compared to 2017.
Israel
Our ready-mix concrete sales volumes from our operations in Israel increased 4% in 2018 compared to 2017. The increase in the ready-mix concrete sales volumes was mainly driven by an increase in market demand, as well as projects in the south and center regions. Our operations in Israel represented 4% of our total revenues for the year ended December 31, 2018, in Mexican Peso terms, before eliminations resulting from consolidation. Our average sales price of ready-mix concrete of our operations in Israel increased 2%, in Israeli New Shekel terms, in 2018 compared to 2017. For the year ended December 31, 2018, in our operations in Israel ready-mix concrete represented 66% and our aggregates and other businesses 34% of revenues, in Mexican Peso terms, from our operations in Israel before intra-sector eliminations within the segment and before eliminations resulting from consolidation, as applicable.
As a result of increases in ready-mix concrete sales volumes and sales prices, revenues from our operations in Israel, in Israeli New Shekel terms, increased 5% in 2018 compared to 2017.
Rest of Asia, Middle East and Africa
Our domestic cement sales volumes from our operations in the Rest of Asia, Middle East and Africa decreased 20% in 2018 compared to 2017, and ready-mix concrete sales volumes increased 4% over the same period. Our cement export volumes from our operations in Rest of Asia, Middle East and Africa, which represented 13% of our Rest of Asia, Middle East and Africa cement sales volumes for the year ended December 31, 2018, decreased 28% in 2018 compared to 2017. All of our total cement exports from our operations in the region during 2018 were within the same operations region. Our revenues from our operations in our Rest of Asia, Middle East and Africa segment represented 1% of our total revenues for the year ended December 31, 2018, in Mexican Peso terms, before eliminations resulting from consolidation. Our average sales price of domestic cement remained flat, in Dollar terms, in 2018 compared to 2017, and the average sales price of ready-mix concrete decreased 1%, in Dollar terms, over the same period. For the year ended December 31, 2018, cement represented 35% and ready-mix concrete 65% of revenues from our operations in the Rest of Asia, Middle East and Africa before intra-sector eliminations within the segment and before eliminations resulting from consolidation, as applicable.
55
As a result of increases in ready-mix concrete sales volumes, partially offset by a decrease in domestic cement sales volumes and ready-mix concrete sales prices, revenues from our operations in Rest of Asia, Middle East and Africa, in Dollar terms, increased 4% in 2018 compared to 2017.
Others
Our Others segment refers to: (i) cement trade maritime operations, (ii) our information technology solutions business (Neoris N.V.), (iii) CEMEX, S.A.B. de C.V. and other corporate entities and (iv) other minor subsidiaries with different lines of business. Revenues from our Others segment increased 13% before intra-sector eliminations within the segment and before eliminations resulting from consolidation, as applicable, in 2018 compared to 2017, in Dollar terms. The increase resulted primarily from an increase in our worldwide cement volume of our trading operations and a sales increase in our information technology solutions company. For the year ended December 31, 2018, our information technology solutions company represented 20% and our trading operations represented 50% of our revenues in our Others segment, in Dollar terms.
Cost of Sales. Our cost of sales, including depreciation, increased 8% from Ps168,858 million in 2017 to Ps182,965 million in 2018. As a percentage of revenues, cost of sales increased from 65.6% in 2017 to 66.1% in 2018. The increase in cost of sales as a percentage of revenues was mainly driven by higher energy costs, as well as higher volumes of purchased cement and clinker. Our cost of sales includes freight expenses of raw materials used in our producing plants.
Gross Profit. For the reasons explained above, our gross profit increased 6% from Ps88,579 million in 2017 to Ps93,890 million in 2018. As a percentage of revenues, gross profit decreased from 34.4% in 2017 to 33.9% in 2018. In addition, our gross profit may not be directly comparable to those of other entities that include all their freight expenses in cost of sales. As described below, we include freight expenses of finished products from our producing plants to our points of sale and from our points of sale to our customers’ locations within operating expenses as part of distribution and logistics expenses.
Operating expenses. Our operating expenses, which are represented by administrative, selling and distribution and logistics expenses, increased 8%, from Ps55,967 million in 2017 to Ps60,694 million in 2018. As a percentage of revenues, operating expenses increased from 21.7% in 2017 to 21.9% in 2018. Our operating expenses include expenses related to personnel, equipment and services involved in sales activities and storage of product at points of sale, which are included as part of the operating expenses, as well as freight expenses of finished products between plants and points of sale and freight expenses between points of sale and the customers’ facilities, which are included as part of the line item “Distribution and logistics expenses.” For the years ended December 31, 2017 and 2018, selling expenses included as part of the line item “Operating expenses” amounted to Ps6,429 million and Ps6,315 million, respectively. As discussed above, we include freight expenses of finished products from our producing plants to our points of sale and from our points of sale to our customers’ locations within distribution and logistics expenses, which in aggregate represented costs of Ps28,485 million in 2017 and Ps31,992 million in 2018. As a percentage of revenues, distribution and logistics expenses increased from 11.1% in 2017 to 11.6% in 2018.
Operating Earnings Before Other Expenses, Net
For the reasons mentioned above, our operating earnings before other expenses, net increased 2% from Ps32,612 million in 2017 to Ps33,196 million in 2018. As a percentage of revenues, operating earnings before other expenses, net decreased from 12.7% in 2017 to 12.0% in 2018. Additionally, set forth below is a quantitative and qualitative analysis of the effects of the various factors affecting our operating earnings before other expenses, net on a reportable segment basis.
Mexico
Our operating earnings before other expenses, net, from our operations in Mexico increased 5% in 2018 compared to 2017, in Mexican Peso terms, from operating earnings before other expenses, net, of Ps18,969 million in 2017 to operating earnings before other expenses, net, of Ps20,006 million in 2018. Our operating earnings before other expenses from our operations in Mexico represented 60% of our total operating earnings before other expenses for the year ended December 31, 2018, in Mexican Peso terms. The increase resulted primarily from the increase in our revenues, partially offset by higher maintenance cost.
56
United States
Our operating earnings before other expenses, net, from our operations in the United States increased 30% in 2018 compared to 2017, in Dollar terms. Our operating earnings before other expenses from our operations in the United States represented 19% of our total operating earnings before other expenses for the year ended December 31, 2018, in Mexican Peso terms. The increase in operating earnings before other expenses, net resulted primarily from an increase in our revenues.
Europe
United Kingdom. Our operating earnings before other expenses, net, from our operations in the United Kingdom decreased 47% in 2018 compared to 2017 in Pound terms. Our operating earnings before other expenses from our operations in the United Kingdom represented 3% of our total operating earnings before other expenses for the year ended December 31, 2018, in Mexican Peso terms. The decrease resulted primarily from a decrease in our revenues, as well as higher production cost.
France. Our operating earnings before other expenses, net, from our operations in France increased 105% in 2018 compared to 2017 in Euro terms. Our operating earnings before other expenses from our operations in France represented 2% of our total operating earnings before other expenses for the year ended December 31, 2018, in Mexican Peso terms. The increase in our operating earnings before other expenses, net in France resulted primarily from an increase in our revenues and due to our cost reduction efforts.
Germany. Our operating earnings before other expenses, net, from our operations in Germany decreased 20% in 2018 compared to 2017 in Euro terms. Our operating earnings before other expenses from our operations in Germany represented 1% of our total operating earnings before other expenses for the year ended December 31, 2018, in Mexican Peso terms. The decrease resulted primarily from an increase in our operational costs partially offset by an increase in our revenues.
Spain. Our operating earnings before other expenses, net, from our operations in Spain increased 20% in 2018 compared to 2017, in Euro terms. Our operating loss before other expenses from our operations in Spain represented a loss of Ps442 million, which was a negative impact of 1% of our total operating earnings before other expenses for the year ended December 31, 2018, in Mexican Peso terms. The increase in the operating earnings before other expenses, net, resulted primarily from an increase in our revenues, partially offset by an increase in our production and operational costs.
Poland. Our operating earnings before other expenses, net, from our operations in Poland increased 37% in 2018 compared to 2017, in Polish Zloty terms. Our operating earnings before other expenses from our operations in Poland represented 1% of our total operating earnings before other expenses for the year ended December 31, 2018, in Mexican Peso terms. The increase in the operating earnings before other expenses, net, resulted primarily from an increase in our revenues partially offset by an increase in our production cost.
Czech Republic. Our operating earnings before other expenses, net, from our operations in the Czech Republic increased 10% in 2018 compared to 2017, in Czech Koruna terms. Our operating earnings before other expenses from our operations in the Czech Republic represented 2% of our total operating earnings before other expenses for the year ended December 31, 2018, in Mexican Peso terms. The increase in the operating earnings before other expenses, net, resulted primarily from an increase in our revenues, as well as a reduction in our operational costs.
Rest of Europe. Our operating earnings before other expenses, net, from our operations in the Rest of Europe increased 19% in 2018 compared to 2017, in Euro terms. Our operating earnings before other expenses from our operations in the Rest of Europe region represented 1% of our total operating earnings before other expenses for the year ended December 31, 2018, in Mexican Peso terms. The increase resulted primarily from an increase in our revenues.
57
South, Central America and the Caribbean
Colombia. Our operating earnings before other expenses, net, from our operations in Colombia decreased 21% in 2018 compared to 2017, in Colombian Peso terms. Our operating earnings before other expenses from our operations in Colombia represented 4% of our total operating earnings before other expenses for the year ended December 31, 2018, in Mexican Peso terms. The decrease resulted primarily from a decrease in revenues, as well as an increase in our production cost due to lower demand.
Panama. Our operating earnings before other expenses, net, from our operations in Panama decreased 47% in 2018 compared to 2017 in Dollar terms. Our operating earnings before other expenses from our operations in Panama represented 3% of our total operating earnings before other expenses for the year ended December 31, 2018, in Mexican Peso terms. The decrease resulted primarily from a decrease in our revenues, as well as an increase in our energy cost.
Costa Rica. Our operating earnings before other expenses, net, from our operations in Costa Rica decreased 14% in 2018 compared to 2017, in Costa Rican Colones terms. Our operating earnings before other expenses from our operations in Costa Rica represented 2% of our total operating earnings before other expenses for the year ended December 31, 2018, in Mexican Peso terms. The decrease resulted primarily from a decrease in revenues and an increase in production and transportation costs.
Caribbean TCL. Our operating earnings before other expenses, net, from our operations in Caribbean TCL decreased 2% in 2018 compared to 2017, in Trinidad and Tobago Dollar terms. Our operating earnings before other expenses from our Caribbean TCL operations represented 2% of our total operating earnings before other expenses for the year ended December 31, 2018, in Mexican Peso terms. The decrease resulted primarily from an increase in production and energy costs, partially offset by an increase in our revenues.
Dominican Republic. Our operating earnings before other expenses, net, from our operations in the Dominican Republic increased 14% in 2018 compared to 2017 in Dominican Peso terms. Our operating earnings before other expenses from our operations in the Dominican Republic represented 3% of our total operating earnings before other expenses for the year ended December 31, 2018, in Mexican Peso terms. The increase in the operating earnings before other expenses, net, resulted primarily from an increase in our revenues, partially offset by an increase in production cost.
Rest of South, Central America and the Caribbean. Our operating earnings before other expenses, net, from our operations in the Rest of South, Central America and the Caribbean decreased 4% in 2018 compared to 2017, in Dollar terms. Our operating earnings before other expenses from our operations in the Rest of South, Central America and the Caribbean region represented 4% of our total operating earnings before other expenses for the year ended December 31, 2018, in Mexican Peso terms. The decrease resulted primarily from a decrease in our revenues.
Asia, Middle East and Africa
The Philippines. Our operating earnings before other expenses, net, from our operations in the Philippines decreased 21% in 2018 compared to 2017 in Philippine Peso terms. Our operating earnings before other expenses from our operations in the Philippines represented 2% of our total operating earnings before other expenses for the year ended December 31, 2018, in Mexican Peso terms. The decrease resulted primarily from an increase in our energy costs, partially offset by an increase in revenues.
Egypt. Our operating earnings before other expenses, net, from our operations in Egypt decreased 24% in 2018 compared to 2017 in Egyptian Pound terms. Our operating earnings before other expenses from our operations in Egypt represented 1% of our total operating earnings before other expenses for the year ended December 31, 2018, in Mexican Peso terms. The decrease resulted primarily from higher fuel and electricity costs, partially offset by an increase in our revenues.
58
Israel. Our operating earnings before other expenses, net, from our operations in Israel increased 5% in 2018 compared to 2017, in Israeli New Shekel terms. Our operating earnings before other expenses from our operations in Israel represented 4% of our total operating earnings before other expenses for the year ended December 31, 2018, in Mexican Peso terms. The increase in the operating earnings before other expenses, net, resulted primarily from an increase in our revenues.
Rest of Asia, Middle East and Africa. Our operating earnings before other expenses, net, from our operations in the Rest of Asia, Middle East and Africa decreased 15% in 2018 compared to 2017 in Dollar terms. Our operating earnings before other expenses from our operations in the Rest of Asia, Middle East and Africa region represented 1% of our total operating earnings before other expenses for the year ended December 31, 2018, in Mexican Peso terms. The decrease resulted primarily from an increase in our production cost, partially offset by an increase in our revenues.
Others. Our operating loss before other expenses, net, from our operations in our Others segment increased 22% in 2018 compared to 2017, in Mexican Peso terms. Our operating loss before other expenses increased from Ps3,385 million in 2017 to Ps4,127 million in 2018. The increase in our operating loss resulted primarily from an increase in our operating cost from our other segment, partially offset by an increase in our revenues.
Other Expenses, Net. Our other expenses, net, increased 53%, in Mexican Peso terms, from an expense of Ps3,815 million in 2017 to an expense of Ps5,837 million in 2018. The increase in 2018 resulted primarily from the losses from the sale of assets and others, net, which includes a loss of Ps1,080 million in connection with property damages and natural disasters, partially offset by a decrease in impairment losses in 2017 compared to 2018. See notes 6, 14, 15 and 24.1 to our 2018 audited consolidated financial statements included in the February 28 6-K.
The most significant items included under this caption for the years ended December 31, 2017 and 2018, are as follows:
| For the Year Ended December 31, | ||||||||
| 2017 | 2018 | |||||||
| (in millions of Mexican Pesos) | ||||||||
| Impairment losses |
Ps (2,936 | ) | Ps (1,188 | ) | ||||
| Restructuring costs |
(843 | ) | (1,382 | ) | ||||
| Charitable contributions |
(127 | ) | (105 | ) | ||||
| Results from the sale of assets and others, net |
91 | (2,994 | ) | |||||
| Remeasurement of pension liabilities |
– | (168 | ) | |||||
|
|
|
|
|
|||||
| Ps (3,815 | ) | Ps (5,837 | ) | |||||
|
|
|
|
|
|||||
Financial expense. Our financial expense decreased 35%, from Ps19,301 million in 2017 to Ps12,597 million in 2018, primarily attributable to lower interest rates on our financial debt as well as a decrease in our financial debt during 2018 compared to 2017. See note 16.1 to our 2018 audited consolidated financial statements included in the February 28 6-K.
Financial income and other items, net. Our financial income and other items, net, in Mexican Peso terms, decreased significantly, from Ps3,616 million in 2017 to Ps96 million in 2018, mainly as a result of the sale of associates and the remeasurement of previously held interest before change in control of associates, which decreased significantly, from a gain of Ps4,154 million in 2017 to a loss of Ps204 million in 2018, primarily attributable to the gain from the sale of GCC’s common stock during 2017. See notes 13.1 to our 2018 audited consolidated financial statements included in the February 28 6-K.
59
The most significant items included under this caption for the years ended December 31, 2017 and 2018, are as follows:
| For the Year Ended December 31, |
||||||||
| 2017 | 2018 | |||||||
| (in millions of Mexican Pesos) | ||||||||
| Financial income and other items, net: |
||||||||
| Results from sale of associates and re-measurement of previously held interest before change in control of associates |
4,164 | (204 | ) | |||||
| Financial income |
338 | 355 | ||||||
| Results from financial instruments |
161 | 692 | ||||||
| Foreign exchange results |
(26 | ) | 341 | |||||
| Effects of net present value on assets and liabilities and others, net |
(1,021 | ) | (1,088 | ) | ||||
|
|
|
|
|
|||||
| Ps 3,616 | Ps 96 | |||||||
|
|
|
|
|
|||||
Income Taxes. Our income tax effect in the income statements, which is primarily comprised of current income taxes plus deferred income taxes, increased significantly from an expense of Ps520 million in 2017 to an expense of Ps4,467 million in 2018.
The increase in the income tax expense is mainly attributable to an increase in our deferred income tax expense during the period, which decreased from a deferred income tax revenue of Ps2,938 million in 2017, mainly associated with the recognition of deferred tax assets related to tax loss carryforwards from our operations in the United States in 2017, to a deferred tax expense of Ps2,569 million in 2018 that includes the derecognition of deferred income tax assets for Ps1,770 million recognized in prior years. Such increase in our deferred income tax expense during 2018 was partially offset by a decrease in our current income tax expense, which decreased from Ps3,458 million in 2017 to Ps1,898 million in 2018. The decrease in our current income tax expense in 2018 was mainly attributable to lower taxable income in certain operations, such as Central and South America, as well as a reduction in our uncertain tax positions during the period for Ps624 million. See notes 19.1, 19.2 and 19.3 to our 2018 audited consolidated financial statements included in the February 28 6-K.
For each of the years ended December 31, 2017 and 2018, our statutory income tax rate in Mexico was 30%. Our average effective tax rate in 2017, which is determined as described below, resulted in an income tax rate of 3.8%, considering earnings before income tax of Ps13,700 million, and our average effective tax rate in 2018 resulted in an income tax rate of 28.8%, considering earnings before income tax of Ps15,511 million. Our average effective tax rate equals the net amount of income tax expense divided by earnings before income taxes, as these line items are reported in our consolidated income statements. See “Item 3—Key Information—Risk Factors—Risks Relating to Our Business—Certain tax matters may have an adverse effect on our cash flow, financial condition and net income” and note 19.4 to our 2018 audited consolidated financial statements included in the February 28 6-K.
Net Income from continuing operations. For the reasons described above, our net income from continuing operations for 2018 decreased 16% from a net income from continuing operations of Ps13,180 million in 2017 to a net income from continuing operations of Ps11,044 million in 2018. As a percentage of revenues, net income from continuing operations represented 5.1% for the year ended as of December 31, 2017 and 4.0% for the year ended as of December 31, 2018.
Discontinued operations. For the years ended December 31, 2017 and 2018, our discontinued operations included in our consolidated income statements amounted to Ps3,461 million and Ps212 million, respectively. As a percentage of revenues, discontinued operations, net of tax, represented 1.3% for the year ended as of December 31, 2017 and 0.1% for the year ended as of December 31, 2018. See note 4.2 to our 2018 audited consolidated financial statements included in the February 28 6-K.
Consolidated Net Income. For the reasons described above, our consolidated net income (before deducting the portion allocable to non-controlling interest) for 2018 decreased 32%, from a consolidated net income of Ps16,641 million in 2017 to a consolidated net income of Ps11,256 million in 2018. As a percentage of revenues, consolidated net income represented 6.5% for the year ended as of December 31, 2017, and 4.1% for the year ended as of December 31, 2018.
Non-controlling Interest Net Income. Changes in non-controlling interest net income in any period reflect changes in the percentage of the stock of our subsidiaries held by non-associated third parties as of the end of each month during the relevant period and the consolidated net income attributable to those subsidiaries. Non-controlling
60
interest net income decreased 44%, from an income of Ps1,417 million in 2017 to an income of Ps789 million in 2018, primarily attributable to a decrease in the net income of the consolidated entities in which others have a non-controlling interest. As a percentage of revenues, non-controlling interest net income represented 0.6% for the year ended as of December 31, 2017, and 0.3% for the year ended as of December 31, 2018. See note 20.4 to our 2018 audited consolidated financial statements included in the February 28 6-K.
Controlling Interest Net Income. Controlling interest net income represents the difference between our consolidated net income and non-controlling interest net income, which is the portion of our consolidated net income attributable to those of our subsidiaries in which non-associated third parties hold interests. For the reasons described above, our controlling interest net income decreased 31%, from a controlling interest net income of Ps15,224 million in 2017 to Ps10,467 million in 2018. As a percentage of revenues, controlling interest net income, represented 5.9% for the year ended as of December 31, 2017, and 3.8% for the year ended as of December 31, 2018.
Liquidity and Capital Resources
Operating Activities
We have satisfied our operating liquidity needs primarily through operations of our subsidiaries and expect to continue to do so for both the short and long-term. Although cash flow from our operations has historically met our overall liquidity needs for operations, servicing debt and funding capital expenditures and acquisitions, our subsidiaries are exposed to risks from changes in foreign currency exchange rates, price and currency controls, interest rates, inflation, governmental spending, social instability and other political, economic and/or social developments in the countries in which we operate, any one of which may materially decrease our net income and decrease cash from operations. Consequently, in order to meet our liquidity needs, we also rely on cost-cutting and operating improvements to optimize capacity utilization and maximize profitability, as well as borrowing under credit facilities, proceeds of debt and equity offerings, and proceeds from asset sales. Our consolidated net cash flows provided by operating activities from continuing operations before financial expense and coupons on Perpetual Debentures and income taxes paid in cash were Ps61,342 million in 2016, Ps51,420 million in 2017 and Ps43,316 million in 2018. See our statements of cash flows included elsewhere in this report. CEMEX management is of the opinion that working capital is sufficient for our present requirements.
Sources and Uses of Cash
Our review of sources and uses of resources below refers to nominal amounts included in our statement of cash flows for 2016, 2017 and 2018.
Our primary sources and uses of cash during the years ended December 31, 2016, 2017 and 2018 were as follows:
| Year Ended December 31, | ||||||||||||
| 2016 | 2017 | 2018 | ||||||||||
| (in millions of Mexican Pesos) | ||||||||||||
| Operating Activities |
||||||||||||
| Consolidated net income |
15,204 | 16,641 | 11,256 | |||||||||
| Discontinued operations |
713 | 3,461 | 212 | |||||||||
|
|
|
|
|
|
|
|
|
| ||||
| Net income from continuing operations |
14,491 | 13,180 | 11,044 | |||||||||
| Non-cash items |
35,834 | 30,201 | 33,334 | |||||||||
| Changes in working capital, excluding income taxes |
11,017 | 8,039 | (1,062 | ) | ||||||||
|
|
|
|
|
|
|
|
|
| ||||
| Net cash flows provided by operating activities from continuing operations before financial expense, coupons on Perpetual Debentures and income taxes |
61,342 | 51,420 | 43,316 | |||||||||
| Financial expense and coupons on Perpetual Debentures and income taxes paid |
(23,312 | ) | (20,423 | ) | (16,781 | ) | ||||||
|
|
|
|
|
|
|
|
|
| ||||
| Net cash flows provided by operating activities from continuing operations |
38,030 | 30,997 | 26,535 | |||||||||
| Net cash flows provided by operating activities from discontinued operations |
1,192 | 108 | 10 | |||||||||
|
|
|
|
|
|
|
|
|
| ||||
| Net cash flows provided by operating activities |
39,222 | 31,105 | 26,545 | |||||||||
| Investing Activities |
||||||||||||
| Property, machinery and equipment, net |
(4,563 | ) | (10,753 | ) | (11,631 | ) | ||||||
| Acquisition and disposal of subsidiaries and other disposal groups, net |
1,424 | 23,841 | (481 | ) | ||||||||
| Intangible assets, other deferred charges and other non-current assets, net |
(2,341 | ) | (1,481 | ) | (3,575 | ) | ||||||
|
|
|
|
|
|
|
|
|
| ||||
61
| Year Ended December 31, | ||||||||||||
| 2016 | 2017 | 2018 | ||||||||||
| (in millions of Mexican Pesos) | ||||||||||||
| Net cash flows (used in) provided by investing activities from continuing operations |
(5,480 | ) | 11,607 | (15,687 | ) | |||||||
| Net cash flows (used in) provided by investing activities from discontinued operations |
1 | — | — | |||||||||
|
|
|
|
|
|
|
|
|
| ||||
| Net cash flows (used in) provided by investing activities |
(5,479 | ) | 11,607 | (15,687 | ) | |||||||
| Financing Activities |
||||||||||||
| Sale of non-controlling interest in subsidiaries |
9,777 | (55 | ) | — | ||||||||
| Derivative instruments |
399 | 246 | 392 | |||||||||
| Repayment of debt, net |
(41,044 | ) | (37,826 | ) | (9,260 | ) | ||||||
| Other financial obligations, net |
(5,779 | ) | (1,473 | ) | (7,082 | ) | ||||||
| Share repurchase program |
— | — | (1,520 | ) | ||||||||
| Securitization of trade receivables |
(999 | ) | 169 | 644 | ||||||||
| Non-current liabilities, net |
(1,972 | ) | (3,745 | ) | (2,716 | ) | ||||||
|
|
|
|
|
|
|
|
|
| ||||
| Net cash flows used in financing activities |
(39,618 | ) | (42,684 | ) | (19,542 | ) | ||||||
|
|
|
|
|
|
|
|
|
| ||||
| Decrease in cash and cash equivalents from continuing operations |
(7,068 | ) | (80 | ) | (8,694 | ) | ||||||
| Increase in cash and cash equivalents from discontinued operations |
1,193 | 108 | 10 | |||||||||
| Cash conversion effect, net |
2,169 | 2,097 | 1,011 | |||||||||
| Cash and cash equivalents at beginning of period |
15,322 | 11,616 | 13,741 | |||||||||
|
|
|
|
|
|
|
|
|
| ||||
| Cash and cash equivalents at end of period |
11,616 | 13,741 | 6,068 | |||||||||
|
|
|
|
|
|
|
|
|
| ||||
2018. During 2018, excluding the positive foreign currency effect of our initial balances of cash and cash equivalents generated during the period of Ps1,011 million, there was a decrease in cash and cash equivalents from continuing operations of Ps8,694 million. This decrease was the result of our net cash flows used in financing activities of Ps19,542 million and our net cash flows used in investing activities from continuing operations of Ps15,687 million, partially offset by our net cash flows provided by operating activities from continuing operations, which, after financial expense and coupons on Perpetual Debentures and income taxes paid in cash of Ps16,781 million, amounted to Ps26,535 million.
For the year ended December 31, 2018, our net cash flows provided by operating activities included cash flows applied in working capital of Ps1,062 million, which was primarily comprised of other accounts receivable and other assets, inventories and other accounts payable and accrued expenses, for an aggregate amount of Ps5,949 million, partially offset by trade payables and trade receivables, net for an aggregate amount of Ps4,887 million.
During 2018, our net cash flows provided by operating activities from continuing operations after financial expense and coupons on Perpetual Debentures and income taxes paid in cash of Ps26,535 million were mainly disbursed in connection with (i) our net cash flows used in financing activities of Ps19,542 million, which include repayment of our debt, net, other financial obligations, net, share repurchase program and non-current liabilities, net, for an aggregate amount of Ps20,578 million, partially offset by derivative instruments and securitization of trade receivables for an aggregate amount of Ps1,036 million and (ii) our net cash flows used in the investing activities from continuing operations of Ps15,687 million, which was primarily comprised of investment in property, machinery and equipment, net, intangible assets, other deferred charges and other non-current assets, net and by acquisition and disposal of subsidiaries and other disposal groups, net.
2017. During 2017, excluding the positive foreign currency effect of our initial balances of cash and cash equivalents generated during the period of Ps2,097 million, there was a decrease in cash and cash equivalents from continuing operations of Ps80 million. This decrease was the result of our net cash flows used in financing activities of Ps42,684 million, partially offset by our net cash flows provided by operating activities from continuing operations, which, after financial expense and coupons on Perpetual Debentures and income taxes paid in cash of Ps20,423 million, amounted to Ps30,997 million, and by our investing activities from continuing operations of Ps11,607 million.
For the year ended December 31, 2017, our net cash flows provided by operating activities included cash flows generated in working capital of Ps8,039 million, which was primarily comprised of trade receivables, net, other accounts receivable and other assets, inventories, trade payables and other accounts payable and accrued expenses.
62
During 2017, our net cash flows provided by operating activities from continuing operations after financial expense and coupons on Perpetual Debentures and income taxes paid in cash of Ps30,997 million and our net cash flows provided by investing activities from continuing operations of Ps11,607 million, which include acquisition and disposal of subsidiaries and other disposal groups, net for an amount of Ps23,841 million, partially offset by investment in property, machinery and equipment, net and intangible assets, other deferred charges and other non-current assets, net for an aggregate amount of Ps12,234 million, were disbursed in connection with our net cash flows used in financing activities of Ps42,684 million, which include repayment of our debt, net, other financial obligations, net, non-current liabilities and sale of non-controlling interest in subsidiaries for an aggregate amount of Ps43,099 million, partially offset by derivative instruments and securitization of trade receivables for an aggregate amount of Ps415 million.
2016. During 2016, excluding the positive foreign currency effect of our initial balances of cash and cash equivalents generated during the period of Ps2,169 million, there was a decrease in cash and cash equivalents from continuing operations of Ps7,068 million. This decrease was the result of our net cash flows used in financing activities of Ps39,618 million and our net cash flows used in investing activities from continuing operations of Ps5,479 million, partially offset by our net cash flows provided by operating activities from continuing operations, which, after financial expense and coupons on Perpetual Debentures and income taxes paid in cash of Ps23,312 million, amounted to Ps38,030 million.
For the year ended December 31, 2016, our net cash flows provided by operating activities included cash flows generated in working capital of Ps11,017 million, which was primarily comprised of trade payables and other accounts payable and accrued expenses, for an aggregate amount of Ps16,928 million, partially offset by trade receivable, net, other accounts receivable and other assets and inventories for an aggregate amount of Ps5,911 million.
During 2016, our net cash flows provided by operating activities from continuing operations after financial expense and coupons on Perpetual Debentures and income taxes paid in cash of Ps38,030 million were mainly disbursed in connection with (i) our net cash flows used in financing activities of Ps39,618 million, which include repayment of our debt, net, other financial obligations, net, securitization of trade receivables and non-current liabilities for an aggregate amount of Ps49,794 million, partially offset by derivative instruments and sale of non-controlling interest in subsidiaries for an aggregate amount of Ps10,176 million and (ii) our net cash flows used in the investing activities from continuing operations of Ps5,479 million, which include investment in property, machinery and equipment, net and intangible assets, other deferred charges and other non-current assets, net for an aggregate amount of Ps6,904 million, partially offset by acquisition and disposal of subsidiaries and other disposal groups, net for an amount of Ps1,424 million.
As of December 31, 2018, we had the following lines of credit, of which the only commited portion refers to the revolving credit facility under the 2017 Credit Agreement, at annual interest rates ranging between 0.75% and 8.50%, depending on the negotiated currency:
| Lines of Credit | Available | |||||||
| (in millions of Mexican Pesos) | ||||||||
| Other lines of credit in foreign subsidiaries |
9,440 | 7,286 | ||||||
| Other lines of credit from banks |
11,294 | 8,956 | ||||||
| Revolving credit facility |
22,303 | 16,211 | ||||||
|
|
|
|
|
|
| |||
| 43,037 | 32,453 | |||||||
|
|
|
|
|
|
| |||
In addition, as of December 31, 2018, we had available committed lines of credit under the 2017 Credit Agreement, which include a revolving credit facility and an undrawn term loan trance of the 2017 Credit Agreement for a combined amount of Ps16,211 million (U.S.$825 million). This, in addition to our proven capacity to continually refinance and replace short-term obligations, will enable us to meet any liquidity risk in the short term.
Capital Expenditures
Our capital expenditures incurred for the years ended December 31, 2017 and 2018, and our expected capital expenditures during 2019, which include an allocation to 2019 of a portion of our total future committed amount, are as follows:
63
| Actual for the Year Ended December 31, Actual |
Estimated in 2019 | |||||||||||
| 2017 | 2018 | |||||||||||
| (in millions of U.S. Dollars) | ||||||||||||
| Mexico |
113 | 117 | 157 | |||||||||
| United States |
185 | 239 | 236 | |||||||||
| Europe |
||||||||||||
| United Kingdom |
53 | 47 | 44 | |||||||||
| France |
20 | 23 | 39 | |||||||||
| Germany |
23 | 16 | 18 | |||||||||
| Spain |
29 | 26 | 14 | |||||||||
| Poland |
12 | 29 | 25 | |||||||||
| Czech Republic |
8 | 9 | 8 | |||||||||
| Rest of Europe |
9 | 11 | 13 | |||||||||
| South, Central America and the Caribbean |
||||||||||||
| Colombia |
62 | 22 | 22 | |||||||||
| Panama |
8 | 12 | 9 | |||||||||
| Costa Rica |
2 | 3 | 3 | |||||||||
| Caribbean TCL |
31 | 27 | 16 | |||||||||
| Dominican Republic |
9 | 8 | 8 | |||||||||
| Rest of South, Central America and the Caribbean |
9 | 8 | 17 | |||||||||
| Asia, Middle East and Africa |
||||||||||||
| Philippines |
28 | 28 | 152 | |||||||||
| Egypt |
22 | 9 | 10 | |||||||||
| Israel |
21 | 21 | 19 | |||||||||
| Rest of Asia, Middle East and Africa |
3 | 5 | 9 | |||||||||
| Others |
5 | 5 | 30 | |||||||||
|
|
|
|
|
|
|
|
|
| ||||
| Total consolidated |
653 | 668 | 850 | |||||||||
|
|
|
|
|
|
|
|
|
| ||||
| Of which: |
||||||||||||
| Expansion capital expenditures |
137 | 160 | 550 | |||||||||
| Base capital expenditures |
516 | 508 | 300 | |||||||||
|
|
|
|
|
|
|
|
|
| ||||
For the years ended December 31, 2017 and 2018, we recognized U.S.$656 million and U.S.$668 million in capital expenditures from our continuing operations, respectively. As of December 31, 2018, in connection with our significant projects, we had contractually committed capital expenditures of approximately U.S.$130 million, including our capital expenditures estimated to be incurred during 2019. This amount is expected to be incurred during 2019, based on the evolution of the related projects. Pursuant to the 2017 Credit Agreement, we are prohibited from making aggregate annual capital expenditures in excess of U.S.$1 billion in any financial year (excluding certain capital expenditures, joint venture investments and acquisitions by each of CLH and CHP and their respective subsidiaries and those funded by Relevant Proceeds (as defined in the 2017 Credit Agreement)), which capital expenditures, joint venture investments and acquisitions at any time then incurred are subject to a separate aggregate limit of (a) U.S.$500 million (or its equivalent) for CLH and its subsidiaries and (b) U.S. $500 million (or its equivalent) for CHP and its subsidiaries. In addition, the amounts of which we and our subsidiaries are allowed for permitted acquisitions and investments in joint ventures cannot exceed certain thresholds as set out in the 2017 Credit Agreement.
Our Indebtedness
As of December 31, 2018, we had Ps207,724 million (U.S.$10,571 million) (principal amount Ps209,153 million (U.S.$10,644 million), excluding deferred issuance costs) of total debt plus other financial obligations in our statement of financial position, which does not include Ps8,729 million (U.S.$444 million) of Perpetual Debentures. Of our total debt plus other financial obligations, 7% were short-term (including current maturities of long-term debt) and 93% were long-term. As of December 31, 2018, 64% of our total debt plus other financial obligations was Dollar-denominated, 26% was Euro-denominated, 5% was Pound Sterling-denominated, 3% was Philippine Peso-denominated and immaterial amounts were denominated in other currencies. See notes 16.1, 16.2 and 20.4 to our 2018 audited consolidated financial statements included in the February 28 6-K.
On August 14, 2009, CEMEX, S.A.B. de C.V. and certain of its subsidiaries entered into a financing agreement (the “2009 Financing Agreement”), which extended the final maturities of U.S.$15 billion in syndicated and bilateral loans and private placement notes to February 14, 2014. On July 5, 2012, CEMEX, S.A.B. de C.V. and
64
certain of its subsidiaries launched an exchange offer and consent request (the “2012 Exchange Offer and Consent Request”) to eligible creditors under the 2009 Financing Agreement pursuant to which eligible creditors were requested to consent to certain amendments to the 2009 Financing Agreement (together, the “2012 Amendment Consents”). In addition, CEMEX, S.A.B. de C.V. and certain of its subsidiaries offered to exchange the indebtedness owed to such creditors under the 2009 Financing Agreement that were eligible to participate in the 2012 Exchange Offer and Consent Request (the “Participating Creditors”) for (i) new loans (or, in the case of the private placement notes, new private placement notes) or (ii) up to U.S.$500 million of our 9.50% Senior Secured Notes due 2018 issued on September 17, 2012 (the “June 2018 U.S. Dollar Notes”), in each case, in transactions exempt from registration under the Securities Act of 1933, as amended (the “Securities Act”). On September 17, 2012, CEMEX, S.A.B. de C.V. and certain of its subsidiaries successfully completed the refinancing transactions contemplated by the 2012 Exchange Offer and Consent Request (collectively, the “2012 Refinancing Transaction”), and CEMEX, S.A.B. de C.V. and certain of its subsidiaries entered into (a) an amendment and restatement agreement, dated September 17, 2012, pursuant to which the 2012 Amendment Consents with respect to the 2009 Financing Agreement were given effect, and (b) a facilities agreement, dated September 17, 2012 (as amended from time to time, the “2012 Facilities Agreement”), pursuant to which CEMEX, S.A.B. de C.V. and certain of its subsidiaries were deemed to borrow loans from those Participating Creditors participating in the 2012 Exchange Offer and Consent Request in principal amounts equal to the principal amounts of indebtedness subject to the 2009 Financing Agreement that was extinguished by such Participating Creditors. As a result of the 2012 Refinancing Transaction, Participating Creditors received (i) U.S.$6,155 million in aggregate principal amount of new loans and new private placement notes and (ii) U.S.$500 million aggregate principal amount of the June 2018 U.S. Dollar Notes. In addition, U.S.$525 million aggregate principal amount of loans and private placement notes, which had remained outstanding under the 2009 Financing Agreement as of September 17, 2012, were subsequently repaid in full, as a result of prepayments made in accordance with the 2012 Facilities Agreement.
On September 29, 2014, CEMEX, S.A.B. de C.V. and certain of its subsidiaries entered into a facilities agreement, as amended and restated (the “2014 Credit Agreement”), for U.S.$1.35 billion with nine of the main lending banks from its 2012 Facilities Agreement. On November 3, 2014, five additional banks joined the 2014 Credit Agreement as lenders with aggregate commitments of U.S.$515 million, increasing the total amount of the 2014 Credit Agreement from U.S.$1.35 billion to U.S.$1.87 billion (increasing the revolving tranche of the 2014 Credit Agreement proportionally to U.S.$746 million).
On July 30, 2015, CEMEX, S.A.B. de C.V. repaid in full the total amount outstanding of U.S.$1.94 billion under the 2012 Facilities Agreement with new funds from 17 financial institutions, which joined new tranches under the 2014 Credit Agreement.
On November 30, 2016, CEMEX, S.A.B. de C.V. prepaid U.S.$373 million outstanding under the 2014 Credit Agreement and corresponding to the September 2017 amortization thereunder. In addition to this prepayment, and as part of an agreement reached with a group of lenders under the 2014 Credit Agreement, U.S.$664 million (Ps13,758 million) of funded commitments under the 2014 Credit Agreement maturing in 2018 were exchanged into a revolving facility, maintaining their original amortization schedule and the same terms and conditions.
On July 19, 2017, CEMEX, S.A.B. de C.V. and certain of its subsidiaries entered into the 2017 Credit Agreement for an amount in different currencies equivalent to U.S.$4.1 billion (in aggregate), the proceeds of which were used to refinance in full the indebtedness incurred under the 2014 Credit Agreement and other debt repayment obligations, allowing us to increase the average life of our syndicated bank debt to approximately 4.3 years with a final maturity in July 2022. The indebtedness incurred under the 2017 Credit Agreement ranks equally in right of payment with certain of our other existing and future indebtedness, pursuant to the terms of the Intercreditor Agreement.
As of July 19, 2017, total commitments initially available under the 2017 Credit Agreement included (i) €741 million, (ii) £344 million and (iii) U.S.$2,746 million, out of which U.S.$1,135 million were in the revolving credit facility tranche of the 2017 Credit Agreement. As of December 31, 2018, the 2017 Credit Agreement had an amortization profile, considering all commitments of U.S.$4.1 billion under the 2017 Credit Agreement, of U.S.$580 million in 2020, U.S.$1,159 million in 2021 and U.S.$1,440 million in 2022. See note 16.1 to our 2018 audited consolidated financial statements included in the February 28 6-K.
65
CEMEX, S.A.B. de C.V. and certain of its subsidiaries have pledged the Collateral and all proceeds of the Collateral, to secure our payment obligations under the 2017 Credit Agreement, our outstanding Senior Secured Notes and under several other of our financing arrangements. These subsidiaries whose shares were pledged or transferred as part of the Collateral collectively own, directly or indirectly, substantially all our operations worldwide. See “Risk Factors—We pledged the capital stock of some of our subsidiaries that represent substantially all of our business as collateral to secure our payment obligations under the 2017 Credit Agreement, the indentures governing our outstanding Senior Secured Notes and other financing arrangements.”
As of December 31, 2018, we reported an aggregate amount of outstanding debt of Ps62,460 million (U.S.$3,179 million) under the 2017 Credit Agreement. As of December 31, 2018, we had U.S.$825 million available under the U.S.$1,135 million revolving credit facility tranche of the 2017 Credit Agreement. If we are unable to comply with our upcoming principal maturities under our indebtedness, or are not able to refinance or extend maturities of our indebtedness, our debt could be accelerated. Acceleration of our debt would have a material adverse effect on our financial condition. See “Risk Factors—We have a substantial amount of debt and other financial obligations maturing in the next several years. If we are unable to secure refinancing on favorable terms or at all, we may not be able to comply with our upcoming payment obligations. Our ability to comply with our principal maturities and financial covenants may depend on us implementing certain initiatives which may include making asset sales, and there is no assurance that we will be able to execute such sales on terms favorable to us or at all.”
For a discussion of restrictions and covenants under the 2017 Credit Agreement, see “Risk Factors—Risks Relating to Our Business—The 2017 Credit Agreement contains several restrictions and covenants. Our failure to comply with such restrictions and covenants could have a material adverse effect on our business and financial conditions” of our 2017 Annual Report and under “Risk Factors” in this report.
For a description of the Senior Secured Notes, see “Summary of Material Contractual Obligations and Commercial Commitments—Senior Secured Notes.”
Some of our subsidiaries and special purpose vehicles (“SPVs”) have issued and/or provided guarantees of certain of our indebtedness, as indicated in the table below.
|
The Notes |
Notes |
2017 |
Perpetual | |||||
| Amount outstanding as of December 31, 2018(1) |
U.S.5,606 (Ps110,907 million)) |
U.S.$3,179 |
U.S.$444 | |||||
| CEMEX Finance LLC | ✓ | ✓ | ✓ | |||||
| CEMEX, S.A.B. de C.V. | ✓ | ✓ | ✓ | ✓ | ||||
| CEMEX México, S.A. de C.V. | ✓ | ✓ | ✓ | ✓ | ||||
| CEMEX Concretos, S.A. de C.V. | ✓ | ✓ | ✓ | |||||
| Empresas Tolteca de México, S.A. de C.V. | ✓ | ✓ | ✓ | |||||
| New Sunward Holding B.V. | ✓ | ✓ | ✓ | ✓ | ||||
| CEMEX España, S.A. | ✓ | ✓ | ✓ | |||||
| Cemex Asia B.V. | ✓ | ✓ | ✓ | |||||
| CEMEX Corp. | ✓ | ✓ | ✓ | |||||
| Cemex Africa & Middle East Investments B.V. | ✓ | ✓ | ✓ | |||||
| CEMEX France Gestion (S.A.S.) | ✓ | ✓ | ✓ | |||||
| Cemex Research Group AG | ✓ | ✓ | ✓ | |||||
| CEMEX UK | ✓ | ✓ | ✓ |
| (1) | Includes Senior Secured Notes and Perpetual Debentures held by CEMEX, as applicable. |
66
In addition, as of December 31, 2018, (i) CEMEX Materials LLC is a borrower of Ps3,042 million (U.S.$155 million) (principal amount Ps2,945 million (U.S.$150 million)) under an indenture, which is guaranteed by CEMEX Corp.; and (ii) several of our other operating subsidiaries were borrowers under debt facilities aggregating Ps6,728 million (U.S.$342 million).
Most of our outstanding indebtedness has been incurred to finance our acquisitions and to finance our capital expenditure programs. Historically, we have addressed our liquidity needs (including funds required to make scheduled principal and interest payments, refinance debt, and fund working capital and planned capital expenditures) with operating cash flow, securitizations, borrowings under credit facilities, proceeds of debt and equity offerings and proceeds from asset sales.
If the global economic environment deteriorates and our operating results worsen significantly, if we were unable to complete debt or equity offerings or if the proceeds of any divestitures and/or our cash flow or capital resources prove inadequate, we could face liquidity problems and may not be able to comply with our upcoming principal payments under our indebtedness or refinance our indebtedness. If we are unable to comply with our upcoming principal maturities under our indebtedness, or refinance or extend maturities of our indebtedness, our debt could be accelerated. Acceleration of our debt would have a material adverse effect on our business and financial condition.
We and our subsidiaries have sought and obtained waivers and amendments to several of our debt instruments relating to a number of financial ratios in the past. Our ability to comply with these ratios may be affected by current global economic conditions and volatility in foreign exchange rates and the financial and capital markets. We may need to seek waivers or amendments in the future. However, we cannot assure you that any future waivers or amendments, if requested, will be obtained. If we or our subsidiaries are unable to comply with the provisions of our debt instruments, and are unable to obtain a waiver or amendment, the indebtedness outstanding under such debt instruments could be accelerated. Acceleration of these debt instruments would have a material adverse effect on our financial condition.
Relevant Transactions Related to Our Indebtedness in 2018
As of December 31, 2018, we had Ps207,724 million (U.S.$10,571 million) (principal amount Ps209,153 million (U.S.$10,644 million), excluding deferred issuance costs) of total debt plus other financial obligations in our statement of financial position, which does not include Ps8,729 million (U.S.$444 million) of Perpetual Debentures. As of December 31, 2018, 64% of our total debt plus other financial obligations was Dollar-denominated, 26% was Euro-denominated, 5% was Pound Sterling-denominated, 3% was Philippine Peso-denominated and immaterial amounts were denominated in other currencies. The following is a description of our most important transactions related to our indebtedness in 2018:
| ● | On January 10, 2018, we redeemed the remaining €400 million aggregate principal amount of the 4.750% Senior Secured Notes due 2022 (the “January 2022 Euro Notes”). |
| ● | On February 14, 2018, we drew down U.S.$377 million aggregate principal amount under the previously undrawn term loan tranche of the 2017 Credit Agreement. |
| ● | On February 14, 2018, we agreed, through one of our subsidiaries in the United States, to increase our ownership interest in Lehigh White Cement Company from 24.5% to 36.75%. On March 29, 2018, we closed the acquisition and paid a total of U.S.$36 million. |
| ● | On March 15, 2018, we redeemed the remaining U.S.$365 million aggregate principal amount of the 3.750% Convertible Subordinated Notes due 2018 (the “March 2018 Optional Convertible Subordinated U.S. Dollar Notes”). |
| ● | On March 15, 2018, we redeemed the remaining U.S.$341 million aggregate principal amount of the 7.25% Senior Secured Notes due 2021 (the “January 2021 U.S. Dollar Notes”). |
67
| ● | During March 2018, we renewed the securitization programs outstanding in the United States, France and the United Kingdom. As a result of such renewals, each program is now scheduled to mature in March 2019. |
| ● | During June 2018, we renewed the securitization progam outstanding in Mexico. As a result of such renewal, the program is now scheduled to mature in June 2019. |
| ● | In July 2018, we redeemed the remaining U.S.$313 million aggregate principal amount of the L + 4.75% Senior Secured Notes due 2018 (the “October 2018 U.S. Dollar Notes”). |
| ● | During 2018, we conducted drawdowns and repayments under the revolving tranche of the 2017 Credit Agreement, resulting in a principal outstanding amount under the revolving tranche of the 2017 Credit Agreement of Ps6,092 million (U.S.$310 million) as of December 31, 2018. In addition, as of December 31, 2018, we had an aggregate amount of Ps16,211 million (U.S.$825 million) available under the revolving tranche of the 2017 Credit Agreement. |
We used a substantial portion of the proceeds from these transactions to repay and refinance indebtedness, to improve our liquidity position and for general corporate purposes. Through these and prior refinancing transactions, we addressed all maturities under the 2009 Financing Agreement, the 2012 Facilities Agreement and the 2014 Credit Agreement. For a description of the 2017 Credit Agreement, see “—Our Indebtedness.”
Our Other Financial Obligations
Other financial obligations in the consolidated statement of financial position as of December 31, 2017 and 2018 are detailed as follows:
| December 31, 2017 | December 31, 2018 | |||||||||||||||||||||||
| Short- term |
Long- term |
Total | Short- term |
Long- term |
Total | |||||||||||||||||||
| March 2020 Optional Convertible Subordinated U.S. Dollar Notes |
— | 9,985 | 9,985 | — | 10,097 | 10,097 | ||||||||||||||||||
| March 2018 Optional Convertible Subordinated U.S. Dollar Notes |
7,115 | — | 7,115 | — | — | — | ||||||||||||||||||
| November 2019 Mandatory Convertible Mexican Peso Notes |
323 | 371 | 694 | 374 | — | 374 | ||||||||||||||||||
| Liabilities secured with accounts receivable |
11,313 | — | 11,313 | 11,770 | — | 11,770 | ||||||||||||||||||
| Finance leases |
611 | 2,503 | 3,114 | 595 | 1,931 | 2,526 | ||||||||||||||||||
|
|
|
|
|
|
|
|
|
|
|
|
|
|
|
|
|
|
| |||||||
| 19,362 | 12,859 | 32,221 | 12,739 | 12,028 | 24,767 | |||||||||||||||||||
|
|
|
|
|
|
|
|
|
|
|
|
|
|
|
|
|
|
| |||||||
As mentioned in note 2.6 to our 2018 audited consolidated financial statements included in the February 28 6-K, which is incorporated by reference in this report, financial instruments convertible into CEMEX, S.A.B. de C.V.’s CPOs and/or ADSs contain components of both liability and equity, which are recognized differently depending on whether the instrument is mandatorily convertible, or is optionally convertible by election of the note holders, as well as upon the currency in which the instrument is denominated and the functional currency of the issuer.
March 2020 Optional Convertible Subordinated U.S. Dollar Notes
During 2015, CEMEX, S.A.B. de C.V. issued U.S.$521 million aggregate principal amount of 3.72% convertible subordinated notes due in March 2020 (the “March 2020 Optional Convertible Subordinated U.S. Dollar Notes”) as a result of exchanges or settlements of other convertible notes. The March 2020 Optional Convertible Subordinated U.S. Dollar Notes, which are subordinated to all of CEMEX’s liabilities and commitments, are convertible into a fixed number of CEMEX, S.A.B. de C.V.’s ADSs at any time at the holder’s election and are subject to antidilution adjustments. The aggregate fair value of the conversion option as of the issuance dates, which amounted to Ps199 million, was recognized in other equity reserves. As of December 31, 2017 and 2018, the conversion price per ADS for the March 2020 Optional Convertible Subordinated U.S. Dollar Notes was approximately U.S.$11.01 in both years. After antidilution adjustments, the conversion rate for the March 2020 Optional Convertible Subordinated U.S. Dollar Notes as of December 31, 2017 and 2018 was 90.8592 ADSs per each U.S.$1,000 principal amount of such notes in both years. See note 16.2 to our 2018 audited consolidated financial statements included in the February 28 6-K.
68
March 2018 Optional Convertible Subordinated U.S. Dollar Notes
On March 15, 2011, CEMEX, S.A.B. de C.V. closed the offering of U.S.$690 million principal amount of 3.75% convertible subordinated notes due in 2018 (the “March 2018 Optional Convertible Subordinated U.S. Dollar Notes”). The notes were subordinated to all of CEMEX’s liabilities and commitments. The notes were convertible into a fixed number of CEMEX, S.A.B. de C.V. ADSs and are subject to antidilution adjustments. On June 19, 2017, CEMEX, S.A.B. de C.V. agreed with certain institutional holders on the early conversion of U.S.$325 million of the March 2018 Optional Convertible Subordinated U.S. Dollar Notes in exchange for the issuance of approximately 43 million ADSs, which included the number of additional ADSs issued to the holders as non-cash inducement premiums. As a result of the early conversion, the liability component of the converted notes of Ps5,468 million was reclassified from “Other financial obligations” to “Other equity reserves”. In addition, CEMEX, S.A.B. de C.V. increased common stock for Ps4 million and additional paid-in capital for Ps7,059 million against other equity reserves, and recognized expense for the inducement premiums paid in shares of Ps769 million, recognized within “Financial income and other items, net” in the income statement for 2017. After the early conversion of notes described above, the U.S.$365 million of the March 2018 Optional Convertible Subordinated U.S. Dollar Notes that remained outstanding, were repaid in cash at their maturity on March 15, 2018. Concurrent with the offering of the March 2018 Optional Convertible Subordinated U.S. Dollar Notes, a portion of the net proceeds from this transaction was used to fund the purchase of capped call options, which, when purchased, were had generally expected to reduce the potential dilution cost to CEMEX upon the potential conversion of such notes. See notes 16.2 and 16.4 to our 2018 audited consolidated financial statements included in the February 28 6-K.
November 2019 Mandatory Convertible Mexican Peso Notes
In December 2009, CEMEX, S.A.B. de C.V. exchanged debt into U.S.$315 million principal amount of 10% mandatorily convertible securities denominated in Mexican Pesos with maturity in 2019 (the “November 2019 Mandatory Convertible Mexican Peso Notes”). Reflecting antidilution adjustments, the notes will be converted at maturity or earlier if the price of the CPO reaches Ps26.22 into approximately 236 million CPOs at a conversion price of Ps17.48 per CPO. Holders have an option to voluntarily convert their securities on any interest payment date into CPOs. Considering the currency in which the notes are denominated and the functional currency of CEMEX, S.A.B. de C.V.’s financing division, the conversion option embedded in these securities is treated as a stand-alone derivative liability at fair value in the income statements. Changes in fair value of the conversion option generated losses of U.S.$29 million (Ps545 million) in 2016, gains of U.S.$19 million (Ps359 million) in 2017, and gains of U.S.$20 million (Ps391 million) in 2018. The March 2018 Optional Convertible Subordinated U.S. Dollar Notes did not convert, and were redeemed upon maturity on March 15, 2018. See notes 2.4, 16.2 and 16.4 to our 2018 audited consolidated financial statements included in the February 28 6-K.
Our Receivables Financing Arrangements
Our subsidiaries in Mexico, the United States, France and the United Kingdom are parties to sales of trade accounts receivable programs with financial institutions, referred to as securitization programs. As of December 31, 2017 and 2018, trade accounts receivable included receivables of U.S.$647 million (Ps12,713 million) and U.S.$664 million (Ps13,048 million), respectively. Under these programs, our subsidiaries effectively surrender control associated with the trade accounts receivable sold and there is no guarantee or obligation to reacquire the assets; nonetheless, in such programs, our subsidiaries retain certain residual interest in the programs and/or maintain continuing involvement with the accounts receivable; therefore, the trade accounts receivable sold were not removed from the statement of financial position and the funded amounts were recognized within the line item of “Other financial obligations,” and the difference in each year against the trade receivables sold was maintained as reserves. Trade accounts receivable qualifying for sale exclude amounts over certain days past due or concentrations over certain limits to any customer, according to the terms of the programs. The portion of the accounts receivable sold maintained as reserves amounted to U.S.$71 million (Ps1,400 million) and U.S.$65 million (Ps1,278 million) as of December 31, 2017 and 2018, respectively. Therefore, the funded amount to us was U.S.$576 million (Ps11,313 million) in 2017 and U.S.$599 million (Ps11,770 million) as of December 31, 2018. The discount granted to the acquirers of the trade accounts receivable is recorded as financial expense and amounted to U.S.$16 million
69
(Ps308 million) and U.S.$23 million (Ps446 million) in 2017 and 2018, respectively. Our securitization programs are negotiated for periods of one year and are usually renewed at their maturity. See notes 9 and 16.2 to our 2018 audited consolidated financial statements included in the February 28 6-K.
Finance Leases
As of December 31, 2017 and 2018, we held several operating buildings and mainly mobile equipment, under finance lease contracts for a total of U.S.$158 million (Ps3,114 million) and U.S.$129 million (Ps2,526 million), respectively. See note 16.2 to our 2018 audited consolidated financial statements included in the February 28 6-K. Future payments associated with these contracts are presented in note 23.5 to our 2018 audited consolidated financial statements included in the February 28 6-K.
Perpetual Debentures
We define the “Perpetual Debentures” as, collectively, (i) U.S. Dollar-Denominated 6.196% Fixed-to-Floating Rate Callable Perpetual Debentures issued by C5 Capital (SPV) Limited, (ii) U.S. Dollar-Denominated 6.640% Fixed-to-Floating Rate Callable Perpetual Debentures issued by C8 Capital (SPV) Limited, (iii) U.S. Dollar-Denominated 6.722% Fixed-to-Floating Rate Callable Perpetual Debentures issued by C10 Capital (SPV) Limited and (iv) Euro-Denominated 6.277% Fixed-to-Floating Rate Callable Perpetual Debentures issued by C10-EUR Capital (SPV) Limited.
As of December 31, 2016, 2017 and 2018, non-controlling interest stockholders’ equity included U.S.$438 million (Ps9,075 million), U.S.$447 million (Ps8,784 million) and U.S.$444 million (Ps8,729 million), respectively, representing the notional amount of Perpetual Debentures, which exclude any perpetual debentures held by subsidiaries. The Perpetual Debentures have no fixed maturity date and do not represent contractual obligations to exchange any series of its outstanding Perpetual Debentures for financial assets or financial liabilities. Based on their characteristics, the Perpetual Debentures, issued through SPVs, qualify as equity instruments and are classified within non-controlling interest as they were issued by consolidated entities, and, if the conditions to interest deferred are satisfied, we have the unilateral right to defer indefinitely the payment of interest due on the Perpetual Debentures. Issuance costs, as well as the interest expense, which is accrued based on the principal amount of the Perpetual Debentures, are included within “Other equity reserves” and represented expenses of Ps507 million, Ps482 million and Ps553 million in 2016, 2017 and 2018, respectively. The different SPVs were established solely for purposes of issuing the Perpetual Debentures and are included in our 2018 audited consolidated financial statements included in the February 28 6-K. As of December 31, 2017, the Perpetual Debentures were as follows:
| Issuer |
Issuance Date | Nominal Amount at Issuance Date (in millions) |
Nominal Amount Outstanding as of December 31, 2018 (in millions) |
Repurchase Option | Interest Rate | |||||
| C10-EUR Capital (SPV) Ltd.(3) |
May 2007 | €730 | €64 | Tenth anniversary | EURIBOR + 4.79% | |||||
|
C8 Capital (SPV) Ltd.(2) |
February 2007 | U.S.$750 | U.S.$135 | Eighth anniversary | LIBOR + 4.40% | |||||
| C5 Capital (SPV) Ltd.(1)(2) |
December 2006 | U.S.$350 | U.S.$61 | Fifth anniversary | LIBOR + 4.277% | |||||
|
C10 Capital (SPV) Ltd.(2) |
December 2006 | U.S.$900 | U.S.$175 | Tenth anniversary | LIBOR + 4.71% |
| (1) | Under the 2017 Credit Agreement, and previously under the 2014 Credit Agreement, we are not permitted to call the Perpetual Debentures. |
| (2) | “LIBOR” above refers to the London Inter-Bank Offered Rate. As of December 31, 2017 and 2018, 3-month LIBOR was approximately 1.6943% and 2.8076%, respectively. |
| (3) | “EURIBOR” above refers to the Euro Interbank Offered Rate. As of December 31, 2017 and 2018, 3-month EURIBOR was approximately – 0.329% and –0.309%, respectively. |
Stock Repurchase Program
Under Mexican law, CEMEX, S.A.B. de C.V.’s shareholders are the only ones authorized to approve the maximum amount of resources that can be allocated to the stock repurchase program at any annual general ordinary shareholders’ meeting. Unless otherwise instructed by CEMEX, S.A.B. de C.V.’s shareholders, we are not required to purchase any minimum number of shares pursuant to such program.
70
In connection with CEMEX, S.A.B. de C.V.’s 2015 and 2016 annual general ordinary shareholders’ meetings held on March 31, 2016 and March 30, 2017, respectively, no maximum amount of resources was proposed for a stock repurchase program. In connection with CEMEX, S.A.B. de C.V.’s 2017 annual general ordinary shareholders’ meeting held on April 5, 2018, a proposal was approved to set the amount of U.S.$500 million or its equivalent in Mexican Pesos as the maximum amount of resources for the year ending on December 31, 2018, and until the next ordinary shareholders meeting to be held in 2019, which reviews the 2018 financial year, that CEMEX, S.A.B. de C.V. can use to repurchase its own shares or securities that represent such shares. The board of directors of CEMEX, S.A.B. de C.V. approved the policy and procedures for the operation of the stock repurchase program, and is authorized to determine the basis on which the repurchase and placement of such shares is made, appoint the persons who will be authorized to make the decision of repurchasing or replacing such shares and appoint the persons responsible to make the transaction and furnish the corresponding notices to authorities. The board of directors and/or attorneys-in-fact or delegates designated in turn, or the persons responsible for such transactions, will determine in each case, if the repurchase is made with a charge to stockholders’ equity as long as the shares belong to CEMEX, S.A.B. de C.V., or with a charge to share capital if it is resolved to convert the shares into non-subscribed shares to be held in treasury. We remain subject to certain restrictions regarding the repurchase of shares of our capital stock under the 2017 Credit Agreement and the indentures governing the outstanding Senior Secured Notes.
On November 27, 2018, CEMEX, S.A.B. de C.V. initiated its stock repurchase program as per the resolutions approved at CEMEX, S.A.B. de C.V.’s 2017 annual general ordinary shareholders’ meeting held on April 5, 2018. As of December 31, 2018, a total of 153,603,753 CPOs were repurchased at an average price of approximately Ps 9.90 per CPO, for a total amount of Ps 1,520 million (U.S.$75 million).
The following table sets out information concerning repurchases by CEMEX, S.A.B. de C.V. of its CPOs in 2018. We did not repurchase CPOs other than through the stock repurchase program.
| Period |
Total Number of CPOs Purchased |
Average Price per CPO |
Total Number of CPOs Purchases as Part of Publicly Announced Plans or Programs |
Approximate Peso Value of CPOs that May Yet Be Purchased Under Plans |
||||||||||||
|
January 1 to January 31 |
- | - | - | - | ||||||||||||
|
February 1 to February 28 |
- | - | - | - | ||||||||||||
|
March 1 to March 31 |
- | - | - | - | ||||||||||||
|
April 1 to April 30 |
- | - | - | 9,309,800,000.00 | ||||||||||||
|
May 1 to May 31 |
- | - | - | 9,309,800,000.00 | ||||||||||||
|
June 1 to June 30 |
- | - | - | 9,309,800,000.00 | ||||||||||||
|
July 1 to July 31 |
- | - | - | 9,309,800,000.00 | ||||||||||||
|
August 1 to August 31 |
- | - | - | 9,309,800,000.00 | ||||||||||||
|
September 1 to September 30 |
- | - | - | 9,309,800,000.00 | ||||||||||||
|
October 1 to October 31 |
- | - | - | 9,309,800,000.00 | ||||||||||||
|
November 1 to November 30 |
37,743.252 | 9.9481 | 37,743.252 | 8,934,326,030.80 | ||||||||||||
|
December 1 to December 31 |
115,860,501 | 9.8780 | 115,860,501 | 7,789,859,079.81 | ||||||||||||
|
Total |
153,603,753 | 153,603,753 | ||||||||||||||
Research and Development, Patents and Licenses, etc.
Headed by CEMEX Research and Development Centers in Switzerland (“CEMEX Research Center”), R&D is increasingly assuming a key role as it is recognized as an important contributor to CEMEX’s comprehensive pricing strategy for CEMEX’s products. Through the development of innovative technologies, services, and commercial models, CEMEX is leveraging its know-how based assets to create an important differentiation in its offerings to customers in a broad range of markets with unique challenges. Focus is placed on creating tangible value for our customers by making their business more profitable, but more importantly, as leaders in the industry, there is an underlying mission for CEMEX to elevate and accelerate the industry’s evolution in order to achieve greater sustainability, increase engagement in social responsibility and provoke an important leap in its technological advancement.
71
CEMEX’s R&D initiatives are globally led, coordinated and managed by CEMEX Research Center, which encompasses the areas of Product Development & Construction Trends, Cement Production Technology, Sustainability, Business Process & IT, Innovation, and Commercial & Logistics. CEMEX’s interaction and engagement with customers is growing and evolving through the exploration of novel interaction methodologies. CEMEX’s R&D continues to develop and evolve in the area of customer centricity, but with complementary emphases on digitalization, development of digital-based business models, socio-urban dynamics, processes and technologies to mitigate CO2, and evaluating, adopting, and proposing methodologies to engage specific types of customers, whom are key decision makers in the very early stages of a construction project. Such methodologies are defining innovative approaches to involve and expose existing, potential, and future customers (e.g. Engineering & Architectural students) to our value added products (cement, aggregates, ready-mix, and admixtures) and constructions solutions. In other words, we aspire to create a unique customer experience in which the customer can see, touch, interact, and even stimulate the modification of our technologies. The areas of Product Development & Construction Trends and Cement Production Technology are responsible for, among others, developing new products for our cement, ready-mix concrete, aggregate and admixture businesses as well as introduce novel and/or improved processing and manufacturing technology for all of CEMEX’s core businesses The aforementioned areas also address energy efficiency of buildings, comfort, novel and more efficient construction systems. Additionally, the Product Development & Construction Trends and Sustainability areas collaborate to develop and propose construction solutions through consulting and the integration of the aforementioned technologies. The Cement Production Technology and Sustainability areas are dedicated to, among others, operational efficiencies leading to cost reductions and enhancing our CO2 footprint and overall environmental impact through the usage of alternative or biomass fuels, the use of supplementary materials in substitution of clinker as well as by managing our CO2 footprint, mitigating it and processing it in the context of a circular economy. For example, we have developed processes and products that allow us to reduce heat consumption in our kilns, which in turn reduces energy costs. Special emphasis is placed on defining parameters by which we communicate our efforts to preserve resources for the future, reduce our CO2 footprint, and become more resilient. On the energy front, the R&D team is taking on the topic of energy storage, which represents the largest and most near-term opportunity to accelerate renewable energy deployments and bring us closer to replacing fossil fuels as the primary resource to meet the world’s continual growth in energy demand. Global products/brands have been conceptualized and engineered to positively impact the jobsite safety, promote efficient construction practices, sensibly preserve natural resources vital to life, lower carbon foot-print and improve the quality of life in rapidly transforming cities. Underlying CEMEX’s R&D philosophy is a growing culture of global collaboration and coordination, where the Innovation Team identifies and promotes novel collaboration practices and mobilizes its adoption within CEMEX. Getting closer and understanding our customers is a fundamental transformation within CEMEX, and consequently the Commercial & Logistics area is carrying out research initiatives to better attend the needs of customers as well as identify key changes in our supply chain management that should enable us to bring products, solutions, and services to our customers in the most cost-effective and efficient manner, using what we believe to be the best available technologies to design a new standard in digital commercial models.
There are nine laboratories supporting CEMEX’s R&D efforts under a collaboration network. The laboratories are strategically located in close proximity to our plants, and assist the operating subsidiaries with troubleshooting, optimization techniques and quality assurance methods. The laboratory located in Switzerland is continually improving and consolidating our research and development efforts in the areas of cement, concrete, aggregates, admixtures, mortar and asphalt technology, sustainability as well as in energy management. In addition, CEMEX Research Center actively generates as well as registers patents and pending applications in many of the countries in which CEMEX operates. Patents and trade secrets are managed strategically in order for us to achieve important technology lock-ins associated with CEMEX technology.
Our Information Technology divisions develop information management systems and software relating to cement and ready-mix concrete operational practices, automation and maintenance. These systems have helped us to better serve our clients with respect to purchasing, delivery and payment. More importantly, thanks to the activities of the Business Process and IT departments, CEMEX is continuously improving and innovating its business processes to adapt them to the dynamically evolving markets, and better serve CEMEX’s needs. The launch of CEMEX GO and its deployment in our operations is a testament to our commitment to evolve our digital commercial model to better serve the market and our customers especially.
72
R&D activities comprise part of the daily routine of the departments and divisions mentioned above; therefore, the costs associated with such activities are expensed as incurred. However, the costs incurred in the development of software for internal use are capitalized and amortized in operating results over the estimated useful life of the software, which is approximately five years.
In 2016, 2017 and 2018 the total combined expense of the CEMEX technology and energy departments, which includes all significant R&D activities, amounted to Ps712 million (U.S.$38 million), Ps754 million (U.S.$38 million) and Ps758 million (U.S.$38 million), respectively.
Trend Information
Other than as disclosed elsewhere in this report, we are not aware of any trends, uncertainties, demands, commitments or events for the year ended December 31, 2018 that are reasonably likely to have a material and adverse effect on our revenues, income, profitability, liquidity or capital resources, or that would cause the disclosed financial information to be not necessarily indicative of future results of operations or financial conditions.
Summary of Material Contractual Obligations and Commercial Commitments
The 2017 Credit Agreement
On July 19, 2017, CEMEX, S.A.B. de C.V. and certain of its subsidiaries entered into a facilities agreement for an amount in different currencies equivalent to U.S.$4.1 billion (in aggregate), the proceeds of which were used to refinance indebtedness incurred under a then-existing credit agreement and other debt repayment obligations. As of December 31, 2017, the outstanding indebtedness incurred under the 2017 Credit Agreement was U.S.$2.5 billion.
As of December 31, 2018, we reported an aggregate principal amount of outstanding debt of Ps63,040 million (U.S.$3,208 million) under the 2017 Credit Agreement. The 2017 Credit Agreement is secured by a first-priority security interest over the Collateral and all proceeds of such Collateral. As of July 19, 2017, commitments initially available under the 2017 Credit Agreement included (i) €741 million, (ii) £344 million and (iii) U.S.$2,746 million, out of which U.S.$1,135 million were in the revolving credit facility tranche of the 2017 Credit Agreement. As of December 31, 2018, the 2017 Credit Agreement had an amortization profile, considering all commitments of U.S.$4.1 billion under the 2017 Credit Agreement, of U.S.$580 million in 2020, U.S.$1,159 million in 2021 and U.S.$1,440 million in 2022.
Our failure to comply with restrictions and covenants under the 2017 Credit Agreement could have a material adverse effect on our business and financial conditions.
For a discussion of restrictions and covenants under the 2017 Credit Agreement, see “Item 3—Key Information—Risk Factors—The 2017 Credit Agreement contains several restrictions and covenants. Our failure to comply with such restrictions and covenants could have a material adverse effect on our business and financial conditions” of our 2017 Annual Report and under “Risk Factors” in this report.
Senior Secured Notes
The indentures governing our outstanding Senior Secured Notes impose significant operating and financial restrictions on us. These restrictions will limit our ability, among other things, to: (i) create liens; (ii) incur in additional debt; (iii) change CEMEX’s business or the business of any obligor or material subsidiary (in each case, as defined in the 2017 Credit Agreement); (iv) enter into mergers; (v) enter into agreements that restrict our subsidiaries’ ability to pay dividends or repay intercompany debt; (vi) acquire assets; (vii) enter into or invest in joint venture agreements; (viii) dispose certain assets; (ix) grant additional guarantees or indemnities; (x) declare or pay cash dividends or make share redemptions; (xi) enter into certain derivatives transactions and (xii) exercise any call option in relation to any perpetual bonds issues unless the exercise of the call options does not have a materially negative impact on our cash flow.
73
January 2021 U.S. Dollar Notes and October 2018 U.S. Dollar Notes. On October 2, 2013, CEMEX, S.A.B. de C.V. issued the October 2018 U.S. Dollar Notes, in transactions exempt from registration pursuant to Rule 144A and Regulation S under the Securities Act. CEMEX México, CEMEX España, New Sunward, CEMEX Asia B.V. (“CEMEX Asia”), CEMEX Concretos, S.A. de C.V. (“CEMEX Concretos”), CEMEX Corp., CEMEX Finance, CEMEX Africa & Middle East Investments B.V. (“CEMEX Africa & Middle East Investments”), CEMEX France Gestion (S.A.S.) (“CEMEX France”), CEMEX Research Group AG (“CEMEX Research Group”), CEMEX UK and Empresas Tolteca de México, S.A. de C.V. (“Empresas Tolteca”) have fully and unconditionally guaranteed the performance of all obligations of CEMEX, S.A.B. de C.V. under the January 2021 U.S. Dollar Notes and October 2018 U.S. Dollar Notes. The payment of principal, interest and premium, if any, on such notes is secured by a first-priority security interest over the Collateral and all proceeds of the Collateral. On May 12, 2016, CEMEX, S.A.B. de C.V. completed the purchase of U.S.$178.5 million aggregate principal amount of the October 2018 U.S. Dollar Notes through a cash tender offer in May 2016 (the “May 2016 Tender Offer”). All such October 2018 U.S. Dollar Notes purchased in the May 2016 Tender Offer were immediately canceled. Following the settlement of the May 2016 Tender Offer, U.S.$319.5 million aggregate principal amount of the October 2018 U.S. Dollar Notes remained outstanding. In addition, we repurchased U.S.$6.1 million principal amount of the October 2018 U.S. Dollar Notes in open market purchases in 2016, all of which have been canceled. The remaining U.S.$313 million aggregate principal amount of the October 2018 U.S. Dollar Notes were redeemed in July 2018. CEMEX, S.A.B. de C.V. completed the purchase of U.S.$241.9 million and U.S.$385.1 million aggregate principal amount of the January 2021 U.S. Dollar Notes through a cash tender offer in October 2016 and a cash tender offer in March 2017. All such January 2021 U.S. Dollar Notes purchased in the tender offers were immediately canceled. Following the settlement of both tender offers, U.S.$341.7 million aggregate principal amount of the January 2021 U.S. Dollar Notes remained outstanding. In addition, we repurchased U.S.$31.4 million principal amount of the January 2021 U.S. Dollar Notes in open market purchases in 2016, all of which have been canceled. In addition, we repurchased U.S.$8.5 million principal amount of the January 2021 U.S. Dollar Notes in an open market purchase in 2017, all of which have been cancelled. On March 15, 2018, we redeemed all of the outstanding January 2021 U.S. Dollar Notes.
April 2024 U.S. Dollar Notes. On April 1, 2014, CEMEX Finance issued the April 2024 U.S. Dollar Notes in transactions exempt from registration pursuant to Rule 144A and Regulation S under the Securities Act. CEMEX, S.A.B. de C.V., CEMEX México, CEMEX España, New Sunward, CEMEX Asia, CEMEX Concretos, CEMEX Corp., CEMEX Africa & Middle East Investments, CEMEX France, CEMEX Research Group, CEMEX UK and Empresas Tolteca have fully and unconditionally guaranteed the performance of all obligations of CEMEX Finance under the April 2024 U.S. Dollar Notes. The payment of principal, interest and premium, if any, on such notes is secured by a first-priority security interest over the Collateral and all proceeds of the Collateral.
January 2025 U.S. Dollar Notes and January 2022 Euro Notes. On September 11, 2014, CEMEX, S.A.B. de C.V. issued the January 2025 U.S. Dollar Notes and the January 2022 Euro Notes, in transactions exempt from registration pursuant to Rule 144A and Regulation S under the Securities Act. CEMEX México, CEMEX Concretos, Empresas Tolteca, New Sunward, CEMEX España, CEMEX Asia, CEMEX Corp., CEMEX Finance, Cemex Africa & Middle East Investments, CEMEX France, CEMEX Research Group and CEMEX UK have fully and unconditionally guaranteed the performance of all obligations of CEMEX, S.A.B. de C.V. under the January 2025 U.S. Dollar Notes and January 2022 Euro Notes. The payment of principal, interest and premium, if any, on such notes is secured by a first-priority security interest over the Collateral and all proceeds of the Collateral. On January 10, 2018, we redeemed all of the outstanding January 2022 Euro Notes.
May 2025 U.S. Dollar Notes and March 2023 Euro Notes. In March 2015, CEMEX, S.A.B. de C.V. issued the May 2025 U.S. Dollar Notes and the March 2023 Euro Notes in transactions exempt from registration pursuant to Rule 144A and Regulation S under the Securities Act. CEMEX México, CEMEX Concretos, Empresas Tolteca, New Sunward, CEMEX España, CEMEX Asia, CEMEX Corp., CEMEX Finance, Cemex Africa & Middle East Investments, CEMEX France, CEMEX Research Group and CEMEX UK, have fully and unconditionally guaranteed the performance of all obligations of CEMEX, S.A.B. de C.V. under the May 2025 U.S. Dollar and March 2023 Euro Notes. The payment of principal, interest and premium, if any, on such notes is secured by a first-priority security interest over the Collateral and all proceeds of the Collateral.
74
April 2026 U.S. Dollar Notes. On March 16, 2016, CEMEX, S.A.B. de C.V. issued the April 2026 U.S. Dollar Notes, in transactions exempt from registration pursuant to Rule 144A and Regulation S under the Securities Act. CEMEX México, CEMEX España, New Sunward, CEMEX Asia, CEMEX Concretos, CEMEX Corp., CEMEX Finance, CEMEX Africa & Middle East Investments, CEMEX France, CEMEX Research Group and CEMEX UK and Empresas Tolteca have fully and unconditionally guaranteed the performance of all obligations of CEMEX, S.A.B. de C.V. under the April 2026 U.S. Dollar Notes. The payment of principal, interest and premium, if any, on such notes is secured by a first-priority security interest over the Collateral and all proceeds of the Collateral.
June 2024 Euro Notes. On June 14, 2016, CEMEX Finance issued the June 2024 Euro Notes in transactions exempt from registration pursuant to Rule 144A and Regulation S under the Securities Act. CEMEX, S.A.B. de C.V., CEMEX México, CEMEX Concretos, Empresas Tolteca, New Sunward, CEMEX España, CEMEX Asia, CEMEX Corp., Cemex Africa & Middle East Investments, CEMEX France, Cemex Research Group and CEMEX UK have fully and unconditionally guaranteed the performance of all obligations of CEMEX Finance under the June 2024 Euro Notes. The payment of principal, interest and premium, if any, on such notes is secured by a first-priority security interest over the Collateral and all proceeds of the Collateral.
December 2024 Euro Notes. On December 5, 2017, CEMEX, S.A.B. de C.V. issued the 2.750% Euro-Denominated Senior Secured Notes due 2024 (the “December 2024 Euro Notes”), in transactions exempt from registration pursuant to Rule 144A and Regulation S under the Securities Act. CEMEX México, CEMEX España, New Sunward, CEMEX Asia, CEMEX Concretos, CEMEX Corp., CEMEX Finance, CEMEX Africa & Middle East Investments, CEMEX France, CEMEX Research Group, CEMEX UK and Empresas Tolteca have fully and unconditionally guaranteed the performance of all obligations of CEMEX, S.A.B. de C.V. under the December 2024 Euro Notes. The payment of principal, interest and premium, if any, on such notes is secured by a first-priority security interest over the Collateral and all proceeds of the Collateral.
Convertible Notes
March 2020 Optional Convertible Subordinated U.S. Dollar Notes. During 2015, CEMEX, S.A.B. de C.V. issued U.S.$521 million aggregate principal amount of its March 2020 Optional Convertible Subordinated U.S. Dollar Notes. The March 2020 Optional Convertible Subordinated U.S. Dollar Notes were issued: (a) U.S.$200 million as a result of the exercise on March 13, 2015 of U.S.$200 million notional amount of CCUs, and (b) U.S.$321 million as a result of private exchanges with certain institutional investors on May 28, 2015, which together with early conversions, resulted in a total of U.S.$626 million aggregate principal amount of our 3.250% Convertible Subordinated Notes due 2016 issued in March 2011 (the “March 2016 Optional Convertible Subordinated U.S. Dollar Notes”) held by such investors being paid and the issuance and delivery by CEMEX of an estimated 42 million ADSs, which included a number of additional ADSs issued to the holders as non-cash inducement premiums. The March 2020 Optional Convertible Subordinated U.S. Dollar Notes, which are subordinated to all of CEMEX’s liabilities and commitments, are convertible into a fixed number of CEMEX, S.A.B. de C.V.’s ADSs at any time at the holder’s election and are subject to antidilution adjustments. The difference at the exchange date between the fair value of the March 2016 Optional Convertible Subordinated U.S. Dollar Notes and the 42 million ADSs against the fair value of the March 2020 Optional Convertible Subordinated U.S. Dollar Notes, represented a loss of Ps365 million recognized in 2015 as part of “Financial income and other items, net”. The aggregate fair value of the conversion option as of the issuance dates which amounted to Ps199 million was recognized in other equity reserves. As of December 31, 2017 and 2018, the conversion price per ADS for the March 2020 Optional Convertible Subordinated U.S. Dollar Notes was approximately U.S.$11.01 in both years. After antidilution adjustments, the conversion rate for the March 2020 Optional Convertible Subordinated U.S. Dollar Notes as of December 31, 2018 and 2018 was 90.8592 ADS per each U.S.$1,000 principal amount of such notes in both years. See note 16.2 to our 2018 audited consolidated financial statements included in the February 28 6-K.
November 2019 Mandatory Convertible Mexican Peso Notes. In December 2009, CEMEX, S.A.B. de C.V. completed an exchange offer of debt into mandatorily convertible securities in Pesos for approximately U.S.$315 million principal amount of the November 2019 Mandatory Convertible Mexican Peso Notes. Reflecting antidilution adjustments, the notes will be converted at maturity or earlier if the price of the CPO reaches Ps26.22 into approximately 236 million CPOs at a conversion price of Ps17.48 per CPO. The conversion rate under the November 2019 Mandatory Convertible Mexican Peso Notes is 509.1077 CPOs per each convertible obligation. During their tenure, holders have an option to voluntarily convert their securities on any interest payment date into CPOs. Considering the currency in which the notes are denominated and the functional currency of CEMEX, S.A.B.
75
de C.V.’s financing division, the conversion option embedded in these securities is treated as a stand-alone derivative liability at fair value in the income statements. Changes in fair value generated a gain of U.S.$20 million (Ps391 million) in 2018, a gain of U.S.$19 million (Ps359 million) in 2017 and a loss of U.S.$29 million (Ps545 million) in 2016. See note 16.2 to our 2018 audited consolidated financial statements included in the February 28 6-K.
March 2018 Optional Convertible Subordinated U.S. Dollar Notes. On March 15, 2011, CEMEX, S.A.B. de C.V. closed the offering of U.S.$690 million aggregate principal amount of the March 2018 Optional Convertible Subordinated U.S. Dollar Notes. The notes are subordinated to all of CEMEX’s liabilities and commitments. The notes are convertible into a fixed number of CEMEX, S.A.B. de C.V.’s ADSs, at the holder’s election, and are subject to antidilution adjustments. On June 19, 2017, the CEMEX, S.A.B. de C.V. agreed to, with certain institutional holders, the early conversion of approximately U.S.$325 in aggregate principal amount of the March 2018 Optional Convertible Subordinated U.S. Dollar Notes in exchange for approximately 43 million ADSs, which included the number of additional ADSs issued to the holders as non-cash inducement premiums. As a result of the early conversion agreements, the liability components of the converted notes of Ps5,468 million was reclassified from other financial obligations to other equity reserves. In addition, considering the issuance of shares, CEMEX, S.A.B. de C.V. increased common stock for Ps4 million and additional paid-in capital for Ps7,059 million against other equity reserves, and recognized expense for the inducement premiums paid in shares of Ps769 million, recognized within “Financial income and other items, net” in the 2017 income statement. After the early conversion of notes described above, the U.S.$365 million of the March 2018 Optional Convertible Subordinated U.S. Dollar Notes that remained outstanding, were repaid in cash at their maturity on March 15, 2018. Concurrent with the offering of the March 2018 Optional Convertible Subordinated U.S. Dollar Notes, a portion of the net proceeds from this transaction was used to fund the purchase of capped call options, which, when purchased, were generally expected to reduce the potential dilution cost to CEMEX upon the potential conversion of such notes See note 16.2 to our 2018 audited consolidated financial statements included in the February 28 6-K.
Commercial Commitments
On July 27, 2012, we entered into a Master Professional Services Agreement with IBM. This agreement provides the framework for the services IBM provides to us on a global scale, including: information technology, application development and maintenance, finance and accounting outsourcing, human resources administration and contact center services. The term of the agreement began on July 27, 2012 and will end on August 31, 2022, unless earlier terminated. Our minimum required payments to IBM under the agreement are approximately U.S.$50 million per year. We have the right to negotiate a reduction of service fees every two years if, as a result of a third party’s benchmarking assessment, it is determined that IBM’s fees are greater than those charged by other providers for services of similar nature. We may terminate the agreement (or a portion of it) at our discretion and without cause at any time by providing at least six-months’ notice to IBM and paying termination charges consisting of IBM’s unrecovered investment and breakage and wind-down costs. In addition, we may terminate the agreement (or a portion of it) for cause without paying termination charges. Other termination rights may be available to us for a termination charge that will vary with the reason for termination. IBM may terminate the agreement if we (i) fail to make payments when due or (ii) become bankrupt and do not pay in advance for the services.
On April 28, 2017, we completed the sale of the assets and activities related to the ready-mix concrete pumping business in Mexico to Cementos Españoles de Bombeo, S. de R.L., which is a Mexican subsidiary of Pumping Team specializing in the supply of ready-mix concrete pumping services, for an aggregate price of Ps1,649 million, which included the sale of fixed assets for Ps309 million, plus administrative and client and market development services, as well as the lease of facilities in Mexico that we will supply to Pumping Team over a period of ten years with the possibility to extend for three additional years, for an aggregate initial amount of Ps1,340 million. The proceeds are recognized each period as services are rendered. There is a possibility of contingent revenue, subject to results, of up to Ps557 million linked to annual metrics beginning in the first year and through the fifth year of the agreement. For the first year of operation under the agreements from May 2017 to April 2018, we received Ps25 million of such contingent revenue.
As of December 31, 2018, we did not depend on any of our suppliers of goods or services to conduct our business.
76
Contractual Obligations
As of December 31, 2017 and 2018, we had material contractual obligations as set forth in the table below.
| As of December 31, 2017 |
As of December 31, 2018 | |||||||||||||||||||||||
| Obligations |
Total | Less than 1 year |
1-3 years | 3-5 years | More than 5 years |
Total | ||||||||||||||||||
| (in millions of U.S. Dollars) | ||||||||||||||||||||||||
| Long-term debt |
U.S.$ | 9,892 | 7 | 1,788 | 2,347 | 5,197 | 9,339 | |||||||||||||||||
| Finance lease obligations(1) |
175 | 36 | 87 | 19 | 1 | 143 | ||||||||||||||||||
| Convertible notes(2) |
906 | 19 | 514 | – | – | 533 | ||||||||||||||||||
|
|
|
|
|
|
|
|
|
|
|
|
|
|||||||||||||
| Total debt and other financial obligations(3) |
10,973 | 62 | 2,389 | 2,366 | 5,198 | 10,015 | ||||||||||||||||||
| Interest payments on debt(4) |
3,073 | 508 | 960 | 777 | 535 | 2,780 | ||||||||||||||||||
| Pension plans and other benefits(5) |
1,587 | 148 | 270 | 270 | 664 | 1,352 | ||||||||||||||||||
| Acquisition of property, plant and equipment(6) |
— | 87 | 43 | – | – | 130 | ||||||||||||||||||
| Purchases of raw material, fuel and energy(7) |
4,326 | 702 | 955 | 1,230 | 2,270 | 5,157 | ||||||||||||||||||
|
|
|
|
|
|
|
|
|
|
|
|
|
|||||||||||||
| Total contractual obligations |
U.S.$ | 20,453 | 1,693 | 4,968 | 4,874 | 9,106 | 20,641 | |||||||||||||||||
|
|
|
|
|
|
|
|
|
|
|
|
|
|||||||||||||
| Total contractual obligations |
Ps | 401,901 | 33,267 | 97,621 | 95,774 | 178,933 | 405,595 | |||||||||||||||||
|
|
|
|
|
|
|
|
|
|
|
|
|
|||||||||||||
| (1) | Represents nominal cash flows. As of December 31, 2018, the net present value of future payments under such leases was U.S.$122 million (Ps2,396 million), of which, U.S.$74 million (Ps1,450 million) refers to payments from 1 to 3 years and U.S.$14 million (Ps276 million) refers to payments from 3 to 5 years. Beginning January 1, 2019, IFRS 16 eliminates the classifications of finance and operating leases. This elimination has no effect on the reported amounts of cash flows considering the contracts outstanding as of December 31, 2018. See note 2.20 to our 2018 audited consolidated financial statements included in the February 28 6-K. |
| (2) | Refers to the components of liability of the convertible notes described in note 16.2 and 16.4 to our 2018 audited consolidated financial statements included in the February 28 6-K. and assumes repayment at maturity and no conversion of such convertible notes. |
| (3) | The schedule of debt payments, which includes current maturities, does not consider the effect of any refinancing of debt that may occur during the following years. In the past, CEMEX has replaced its long-term obligations for others of a similar nature. |
| (4) | Estimated cash flows on floating rate denominated debt were determined using the floating interest rates in effect as of December 31, 2017 and 2018. |
| (5) | Represents estimated annual payments under these benefits for the next 10 years (see note 18 to our 2018 audited consolidated financial statements included in the February 28 6-K), including the estimate of new retirees during such future years. |
| (6) | Refers mainly to the expansion of a cement-production line in the Philippines. |
| (7) | Future payments for the purchase of raw materials are presented on the basis of contractual nominal cash flows. Future nominal payments for energy were estimated for all contractual commitments on the basis of an aggregate average expected consumption per year using the future prices of energy established in the contracts for each period. Future payments also include CEMEX’s commitments for the purchase of fuel. |
| (8) | Additionally to the contractual obligations mentioned in the table above, as of December 31, 2018 there is a contractual obligation for an amount of US$ 1,207 million regarding operating leases, for which maturities are U.S.$186 million in less than 1 year, U.S.$351 million after 1 through 3 years, U.S.$231 million after 3 through 5 years and U.S.$439 million after more than 5 years. The amounts represent nominal cash flows. CEMEX has operating leases, primarily for operating facilities, cement storage and distribution facilities and certain transportation and other equipment, under which annual rental payments are required plus the payment of certain operating expenses. Rental expense was U.S.$121 million (Ps2,507 million) in 2016, U.S.$115 million (Ps2,252 million) in 2017 and U.S.$185 million (Ps3,493 million) in 2018. Beginning January 1, 2019, IFRS 16 eliminates the classifications of finance and operating leases. This elimination has no effect on the reported amounts of cash flows considering the contracts outstanding as of December 31, 2018. |
As of December 31, 2016, 2017 and 2018, in connection with the commitments for the purchase of fuel and energy included in the table above, a description of the most significant contracts is as follows:
In connection with the beginning of full commercial operations of Ventika, S.A.P.I. de C.V. and Ventika II S.A.P.I. de C.V. wind farms (jointly “Ventikas”) located in the Mexican state of Nuevo Leon with a combined generation capacity of 252 MW, we agreed to acquire a portion of the energy generated by Ventikas for our overall electricity needs in Mexico for a period of 20 years, which began in April 2016. As of December 31, 2018, the estimated annual cost of this agreement was U.S.$24.7 million, assuming energy generation at full capacity (energy supply from wind sources is variable in nature and final amounts can be determined only based on energy ultimately received at the agreed prices per unit).
77
In September 2006, in order to take advantage of the high wind potential in the “Tehuantepec Isthmus,” we and ACCIONA formed an alliance to develop a wind farm project for the generation of 250 MW in the Mexican state of Oaxaca. We acted as promoter of the project, which was named EURUS. ACCIONA provided the required financing, constructed the facility and currently owns and operates the wind farm. The operation of the 167 wind turbines on the farm commenced on November 15, 2009. The agreements between us and ACCIONA established that our plants in Mexico will acquire a portion of the energy generated by the wind farm for a period of at least 20 years, which began in February 2010, when EURUS reached the committed limit capacity. For the years ended December 31, 2015, 2016, 2017 and 2018, EURUS supplied approximately 28.0%, 22.9%, 20.6% and 21.0%, respectively, of our overall electricity needs in Mexico during such years.
In 1999, we entered into agreements with an international partnership, which financed, built and operated TEG, an electrical energy generating plant in Mexico. In 2007, the original operator was replaced. Pursuant to the agreement, we would purchase the energy generated from TEG for a term of not less than 20 years, which started in April 2004 and that was further extended until 2027 with the change of operator. In addition, we committed to supply TEG and another third-party electrical energy generating plant adjacent to TEG all fuel necessary for their operations, a commitment that has been hedged through four 20-year agreements entered with PEMEX, which terminates in 2024. Consequently, for the last three years, CEMEX intends to purchase the required fuel in the market. For the years ended December 31, 2015, 2016, 2017 and 2018, TEG supplied approximately 69.3%, 66.3%, 68.4% and 64.9%, respectively, of our overall electricity needs during such year for our cement plants in Mexico.
In regards with the above, in March 1998 and July 1999, we signed contracts with PEMEX providing that beginning in April 2004 PEMEX’s refineries in Cadereyta and Madero City would supply us with a combined volume of approximately 1.75 million tons of pet coke per year. As per the pet coke contracts with PEMEX, 1.2 million tons of the contracted volume will be allocated to TEG and the other energy producer and the remaining volume will be allocated to our operations in Mexico. By entering into the pet coke contracts with PEMEX, we expect to have a consistent source of pet coke throughout the 20-year term.
In 2007, CEMEX Zement GmbH (“CXZ”), our subsidiary in Germany, entered into a long-term energy supply contract with Vattenfall Europe New Energy Ecopower (“VENEE”), pursuant to which VENEE committed to supply energy to our Rüdersdorf plant for a period of 15 years starting on January 1, 2008. Since 2017 the new owner of the power plant and the contract is the STEAG—Industriekraftwerk Rüdersdorf GmbH (“SIKW”). Based on the contract, each year CXZ has the option to fix in advance the volume of energy that it will acquire from SIKW, with the option to adjust the purchase amount one time on a monthly and quarterly basis. According to this agreement, CXZ has acquired 27 MW for 2018 and 28 MW for 2019 and CXZ expects to acquire between 26 and 28 MW for the following years starting in 2018 and thereafter. The estimated annual cost of this agreement is approximately U.S.$12 million assuming that CEMEX receives all its energy allocation. The contract, which establishes a price mechanism for the energy acquired, based on the price of energy future contracts quoted on the European Energy Exchange, did not require initial investments and was expected to be performed at a future date. Based on its terms, this contract qualified as a financial instrument under IFRS. However, as the contract is for CEMEX’s own use and CEMEX sells any energy surplus as soon as actual energy requirements are known, regardless of changes in prices and thereby avoiding any intention of trading in energy, such contract is not recognized at its fair value.
Off-Balance Sheet Arrangements
We do not have any off-balance sheet arrangements that are reasonably likely to have a material effect on our financial condition, operating results and liquidity or capital resources.
Quantitative and Qualitative Market Disclosure
Our Derivative Financial Instruments
For the year ended December 31, 2017, we had net gains related to the recognition of changes in fair values of derivative financial instruments of Ps161 million (U.S.$9 million). For the year ended December 31, 2018, we had a net gain related to the recognition of changes in fair values of derivative financial instruments of Ps692 million (U.S.$38 million). See note 16.4 to our 2018 audited consolidated financial statements included in the February 28 6-K.
78
In the ordinary course of business, we are exposed to credit risk, interest rate risk, foreign exchange risk, equity risk, commodities risk and liquidity risk, considering the guidelines set forth by the CEMEX, S.A.B. de C.V. board of directors, which represent our risk management framework and are supervised by several of our committees. Our management establishes specific policies that determine strategies focused on obtaining natural hedges or risk diversification to the extent possible, such as avoiding customer concentration on a determined market or aligning the currencies portfolio in which we incur our debt with those in which we generate our cash flows. As of December 31, 2017 and 2018, these strategies were sometimes complemented by the use of derivative financial instruments. See note 16.4 and 16.5 to our 2018 audited consolidated financial statements included in the February 28 6-K.
During the reported periods, in compliance with the guidelines established by our Risk Management Committee, and in line with any restrictions set forth by our debt agreements, our hedging strategy and risk management framework, we held derivative financial instruments with the objectives of: (a) hedging foreign exchange risk of our net assets in foreign subsidiaries; (b) changing the risk profile associated with changes in the interest rates of our debt agreements; (c) hedging of forecasted transactions; (d) changing the risk profile or fixing the price of fuels and electric energy; and (e) accomplishing other corporate objectives.
For the majority of the last ten years, we significantly decreased our use of derivatives instruments related to debt, both currency and interest rate derivatives, thereby reducing the risk of cash margin calls.
Since February 2017, we began a U.S.$/MXN Forward program to hedge some of our foreign exchange exposures, with a planned notional amount up to $1.25 billion. As of December 31, 2018, we have forwards in place for approximately U.S.$1,249 million. These instruments have a negative pay-out when Mexican Peso is strengthening and vice-versa. For accounting purposes under IFRS, this program has been designated as a hedge of our net investment in Mexican Pesos, pursuant to which changes in the fair market value of these instruments are recognized as part of other comprehensive income in equity.
In June 2018 we entered into U.S.$1 billion of interest rate swaps to hedge interest payments of existing bank loans referenced to U.S. floating rates. These interest rate swaps, effective in June 2019, will mature in June 2023. For accounting purposes under IFRS, these contracts have been designated as cash flow hedges, pursuant to which, changes in fair value are initially recognized as part of other comprehensive income in equity and are subsequently recycled through financial expense as interest expense on the related bank loans accrues.
We maintain forward contracts negotiated to hedge the price of certain fuels, including diesel, gas and coal, as solid fuel, in several of our operations. By means of these contracts, for our own consumption only, we fixed the price of these fuels over certain volumes representing a portion of the estimated consumption of such fuels in several of our operations. These contracts have been designated as cash flow hedges of diesel, gas or coal consumption, and as such, changes in fair value are recognized temporarily through other comprehensive income and are recycled to operating expenses as the related fuel volumes are consumed.
With respect to our existing financial derivatives, we may incur net losses and be subject to margin calls that will require cash. If we enter into new derivative financial instruments, we may incur net losses and be subject to margin calls in which the cash required to cover margin calls may be substantial and may reduce the funds available to us for our operations or other capital needs.
As with any derivative financial instrument, we assume the creditworthiness risk of the counterparty, including the risk that the counterparty may not honor its obligations to us. Before entering into any derivative financial instrument, we evaluate, by reviewing credit ratings and our business relationship according to our policies, the creditworthiness of the financial institutions and corporations that are prospective counterparties to our derivative financial instruments. We select our counterparties to the extent we believe that they have the financial capacity to meet their obligations in relation to these instruments. Under current financial conditions and volatility, we cannot assure that risk of non-compliance with the obligations agreed to with such counterparties is minimal. See note 16.4 and 16.5 to our 2018 audited consolidated financial statements included in the February 28 6-K.
79
The fair value of derivative financial instruments is based on estimated settlement costs or quoted market prices and supported by confirmations of these values received from the counterparties to these financial instruments. The notional amounts of derivative financial instrument agreements are used to measure interest to be paid or received and do not represent the amount of exposure to credit loss.
| At December 31, 2017 | At December 31, 2018 | |||||||||||||||||||
| (in millions of U.S. Dollars) |
Notional Amount |
Estimated Fair value |
Notional Amount |
Estimated Fair value |
Maturity Date | |||||||||||||||
| Net investment hedge |
1,160 | 47 | 1,249 | 2 | December 2020 | |||||||||||||||
| Foreign exchange forwards related to forecasted transactions |
381 | 3 | – | – | – | |||||||||||||||
| Equity forwards on third party shares |
168 | 7 | 111 | 2 | March 2020 | |||||||||||||||
| Interest Rate Swaps |
137 | 16 | 1,126 | (8) | September 2022/June 2023 | |||||||||||||||
| Fuel price hedging |
72 | 20 | 122 | (14) | December 2023 | |||||||||||||||
| November 2019 Mandatory Convertible Mexican Peso Notes |
— | (20) | – | (1) | November 2019 | |||||||||||||||
|
|
|
|
|
|
|
|
|
|||||||||||||
| 1,918 | 73 | 2,608 | (19) | |||||||||||||||||
|
|
|
|
|
|
|
|
|
|||||||||||||
Our Net Investment Hedge. As of December 31, 2017 and 2018, we negotiated foreign exchange forwards contracts (U.S.$/Mexican Peso) under a program for up to U.S.$1,250 million, with monthly revolving settlement dates from 1 to 24 months to hedge our exposure to currency translation effects arising from certain investments in foreign subsidiaries. The average life of these contracts is approximately one year. For accounting purposes under IFRS, we have designated this program as a hedge of CEMEX’s net investment in Mexican Pesos, pursuant to which changes in fair market value of these instruments are recognized as part of other comprehensive income in stockholders’ equity. For the years 2017 and 2018, changes in the fair value of these foreign exchange forward contracts generated gains of U.S.$6 million (Ps110 million) and losses of U.S.$59 million (Ps1,157 million), respectively. As of December 31, 2017 and 2018, the fair value of the foreign exchange forward represented an asset of U.S.$47 million (Ps923 million) and U.S.$2 million (Ps39 million), respectively. See note 16.4 to our 2018 audited consolidated financial statements included in the February 28 6-K.
Our Foreign exchange forwards related to forecasted transactions. As of December 31, 2017, we held U.S.$/Euro foreign exchange forwards contracts maturing on January 10, 2018, negotiated to maintain the Euro value of a portion of proceeds from debt issuances maintained in U.S. dollars that were used to repurchase debt denominated in euros (See note 16.1 to our 2018 audited consolidated financial statements included in the February 28 6-K). In addition, in February 2017 we settled U.S.$/Mexican Peso foreign exchange forwards contracts negotiated to hedge the U.S. dollar value of the proceeds from the expected sale of pumping assets in Mexico (See note 4.3 to our 2018 audited consolidated financial statements included in the February 28 6-K). For the years 2016, 2017 and 2018, the aggregate results of these instruments, including the effects resulting from positions entered and settled during the year, generated gains of U.S.$10 million (Ps186 million) in 2016, losses of U.S.$17 million (Ps337 million) in 2017 and losses of U.S.$1 million (Ps21 million) in 2018, recognized within “Financial income and other items, net” in the income statement. As of December 31, 2017, the fair value of the foreign exchange forward represented an asset of U.S.$3 million (Ps59 million). See note 16.4 to our 2018 audited consolidated financial statements included in the February 28 6-K.
Our Equity Forwards on Third-Party Shares. As of December 31, 2017 and 2018, in connection with the definitive sale of our GCC shares in September 2017 to two financial institutions that acquired all corporate rights and control under the aforementioned shares (see note 13.1 to our 2018 audited consolidated financial statements included in the February 28 6-K), we negotiated equity forward contracts to be settled in cash maturing in March 2019 and March 2020, respectively, over the price of 31.5 million GCC shares in 2017 and 20.9 million GCC shares in 2018. During 2018, we settled a portion of these contracts early for 10.6 million shares. During 2017 and 2018, changes in the fair value of these instruments and early settlement effects generated losses of U.S.$24 million (Ps463 million) in 2017 and gains of U.S.$25 million (Ps436 million) in 2018, recognized within “Financial income and other items, net” in the income statement. GCC is a Mexican construction company listed on the Mexican Stock Exchange. As of December 31, 2017 and 2018, the fair value of the equity forwards represented an asset of U.S.$7 million (Ps138 million) and U.S.$2 million (Ps39 million), respectively, net of cash collateral. See note 16.4 to our 2018 audited consolidated financial statements included in the February 28 6-K.
80
Our Interest Rate Swaps. As of December 31, 2018, we held interest rate swaps in the amount of U.S.$1,000 million, the fair value of which represented a liability of U.S.$19 million (Ps373 million). They were negotiated in June 2018 to fix interest payments of existing bank loans bearing floating rates. The contracts mature in June 2023. For accounting purposes under IFRS, we designated these contracts as cash flow hedges, pursuant to which changes in fair value are initially recognized as part of other comprehensive income in equity and are subsequently recycled through financial expense as interest expense on the related bank loans accrues. For the year 2018, changes in the fair value of these contracts generated losses of U.S.$19 million (Ps364 million) as reflected in the income statement.
As of December 31, 2017 and 2018, we had an interest rate swap maturing in September 2022 associated with an agreement entered into by us for the acquisition of electric energy in Mexico, the fair value of which represented assets of U.S.$16 million (Ps314 million) and U.S.$11 million (Ps216 million), respectively. Pursuant to this instrument, during the tenure of the swap and based on its notional amount, we received a fixed rate of 5.4% and pay LIBOR. Changes in the fair value of this interest rate swap generated losses of U.S.$6 million (Ps112 million) in 2016, U.S.$6 million (Ps114 million) in 2017 and U.S.$6 million (Ps114 million) in 2018, recognized in the income statement for each period. See note 16.4 to our 2018 audited consolidated financial statements included in the February 28 6-K.
Fuel price hedging. As of December 31, 2017 and 2018, we maintained forward contracts negotiated to hedge the price of certain fuels, including diesel, gas and coal in several countries for aggregate notional amounts of U.S.$72 million (Ps1,415 million) and U.S.$122 million (Ps2,398 million), respectively, with an estimated aggregate fair value representing assets of U.S.$20 million (Ps394 million) in 2017 and liabilities of U.S.$14 million (Ps275 million) in 2018. By means of these contracts, for our own consumption only, we fixed the price of these fuels over certain volumes representing a portion of the estimated consumption of such fuels in several operations. These contracts have been designated as cash flow hedges of diesel, gas or coal consumption, and as such, changes in fair value are recognized temporarily through other comprehensive income and are recycled to operating expenses as the related fuel volumes are consumed. For the years 2016, 2017 and 2018, changes in fair value of these contracts recognized in other comprehensive income represented gains of U.S.$15 million (Ps311 million), gains of U.S.$4 million (Ps76 million) and losses of U.S.$35 million (Ps697 million), respectively. See note 16.4 to our 2018 audited consolidated financial statements included in the February 28 6-K.
Our November 2019 Mandatory Convertible Mexican Peso Notes. In connection with the November 2019 Mandatory Convertible Mexican Peso Notes (see note 16.2 to our 2018 audited consolidated financial statements included in the February 28 6-K), considering that the securities are denominated in pesos and the functional currency of CEMEX, S.A.B. de C.V.’s division that issued the securities is the dollar (See note 2.4 to our 2018 audited consolidated financial statements included in the February 28 6-K), we separated the conversion option embedded in such instruments and recognized it at fair value through the income statement, which as of December 31, 2017 and 2018, resulted in a liability of U.S.$20 million (Ps393 million) and U.S.$1 million (Ps20 million), respectively. Changes in fair value generated a loss of U.S.$29 million (Ps545 million) in 2016, a gain of U.S.$19 million (Ps359 million) in 2017 and gain of U.S.$20 million (Ps391 million) in 2018.
In addition, on March 15, 2011, CEMEX, S.A.B. de C.V. entered into capped calls, considered antidilution adjustments, for over 80 million ours ADSs that matured in March 2018 in connection with the March 2018 Optional Convertible Subordinated U.S. Dollar Notes, by means of which, at maturity of the notes, we would receive in cash the excess between the market price and the strike price of approximately U.S.$8.57 per ADS, with a maximum appreciation per ADS of U.S.$5.27 . We paid aggregate premiums of U.S.$104 million. In August 2016, we amended 58.3% of the total notional amount of the capped calls to lower the exercise price in exchange for reducing the number of underlying options. As a result, we retained capped calls on over 71 million ADSs. Changes in the fair value of these instruments generated gains of U.S.$44 million (Ps818 million) in 2016 and gains of U.S.$37 (Ps725 million) in 2017 and, recognized within “Financial income and other items, net” in the income statement. During 2017, CEMEX unwound and settled all its capped calls receiving in exchange U.S.$103 million in cash. See note 16.4 to our 2018 audited consolidated financial statements included in the February 28 6-K.
81
Interest Rate Risk, Foreign Currency Risk and Equity Risk
Interest Rate Risk. The table below presents tabular information of our fixed and floating rate long-term foreign currency-denominated debt as of December 31, 2018. Average floating interest rates are calculated based on forward rates in the yield curve as of December 31, 2018. Future cash flows represent contractual principal payments. The fair value of our floating rate long-term debt is determined by discounting future cash flows using borrowing rates available to us as of December 31, 2018 and is summarized as follows:
| Expected maturity dates as of December 31, 2018 | ||||||||||||||||||||||||||||
| Long-Term Debt(1) |
2019 | 2020 | 2021 | 2022 | After 2023 | Total | Fair Value | |||||||||||||||||||||
| (In millions of U.S. Dollars, except percentages) | ||||||||||||||||||||||||||||
| Variable rate |
U.S.$ 5 | 585 | 1,200 | 1,497 | 118 | U.S.$ 3,405 | U.S.$ 3,252 | |||||||||||||||||||||
| Average interest rate |
4.51% | 3.62% | 3.68% | 3.35% | 4.15% | |||||||||||||||||||||||
| Fixed rate |
U.S.$ 2 | 1 | 1 | 38 | 5,825 | U.S.$ 5,867 | U.S.$ 5,902 | |||||||||||||||||||||
| Average interest rate |
6.58% | 5.55% | 5.58% | 5.62% | 5.60% | |||||||||||||||||||||||
| (1) | The information above includes the current maturities of the long-term debt. Total long-term debt as of December 31, 2018 does not include our other financial obligations and the Perpetual Debentures for an aggregate amount of U.S.$444 million (Ps8,729 million) issued by consolidated entities. See notes 16.2 and 20.4 to our 2018 audited consolidated financial statements included in the February 28 6-K. |
As of December 31, 2018, we were subject to the volatility of floating interest rates, which, if such rates were to increase, may adversely affect our financing cost and our net income. As of December 31, 2017, 31% of our foreign currency-denominated long-term debt bears floating rates at a weighted average interest rate of LIBOR plus 268 basis points. As of December 31, 2018, 37% of our foreign currency-denominated long-term debt bears floating rates at a weighted average interest rate of LIBOR plus 241 basis points. As of December 31, 2017 and 2018, if interest rates at that date had been 0.5% higher, with all other variables held constant, CEMEX’s net income for 2017 and 2018 would have been reduced by approximately U.S.$18 million (Ps353 million) and U.S.$19 million (Ps366 million), respectively, as a result of higher interest expense on variable-rate debt. However, this analysis does not include the interest rate swaps held by CEMEX during 2017 and 2018. See note 16.5 to our 2018 audited consolidated financial statements included in the February 28 6-K.
Foreign Currency Risk. Due to our geographic diversification, our revenues are generated in various countries and settled in different currencies. However, some of our production costs, including fuel and energy, and some of our cement prices, are periodically adjusted to take into account fluctuations in the U.S. Dollar/Mexican Peso exchange rate. For the year ended December 31, 2018, approximately 21% of our revenues, before eliminations resulting from consolidation, were generated in Mexico, 24% in the United States, 7% in the United Kingdom, 6% in France, 4% in Germany, 3% in Spain, 2% in Poland, 1% in the Czech Republic, 2% in the Rest of Europe, 3% in Colombia, 2% in Panama, 1% in Costa Rica, 2% in Caribbean TCL, 1% in the Dominican Republic, 3% in the Rest of South, Central America and the Caribbean region, 3% in Philippines, 2% in Egypt, 4% in Israel, 1% in the Rest of Asia, Middle East and Africa region and 8% from our Other operations.
Foreign exchange gains and losses occur by monetary assets or liabilities in a currency different from its functional currency, and are recorded in the consolidated income statements, except for exchange fluctuations associated with foreign currency indebtedness directly related to the acquisition of foreign entities and related parties’ long-term balances denominated in foreign currency, for which the resulting gains or losses are reported in other comprehensive income. As of December 31, 2017 and 2018, excluding from the sensitivity analysis the impact of translating the net assets of foreign operations into our reporting currency and considering a hypothetical 10% strengthening of the U.S. Dollar against the Mexican Peso, with all other variables held constant, our net income for 2017 and 2018 would have increased by approximately U.S.$119 million (Ps2,343 million) and U.S.$63 million (Ps1,240 million), respectively, as a result of higher foreign exchange losses on our dollar-denominated net monetary liabilities held in consolidated entities with other functional currencies. Conversely, a hypothetical 10% weakening of the U.S. Dollar against the Mexican Peso would have had the opposite effect.
As of December 31, 2018, 64% of our total debt plus other financial obligations was U.S. Dollar-denominated, 29% was Euro-denominated, 5% was British Pounds-denominated, 2% was Philippine Peso-denominated and immaterial amounts were denominated in other currencies, which does not include Ps8,729 million (U.S.$444 million) of Perpetual Debentures; therefore, we had a foreign currency exposure arising from the debt
82
plus other financial obligations denominated in U.S. Dollars, and the debt and other financial obligations denominated in Euros, versus the currencies in which our revenues are settled in most countries in which we operate. We cannot guarantee that we will generate sufficient revenues in U.S. Dollars and Euros from our operations to service these obligations. As of December 31, 2017 and 2018, CEMEX had not implemented any derivative financing hedging strategy to address this foreign currency risk.
Equity Risk. As described above, we have entered into equity forward contracts on GCC shares. Under these equity forward contracts, there is a direct relationship in the change in the fair value of the derivative with the change in price of the underlying share. Upon liquidation, the equity forward contracts provide for cash settlement and the effects are recognized in the income statements as part of “Financial income and other items, net” in our 2018 audited consolidated financial statements included in the February 28 6-K.
As of December 31, 2018, the potential change in the fair value of CEMEX’s forward contracts in GCC shares that would result from a hypothetical, instantaneous decrease of 10% in the market price of GCC shares in dollars, with all other variables held constant, CEMEX’s net income for 2017 and 2018 would have been reduced by U.S.$14 million (Ps283 million) and U.S.$11 million (Ps210 million), as a result of additional negative changes in fair value associated with these forward contracts. A 10% hypothetical increase in the price of GCC shares in 2017 would have generated approximately the opposite effect, respectively.
In addition, even though the changes in fair value of our embedded conversion option in the November 2019 Mandatory Convertible Mexican Peso Notes that are denominated in a currency other than the functional issuer’s currency affect the income statement, they do not imply any risk or variability in cash flows, considering that through their exercise, we will settle a fixed amount of debt with a fixed amount of shares. As of December 31, 2017 and 2018, the potential change in the fair value of the embedded conversion options in the November 2019 Mandatory Convertible Mexican Peso Notes that would result from a hypothetical, instantaneous increase of 10% in the market price of our CPOs, with all other variables held constant, would have decreased our net income by U.S.$9 million (Ps180 million) in 2017 and decreased by U.S.$1 million (Ps16 million) in 2018 as a result of additional negative changes in fair value associated with this option. A 10% hypothetical decrease in our CPO price would generate approximately the opposite effect.
Liquidity Risk. We are exposed to risks from changes in foreign currency exchange rates, prices and currency controls, interest rates, inflation, governmental spending, social instability and other political, economic and/or social developments in the countries in which we operate, any one of which may materially affect our results and reduce cash from operations.
As of December 31, 2018, current liabilities, which included Ps13,622 million of current maturities of debt and other financial obligations, exceeded current assets by Ps22,891 million. For the year ended December 31, 2018, we generated net cash flows provided by operating activities from continuing operations of Ps26,545 million, after payments of interest and income taxes. Our management believes that we will generate sufficient cash flows from operations. In addition, as of December 31, 2018, we have committed available lines of credit under the 2017 Credit Agreement, which include the revolving credit facility and an undrawn tranche for a combined amount of Ps16,211 million (U.S.$825 million). This, in addition to our proven capacity to continually refinance and replace our short-term obligations, will enable us to meet any liquidity risk in the short term. See notes 16.1 and 23.5 to our 2018 audited consolidated financial statements included in the February 28 6-K.
As of December 31, 2017 and 2018, the potential requirement for additional margin calls under our different commitments is not significant.
Investments, Acquisitions and Divestitures
The transactions described below represent our principal investments, acquisitions and divestitures completed during 2016, 2017 and 2018.
83
Investments and Acquisitions
In August 2018, our subsidiary in the United Kingdom acquired the shares of the ready-mix producer Procon for an amount in Pounds Sterling equivalent to U.S.$22 million, considering the Pound Sterling to Dollar exchange rate as of August 31, 2018. As of December 31, 2018, based on the preliminary valuation of the fair values of the assets acquired and liabilities assumed, the net assets of Procon amount to U.S.$10 million (Ps196 million) and goodwill was determined in the amount of U.S.$12 million (Ps244 million).
On January 24, 2017, Sierra, which is a wholly-owned CEMEX España subsidiary, announced that, having received a foreign investment license from the Trinidad and Tobago Ministry of Finance, all terms and conditions had been complied with or waived and the Offer to all shareholders that took place on December 5, 2016, had accordingly been declared unconditional. In addition, such Offer closed in Jamaica on February 7, 2017. Sierra acquired all TCL shares deposited pursuant to the Offer up to the maximum number of the offered shares. TCL shares deposited in response to the Offer together with Sierra’s existing shareholding in TCL represented 69.83% of the outstanding TCL shares. The total consideration paid by Sierra for the TCL shares was U.S.$86 million. After conclusion of the Offer, CEMEX consolidates TCL and its subsidiaries, including CCCL, for financial reporting purposes beginning February 1, 2017.
Divestitures
On September 27, 2018, a subsidiary of CEMEX, S.A.B. de C.V. concluded the sale of our Brazilian Operations through the sale to Votorantim Cimentos N/NE S.A. of all shares of our Brazilian subsidiary Cimento Vencemos Do Amazonas Ltda, consisting of a fluvial cement distribution terminal located in Manaus, Amazonas province, as well as the related operating license. See note 4.2 to our 2018 audited consolidated financial statements included in the February 28 6-K.
During 2016, 2017 and 2018, we made divestitures of U.S.$1,045 million, U.S.$1,514 million and U.S.$84 million, respectively (which included fixed assets of U.S.$121 million, U.S.$93 million and U.S.$69 million, respectively).
On May 26, 2016, we closed the sale of our operations in Bangladesh and Thailand to SIAM Cement for U.S.$70 million. The proceeds from this transaction were used mainly for debt reduction and for general corporate purposes.
On July 18, 2016, CHP closed its initial public offering of 45% of its common shares in the Philippines, and 100% of CHP’s common shares started trading on the Philippine Stock Exchange under the ticker “CHP.” As of December 31, 2017, CASE, an indirect subsidiary of CEMEX España, directly owned 55% of CHP’s outstanding common shares. The net proceeds to CHP from its initial public offering were U.S.$507 million after deducting estimated underwriting discounts and commissions, and other estimated offering expenses payable by CHP. CHP used the net proceeds from the initial public offering to repay existing indebtedness owed to BDO Unibank and to an indirect subsidiary of CEMEX, S.A.B. de C.V. CHP’s assets consist primarily of CEMEX’s cement manufacturing assets in the Philippines.
On August 29, 2016, we announced that we would be participating in the corporate restructuring of GCC, which resulted in CEMEX owning 23% of the outstanding share capital of GCC and, additionally, a minority interest in CAMCEM, an entity which in turn owns a majority interest in GCC. On the same day, we also announced that we reached an agreement with GCC on the terms and conditions regarding the sale to GCC of certain assets in the U.S. On November 18, 2016, after all conditions precedent were satisfied, CEMEX announced that it had closed the sale of certain assets in the U.S. to GCC for U.S.$306 million. The assets were sold by an affiliate of CEMEX to an affiliate of GCC in the U.S., and mainly consisted of CEMEX’s cement plant in Odessa, Texas, two cement terminals and the building materials business in El Paso, Texas and Las Cruces, New Mexico. On February 15, 2017, we sold 45,000,000 shares of common stock of GCC, representing 13.53% of the equity capital of GCC, at a price of Ps95 per share in a public offering to investors in Mexico authorized by the CNBV and in a concurrent private placement to eligible investors outside of Mexico. After the offerings, CEMEX, S.A.B. de C.V. owned a 9.47% direct interest in GCC and the minority interest in CAMCEM. Proceeds from the sale were Ps4,094 million (U.S.$210 million). On September 28, 2017, CEMEX, S.A.B. de C.V. announced the final sale of the remaining
84
9.47% direct interest in GCC previously held by CEMEX, S.A.B. de C.V. for U.S.$168 million (Ps3,012 million). Following this sale of shares, we no longer held a direct interest but continued to hold an indirect share of 20% in GCC through our minority interest in CAMCEM. The proceeds of this transaction were mainly used for debt reduction and for general corporate purposes.
On December 2, 2016, we agreed to the sale of our assets and operations related to our ready-mix concrete pumping business in Mexico to Pumping Team, a specialist in the supply of ready-mix concrete pumping services based in Spain, for Ps1,649 million. This agreement included the sale of fixed assets upon closing of the transaction for Ps309 million plus administrative and client and market development services. Under this agreement, we will also lease facilities in Mexico to Pumping Team over a period of ten years with the possibility to extend for three additional years, for an aggregate initial amount of Ps1,340 million, plus a contingent revenue subject to results for up to Ps557 million linked to annual metrics beginning in the first year and up to the fifth year of the agreement. On April 28, 2017, after receiving the approval by the Mexican authorities, we concluded the sale.
On January 31, 2017, one of our subsidiaries in the U.S. closed the sale of our Concrete Pipe Business to Quikrete for U.S.$500 million plus an additional U.S.$40 million contingent consideration based on future performance.
On February 10, 2017, one of our subsidiaries in the United States sold its Fairborn, Ohio cement plant and cement terminal in Columbus, Ohio to Eagle Materials for U.S.$400 million. The proceeds obtained from this transaction were used mainly for debt reduction and for general corporate purposes.
On June 30, 2017, one of our subsidiaries in the U.S. closed the divestment of the Pacific Northwest Materials Business, consisting of aggregates, asphalt and ready-mix concrete operations in Oregon and Washington to Cadman Materials for U.S.$150 million. The proceeds obtained from this sale were used mainly for debt reduction and general corporate purposes.
On September 29, 2017, one of our subsidiaries in the U.S. closed the divestment of the Block USA Materials Business, consisting of concrete block, architectural block, concrete pavers, retaining walls and building material operations in Alabama, Georgia, Mississippi and Florida, to Oldcastle for approximately U.S.$38 million. The proceeds obtained from this sale were used mainly for debt reduction and general corporate purposes.
BUSINESS
CEMEX, S.A.B. de C.V. is a publicly traded variable stock corporation (sociedad anónima bursátil de capital variable) organized under the laws of Mexico, with its principal executive offices located at Avenida Ricardo Margáin Zozaya #325, Colonia Valle del Campestre, San Pedro Garza García, Nuevo León, 66265, Mexico. Our main phone number is +52 81 8888-8888. Our website is www.cemex.com. The information on our website is not incorporated by reference in this report and you should not consider it a part of this report.
CEMEX, S.A.B. de C.V. started doing business in 1906 and was registered with the Mercantile Section of the Public Registry of Property and Commerce in Monterrey, Nuevo León, Mexico, on June 11, 1920 for a period of 99 years. At CEMEX, S.A.B. de C.V.’s 2002 ordinary general shareholders’ meeting, this period was extended to the year 2100 and in 2015 this period changed to be indefinite. Beginning April 2006, CEMEX’s full legal and commercial name is CEMEX, Sociedad Anónima Bursátil de Capital Variable.
CEMEX is one of the largest cement companies in the world, based on annual installed cement production capacity as of December 31, 2018, of approximately 92.6 million tons and 2018 cement sales volumes of 69.4 million tons. After the merger of Holcim with Lafarge during 2015, which resulted in the company LafargeHolcim, we estimate we are the next largest ready-mix concrete company in the world with annual sales volumes of approximately 53.3 million cubic meters and one of the largest aggregates companies in the world with annual sales volumes of approximately 149.8 million tons, in each case, based on our annual sales volumes in 2018. We are also one of the world’s largest traders of cement and clinker, having traded approximately 10 million tons of cement and clinker in 2018. This information does not include discontinued operations. See note 4.2 to our 2018 audited consolidated financial statements included in the February 28 6-K. CEMEX, S.A.B. de C.V. is an operating and
85
holding company engaged, directly or indirectly, through its operating subsidiaries, primarily in the production, distribution, marketing and sale of cement, ready-mix concrete, aggregates, clinker and other construction materials throughout the world. We provide reliable construction-related services to customers and communities and maintains business relationships in more than 50 countries throughout the world.
We operate globally, with operations in Mexico, the United States, Europe, South America, Central America, the Caribbean, Asia, the Middle East and Africa. We had total assets of Ps552,628 million (U.S.$28,124 million) as of December 31, 2018, and an equity market capitalization of approximately Ps135,298 million (U.S.$6,942 million) as of March 8, 2019.
As of December 31, 2018, our cement production facilities were located in Mexico, the United States, the United Kingdom, Germany, Spain, Poland, Latvia, the Czech Republic, Croatia, Colombia, Panama, Costa Rica, the Dominican Republic, Puerto Rico, Nicaragua, Trinidad and Tobago, Jamaica, Barbados, Egypt, and the Philippines.
During the majority of the last 28 years, we embarked on a major geographic expansion program to diversify our cash flows and enter markets whose economic cycles within the cement industry largely operate independently from those of Mexico and which offer long-term growth potential. We have built an extensive network of marine and land-based distribution centers and terminals that gives us marketing access around the world. As part of our strategy, we also periodically review and reconfigure our operations in implementing our post-merger integration process, and we also divest assets that we believe are less important to our strategic objectives. The following are our significant acquisitions and our most significant divestitures and reconfigurations that we have announced or closed since 2015:
| ● | On October 31, 2015, after all conditions precedent were satisfied, we completed the sale of our operations in Austria and Hungary to the Rohrdorfer Group for €165 million (U.S.$179 million or Ps3,090 million) after final adjustments for changes in cash and working capital balances as of the transfer date. Our combined operations in Austria and Hungary consisted of 29 aggregates quarries and 68 ready-mix plants. The operations in Austria and Hungary for the ten-month period ended October 31, 2015, included in our consolidated income statements, were reclassified to the single line item “Discontinued operations,” which includes, in 2015, a gain on sale of U.S.$45 million (Ps741 million). Such gain on sale includes the reclassification to the income statement of foreign currency translation effects accrued in equity until October 31, 2015 for an amount of U.S.$10 million (Ps215 million). See note 4.2 to our 2018 audited consolidated financial statements included in the February 28 6-K. |
| ● | On May 26, 2016, we closed the sale of our operations in Bangladesh and Thailand to SIAM Cement for U.S.$70 million (Ps1,450 million). Our operations in Bangladesh and Thailand for the period from January 1, 2016 to May 26, 2016 and the year ended December 31, 2015 included in our consolidated income statements were reclassified to the single line item “Discontinued operations,” which includes, in 2016, a gain on sale of U.S.$24 million (Ps424 million). See note 4.2 to our 2018 audited consolidated financial statements included in the February 28 6-K. |
| ● | On July 18, 2016, CHP closed its initial public offering of 45% of its common shares in the Philippines, and 100% of CHP’s common shares started trading on the Philippine Stock Exchange under the ticker “CHP.” As of December 31, 2017, CASE, an indirect subsidiary of CEMEX, S.A.B. de C.V., directly owned 55% of CHP’s outstanding common shares. The net proceeds to CHP from its initial public offering were U.S.$507 million after deducting estimated underwriting discounts and commissions, and other estimated offering expenses payable by CHP. CHP used the net proceeds from the initial public offering to repay existing indebtedness owed to BDO Unibank and to an indirect subsidiary of CEMEX, S.A.B. de C.V. |
| ● | On November 18, 2016, after all conditions precedent were satisfied, we announced that we had closed the sale of certain assets in the U.S. to GCC for U.S.$306 million (Ps6,340 million). The assets were sold by an affiliate of ours to an affiliate of GCC in the U.S., and mainly consisted of our cement plant in Odessa, Texas, two cement terminals and the building materials business in El Paso, Texas and Las Cruces, New Mexico. |
86
| ● | On December 2, 2016, we agreed to the sale of our assets and operations related to our ready-mix concrete pumping business in Mexico to Cementos Españoles de Bombeo, S. de R.L., subsidiary in Pumping Team, a specialist in the supply of ready-mix concrete pumping services based in Spain, for Ps1,649 million. This agreement included the sale of fixed assets upon closing of the transaction for Ps309 million plus administrative, client and market development services. Under this agreement, we will also lease facilities in Mexico to Pumping Team over a period of ten years with the possibility to extend such term for three additional years, for an aggregate initial amount of Ps1,340 million, plus a contingent revenue subject to results for up to Ps557 million linked to annual metrics beginning in the first year and up to the fifth year of the agreement. On April 28, 2017, after receiving the approval by the Mexican authorities, we concluded the sale. |
| ● | On December 5, 2016, Sierra, one of CEMEX, S.A.B. de C.V.’s indirect subsidiaries, presented an offer to all shareholders of TCL (as amended, the “Offer”), a company then publicly listed in Trinidad and Tobago, Jamaica and Barbados, to acquire up to 132,616,942 ordinary shares in TCL, pursuant to which Sierra offered a certain offer price payable (the “Offer Price”), at the option of shareholders of TCL, except for shareholders of TCL in Barbados, in either TT$ or U.S.$ in Trinidad, and Jamaican Dollars or U.S.$ in Jamaica TCL. The Offer Price represented a premium of 50% over the December 1, 2016 closing price of TCL’s shares on the Trinidad and Tobago Stock Exchange. The total number of TCL shares tendered and accepted in response to the Offer was 113,629,723 which, together with Sierra’s pre-existing shareholding in TCL (147,994,188 shares), represent 69.83% of the outstanding TCL shares. The total cash payment by Sierra for the tendered shares was U.S.$86 million. CEMEX started consolidating TCL for financial reporting purposes on February 1, 2017. In March 2017, TCL de-listed from the Jamaica and Barbados stock exchanges. TCL’s subsidiaries include, but are not limited to CCCL, a publicly listed company in Jamaica, and Arawak, which, as of December 31, 2018, owned cement plants in Jamaica and Barbados, respectively. |
| ● | On January 31, 2017, one of our subsidiaries in the U.S. closed the sale of our Concrete Pipe Business to Quikrete for U.S.$500 million plus an additional U.S.$40 million contingent consideration based on future performance. |
| ● | On February 10, 2017, one of our subsidiaries in the United States sold its Fairborn, Ohio cement plant and cement terminal in Columbus, Ohio to Eagle Materials Inc. (“Eagle Materials”) for U.S.$400 million (Ps8,288 million). The proceeds obtained from this transaction were used mainly for debt reduction and for general corporate purposes. |
| ● | On February 15, 2017, CEMEX, S.A.B. de C.V. sold 45,000,000 shares of common stock of GCC, representing 13.53% of the equity capital of GCC, at a price of Ps95 per share in a public offering to investors in Mexico and in a concurrent private placement to eligible investors outside of Mexico. Prior to the GCC shares offerings, CEMEX, S.A.B. de C.V. owned a 23% direct interest in GCC and a minority interest in CAMCEM, an entity which owns a majority interest in GCC. After the GCC offerings, CEMEX, S.A.B. de C.V. owned a 9.47% direct interest in GCC and a minority interest in CAMCEM. Proceeds from the sale were U.S. $210 million (Ps4,094 million). We used the proceeds of the GCC shares offerings for general corporate purposes; |
| ● | On June 30, 2017, one of our subsidiaries in the U.S. closed the divestment of the Pacific Northwest Materials Business, consisting of aggregate, asphalt and ready mix concrete operations in Oregon and Washington to Cadman Materials for U.S.$150 million. The proceeds obtained from this sale were used mainly for debt reduction and general corporate purposes. |
| ● | On September 28, 2017, CEMEX, S.A.B de C.V. sold its then remaining direct interest in GCC, consisting of 31,483,332 shares of common stock of GCC, representing 9.47% of the equity capital of GCC for U.S.$168 million (Ps3,012 million), which was used for debt reduction and for general corporate purposes. Following this sale of shares, CEMEX, S.A.B de C.V. no longer held a direct interest in GCC but continued to hold an indirect interest of 20% in GCC through its minority interest in CAMCEM. |
87
| ● | On September 29, 2017, one of our subsidiaries in the U.S. closed the divestment of the Block USA Materials Business (the “Block USA Materials Business”), consisting of concrete block, architectural block, concrete pavers, retaining walls and building material operations in Alabama, Georgia, Mississippi and Florida, to Oldcastle for U.S.$38 million. The proceeds obtained from this sale were used mainly for debt reduction and general corporate purposes. |
| ● | In August 2018, our subsidiary in the United Kingdom acquired the shares of the ready-mix producer Procon for an amount in Pounds Sterling equivalent to U.S.$22 million, considering the Pound Sterling to Dollar exchange rate as of August 31, 2018. As of December 31, 2018, based on the preliminary valuation of the fair values of the assets acquired and liabilities assumed, the net assets of Procon amount to U.S.$10 million (Ps196 million) and goodwill was determined in the amount of U.S.$12 million (Ps244 million). |
| ● | On September 27, 2018, a subsidiary of CEMEX, S.A.B. de C.V. concluded the sale of our Brazilian Operations through the sale to Votorantim Cimentos N/NE S.A. of all shares of our Brazilian subsidiary Cimento Vencemos Do Amazonas Ltda, consisting of a fluvial cement distribution terminal located in Manaus, Amazonas province, as well as the related operating license. See note 4.2 to our 2018 audited consolidated financial statements included in the February 28 6-K. |
In addition, during 2018, we also increased our interest in Lehigh White Cement Company, a company that manufactures white cement in the U.S., from 24.5% to 36.75%, by paying a total consideration of approximately U.S.$36 million.
See “Recent Developments—Recent Developments Relating to Our Assets Divestiture Plans” on information on recent plans for divestitures.
Our Products
We always strive to provide superior building solutions in the markets we serve. To this end, we tailor our products and services to suit customers’ specific needs, from home construction, improvement and renovation to agricultural, industrial and marine/hydraulic applications.
Cement
Cement is a binding agent, which, when mixed with sand, stone or other aggregates and water, produces either ready-mix concrete or mortar. Whether in bags or in bulk, we provide our customers with high-quality branded cement products and services. We tap our professional knowledge and experience to develop customized products that fulfill our clients’ specific requirements and foster sustainable construction. In many of the countries where we have cement operations, a large proportion of cement sold is a bagged, branded product. We often deliver the product to a large number of distribution outlets such that our bagged, branded cement is available to the end users in a point of sale in close proximity to where the product will be used. We strive to develop brand identity and recognition in our bagged product.
We manufacture cement through a closely controlled chemical process, which begins with the mining and crushing of limestone and clay, and, in some instances, other raw materials. The clay and limestone are then pre-homogenized, a process which consists of combining different types of clay and limestone. The mix is typically dried, then fed into a grinder which grinds the various materials in preparation for the kiln. The raw materials are calcined, or processed, at a very high temperature in a kiln, to produce clinker. Clinker is the intermediate product used in the manufacture of cement. For limestone, clay and gypsum, requirements are based on chemical composition that, depending on the other materials available, matches with the quality demanded by the production process. For cement limestone, clay and gypsum, we run chemical tests to prepare the mining plan of the quarry, to confirm material quality and reduce variations in the mineral content. We consider that limestone and clay quality of our cement raw material quarries are adequate for the cement production process.
88
There are two primary processes used to manufacture cement: the dry process and the wet process. The dry process is more fuel efficient. As of December 31, 2018, 53 of our 56 operative production plants used the dry process and three used the wet process. Our operative production plants that use the wet process are in the United Kingdom, Nicaragua and Trinidad and Tobago. In the wet process, the raw materials are mixed with water to form slurry, which is fed into a kiln. Fuel costs are greater in the wet process than in the dry process because the water that is added to the raw materials to form slurry must be evaporated during the clinker manufacturing process. In the dry process, the addition of water and the formation of slurry are eliminated, and clinker is formed by calcining the dry raw materials. In the most modern application of this dry process technology, the raw materials are first blended in a homogenizing silo and processed through a pre-heater tower that utilizes exhaust heat generated by the kiln to pre-calcine the raw materials before they are calcined to produce clinker.
Clinker and gypsum are fed in pre-established proportions into a cement grinding mill where they are ground into an extremely fine powder to produce finished cement. We primarily cover our gypsum needs from third parties; however, we also operate gypsum quarries in the United States, Spain, the Dominican Republic and Egypt. Our main types of cement include the following:
Gray Ordinary Portland Cement: Our gray ordinary portland cement is a high-quality, cost-effective building material, mainly composed of clinker, that meets applicable chemical and physical requirements and is widely used in all construction segments: residential, commercial, industrial, and public infrastructure.
White Portland Cement: CEMEX is one of the world’s largest producers of white portland cement. We manufacture this type of cement with limestone, low iron content kaolin clay, and gypsum. Customers use our white portland cement in architectural works requiring great brightness and artistic finishes, to create mosaics and artificial granite, and for sculptural casts and other applications where white prevails.
Masonry or Mortar: Masonry or mortar is a portland cement that we mix with finely ground inert matter (limestone). Our customers use this type of cement for multiple purposes, including concrete blocks, templates, road surfaces, finishes, and brick work.
Oil-well Cement: Our oil-well cement is a specially designed variety of hydraulic cement produced with gray portland clinker. It usually forges slowly and is manageable at high temperatures and pressures. Produced in classes from A to H and J, our oil-well cement is applicable for different depth, chemical aggression, or pressure levels.
Blended Cement: Blended hydraulic cements are produced by inter-grinding or blending portland cement and supplementary cementitious materials such as ground granulated blast furnace slag, fly ash, silica fume, calcined clay, hydrated lime, and other pozzolans. The use of blended cements in ready-mix concrete reduces mixing water and bleeding, improves workability and finishing, inhibits sulfate attack and the alkali-aggregate reaction, and reduces the heat of hydration. CEMEX offers an array of blended cements which have a lower CO2 footprint resulting from their lower clinker content due to the addition of supplementary cementitious materials. The use of blended cements reinforces our strong dedication to sustainable practices and furthers our objective of offering an increasing range of more sustainable products.
Ready-Mix Concrete: Ready-mix concrete is a combination of cement, fine and coarse aggregates, admixtures (which control properties of the concrete including plasticity, pumpability, freeze-thaw resistance, strength and setting time), and water. We tailor our ready-mix concrete to fit our clients’ specific needs. By changing the proportion of water, aggregates, and cement in the mix, we modify our concrete’s resistance, manageability, and finish. We also use additives to customize our concrete consistent with the transportation time from our plant to the project, weather conditions at the construction site, and the project’s specifications. From our water-resistant to our self-compacting concrete, we produce a great variety of specially designed concrete to meet the many challenges of modern construction.
We develop solutions based on the thorough knowledge and application of ready-mix concrete technology. Leveraging years of experience, a global pool of knowledge, and state-of-the-art expertise about the different ready-mix concrete constituents and their interaction, we offer our customers tailor-designed concrete. CEMEX ready-mix concrete technologists are able to modify the properties of concrete through the use of innovative chemical
89
admixtures, combined with the proper proportions of the various concrete constituents. For example, depending on the type of application and jobsite requirements, we can design ready-mix concrete that is more fluid, stronger, develops strength faster, and also retains workability longer. Through the development of chemical admixtures solutions, our researchers design special concretes that fulfill the construction industry’s increasingly demanding performance requirements. CEMEX offers a special ready-mix concrete portfolio, comprised of such products as ultra-rapid hardening concrete, crack-resistant/low shrinkage concrete, self-consolidating concrete, architectural concrete, pervious concrete, and a number of others.
We continuously work to improve the properties of ready-mix concrete that make it a key component of sustainable construction: durability, resistance to aggressive environments, light reflection, and capacity to store energy, among others. We also constantly work to develop innovative solutions that advance the sustainability of structures made with ready-mix concrete. This way, our customers can design sustainable buildings that can take advantage of the benefits of concrete in a wide range of applications. We offer engineered concrete for harbors and bridges with a special design of high performance concrete that combines durability and low maintenance with resistance to aggressive environments, and for industrial applications which consists of concrete with high acid resistance which is robust and durable for such uses as cooling towers; we also offer concrete for building and housing used for structures such as self-compacting concrete that improves the strength and durability of building structures, while reducing energy use and noise due to concrete vibration, and envelope concrete such as structural lightweight concrete or insulating concrete forms which offer insulation solutions to improve energy efficiency in buildings, and concrete for building design that takes advantage of concrete’s capacity to store energy—its thermal mass—minimizing temperature fluctuations in a building over the course of the day, reducing the need for additional heating and cooling; we also offer ready-mix concrete for water and wastewater management and for roads and pavements.
The types of ready-mix concrete we offer our clients include, but are not limited to:
Standard Ready-Mix Concrete: Standard ready-mix concrete is the most common form of concrete. It is prepared for delivery at a concrete plant instead of mixed on the construction site.
Architectural and Decorative Concrete: This type of ready-mix concrete can provide a structural function, as well as an aesthetic or decorative finish. It can offer smooth or rough surfaces or textures, as well as a variety or range of colors.
Rapid-Setting Concrete: Designed to enhance early strength development, this type of ready-mix concrete allows fast formwork removal, accelerated construction sequencing, and rapid repair for such jobs as roads and airport runways. Typically used in low temperature (5-10°C) concreting during winter, this type of ready-mix concrete can also be used in buildings, railways, and precast applications. In addition to saving time, this type of ready-mix concrete technology offers improved durability and acid resistance.
Fiber-Reinforced Concrete: Ready-mix concrete designed with micro or macro fibers that can be used either for structural applications, where the fibers can potentially substitute for steel rebar reinforcement, or for reducing shrinkage, primarily early age shrinkage. Macro fibers can significantly increase the ductility of concrete, making it highly resistant to crack formation and propagation.
Fluid-Fill Concrete: Fluid mortar or ready-mix concrete simplifies the process of laying pipe and cable by surrounding the pipe or cable with a tightly packed shell that provides protection from the elements, prevents settling, and enables crews to work quickly.
Roller-Compacted Concrete: Compacted in place and cured, roller-compacted concrete is a zero slump ready-mix concrete with the abrasion resistance to withstand high velocity water, making it the material of choice for spillways and other infrastructure subject to high flow conditions. It represents a competitive solution in terms of cost and durability when compared to asphalt.
Self-Consolidating Concrete: Self consolidating concrete has very high flow; therefore, it is self-leveling, eliminating the need for vibration. Due to the superplasticizers used, chemical admixtures that impart very high flow, self-consolidating concrete exhibits very high compaction as a result of its low air content. Consequently, self-consolidating concrete can have very high strengths, exceeding 50 MPa.
90
Pervious Concrete: Because of its unique design mix, pervious concrete is a highly porous material that allows water, particularly rainwater, to filter through, reduces flooding and heat concentration by up to 4°C, and helps to prevent skidding on wet roads. This ready-mix concrete is ideally used in parking lots, footpaths, and swimming pool border applications.
Antibacterial Concrete: This type of ready-mix concrete helps control bacteria growth and is used to help maintain clean environments in structures such as hospitals, laboratories, and farms.
Aggregates: We are one of the world’s largest suppliers of aggregates: primarily the crushed stone, sand and gravel, used in virtually all forms of construction. Our customers use our aggregates for a wide array of applications: as a key component in the construction and maintenance of highways, walkways, parking lots, airport runways, and railways; for drainage, water filtration, purification, and erosion control; as fill material; for sand traps on golf courses, beaches, playing field surfaces, horse racing tracks, and related applications; and to build bridges, homes, and schools.
Aggregates are obtained from land-based sources such as sand and gravel pits and rock quarries or by dredging marine deposits.
Hard Rock Production. Rock quarries usually operate for at least 30 years and are developed in distinct benches or steps. A controlled explosion is normally used to release the rock from the working face. It is then transported by truck or conveyor to a crusher to go through a series of crushing and screening stages to produce a range of final sizes to suit customers’ needs. Dry stone is delivered by road, rail or water from the quarry.
Sand and Gravel Production. Sand and gravel quarries are much shallower than rock quarries and are usually worked and restored in progressive phases. Water can either be pumped out of the quarries allowing them to be worked dry or they can be operated as lakes with extraction below water. A conveyor draws the raw material into the processing plant where it is washed to remove unwanted clay and to separate sand. Sand separated during processing is dewatered and stockpiled. Gravel then passes over a series of screens that sieve the material into different sizes. Processing separates the gravel into stockpiles in a range of sizes for delivery.
Marine Aggregate Production. A significant proportion of the demand for aggregates is satisfied from rivers, lakes, and seabeds. Marine resources are increasingly important to the sustainable growth of the building materials industry. Marine aggregates also play an important role in replenishing beaches and protecting coastlines from erosion. At sea, satellite navigation is used to position a vessel precisely within its licensed dredging area. Vessels trail a pipe along the seabed and use powerful suction pumps to draw sand and gravel into the cargo hold. Dredged material is discharged at wharves, where it is processed, screened and washed for delivery.
Aggregates are an indispensable ingredient in ready-mix concrete, asphalt, and mortar. Accounting for approximately 60% to 75% of ready-mix concrete’s volume, aggregates strongly influence concrete’s freshly mixed and hardened properties. Aggregates not only increase concrete’s strength, but also can make the mix more compact, enabling applications such as weatherproofing and heat retention. They can further contribute to concrete’s aesthetic qualities. For example, sand gives surface treatments their brightness.
The types of aggregates we offer our clients include, but are not limited to:
Crushed Stone and Manufactured Sand: These products are obtained by mining rock and breaking it down to a preferred size. In the case of manufactured sand, the product is obtained by crushing rock to the selected shape or texture, ensuring product and project specifications are met. Sources of crushed stone can be igneous, sedimentary, or metamorphic.
Gravel: Gravel deposits are produced through a natural process of weathering and erosion. It can be used for roads, for concrete manufacturing, or for decorative purposes.
91
Sand: Sand occurs naturally and is composed of fine rock material and mineral particles. Its composition is variable depending on the source. It can be used for roads, for concrete manufacturing, or sanitation.
Recycled Concrete: Recycled concrete is created by breaking, removing, and crushing existing concrete to a preferred size. It is commonly used as a base layer for other construction materials because it compacts to form a firm surface.
Related Products
We rely on our close relationship with our customers to offer them complementary products for their construction needs, which mainly include the following:
Asphalt: We offer a wide range of cost effective, high performance asphalt products, from our standard hot mix asphalt, which is made by combining crushed stone with liquid asphalt cement, to highly technical products that can be used on major highway systems, driveways, commercial parking lots, or rural country roads. Designed for consistency and reliability, our asphalt products are designed to withstand different weight loads, traffic volumes, and weather conditions.
Concrete Block: Standard concrete block, sometimes referred to as gray block, concrete masonry unit, or cinder block, is one of the most practical and long-lasting materials used in building. Its strength, durability, and versatility, including its energy efficiency, excellent fire and high wind resistance, and noise insulation, make concrete block a compelling alternative to many other building materials.
Roof Tiles: We offer a comprehensive range of concrete roof tiles and fittings, designed to meet the requirements of most roofing applications. Available in a wide selection of sizes, shapes, and colors, our roof tiles serve residential and commercial needs.
Architectural Products: Our high-end architectural concrete products offer a range of styles for different building or landscaping projects. Specialty rock products, as well as architectural block, in an array of colors, sizes, and textures, take our customers’ design to a new level. Block paving solutions and decorative paving provide an ideal range of applications for any hard landscaping project.
Pipe: We design and manufacture standard and special concrete pipe for various applications such as storm and sanitary sewers. Offered in diverse types, sizes, and lengths, our pipe products meet or exceed applicable standards and customer requirements throughout our different operations.
Other Precast Products: Among our other precast products, we offer rail products, concrete floors, box culverts, bridges, drainage basins, barriers, and parking curbs. In selected markets, we further complement our commercial offer with admixtures, gypsum, and cementitious materials such as fly ash and blast furnace slag.
Building Solutions
We help build the homes people live in, the roads that connect them, and the infrastructure that makes their cities vibrant. With over a century of experience delivering tailor-made building solutions, we work with our customers around the world to build sustainable structures that will thrive today and well into the future.
Housing: We integrate our cutting-edge design, building materials, and construction systems into flexible and replicable housing solutions for our clients and communities across the globe.
Paving: As the world’s leader in concrete-based pavement solutions, we help connect cities and their surrounding communities through safer, more durable, and energy-efficient highways, mass transit systems, airport runways, rural roadways, and city streets.
Green Building Consultancy: We are focused on delivering sustainable building solutions to the increasingly complex needs of a society with limited natural resources.
92
Services
We continuously communicate and interact with our customers to identify and implement effective ways to meet their toughest challenges. We recognize that customer loyalty happens by design, not by chance. To better serve our customers, we not only need to have a clear understanding of what they need, but also the means and passion to fulfill those needs. The following are examples of the different services offered to our customers throughout our operations, all of which services are provided in substantially all our operations and may vary from location to location:
24/7 LOAD®: Our delivery service offers customers the ease of receiving products mostly whenever they need them, allowing our customers to optimize their project schedules according to their specific needs.
ATM-like Bulk Cement Dispatch System: This service offers our customers greater flexibility and efficiency. It enables them to get cement at their convenience, shortening their logistics schedules by minimizing loading and unloading times and also cutting back on more traditional transactional practices.
Construrama®: We partner with our cement distribution network to offer customers an extensive range of brand-name products at competitive prices. Our retailers also receive integral training to better manage all aspects of their business, including inventory management, product promotion, salesforce programs, product-delivery and sourcing logistics.
Customer-oriented Educational and Training Services: In several of the countries where we operate, customers can receive training on specific topics related to the use of building materials. By sharing knowledge and best practices, our educational and training services guide and teach our customers. Topics range from teaching customers about the characteristics and uses of white cement, to showing retailers how to improve their inventory management and increase their sales.
Construction Financing Services: Most of our customers can receive financing on certain projects and product purchases through various innovative financing programs that vary from country to country. For example, since 1998, our United Nations award-winning low-income housing program, Patrimonio Hoy, has assisted more than 587,000 families with affordable services and building materials through financing mechanisms and technical assistance. Additionally, in certain countries where we operate, such as Mexico, we offer turn-key solutions for developers and partner with governments and local authorities to identify, coordinate, and develop public infrastructure projects.
Mobile Solutions: Through automated messages sent via short message services (SMS), most of our customers can be notified each time an order of cement or ready-mix concrete is ready for delivery. This free-of-charge service keeps our customers well informed of their specific project logistics. Most of our customers can also receive information about their pending invoice payments.
Multiproducts: We offer our customers in most of the countries in which we operate a one-stop shopping experience by providing them with a full array of complementary construction-related supplies through our retail stores from plumbing and electrical supplies to paint, lumber, and lighting fixtures.
Online Services: Most of our customers have all day online access to information, from account balances to new products and services releases through online services such as CEMEX Go, CEMEX Connect, CEMEX One, eSelling, CEMEXNet, Commercial Portal. Our customers can place online cement orders, and in some countries, they are able to review their order status at any time during the day or night. The online service is also an open communication channel to receive feedback from our customers.
Service Centers: We offer a one-stop contact call center where customers can manage their business and find fast, reliable service, place orders, make inquiries, review order status, or request technical assistance, all in one single call.
93
Smart Silo®: We work together with our customers, so they always have the appropriate quantity of cement in their silos. Through 24-hour monitoring of our customers’ silos’ cement stock levels, our SmartSilo® technology allows us to anticipate and respond to their product replenishment needs ahead of time.
Technical Support: We look to provide our customers with top-level technical assistance through our state-of-the-art equipment and our highly professional, well-trained technical services staff. We look to take extra efforts and provide value above and beyond fulfilling our customers’ need for cement, aggregates, ready-mix concrete, and related products such as mortar.
User Base
Cement is the primary building material in the industrial and residential construction sectors of the majority of markets in which we operate. The lack of available cement substitutes further enhances the marketability of our product. The primary end-users of cement in each region in which we operate vary but usually include, among others, wholesalers, ready-mix concrete producers, industrial customers and contractors in bulk. Additionally, sales of bagged cement to individuals for self-construction and other basic needs are a significant component of the retail sector. The end-users of ready-mix concrete generally include homebuilders, commercial and industrial building contractors and road builders. Major end-users of aggregates include ready-mix concrete producers, mortar producers, general building contractors and those engaged in road building activity, asphalt producers and concrete product producers. In summary, because of their many favorable qualities, builders worldwide use our cement, ready-mix concrete and aggregates for almost every kind of construction project, from hospitals and highways to factories and family homes.
As of December 31, 2018, we did not depend on any of our existing customers to conduct our business and the loss of any of our existing customers individually would not have had a material adverse effect on our financial condition or results of operations. For the period ended December 31, 2018, none of our customers represented more than 10% of our consolidated revenues.
Our Business Strategy
CEMEX has a general vision and value creation model comprised of the following six elements: (i) purpose, (ii) mission, (iii) values, (iv) strategy, (v) operating model and (vi) stakeholders.
PURPOSE. We expect to build a better future for our employees, our customers, our shareholders, and the communities where we live and work.
MISSION. We intend to create sustainable value by providing industry-leading products and solutions to satisfy the construction needs of our customers around the world.
VALUES. We intend to: (i) protect the safety of all our employees by being accountable to each other for our actions and behaviors and trying to be an industry leader by example; (ii) focus on our customers by aligning ourselves closely with their business and their needs and, following through with our commitments, resolving problems quickly and making it easy to do business with us; (iii) pursue excellence in all aspects of our business and interactions with customers by challenging ourselves to constantly improve and build upon our strong reputation around the world for quality and reliability; (iv) work as one CEMEX by leveraging on our collective strength and global knowledge to share best practices, replicate good ideas and collaborate across boundaries; and (v) act with integrity by remaining honest and transparent in all our interactions, complying with our code of ethics, and caring for our people, communities and natural resources.
STRATEGY. To achieve our mission, our strategy is to create value by building and managing a global portfolio of integrated cement, ready-mix concrete, aggregates and related businesses. The four pillars that underpin our strategy are (i) valuing our employees as our main competitive advantage and primary asset, (ii) helping our customers succeed, (iii) pursuing markets that offer long-term profitability, and (iv) looking to have sustainability fully embedded in our business.
94
To aid our strategy, in 2018, we embarked on our strategic program to build A Stronger CEMEX. This transformational plan is designed to fortify CEMEX’s position as a leading global heavy building materials company, accelerate our path to investment grade, enhance CEMEX, S.A.B. de C.V.’s total shareholder return and generate long-term value for all of our stakeholders. Through this plan, we expect to rebalance and streamline our existing portofolio in order to be better positioned to deliver higher growth and greater stakeholder value over the mid-to-long-term by divesting between U.S.$1.5 billion and U.S.$2 billion in assets by 2020; achieve operational improvements in both our regional and headquarter operations that should translate into annual cost savings of U.S.$150 million by 2019; accelerate our path to investment grade by further deleveraging CEMEX by reducing debt in an amount of U.S.$3.5 billion by 2020; and to return value to CEMEX, S.A.B. de C.V. shareholders through dividends and stock repurchase programs.
We value people as our main competitive advantage
We aspire to hire top-class employees, and our team’s health, safety and professional growth are top priorities. We develop leaders and encourage them to create new ways of thinking and acting, while assessing risks and opportunities. We look to foster an open dialogue in our interactions to align and achieve greater results.
Placing Health and Safety First.
Health and Safety (“H&S”) remains one of our top values and priorities. We are working towards developing a culture within which everyone in our organization embraces H&S. We believe that the health and safety of our employees, contractors and the people we interact with in our local communities on a day-to-day basis is of the utmost importance.
To help us meet our goals, four core principles guide our decisions and actions: (i) nothing comes before the health and safety of our employees, contractors, and communities; (ii) making health and safety a moral responsibility per employee by looking after ourselves and each other; (iii) looking to create safe workplaces; and (iv) maintaining accountability for health and safety practices.
We are constantly working towards our ultimate target of zero injuries worldwide, evidenced by our Zero4Life objective. In 2018, we achieved a number of records in relation to our health and safety performance. The total number of Lost Time Injuries (“LTI”) was reduced by 22% and total number of Total Recordable Injuries (“TRI”) by 26%, when compared to 2017. We also reduced our sickness absence rate by 6%. Our Employee LTI Frequency Rate was held at the low level of 0.6 and we believe we are on track to reach our goal of reducing such rate to 0.3 or less by 2020. We are also encouraged by the fact that 96% of CEMEX’s operations experienced no fatalities or lost time injuries in 2018. We recognize that the remaining 4% is still considerable; however, we consider that the overall direction is positive. In addition, in 2018, we recorded our lowest Employee TRI Frequency Rate, reaching 2.4, compared to 3.4 in 2017 and 4.1 in 2016. Each of our 5 regions, together with 16 countries, reduced their TRI rates, with 7 countries maintaining a rate of zero.
In 2018, we reduced the number of fatalities by 35% and we are pleased to report there were zero employee fatalities. However, there were 4 fatalities that occurred at our facilities and one at a third party’s facility, all of which involved contractors, as well as 8 that occurred during transportation activities, involving third parties and contractors.
Most of the fatalities were due incidents involving moving vehicles. In an effort to eliminate those types of incidents, we continue to invest in technology and training programs that aim to encourage our employees and contractors to use the appropriate driving techniques to take care of themselves and other vulnerable road users. For example, our Global Supply Chain Health & Safety track has helped to further embed our Vulnerable Road Users program as well as support the roll out of a communication campaign focused on contract drivers. We will continue to work hard and drive forward with our initiatives so that all of our employees and contractors understand the importance of and become integral to our H&S culture.
95
The following table sets forth our performance indicators with respect to safety by geographic location for the year ended December 31, 2018:
| Mexico | United States |
Europe | SCA&C | Asia, Middle East and Africa |
Total CEMEX |
|||||||||||||||||||
| Total fatalities, employees, contractors and other third parties (#) |
4 | 0 | 4 | 2 | 3 | 13 | ||||||||||||||||||
| Fatalities employees (#) |
0 | 0 | 0 | 0 | 0 | 0 | ||||||||||||||||||
| Fatality rate employees(1) |
0 | 0 | 0 | 0 | 0 | 0 | ||||||||||||||||||
| Lost-Time injuries (LTI), employees (#) |
9 | 15 | 12 | 8 | 3 | 48 | ||||||||||||||||||
| Lost-Time injuries (LTI), contractors (#) |
12 | 11 | 8 | 9 | 3 | 46 | ||||||||||||||||||
| Lost-Time injury (LTI) frequency rate, employees per million hours worked |
0.4 | 0.8 | 0.6 | 0.5 | 0.4 | 0.5 | ||||||||||||||||||
| (1) | Incidents per 10,000 people in a year. |
At CEMEX, health and safety training is a key part of our strategy to reach our Zero4Life goal. We look for all our employees to have the correct knowledge, skills, and experience to perform their jobs in a safe manner. As part of our manager-training program, executives and supervisors must complete our Health and Safety Academy, which is designed to enhance the leadership skills of our line managers and supervisors and so that H&S is our top priority across our organization—for our production plants and our corporate offices. The Health and Safety Academy was launched in 2016 with the Foundation module, which prepares our line managers to lead by example and play a fundamental role in ensuring safety throughout our operations. Our Module 2, which was launched in 2017 and rolled out further in 2018, enables our line managers to apply and use the 14 tools of our H&S Management System (HSMS) to support our Zero4Life objective in their operations. Since we launched the Health and Safety Academy, 7,816 line managers have been through our Foundation module and so far, 4,718 with our Module 2. In 2018, we also launched Module 3, which is aimed at enhancing proficiency in key H&S topics. During 2019, we expect that each region will be able to start deploying this new module. Additionally, we continued to provide a wide range of training to our front-line workers in various topics, including safe driving, machinery isolation, emergency management, and occupational health and wellbeing.
Furthermore, we have continued to support our global networks with respect to H&S. We have a dedicated H&S Track that sits within each network to promote working together through a coordinated, consistent, and collaborative approach to reach our goal of zero injuries: (i) the H&S Functional Network; (ii) the Global H&S Council; (iii) 6 global network H&S tracks; and (iv) a Global Health Forum.
Across our operations, we continue to enhance our health practices and reduce our safety risks to strengthen our H&S objective. During 2018, throughout our Global Network H&S tracks, we implemented diverse initiatives that support our Zero4Life commitment. As further example of activity in our global H&S tracks, the Global Cement group provided a way to support ongoing improvements with ‘Management of Change,’ the Aggregates team maintained their focus on fully implementing minimum safety features in mobile equipment in all global operations, and in Ready-mix, they progressed further with a rigorous approach towards safety checklists and driver training.
Supported by our Global Health Forum specialist team, we also remain focused on the occupational health and wellbeing of our employees. In 2018, we continued to provide health checks, further promoted our CEMEX Health Essentials and better defined a health recognition program for our operations. Among some countries where we have operations, we organized a range of health activities and events to help raise awareness and to encourage healthy habits. Some examples of specific initiatives include the United States, where they rolled-out a program for employees to stop smoking, Panama, where they held healthy-eating campaigns and fitness workshops, and Egypt, where they invested in improvements to certain machinery to lower noise exposure levels to help prevent potential harm.
In addition to the local assessment and approval of programs with contractors that we have in each country where we operate, we are also implementing third party verification to help us validate the Health and Safety credentials of contractors we may potentially engage, including major contractors. In 2018, we created a target to approve at least 80% of the spending value with such contractors. As of December 31, 2018, we have accomplished verification of 61% of such contractors, which represents 4,733 of the major contractors that access our operation facilities.
96
Attracting and Retaining Talent. We aim to offer the programs, benefits, and work environment that are designed to attract and retain talented employees. Our approach to talent management is founded on three pillars: (i) employ the right people, in the right place, at the right time to perform the right job to achieve our strategy; (ii) enable a high-performing and rewarding culture to deliver sustainable business value in a safe, ethical workplace; and (iii) build and develop our workforce capabilities to confront challenges and pursue excellence.
As we transform and look to expand, one of our main objectives is to develop people with the potential to fill key leadership positions—increasing their experience and capabilities to equip them to succeed in increasingly challenging roles. Through this process, we work to improve our employees’ commitment to us by helping them meet their own career development expectations and preparing them for key roles as they face critical challenges in their professional development. Our succession management process enables us to build a talented pool of leaders with the skills and understanding of our business fundamentals to continue our pursuit of reaching our goals. Through ongoing training and development opportunities, our employees are taught new skills and their expertise is deepened in several critical areas, including H&S, customer-centric capabilities, environmental conservation and awareness, leadership development, and stakeholder engagement.
We look to foster a dynamic, high-performance environment where open dialogue is encouraged and rewarded. Apart from competitive compensation, more than 80% of our global workforce receives health and life insurance benefits beyond those required by local law in their respective countries. Approximately half of our global workforce receives retirement provision benefits above local requirements, and more than 60% of our operations receive additional funds for disability and invalidity coverage beyond what is required by local laws in their respective countries.
In 2017, we began to integrate our current institutional Academies—Commercial, Health & Safety, Supply Chain, and Culture & Values—under the concept of CEMEX University. CEMEX University aims to develop a digital continuous learning ecosystem for our employees and respond to our multi-region, multi-business learning needs. CEMEX University leverages traditional in-person training with new digital learning platforms to embed a growth mindset throughout our organization and fulfill our employees’ potential.
In April 2018, our Chief Executive Officer approved our Human Rights Policy, applicable to all CEMEX employees, directors and officers, which states that, among other things, CEMEX looks to provide a workplace that is free from harassment and discrimination on the basis of race, gender, national origin, sexual orientation, disability, membership to any political, religious or union organization and offering them equal opportunities for training, personal development, individual recognition and promotion on the basis of merit. Employees who believe that there may have been a violation of the principles laid down in the Human Rights Policy can report it through various channels, including local Human Resources departments, Ethics Committees and our ETHOS line secured internet website. Community members, contractors and suppliers are also encouraged to submit a report through the ETHOS line if they believe there may have been a violation of the Human Rights Policy or any other guideline as stated in our recently updated Code of Ethics and Business Conduct.
Helping our customers succeed
We aim to place our customers at the center of everything we do. We achieve this by delivering a superior customer experience driven by a bold digital transformation.
Delivering A Superior Customer Experience.
Our Customer Centricity Global Network has implemented various initiatives to place our customer at the center of everything we do. Additionally, through the creation of CEMEX Ventures, we are developing new sources of possible revenue by developing ideas that we expect will revolutionize our industry through the use of technology. Among these efforts, CEMEX Go is at the center of our transformation.
We want our customers to view us as reliable, easy to work with, innovative, expert and professional. We have organized our company and redesigned our processes in an effort to create the best possible experience for our customers.
97
Through our Commercial Academy and related initiatives, we are reinforcing focus on customers as a core organizational value and priority that meets both our customers’ and our need for growth and profitability. To date, we have delivered approximately 5,700 training sessions to our professionals, reaching approximately 2,000 employees worldwide. Additionally, we enjoy a wide reach in most of the markets where we operate, with what we believe to be the facilities and logistical capabilities to serve our customers accurately, consistently, and rapidly.
Moreover, we are strategically expanding our manufacturing and distribution capabilities to serve our customers’ and communities’ increasing demand for high-quality public infrastructure, commercial buildings, and housing projects more efficiently, effectively, and reliably. For example, in 2017, we successfully acquired and consolidated a majority stake in Caribbean TCL. As one of the leading producers and distributors of cement and ready-mix concrete products in the Caribbean, Caribbean TCL significantly bolsters our regional operations and trading network—enabling us to deliver a strong experience for our new and existing customers in the area.
Digital Transformation. Beyond changing the way we operate internally, we are leveraging digital technologies to transform our customers experience with CEMEX. We are embracing digital technologies to both streamline and simplify the way our customers engage with us and enhance how we operate. To this end, we launched a digital transformation strategy during 2016.
Over the past few years, we developed and implemented several digital solutions that are being used by our customers. Specifically, in November 2016, we announced a partnership with International Business Machines Corporation (IBM) and Neoris, Inc., one of our subsidiaries, to develop digital solutions to help us transform how we interact with customers. Following the initial deployment, we are continuously updating and adding capabilities to continually improve the functionality and stay ahead of our customers’ expectations.
We intend to transform the global building materials industry with CEMEX Go, an innovative, fully digital customer integration platform. CEMEX Go is a multi-device offering that provides a seamless experience for order placement, live tracking of shipments, and managing invoices and payments for our main products.
During 2017, we started the rollout of CEMEX Go in the United States and Mexico. During 2018, CEMEX Go was deployed in Colombia, France, Costa Rica, Panama, Nicaragua, El Salvador, Spain, the Dominican Republic, Puerto Rico, Guatemala, Peru, Poland, Philippines, the Czech Republic, Egypt and UAE. As of February 28, 2019, its deployment was completed in Germany, United Kingdom and Israel, and its deployment throughout our other geographies is pending.
As of February 28, 2019, CEMEX Go had approximately 30,000 users across our geographies, and through it we received approximately 45% of our main products orders.
As the only global building materials company with its own concrete admixtures business, we are able to design and develop novel, tailor-made concrete technologies with our proprietary chemicals. Moreover, our experts in fields such as geology, chemistry, materials science, and various other engineering disciplines work alongside behavioral scientists, cultural anthropologists, and commercial strategists to anticipate and understand society’s trends to create innovative, sustainable construction solutions that seek to satisfy our customers’ current and future needs, while truly challenging the current state of the art. Among other benefits, our concrete solutions help improve land use, increase water and energy efficiency, mitigate noise pollution, and lower buildings’ carbon footprint.
Led by Global R&D in Switzerland, our team of experts works in close collaboration with our customers to offer them unique, integrated, cost-effective solutions that aim to fulfill their specific performance requirements, including a growing portfolio of value-added brands. In order to provide the same offering in all of our operations, our salesforce is continually informed and trained on value-added brands, with material shared by Global R&D through our internal Global Networks. Another initiative is to begin integrating Building Information Modeling (BIM) technology into our interaction with customers, providing them an overview of their projects and how our products can be incorporated.
98
Technologies developed by our Global R&D are protected by more than 50 international patent families, covering new cements, cementitious materials, concrete mix designs, admixtures formulations, and construction systems.
Together with members of our Aggregates Global Network, our Global R&D supported the design, creation, and launch of our new value-added aggregates brand: neogem. These products are specialized high-quality aggregates, whose intrinsic properties meet the essential needs of five market sectors—Agricultural, Environmental, Industrial, Landscaping, and Sports. Neogem covers an extensive range of premium minerals that can add value to our customers’ projects through particular functional or aesthetic features. Neogem products are innovative, carefully selected, and tailor-made solutions that go beyond commonly known building materials.
Pursue markets that offer long-term profitability
We look to operate in markets where we can add value for our employees, our customers and CEMEX, S.A.B. de C.V.’s shareholders. We intend to focus on those markets that offer long-term profitability. We believe that a geographically diverse portfolio of assets provides us with the opportunity for significant value creation through profitable organic growth over the medium- to long-term. Consequently, we intend to be selective and strategic about where we operate. We believe our business portfolio is particularly focused on geographies that combine strong fundamentals, ranging from economic growth potential to per-capita cement consumption, population growth, degree of urban development and political stability.
Leveraging our global presence and extensive operations worldwide, we intend to continue focusing on our core cement, aggregates, ready-mix concrete and related businesses. By managing our core operations as one vertically integrated business, we not only capture a significant portion of the cement value chain, but also create value for our customers by offering comprehensive building solutions. Historically, this strategic focus has enabled us to grow our existing businesses, particularly in high-growth markets and with specialized, high-margin products.
Complementary Businesses. We participate selectively in complementary businesses, including, but not limited to, the development of alternative and renewable sources of energy, concrete pavement solutions, housing, prefabricated concrete products, admixtures. We believe such projects allows us to provide valuable services to our customers, grow our core markets, develop our competitive advantage, and improve our overall performance.
New Businesses Enabled By Digital Technologies. During 2017, we launched our open innovation and corporate venture capital unit, CEMEX Ventures, which focuses on engaging startups, entrepreneurs, universities, and other stakeholders expected to shape the construction ecosystem of tomorrow by tackling our industry’s toughest challenges.
Leveraging our knowledge of the industry with new, leading edge technologies and platforms, CEMEX Ventures is developing opportunities in key focus areas outside of our core business, including urban development, connectivity improvements across the construction value chain, and new construction trends and technologies, while developing new project finance resources.
CEMEX Ventures’ main role is to look for investment opportunities that go beyond our core business. It also aims to identify and assess emerging technologies to bring CEMEX new ideas and perceptions of the construction ecosystem. To this end, CEMEX Ventures allocates resources to search, incubate, and deploy innovative construction related opportunities and solutions.
During 2017, CEMEX Ventures analyzed more than 2,000 potential businesses, invested in three startups, and developed and engaged in six deep dives with CEMEX employees. CEMEX Ventures also held its Open Challenge, its first competition for startups, entrepreneurs, innovators, businesses, and employees that are exploring new opportunities in any of its focus areas. Following its success, in 2018, CEMEX Ventures launched its Construction Startup Competition which aimed to find startups looking to lead the transformation of the construction industry and held its second startup competition for entrepreneurs, innovators, businesses and employees where more than 250 startups proposed solutions and business opportunities in key focus areas. Furthermore, during 2018 CEMEX Ventures analyzed more than 1500 potential businesses, invested in three additional startups, began incubating four new business proposals and published six new industry technology insight reports. CEMEX Ventures is preparing its Construction Startup Competition for 2019.
99
Look to have sustainability fully embedded in our business
Our sustainability efforts begin with CEMEX, S.A.B. de C.V.’s board of directors and are then facilitated across our entire organization. CEMEX, S.A.B. de C.V.’s Sustainability Committee is comprised of four of CEMEX, S.A.B. de C.V.’s board of directors members reporting directly to CEMEX, S.A.B. de C.V.’s board of directors. The Sustainability Committee is supported by our Corporate Sustainability function, which reports to the Executive Vice President of Sustainability and Operations Development, who is also a member of our Executive Committee. To help embed sustainability into our entire business strategy, we have coordinators representing each geographical region where we operate. In parallel, our Global Sustainability Functional Network works to implement our core sustainability initiatives across all of our operating regions and business lines.
Improving Quality of Life and Well-being. As a company that looks to make a progressive impact through its innovative services and solutions, our ability to operate as a responsible business is fundamental to our business model. This enables us to understand stakeholders’ material issues, map social impacts, and identify risks and opportunities in order to create shared value for us and society.
Our high impact social strategy directly contributes to our vision of building a better future and aims to understand our stakeholders’ expectations by managing our impacts and creating value and well-being through three strategic priorities: (i) co-designing and implementing socially impactful inclusive business models with customers and entrepreneurs; (ii) implementing sustainable community engagement plans to improve quality of life; and (iii) designing and co-creating responsible cross-functional practices within our operations and our value chain.
To achieve these three priorities, our aim is to continue improving the quality of life and well-being of our employees and our communities by considering economic, social, and environmental criteria and focusing on: (i) education and development capabilities; (ii) sustainable and resilient infrastructure and mobility; (iii) social and environmental entrepreneurship; and (iv) culture of environment protection and health.
Although our social projects focus on our core business expertise to create value and well-being, we believe that we are also causing positive impacts on other global challenges. Thus, consistent with our commitment to the United Nations Sustainable Development Goals, we measure our progress and contributions to some of these goals.
Pursuing Excellence in Environmental Management. We believe the pursuit of excellent environmental practices benefits sustainable growth. In addition to our board of directors-level Sustainability Committee, our Global Environmental Council, which is composed of our primary environmental executives responsible for each of our operating regions, shares new trends, proposals, and best practices to identify, inform, and tackle key environmental management concerns.
We are committed to contribute to climate change mitigation and its consequences. For decades, as part of our carbon emissions reduction strategy, we have focused on using low-emission alternatives to traditional fossil fuels, decreasing our clinker factor, promoting clean energy, and increasing energy efficiency across our operations. To this end, we have continuously sought to increase our use of low carbon alternative fuels, which represented 27.1% of our total fuel mix in 2018, and generated more than U.S.$180 million in savings including CO2 emissions avoided in carbon regulated markets.
As a result of our efforts, we reduced our net CO2 emissions per ton of cementitious products by more than 21% compared with our 1990 baseline—equivalent to the emissions generated by 1.5 million homes’ electric consumption in a year. We actively seek to develop new technologies to reduce our carbon footprint. Most notably, we are currently involved in six European research projects that aim to directly and indirectly reduce our carbon emissions. Furthermore, we explore alternatives to traditional clinker and cement chemistry that enable the production of less CO2-intensive cements.
100
We actively seek to develop new technologies to reduce our carbon footprint. Most notably, we are currently involved in four European research projects that aim to directly and indirectly reduce our carbon emissions. Furthermore, we explore alternatives to traditional clinker and cement chemistry that enable the production of less CO2-intensive cements.
To complement these technical measures, we participate in several forums and bilateral dialogues with key stakeholders. These activities are designed to disseminate knowledge about potential reduction measures in our sector and to promote a legislative framework that enables us to implement these measures. For example, these activities include our leading role in the Cement Sustainability Initiative, a cement sector project under the World Business Council for Sustainable Development, and the World Bank-led Carbon Pricing Leadership Coalition.
We have the expertise to responsibly source, process, store, and recover energy from alternative fuels, and we are confident that increasing co-processing residues from other sectors in our cement plants will further contribute to overcoming challenges such as climate change, waste management, and fossil fuel depletion—while utilizing the principles of a circular economy.
Our key contribution to a circular economy is our transformation of waste streams from other sectors into valuable materials. To reduce most of the waste generated from our processes, we maximize our reuse of clinker kiln dust in our production loop, largely avoiding landfill disposal. To realize the financial and environmental benefits of waste, we monitor, minimize, reuse, and recycle our waste, whenever possible.
In 2018, more than 90% of the waste generated by our production processes was recovered, reused or recycled. The remaining material was sent to disposal sites. Additionally, last year alone, we used more than 13 million tons of waste as fuels and alternative raw materials across our business lines. This is equivalent to the waste produced by almost 50 million people in one year.
CEMEX Environmental Management System (“EMS”). We use EMS to evaluate and facilitate consistent and complete implementation of risk-based environmental management tools across our operations. The EMS consists of key mechanisms for environmental impact assessment, stakeholder engagement, and accident response based on input from a range of environmental and biodiversity specialists.
As of December 31, 2018, 90% of our operations had implemented either the CEMEX EMS or equivalent programs. As we approach full implementation of our global EMS in 2020, our goal is for all CEMEX facilities to be 100% compliant with our internal environmental criteria.
The release of nitrogen oxides (NOx), sulfur compounds (SOx), and dust occurs during cement manufacturing. Other emissions, including dioxins, furans, volatile organic compounds, and heavy metals, are released in very small or negligible quantities. To control our stack emissions and remain compliant with local and national regulations, we have steadily expanded emissions monitoring at our manufacturing operations even exceeding regulation requirements in many geographies.
Through our internal EMS and more specifically through our Atmospheric Emissions Global Procedure, we monitor major emissions which assists us in compliance with local regulation limits. To further improve upon these efforts, we have updated the minimum performance levels to fulfill annually for major emissions. In addition, we are establishing more stringent environmental standards for air emissions that will be based on EU Best Available Techniques.
In 2018, we invested U.S. $83 million in sustainability related projects at our global operations, including projects to monitor and control our air emissions, increase our operations efficiency and mitigate our carbon footprint through alternative fuels and clinker substitution efforts.
Our environmental incidents management. We consistently work to minimize our environmental impact, and we are prepared to respond to any emergency that may pose a potential threat to our operations and local communities: (i) we work with our neighbors, law enforcement officials, public agencies, and other stakeholders to develop contingency plans at each of our sites; (ii) we created emergency response teams that are specifically trained to address environmental incidents and hold annual emergency drills; and (iii) we consistently record and report incidents at every level of our business to identify recurring root causes and to share corrective actions.
101
We have updated our Global Environmental Incident Reporting Tool to include social incidents—consolidating our holistic approach to the integral management of incidents. We believe that transparent and timely reporting is the first step to reducing the occurrence and severity of such events. Our rigorous efforts to strengthen a detailed documentation and analysis of environmental and social incidents led to the registration of 2 Category 1 events during 2018. Moreover, given our new reporting scope our Category 2 incidents went from 37 in 2017 to 57 in 2018. Enhancing the CEMEX Environmental and Social Incidents Reporting Procedure has also allowed the circumstances of specific incidents to be registered in the context of their corrective action to allow a better follow-up and corresponding remediation.
Preserving land, water and biodiversity. The preservation of land, biodiversity, and water plays a key role in our long-term resource management strategy.
To protect water and enable our business to succeed, we are increasing our water efficiency and minimizing our water waste through the implementation of our Corporate Water Policy. This policy includes standardization of our water measurement based on the Water Protocol developed in coordination with the International Union for Conservation of Nature.
Operating Model. We aim to operate effectively and achieve the greatest possible value by leveraging our knowledge and scale to establish best practices and common practices worldwide. Our operating model consists of: (i) working with global networks to market our products and solutions; (ii) providing modern support functions and technology to clients and customers; (iii) ensuring clear and effective transactional functions at all levels of our business; and (iv) maintaining efficient governance controls.
STAKEHOLDERS. We value our: (i) employees by providing a great workplace that helps them build skills, expertise and a strong sense of purpose; (ii) clients by tailoring our offerings to solve their construction needs while making it easy for them to work with us and by providing enhanced performance and reliability; (iii) shareholders by focusing on maximizing revenue, reducing costs, optimizing assets and reducing risk; and (iv) community and suppliers by serving as an engine of economic growth, building more capable, inclusive and resilient communities and striving to reduce local air, water and waste impacts in an effort to conserve biodiversity.
Cement and concrete promotion partners. We are increasingly involved in global bodies—which help to coordinate these worldwide topics—such as the Cement Sustainability Initiative. The Cement Sustainability Initiative is a sector initiative within the World Business Council for Sustainable Development.
Environment partners. We work closely with several partners to protect the environment and biodiversity of the countries in which we operate by engaging in fruitful partnerships with global, national, and local organizations. At a global level, we cooperate closely with UNESCO, Wild Foundation, Birdlife International, Wildlife Conservation Society, Conservation International, and the International Union for Conservation of Nature.
Knowledge and learning partners. We often leverage the knowledge and expertise from our partnerships with academic and research institutions.
We continue to support the Massachusetts Institute of Technology (MIT) Concrete Sustainability Hub (CSHub). By conducting ongoing research, the mission of the MIT CSHub is to develop breakthroughs that will achieve sustainable and durable homes, buildings, and infrastructure through advances in concrete technology. MIT results show that inter-industry competition means lower prices for both concrete and asphalt and that a diversified network provides better performance.
Social impact partners. Our more than 500 partnerships and strategic alliances worldwide have proven a key success factor in multiplying our positive impact on society.
102
Financial Strategy
Regain our Investment Grade.
In light of the global economic environment and our substantial amount of indebtedness, we have been focusing, and expect to continue to focus, on optimizing our operations by looking to grow our market positions and our core business and implementing our pricing policies for our products, on strengthening our capital structure and regaining financial flexibility through reducing our debt and cost of debt, improving cash flow generation and extending maturities.
We plan to maintain and grow our market positions in cement, ready-mix concrete and aggregates by being one of the most customer-centric companies in the industry. We also expect to implement pricing initiatives for our products and receive compensation through fees for the services we provide that should allow us to improve our overall profits. We anticipate advocating and promoting the increased usage of cementitious based products, to grow our aggregate footprint and replace our aggregate reserves in a manner, designed to have a sustainable business, and to operate in the most capital and cost-efficient manner possible.
We continue to look to reduce our overall production related costs for all of our products and corporate overhead through disciplined cost management policies and through improving efficiencies by removing redundancies. We have implemented several worldwide standard platforms as part of this process and have also started different initiatives, such as a system designed to improve our operating processes worldwide. In addition, we implemented centralized management information systems throughout our operations, including administrative, accounting, purchasing, customer management, budget preparation and control systems, which have helped us achieve cost efficiencies, and we also have a strategic agreement with IBM expected to improve some of our business processes. We have also transferred key processes, such as procurement and trading, from a centralized model to a regional model and are simplifying and delayering our business to accelerate decision-making and maximize efficiency. In a number of our core markets, such as Mexico, we launched initiatives aimed at reducing the use of fossil fuels, consequently looking to reduce our overall energy costs.
Furthermore, significant economies of scale in key markets at times allow us to obtain competitive freight contracts for key components of our cost structure, such as fuel and coal, among others.
Through a worldwide import and export strategy, we will continue to seek to optimize capacity utilization and maximize profitability by redirecting our products from countries experiencing economic downturns to target export markets where demand may be greater. Our global trading system enables us to coordinate our export activities globally to try and take advantage of demand opportunities and price movements worldwide allowing our regions to have access to information required to execute our trading activities. Should demand for our products in the United States improve, and subject to any measures the current U.S. government could implement, we believe we are well-positioned to service this market through our established presence in the southern and southwestern regions of the country and our current ability to import to the United States.
Our industry relies heavily on natural resources and energy, and we use cutting-edge technology to increase energy efficiency, reduce carbon dioxide emissions and optimize our use of raw materials and water. We are committed to measuring, monitoring and improving our environmental performance. In the last few years, we have implemented various procedures to improve the environmental impact of our activities as well as our overall product quality, such as a reduction of carbon dioxide emissions, an increased use of alternative fuels to reduce our reliance on primary fuels, an increased number of sites with local environmental impact plans in place and the use of alternative raw materials in our cement.
Global Cost-Reduction and Pricing Initiatives
In response to decreased demand in most of our markets as a result of the global economic recession, since 2008 we identified and began implementing global cost-reduction initiatives intended to reduce our annual cost structure to a level consistent with the decline in demand for our products. Such global cost-reduction initiatives have encompassed different undertakings, including headcount reductions, capacity closures across the cement value
103
chain and a general reduction in global operating expenses. During the past years, CEMEX has launched a company-wide program aimed at enhancing competitiveness, providing a more agile and flexible organizational structure and supporting an increased focus on the company’s markets and customers. For the year ended December 31, 2018, and as part of our A Stronger CEMEX plan, we implemented the initiatives that should allow us to achieve anuualized cost savings of U.S.$150 million by 2019. These initiatives include improving our operational performance and expense rationalization, increasing our use of alternative fuels in several of the countries in which we operate, serving our customers better and at lower costs, optimizing our production and logistics supply chain models, and optimizing our procurement strategy.
In connection with the implementation of our cost-reduction initiatives, and as part of our ongoing efforts to eliminate redundancies at all levels and streamline corporate structures to increase our efficiency and reduce operating expenses, as well as our divestitures, we have reduced our global headcount by approximately 26%, from 56,800 employees as of December 31, 2008 (excluding personnel from our operations in Australia sold in 2009 and our operations in Venezuela, which were expropriated in 2008) to approximately 42,000 employees as of December 31, 2018.
Also as part of these initiatives, since 2009, we have temporarily shut down (some for a period of at least two months) several cement production lines in order to rationalize the use of our assets and reduce the accumulation of our inventories. We have also announced the permanent closure of some of our cement plants, such as our Davenport cement plant located in northern California in 2010. Similar actions were taken in our ready-mix concrete and aggregates businesses. Such rationalizations have included, among others, our operations in Mexico, the United States, Spain and the United Kingdom.
Furthermore, during 2017, we achieved energy cost-savings by actively managing our energy contracting and sourcing, and by increasing our use of alternative fuels. We believe that these cost-saving measures better position us to quickly adapt to potential increases in demand and thereby benefit from the operating leverage we have built into our cost structure.
We have also introduced a comprehensive pricing strategy for our products that is expected to more fully reflect and capture the high value-creating capability of our products and services. Our strategy focuses on value enhancement, optimizing gains in customer relationships and in generating sufficient returns that would allow us to reinvest in our business. Under this strategy we are establishing internal procedures and guidelines that are expected to support our approach to pricing our different products and services.
Optimizing Capital Expenditures
During different parts of the past years, we had reduced capital expenditures related to maintenance and expansion of our operations in response to weak demand for our products. Such reductions were implemented to maximize our free cash flow generation available for debt service and debt reduction, consistent with our ongoing efforts to strengthen our capital structure, improve our conversion of Operating EBITDA to free cash flow and regain our financial flexibility. During 2017 and 2018, our capital expenditures related to maintenance and expansion of our operations have been U.S.$656 million and U.S.$668 million, respectively, lower than the U.S.$685 million expended in 2016. Pursuant to the 2017 Credit Agreement, we are limited in our ability to make aggregate annual capital expenditures in excess of U.S.$1 billion in any financial year (excluding certain capital expenditures, joint venture investments and acquisitions to be made by each of CLH and/or CHP and their respective subsidiaries and those funded by Relevant Proceeds (as defined in the 2017 Credit Agreement)), which capital expenditures, joint venture investments and acquisitions at any time then incurred are subject to a separate aggregate limit of (a) U.S.$500 million (or its equivalent) for each of CLH and its subsidiaries and (b) U.S. $500 million (or its equivalent) for each of CHP and its subsidiaries. In addition, the amounts of which we and our subsidiaries allowed for permitted acquisitions and investments in joint ventures cannot exceed certain thresholds as set forth in the 2017 Credit Agreement. We believe that these restrictions on capital expenditures may still allow us to opportunistically increase capital expenditures in some of the markets in which we operate, if necessary, to take advantage of improved market conditions, if any.
104
Our Corporate Structure
CEMEX, S.A.B. de C.V. is an operating and also a holding company, and in general CEMEX operates its business through subsidiaries that, in turn, hold interests in CEMEX’s cement and ready-mix concrete operating companies, as well as other businesses. This chart summarizes CEMEX, S.A.B. de C.V.’s corporate structure as of December 31, 2018. The chart also shows, unless otherwise indicated, for each company, CEMEX, S.A.B. de C.V.’s approximate direct or indirect, or consolidated, percentage equity ownership or economic interest. The chart has been simplified to show only some of CEMEX’s major holding companies and/or operating companies in the main countries in which CEMEX operates, and/or relevant companies in which CEMEX holds a significant direct or indirect interest, and does not include all of CEMEX’s operating subsidiaries and its intermediate holding companies.
105
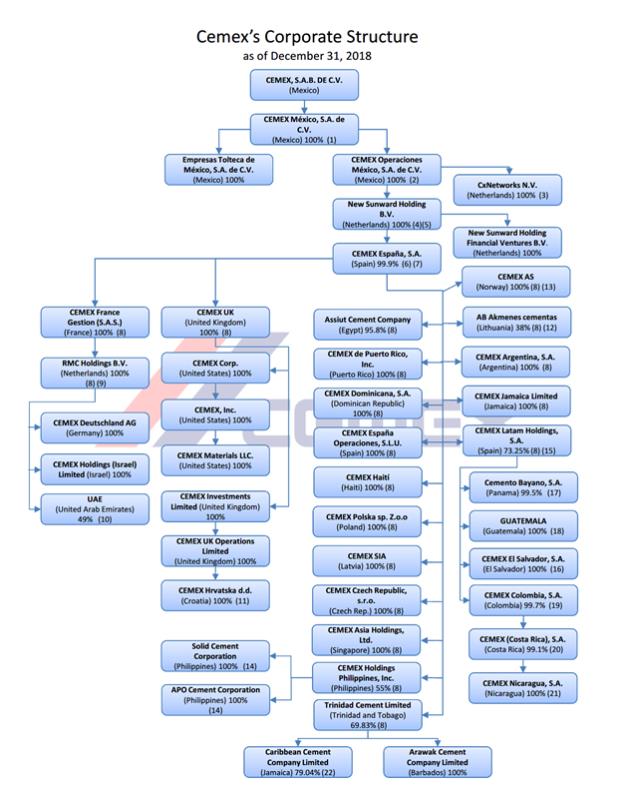
106
| (1) | Includes an approximately 99.99% interest pledged or transferred to a security trust as collateral for the benefit of certain secured creditors of CEMEX, S.A.B. de C.V. and certain of its subsidiaries. |
| (2) | Includes an approximately 99.99% interest pledged or transferred to a security trust as collateral for the benefit of certain secured creditors of CEMEX, S.A.B. de C.V. and certain of its subsidiaries. |
| (3) | CxNetworks N.V. is the holding company of the global business and IT consulting entities, including Neoris N.V. |
| (4) | Includes a 100% interest pledged or transferred to a security trust as collateral for the benefit of certain secured creditors of CEMEX, S.A.B. de C.V. and certain of its subsidiaries. |
| (5) | Includes CEMEX Operaciones México’s 59.64% interest and CTH’s 40.36% interest. CEMEX, S.A.B. de C.V. indirectly holds 100% of CEMEX Operaciones México and CTH. |
| (6) | Includes New Sunward’s and CEMEX, S.A.B. de C.V.’s interest, and shares held in CEMEX España’s treasury. |
| (7) | Includes an approximately 99.63% interest pledged or transferred to a security trust as collateral for the benefit of certain secured creditors of CEMEX, S.A.B. de C.V. and certain of its subsidiaries. |
| (8) | Includes CEMEX España’s direct or indirect, or consolidated, interest. |
| (9) | Includes CEMEX France’s 94.75% interest and CEMEX UK’s 5.25% interest. |
| (10) | Represents CEMEX España’s indirect economic interest in three companies incorporated in the United Arab Emirates, CEMEX Topmix LLC, CEMEX Supermix LLC and CEMEX Falcon LLC. CEMEX España indirectly owns a 49% equity interest in each of these companies, and CEMEX España indirectly holds the remaining 51% of the economic benefits through agreements with other shareholders. |
| (11) | Divestment of CEMEX Hrvatska d.d. was expected to be completed during the first half of 2017, but the divestment will not be made and CEMEX Hrvatska d.d. remains one of our subsidiaries. |
| (12) | Represents CEMEX España’s indirect 37.84% and 11.76% interest in ordinary and preferred shares, respectively. |
| (13) | CEMEX AS is an operating company and also the holding company for CEMEX’s operations in Finland, Norway and Sweden. |
| (14) | Represents CHP’s direct and indirect equity interest. |
| (15) | Represents outstanding shares of CLH’s capital stock and excludes treasury stock. |
| (16) | Represents CLH’s indirect interest. |
| (17) | Represents CLH’s 99.483% indirect interest in ordinary shares, and excludes: (i) a 0.516% interest held in Cemento Bayano, S.A.’s treasury, and (ii) a 0.001% interest held by third parties. |
| (18) | Represents CLH’s direct and indirect interest in four companies incorporated in Guatemala, CEMEX Guatemala, S.A., Global Concrete, S.A., Gestión Integral de Proyectos, S.A. and Cementos de Centroamérica, S.A. |
| (19) | Represents CLH’s 99.75% consolidated (direct and indirect) interest in ordinary shares and 98.94% direct interest in preferred shares. |
| (20) | Represents CEMEX Colombia’s indirect interest. |
| (21) | Includes CEMEX (Costa Rica), S.A.’s 98% interest and CEMEX Colombia’s 2% indirect interest. |
| (22) | Includes TCL’s direct and indirect 74.08% interest and CEMEX’s indirect 4.96% interest. |
Our Operations
MEXICO
Overview. For the year ended December 31, 2018, our operations in Mexico represented 21% of our revenues in Mexican Peso terms before eliminations resulting from consolidation. As of December 31, 2018, our business in Mexico represented approximately 32% of our total installed cement capacity and 12% of our total assets.
As of December 31, 2018, CEMEX, S.A.B. de C.V. was both a holding company for some of our operating companies in Mexico and an operating company involved in the manufacturing and distribution of cement, aggregates and other construction materials in Mexico. CEMEX, S.A.B. de C.V., indirectly, is also the holding company for substantially all our international operations. CEMEX, S.A.B. de C.V. accounts for a substantial part of the revenues and operating income of our operations in Mexico.
107
Our Tepeaca cement plant in Puebla, Mexico currently has a production capacity of approximately 3.4 million tons of cement per year. In December 2014, we announced the restart of the Tepeaca cement plant expansion, consisting in the construction of a new kiln. Its total production capacity is expected to reach approximately 4.9 million tons of cement per year by 2020 and 7.8 million tons of cement per year by 2022. Additionally, we are currently investing in the same region to increase our cement production capacity by 0.5 million tons of cement through a debottlenecking project for our operations in Huichapan. The project is expected to be completed in the first quarter of 2019.
In 2001, we launched the Construrama program, a registered brand name for construction material stores. Through this program, we offer to an exclusive group of our Mexican distributors the opportunity to sell a variety of products under the Construrama brand name, a concept that includes the standardization of stores, image, marketing, products and services. As of December 31, 2018, approximately 919 independent concessionaries with more than 2,043 stores have been integrated into the Construrama program, with nationwide coverage.
Industry. For 2018, the National Institute of Statistics and Geography (Instituto Nacional de Estadística y Geografía) indicated that total construction activity in Mexico expanded by 0.6% up to December (seasonally adjusted figures). Such expansion has been attributed to a positive performance in the building sector of 1.7% and special works of 6.1% partially offset by a decline in infrastructure activity of 5%.
Cement in Mexico is sold principally through distributors, with the remaining balance sold through ready-mix concrete producers, manufacturers of pre-cast concrete products and construction contractors. Cement sold through distributors is mixed with aggregates and water by the end user at the construction site to form concrete. Ready-mix concrete producers mix the ingredients in plants and deliver it to local construction sites in mixer trucks, which pour the concrete. Unlike more developed economies, where purchases of cement are concentrated in the commercial and industrial sectors, retail sales of cement through distributors in 2018 accounted for approximately 59% of Mexico’s demand (bagged presentation). Individuals who purchase bags of cement for self-construction and other basic construction needs are a significant component of the retail sector. We believe that this large retail sales base is a factor that significantly contributes to the overall performance of the Mexican cement market.
The retail nature of the Mexican cement market also enables us to foster brand loyalty, which distinguishes us from other worldwide producers selling primarily in bulk. We own the registered trademarks for our brands in Mexico, such as “Tolteca,” “Monterrey,” “Maya,” “Anahuac,” “Campana,” “Gallo,” “Centenario,” as well as certain sub-brands, such as “Extra,” “Impercem” and “Optimo” for grey cements and mortar and, additionally, recently launched “Multiplast” for coatings. We believe that these brand names are important in Mexico since cement is principally sold in bags to retail customers who may develop brand loyalty based on differences in quality and service. In addition, we own the registered trademark for the “Construrama” brand name for construction material stores.
Competition. In the early 1970s, the cement industry in Mexico was regionally fragmented. However, for over more than the past 45 years, cement producers in Mexico have increased their production capacity and the Mexican cement industry has consolidated into a national market, thus becoming increasingly competitive. The major cement producers in Mexico are CEMEX; LafargeHolcim; Sociedad Cooperativa Cruz Azul, a Mexican operator; Cementos Moctezuma, an associate of Cements Molins and Buzzi-Unicem; and GCC, a Mexican operator in whose majority holder, CAMCEM, we hold a minority interest. During 2013, a then new cement producer, Elementia (Cementos Fortaleza), entered the market and in 2014 acquired two plants from Lafarge (prior to the Lafarge-Holcim merger). The major ready-mix concrete producers in Mexico are CEMEX, LafargeHolcim, Sociedad Cooperativa Cruz Azul and Cementos Moctezuma. In addition, the use of non-integrated ready-mixers has been increasing.
We believe potential entrants into the Mexican cement market face various barriers to entry, including, among other things, the time-consuming and expensive process of establishing a retail distribution network and developing the brand identification necessary to succeed in the retail market; the lack of port infrastructure and the high inland transportation costs resulting from the low value-to-weight ratio of cement; the distance from ports to major consumption centers and the presence of significant natural barriers, such as mountain ranges, which border Mexico’s east and west coasts; the strong brand recognition and the wide variety of special products with enhanced properties; the extensive capital expenditure requirements; and the length of time required for construction of new plants, which is approximately two years.
108
Our Operating Network in Mexico
During 2018, we operated 13 out of our total of 15 cement plants (two were temporarily inactive) and 87 cement distribution centers (including seven marine terminals) located throughout Mexico.
We operate modern cement plants on the Gulf of Mexico and Pacific coasts, allowing us to take advantage of attractive transportation costs to export to the United States, the Caribbean, and Central and South America.

109

Products and Distribution Channels
Cement. For the year ended December 31, 2018, our cement operations represented 57% of revenues for our operations in Mexico before eliminations resulting from consolidation in Mexican Peso terms and our domestic cement sales volume represented 94% of our total cement sales volume in Mexico. As a result of the retail nature of the Mexican market, our operations in Mexico are not dependent on a limited number of large customers. The total volume of the five most important distributors accounted for approximately 12% of our total cement sales by volume in Mexico in 2018 (excluding our in-house channels).
Ready-Mix Concrete. For the year ended December 31, 2018, our ready-mix concrete operations represented 22% of revenues for our operations in Mexico before eliminations resulting from consolidation in Mexican Peso terms. Our ready-mix concrete operations in Mexico purchase all their cement requirements from our cement operations in Mexico. Ready-mix concrete is sold through our own internal sales force and facilities network.
Aggregates. For the year ended December 31, 2018, our aggregates operations represented 5% of revenues for our operations in Mexico before eliminations resulting from consolidation in Mexican Peso terms.
Exports. Our operations in Mexico export a portion of their cement production, mainly in the form of cement and to a lesser extent in the form of clinker. Exports of cement by our operations in Mexico represented approximately 6% of our total cement sales volume in Mexico for 2018. In 2018, approximately 63% of our cement exports from Mexico were to the United States, 27% were to Central America and the Caribbean region and 10% were to South America.
The cement and clinker exports by our operations in Mexico to the United States are mostly marketed through our trading network subsidiaries. Our cement and clinker transactions between CEMEX and its subsidiaries, are conducted on an arm’s-length basis.
Production Costs. Our cement plants in Mexico primarily utilize pet coke and alternative fuels. We have entered into four 20-year agreements with Petróleos Mexicanos (“PEMEX”) pursuant to which PEMEX has agreed to supply us with pet coke, including Termoeléctrica del Golfo’s (“TEG”) coke consumption, through 2022/2023. In 2018, due to operational issues at their refineries, PEMEX supplied us with approximately a total of 0.5 million tons of pet coke, less than half of the minimum annual volume committed. The PEMEX pet coke contracts have reduced
110
the volatility of our fuel costs for our operations in Mexico. In addition, in 1992, our operations in Mexico began using alternative fuels to further reduce the consumption of residual fuel oil and natural gas. These alternative fuels represented approximately 25% of the total fuel consumption for our operations in Mexico in 2018. For additional information, see “Summary of Material Contractual Obligations and Commercial Commitments—Contractual Obligations.”
In 1999, we entered into an agreement with an international partnership, which financed, built and operated TEG, a 230 megawatt (“MW”) energy plant in Tamuín, San Luis Potosí, Mexico. We entered into this agreement in order to reduce the volatility of our energy costs. The power plant commenced commercial operations in April 2004. In 2007, the original operator was replaced and the agreement was extended to 2027. For additional information, see “Summary of Material Contractual Obligations and Commercial Commitments—Contractual Obligations.”
In 2006, in order to take advantage of the high wind potential in the “Tehuantepec Isthmus,” CEMEX and the Spanish company ACCIONA, S.A. (“ACCIONA”), formed an alliance to develop a wind farm project for the generation of 250 MW in the Mexican state of Oaxaca. The installation of 167 wind turbines in the farm was finished on November 15, 2009. For additional information, see “Summary of Material Contractual Obligations and Commercial Commitments—Contractual Obligations.”
In connection with the beginning of full commercial operations of the Ventikas located in the Mexican state of Nuevo Leon, with a combined generation capacity of 252 MW, we agreed to acquire a portion of the energy generated by Ventikas for our Mexican plants for a period of 20 years, which began in April 2016. During 2018, Ventikas supplied approximately 10% of CEMEX’s overall electricity needs in Mexico. This agreement is for CEMEX’s own use and CEMEX does not intend to engage in energy trading. In 2017, we signed a contract with Energía Azteca X, a Natural Gas Combine Cycle plant located in Mexicali, Baja California. This plant started supplying energy to CEMEX Ensenada plant in November 2018. We expect to consume from Energía Azteca X around 70% of the CEMEX Ensenada electric energy operation needs, which are approximately 5 GW per month.
We have, from time to time, purchased hedges from third parties to reduce the effect of volatility in energy prices in Mexico. See “Summary of Material Contractual Obligations and Commercial Commitments—Contractual Obligations.” Additionally, in 2015, we created CEMEX Energía, S.A.P.I. de C.V., an energy division seeking to develop a portfolio of power projects in Mexico, which is in the process of becoming a participant in the wholesale electricity market through a subsidiary. This subsidiary participated as a buyer in the third long-term power auction organized in 2017 by the National Center for Energy Control (Centro Nacional de Control de Energía) (“CENACE”) (the independent system operator) and has been allocated a 20-year contract, starting in 2019. The contract is for 16,129 clean energy certificates per year for compliance with legal requirements and 14.9 GWh/a of electric power to be supplied to CEMEX’s own operations in Mexico.
Description of Properties, Plants and Equipment. As of December 31, 2018, we had 15 wholly-owned cement plants and proportional interests through associates in three other cement plants located throughout Mexico, with a total potential capacity of 29.5 million tons per year, of which two were temporarily inactive. We have exclusive access to limestone quarries and clay reserves near each of our plant sites in Mexico. We estimate that, as of December 31, 2018, the limestone and clay permitted proven and probable reserves of our operations in Mexico had an average remaining life of approximately 135 and 88 years, respectively, assuming 2014-2018 average annual cement production levels. As of December 31, 2018, all our production plants in Mexico utilized the dry process.
As of December 31, 2018, we had a network of 80 land distribution centers in Mexico, which are supplied through a fleet of our own trucks and rail cars, as well as leased trucks and rail facilities, and operated seven marine terminals. In addition, we had 256 ready-mix concrete plants (38 were temporarily inactive) ready-mix concrete plants throughout 77 cities in Mexico, more than 2,500 ready-mix concrete delivery trucks and 12 aggregates quarries.
Capital Expenditures. We made capital expenditures of U.S.$84 million in 2016, U.S.$113 million in 2017 and U.S.$117 million in 2018 in our operations in Mexico. We currently expect to make capital expenditures of over U.S.$157 million in our operations in Mexico during 2019.
111
UNITED STATES
Overview. For the year ended December 31, 2018, our operations in the United States represented 24% of our revenues in Mexican Peso terms before eliminations resulting from consolidation. As of December 31, 2018, our business in the United States represented 17% of our total installed cement capacity and approximately 49% of our total assets. As of December 31, 2018, CEMEX, Inc. was the main holding company of our operating subsidiaries in the United States.
As of December 31, 2018, we had a cement manufacturing capacity of approximately 15.4 million tons per year in our operations in the United States, including 0.6 million tons in proportional interests through non-controlling holdings. As of December 31, 2018, we operated a geographically diverse base of 11 cement plants (two were temporarily inactive) located in Alabama, California, Colorado, Florida, Georgia, Kentucky, Louisiana, Pennsylvania, Tennessee and Texas. As of that date, we also operated 46 rail, truck or water served active cement distribution terminals in the United States. As of December 31, 2018, we had 327 ready-mix concrete plants located in Alabama, Arizona, California, Florida, Georgia, Nevada, Tennessee, Texas and Virginia and 50 active aggregates facilities in Arizona, California, Florida, Georgia, Nevada, South Carolina and Texas.
On September 23, 2013, we and Concrete Supply Company, a leading producer of ready-mix concrete throughout the Carolinas, entered into a joint venture agreement and formed a joint venture company named Concrete Supply Co., LLC, which is majority owned by Concrete Supply Holdings Co, who acts as the managing member. This joint venture is a leading concrete supplier in North and South Carolina with strong local management.
On February 2015, we completed an asset swap with Vulcan Materials Company, under which CEMEX exchanged its asphalt plants in Arizona and Sacramento for 12 ready-mix concrete plants in California. Under the agreement, CEMEX continues supplying aggregates to the exchanged asphalt plants. Also, CEMEX is able to capture incremental cement sales to the acquired ready-mix concrete plants. Given the operations and strategic focus in these markets, we expect each party should earn a higher return on the exchanged assets and continue serving its customers efficiently. This swap was a cash-free transaction.
On January 31, 2017, one of CEMEX, S.A.B. de C.V.’s subsidiaries in the U.S. closed the sale of our Concrete Pipe Business to Quikrete for U.S.$500 million plus an additional U.S.$40 million contingent consideration based on future performance.
Industry. Demand for cement is derived from the demand for ready-mix concrete and concrete products which, in turn, is dependent on the demand for construction. The construction industry is composed of three major sectors: the residential, the industrial-and-commercial, and the public sectors. The public sector is the most cement intensive sector, particularly for infrastructure projects such as streets, highways and bridges.
The construction industry continues to recover from the recession experienced during 2008 and 2009, which was the worst downturn in over 70 years. The construction industry was hit particularly hard during this recession due to the collapse of the housing sector. Housing starts fell 73% from a peak of 2.1 million units in 2005 to only 554,000 units in 2009. The decline in housing and other construction activity resulted in a 45% decline in cement demand from 2005 to 2010. The economic recovery has proceeded at a relatively moderate pace, with real gross domestic product average annual growth of 2.2% since 2011, and as of full year 2018. With the economy growing again, the construction sector stabilized in 2010 and joined the economy-wide recovery in 2011. The excess vacant inventory in the housing sector has been absorbed and existing home inventories for sale have declined to below normal levels across the nation, which together have supported an increase in housing prices for 2016, 2017 and 2018 of about 12%. Housing starts increased by 227% from 554 thousand units in 2009 to 1.26 million units in 2018. Housing starts in 2018 increased by 5% from 2017 to 1.26 million units, which remains well below the historical steady state level. The industrial-and-commercial sector has also been growing with nominal spending up 77% from 2013 to 2018. Industrial-and-commercial nominal spending increased by 5% in 2018. The public sector, which has lagged the other construction sectors in this recovery, recorded a spending increase of 6% in 2018. Cement demand has been increasing annually since 2013 with an estimated growth of 1.9% in 2018 after an increase of 23% from 2012 to 2017. The Portland Cement Association is forecasting a 2.6% increase in cement demand in the U.S. for 2019.
112
Competition. The cement industry in the United States is highly competitive, including national and regional cement producers in the United States. Our principal competitors in the United States are LafargeHolcim, Buzzi-Unicem, Heidelberg and Ash Grove Cement.
The independent U.S. ready-mix concrete industry is highly fragmented. According to the National Ready Mixed Concrete Association (“NRMCA”), it is estimated that there are about 5,500 ready-mix concrete plants that produce ready-mix concrete in the United States and about 55,000 ready-mix concrete mixer trucks that deliver the concrete to the point of placement. The NRMCA estimates that the value of ready-mix concrete produced by the industry is approximately U.S.$35 billion per year. Given that the concrete industry has historically consumed approximately 75% of all cement produced annually in the United States, many cement companies choose to develop concrete plant capabilities.
Aggregates are widely used throughout the United States for all types of construction because they are the most basic materials for building activity. The U.S. Geological Survey (“USGS”) estimates over 2.4 billion tons of aggregates were produced in 2018, an increase of about 5% over 2017. Crushed stone accounted for 59% of aggregates consumed, sand & gravel 41%, and slag 1%. These products are produced in all 50 states and have a value of U.S.$ 26 billion. The U.S. aggregates industry is highly fragmented and geographically dispersed. The top ten producing states represent approximately 55% of all production. According to the USGS, during 2018, an estimated 3,800 companies operated approximately 9,350 sand and gravel sites and 1,465 companies operated 3,710 crushed stone quarries and 90 underground mines in the 50 U.S. states.
Our Operating Network in the United States
The maps below reflect the location of our operating assets, including our cement plants and cement terminals in the United States as of December 31, 2018.

113

Products and Distribution Channels
Cement. For the year ended December 31, 2018, our cement operations represented 32% of our operations in the United States’ revenues before eliminations resulting from consolidation in Mexican Peso terms. In the United States, we deliver a substantial portion of cement by rail, which occasionally those go directly to customers. Otherwise, shipments go to distribution terminals where customers pick up the product by truck or we deliver the product by truck. The majority of our cement sales in the United States are made directly to users of gray portland and masonry cements, generally within a radius of approximately 200 miles of each plant.
Ready-Mix Concrete. For the year ended December 31, 2018, our ready-mix concrete operations represented 42% of our operations in the United States’ revenues before eliminations resulting from consolidation in Mexican Peso terms. Our ready-mix concrete operations in the United States purchase most of their cement aggregates requirements from our cement operations in the United States. Our ready-mix concrete products are mainly sold to residential, commercial and public contractors and to building companies.
Aggregates. For the year ended December 31, 2018, our aggregates operations represented 17% of our operations in the United States’ revenues before eliminations resulting from consolidation in Mexican Peso terms. We estimate that, as of December 31, 2018, the crushed stone quarries and sand/gravel pits permitted proven and probable reserves of our operations in the United States had an average remaining life of approximately 38 years, assuming 2014-2018 average annual aggregates production levels. Our aggregates are consumed mainly by our internal operations and by our trade customers in the ready-mix, concrete products and asphalt industries.
Production Costs. The largest cost components of our plants are usually electricity and fuel, which accounted for approximately 26% of our total production costs of our cement operations in the United States in 2018. We are currently implementing a program expected to gradually replace coal with more economic fuels, such as pet coke, tires and other alternative fuels, which has resulted in reduced energy costs. By retrofitting our cement plants to handle alternative energy fuels, we have gained more flexibility in supplying our energy needs and have become less vulnerable to potential price spikes. In 2018, the increased use of alternative fuels helped to offset the effect on our fuel costs of increasing coal prices. Power costs in 2018 represented approximately 11% of our cash manufacturing cost of our cement operations in the United States, which represents production cost before depreciation. We have improved the efficiency of our electricity usage of our cement operations in the United States, concentrating our manufacturing activities in off-peak hours and negotiating lower rates with electricity suppliers.
114
Description of Properties, Plants and Equipment. As of December 31, 2018, we operated 11 cement manufacturing plants in the United States (two were temporarily inactive), and had a total installed capacity of 15.3 million tons per year including 0.7 million tons representing our proportional interests through associates in seven other cement plants. We estimate that, as of December 31, 2018, the limestone permitted proven and probable reserves of our operations in the United States had an average remaining life of approximately 43 years, assuming 2014-2018 average annual cement production levels. As of that date, we operated a distribution network of 43 cement terminals. All of our 11 cement production facilities in 2018 were wholly-owned by CEMEX, Inc., except for the Louisville, Kentucky plant, which is owned by Kosmos Cement Company, a joint venture in which we own a 75% interest and a subsidiary of Dyckerhoff AG (a subsidiary of Buzzi-Unicem) owns a 25% interest. As of December 31, 2018, CEMEX Inc. had 327 wholly-owned ready-mix concrete plants (47 were temporarily inactive) and operated 50 aggregates quarries. As of December 31, 2018, we distributed fly ash through six terminals and two third-party-owned utility plants, which operate both as sources of fly ash and distribution terminals. As of that date, we also owned 12 concrete block facilities.
In the United States, we have continued to take a number of actions to streamline our operations and improve productivity, including temporary capacity adjustments and rationalizations in some of our cement plants, and shutdowns of ready-mix and block plants and aggregates quarries. We are currently utilizing approximately 86% of our ready-mix plants, 55% of our block manufacturing plants and 82% of our aggregates quarries in the United States.
Capital Expenditures. We made capital expenditures of U.S.$197 million in 2016, U.S.$185 million in 2017 and U.S.$239 million in 2018 in our operations in the United States. We currently expect to make capital expenditures of approximately U.S.$236 million in our operations in the United States during 2019.
EUROPE
For the year ended December 31, 2018, our business in Europe, which includes our operations in the United Kingdom, France, Germany, Spain, Poland and the Rest of Europe, as described below, represented 25% of our revenues before eliminations resulting from consolidation. As of December 31, 2018, our business in Europe represented 26% of our total installed capacity and 20% of our total assets.
Our Operations in the United Kingdom
Overview. For the year ended December 31, 2018, our operations in the United Kingdom represented 7% of our revenues in Mexican Peso terms, before eliminations resulting from consolidation in Mexican Peso terms. As of December 31, 2018, our operations in the United Kingdom represented 6% of our total assets.
As of December 31, 2018, CEMEX Investments Limited was the main holding company of our operating subsidiaries in the United Kingdom. We are a leading provider of building materials in the United Kingdom with vertically integrated cement, ready-mix concrete, aggregates and asphalt operations. We are also an important provider of concrete and precast materials solutions such as concrete blocks, concrete block paving, flooring systems and sleepers for rail infrastructure.
Industry. According to the United Kingdom’s Construction Products Association, in 2018, the gross domestic product of the United Kingdom was estimated to have grown by 1% compared to 2% growth in 2017. Total construction output is estimated to have decreased by 0.2% in 2018, as compared to a 7% increase in 2017. Whilst public housing fell by 2%, the private housing sector is estimated to have grown by 5% in 2018, with the private housing market continuing to be stimulated by the government’s Help to Buy scheme. In 2018, the public non-housing sector is estimated to have decreased by 14% in 2018 and the industrial sector grew by 9% due to increased demand for large, high value warehousing projects. In 2018, the commercial sector decreased by 5%, due to declines in office and retail construction and two former Carillion PFI hospital projects moving to public funding. The infrastructure sector grew by 1% driven by persistent delays and overruns. As of December 31, 2018, the official data corresponding to 2018 has not been released by the Mineral Products Association, but we estimate that domestic cement demand contracted in 2018 compared to 2017.
115
Competition. Our primary competitors in the United Kingdom are: Tarmac (now owned by CRH after divestments by Lafarge and Holcim during their merger), Hanson (a subsidiary of HeidelbergCement), Aggregate Industries (a subsidiary of LafargeHolcim) and Breedon Group, formerly Breedon Aggregates, which acquired Hope Construction Materials (owned by Mittal Investments and formed three years ago from enforced divestments by Lafarge and Tarmac when they created Lafarge Tarmac). The Lafarge Tarmac business was divested to CRH (except for two cement plants to be retained by LafargeHolcim). In addition, an estimated 2.8 million tons of cement were imported to the United Kingdom by various players including CRH, LafargeHolcim, HeidelbergCement and other independents, with material increasingly arriving from over-capacity markets including Ireland, Spain and Greece.
Our Operating Network in the United Kingdom

116

Products and Distribution Channels
Cement. For the year ended December 31, 2018, our cement operations represented 17% of revenues for our operations in the United Kingdom before eliminations resulting from consolidation in Mexican Peso terms. About 84% of our United Kingdom cement sales were of bulk cement, with the remaining 16% in bags. Our bulk cement is mainly sold to ready-mix concrete, concrete block and pre-cast product customers and contractors. Our bagged cement is primarily sold to national builders’ merchants.
Ready-Mix Concrete. For the year ended December 31, 2018, our ready-mix concrete operations represented 26% of revenues for our operations in the United Kingdom before eliminations resulting from consolidation in Mexican Peso terms. Special products, including self-compacting concrete, fiber-reinforced concrete, high strength concrete, flooring concrete and filling concrete, represented 25% of our 2018 United Kingdom sales volume. In 2018, our ready-mix concrete operations in the United Kingdom purchased 99% of its cement requirements from our cement operations in the United Kingdom and approximately 89% of its aggregates requirements from our aggregates operations in the United Kingdom. Our ready-mix concrete products are mainly sold to public, commercial and residential contractors.
Aggregates. For the year ended December 2018, our aggregates operations represented 29% of revenues for our operations in the United Kingdom before eliminations resulting from consolidation in Mexican Peso terms. In 2018, our United Kingdom aggregates sales were divided as follows: 48% were sand and gravel, 45% limestone and 7% hard stone. In 2018, 13% of our aggregates volumes were obtained from marine sources along the United Kingdom’s coast. In 2018, approximately 37% of our United Kingdom aggregates production was consumed by our own ready-mix concrete operations as well as our asphalt, concrete block and precast operations. We also sell aggregates to major contractors to build roads and other infrastructure projects.
117
Production Costs
Cement. In 2018, fixed production costs decreased by 1% driven by there being fewer days of major overhaul in 2018 compared to 2017. Variable costs increased by 1% in absolute terms, primarily as a result of lower volumes. We continued to implement our cost reduction programs through our use of alternative fuels. In March 2015, our partner Suez opened its Malpass factory, adjacent to our Rugby plant, to supply us with refuse derived fuels.
Ready-Mix Concrete. In 2018, fixed production costs increased by 9%, as compared to fixed production costs in 2017, due to annual salary increases, higher repairs and maintenance and higher than anticipated leasing charges.
Aggregates. In 2018, fixed production costs increased by 6% as compared to 2017 fixed production costs.
Description of Properties, Plants and Equipment. As of December 31, 2018, we operated two cement plants and one clinker grinding facility in the United Kingdom. Assets in operation at year-end 2018 represent an installed cement capacity of 2.4 million tons per year. We estimate that, as of December 31, 2018, the limestone and clay permitted proven and probable reserves of our operations in the United Kingdom had an average remaining life of approximately 47 and 21 years, respectively, assuming 2014-2018 average annual cement production levels. As of December 31, 2018, we also owned two cement import terminals and operated 197 ready-mix fixed concrete plants (seven were temporarily inactive) and 62 aggregates quarries in the United Kingdom. In addition, we had operating units dedicated to the asphalt, concrete blocks, concrete block paving, sleepers and flooring businesses in the United Kingdom.
In order to have access to blended cements, which are more sustainable based on their reduced clinker factor and use of by-products from other industries, our grinding and blending facility at the Port of Tilbury, located on the Thames River east of London has an annual grinding capacity of approximately 1.2 million tons, which allows us to have access to blended cements. Blended cements are more sustainable based on their reduced clinker factor and use of by-products from other industries.
Capital Expenditures. We made capital expenditures of U.S.$53 million in 2016, U.S.$30 million in 2017 and U.S.$47 million in 2018 in our operations in the United Kingdom. We currently expect to make capital expenditures of approximately U.S.$44 million in our operations in the United Kingdom during 2019.
Our Operations in France
Overview. As of December 31, 2018, CEMEX France was our main subsidiary in France. We are a leading ready-mix concrete producer and a leading aggregates producer in France. We distribute most of our materials by road and a significant quantity by waterways, seeking to maximize the use of this efficient and sustainable alternative. For the year ended December 31, 2018, our operations in France represented 6% of our revenues in Mexican Peso terms, before eliminations resulting from consolidation. As of December 31, 2018, our operations in France represented 3% of our total assets.
Industry. According to the French Building Association, housing starts in the residential sector decreased by 1% in 2018 compared to 2017. Non-residential buildings starts increased by 2% in 2018 compared to 2017 and demand from the public works sector increased by approximately 11% over the same period.
According to the Building Materials Association Forecasts, total ready-mix concrete consumption in France in 2018 reached approximately 39.8 million of cubic meters, a 3% increase compared to 2017, and total aggregates production amounted to approximately 307 million tons, a 2% increase compared to 2017.
Competition. Our main competitors in the ready-mix concrete market in France include LafargeHolcim, Heildelberg, CRH and Vicat. Our main competitors in the aggregates market in France include LafargeHolcim, Heildelberg, Colas (Bouygues) and Eurovia (Vinci). In France, we rely on sourcing cement from third parties, while many of our major competitors in ready-mix concrete are subsidiaries of French cement producers.
118
Our Operating Network in France


Description of Properties, Plants and Equipment. As of December 31, 2018, we operated 244 ready-mix concrete plants in France, 1 maritime cement terminal located in Le Havre, on the northern coast of France, 21 land distribution centers, 42 quarries and 10 river ports.
Capital Expenditures. We made capital expenditures of U.S.$20 million in 2016, U.S. $20 million in 2017 and U.S.$23 million in 2018 in our operations in France. We currently expect to make capital expenditures of approximately U.S.$18 million in our operations in France during 2019.
119
Our Operations in Germany
Overview. For the year ended December 31, 2018, our operations in Germany represented 4% of our revenues in Mexican Peso terms, before eliminations resulting from consolidation. As of December 31, 2018, our operations in Germany represented 2% of our total assets. As of December 31, 2018, CEMEX Deutschland AG was our main subsidiary in Germany. We are a leading provider of building materials in Germany, with vertically integrated cement, ready-mix concrete and aggregates businesses.
On January 5, 2015, we closed a series of transactions with Holcim, pursuant to which, we sold to Holcim assets in the western region of Germany consisting of one cement plant, two cement grinding mills, one slag granulator, 22 aggregates quarries and 79 ready-mix plants, while we maintained our operations in the north, east and south of Germany.
Industry. According to EUROCONSTRUCT Institute, the total construction output in Germany increased by 2% in 2018, compared to 2017. The main driver of such increase was the residential sector. According to the German Cement Association, in 2018, the national cement consumption in Germany increased by 2% to 29.4 million tons, while the ready-mix concrete market and the aggregates market each increased by approximately 2% and 1%, respectively, when compared to 2017.
Competition. Our primary competitors in the cement market in Germany are Heidelberg, Dyckerhoff (a subsidiary of Buzzi-Unicem), LafargeHolcim, CRH and Schwenk, a local German competitor. These competitors, along with CEMEX in Germany, represent a market share of about 80%, as estimated by us for 2018. The ready-mix concrete and aggregates markets in Germany are fragmented and regionally heterogeneous, with many local competitors. The consolidation process in the ready-mix concrete and aggregates markets is moderate.
Our Operating Network in Germany

120

Description of Properties, Plants and Equipment. As of December 31, 2018, we operated one cement plant in Germany and our installed cement capacity was 2.4 million tons per year. We estimate that, as of December 31, 2018, the limestone permitted proven and probable reserves of our operations in Germany had an average remaining life up to 38 years, assuming 2014-2018 average annual cement production levels. As of that date, our operations in Germany included one cement grinding mill, 84 ready-mix concrete plants (four were temporarily inactive), 25 aggregates quarries (three were temporarily inactive), two land distribution centers for cement and two maritime terminals.
Capital Expenditures. We made capital expenditures of U.S.$26 million in 2016, U.S.$23 million in 2017 and U.S.$16 million in 2018 in our operations in Germany. We currently expect to make capital expenditures of approximately U.S.$18 million in our operations in Germany during 2019.
Our Operations in Spain
Overview. As of December 31, 2018, we held approximately 99.9% of CEMEX España (including shares held in treasury), a holding company for most of our international operations, including our operations in Spain. For the year ended December 31, 2018, our operations in Spain represented 3% of our revenues in Mexican Peso terms, before eliminations resulting from consolidation. As of December 31, 2018, our operating business in Spain represented 5% of our total assets.
On October 1, 2012, CEMEX España agreed to spin-off its Spanish industrial operations in favor of CEMEX España Operaciones, S.L.U. (“CEMEX España Operaciones”), a subsidiary in which CEMEX España holds 100% of the share capital.
In December 2012, the merger of CEMEX España Operaciones and Aricemex, S.A. and Hormicemex, S.A. was completed and, as a result, our manufacturing and sales of cement, aggregates, concrete and mortar were consolidated in CEMEX España Operaciones, which became our Spanish operating subsidiary.
Industry. In 2018, the investment in the construction sector in Spain is estimated to have increased by 6% compared to 2017, primarily driven by the residential sector, which is estimated to have increased by 7% in 2018. According to the latest of our estimates cement consumption in Spain increased by 8% in 2018 compared to 2017.
According to Spanish Cement Producers Association (Agrupación de Fabricantes de Cemento de España) (“OFICEMEN”), cement imports increased 15% in 2015, decreased 11% in 2016 and increased by 0.3% in 2017. Clinker imports according to OFICEMEN declined 26% in 2013, 2% in 2014, 50% in 2015, 86% in 2016, increased 4% in 2017 and, according to our estimates, decreased by 99% in 2018 compared to 2017.
121
In the early 1980s, Spain was one of the leading exporters of cement in the world, exporting up to 13 million tons per year. However, as of December 31, 2018, cement exports amounted to approximately 3.6 million tons per year. In recent years, Spanish cement and clinker export volumes have fluctuated, reflecting the rapid changes in demand in the Mediterranean basin as well as the strength of the Euro and changes in the domestic market. According to OFICEMEN, these total export volumes increased 18% in 2013, 33% in 2014, decreased 4% in 2015, increased 6% in 2016, decreased 8% in 2017 and, according to our estimates, decreased by 8% in 2018 compared to 2017.
Competition. According to our estimates, as of December 31, 2018, we were one of the largest multinational producers of clinker and cement in Spain. Competition in the ready-mix concrete industry is intense in large urban areas. The overall high degree of competition in the Spanish ready-mix concrete industry is reflected in the multitude of offerings from a large number of concrete suppliers. We have focused on developing value added products and attempting to differentiate ourselves in the marketplace. The distribution of ready-mix concrete remains a key component of our business strategy in Spain.
Our Operating Network in Spain

122
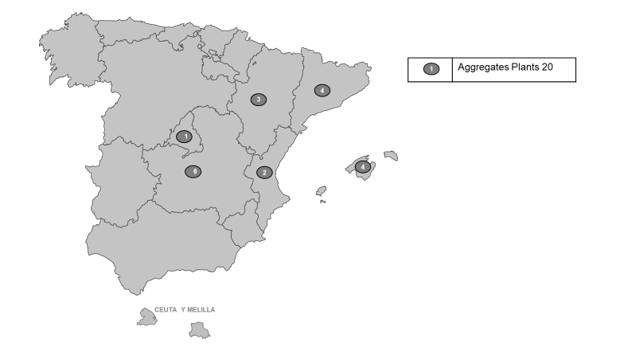
Products and Distribution Channels
Cement. For the year ended December 31, 2018, our cement operations represented 72% of revenues for our operations in Spain before eliminations resulting from consolidation in Mexican Peso terms. We offer various types of cement in Spain, targeting specific products to specific markets and users. In 2018, approximately 17% of the domestic sales volume of CEMEX España Operaciones consisted of bagged cement, and the remainder of CEMEX España Operaciones’s domestic sales volume consisted of bulk cement, primarily to ready-mix concrete operators, including sales to our other operations in Spain, as well as industrial customers that use cement in their production processes and construction companies.
Ready-Mix Concrete. For the year ended December 31, 2018, our ready-mix concrete operations represented 16% of revenues for our operations in Spain before eliminations resulting from consolidation in Mexican Peso terms. Our ready-mix concrete operations in Spain in 2018 purchased almost 89% of their cement requirements from our cement operations in Spain and approximately 56% of their aggregates requirements from our aggregates operations in Spain.
Aggregates. For the year ended December 31, 2018, our aggregates operations represented 5% of revenues for our operations in Spain before eliminations resulting from consolidation in Mexican Peso terms.
Exports. Exports of cement and clinker by our operations in Spain, which represented approximately 18% of revenues for our operations in Spain before eliminations resulting from consolidation, decreased approximately 23% in 2018 compared to 2017, primarily as a result of a decrease in volume sold to the United States, Malta and Morocco, offset by higher sales to the United Kingdom and Guatemala. Export prices are lower than domestic market prices, and costs are usually higher for export sales. Of our total exports from Spain in 2018, 39% consisted of white cement, 28% of gray portland cement and 34% of clinker. Of our total cement export volumes from our operations in Spain during 2018, 24% were to the United States, 25% were to the United Kingdom, 9% were to our South, Central America and the Caribbean region, 3% were to Poland, 10% were to the Rest of Europe region, 2% were to Israel, and 27% were to the Rest of Asia, Middle East and Africa region.
Production Costs. We have improved the efficiency of our operations in Spain by introducing technological improvements that have significantly reduced our energy costs, including the use of alternative fuels, in accordance with our cost reduction efforts. In 2018, we used organic waste, tires and plastics as fuel, achieving a 34% substitution rate for pet coke in our gray and white clinker kilns for the year.
123
Description of Properties, Plants and Equipment. As of December 31, 2018, our operations in Spain included seven cement plants located in Spain, with an annual installed cement capacity of 10.4 million tons. As of that date, we also had 24 operative distribution centers, including 16 land and 8 marine terminals, 63 ready-mix concrete plants (38 were temporarily inactive), 20 aggregates quarries (13 were temporarily inactive) and 7 mortar plants. As of December 31, 2018, we owned 9 limestone quarries located in close proximity to our cement plants and 4 clay quarries in our cement operations in Spain. We estimate that, as of December 31, 2018, the limestone and clay permitted proven and probable reserves of our operations in Spain had an average remaining life of approximately 82 and 32 years, respectively, assuming 2014-2018 average annual cement production levels.
Capital Expenditures. We made capital expenditures of U.S.$25 million in 2016, U.S.$29 million in 2017 and U.S.$26 million in 2018 in our operations in Spain. We currently expect to make capital expenditures of approximately U.S.$14 million in our operations in Spain during 2019.
Our Operations in Poland
Overview. As of December 31, 2018, CEMEX Polska Sp. Z.O.O. (“CEMEX Polska”) was our main subsidiary in Poland. We are a leading provider of building materials in Poland, serving the cement, ready-mix concrete and aggregates markets. As of December 31, 2018, we operated two cement plants with an installed cement capacity of three million tons per year and one grinding mill in Poland. As of December 31, 2018, we also operated 41 ready-mix concrete plants (one was temporarily inactive), seven aggregates quarries (one was temporarily inactive) and two maritime terminals in Poland. For the year ended December 31, 2018, our operations in Poland represented 2% of our revenues in Mexican Peso terms, before eliminations resulting from consolidation. As of December 31, 2018, our operating business in Poland represented 1% of our total assets.
Industry. According to our estimates, total cement consumption in Poland reached approximately 19.3 million tons in 2018, increasing compared to 2017.
Competition. Our primary competitors in the cement, ready-mix concrete and aggregates markets in Poland are Heidelberg, LafargeHolcim, CRH, Dyckerhoff and Miebach.
Capital Expenditures. We made capital expenditures of U.S.$10 million in 2016, U.S.$12 million in 2017 and U.S.$29 million in 2018 in our operations in Poland. We currently expect to make capital expenditures of approximately U.S.$25 million in our operations in Poland during 2019.
Our Operations in the Czech Republic
Overview. As of December 31, 2018, CEMEX Czech Republic, s.r.o. was our main subsidiary in the Czech Republic. We are a leading producer of ready-mix concrete and aggregates in the Czech Republic. We also distribute cement in the Czech Republic. As of December 31, 2018, we operated 74 ready-mix concrete plants (two out of them were inactive), 15 aggregates quarries in the Czech Republic and three aggregates quarries in Slovakia which were divested during February 2018. As of that date, we also operated one cement plant with annual cement installed capacity of one million tons, one cement grinding mill, one cement terminal and one admixtures plant in the Czech Republic. For the year ended December 31, 2018, our operations in the Czech Republic represented 1% of our revenues in Mexican Peso terms, before eliminations resulting from consolidation. As of December 31, 2018, our operating business in the Czech Republic represented 1% of our total assets.
Industry. According to the Czech Statistical Office, total construction output in the Czech Republic increased by approximately 9% in 2018. The increase was driven by an acceleration in the building development segment and civil engineering. The main drivers behind the increase were private investments in industrial as well as housing development, and the growth was stable throughout 2018. For 2018, the increase in building construction is estimated at 9%, while an increase in civil engineering construction is estimated at 9%. The increase in civil engineering construction was mainly due to public investment activity and reconstruction of highways. According to the Czech Cement Association, total cement consumption in the Czech Republic reached year-over-year growth of 9% in the first half of 2018. Full year growth is estimated around 6%. Specific full-year data for 2018 will be provided by the Czech Cement Association in July 2019 due to limitations imposed by EU competition laws. According to our estimates, in 2018, growth of each of total ready-mix concrete production is estimated at 6% and estimated growth of the aggregates market in the Czech Republic is 4.0%.
124
Competition. Our main competitors in the cement, ready-mix concrete and aggregates markets in the Czech Republic are Heidelberg, Buzzi, LafargeHolcim, Strabag and Skanska.
Capital Expenditures. We made capital expenditures of U.S.$7 million in 2016, U.S.$8 million in 2017 and U.S.$9 million in 2018, in our operations in the Czech Republic. We currently expect to make capital expenditures of approximately U.S.$8 million in our operations in the Czech Republic during 2019.
Rest of Europe
As of December 31, 2018, our operations in the Rest of Europe segment consisted primarily of our operations in Croatia and Latvia, as well as trading activities in Scandinavia and Finland. These operations represented 2% of our revenues in Mexican Peso terms, before eliminations resulting from consolidation in Mexican Peso terms, for the year ended December 31, 2018, and 2% of our total assets as of December 31, 2018.
Our Operations in Croatia
Overview. As of December 31, 2018, we held 100% of CEMEX Hrvatska d.d., our operating subsidiary in Croatia. We were the largest cement producer in Croatia based on installed capacity as of December 31, 2018, according to our estimates. We have three cement plants in Croatia with an annual installed capacity of 2.4 million tons. As of December 31, 2018, one plant in Croatia was temporarily inactive. As of December 31, 2018, we operated 12 land distribution centers, three maritime cement terminals in Croatia, Bosnia and Herzegovina and Montenegro, six ready-mix concrete facilities in Croatia and Bosnia and Herzegovina and two aggregates quarry in Croatia.
On April 5, 2017, CEMEX announced that the European Commission issued a decision that ultimately does not allow Duna-Dráva Cement to purchase our aforementioned operations in Croatia. Consequently, the transaction did not close and CEMEX decided to maintain its operations in Croatia and continue to operate them for an indefinite time. As of December 31, 2017 and 2018 and for the years ended December 31, 2018, 2017 and 2016, our operations in Croatia are consolidated line-by-line in the financial statements. See our note 4.2 to our 2018 audited consolidated financial statements included in the February 28 6-K.
Industry. According to our estimates, total cement consumption in Croatia, Bosnia and Herzegovina and Montenegro reached almost 3.5 million tons in 2018, an increase of 5% compared to 2017.
Competition. Our primary competitors in the cement market in Croatia are Nexe and LafargeHolcim.
Capital Expenditures. There were no capital expenditures made in Croatia in 2016, we made capital expenditures of U.S.$5 million in 2017 and U.S.$4 million in 2018 in our operations in Croatia. We currently expect to make capital expenditures of approximately U.S.$2 million in our operations in Croatia during 2019.
Our Operations in Latvia
Overview. As of December 31, 2018, CEMEX SIA was our operating subsidiary in Latvia. We are the only cement producer and a leading ready-mix concrete producer and supplier in Latvia. From our cement plant in Latvia we also supply markets mainly in Estonia, Lithuania, Finland and Sweden, among others. As of December 31, 2018, we operated one cement plant in Latvia with an installed cement capacity of 1.6 million tons per year. We also operated six ready-mix concrete plants (one was temporarily inactive) and four aggregates quarries in Latvia. In 2018, we continued to develop in the road construction business by supplying Roller Compacted Concrete.
Capital Expenditures. In total, we made capital expenditures of U.S.$7 million in 2016, U.S.$4 million in 2017 and U.S.$7 million in 2018 in our operations in Latvia. We currently expect to make capital expenditures of approximately U.S.$0.1 million in our operations in Latvia during 2019.
125
Our Equity Investment in Lithuania
Overview. As of December 31, 2018, we owned an interest of 37.8% in Akmenés Cementas AB, a cement producer in Lithuania, which operates one cement plant in Lithuania with an annual installed cement capacity of 1.8 million tons.
Our Operations in Other European Countries
Overview. As of December 31, 2018, we operated 8 marine cement terminals in Norway and Sweden through CEMEX AS, a leading bulk-cement importer in the Nordic region. As of December 31, 2018, we also operated three marine cement terminals in Finland. Please see “Recent Developments” for information on the divestment of these operations.
Capital Expenditures. We made no significant capital expenditures in our operations in other European countries in 2016, 2017 and 2018. We currently do not expect to make any significant capital expenditures in our operations in other European countries during 2019.
South, Central America and the Caribbean
For the year ended December 31, 2018, our business in SCA&C, which includes our operations in Colombia, Panama, Costa Rica, Caribbean TCL and Rest of South, Central America and the Caribbean segments, as described below, represented 12% of our revenues before eliminations resulting from consolidation in Mexican Peso terms. As of December 31, 2018, our business in SCA&C represented 15% of our total installed capacity and 9% of our total assets.
CLH is the main holding company for CEMEX’s operations in Colombia, Panama, Costa Rica, Guatemala, Nicaragua and El Salvador.
Our Operations in Colombia
Overview. As of December 31, 2018, CLH directly and indirectly owned 99.7% of CEMEX Colombia, S.A. (“CEMEX Colombia”), our main subsidiary in Colombia. As of December 31, 2018, CEMEX Colombia was the second-largest cement producer in Colombia, based on installed capacity of 4.0 million tons per year as of December 31, 2018. For the year ended December 31, 2018, our operations in Colombia represented 3% of our revenues before eliminations resulting from consolidation in Mexican Peso terms. As of December 31, 2018, our operations in Colombia represented 4% of our total assets.
CEMEX Colombia has a significant market share in the cement and ready-mix concrete market in the “Urban Triangle” of Colombia comprising the cities of Bogotá, Medellín and Cali. During 2018, these three metropolitan areas accounted for approximately 40% of Colombia’s cement consumption. CEMEX Colombia’s Ibague plant, which uses the dry process and is strategically located in the Urban Triangle, is CEMEX Colombia’s largest plant and had an annual installed capacity of 2.5 million tons as of December 31, 2018. CEMEX Colombia, through its Cúcuta plant and Clemencia grinding facility, is also an active participant in Colombia’s northeastern and coastal markets.
Industry. According to our estimates, the installed capacity for cement in Colombia was 19 million tons in 2018. According to DANE (Departamento Administrativo Nacional de Estadística), total cement consumption in Colombia reached 12 million tons during 2018, a decrease of 1% from 2017, while cement exports from Colombia reached 0.4 million tons. We estimate that close to 62% of cement in Colombia is consumed by the housing and self-construction sector, while the infrastructure sector accounts for approximately 27% of total cement consumption and has been growing in recent years. The other construction segments in Colombia, including the formal housing and commercial sectors, account for the balance of cement consumption in Colombia.
126
Competition. Our two largest competitors in Colombia are Cementos Argos, which has established a leading position in the Colombian Caribbean coast, Antioquia and Southwest region markets, and LafargeHolcim Colombia. There are eight other local and regional competitors.
The ready-mix concrete industry in Colombia is fairly consolidated with the top three producers accounting for approximately 72 % of the market as of December 31, 2018. CEMEX Colombia was the second-largest ready-mix concrete producer as of December 31, 2018. The first- and third-largest producers were Cementos Argos and LafargeHolcim Colombia, respectively.
The aggregates market in Colombia is highly fragmented and is dominated by the informal market. Approximately 80% of the aggregates market in Colombia was comprised of small independent producers as of December 31, 2018.
Our Operating Network in Colombia


127
Products and Distribution Channels
Cement. For the year ended December 31, 2018, our cement operations represented 51% of revenues for our operations in Colombia before eliminations resulting from consolidation in Mexican Peso terms.
Ready-Mix Concrete. For the year ended December 31, 2018, our ready-mix concrete operations represented 27% of revenues for our operations in Colombia before eliminations resulting from consolidation in Mexican Peso terms.
Aggregates. For the year ended December 31, 2018, our aggregates operations represented 8% of revenues for our operations in Colombia before eliminations resulting from consolidation in Mexican Peso terms.
Description of Properties, Plants and Equipment. As of December 31, 2018, CEMEX Colombia owned two operating cement plants and three mills, having a total annual installed capacity of 4.0 million tons. In addition, through its grinding mills, CEMEX Colombia could produce 0.5 million tons of cement sourced by third parties. In 2018, we replaced 18% of our total fuel consumed in CEMEX Colombia with alternative fuels, and we had an internal electricity generating capacity of approximately 37 MW as of December 31, 2018. We estimate that, as of December 31, 2018, the limestone and clay permitted proven and probable reserves of our operations in Colombia had an average remaining life of approximately 67 and 100 years, respectively, assuming 2014-2018 average annual cement production levels. The operating licenses for quarries in Colombia are renewed every 30 years; assuming renewal of such licenses, we estimate having sufficient limestone reserves for our operations in Colombia for over 200 years assuming 2014-2018 average annual cement production levels. As of December 31, 2018, CEMEX Colombia operated 14 land distribution centers, two mortar plants, 52 ready-mix concrete plants (seven were temporarily inactive) and ten aggregates operations (nine were temporarily inactive). As of that date, CEMEX Colombia also owned 18 limestone quarries.
CEMEX Colombia is also building a new cement plant in the Antioquia department of the Municipality of Maceo, Colombia. See “Regulatory Matters and Legal Proceedings—Other Legal Proceedings—Maceo, Colombia—Operational Matters” for the status of that project.
Capital Expenditures. We made capital expenditures of U.S.$180 million in 2016, U.S.$62 million in 2017 and U.S.$22 million in 2018 in our operations in Colombia. We currently expect to make capital expenditures of approximately U.S.$22 million in our operations in Colombia during 2019.
Our Operations in Panama
Overview. As of December 31, 2018, CLH indirectly held an approximate 99.48% interest in Cemento Bayano, S.A., our main subsidiary in Panama and a leading cement producer in the country. For the year ended December 31, 2018, our operations in Panama represented 2% of our revenues before eliminations resulting from consolidation in Mexican Peso terms.
Industry. We estimate that approximately 1.8 million cubic meters of ready-mix concrete were sold in Panama during 2018. Cement consumption in Panama decreased 13% in 2018 compared to 2017, mainly due to a slowdown in the execution of infrastructure projects, high level inventories in residential and commercial units, and a one-month labor strike in the construction sector during the months of April and May.
Competition. The cement industry in Panama includes three cement producers: Cemento Bayano, Argos Panamá, an affiliate of Cementos Argos, and Cemento Interoceánico, a company in which we are a minority shareholder.
Description of Properties, Plants and Equipment. As of December 31, 2018, Cemento Bayano operated one cement plant in Panama, with an annual installed capacity of 2.1 million tons of cement. As of that date, Cemento Bayano also owned and operated 10 ready-mix concrete plants (one was temporarily inactive), three aggregates quarries (all of which are currently inactive) and four land distribution centers.
128
Capital Expenditures. We made capital expenditures of U.S.$7 million in 2016, U.S.$8 million in 2017 and U.S.$12 million in 2018 in our operations in Panama. We currently expect to make capital expenditures of approximately U.S.$9 million in our operations in Panama during 2019.
Our Operations in Costa Rica
Overview. As of December 31, 2018, CEMEX Colombia, a CLH subsidiary, indirectly held an approximate 99.1% interest in CEMEX (Costa Rica), S.A. (“CEMEX Costa Rica”), our main operating subsidiary in Costa Rica and a leading cement producer in the country. For the year ended December 31, 2018, our operations in Costa Rica represented 1% of our revenues before eliminations resulting from consolidation in Mexican Peso terms.
During 2015, a total of U.S.$5 million were invested as part of a program to increase the overall capacity in the Colorado de Abangares plant, allowing a 10% throughput increase that catered to the needs of our operations in Nicaragua during 2016. Since the expansion, Colorado Plant’s kiln has been operating at the expected capacity with an operational efficiency above 97%. The majority of our operational requirements in Nicaragua have been consistently provided from our operations in Costa Rica.
Industry. We estimate that approximately 1.3 million tons of cement were sold in Costa Rica during 2018. In 2018, the market had an estimated ratio of 50/50 in the bulk/bagged mix due to traditional building techniques in the housing segment which require bagged cement and industrial-and-commercial demand ready mix which requires bulk.
Competition. The Costa Rican cement industry currently includes three producers, CEMEX Costa Rica and LafargeHolcim Costa Rica, both of which have integrated lines, and Fortaleza, which started a cement mill during June 2018 which imports clinker from different sources. Further, in 2018, an estimated 1,300 tons of cement was imported by Holcim due to operational problems and 800 tons of special cement was imported by Costa Rican Institute of Electricity.
Description of Properties, Plants and Equipment. As of December 31, 2018, CEMEX Costa Rica operated one cement plant and one grinding mill in Costa Rica, with a total annual installed capacity of 0.9 million tons. As of that date, CEMEX Costa Rica had seven operational ready-mix concrete plants, one aggregates quarry and one land distribution center.
Exports. During 2018, clinker exports by our operations in Costa Rica represented approximately 24% of our total production and were made to our operations in Nicaragua.
Capital Expenditures. We made capital expenditures of U.S.$4 million in 2016, U.S.$2 million in 2017 and U.S.$3 million in 2018 in our operations in Costa Rica. We currently expect to make capital expenditures of approximately U.S.$3 million in our operations in Costa Rica during 2019.
Our Operations in Caribbean TCL
During 2017, Sierra, pursuant to the Offer, acquired 113,629,723 ordinary shares of TCL, which, together with Sierra’s existing ownership of TCL of 39.5%, resulted in Sierra holding 69.83% of the outstanding TCL shares as of December 31, 2017. The total consideration paid by Sierra for the TCL shares was U.S.$86 million (Ps1,791 million). We started consolidating TCL and its subsidiaries for financial reporting purposes on February 1, 2017. In March 2017, TCL de-listed from the Jamaica and Barbados stock exchanges.
As of December 31, 2018, Caribbean TCL was the leading producer and marketer of cement and ready-mix concrete products in the Caribbean’s construction sector, with operations strategically located in Jamaica, Trinidad and Tobago, Guyana and Barbados.
129
Our focus with respect to Caribbean TCL will continue on attempting to maximize synergies from TCL’s integration with us. We intend on improving the productivity and capacity of our Caribbean TCL’s cement plants, on continuing the vertical integration of TCL’s business, on investing in developing its employees and by offering strong value products.
Our Operations in Trinidad & Tobago
Description of Properties, Plants and Equipment. As of December 31, 2018, TCL operated one cement plant in Trinidad & Tobago, with a total annual installed capacity of 0.9 million tons. As of that date, TCL had five operational ready-mix concrete plants (one was temporarily inactive), two aggregates quarries and four land distribution centers.
Capital Expenditures. We made capital expenditures of U.S.$7 million in 2017 and U.S.$6 million in 2018 in Trinidad & Tobago. We currently expect to make capital expenditures of U.S.$5 million during 2019.
Our TCL Operations in Jamaica
Overview. As of December 31, 2018, we held an indirect controlling position mainly through TCL in CCCL in Jamaica TCL.
Description of Properties, Plants and Equipment. As of December 31, 2018, CCCL operated one cement plant in Jamaica, with a total annual installed capacity of 1.2 million tons. As of that date, CCCL had one aggregate quarry and three land distribution centers.
Capital Expenditures. We made capital expenditures of U.S.$16 million in 2017 and U.S.$13 million in 2018 in CCCL. We currently expect to make capital expenditures of approximately U.S.$9 million in our operations in CCCL during 2019.
Our Operations in Barbados
Overview. As of December 31, 2018, we held an indirect controlling position in Arawak in Barbados.
Description of Properties, Plants and Equipment. As of December 31, 2018, Arawak operated one cement plant in Barbados, with a total annual installed capacity of 0.4 million tons. As of that date, Arawak had one ready-mix plant (temporarily inactive) and one land distribution center.
Capital Expenditures. We made capital expenditures of U.S.$5 million in 2017 and U.S.$7 million in 2018 in Barbados. We currently expect to make capital expenditures of approximately U.S.$2 million in our operations in Barbados during 2019.
Our Operations in the Dominican Republic
Overview. As of December 31, 2018, CEMEX Dominicana, S.A. (“CEMEX Dominicana”) was our main subsidiary in the Dominican Republic and a leading cement producer in the country. CEMEX Dominicana’s sales network covers the country’s main consumption areas, which are Santo Domingo, Santiago de los Caballeros, La Vega, San Pedro de Macorís, Samaná and La Altagracia. On May 8, 2000, CEMEX Dominicana entered into a lease agreement with the government of the Dominican Republic related to the exploitation of a gypsum mine located at Las Salinas, Barahona, which has enabled CEMEX Dominicana to supply all local and regional gypsum requirements. The lease agreement expires on May 8, 2025 and may be extended by the parties. For the year ended December 31, 2018, our operations in the Dominican Republic represented 1% of our revenues before eliminations resulting from consolidation in Mexican Peso terms. As of December 31, 2018, our operations in the Dominican Republic represented 1% of our total assets.
Industry. In 2018, cement consumption in the Dominican Republic reached 4.4 million tons according to Asociación Dominicana de Productores de Cemento Portland (ADOCEM).
130
Competition. Our principal competitors in the Dominican Republic are Cementos Cibao, a local competitor; Domicem, a mixed Italian/local cement producer; Cementos Argos, a grinding operation of a Colombian cement producer; Cementos Santo Domingo, a cement grinding partnership between a local investor and Cementos La Union from Spain; Cementos Panam, a local cement producer; and Cementos Andino, a grinding operation; and a partially-constructed cement kiln of a Colombian cement producer.
Description of Properties, Plants and Equipment. As of December 31, 2018, CEMEX Dominicana operated one cement plant in the Dominican Republic, with an installed capacity of 2.6 million tons per year. As of that date, CEMEX Dominicana also owned eight ready-mix concrete plants, one aggregates quarry, two land distribution centers and two marine terminals.
Capital Expenditures. We made capital expenditures of U.S.$9 million in 2016, U.S.$9 million in 2017 and U.S.$8 million in 2018 in our operations in the Dominican Republic. We currently expect to make capital expenditures of approximately U.S.$8 million in our operations in the Dominican Republic during 2019.
Rest of South, Central America and the Caribbean
As of December 31, 2018, our operations in the Rest of South, Central America and the Caribbean segment consisted primarily of our operations in Puerto Rico, Guatemala, Nicaragua and other countries in the Caribbean, excluding our Caribbean TCL segment. These operations represented 3% of our revenues, in Mexican Peso terms, before eliminations resulting from consolidation. As of December 31, 2018, our business in the Rest of South, Central America and the Caribbean segment represented 1% of our total assets.
Our Operations in Puerto Rico
Overview. As of December 31, 2018, CEMEX de Puerto Rico, Inc. (“CEMEX Puerto Rico”) was our main subsidiary in Puerto Rico.
Industry. In 2018, cement consumption in Puerto Rico reached 0.6 million tons according to the Puerto Rico Economic Development Bank.
Competition. The cement industry in Puerto Rico in 2018 was comprised of two cement producers: CEMEX Puerto Rico and Cementos Argos (formerly Antilles Cement Co (Marine Terminal) and, our new acquisition, San Juan Cement Co (Cement Plant)).
Description of Properties, Plants and Equipment. As of December 31, 2018, CEMEX Puerto Rico operated one cement plant with an installed cement capacity of approximately 1.2 million tons per year (currently operating as a grinding mill only). As of that date, CEMEX Puerto Rico also owned 14 ready-mix concrete plants (10 were temporarily inactive and two were leased to third parties) and two land distribution centers (one was temporarily inactive). As of that date, CEMEX Puerto Rico also owned an aggregates quarry, which is currently closed, and one marine terminal used for fly ash.
Capital Expenditures. We made capital expenditures of U.S.$2 million in 2016, U.S.$2 million in 2017 and U.S.$1 million in 2018 in our operations in Puerto Rico. We currently expect to make capital expenditures of approximately U.S.$3 million in our operations in Puerto Rico during 2019.
Our Operations in Nicaragua
Overview. As of December 31, 2018, CEMEX Colombia and CEMEX Costa Rica, both CLH subsidiaries, indirectly and directly owned 100% of CEMEX Nicaragua, S.A. (“CEMEX Nicaragua”), our operating subsidiary in Nicaragua.
Industry. We estimate that approximately 0.9 million tons of cement, approximately 0.2 million cubic meters of ready-mix concrete and approximately 4.5 million tons of aggregates were sold in Nicaragua during 2018.
131
Competition. Two market participants compete in the Nicaraguan cement industry, CEMEX and LafargeHolcim.
Description of Properties, Plants and Equipment. As of December 31, 2018, we leased and operated one fixed cement plant and one grinding mill with a total installed capacity of 0.6 million tons, six ready-mix plants (three were temporarily inactive), and two distribution centers in Nicaragua. Since March 2003, CEMEX Nicaragua has also leased a 100,000 ton milling plant in Managua, which has been used exclusively for pet coke milling.
Capital Expenditures. We made capital expenditures of U.S.$3.0 million in 2016, U.S.$6.0 million in 2017 and U.S.$6 million in 2018 in our operations in Nicaragua. We currently expect to make capital expenditures of approximately U.S.$4 million in our operations in Nicaragua during 2019.
Our Operations in Guatemala
Overview. As of December 31, 2018, CLH indirectly owned 100% of CEMEX Guatemala, our main operating subsidiary in Guatemala. As of December 31, 2018, we owned and operated one cement grinding mill in Guatemala with an installed capacity of 0.5 million tons per year. As of that date, we also owned and operated five land distribution centers, one clinker dome close to the maritime terminal in the southern part of the country and three ready-mix plants.
Capital Expenditures. We made capital expenditures of U.S.$6 million in 2016, U.S.$2 million in 2017 and U.S.$1 million in 2018 in Guatemala. We currently expect to make capital expenditures of approximately U.S.$2 million in our operations in Guatemala during 2019.
Our Operations in Other South, Central American and Caribbean Countries
Overview. As of December 31, 2018, CEMEX España indirectly held 100% of Readymix Argentina, S.A., which owned one ready-mix concrete plant in Argentina, however, this plant ceased operations in May 2018. The remaining assets were sold in July 2018 and the company is currently under a liquidation process. We also held a non-controlling position in National Cement Ltd. in the Cayman Islands, Maxcem Bermuda Ltd. in Bermuda and Societe des Ciments Antillais, a company with cement operations in Guadalupe and Martinique. As of December 31, 2018, CEMEX España additionally indirectly held a 100% interest in CEMEX Jamaica Limited, which operates one calcined lime plant in Jamaica with a capacity of approximately 120,000 tons per year and one hydrate line with a capacity of approximately 4.800 tons per year.
We believe that the Caribbean region holds considerable strategic importance because of its geographic location. As of December 31, 2018, we operated a network of nine marine terminals in the Caribbean region, which facilitated exports from our operations in several countries, including Mexico, the Dominican Republic, Puerto Rico and the United States. Three of our marine terminals are located in the main cities of Haiti, three are in the Bahamas, and until September 2018, we also operated a terminal in Manaus, Brazil, which was divested generating proceeds of U.S.$29 million, which were used to reduce debt. As of December 31, 2018, we also had a non-controlling interest in two other terminals, one in Bermuda and the other in the Cayman Islands.
Capital Expenditures. In our operations in SCA&C, we made capital expenditures of U.S.$1 million in 2016, U.S.$1 million in 2017 and U.S.$1 million in 2018. We currently expect to make capital expenditures of U.S.$1 million in our operations in other SCA&C countries during 2019.
Asia, Middle East and Africa
For the year ended December 31, 2018, our business in Asia, Middle East and Africa, which includes our operations in the Philippines, Egypt, Israel and the Rest of Asia, Middle East and Africa segment, as described below, represented 10% of our revenues before eliminations resulting from consolidation in Mexican Peso terms. As of December 31, 2018, our business in Asia represented 11% of our total installed capacity and approximately 6% of our total assets.
132
Our Operations in the Philippines
Overview. As of December 31, 2018, on a consolidated basis through various subsidiaries, CEMEX, S.A.B. de C.V. held indirectly 100% of CASE, which in turn owned 55% of the outstanding share capital of CHP. As of December 31, 2018, CHP directly and indirectly owned 100% of our two operating subsidiaries in the Philippines, Solid Cement Corporation (“Solid Cement”) and APO Cement Corporation (“APO”). For the year ended December 31, 2018, our operations in the Philippines represented 3% of our revenues before eliminations resulting from consolidation in Mexican Peso terms. As of December 31, 2018, our operations in the Philippines represented 2% of our total assets.
CHP is investing in a new 1.5 million ton integrated cement production line at CEMEX’s Solid Cement plant in Luzon with an estimated investment of approximately U.S.$234 million. Upon completion, this new line should double the capacity of the Solid Cement plant and will represent a 27% increase in our cement capacity in the Philippines. In December 2017, the Department of Environment and Natural Resources issued an environmental compliance certificate to CHP that covers the new line. The new line is estimated to start operations by the last quarter of 2020.
Competition. As of December 31, 2018, our major competitors in the Philippine cement market were LafargeHolcim, Republic, Eagle, Northern, Goodfound, Taiheiyo and Mabuhay.
Description of Properties, Plants and Equipment. As of December 31, 2018, our operations in the Philippines included two cement plants with an annual installed capacity of 4.5 million tons, exclusive access to two quarries to supply raw materials to our cement plants, 23 land distribution centers and five marine distribution terminals. We estimate that, as of December 31, 2018, the limestone and clay permitted proven and probable reserves accessed by our operations in the Philippines had an average remaining life of approximately 38 and 13 years, respectively, assuming 2014-2018 average annual cement production levels.
Cement. For the year ended December 31, 2018, our cement operations represented 99% of revenues for our operations in the Philippines before eliminations resulting from consolidation in Mexican Peso terms.
Capital Expenditures. We made capital expenditures of U.S.$22 million in 2016, U.S.$28 million in 2017 and U.S.$28 million in 2018 in our operations in the Philippines. We currently expect to make capital expenditures of approximately U.S.$153 million in our operations in the Philippines during 2019.
Our Operations in Egypt
Overview. As of December 31, 2018, ACC was our main subsidiary in Egypt. As of December 31, 2018, we operated one cement plant in Egypt, with an annual installed capacity of approximately 5.4 million tons. This plant is located approximately 280 miles south of Cairo and serves the upper Nile region of Egypt, as well as Cairo and the delta region, Egypt’s main cement market. We estimate that, as of December 31, 2018, the limestone and clay permitted proven and probable reserves of our operations in Egypt had an average remaining life of approximately 56 and 60 years, respectively, assuming 2014-2018 average annual cement production levels. In addition, as of December 31, 2018, we operated seven ready-mix concrete plants (one was temporarily inactive), of which four are owned and three are under management contracts and eight land distribution centers in Egypt. For the year ended December 31, 2018, our operations in Egypt represented 2% of our revenues before eliminations resulting from consolidation in Mexican Peso terms and 1% of our total assets.
See “Regulatory Matters and Legal Proceedings—Other Legal Proceedings—Egypt Share Purchase Agreement” for a description of certain legal proceedings relating to the share purchase agreement, signed in November 1999 between CEMEX, S.A.B. de C.V. and state-owned Metallurgical Industries Company, pursuant to which CEMEX, S.A.B. de C.V. acquired a controlling interest in ACC.
Industry. According to the Ministry of Investment official figures and CEMEX’s estimations, based on government data (local and imported cement), the Egyptian market consumed approximately 51.2 million tons of cement during 2018. Cement consumption decreased by approximately 5% in 2018 compared to 2017, which was
133
mainly attributed to an overall decline in consumers’ disposable income driven by lower purchasing power, ongoing removal of subsidies and high interest rates, all of which impact the construction and cement sectors. As of December 31, 2018, the cement industry in Egypt had a total of 18 cement producers, with an aggregate annual installed cement production capacity of approximately 89 million tons.
Competition. According to the Ministry of Investment official figures, during 2018, LafargeHolcim (Egyptian Cement Company), CEMEX (ACC) and Heidelberg (Suez Cement, Torah Cement and Helwan Portland Cement) were three of the largest cement producers in the world and represented approximately 35% of the total cement production in Egypt. Other significant competitors in Egypt are Arabian (La Union), Titan (Alexandria Portland Cement and BeniSuef Cement), Amreyah (InterCement), National, Sinai (Vicat), Sinai White cement (Cementir), South Valley, Nile Valley, El Seweedy, Army Cement (Arish Cement), Aswan Medcom, Misr BeniSuef, Al Nahda and Misr Quena Cement Companies, Building Materials Industries Co. ASEC Cement, Egyptian Cement (El Masreyeen), Shoura Cement and Egyptian Kuwait Holding Company.
Cement and Ready-Mix Concrete. For the year ended December 31, 2018, cement represented 84% and ready-mix concrete represented 11% of revenues for our operations in Egypt before eliminations resulting from consolidation in Mexican Peso terms.
Capital Expenditures. We made capital expenditures of U.S.$20 million in 2016, U.S.$22 million in 2017 and U.S.$9 million in 2018 in our operations in Egypt. We currently expect to make capital expenditures of approximately U.S.$10 million in our operations in Egypt during 2019.
Our Operations in Israel
Overview. As of December 31, 2018, CEMEX Holdings (Israel) Ltd. was our subsidiary in Israel. We are a leading producer and supplier of raw materials for the construction industry in Israel. In addition to ready-mix concrete and aggregates, we produce a diverse range of building materials and infrastructure products in Israel. As of December 31, 2018, we operated 64 ready-mix concrete plants, six aggregates quarries, one sand pit, one concrete products plant, one admixtures plant, and one lime factory in Israel. For the year ended December 31, 2018, our operations in Israel represented 4% of our revenues before eliminations resulting from consolidation in Mexican Peso terms and 2% of our total assets.
Capital Expenditures. We made capital expenditures of U.S.$16 million in 2016, U.S.$21 million in 2017 and U.S.$21 million in 2018 in our operations in Israel. We currently expect to make capital expenditures of approximately U.S.$19 million in our operations in Israel during 2019.
Rest of Asia, Middle East and Africa
As of December 31, 2018, our operations in the Rest of Asia, Middle East and Africa consisted primarily of our operations in the UAE. These operations represented 1% of our revenues in Mexican Peso terms, before eliminations resulting from consolidation in Mexican Peso terms, for the year ended December 31, 2018, and 1% of our total assets as of December 31, 2018.
Our Operations in the UAE
Overview. As of December 31, 2018, we held a 49% equity interest (and 100% economic benefit) in three of our main UAE companies: CEMEX Topmix LLC and CEMEX Supermix LLC, two ready-mix manufacturing companies, and CEMEX Falcon LLC, which specializes in the production of cement and slag, as well as in other companies in the country. We are not allowed to have a controlling interest in these companies (UAE Commercial Companies Law requires 51% ownership by UAE nationals). However, through agreements with other shareholders in these companies, we have control over the remaining 51% of the economic benefits in each of the companies. As a result, we own a 100% economic interest in all three companies. We also held 100% in CEMEX Arabia FZC, a company dedicated to trading activities (100% ownership is possible as it is in a Free Zone). As of December 31, 2018, we owned eight ready-mix concrete plants (one was temporarily inactive) and one cement and slag grinding facility in the UAE, serving the markets of Dubai and Abu Dhabi as well as neighboring countries such as Oman.
134
Capital Expenditures. We made capital expenditures of U.S.$4 million in 2016, U.S.$3 million in 2017 and U.S.$5 million in 2018 in our operations in the UAE. We currently expect to make capital expenditures of approximately U.S.$6 million in our operations in the UAE during 2019.
Sale of our Operations in Rest of Asia, Middle East and Africa
On May 26, 2016, we closed the sale of our operations in Bangladesh and Thailand to SIAM Cement for U.S.$70 million (Ps1,450 million). In June 2017, we divested our concrete operations in Malaysia through a management buy-out for U.S.$4.6 million. The proceeds from each of these transactions were used mainly for debt reduction and for general corporate purposes.
OUR TRADING OPERATIONS
In 2018, we traded approximately 12.4 million tons of cementitious and non-cementitious materials in 102 countries, including 10.2 million tons of cement and clinker. Approximately 5.7 million tons of the traded cement and clinker consisted of exports from our operations in Spain, Croatia, Mexico, Germany, Latvia, the Dominican Republic, Costa Rica, Trinidad, Barbados, Puerto Rico, Jamaica, Poland, Nicaragua, the Czech Republic, Philippines, Guatemala and the UAE. The remaining approximately 4.4 million tons were purchased from third parties in countries such as Spain, Taiwan, Turkey, Canada, Thailand, Portugal and Vietnam. In 2018, we traded approximately 1.3 million tons of granulated blast furnace slag, a non-clinker cementitious material, and 0.9 million tons of other products.
Our trading network enables us to maximize the capacity utilization of our facilities worldwide while reducing our exposure to the inherent cyclicality of the cement industry. We are able to distribute excess capacity to regions around the world where there is demand. In addition, our worldwide network of strategically located marine terminals allows us to coordinate maritime logistics on a global basis and minimize transportation expenses. Our trading operations also enable us to explore new markets without significant initial capital expenditure.
Freight rates, which account for a large share of the total import supply cost, have been subject to significant volatility in recent years. Our trading operations, however, have obtained significant savings by contracting maritime transportation in due time and by using our own and chartered fleet, which transported approximately 62% of our cement and clinker traded volume during 2018.
In addition, based on our spare fleet capacity, we provide freight service to third parties, thus providing us with valuable shipping market information and generating additional revenues.
REGULATORY MATTERS AND LEGAL PROCEEDINGS
A description of material regulatory matters and legal proceedings affecting CEMEX, S.A.B. de C.V. and its consolidated subsidiaries (“us”, “our”) is provided below. Materiality is tested at a CEMEX, S.A.B. de C.V. consolidated level.
Antitrust Proceedings
Polish Antitrust Investigation
On January 2, 2007, CEMEX Polska received a notification from the Polish Competition and Consumer Protection Office (the “Protection Office”) informing it of the formal initiation of an antitrust proceeding against all cement producers in Poland, including CEMEX Polska and another of our indirect subsidiaries in Poland. The notification alleged that there was an agreement between all cement producers in Poland regarding prices and other sales conditions for cement, an agreed division of the market with respect to the sale and production of cement, and the exchange of confidential information, all of which limited competition in the Polish market with respect to the production and sale of cement. On December 9, 2009, the Protection Office delivered to CEMEX Polska its decision against Polish cement producers related to an investigation which covered a period from 1998 to 2006. The decision imposed fines on a number of Polish cement producers, including CEMEX Polska. The fine imposed on CEMEX
135
Polska was approximately Polish Zloty 115.56 million (approximately U.S.$30.79 million as of December 31, 2018, based on an exchange rate of Polish Zloty 3.7526 to U.S.$1.00), which is approximately 10% of CEMEX Polska’s total revenue in 2008. CEMEX Polska disagreed with the decision, denied that it committed the practices alleged by the Protection Office and, therefore, on December 23, 2009, CEMEX Polska filed an appeal before the Polish Court of Competition and Consumer Protection in Warsaw (the “First Instance Court”). After a series of hearings, on December 13, 2013, the First Instance Court issued its judgment in regards with the appeals filed by CEMEX Polska and other cement producers, which were previously combined into a joint appeal. The First Instance Court reduced the penalty imposed on CEMEX Polska to approximately Polish Zloty 93.89 million (approximately U.S.$25.02 million as of December 31, 2018 based on an exchange rate of Polish Zloty 3.7526 to U.S.$1.00), which was approximately equal to 8.125% of CEMEX Polska’s revenue in 2008. On May 8, 2014, CEMEX Polska filed an appeal against the First Instance Court judgment before the Appeals Court in Warsaw. On March 27, 2018, after several hearings in the Appeals Court, the Appeals Court issued its final judgment reducing the fine imposed upon CEMEX Polska to Polish Zloty 69.4 million (approximately U.S.$18.49 million as of December 31, 2018 based on an exchange rate of Polish Zloty 3.7526 to U.S.$1.00). This penalty is equal to approximately 6% of CEMEX Polska’s revenue in 2008 and has already been paid. On November 19, 2018, CEMEX Polska filed before the Polish Supreme Court an extraordinary, narrow-based cassation appeal against the Appeal Court’s judgment specifically seeking the reduction of the imposed fine. As of December 31, 2018, CEMEX Polska expects that, during the first half of 2019, the Polish Supreme Court will issue a decision regarding acceptance of the cassation appeal for its review. As of December 31, 2018, we do not expect that a final adverse resolution to this matter would have a material adverse impact on our results of operations, liquidity and financial condition.
Antitrust Investigation in Spain by the CNMC
On September 16 and 17, 2014, the Competition Directorate (Dirección de Competencia) of the Spanish National Commission of Markets and Competition (Comisión Nacional de los Mercados y la Competencia) (“CNMC”), in the context of an investigation of the Spanish cement, ready-mix concrete and related products industry regarding alleged anticompetitive practices, inspected one of our facilities in Spain. On January 12, 2015, CEMEX España Operaciones was notified of the initiation by the CNMC of a disciplinary proceeding for alleged prohibited conducts pursuant to Article 1 of the Spanish Competition Law (Ley 15/2007, de 3 de Julio, de Defensa de la Competencia). On November 19, 2015, CEMEX España Operaciones was notified that the alleged anticompetitive practices covered the year 2013 for the cement market and the years 2008, 2009, 2012, 2013 and 2014 for the ready-mix market. On March 8, 2016, the Competition Directorate (Dirección de Competencia) notified CEMEX España Operaciones of a resolution proposal (propuesta de resolución) which considers that the alleged anti-competitive practices were carried out in the markets and years previously indicated. Thereafter, CEMEX España Operaciones submitted allegations rejecting the resolution proposal. On September 8, 2016, CEMEX España Operaciones was notified of a decision issued by the CNMC pursuant to which CEMEX España Operaciones has been required to pay a fine of €5,865,480 (approximately U.S.$6.72 million as of December 31, 2018, based on an exchange rate of €0.8727 to U.S.$1.00). On November 7, 2016, CEMEX España Operaciones filed an appeal before the National Court (Audiencia Nacional) against the CNMC’s decision. The National Court has been requested to suspend the sanction, and, by a resolution issued on December 22, 2016, the National Court granted the requested suspension, subject to issuance of a bank guarantee for the principal amount of the sanction. The CNMC has been notified of both the interposition of the appeal and the request for suspension. As of December 31, 2018, we do not expect that a final adverse resolution to this matter would have a material adverse impact on our results of operations, liquidity and financial condition.
Antitrust Case in Georgia and South Carolina
On July 24, 2017, two ready-mix concrete producers filed a lawsuit in a U.S. Federal Court in the state of Georgia against certain subsidiaries of CEMEX in the U.S. and other companies alleging customer allocation and price fixing in both the ready-mix concrete and cement markets in the coastal Georgia and southeastern coastal South Carolina areas. As CEMEX does not participate in the ready-mix concrete market in these areas, the lawsuit does not allege any improper actions by CEMEX with respect to ready-mix concrete. On October 2, 2017, we filed a motion to dismiss the lawsuit. This motion to dismiss was denied on August 21, 2018, and, as a result, CEMEX will continue to defend the allegations in the ongoing proceedings with its answer filed at the end of October 2018. As of December 31, 2018, we are not able to assess with certainty the likelihood of an adverse result in this lawsuit, but we believe a final adverse resolution to this lawsuit is not probable; however, if adversely resolved, we do not expect such adverse resolution to have a material adverse impact on our results of operations, liquidity and financial condition.
136
United States and its Territories Department of Justice Grand Jury Subpoena
Certain of our U.S. subsidiaries were notified of a grand jury subpoena dated March 29, 2018 issued by the DOJ in connection with an investigation into possible antitrust law violations in connection with our sales (and related sales practices) of gray portland cement and slag in the U.S. and its territories. This subpoena does not mean that the DOJ has concluded that we or any of our affiliates or employees have violated the law. The grand jury subpoena is intended to gather facts necessary to make an informed decision about whether violations of U.S. law have occurred. As of December 31, 2018, we are cooperating with the DOJ and intend to comply with the subpoena. As of December 31, 2018, given the early stages of the investigation, we are not able to assess if this investigation will lead to any fines, penalties or remedies against us, or if such fines, penalties or remedies, if any, would have a material adverse effect on our results of operations, liquidity or financial condition.
Antitrust Investigation in Panama
On June 12, 2018, the Authority for Consumer Protection and Competition Defense of Panama (the “Panama Authority”) carried out a discovery procedure within the context of an administrative investigation ex officio against CEMEX and other competitors for the alleged commission of absolute and relative monopolistic practices in relation to the gray concrete and the ready-mix concrete markets. Pursuant to the administrative investigation, the Panama Authority determined that there were sufficient elements to serve as a basis for considering the possible existence of monopolistic or anticompetitive practices. These practices consist of (i) price fixing and/or production restriction in the gray cement market sold to ready-mix concrete manufacturing companies in Panama; and (ii) unilateral and/or joint predatory acts and/or cross subsidies in the ready-mix concrete market. On October 16, 2018, the Panama Authority issued us a new information request in order to continue their investigation. This administrative investigation does not mean that the Panama Authority has concluded that we, or any of our affiliates or employees in Panama have violated the law, rather, the Panama Authority is gathering facts necessary to make an assessment on whether violations of Panamanian law have occurred. As of December 31, 2018, we are cooperating with the Panama Authority. As of December 31, 2018, given the status of the investigation, we are not able to assess whether this investigation will lead to any fines, penalties or remedies against us, or if such fines, penalties or remedies, if any, would have a material adverse effect on our results of operations, liquidity or financial condition.
Antitrust Investigation in Colombia
On September 5, 2013, CEMEX Colombia was notified of Resolution No. 49141 dated August 21, 2013, issued by the Colombian Superintendency of Industry and Commerce (Superintendencia de Industria y Comercio) (“SIC”) pursuant to which the SIC opened an investigation and issued a statement of objections (pliego de cargos) against five cement companies and 14 directors of those companies, including CEMEX Colombia, for alleged anti-competitive practices. The investigated parties were accused of breaching: (i) Article 1 of Law 155 of 1959, which prohibits any kind of practice, procedure or system designed to limit free competition and determining or maintaining unfair prices; (ii) numeral 1 of Article 47 of Decree 2153 of 1992, which prohibits any agreements designed to directly or indirectly fix prices; and (iii) numeral 3 of Article 47 of Decree 2153 of 1992, which prohibits any market sharing agreements between producers or between distributors. Additionally, 14 executives, including two former executives of CEMEX Colombia, were also being investigated for breaching paragraph 16 of Article 4 of Decree 2153 of 1992, as amended by Article 26 of Law 1340 of 2009, which provides that the SIC may investigate and sanction any individual who collaborates, facilitates, authorizes, executes or tolerates behavior that violates free competition rules. Although the SIC announced three charges, only two of them were under investigation, namely, price fixing agreements and market sharing agreements.
On December 11, 2017, the SIC’s Chief Superintendent decided to impose a sanction against CEMEX Colombia, two other cement companies and six natural persons, for entering into an agreement to fix gray cement prices in Colombia. The fines imposed upon CEMEX Colombia, which were paid on January 5, 2018, amounted to $73,771,700,000 Colombian Pesos (approximately U.S.$22.70 million as of December 31, 2018, based on an exchange rate of 3,249.75 Colombian Pesos to U.S.$1.00). By means of the same resolution dated December 11, 2017, the Chief Superintendent determined there was not sufficient material evidence and ordered to close the investigation related to the other alleged conduct against CEMEX Colombia pursuant to Resolution No. 49141 dated August 21, 2013.
137
CEMEX Colombia decided not to file a reconsideration request, and, instead, filed an annulment and reestablishment of right claim (acción de nulidad y restablecimiento de derecho) before the Administrative Court (Tribunal Contencioso Administrativo) on June 7, 2018 requesting that the charges brought forth by the SIC are annulled and restitution of the fine is paid, with any adjustments provided for by Colombian law. This claim could take up to six years to be resolved. As of December 31, 2018, we are not able to assess the likely result of this matter, but if such matter is resolved adversely to us, we do not expect such adverse resolution to have a material adverse impact on our results of operations, liquidity and financial condition.
Environmental Matters
In the ordinary course of business, we are subject to a broad range of environmental laws and regulations in each of the jurisdictions in which we operate. These laws and regulations impose increasingly stringent environmental protection standards regarding, among other things, air emissions, wastewater discharges, the use and handling of hazardous waste or materials, waste disposal practices and the remediation of environmental damage or contamination. These laws and regulations expose us to the risk of substantial environmental costs and liabilities, including liabilities associated with divested assets and past activities and, in some cases, the acts and omissions of the previous owners or operators of a property or facility that we own or operate. Furthermore, in some jurisdictions, certain environmental laws and regulations impose liability without regard to fault or the legality of the original activity at the time of the actions giving rise to liability. To prevent, control and remediate environmental problems and maintain compliance with regulatory requirements, in line with our global initiatives on environmental management, we maintain an environmental policy designed to monitor and control environmental matters. Our environmental policies require that each of our subsidiaries respect and comply with local laws and meet our own internal standards to minimize the use of non-renewable resources and the generation of hazardous and other wastes. We use processes that are designed to reduce the impact of our operations on the environment throughout all the production stages in all our operations worldwide. In addition, during 2012 we started the implementation of a global EMS at our operating sites that provides a framework to facilitate the consistent and systematic implementation of practical, risk-based environmental management at all sites. As of December 31, 2018, we expect to finish the implementation of the EMS at all of our operating sites by December 31, 2020. It will be used to support sites and businesses across CEMEX globally to document, maintain and continuously improve our environmental performance. We believe that, as of December 31, 2018, a substantial part of our operations already comply with all material environmental laws applicable to us, as the majority of our cement plants already have some kind of EMS (most of which are ISO 14000 certified by the International Organization for Standardization (“ISO”)), with the remaining implementation efforts directed mainly on our aggregates and ready-mix plants.
We regularly incur capital expenditures that have an environmental component or that are impacted by environmental regulations. However, we do not keep separate accounts for such mixed capital and environmental expenditures. Environmental expenditures that extend the life, increase the capacity, improve the safety or efficiency of assets or are incurred to mitigate or prevent future environmental contamination may be capitalized. Other environmental costs are expensed when incurred. For the years ended December 31, 2016, 2017 and 2018, our sustainability capital expenditures (including our environmental expenditures and investments in alternative fuels and cementitious materials) were approximately U.S.$79.9 million, approximately U.S.$83.14 million and approximately U.S.$83 million, respectively. As of December 31, 2018, we do not expect a material increase in our environmental expenditures compare to the years ended December 31, 2016 and 2017.
The following is a discussion of environmental regulations and related matters in our major markets.
138
Mexico
We were one of the first industrial groups in Mexico to sign an agreement with the Mexican Ministry of Environment and Natural Resources (Secretaría del Medio Ambiente y Recursos Naturales) (“SEMARNAT”) to carry out voluntary environmental audits in our 15 Mexican cement plants under a government-run program. In 2001, the Mexican Environmental Protection Agency (Procuraduría Federal de Protección al Ambiente), which is part of SEMARNAT, completed the audit of our cement plants and awarded each of them a Clean Industry Certificate (Certificado de Industria Limpia) (“CIC”) certifying that our cement plants are in full compliance with applicable environmental laws. The CICs are subject to renewal every two years. As of December 31, 2018, our operating cement plants in Mexico had CICs or were in the process of renewing them. As of December 31, 2018, we expect that we should be able to renew all currently expired CICs.
For over a decade, the technology for co-processing used tires into an energy source has been employed in our plants located in Ensenada and Huichapan. By the end of 2016, almost all our cement plants in Mexico were using tires as an alternative fuel (except for installations in Torreon and Valles). As of December 31, 2018, municipal collection centers in the cities of Tijuana, Mexicali, Ensenada, Mexico City, Reynosa, Nuevo Laredo and Guadalajara enable us to obtain, as alternative fuel, an estimated 24,000 tons of tires per year. Overall, approximately 25.39% of the total fuel used in our operating cement plants in Mexico during 2018 was comprised of alternative fuels.
Between 1999 and December 31, 2018, our operations in Mexico have invested approximately U.S.$137.41 million in the acquisition of environmental protection equipment and the implementation of the ISO 14001:2004 environmental management standards of ISO. The audit to obtain the renewal of the ISO 14001:2004 certification took place during 2018 and our operating cement plants in Mexico obtained the renewal of the ISO 14001:2004 certification for environmental management systems, which is valid until February of 2021.
On June 6, 2012 the General Law on Climate Change (Ley General de Cambio Climático) (the “Climate Change Law”) was published in the Mexican Official Gazette (Diario Oficial de la Federación) and became effective on August 4, 2012. The Climate Change Law establishes a legal framework to regulate policies for climate change mitigation and adaptation. Important provisions of the Climate Change Law require the development of secondary legislation, and depend on the publication of subsequent implementing regulations. For instance, the Climate Change Law provides, among other things, for (i) the elaboration of a registry of the emissions that are generated by fixed sources, (ii) companies to report their emissions, if required, and (iii) the application of fines to those companies that fail to report or that report false information. In this regard, on October 28, 2014, the Regulations to the General Law on Climate Change Regarding the National Registry of Emissions (Reglamento de la Ley General de Cambio Climático en Materia del Registro Nacional de Emisiones) (the “Regulations”) were published in the Mexican Official Gazette (Diario Oficial de la Federación), becoming effective on October 28, 2014. The purpose of the Regulations is to govern the Climate Change Law regarding the National Registry of Emissions, identifying the sectors and subsectors, which include among others, the cement industry, that must file the corresponding reports before the National Registry of Emissions. We had previously reported our direct and indirect carbon dioxide emissions to SEMARNAT under a voluntary scheme. The Climate Change Law also allows for the establishment of specific greenhouse gas reduction targets in accordance with the respective contribution of each economic sector to the national greenhouse gas emissions. As of December 31, 2018, we are not able to determine the impact that any measures related to the Regulations and Climate Change Law may have on our operations in Mexico. Although the Climate Change Law does not establish a program for emissions trading, it does vest on the Mexican federal government the power to create, authorize and regulate such a scheme, which may be voluntary or binding. We are closely observing the development of implementing regulations and, as of December 31, 2018, we cannot estimate the impact, if any, that any measures related to this may have upon our operations in Mexico. A Special Tax on Production and Services (Impuesto Especial Sobre Producción y Servicios) on the sale and import of fossil fuels was included in the tax reform that became effective on January 1, 2014. During the year ended December 31, 2018, petroleum coke, a primary fuel widely used in our kilns in Mexico was taxed at a rate of Ps18.29 (approximately U.S.$0.93 as of December 31, 2018, based on an exchange rate of Ps19.65 to U.S.$1.00) per ton.
On August 12, 2014, a package of energy reform legislation became law in Mexico. The then newly enacted energy reform legislation, which included nine new laws, as well as amendments to existing laws, implemented the December 2013 constitutional energy reform and established a new legal framework for Mexico’s energy industry. One of the new laws that was enacted is the Electric Industry Law (Ley de la Industria Eléctrica) (the “Electric Industry Law”), which establishes a legal framework for electricity-related activities in Mexico, which has the effect of structurally changing the national electric industry. The Electric Industry Law encourages the use of
139
electricity generated through clean energy sources, while introducing negotiable clean energy certificates as well as other measures aimed at achieving greenhouse gas reductions. On October 31, 2014, certain rules and regulations related to the energy reform legislation, including the regulations of the Electric Industry Law, were published. As part of the Electric Industry Law, a system for tradable clean energy certificates was created and certain clean energy procurement obligations were imposed on consumers. The clean energy procurement obligations for 2019 to 2022 have been announced at 5.8%, 7.4%, 10.9% and 13.9%, respectively, and this requirement is expected to increase in subsequent years. CEMEX’s operations in Mexico have ongoing commitments to procure power from renewable projects operating under the “self-supply” framework of the former Electric Energy Public Service Law, and the energy supplied under these contracts is exempted from the clean energy obligation. Nonetheless, since 2018, we are required to acquire clean energy certificates to comply with the clean energy obligations for the fraction of energy supply that does not come from clean generators. Over time, according to the penalty levels set by the Mexican Energy Regulatory Commission (Comisión Reguladora de Energía), non-compliance with the clean energy procurement obligations could have a material adverse impact on our business or operations in Mexico, but as of December 31, 2018, we are not able to assess if such impact would in turn have a material adverse impact on our results of operations, liquidity and financial condition.
On September 8, 2015, the Electricity Market Rules (Bases del Mercado Eléctrico) (the “Rules”) were published in the Mexican Official Gazette (Diario Oficial de la Federación) and became effective on September 9, 2015. The Rules, which are an important step forward in the implementation of the reforms enacted regarding Mexico’s energy industry, contain the design and operation principles of the different components of the wholesale electricity market (the “Electricity Market”). As of December 31, 2018, we are authorized to become participants in the Electricity Market. Additionally, CEMEX participated as a buyer in the third long-term power auction organized in 2017 by CENACE, the independent national electric system operator, and has been allocated a 20-year contract for 16,129 clean energy certificates per year for compliance starting in 2020 and 14.9 GWh/a of electric power.
During 2016, a new electrical standards code was issued in Mexico (Código de Red) (the “Code”). The Code establishes new standards for electrical operation that will be enforced beginning in 2019 against consumers connected to the national grid. As of December 31, 2018, we estimate that the implementation of the Code will require investments across our operating assets in Mexico, which we expect to amount to approximately U.S.$6 million.
United States
Our operating subsidiaries in the United States are subject to a wide range of U.S. federal, state and local laws, regulations and ordinances dealing with the protection of human health and the environment that are strictly enforced and can lead to significant monetary penalties for noncompliance. These laws and regulations expose us to the risk of substantial environmental costs and liabilities, including liabilities associated with divested assets and past activities and, in some cases, the acts and omissions of the previous owners or operators of a property or facility. These laws regulate, among other things, water discharges, noise, and air emissions, including dust, as well as the handling, use and disposal of hazardous and non-hazardous waste materials. Certain laws also create a shared liability scheme under which parties are held responsible for the cost of cleaning up releases to the environment of designated hazardous substances. We therefore may have to conduct environmental remediation associated with the disposal or release of hazardous substances at our various operating facilities, or at sites in the United States to which we sent hazardous waste for disposal. As of December 31, 2018, we believe that our current procedures and practices for handling and managing materials are generally consistent with industry standards and legal and regulatory requirements, and also believe that we take appropriate precautions designed to protect employees and others from harmful exposure to hazardous materials.
As of December 31, 2018, CEMEX, Inc. and its subsidiaries had accrued liabilities specifically relating to environmental matters in the aggregate amount of approximately U.S.$32.54 million. The environmental matters relate to (i) the disposal of various materials, in accordance with past industry practice, that might be categorized as hazardous substances or wastes, and (ii) the cleanup of hazardous substances or wastes at sites used or operated by CEMEX, Inc. and its subsidiaries including discontinued operations, either individually or jointly with other parties. Most of the proceedings are in the preliminary stages, and a final resolution might take several years. For purposes of recording the provision, CEMEX, Inc. and its subsidiaries consider that it is probable that a liability has been incurred and the amount of the liability is reasonably estimable, whether or not claims have been asserted, and
140
without giving effect to any possible future recoveries. Based on information developed as of December 31, 2018, CEMEX, Inc. does not believe it will be required to spend significant sums on these matters, in excess of the amounts previously recorded. The ultimate cost that might be incurred to resolve these environmental issues cannot be assured until all environmental studies, investigations, remediation work, and negotiations with, or litigation against, potential sources of recovery have been completed.
In 2007, EPA launched a CAA enforcement initiative against the U.S. cement industry. The primary goal of the initiative was to assess the industry’s historic compliance with the CAA’s New Source Review program and to reduce emissions from the industry through the installation of add-on controls. We have actively engaged with EPA in its investigations, which involved multiple of our facilities in the United States, and have entered into four settlements involving a total of U.S.$6.1 million in civil penalties and a commitment to incur certain capital expenditures for pollution control equipment at its Victorville, California; Fairborn, Ohio (divested on February 10, 2017); Lyons, Colorado; Knoxville, Tennessee; Louisville, Kentucky; Demopolis, Alabama; Odessa, Texas (divested on November 18, 2016); and New Braunfels, Texas plants. Based on our past experience with such matters and currently available information, as of December 31, 2018, we do not expect that any further proceedings will have a material adverse impact on our results of operations, liquidity and financial condition.
In 2002, CEMEX Construction Materials Florida, LLC (formerly Rinker Materials of Florida, Inc.) (“CEMEX Florida”), a subsidiary of CEMEX, Inc., was granted a federal quarry permit and was the beneficiary of another federal quarry permit for the Lake Belt area in South Florida. The permit held by CEMEX Florida covered CEMEX Florida’s SCL and FEC quarries. CEMEX Florida’s Kendall Krome quarry is operated under the permit of which it was a beneficiary. The FEC quarry is the largest of CEMEX Florida’s quarries measured by volume of aggregates mined and sold. CEMEX Florida’s Miami cement mill is located at the SCL quarry and is supplied by that quarry, while the FEC and Kendall Krome quarries have supplied aggregates to CEMEX and third-party users. In response to litigation brought by environmental groups concerning the manner in which the federal quarry permits were granted, in January 2009, the U.S. District Court for the Southern District of Florida ordered the withdrawal of the federal quarry permits for CEMEX Florida’s SCL, FEC and Kendall Krome quarries. The judge ruled that there were deficiencies in the procedures and analysis undertaken by the Army Corps of Engineers (“Corps”) in connection with the issuance of the permits. Upon appeal, on January 21, 2010, the Eleventh Circuit Court of Appeals affirmed the district court’s ruling withdrawing the federal quarry permits for the three CEMEX Florida quarries as well as other third-party federal quarry permits subject to the litigation. On January 29, 2010, the Corps completed a multi-year review commenced as a result of this litigation and issued a Record of Decision (“ROD”) supporting the issuance of new federal quarry permits for the FEC and SCL quarries. Excavation of new aggregates was stopped at the FEC and SCL quarries from January 20, 2009 until new permits were issued. The FEC permit was issued on February 3, 2010, and the SCL permit on February 18, 2010. The ROD also indicated that a number of potential environmental impacts must be addressed at the wetlands located at the Kendall Krome site before a new federal quarry permit may be issued for mining at that quarry. As of December 31, 2018, it is unclear how long it will take to fully address the Corps’ concerns regarding mining in the Kendall Krome wetlands. While no new aggregates will be quarried from wetland areas at Kendall Krome pending the resolution of the potential environmental issues, the FEC and SCL quarries will continue to operate. If CEMEX Florida is unable to maintain the new Lake Belt permits, CEMEX Florida would need to source aggregates, to the extent available, from other locations in Florida or import aggregates. This would likely affect operating income from our Florida operations. As of December 31, 2018, any adverse impacts on the Florida economy arising from the cessation or significant restriction of quarrying operations in the Lake Belt area could also have a material adverse impact on our results of operations, liquidity and financial condition.
In June 2010, EPA proposed regulating Coal Combustion Residuals (“CCRs”) generated by electric utilities and independent power producers as a hazardous or special waste under the United States Resource Conservation and Recovery Act. In the Unites States, we use CCRs as a raw material in our cement manufacturing process, as well as a supplemental cementitious material in some of our ready-mix concrete products. On December 19, 2014, EPA issued a final rule on the regulation of CCRs (the “Final Rule”). As of December 31, 2018, we believe that the effects of the Final Rule would not have a material adverse impact on our results of operations, liquidity and financial condition.
141
Our operations in the United States are subject to a number of federal and state laws and regulations addressing climate change. On the federal side, EPA has promulgated a series of regulations pertaining to emissions of GHGs from industrial sources. EPA issued the Mandatory Reporting of GHGs Rule, effective December 29, 2009, which requires certain covered sectors, including cement manufacturing, with GHG emissions above an established threshold to inventory and report their GHG emissions annually on a facility-by-facility basis. In 2010, EPA issued a final rule that establishes GHG thresholds for the New Source Review Prevention of Significant Deterioration (“PSD”) and Title V Operating Permit programs. The rule “tailors” the requirements of these CAA permitting programs to limit which facilities will be required to obtain PSD and Title V permits for GHG emissions. Cement production facilities are included within the categories of facilities required to obtain permits, provided that their GHG emissions exceed the thresholds in the tailoring rule. The PSD program requires new major sources of regulated pollutants and major modifications at existing major sources to secure pre-construction permits that establish, among other things, limits on pollutants based on Best Available Control Technology (“BACT”).
According to EPA’s rules, stationary sources, such as cement manufacturing, which are already regulated under the PSD program for non-GHG pollutants, need to apply for a PSD permit for any GHG emissions increases above 75,000 tons/year of carbon dioxide equivalent (“CO2E”). Therefore, new cement plants and existing plants undergoing modification which are major sources for non-GHG pollutants regulated under the CAA need to acquire a PSD permit for construction or modification activities that increase CO2E by 75,000 or more tons/year, and would have to determine and install BACT controls for those emissions. Furthermore, any new source that emits 100,000 tons/year of CO2E or any existing source that emits 100,000 tons/year of CO2E and undergoes modifications that would increase CO2E emissions by at least 75,000 tons/year, must comply with PSD obligations. Complying with these PSD permitting requirements can involve significant costs and delay. As of December 31, 2018, the costs of future GHG-related regulation of our facilities through these efforts or others could have a material economic impact on our U.S. operations and the U.S. cement manufacturing industry, which in turn could have a material adverse impact in our results of operations, liquidity and financial condition.
With respect to state efforts to address climate change, in 2006, the State of California adopted the Global Warming Solutions Act (Assembly Bill 32 or “AB32”) setting into law a goal to reduce the State’s carbon dioxide emissions to 1990 levels by 2020. As part of the measures derived from AB32, the California Air Resources Board (“CARB”) developed a cap-and-trade program, enforced from 2013, that covers most industrial sources of greenhouse gas emissions in the State, including cement production facilities. The program involves allocating a number of allowances free of charge to covered installations, which must subsequently surrender back to the regulator a number of allowances or qualified offset credits matching their verified emissions during the compliance period. Based on the free allowances received, our Victorville cement plant met all of its compliance obligations for the second compliance period (2015 to 2017) without a material impact on its operating costs; and, as of December 31, 2018, it is expected to meet all of its compliance obligations for the third compliance period (2018 to 2020) without a material impact on its operating costs. Furthermore, as of December 31, 2018, for our operations in California, we are actively pursuing initiatives to substitute fossil fuels for lower carbon fuels, improve our energy efficiency and utilize renewable power in an effort to economically reduce our direct and indirect GHG emission intensities. However, even with these ongoing efforts and the expected distribution of free allowances, as of December 31, 2018, the measures corresponding to future compliance periods of AB32, which may eventually require us to purchase emission allowances at increased prices due to their reduced availability, and the resulting overall costs of complying with a cap-and-trade program, may have a negative impact on our operations in California, which in turn could have an adverse impact on our results of operations, liquidity and financial condition.
In 2007, CARB approved a regulation that requires California equipment owners/operators to reduce diesel particulate and nitrogen oxide emissions from in-use off-road diesel equipment and to meet progressively more restrictive emission targets. In 2008, CARB approved a similar regulation for in-use on-road diesel equipment. The emission targets requires us to retrofit our California-based equipment with diesel emission control devices or replace equipment with new engine technology in accordance with certain deadlines. As of December 31, 2018, compliance with the CARB regulations has resulted in equipment related expenses or capital investments, including overhauling engines and purchases of new equipment directly related to the CARB regulations, in excess of U.S.$32.45 million. As of December 31, 2018, we believe that we may continue to incur substantial expenditures to comply with these requirements.
142
Europe
General overview of European Union (“EU”) industrial regulation
As of December 31, 2018, the EU legal system operates in a way different to federal systems. The EU legal regime is referred to as supra-national law, it sits above the legal systems of the different EU Member States, which retain their independence subject to tight oversight from EU institutions, especially the Court of Justice, the European Commission, and the European Parliament. As such, EU law operates (in its many fields of application, including industrial regulation) in order to control and authoritatively interpret the legislation and implementation of law (EU and domestic) in those Member States. One of the key manifestations of this supra-national control are the inter-related doctrines of the supremacy of EU law and of conforming interpretation. Essentially, where an area of legal control in a Member State has its origin in an EU Directive, then the Member States must transpose the Directive fully and effectively into their domestic law and every organ of the Member State, including its regulators and its courts, must interpret (and if necessary change) domestic law in order to conform with the objectives and the letter of the relevant EU Directive. This is of relevance to the cement sector since almost every aspect of its environmental regulation has its origins in EU legislation.
In the EU, the cement sector is subject to a range of environmental laws at EU and national EU member state (“Member State”) levels. These laws can be broadly categorized as: (1) primary and direct controls placed upon their main operational activities; and (2) more general legal regimes which protect different aspects of the environment across many sectors.
The primary examples of the first kind of control are the various laws governing the specific operational activities of the sector, through stringent permitting and emissions controls, which are further explained below. Examples of the second, more general, legal controls are the EU Water Framework Directive (2000/60/EC) and the EU Waste Framework Directive (2008/98/EC) which impose various obligations in relation to the protection of surface and underground water environments and the recovery, disposal and overall management of waste respectively. In practice, even these more general laws indirectly impact our industry through permitting emissions control systems.
EU Industrial Emissions Permits and Emissions Controls
In the EU, the primary legal environmental controls applied to cement plants have been those EU Directives which control operational activities and emissions from those activities. Until recently, these controls were primarily derived from two EU Directives: (1) the so-called “IPPC Directives” (as described below) and (2) the Waste Incineration Directive (as defined below). On January 6, 2011, the Industrial Emissions Directive (2010/75/EU) (“IED”) came into force. The IED recasts seven pieces of existing legislation into a single coherent legislative instrument, including the IPPC Directives and the Waste Incineration Directive, both of which it repeals. With some exceptions, the IED retains the essential substance of the earlier Directives.
The primary EU legislative control over the sector (until the transition between 2010-2014 of the IED) was the Directive on Integrated Pollution Prevention and Control (2008/1/EC) (“IPPC Directive”), which was repealed by the IED. The 2008 version of this Directive was in fact an update and consolidation of an earlier Directive first promulgated in 1996. Since 1996, these IPPC Directives have adopted an integrated approach to regulation of various sectors of industrial plant, including cement, by taking into account and controlling/regulating the whole environmental performance of the plant. They required cement works to have a permit which, except until recently in England and Wales (where it is now known as an “environmental permit”), and still in some other states, continues to be referred to as an “IPPC Permit.” These permits contain emission limit values and other conditions based on the application of a legal and technical concept called “best available techniques” (“BAT”).
The concept of BAT is central to the system, and effectively imposes a legal obligation on plant operators to use and apply the best available techniques (as they develop from time to time) in order to prevent or, where this is not practicable, minimize emissions of pollutants likely to be emitted in significant quantities from the plant to air, water or land. Emission limit values, parameters or equivalent technical measures must be based on the best available techniques, without prescribing the use of one specific technique or technology and taking into consideration the technical characteristics of the installation concerned, its geographical location and local environmental conditions. In all cases the permit conditions must ensure a high level of protection for the environment as a whole.
143
Permit conditions also have to address energy efficiency, waste minimization, prevention of accidental emissions and site restoration. To assist the permitting authorities and companies in determining the BAT, the European Commission has organized an exchange of information between experts from the Member States, industry and environmental organizations. This resulted in the adoption and publication by the European IPPC Bureau (part of the European Commission) of BAT Reference Documents (“BREFs”) for the industry sectors covered by the IPPC Directive. A key element of the BREFs are the conclusions on BAT (“BAT conclusions”) which are used as a reference for setting permit conditions. All of these IPPC Directive requirements have been followed through (and in some respects tightened) by the IED.
The second earlier Directive, which was applied in direct control of cement operations, was the EU Waste Incineration Directive (2000/76/EC) (“Waste Incineration Directive”) which regulated those parts of the cement operation that used recovered waste materials as substitute fuels in cement kilns. Its aim was to prevent or limit, as far as practicable, negative effects on the environment, in particular pollution by emissions in air, soil, surface water and groundwater and the resulting risks to human health, from incineration and co-incineration plants.
Cement and lime kilns as a primary or secondary source of fuel fall within the definition of “co-incineration plants.” The Waste Incineration Directive sought to achieve its aim by setting and maintaining stringent operational conditions and technical requirements, as well as emission limit values for a range of pollutants including dust, nitrogen oxides, sulfur dioxide, hydrogen chloride, heavy metals and dioxins. Again, the essential substance of the Waste Incineration Directive has been followed through into the IED, which repealed it together with the IPPC Directive.
The IED has applied to new industrial installations since January 7, 2013 and to existing industrial installations (other than large combustion plants with a rated thermal input equal to or greater than 50 MW) since January 7, 2014. Under the IED, operators of industrial installations, including cement plants, are required to obtain an integrated permit from the relevant permitting authority in the Member States. As with the IPPC Directive, permit conditions, including emission limit values, must be based on BAT and, as of December 31, 2018, a total of 21 BREFs of the existing 32 are being rewritten or revised for the IED. However, there is an important difference between the IPPC Directive and the IED. Under the IPPC Directive, the BREFs were considered as guidance only. This is not the case under the IED. Where BAT conclusions specify emission levels, permitting authorities are required to set emission limit values that do not exceed these levels. They may derogate from this requirement only where the costs associated with the achievement of the emission levels associated with the BAT disproportionately outweigh the environmental benefits due to the geographical location, the local environmental conditions or the technical characteristics of the installation concerned. The permitting authorities must document the reasons for the derogation from the emission limit values in the permit, including the result of the cost-benefit assessment. In April 2013, pursuant to European Commission Decision No. 2013/163/EU, the European Commission published new BAT conclusions under the IED for Production of Cement, Lime and Magnesium Oxide, together with specific emission levels. This document sets out an extensive list of technical requirements for most aspects of the cement manufacture process in the EU, with a view to prevention and minimization of all polluting emissions. It is a new requirement under the IED that permitting authorities must review and, if necessary, update permit conditions within four years of the European Commission publishing decisions on BAT conclusions for a particular activity. The European Commission describes review of the BREFs as a continuing process due to ongoing technological advances so updates may be expected. As of December 31, 2018, this has the potential to require our operations in Europe to be adapted to conform to the latest BAT, which in turn could impact our operations.
As of December 31, 2018, we believe that our operations in Member States will be impacted given the change in regulatory approach heralded by the legislation, its ongoing revision and the fact that it will be key to permitting of the cement industry in the EU. As of December 31, 2018, we are not able to assess the degree of impact the requirements that come into effect under the IED will have on our operations in Member States.
144
Croatia
As a result of a lawsuit filed by the city of Kastela against the Ministry of Environment of the Republic of Croatia, the IPPC Permit issued on behalf of CEMEX Croatia by the Ministry of Environment was revoked on July 6, 2015 by a final and non-appealable judgment of a first instance court in Split, Croatia. The judgment required the Ministry of Environment to repeat the procedure for the issuance of a new IPPC Permit. On November 23, 2015, the Ministry of Environment issued a new IPPC Permit, which has been challenged by the city of Kastela. On January 7, 2016, CEMEX Croatia received the claim and replied to it in due time. The Ministry of Environment also replied to the claim. At a court hearing held on September 14, 2016, the litigation proceedings concluded. On November 18, 2016, the administrative court in Split, Croatia notified CEMEX Croatia that the decision regarding the IPPC Permit was annulled and the matter was remanded to the Ministry of Environment in order to repeat the procedure. On December 2, 2016, CEMEX Croatia and the Ministry of Environment filed an appeal against such judgment. As of December 31, 2018, CEMEX Croatia was awaiting the decision on the appeal. If the IPPC Permit is conclusively annulled, we do not believe that such judgment would have a material adverse impact on our results of operations, liquidity and financial condition.
In addition, in accordance with Article 21(3) of the IED, within four years of BAT conclusion publications, the competent authority (the regulator issuing the permit for an industrial installation) is to reconsider and, if necessary, update all permit conditions and ensure that the installation complies with such permit conditions. Accordingly, on January 3, 2017, the Ministry of Environment invited CEMEX Croatia to submit relevant expert opinions in order to update the existing permit conditions and ensure compliance with permit conditions. On March 20, 2017, CEMEX Croatia submitted expert opinions to the Ministry of Environment. As of December 31, 2018, the hearing to determine whether the installation is in compliance with all permit conditions was opened to the public by the Ministry of Environment on June 29, 2018 and was completed 30 days later. If the installation is determined to be in compliance, a permit would be issued within approximately six months of completion of the hearing. In the meantime, CEMEX Croatia applied for a new permit in accordance with the IED. Should the IPPC Permit be finally annulled, as of December 31, 2018, we do not believe that the judgment would have a material adverse impact on our results of operations, liquidity and financial condition.
EU Emissions Trading
In 1997, as part of the United Nations Framework Convention on Climate Change, the Kyoto Protocol was adopted to limit and reduce GHG emissions. The Kyoto Protocol set legally binding emission reduction targets for 37 industrialized countries and the EU. Under the Kyoto Protocol, industrialized countries agreed to reduce their collective GHG emissions by 5% against 1990 levels over the five-year period 2008-2012; future mandatory targets were expected to be established for commitment periods after 2012. To compensate for the sting of binding targets, the Kyoto Protocol allows three “flexibility” mechanisms to be used by parties in meeting their emission limitation commitments: the Clean Development Mechanism (“CDM”), Joint Implementation (“JI”) and International Emissions Trading.
In 2012, at the United Nations Climate Change Conference in Doha, Qatar, the Doha Amendment to the Kyoto Protocol was adopted. Certain parties, including the UK and the EU, committed to reduce GHG emissions by at least 18% below 1990 levels in the eight-year period from 2013 to 2020.
Our operations in the United Kingdom, Spain, Germany, Latvia, Poland, Croatia (since 2013) and the Czech Republic, are subject to binding caps on CO2 emissions imposed pursuant to the EU’s emissions trading system (“ETS”), a “cap and trade” system that was established in 2003 by Directive 2003/87/EC to implement the Kyoto Protocol. Under the ETS, a cap or limit is set on the total amount of CO2 emissions that can be emitted by the power plants, energy-intensive installations (including cement plants) and commercial airlines that are covered by the system. The cap is reduced over time, so that the total amount of emissions will decrease. Within the cap, installation operators receive or buy emission allowances. These allowances are tradable so as to enable operators that manage to reduce their emissions to sell their excess allowances to operators that are not reaching their emissions objectives. After the end of each year, an operator must surrender enough carbon allowances to cover all its emissions. In general, failure to meet the emissions caps is subject to significant monetary penalties of EUR 100 for each ton of carbon dioxide equivalent emitted by the installation for which the operator has not surrendered allowances.
145
In addition to carbon allowances, the ETS also allows the use of Kyoto Protocol units: the Emission Reduction Unit, representing a metric ton of carbon saved by a project under the JI mechanism, and the Certified Emission Reduction (“CER”) under the CDM. The ETS recognizes these units as equivalent to its carbon allowances and allows them to be used by operators for compliance up to a certain limit to offset their carbon emissions in the EU. As of December 31, 2018, we have registered 19 CDM projects with a total potential to, according to our estimates, reduce approximately 2.44 million tons of CO2e emissions per year. The corresponding CERs from these projects could be used for internal purposes or sold to third parties. Croatia, as a late entrant due to when it joined the EU, has a right to use only 4.5% of its verified carbon emissions in relation to other EU ETS members which have a right to use up to 11% of their free allocation of EU allowances.
The ETS consists of four trading phases: Phase I which lasted from January 1, 2005 to December 31, 2007, Phase II, which lasted from January 1, 2007 to December 31, 2012, and was intended to meet commitments under the Kyoto First Commitment Period, Phase III which commenced on January 1, 2013 and will end on December 31, 2020 and Phase IV which will commence on January 1, 2021 and end on December 31, 2030. For Phases III and IV of the ETS there is also a cap on nitrous oxide and perfluorocarbons emissions. Prior to the commencement of each of ETS Phases I and II, each Member State was responsible for publishing its National Allocation Plan (“NAP”), a document which sets out a national cap on the total amount of carbon emissions by all installations during each relevant trading phase and the methodology by which the cap would be allocated to the different sectors in the ETS and their respective installations. Each Member State’s cap contributed to an overall EU cap on emissions, where one carbon allowance must be surrendered to account for one metric ton of carbon emitted. The carbon allowances were mostly distributed for free by each Member State to its ETS installations, although some Member States also used a fraction of their material cap for auctioning, mainly to power generators. Under ETS Phase III, however, the system of NAPs was replaced by a single EU-wide, top-down, cap on CO2 emissions, with allocation for all installations made according to harmonized EU rules and set out in each Member State’s National Implementation Measures (“NIM”). Additional restrictions have been introduced on the extent to which Kyoto Protocol units, such as CERs, can be used to offset EU carbon emissions, and auctioning, not free allocation, has become the default method for distributing allowances. For those allowances that are still given away free, as discussed below, harmonized rules apply based on EU-wide benchmarks of emissions performance.
EU policymakers see the free allocation of allowances as a principal way to reduce the risk of carbon leakage—that is, the risk that energy-intensive industries, facing higher costs because of the ETS, will move their facilities beyond the EU’s borders to countries that do not have climate change controls, thus resulting in a leakage of CO2 emissions without any environmental benefits. In 2009, a list of ETS sectors deemed to be at significant risk of carbon leakage was formally adopted by the European Commission, following agreement by Member States and the European Parliament. The list which was valid from 2010 to 2014 included the cement production sector, on the basis that the additional costs imposed by the ETS would lead to a 30% or more increase in production costs as a proportion of the “gross value added.” A decision on the list of sectors deemed to be at significant risk of carbon leakage for the period 2015-2019 was adopted by the European Commission on October 29, 2014 and the cement production sector was selected again. Sectors classified as deemed to be at significant risk of carbon leakage will continue to receive 100% of their benchmark allocation of allowances free of charge during Phase III, adjusted by a cross-sectoral correction factor that is being applied uniformly upon all participating facilities in Europe in order to reduce the amount of free allocation that each installation so that the total sum does not exceed the authorized EU-wide cap for free allocation. By contrast, sectors that are not considered at risk of carbon leakage received 80% of their benchmark allowances for free in 2013, declining to 30% by 2020. Sectors classified as deemed to be at significant risk of carbon leakage are also expected to continue to receive 100% of their benchmark allocation of allowances free of charge during Phase IV.
On April 27, 2011, the European Commission adopted Decision 2011/278/EU that states the rules, including the benchmarks of greenhouse gas emissions performance, to be used by the Member States in calculating the number of allowances to be annually allocated for free to industrial sectors (such as cement) that are deemed to be exposed to the risk of “carbon leakage.” The number of allowances to be allocated to installations for free will be based on a combination of historic activity levels at that installation and an EU benchmark of carbon efficiency for the production of a particular product—for example, clinker. An installation’s historic activity level is calculated by taking the median of its annual production levels during the baseline period, either 2005 to 2008 or, where historic activity levels are higher, 2009/10. The product benchmark is based on the average carbon emissions of the top 10% most “carbon efficient” EU installations for a particular product during 2007/8, where carbon efficiency is measured
146
by carbon intensity or carbon emission per metric ton of product. Preliminary allocation calculations based on the rules were carried out by each Member State and included in a NIM table which was sent for scrutiny to the European Commission. On September 5, 2013, the European Commission adopted Decision 2013/448/EU which approved the NIMs submitted by most Member States and which sets the annual cross-sectoral correction factors for the period 2013-2020. The cross-sectoral correction figure will be used to adjust the levels of product benchmarks used to calculate the free allocation of allowances to each installation. This is to ensure that the total amount handed out for free does not exceed the maximum set in Directive 2003/87/EC. Each Member State is required to adjust its national allocation table of free allowances each year and submit this for approval to the European Commission prior to issuing allowances. The application of this cross-sectoral correction factor has resulted in an important decrease in the quantity of allowances that our ETS-participant operations have received for free in the 2013-2020 period and expect to receive for free in the 2021-2030 period.
On February 26, 2014, the European Commission adopted a decision on national allocation allowances for the last group of Member States including Croatia, which was granted 5.56 million of free allowances. Since this time, a regularly updated allocation table showing the number of allowances that have been allocated per Member State is published on the European Commission’s website. Based on the European Commission approved NIMs that were published in the first quarter of 2014 for Phase III, as of December 31, 2018, we expect that the aggregate amount of allowances that will be annually allocated for free to CEMEX in the remainder of Phase III of the ETS will be sufficient to operate. An important factor in providing such assurance is the European Commission Decision 2014/746/EU (which took effect on January 1, 2015) which, as mentioned, included the manufacture of cement as an industry at significant risk of carbon leakage meaning that the industry will continue to receive 100% of its benchmark allocation of allowances free of charge during Phase III. Although the European Council has indicated that the free allocation of allowances to sectors at significant risk of carbon leakage will continue beyond Phase III into Phase IV, a future decision that the cement industry should no longer be regarded as being at significant risk of carbon leakage could have a material impact on our operations and our results of operations, liquidity and financial condition.
An installation can only receive its full allocation of free allowances in Phase III and Phase IV if it is deemed to have not partially ceased under the “partial cessation rule” of the ETS. Partial cessation applies where a sub-installation which contributes at least 30% of the installation’s final annual amount of emissions allocated, or contributes to more than 50,000 allowances, reduces its activity level by at least 50% of its historic activity levels. If activity levels are reduced to between 50% and 75% of the historic activity level, the amount of free carbon allowances the sub-installation will receive will reduce by half in the following year; if activity levels are reduced by 75% to 90% compared to historic activity levels, the amount of free carbon allowances the sub-installation will receive will reduce by 75% in the following year; and if activity levels are reduced by 90% or more compared to historic activity levels, no allowances shall be allocated free of charge the following year with respect to the sub-installation concerned. This represents a change from ETS Phase II, in which the rules for partial cessation were defined by each Member State’s NAP and often did not result in any reduction in the level of free allocation, but an installation was no longer entitled to a free allocation from the following year if it had permanently ceased operating. The new rules are therefore more stringent, and to the extent that they result in our plants foregoing free carbon allowances, as of December 31, 2018, they could represent a significant loss of revenue to us, since carbon allowances are also tradable, which in turn could have a material adverse impact on our results of operations, liquidity and financial condition.
Despite having sold a substantial amount of allowances during Phase II of the ETS, as mentioned, as of December 31, 2018, we believe that the aggregate amount of allowances that will be annually allocated for free to CEMEX in the remainder of Phase III of the ETS (2013-2020) will be sufficient to operate. This assessment stems from various factors, notably our efforts to reduce emissions per unit of clinker produced, the stream of offset credits coming from our internal portfolio of CDM projects and our long position in the initial years of Phase III of the ETS. We are taking measures intended to minimize our exposure to this market, while continuing to supply our products to our customers. As of December 31, 2018, it is not possible to predict with certainty at this stage how CEMEX will be affected by changes to the EU ETS in Phase IV. Directive 2003/87/EC has been amended by Directive 2018/410/EU which reduces the EU-wide overall cap on emission allowances by 2.2% every year from 2021, requires that benchmarks are updated based on recent data and replaces the “historic activity level” with a more dynamic allocation based on recent production. These modifications suggest that there may be fewer allowances available with respect to our operations in the future. As of December 31, 2018, we expect that the aggregate amount of allowances that will be annually allocated for free to CEMEX in Phase IV would not be sufficient for our operations. Therefore, CEMEX would require to purchase emission allowances at some point in time during Phase IV.
147
Great Britain Landfills
In Great Britain, future expenditure on closed and current landfill sites has been assessed and quantified over the period in which the sites are considered to have the potential to cause environmental harm, generally consistent with the regulatory view of up to 60 years from the date of closure. The assessed expenditure relates to the costs of monitoring the sites and the installation, repair and renewal of environmental infrastructure. The costs have been quantified on a net present value basis in the amount of £131,258,041 (approximately U.S.$167.37 million as of December 31, 2018, based on an exchange rate of £0.7843 to U.S.$1.00) as of December 31, 2018, and we made an accounting provision for this amount.
Colombian Water Use Litigation
On June 5, 2010, the District of Bogotá’s Environmental Secretary (Secretaría Distrital de Ambiente de Bogotá) (the “Environmental Secretary”) issued a temporary injunction suspending all mining activities at CEMEX Colombia’s El Tunjuelo quarry, located in Bogotá, Colombia. As part of the temporary injunction, Holcim Colombia and Fundación San Antonio (local aggregates producers that also have mining activities located in the same area as the El Tunjuelo quarry) were ordered to suspend mining activities in that area. The Environmental Secretary alleged that during the past 60 years, CEMEX Colombia and the other companies illegally changed the course of the Tunjuelo River, used the percolating waters without permission and improperly used the edge of the river for mining activities. In connection with the temporary injunction, in June 2010, the Environmental Secretary initiated proceedings to impose fines against CEMEX Colombia.
CEMEX Colombia requested that the temporary injunction be revoked, arguing that its mining activities are supported by all authorizations required pursuant to the applicable environmental laws and that all the environmental impact statements submitted by CEMEX Colombia have been reviewed and authorized by the Ministry of Environment and Sustainable Development (Ministerio de Ambiente y Desarrollo Sostenible). On June 11, 2010, the local authorities in Bogotá, in compliance with the Environmental Secretary’s decision, sealed off the mine to machinery and prohibited the extraction of CEMEX Colombia’s aggregates inventory. By means of Resolution No. 02167 dated July 11, 2018 (amended by means of Resolution No. 2193 dated July 12, 2018) issued by the Environmental Secretary, a fine in the amount of $1,234,000,000 Colombian Pesos (approximately U.S.$379,721.52 as of December 31, 2018, based on an exchange rate of 3,249.75 Colombian Pesos to U.S.$1.00) was imposed on CEMEX Colombia for using subterranean waters of the Tunjuelo River without having the corresponding concession or permit. No damage to the Tunjuelo River was caused. CEMEX Colombia was expressly exonerated of carrying out harmful activities against the Tunjuelo River because no negligent or willful misconduct was proven against the company. CEMEX Colombia paid the aforementioned fine on August 1, 2018 and, as such, this proceeding has ended.
Philippines Environmental Class Action
On September 20, 2018, a landslide occurred in Sitio Sindulan, Barangay Tina-an, Naga City, Cebu, Philippines (the “Landslide”), a site located within an area covered by mining rights of APO Land & Quarry Corporation (“ALQC”).
CEMEX, S.A.B. de C.V. is an indirect minority shareholder in ALQC, the principal raw material supplier of one of our subsidiaries in the Philippines, APO.
On November 19, 2018, CHP and APO were served summonses concerning an environmental class action lawsuit filed by 40 individuals and one legal entity (on behalf of 8,000 individuals allegedly affected by the Landslide) at the Regional Trial Court of Talisay, Cebu, against CHP, ALQC, APO, the Mines and Geosciences
148
Bureau of the Department of Environment and Natural Resources, the City Government of Naga, and the Province of Cebu, for “Restitution of Damage of the Natural and Human Environment, Application for the Issuance of Environmental Protection Order against Quarry Operations in Cebu Island with Prayer for Temporary Protection Order, Writ of Continuing Mandamus for Determination of the Carrying Capacity of Cebu Island and Rehabilitation and Restoration of the Damaged Ecosystems”.
In the complaint, among other allegations, plaintiffs claim that the Landslide occurred as a result of the defendants’ gross negligence, and seek, among other relief, (a) monetary damages in the amount of approximately 4.3 billion Philippine Pesos (approximately U.S.$81.78 million as of December 31, 2018, based on an exchange rate of 52.58 Philippine Pesos to U.S.$1.00) , (b) the establishment of a 500 million Philippine Pesos (approximately U.S.$9.51 million as of December 31, 2018, based on an exchange rate of 52.58 Philippine Pesos to U.S.$1.00) rehabilitation fund, and (c) the issuance of a temporary environment protection order against ALQC aiming to prevent ALQC from performing further quarrying activities while the case is still pending.
In the event a final adverse resolution is issued in this matter, plaintiffs will have the option to proceed against any one of ALQC, APO or CHP for satisfaction of the entirety of the potential judgement award, without the need to proceed against any other private defendant beforehand. Thus, ALQC’s, APO’s or CHP’s assets alone could be exposed to execution proceedings. As of December 31, 2018, because of the status and preliminary stage of the lawsuit, considering all possible defenses available, we cannot assess with certainty the likelihood of an adverse result in this lawsuit, and, in turn, we cannot assess if a final adverse resolution, if any, would have a material adverse impact on our results of operations, liquidity and financial condition.
Tariffs
The following is a discussion of tariffs on imported cement in some of the countries and regions in which we operate.
Mexico
Mexican tariffs on imported goods vary by product and have historically been as high as 100%. Over the years, import tariffs have been substantially reduced and currently range from none at all for raw materials to over 20% for finished products. As a result of NAFTA, starting January 1, 1998, the tariff on cement imported into Mexico from the United States or Canada was eliminated. As of December 31, 2018, Mexico, the U.S. and Canada have reached an agreement with respect to NAFTA’s renegotiation which would not have any impact on tariffs on cement imported from the United States or Canada into Mexico. The new agreement signed on November 30, 2018, which is to be called the United States-Mexico-Canada Agreement (USMCA), can come into effect following Congressional ratification. Meanwhile, NAFTA will remain in effect.
While the lack of existence or reduction in tariffs could lead to increased competition from imports in the markets in Mexico in which we operate, it is possible that other factors, such as the cost of transportation incurred from most producers outside Mexico to central Mexico, traditionally the region of highest demand in Mexico, could be seen as a barrier to enter certain of the regions in Mexico in which we operate.
United States
Cement imported into the United States from Cuba and North Korea is subject to custom duties depending on the specific type of cement. Imports into the United States from Cuba and North Korea are generally prohibited due to the U.S. import/export controls and economic sanctions. In order to import cement and other products into the United States from Cuba or North Korea, an importer would be required to obtain a license from the U.S. government or otherwise establish the existence of a license exception.
On September 18, 2018, the United States Trade Representative released a list of approximately $200 billion worth of Chinese imports that were to be subject to additional tariffs. This list included cement, clinker, slag cement, and granulated slag from the manufacture of iron or steel. These additional tariffs were effective starting September 24, 2018 and initially were in the amount of 10%. The U.S. was expected to increase the additional tariffs
149
to 25% starting January 1, 2019, but this increase was postponed for 90 days starting on December 1, 2018, to allow time for the United States and China to negotiate their trade disputes. Accordingly, as of December 31, 2018, absent a resolution of the trade disputes, the rate of additional duty for the products covered by the September 2018 tariff action will increase to 25% on March 2, 2019. Should that occur, the U.S. is expected to establish a product exclusion process.
Cement imports from countries other than Cuba, China and North Korea into the United States are currently duty free, however, certain individuals and entities on U.S. government lists of specially designated nationals and prohibited parties, may be subject to U.S. import/export controls and other sanctions that prohibit transactions (including import transactions) with such persons without a license.
Europe
Member countries of the EU are subject to the uniform EU commercial policy. There is no tariff on cement imported into a country that is a member of the EU from another member country or on cement exported from an EU country to another member country. As of December 31, 2018, for cement imported into a member country from a non-member country, the tariff was 1.7% of the customs value. Any country with preferential treatment with the EU is subject to the same tariffs as members of the EU. Most Eastern European producers exporting cement into EU countries currently pay no tariff.
Tax Matters
Mexico
In November 2009, the Mexican National Congress (Congreso de la Unión) approved a general tax reform, effective as of January 1, 2010 (the “2010 Tax Reform”). Specifically, the 2010 Tax Reform included changes to the tax consolidation regime that required CEMEX, among others, to determine and retroactively pay taxes at a current rate on items in past years that were eliminated in consolidation or that reduced consolidated taxable income (“Additional Consolidated Taxes”). The 2010 Tax Reform required CEMEX to pay taxes on certain previously exempted intercompany dividends, certain other special tax items and operating losses generated by members of the consolidated tax group not recovered by the individual company generating such losses within the succeeding ten-year period. The 2010 Tax Reform also increased the statutory income tax rate from 28% to 30% for the years 2010 to 2012, then lowered it to 29% for 2013 and 28% for 2014 and future years. However, in December of 2012, the Federal Revenue Law for the fiscal year of 2013 (Ley de Ingresos de la Federación para el Ejercicio Fiscal de 2019), had established that the statutory income tax rate would remain at 30% in 2013, and thereafter lowered to 29% for 2014 and 28% for 2015 and future years. As per the tax reforms enacted in 2014 and effective as of January 1 2014, the statutory income tax will remain at 30%.
For the 2010 fiscal year, CEMEX was required to pay (at the new 30% tax rate) 25% of the Additional Consolidated Taxes for the period between 1999 and 2004, with the remaining 75% payable as follows: 25% in 2011, 20% in 2012, 15% in 2013 and 15% in 2014. Additional Consolidated Taxes arising after the 2004 tax year are taken into account in the sixth fiscal year after such year and are payable over the succeeding five years in the same proportions (25%, 25%, 20%, 15% and 15%). Applicable taxes payable as a result of this tax reform are increased by inflation adjustments as required by the Mexican Income Tax Law (Ley del Impuesto Sobre la Renta). In connection with these changes in the tax consolidation regime in Mexico, as of December 31, 2009, we recognized a liability of approximately Ps10.5 billion (approximately U.S.$534.35 million as of December 31, 2018, based on an exchange rate of Ps19.65 to U.S.$1.00), of which approximately Ps8.2 billion (approximately U.S.$417.30 million as of December 31, 2018, based on an exchange rate of Ps19.65 to U.S.$1.00) was recognized under “Other non-current assets” in connection with the net liability recognized under the new tax law and that we expect to realize in connection with the payment of this tax liability, and approximately Ps2.2 billion (approximately U.S.$111.96 million as of December 31, 2018, based on an exchange rate of Ps19.65 to U.S.$1.00) was recognized against “Retained earnings” upon adoption of IFRS according to the new law, related to: (a) the difference between the sum of the equity of the controlled entities for tax purposes and the equity for tax purposes of the consolidated entity, (b) dividends from the controlled entities for tax purposes to CEMEX, S.A.B. de C.V., and (c) other transactions among the companies included in the tax consolidation group that represented the transfer of resources within such group.
150
On June 30, 2010, CEMEX paid approximately Ps325 million (approximately U.S.$16.54 million as of December 31, 2018, based on an exchange rate of Ps19.65 to U.S.$1.00) of Additional Consolidated Taxes. This first payment represented 25% of the Additional Consolidated Taxes for the period that includes from 1999 to 2004. On March 31, 2011, CEMEX made a second payment of approximately Ps506 million (approximately U.S.$25.75 million as of December 31, 2018, based on an exchange rate of Ps19.65 to U.S.$1.00). This second payment, together with the prior payment, represented 50% of the Additional Consolidated Taxes for the period that includes from 1999 to 2004, and also included the first payment of 25% of the Additional Consolidated Taxes for the period that corresponds to 2005. On March 30, 2012, CEMEX paid Ps698 million (approximately U.S.$35.52 million as of December 31, 2018, based on an exchange rate of Ps19.65 to U.S.$1.00). This third payment, together with the two prior payments, represented 70% of the Additional Consolidated Taxes for the period that includes from 1999 to 2004, 50% of the Additional Consolidated Taxes for the period that corresponds to 2005 and it also included the first payment of 25% of the Additional Consolidated Taxes for the period that corresponds to 2006. On March 27, 2013, CEMEX paid Ps2 billion (approximately U.S.$101.78 million as of December 31, 2018, based on an exchange rate of Ps19.65 to U.S.$1.00). This fourth payment, together with the three prior payments, represented 85% of the Additional Consolidated Taxes for the period that includes from 1999 to 2004, 70% of the Additional Consolidated Taxes for the period that corresponds to 2005, 50% of the Additional Consolidated Taxes for the period that corresponds to 2006 and 25% of the Additional Consolidated Taxes for the period that corresponds to 2007. On March 31, 2014, CEMEX paid Ps2 billion (approximately U.S.$101.78 million as of December 31, 2018, based on an exchange rate of Ps19.65 to U.S.$1.00). This fifth payment, together with the four prior payments, represented 100% of the Additional Consolidated Taxes for the period that includes from 1999 to 2004, 85% of the Additional Consolidated Taxes for the period that corresponds to 2005, 70% of the Additional Consolidated Taxes for the period that corresponds to 2006 and 50% of the Additional Consolidated Taxes for the period that corresponds to 2007. On March 31, 2015, CEMEX paid Ps1.5 billion (approximately U.S.$76.34 million as of December 31, 2018, based on an exchange rate of Ps19.65 to U.S.$1.00). This sixth payment, together with the five prior payments, represented 100% of the Additional Consolidated Taxes for the period that includes from 1999 to 2004, 100% of the Additional Consolidated Taxes for the period that corresponds to 2005, 85% of the Additional Consolidated Taxes for the period that corresponds to 2006 and 70% of the Additional Consolidated Taxes for the period that corresponds to 2007. On March 31, 2016, CEMEX paid Ps119 million (approximately U.S.$6.06 million as of December 31, 2018, based on an exchange rate of Ps19.65 to U.S.$1.00). This seventh payment, together with the six prior payments, represented 100% of the Additional Consolidated Taxes for the period that includes from 1999 to 2004, 100% of the Additional Consolidated Taxes for the period that corresponds to 2005, 100% of the Additional Consolidated Taxes for the period that corresponds to 2006 and 85% of the Additional Consolidated Taxes for the period that corresponds to 2007. On March 31, 2017, CEMEX paid Ps38 million (approximately U.S.$1.93 million as of December 31, 2018, based on an exchange rate of Ps19.65 to U.S.$1.00). This eighth payment, together with the seven prior payments, represented 100% of the Additional Consolidated Taxes for the period from 1999 to 2004, 100% of the Additional Consolidated Taxes for the period that corresponds to 2005, 100% of the Additional Consolidated Taxes for the period that corresponds to 2006 and 100% of the Additional Consolidated Taxes for the period that corresponds to 2007. As of December 31, 2018, we have paid an aggregate amount of approximately Ps7.3 billion (approximately U.S.$371.50 million as of December 31, 2018, based on an exchange rate of Ps19.65 to U.S.$1.00) of Additional Consolidated Taxes.
In December 2010, pursuant to certain additional rules, the tax authorities granted the option to defer the calculation and payment of certain items included in the law in connection with the taxable amount for the difference between the sum of the equity of controlled entities for tax purposes and the equity of the consolidated entity for tax purposes. As a result, CEMEX reduced its estimated tax payable by approximately Ps2.9 billion (approximately U.S.$147.58 million as of December 31, 2018, based on an exchange rate of Ps19.65 to U.S.$1.00) against a credit to the income statement when the new tax enactment took place. In addition, after accounting for the following that took place in 2010: (a) cash payments, (b) income tax from subsidiaries paid to CEMEX, S.A.B. de C.V., and (c) other adjustments, the estimated tax payable for tax consolidation in Mexico amounted to approximately Ps10.1 billion (approximately U.S.$513.99 million as of December 31, 2018, based on an exchange rate of Ps19.65 to U.S.$1.00) as of December 31, 2010. Furthermore, after accounting for the following that took place in 2011: (a) cash payments, (b) income tax from subsidiaries paid to CEMEX, S.A.B. de C.V., and (c) other adjustments, the estimated tax payable for tax consolidation in Mexico increased to approximately Ps12.4 billion (approximately U.S.$631.04 million as of December 31, 2018, based on an exchange rate of Ps19.65 to U.S.$1.00) as of December 31, 2011. Additionally, after accounting for the following that took place in 2012: (a) cash payments, (b) income tax from the subsidiaries paid to CEMEX, S.A.B. de C.V., and (c) other adjustments, as of
151
December 31, 2012, the estimated tax payable for tax consolidation in Mexico increased to approximately Ps14.5 billion (approximately U.S.$737.91 million as of December 31, 2018, based on an exchange rate of Ps19.65 to U.S.$1.00). Furthermore, after accounting for the following that took place in 2013: (a) cash payments, (b) income tax from subsidiaries paid to CEMEX, S.A.B. de C.V., (c) other adjustments, and (d) effects of tax deconsolidation, as of December 31, 2013, the estimated tax payable for tax consolidation in Mexico increased to approximately Ps24.8 billion (approximately U.S.$1.26 billion as of December 31, 2018, based on an exchange rate of Ps19.65 to U.S.$1.00). Additionally, after accounting for the following that took place in 2014: (a) payments, the majority of which were in cash, and (b) other adjustments, as of December 31, 2014, the estimated tax payable for tax consolidation in Mexico decreased to approximately Ps21.4 billion (approximately U.S.$1.09 billion as of December 31, 2018, based on an exchange rate of Ps19.65 to U.S.$1.00). Additionally, after accounting for the following that took place in 2015 and after giving effect to the 2016 Tax Reform (as defined below), as a result of: (a) payments made during the period, the tax payable for tax consolidation in Mexico was decreased to approximately Ps16.2 billion (approximately U.S.$824.43 million as of December 31, 2018, based on an exchange rate of Ps19.65 to U.S.$1.00), which after the application of (b) different tax credits, and (c) assets for tax loss carryforwards worth, before discount, approximately Ps11.9 billion (approximately U.S.$605.60 million as of December 31, 2018, based on an exchange rate of Ps19.65 to U.S.$1.00), as of December 31, 2015, the estimated tax payable for tax consolidation in Mexico further decreased to approximately Ps3.9 billion (approximately U.S.$198.47 million as of December 31, 2018, based on an exchange rate of Ps19.65 to U.S.$1.00). Additionally, after accounting for the following that took place in 2016: (a) cash payments, and (b) other adjustments, as of December 31, 2016, the estimated tax payable for tax consolidation in Mexico decreased to approximately Ps3.2 billion (approximately U.S.$162.85 million as of December 31, 2018, based on an exchange rate of Ps19.65 to U.S.$1.00). Additionally, after accounting for the following that took place in 2017: (a) cash payments and (b) other adjustments, as of December 31, 2017, the estimated tax payable for tax consolidation in Mexico decreased to approximately Ps2.5 billion (approximately U.S.$127.23 million as of December 31, 2018, based on an exchange rate of Ps19.65 to U.S.$1.00). Additionally, after accounting for cash payments and other adjustments that took place in 2018, as of December 31, 2018, the estimated tax payable for tax consolidation in Mexico decreased to approximately Ps1.6 billion (approximately U.S.$81.42 million as of December 31, 2018, based on an exchange rate of Ps19.65 to U.S.$1.00).
In addition, as a result of the enactment of the new Income Tax Law (Ley del Impuesto Sobre la Renta) in Mexico approved in December 2013 and effective as of January 1, 2014 (the “2014 Tax Reform”), the statutory income tax rate for 2014 and beyond will remain at 30%, and the tax consolidation regime that was in effect up until December 31, 2013, was replaced prospectively by a new integration regime, to which CEMEX will not apply. In consequence, as of 2014, each company in Mexico will determine its income taxes based solely on its individual results, and a period of up to ten years has been established for the settlement of the liability for income taxes related to the tax consolidation regime accrued until December 31, 2013 (“Deconsolidation Taxes”). Additionally, the 2014 Tax Reform abolished the flat rate business tax law and the cash deposit tax.
On April 30, 2014, CEMEX paid Ps2.3 billion (approximately U.S.$117.05 million as of December 31, 2018, based on an exchange rate of Ps19.65 to U.S.$1.00). From this amount, Ps987 million (approximately U.S.$50.23 million as of December 31, 2018, based on an exchange rate of Ps19.65 to U.S.$1.00) were paid in cash and Ps1.3 billion (approximately U.S.$66.16 million as of December 31, 2018, based on an exchange rate of Ps19.65 to U.S.$1.00) were paid through the application of a tax credit, which represented approximately 25% of the Deconsolidation Taxes for the period that corresponded to the 2008 tax year. On April 30, 2015, CEMEX paid Ps3.7 billion (approximately U.S.$188.30 million as of December 31, 2018, based on an exchange rate of Ps19.65 to U.S.$1.00). From this amount, Ps2.3 billion (approximately U.S.$117.05 million as of December 31, 2018, based on an exchange rate of Ps19.65 to U.S.$1.00) were paid in cash and Ps1.4 billion (approximately U.S.$71.25 million as of December 31, 2018, based on an exchange rate of Ps19.65 to U.S.$1.00) were paid through the application of a tax credit. This second payment, together with the first payment, represented 50% of the Deconsolidation Taxes for the period that corresponds to the 2008 tax year and 25% of the Deconsolidation Taxes for the period that corresponds to the 2009 tax year. On April 29, 2016, CEMEX paid Ps728 million (approximately U.S.$37.05 million as of December 31, 2018, based on an exchange rate of Ps19.65 to U.S.$1.00). This third payment, together with the two prior payments, represented 70% of the Deconsolidation Taxes for the period that corresponds to the 2008 tax year, 50% of the Deconsolidation Taxes for the period that corresponds to the 2009 tax year and 25% of the Deconsolidation Taxes for the period that corresponds to the 2010 tax year. On April 28, 2017, CEMEX paid Ps924 million (approximately U.S.$47.02 million as of December 31, 2018, based on an exchange rate of Ps19.65 to
152
U.S.$1.00). This fourth payment, together with the three prior payments represented 85% of the Deconsolidation Taxes for the period that corresponds to the 2008 tax year, 70% of the Deconsolidation Taxes for the period that corresponds to the 2009 tax year, 50% of the Deconsolidation Taxes for the period that corresponds to the 2010 tax year and 25% of the Deconsolidation Taxes for the period that corresponds to the 2011 tax year. On April 30, 2018, CEMEX paid Ps970 million (approximately U.S.$49.36 million as of December 31, 2018, based on an exchange rate of Ps19.65 to U.S.$1.00). This fifth payment, together with the four prior payments represented 100% of the Deconsolidation Taxes for the period that corresponds to the 2008 tax year, 85% of the Deconsolidation Taxes for the period that corresponds to the 2009 tax year, 70% of the Deconsolidation Taxes for the period that corresponds to the 2010 tax year, 50% of the Deconsolidation Taxes for the period that corresponds to the 2011 tax year and 25% of the Deconsolidation Taxes for the period that corresponds to the 2012 tax year.
In October 2015, the Mexican National Congress (Congreso de la Unión) approved a tax reform, effective as of January 1, 2016 (the “2016 Tax Reform”). Specifically, the 2016 Tax Reform granted Mexican companies two tax credits to offset part of the Deconsolidation Taxes payable as a result of the elimination of the group taxation regime: (a) 50% of the taxes due as a result of unamortized losses used to compute the consolidated tax could be settled with individual accumulated losses adjusted for inflation using a factor of .15 multiplied by such losses, and (b) tax credit against Deconsolidation Taxes related to intercompany dividends that were paid without having sufficient tax profits. CEMEX applied both tax credits against its remaining Deconsolidation Taxes through the filing of amended tax returns regarding the year ending on December 31, 2015 and upon the withdrawal of the constitutional challenge (juicio de amparo) against the 2014 Tax Reform filed by us on February 12, 2015. Additionally, the 2016 Tax Reform granted Mexican companies the option not to pay the remaining asset tax payments included in the Deconsolidation Tax liability. CEMEX also applied this option.
As of December 31, 2018, taking into account the effects of the 2016 Tax Reform, our estimated payment schedule of Deconsolidation Taxes (which includes the Additional Consolidated Taxes) is as follows: approximately Ps590 million (approximately U.S.$30.03 million as of December 31, 2018, based on an exchange rate of Ps19.65 to U.S.$1.00) in 2019; approximately Ps406 million (approximately U.S.$20.66 million as of December 31, 2018, based on an exchange rate of Ps19.65 to U.S.$1.00) in 2020; and approximately Ps575 million (approximately U.S.$29.26 million as of December 31, 2018, based on an exchange rate of Ps19.65 to U.S.$1.00) in 2021 and thereafter.
Property Tax Matter in the State of Hidalgo, Mexico
During the last quarter of 2017, the municipality of Atotonilco de Tula, Hidalgo, Mexico issued new valuations regarding our operating facility in that municipality to assess the corresponding property tax payable by CEMEX México starting in 2017. As of December 31, 2018, CEMEX México is contesting the legality of such valuations before the Administrative Court of the State of Hidalgo (Tribunal de Justicia Administrativa del Estado de Hidalgo), which has not yet issued a decision. CEMEX México contends that the valuation by the municipality is contrary to the Cadastral Law of the State of Hidalgo (Ley de Catastro del Estado de Hidalgo) and has twice tried to effect payment of the property tax corresponding to the years 2017 and 2018 in accordance with its calculations made pursuant to the Revenue Law of the Municipality of Atotonilco de Tula, Hidalgo (Ley de Ingresos del Municipio de Atotonilco de Tula, Hidalgo) and the Cadastral Law of the State of Hidalgo (Ley de Catastro del Estado de Hidalgo) in effect as of December 31, 2018. The municipality has refused to accept such payment based on an alleged difference in the property tax to be paid, which has not been formally determined by the municipality. The municipality’s refusal to accept payment could result in CEMEX México failing to obtain a municipal license required for the operation of CEMEX México’s Atotonilco operating facility pursuant to municipal regulations published in the Official Gazette of the State of Hidalgo (Periódico Oficial del Estado de Hidalgo) on February 12, 2018, since payment of the corresponding property tax is a requirement for obtaining the municipal license. If the legal actions initiated by CEMEX México in this matter during the first half of 2018 are resolved favorably, CEMEX México would be allowed to pay the corresponding property tax in accordance with its own calculations and the municipal license would be obtained. An adverse result in this matter would result in temporary failure to obtain the aforementioned municipal license, which could affect the operations of our Atotonilco facility while this license is obtained. As of December 31, 2018, we are not able to assess the likelihood of an adverse result to this matter; however, if such matter is finally resolved adversely to us and it affects the operations of our Atotonilco facility, such effect could have an adverse impact on our results of operations, liquidity and financial condition.
153
United States
As of December 31, 2018, the United States Internal Revenue Service (“IRS”) concluded its audits for the years 2014, 2015 and 2016. The final findings did not alter the originally filed CEMEX returns in the U.S., which had no reserves set aside for any potential tax issues. On August 9, 2017 and March 29, 2018, the IRS commenced its audits of the 2017 and 2018 tax years, respectively, under the compliance assurance process. As of December 31, 2018, we have not identified any material audit issues and, as such, no reserves are recorded for the 2017 and 2018 tax year audits in our financial statements.
Colombia
On April 1, 2011, the Colombian Tax Authority notified CEMEX Colombia of a proceeding notice in which the Colombian Tax Authority rejected certain deductions taken by CEMEX Colombia in its 2009 year-end tax return. The Colombian Tax Authority assessed an increase in taxes to be paid by CEMEX Colombia in the amount of approximately 90 billion Colombian Pesos (approximately U.S.$27.69 million as of December 31, 2018, based on an exchange rate of 3,249.75 Colombian Pesos to U.S.$1.00) and imposed a penalty in the amount of approximately 144 billion Colombian Pesos (approximately U.S.$44.31 million as of December 31, 2018, based on an exchange rate of 3,249.75 Colombian Pesos to U.S.$1.00). The Colombian Tax Authority argues that certain expenses are not deductible for fiscal purposes because they are not linked to direct revenues recorded in the same fiscal year, without taking into consideration that future revenue will be taxed with income tax in Colombia. CEMEX Colombia responded to the proceeding notice on June 25, 2011. On December 15, 2011, the Colombian Tax Authority issued its final determination, which confirmed the information in the special proceeding. CEMEX Colombia appealed the final determination on February 15, 2012. On January 17, 2013, the Colombian Tax Authority notified CEMEX Colombia of the resolution confirming the official liquidation. CEMEX Colombia appealed the final determination on May 10, 2013 which was admitted on June 21, 2013. On July 3, 2013, the appeal was notified to the Colombian Tax Authority, and hearings took place on February 18, 2014 and March 11, 2014. An adverse resolution to the appeal was notified to CEMEX Colombia on July 14, 2014 and on July 22, 2014, CEMEX Colombia filed an appeal before the Colombian Consejo de Estado against such adverse resolution. As of December 31, 2018, if the appeal before the Colombian Consejo de Estado is adversely resolved against CEMEX Colombia, in addition to any amounts to be paid in confirmation of the official liquidation, CEMEX Colombia would, as of the payment date, be required to pay interest on the amounts that would be declared due as of the dates they would have had to be paid. As of December 31, 2018, at this stage of the proceeding and considering all possible defenses available, we cannot assess with certainty the likelihood of an adverse result in this special proceeding but we believe a final adverse resolution to this special proceeding is not probable; however, if adversely resolved, we do not expect it would have a material adverse impact on our results of operations, liquidity and financial condition.
On April 6, 2018, the Colombian Tax Authority notified CEMEX Colombia of a proceeding notice in which the Colombian Tax Authority rejected certain deductions taken by CEMEX Colombia in its 2012 year-end income tax return. The Colombian Tax Authority assessed an increase in taxes to be paid by CEMEX Colombia in the amount of approximately 124.79 billion Colombian Pesos (approximately U.S.$38.40 million as of December 31, 2018, based on an exchange rate of 3,249.75 Colombian Pesos to U.S.$1.00) and imposed a penalty in the amount of approximately 124.79 billion Colombian Pesos (approximately U.S.$38.40 million as of December 31, 2018, based on an exchange rate of 3,249.75 Colombian Pesos to U.S.$1.00). On June 22, 2018, CEMEX Colombia responded to the proceeding notice and on December 28, 2018, CEMEX Colombia was notified of the issuance of an official liquidation confirming the information in the proceeding notice. CEMEX Colombia intends to appeal the Colombian Tax Authority’s decision within the next two months and exhaust all legal recourses available, which could take between six and eight years to resolve. As of December 31, 2018, if a final resolution adverse to CEMEX Colombia is reached in this matter, in addition to any amounts to be paid in confirmation of the official liquidation, CEMEX Colombia would, as of the payment date, be required to pay interest on the amounts that would be declared due as of the dates they would have had to be paid. As of December 31, 2018, at this stage of the proceeding and considering all possible defenses available, while we cannot assess with certainty the likelihood of an adverse result in this special proceeding, we believe a final adverse resolution to this special proceeding is not probable. However, if adversely resolved, we do not expect such adverse resolutions to have a material adverse impact on our results of operations, liquidity and financial condition.
154
On September 5, 2018, the Colombian Tax Authority notified CEMEX Colombia of a proceeding notice in which the Colombian Tax Authority rejected certain deductions taken by CEMEX Colombia in its 2011 year-end income tax return. The Colombian Tax Authority assessed an increase in taxes to be paid by CEMEX Colombia in the amount of approximately 85.17 billion Colombian Pesos (approximately U.S.$26.21 million as of December 31, 2018, based on an exchange rate of 3,249.75 Colombian Pesos to U.S.$1.00) and imposed a penalty in the amount of approximately 85.17 billion Colombian Pesos (approximately U.S.$26.21 million as of December 31, 2018, based on an exchange rate of 3,249.75 Colombian Pesos to U.S.$1.00). On November 30, 2018, CEMEX Colombia responded to the proceeding notice and, if an official liquidation is issued, CEMEX Colombia intends to appeal the Colombian Tax Authority’s decision and exhaust all legal recourses available, which could take between six and eight years to resolve. As of December 31, 2018, if a final resolution adverse to CEMEX Colombia is reached in this matter, in addition to any amounts to be paid in confirmation of the official liquidation, CEMEX Colombia would, as of the payment date, be required to pay interest on the amounts that would be declared due as of the dates they would have had to be paid. As of December 31, 2018, at this stage of the proceeding and considering all possible defenses available, while we cannot assess with certainty the likelihood of an adverse result in this special proceeding, we believe a final adverse resolution to this special proceeding is not probable. However, if adversely resolved, we do not expect such adverse resolution to have a material adverse impact on our results of operations, liquidity and financial condition.
Spain
On July 7, 2011, the tax authorities in Spain notified CEMEX España of a tax audit process in Spain covering the tax years from and including 2006 to 2009. The tax authorities in Spain have challenged part of the tax losses reported by CEMEX España for such years. CEMEX España has been formally notified of fines in the aggregate amount of approximately €456 million (approximately U.S.$522.53 million as of December 31, 2018, based on an exchange rate of €0.8727 to U.S.$1.00) resulting from the July 7, 2011 tax audit process in Spain. The laws of Spain provide a number of appeals that can be filed against such fines without CEMEX España having to make any payment until such appeals are finally resolved. On April 22, 2014, CEMEX España filed appeals against such fines before the Tribunal Economico Administrativo Central (“TEAC”) of the Spanish Tax Authorities. On September 20, 2017, CEMEX España was notified by the TEAC about an adverse resolution to such appeals. CEMEX España filed a recourse against such resolution on November 6, 2017 before the National Court (Audiencia Nacional) and applied for the suspension of the payment of the fines. The National Court (il) admitted the recourse; and, on January 31, 2018, it notified CEMEX España of the granting of the suspension of the payment, subject to the provision of guarantees on or before April 2, 2018. In this regard, CEMEX España provided the respective guarantees in the form of a combination of a liability insurance policy and a mortgage of several assets in Spain owned by its Spanish subsidiary CEMEX España Operaciones, S.L.U. On November 6, 2018, the National Court (Audiencia Nacional) confirmed the acceptance of the guarantees by the Spanish Tax Office, which ensures the suspension of the payment until the recourses are definitively resolved. As of December 31, 2018, at this stage of the matter and considering all possible defenses available, while we cannot assess with certainty the likelihood of an adverse result in this matter, we believe a final adverse resolution to this matter is not probable. However, if adversely resolved, we believe such adverse resolution could have a material adverse impact on our results of operations, liquidity and financial condition.
Egypt
On February 9, 2014, ACC was notified of the decision of the Egyptian Ministry of Finance’s Appeals Committee (the “Appeals Committee”) pursuant to which ACC has been required to pay a development levy on clay (the “Levy on Clay”) applied to the Egyptian cement industry in the amount of: (i) approximately 322 million Egyptian Pounds (approximately U.S.$17.93 million as of December 31, 2018, based on an exchange rate of Egyptian Pounds 17.9559 to U.S.$1.00) for the period from May 5, 2008 to August 31, 2011; and (ii) approximately 50,235 Egyptian Pounds (approximately U.S.$2,797.69 as of December 31, 2018, based on an exchange rate of Egyptian Pounds 17.9559 to U.S.$1.00) for the period from September 1, 2011 to November 30, 2011. On March 10, 2014, ACC filed a claim before the North Cairo Court requesting the nullification of the Appeals Committee’s decision and requesting that the North Cairo Court rule that the Egyptian tax authority is not entitled to require payment of the aforementioned amounts. In parallel, ACC has filed a request before the Ministerial Committee for Resolution of Investment Disputes (the “Ministerial Committee”) claiming non-entitlement of the Egyptian tax authority to the Levy on Clay used in the production of cement from the date of enforceability of Law No. 114/2008
155
up until issuance of Law No. 73/2010, and from cement produced using imported clinker. On September 28, 2015, ACC was notified by the Egyptian Cabinet that on September 2, 2015, it ratified an August 10, 2015 decision by the Ministerial Committee (the “Ministerial Committee’s Decision”) pursuant to which the Egyptian tax authority is instructed to cease claiming payment of the Levy on Clay from ACC. The Ministerial Committee’s Decision applies to the years from 2008 up to the issuance date of Law No. 73/2010. It was further decided that the Levy on Clay should not be imposed on imported clinker. At this stage, as of December 31, 2018, the Ministerial Committee’s Decision strongly supports ACC’s position in this dispute, given the fact that the Ministerial Committee’s Decision is legally binding on the Egyptian tax authority. The Ministerial Committee’s Decision was submitted to the Egyptian tax authority and, accordingly, the Egyptian tax authority issued a settlement memorandum (the “Settlement Memorandum”), whereby it confirmed and recognized the Ministerial Committee’s Decision. Furthermore, in application of the Settlement Memorandum and the Ministerial Committee’s Decision, the Egyptian tax authority issued a new claim to ACC for an adjusted amount of 55,586 Egyptian Pounds (approximately U.S.$3,095.70 as of December 31, 2018, based on an exchange rate of Egyptian Pounds 17.9559 to U.S.$1.00). On a March 7, 2016 session of the North Cairo Court, ACC submitted the Settlement Memorandum and the Ministerial Committee’s Decision. At a May 28, 2016 session before the North Cairo Court, the expert’s office appointed to review the case file submitted its report that confirmed and recognized the Ministerial Committee’s Decision and at this session this case was reviewed jointly with the Egyptian tax authority case which was filed to challenge ACC’s right to cancel the Levy on Clay. On December 27, 2016, the North Cairo Court ruled for referring the two jointly reviewed cases to the Cairo Administrative Judiciary Court for the former’s lack of jurisdiction to review the same. These cases have been adjourned by the Commissioners of the Cairo Administrative Judiciary Court to February 4, 2019 for submission of documents by the attorney for the State pertaining to the settlement of the dispute with ACC. We do not expect that such referral will prejudice what we believe is ACC’s favorable legal position in this dispute. As of December 31, 2018, we do not expect our operations, liquidity and financial condition to suffer a material adverse impact because of this matter.
Other Legal Proceedings
Colombian Construction Claims
On August 5, 2005, the Urban Development Institute (Instituto de Desarrollo Urbano) (“UDI”), and an individual filed a lawsuit in the Fourth Anti-Corruption Court of Bogotá (Fiscalía Cuarta Anticorrupción de Bogotá) against a subsidiary of CEMEX Colombia claiming that it was liable, along with the other members of the Asociación Colombiana de Productores de Concreto (“ASOCRETO”), an association formed by the ready-mix concrete producers in Colombia, for the premature distress of the concrete slabs of the Autopista Norte trunk line of the TransMilenio bus rapid transit system of Bogotá in which ready-mix concrete and flowable fill supplied by CEMEX Colombia and other ASOCRETO members was used. The plaintiffs alleged that the base material supplied for the road construction failed to meet the quality standards offered by CEMEX Colombia and the other ASOCRETO members and/or that they provided insufficient or inaccurate information in connection with the product. The plaintiffs were seeking the repair of the concrete slabs in a manner which guarantees their service during the 20-year period for which they were originally designed, and estimate that the cost of such repair could have been approximately 100 billion Colombian Pesos (approximately U.S.$30.77 million as of December 31, 2018, based on an exchange rate of 3,249.75 Colombian Pesos to U.S.$1.00). The lawsuit was filed within the context of a criminal investigation against a former director and two officers of the UDI, the contractor, the inspector and two ASOCRETO officers. On January 21, 2008, a court issued an order, sequestering the El Tunjuelo quarry, as security for payment of a possible future money judgment against CEMEX Colombia. The court determined that in order to lift this attachment and prevent further attachments, CEMEX Colombia was required to deposit 337.8 billion Colombian Pesos (approximately U.S.$103.95 million as of December 31, 2018, based on an exchange rate of 3,249.75 Colombian Pesos to U.S.$1.00) in cash instead of posting an insurance policy to secure such recovery. CEMEX Colombia appealed this decision and the Superior Court of Bogotá (Tribunal Superior de Bogotá) allowed CEMEX to present an insurance policy in the amount of 20 billion Colombian Pesos (approximately U.S.$6.15 million as of December 31, 2018, based on an exchange rate of 3,249.75 Colombian Pesos to U.S.$1.00). CEMEX gave the aforementioned security and, on July 27, 2009, the court lifted the attachment on the quarry.
On October 10, 2012, the court issued a first instance judgment pursuant to which the accusation made against the ASOCRETO officers was nullified. The judgment also convicted a former UDI director, the contractor’s legal representatives and the inspector to a prison term of 85 months and a fine of 32 million Colombian Pesos
156
(approximately U.S.$9,846.91 as of December 31, 2018, based on an exchange rate of 3,249.75 Colombian Pesos to U.S.$1.00). As a consequence of the nullification, the judge ordered a restart of the proceeding against the ASOCRETO officers. The UDI and other parties to the legal proceeding appealed the first instance judgment and on August 30, 2013 the Superior Court of Bogotá resolved to reduce the prison term imposed to the former UDI director and the UDI officers to 60 months and imposed a fine equivalent to 8.8 million Colombian Pesos (approximately U.S.$2,707.90 as of December 31, 2018, based on an exchange rate of 3,249.75 Colombian Pesos to U.S.$1.00). Additionally, the UDI officers were sentenced to severally pay the amount of 108 billion Colombian Pesos (approximately U.S.$33.23 million as of December 31, 2018, based on an exchange rate of 3,249.75 Colombian Pesos to U.S.$1.00) for the purported damages in the concrete slabs of the TransMilenio bus rapid transit system. Additionally, the Superior Court of Bogotá overturned the penalty imposed to the contractor’s legal representatives and inspector because the criminal action against them was time barred. Furthermore, the Superior Court of Bogotá revoked the annulment in favor of the ASOCRETO officers and ordered the first instance judge to render a judgment regarding the ASOCRETO officers’ liability or lack thereof. On June 25, 2014, the Supreme Court of Colombia’s Penal Cassation Chamber (Sala de Casación Penal de la Corte Suprema de Justicia de Colombia) dismissed the cassation claim filed by the former UDI director and the UDI officers against the Superior Court of Bogotá’s judgment. Dismissal of the cassation claim has no effect on CEMEX Colombia’s or the ASOCRETO officers’ interests in these proceedings. On January 21, 2015, the Penal Circuit Court of Bogotá issued a resolution agreeing with the arguments presented by CEMEX Colombia regarding the application of the statute of limitations to the criminal investigation against the ASOCRETO officers and acknowledging that the ASOCRETO officers were not public officers, and as a consequence, finalizing the process against the ASOCRETO officers and the civil responsibility claim against CEMEX Colombia. On July 28, 2015, the Superior Court of Bogotá (Tribunal Superior de Bogotá) upheld this resolution and as such the action brought against CEMEX Colombia for the premature distress of the concrete slabs of the Autopista Norte trunk line has ended. In addition, six legal actions related to the premature distress of the concrete slabs of the Autopista Norte trunk line of the TransMilenio bus rapid transit system were brought against CEMEX Colombia. The Cundinamarca Administrative Court (Tribunal Administrativo de Cundinamarca) nullified five of these actions and, as of December 31, 2018, only one remains outstanding. In addition, the UDI filed another action alleging that CEMEX Colombia made misleading advertisements on the characteristics of the flowable fill used in the construction of the concrete slabs. CEMEX Colombia participated in this project solely and exclusively as supplier of the ready-mix concrete and flowable fill, which were delivered and received to the satisfaction of the contractor, complying with all the required technical specifications. CEMEX Colombia neither participated in nor had any responsibility on the design, sourcing of materials or their corresponding technical specifications or construction. On May 24, 2016, the Civil Court of Bogota settled the action filed by the UDI against CEMEX Colombia. The court accepts the arguments in defense of CEMEX Colombia, ruling that the flowable fill is not what caused the damage to the slabs and that the damages were caused by design changes when executing the road without consulting the original designer and the lack of drains. The UDI filed an appeal against the court’s ruling. On December 7, 2016, the Superior Court of Bogota (Tribunal Superior de Bogotá) upheld the Civil Court of Bogota’s decision. As of December 31, 2018, at this stage of the proceedings with respect to the remaining pending action filed before the Cundinamarca Administrative Court, if adversely resolved, we do not expect that such adverse resolution will have a material adverse impact on our results of operations, liquidity and financial condition.
Croatian Concession Litigation
After an extended consultation period, in April 2006, the cities of Kastela and Solin in Croatia published their respective Master (physical) Plans defining the development zones within their respective municipalities, adversely impacting the mining concession granted to CEMEX Croatia by the Government of Croatia in September 2005. During the consultation period, CEMEX Croatia submitted comments and suggestions to the Master Plans intended to protect and preserve the rights of CEMEX Croatia’s mining concession, but these were not taken into account or incorporated into the Master Plans by Kastela and Solin. Immediately after publication of the Master Plans, CEMEX Croatia filed a series of lawsuits and legal actions before the local and federal courts to protect its acquired rights under the mining concessions, including: (i) on May 17, 2006, a constitutional appeal before the constitutional court in Zagreb, seeking a declaration by the court concerning CEMEX Croatia’s constitutional claim for decrease and obstruction of rights earned by investment and seeking prohibition of implementation of the Master Plans; and (ii) on May 17, 2006, an administrative proceeding before an administrative court seeking a declaration from the Government of Croatia confirming that CEMEX Croatia acquired rights under the mining concessions. The administrative court subsequently ruled in favor of CEMEX Croatia, validating the legality of the mining concession
157
granted to CEMEX Croatia by the Government of Croatia, in September 2005. On June 15, 2012, we were notified that the case had been transferred from the constitutional court to the administrative court as a result of a new law that places the administrative courts in charge of disputes relating to environmental planning. In February 2014, the administrative court requested CEMEX Croatia to declare if it was still interested in proceeding with the concession litigation and if so, to provide additional clarification and documentation to support such claims. On March 3, 2014, CEMEX Croatia submitted the clarification and required documentation and on April 4, 2014, CEMEX Croatia was notified that the administrative court rejected its claims and found that its acquired rights or interests under the mining concessions had not been violated as a result of any act or decision made by the cities of Solin or Kastela or any other governmental body.
On April 29, 2014, CEMEX Croatia filed two claims before the Constitutional Court of the Republic of Croatia alleging that CEMEX Croatia’s constitutional rights to a fair trial and judicial protection had been violated. On August 1, 2014, CEMEX Croatia also filed an application before the European Court of Human Rights alleging that CEMEX Croatia’s constitutional rights to a fair trial, property rights, concession rights and investment had been violated due to irregularities in a general act, which has been denied. The European Court of Human Rights found the application to be inadmissible pursuant to articles 34 and 35 of the Convention for the Protection of Human Rights and Fundamental Freedoms, meaning that CEMEX Croatia did not exhaust all its domestic legal remedies, thus stipulating the Constitutional Court of the Republic of Croatia’s jurisdiction in this matter. On February 6, 2015, the decision of the European Court of Human Rights was sent to the Constitutional Court of the Republic of Croatia. The Constitutional Court of the Republic of Croatia granted the claim, annulled the decision of the administrative court and remanded the case to the administrative court for a new trial. On June 9, 2017, the administrative court issued a decision rejecting CEMEX Croatia’s request. CEMEX will not file an appeal, thus the administrative court’s decision is final. During May 2015, CEMEX Croatia obtained a new location permit from the Croatian Ministry of Construction and Physical Planning for CEMEX Croatia’s Sveti Juraj-Sveti Kajo quarry. On August 2, 2016, CEMEX Croatia obtained a decision pursuant to which a right of way was granted on land owned by the Republic of Croatia and located in Sveti Juraj-Sveti Kajo quarry. The period of such right of way will be compatible with the location permit previously granted. On December 5, 2018, CEMEX Croatia was notified of a decision issued by the Ministry of Economy granting CEMEX Croatia a mining concession that will expire on May 31, 2053 and, as a result, this proceeding has ended. As of December 31, 2018, we do not expect our operations, liquidity and financial condition to suffer a material adverse impact because of this matter.
Israeli Class Action Litigation
On June 21, 2012, one of our subsidiaries in Israel was notified about an application for the approval of a class action suit against it. The application was filed by a homeowner who built his house with concrete supplied by our Israeli subsidiary in October 2010 (an identical application was filed against three other companies by the same legal representative). According to the application, the plaintiff claims that the concrete supplied to him did not meet with the “Israel Standard for Concrete Strength No. 118” and that, as a result, our Israeli subsidiary acted unlawfully toward all of its customers who requested a specific type of concrete but that received concrete that did not comply with Israeli standard requirements. As per the application, the plaintiff claims that the supply of the alleged non-conforming concrete has caused financial and non-financial damages to those customers, including the plaintiff. We presume that the class action would represent the claim of all the clients who purchased the alleged non-conforming concrete from our Israeli subsidiary during the past seven years, the limitation period according to applicable laws in Israel. The damages that could be sought amount to approximately 276 million Israeli Shekels (approximately U.S.$73.64 million as of December 31, 2018, based on an exchange rate of 3.748 Israeli Shekels to U.S.$1.00).
Our Israeli subsidiary submitted a formal response to the corresponding court. Both parties presented their preliminary arguments. In a hearing held on December 20, 2015, the preliminary proceeding was completed and the court set dates for hearing evidence on May 8, 10 and 16, 2016. In addition, the court decided to join together all claims against all four companies, including our subsidiary in Israel, in order to simplify and shorten court proceedings, however, it should be mentioned that the court had not formally decided to join together all claims. On the hearing dates, the applicants in all four claims presented evidence, including expert testimony. An abandonment of action has been submitted to the court regarding two of the four defendant companies, but our Israel subsidiary and another company remain as defendants. Our Israel subsidiary and the applicant already submitted their summations with regards to the application for the approval of the class action. We are waiting for a judgment regarding this application and with respect to the abandonment of action that has been submitted with regards to the
158
two other defendants. As of December 31, 2018, at this stage of the proceeding, we believe that the likelihood of an adverse result in this special proceeding is not probable as our Israel subsidiary is not able to assess the likelihood of the class action application being approved or, if approved, of an adverse result, such as an award for damages in the full amount that could be sought, but if adversely resolved, we do not believe the final resolutions would have a material adverse impact on our results of operations, liquidity and financial condition.
Egypt Share Purchase Agreement
On April 7, 2011 and March 6, 2012, lawsuits seeking, among other things, the annulment of the share purchase agreement entered into by and between CEMEX and state-owned Metallurgical Industries Company (the “Holding Company”) in November 1999 pursuant to which CEMEX acquired a controlling interest in ACC (the “Share Purchase Agreement”), were filed by different plaintiffs, including 25 former employees of ACC, before the 7th and 8th Circuits of Cairo’s State Council Administrative Judiciary Court, respectively. Hearings in both cases were adjourned in order for the State Commissioner Authority (“SCA”) to prepare the corresponding reports to be submitted for the consideration of the 7th and 8th Circuits of Cairo’s State Council Administrative Judiciary Court. During March 2015, the SCA submitted the relevant reports recommending, in both cases, that the 7th and 8th Circuits of Cairo’s State Council Administrative Judiciary Court stays the proceedings until the High Constitutional Court pronounces itself with regards to the challenges against the constitutionality of the Presidential Decree on Law No. 32 of 2014 (“Law 32/2014”). A hearing was held on October 13, 2015 before the 8th Circuit of Cairo’s State Council Administrative Judiciary Court in which the SCA’s report was reviewed and the case was adjourned to January 26, 2016 for passing judgment. At the session held on January 26, 2016, the 8th Circuit of Cairo’s State Council Administrative Judiciary Court issued a judgment ruling for the dismissal of this case considering the plaintiff’s lack of standing. The legal prescription period for the plaintiff to challenge the judgment before the High Administrative Court of 60 calendar days from the date of issuance of the judgment expired without the plaintiff filing a challenge to the judgment. Accordingly, the January 26, 2016 judgment issued by the 8th Circuit of Cairo’s State Council Administrative Judiciary Court is final and definitive. At a session held on September 3, 2015, the 7th Circuit of Cairo’s State Council Administrative Judiciary Court accepted the SCA’s report recommendation and ruled for staying the proceedings until the High Constitutional Court pronounces itself with regards to the challenges against the constitutionality of Law 32/2014. As of December 31, 2018, at this stage of the proceedings, we believe that the likelihood of an adverse result in this matter is not probable as we are not able to assess the likelihood of an adverse resolution regarding this lawsuit filed before the 7th Circuit of Cairo’s State Council Administrative Judiciary Court, but if adversely resolved, we do not believe the resolution in the first instance would have an immediate material adverse impact on our results of operations, liquidity and financial condition as there are different legal recourses that we could take. However, if we exhaust all legal recourses available to us, a final adverse resolution of this matter could have a material adverse impact on our operations, liquidity and financial condition.
Regarding a different lawsuit submitted to a First Instance Court in Assiut, Egypt and notified to ACC on May 23, 2011, on September 13, 2012, the first instance court of Assiut, Egypt issued a judgment (the “First Instance Judgment”) to (i) annul the Share Purchase Agreement; and (ii) reinstate former employees to their former jobs at ACC. The First Instance Judgment was notified to ACC on September 19, 2012. On October 18, 2012, ACC filed an appeal against the First Instance Judgment, which was followed by the Holding Company’s appeal filed on October 20, 2012 before the Appeal Court in Assiut, Egypt (the “Appeal Court”). At a November 17, 2013 hearing, the Appeal Court decided to join the appeals filed by ACC and the Holding Company and adjourned the session to January 20, 2014 to render judgment. On January 20, 2014, the Appeal Court issued a judgment (the “Appeal Judgment”) accepting both appeals, revoking the First Instance Judgment, ruling for non-qualitative jurisdiction of the first instance court to review the case and referred the matter to the administrative court in Assiut, Egypt (the “Assiut Administrative Court”) for a hearing to be held on March 16, 2014. This hearing was subsequently rescheduled to May 17, 2014 and ultimately was not held because the case file had not been completed on time in order for it to be referred to the Assiut Administrative Court. The SCA submitted a report recommending that the Assiut Administrative Court to declare itself incompetent to review this case and to refer it to the Assiut Administrative Judiciary Court (the “Assiut Administrative Judiciary Court”). The Assiut Administrative Court scheduled a new hearing for October 11, 2014 to review the case. On October 15, 2014, the Assiut Administrative Court ruled for its non-jurisdiction to review the case and referred the case to the Assiut Administrative Judiciary Court. On December 11, 2014, ACC filed an appeal against the Assiut Administrative Court ruling (the “Appeal”), requesting that its enforcement be suspended until a judgment is issued on the appeal filed before the Cassation
159
Court on March 12, 2014. Additionally, another appeal substantially in the same terms as the Appeal was filed on March 10, 2014 by the Holding Company against the same ruling (the “Parallel Appeal”). On February 10, 2015 and March 17, 2015, hearings were held before the Assiut Administrative Judiciary Court’s SCA in which the SCA decided to adjourn in order to prepare the corresponding report to be submitted for the consideration of the Assiut Administrative Judiciary Court. On October 2015, the SCA issued a report recommending mainly that due to the absence of geographical jurisdiction to review the case, it should be referred to the 7th Circuit of “Economic and Investment Disputes” of Cairo’s State Council Administrative Judiciary Court. The Assiut Administrative Judiciary Court held a hearing for the case on February 24, 2016, in which it decided to refer the case to the First Circuit (formerly 7th Circuit) of “Economic and Investment Disputes” of Cairo’s State Council Administrative Judiciary Court. Cairo’s State Council Administrative Judiciary Court held a hearing on March 28, 2017 to notify the parties of the procedures, whereupon the court adjourned the hearing until June 13, 2017 in order for the parties to submit their memoranda. On June 13, 2017 the court decided to refer the case back to SCA to prepare and submit a complementary report on the merits. The SCA shall notify ACC with a new hearing date before the SCA if it deems necessary, or after the SCA finishes the preparation of the complementary report a new hearing will be scheduled before Cairo’s State Council Administrative Judiciary Court. In a session held on February 11, 2016 in order to review the Appeal, the Assiut Administrative Judiciary Court decided to refer the case to the First Circuit of Cairo’s State Council Administrative Judiciary Court, which in turn decided to refer the Appeal to the Assiut Administrative Judiciary Court. On November 9, 2016, the Assiut Administrative Judiciary Court held a session in order to review the referred Appeal, and adjourned the Appeal to February 8, 2017. On February 8, 2017, the court adjourned the hearing until June 14, 2017 in order for the parties to submit their final memoranda. On June 14, 2017 the court postponed the hearing until November 23, 2017 in order for the parties to review the submitted documents. At the hearing held on November 23, 2017, the Assiut Administrative Judiciary Court referred the Appeal to the Commissioner’s Division for the Commissioner to render the corresponding opinion. On August 27, 2018, the Assiut Administrative Judiciary Court decided to refer the Parallel Appeal to the Cairo Administrative Judiciary Court. We expect a similar ruling on the Appeal filed by ACC. As of December 31, 2018, at this stage of the proceedings, we believe that the likelihood of an adverse result in this matter is not probable as we are not able to assess the likelihood of an adverse resolution regarding this lawsuit filed before the First Circuit of Cairo’s State Council Administrative Judiciary Court, but if adversely resolved, we do not believe the resolution in the first instance would have an immediate material adverse impact on our results of operations, liquidity and financial condition as there are different legal recourses that we could take. However, if we exhaust all legal recourses available to us, a final adverse resolution of this matter could have a material adverse impact on our operations, liquidity and financial condition.
On March 12, 2014, ACC filed a challenge before the Cassation Court against the part of the Appeal Judgment that refers to the referral of the case to the Assiut Administrative Court and payment of the appeal expenses and attorney fees, and requested a suspension of the Appeal Judgment execution with respect to these matters until the Cassation Court renders its judgment (the “Challenge”). A hearing was held on April 12, 2016 in order to review the Challenge’s summary request only, which requested the Cassation Court to stay the execution of part of the Appeal Judgment regarding the referral of the case to the Assiut Administrative Court and payment of the appeal expenses and attorney fees. At this hearing the Cassation Court rejected the summary request. As of December 31, 2018, ACC has not been notified of a session before the Cassation Court in order to review the subject matter of the Challenge. As of December 31, 2018, at this stage of the proceedings, we believe that the likelihood of an adverse result in this matter is not probable as we are not able to assess the likelihood of an adverse resolution regarding the Challenge, but if adversely resolved, we do not believe the resolution would have an immediate material adverse impact on our results of operations, liquidity and financial condition as there are different recourses that we could take. However, if we exhaust all legal recourses available to us, a final adverse resolution of this matter could have a material adverse impact on our operations, liquidity and financial condition.
Also, on February 23, 2014, three plaintiffs filed a lawsuit before the Assiut Administrative Judiciary Court requesting the cancellation of the resolutions taken by the Holding Company’s shareholders during the extraordinary general shareholders meeting pursuant to which it was agreed to sell ACC’s shares and enter into the Share Purchase Agreement in 1999. A hearing held on May 17, 2014 was adjourned in order for the SCA to prepare a report to be submitted for the consideration of the Assiut Administrative Judiciary Court. On September 4, 2014, ACC received the report issued by the SCA which is non-binding to the Assiut Administrative Judiciary Court. On December 11, 2014, the Assiut Administrative Judiciary Court resolved to refer the case to the 7th Circuit of Cairo’s State Council Administrative Judiciary Court. The 7th Circuit of Cairo’s State Council Administrative Judiciary Court decided to
160
adjourn to July 25, 2015 in order to review the parties’ pleadings. On this hearing held on July 25, 2015, the 7th Circuit of Cairo’s State Council Administrative Judiciary Court adjourned the case to September 3, 2015 for passing judgment. At the session held on September 3, 2015, the 7th Circuit of Cairo’s State Council Administrative Judiciary Court ruled for staying the proceedings until the High Constitutional Court pronounces itself with regards to the challenges against the constitutionality of Law No.32/2014. As of December 31, 2018, we still do not have sufficient information to assess the likelihood of the 7th Circuit of Cairo’s State Council Administrative Judiciary Court cancelling the resolutions adopted by the Holding Company’s shareholders, or, if such shareholders’ resolutions are cancelled, how would such cancellation affect us, but if adversely resolved, we do not believe the resolution in this first instance would have an immediate material adverse impact on our results of operations, liquidity and financial condition as there are different legal recourses that we could take. However, if we exhaust all legal recourses available to us, a final adverse resolution of this matter could have a material adverse impact on our operations, liquidity and financial condition.
On April 22, 2014, Law 32/2014, which regulates legal actions to challenge agreements entered into by the Egyptian State (including its ministries, departments, special budget entities, local administrative units, authorities and state-participated companies) and third parties, was published in the Official Gazette, becoming effective as of April 23, 2014, but subject to its presentation, discussion and approval by the House of Representatives 15 days after it holds its first session. As per the provisions of Law 32/2014, and considering certain exceptions, only the parties to these agreements have standing to challenge the validity of an agreement. During October and November 2015, parliamentary elections to the House of Representatives took place and the elected House of Representatives started to hold its sessions on January 10, 2016, as expected, and Law 32/2014 was discussed and ratified on January 20, 2016, as legally required. As of December 31, 2018, a constitutional challenge has been filed by a third party against Law 32/2014 before the High Constitutional Court. The High Constitutional Court scheduled a hearing for May 6, 2017 to proceed with the constitutional challenge that was filed against Law 32/2014 after the SCA had submitted its report with respect to the case. On May 6, 2017 the court decided to refer the case back to SCA to prepare and submit a complementary report on the merits. The SCA, if it deems it necessary, may schedule a hearing for reviewing the case before the SCA. After the SCA finishes the preparation of the complementary report, a new hearing will be scheduled before the High Constitutional Court. As of December 31, 2018, we are still not able to assess if the High Constitutional Court will dismiss Law 32/2014, but if the High Constitutional Court dismisses Law 32/2014, this could adversely impact the ongoing matters regarding the Share Purchase Agreement, which could have a material adverse impact on our operations, liquidity and financial condition.
Maceo, Colombia—Legal Proceedings in Colombia
On August 28, 2012, CEMEX Colombia entered into a memorandum of understanding (the “MOU”) with CI Calizas y Minerales S.A. (“CI Calizas”) to acquire land, a mining concession, an environmental license, free trade zone benefits and related assets necessary to carry out the Maceo Project. In connection with the MOU, CI Calizas was represented by a non-governmental individual (the “Representative”).
After the execution of the MOU, one of CI Calizas’ former shareholders was linked to an expiration of the property proceeding by the Colombian Attorney General’s Office (the “Attorney General’s Office”) that, among other measures, suspended CI Calizas’ ability to transfer certain assets to CEMEX Colombia as required by the MOU (the “Affected Assets”). In order to protect its interests in the Affected Assets, CEMEX Colombia joined the expiration of the property proceeding, attended each procedural stage and cooperated with the Attorney General’s Office. CEMEX Colombia also requested the dismissal of the expiration of the property proceeding against the Affected Assets. On May 2, 2016, in order to collect further evidence, the Attorney General’s Office denied CEMEX Colombia’s request for the dismissal of the expiration of the property proceeding. The expiration of the property proceeding is in its investigative phase, pending the appointment of the ad litem curators by the Attorney General’s Office. Upon appointment of the ad litem curators, the evidentiary phase will commence and the relevant evidence will be presented and studied. We expect that the Attorney General’s Office’s final decision as to whether it will proceed with the expiration of the property proceeding with respect to the Affected Assets could take five to ten years.
In July 2013, CEMEX Colombia entered into a five-year lease agreement (the “Lease Agreement”) with a depository that had been designated by the Colombian National Narcotics Directorate (Dirección Nacional de Estupefacientes) (the “CNND”) with respect to the Affected Assets. The Lease Agreement, along with an
161
accompanying governmental mandate, authorized CEMEX Colombia to continue the work necessary for the construction and operation of the Maceo Project during the expiration of the property proceeding. The Lease Agreement expired on July 15, 2018. Notwithstanding the expiry of the Lease Agreement, CEMEX Colombia is entitled to continue using the Affected Assets pursuant to the terms of the accompanying mandate until the conclusion of the expiration of the property proceeding. As of December 31, 2018, the Colombian Administrator of Special Assets (Sociedad de Activos Especiales S.A.S) (the “SAE”), which assumed the functions of the CNND after the CNND’s liquidation, disputes the validity of the accompanying mandate and requested judicial mediation in order to advance the finalization of a new long-term lease agreement of the Affected Assets that would allow CEMEX Colombia to continue the work necessary for the construction and operation of the Maceo Project during the expiration of the property proceeding.
Assuming that CEMEX Colombia conducted itself in good faith, and taking into account that its investments in the Maceo Project were incurred with the consent of the SAE and CI Calizas under the Lease Agreement and the accompanying mandate, we believe the value of such investments is protected by Colombian law. Colombian law provides that, if a person builds on another person’s property with the knowledge of such other person, the person that built on the property shall be compensated with the value of what was built or otherwise be transferred the property in the event the owner of the property decides to recover possession. We also believe that, during the term of the Lease Agreement and the accompanying mandate, CEMEX Colombia may use the Affected Assets in order to operate the Maceo Project. In the event that CEMEX Colombia’s right to the Affected Assets is extinguished in favor of the government of Colombia, which we believe is unlikely, the SAE may decide not to sell the Affected Assets to CEMEX Colombia. In either case, under Colombian law, CEMEX Colombia would be entitled to compensation for the value of the investments made in the Maceo Project. As of December 31, 2018, at this stage of the proceedings, we believe that the likelihood of an adverse result in this matter is not probable as we are not able to assess the likelihood of CEMEX Colombia receiving an adverse decision relating to the expiration of the property proceedings or if the ownership of the assets subject to the MOU will be extinguished in favor of the Republic of Colombia; however, as of December 31, 2018, we believe that an adverse resolution in which CEMEX Colombia is not compensated for the value of its investments in the Maceo Project could have a material adverse effect on our results of operations, liquidity or financial condition.
On December 30, 2013, CEMEX Colombia and the Representative entered into a different memorandum of understanding (the “Land MOU”), pursuant to which the Representative would represent CEMEX Colombia in the acquisition of lands adjacent to the Maceo Project. In connection with the Maceo Project, CEMEX Colombia conveyed to the Representative over U.S.$13.28 million, including cash payments and interest (based on an exchange rate of 3,249.75 Colombian Pesos to U.S.$1.00 as of December 31, 2018). Due to the expiration of the property proceeding against the Affected Assets described above, the acquisition of the Affected Assets was not finalized.
During 2016, CEMEX, S.A.B. de C.V. received reports through its anonymous reporting hotline regarding potential misconduct by certain employees, including with regard to the Maceo Project. CEMEX, S.A.B. de C.V. initiated an investigation and internal audit pursuant to its corporate governance policies and its code of ethics.
On September 23, 2016, CLH disclosed that it had identified irregularities in the process for the purchase of the land related to the Maceo Project in an accusation with the Attorney General’s Office so that the Attorney General’s Office may take the actions it deems appropriate. Further, on December 20, 2016, CLH enhanced such filing with additional information and findings obtained as of such date. On June 1, 2017 the Attorney General’s Office petitioned a hearing for imputation of charges (audiencia de imputación de cargos) against two former employees of CEMEX and a representative of CI Calizas. The hearing took place from June 7, 2018 to June 29, 2018 and finished with the imposition of precautionary measures against the former executives and representative of CI Calizas.
On September 23, 2016, CLH and CEMEX Colombia terminated the employment of the Vice President of Planning of CLH, who was also CEMEX Colombia’s Director of Planning, and the Legal Counsel of CLH, who was also the General Counsel of CEMEX Colombia. In addition, effective as of September 23, 2016, the Chief Executive Officer of CLH, who was also the President of CEMEX Colombia, resigned from both positions. On October 4, 2016, in order to strengthen levels of leadership, management and corporate governance practices, the Board of Directors of CLH resolved to split the roles of Chairman of the Board of Directors of CLH, Chief Executive Officer
162
of CLH and Director of CEMEX Colombia, and appointed a new Chairman of the Board of Directors of CLH, a new Chief Executive Officer of CLH, a new Director of CEMEX Colombia and a new Vice President of Planning of CLH and CEMEX Colombia. A new legal counsel for CLH and CEMEX Colombia was also appointed during the fourth quarter of 2016.
Additionally, pursuant to the requirements of CEMEX, S.A.B. de C.V.’s and CLH’s audit committees, CEMEX Colombia retained external counsel to assist CLH and CEMEX Colombia to collaborate as necessary with the Attorney General’s Office, as well as to assist on other related matters. A forensic investigator in Colombia was engaged, as well.
The Attorney General’s Office is investigating the irregularities in connection with the transactions conducted pursuant to the MOU and the Land MOU. Such investigation is running its due course but has not concluded, and, as such, we cannot predict what actions, if any, the Attorney General’s Office may implement. Any actions by the Attorney General’s Office and any actions taken by us in response to the aforementioned irregularities regarding the Maceo Project, including, but not limited to, the departure of the abovementioned executives, could have a material adverse effect on our results of operations, liquidity or financial condition.
Investigations related to ongoing matters in Colombia and certain other countries
In December 2016, CEMEX, S.A.B. de C.V. received subpoenas from the SEC seeking information to determine whether there have been any violations of the U.S. Foreign Corrupt Practices Act stemming from the Maceo Project. These subpoenas do not mean that the SEC has concluded that CEMEX, S.A.B. de C.V. or any of its affiliates violated the law. As discussed in “— Maceo, Colombia—Legal Proceedings in Colombia,” internal audits and investigations by CEMEX, S.A.B. de C.V. and CLH had raised questions about payments relating to the Maceo Project. The payments made to the Representative in connection with the Maceo Project did not adhere to CEMEX, S.A.B. de C.V.’s and CLH’s internal controls. As announced on September 23, 2016, the CLH and CEMEX Colombia officers responsible for the implementation and execution of the above referenced payments were terminated and the then Chief Executive Officer of CLH resigned. CEMEX, S.A.B. de C.V. has been cooperating with the SEC and the Attorney General’s Office and intends to continue cooperating fully with the SEC and the Attorney General’s Office. We previously disclosed that it was possible that the DOJ and other investigatory entities in other jurisdictions could also open investigations into this matter. In this regard, on March 12, 2018, the DOJ issued a grand jury subpoena to CEMEX, S.A.B. de C.V. relating to its operations in Colombia and other jurisdictions. CEMEX, S.A.B. de C.V. intends to cooperate fully with the SEC, the DOJ and any other investigatory entity. As of December 31, 2018, CEMEX, S.A.B. de C.V. is unable to predict the duration, scope, or outcome of either the SEC investigation or the DOJ investigation, or any other investigation that may arise, or, because of the current status of the SEC investigation and the preliminary nature of the DOJ investigation, the potential sanctions which could be borne by CEMEX, S.A.B. de C.V., or if such sanctions, if any, would have a material adverse impact on CEMEX, S.A.B. de C.V.’s consolidated results of operations, liquidity or financial position.
Maceo, Colombia—Operational Matters
On October 27, 2016, CLH decided to postpone the commencement of operations of the cement plant in Maceo, Colombia. This decision was mainly due to the following circumstances:
(1) CEMEX Colombia had not received permits required to finalize road access to such cement plant. The only existing access to such cement plant cannot guarantee safety or operations and could limit the capacity to transport products from the cement plant. As of December 31, 2018, the process to obtain the permits required to finalize the road access to such cement plant in Maceo, Colombia, is ongoing. CEMEX Colombia has provided all information that the authorities have requested in order to grant such permits, but CEMEX Colombia is not able to assess if and when such permits will be received;
(2) CEMEX Colombia had not received a final response to the request to expand the free trade zone that covers the Maceo Project in order to commission a new clinker line at such cement plant. Failure to obtain such expansion would jeopardize CEMEX Colombia’s capability to consolidate the benefits that would otherwise be available for CEMEX Colombia in the area. CEMEX Colombia had requested to the Colombian Ministry of Trade, Industry and Tourism (Ministerio de Comercio, Industria y Turismo) an expansion of the free trade zone, for which
163
CEMEX Colombia did not receive a final decision. CEMEX Colombia believes the delay in such decision could have been related to the expiration of the property proceeding against the Affected Assets. During the third quarter of 2017, at the request of CEMEX Colombia, the DIAN granted the suspension of the expansion process of the free trade zone that CEMEX Colombia had previously requested. Thus, the expansion process of the free trade zone will be stayed until March 31, 2019. As of December 31, 2018, CEMEX Colombia believes that by March 31, 2019, the partial adjustment to the District of Integrated Management should be finalized, which should allow CEMEX Colombia to proceed with the expansion process of the free trade zone;
(3) The environmental license and the mining concession related to the Maceo Project were held by different legal entities, which is contrary to typical procedure in Colombia. The environmental license related to the Maceo Project is held by Central de Mezclas S.A. (“Central de Mezclas”), a subsidiary of CEMEX Colombia. However, the mining permit related to the Maceo Project was remanded back to CI Calizas as a result of the revocation of such mining concession by the Mining Secretariat (Secretaría de Minas) of Antioquia in December 2013. In connection with the environmental license that had been issued for the Maceo Project, during the second half of 2016, Corantioquia, the regional environmental agency with jurisdiction over the Maceo Project environmental license, requested authorization and consent from Central de Mezclas to reverse the assignment of the environmental license for the Maceo Project back to CI Calizas, which also holds the corresponding mining title. On February 22, 2018, Central de Mezclas granted such authorization. CEMEX Colombia had requested a modification to the environmental license, and on December 13, 2016, Corantioquia notified Central de Mezclas that it had adopted the decision to deny the request for modification of the environmental license related to the Maceo Project to 950,000 tons per annum on the basis of the overlap of the project area with the District of Integrated Management. On December 14, 2016, Central de Mezclas appealed the decision. On March 28, 2017, Central de Mezclas was notified of Corantioquia’s decision, which affirmed the decision that had previously denied the modification of the environmental license for a 950,000 per annum project. As a result, as of December 31, 2018, CEMEX Colombia was actively working on the zoning and compatibility of the District of Integrated Management, as well as analyzing alternatives for a partial adjustment to the District of Integrated Management, to avoid future discussions regarding feasibility of expanding the proposed production in the Maceo Project beyond 950,000 tons per annum. Once these alternatives are implemented, as of December 31, 2018, CEMEX Colombia will reconsider submitting a new request pursuing the modification of the environmental license to expand its production of 950,000 tons per annum as initially planned;
(4) CEMEX Colombia determined that the area covered by the environmental license related to the Maceo Project partially overlapped with a District of Integrated Management (Distrito de Manejo Integrado), which could limit the granting of the environmental license modification. On October 9, 2017, CEMEX Colombia filed a petition with Corantioquia to decrease the zoning area covered by the environmental license related to the construction by CEMEX Colombia of the Maceo Project, in order to avoid any overlap with the District of Integrated Management. On January 12, 2018, CEMEX Colombia was notified of Corantioquia’s decision to admit such petition and initiate the proceedings; and
(5) CEMEX Colombia had not received authorizations for the modification of land use in order to carry out industrial and mining activities at the site of the cement plant in Maceo, Colombia. As of December 31, 2018, the process to obtain the authorizations required to modify the land use of the site of the cement plant in Maceo, Colombia, is ongoing.
CEMEX Colombia and Central de Mezclas plan to continue to work on solving the issues causing the postponement of the commissioning of the Maceo Project cement plant in order to capture, as soon as reasonably possible, the full operating benefits of this facility in Colombia. CEMEX Colombia believes some of these issues could be related to the expiration of the property proceeding against the Affected Assets. As of December 31, 2018, we do not expect to suffer a material adverse impact to our results of operations, liquidity or financial condition as a result of the Maceo Project cement plant not being commissioned to operate pending resolution of these issues.
Quarry matter in France
One of our subsidiaries in France, CEMEX Granulats Rhône Méditerranée (“CEMEX Granulats”), is a party to a contract executed in 1990 (the “Quarry Contract”) with SCI La Quinoniere (“SCI”), pursuant to which CEMEX Granulats has drilling rights to extract reserves and conduct quarry remediation at a quarry in the Rhone
164
region of France. In 2012, SCI filed a claim against CEMEX Granulats for breach of the Quarry Contract, requesting the rescission of the Quarry Contract and damages plus interest, totaling an aggregate amount of approximately €55 million (approximately U.S.$63.02 million as of December 31, 2018, based on an exchange rate of €0.8727 to U.S.$1.00), resulting from CEMEX Granulats having partially filled the quarry allegedly in breach of the terms of the Quarry Contract. On May 18, 2016, CEMEX Granulats was notified about an adverse judgment in this matter by the corresponding court in Lyon, France, primarily ordering the rescission of the Quarry Contract and damages plus interest, totaling an aggregate amount of approximately €55 million (approximately U.S.$63.02 million as of December 31, 2018, based on an exchange rate of €0.8727 to U.S.$1.00). This judgment is not enforceable. CEMEX Granulats filed the notice of appeal with the appeal court in Lyon, France. SCI updated its claim for damages to an approximate aggregate amount of €67 million (approximately U.S.$76.78 million as of December 31, 2018, based on an exchange rate of €0.8727 to U.S.$1.00). The judgment of the appeal court was notified to CEMEX Granulats on March 13, 2018. It overrules the first instance judgment but orders the rescission of the Quarry Contract. It also appoints a judicial expert to (i) determine the volume of both excavated materials and backfilling materials and (ii) give his opinion on the potential damages suffered by SCI. This judgment is enforceable. CEMEX Granulats has filed the notice of appeal with the Court of Cassation, which will advance in parallel to the judicial expert’s process (two meetings were held on June 6, 2018 and November 27, 2018, respectively). Proceedings on any additional hearings with respect to this appeal or any other actions CEMEX Granulats has initiated in this matter are expected to be finalized during the second or third quarter of 2019. As of December 31, 2018 there can be no assurance as to whether or not CEMEX Granulats will receive an adverse result to any appeals or any other recourses it may pursue. At this stage of the proceedings, as of December 31, 2018, we are not able to assess the likelihood of an adverse result regarding this matter, but if adversely resolved, we do not expect that it will have a material adverse impact on our results of operations, liquidity and financial condition.
Federal Securities Class Action
On March 16, 2018, a securities class action complaint was filed against us, one of our members of the board of directors, and certain of our executive officers in the U.S. District Court for the Southern District of New York, on behalf of investors who purchased or otherwise acquired our securities between August 14, 2014 to March 13, 2018, inclusive. The complaint alleges violations of Sections 10(b) and 20(a) of the Securities Exchange Act of 1934, as amended based on purportedly issuing press releases and SEC filings that included materially false and misleading statements in connection with alleged misconduct relating to the Maceo Project and the potential regulatory or criminal actions that might arise as a result. On September 14, 2018, we filed a motion to dismiss this lawsuit. During the fourth quarter of 2018, plaintiffs filed an opposition brief to this motion to dismiss and we filed a response to such opposition brief. We deny liability and intend to vigorously defend the case. As of December 31, 2018, at this stage of the proceedings, we are not able to assess the likelihood of an adverse result to this lawsuit because of its current status and its preliminary nature, and for the same reasons we are also not able to assess if a final adverse result in this lawsuit would have a material adverse impact on our results of operations, liquidity and financial condition.
General
As of December 31, 2018, we are involved in various legal proceedings involving, but not limited to, product warranty claims, environmental claims, claims regarding the procurement and supply of products, indemnification claims relating to divestments and acquisitions and similar types of claims brought against us that have arisen in the ordinary course of business. We also receive various information requests from governmental and administrative authorities when such authorities are conducting periodic or general reviews of the markets in which we operate. We believe we have made adequate provisions to cover both current and contemplated general and specific litigation risks, and we believe these matters will be resolved without any significant effect on our operations, financial position and results of operations. We are sometimes able to make and disclose reasonable estimates of the expected loss or range of possible loss, as well as disclose any provision accrued for such loss. However, for a limited number of ongoing legal proceedings, we may not be able to make a reasonable estimate of the expected loss or range of possible loss or may be able to do so but believe that disclosure of such information on a case-by-case basis would seriously prejudice our position in the ongoing legal proceedings or in any related settlement discussions. Accordingly, in these cases, we have disclosed qualitative information with respect to the nature and characteristics of the contingency, but have not disclosed the estimate of the range of potential loss.
165
Serious News for Serious Traders! Try StreetInsider.com Premium Free!
You May Also Be Interested In
- Payward Services to Unlock Pre-IPO Access to Bending Spoons Through xStocks
- Fix Mold Miami Introduces Next-Generation Fiberglass Restoration to Safeguard Indoor Air Quality Across South Florida
- EVA Air Debuts the First Washington, D.C. to Taipei Nonstop Service
Create E-mail Alert Related Categories
SEC FilingsSign up for StreetInsider Free!
Receive full access to all new and archived articles, unlimited portfolio tracking, e-mail alerts, custom newswires and RSS feeds - and more!