

Form 6-K CANADIAN NATIONAL RAILWA For: Apr 28
 Tweet
Tweet Share
Share
UNITED STATES
SECURITIES AND EXCHANGE COMMISSION
Washington, D.C. 20549
Form 6-K
REPORT OF FOREIGN ISSUER PURSUANT TO RULE 13a-16 OR 15d-16
OF THE SECURITIES EXCHANGE ACT OF 1934
For the month of March 2020
Commission File Number: 001-02413
Canadian National Railway Company
(Translation of registrant’s name into English)
935 de la Gauchetiere Street West
Montreal, Quebec
Canada H3B 2M9
(Address of principal executive offices)
Indicate by check mark whether the registrant files or will file annual reports under cover of Form 20-F or Form 40-F:
Form 20-F o Form 40-F x
Indicate by check mark if the registrant is submitting the Form 6-K in paper as permitted by Regulation S-T Rule 101(b)(1):
Yes o No x
Indicate by check mark if the registrant is submitting the Form 6-K in paper as permitted by Regulation S-T Rule 101(b)(7):
Yes o No x
Indicate by check mark whether by furnishing the information contained in this Form, the Registrant is also thereby furnishing the information to the Commission pursuant to Rule 12g3-2(b) under the Securities Exchange Act of 1934:
Yes o No x
If “Yes” is marked, indicate below the file number assigned to the registrant in connection with Rule 12g3-2(b): N/A
SIGNATURES
Pursuant to the requirements of the Securities Exchange Act of 1934, the registrant has duly caused this report to be signed on its behalf by the undersigned, thereunto duly authorized.
|
|
|
|
Canadian National Railway Company | ||
|
Date: |
March 24, 2020 |
|
|
|
|
|
|
|
|
By: |
/s/ Sean Finn | |
|
|
|
|
|
Name: |
Sean Finn |
|
|
|
|
|
Title: |
Executive Vice-President Corporate Services and Chief Legal Officer |
CANADIAN NATIONAL RAILWAY COMPANY
|
Items |
|
Description |
|
|
|
|
|
1 |
|
|
|
|
|
|
|
2 |
|
|
|
|
|
|
|
3 |
|
|
|
|
|
|
|
4 |
|
|
|
|
|
|
|
5 |
|
Notice of Availability of Materials for the 2020 Annual Meeting of Shareholders Canadian National Railway Company Our annual meeting of holders of common shares will be conducted solely via a live webcast meeting on Tuesday, April 28, 2020 at 10:00 a.m. (Eastern Daylight Time) at www.virtualshareholdermeeting.com/CNI2020. At this website, shareholders will be able to attend the meeting live, submit questions and vote their shares while the meeting is being held. For the purposes of: 1. receiving the consolidated financial statements for the year ended December 31, 2019, and the auditors’ reports thereon (for details, see subsection “Financial Statements” under the “Business of the Meeting” section of the management information circular dated March 10, 2020 (the “Information Circular”)); 2. electing the directors (for details, see subsection “Election of Directors” under the “Business of the Meeting” section of the Information Circular); 3. appointing the auditors (for details, see subsection “Appointment of Auditors” under the “Business of the Meeting” section of the Information Circular); 4. considering and approving, in an advisory, non-binding capacity, a resolution (the full text of which is set out on page 9 of the Information Circular) accepting Canadian National Railway Company’s (the “Company”) approach to executive compensation as disclosed in the “Statement of Executive Compensation” section of the Information Circular (for details, see subsection “Advisory Vote on Executive Compensation” under the “Business of the Meeting” section of the Information Circular); and 5. transacting such other business as may properly be brought before the meeting or any adjournment or postponement thereof (for details, see subsection “Other Business” under the “Business of the Meeting” section of the Information Circular). The Board of Directors has fixed March 6, 2020 as the record date (the “Record Date”) for the determination of the holders of common shares entitled to receive notice of the meeting and vote at the meeting.

Notice-And-Access This year, as permitted under Canadian securities rules, you are receiving this notification as the Company has opted to use the “notice-and-access” mechanism for delivery of this notice of annual meeting of shareholders, the Information Circular prepared in connection with the Meeting, the Annual Financial Statements and other proxy-related materials (collectively, the “Meeting Materials”) to its shareholders. In lieu of mailing physical copies of the Meeting Materials to shareholders, the “notice-and-access” provisions allow Canadian companies to send shareholders a notice about how to access Meeting Materials online and how to request that a paper copy be sent to them. The use of notice and access allows for faster access to the Meeting Materials, contributes to the protection of the environment, is consistent with our sustainability strategy and helps reduce printing and postage costs. The Meeting Materials are available electronically via the links mentioned below. To receive a physical copy of the Meeting Materials, please follow the instructions set out in this notice. Shareholders who have already signed up for electronic delivery of Meeting Materials will continue to receive them by email. Shareholders will continue to receive by mail a proxy form or voting instruction form enabling them to vote at the Company’s Meeting. How to Access the Meeting Materials The Meeting Materials are available on our website (www.cn.ca/en/investors/), on the website of our transfer agent, Computershare Trust Company of Canada (“Computershare”) (www.envisionreports.com/CNR2020), on SEDAR (www.sedar.com) and on the U.S. Securities and Exchange Commission (“SEC”) website (www.sec.gov) through EDGAR. How to Request a Paper Copy of the Meeting Materials Before the Meeting You may request paper copies of the Meeting Materials at no cost up to one year from the date the Information Circular was filed on SEDAR (on or about March 24, 2020). Your request should be received at least ten (10) business days prior to the Meeting date in order to receive the Meeting Materials in advance of such date and the Meeting date. You may request paper copies of the Meeting Materials by calling 1-877-907-7643 and entering the control number provided on the form of proxy or the voting instruction form and following the instructions provided. Please note that you will not receive another form of proxy or voting instruction form. Please retain your current one to vote your common shares. After the Meeting By contacting Broadridge at 1-877-907-7643 or Computershare via their website (www.investorcentre.com/service) or by phone at 1-800-564-6253, a copy of the Meeting Materials will be sent to you within ten (10) calendar days of receiving your request. Voting You may vote your common shares on the Internet, by phone or by mail. Please refer to the instructions on your separate form of proxy or voting instruction form, as applicable, on how to vote using these methods. If you wish to vote at the meeting, you do not need to complete or return your proxy form or voting instruction form, as applicable. The day of the Meeting, you may vote via the live webcast by completing a ballot online during the Meeting. You will need to visit www.virtualshareholdermeeting.com/CNI2020 and check-in using your control number included on your proxy form or voting instruction form, as applicable. The deadline for receiving duly completed forms of proxy or voting instruction forms or a vote using the telephone or over the Internet ahead of the Meeting is 5:00 p.m. (Eastern Daylight Time) on April 27, 2020. Shareholders are reminded to read the information circular and other meeting materials carefully before voting their common shares. Questions If you have any questions regarding this notice, the notice-and-access mechanism or the Meeting you can contact Broadridge at 1-855-887-2244 or Computershare via their website (www.investorcentre.com/service) or by phone at 1-800-564-6253.
Notice of Annual Meeting of Shareholders Our annual meeting of holders of common shares will be conducted solely via a live webcast meeting on Tuesday, April 28, 2020 at 10:00 a.m. (Eastern Daylight Time) at www.virtualshareholdermeeting.com/CNI2020. At this website, shareholders will be able to attend the meeting live, submit questions and vote their shares while the meeting is being held. For the purposes of: 1. receiving the consolidated financial statements for the year ended December 31, 2019, and the auditors’ reports thereon; 2. electing the directors; 3. appointing the auditors; 4. considering and approving, in an advisory, non-binding capacity, a resolution (the full text of which is set out on page 9 of the accompanying management information circular) accepting the Company’s approach to executive compensation as disclosed in the “Statement of Executive Compensation” section of the accompanying management information circular; and 5. transacting such other business as may properly be brought before the meeting or any adjournment or postponement thereof. The Board of Directors has fixed March 6, 2020 as the Record Date for the determination of the holders of common shares entitled to receive notice of the meeting and vote at the meeting. By order of the Board of Directors Sean Finn Executive Vice-President Corporate Services and Chief Legal Officer and Corporate Secretary March 10, 2020 Montreal, Quebec
ONWARD TOGETHER MANAGEMENT INFORMATION CIRCULAR AND NOTICE OF ANNUAL MEETING OF SHAREHOLDERS APRIL 28, 2020

Notice of Annual Meeting of Shareholders Our annual meeting of holders of common shares will be conducted solely via a live webcast meeting on Tuesday, April 28, 2020 at 10:00 a.m. (Eastern Daylight Time) at www.virtualshareholdermeeting.com/CNI2020. At this website, shareholders will be able to attend the meeting live, submit questions and vote their shares while the meeting is being held. For the purposes of: 1. receiving the consolidated financial statements for the year ended December 31, 2019, and the auditors’ reports thereon; 2. electing the directors; 3. appointing the auditors; 4. considering and approving, in an advisory, non-binding capacity, a resolution (the full text of which is set out on page 9 of the accompanying management information circular) accepting the Company’s approach to executive compensation as disclosed in the “Statement of Executive Compensation” section of the accompanying management information circular; and 5. transacting such other business as may properly be brought before the meeting or any adjournment or postponement thereof. The Board of Directors has fixed March 6, 2020 as the Record Date for the determination of the holders of common shares entitled to receive notice of the meeting and vote at the meeting. By order of the Board of Directors Sean Finn Executive Vice-President Corporate Services and Chief Legal Officer and Corporate Secretary March 10, 2020 Montreal, Quebec

Letter to Shareholders March 10, 2020 Dear Shareholder: On behalf of the Board of Directors (the “Board” or “Board of Directors”) and management of Canadian National Railway Company (the “Company” or “CN”), we cordially invite you to attend the annual meeting of shareholders, which will be held on Tuesday April 28, 2020 at 10:00 a.m. (Eastern Daylight Time). This management information circular (the “Information Circular”) describes the business to be conducted at the meeting and provides information on executive compensation and CN’s governance practices. In addition to these items, we will discuss highlights of our 2019 performance and our plans for the future. 2019 was a historic year for CN as we celebrated 100 years on the move. We’ve certainly come a long way in the past century thanks to the support of thousands of dedicated employees, customers, supply chain partners, shareholders and other stakeholders. Delivering responsibly is at the heart of how we are building for the future. It means moving customer goods safely and efficiently, being environmentally responsible, attracting and developing the best and diverse railroaders, helping build safer, stronger communities, while adhering to the highest ethical standards. Five principles anchor our sustainability commitment: Safety, Environment, People, Community, and Governance. We believe rail has a tremendous potential to reduce the environmental impact of transportation. As a mover of the economy, CN is committed to playing a key role in the transition to a lower carbon economy. Our sustainability performance has continued to earn us a place among the world’s best for several years running. For example, we are proud to have been consistently listed on the Dow Jones Sustainability World Index, recognized as a leader by the CDP, ranked again as one of the Best 50 Corporate Citizens in Canada by Corporate Knights, and are a proud member of the FTSE4Good Index, Global Challenges Index and the Jantzi Social Index. We have also received many accolades for our performance in corporate governance over the years, including ranking again first in the industrials group and seventh overall among Canadian publicly traded companies on the Globe and Mail’s 2019 review of corporate governance practices. We also prioritize community engagement. Over the past century, CN has been proud to be an important part of the many cities, towns and Aboriginal communities across our network. Our goal is to get involved in local efforts, bring people together and create positive, lasting change through trust and integrity. One example is how we work with communities to enhance emergency preparedness through training, risk assessments, and information sharing. The annual meeting of shareholders will be held online, through a live webcast meeting. You will be able to attend the meeting online and submit your questions during the meeting by visiting www.virtualshareholdermeeting.com/CNI2020. You will also be able to vote your shares electronically during the meeting. We are pleased to embrace the latest technology to provide easy access, improved communication, and cost savings for our shareholders and the Company. We believe hosting an online webcast meeting helps enable greater participation by our shareholders by allowing shareholders that might not otherwise be able to travel to a physical meeting to attend online and participate from any location around the world. Holding an online webcast shareholder meeting minimizes the health risk that may be associated with large gatherings and is also in line with our sustainability vision and belief. Your participation in the affairs of the Company is important to us. If you attend the meeting via webcast, you will have the opportunity to interact with members of the Board and senior executive officers of the Company. We encourage you to complete and return the enclosed proxy form or voting instruction form in the envelope provided for this purpose, so that your views can be represented. Even if you plan to attend the meeting, you may find it convenient to vote your shares in advance of the meeting over the internet or by completing and returning the enclosed proxy form or voting instruction form, as applicable. Please consult the information on page 5 of the Information Circular to find out how to attend the meeting online and vote your shares. Robert Pace, D.COMM., C.M. Chair of the Board Jean-Jacques Ruest President and Chief Executive Officer 1 CN MANAGEMENT INFORMATION CIRCULAR 2020 LETTER TO SHAREHOLDERS

What’s Inside Notice of Annual Meeting of Shareholders 3 Proxy Summary 5 Delivery of Meeting Materials and Voting Information 1 Letter to Shareholders 8 Business of the Meeting 10 Nominees for Election to the Board 17 Board of Directors Compensation 22 Statement of Corporate Governance Practices 34 Statement of Executive Compensation 38 Compensation Discussion and Analysis 67 Other Information 68 Schedule A – Mandate of the Board 69 Schedule B – Reports of the Committees 75 Schedule C – Additional Audit Committee Disclosure This Information Circular is provided in connection with the solicitation of proxies by management of Canadian National Railway Company for use at the annual meeting of its shareholders or at any adjournment or postponement thereof (the “Meeting”). In this document “you” and “your” refer to the shareholders of CN and “CN”, the “Company”, “we”, “us”, or “our” refer to Canadian National Railway Company. The Meeting will be held on Tuesday, April 28, 2020, at 10:00 a.m. (Eastern Daylight Time) for the purposes set forth in the foregoing Notice of Meeting. The information contained herein is given as at February 27, 2020, except as indicated otherwise. Shareholder Voting Matters and Recommendation V OTING M AT TER Election of 13 Directors V OTING M AT TER Appointment of KPMG LLP as Auditors V OTING M AT TER Advisory Resolution on Executive Compensation BOARD VOTE RECOMMENDATION FOR each nominee BOARD VOTE RECOMMENDATION FOR BOARD VOTE RECOMMENDATION FOR FOR MORE INFORMATION SEE PAGE 8 FOR MORE INFORMATION SEE PAGE 8 FOR MORE INFORMATION SEE PAGE 9 2 CN MANAGEMENT INFORMATION CIRCULAR 2020

The following summary highlights some of the important information you will find in this Information Circular, as well as information about our Company. We recommend that you read the entire Information Circular before voting. Proxy Summary Board of Directors Highlights 5X Director’s share ownership set at 5 times the annual director retainer within 5 years 49 100% Combined number of board and committee meetings held in 2019 Board and committee attendance in 2019 0 100% Percentage of board members, other than our CEO, who are independent 38% Board members that sit together on the Percentage of board members board of another public company who are women Our Director Nominees SHARE OTHER OWNERSHIP (2) TOP 3 COMPETENCIES (1) DIRECTOR SINCE PUBLIC BOARDS % OF VOTES FOR 2019 (MULTIPLE OF REQUIREMENT) NAME / AGE POSITION Shauneen Bruder (60) Finance, Strategy, Sales 2017 Corporate Director 1 0.9 99.62 Donald J. Carty (73) Strategy, Finance, HR 2011 Corporate Director 2 8 99.03 Gordon D. Giffin (70) Policy, Legal, HR 2001 Partner, Dentons US LLP 2 8 96.06 Julie Godin (45) HR, Strategy, Finance 2017 Co-Chair of the Board and Executive Vice-President, Strategic Planning and Corporate Development, CGI Inc. 1 0.9 99.20 Edith E. Holiday (68) Legal, Policy, Strategy 2001 Corporate Director and Trustee 4 8 88.22 V. Maureen Kempston Darkes (71) Transport, Sales, HR 1995 Corporate Director 2 15 95.21 Denis Losier (67) Finance, HR, Sales 1994 Corporate Director 1 22 93.52 Kevin G. Lynch (69) Policy, Finance, Strategy 2014 Vice-Chair, BMO Financial Group 1 2 92.07 James E. O’Connor (70) Strategy, Engineering, HR 2011 Corporate Director 2 3 99.55 Robert Pace (65) HR, Transport, Strategy 1994 Chair of the Board, CN President and CEO, The Pace Group 1 11 95.13 Robert L. Phillips (69) Transport, Strategy, Sales 2014 President, R.L. Phillips Investments Inc. 4 (3) 2 98.07 Jean-Jacques Ruest (65) Sales, Transport, Strategy 2018 President and Chief Executive Officer, CN — Note 4 99.36 Laura Stein (58) Legal, Engineering, Finance 2014 Executive Vice-President – General Counsel & Corporate Affairs, The Clorox Company 1 2 93.30 (1) Refer to description of competencies on page 27 of this Information Circular. (2) For a discussion on the shareholding requirements of the Board Chair and non-executive directors, please see section on “Share Ownership” on page 19 of this Information Circular. (3) Will be a member of three public boards other than CN starting in May 2020. (4) For a discussion on Mr. Ruest’s shareholding requirements, please see section on “Stock Ownership” on page 47 of this Information Circular. 3 CN MANAGEMENT INFORMATION CIRCULAR 2020 PROXY SUMMARY

2019 Key Business Highlights Employees at year end 25,975 Revenues $14.9 B Free cash flow (1) $2.0 B Capital investments $3.9 B Reported diluted earnings per share $5.83 Adjusted diluted earnings per share (1) $5.80 Key Environment, Social & Governance Highlights 38% Adopted a policy of having a minimum representation of 1/3 of the Board by women; 38% of our directors are women. Transparency Publicly disclosing on www.cn.ca website information on our lobbying activities, a list of our political contributions and a detailed list of our corporate memberships, including industry associations and policy organizations. Iconic Brand Recognized by Interbrand Canada as one of the 150 companies, organizations and institutions that are the most iconic in Canada. Catalyst Accord Signatory to the Catalyst Accord 2022 which promotes gender diversity on boards and executive management. Climate Change Over the past 25 years, CN has reduced its locomotive emission intensity by 39% while achieving record growth in the volume of freight it moves. In support of keeping the global temperature increase below 2 degrees Celsius compared to pre-industrial temperatures, in 2018, CN was the first railroad in North America to set a science-based target of 29% emission intensity reduction by 2030 based on 2015 levels. Sustainability Leader For eight consecutive years, CN has been listed on the DJSI World Index and for 11 consecutive years on the DJSI North America Index. In 2019, CN was the only Canadian company listed in the Transportation and Transportation Infrastructure sector. Best Corporate Citizen Ranked among the Best 50 Corporate Citizens in Canada by Corporate Knights for the 11 consecutive year in a row. First th Recognized by the Globe and Mail’s annual review of corporate governance practices in Canada, where CN ranked 1st in the industrials group and 7th overall. Executive Compensation Disciplined Approach to Compensation CN’s approach to executive compensation is driven by a commitment to deliver sustainable and solid returns to shareholders. CN exercises a disciplined approach to executive compensation by ensuring that target compensation, while reasonable, supports attraction and retention of executive talent. In addition, short-and long-term incentive plans are structured to align realized pay and shareholder returns. Compensation programs are designed to encourage appropriate behaviours and include appropriate risk mitigation mechanisms. The executive compensation policy aims to position target total direct compensation between the median and the 60th percentile of the executives’ respective comparator group. • ~ 77% of NEOs’ target total direct compensation is variable and linked to CN’s performance • Incentive payout capped and no guaranteed minimum payout • Inclusion of a relative total shareholder return condition as a performance measure for Performance Share Units Best practices adopted by CN • Safety component in the Annual Incentive Bonus Plan has been extended to all senior management employees in 2019 • Increased stock ownership requirements introduced in 2019 • President and CEO post-employment shareholding requirement • Extended executive clawback policy allowing the clawback of bonus or incentive based compensation awarded after March 7, 2017 in circumstances of gross negligence, intentional misconduct, fraud, theft or embezzlement without the need for a financial restatement • No employment contracts for NEOs • Benchmark compensation against a reasonable / size appropriate peer group • Double trigger change-of-control provisions • Provide shareholders an annual say on pay vote All NEOs 2019 Target Pay at Risk 23.4% Base Salary 76.6% At-Risk (1) See the section entitled Adjusted performance measures in CN’s Management’s Discussion and Analysis included in the Company’s 2019 Annual Report for an explanation of this measure and reconciliation to the nearest GAAP measure. 4 CN MANAGEMENT INFORMATION CIRCULAR 2020 PROXY SUMMARY 18.6% Annual Incentive Bonus Plan 33.7% Performance Share Units Awards 24.3% Stock Options Awards

Delivery of Meeting Materials and Voting Information Your Vote is Important As a shareholder, it is important that you read this Information Circular carefully and then vote your shares, either before or at the Meeting. The following section provides you with information on how to vote your shares. Notice and Access This year, as permitted under Canadian Securities Rules and pursuant to exemptions from the sending of financial statements and proxy solicitation requirements granted by the Director of Corporations Canada, we are using “Notice and Access” to deliver this Information Circular to both registered and non-registered shareholders. Instead of receiving a paper copy of the Information Circular in the mail, shareholders who hold common shares of CN on March 6, 2020, the record date for the Meeting, have access to it online. Shareholders will receive a package in the mail with a notice (the “Notice”) explaining how to access the Information Circular electronically and how to request a paper copy of it. A form of proxy for registered shareholders or a voting instruction form for non-registered shareholders or Employee Shares, will be included with the Notice with instructions on how to vote your shares. Adopting Notice and Access allows for faster access to the Information Circular, contributes to the protection of the environment, is consistent with our sustainability strategy and helps reduce printing and postage costs. How to access the Information Circular electronically T h e In format i on Ci r cul ar i s a v ai l abl e on our we bs i t e (www.cn.ca/investors) and on the website of our transfer agent, Computershare Trust Company of Canada (Computershare) (www.envisionreports.com/CNR2020), on SEDAR (www.sedar.com) and on the U.S. Securities and Exchange Commission (“SEC”) website (www.sec.gov) through EDGAR. How to request a paper copy of the Information Circular and Financial Statements You may request paper copies of the Information Circular and Financial Statements at no cost up to one year from the date the Information Circular was filed on SEDAR (on or about March 24, 2020). Your request should be received at least ten (10) business days prior to the Meeting date in order to receive the Information Circular in advance of such date and the Meeting date. You may request paper copies of either the Information Circular and Financial Statements by calling 1-877-907-7643 and entering the control number provided on the proxy form or the voting instruction form and following the instructions provided. If you request a paper copy of the Information Circular note that you will not receive a new form of proxy or voting instruction form, so you should keep the original form sent to you in order to vote. Questions? If you have questions about Notice and Access or to request a paper copy of the Information Circular after the Meeting at no charge, you can contact Broadridge at 1-877-907-7643 or Computershare via their website (www.investorcentre.com/service) or by phone at 1-800-564-6253. Important information about the Meeting The Meeting will be conducted online only, via a live webcast. Shareholders will not be able to attend the Meeting in person. You will be able to attend, participate and vote at the Meeting online via the webcast. Board members and senior executive officers will participate in the Meeting and be available for questions. Attending the Online Annual Meeting To participate in the Meeting, shareholders (registered, non-registered and holders of Employee Shares) will need to visit www.virtualshareholdermeeting.com/CNI2020 and check-in using the control number included either on your proxy form or voting instruction form, as applicable. The Meeting platform is fully supported across browsers and devices running the most updated version of applicable software plugins. You should ensure you have a strong, preferably high-speed, internet connection wherever you intend to participate in the Meeting. The Meeting will begin promptly at 10:00 a.m. (Eastern Daylight Time) on April 28, 2020. Online check-in will begin starting an hour prior, at 9:00 a.m. (Eastern Daylight Time). You should allow ample time for online check-in procedures. For any technical difficulties experienced during the check-in process or during the Meeting, please call 1-800-586-1548 (Canada and U.S.) or 1-303-562-9288 (international toll-free) for assistance. The webcast Meeting allows you to attend the Meeting live, submit questions and submit your vote while the Meeting is being held if you have not done so in advance of the Meeting. CN is also providing a toll-free conference call for shareholders that do not have internet access or that prefer that method, either to verbally ask a question at the Meeting, or to listen in as an alternative to the webcast. Using your control number included either on your proxy form or voting instruction form, as applicable, you will be able to listen to the Meeting proceedings and submit your question verbally during the Meeting; however, you will not be able to vote your shares on the phone during the Meeting and will have to use the online webcast for that purpose if you have not done so in advance of the Meeting. To join the conference call, you must call 1-877-328-2502 (Canada and U.S.) or 1-412-317-5419 (international toll-free). Guests will be able to attend the Meeting through the live webcast only, by joining the webcast as a guest www.virtualshareholdermeeting. com/CNI2020. They will not be able to submit questions or vote. They will not be allowed to dial into the conference call. Submitting Questions Following the Meeting, we will hold a live Q&A session, during which we intend to answer all written questions submitted before or during the Meeting. Only shareholders may submit questions at the Meeting, either before or during the Meeting. To ask a question before the Meeting, you need go to proxyvote.com and log in using your control number included either on your proxy form or voting instruction form, as applicable. Once 5 CN MANAGEMENT INFORMATION CIRCULAR 2020 VOTING INFORMATION

past the log-in screen, please click on “Questions for Management,” type in your question and click “Submit.” To ask a question during the Meeting you may do so in two ways: in writing through the live webcast at www.virtualshareholdermeeting.com/CNI2020 after logging-in, type your question into the “Ask a Question” field, and click “Submit”; or verbally through the conference call by dialing 1-877-328-2502 (Canada and U.S.) or 1-412-317-5419 (international toll-free) using your control number. A meeting operator will queue-in your question and open the line at the appropriate time. Guests will not be able to submit questions either before or during the Meeting. The Chair of the Meeting reserves the right to edit or reject questions he deems profane or otherwise inappropriate in accordance with the rules of conduct of the Meeting which are available at www.cn.ca/en/investors/ and following the Meeting web page. Any questions pertinent to the Meeting that cannot be answered during the Meeting due to time constraints will be posted online and answered at www.cn.ca/en/investors/. The questions and answers will be available as soon as practical after the Meeting and will remain available until one week after posting. The Chair of the Meeting has broad authority to conduct the Meeting in an orderly manner. To ensure the Meeting is conducted in a manner that is fair to all shareholders, the Chair of the Meeting may exercise broad discretion in the order in which questions are asked and the amount of time devoted to any one question. Consistent with our prior in-person annual meetings, all questions submitted in accordance with our rules of conduct for shareholders meeting generally are addressed in the order received. Who can vote Shareholders at the close of business on March 6, 2020 (the “Record Date”), are entitled to vote at the Meeting or at any adjournment or postponement thereof, either personally or by proxy. As of the close of business on the Record Date, the Company had 712,016,062 common shares without par value outstanding. Subject to the voting restrictions described in this section, each common share carries the right to one vote. How to vote If you are eligible to vote and your common shares are either registered in your name or are held in the name of a nominee (non-registered or Employee Shares), you can vote your common shares at the Meeting or by proxy in advance of the Meeting, as explained below. Voting by proxy in advance of the Meeting is the easiest way to vote your shares. The same procedures apply whether you are a registered shareholder, non-registered shareholder or holder of Employee Shares. You are a registered shareholder if your name appears on your share certificate or your Direct Registration System (DRS) confirmation. If you are a registered shareholder, you will receive a proxy form containing the relevant details concerning the business of the Meeting, including a control number that must be used to vote by proxy in advance of the Meeting or join the live webcast and phone line the day of the Meeting to attend the Meeting live, submit your questions and submit your vote while the Meeting is being held. If your common shares are not registered in your name and are held in the name of a nominee such as a trustee, financial institution or securities broker, you are a non-registered shareholder. If your common shares are listed in an account statement provided to you by your broker, those common shares will, in all likelihood, not be registered in your name. Such common shares will more likely be registered under the name of your broker or an agent of that broker. Without specific instructions, brokers and their agents or nominees are prohibited from voting shares for the broker’s client. If you are a non-registered shareholder, you will receive a voting instruction form containing the relevant details concerning the business of the Meeting, including a control number that must be used to vote by proxy in advance of the Meeting or join the live webcast and phone line the day of the Meeting to attend the Meeting live, submit your questions and submit your vote while the Meeting is being held. Common shares purchased by employees of the Company under its Canadian and U.S. Employee Share Investment Plans and its Savings Plan for U.S. Operations (the “Plans”) are known as Employee Shares. Employee Shares remain registered in the name of the Plans’ Custodian (currently Computershare Trust Company of Canada or Fidelity Institutional Retirement Services Company, as applicable), unless the employees have withdrawn their common shares from the Plans in accordance with their provisions. If you are a holder of Employee Shares you will receive a voting instruction form containing the relevant details concerning the business of the Meeting, including a control number that must be used to vote by proxy in advance of the Meeting or join the live webcast and phone line the day of the Meeting to attend the Meeting live, submit your questions and submit your vote while the Meeting is being held. Vote in advance of the Meeting - Voting by Proxy Below are the different ways in which you can give your voting instructions, details of which are found in the proxy form or voting instruction form, as applicable, accompanying this Information Circular: Go to www.proxyvote.com and follow the instructions. You will need your control number found on your proxy form or voting instruction form, as applicable. Complete and return the proxy form or voting instruction form as applicable, in the prepaid envelope provided. INTERNET MAIL Call 1-800-474-7493 (English) or 1-800-474-7501 (French). You will need your control number found on your proxy form or voting instruction form, as applicable. Complete the proxy form or voting instruction form, as applicable and return it by fax at 905-507-7793 or 514-281-8911. PHONE FAX If you are using mail, your duly completed proxy form or voting instruction form, as applicable must have been received by our proxy tabulator with sufficient time for your vote to be processed, and in all cases, no later than 5:00 p.m. on April 24, 2020 (Eastern Daylight Time). For all other methods, you must have voted before 5:00 p.m. on April 27, 2020, (Eastern Daylight Time) or if the Meeting is adjourned or postponed, by no later than 5:00 p.m. on the business day prior to the day fixed for the adjourned or postponed Meeting. Voting at the Meeting If you wish to vote at the meeting, you do not need to complete or return your proxy form or voting instruction form, as applicable. The day of the Meeting, all shareholders, whether you are a registered or non-registered shareholder or holder of Employee Shares, you will be able to vote via the live webcast by completing a ballot online during the Meeting. You will need to visit www.virtualshareholdermeeting.com/CNI2020 and check-in using your control number included on your proxy form or voting instruction form, as applicable, as further described under “Attending the Online Meeting”. If you wish to appoint someone as proxy to vote your shares for you at the Meeting during the live webcast, please follow the instructions found on either your proxy form or voting instruction form, as applicable. You will need to create a unique eight-character identification number which will allow your appointee to join the Meeting and vote your shares on your behalf. WEBCAST 6 CN MANAGEMENT INFORMATION CIRCULAR 2020 VOTING INFORMATION

How your Shares will be Voted You can choose to vote FOR, WITHHOLD or AGAINST, depending on the items to be voted on. When you vote by proxy, you may appoint either the persons named as proxies in the proxy form or voting instruction form (who are the Board Chair and the President and Chief Executive Officer of the Company, or in the case of Employee Shares, Computershare Trust Company of Canada or Fidelity Institutional Retirement Services Company) or you may appoint someone else to vote for you as your proxy holder by using the enclosed form of proxy or voting instruction form. You have the right to appoint any other person or company (who need not be a shareholder) to attend and act on your behalf at the Meeting. That right may be exercised by writing the name of such person or company in the blank space provided, and following the instructions, found in the proxy form or voting instruction form, or by completing another proper form of proxy. Make sure that the person you appoint is aware that he or she is appointed and that this person log into the online Meeting using the credentials you created for him/her as your appointee. Your common shares will be voted or withheld from voting in accordance with your instructions indicated on the proxy form or voting instruction form. If no instructions are indicated, your common shares represented by proxies in favour of the Board Chair or the President and Chief Executive Officer (or in the case of Employee Shares, Computershare Trust Company of Canada or Fidelity Institutional Retirement Services Company) will be voted as follows: Changing your Vote You may revoke your proxy at any time, by voting again on the Internet or by phone or fax before 5:00 p.m. on April 27, 2020 (Eastern Daylight Time) or by following the below instructions: • by completing an instrument in writing (which includes another form of proxy or voting instructions form, as applicable with a later date) executed by you, or by your attorney (duly authorized in writing), and: • deposited with the Corporate Secretary of the Company at the registered office of the Company (935 de La Gauchetière Street West, 16th Floor, Montreal, Quebec, Canada, H3B 2M9) at any time up to and including 5:00 p.m. on April 27, 2020 (Eastern Daylight Time) or any adjournment or postponement thereof. filed electronically with the chair of the Meeting (at [email protected]) on the day of the Meeting or any adjournment or postponement thereof, or in any other manner permitted by law. • CN’s Voting Restrictions Our articles of continuance, as amended, provide that no person, together with his or her associates, shall hold, beneficially own or control, directly or indirectly, voting shares to which are attached more than 25% in the aggregate of the votes attached to all our voting shares that may ordinarily be cast to elect directors of the Company. In addition, where the total number of voting shares held, beneficially owned or controlled, directly or indirectly, by any one person together with his or her associates exceeds such 25% maximum, no person shall, in person or by proxy, exercise the voting rights attached to the voting shares held, beneficially owned or controlled, directly or indirectly, by such person or his or her associates. To the knowledge of the directors and senior officers of the Company, based on the most recent publicly available information, the only person who beneficially owns, or directly or indirectly exercises control or direction over, shares carrying 10% or more of the voting rights attached to any class of shares of the Company is Mr. William H. Gates, III. Mr. Gates is the sole member of Cascade Investment, L.L.C. (“Cascade”). Cascade held 101,400,770 common shares of the Company on the Record Date, representing 14.24% of the outstanding common shares of the Company. In addition, Mr. Gates is a co-trustee of the Bill & Melinda Gates Foundation Trust, which held 17,126,874 common shares of the Company on the Record Date, representing 2.40% of the outstanding common shares of the Company. Hence, on the Record Date, Mr. Gates is deemed to have control or direction over 118,527,644 common shares, representing 16.64% of the outstanding common shares of the Company. i) ii) iii) FOR the election of management’s nominees as directors FOR the appointment of KPMG LLP as auditors FOR, in an advisory, non-binding capacity, the approach to executive compensation disclosed in the “Statement of Executive Compensation” section of this Information Circular and at the discretion of the proxy holder in respect of amendments to any of the foregoing matters or on such other business as may properly be brought before the Meeting. Should any nominee named herein for election as a director become unable to accept nomination for election, it is intended that the person acting under proxy in favour of management will vote for the election in his or her stead of such other person as management of the Company may recommend. Management has no reason to believe that any of the nominees for election as directors will be unable to serve if elected to office and is not aware of any amendment or other business likely to be brought before the Meeting. The Board of Directors and management are recommending that shareholders vote FOR items (i), (ii) and (iii). A simple majority of the votes cast will constitute approval of each of these matters. Additional Information Proxy Solicitation Management of the Company is soliciting your proxy. The solicitation is being made primarily by mail, but our directors, officers or employees may also solicit proxies at a nominal cost to the Company. The Company has retained and will pay for the services of D.F. King, a division of AST Investor Services Inc. (“D.F. King”), for the solicitation of proxies in Canada and the U.S., at an aggregate cost estimated to be approximately C$31,000 plus additional costs relating to out-of-pocket expenses. Questions If you have questions about the information contained in this Information Circular or require assistance in completing your form of proxy or voting instruction form, please call D.F. King, the Company’s proxy solicitation agent, toll-free in North America at 1-800-239-6813 or at 1-212-771-1133 outside of North America; or by e-mail at [email protected]. Transfer Agent You can contact the transfer agent either by mail at Computershare Trust Company of Canada, 100 University Ave., 8th Floor, Toronto (Ontario) M5J 2Y1, by telephone at 1-800-564-6253, by fax at 1-888-453-0330 or by internet at www.investorcentre.com/service, or in French at www.centredesinvestisseurs.com/service. Intermediaries Fees Non-registered shareholders are either objecting beneficial owners who object that intermediaries disclose information about their ownership in the Company, or non-objecting beneficial owners, who do not object to such disclosure. The Company pays intermediaries to send proxy-related materials to both objecting and non-objecting beneficial owners. 7 CN MANAGEMENT INFORMATION CIRCULAR 2020 VOTING INFORMATION

Business of the Meeting Financial Statements Our consolidated financial statements for the year ended December 31, 2019, together with the auditors’ reports thereon, are included in the 2019 Annual Report of the Company, available on our website at www.cn.ca, on SEDAR at www.sedar.com, in the Company’s annual report on Form 40-F available on the SEC’s website at www.sec.gov through EDGAR, and in print, free of charge, to any shareholder who requests a copy by contacting our Corporate Secretary at (514) 399-7091 or Vice-President, Investor Relations at (514) 399-0052. Election of Directors Our articles of continuance, as amended, provide that our Board of Directors shall consist of a minimum of seven and a maximum of 21 directors. Pursuant to a resolution of the Board of Directors, 13 persons are to be elected as directors for the current year, each to hold office until the next annual meeting of shareholders or until such person’s successor is elected or appointed. The term of office of each of the present directors expires at the close of the Meeting. The persons named in the section entitled “Nominees for Election to the Board — Description of Nominees” will be presented for election at the Meeting as management’s nominees. All of the nominees proposed for election as directors are currently directors of the Company. All persons nominated were recommended to the Board of Directors by the Corporate Governance and Nominating Committee. Unless authority is withheld, the persons designated in the accompanying form of proxy or voting instruction form intend to vote FOR the election of the persons named in the section entitled “Nominees for Election to the Board — Description of Nominees”. These nominees are, in the opinion of the Board of Directors and management, well qualified to act as directors of the Company for the ensuing year and have confirmed their willingness to serve as directors. The Board of Directors and management do not contemplate that any of these nominees will be unable to serve as a director, but should that occur for any reason before the Meeting, the persons designated in the accompanying form of proxy or voting instruction form reserve the right to vote for another nominee at their discretion unless the shareholder who has given such proxy or voting instruction form has directed that the common shares be withheld from voting on the election of any of the directors. Majority Voting Policy The Board of Directors has adopted a policy which is part of our Corporate Governance Manual, to the effect that a nominee for election as a director of the Company who receives a greater number of votes “withheld” than votes “for”, with respect to the election of directors by shareholders, will tender his or her resignation to the Board Chair promptly following the meeting of shareholders at which the director is elected. The Corporate Governance and Nominating Committee will consider such offer and make a recommendation to the Board of Directors whether to accept it or not. The Board of Directors will make its decision and promptly announce it in a press release within 90 days following the meeting of shareholders, a copy of which will be provided to the Toronto Stock Exchange (“TSX”). The Board of Directors shall however, accept such resignation absent exceptional circumstances. The resignation shall be effective when accepted by the Board of Directors. The director who offered to tender his or her resignation should not be part of any committee or Board of Directors deliberations pertaining to the resignation offer. This policy only applies in circumstances involving an uncontested election of directors. An “uncontested election of directors” means that the number of director nominees is the same as the number of directors to be elected to the Board and that no proxy material is circulated in support of one or more nominees who are not part of the candidates supported by the Board of Directors. Appointment of Auditors The Board of Directors and the Audit Committee recommend that KPMG LLP be appointed to serve as the Company’s auditors until the next annual meeting of shareholders. The Audit Committee is responsible for recommending the appointment of the external auditors, evaluating and monitoring their qualifications, performance and independence, as well as assessing the appropriateness of the audit fees. KPMG LLP has served as the Company’s independent auditors since 1992. The Audit Committee continuously assesses the Company’s external auditors, and on an annual basis reviews the audit and non-audit fees, audit quality, independence, and tenure of our auditors, including the benefits and risks of having a long-tenured auditor and the controls and processes that help ensure KPMG’s independence. See “Schedule C – Additional Audit Committee Disclosure” for more details on auditors’ independence. For the years ended December 31, 2019 and 2018, the fees for audit, audit-related, tax and all other services provided to the Company by KPMG LLP were the following: Pursuant to the terms of its charter, the Audit Committee approves all audit and audit-related services, audit engagement fees and terms and all non-audit engagements provided by the external auditors. The Audit Committee pre-approved all the services performed by the auditors for audit, audit-related and non-audit related services for the years ended December 31, 2019 and 2018. The nature of the services under each category is described below. Audit Fees Consists of fees incurred for professional services rendered by the auditors in relation to the audit of the Company’s consolidated annual financial statements and those of its subsidiaries and the audit relating to the Company’s internal control over financial reporting. Audit-Related Fees Audit-related fees were incurred for professional services rendered by the auditors in relation to the audit of the financial statements for the Company’s pension plans, and for attestation services in connection with reports required by statute or regulation and due diligence and other services, including comfort letters, in connection with the issuance of securities and other audit-related fees. FEE (IN THOUSANDS) 2019 (C$) 2018 (C$) Audit Audit-related Tax All other 2,718 1,234 1,288 50 2,745 1,243 1,143 417 TOTAL FEES 5,290 5,548 8 CN MANAGEMENT INFORMATION CIRCULAR 2020 BUSINESS OF THE MEETING

Tax Fees Fees consist of compliance related services associated to cross-border employee tax filings, for assistance related to the preparation of Canadian and U.S. research and development tax credit filings and other tax compliance services. All Other Fees Consists of fees related to cybersecurity services and for services related to a foreign subsidiary. Unless authority is withheld, the persons designated in the accom-panying form of proxy or voting instruction form intend to vote FOR the appointment of KPMG LLP as auditors of the Company to hold office until the next annual meeting of shareholders. Advisory Vote on Executive Compensation The Company is again providing its shareholders with an opportunity to cast at the Meeting an advisory vote on the Company’s approach to executive compensation, as disclosed in the “Statement of Executive Compensation” section of this Information Circular. Such section describes the role of the Human Resources and Compensation Committee in overseeing compensation of executives and ensuring that it is linked to the Company’s three-year business plan. The section also describes the Company’s executive compensation principles, the structure of the compensation plans for executives, and the alignment of such plans with the interests of our shareholders. The Board of Directors recommends that shareholders vote FOR the resolution set out below and, unless otherwise instructed, the persons designated in the form of proxy or voting information form intend to vote FOR the following resolution: “RESOLVED that, on an advisory basis and not to diminish the role and responsibilities of the Board of Directors, the shareholders accept the approach to executive compensation disclosed in the section entitled ‘Statement of Executive Compensation’ of the Information Circular of the Company dated March 10, 2020.” The Board of Directors has adopted a policy to the effect that, if a majority of the shares represented in person or by proxy at a meeting are voted against the above non-binding advisory resolution, the Board Chair or the Chair of the Human Resources and Compensation Committee will oversee a process to engage with shareholders with a view to giving them the opportunity to express their specific concerns. The Board of Directors and the Human Resources and Compensation Committee will consider the results of this process and, if appropriate, review the Company’s approach to executive compensation in the context of shareholders’ specific concerns. Other Business Following the conclusion of the formal business to be conducted at the Meeting, we will: • discuss highlights of our 2019 performance and plans for the future, and • invite questions and comments from shareholders. As of the date of this Circular, management is not aware of any changes to these items and does not expect any other items to be brought forward at the Meeting. If there are changes or new items, your proxyholder can vote your shares on these items as he or she sees fit. 9 CN MANAGEMENT INFORMATION CIRCULAR 2020 BUSINESS OF THE MEETING

Nominees for Election to the Board Description of Nominees The following tables set out information as at February 27, 2020, unless otherwise indicated, and include a profile of each nominated director with an explanation of his or her experience, qualifications, top three competencies, participation on the Board and its committees, ownership of securities of CN, as well as participation on the boards of other public companies during the past five years. A more detailed description of our directors’ competencies can be found under the heading “Competency Matrix” in the section entitled “Statement of Corporate Governance Practices”. Each nominee is a current director of the Company. Shauneen Bruder Corporate Director Ms. Bruder was, until her retirement on October 31, 2019, the Executive Vice-President, Operations at the Royal Bank of Canada (“RBC”) where she was responsible for overseeing operations related to all personal and business clients in Canada. Her previous senior roles at RBC include Executive Vice-President of Business and Commercial Banking, Chief Operating Officer of the Global Wealth Management division and President of RBC Centura Banks, Inc. in North Carolina. She is a member of the Institute of Corporate Directors and is Chair of the Board of Governors for the University of Guelph. Previously, she was appointed as the Chairperson of the Canadian Chamber of Commerce and the Canadian American Business Council. She serves as Honorary Consul for Luxembourg in Toronto. In 2012, she was awarded the Queen’s Diamond Jubilee Medal. Ms. Bruder was inducted in the Women’s Executive Network 100 Most Powerful Women in Canada Hall of Fame in 2016. Ms. Bruder holds a B.A. from the University of Guelph and an MBA (Gold Medalist) from Queen’s University. AGE 60 (1) Ontario, Canada DIRECTOR SINCE April 25, 2017 Independent PRINCIPAL COMPETENCIES Finance/Accounting, Strategy, Sales/ Marketing MEMBER OF (2) ATTENDANCE 2019 OTHER CURRENT PUBLIC BOARD Board Donations and Sponsorships Committee (3) Environment, Safety and Security Committee(6) Finance Committee Human Resources and Compensation Committee Pension and Investment Committee(7) Strategic Planning Committee 100% 100% 100% 100% 100% 100% 100% Andrew Peller Limited (2018 - present) SECURITIES HELD Value at risk C$1,525,650(4) Common Shares Owned or Controlled (5) 13,125 9,873 February 2020 February 2019 99.62% votes in favour in 2019 Donald J. Carty, O.C., LL.D. Corporate Director Mr. Carty retired as Vice-Chairman and Chief Financial Officer of Dell, Inc. (computer manufacturer), a position he assumed from January 2007 until June 2008, and as Chairman and CEO of AMR Corporation and American Airlines in 2003 after 30 years in the airline business, where he previously served as President and Executive Vice-President of Finance & Planning of AMR Airline Group and American Airlines. He was President and CEO of CP Air from 1985 to 1987. In the voluntary sector, Mr. Carty is on the Executive Board of the SMU Cox School of Business. He is a former Chairman of Big Brothers Big Sisters of America. In 1999, Board Alert named Mr. Carty one of the year’s Outstanding Directors and in 2015, he was named to the top 100 of the National Association of Corporate Directors List. He was named an Officer of the Order of Canada in 2003. In addition to serving on the public boards mentioned in the following table, Mr. Carty serves as Chairman of the board of Porter Airlines, Inc. Mr. Carty holds a B.A. and an Honorary Doctor of Laws from Queen’s University and an MBA from Harvard Business School. AGE 73 (1) Texas, U.S.A. DIRECTOR SINCE January 1, 2011 Independent PRINCIPAL COMPETENCIES Strategy, Finance/ Accounting, Human Resources MEMBER OF (2) ATTENDANCE 2019 OTHER CURRENT PUBLIC BOARDS Board Audit Committee (Chair) Environment, Safety and Security Committee Human Resources and Compensation Committee Pension and Investment Committee (3) Strategic Planning Committee 100% 100% 100% 100% 100% 100% Hawaiian Holdings, Inc. VMWare, Inc. OTHER PUBLIC BOARDS DURING PAST 5 YEARS (2016 - present) (2015 - present) EMC Corporation Virgin America Inc. Talisman Energy Inc. (2015 - 2016) (2006 - 2016) (2009 - 2015) 99.03% votes in favour in 2019 SECURITIES HELD Value at risk C$12,062,471 (4) Common Shares Owned or Controlled (5) 105,518 101,858 February 2020 February 2019 10 CN MANAGEMENT INFORMATION CIRCULAR 2020 NOMINEES FOR ELECTION TO THE BOARD

Ambassador Gordon D. Giffin Partner, Dentons US LLP Mr. Giffin is a Partner of Dentons (law firm), where he maintains offices in Washington, D.C. and Atlanta, Georgia. He has been engaged in the practice of law or government service for more than thirty-five years. Mr. Giffin was United States Ambassador to Canada from 1997 to 2001. Mr. Giffin is a member of the Board of Trustees of the Jimmy Carter Presidential Center and is a member of the Council on Foreign Relations and the Tri-Lateral Commission. In addition to serving on the public boards mentioned in the following table, Mr. Giffin serves on the Board of Counsellors of McLarty Global and on the boards of directors of CIBC USA Holdings Inc. Mr. Giffin holds a B.A. from Duke University and a J.D. from Emory University School of Law. AGE 70 (1) Georgia, U.S.A. DIRECTOR SINCE May 1, 2001 Independent PRINCIPAL COMPETENCIES Public Policy, Legal, Human Resources MEMBER OF (2) ATTENDANCE 2019 OTHER CURRENT PUBLIC BOARDS Board Corporate Governance and Nominating Committee Environment, Safety and Security Committee Pension and Investment Committee (3) Strategic Planning Committee 100% 100% 100% 100% 100% Canadian Natural Resources Limited (Lead Director) TransAlta Corporation (Chair) OTHER PUBLIC BOARDS DURING PAST 5 YEARS (2002 - present) (2002 - present) ECN Capital Corp. Canadian Imperial Bank of Commerce Element Financial Corporation Just Energy Group Inc. (2016 - 2017) (2001 - 2017) (2013 - 2016) (2006 - 2015) 96.06% votes in favour in 2019 SECURITIES HELD Value at risk C$12,017,316 (4) Common Shares Owned or Controlled (5) 105,123 102,075 February 2020 February 2019 Julie Godin Co-Chair of the Board and Executive Vice-President, Strategic Planning and Corporate Development, CGI Inc. Ms. Godin is Co-Chair of the Board and Executive Vice-President, Strategic Planning and Corporate Development of CGI Inc. (“CGI”) (information technology consulting company) where she collaborates with the CGI Board to set the strategic direction of the company and maintain equilibrium among CGI’s three stakeholders — clients, employees (whom CGI calls members) and shareholders — to ensure each stakeholders’ long-term success. She also oversees the ongoing development of the CGI Management Foundation, which includes the key elements and best practices that define and guide the company’s actions, along with leading CGI’s strategic planning, marketing, communications and IP strategy functions. Previously Ms. Godin was Vice-Chair of the Board and Executive Vice-President, Chief Planning and Administration Officer, where Ms. Godin oversaw a number of functions across the company, including global security, mergers and acquisitions, and global human resources, including executive compensation and succession planning, as well as organizational model sustainability to secure organic growth. Before joining CGI, Ms. Godin founded Oxygen Corporate Health, a company that manages comprehensive health and wellness programs in the workplace. Oxygen merged its activities with those of CGI. In 2000, Ms. Godin co-founded the Godin Family Foundation, a non-profit organization that strives to reduce poverty, promote education and improve the health of children and teens in disadvantaged areas. Ms. Godin holds a B.A. from the Université de Sherbrooke. AGE 45 (1) Quebec, Canada DIRECTOR SINCE April 25, 2017 Independent PRINCIPAL COMPETENCIES Human Resources, Strategy, Finance/ Accounting MEMBER OF (2) ATTENDANCE 2019 OTHER CURRENT PUBLIC BOARD Board Corporate Governance and Nominating Committee Environment, Safety and Security Committee (7) Finance Committee Human Resources and Compensation Committee Pension and Investment Committee(3)(6) Strategic Planning Committee 100% 100% 100% 100% 100% 100% 100% CGI Inc. (Co-Chair) (2013-present) SECURITIES HELD Value at risk C$1,525,650(4) Common Shares Owned or Controlled(5) 13,125 9,873 February 2020 February 2019 99.20% votes in favour in 2019 11 CN MANAGEMENT INFORMATION CIRCULAR 2020 NOMINEES FOR ELECTION TO THE BOARD
Edith E. Holiday Corporate Director & Trustee Ms. Holiday is a Corporate Director and Trustee and a former General Counsel, United States Treasury Department and former Secretary of the Cabinet, The White House. Ms. Holiday serves on the public boards mentioned in the following table. She was also the recipient of the DirectWomen’s 2009 Sandra Day O’Connor Board Excellence Award, which honours women who have served with distinction on the board of a public company and advanced the value of diversity in the workplace. She is also the recipient of the Secretary of the Treasury’s highest award, the Alexander Hamilton Award. Ms. Holiday holds a B.S. and a J.D. from the University of Florida, and she was admitted to the bars of the states of Florida, Georgia and the District of Columbia. AGE 68(1) Florida, U.S.A. DIRECTOR SINCE June 1, 2001 Independent PRINCIPAL COMPETENCIES Legal, Public Policy, Strategy MEMBER OF(2) ATTENDANCE 2019 OTHER CURRENT PUBLIC BOARDS Board Pension and Investment Committee (Chair)(3) Audit Committee Finance Committee Strategic Planning Committee 100% 100% 100% 100% 100% Santander Consumer USA Holdings, Inc. White Mountains Insurance Group, Ltd. Franklin Templeton Group of Funds (various companies) (Lead Director) Hess Corporation OTHER PUBLIC BOARD DURING PAST 5 YEARS (2016 - present) (2004 - present) (1996 - present) (1993 - present) 88.22% votes in favour in 2019 RTI International Metals, Inc. (1999 - 2015) SECURITIES HELD Value at risk C$12,786,553(4) Common Shares Owned or Controlled(5) 111,852 109,066 February 2020 February 2019 V. Maureen Kempston Darkes, O.C., D. COMM., LL.D. Corporate Director Ms. Kempston Darkes is the retired Group Vice-President and President Latin America, Africa and Middle East, General Motors Corporation (“GM”). In 2009, she ended a 35-year career at GM during which she attained the highest operating position ever held by a woman at GM. From 1994 to 2001, she was President and General Manager of General Motors of Canada Limited and Vice-President of GM. She is an Officer of the Order of Canada, a member of the Order of Ontario and was ranked by Fortune magazine in 2009 as the 12th Most Powerful Woman in International Business and amongst the Women’s Executive Network’s 2012 Canada’s Most Powerful Women: Top 100 Award Winners. In 2006, she was the recipient of the Governor General of Canada’s Awards in Commemoration of the Persons Case and was inducted as a fellow of the Institute of Corporate Directors in 2011. She has also been an appointee of the Government of Canada to the Science, Technology and Innovation Council and the Advisory Council for Promoting Women on Boards. Ms. Kempston Darkes serves on the public boards mentioned in the following table. Ms. Kempston Darkes has received Honorary Doctor of Law Degrees from the University of Toronto and the University of Victoria, as well as an Honorary Doctor of Commerce from Saint Mary’s University. She holds a B.A. in history and political science from Victoria University in the University of Toronto and an LL.B. from the University of Toronto Faculty of Law. AGE 71(1) Ontario, Canada Florida, U.S.A. DIRECTOR SINCE March 29, 1995 Independent PRINCIPAL COMPETENCIES Transport Industry/ Safety, Sales/ Marketing, Human Resources MEMBER OF(2) ATTENDANCE 2019 OTHER CURRENT PUBLIC BOARDS Board Audit Committee Corporate Governance and Nominating Committee Finance Committee Pension and Investment Committee(3) Strategic Planning Committee 100% 100% 100% 100% 100% 100% Enbridge Inc. Brookfield Asset Management Inc. OTHER PUBLIC BOARDS DURING PAST 5 YEARS (2010 - present) (2008 - present) Schlumberger Limited Balfour Beatty Plc. (2014 - 2019) (2012 - 2017) SECURITIES HELD 95.21% votes in favour in 2019 Value at risk C$22,899,048(4) Common Shares Owned or Controlled(5) 196,998 194,009 February 2020 February 2019 12 CN MANAGEMENT INFORMATION CIRCULAR 2020 NOMINEES FOR ELECTION TO THE BOARD
The Hon. Denis Losier, P.C., LL.D., C.M. Corporate Director The Honorable Denis Losier is the retired President and Chief Executive Officer of Assumption Life (life insurance company). Between 1989 and 1994, Mr. Losier held various cabinet level positions with the government of the Province of New Brunswick, including Minister of Fisheries and Aquaculture and Minister of Economic Development and Tourism. Mr. Losier was co-chair of the University of Moncton’s Excellence Campaign. In 2008, he was named a member of the Security Intelligence Review Committee of Canada, and, as such, was made a Member of the Queen’s Privy Council. In addition to serving on the public boards mentioned in the following table, Mr. Losier was a director of Enbridge Gas New Brunswick until 2017 and is the past chair of the board of directors of Invest N.B. He is also a past member and director of the New Brunswick Business Council and Canadian Blood Services, respectively. Mr. Losier was appointed a Member of the Order of Canada in 2011. Mr. Losier holds a Bachelor of Economics from the University of Moncton and a Masters of Economics from the University of Western Ontario. Mr. Losier was awarded an Honorary Doctorate Degree in Business Administration from the University of Moncton. AGE 67(1) New Brunswick, Canada DIRECTOR SINCE October 25, 1994 Independent PRINCIPAL COMPETENCIES Finance/Accounting, Human Resources, Sales/Marketing MEMBER OF(2) ATTENDANCE 2019 OTHER CURRENT PUBLIC BOARD Board Corporate Governance and Nominating Committee (Chair) Donations and Sponsorships Committee(3) Pension and Investment Committee(3) Strategic Planning Committee 100% 100% 100% 100% 100% Plaza Retail REIT OTHER PUBLIC BOARD DURING PAST 5 YEARS (2007 - present) Capital DGMC Inc. (2013 - 2016) SECURITIES HELD Value at risk C$34,773,893(4) Common Shares Owned or Controlled(5) 299,156 295,796 93.52% votes in favour in 2019 February 2020 February 2019 The Hon. Kevin G. Lynch, P.C., O.C., PH.D., LL.D. Vice-Chair, BMO Financial Group The Honourable Kevin Lynch has been Vice Chairman of BMO Financial Group since 2010. Prior to joining BMO, Dr. Lynch had a distinguished career with the Government of Canada, serving as Clerk of the Privy Council, Secretary to the Cabinet, Deputy Minister of Finance, Deputy Minister of Industry as well as Executive Director for Canada at the International Monetary Fund. Dr. Lynch is the past Chancellor of the University of King’s College, the past Chair of the Board of Governors of the University of Waterloo, a Senior Fellow of Massey College and a Trustee of the Killam Trusts. In addition to serving on the public boards mentioned in the following table, Dr. Lynch is a director emeritus of the Governor General’s Rideau Hall Foundation and is a director of Communitech and the Asia Pacific Foundation of Canada, as well as a member of the World Economic Forum (WEF) Committee on “Balancing Financial Stability, Innovation and Economic Growth”. Dr. Lynch earned his BA from Mount Allison University, a Masters in Economics from the University of Manchester and a doctorate in Economics from McMaster University. He was made a Member of the Queen’s Privy Council for Canada in 2009, was appointed an Officer of the Order of Canada in 2011, has received 11 honorary doctorates from Canadian Universities and was awarded the Queen’s Golden and Diamond Jubilee Medals for public service. AGE 69 (1) Ontario, Canada DIRECTOR SINCE April 23, 2014 Independent PRINCIPAL COMPETENCIES Public Policy, Finance/ Accounting, Strategy MEMBER OF(2) ATTENDANCE 2019 OTHER CURRENT PUBLIC BOARD Board Human Resources and Compensation Committee (Chair) Audit Committee Corporate Governance and Nominating Committee Pension and Investment Committee(3) Strategic Planning Committee 100% 100% 100% 100% 100% 100% SNC-Lavalin Group Inc. (Chairman) OTHER PUBLIC BOARDS DURING PAST 5 YEARS (2017 - present) CNOOC Limited Empire Company Limited (Sobeys, Inc.) (2014 - 2019) (2013 - 2017) SECURITIES HELD Value at risk C$3,262,392(4) Common Shares Owned or Controlled(5) 28,066 25,484 92.07% votes in favour in 2019 February 2020 February 2019 13 CN MANAGEMENT INFORMATION CIRCULAR 2020 NOMINEES FOR ELECTION TO THE BOARD

James E. O’Connor Corporate Director Mr. O’Connor is the retired chair of the board of directors of Republic Services, Inc., a leading provider of non-hazardous solid waste collection, recycling and disposal services in the United States. From 1998 to 2011, Mr. O’Connor was chair and Chief Executive Officer of Republic Services, Inc. Prior to 1998, he had held various management positions at Waste Management, Inc. In 2001, Mr. O’Connor was the recipient of the Ellis Island Medal of Honor from the National Ethnic Coalition of Organizations (NECO) which rewards Americans who exemplify outstanding qualities in both their personal and professional lives, while continuing to preserve the richness of their particular heritage. He was named to the list of America’s Best CEOs each year, between 2005 and 2010. In 2011, Mr. O’Connor was named to the Institutional Investors’ All American Executive Team. He is also active in many community causes, especially those that benefit children. Mr. O’Connor has served on the board of directors of the SOS Children’s Village. In addition to serving on the public boards mentioned in the following table, Mr. O’Connor serves on the board of directors of the South Florida P.G.A. of America Foundation. Mr. O’Connor holds a Bachelor of Science in Commerce (concentration in accounting) from DePaul University. AGE 70(1) Florida, U.S.A. DIRECTOR SINCE April 27, 2011 Independent PRINCIPAL COMPETENCIES Strategy, Engineering/ Environment, Human Resources MEMBER OF(2) ATTENDANCE 2019 OTHER CURRENT PUBLIC BOARDS Board Strategic Planning Committee (Chair) Audit Committee Donations and Sponsorships Committee(3) Environment, Safety & Security Committee Finance Committee 100% 100% 100% 100% 100% 100% Casella Waste Systems, Inc. (Lead Director) Clean Energy Fuels Corp. (2015 - present) (2011 - present) SECURITIES HELD Value at risk C$4,050,927(4) Common Shares Owned or Controlled(5) 35,436 33,315 February 2020 February 2019 99.55% votes in favour in 2019 Robert Pace, D. COMM., C.M. Chair of the Board, CN President & CEO, The Pace Group Mr. Pace became Chair of the Board of Directors of CN in 2014 and is President and Chief Executive Officer, The Pace Group (radio broadcasting, real estate development and environmental services). He began his professional career practicing law in Halifax. In 1981, he accepted an appointment to act as the Atlantic Advisor to the Prime Minister of Canada, the Right Honorable Pierre Elliott Trudeau, in Ottawa. In addition to serving on the public boards mentioned in the following table, Mr. Pace is former Chairman of the Walter Gordon Foundation. He is also a director of the Atlantic Salmon Federation and former director of the Asia Pacific Foundation. Mr. Pace holds an MBA and an LL.B from Dalhousie University and holds an Honorary Doctor of Commerce Degree from Saint Mary’s University. He was appointed a Member of the Order of Canada in 2016. Mr. Pace has also completed Corporate Director education programs at both Harvard and Chicago Business Schools. AGE 65(1) Nova Scotia, Canada DIRECTOR SINCE October 25, 1994 Independent PRINCIPAL COMPETENCIES Human Resources, Transport Industry/ Safety, Strategy MEMBER OF(2) ATTENDANCE 2019 OTHER CURRENT PUBLIC BOARD Board (Chair) Donations and Sponsorships Committee (Chair)(3) Corporate Governance and Nominating Committee Environment, Safety & Security Committee Strategic Planning Committee 100% 100% 100% 100% 100% High Liner Foods Incorporated (Chair) (1998 - present) SECURITIES HELD Value at risk C$39,480,335(4) Common Shares Owned or Controlled(5) 339,645 333,351 February 2020 February 2019 95.13% votes in favour in 2019 14 CN MANAGEMENT INFORMATION CIRCULAR 2020 NOMINEES FOR ELECTION TO THE BOARD

Robert L. Phillips President, R.L. Phillips Investments Inc. Mr. Phillips is the President of R.L. Phillips Investments Inc. and was previously President and Chief Executive Officer and director of British Columbia Railway Company Limited from 2001 to 2004. Mr. Phillips was Executive Vice-President, Business Development and Strategy for MacMillan Bloedel Ltd. and, before that, held the position of Chief Executive Officer at PTI Group and Dreco Energy Services Limited. He also enjoyed a prestigious career as a corporate lawyer and was appointed to the Queen’s Counsel in Alberta in 1991. Mr. Phillips was inducted as a fellow of the Institute of Corporate Directors in June 2017. Mr. Phillips serves on the public boards mentioned in the following table. Mr. Phillips received his Bachelor of Laws (Gold Medalist), and Bachelor of Science, Chemical Engineering (Hons) from the University of Alberta. AGE 69(1) British Columbia, Canada DIRECTOR SINCE April 23, 2014 Independent PRINCIPAL COMPETENCIES MEMBER OF(2) ATTENDANCE 2019 OTHER CURRENT PUBLIC BOARDS Board Finance Committee (Chair) Corporate Governance and Nominating Committee Environment, Safety & Security Committee Human Resources and Compensation Committee 100% 100% 100% 100% 100% Capital Power Corporation Maxar Technologies Inc. (and its predecessor, Maxar Technologies Ltd (formerly MacDonald Dettwiler & Associates Ltd.))* West Fraser Timber Co. Ltd. (Lead Director) Canadian Western Bank (Chair) OTHER PUBLIC BOARD DURING PAST 5 YEARS (2019 - present) (2003 - present) Transport Industry/ Safety, Strategy, Sales/ Marketing (2005 - present) (2001 - present) S trategic Planning Committee 100% Precision Drilling Corporation (2004 - 2017) 98.07% votes in favour in 2019 *Mr. Phillips is retiring from the Board of Maxar Technologies Inc. and is not standing for re-election at the May 2020 meeting. SECURITIES HELD Value at risk C$3,655,748(4) Common Shares Owned or Controlled(5) 31,450 28,807 February 2020 February 2019 Jean-Jacques Ruest President and Chief Executive Officer, CN Mr. Ruest was appointed President and Chief Executive Officer in July 2018, after having served as Interim President and CEO since March 2018. He was previously Executive Vice-President and Chief Marketing Officer since January 2010, with responsibility for providing the strategic direction and leadership for CN’s Sales, Marketing and CN Supply Chain Solutions groups. Mr. Ruest joined CN in 1996. Prior to this, Mr. Ruest worked for 16 years at a major international chemical company. Mr. Ruest holds a Masters in Business Administration in Marketing from HEC Montréal (Université de Montréal) and a Bachelor of Science degree in applied chemistry from Université de Sherbrooke. He also completed the executive program of the University of Michigan Business School, and CN’s Railroad MBA program. Over the course of his career, Mr. Ruest has been honoured many times by the business community, notably as 2019 Railroader of the Year and an Inductee to the International Maritime Hall of Fame in 2017. AGE 65(1) Quebec, Canada DIRECTOR SINCE July 24, 2018 Non-Independent PRINCIPAL COMPETENCIES Sales/Marketing, Transport Industry/ Safety, Strategy MEMBER OF(2) ATTENDANCE 2019 OTHER PUBLIC BOARD DURING PAST 5 YEARS Board Donations and Sponsorships Committee(3) Strategic Planning Committee 100% 100% 100% Nil SECURITIES HELD Value at risk C$39,448,950(4) Common Shares Owned or Controlled(5) 339,375 318,281 99.36% votes in favour in 2019 February 2020 February 2019 Stock Options Held(8) 741,559 605,559 February 2020 February 2019 15 CN MANAGEMENT INFORMATION CIRCULAR 2020 NOMINEES FOR ELECTION TO THE BOARD

Laura Stein Executive Vice-President – General Counsel & Corporate Affairs, The Clorox Company Ms. Stein is the Executive Vice-President – General Counsel & Corporate Affairs of The Clorox Company (marketer and manufacturer of consumer products) where she serves on the executive committee. From 2000 to 2005, Ms. Stein was Senior Vice-President, General Counsel of the H.J. Heinz Company. She was also previously a corporate lawyer with Morrison & Foerster in San Francisco and Hong Kong. Ms. Stein is a former director of Nash Finch Company and serves on the boards of several not-for-profit organizations, including the Pro Bono Institute, the Leadership Council on Legal Diversity and the International Association of Women Judges. Previously, Ms. Stein was chair of the Association of Corporate Counsel, president of the Association of General Counsel, co-chair of the General Counsel Committee of the ABA Business Law Section and a director of the Pittsburgh Ballet Theater. Ms. Stein has received the Margaret Brent Award, the American Bar Association’s highest award for women lawyers; the Sandra Day O’Connor Board Excellence Award; and the Corporate Board Member America’s Top General Counsel Recognition Award. Ms. Stein received her J.D. from Harvard Law School, and is a graduate of Dartmouth College where she earned undergraduate and master’s degrees. AGE 58(1) California, U.S.A. DIRECTOR SINCE April 23, 2014 Independent PRINCIPAL COMPETENCIES Legal, Engineering/ Environment, Finance/ Accounting MEMBER OF(2) ATTENDANCE 2019 OTHER CURRENT PUBLIC BOARD Board Environment, Safety & Security Committee (Chair) Audit Committee Finance Committee Human Resources and Compensation Committee Strategic Planning Committee 100% 100% 100% 100% 100% 100% Franklin Resources, Inc. (2005 - present) SECURITIES HELD Value at risk C$3,227,047(4) Common Shares Owned or Controlled(5) 28,229 24,609 February 2020 February 2019 93.30% votes in favour in 2019 (1) The age of the directors is provided as at April 28, 2020, the date of the Meeting. (2) For a detailed review of the 2019 Board and committee attendance by directors, please refer to the Attendance Table found in the “Statement of Corporate Governance Practices” section of this Information Circular. (3) The Donations and Sponsorships Committee and the Pension and Investment Committee are mixed committees composed of both members of the Board of Directors, as well as officers of the Company. (4) The Value at Risk for non-executive directors represents the total value of common shares and Deferred Share Units (“DSUs”) under the Deferred Share Unit Plan for non-executive directors (“DSU Plan”), which total value is based on the February 27, 2020, closing price of the common shares on the TSX (C$116.24) or, for Donald J. Carty, Ambassador Gordon D. Giffin, Edith E. Holiday, James E. O’Connor and Laura Stein, the closing price of the common shares on the New York Stock Exchange (“NYSE”) (U.S.$85.56) converted to Canadian dollars using the rate of exchange of the Bank of Canada (U.S.$1.00 = C$1.3361) on the same date. The Value at Risk for Jean-Jacques Ruest represents the total value of common shares owned or controlled and DSUs under the Company’s Voluntary Incentive Deferral Plan (“VIDP”), which total value is based on the February 27, 2020, closing price of the common shares on the TSX. (5) The information regarding common shares beneficially owned, controlled or directed directly or indirectly, has been furnished by the respective nominees individually and includes DSUs for non-executive directors. For further information on the DSU Plan, please see the “Board of Directors Compensation” section of this Information Circular. In the case of Jean-Jacques Ruest, common shares owned or controlled includes DSUs under the VIDP, but does not include common shares under stock options. For further details on the VIDP, please see the “Statement of Executive Compensation” section of this Information Circular. (6) Became a member of the Committee on April 29, 2019. (7) Stepped down from the Committee on April 29, 2019. (8) The information regarding stock options comprises the stock options granted to Mr. Ruest under the Management Long-Term Incentive Plan. For further details on the plan, please see the “Statement of Executive Compensation” section of this Information Circular. Additional Disclosure Relating to Directors As of the date hereof, to the knowledge of the Company and based upon information provided to it by the nominees for election to the Board of Directors, no such nominee is or has been, in the last 10 years, a director or executive officer of any company that, while such person was acting in that capacity or within a year of that person ceasing to act in that capacity, became bankrupt, made a proposal under any legislation relating to bankruptcy or insolvency or was subject to or instituted any proceedings, arrangement or compromise with creditors or had a receiver, receiver manager or trustee appointed to hold its assets, except for Mr. Losier who was a director of XL-ID Solutions Inc. (formerly, Excellium Inc.) (“XL-ID”) from July 23, 2013 to August 29, 2013. On January 3, 2014, XL-ID announced that it had submitted a proposal to its creditors under the Bankruptcy and Insolvency Act (Canada). On February 13, 2014, XL-ID announced that it had received a final order from the Superior Court of Quebec approving the proposal approved by its creditors. 16 CN MANAGEMENT INFORMATION CIRCULAR 2020 NOMINEES FOR ELECTION TO THE BOARD

Board of Directors Compensation CN’s compensation program is designed to attract and retain the most qualified people to serve on CN’s Board and its committees and takes into account the risks and responsibilities of being an effective director. To reflect the Company’s extensive operations in the United States and the Company’s need to attract and retain directors with experience in doing business in the United States, the compensation of the non-executive directors of the Company is designed to be comparable to that of large U.S.-based companies. The Board sets the compensation of non-executive directors based on the Corporate Governance and Nominating Committee’s recommendations. This Committee regularly reviews the compensation of non-executive directors and recommends to the Board such adjustments as it considers appropriate and necessary to recognize the workload, time commitment and responsibility of the Board and committee members and to remain competitive with director compensation trends in Canada and the U.S. Any director who is also an employee of the Company or of any of its affiliates, does not receive any compensation as a director. Effective January 1, 2015, following a review of the compensation arrangements for non-executive directors with the help of external advisors, the Board, upon the advice of the Corporate Governance and Nominating Committee, approved revisions to non-executive directors’ compensation, which now consists of an all-inclusive annual retainer structure comprising both a cash and an equity component. Board and committee meeting attendance fees, as well as travel attendance fees were eliminated and the flat-fee compensation structure applies regardless of the number of meetings attended by directors. The compensation structure was reviewed thereafter annually by the Corporate Governance and Nominating Committee and the Board and has remained unchanged, including for the year 2020. The flat-fee approach was found, and continues to be, consistent with the compensation trends of the comparator groups, adds predictability to compensation paid to non-executive directors, and is simpler to administer. Comparator Groups CN’s non-executive directors compensation is compared against three separate comparator groups: (i) selected Class I Railroads (see table below) composed of the same companies used for benchmarking the NEOs’ compensation, given CN is one of the Class I Railroads; (ii) a Canadian peer group of companies (see table opposite) with comparable size to CN in terms of revenues and market capitalization, given CN is a Canadian company competing to attract and retain Canadian directors; and (iii) the U.S. companies comprised of the Standard and Poor’s 500 Index, given CN’s extensive network in the U.S. and its need to attract and retain U.S.-based directors. In 2018 and 2019, a market review of the compensation of CN’s non-executive directors carried out with the assistance of an external firm confirmed that compensation remained well-aligned with the upper end of each of these comparator groups. Selected Class I Railroads Union Pacific Corporation (U.S.) Norfolk Southern Corporation (U.S.) Canadian Pacific Railway Ltd. (CDN.) CSX Corporation (U.S.) Canadian Peer Group of Companies Air Canada Airlines Bank of Montreal Banks Barrick Gold Corporation Metals & Mining BCE Inc. Diversified Telecommunication Bombardier Inc. Aerospace & Defense Canadian Imperial Bank of Commerce Banks of Commerce Canadian Natural Resources Ltd. Oil, Gas and Consumable Fuels Canadian Pacific Railway Ltd. Road & Rail Canadian Tire Corporation Multiline Retail Cenovus Energy Inc. Oil, Gas and Consumable Fuels CGI Inc. IT services Manulife Financial Insurance Corporation Nutrien Ltd Chemicals Rogers Communications Inc. Diversified Telecommunication Sun Life Financial Inc. Insurance Suncor Energy Inc. Oil, Gas and Consumable Fuels Teck Resources Ltd. Metals & Mining Telus Corporation Diversified Telecommunication Thomson Reuters Corporation Media TC Energy Corporation Oil, Gas and Consumable Fuels 17 CN MANAGEMENT INFORMATION CIRCULAR 2020 BOARD OF DIRECTORS COMPENSATION

Compensation Levels The following table shows the compensation levels for CN’s non-executive directors during 2019. The Corporate Governance and Nominating Committee reviewed the compensation levels for CN’s non-executive directors in 2019 and in light of the flat fee compensation structure, resolved that such compensation levels remain unchanged for 2020. Directors’ compensation levels have therefore remained the same since 2015. FEES (U.S.$) 2019 TYPE OF FEE (1) Board Chair Cash Retainer(2) Board Chair Share Grant Retainer(2) 175,000 375,000 Director Cash Retainer Director Share Grant Retainer 35,000 200,000 Committee Chair Cash Retainers(3) Audit and HRC Committees Chairs Other Committees Chairs 75,000 65,000 Committee Member Cash Retainer 55,000 (1) The non-executive directors (including the Board Chair) may choose to receive all or part of their cash retainers in common shares or DSUs (see the following Compensation Tables for details) and their common share grant retainer can also be received in DSUs. The common shares are purchased on the open market. (2) The Board Chair receives no additional director retainer nor committee chair or committee member retainer. (3) Committee chairs receive no additional committee chair or committee member retainer. Compensation Table in Canadian Dollars (1) The table below reflects in detail the compensation earned by the Company’s non-executive directors, expressed in Canadian dollars, in the 12-month period ended December 31, 2019, in accordance with the disclosure rules issued by the Canadian Securities Administrators (the “CSA”). Directors’ compensation has been set in U.S. dollars since 2002 and the fluctuation in the exchange rate affects year-over-year comparability. Please see footnote 1 in the below table for currency exchange information, and the Compensation Table in U.S. dollars. Fees Earned (Canadian $) PERCENTAGE OF TOTAL FEES RECEIVED COMMITTEE CHAIR & DIRECTOR AND COMMITTEE IN COMMON BOARD CHAIR CASH RETAINER MEMBER CASH TOTAL CASH RETAINERS (2) SHARE-BASED AWARDS (3) ALL OTHER COMPENSATION TOTAL COMPENSATION SHARES AND/OR DSUs (5) NAME OF DIRECTOR RETAINER Shauneen Bruder Donald J. Carty Ambassador Gordon D. Giffin Julie Godin Edith E. Holiday V. Maureen Kempston Darkes The Hon. Denis Losier The Hon. Kevin G. Lynch James E. O’Connor Robert Pace Robert L. Phillips Laura Stein 46,004 46,004 46,442 46,004 46,442 46,442 46,442 46,004 46,442 232,208 46,442 46,004 72,292 98,580 72,980 72,292 86,249 72,980 86,249 98,580 86,249 – 86,249 85,436 118,296 144,584 119,422 118,296 132,691 119,422 132,691 144,584 132,691 232,208 132,691 131,440 262,880 262,880 262,880 262,880 262,880 262,880 262,880 262,880 262,880 492,900 262,880 262,880 381,176 407,464 382,302 381,176 395,571 382,302 395,571 407,464 395,571 726,860 395,571 394,320 100% 100% 69% 100% 66% 69% 66% 100% 66% 68% 66% 100% 1,752 (4) TOTAL 740,880 918,136 1,659,016 3,384,580 5,045,348 80% (1) All directors earned compensation in U.S. dollars. The directors and the Board Chair may choose to receive all or part of their cash retainers in common shares or DSUs, and may also choose to receive their common share grant retainer in DSUs. Compensation received in cash was converted to Canadian dollars using the average rate of exchange of the Bank of Canada for 2019 (U.S.$1.00 = C$1.3269). Compensation elected to be received in common shares or DSUs was converted to Canadian dollars using the rate of exchange of the Bank of Canada (U.S.$1.00 = C$1.3144), on the purchase or reference day (January 31, 2019). (2) The following directors elected to receive cash retainers in common shares or DSUs with respect to the amounts set forth beside their names: Shauneen Bruder (C$118,296), Donald J. Carty (C$144,584), Julie Godin (C$118,296), the Hon. Kevin G. Lynch (C$144,584), and Laura Stein (C$131,440). (3) Represents a common share grant valued at U.S.$200,000 received by each non-executive director as part of the director retainer and U.S.$375,000 for the Board Chair as part of the Board Chair retainer. See Note 1 for currency conversion information. (4) Includes the value of insurance premiums for 2019 for North American emergency protection outside Mr. Pace’s province of residence. The annual cost to the Company for 2019 for such benefits was C$1,752. (5) This percentage is calculated by dividing the aggregate of the cash retainers elected by non-executive directors to be received in common shares or DSUs described in notes (1) and (3) above and the value provided under the share-based awards column, by the value provided under the total compensation column. 18 CN MANAGEMENT INFORMATION CIRCULAR 2020 BOARD OF DIRECTORS COMPENSATION

Compensation Table in U.S. Dollars The table below reflects in detail the compensation earned by the Company’s non-executive directors in U.S. dollars in the 12-month period ended December 31, 2019. Fees Earned (U.S.$) DIRECTOR AND COMMITTEE CHAIR & BOARD CHAIR CASH RETAINER COMMITTEE MEMBER TOTAL CASH RETAINERS SHARE BASED AWARDS NAME OF DIRECTOR CASH RETAINER TOTAL Shauneen Bruder Donald J. Carty Ambassador Gordon D. Giffin Julie Godin Edith E. Holiday V. Maureen Kempston Darkes The Hon. Denis Losier The Hon. Kevin G. Lynch James E. O’Connor Robert Pace Robert L. Phillips Laura Stein 35,000 35,000 35,000 35,000 35,000 35,000 35,000 35,000 35,000 175,000 35,000 35,000 55,000 75,000 55,000 55,000 65,000 55,000 65,000 75,000 65,000 – 65,000 65,000 90,000 110,000 90,000 90,000 100,000 90,000 100,000 110,000 100,000 175,000 100,000 100,000 200,000 200,000 200,000 200,000 200,000 200,000 200,000 200,000 200,000 375,000 200,000 200,000 290,000 310,000 290,000 290,000 300,000 290,000 300,000 310,000 300,000 550,000 (1) 300,000 300,000 TOTAL 560,000 695,000 1,255,000 2,575,000 3,830,000 (1) Excludes the value of insurance premiums for 2019 for North American emergency protection outside Mr. Pace’s province of residence. The annual cost to the Company for such benefits for 2019 was C$1,752. Share Ownership The Directors of the Company play a central role in enhancing shareholder value and each of them has a substantial investment in the Company. The Board revised the share ownership guidelines for non-executive directors in the fall of 2018. Effective January 1, 2019, each non-executive director should own, within five years of joining the Board, Each non-executive director is required to receive at least 50% of his or her annual director, committee, Board Chair and committee chair cash retainers in CN Securities and may elect to receive up to 100% of such retainers in CN Securities until his or her Minimum Shareholding Requirement is met. Once the Minimum Shareholding Requirement is met, directors may continue to elect to receive up to 100% of such retainers in CN Securities. Approximately 80% of the total annual compensation of the non-executive directors for 2019 was in the form of Directors’ ownership requirement for two years beyond board tenure aligns with longer-term stewardship. common shares, DSUs or similar share equivalents of CN, if any, (“CN Securities”) with a value of the Canadian dollar equivalent of five times the aggregate of the annual director retainer (which includes cash and the value of any grant of CN Securities and in the case of the Board Chair, the aggregate of the annual Board Chair retainer in cash and the value of any grant of CN Securities) (the “Minimum Shareholding Requirement”). Each non-executive director is required to continue to hold such value throughout his Directors are required to own, within 5 years of joining the Board, CN shares worth 5 times their annual retainer requirements. CN Securities. The average value of CN Securities owned by non-executive directors is approximately C$12.6 million (based on the February 27, 2020 closing price of the common shares of the Company on the TSX (C$116.24), or the NYSE (U.S.$85.56) for U.S. directors). or her tenure as a director and continue to hold 50% of the Minimum Shareholding Requirement for a period of two years after the director leaves the Board. In addition, the CN Securities held to comply with the Minimum Shareholding Requirement shall not be, during the director’s tenure, the object of specific monetization procedures or other hedging procedures to reduce the exposure related to his or her holding. 19 CN MANAGEMENT INFORMATION CIRCULAR 2020 BOARD OF DIRECTORS COMPENSATION

Share Ownership Table The following table provides information on the number and the value of common shares and DSUs owned by each nominee for election to the Board of Directors as at February 27, 2020, and the Minimum Shareholding Requirement status. Values Expressed in Canadian $ TOTAL NUMBER OF COMMON SHARES OWNED, NUMBER OF TOTAL VALUE GUIDELINE COMMON SHARES TOTAL VALUE OF COMMON SHARES MET/ VALUE AT OF COMMON SHARES TOTAL VALUE INVESTMENT RISK AS OWNED, OF DSUs CONTROLLED AND DSUs REQUIRED MULTIPLE OF CONTROLLED (VALUE AT RISK) (2) NUMBER OF DSUs HELD (3) (VALUE AT RISK) (2) OR DIRECTED AND DSUs (3) (VALUE AT RISK) (2) TO MEET GUIDELINE SHAREHOLDING YEAR (1) NAME OF DIRECTOR OR DIRECTED REQUIREMENT Shauneen Bruder 2020 2019 Variation – – – 13,125 9,873 3,252 13,125 9,873 3,252 – 1,525,650 1,525,650 44,268 0.9 Donald J. Carty 2020 2019 Variation 84,766 81,476 3,290 20,752 20,382 370 105,518 101,858 3,660 9,690,171 2,372,300 12,062,471 8 Ambassador Gordon D. Giffin 2020 2019 Variation 52,054 50,367 1,687 53,069 51,708 1,361 105,123 102,075 3,048 5,950,642 6,066,674 12,017,316 8 Julie Godin 2020 2019 Variation – – – 13,125 9,873 3,252 13,125 9,873 3,252 – 1,525,650 1,525,650 44,268 0.9 Edith E. Holiday 2020 2019 Variation 73,998 71,886 2,112 37,854 37,180 674 111,852 109,066 2,786 8,459,208 4,327,345 12,786,553 8 V. Maureen Kempston Darkes 2020 2019 Variation 140,240 138,262 1,978 56,758 55,747 1,011 196,998 194,009 2,989 16,301,498 6,597,550 22,899,048 15 The Hon. Denis Losier 2020 2019 Variation 171,254 172,254 (1,000) 127,902 123,542 4,360 299,156 295,796 3,360 19,906,565 14,867,328 34,773,893 22 The Hon. Kevin G. Lynch 2020 2019 Variation – – – 28,066 25,484 2,582 28,066 25,484 2,582 – 3,262,392 3,262,392 2 James E. O’Connor 2020 2019 Variation 35,436 33,315 2,121 – – – 35,436 33,315 2,121 4,050,927 – 4,050,927 3 Robert Pace 2020 2019 Variation 205,457 205,457 – 134,188 127,894 6,294 339,645 333,351 6,294 23,882,322 15,598,013 39,480,335 11 Robert L. Phillips 2020 2019 Variation 9,800 9,625 175 21,650 19,182 2,468 31,450 28,807 2,643 1,139,152 2,516,596 3,655,748 2 Jean-Jacques Ruest 2020 2019 Variation 167,058 149,034 18,024 172,317 169,247 3,070 339,375 318,281 21,094 19,418,822 20,030,128 39,448,950 Note 4 Laura Stein 2020 2019 Variation – – – 28,229 24,609 3,620 28,229 24,609 3,620 – 3,227,047 3,227,047 2 (1) The number of common shares and DSUs held by each director is set out as at February 27, 2020, and for 2019, is set out as at February 27, 2019. (2) The Total Value is based on the February 27, 2020 closing price of the common shares on the TSX (C$116.24) or, for Donald J. Carty, Ambassador Gordon D. Giffin, Edith E. Holiday, James E. O’Connor and Laura Stein, the NYSE (U.S.$85.56) converted into Canadian dollars using the closing exchange rate (U.S.$1.00 = C$1.3361) on the same date. (3) Includes DSUs elected as part of directors’ 2020 compensation for non-executive directors and DSUs under the Company’s VIDP held by Jean-Jacques Ruest. (4) For a discussion on Jean-Jacques Ruest’s shareholding requirements, please see the section on “Stock Ownership” on page 47 of this Information Circular. 20 CN MANAGEMENT INFORMATION CIRCULAR 2020 BOARD OF DIRECTORS COMPENSATION

Directors’ Deferred Share Unit Plan Subject to the Minimum Shareholding Requirement, non-executive directors may elect to receive all or part of their director, committee member, Board Chair, and committee chair cash retainers either in cash, common shares of the Company purchased on the open market or DSUs. They may also elect to receive their common share grant retainer in DSUs. Each DSU entitles the beneficiary thereof to receive upon resignation, retirement or death, one common share of the Company purchased on the open market, plus additional DSUs reflecting dividend equivalents. Each non-executive director has an account where notional DSUs are credited and held until the director leaves the Board. The number of DSUs credited to each non-executive director’s account is calculated by dividing the amount elected to be received in DSUs by the common share price on the day the credit is made. Participants in the DSU Plan are credited additional notional DSUs that are equivalent to the dividends declared on the Company’s common shares. The number of DSUs is calculated using the methodology described above, using the total notional dividend amount and the share price on the dividend payment date. Such additional DSUs are credited to each non-executive director’s account on each dividend payment date. When a non-executive director leaves the Board, the Company is required to deliver to such director a number of common shares purchased on the open market equivalent to the number of DSUs held by the non-executive director in the DSU Plan, taking into account the appropriate tax withholdings. All administration costs as well as any brokerage fees associated with the purchase and delivery of common shares are supported by CN. 21 CN MANAGEMENT INFORMATION CIRCULAR 2020 BOARD OF DIRECTORS COMPENSATION

Statement of Corporate Governance Practices General We are committed to adhering to the highest standards of corporate governance and our corporate governance practices were designed in a manner consistent with this objective. The role, specific mandate and functioning rules of the Board of Directors and of each of its committees are set forth in our Corporate Governance Manual which was formally approved by the Board of Directors on January 21, 2003, and last amended on March 10, 2020. Our Corporate Governance Manual is available on our website at www.cn.ca, under Delivering Responsibly/Governance. It is revised regularly with a view to continually improving our practices provided that we comply with Canadian governance requirements. Except as summarized on our website at www.cn.ca, under Delivering Responsibly/Governance, our governance practices comply with the NYSE corporate governance rules in all significant respects. The CSA adopted, in June 2005, National Instrument 58-101 — Disclosure of Corporate Governance Practices (as amended from time to time, the “Disclosure Instrument”) and National Policy 58-201 — Corporate Governance Guidelines (as amended from time to time, the “Governance Policy”). The Governance Policy provides guidance on governance practices to Canadian issuers, while the Disclosure Instrument requires issuers to make the prescribed disclosure regarding their own governance practices. The Company believes that its corporate governance practices meet and exceed the requirements of the Disclosure Instrument and the Governance Policy. The text set forth hereunder refers to the items of the Disclosure Instrument as well as to the guidelines of the Governance Policy, where applicable. The Company also refers, where appropriate, to the NYSE Corporate Governance Standards (the “NYSE Standards”). The Board of Directors is of the opinion that the Company’s corporate governance practices are well designed to assist the Company in achieving its principal corporate objective, which is the enhancement of shareholder value. The mandate of the Board is set out in Schedule A to this Information Circular. The Board of Directors has approved the disclosure of the Company’s governance practices described below, on the recommendation of the Corporate Governance and Nominating Committee. by assessing their effectiveness and comparing them with evolving best practices, changing circumstances and our needs. Our Corporate Governance Manual forms part of the documentation given to all persons elected or appointed to the Board of Directors. As a Canadian reporting issuer with securities listed on the TSX and the NYSE, our corporate governance practices comply with applicable rules adopted by the CSA, applicable provisions of the U.S. Sarbanes-Oxley Act of 2002 (the “Sarbanes-Oxley Act”) and related rules of the SEC. We are exempted from complying with many of the NYSE corporate governance rules, CN’s Corporate Governance Manual is revised regularly with a view to continually improving our practices by assessing their effectiveness and comparing them with evolving best practices, changing circumstances and our needs. Code of Business Conduct Our Code of Business Conduct is applicable to all directors, officers and employees of CN. We expect everyone working on our Company’s behalf, including consultants, agents, suppliers and business partners, to obey the law and adhere to high ethical standards. The Code of Business Conduct addresses many important matters, including conflicts of interest, protection and proper use of the Ombudsman offers a confidential, neutral and informal avenue which facilitates fair and equitable resolutions to concerns arising within the Company. Yearly, the CN Ombudsman presents a report that summarizes all cases logged and handled by the Office of the Ombudsman to the Corporate Governance and Nominating Committee. The Company believes that ethical business conduct is an important part of its success. Hence, the mandate of the Board attached as Schedule A to this Information Circular states that the Board has the responsibility for overseeing management in the competent and ethical operation of the Company. The Board of Directors and management are committed to maintaining and instilling a strong ethical culture at CN, and as such, have developed a solid ethics program based on CN’s core values of integrity and respect. The Code of Business Conduct is regularly reviewed to ensure it reflects those core values and remains consistent with industry trends and standards. Each director, executive officer and management employee must certify annually his or her compliance with the Code of Business Conduct and employees are required to complete an on-line training course on the Code of Business Conduct. An integrity training is also part of every new employee’s onboarding program on our core values of integrity and respect, and the importance of protecting CN’s reputation, understanding what Doing the Right Thing means and how to identify and avoid potential conflict of interest situations. As part of such ethics program, employees are required to avoid outside interests that may impair or appear to impair the effective performance of their responsibilities to the Company, and be fair and impartial in all dealings with customers, suppliers and partners. Employees must report to their manager any real or potential conflict of interest, and as required, provide written disclosure of such conflict. of corporate assets and opportunities, confidentiality of corporate information, fair dealing, compliance with laws and reporting of any illegal or unethical behaviour. The Corporate Governance and Nominating Committee and the Board of Directors review and update the Code of Business Conduct regularly to ensure that it is consistent with current industry trends and standards; clearly communicates CN’s organizational mission, values, and principles; and, most importantly, serves as a reference guide for employees to support everyday decision making. Although waivers to the Code of Business Conduct may be CN’s Code of Business Conduct clearly communicates CN’s organizational mission, values, and principles; and, most importantly, serves as a reference guide for employees to support everyday decision making. granted in exceptional circumstances, no waiver has ever been granted to a director or executive officer in connection therewith. The Corporate Governance and Nominating Committee reviews, monitors and oversees the disclosure relating to the Company’s Code of Business Conduct. Each year, management reports to such committee on the implementation of the Code of Business Conduct within the organization and on any significant contravention of the Code of Business Conduct by employees of the Company. The Office 22 CN MANAGEMENT INFORMATION CIRCULAR 2020 STATEMENT OF CORPORATE GOVERNANCE PRACTICES

Similarly, the Board requests that every director disclose any direct or indirect interest he or she has in any organization, business or association, which could place the director in a conflict of interest. Every year, a questionnaire is sent to each director to ensure that the director is in no such conflict that has not been disclosed. Should there be a discussion or decision relating to an organization, business or association in which a director has an interest, the Board will request that such director not participate or vote in any such discussion or decision. The Board of Directors also adopted procedures allowing interested parties (i) to submit accounting and auditing complaints or concerns to CN; and (ii) to communicate directly with the Board Chair, who presides over all non-executive director sessions. These procedures are described on our website at www.cn.ca, under Delivering Responsibly/ Governance. The Code of Business Conduct provides that concerns of employees regarding any potential or real wrongdoing in terms of accounting or auditing matters may be submitted confidentially through CN’s Hotline. The Code of Business Conduct is available on our website at www.cn.ca, under Delivering Responsibly/Governance and in print to any shareholder who requests a copy by contacting our Corporate Secretary. The Code of Business Conduct has also been filed with the Canadian and U.S. securities regulatory authorities. Independence of Directors To better align the interests of the Board of Directors with those of our shareholders, with the exception of our President and Chief Executive Officer, all of the nominees Independence Status of Board of Directors NON-INDEPENDENT AND REASON FOR NON-INDEPENDENCE STATUS INDEPENDENT 12 of the 13 nominees for election to the Board of Directors are independent. for election to the Board of Directors are independent. In determining whether a director is an independent director, the Board of Directors applies the standards developed by the CSA, the NYSE and the additional standards adopted by the Shauneen Bruder Donald J. Carty Ambassador Gordon D. Giffin Julie Godin Edith E. Holiday V. Maureen Kempston Darkes The Hon. Denis Losier The Hon. Kevin G. Lynch James E. O’Connor Robert Pace Robert L. Phillips Laura Stein Jean-Jacques Ruest, President and CEO, CN Board. These standards are set out in CN’s Corporate Governance Manual which is available on our website at www.cn.ca, under Delivering Responsibly/Governance. As shown in the table to the right, 12 of the 13 nominees for election to the Board of Directors are independent: Independent Chair of the Board The Company’s Board has been led by a non-executive Chair since CN became public in 1995 and we believe that the separation of the positions of President and Chief Executive Officer and Chair of the Board contributes to allowing the Board to function independently of management. Our Corporate Governance Manual provides that the Board Chair must be an independent director who is designated by the Board. The Corporate Governance Manual describes the responsibilities of the Chair of the Board. The key role of the Board Chair is to take all reasonable measures to ensure that the Board (i) has structures and procedures in place to enable it to function independently of management; (ii) carries out its responsibilities effectively; and (iii) clearly understands and respects the boundaries between the responsibilities of the Board and those of management. Mr. Pace, who is the current independent Chair, became Chair of the Board on April 23, 2014. Position Descriptions Our Corporate Governance Manual includes position descriptions for the Board Chair and the Committee Chairs, as well as a position description for the President and Chief Executive Officer of the Company. Committees of the Board Given the size, nature and geographical scope of our activities and the great number of laws and regulations to which we are subject, the Board of Directors has subdivided its supervision mandate into six areas and has established committees that have certain responsibilities for such areas. These committees are: Audit, Finance, Corporate Governance and Nominating, Human Resources and Compensation, Environment, Safety and Security and Strategic Planning. Their charters are available as part of CN’s Corporate Governance Manual. The Board of Directors also established the Pension and Investment Committee and the Donations and Sponsorships Committee, which are mixed committees composed of members of the Board of Directors as well as officers of the Company. Each committee reports to the Board of Directors and, subject to certain limited exceptions, there are no standing delegations of the Board of Directors’ decision-making authority to any committees. A report of each committee’s activities over the past year can be found at Schedule B of this Information Circular. The following is a brief summary of the mandate of each committee of the Board of Directors. Audit Committee The Audit Committee is responsible for overseeing the Company’s financial reporting, monitoring risk management, internal controls and internal and external auditors. The mandate of the Audit Committee is further described in “Schedule C — Additional Audit Committee Disclosure” and in its charter which is included in our Corporate Governance Manual. The charter of the Audit Committee provides that it must be composed solely of independent directors. As at March 10, 2020, each member of the Audit Committee is independent. No member of the Audit Committee receives, other than in his or her capacity as a Director or member of a Board committee, directly or indirectly, any fee from the Company or any subsidiary of the Company, nor is an affiliated person of the Company, or any subsidiary of the Company. 23 CN MANAGEMENT INFORMATION CIRCULAR 2020 STATEMENT OF CORPORATE GOVERNANCE PRACTICES

Finance Committee The Finance Committee has the responsibility of overseeing the Company’s financial policies and strategy, and authorizing, approving and recommending certain financial activities. As part of these responsibilities, the Finance Committee provides oversight with respect to our capital structure, dividend strategy, share repurchase program, cash flows and key financial ratios, reviews the opportunities and parameters for debt or equity financing, reviews financing documents and, within the scope of its authority levels established by the Board, may authorize the borrowing of money, the issuing of debt securities or other forms of financing, and makes recommendations to the Board thereon. The responsibilities, powers and operation of the Finance Committee are further described in its charter which is included in our Corporate Governance Manual. Corporate Governance and Nominating Committee The Corporate Governance and Nominating Committee has the responsibility of monitoring the composition of the Board of Directors and its committees and overseeing corporate governance matters. As part of its responsibilities, the Corporate Governance and Nominating Committee develops, reviews and monitors criteria for selecting directors, including required or desired competencies and skills to improve the Board of Directors and, in consultation with the Board Chair, identifies candidates qualified to become Board members. This Committee reviews the corporate governance guidelines applicable to the Company, recommends any change that should be made thereto and monitors the disclosure of its practices. The responsibilities, powers and operation of the Corporate Governance and Nominating Committee are further described in its charter which is included in our Corporate Governance Manual. The charter of the Corporate Governance and Nominating Committee provides that it must be composed solely of independent directors. As at March 10, 2020, each member of the Corporate Governance and Nominating Committee is independent. Human Resources and Compensation Committee The Human Resources and Compensation Committee has the responsibility of monitoring executive management’s performance assessment, compensation and succession planning. This Committee also has the mandate to review human resources practices by ensuring, amongst other things, that appropriate human resources systems are in place so that the Company can attract, motivate and retain the quality of personnel required to meet its business objectives. The mandate of the Human Resources and Compensation Committee is further described in the section entitled “Statement of Executive Compensation — Human Resources and Compensation Committee” on page 36 of this Information Circular and in its charter which is included in our Corporate Governance Manual. The charter of the Human Resources and Compensation Committee provides that it must be composed solely of independent directors. As at March 10, 2020, each member of the Human Resources and Compensation Committee is independent. The Board has adopted a policy, which is included in our Corporate Governance Manual, providing that no more than one in three members of the Human Resources and Compensation Committee shall be a sitting CEO of another company, at least one member shall be experienced in executive compensation, and the President and Chief Executive Officer of the Company shall be excluded from the Committee member selection process. Reference is made to the subsection entitled “Statement of Executive Compensation — Human Resources and Compensation Committee — Independent Advice” on page 37 of this Information Circular for disclosure in respect of the executive compensation consultant. Environment, Safety and Security Committee The Environment, Safety and Security Committee has the responsibility, amongst other things, of overseeing the development and implementation of environmental, safety and security policies, assessing environmental, safety and security practices, and reviewing the Company’s business plan to ascertain whether environmental, safety and security issues are adequately taken into consideration. The responsibilities, powers and operation of the Environment, Safety and Security Committee are further described in its charter which is included in our Corporate Governance Manual. Strategic Planning Committee The Strategic Planning Committee, which is composed of all of the members of the Board of Directors, focuses on strategic and financial issues, including the review of the key assumptions, as well as the economic, business, regulatory and competitive conditions underlying the Company’s business plan. It also reviews, with the President and Chief Executive Officer and other appropriate executive officers, the Company’s business plan and capital budget prior to their formal approval by the Board of Directors. The responsibilities, powers and operation of the Strategic Planning Committee are further described in its charter which is included in our Corporate Governance Manual. Pension and Investment Committee The Pension and Investment Committee, which is a mixed committee composed of directors and officers, has the responsibility to review pension-related matters broadly, including reviewing the activities of the CN Investment Division (“CNID”), reviewing and approving CNID Incentive Plan and award payouts thereunder, advising CNID on investment of assets of CN’s Pension Trust Funds, approving certain of the investments made by CN’s Pension Trust Funds, and being informed of all matters related to pension liabilities or that are otherwise relevant in developing CN’s pension risk management strategy and pension plan design. The responsibilities, powers and operation of the Pension and Investment Committee are further described in its charter which is included in our Corporate Governance Manual. Donations and Sponsorships Committee The Donations and Sponsorships Committee, which is a mixed committee composed of directors and officers, has the responsibility, amongst other things, of developing a donations and sponsorships strategy and of reviewing and approving donation and sponsorship requests. The responsibilities, powers and operation of the Donations and Sponsorships Committee are further described in its charter which is included in our Corporate Governance Manual. Risk Management Oversight At CN, the Board is entrusted with the responsibility to oversee that management identifies and evaluates the significant business risks that the Company is exposed to and implements processes and programs to manage these risks. A significant risk is generally defined as an exposure that has the potential to materially impact CN’s ability to meet or support its business objectives. The Board achieves this risk oversight through strategic overviews of significant risks and issues, and business updates with the President and Chief Executive Officer, and executives. The overviews may cover among others, risks related to: • • • • • • • general economic conditions; foreign currency; capital investments; information technology and cybersecurity; environment; existing operations, such as labour disputes; and developments in regulations: tax legislation and safety regulations. 24 CN MANAGEMENT INFORMATION CIRCULAR 2020 STATEMENT OF CORPORATE GOVERNANCE PRACTICES

Company officers provide, to the Board or one of its committees, regular presentations and updates on the execution of business strategies, business opportunities, risk and safety management, ethical conduct, and detailed reports on specific risk issues. The risk oversight responsibility is shared between the Board and its committees. The Board delegates responsibility for oversight of certain risk elements to the various committees in order to ensure appropriate expertise, attention and diligence. The Board may use external resources when appropriate to assess enterprise risk and management processes. Risk information is reviewed by the Board and/or committees of the Board throughout the year. The Audit Committee is responsible for ensuring that appropriate risk management processes are in place across the organization. It considers the effectiveness of the operation of CN’s internal control procedures and reviews reports from CN’s internal and external auditors. As part of its risk oversight activities, the Audit Committee ensures that significant risks identified are referred to a Board committee or the Board, as appropriate. Specifically, the Audit Committee reviews the Company’s risk assessment, including risk oversight and risk management policies under the Enterprise Risk Management (“ERM”) program. Management undertakes an enterprise-wide process to identify, classify, assess and report on CN’s significant risks and mitigation strategies. The ERM program provides a common risk management framework/ environment to identify, assess, monitor, and mitigate key business risks. Management provides to the Audit Committee an annual ERM update. Risks are given a rating based on an assessment of inherent risk, after considering mitigating processes and controls in place. Each risk is assigned to members of senior management who develop and implement controls to mitigate the risks. In addition, the Audit Committee requests that an independent review of the mitigating controls be performed on the identified risks on a rotational basis. For a detailed explanation of the material risks applicable to CN and its affiliates, see the section entitled “Business risks” in CN’s Management’s Discussion and Analysis included in CN’s 2019 Annual Report, available on SEDAR at www.sedar.com, on the SEC website at www.sec.gov through EDGAR and on CN’s website at www.cn.ca. Committees and Key Risks Overseen AUDIT Financial — Taxation — Business Interruption — Information and Operational Technology Security — Cybersecurity — ERM Framework (Program) — Compliance with Laws and Regulations FINANCE Credit — Commodity Price — Interest Rate — Foreign Currency — Liquidity — Pension Funding CORPORATE GOVERNANCE & NOMINATING Compliance and Ethics — Compliance with Governance rules HUMAN RESOURCE & COMPENSATION Human Capital — Compensation — Succession Planning — Employee Benefit Obligations — Pension Plan ENVIRONMENT, SAFETY AND SECURITY Health & Safety – Injury and Accident — Security — Regulatory — Environmental STRATEGIC PLANNING Economic — Market — Competitive — Regulatory PENSION & INVESTMENT Pension Investment — Pension Plan Board and Committee Meetings Process The Board Chair, in collaboration with the Corporate Secretary, has the responsibility of establishing a schedule for the meetings of the Board of Directors and its committees. During this process, the Corporate Secretary, in collaboration with the Board and committee chairs and the appropriate executive officers, establishes Board and committee working plans for the year. We believe that proceeding in this manner helps in the preparation of in-depth presentations conducive to meaningful information sessions and discussions while allowing management to plan ahead. If, during the course of the year, events or circumstances require Board or committee action or consideration, additional meetings are called. The total number of meetings and the attendance record for each director for all Board and committee meetings held during the course of 2019 are set out in the section entitled “Statement of Corporate Governance Practices — Board and Committee Attendance” of this Information Circular. Independent members of the Board hold in camera meetings at or after every regular in-person meeting of the Board. Communication regularly takes place between the Board Chair and the Company’s executives and, through the Office of the Corporate Secretary, between executive officers having responsibilities for matters placed under the supervision of particular committees and the Chairs of such committees. This open communication ensures that all meaningful information concerning the affairs and progress of the Company are transmitted to those members of the Board of Directors or committees having special supervisory responsibilities. In Camera Meetings The independent directors meet at or after every regular in-person meeting of the Board of Directors during in camera sessions, without the presence of management and under the chairmanship of the Board Chair. During the financial year ended December 31, 2019, there were 10 in camera sessions that were attended exclusively by non-executive directors. 25 CN MANAGEMENT INFORMATION CIRCULAR 2020 STATEMENT OF CORPORATE GOVERNANCE PRACTICES

Board and Committee Attendance The following table shows the record of attendance for each current director at meetings of the Board and its committees, of which they were members, as well as the number of Board and Board committee meetings held during the 12-month period that ended on December 31, 2019. Attendance and Meetings Held Table NUMBER AND % OF MEETINGS ATTENDED IN 2019 HUMAN RESOURCES AND CORPORATE DONATIONS GOVERNANCE AND ENVIRON-MENT, SAFETY AND SECURITY COMMITTEE PENSION OVERALL ATTENDANCE/ MEETINGS HELD AND NOMINATING COMMITTEE SPONSOR-SHIPS COMMITTEE COMPEN-AND STRATEGIC PLANNING COMMITTEE AUDIT COMMITTEE FINANCE SATION INVESTMENT COMMITTEE (1) COMMITTEE (1) COMMITTEE COMMITTEES (TOTAL) NAME OF DIRECTOR BOARD Shauneen Bruder 10/10 (100%) 2/2 2/2(2) 8/8 6/6 2/2(3) 4/4 24/24 (100%) 34/34 (100%) Donald J. Carty 10/10 (100%) 5/5 (Chair) 4/4 6/6 6/6 4/4 25/25 (100%) 35/35 (100%) Ambassador Gordon D. Giffin 10/10 (100%) 4/4 4/4 6/6 4/4 18/18 (100%) 28/28 (100%) Julie Godin 10/10 (100%) 4/4 2/2(3) 8/8 6/6 4/4(2) 4/4 28/28 (100%) 38/38 (100%) Edith E. Holiday 10/10 (100%) 5/5 8/8 6/6 (Chair) 4/4 23/23 (100%) 33/33 (100%) V. Maureen Kempston Darkes 10/10 (100%) 5/5 4/4 8/8 6/6 4/4 27/27 (100%) 37/37 (100%) The Hon. Denis Losier 10/10 (100%) 4/4 (Chair) 2/2 6/6 4/4 16/16 (100%) 26/26 (100%) The Hon. Kevin G. Lynch 10/10 (100%) 5/5 4/4 6/6 (Chair) 6/6 4/4 25/25 (100%) 35/35 (100%) James E. O’Connor 10/10 (100%) 5/5 2/2 4/4 8/8 4/4 (Chair) 23/23 (100%) 33/33 (100%) Robert Pace 10/10 (100%) (Chair) 4/4 2/2 (Chair) 4/4 4/4 14/14 (100%) 24/24 (100%) Robert L. Phillips 10/10 (100%) 4/4 4/4 8/8 (Chair) 6/6 4/4 26/26 (100%) 36/36 (100%) Jean-Jacques Ruest 10/10 (100%) 2/2 4/4 6/6 (100%) 16/16 (100%) Laura Stein 10/10 (100%) 5/5 4/4 (Chair) 8/8 6/6 4/4 27/27 (100%) 37/37 (100%) NUMBER OF MEETINGS HELD 10 5 4 2 4 8 6 6 4 39 49 (1) In addition to committee members, all non-executive board members were invited to attend the meetings of the Human Resources and Compensation Committee held in January, July and December, and meetings of the Finance Committee held in March, July and October. (2) Became a member of the Committee on April 30, 2019. (3) Stepped down from the Committee on April 30, 2019. Director Selection Review of Credentials In consultation with the Board Chair, the Corporate Governance and Nominating Committee annually reviews the credentials of nominees for election or re-election as members of the Board of Directors. It considers their qualifications, the The Corporate Governance and Nominating Committee monitors and is constantly on the lookout for new candidates for nomination to the Board of Directors and is mindful of the mandatory retirement dates of current directors. Competency Matrix The Corporate Governance and Nominating Committee, together with the Board Chair, is responsible for determining the needs of the Board in the long term and identifying new candidates to stand as nominees for election or appointment as directors. Over the last few years, the Corporate Governance and Nominating Committee and the Board Chair focused on board renewal and succession in light of upcoming director retirements and on expanding and completing the Board’s overall expertise in certain areas and diversity. The Board Chair and the Corporate Governance and Nominating Committee continue to engage in an ongoing, in-depth succession planning process. Board renewal and succession has been an item at most meetings of the Corporate Governance and Nominating Committee. In proposing the list of Board nominees, the Board of Directors is guided by the process described in our Corporate Governance Manual. As part of the process, the Board Chair, in consultation with the Corporate Governance and Nominating Committee, develops a competency matrix based on knowledge areas, types of expertise, gender, age and geographical validity of the credentials underlying each nomination, and, for nominees who are already directors of the Company, an evaluation of their effectiveness and performance as members of the Board of Directors, including their attendance at Board and committee meetings. Board and Board committee members are expected to attend all meetings. As stated in our Corporate Governance Manual, any director who has attended less than 75% of meetings of the Board or meetings of committees on which they sit, for more than two consecutive years, without a valid reason for the absences, will not be renominated. CN’s competency matrix is based on areas of knowledge, expertise, diversity, age, gender and geography, and identifies any gaps to be addressed in the nomination process. 26 CN MANAGEMENT INFORMATION CIRCULAR 2020 STATEMENT OF CORPORATE GOVERNANCE PRACTICES
representation, and identifies any gaps to be addressed in the director nomination process. The Board ensures that the skill set developed by directors, through their business expertise and experience, meets the needs of the Board. The Board also gives careful consideration to factors such as age, diversity (including gender and other Designated Groups), geographical location, competencies and experience of current directors, the suitability and performance of directors proposed for election, as well as their independence, qualifications, financial acumen, business judgment and board dynamics. This competency matrix is reviewed regularly by the Board Chair with Board members, and is updated as may be required. The Corporate Governance and Nominating Committee regularly reviews its competency matrix with a view of expanding the Board’s overall experience and expertise and filling any gaps so that the needs of the Board are met. The Corporate Governance and Nominating Committee and the Board have approved the below matrix. In order to assist the Corporate Governance and Nominating Committee and the Board Chair in recommending candidates to become directors of CN, the Corporate Governance and Nominating Committee has constituted, together with the Board Chair, an evergreen list of potential Board candidates, which it updates from time to time. Prior to nominating a new director for election or appointment, the Board Chair and the President and Chief Executive Officer meet with the candidate to discuss his or her interest and willingness to serve on CN’s Board, potential conflicts of interest, and his or her ability to devote sufficient time and energy to the Board of Directors. The following table identifies the competencies of each nominee for election to the Board of Directors, together with their gender, age range and tenure at CN. Description of Competencies • Sales/Marketing: Experience as a senior executive in a product, service or distribution company; experience in supply chain management and strong knowledge of CN’s markets, customers and strategy. Finance/Accounting: Experience in corporate finance, overseeing complex financial transactions, investment management; experience in financial accounting and reporting, auditing, and internal controls. • Legal: Experience as a senior practicing lawyer either in private practice or the legal department of a major public entity. Strategy: Experience in strategic planning and leading growth for a major public entity. Human Resources: Experience in oversight of compensation programs, particularly compensation programs for executive level employees and incentive based compensation programs; experience with talent management, succession planning, leadership development and executive recruitment. • Engineering/Environment: Thorough understanding of the operations of the transportation industry (particularly the rail industry), environmental issues and transportation industry regulations. Transport Industry/ Safety: Knowledge and experience in the transportation industry, including strategic context and business and safety issues facing the transportation industry. Public Policy: Experience in, or a strong understanding of, the workings of government and public policy in Canada and the United States. • • • • • 27 CN MANAGEMENT INFORMATION CIRCULAR 2020 STATEMENT OF CORPORATE GOVERNANCE PRACTICES NAME OF DIRECTOR COMPETENCIES GENDER AGE RANGE BOARD TENURE SALES / MARKETING FINANCE / ACCOUNTING LEGAL STRATEGY HUMAN RESOURCES ENGINEERING/ ENVIRONMENT TRANSPORT INDUSTRY/ SAFETY PUBLIC POLICY 59 AND UNDER 60-65 66-75 0-5 YEARS 6-10 YEARS 11 + YEARS Shauneen Bruder F Donald J. Carty M Ambassador Gordon D. Giffin M Julie Godin F Edith E. Holiday F V. Maureen Kempston Darkes F The Hon. Denis Losier M The Hon. Kevin G. Lynch M James E. O’Connor M Robert Pace M Robert L. Phillips M Jean-Jacques Ruest M Laura Stein F

Diversity at CN CN recognizes the importance of creating a diverse and inclusive work environment that respects and values the contribution and uniqueness of every individual. The Company also believes in the benefits of having diversity at the Board and executive management levels. Diversity promotes the inclusion of different perspectives and ideas, mitigates the risk of groupthink and improves oversight. Diversity at CN favours effective, inclusive and nuanced decision-making and contributes to implementing the highest governance standards while signalling CN’s core values and culture to various stakeholders. While setting the tone at the top, CN is committed to diversity at all levels within the Company and to fostering an inclusive diverse culture based on merit, a variety of perspectives and free of conscious or unconscious bias. Our commitment is anchored in our Diversity and Inclusion Plan (“Diversity Plan”) which is part of our talent acquisition strategy designed to increase the representation of designated groups (such groups including women, Aboriginal peoples, members of visible minorities and persons with disabilities) (“Designated Groups”) within CN’s workforce and to develop a more inclusive workplace. Our Diversity Plan, that applies at all levels within the Company, includes strategies on sourcing (including scholarships and internships), selection, hiring, training and development of diverse candidates, and it touches everyone including the Board members, our executive management and employees, and external candidates. The strategy of building a diverse and inclusive workforce involves an integrated approach on sensitizing, recognizing and building awareness on diversity and inclusion in the workplace. In an increasingly complex global marketplace, the ability to draw on a wide-range of viewpoints, backgrounds, skills, and experience is critical to the Company’s success. While CN remains committed to selecting the best candidate to fulfil Board and executive roles and appointment decisions are based foremost on merit, it also believes that diversity of profiles among the members of the Board and executive management allows for more effective oversight, stewardship and management. Accordingly, in selecting qualified candidates, a wide-range of aspects of diversity are considered, to ensure that the Board and executive management, as a whole, reflect a range of viewpoints, backgrounds, skills, experience and expertise. Board Diversity The Board’s Corporate Governance and Nominating Committee, in consultation with the Board Chair, is responsible for recommending qualified persons to serve on the Board. In connection with its efforts to create and maintain a diverse Board, on March 10, 2015, the Corporate Governance and Nominating Committee recommended, and the Board approved, the adoption of a diversity policy for the Board. As benefits of all aspects of diversity on the Board. Under the Diversity Policy and as part of its mandate, in order to ensure its effective implementation, the Corporate Governance and Nominating Committee: • has created a search process that seeks qualified Board candidates from, among other areas, the traditional pool of corporate directors and officers, government, academic institutions, private enterprise, non-profit organizations, trade associations and professions such as accounting, human resources, and legal services; uses CN’s network of organizations and trade groups that may help identify diverse candidates; has in the past and may again retain an executive search firm to help meet the Board’s diversity objectives; periodically reviews its recruitment and selection processes to ensure that diversity remains a component of any director search; and endeavors to consider the level of representation of Designated Groups on the Board in identifying and nominating candidates for election or re-election to the Board. • • • • Diversity and Executive Management CN recognizes the importance of having a diverse executive management team which offers a depth of perspectives, enhances the Company’s operations and is essential in maintaining a competitive focus. On March 10, 2020, the Board adopted the Diversity Policy that now applies, in addition to Board members, also to executive management positions. Pursuant to the revised Diversity Policy, the Human Resources and Compensation Committee is responsible for considering candidates for executive management appointments that possess the qualifications, competencies, experience, leadership skills and level of commitment required to fulfill executive functions. In fulfilling its oversight role, the Human Resources and Compensation Committee regularly reviews CN’s integrated approach to executive and high-potential talent management and succession planning. The Committee also considers processes and practices for leadership development and reviews the depth of succession pools for senior leadership roles across the Company in order to ensure that CN has a pool of potential diverse successors for the executive functions. Appointments are based on a balance of criteria, including merit, skill, background, experience and competency of the individual at the relevant time. Nonetheless, executive management appointments are reviewed with our diversity and talent management objectives in mind, including the level of representation of Designated Groups. Diversity Initiatives Strengthening Partnerships to Increase Opportunities for Aboriginal People Over the past few years, our CN Aboriginal Affairs and Talent Acquisition teams have worked closely together to increase our visibility within Aboriginal communities to promote CN employment opportunities. We were invited by First Nation leaders to hold individual career planning and career fair events. These opportunities have led to further discussions on post-secondary training partnerships and future invitations to work with Aboriginal People in promoting CN as a long-term employer. We also provide sensitivity training on diversity and inclusion as part of our hiring, onboarding and development programs. In 2018, CN was certified at the bronze level by Progressive Aboriginal Relations, signaling to communities that we are committed to building positive relationships and partnerships with Aboriginal communities. Supported by management and the Board, these initiatives are examples of CN’s commitment to diversity and inclusion across the Company. As well, CN is honored to have been recognized as one of Canada’s Best Diversity Employers and one of Montreal’s Top Employers in 2019. further set forth below, this policy was further revised on March 10, 2020 to broaden its scope and include new, more ambitious targets so as to include all members of Designated Groups. The revised diversity policy with respect to directors and executive management (“Diversity Policy”) provides that, in considering the Board’s composition and making recommendations for Board members, the Corporate Governance and Nominating Committee will take into account: (i) the size of the Board; CN believes that a diverse board has the potential for richer discussion and debate that may increase effectiveness in decision-making and advising functions. (ii) the particular competencies, skills and experience currently sought by the Board, including requirements to staff certain Board committees; (iii) the competencies, skills and experience each of the current directors possesses; and (iv) personal attributes and other qualities of each director, having regard to the 28 CN MANAGEMENT INFORMATION CIRCULAR 2020 STATEMENT OF CORPORATE GOVERNANCE PRACTICES

Talent Recruitment and Diversity – Ensuring a Diverse Pipeline of Applicants Having a workforce with unique talents that reflects the diversity of our customers and communities where we operate is a key contributor to our success. We are focused on hiring diverse and qualified candidates – encouraging collaboration and creative thinking. We continue to build a diverse pipeline of applicants through targeted recruitment campaigns, strategic partnerships and strengthened outreach. Last year, our targeted recruitment campaigns enabled us to promote opportunities for women in non-traditional roles and build stronger relationships with Aboriginal People. We also strengthened our technology platforms by implementing a new talent acquisition module. The module provides CN recruiters and Human Resources managers access to candidates who self-identified as part of a Designated Group and the representation of diverse candidates for CN positions. Diversity Statistics and Targets In 2015, CN adopted a target of having a Board composed of at least one-third (33%) of women directors by 2017. That same year, CN also became a member of the Canadian Chapter of the 30% Club, an organization with an aspirational objective of having representation of at least 30% women on boards by 2019. This target was achieved at the beginning of 2017. Currently five out of 13 (38%) of our Board members and nominees are women. In furtherance of its continued commitment to diversity and inclusion, the Board has decided to set new aspirational diversity targets related to the inclusion of qualified candidates issued from the Designated Groups among its directors. Accordingly, the revised Diversity Policy provides that CN aspires to maintain at least one-third (33%) representation by women on the Board and attain, by the end of 2022, and thereafter maintain, a Board composition in which at least forty percent (40%) of the Board members are members of the Designated Groups. The Board has also elected to set targets for its executive management team (being all Vice-Presidents and more senior positions) comprising 30 positions, of which 20% are currently held by women. As such, the Company aspires to have, by the end of 2022, and thereafter maintain, an executive management team in which at least thirty percent (30%) are women. Our targets align with CN’s pledge to accelerate the advancement of women in business, as set out in the Catalyst Accord 2022, to which CN is a signatory. We have set aspirational targets for women only on the executive team at this time and not for any other members of Designated Groups as CN has determined to make this a priority and is working on programs and processes that clearly support women’s career development and a better gender balance. CN is also committed to taking concrete steps to further the advancement of women, by proactively identifying talented women and encouraging them to apply for more senior roles, implementing development opportunities for high potential women, ensuring that selection and promotion processes are free of gender bias, analyzing statistics and progress on an annual basis, promoting the importance of diversity to managers of the Company and raising their awareness as to their roles and obligations. The Corporation’s Diversity Plan, internal recruitment processes and other diversity initiatives constitute however concrete steps in ensuring that CN’s talent pool of senior managers is properly developed and candidates from all Designated Groups are actively sought, beyond the gender diversity target. The current representation of each Designated Group on the Board and among executive officers is set out in the tables below. The following disclosure is derived from information provided by the directors and executive officers. In accordance with privacy legislation, such information was collected on a voluntary basis, and where a particular individual chose not to respond, CN did not make any assumptions or otherwise assign data to that individual. The executive officers are a sub-set of the executive management team and comprises 10 positions. As at March 10, 2020 # OF DIRECTORS / TOTAL # OF DIRECTORS DIRECTOR NOMINEES: % Women Aboriginal Peoples – Persons with Disabilities – Members of Visible Minorities 5/13 0/13 38% 0% As at March 10, 2020 # OF EXECUTIVE OFFICERS / TOTAL # OF EXECUTIVE OFFICERS EXECUTIVE OFFICERS: % Women 2/10 0/10 20% 0% Aboriginal Peoples – Persons with Disabilities – Members of Visible Minorities On an annual basis, the Corporate Governance and Nominating Committee (in connection with diversity among directors) and the Human Resources and Compensation Committee (in connection with diversity among executive management) assess the effectiveness of the nomination/appointment process in achieving CN’s diversity objectives and measure the annual and cumulative progress in achieving its diversity targets. The Diversity Policy is available on our website at www.cn.ca, under Delivering Responsibly/Governance. Board Renewal and Other Practices Retirement from the Board The Board has adopted a policy on the mandatory retirement age for directors whereby a director would not, unless otherwise determined by the Board, in its discretion, be nominated for re-election at the annual meeting of shareholders following his or her 75th birthday. Board Tenure and Term Limits On November 21, 2016, the Board approved an amendment to its Tenure Policy, to the effect that any new individual nominated or elected to the Board of Directors, effective as of April 25, 2017, would be subject to term limits. Effective as of April 25, 2017, new members of the Board that CN’s policy on Chair term limits, together with its policy on mandatory retirement age and its new director term limits, establishes a mechanism that ensures Board Chair, committee chair, and director renewal, provides a fresh perspective in the boardroom and improves the Board’s ability to plan its composition over a longer period of time. • Effective as of April 23, 2014, but without regard to past service, CN’s Board Chair may serve for a term of five (5) years, renewable annually for up to a maximum of three (3) more years, subject to the discretion of the Board of Directors to further extend the term, if deemed appropriate. At the end of the term(s) as Board Chair, the departing Board Chair would not stand for election as a director of CN at the next annual shareholders’ meeting. The above term(s) for the Board Chair would remain subject to the mandatory retirement age limit of 75 years of age. • Effective as of April 23, 2014, but without regard to past service, committee chairs will serve for a term of three (3) years, renewable for one further two (2) year term, subject to the discretion of the Board of Directors to extend the term, if deemed appropriate. of Directors may serve for a maximum term of fourteen (14) years. The Board has also adopted a policy, w hic h is par t o f CN’s Co r po rate Governance Manual, to the effect that the Board Chair and the Committee Chair tenure would be subject to term limits. The Board of Directors is of the view Effective as of April 25, 2017, new members of the Board may serve for a maximum term of fourteen (14) years. 29 CN MANAGEMENT INFORMATION CIRCULAR 2020 STATEMENT OF CORPORATE GOVERNANCE PRACTICES

The election or appointment of the CN Board Chair or committee chairs, respectively, is subject to annual review and election/appointment. In addition, directors are expected to inform the Board Chair of any major change in their principal occupation so that the Board will have the opportunity to decide the appropriateness of such director’s continuance as a member of the Board or of a Board committee. In early 2020, the Corporate Governance and Nominating Committee and the Board, after giving careful consideration to the board composition, including diversity, competencies, experience and performance of current directors, as well as their independence, qualifications, financial acumen, business judgment and board dynamics, unanimously recommended that all current directors stand for election at the 2020 Meeting. Common Directorships With a view to further strengthen directors’ independence, the Board has adopted a policy pursuant to which a director shall not accept the invitation to join an outside board on which a director of CN already sits without previously obtaining the approval of the Corporate Governance and Nominating Committee. In addition, the Board has adopted a policy, which is included in our Corporate Governance Manual, to the effect that no more than two of the Company’s directors should generally serve on the same outside board or outside board committee. As of March 10, 2020, no members of our Board of Directors served together on the boards of other public companies. Number of Directorships CN recognizes that Board membership requires a significant dedication of time. As a result, the number of boards on which an individual can serve is necessarily limited. With a view to taking reasonable steps to ensure the ability of each candidate to make the commitment of time necessary to be a director of CN, the Board will apply the following guidelines when considering candidates to become directors of CN: • for candidates that are chief executive officers or other senior executives of public corporations, the Board will prefer individuals who hold no more than two (2) public corporation directorships in total (including CN’s Board and membership on the board of the corporation at which an individual is employed); and • for other candidates, the Board will prefer individuals who hold no more than five (5) public corporation directorships in total (including CN’s Board). Directors are expected to provide the Board Chair with information as to all boards of directors that they sit on or that they have been asked to join so as to allow the Board to determine whether it is appropriate for such director to continue to serve as a member of the Board or of a Board Committee. The Corporate Governance and Nominating Committee and the Board Chair will apply Board nominee selection criteria, including directors’ past contributions to the Board and availability to devote sufficient time to fulfill their responsibilities, prior to recommending directors for re-election for another term. The biographies on pages 10 to 16 of this Information Circular identify the other reporting issuers of which each nominee is a director. Director Emeritus The Board of Directors confers, from time to time, the honorary status of Director Emeritus to retiring or former directors who have made significant contributions to the Board through long and distinguished service and accomplishments. Currently, lifetime emeritus status has been bestowed upon Raymond Cyr, James Gray, Michael Armellino, Hugh Bolton, Charles Baillie, Edward Lumley and David McLean as Chairman Emeritus, as well as upon the late Purdy Crawford and the late Cedric Ritchie. Directors Emeritus are invited to attend the annual meeting of shareholders and certain Company or Board events taking place in their geographic area of residence and are reimbursed for reasonable travel and other out-of-pocket expenses in connection with attendance at such events. Board Performance Assessment Process The Board of Directors has implemented, and reviews, from time to time, a comprehensive process to annually assess its effectiveness, the effectiveness of its committees, the Board Chair, the committee chairs and individual directors. This process is under the supervision of the Corporate Governance and Nominating Committee and the Board Chair and is comprised of the following steps: • The following questionnaires are prepared by the Office of the Corporate Secretary and approved by the Corporate Governance and Nominating Committee and the Board Chair, taking into account current issues, the findings of previous years and input from the Board of Directors: • Following receipt of the completed questionnaires, the Board Chair contacts every director and conducts open and confidential one-on-one meetings. The purpose of these meetings is to discuss the answers received from and in respect of each director, to take into account any comments which the director may have and to review the self-evaluation of each director. One of the Corporate Governance and Nominating Committee or Human Resources and Compensation Committee Chairs also discusses individually with each director his or her responses and comments on the Board Chair evaluation questionnaire. Reports are then made by the Board Chair, the Corporate Governance and Nominating Committee and Human Resources and Compensation Committee Chairs to the Board of Directors, with suggestions to improve the effectiveness of the Board of Directors, Board committees, Board and committee chairs, and separately to individual directors in respect of their personal performance. The Board Chair and committee chairs take into consideration the overall results and suggestions derived from the annual Board performance assessment in order to improve the functioning and activities of the Board and Board committees. • • Board and committee performance evaluation questionnaires, including a self-assessment by individual directors; Board Chair evaluation questionnaire; and Committee Chair evaluation questionnaires. • • • • Each questionnaire is then sent to every director and a complete set of the responses is forwarded to the Board Chair, except for the responses to the evaluation questionnaire relating to the Board Chair, which is forwarded directly to each of the Chairs of the Corporate Governance and Nominating Committee and the Human Resources and Compensation Committee. 30 CN MANAGEMENT INFORMATION CIRCULAR 2020 STATEMENT OF CORPORATE GOVERNANCE PRACTICES

Peer Assessment and Independent Advisor The Board Chair leads on an annual basis a peer review process through one-on-one meetings with each individual director. In addition, the Board may, from time to time, hire an independent advisor to assist the Board of Directors in independently assessing the performance of the Board of Directors, Board committees, Board and committee chairs and individual directors. The Corporate Governance and Nominating Committee also considers on an annual basis the appropriateness of conducting a peer assessment through an independent advisor. In 2016, an outside consultant was retained to conduct a peer review. The peer evaluation process provided for feedback on the effectiveness of individual directors. Each director was given the opportunity to assess the contribution of each of his or her peers relative to the performance standards for the The overall results and suggestions derived from the annual Board performance assessment are taken into consideration to improve the functioning and activities of the Board and its committees. director position description as set out in CN’s Corporate Governance Manual. The results were compiled and reviewed confidentially by the outside c onsultant. The Chair then received the results of each director’s peer assessment and met with each director to discuss his or her respective assessment. The Board performance assessment process is further described in CN’s Corporate Governance Manual which is available on our website at www.cn.ca, under Delivering Responsibly/Governance. Director Orientation and Continuing Education Orientation Our orientation program includes presentations by the Company’s officers on CN’s organizational structure and the nature and operation of its business, a review with the Board Chair of the methods of operation and the roles of the Board and its committees, a discussion on the contribution individual directors are expected to make and access to appropriate information or outside resources as required. New directors are provided with the following: a directors’ handbook containing corporate and other information required to familiarize themselves with the Company, its organization and operations and CN’s key corporate governance and public disclosure documents, including CN’s Corporate Governance Manual and board and committee charters; information regarding the review process for the Board, its committees and their chairs, and individual directors; CN’s important policies and procedures, including CN’s Code of Business Conduct; and organizational charts and other business orientation materials, including CN’s Investor Fact Book, sustainability and safety brochures, financial statements and regulatory information. In addition, meetings are arranged with new directors and members of CN’s Leadership team to provide an overview of their areas of responsibility and their function/department. These areas include finance, corporate services, marketing, operations, technology, human resources and investor relations. New directors also receive presentations by the Company’s officers on CN’s business and operations, safety, security, sustainability, community outreach initiatives and talent development, amongst others. New directors are also invited to attend the following Company events: • encourages presentations by outside experts to the Board or committees on matters of particular importance or emerging significance; and at least annually, holds a Board meeting at or near an operating site or other facility of the Company, a key customer, supplier or affiliated company. • The Board Chair arranges for Board members to have access to education and information on an ongoing basis pertaining to Board effectiveness and the best practices associated with successful boards, briefings on factors or emerging trends that may be relevant to the Company’s business strategy and other material as deemed appropriate by the Board Chair. The Company also makes available, at its cost, a host of educational programs provided by leading institutions. We encourage directors to attend seminars and other educational programs and to report back to the Board on the quality of such programs. Educational reading materials on corporate governance and other topics are also included in the materials provided to the Board in advance of meetings. In 2019, Board members were provided with educational reading materials and presentations on a variety of matters and topics, including corporate governance, executive compensation, executive succession planning, shareholders and shareholder associations, key accounting considerations, financial strategy, risk management and disclosure, and Canadian and U.S. securities law developments. The Board regularly received updates and reports by CN’s internal counsel on regulatory matters of importance and emerging issues of significance to CN and the railway industry, such as diversity, safety, technology and risk mitigation. In addition, in 2019, members of the Board attended courses in subject areas which included effective corporate boards, board structure, processes and composition and participated in discussion panels. Directors also interacted with executive and senior management at every Board meeting and received regular and extensive presentations on matters of strategic importance to the Company’s business, including presentations on its customer engagement initiatives, safety, stakeholder and community outreach initiatives, business growth strategy, operating plans, supply chain strategy, car management, CN’s sustainability initiatives, cybersecurity and regulatory matters relevant to the business of the Company. Moreover, the directors have, from time to time, been provided with first-hand opportunities to visit certain sites where CN has made significant investments. They have visited our Information Technology command centre, certain CN main yards such as Kirk Yard, the CN Woodcrest Shops and the Elgin, Joliet and Eastern Railway properties in the United States. The Board has also visited CN’s two state-of-the-art training centres in Winnipeg, Manitoba and near Chicago, Illinois, and toured a Geometry Test Car. In 2016, the Board visited Two Harbours, Minnesota to tour CN’s iron ore dock operations and the E.H. Gott vessel, for an in-depth review of the vessel and dock operations. In 2017, the Board, as part of its stakeholder engagement initiatives, attended community • • • • • Annual business plan meeting with top 200 employees; Annual sales meetings; Industry conferences or CN’s analyst/investor meetings; Leadership training sessions and dinners with participants; and Other company events on an ad hoc basis. In addition, new directors are encouraged to visit sites across CN’s network relating to the Company’s operations. These sites include mechanical and car shops, intermodal and engineering groups, data centres, training centres, railway yards and ports and terminals. Continuing Education The Board recognizes the importance of ongoing director education and the need for each director to take personal responsibility for this process. To facilitate ongoing education, the Company: • maintains a membership for each director in an organization dedicated to corporate governance and ongoing director education; • encourages and funds the attendance of each director at seminars or conferences of interest and relevance; 31 CN MANAGEMENT INFORMATION CIRCULAR 2020 STATEMENT OF CORPORATE GOVERNANCE PRACTICES

events in Regina, Saskatchewan and Ottawa, Ontario. In 2018, the Board visited the Port of Prince Rupert for a detailed tour of customer operations in Prince Rupert (DP World) and Ridley Island (Ray-Mont Logistics and Ridley Terminals). In 2019, the Board, the President and CEO and other executive officers attended meetings and event in Singapore, including a tour of the Port of Singapore, to provide our directors with the opportunity to see first-hand the scope of the thriving economic activities in South East Asia and gain an understanding of North America’s trade potential with South East Asia. The following table lists seminars and courses by external providers, as well as dedicated internal sessions and presentations on key CN subject matters, that the directors of the Company attended in 2019 and early 2020. SUBJECT MATTER TOPIC PRESENTED PRESENTED/HOSTED BY ATTENDED BY SAFETY Safety Update Incident / Crisis Management Engineering Review CN Safety & Environment CN Corporate Services CN Mechanical & Engineering All directors All directors All directors CUSTOMER RELATIONS Operational and Service Excellence CN Operations & Marketing All directors INVESTOR RELATIONS Competitive Context Investor Engagement CN Investor Relations CN Investor Relations All directors All directors MARKETING Market Updates CN Marketing All directors SUSTAINABILITY Fuel Productivity Workforce Renewal & Talent Value CN Financial Planning CN Human Resources All directors All directors TECHNOLOGY Positive Train Control Updates Enhanced Train Control Updates Cybersecurity and Information Technology Technology and Innovation CN Information Technology CN Information Technology CN Information Technology CN Information Technology Audit Committee members All directors All directors All directors LAW & GOVERNMENT AFFAIRS Updates on Canadian and U.S. Regulatory and Political environment Updates on NAFTA/USMCA and Trade Leading Governance and Board Diversity Practices CN Corporate Services CN Corporate Development CN Corporate Services All directors All directors All directors FINANCE Credit Rating Presentation CN Treasury and Credit Rating Agency All directors Stakeholder Engagement CN is recognized as a company that delivers responsibly, is a key part of the solution for customers, and is a true backbone of the economy. Over the year, we continued to deepen the Company’s sustainability agenda: moving customer goods safely and efficiently, ensuring environmental stewardship, attracting and developing the best railroaders, adhering to the highest ethical standards and building safer, stronger communities. Shareholders Engagement CN recognizes the importance of strong and consistent engagement with its shareholders and we welcome and encourage interaction with our shareholders as we believe it is important to have direct frequent engagement in order to allow and encourage an open dialogue and exchange of ideas. Our Investor Relations department actively engages with the broad investment community, including shareholders, sell-side analysts, potential investors, as well as shareholder advocacy groups, to provide public information on the Company, as well as to address any specific questions or concerns. Over the last year, we have engaged in the following initiatives, among others: • Sell-side-sponsored conferences: throughout the year, CN executives speak at industry investors conferences on CN’s business and operations. The presentations are webcast and available to listen live via the CN website at www.cn.ca. We have in place various means of communication for receiving feedback from interested parties, such as a toll-free number for general inquiries (1-888-888-5909). Shareholders and other interested parties may also communicate with the Board and its Chair by calling 514-399-6544. The Board of Directors also adopted procedures allowing interested parties (i) to submit accounting and auditing complaints or concerns to us and (ii) to communicate directly with the Chair of the Board, who presides over all non-executive director sessions. These procedures are described on our website at www.cn.ca, under Delivering Responsibly/ Governance. In addition, the Company continued its stakeholder activities by: • engaging with all levels of government as a participant on advisory councils, review boards and regulatory proceedings; conducting community outreach; working collaboratively with supply chain partners; participating in industry associations (Railway Association of Canada; Association of American Railroads); engaging with suppliers at our annual supplier council and through our Sustainable Procurement Excellence program; strengthening our relationships and improving our communication with customers; ensuring the opportunity for regular two-way communication with employees; and taking part in structured community engagement. • Earnings calls: engagement by CN executives on a quarterly basis with the investment community to review our quarterly financial and operating results; Investor Day: approximately every two years, engagement by CN executive team and senior management with the investment community to discuss the Company’s strategic agenda. In 2019, CN invited investors to “Experience a Day in the Life of a Railroad”, including a tour of Macmillan Yard and Brampton Intermodal Terminal in the Toronto area; Non-deal roadshows: throughout the year, multiple engagements by CN executives and the Vice-President, Investor Relations with institutional investors to provide public information on our strategic agenda, business and operations; and • • • • • • • • • 32 CN MANAGEMENT INFORMATION CIRCULAR 2020 STATEMENT OF CORPORATE GOVERNANCE PRACTICES

For the year 2019, CN received a number of awards and recognition including: Examples of the Company’s Aboriginal engagement activities include: • Ranked among the best 50 corporate citizens in Canada by Corporate Knights Listed on the Jantzi Social Index Listed on FTSE4Good Index Listed on Canada’s Top 100 Employers Named to Dow Jones Sustainability World Index for the eighth consecutive year and to the DJSI North American Index for the 11th consecutive year • Support of and attendance at the Assembly of First Nations Annual General Assembly and Circle of Trade Tradeshow Safety presentations made to First Nations Celebration of National Indigenous Peoples Day Partnerships with Indspire, Level and Tech for Canada, three national organizations aimed at empowering Aboriginal peoples through education Sponsorship and participation in numerous PowWows to celebrate Aboriginal culture • • • • • • • • Aboriginal Engagement The Company is committed to developing respectful and mutually-beneficial relationships with all Aboriginal peoples and does so by: In 2018, the CN Law Department was recognized by Thompson Reuters as the recipient of an Innovatio Award in the category of Diversity for all the initiatives in Aboriginal Relations. For more details, please refer to our website at www.cn.ca/aboriginalvision. Community Engagement Great community relations are vital to the running of CN’s transcontinental railroad. That’s why CN strives to be a good neighbour – not only in its commitment to safety and environmental sustainability, but also in making Canada’s communities better and safer places to live, work and play. As part of CN’s commitment to help build safer, stronger communities, CN is establishing community boards across the country. These boards will be located in all major cities across our network and will guide the CN Stronger Communities Fund’s decisions and strengthen community partnerships in these major cities. So far, community boards have been established in Halifax, Saskatoon, Edmonton and Vancouver, Canada. On the safety front, CN actively engaged communities across its network, meeting with emergency responders and elected officials, providing training and expertise and sharing relevant information on dangerous goods shipments. Throughout 2019, CN also continued its support of hundreds of CN railroaders in the community who are champions in the causes they choose to support. CN granted C$1.5 million to support its employees, their families and pensioners in their volunteer efforts. • proactively engaging Aboriginal communities and maintaining open dialogue; promoting opportunities for Aboriginal peoples to join the Company’s workforce; supporting Aboriginal Community initiatives and participating in Aboriginal organizations; and seeking out and encouraging opportunities for Aboriginal business and procurement. • • • In 2015, Canada’s Truth and Reconciliation Commission called on corporations to play a role in reconciliation with Canada’s Aboriginal peoples, including providing education for management and staff on the history of Aboriginal peoples. As part of its Aboriginal Vision, the Company actively encourages employee sensitivity to Aboriginal issues and has provided in-person cultural awareness training since 2015. An eLearning version of the training was launched in early 2017, providing access to a greater number of employees. As at December 31, 2019, more than 8,200 employees had completed the training. In 2018, this training received a President’s Award in the CN Values category, indicating its importance for CN. In 2019, this training became mandatory for all employees in Canada. In 2018, CN was the first transportation company to obtain the bronze certification under the Progressive Aboriginal Relations program of the Canadian Council for Aboriginal Business (CCAB) and one of the first companies to become a Procurement Champion of the CCAB program. 33 CN MANAGEMENT INFORMATION CIRCULAR 2020 STATEMENT OF CORPORATE GOVERNANCE PRACTICES

Statement of Executive Compensation Dear Shareholder: On behalf of the Human Resources and Compensation Committee (“Committee”) and the Board of Directors we welcome this opportunity to share our approach to executive compensation. Once again in 2019, the Company’s annual “Say on Pay” advisory vote received strong support with 97.02% of the votes in favour of CN’s disciplined approach to executive compensation, the highest amongst the publicly traded Class I Railroads. CN remains committed to transparency by providing clear and comprehensive disclosure information to its shareholders. 2019 Overview In July 2019, Robert Reilly was appointed Executive Vice-President and Chief Operating Officer (“COO”). Mr. Reilly has also assumed interim responsibility for CN’s Information and Technology function since November 2019. Mr. Reilly’s extensive leadership experience includes safety, rail operations, field application of rail technologies, and a deep understanding of the intermodal business at major ports and major terminals. In addition, in December of 2019, Dorothea Klein joined CN as its new Senior Vice-President and Chief Human Resources Officer. Mrs. Klein has served large North American and European companies from various industries and her experience will enable CN to continue to implement and manage leading human resources and labour relations practices. 2019 was a challenging year for both CN and its customers. The early part of the year was characterized by prolonged cold weather, followed by a decrease in volumes due to weak demand across the rail industry, and a work stoppage in November in connection with the conductor strike. Despite these challenges, the Company was able to achieve solid financial performance delivering C$596 million of revenue growth compared to last year. Diluted earnings per share was C$5.83 and adjusted diluted earnings per share(a) increased by 5% to C$5.80 in 2019. On the safety side, the Company continued to focus on becoming the safest railroad in North America. Although CN’s Federal Railroad Administration (“FRA”) accident ratio(2) over the last 3 years is 29% better than the average FRA accident ratio for the U.S. Class I Railroads(3) over the same period, CN did not meet its safety targets for the year 2019. CN continues to invest significantly in training, coaching, recognition and employee involvement initiatives, with a focus on safety to reduce injuries. CN recently launched an important safety campaign that focuses on a singular goal: reduce serious injuries and fatalities to zero at CN so everyone can go home safely every single day. The campaign is based on a set of rules developed by the Company, called Life Critical Rules, that if not followed to the letter can lead to serious injury or even death. In addition to this new campaign, the two CN campuses trained over 8,900 experienced railroaders, new hires and customers over the year 2019. The Company also continued its successful Looking Out for Each Other program, which urges its team members to work together to be vigilant about safety and to speak up if they spot an unsafe situation. Disciplined Approach to Compensation CN’s approach to executive compensation continues to be driven by our goal to deliver sustainable and solid returns to shareholders. CN exercises a disciplined approach by ensuring that target compensation supports the attraction and retention of executive talent while remaining within our executive compensation policy. In addition, short-and long-term incentive plans are structured to align realized pay and shareholder returns through the use of various key performance measures, including the use of Relative Total Shareholder Return (“Relative TSR”) performance measures. Long-term growth and value creation remain central to our pay strategy and targets are set to ensure that our compensation policies do not encourage undue risk-taking on the part of our executives. CN’s executive compensation program also supports safe and reliable operations, environmentally and socially responsible practices and industry-leading returns. CN’s executive compensation policy positions target total direct compensation between the median and the 60th percentile of the executives’ respective comparator group. Our disciplined approach to compensation continues to ensure sound and performance driven compensation which is reviewed annually by the Committee. The Committee also independently retains the services of Hugessen Consulting, Inc. (“Hugessen”) to provide advice on compensation recommendations that are presented for Committee approval. 2015 2016201720182019 Revenues (C$ million) Operating income (C$ million) Operating ratio (%) 12,611 5,155 59.1 12,037 5,032 58.2 13,041 5,243 59.8 14,321 5,493 61.6 14,917 5,593 62.5 A djusted diluted earnings per share (C$)(a) 4.444.594.995.505.80 (a) This non-GAAP measure has no standardized meaning prescribed by U.S. GAAP and, therefore, may not be comparable to similar measures presented by other companies and as such, should not be considered in isolation. See the section entitled Adjusted performance measures in CN’s Management’s Discussion and Analysis included in the Company’s 2019, 2018 and 2017 Annual Reports for an explanation of this measure and reconciliation to the nearest GAAP measure. CN continued to invest significantly in its capital program, with an overall investment in 2019 of C$3.9 billion, a record level for the Company, including C$1.6 billion invested to maintain the safety and integrity of the network. CN’s capital spending also included C$1.2 billion on strategic initiatives to increase capacity, enable growth and improve network resiliency, including line capacity upgrades and information technology initiatives. The Company maintained its commitment to shareholders by returning over C$3.2 billion through share buybacks and dividends in 2019. CN’s capital allocations and its strong performance continued to be recognized by the market with a share price increase over the past three years of 30% in Canada, compared to a 11.6% increase over the same period for the S&P/TSX Composite Index. In addition, the Company’s market capitalization in Canada has increased by nearly C$14.7 billion during that same period.(1) (1) Market capitalization increase is based on the period running from December 31, 2016 to December 31, 2019. (2) Accident rate (per million train miles) based on FRA reporting criteria. (3) CSX, NS, BNSF, UP, KCS 34 CN MANAGEMENT INFORMATION CIRCULAR 2020 STATEMENT OF EXECUTIVE COMPENSATION
Compensation Decisions in 2019 The compensation of our NEOs is paid in U.S. dollars to provide a more precise, meaningful and stable comparison with U.S. denominated compensation of incumbents in equivalent positions within the comparator group. Given that Canadian securities regulations require that the compensation information provided in the Summary Compensation Table and other prescribed tables be stated in Canadian dollars, currency fluctuations impact the year-over-year comparability of compensation levels. The Committee believes that the Company’s comparator groups and the U.S. dollar denominated approach to compensation for the NEOs are appropriate and, combined with an overall disciplined approach, provide a competitive total compensation package. Base Salary CN’s policy for base salaries and target bonuses continues to be at the median of the comparator group. In 2019, the overall salary positioning for the NEOs was aligned with the policy. The Committee continues to closely monitor the compensation paid to all executives to ensure it supports a market competitive compensation envelope. Annual Incentive Bonus Plan (“AIBP”) The 2019 annual incentive target was adjusted to 140% for the President and Chief Executive Officer and remained constant at 80% of base salary for the Executive Vice-Presidents, and 65% of base salary for the Senior Vice-Presidents. The AIBP was comprised of three (3) components: corporate financial (70%), safety (10%) and individual performance (20%). In 2019, changes were made to the AIBP to notably emphasize the shared leadership accountability in the achievement of CN’s safety agenda. These changes included the extension of the corporate safety component to all senior management employees. The retirement notice period for executives and senior management employees was also reduced from six to three months. The corporate financial component is designed to measure and reward against challenging targets for revenue, operating income, diluted earnings per share, ROIC, and free cash flow. For 2019, the Company did not meet its corporate financial objectives. Given that annual incentive bonus payout under the AIBP is conditional on the achievement of the corporate financial objectives, no bonus was paid for the year 2019. Long-Term Incentive Program In order to align certain features with market practice, changes were also made to the Long-Term Incentive (“LTI”) plans design in 2019, including a change to the retirement definition as well as adjustments to the vesting provisions in case of involuntary termination without cause or death. A detailed explanation of the changes implemented in 2019 is presented on page 45. Plan Changes in 2020 In 2019, the Committee continued its review of the Company’s compensation plans and approved changes to its short-and long-term incentive plans to be effective in 2020. The changes principally aim at further enhancing the link between corporate financial performance and payouts under the AIBP, and CN’s relative performance and payouts under the LTI plans. The changes are summarized below with a detailed explanation presented on page 49. • Reduction of the number of metrics used in the corporate financial component of the AIBP Introduction of a threshold performance and higher maximum bonus trigger level for the AIBP objectives Increased weighting on Relative TSR in the Performance Share Units (“PSUs”) Extension of the vesting period for stock options from four to five years Extension of the time period to exercise stock options and for stock options to vest in case of retirement • • • • Compensation Risk Mitigation Our compensation programs are designed to encourage appropriate behaviours and include appropriate risk mitigation mechanisms. In 2019, Willis Towers Watson conducted its annual review, reflecting the plan changes in 2020, and confirmed its view that “there does not appear to be significant risks arising from CN’s compensation programs that are reasonably likely to have a material adverse effect on the Company”. At its December 2019 meeting, the Committee reviewed the Willis Towers Watson risk assessment report and supported its conclusions. In its own assessment, the Committee has determined that proper risk mitigation features are in place within the Company’s compensation programs. Conclusion The Committee and the Board of Directors believe that compensation outcomes are appropriate and aligned with CN’s approach to executive compensation. The Committee remains fully engaged in ensuring that CN’s executive compensation remains anchored to a disciplined approach, linked to performance, and is market competitive. The Chair of the Committee and other members of the Committee will be present during the Meeting to answer questions you may have about CN’s executive compensation. We believe that our approach to executive compensation supports the execution of the Company’s strategic plan, and we remain committed to developing compensation programs that will continue to be aligned with our shareholders’ long-term interests. Robert Pace Chair of the Board The Honorable Kevin G. Lynch Chair of the Human Resources and Compensation Committee 35 CN MANAGEMENT INFORMATION CIRCULAR 2020 STATEMENT OF EXECUTIVE COMPENSATION
Human Resources and Compensation Committee Composition of the Human Resources and Compensation Committee The Committee is composed of six independent members. All members have a thorough understanding of compensation policies and principles related to executive compensation and have experience in human resources and compensation matters. Furthermore, they are also members of other committees of the Board and this overlap provides for a strong link between the Committees’ risk oversight responsibilities. The following is a description of the education, skills and experience of each member of the Committee as at the date of this Information Circular that are relevant to the performance of his/her responsibilities as a member of the Committee, including skills and experience enabling the Committee to make decisions on the suitability of the Company’s compensation policies and practices: • Ms. Stein currently serves as Executive Vice-President — General Counsel & Corporate Affairs at The Clorox Company. She also served as Senior Vice-President and General Counsel at H.J. Heinz Company. In her role as general counsel for two Fortune 500 companies working closely with the board of directors, the chief executive officer and the head of human resources, Ms. Stein gained extensive experience and expertise in a large variety of human resources and compensation matters, such as succession planning, talent development, inclusion and diversity. Ms. Stein has also engaged with shareholders’ advisory groups on various compensation matters. The following table summarizes the Committee members’ human resources and compensation-related experience: NUMBER OF COMMITTEE MEMBERS WITH VERY STRONG OR STRONG EXPERIENCE AREA OF EXPERIENCE • Ms. Bruder is the retired Executive Vice-President, Operations at the Royal Bank of Canada where she was responsible for operations related to all personal and business clients in Canada delivered through more than 8,000 employees. In her corporate and board roles she gained extensive experience overseeing human resource matters including compensation design, performance management and talent/succession planning. Mr. Carty spent 30 years in the airline business before retiring as Vice-Chairman and Chief Financial Officer of Dell, Inc. Mr. Carty has experience in developing and implementing compensation plans and performance-based goals for executive and enterprise-wide personnel. Mr. Carty served as chair of the Human Resources Committee of Talisman Energy, Inc. until 2015 and is actively involved in human resources as chair of the board of directors of Porter Airlines, Inc., and past chair of the board of directors of Virgin America Inc. Ms. Godin is Co-Chair of the Board and Executive Vice-President, Strategic Planning and Corporate Development of CGI where she collaborates with the CGI Board to set the strategic direction of the company and maintain equilibrium among CGI’s three stakeholders— clients, employees (whom CGI calls members) and shareholders — to ensure each stakeholders’ long-term success. She also oversees the ongoing development of the CGI Management Foundation, which includes the key elements and best practices that define and guide the company’s actions, along with leading CGI’s strategic planning, marketing, communications and IP strategy functions. Previously Ms. Godin was Vice-Chair of the Board and Executive Vice-President, Chief Planning and Administration Officer, where Ms. Godin oversaw a number of functions across the company, including global security, mergers and acquisitions, and global human resources. Mr. Lynch, chair of the Committee, held various senior positions in the Government of Canada, including Clerk of the Privy Council, Secretary to the Cabinet and Head of the Public Service of Canada where he was responsible for the overall management of 263,000 employees in 80 departments and agencies of the Canadian government. Mr. Lynch is a member of the Leadership Council of the Bank of Montreal and is the chair of the board of directors of SNC-Lavalin Group Inc. He was chair of the Corporate Governance Committee and a member of the Human Resources Committee of Empire Company Limited (Sobeys) until 2017. Mr. Phillips served as President and Chief Executive Officer of various companies, including Dreco Energy Services, Ltd., PTI Group, Inc., and British Columbia Railway Corporation where he gained in-depth exposure to human resources and compensation matters. He currently serves on the Human Resources and Compensation Committee of Canadian Western Bank and West Fraser Timber Co. Ltd. Mr. Phillips was inducted as a fellow of the Institute of Corporate Directors in June 2017. Membership on HR committees 6/6 100% Organizational exposure to the HR function 6/6 100% Leadership and succession planning, talent development 6/6 100% Approval of employment contracts 6/6 100% • Development/oversight of incentive programs 5/6 83% Oversight of stress-testing of incentive programs vs. business/operating performance 6/6 100% Pension plan administration/oversight 4/6 67% Interpretation and application of regulatory requirements related to compensation policies and practices 5/6 83% • Engagement with investors and investor representatives on compensation issues 4/6 67% Oversight of financial analysis related to compensation policies and practices 5/6 83% Exposure to market analysis related to compensation policies and practices 5/6 83% Drafting or review of contracts and other legal materials related to compensation policies and practices 4/6 67% Oversight of labour matters 5/6 83% Mandate of the Human Resources and Compensation Committee The Committee’s responsibilities include: • ensuring that appropriate mechanisms are in place regarding succession planning for the executive management positions, including that of the President and Chief Executive Officer; reviewing the President and CEO and his direct reports’ performance assessment; reviewing leadership and talent management for the Company’s key positions; overseeing the identification and management of risks associated with CN’s compensation policies and practices and reviewing disclosure on: (i) the role of the Committee in that respect; (ii) any practices that CN uses to identify and mitigate such risks; and, (iii) any identified risk arising from CN’s compensation policies and practices that is reasonably likely to have a material adverse effect on CN; overseeing the selection of any benchmark group used in determining compensation or any element of compensation and reviewing disclosure on such group; • • • • • • 36 CN MANAGEMENT INFORMATION CIRCULAR 2020 STATEMENT OF EXECUTIVE COMPENSATION

• retaining outside advisors to assist in the performance of its functions and responsibilities, including compensation consultants, independent legal counsel or other independent advisors, and overseeing their work; evaluating the independence of compensation consultants in accordance with applicable NYSE listing standards or other applicable laws, rules or regulations; recommending to the Board of Directors the President and CEO and his direct reports’ compensation; and reviewing human resources practices by ensuring, among other things, that appropriate human resources systems are in place to allow the Company to attract, motivate and retain the quality of personnel required to meet its business objectives. Independent Advice The Committee retains the services of executive compensation consultants to provide advice on compensation recommendations that are presented for Committee approval. Since October 2007, the Committee has retained the services of Hugessen for that purpose. The Committee mandated Hugessen to review and provide advice directly to the Committee on executive compensation recommendations and related questions. In aggregate, the fees invoiced by Hugessen in 2019 totalled approximately C$388,700. Services performed by Hugessen were compensation-related services in light of the review of the various compensation plans performed in 2019 and were provided directly to the Committee and to the Pension and Investment Committee. The Committee has also reviewed Hugessen’s independence and evaluated its performance for 2019. The Committee is satisfied with the advice received from Hugessen and that such advice is objective and independent. Hugessen also meets the independence requirements of the NYSE Listing Standards and confirmed that, on an annualized basis, the amount of fees received by the firm from CN represents less than 5% of Hugessen’s total fees. Since 2007, the Board of Directors has adopted a policy to the effect that the Chair of the Committee must pre-approve all non-compensation services provided to the Company by the consultant retained by the Committee to perform executive compensation-related services. Pursuant to an understanding between the Committee and Hugessen, the latter has agreed not to perform any work for management. • • • The Committee’s full charter is available as part of CN’s Corporate Governance Manual at www.cn.ca, under Delivering Responsibly/ Governance. Finally, the Committee met six (6) times in 2019 and held in camera sessions during each meeting. The report of the Committee, set forth in Schedule B to this Information Circular, outlines the major subject areas reviewed by the Committee during the year. Talent Management and Succession Planning Effective talent management, leadership development, succession planning, and employee engagement are priorities for the Board of Directors and the Committee. A comprehensive framework, focusing on the identification, assessment, and development of talent is used to ensure that the Company has an appropriate pipeline of potential successors at the executive and management levels. CN prepares talent for broader and more complex roles by differentiating development needs and providing meaningful professional experiences. When required, the Company also uses external hiring to address succession gaps and procure critical skills. Regular updates on the talent management and leadership development of each function are reviewed by the Committee. Throughout the year, the Committee also conducts in-depth executive reviews focused on the strength and diversity of succession pools for key leadership roles across CN. The Company also integrates a more precise approach for high-potentials in an effort to prepare them for broader and more complex roles while developing critical leadership capabilities. A complete review of the contingency as well as short-, medium-and long-term succession plans for the executive team is conducted annually, and specific plans to address identified gaps are reviewed. In 2019, CN supplemented its executive talent with both seasoned expertise and new skill set to better position itself for the future. In conjunction, CN intensified its focus on the assessment and development of the next cohort of leadership to drive effective succession planning and strengthen the diverse talent pipeline. The Committee also continued to monitor the development of members of the executive team and to initiate customized development plans as required. CN also regularly hones its career development program to provide targeted training and practical work experience that will reinforce the development of talent. The Committee is satisfied that the proper talent management and succession planning strategies are in place to ensure the Company’s ongoing success. Executive Compensation – Related Fees 37 CN MANAGEMENT INFORMATION CIRCULAR 2020 STATEMENT OF EXECUTIVE COMPENSATION SERVICES RENDERED IN 2019 (C$) SERVICES RENDERED IN 2018 (C$) EXECUTIVE COMPENSATION ALL OTHER – RELATED FEESFEES EXECUTIVE COMPENSATION ALL OTHER – RELATED FEESFEES Hugessen388,7000 268,9000

Compensation Discussion and Analysis Executive Summary Named Executive Officers This Compensation Discussion and Analysis (“CD&A”) section covers executive compensation for the year ended December 31, 2019, and focuses on the following NEOs who appear in the compensation tables: Jean-Jacques Ruest President and Chief Executive Officer (“President and CEO”) Ghislain Houle Executive Vice-President and Chief Financial Officer (“CFO”) Robert Reilly Executive Vice-President and Chief Operating Officer (“COO”) and Interim Chief Information and Technology Officer Sean Finn Executive Vice-President Corporate Services and Chief Legal Officer (“CLO”) Dorothea Klein Senior Vice-President and Chief Human Resources Officer (“CHRO”) Robert Reilly joined CN in June 2019 as Executive Vice-President, transitioning into the role of COO, function he assumed on July 1, 2019. Mr. Reilly has also assumed interim responsibility for CN’s Information and Technology function since November 2019. In addition, in December 2019, Dorothea Klein joined CN as its new Senior Vice-President and Chief Human Resources Officer. Compensation Framework The Company follows a comprehensive executive compensation program for NEOs which includes: i) base salary; ii) annual incentive bonus; iii) long-term incentives; iv) pension benefits; and v) executive perquisites. The first three elements define total direct compensation. The objective of CN’s compensation program is to attract, retain and engage top talent by ensuring that there is a clear link between the Company’s long-term strategy, its business plan and executive rewards. Decisions on how much to pay the NEOs and all other executives in terms of total direct compensation are based on the Company’s executive compensation policy. The policy aims to position target total direct compensation between the median and the 60th percentile of the executives’ respective comparator groups. For the President and CEO, and the Executive Vice-Presidents, the comparator group consists of select Class I Railroads (Union Pacific Corporation, CSX Corporation, Norfolk Southern Corporation and Canadian Pacific Railway Limited). For all other executives, including the CHRO, the comparator group is comprised of a broad sample of U.S. industrial organizations with revenues between U.S.$6 billion and U.S.$15 billion that participate in Willis Towers Watson’s proprietary database. CN generated revenues of C$14.9 billion in 2019. For executives in group or division level positions, a complete sample of the U.S. industrial organizations is used, with revenue ranges aligned to reflect the scope of the role of the respective CN executives. More information on the comparator groups can be found on page 41. In December 2019, as part of the annual compensation review process, Willis Towers Watson provided an assessment of how total direct compensation offered to all executives during the year compared against that of the respective comparator groups. Willis Towers Watson reported that the overall aggregate positioning of all executives’ total direct compensation is aligned with CN’s comparator group. Decision Process The compensation of the NEOs, other than that of the President and CEO, is recommended by the President and CEO and reviewed and recommended by the Committee for approval by the Board of Directors. The compensation of the President and CEO is recommended by the Committee and approved by the independent members of the Board of Directors. The President and CEO serves at the discretion of the Board. Neither the President and CEO nor the other NEOs have employment contracts. 2019 Base Salary The base salaries of the President and CEO, Executive Vice-Presidents and Senior Vice-Presidents are paid in U.S. dollars in order to provide for a more precise, meaningful and stable comparison with U.S. denominated salaries in equivalent positions within the comparator group. As part of the NEOs’ annual compensation review, base salaries were set with reference to the median of the applicable comparator group. Salary increases reflect market competitiveness, leadership abilities, retention considerations and succession plans. For more information on base salaries, please refer to page 43. 2019 Annual Bonus Results In 2019, the President and CEO’s target bonus was adjusted to 140% of base salary, the Executive Vice-Presidents’ target bonus was 80% of base salary, and the Senior Vice-Presidents’ target bonus was 65% of base salary. For 2019, the AIBP was comprised of corporate financial (70%), safety (10%) and individual (20%) performance components. The corporate financial component was measured against challenging targets for revenue, operating income, diluted earnings per share, ROIC and free cash flow. The Board of Directors is of the view that its chosen corporate financial performance objectives are appropriate for a capital-intensive business such as CN. 2019 was a challenging year for both CN and its customers. The early part of the year was characterized by prolonged cold weather, followed by a decrease in volumes due to weak demand across the rail industry, and a work stoppage in November in connection with the conductor strike. Consequently, the Company did not meet its corporate financial objectives and the Board of Directors assessed the performance of the Company at “does not meet”, resulting in a corporate financial bonus factor of 0%. Given that annual incentive bonus payout under the AIBP is conditional on the achievement of the corporate financial objectives, no bonus was paid for the year 2019. The table showing the 2019 corporate financial performance objectives, as approved by the Board of Directors in January 2019, and the 2019 results can be found on page 44. 2019 Long-Term Incentives In determining the appropriate long-term incentive fair value of LTI granted to NEOs, the Committee considered external market data, as well as other factors such as individual performance, retention risk and succession plans, and the Company’s compensation policy. The fair value of LTI grants for NEOs is determined with reference to the 60th percentile of the applicable comparator group. To align with mid-and long-term business performance and shareholder value creation, long-term incentives consist of a combination of PSUs and stock options, respectively weighing 55% and 45% of the long-term incentive fair value granted(1). (1) The weighting of the 2019 long-term incentive grant value for the President and CEO was different (67% PSUs and 33% Stock Options) to reflect stock option distribution requirements which limit the number of stock options, as per stock exchanges rule, that may be awarded during any calendar year to any individual participant to a maximum of 20% of the stock options awarded in that year. 38 CN MANAGEMENT INFORMATION CIRCULAR 2020 COMPENSATION DISCUSSION AND ANALYSIS
The payout of PSUs granted in 2019 to NEOs is subject to two distinct performance measures. 70% of the PSU award is subject to the achievement of solid ROIC performance for the period ending on December 31, 2021, and to the attainment of a minimum average closing share price established at the beginning of the cycle. The remaining 30% is subject to CN’s Relative TSR measured against two comparator groups: i) selected Class I Railroads and ii) S&P/TSX 60 companies for the same period ending on December 31, 2021. The stock options granted in 2019 are conventional and vest over four years at a rate of 25% at each anniversary date. Stock options have a 10-year term. The table summarizing the performance objectives and payout condition of the 2019 PSU award can be found on page 46. 2017 Performance Share Units Award Payout The Committee reviewed the vesting of the 2017 PSU award against the performance targets for each measure: ROIC PSUs and Relative TSR PSUs. ROIC PSUs: The Company achieved a three-year average ROIC to December 31, 2019, of 16.69%. In accordance with the plan rules and considering the achievement of the minimum average closing share price condition, a performance vesting factor of 169.4% (out of a maximum of 200%) was applied for the ROIC PSUs awarded in 2017. Relative TSR PSUs: The Company delivered a Relative TSR performance of 37.82%(1) over the period from January 1, 2017 to December 31, 2019, resulting in an overall performance vesting factor of 100% (out of a maximum of 200%), reflecting the weighted average performance vesting factor of both measures (0% for Class I Railways and 200% for S&P/TSX 60). As part of the equity-settlement conversion, PSUs were settled on February 25, 2020 in CN common shares purchased on the open market to encourage share ownership among participants, subject to compliance with the other conditions of the award agreements. The table illustrating the 2017 PSU performance objectives and results can be found on page 46. Non-Compete, Non-Solicitation and Non-Disclosure The railroad industry operates in a highly competitive market. In recent years, the Company has continued in its efforts to protect its interests and its confidential information. Accordingly, the Company’s long-term incentive award agreements, as well as its non-registered pension plans, contain non-compete, non-solicitation, non-disclosure of confidential information and other restrictive clauses. Payouts under the long-term incentive plans or the non-registered pension plans are conditional upon current or former employees continuing to comply with these restrictive commitments for a period of two years following their termination of employment or retirement from the Company. Further details related to CN’s non-compete and non-solicitation provisions are available on page 48. Risk Mitigation in Our Compensation Program The Company has a formalized compensation policy to guide compensation program design and decisions. Many of the characteristics inherent in the Company’s executive compensation program encourage the right behaviours, thus mitigating risks and aligning long-term results with shareholder interests. The following are examples of such characteristics: • Appropriate balance between fixed and variable pay, as well as short-and long-term incentives; • Multiple performance measures to be met or exceeded in the AIBP; • Inclusion of a safety component in the AIBP; • Capped incentive payout opportunities with no minimum guaranteed payout; • The use of Relative TSR performance measures in the PSUs strengthen alignment between executive pay and shareholders return; • Cannot engage in hedging activity or in any form of transactions in publicly-traded options on CN securities; • Executive compensation clawback policy is in place and was amended in 2017 to allow the clawback of bonus or incentive based compensation awarded after March 7, 2017 in circumstances of gross negligence, intentional misconduct, fraud, theft or embezzlement without the need for a financial restatement; • Stock ownership guidelines apply to executives and senior management employees, including post-employment constraints for the President and CEO; and • The Committee retains the services of an independent executive compensation consultant. A complete list and description of these risk-mitigating features is available on page 49. In December 2019, following an annual review of the Company’s compensation policy, programs and practices, Willis Towers Watson concluded again this year that “there does not appear to be significant risks arising from CN’s compensation programs that are reasonably likely to have a material adverse effect on the Company”. The Committee supports the conclusions from Willis Towers Watson’s risk assessment report and, in its own assessment, determined that proper risk mitigation features are in place within the Company’s compensation program. Vertical Pay Ratio Based on the constructive engagement with the BC Government and Service Employees’ Union (“BCGEU”), an investor of CN, following the receipt of its shareholder proposal for the Meeting and which was later withdrawn, starting with the review of compensation programs for 2021, the Committee will review a NEOs vertical pay ratio analysis, including a comparison between the NEOs’ total direct compensation and the median annual total direct compensation for all employees. This analysis will be provided for the Committee’s information to provide additional context when the Committee reviews the Company’s compensation programs. (1) Relative TSR performance is calculated using CNR 20-day share price average immediately prior to January 1, 2017 (including dividend reinvestment) and CNR 20-day share price average ending on December 31, 2019 (including dividend reinvestment). The same calculation is used for all companies part of both comparator groups. 39 CN MANAGEMENT INFORMATION CIRCULAR 2020 COMPENSATION DISCUSSION AND ANALYSIS

Executive Compensation Policy Objectives The Company’s executive compensation policy and programs are designed to ensure that there is a clear link between the Company’s long-term strategy, its business plan and executive rewards, thus encouraging appropriate behaviour. A significant proportion of executive incentive compensation is, as a result, tied to key corporate objectives that play a critical role in driving the organization’s short-and long-term profitability and return to shareholders. The executive compensation program is also designed to be competitive in order to attract, retain and motivate outstanding executive talent while providing for appropriate risk control features. Fixed Compensation Base Salary Total Cash Compensation Annual Incentive Bonus • Corporate Financial Objectives • Corporate Safety Objectives • Individual Objectives Variable Incentive Total Direct Compensation Executive Compensation Total Long-Term Incentives • Performance Share Units (ROIC and Minimum Share Price Condition and Relative TSR Performance) • Stock Options Variable Incentive Indirect Compensation Pension Benefits and Executive Perquisites The executive compensation program is comprised of five elements: i) base salary; ii) annual incentive bonus; iii) long-term incentives; iv) pension benefits; and, v) executive perquisites. The combination of base salary, annual incentive bonus and long-term incentives defines the total direct compensation offering, which is weighted towards variable, “pay-for-performance” elements. Compensation Policy The Company’s Executive Compensation Policy The executive compensation policy aims to target total direct compensation between the median and 60th percentile of the executives’ respective comparator groups. Base salaries and target annual bonuses are set with reference to the median level of the respective comparator group, whereas the grant date fair value of long-term incentives is set with reference to the 60th percentile. The Committee believes that the compensation policy and its principles provide for competitive and reasonable compensation levels. Compensation Decisions and Process The compensation is determined as part of an annual process followed by the Committee and outlined in the chart below: STEP 3 – January • Review of annual and long-term incentive payouts for the prior year Review of compensation programs and annual compensation adjustments Review of new annual targets and long-term incentive awards and performance-vesting conditions Stress-testing of incentive grants • • • STEP 4 – March to October • Monitoring and evaluation of progress and performance of compensation programs Talent management reviews STEP 1 – September to December • Business plan review and approval by the Board • Definition of performance criteria and targets based on Business Plan • The Committee reviews benchmark information in December each year, and approves compensation adjustments in January of the following year by taking into consideration comparator group practices, economic outlook, individual performance, leadership abilities, retention considerations and succession plans. The Committee reviews and recommends for approval by the Board of Directors the performance targets related to both the AIBP and the PSUs in January. Aside from the Relative TSR targets, these targets are derived from CN’s annual business plan, which is prepared by management and reviewed with the full Board during the Strategic Planning Committee meeting prior to the beginning of the applicable year. Business planning is an extensive process during which Management examines with the Board the economic, business, regulatory and competitive conditions which affect or can be expected to affect CN’s business in the following three-year period. Throughout the year, members of the Committee are provided with updates related to the Company’s performance against targets. STEP 2 – December • Evaluation of the individual performance assessment for the NEOs Review of compensation benchmark, and pay positioning Annual review of risk and assessment of risk mitigation features • • 40 CN MANAGEMENT INFORMATION CIRCULAR 2020 COMPENSATION DISCUSSION AND ANALYSIS

The Board and Committee also have open access to executive management throughout the year, should they wish to discuss specific business issues or seek clarification. The Board and the Committee are therefore confident that they have detailed visibility of the Company’s financial performance and that they are appropriately equipped to recommend executive compensation decisions. Finally, throughout the annual executive compensation review process, the Committee also receives and considers advice from its independent compensation consultant, Hugessen. The annual grant of PSUs and stock options to NEOs and other eligible employees is reviewed and approved by the Board of Directors in January for the then current year. In determining the appropriate long-term incentive fair value granted to each NEO, the Committee considered external market data, as discussed in the “Benchmarking Using Comparator Groups” section, as well as other factors such as individual performance, leadership, and talent retention. Benchmarking Using Comparator Groups The median and 60th percentile competitive pay levels are determined using comparator groups, which have been carefully reviewed and endorsed by the Committee as being appropriate for the level and nature of the benchmarked positions. In determining compensation for the President and CEO and the Executive Vice-Presidents, the Company considers a comparator group of North American companies comprised of the following Class I Railroads: Union Pacific Corporation, CSX Corporation, Norfolk Southern Corporation, and Canadian Pacific Railway Limited. These companies are similar in terms of industry and complexity, including size, revenue, capital investment, and market capitalization and directly compete with CN for key talent. Furthermore, half of CN’s Relative TSR performance indicator for the PSUs is measured against the same comparator group (please refer to page 46 for a description of the plan). The following table shows CN’s positioning relative to the primary comparator group for the President and CEO and the Executive Vice-Presidents. Data is as at December 31, 2019. MARKET CAPIT AVERAGE NUMBER OF EMPLOYEES COMPARATOR GROUP REVENUE (MILLIONS) NET INCOME (MILLIONS) ALIZATION (MILLIONS) Union Pacific Corporation CSX Corporation Norfolk Southern Corporation Canadian Pacific Railway, Limited U.S.$21,708 U.S.$5,919 U.S.$125,500 37,483 U.S.$11,937 U.S.$11,296 U.S.$3,331 U.S.$2,722 U.S.$56,600 U.S.$50,600 21,561 24,442 C$7,792 C$2,440 C$45,400 13,103 AVERAGE(1) C$16,856 C$4,581 C$86,900 24,147 Canadian National Railway Company C$14,917 C$4,216 C$84,000 26,733 RANK(1) 4 3 2 2 (1) Values were converted into Canadian dollars using the 2019 average exchange rate of U.S.$1.00 = CAD$1.3269, except for the market capitalization where the December 31, 2019 exchange rate of U.S.$1.00 = CAD$1.2990 was used. The comparator group used for the benchmarking of compensation for all executives other than the President and CEO and Executive Vice-Presidents is a broad sample of comparably-sized U.S. industrial organizations with revenues between U.S.$6 billion and U.S.$15 billion that participate in Willis Towers Watson’s proprietary database. For more clarity, this comparator group is used for the CHRO. For executives in group or division level positions, a complete sample of the U.S. industrial organizations is used, with revenue ranges aligned to reflect the scope of the role of the respective CN executive. The Committee also considers data from this sample for the President and CEO and the Executive Vice-Presidents for purposes of verifying the alignment with general compensation trends, but not for direct benchmarking purposes, given the direct comparability of the above-mentioned Class I Railroads. Components of the 2019 Executive Compensation Program The following table summarizes the components of the Company’s executive compensation program, which is driven by the executive compensation policy and weighted towards variable, “pay-for-performance” elements. Each component is then further detailed in this section. COMPONENT AND FORM RISK-MITIGATING ELEMENTS OBJECTIVES AND RATIONALE 2019 DESIGN SUMMARY OPPORTUNITY Base Salary Cash Fixed rate of pay Set with reference to median of the respective comparator group Provides for a balanced mix Provide competitive level of fixed compensation of pay components (fixed vs. Individual salary recommendations based on competitive assessment and economic outlook, leadership, retention and succession considerations ariable) v Recognize sustained individual performance Use of external advisor and peer group analysis Reflect increase in role responsibility and/or growth in role Annual Incentive Bonus Annual awards based on achievement of five pre-determined Target is 140% of base salary for the President Use of multiple performance measures Reward the achievement corporate financial performance objectives (70%), two pre-determined corporate safety performance objectives (10%) and individual performance (20%) of a balanced set of and CEO, 80% for the annual corporate financial performance objectives Plan targets reviewed and approved annually based on in-depth review of annual business plan Executive Vice-Presidents, Cash-based performance pay and 65% for the Senior Performance period: 1 year Reward the achievement of a set of annual corporate safety performance Vice-Presidents. Maximum payout is limited to 2.0 times the target Payout trigger based on corporate performance objectives For other eligible Reward the achievement of personal objectives aligned with each employee’s area of responsibility and role in realizing operating results management employees, target is based on grade Increased diversification with the addition of a safety level with a maximum payout limited to 1.5 or 2.0 times the target component Payouts are capped Drive superior corporate No guaranteed minimum financial and safety as well as individual performance payout Payouts subject to a clawback policy Payouts for executives, and senior management employees are subject to a three-month notice period in the year of retirement. 41 CN MANAGEMENT INFORMATION CIRCULAR 2020 COMPENSATION DISCUSSION AND ANALYSIS

COMPONENT AND FORM RISK-MITIGATING ELEMENTS OBJECTIVES AND RATIONALE 2019 DESIGN SUMMARY OPPORTUNITY Long-Term Incentives PERFORMANCE SHARE UNITS (55%) 70% of the PSU value is subject to the attainment of three-year Long-term incentive grant date fair value determined Significant weighting towards long-term incentive compensation Align management interests with shareholder value growth and total return relative to Performance-average ROIC targets and to the attainment of a minimum average closing share price established at the beginning of the cycle based share units payable in equity, purchased in the market with reference to the 60th percentile of the applicable Overlapping multi-year performance periods comparator group comparable groups 30% of the PSU value is subject to CN’s relative performance against selected Class I Railroads and S&P/TSX 60 companies PSU performance vesting factor capped at 200% Reward the achievement of sustained financial performance Mix of financial, market and es In the case of retirement, employees must remain in active and continuous service until March 31 of the year following the year in which the grant was made to be eligible for payout r elative performance measur PSU payouts are capped and there is no minimum guaranteed payout Contribute to retention of key talent Performance period: Three years Recognize individual contribution and potential Payouts subject to a clawback policy Stock options STOCK OPTIONS (45%) Conventional stock options that vest over four years at a rate of 25% per year Payouts subject to non-compete provisions In the case of retirement, employees must remain in active and continuous service until the last day of the year in which the grant was made to be eligible for payout Performance period: Four-year vesting, ten-year term Pension Benefits Cash payments following retirement CANADIAN PENSION PLANS Defined Benefit Plan(1): Benefits payable calculated as a percentage of the five-year highest average earnings multiplied by pensionable service Non-registered plans restricted to executives and senior management employees The COO and the CHRO participate in a Defined Contribution Plan, which limits CN’s exposure to risk. Provide an effective and attractive executive compensation program Pensionable service period for most defined benefit plans: Maximum of 35 years Most retirement benefits for executives and senior management employees are calculated using base salary and annual bonus (up to target levels) Payouts subject to non-compete for non-registered plans Defined Contribution Plan(2): Benefits based on the participant’s required and optional contributions and on Company-matched contributions Non-registered plans: Supplement to the registered plans and provide benefits in excess of the Canadian Income Tax Act limits U.S. PENSION PLANS Defined Benefit Plan: Benefits payable calculated as a percentage of the five-year highest average earnings (out of the last 10 years) multiplied by credited service Maximum of 35 years of credited service for most defined benefit plans Savings Plan: 401(k) benefits based on the participant’s voluntary contributions and 50% matching by the Company, limited to 3% of base pay Defined Contribution Feature: Additional benefits included in the Savings Plan based on Company contributions equal to 3.5% of base pay Non-registered plans: Supplement to the registered plans and provide benefits in excess of IRS and Railroad Retirement Board limits Executive Perquisites Non-cash perquisites Healthcare and life insurance benefits, annual physical exam, club membership, company-leased vehicle, parking, financial counselling and tax services Competitive Use of corporate aircraft restricted to business-related purposes (1) Applies to employees hired prior to 2006. (2) Applies to employees hired after 2005 or who have elected to convert from a defined benefit plan. 42 CN MANAGEMENT INFORMATION CIRCULAR 2020 COMPENSATION DISCUSSION AND ANALYSIS
Base Salary The Committee normally reviews the base salaries of executives in January each year, by taking into consideration median comparator group practices, economic outlook, leadership abilities, retention considerations, and succession plans. The base salaries of the President and CEO, the Executive Vice-Presidents, and the Senior Vice-Presidents are paid in U.S. dollars in order to provide for a more precise, meaningful and stable comparison with U.S.-denominated salaries of incumbents in equivalent positions within the comparator group. Annual Incentive Bonus Plan In addition to the NEOs, approximately 4,750 active management employees are eligible to participate in an annual performance-based bonus plan. Under the Company’s AIBP, minimum, target and maximum payouts, expressed as a percentage (%) of base salary, are as follows for the President and CEO, the Executive Vice-Presidents, the Senior Vice-Presidents and Vice-Presidents: For 2019, the AIBP was comprised of the following components: 1. Corporate Financial Performance: 70% of the bonus was linked to the achievement of a balanced set of objectives that contribute to the Company’s long-term financial growth and profitability. The Committee ensures that performance goals and conditions are directly aligned with the achievement of the Company’s corporate objectives as set out in the Company’s business plan, which is recommended by the Strategic Planning Committee and reviewed and approved by the Board of Directors. These corporate objectives are taken into account in establishing the Company’s targets under the AIBP. In addition, in setting the AIBP targets for the upcoming year, the Company generally excludes items from the prior year that did not necessarily arise as part of the normal business of the Company, which can impact the comparability of the Company’s year-over-year financial performance and the Company’s current year targets in relation to the prior year’s results. In 2019, the Board of Directors assessed the Company’s corporate financial performance against targets for revenues, operating income, diluted earnings per share, free cash flow, and one-year ROIC. These measures were selected because they are quantifiable measures that play an important role in driving the organization’s profitability and return to shareholders. Additionally, the Board is of the view that its chosen corporate objectives are appropriate for a capital-intensive business like CN. The 2019 targets were approved by the Board of Directors in January 2019 based on the Company’s business and financial outlook at that time. Under the terms of the AIBP, a maximum corporate performance factor of 200% for executives and senior management employees can be applied to an eligible employee’s annual bonus payout when financial results exceed all five corporate performance stretch (maximum) objectives. There is no payout under a given measure if base performance is not achieved. Base performance is equivalent to “target” performance as generally understood with the exception that performance below “base” for a given measure does not trigger any payment under that measure. (1) (1) POSITION MINIMUM TARGET MAXIMUM President and CEO Executive Vice-Presidents Senior Vice-Presidents Vice-Presidents 0% 0% 0% 0% 140% (2) 80% 65% 50/60% 280% (2) 160% 130% 100/120% (1) As a percentage of base salary as at December 31, 2019. (2) Adjusted as of January 1, 2019. The bonus payout received under the AIBP for the executives depends on the achievement of corporate financial (70%) and safety (10%), and individual (20%) objectives. This design reflects the Company’s view that any short-term incentive should be tied both to the overall financial and operational performance of the Company and to those areas of its business that each employee can influence directly. The following illustrates the 2019 AIBP for the President and CEO: AIBP for the President and CEO Corporate Financial Performance Corporate Safety Individual Performance Performance Corporate Financial Performance Corporate Safety Performance Individual Performance 25% Revenues 25% Operating Income 15% Diluted Earnings per Share 20% Free Cash Flow 15% Return on Invested Capital 50% FRA Accident Ratio 50% FRA Injury Ratio 25% Operational and Service Excellence 25% Top Line in 2019, mid-to long-term Organic Business Development, and Inorganic Acquisitions and Joint Ventures 20% Employee Engagement, Talent Culture, Leadership Team Effectiveness 10% Stakeholder and Regulatory Engagement 20% Safety Culture 43 CN MANAGEMENT INFORMATION CIRCULAR 2020 COMPENSATION DISCUSSION AND ANALYSIS 70% 10% 20%

Performance Objectives and Results – 2019 Annual Incentive Bonus Plan In January 2019, the performance targets were set assuming an exchange rate of U.S.$1.00 = C$1.30. During the year, the actual average exchange rate was at U.S.$1.00 = C$1.33. At the end of 2019, the Company’s targets, with the exception of ROIC, were adjusted to take into consideration the foreign exchange and, in the case of Revenues, the difference between actual and forecasted oil and diesel prices with respect to the Company’s fuel surcharges. The following table, therefore, compares the 2019 adjusted performance targets with the actual 2019 results as reported by the Company. TARGET) (MAXIMUM) (1) Corporate objectives assume an average exchange rate of U.S.$1.00 = C$1.30. (2) Corporate objectives and results reflect an actual average exchange rate of U.S.$1.00 = C$1.33. (3) Results exclude TransX and H&R as these businesses were not part of Board approved Targets set in January. Diluted Earnings per Share and ROIC results have also been adjusted to remove the impact of tax enactments. (4) Revenues target has been adjusted to reflect actual fuel surcharges invoiced to clients based on actual oil and diesel prices in 2019. (5) ROIC and Free cash flow are non-GAAP measures that have no standardized meaning prescribed by U.S. GAAP and, therefore, may not be comparable to similar measures presented by other companies and as such, should not be considered in isolation. See the sections entitled “Return on invested capital (ROIC) and adjusted ROIC” and “Liquidity and capital resources – Free cash flow” in CN’s Management’s Discussion and Analysis included in the Company’s 2019 Annual Report for explanations of these measures and reconciliations to the nearest U.S. GAAP measure. (6) As indicated in note (5), free cash flow does not have any standardized meaning prescribed by U.S. GAAP and, therefore, may not be comparable to similar measures presented by other companies. The Company believes that free cash flow is a useful measure of liquidity as it demonstrates the Company’s ability to generate cash for debt obligations and for discretionary uses such as payment of dividends, share repurchases and strategic opportunities. The Company defines its free cash flow measure as the difference between net cash provided by operating activities and net cash used in investing activities; adjusted for the impact of business acquisitions, if any. (7) As indicated in note (5) ROIC does not have any standardized meaning prescribed by U.S. GAAP and, therefore, may not be comparable to similar measures presented by other companies. ROIC measures the Company’s efficiency in the use of its capital funds and is viewed as a key measure of long-term value generation to its shareholders. ROIC is generally calculated as net income plus interest expense after-tax divided by the total of the average net indebtedness and the average shareholders’ equity and may, in certain instances, be adjusted for certain items as determined by the Committee. As such in 2019, and consistent with previous years, ROIC result was adjusted to reflect Accumulated Other Comprehensive Income (AOCI) level used upon setting the targets. For 2019, despite having achieved solid financial results, the Company did not meet its corporate financial targets and, the Board of Directors assessed the corporate performance at “does not meet”, resulting in no bonus payout for the year 2019. 2. Corporate Safety Performance: 10% of the annual bonus target was linked to the Company’s safety performance. In 2019, the Board of Directors assessed the Company’s corporate safety performance against two safety performance metrics with equal weighting: FRA accident and injury ratio. Under the terms of the AIBP, the performance factor for the corporate safety component can range from 0% to 200%. developed by the Company, called Life Critical Rules, that if not followed to the letter can lead to serious injury or even death. In addition to this new campaign, the two CN campuses trained over 8,900 experienced railroaders, new hires and customers over the year 2019. The Company also continued its successful Looking Out for Each Other program, which urges its team members to work together to be vigilant about safety and to speak up if they spot an unsafe situation. For 2019, after considering the operational results against established safety objectives, the Board of Directors assessed the corporate safety performance of the Company at “does not meet”, resulting in no payout for the safety bonus component. Given that payout under the corporate safety component is conditional upon a payout being declared under the corporate financial component, no payout would have occurred for the year 2019, notwithstanding the corporate safety performance of the Company. 3. Individual Performance: 20% of the bonus was based on personal business-oriented objectives that considered the strategic and operational priorities related to each executive’s respective function, with a strong overall focus on: operations and service excellence, top line focus, mid-to long-term organic business development, and inorganic acquisitions and joint ventures, employee engagement, talent culture, leadership team effectiveness, stakeholder and regulatory engagement, and safety culture. The individual performance factor can range from 0% to 200% for NEOs, other executives and senior management employees. The individual performance factor for the President and CEO position is based on an individual assessment reviewed and approved by the Committee. Corporate Safety Performance Objectives and Results – 2019 Annual Incentive Bonus Plan In 2019, CN continued to focus on its objective of being the safest railroad in North America. Although CN’s FRA accident ratio over the last 3 years is 29% better than the average FRA accident ratio for the U.S. Class I Railroads(1) over the same period, CN did not meet its safety targets for the year 2019. CN continues to invest significantly in training, coaching, recognition and employee involvement initiatives, with a focus on safety to reduce injuries. CN recently launched an important safety campaign that focuses on a singular goal: reduce serious injuries and fatalities to zero at CN so everyone can go home safely every single day. The campaign is based on a set of rules (1) CSX, NS, BNSF, UP, KCS 44 CN MANAGEMENT INFORMATION CIRCULAR 2020 COMPENSATION DISCUSSION AND ANALYSIS SAFETY OBJECTIVES AS OF JANUARY 1, 2019 RESULTS 2019 PERFORMANCE ASSESSMENT BASE STRETCH WEIGHT (THRESHOLD) (MAXIMUM) FRA Accident Ratio (per million of50%1.601.50 train miles) FRA Injury Ratio (per 200,00050%1.601.50 person hours) 2.11 1.91 Does Not Meet Does Not Meet IN MILLIONS (EXCEPT PER SHARE DATA AND ROIC) CORPORATE OBJECTIVES AS OF JANUARY 1, 2019 (1) CORPORATE OBJECTIVES AS ADJUSTED (2) RESULTS 2019 (3) (C$) PERFORMANCE ASSESSMENT BASE (THRESHOLD/STRETCH TARGET) (MAXIMUM) WEIGHT (C$)(C$) BASE (THRESHOLD/STRETCH (C$)(C$) Revenues 25%15,50715,717 Operating Income25%6,1356,280 Diluted Earnings per Share15% $6.00 $6.15 Free Cash Flow(5)(6)20%2,2352,350 ROIC(5)(7) 15%15.30%15.90% 15,629 (4)15,839 (4) 6,2456,390 $6.10$6.25 2,3522,467 15.30%15.90% 14,595 5,594 $5.68 1,992 14.88% Does not Meet Does not Meet Does not Meet Does not Meet Does not Meet
In 2019, the individual objectives of the NEOs included both quantitative measures and qualitative strategic and operational considerations related to their function. At year-end, the President and CEO reviewed the performance of the other NEOs, taking into consideration their achievements against their pre-determined individual objectives and determined their individual bonus factor, subject to Committee review and Board approval. The Committee then reviewed and reflected on each NEO’s individual achievements against objectives, as well as their overall leadership in meeting their function’s objectives. For 2019, the overall average individual bonus factor for the NEOs was 104%. However, given that annual incentive bonus payout under the individual component is conditional upon a payout being declared under the corporate financial component, no bonus was paid for the year 2019. The following formula illustrates how an eligible executive employee’s annual base salary (as at December 31, 2019), target payout (expressed as a percentage of base salary), corporate financial, corporate safety and individual performance factors interact in the determination of the actual annual bonus payout: Annual Bonus Payout Formula Corporate Financial Performance CORPORATE FINANCIAL PERFORMANCE FACTOR ANNUAL BASE SALARY TARGET PAYOUT X X X 70% Corporate Safety Performance CORPORATE FINANCIAL PERFORMANCE FACTOR WHEN BELOW 100% CORPORATE SAFETY PERFORMANCE FACTOR ANNUAL BASE SALARY TARGET PAYOUT X X X X 10% Individual Performance CORPORATE FINANCIAL PERFORMANCE FACTOR WHEN BELOW 100% ANNUAL BASE SALARY INDIVIDUAL PERFORMANCE FACTOR TARGET PAYOUT X X X X 20% For the year 2019, as the Company did not achieve its corporate financial objectives, there was no bonus payout for the management team, including the President and CEO and all other executives. Long-Term Incentives The Board of Directors considers a number of factors to assess the Company’s long-term incentive strategy, including the balance between long-term value creation and shareholder wealth protection, executive stock ownership position versus stock option holdings, executive retention risk, as well as the dilution impact of different long-term incentive vehicles. Since 2005, the Board of Directors has elected to grant a combination of stock options and PSUs to NEOs, as well as to executives and senior management employees. LTI values disclosed in the Summary Compensation Table on page 55 are calculated using the Willis Towers Watson expected life binomial methodology. The same valuation methodology is also used for benchmark and grant purposes. This valuation methodology provides for precise and comparable compensation information. The Company uses a rolling three-year valuation factor to limit year-over-year fluctuations of the valuation factor for both stock options and PSUs. PSUs and stock options are weighted 55% and 45% of the long-term incentive award value, respectively, except for the President and CEO position. The President and CEO’s long-term incentive award has a smaller relative weight in stock option value, due to the 20% limitation on the number of stock options that can be awarded to any one individual in a particular year, pursuant to the terms of the Management Long-Term Incentive Plan (“MLTIP”) and the stock exchanges rule (please refer to page 61 for a description of the plan). LTI Award The annual grant of PSUs and stock options to NEOs and other eligible employees is reviewed and approved at the meetings of the Committee and the Board of Directors, which occur each year in January. In order to determine each NEO’s LTI award, the Committee takes into consideration individual performance, retention risk and succession plans, as well as the Company’s compensation policy and the value of LTIs granted by the applicable comparator group (please refer to section “Benchmarking Using Comparator Groups” on page 41). The Committee does not consider previous executive grants when setting the individual awards, as the LTI plans are inherently performance-based. The Board may also, at its discretion, approve additional grants of PSUs and stock options to NEOs during the year. The exercise price of the stock options granted is equal to the closing price of the Company’s common shares on the TSX or the NYSE on the grant date. A minimum active service condition exists for stock options and PSUs to support the retention of key talent approaching retirement. The minimum active service condition is 12 months for stock options and 15 months for PSUs. Should an executive, including NEOs, or other management employees retire prior to the end of the minimum service condition in the award agreement, PSUs and stock options awarded pursuant to that agreement would be forfeited. In 2018, the Committee initiated its review of CN’s compensation programs and approved changes to CN’s LTI plans effective as of January 1, 2019, which aim to further align certain plan features with market practice. • The retirement definition for the LTI plans was amended for awards made in 2019 and after to the earlier of (i) 55 years of age and 12 years of continuous service, or (ii) 60 years of age and 7 years of continuous service. The same retirement definition applied to the AIBP starting on January 1, 2020. 45% Stock Options 55% PSUs 50% 50% S&P/TSX 60 Selected Class I Railroads 45 CN MANAGEMENT INFORMATION CIRCULAR 2020 COMPENSATION DISCUSSION AND ANALYSIS 70% ROIC + Minimum Share Price Conditions 30% Relative TSR Performance

• In the case of an involuntary termination without cause, death or disability, the vesting of the PSUs, for awards made in 2019 and after will be prorated based on the number of completed months in active service during the three-year plan period. It was previously based on the prorated number of years in active service during the plan period, where a year was considered completed if 9 months had elapsed during such year. In the case of an involuntary termination without cause, the three-month continued vesting provision applicable to stock options was removed for awards made in 2019 and after. The vested stock options at the time of involuntary termination without cause remain exercisable for a period of three months from the termination date, however, no stock options can vest during such three-month period. In the case of death, all unvested options will vest immediately and shall remain exercisable for a period of 12 months from the date of death. Previously the vesting was prorated upon death. 2. Relative TSR PSUs Thirty percent (30%) of the PSU award value is subject to CN’s Relative TSR measured against two equally-weighted comparator groups: i) selected Class I Railroads, and ii) S&P/TSX 60 companies. Relative TSR performance measures CN’s share price appreciation, inclusive of dividends, over the three-year plan period against the companies within each comparator group. Relative TSR PSUs awarded in 2019 to NEOs and other designated employees are subject to the attainment of the performance measures presented in the table below: • TSR relative to S&P/TSX 60 TSR relative to Selected Class I railways CNR PAYOUT (1) CNR PAYOUT • 75 Percentile and above th 200% 100% 50% 0% 1 st 200% 150% 100% 50% 0% 50 Percentile 25th Percentile th 2 nd 3rd 4th 5th Performance Share Units: 2019 Award The objective of the PSUs is to enhance the Company’s ability to attract and retain talented employees and to provide alignment of interests between such employees and the shareholders of the Company. PSUs vest after three years and the grant date fair value of the PSUs awarded to each NEO in 2019 is included in the Summary Compensation Table on page 55, under the Share-Based Awards column. The vesting of PSUs is subject to the achievement of performance measures defined at the beginning of the cycle and the payout can range from 0% to 200%. At the end of the performance cycle, the number of PSUs will be adjusted based on the achievement of the performance conditions detailed below. PSUs will be settled in CN common shares purchased on the open market. Less than the 25th Percentile (1) Interpolation between points. The grant date fair value of the PSUs awarded to each NEO in 2019 is included in the Summary Compensation Table on page 55, under the Share-Based Awards column. Performance Share Units: 2017 Award Payout PSUs awarded in 2017 to NEOs and other designated employees vested based on the achievement of performance targets for each measure: ROIC PSUs and Relative TSR PSUs. ROIC PSUs (70% of the grant value): The Company delivered a three-year average ROIC of 16.69%, resulting in a performance vesting factor of 169.4% (out of a maximum of 200%). As the minimum average closing share price condition was also met, payout occurred in February 2020 in accordance with the Share Units Plan and the 2017 award agreement. Relative TSR PSUs (30% of the grant value): The Company delivered a TSR performance of 37.82%(1) over the period from January 1, 2017 to December 31, 2019, resulting in an overall performance vesting factor of 100% (out of a maximum of 200%), reflecting the weighted average performance vesting factor of both measures (0% for Class I Railways and 200% for S&P/TSX 60). As part of the equity-settlement conversion, PSUs were settled on February 25, 2020 in CN common shares purchased on the open market. PSUs awarded in 2019 are performance measures: 1. ROIC PSUs subject to the following two Seventy percent (70%) of the PSU award value is subject to the achievement of a target related to the Company’s average three-year ROIC over the plan period and the payment will be conditional upon meeting a minimum average closing share price during the last three months of 2021. The ROIC for each of the applicable plan years is generally calculated as net income before interest expense, divided by the total of the Company’s average net indebtedness and the average shareholders’ equity, and may, in certain instances, be adjusted for certain items as determined by the Committee. ROIC measures the Company’s efficiency in the use of its capital funds and is viewed as a key measure of long-term value generation to its shareholders. ROIC performance objectives are based on CN’s business plan. ROIC PSUs granted in 2019 to NEOs and other designated employees are subject to the attainment of the performance measures presented in the table below: Performance Objectives and Results – Performance Share Units – 2017 Award ROIC PSUs – 70% of the grant value: PERFORMANCE VESTING FACTOR (1) OBJECTIVE RESULTS ROIC PSUs performance measure PERFORMANCE OBJECTIVE: Average ROIC for the three-year period ended on December 31, 2019 Below 13.5% 13.5% 14.5% 16.0% 16.5% 17.0% and above 0% 50% 100% 125% 150% 200% PERFORMANCE VESTING FACTOR (1) OBJECTIVE (2) 16.69% PERFORMANCE OBJECTIVE: Average ROIC for the three-year period ending on December 31, 2021 Below 13.5% 13.5% 14.5% 16.0% 16.5% 17.0% and above 0% 50% 100% 125% 150% 200% translating into a payout factor of 169.4% PAYOUT CONDITION: Minimum average closing share price for the last three months of 2019 C$90.56 on the TSX C$118.71 U.S.$89.87 or the NYSE U .S.$67.92 on PAYOUT CONDITION: Minimum average closing share price for the last three months of 2021 C$104.19 on the TSX or U.S.$77.08 on the NYSE (1) Interpolation applies between objectives. (2) Adjusted to exclude deferred income taxes resulting from various tax enactments, including U.S. tax changes. (1) Interpolation applies between objectives. (1) TSR performance is calculated using CNR 20-day share price average immediately prior to January 1, 2017 (including dividend reinvestment) and CNR 20-day share price average ending on December 31, 2019 (including dividend reinvestment). The same calculation is used for all companies part of both comparator groups. 46 CN MANAGEMENT INFORMATION CIRCULAR 2020 COMPENSATION DISCUSSION AND ANALYSIS

Relative TSR PSUs – 30% of the grant value: The value vested during the year for each NEO is included in the table Incentive Plan Awards — Value Vested or Earned During the Year, and under the Share-Based Awards — Value Vested During the Year column on page 60. Stock Options Stock options were granted in 2019 to NEOs and other designated employees pursuant to the MLTIP. Please refer to page 61 for details of the MLTIP. The stock options granted in 2019 vest over four years at a rate of 25% at each anniversary date and have a ten-year term. Grants were made in the currency of the recipient’s salary. Stock options are granted with the objective of rewarding NEOs and other designated employees for creating sustainable, long-term shareholder value. If the share price increases between the grant date and the vesting date, stock options will have a realizable value. Gains are realized once the stock options are exercised. The gain will be equivalent to the difference between the share price on the date of exercise and the grant date share price, multiplied by the number of stock options exercised. The grant date fair value of the stock options awarded to NEOs in 2019 is included in the Summary Compensation Table on page 55, under the Option-Based Awards column. TSR relative to S&P/TSX 60 (15% of the grant value) CNR PAYOUT (1) RESULTS 75th Percentile and above 50th Percentile 25th Percentile 200% 100% 50% 37.82% TSR resulting in the 75th percentile and translating into a payout factor of 200% L ess than the 25 Percentile th 0% (1) Interpolation applies between objectives. TSR relative to selected Class I Railways (15% of the grant value) CNR PAYOUT RESULTS 1st 2nd 3rd 4th 5th 200% 150% 100% 50% 0% 37.82% TSR resulting in the 5th place ranking and translating into a payout factor of 0% Executive Perquisites NEOs are eligible to receive perquisites and personal benefits in accordance with the Company’s policy and in line with general market practice. These typically include the use of a Company-leased vehicle, parking, financial counselling and tax services, club membership, certain healthcare benefits and life insurance, and an annual executive physical exam. Other executives and senior management employees are also eligible to receive select perquisites; the type and value of the perquisites are generally determined by the grade of the employee’s position. All executives must comply with the aircraft utilization policy, which restricts the usage of the corporate aircraft to business-related purposes only, save for exceptional circumstances and provided all incremental costs are fully reimbursed. Employee Share Investment Plan The Employee Share Investment Plan (“ESIP”), available to all Company employees, provides the opportunity to participate in CN’s ownership through the purchase of CN common shares on the open market via payroll deductions. Employees may contribute between 1% and 10% of their gross base salary to the ESIP every pay period. The Company provides a 35% match on the first 6% of employee contributions. Since January 1, 2019, Company contributions to the ESIP are subject to a one-year vesting period and are forfeited should certain participant contributions be sold or disposed of prior to vesting. Over 80% of CN’s employees are shareholders of the Company through participation in the ESIP, and in 2019, all NEOs participated in the ESIP. The value of the Company match received by NEOs in 2019 under the ESIP is indicated in the Details of the All Other Compensation Amounts table on page 58. Other Key Compensation Programs of the Company Stock Ownership The Committee strongly supports stock ownership by executives. Stock ownership guidelines require a minimum level of stock ownership, set as a multiple of base salary, to be achieved within a five-year period (or a seven-year period for the lower level of senior management employees) to align the interests of executives with those of shareholders. As at December 31, 2019, 194 executives and senior management employees were subject to share ownership guidelines. Once executives and senior management employees have met their initial shareholding requirements, they are required to maintain compliance, which is reported annually to the Committee. Stock ownership guidelines can be met through the holding of common shares and vested deferred share units under the Company’s Voluntary Incentive Deferral Plan (“VIDP”). Stock options (vested or unvested) and unvested LTI grants are not considered towards the minimum level of stock ownership. The Company believes that its senior leaders have a very significant impact on CN’s financial and operational results as well as its long-term growth. To further align with CN’s shareholder interests, the Company has increased its stock ownership guideline levels, as of January 1, 2019, as follows: (1) 2018 AND BEFORE 2019 AND AFTER President and CEO Executive Vice-Presidents Senior Vice-Presidents Vice-Presidents Senior Management 5 times base salary 3 times base salary 3 times base salary 1.5 to 2 times base salary 1 times base salary 8 times base salary 5 times base salary 4 times base salary 2 to 2.5 times base salary 1.5 times base salary (1) All employees subject to stock ownership guidelines before January 1, 2019 were given an additional two years to comply with the increase in ownership guidelines. The President and CEO is also required to maintain his stock ownership guideline level until one year after cessation of employment. As at December 31, 2019, all NEOs achieved their share ownership requirements, with the exception of Mr. Reilly and Mrs. Klein who were hired in June 2019 and in December 2019, respectively. They have a five-year period to achieve the minimum stock ownership requirement level. 47 CN MANAGEMENT INFORMATION CIRCULAR 2020 COMPENSATION DISCUSSION AND ANALYSIS

Stock Ownership Status as at December 31, 2019 Non-Compete / Non-Solicitation Provisions Non-compete and non-solicitation provisions are included in the PSU and stock option award agreements for all executives and other management employees. In 2010, the Board of Directors approved the inclusion of non-compete and non-solicitation provisions in certain supplemental retirement plans and arrangements. Such provisions were also harmonized in 2010 and 2011 across the non-registered pension plans that apply to all executives and senior management employees. Non-compete and non-solicitation provisions will be applied if a recipient fails to comply with certain commitments for a two-year period following termination of employment. Those commitments prohibit, as detailed in such provisions: VALUE HOLDINGS AS A MULTIPLE REQUIRED NUMBER VALUE OFTO MEET (2)(3) NAMED EXECUTIVE OF SHARES HOLDINGS GUIDELINES OF BASE HELD (1) (C$)SALARY (3) OFFICER (C$) Jean-Jacques Ruest Ghislain Houle Robert Reilly(4) Sean Finn Dorothea Klein(4) 322,913 121,603 182 67,735 26 37,932,590 14,284,704 21,380 7,956,830 3,054 7,961,400 4,013,873 3,648,975 3,881,183 2,468,034 38.1 x 17.8 x 0.0 x 10.3 x 0.0 x (1) Common shares and/or vested deferred share units as at December 31, 2019. (2) Value is based on the closing share price of the common shares on December 31, 2019, on the TSX (C$117.47). (3) U.S.$ salaries as at December 31, 2019, were converted to Canadian dollars using the average rate during the year (U.S.$1.00 = C$1.3269). (4) Mr. Reilly and Mrs. Klein joined the Company in June and December 2019, respectively. a) the use of confidential CN information for any purpose other than performing his or her duties with CN; engaging in any business that competes with CN; soliciting, accepting the business of a customer, client, supplier or distributor of CN or hiring or engaging employees of CN; taking advantage or profit from any business opportunity of which they became aware in the course of employment with CN; and taking any action as a result of which relations between CN and its consultants, customers, clients, suppliers, distributors, employees or others may be impaired or which might otherwise be detrimental to the business interests or reputation of CN. b) c) Anti-Hedging Policy Under the Company’s Insider Trading and Reporting Policy, no directors, officers or employees can engage in hedging activity or in any form of transactions in publicly-traded options on CN securities. This relates to all forms of derivatives, including “puts” and “calls”. Change of Control Provisions The MLTIP and the Share Units Plan include “double trigger provisions”. Pursuant to such provisions, the vesting of non-performance stock options or PSUs held by a participant would not accelerate upon a Change of Control, unless the participant is terminated without cause or resigns for good reason. A Change of Control means any of the following events: d) e) Executive Compensation Clawback CN’s clawback policy applies to all CN executives. Under this policy, the Board may, in its sole discretion, to the full extent permitted by governing laws and to the extent it determines that it is in the Company’s best interest to do so, require reimbursement of all or a portion of annual and long-term incentive compensation received by an executive. The Board of Directors may seek reimbursement of full or partial compensation from an executive or former executive in situations where: a) in the event the ownership restrictions in the CN Commercialization Act are repealed, a formal bid for a majority of the Company’s outstanding common shares; approval by the Company’s shareholders of an amalgamation, merger or consolidation of the Company with or into another corporation, unless the definitive agreement of such transaction provides that at least 51% of the directors of the surviving or resulting corporation immediately after the transaction are the individuals who, at the time of such transaction, constitute the Board and that, in fact, these individuals continue to constitute at least 51% of the board of directors of the surviving or resulting corporation during a period of two consecutive years; or approval by the Company’s shareholders of a plan of liquidation or dissolution of the Company. b) a) the amount of incentive compensation received by the executive or former executive was calculated based upon, or contingent on, the achievement of certain financial results that were subsequently the subject of or affected by a restatement of all or a portion of the Company’s financial statements; the executive engaged in gross negligence, intentional misconduct or fraud that caused or partially caused the need for the restatement; and the incentive compensation payment received would have been lower had the financial results been properly reported. b) c) c) The provisions state that acceleration of vesting would not occur if a proper substitute to the original stock options or PSUs is granted to the participant. If such substitute is granted and a participant is terminated without cause or submits a resignation for good reason within 24 calendar months after a Change of Control, all outstanding substitute stock options or PSUs which are not then exercisable shall vest and become exercisable or payable in full upon such termination or resignation. Substitute stock options that are vested and exercisable shall remain exercisable for a period of 24 calendar months from the date of such termination or resignation and PSUs shall be remitted within 30 days. Discretion is left to the Board of Directors to take into account special circumstances. The definition of a resignation for good reason is included in the Termination and Change of Control Benefits table on page 65. In addition, with respect to bonus or long-term incentives awarded after March 7, 2017, in the event that any executive is found to have engaged in gross negligence, intentional misconduct, fraud, theft or embezzlement, whether or not there is a financial restatement, the Board may in its discretion, to the full extent permitted by governing law and to the extent it determines that it is in CN’s best interest to do so, require the reimbursement of some or all of the after-tax amount of any incentive compensation already paid in the previous 24 months or forfeit his or her vested or unvested incentive awards in accordance with plan terms. 48 CN MANAGEMENT INFORMATION CIRCULAR 2020 COMPENSATION DISCUSSION AND ANALYSIS
Plan Changes in 2020 In 2019, the Committee continued its review of the Company’s compensation plans and approved changes to its short-and long-term incentive plans effective January 1, 2020. The changes principally aim at further enhancing the link between corporate financial performance and payouts under the AIBP, and CN’s relative performance and payouts under the LTI plans. • The corporate financial performance of the AIBP is now measured using three metrics instead of five: Revenue, Operating Income and Free Cash-Flow. Earnings per share (EPS) and return on invested capital (ROIC) metrics are removed to avoid redundancy, given their correlation with other metrics. In addition, ROIC is a performance metric already measured through CN’s PSU. • The performance ranges relating to the three financial metrics of the AIBP are modified to provide a more balance payout range: A threshold performance level is introduced which would allow for a bonus payout if the Company’s performance is below the target level but above the threshold, whereas performance below the threshold would result in no bonus payout. In return, the maximum performance level is increased, making it more challenging to reach maximum payout. The PSU mix is adjusted to increase directional alignment between Relative TSR performance of CN and PSU payouts: The weighting of the ROIC PSUs is reduced from 70% to 60% of the PSU award value and the weighting of the Relative TSR PSUs is increased from 30% to 40% of the PSU award value, equally-weighted between the selected Class I Railroads and S&P/TSX 60 companies. The vesting period of the stock options is increased from 4 years to 5 years. The time period to exercise stock options in case of retirement is increased from 3 years to 4 years to align with the extended vesting period and to allow for all stock options to vest through retirement. • • • Risk Mitigation in Our Compensation Program One of the Company’s fundamental goals is to create sustained shareholder value. To support this objective, the Committee focuses on developing and recommending an executive compensation policy and program that aligns with the Company’s business strategy, emphasizes pay-for-performance, and encourages the right behaviours. Hence, many characteristics of the Company’s executive compensation program serve to mitigate risk and emphasize the importance of longer-term value creation: Structured Process • The LTI awards, which constitute a significant portion of NEO compensation, vest over a three-or four-year period, motivating executives to create longer-term value. Effective January 1, 2020, the vesting period of the stock options is increased from four to five years. The performance measures used within the Share Units Plan reflect an appropriate balance between financial and share price conditions. Payout of PSUs subject to ROIC performance is also contingent upon meeting a minimum share price condition that triggers payment only if share price appreciates during the three-year term. The use of Relative TSR performance measures strengthen alignment between executive pay and shareholders return. • • • An annual review of the performance measures under the Company’s AIBP and Share Units Plan takes place to ensure their continued relevance. The Committee completes a formal assessment of performance each year, and can then use discretion to increase or decrease any compensation awards if it deems appropriate based on market factors or other extenuating circumstances. Stress-testing exercises are performed annually for proposed LTI grants and results are presented to the Committee for their consideration prior to the Committee and the Board approving such grants. • • Fixed Limits on Variable Compensation • The AIBP and the Share Units Plan are designed to include the possibility of a zero payout, as well as a pre-defined maximum. The COO and CHRO participate in a Defined Contribution Plan, which limits CN’s exposure to risk. • • Protection Mechanisms Balanced Program • The Company’s executive compensation clawback policy allows the Board, in certain situations, to request the full or partial reimbursement of annual and long-term incentive awards received by executives (please refer to section “Executive Compensation Clawback” on page 48 for more information). The NEOs are not governed by employment contracts and the long-term incentive plans include “double-trigger provisions”, such that the vesting of LTI awards would generally not accelerate upon a Change in Control. Under the Company’s Insider Trading and Reporting Policy, directors, executives and employees are prohibited from engaging in hedging activities against CN securities. In order to further align their interests with those of shareholders, executives and senior management employees (194 individuals) are required to meet specific stock ownership guidelines. In addition, the President and CEO must maintain his stock ownership level for one year after cessation of employment (please refer to section “Stock Ownership” on page 47 for more information). • The compensation program appropriately balances fixed and variable pay, as well as short-and long-term incentives (in aggregate, approximately 77% of NEOs’ target total direct compensation is directly linked to the Company’s performance). The corporate component of the AIBP includes performance measures that are appropriately balanced, thus diversifying the risk associated with the use of any single performance measure (please refer to section “Annual Incentive Bonus Plan” on page 43 for more information). The safety component of the AIBP includes two standard safety metrics and further increases diversification of the plan, thus mitigating potential risk associated with the plan. There are multi-year, overlapping performance periods for the PSUs and stock options, which encourages consistent, long-term behaviour and mitigates risk. • • • • • • 49 CN MANAGEMENT INFORMATION CIRCULAR 2020 COMPENSATION DISCUSSION AND ANALYSIS
• Commencing at various dates, for executives and senior management employees, the payout of LTI awards and the payment of retirement benefits under the Company’s non-registered pension plans are conditional on compliance with the conditions of their benefit plans, award or employment agreements, including, but not limited to, non-compete, non-solicitation, non-disclosure of confidential information and other restrictive covenants (please refer to section “Non-Compete/ Non-Solicitation Provisions” on page 48 for more information). Independent Advice • Management retains the services of an external executive compensation consultant to assist in compensation-related matters for its executives. The Committee retains the services of an independent executive compensation consultant to provide advice on compensation recommendations that are presented for Committee approval. In 2019, Willis Towers Watson was mandated to review the Company’s compensation policy, programs and practices and assessed any potential risk implications and concluded that “there does not appear to be significant risks arising from CN’s compensation programs that are reasonably likely to have a material adverse effect on the Company”. The Committee played an active role in reviewing the risk assessment report and in discussing the finding provided by Willis Towers Watson. The Committee supports the conclusion from the Willis Towers Watson risk assessment report and in its own assessment determined that proper risk mitigation features are in place within the Company’s compensation programs. Throughout the year, the Committee plays an important oversight role related to the identification and management of risks associated with CN’s compensation programs and practices. For example, in camera sessions, restricted to members of the Committee, are held at the start of each of the Committee meetings to allow for discussion regarding any compensation or risk-related issue. The Committee also believes in the benefits of a certain level of overlapping membership between the Audit and the Human Resources and Compensation Committees, particularly with regard to risk monitoring. As such, Donald J. Carty, Chair of the Audit Committee, is a member of the Human Resources and Compensation Committee; and, the Honorable Kevin G. Lynch, Chair of the Human Resources and Compensation Committee, is a member of the Audit Committee and of the Pension and Investment Committee. The Honorable Kevin G. Lynch is also a member of the Strategic Planning Committee. These overlaps effectively provide a link between committees’ risk oversight responsibilities. Compensation of the NEOs Jean-Jacques Ruest President and Chief Executive Officer Mr. Ruest was appointed President and CEO on July 24, 2018, after having served as Interim President and Chief Executive Officer from March 5, 2018. He joined CN in 1996 and held several positions within the sales and marketing team, including the position of Executive Vice-President and Chief Marketing Officer (“CMO”) from January 2010 to July 2018. Mr. Ruest is a seasoned executive and has extensive marketing experience within the railway industry. Prior to joining CN, he had more than 15 years of experience working for a major international chemical company. Mr. Ruest holds a Master’s in Business Administration in Marketing from HEC Montréal and a Bachelor of Science degree in Applied Chemistry from Université de Sherbrooke. He also completed the executive program from the University of Michigan’s business school. As President and CEO, Mr. Ruest is responsible for providing leadership and vision for CN, as well as achieving strategic and operational goals that will build long-term shareholder value. More details on his role are available in the Company’s Corporate Governance Manual, available at www.cn.ca, under Delivering Responsibly/Governance. Compensation The President and CEO’s annual compensation takes into account factors such as competitive positioning against market, economic outlook, and leadership abilities. The President and CEO’s annual compensation is recommended by the Committee and approved by the independent members of the Board of Directors. The President and CEO serves at the discretion of the Board and does not have an employment contract. In 2019, Mr. Ruest’s base salary was maintained at U.S.$750,000 (C$995,175). Under the AIBP, Mr. Ruest’s target bonus was adjusted to 140% of his base salary. PSUs and stock options are granted to the President and CEO pursuant to the Share Units Plan and the Management Long-Term Incentive Plan. Grants to the President and CEO are made on the same basis and conditions as those of the other NEOs of the Company, subject to the 20% limitation under the MLTIP(1). In 2019, Mr. Ruest received 79,294 PSUs and 157,000 stock options. The fair value of these awards is included in the Summary Compensation Table on page 55, under the Share-Based Awards and Option-Based Awards columns. 2019 Key Accomplishments and Determination of the Annual Incentive Bonus Award Mr Ruest’s performance is measured against objectives approved annually by the Committee and the Board. In 2019, the individual goals as President and CEO for Mr. Ruest included: operations and service excellence (25%); top-line focus, mid-to long-term organic business development, and inorganic acquisitions and joint ventures (25%); employee engagement, talent culture and leadership team effectiveness (20%); stakeholder and regulatory engagement (10%); and safety culture (20%). Specific measures, both quantitative and qualitative, are considered in each of the above-mentioned categories. Additional details on each category are presented below. The Committee reviewed Mr. Ruest’s performance in each category and recommended for Board approval the recommendation of an individual performance factor of 100%. However, as the Company did not meet its corporate financial objectives, there was no bonus payout for the year 2019. Operations and Service Excellence In 2019, capital investments were deployed to enhance cost, service reliability and ultimately to build a competitive edge. Investments included C$1.2 billion on strategic initiatives to increase capacity, enable growth and improve network resiliency, including line capacity upgrades and information technology initiatives. The deployment of advanced technologies has also started with the goal of taking Precision Scheduled Railroading to the next level. Eight Autonomous Track Inspection Cars were commissioned in 2019, inspecting 74% of CN’s core mainline. In addition, Automated Inspection Portals, which are a set of cameras that have the ability to automatically capture and identify images of car components, defects and conditions at track speed, were completed in Winnipeg, Toronto and Memphis. Mobile devices have also been rolled out to about 11,000 employees with three applications completed: Car Maintenance, Local Service Assignments, and Electronic Operating Documents. Finally, in 2019, CN successfully met the federal requirement to operate Positive Train Contol (PTC) on all 35 of its U.S. subdivisions required to be equipped with PTC. CN accomplished this milestone 13 months ahead of the December 31, 2020 deadline. (1) Under the MLTIP and as per stock exchanges rule, no executive can be granted more than 20% of the overall grant in a year. 50 CN MANAGEMENT INFORMATION CIRCULAR 2020 COMPENSATION DISCUSSION AND ANALYSIS
Top-Line in 2019, Mid-to Long-Term Organic Business Development, and Inorganic Acquisitions and Joint Ventures 2019 was a challenging year characterized by a lower volume environment, which led to negative volume growth for the Company. Nonetheless, CN carloads and RTM volumes for 2019 outperformed the North American Class I Railroad average. CN’s inorganic growth vision continued in 2019 with the agreement reached to acquire the Massena rail line from CSX Corporation, and the acquisition of the intermodal temperature-controlled transportation division of the Alberta-based H&R Transport Limited. These acquisitions will allow the Company to expand capacity and foster additional supply chain solutions, to continue to create value for customers. Employee Engagement, Talent Culture, and Leadership Team Effectiveness As at December 31, 2019, CN employed a total of 25,975 employees of which approximately 75% were unionized employees. 2019 was an important year in terms of labour relations, as the Company renewed 17 collective agreements, 11 in Canada and 6 in the U.S. Continuing to build a solid team of railroaders is a key component of CN’s strategic agenda and takes many forms, from diversity and talent development, to training and innovation. The Company continued its efforts to advance diversity across the organization resulting in CN being recognized as one of Canada’s Best Diversity Employers for a third consecutive year. As at December 31, 2019, 20% of executive management (30 employees) are women, and the Company aspires to bring this ratio to 30% by the end of 2022. The Company also continued on its initiatives to develop talent through the sustained implementation of the Talent to Value methodology. This approach focuses on defining value drivers essential to achieving the Company’s strategic plan and, identifying critical roles (both enterprise and functional) required to deliver against those value drivers. CN also updated its HR operating model to align resources and talent to best support the business and drive development of the associated talent. In addition, CN continued to maintain broad leadership development, and deepen the succession pipeline. Stakeholder and Regulatory Engagement In 2019, CN continued its community and stakeholder engagement efforts. CN is actively involved in building safer, stronger communities through the direct connections it makes with the communities in which it operates, like engaging with the farming community through an increased presence, community partnerships, social media and a new podcast. In 2019, CN continued to engage with the investment community, from the Company’s largest shareholders and to potential investors, in order to communicate its strategic agenda. Investor Day presentations to investors and analysts took place in Toronto on June 3 and 4, 2019. CN also continued in its commitment to be a leader in safety, sustainability, innovation and growth, and again, in 2019, earned a place on the Dow Jones Sustainability World Index for the eighth consecutive year and to the DJSI North American Index for the 11th consecutive year. The Company also celebrated its 100th anniversary, where the Company toured parts of North America with CN 100: A Moving Celebration. The moving interactive container village celebrated the people, history and future of CN along with the communities along CN’s network. In each city where the festivities occurred, CN also created a Community Board of community leaders to guide its Stronger Communities Fund decisions and strengthen community partnerships. The Company also planted commemorative forests of 100 mature trees as a legacy gift for the host cities. Safety Culture CN continues to have an unwavering commitment to safety and connectivity with its employees, which is central to having a skilled, safe and engaged workforce. The Company connects employees to this core value by sharing the message that safety is everyone’s responsibility and engaging leaders in the field, who have the greatest ability and impact to make safety a priority. Since January 1, 2019, all senior management employees have a safety component as part of their AIBP, in addition to executive employees who already had the safety component included in their AIBP. A strong focus is on reducing employee injuries. CN recently launched an important safety campaign that focuses on a singular goal: reduce serious injuries and fatalities to zero at CN so everyone can go home safely every single day. The campaign is based on a set of rules, called Life Critical Rules, developed by the Company that if not followed to the letter can lead to serious injury or even death. In addition to this new campaign, the two CN campuses trained over 8,900 experienced railroaders, new hires and customers over the year 2019. The Company also continued its successful Looking Out for Each Other program, which urges its team members to work together to be vigilant about safety and to speak up if they spot an unsafe situation. 2019 Target Total Direct Compensation Summary 2019 TOTAL DIRECT COMPENSATION (AT TARGET) AS A % OF TOTAL DIRECT U.S.$ COMPENSATION Salary 750,000 9.2% AT-RISK COMPENSATION Annual Incentive Bonus Performance Share Units Stock Options 1,050,000 4,202,226 2,097,520 13.0% 51.9% 25.9% TOTAL DIRECT COMPENSATION (target) 8,099,746 2019 Target Pay Mix 9.2% Base Salary 90.8% Pay-at-Risk 51 CN MANAGEMENT INFORMATION CIRCULAR 2020 COMPENSATION DISCUSSION AND ANALYSIS 77.8% LTI (Fair Value) 13.0% Target Bonus
Ghislain Houle Executive Vice-President and Chief Financial Officer Mr. Houle was appointed Executive Vice-President and CFO on July 1, 2016. His responsibilities at CN include financial management, procurement and supply management. Mr. Houle joined the Company in 1997 and occupied various executive roles, including Vice-President and Corporate Comptroller and Vice-President, Financial Planning, before being appointed to his current position. In 2019, Mr. Houle’s base salary was increased to U.S.$605,000 (C$802,775) to reflect his competitive positioning and experience. As in 2018, Mr. Houle’s target bonus for 2019 was 80% of base salary under the AIBP. In addition, Mr. Houle received 19,202 PSUs and 62,298 stock options in 2019, in accordance with the terms of the Share Units Plan and the MLTIP, respectively. 2019 AIBP Objectives Mr. Houle’s performance in 2019 was assessed against individual performance objectives which included: solid, disciplined finance function; operational and service excellence; top line focus, mid-to long-term organic business development, inorganic acquisitions and joint ventures; employee engagement, talent culture, leadership team effectiveness; stakeholder and regulatory engagement; and safety. Mr. Houle was assessed as having met his overall individual performance objectives. However, as the Company did not meet its corporate financial objectives, there was no bonus payout for the year 2019. Robert Reilly Executive Vice-President and Chief Operating Officer and Interim Chief Information and Technology Officer Mr. Reilly joined CN in June 2019 as Executive Vice-President, transitioning into the role of COO, function he assumed on July 1, 2019. Mr. Reilly has also assumed interim responsibility for CN’s Information and Technology function since November 2019. As COO, Mr. Reilly is responsible for CN’s continuous operations, overseeing about 20,000 railroaders from the Transportation, Engineering, Mechanical, Network Operations and Safety groups across North America. Prior to his role at CN, Mr. Reilly joined the Atchison, Topeka and Santa Fe Company (now known as BNSF) in 1989. With his 30 years of experience in the rail industry, Mr. Reilly brings to the Company extensive leadership in safety, rail operations, field application of rail technologies, and a deep understanding of the intermodal business at major ports and large terminals. He is a graduate of Washburn University, Kansas, U.S. and he completed the Executive Program at Stanford University. Upon his hiring in June 2019, Mr. Reilly’s base salary was set at U.S.$550,000 (C$729,795) to reflect his competitive positioning and experience. Mr. Reilly’s target bonus for 2019 was 80% of base salary under the AIBP. In addition, Mr. Reilly received 14,225 PSUs and 46,152 stock options, in accordance with the terms of the Share Units Plan and the MLTIP, respectively. 2019 AIBP Objectives Mr. Reilly’s performance in 2019 was assessed against individual performance objectives which included: safety, operational and service excellence; creating value for customers and shareholders; and people. Mr. Reilly was assessed as having met his overall individual performance objectives. However, as the Company did not meet its corporate financial objectives, there was no bonus payout for the year 2019. 2019 Target Total Direct Compensation Summary 2019 TOTAL DIRECT COMPENSATION (AT TARGET) AS A % OF TOTAL DIRECT COMPENSATION U.S. $ Salary 605,000 20.6% 2019 Target Total Direct Compensation Summary AT-RISK COMPENSATION Annual Incentive Bonus Performance Share Units Stock Options 484,000 1,017,622 832,301 16.5% 34.6% 28.3% 2019 TOTAL DIRECT COMPENSATION (AT TARGET) (1) AS A % OF TOTAL DIRECT COMPENSATION U.S. $ Salary 550,000 22.1% TOTAL DIRECT COMPENSATION (target) 2,938,923 AT-RISK COMPENSATION Annual Incentive Bonus Performance Share Units Stock Options 440,000 825,044 675,204 17.7% 33.1% 27.1% 2019 Target Pay Mix TOTAL DIRECT COMPENSATION (target) 2,490,248 (1) Amounts are on an annualized basis and exclude the special hiring award of U.S.$1,750,000 granted to Mr. Reilly, which was paid entirely in cash. The special award was provided to Mr. Reilly upon his hiring at CN in June 2019 in order to mitigate the compensation losses he incurred by leaving BNSF and was determined based on a review of his then outstanding short-and long-term compensation, both in terms of form and timing, with a view to attracting his valued experience and skill set to CN. The special award is subject to a 24-month clawback provision in the case of resignation or termination for cause. In 2019, Mr. Reilly relocated to CN’s head office in Canada, and amounts also exclude the 2019 tax equalization amount (U.S.$799,159) provided by the Company to maintain Mr. Reilly’s compensation, on a post-tax basis, at a similar level had he remained in the U.S. Details regarding Mr. Reilly’s compensation are included in the amounts set forth in the Summary Compensation Table on page 55. 20.6% Base Salary 79.4% Pay-at-Risk 2019 Target Pay Mix 22.1% Base Salary 77.9% Pay-at-Risk 52 CN MANAGEMENT INFORMATION CIRCULAR 2020 COMPENSATION DISCUSSION AND ANALYSIS 60.2% LTI (Fair Value) 17.7% Target Bonus 62.9% LTI (Fair Value) 16.5% Target Bonus
Sean Finn Executive Vice-President Corporate Services and Chief Legal Officer Mr. Finn was appointed Senior Vice-President, Chief Legal Officer and Corporate Secretary, in December 2000 and CN’s Executive Vice-President Corporate Services and CLO in December 2008. He is responsible for a wide array of legal, governmental, regulatory, public affairs, risk mitigation and security matters. As Corporate Secretary, he is also responsible for CN’s Corporate Governance practices, as well as overseeing CN’s Code of Business Conduct and ethics program. Mr. Finn led CN’s tax function and was appointed CN’s Vice-President, Treasurer and Principal Tax Counsel, in January 2000. Before joining the Company, he was the Managing Tax Partner for a major Montreal law firm. Mr. Finn graduated from the Faculty of Law of Université de Montréal, after which he was admitted to the Quebec Bar, and is a member of the Canadian and American Bar Associations. Mr. Finn has completed the Directors Education Program offered by the Institute of Corporate Directors and the Rotman School of Management, as well as the Excellence in the Boardroom Program at the Rotman School of Management, Executive Programs, University of Toronto. In 2019, Mr. Finn’s base salary was increased to U.S.$585,000 (C$776,237) to reflect his competitive positioning and experience. As in 2018, Mr. Finn’s target bonus for 2019 was 80% of base salary under the AIBP. In addition, Mr. Finn received 15,050 PSUs and 48,829 stock options, in accordance with the terms of the Share Units Plan and the MLTIP, respectively. 2019 AIBP Objectives Mr. Finn’s performance in 2019 was assessed against individual performance objectives which included: successfully taking CN’s stakeholder engagement to the highest standards; successfully leading key strategic initiatives associated with corporate services; leadership development and succession; corporate governance and CN Board; and being a trusted advisor to the CEO and the executive team at CN and to the Board. Mr. Finn was assessed as having met his overall individual performance objectives. However, as the Company did not meet its corporate financial objectives, there was no bonus payout for the year 2019. Dorothea Klein Senior Vice-President and Chief Human Resources Officer Mrs. Klein joined CN in December 2019 as Senior Vice-President and CHRO where she leads the human resources and labour relations function. Mrs. Klein came to CN from ABB, where she was most recently Senior Vice-President, Human Resources of the Electrification Business that counts over 50,000 employees. Mrs. Klein has an extensive human resources, finance and M&A background, having served large North American and European companies in various industries, notably pharmaceuticals and healthcare, over the past 30 years. Mrs. Klein is a graduate of Business Administration at University of Reutlingen ESB Business School, Germany, and the CESEM-NEOMA business school in Reims, France. She also completed Executive Management programs at LSU in Baton Rouge, USA, as well as Wharton and INSEAD. Upon her hiring in December 2019, Mrs. Klein’s base salary was set at U.S.$465,000 (C$617,009) to reflect her competitive positioning and experience. Mrs. Klein’s target bonus for 2019 was 65% of base salary under the AIBP. In addition, Mrs. Klein received 3,384 PSUs and 10,975 stock options, in accordance with the terms of the Share Units Plan and the MLTIP, respectively. 2019 Target Total Direct Compensation Summary 2019 TOTAL DIRECT COMPENSATION (AT TARGET) (1) AS A % OF TOTAL DIRECT COMPENSATION U.S. $ Salary 465,000 41.6% AT-RISK COMPENSATION Annual Incentive Bonus Performance Share Units Stock Options 302,250 192,599 157,491 27.1% 17.2% 14.1% TOTAL DIRECT COMPENSATION (target) 1,117,340 (1) Amounts are on an annualized basis and exclude the special hiring award of U.S.$535,000 granted to Mrs. Klein, which was paid entirely in cash. The special award was provided to Mrs. Klein upon her hiring at CN in December 2019 in order to mitigate the compensation losses she incurred by leaving ABB and was determined based on a review of her then outstanding short-and long-term compensation, both in terms of form and timing, with a view to attracting her valued experience and skill set to CN. The special award is subject to a 24-month clawback provision in the case of resignation or termination for cause. In 2019, Mrs. Klein relocated to CN’s head office in Canada, and the amounts also exclude the 2019 tax equalization amount (U.S.$94,735) provided by the Company to maintain Mrs. Klein’s compensation, on a post-tax basis, at a similar level had she remained in the U.S. Details regarding Mrs. Klein’s compensation are included in the amounts set forth in the Summary Compensation Table on page 55. 2019 Target Total Direct Compensation Summary 2019 TOTAL DIRECT COMPENSATION (AT TARGET) AS A % OF TOTAL DIRECT COMPENSATION U.S. $ 2019 Target Pay Mix Salary 585,000 23.4% AT-RISK COMPENSATION Annual Incentive Bonus Performance Share Units Stock Options 468,000 797,591 652,355 18.7% 31.9% 26.0% TOTAL DIRECT COMPENSATION (target) 2,502,946 41.6% Base Salary 58.4% Pay-at-Risk 2019 Target Pay Mix 23.4% Base Salary 76.6% Pay-at-Risk 53 CN MANAGEMENT INFORMATION CIRCULAR 2020 COMPENSATION DISCUSSION AND ANALYSIS 57.9% LTI (Fair Value) 18.7% Target Bonus 31.3% LTI (Fair Value) 27.1% Target Bonus
President and CEO Compensation Look-Back Table and Five-Year TSR Comparison CN’s compensation plans are designed to align compensation with the creation of shareholder value. As a result, a significant portion of compensation is at risk and long-term incentives are structured to deliver compensation value to the President and CEO if value is created for shareholders. In a low share performance environment, limited value would be delivered to the President and CEO. Over the last five years, CN’s strong operational and financial performance resulted in above target payouts, reflective of the Company’s TSR performance of 60%. The table below compares the total direct compensation awarded to CN’s President and CEOs over the past five years, as reflected in the Summary Compensation Table, to the current value (both realized and realizable) as at December 31, 2019. Compensation outcomes are set against the performance graph on the right which indicates the yearly cumulative total shareholder return on a $100 investment in CN’s common shares compared with the cumulative total return of the S&P/TSX and the S&P 500 Indices from the period beginning December 31, 2014 to the period ended December 31, 2019. It assumes reinvestment of all dividends during the covered period. $300 $200 $100 CNR CNI S&P/TSX S&P 500 $0 DEC-14 DEC-15 DEC-16 DEC-17 DEC-18 DEC-19 CNR (C$) CNI (U.S.$) S&P/TSX (C$) S&P 500 (U.S.$) 100 100 100 100 98 82 92 101 117 101 111 113 136 126 121 138 135 115 110 132 160 143 136 174 TOTAL DIRECT COMPENSATION CURRENT VALUE AS AT DEC. 31, 2019 (2) (C$000s) AWARDED (1) (C$000s) Over the last five years, the total compensation in Canadian dollars paid, as per the Summary Compensation Table, decreased by an average of 3.4% per year for the NEOs as a result of no bonus having been paid for the year 2019. The total compensation for our NEOs over that period was generally aligned with the experience of our shareholders, as a substantial portion of NEOs total compensation is at risk and directly linked to CN’s share price performance. The Committee believes that the Company’s executive compensation policy is effective and appropriately supports a strong relationship between the compensation earned by NEOs and the investment return of shareholders. Claude Mongeau Claude Mongeau(3) Luc Jobin(5) Luc Jobin Luc Jobin(7) Jean-Jacques Ruest(9) Jean-Jacques Ruest 2015 2016 2016 2017 2018 2018 2019 9,847 5,742 5,478 11,792 2,089 4,575 9,266 18,013 6,645 (4) 12,897 15,734 (6) 348 4,777 11,724 (8) (1) Includes salary and variable compensation awarded during the year, as reported in the Summary Compensation Table each year. (2) For any given year, the current value includes salary and annual incentive awarded and the value of long-term incentives (realized and realizable). Long-term incentives for any given year include the value of any exercised stock options, the value of unexercised “in-the-money” stock options as at December 31, 2019, the value attributed to vested PSUs and the value of unvested PSUs as at December 31, 2019, assuming a 100% performance factor. (3) The compensation awarded for Mr. Mongeau was pro-rated to June 30, 2016. (4) PSUs awarded in 2016 were forfeited upon retirement on January 31, 2017 and were not included as at December 31, 2019. (5) The compensation awarded for Mr. Jobin was pro-rated to reflect the appointment date of July 1, 2016. (6) As part of his separation agreement, Mr. Jobin agreed to waive any and all rights to 50% of PSUs awarded to him in 2017. Therefore, these PSUs were cancelled and were not included as at December 31, 2019. (7) The compensation awarded for Mr. Jobin was pro-rated to his departure date. (8) PSUs and stock options awarded in 2018 were forfeited upon his departure in March 2018 and were not included as at December 31, 2019. (9) The compensation awarded for Mr. Ruest was pro-rated to reflect the appointment date of July 24, 2018. Cost of Management Ratio The cost of management ratio expresses the total compensation reported for the NEOs as a percentage of the Company’s adjusted net income. Compensation of the NEOs has been paid in U.S. dollars since 2002 as it provides a more precise, meaningful and stable comparison basis for compensation decisions with U.S.-denominated compensation from the selected Class I Railroad comparator group. A table presenting the compensation paid in U.S. dollars for the NEOs is presented on page 56 — Total Compensation for the NEOs in U.S. Dollars. 2015 2016 2017 2018 2019 Total compensation reported for the NEOs (C$ million)(1) Adjusted Net Income (C$ million)(2) 25.8 3,580 29.8 3,581 29.2 3,778 25.0 4,056 21.7 4,189 COST OF MANAGEMENT RATIO 0.7% 0.8% 0.8% 0.6% 0.5% (1) Total compensation as reported in the summary compensation table each year (including only active NEOs as at December 31 of any year). (2) See the section entitled Adjusted performance measures in CN’s Management’s Discussion and Analysis included in the Company’s 2019, 2018 and 2017 Annual Reports for an explanation of this measure and reconciliation to the nearest GAAP measure. 54 CN MANAGEMENT INFORMATION CIRCULAR 2020 COMPENSATION DISCUSSION AND ANALYSIS 2014 2015 2016 2017 2018 2019

Summary Compensation Table in Canadian Dollars The following table sets forth the annual total compensation in Canadian dollars for the NEOs, in accordance with the Canadian securities disclosure rules issued by the CSA, for the years ended December 31, 2019, 2018, and 2017. Fluctuation in the exchange rate affects year-over-year comparability. Compensation in Canadian $ NON-EQUITY INCENTIVE PLAN COMPENSATION – ANNUAL SHARE-BASED AWARDS (1) (C$) OPTION-BASED AWARDS (2) (C$) INCENTIVE PLANS (3) (C$) PENSION VALUE (4) (C$) ALL OTHER COMPENSATION (5) (C$) TOTAL SALARY (C$) COMPENSATION (C$) NAME AND PRINCIPAL POSITION YEAR Jean-Jacques Ruest 2019 2018 2017 995,175 873,383 (6) 772,667 5,516,472 2,508,845 1,297,533 2,753,780 2,052,555 1,061,254 0 1,577,598 957,407 (351,000) 1,449,000 531,000 26,120 24,034 21,535 8,940,547 8,485,415 4,641,396 President and Chief Executive Officer Ghislain Houle 2019 2018 2017 802,775 764,463 733,709 1,335,883 1,155,645 1,081,352 1,092,707 945,292 884,373 0 991,246 920,499 (88,000) 268,000 506,000 20,375 19,828 18,722 3,163,740 4,144,474 4,144,655 Executive Vice-President and Chief Financial Officer Robert Reilly Executive Vice-President and Chief Operating Officer And Interim Chief & Technology Information Officer 2019 2018 2017 425,713 (7) 0 0 1,086,153 0 0 888,426 0 0 0 0 0 51,833 0 0 3,388,254 (8)(9) 0 0 5,840,379 0 0 Sean Finn 2019 2018 2017 776,237 738,549 720,723 1,047,037 1,010,640 1,009,208 856,461 826,679 825,423 0 932,771 893,044 (282,000) 466,000 318,000 20,618 19,884 19,143 2,418,353 3,994,523 3,785,541 Executive Vice-President Corporate Services and Chief Legal Officer Dorothea Klein Senior Vice-President and Chief Human Resources Officer 2019 2018 2017 51,417 (10) 0 0 255,519 0 0 208,964 0 0 0 0 0 4,102 0 0 836,673(11)(12) 0 0 1,356,675 0 0 (1) Valuation Disclosure for Share-Based Awards — The fair value of share-based awards at the grant date, as shown in the Summary Compensation Table above, reflects the number of PSUs awarded multiplied by the value calculated using the Willis Towers Watson expected life binomial methodology. This methodology was selected as it provides alignment throughout the compensation review process by using the same methodology for benchmarking, grant and disclosure purposes. A summary of the valuation factors calculated using the Willis Towers Watson expected life binomial methodology as well as under the accounting valuation methodology is presented in the following table. Detailed assumptions and valuation factors are presented on page 57. (a) All off-cycle ROIC and TSR awards granted in the first quarter of 2018 were expensed at a grant date fair value of C$49.39 and C$102.74 respectively. (2) Valuation Disclosure for Option-Based Awards — The fair value of option-based awards at the grant date, as shown in the Summary Compensation Table above, reflects the number of stock options awarded multiplied by the value calculated using the Willis Towers Watson expected life binomial methodology. This methodology was selected as it provides alignment throughout the compensation review process by using the same methodology for benchmarking, grant and disclosure purposes. 55 CN MANAGEMENT INFORMATION CIRCULAR 2020 COMPENSATION DISCUSSION AND ANALYSIS WILLIS TOWERS WATSON EXPECTED LIFE BINOMIAL METHODOLOGY ACCOUNTING VALUATION METHODOLOGY VARIANCE VALUATION FACTORGRANT DATE FAIR VALUE VALUATION FACTORGRANT DATE FAIR VALUE WILLIS TOWERS WATSON VS. ACCOUNTING 2019 SHARE-BASED AWARDS ROIC59%January 31 – C$64.69 June 25 – C$71.00 December 6 – C$70.21 63.5%January 31 – C$69.62 75.1%June 25 – C$90.38 72.6%December 6 – C$86.40 January 31 – (C$4.93) June 25 – (C$19.38) December 6 – (C$16.19) TSR 77%January 31 – C$84.43 June 25 – C$92.66 December 6 – C$91.63 116.2%January 31 – C$127.41 117.7%June 25 – C$141.65 108.5%December 6 – C$129.17 January 31 – (C$42.98) June 25 – (C$48.99) December 6 – (C$37.54) 2018 SHARE-BASED AWARD ROIC59%January 25 – C$57.24 March 8 – C$56.10 March 19 – C$56.05 July 26 – C$69.50 50.9%January 25 – C$49.39 (a) 50.9%March 8 – C$49.39 (a) 50.9%March 19 – C$49.39 (a) 74.4%July 26 – C$87.61 January 25 – C$7.85 March 8 – C$6.71 March 19 – C$6.66 July 26 – (C$18.11) TSR 77%January 25 – C$74.71 March 8 – C$73.21 March 19 – C$73.15 July 26 – C$90.71 105.9%January 25 – C$102.74 (a) 105.9%March 8 – C$102.74 (a) 105.9%March 19 – C$102.74 (a) 130.5%July 26 – C$153.67 January 25 – (C$28.03) March 8 – (C$29.53) March 19 – (C$29.59) July 26 – (C$62.96) 2017 SHARE-BASED AWARD ROIC59%C$54.23 57.9%C$53.19 C$1.04 TSR 77%C$70.77 112.5%C$103.37 (C$32.60)

A summary of the valuation factors calculated using the Willis Towers Watson expected life binomial methodology as well as under the accounting valuation methodology is presented in the following table. Detailed assumptions for both methodologies are presented on page 57. (3) Represents the incentive award earned under the AIBP for the applicable year. Refer to page 43 for the details of the AIBP. (4) Includes the compensatory value of pension benefits as reported in the “Defined Benefit Plans” and “Defined Contribution Plans” tables in the “Pension Plan Benefits” section on page 63 and excludes the notional investment earnings (and losses) from the Defined Contribution Supplemental Executive Retirement Plan for Mr. Reilly and Mrs. Klein. Refer to page 64 for details of the Defined Contribution Supplemental Executive Retirement Plans. The compensatory charge for Messrs. Ruest, Houle and Finn is negative because their pensionable earnings during 2019 was lower than expected due to no payments being made from the AIBP for the year 2019. (5) Includes the value of perquisites, personal benefits, and other compensation (as applicable), such as post-retirement benefits or the employer contribution under the ESIP. Perquisites and other personal benefits that, in aggregate, amount to less than C$50,000 or 10% of the total salary for any of the NEOs are not reported in this column. Details are provided in the table on page 58. (6) Mr. Ruest was appointed President and CEO effective July 24, 2018. Mr. Ruest’s 2018 salary reflects five months as President and CEO and seven months as Executive Vice-President and CMO. (7) Mr. Reilly was hired in June 2019 and, as such, his salary for 2019 reflects only 6 months. (8) A special cash award of U.S. $1,750,000 (C$2,322,075) was provided to Mr. Reilly upon his hiring at CN in June 2019 in order to mitigate the compensation losses he incurred by leaving BNSF and was determined based on a review of his outstanding short and long-term compensation both in terms of form and timing, with a view to attracting his valued experience and skill set to CN. This amount is included in the 2019 “All Other Compensation” amount and is subject to a 24-month clawback provision in case of resignation or termination for cause. (9) In 2019, Mr. Reilly relocated to CN’s head office in Canada, and the value includes a 2019 tax equalization amount of C$1,060,404 provided by the Company to maintain Mr. Reilly’s compensation, on a post-tax basis, at a similar level had he remained in the U.S. (10) Mrs. Klein was hired in December 2019 and, as such, her salary for 2019 reflects only 1 month. (11) A special cash award of U.S. $535,000 (C$709,892) was provided to Mrs. Klein upon her hiring at CN in December 2019 in order to mitigate the compensation losses she incurred by leaving ABB and was determined based on a review of her outstanding short and long-term compensation both in terms of form and timing, with a view to attracting her valued experience and skill set to CN. This amount is included in the 2019 “All Other Compensation” amount and is subject to a 24-month clawback provision in case of resignation or termination for cause. (12) In 2019, Mrs. Klein relocated to CN’s head office in Canada, and the value includes a 2019 tax equalization amount of C$125,704 provided by the Company to maintain Mrs. Klein’s compensation, on a post-tax basis, at a similar level had she remained in the U.S. Total Compensation for the NEOs in U.S. Dollars The following table sets forth the annual total compensation in U.S. dollars for the NEOs, for the years ended December 31, 2019, 2018, and 2017. Compensation of the NEOs has been paid in U.S. dollars since 2002 as it provides a more precise, meaningful and stable comparison basis with U.S.-denominated compensation from the selected Class I Railroad comparator group. NON-EQUITY INCENTIVE PLAN COMPENSATION – ANNUAL INCENTIVE PLANS (U.S.$) SHARE-BASED AWARDS (U.S.$) OPTION-BASED AWARDS (U.S.$) PENSION VALUE (U.S.$) ALL OTHER COMPENSATION (U.S.$) TOTAL COMPENSATION (U.S.$) SALARY (U.S.$) NAME AND PRINCIPAL POSITION YEAR Jean-Jacques Ruest 2019 2018 2017 750,000 674,063 595,000 4,202,226 1,974,665 990,074 2,097,520 1,615,676 809,869 – 1,156,851 761,600 (257,388) 1,152,653 395,472 19,685 18,549 16,583 6,812,043 6,592,457 3,568,598 President and Chief Executive Officer Ghislain Houle 2019 2018 2017 605,000 590,000 565,000 1,017,622 935,143 825,118 832,301 765,004 674,887 – 726,880 732,240 (64,530) 213,189 376,853 15,355 15,303 14,417 2,405,748 3,245,519 3,188,515 Executive Vice-President and Chief Financial Officer Robert Reilly Executive Vice-President and Chief Operating Officer And Interim Chief Information & Technology Officer 2019 2018 2017 320,833 – – 825,044 – – 675,204 – – – – – 38,009 – – 2,553,511 – – 4,412,601 – – Sean Finn Executive Vice-President Corporate Services and Chief Legal Officer 2019 2018 2017 585,000 570,000 555,000 797,591 783,831 770,069 652,355 641,342 629,900 – 684,000 710,400 (206,790) 370,694 236,836 15,538 15,346 14,741 1,843,694 3,065,213 2,916,946 Dorothea Klein Senior Vice-President and Chief Human Resources Officer 2019 2018 38,750 – 192,599 – 157,491 – – – 3,008 – 630,547 – 1,022,395 – 2017 – – – – – – – 56 CN MANAGEMENT INFORMATION CIRCULAR 2020 COMPENSATION DISCUSSION AND ANALYSIS WILLIS TOWERS WATSON EXPECTED LIFE BINOMIAL METHODOLOGY ACCOUNTING VALUATION METHODOLOGY VARIANCE VALUATION FACTORGRANT DATE FAIR VALUE VALUATION FACTORGRANT DATE FAIR VALUE WILLIS TOWERS WATSON VS. ACCOUNTING 2019 OPTION-BASED AWARD16%January 31 – C$17.54 June 25 – C$19.25 December 6 – C$19.04 14.7%January 31 – C$16.08 15.0%June 25 – C$18.06 15.5%December 6 – C$18.46 January 31 – C$1.46 June 25 – C$1.19 December 6 – C$0.58 2018 OPTION-BASED AWARD16%January 25 – C$15.52 March 8 – C$15.21 March 19 – C$15.20 July 26 – C$18.85 15.6%January 25 – C$15.10 15.4%March 8 – C$14.67 15.3%March 19 – C$14.57 16.9%July 26 – C$19.91 January 25 – C$0.42 March 8 – C$0.54 March 19 – C$0.63 July 26 – (C$1.06) 2017 OPTION-BASED AWARD17%C$15.62 15.6%C$14.37 C$1.25
Extension to Notes (1) and (2) of the Summary Compensation Table on the Calculation of Grant Date Fair Value of Awards The fair value of the LTI awards reflects their expected value on the date of the grant. Since 2014, the value is calculated based on Willis Towers Watson’s expected life binomial methodology in an effort to align the valuation methodology used throughout the compensation review process for benchmarking, grant and disclosure purposes. Share-based awards represent the awards of PSUs under the Share Units Plan. Option-based awards represent the awards of stock options pursuant to the Management Long-Term Incentive Plan. The grant date fair value for PSUs and stock options considers the following assumptions: Share-Based Awards (PSUs) 2017 (JANUARY) 2018 (JANUARY) 2018 (MARCH 8) 2018 (MARCH 19) Closing share price on grant date (C$) Risk-free interest rate over term of the award(1) 91.91 0.50% to 1.25% based on yield curve 20% 1.50 3 years ROIC – 54.23 TSR – 70.77 97.02 0.75% to 1.25% based on yield curve 19% 1.65 3 years ROIC – 57.24 TSR – 74.71 95.08 0.75% to 1.25% based on yield curve 19% 1.65 3 years ROIC – 56.10 TSR – 73.21 95.00 0.75% to 1.25% based on yield curve 19% 1.65 3 years ROIC – 56.05 TSR – 73.15 Expected stock price volatility over term of the award(2) Expected annual dividends per share (C$) Expected term(3) Resulting fair value per unit (C$) Share-Based Awards (PSUs) 2018 (JULY) 2019 (JANUARY) 2019 (JUNE 25) 2019 (DECEMBER 6) Closing share price on grant date (C$) Risk-free interest rate over term of the award(1) 117.80 109.65 120.34 119.00 0.75% to 1.25% based on yield curve 19% 1.65 3 years 1.50% to 1.75% based on yield curve 18% 1.82 3 years ROIC – 64.69 TSR – 84.43 1.50% to 1.75% based on yield curve 18% 1.82 3 years ROIC – 71.00 TSR – 92.66 1.50% to 1.75% based on yield curve 18% 1.82 3 years ROIC – 70.21 TSR – 91.63 Expected stock price volatility over term of the award(2) Expected annual dividends per share (C$) Expected term(3) Resulting fair value per stock option (C$) ROIC – 69.50 TSR – 90.71 Option-Based Awards 2017 (JANUARY) 2018 (JANUARY) 2018 (MARCH 8) 2018 (MARCH 19) Closing share price on grant date (C$) Risk-free interest rate over term of the award(1) 91.91 97.02 95.08 95.00 0.50% to 2.25% based on yield curve 20% 1.50 6.25 years 15.62 0.75% to 2.25% based on yield curve 18% 1.65 6.25 years 15.52 0.75% to 2.25% based on yield curve 18% 1.65 6.25 years 15.21 0.75% to 2.25% based on yield curve 18% 1.65 6.25 years 15.20 Expected stock price volatility over term of the award(2) Expected annual dividends per share (C$) Expected term(3) Resulting fair value per stock option (C$) Option-Based Awards 2018 (JULY) 2019 (JANUARY) 2019 (JUNE 25) 2019 (DECEMBER 6) Closing share price on grant date (C$) Risk-free interest rate over term of the award(1) 117.80 0.75% to 2.25% based on yield curve 18% 1.65 6.25 years 18.85 109.65 1.50% to 2.50% based on yield curve 19% 1.82 6.25 years 17.54 120.34 1.50% to 2.50% based on yield curve 19% 1.82 6.25 years 19.25 119.00 1.50% to 2.50% based on yield curve 19% 1.82 6.25 years 19.04 Expected stock price volatility over term of the award(2) Expected annual dividends per share (C$) Expected term(3) Resulting fair value per stock option (C$) (1) Based on the zero coupon yield curve rate commensurate with the expected term of a given award. The Willis Towers Watson expected life binomial model uses a yield curve for the risk-free interest rate (with different interest rates applying depending on the lattice node) rather than one particular rate. (2) Based on daily share prices, dividend data and average of volatilities for CN’s NYSE and TSX-listed shares for a period commensurate with the expected term of a given award. (3) Represents the period of time that awards are expected to be outstanding. For option-based awards, the Company uses the SEC Safe Harbor calculation. The share-and option-based awards are sensitive to variations in assumptions, in particular the risk-free interest rate and stock price volatility. 57 CN MANAGEMENT INFORMATION CIRCULAR 2020 COMPENSATION DISCUSSION AND ANALYSIS
Details of “All Other Compensation” Amounts for 2019, 2018, and 2017(1) PERQUISITES AND OTHER PERSONAL BENEFITS(2) ALL OTHER COMPENSATION (TOTAL OF THE TWO PREVIOUS COLUMNS) (C$) OTHER COMPENSATION (C$) NAME YEAR (C$) Jean-Jacques Ruest ESIP employer contribution: Post-retirement benefits: 20,920 (3) 5,200 (4) 2019 Nil 26,120 ESIP employer contribution: Post-retirement benefits: 18,334 (3) 5,700 (4) 2018 Nil 24,034 ESIP employer contribution: Post-retirement benefits: 16,235 (3) 5,300 (4) 2017 Nil 21,535 Ghislain Houle ESIP employer contribution: Post-retirement benefits: 16,875 (3) 3,500 (4) 2019 Nil 20,375 ESIP employer contribution: Post-retirement benefits: 16,028 (3) 3,800 (4) 2018 Nil 19,828 ESIP employer contribution: Post-retirement benefits: 15,422 (3) 3,300 (4) 2017 Nil 18,722 Robert Reilly ESIP employer contribution: Special Cash Award: Tax Equalization Amount: 5,775 (3) 2,322,075(5) 1,060,404(7) 2019 Nil 3,388,254 Sean Finn ESIP employer contribution: Post-retirement benefits: 16,318 (3) 4,300 (4) 2019 Nil 20,618 15,484 (3) 4,400 (4) ESIP employer contribution: Post-retirement benefits: 2018 Nil 19,884 ESIP employer contribution: Post-retirement benefits: 15,143(3) 4,000(4) 2017 Nil 19,143 1,077 (3) 709,892(6) 125,704(7) Dorothea Klein ESIP employer contribution: Special Cash Award: Tax Equalization Amount: 2019 Nil 836,673 (1) This table outlines the perquisites and other compensation received by NEOs in 2019, 2018, and 2017. The amounts are calculated based on the incremental cost to the Company. The policy of the Company on the usage of the corporate aircraft provides that it is restricted to business-related purposes, save for certain exceptional circumstances. (2) Perquisites and other personal benefits include the use of a Company-leased vehicle, parking, club membership, executive physical exam, financial counselling and tax services, and certain healthcare benefits and life insurance coverage. The incremental cost to the Company is determined by the actual cost of the Company-leased vehicle (including gas and maintenance fees), parking, club membership, annual executive physical exam, financial counselling and tax services and by the cost of certain healthcare benefits and life insurance coverage in excess of that offered to salaried employees. See section “Executive Perquisites” on page 47 for more details. Perquisites and other personal benefits that amount to less than C$50,000 (in aggregate) or 10% of total salary for any of the NEOs are reported as “Nil” in this column. (3) Represents the value of the Company-match under the ESIP. See section “Employee Share Investment Plan” on page 47 for more details. (4) Represents the service cost for post-retirement benefits, if applicable. (5) Represents a special cash award of U.S. 1,750,000 (C2,322,075) paid to Mr. Reilly upon his hire in June 2019 to mitigate compensation losses incurred as a result of his departure from BNSF. The cash award is subject to a 24-month clawback provision in case of resignation or termination for cause. See Note 1 on page 52 for more details. (6) Represents a special cash award of U.S.$535,000 (C$709,892) paid to Mrs. Klein upon her hire in December 2019 to mitigate her compensation losses incurred as a result of her departure from ABB. The cash award is subject to a 24-month clawback provision in case of resignation or termination for cause. See Note 1 on page 53 for more details. (7) In 2019, Mr. Reilly and Mrs. Klein relocated to CN’s head office in Canada, and the values represent the 2019 tax equalization amounts provided by the Company to maintain their compensation, on a post-tax basis, at a similar level as if they remained in the U.S. 58 CN MANAGEMENT INFORMATION CIRCULAR 2020 COMPENSATION DISCUSSION AND ANALYSIS

Incentive Plan Awards Share-Based and Option-Based Awards in 2019 The following table shows information regarding grants of PSUs made to NEOs under the Share Units Plan, and grants of stock options made under the MLTIP in 2019, if any. SECURITIES, UNITS OR OTHER RIGHTS (#) SHARE PRICE ON DATE OF GRANT (C$) AWARD’S GRANT DATE FAIR VALUE (1) (C$) END OF PLAN PERIOD OR EXPIRY DATE NAME GRANT DATE AWARD TYPE Jean-Jacques Ruest January 31, 2019 PSUs(2) Options(3) 79,294 157,000 December 31, 2021 January 31, 2029 109.65 109.65 5,516,472 2,753,780 Ghislain Houle January 31, 2019 PSUs(2) Options(3) 19,202 62,298 December 31, 2021 January 31, 2029 109.65 109.65 1,335,883 1,092,707 Robert Reilly June 25, 2019 PSUs(2) Options(3) 14,225 46,152 December 31, 2021 June 25, 2029 120.34 120.34 1,086,153 888,426 Sean Finn January 31, 2019 PSUs(2) Options(3) 15,050 48,829 December 31, 2021 January 31, 2029 109.65 109.65 1,047,037 856,461 Dorothea Klein December 6, 2019 PSUs(2) Options(3) 3,384 10,975 December 31, 2021 December 6, 2029 119.00 119.00 255,519 208,964 (1) The grant date fair values reported for PSUs and stock options are calculated using the same assumptions as described in the extension to footnotes 1 and 2 of the Summary Compensation Table on page 57. (2) The PSUs granted in 2019 were made under the Share Units Plan. The payout of PSUs granted in 2019 to NEOs is subject to two distinct performance measures. Seventy percent (70%) of the PSU award is subject to the achievement of ROIC objectives for the period ending on December 31, 2021, and to the attainment of a minimum average closing share price established at the beginning of the cycle of C$104.19 or U.S.$77.08. The remaining 30% is subject to the TSR performance of CN measured against two comparator groups i) selected Class I Railroads; and ii) S&P/TSX 60 companies for the period ending on December 31, 2021. Details are described under “Performance Share Units: 2019 Award” on page 46. (3) The stock options granted in 2019 were made under the MLTIP and vest over a period of four years, with 25% of the stock options vesting at each anniversary date of the award. Unexercised stock options shall expire on the tenth anniversary of the date of the award. See section “Management Long-Term Incentive Plan” on page 61 for a description of the plan. Outstanding Share-Based Awards and Option-Based Awards The following table shows all awards made to NEOs and outstanding on December 31, 2019. OPTION-BASED AWARDS(1) SHARE-BASED AWARDS MARKET OR NUMBER OF PAYOUT VALUE OF VESTED NUMBER OF SHARES OR MARKET OR SECURITIES VALUE OF UNITS OF PAYOUT VALUE SHARE-BASED UNDERLYING OPTION UNEXERCISED SHARES THAT OF SHARE-BASED AWARDS NOT UNEXERCISED EXERCISE OPTION EXPIRATION DATE IN-THE-MONEY HAVE NOT VESTED (4) (#) AWARDS THAT HAVE NOT VESTED (5) (C$) PAID OUT OR DISTRIBUTED (6) (C$) PRICE (2) (C$) OPTIONS (3) (C$) OPTIONS (#) NAME Jean-Jacques Ruest 157,000 55,053 65,387 67,942 77,407 57,090 60,120 65,560 108.49 117.13 101.97 91.10 68.56 87.03 68.76 61.29 2029/01/31 2028/07/26 2028/01/25 2027/01/26 2026/01/28 2025/01/29 2024/02/03 2023/01/24 16,381,220 116,415 13,677,560 24,221,834 Ghislain Houle 62,298 60,908 56,618 18,047 10,546 7,892 8,260 8,680 11,200 108.49 101.97 91.10 82.68 74.17 84.55 58.71 47.30 38.29 2029/01/31 2028/01/25 2027/01/26 2026/07/27 2026/01/28 2025/01/29 2024/02/03 2023/01/24 2022/01/26 6,326,035 37,975 4,461,683 8,099,261 Robert Reilly 46,152 118.74 2029/06/25 0 14,225 1,671,295 0 Sean Finn 48,829 40,764 26,422 15,426 108.49 95.79 91.10 68.56 2029/01/31 2028/03/08 2027/01/26 2026/01/28 2,776,111 31,802 3,736,417 3,095,361 Dorothea Klein 10,975 116.52 2029/12/06 10,646 3,384 397,586 0 (1) Includes all stock options granted under the MLTIP and outstanding on December 31, 2019. 59 CN MANAGEMENT INFORMATION CIRCULAR 2020 COMPENSATION DISCUSSION AND ANALYSIS

(2) Where applicable, stock option exercise prices in U.S. dollars resulting from stock option grants to NEOs made in U.S. dollars were converted to Canadian dollars using the December 31, 2019, exchange rate of U.S.$1.00 = C$1.2990. The conversion of these option exercise prices results in different Canadian dollar equivalent values for stock option grants made in U.S. dollars when compared to the values presented in the “Share-Based and Option-Based Awards in 2019 table on page 59, under the “Share Price on Date of Grant” column. The following table presents the option exercise prices that were converted to Canadian dollars based on the December 31, 2019 exchange rate: OPTION EXERCISE PRICE (U.S.$) OPTION EXERCISE PRICE (C$) OPTION EXERCISE PRICE (U.S.$) OPTION EXERCISE PRICE (C$) OPTION EXPIRATION DATE OPTION EXPIRATION DATE 2029/12/06 2029/06/25 2029/01/31 2028/07/26 2028/03/08 2028/01/25 2027/01/26 89.70 91.41 83.52 90.17 73.74 78.50 70.13 116.52 118.74 108.49 117.13 95.79 101.97 91.10 2026/07/27 2026/01/28 2025/01/29 2024/02/03 2023/01/24 2022/01/26 63.65 52.78 67.00 52.93 47.18 38.19 82.68 68.56 87.03 68.76 61.29 49.61 (3) The value of unexercised in-the-money stock options at financial year-end for stock options granted to NEOs in Canadian dollars is the difference between the closing share price of the common shares on December 31, 2019, on the TSX (C$117.47) and the exercise price. The value of unexercised in-the-money stock options at financial year-end for stock options granted to NEOs in U.S. dollars is the difference between the closing share price of the common shares on December 31, 2019, on the NYSE (U.S.$90.45) converted to Canadian dollars based on the December 31, 2019, exchange rate of U.S.$1 = C$1.2990 (i.e. U.S.$90.45 × 1.2990 = C$117.49) and the exercise price converted to Canadian dollars using this same exchange rate. Please refer to Note 2 of this table for additional details. This value has not been and may never be realized. The actual gains, if any, will depend on the value of the common shares on the date of exercise. (4) Includes all PSUs outstanding on December 31, 2019, that have not vested on such date under the Share Units Plan. Payouts for these units are conditional upon meeting performance measures and a minimum share price condition that may or may not be achieved. (5) The value of outstanding share units awarded under the Share Units Plan in Canadian dollars is based on the closing price of the common shares on the TSX on December 31, 2019 (C$117.47). The value of outstanding share units awarded under the Share Units Plan in U.S. dollars is based on the closing price of the common shares on the NYSE on December 31, 2019 (U.S.$90.45), converted to Canadian dollars based on the December 31, 2019 exchange rate of U.S.$1 = C$1.2990 (i.e. U.S.$90.45 × 1.2990 = C$117.49). The values assume that the target average Relative TSR and ROIC objectives (i.e. 100%) and the minimum share price condition are met. In accordance with the Share Units Plan, a performance vesting factor between 0% and 200% will apply to the awarded share units. (6) Includes the value as at December 31, 2019 of the 2017 PSU awards granted under the Share Units Plan. The value is based on the closing price of the common shares on the TSX on December 31, 2019 (C$117.47) for grants made in Canadian dollars and based on the closing price of the common shares on the NYSE on December 31, 2019 (U.S.$90.45) converted to Canadian dollars based on the December 31, 2019 exchange rate of U.S.$1 = C$1.2990 (i.e. U.S.$90.45 × 1.2990 = C$117.49) for grants made in U.S. dollars. The payout of the 2017 PSUs awards was subject to two distinct performance measures. Seventy percent (70%) of the 2017 PSU award was subject to the achievement of ROIC objectives for the period ending on December 31, 2019, and to the attainment of a minimum average closing share price established at the beginning of the cycle of C$90.56 or U.S.$67.92. The average ROIC for the period ended on December 31, 2019 was 16.69%, exceeding the target for the plan period, and the minimum share price condition was met. The ROIC performance vesting factor was therefore 169.4%. The remaining thirty percent (30%) was subject to the TSR performance of CN measured against two comparator groups i) selected Class I Railroads; and ii) S&P/TSX 60 companies for the period ending on December 31, 2019. The Relative TSR performance of CN resulted in a Relative TSR performance vesting factor of 100.0%. The 2017 PSU awards were equity-settled for all NEOs on February 25, 2020. Also includes the value as at December 31, 2019 of the DSUs that have vested under the terms of the VIDP based on the closing share price of the Company’s common shares on the TSX of C$117.47. Units held under this deferred compensation plan are only payable upon cessation of employment (please refer to page 62 for more details on the Company’s Deferred Compensation Plans). The following table provides the breakdown, for each of the NEOs, of the market value of vested share-based awards that were not paid out or distributed on December 31, 2019: ACCUMULATED DSUs (C$) 2017 PSUs (C$) TOTAL (C$) NAME Jean-Jacques Ruest Ghislain Houle Robert Reilly Sean Finn Dorothea Klein 3,979,716 3,316,608 0 3,095,361 0 20,242,118 4,782,653 0 0 0 24,221,834 8,099,261 0 3,095,361 0 Incentive Plan Awards – Value Vested or Earned During the Year The following table shows the value from incentive plans vested or earned by NEOs under the Company’s incentive plans, including the annual incentive bonus, PSUs, DSUs and stock options earned during the financial year ended December 31, 2019. Incentive Plan Awards – Value of Exercised Stock Options and Performance Share Units Paid During the Year The following table lists the number of shares acquired and the value realized as a result of stock options exercised by NEOs in 2019 as well as PSUs which vested on December 31, 2019. For stock options exercised, the value realized is calculated by multiplying the number of shares acquired by the difference between the exercise price and the market price of CN common shares on the exercise date. NON-EQUITY OPTION-BASED AWARDS – VALUE VESTED SHARE-BASED INCENTIVE AWARDS – VALUE PLAN COMPENSATION VESTED – VALUE DURING THE YEAR (C$) DURING THE EARNED DURING (1) (2) (3) YEAR THE YEAR NAME (C$) (C$) Jean–Jacques Ruest Ghislain Houle Robert Reilly Sean Finn Dorothea Klein 1,600,563 681,874 0 1,348,155 0 3,979,716 3,316,608 0 3,095,361 0 0 0 0 0 0 (1) Represents the value of the potential gains from stock options granted under the MLTIP in 2015, 2016, 2017, and 2018 that vested during the 2019 financial year. These grants all vest over four years, with 25% of stock options vesting on each anniversary date (see section “Management Long-Term Incentive Plan” starting on page 61 for a description of the Plan). The potential gains are calculated as the difference between the closing price of the common shares on each of the stock option grant anniversary dates in 2019 and the exercise price, converted to Canadian dollars when applicable using the exchange rate on such vesting date (see “Currency Exchange Information” on page 66). This value has not been and may never be, realized. The actual gains, if any, will depend on the value of the common shares on the date of exercise. (2) Includes PSUs granted in 2017 that vested on December 31, 2019 under the Share Units Plan. (3) As the Company did not meet its corporate financial objectives in 2019, there was no bonus earned under the AIBP for the financial year ended on December 31, 2019. 60 CN MANAGEMENT INFORMATION CIRCULAR 2020 COMPENSATION DISCUSSION AND ANALYSIS NAME STOCK OPTIONS PSUS TOTAL VALUE REALIZED (C$) NUMBER OFVALUE SHARES REALIZED ACQUIRED ON ON EXERCISE EXERCISE (C$) VALUE REALIZED ON DECEMBER 31, 2019 (C$) Jean-Jacques Ruest00 Ghislain Houle00 Robert Reilly 00 Sean Finn 53,5581,700,164 Dorothea Klein 00 3,979,716 3,316,608 0 3,095,361 0 3,979,716 3,316,608 0 4,795,525 0

Management Long-Term Incentive Plan The MLTIP was approved by the Company’s shareholders on May 7, 1996, and amended on April 28, 1998; April 21, 2005; April 24, 2007; March 4, 2008; January 27, 2015, January 1, 2019 and, on January 1, 2020. Eligible participants under the MLTIP are employees of the Company or its affiliates as determined by the Board of Directors. Grants cannot be made to non-employee directors under the MLTIP. The maximum number of common shares that may be issued under the MLTIP is 120,000,000. The following table provides information on the status of the reserve and the number of shares issued and issuable under the MLTIP, as at February 29, 2020. Stock Options Outstanding and Available for Grant as of February 29, 2020 Stock Option Features GRANT CURRENCY SAME CURRENCY AS THE RECIPIENT’S SALARY Exercise Price At least equal to the closing share price of the common shares on the TSX or the NYSE (depending on the grant currency) on the grant date. Term Ten years Vesting Criteria Stock options may become exercisable on the anniversary date (“conventional stock options”) and/or upon meeting performance targets (“performance options”) as established for each grant. Since 2005, grants have been of conventional stock options, which vest over four years, with 25% of stock options vesting on each anniversary. Grants made after January 1, 2020, vest over five years, with 20% of stock options vesting on each anniversary. Termination Conditions Stock options shall be cancelled upon the termination of a participant’s employment for cause or if the participant voluntarily terminates employment. In the event that a participant’s employment is terminated by the Company other than for cause, all stock options held by such participant continue to vest and shall be cancelled three months after termination of the participant’s employment. For awards made in 2019 and after, all vested stock options at time of termination held by such participant shall be cancelled three months after termination of the participant’s employment, and all unvested stock options at time of termination shall be cancelled at termination. In the case of retirement, stock options continue to vest and shall be cancelled three years after the retirement date. For awards made in 2020 and after, stock options continue to vest and shall be cancelled four years after the retirement date. Since January 1, 2019, in the event of a participant’s death, all available stock options immediately vest and may be exercised by the estate within a period of twelve months from the date of death. In the event non-compete, non-solicitation, confidentiality or other conditions of the grant are breached, stock options shall be forfeited and cancelled. These conditions are subject to the discretion of the Committee. NUMBER OF % OF COMMON SHARES (#) OUTSTANDING COMMON SHARES Stock options already granted and outstanding Stock options issuable under the MLTIP Shares issued following the exercise of stock options 4,151,169 14,260,341 101,588,490 0.58% 2.00% 14.26% Stock Options Granted under the MLTIP as at December 31, 2019, 2018 and 2017 The following table presents information concerning stock options granted under the MLTIP as at December 31 of the years indicated below. 2019 2018 2017 Number of stock options granted during the year Number of employees who were granted stock options Number of stock options outstanding at year-end Weighted average exercise price of stock options outstanding Number of stock options granted as a % of outstanding shares(1) Number of stock options exercised 933,372 1,099,753 966,666 209 199 189 At the 2007 annual meeting, shareholders approved an ordinary resolution confirming the addition of new amendment provisions to the MLTIP. Such amendment provisions state that the Board of Directors or the Committee, as provided in the MLTIP or pursuant to a specific delegation and in accordance with applicable legislation and regulations, may amend any of the provisions of the MLTIP or suspend or terminate the MLTIP or amend the terms of any then outstanding award of stock options under the MLTIP (“Options”) provided, however, that the Company shall obtain shareholder approval for: 3,736,116 4,198,175 5,046,279 C$86.89 C$79.73 C$66.78 0.13% 1,116,974 0.15% 1,674,277 0.13% 1,179,684 (1) Annual burn rate, as calculated in accordance with Section 613(p) of the TSX Company Manual. As per stock exchanges rule, the maximum number of common shares that may be issued and/or be the subject of a grant to any one participant in a particular year is 20% of the awards in that year. The maximum aggregate number of common shares, with regard to which awards may be made to any participant under the MLTIP and under any other plan, which the Company has or may eventually have, shall not exceed 5% of the common shares issued and outstanding. The maximum number of common shares that may be issued to insiders, at any time, under all security-based compensation, cannot exceed 10% of the issued and outstanding common shares. Also pursuant to the March 8, 2005 amendment, the maximum number of common shares with regard to which awards may be made during a calendar year is limited to 1% of the outstanding common shares at the beginning of that year. As demonstrated in the previous table, the number of stock options granted is well below the 1% limitation. Stock options are non-transferable except, in certain circumstances, upon the death of the holder of such stock options. (i) any amendment to the maximum number of common shares issuable under the MLTIP, except for adjustments in the event that such shares are subdivided, consolidated, converted or reclassified by the Company or that any other action of a similar nature affecting such shares is taken by the Company (a “Share Adjustment”); any amendment which would allow non-employee directors to be eligible for new awards under the MLTIP; any amendment which would permit any Option granted under the MLTIP to be transferable or assignable other than by will or pursuant to succession laws (estate settlements); the addition of a cashless exercise feature, payable in cash or common shares, which does not provide for a full deduction of the number of underlying shares from the MLTIP reserve; the addition in the MLTIP of deferred or performance share unit provisions or any other provisions which result in participants receiving common shares while no cash consideration is received by the Company; any reduction in the exercise price of an Option after the Option has been granted to a participant or any cancellation of an Option and the substitution of that Option by a new Option with a reduced exercise price granted to the same participant, except in the case of a Share Adjustment; (ii) (iii) (iv) (v) (vi) 61 CN MANAGEMENT INFORMATION CIRCULAR 2020 COMPENSATION DISCUSSION AND ANALYSIS

(vii) any extension to the term of an outstanding Option beyond the original expiry date, except in the case of an extension due to a blackout period; (viii) any increase to the maximum number of common shares that may be issued: a. under the MLTIP to any participant during any calendar year; or b. under the MLTIP and under any other plan to any participant; (ix) the addition in the MLTIP of any form of financial assistance and any amendment to a financial assistance provision, which is more favourable to participants. No amendment, suspension or termination shall, except with the written consent or the deemed consent of the participants concerned, affect the terms and conditions of Options previously granted under the MLTIP, unless the rights of the participants have terminated in accordance with the MLTIP. On March 4, 2008, the MLTIP was amended to include a “double-trigger provision”. Pursuant to such provisions, provided that a proper substitute is granted, the vesting of non-performance-based stock options held by a participant would not accelerate upon a Change of Control, unless the participant is terminated without cause or resigns for good reason. Please refer to “Change of Control Provisions” on page 48 for more details on such amendment. On January 27, 2015, the MLTIP was amended to make certain changes to the retirement definition. Before January 27, 2015, the retirement definition of the MLTIP was based on the retirement definition of pension plans. All reporting and non-reporting Company insiders were subject to a retirement definition providing for a minimum retirement age of 55. The amended retirement definition maintains the retirement age at 55 and introduces a minimum continuous service condition of five (5) years to be eligible for continued vesting and exercise of stock options upon retirement. In late 2018, the Board approved changes to the MLTIP which became effective as of January 1, 2019. The retirement definition of the MLTIP was amended for awards made in 2019 and after, to the earlier of (i) 55 years of age and twelve (12) years of continuous service, or (ii) 60 years of age and seven (7) years of continuous service. Another amendment was also made to remove the three-month continued vesting provision in case of involuntary termination without cause for awards made in 2019 and after. The vested stock options at the time of involuntary termination without cause remain exercisable for a period of three months from the termination date, however no stock options become vested during such three-month period. Finally, the MLTIP was amended to provide immediate vesting of all stock options in case of death of the participant. In July 2019, the Board approved changes to the MLTIP which became effective as of January 1, 2020. The vesting period of the the stock options for awards made in 2020 and after was increased from a four-year period, with 25% of the stock options granted that vest on each anniversary date, to a five year period, with 20% of the stock options granted that vest on each anniversary date. Finally, the time period to exercise stock options upon retirement for awards made in 2020 and after was increased from three to four years following the retirement date to align with the extended vesting period and to allow for all stock options to vest through retirement. Deferred Compensation Plans The VIDP was introduced by the Company in 2002. This plan allows NEOs and other senior management employees to elect to defer up to 100% of their annual bonus into DSUs remitted upon retirement or termination of employment. A DSU is equivalent to a common share of the Company and earns notional dividends, which are re-invested into additional DSUs, when cash dividends are paid on the Company’s common shares. The amount deferred is converted into a number of units at the deferral date, using the closing share price on the deferral date. Deferral elections are made at least six months prior to the end of the performance period of the incentive plan. The maximum total amount participants can defer to DSUs is equivalent to their ownership requirement under the Stock Ownership guidelines (see section on “Stock Ownership” under “Other Key Compensation Programs of the Company” on page 47 for a detailed description). The Company also credits a Company match equal to 25% of the number of DSUs resulting from an eligible deferral. These Company-matched DSUs vest over a period of four years (25% per year) from the deferral date. Due to its tax effectiveness and the additional match provided by the Company, this plan offers an opportunity for executives to increase their ownership in CN, linking their future returns to the share price performance. In October 2014, CN modified its VIDP to settle future award payouts in CN common shares purchased on the open market rather than cash. The changes affect DSU awards made in 2016 or after. As a result, amounts deferred in DSUs after January 1, 2016 are settled in shares upon retirement or termination (including vested Company-matched DSUs as well as notional dividends accrued over the deferral period and subject to mandatory waiting periods or monthly instalments for eligible U.S. taxpayers). Following the modification of the VIDP, executives, including NEOs and senior management employees, were offered a one-time election to settle past DSU awards in CN common shares purchased on the open market rather than cash and according to the plan terms. All NEOs have elected to convert their settlement in common shares purchased on the open market. No modification to the nature of the deferrals under the AIBP plan can be made, unless the Board of Directors approves an amendment to the plans. 62 CN MANAGEMENT INFORMATION CIRCULAR 2020 COMPENSATION DISCUSSION AND ANALYSIS

Employment Arrangements President and CEO The Company has not entered into written employment agreement with the President and CEO. It has only provided an appointment letter setting forth general details of employment, which are all described in this Information Circular. The President and CEO is eligible for the same compensation, benefit plans and programs as the other executives except for the following: • Under the AIBP, his target payout is 140% of base salary with a payout ranging from 0% to 280%. • Mr. Ruest is required to maintain a minimum level of stock ownership equivalent to eight times his annual salary. He is also required to maintain this stock ownership level for one year following cessation of employment. Mr. Ruest is limited to participating in only one outside public company board. • Other NEOs The Company has not entered into written employment agreements with the other NEOs. It has only provided appointment letters setting forth general details of employment, which are all described in this Information Circular. Pension Plan Benefits Pension Plans and Other Retirement Arrangements CN Pension Plan (“CNPP”) and CN Pension Plan for Senior Management (“CNPPSM”) Messrs. Ruest, Houle and Finn participate in the CNPP and CNPPSM, which are federally-registered defined benefit pension plans designed to provide retirement benefits based on pensionable years of service and highest average earnings. Highest average earnings are defined as the average pensionable earnings during the last 60 months of compensated service or the best five consecutive calendar years, whichever is greater. Under the CNPP, pensionable earnings consist of base salary and overtime. Under the CNPPSM, pensionable earnings include base salary, overtime, and bonuses paid by the Company under the AIBP, up to the employee’s target level. In 2019, the aggregate annual retirement benefit payable under both plans was subject to a maximum of C$3,026 per year of pensionable service and was calculated as follows: • 1.7% of highest average earnings up to the average year’s maximum pensionable earnings (the “YMPE”) as defined under the Quebec/Canada Pension Plan, multiplied by the number of years of pensionable service (maximum 35 years) plus • 2.0% of highest average earnings in excess of the YMPE, multiplied by the number of years of pensionable service (maximum 35 years). Under both the CNPP and CNPPSM, if the sum of the participant’s age and years of pensionable service is at least 85 and the participant is age 55 or over at the time of retirement from active employment, the participant is eligible to receive an immediate, unreduced pension, subject to the Company’s consent. Retirement benefits vest immediately when participation begins. Special Retirement Stipend Executives and senior management employees who participate in the CNPP also participate in a non-registered, supplemental executive retirement program called the Special Retirement Stipend (the “SRS”). SRS participants enter into an agreement with the Company, which includes confidentiality, non-compete, and non-solicitation clauses. Messrs. Ruest, Houle and Finn have each signed a SRS agreement. The annual amount payable under the SRS equals 2% of the employee’s highest average earnings in excess of the average earnings that result in the maximum pension payable under the CNPP and CNPPSM (approximately C$159,591 in 2019), multiplied by the number of years of pensionable service (maximum 35 years). Earnings consist of base salary and bonuses paid by the Company under the AIBP, up to the employee’s target level. If the sum of the participant’s age and years of pensionable service is at least 85 and the participant is age 55 or over at the time of retirement, the participant is eligible to receive an immediate, unreduced SRS benefit, subject to the conditions set out in the SRS agreement. SRS benefits for employees who entered into a SRS agreement prior to July 1, 2002, vest after two years of employment. For employees who entered into a SRS agreement on or after July 1, 2002, the SRS benefits become vested only if the employee remains in active service for two years and until the age of 55. SRS retirement benefits are paid out of operating funds. Mr. Ruest’s annual benefit payable under the SRS is capped at C$1,000,000. Defined Contribution Pension Plan for Executives and Senior Management (“DCPP”) Mrs. Klein participates in the DCPP The DCPP is a federally-registered defined contribution pension plan that was introduced for executives and senior management employees on January 1, 2006. For non-unionized employees other than executives and senior management, a separate defined contribution plan was also introduced on the same date. Executives and senior management employees hired prior to January 1, 2006, had a one-time opportunity to either join the DCPP or maintain participation in the CNPP and CNPPSM mentioned above. Messrs. Ruest, Houle and Finn elected to remain in the CNPP and CNPPSM. Executives and senior management employees hired on or after January 1, 2006, automatically join the DCPP. Executives participating in the DCPP contribute a specific percentage of their pensionable earnings into their account and the Company contributes the same percentage, subject to the maximum contribution imposed by the Canadian Income Tax Act (C$27,230 in 2019). The contribution percentage for executives depends on age and service as follows: % OF PENSIONABLE POINTS (SUM OF AGE AND SERVICE) EARNINGS Up to 39 40 – 49 50 – 59 60 and above 6% 7% 8% 9% Pensionable earnings include base salary and bonuses payable under the AIBP up to the employee’s target level. All contributions vest immediately and are invested in various investment funds as selected by the participant. No withdrawals or distributions are permitted prior to employment termination. 63 CN MANAGEMENT INFORMATION CIRCULAR 2020 COMPENSATION DISCUSSION AND ANALYSIS
Defined Contribution Supplemental Executive Retirement Plan (“DC SERP”) Mrs. Klein participates in the DC SERP. The DC SERP is a non-registered defined contribution pension plan designed to provide executives and senior management employees with retirement benefits in excess of the Canadian Income Tax Act limit applicable to the DCPP described above. Once contributions have reached the limit prescribed by the Canadian Income Tax Act in the DCPP in a given year, an amount equal to employer and employee contributions in excess of the limit is gradually credited by the Company to a notional account under the DC SERP. These notional contributions vest after two years of employment. Employees do not contribute to the DC SERP. By default, notional contributions accrue investment credits using investment options as selected by the participant in the DCPP. However, participants can make a different investment election under the DC SERP. No withdrawals or distributions are permitted prior to employment termination. Effective January 1, 2011, the DC SERP was amended to include certain confidentiality, non-compete, non-solicitation, and other covenants as a condition of payment of retirement benefits accruing as of the effective date. Canadian National Railway Company Savings Plan for U.S. Operations (“401(k) Plan”) Mr. Reilly participates in the 401(k) Plan, which is a defined contribution retirement plan qualified under Section 401(a) of the Internal Revenue Code offered to U.S. based CN employees. Non-unionized employees participating in the 401(k) Plan may elect to defer of up to 100% of their pensionable earnings in the plan and the Company contributes an amount equal to 50% of the first 6% of the pensionable earnings an employee elects to defer to the 401(k) Plan (“Matching Contribution”). Both employee deferrals and Matching contributions are subject to annual limits imposed by the U.S. Internal Revenue Code. All Matching Contributions vest immediately. Under the defined contribution component of the 401(k) Plan, the Company makes an additional contribution for non-unionized employees of 3.5% of pensionable earnings (“Management Contribution”). Management Contributions vest after three years of employment. Pensionable earnings include base salary and are subject to the annual compensation limit imposed by the Internal Revenue Code (US$280,000 in 2019). The total of all contributions to the 401(k) Plan – employee deferrals, Matching Contributions and Management Contributions for any employee in a plan year are subject to an annual limit imposed by the Internal Revenue Code (US$56,000 in 2019). All contributions are invested in various investment funds as selected by the participant. Canadian National Railway Defined Contribution Supplemental Executive Retirement Plan (“US DC SERP”) Mr. Reilly participates in the US DC SERP. The US DC SERP is a non-qualified defined contribution pension plan designed to provide U.S. based CN executives and senior management employees with supplemental retirement benefits in addition to the 401(k) Plan described above. The Company credits contributions to a notional account under the US DC SERP. Employees do not contribute to the US DC SERP. The annual contribution percentage credited to executives by the Company depends on age and service as follows: POINTS (SUM OF AGE AND SERVICE) % OF PENSIONABLE EARNINGS Up to 39 40 – 49 50 – 59 60 and above 5% 6% 7% 8% Pensionable earnings include base salary and bonuses payable under the AIBP up to the employee’s target level. These notional contributions vest after two years of employment. A participant’s notional contributions accrue investment credits as if invested in a default investment option unless the participant makes other investment elections. No withdrawals or distributions are permitted prior to employment termination. Distributions after termination of employment are made in the number of instalments elected by the participant. Effective January 1, 2011, the US DC SERP was amended to include certain confidentiality, non-compete, non-solicitation, and other covenants as a condition of payment of contributions accruing after 2010. Defined Benefit Plans Table The following amounts have been calculated using the actuarial assumptions disclosed in Note 15 — Pensions and Other Post-retirement Benefits, on page 84 of the 2019 Annual Report and in Note 13 — Pensions and Other Post-retirement Benefits, on page 80 of the 2018 Annual Report, available on the Company’s website at www.cn.ca and on SEDAR at www.sedar.com. The amounts calculated in this table are estimates only and are based on assumptions, which may or may not materialize. Amounts shown in this table include pension benefits from the Company’s defined benefit registered pension plans and non-registered supplemental pension arrangements for 2019 and are in Canadian dollars. PRESENT SERVICE OF SALARY/ OF PLAN (1) The change in present value that is attributable to compensation includes the service cost net of employee contributions, the impact of any increase in earnings in excess or below what was assumed and the impact of plan changes. The service cost net of employee contributions is the estimated value of the employer portion of benefits accrued during the calendar year. (2) Annual benefits payable at year end represent accrued benefits as at December 31, 2019 (based on service and pay up to December 31, 2019), payable at age 65 or at unreduced retirement date, if earlier. Actual benefits payable at year end would have been reduced for employees not yet eligible for unreduced benefits. (3) The projected pension is based on current compensation levels and assumes the executive will receive 80% of his target bonus for years after 2019. (4) The present value of the defined benefit obligation is the value of the benefits accrued for all service to the specified point in time. (5) The change in present value that is attributable to non-compensatory elements includes changes in assumptions, interest cost, change in currency, employee contributions, any benefit payments and gains and losses (other than for difference in earnings). The impact on the present value at the end of 2019 relating to non-compensatory elements was mainly due to interest on benefit obligation, and a decrease in the discount rate which increased the present value. This was partially offset by a decrease in the currency exchange rate. 64 CN MANAGEMENT INFORMATION CIRCULAR 2020 COMPENSATION DISCUSSION AND ANALYSIS NUMBER OF YEARS OF CREDITED SERVICE NAME (#) ANNUAL BENEFITS PAYABLE OPENING PRESENT VALUE OF DEFINED BENEFIT OBLIGATION (4) (C$) COMPENSATORY CHANGE (C$) (1) CLOSING VALUE OF NON-DEFINED COMPENSATORYBENEFIT CHANGE (5) OBLIGATION (4) (C$)(C$) AT YEAR END (2)AT AGE 65 (3) (C$)(C$) IMPACT IMPACT COST BONUSCHANGES TOTAL Jean-Jacques Ruest23.67 Ghislain Houle22.32 Sean Finn 26.00 672,000681,000 445,000827,000 654,000746,000 11,641,000 9,477,000 11,188,000 502,000(853,000)0(351,000) 424,000(512,000)0(88,000) 418,000(700,000)0(282,000) 1,021,00012,311,000 1,198,00010,587,000 668,00011,574,000

Defined Contribution Plans Table The table below includes amounts from the Company’s registered and non-registered defined contribution plans. ACCUMULATED VALUE AT START OF YEAR (C$) COMPENSATORY NON-COMPENSATORY ACCUMULATED VALUE AT YEAR END (C$) AMOUNT (1) (C$) AMOUNT (2) (C$) NAME Robert Reilly Dorothea Klein 0 0 51,833 4,102 9,632 4,102 61,465 8,204 (1) Represents employer contributions and notional contributions in the non-registered defined contribution plan. (2) Represents employee contributions and, if any, investment gains and losses and notional investment credits and losses. Non-Registered Plans Table The following table provides the total present value of CN’s non-registered defined benefit and defined contribution plans. These amounts were determined using the actuarial assumptions disclosed in Note 15 — Pensions and Other Post-retirement Benefits, on page 84 of the 2019 Annual Report and in Note 13 — Pensions and Other Post-retirement Benefits, on page 80 of the 2018 Annual Report, available on the Company’s website at www.cn.ca and on SEDAR at www.sedar.com. Amounts include the value of pension benefits for active, deferred and retired executive and senior management participants for 2019. OPENING PRESENT VALUE OF BENEFIT OBLIGATION (C$) CLOSING PRESENT VALUE OF BENEFIT OBLIGATION (C$) PLANS Non-Registered Defined Benefit Plans in Canada and the U.S. Non-Registered Defined Contribution Plans in Canada and the U.S. 440,000,000 7,088,000 490,200,000 (1) 7,566,000 1) The increase in the present value at the end of 2019 for defined benefit plans was mainly due to benefit accruals, interest on the benefit obligation plan, plan experience, and a decrease in the discount rate. This was partially offset by the impact of benefit payments and a decrease in the currency exchange rate. Termination and Change of Control Benefits The Company does not have contractual arrangements or other agreements in connection with termination, resignation, retirement, Change of Control or a change in responsibilities of a NEO, other than the conditions provided in the compensation plans, and summarized as follows: TERMINATION RESIGNATION INVOLUNTARY TERMINATION RETIREMENT(3) CHANGE OF CONTROL FOR CAUSE Annual Incentive Bonus Plan Forfeits eligibility for the plan Entitled to a bonus based on corporate and Entitled to a bonus based on corporate and individual performance and pro-rated on active service in plan year (minimum of three months), subject to providing a three-month notice period prior to retirement. No specific provision Forfeits eligibility for the plan individual performance and pro-rated on active service in plan year (minimum of three months) Stock Options(1) All stock options are cancelled Grants made before January 2019 Continued vesting for three months Exercise of vested stock options within three months or otherwise forfeited Subject to compliance with the two-year non-compete, non-solicitation and confidentiality provisions Grants made since January 2019 Exercise of vested stock options upon involuntary termination within three months or otherwise forfeited Subject to compliance with the two-year non-compete, non-solicitation and confidentiality provisions Subject to respect of two-year non-compete, non-solicitation and confidentiality provisions Grants made before January 2020: continued vesting for three years if the executive remains in continuous and active service until the last day of the year in which the grant was made; exercise of vested stock options within three years or otherwise forfeited Grants made since January 2020: continued vesting for four years if the executive remains in continuous and active service until the last day of the year in which the grant was made; exercise of vested stock options within four years or otherwise forfeited Subject to compliance with the two-year non-compete, non-solicitation and confidentiality provisions If proper substitute is granted, immediate vesting would occur only if participant is terminated without cause or resigns for good reason(2) within two years of the Change of Control All stock options are cancelled Performance Share Units(1) All PSUs are cancelled Grants made before January 2019 Partial payout if performance measures are met and pro-rated (a year is considered completed only if 9 months has elapsed in the year) based on active service during the plan period Subject to compliance with the two-year non-compete, non-solicitation and confidentiality provisions Grants made since January 2019 Partial payout if performance measures are met and pro-rated based on the number of months of active service during the plan period Subject to compliance with the two-year non-compete, non-solicitation and confidentiality provisions Full payout if performance measures are met and if the executive remains in continuous and active service until March 31 of the year following the year in which the grant was made Subject to compliance with the two-year non-compete, non-solicitation and confidentiality provisions If proper substitute is granted, immediate vesting would occur only if participant is terminated without cause or resigns for good reason(2) within two years of the Change in Control All PSUs are cancelled Deferred Share Units Payment of all Payment of all vested units, including the vested Company-matched DSUs Payment of all vested units, including the vested Company-matched DSUs Immediate vesting of unvested Company-matched DSUs Payment of all vested units, vested units, including the vested including the Company-matched DSUs vested Company-matched DSUs 65 CN MANAGEMENT INFORMATION CIRCULAR 2020 COMPENSATION DISCUSSION AND ANALYSIS

TERMINATION FOR CAUSE RESIGNATION INVOLUNTARY TERMINATION RETIREMENT(3) CHANGE OF CONTROL Registered Payment of vested Payment of vested benefits Payment of vested benefits Payment of vested benefitsPayment of vested benefits Pension Plansbenefits Non-RegisteredPayment of vested Pension Plans and benefits Arrangements(1) Payment of vested benefits Subject to compliance with the two-year non-compete, non-solicitation and confidentiality provisions Payment of vested benefits Subject to compliance with the two-year non-compete, non-solicitation and confidentiality provisions Payment of vested benefitsPayment of vested benefits, except for SRS benefits which are forfeited (1) In the event of resignation, involuntary termination, retirement or Change of Control, the payment of awards or vested benefits is subject to certain non-compete, non-solicitation, non-disclosure of confidential information and other restrictive provisions as per the respective plan rules and arrangements. (2) A resignation for good reason may take place only during the 24 months following a Change of Control if (i) the executive is required to relocate his or her office or home base to a location that is outside a 100-kilometer radius of his or her office or home base immediately prior to the Change of Control or (ii) the executive is assigned a set of responsibilities and/or the employment or continued employment of the executive on terms and conditions that are not the substantial equivalent of such executive’s set of responsibilities and/or terms and conditions of employment in effect immediately prior to the Change of Control. (3) For awards made in 2019 and after, the retirement definition (previously 55 years of age and 5 years of continuous service) for the PSUs and the Stock Options has been changed to the earlier of (i) 55 years of age and 12 years of continuous service, or (ii) 60 years of age and 7 years of continuous service. The same definition will also apply to the AIBP starting on January 1, 2020. Involuntary Termination In the event of an involuntary termination, an NEO would receive a severance amount generally in line with applicable legal requirements. No incremental amounts would be payable. Share-based awards, option-based awards and other benefits will be treated according to the terms of the plans under which they were granted, as described in the summary Termination and Change of Control Benefits table on page 65. Retirement On December 31, 2019, Messrs. Ruest, Houle and Finn were eligible for retirement but, unlike Messrs. Ruest and Finn, Mr. Houle did not have sufficient service for unreduced retirement benefits under the defined benefit plans. Had Messrs. Ruest, Houle and Finn retired on December 31, 2019, no other material payments or benefits would have been payable. Share-based awards, option-based awards and other benefits are treated according to the terms of the plans under which they were granted, as described in the summary Termination and Change of Control Benefits table on page 65. Change of Control The following table shows the incremental benefits that NEOs would have been entitled to had there been a change of control on December 31, 2019. SHARE UNIT(1) STOCKDEFERRED (1)(2) S PLAN OPTIONS SHARE UNITS TOTAL (C$) NAME (C$) (C$) (C$) Jean-Jacques Ruest Ghislain Houle Robert Reilly Sean Finn Dorothea Klein 0 0 0 0 0 0 0 0 0 0 0 0 0 0 0 0 0 0 0 0 (1) An NEO would be eligible for immediate vesting only if no proper substitute is granted, or if the executive is terminated without cause or resigns for good reason within two years of the change of control. (2) An NEO would be eligible for immediate vesting of the unvested Company-matched deferred share units allocated to an executive following the deferral of compensation in previous years (see “Deferred Compensation Plans” section on page 62 for a description of the VIDP). The value shown is equal to the number of deferred share units that would vest multiplied by the closing share price of common shares on December 31, 2019 (C$117.47). Currency Exchange Information Compensation disclosed in the “Statement of Executive Compensation” section that is paid in U.S. dollars was converted to Canadian dollars using the following currency exchange rates: COMPENSATION ELEMENTS EXCHANGE RATE USED ACTUAL RATE U.S.$1 = C$X Salary and all other compensation AVERAGE RATE DURING THE YEAR: 2019: 2018: 2017: 1.3269 1.2957 1.2986 Annual incentive bonus plan WHEN BONUS IS EARNED (I.E. DECEMBER 31) December 31, 2019: December 31, 2018: December 31, 2017: 1.2990 1.3637 1.2571 Pension value, Value of unexercised in-the-money options, Market value of share-based awards that have not vested, Non-equity incentive plan compensation – Value earned during the year, Termination scenarios – incremental costs DECEMBER 31 (DECEMBER 31 OF PRIOR YEAR FOR PENSION VALUE) December 31, 2019: December 31, 2018: December 31, 2017: December 31, 2016: 1.2990 1.3637 1.2571 1.3427 Option-based awards – Value vested during the year ACTUAL VESTING DATE OF THE APPLICABLE GRANTS: July 26, 2019: March 19, 2019: March 8, 2019: January 25, 2019: January 26, 2019: July 27, 2019: January 28, 2019: January 29, 2019: 1.3166 1.3320 1.3416 1.3218 1.3218 1.3166 1.3262 1.3269 66 CN MANAGEMENT INFORMATION CIRCULAR 2020 COMPENSATION DISCUSSION AND ANALYSIS

Other Information Securities Authorized for Issuance Under Equity Compensation Plans The table below indicates, as at December 31, 2019, certain information with respect to the Company’s Management Long-Term Incentive Plan. NUMBER OF SECURITIES REMAINING AVAILABLE FOR FUTURE ISSUANCE NUMBER OF SECURITIES TO BE WEIGHTED AVERAGE EXERCISE UNDER EQUITY COMPENSATION PLANS (EXCLUDING SECURITIES REFLECTED IN THE FIRST COLUMN) (#) ISSUED UPON EXERCISE OF OUTSTANDING OPTIONS, WARRANTS AND RIGHTS (#) PRICE OF OUTSTANDING OPTIONS, WARRANTS AND RIGHTS (C$) PLAN CATEGORY Equity compensation plans approved by security holders Equity compensation plans not approved by security holders 3,736,116 86.89 14,946,991 Nil Nil Nil TOTAL 3,736,116 86.89 14,946,991 Indebtedness of Directors and Executive Officers As at March 10, 2020, there was no outstanding indebtedness of current and former directors or officers of the Company and its subsidiaries, whether entered into in connection with the purchase of common shares of the Company or otherwise. Interest of Informed Persons and Others in Material Transactions The management of the Company is not aware of any material interest, direct or indirect, of any informed person of the Company, any proposed director or any associate or affiliate of any informed person or proposed director in any transaction since the commencement of the Company’s most recently completed financial year, or in any proposed transaction, that has materially affected or would materially affect the Company or any of its affiliates or subsidiaries. Shareholder Proposals Shareholder proposals to be considered at the 2021 annual meeting of shareholders must be received at the head office of the Company no later than December 4, 2020, to be included in the Information Circular for such annual meeting. Availability of Documents The Company is a reporting issuer in Canada and the United States and is required to file various documents, including an annual information form and financial statements. Financial information is provided in the Company’s comparative financial statements and Management’s Discussion and Analysis for its most recently completed financial year. Copies of these documents and additional information relating to the Company are available on SEDAR at www.sedar.com and on the SEC website at www.sec.gov through EDGAR, or may be obtained on request from the Corporate Secretary of the Company by calling (514) 399-7091 or Investor Relations at (514) 399-0052. Approval The Board of Directors of the Company has approved the contents of this Information Circular and its sending to the shareholders of the Company. Sean Finn Executive Vice-President Corporate Services and Chief Legal Officer and Corporate Secretary March 10, 2020 67 CN MANAGEMENT INFORMATION CIRCULAR 2020 OTHER INFORMATION

Schedule A | Mandate of the Board The Board has clearly delineated its role and the role of management. The role of the Board is to supervise the management of CN’s business and affairs, with the objective of increasing shareholder value. Management’s role is to conduct the day-to-day operations in a way that will meet this objective. The Board approves all matters expressly required herein, under the Canada Business Corporations Act and other applicable legislation and CN’s Articles and By-laws. The Board may assign to Board committees the prior review of any issues it is responsible for, or as required by applicable laws. Board committee recommendations are generally subject to Board approval. The Board has delegated the approval of certain matters to management pursuant to its Standing Resolutions on Delegation of Authority, as amended from time to time. Meetings of the Board are held at least seven times a year and as necessary. As part of its stewardship responsibility, the Board advises management on significant business issues and has the following responsibilities: A. Approving CN’s Strategy • adopting a strategic planning process, approving and reviewing, on at least an annual basis, a business plan and a strategic framework which take into account, among other things, the opportunities and risks of the business, and monitoring the implementation of the business plan by management. B. Assessing and Overseeing the Succession Planning of Executive Management • overseeing the disclosure of a method for interested parties to communicate directly with the Board Chair or with the non-management directors as a group; and ensuring a Board succession and renewal plan is in place. • D. Monitoring Financial Matters and Internal Controls • monitoring the quality and integrity of CN’s accounting and financial reporting systems, disclosure controls and procedures, internal controls and management information systems, including by overseeing: • choosing the President and Chief Executive Officer (the “President and CEO”), appointing executive management and monitoring the President and CEO and his direct reports’ performance taking into consideration Board expectations and fixed objectives, approving the President and CEO’s corporate goals and objectives and approving annually the compensation of the President and CEO and his direct reports; ensuring that an appropriate portion of the President and CEO and executive management compensation is tied to both the short-and longer-term performance of CN; and taking all reasonable steps to ensure that processes are in place for the recruitment, training, development and retention of executives who exhibit the highest standards of integrity as well as competence. (i) the integrity and quality of CN’s financial statements and other financial information and the appropriateness of their disclosure; the review of the Audit Committee on external auditors’ independence and qualifications; the performance of CN’s internal audit function and of CN’s external auditors; CN’s compliance with applicable legal and regulatory requirements (including those related to environment, safety and security); (ii) (iii) • (iv) • • ensuring that an appropriate risk assessment process is in place to identify, assess and manage the principal risks of CN’s business and financial strategy; and adopting communications and disclosure policies and monitoring CN’s investor relations programs. C. Monitoring Corporate Governance Issues and Board Renewal • • monitoring the size and composition of the Board to favour effective decision-making; taking all reasonable measures to satisfy itself as to the integrity of management and that management creates a culture of integrity throughout CN; monitoring and reviewing, as appropriate, CN’s approach to governance issues and monitoring and reviewing, as appropriate, CN’s Corporate Governance Manual and policies and measures for receiving shareholder feedback; taking all reasonable steps to ensure the highest quality of ethical standards, including reviewing, on a regular basis, the Code of Business Conduct applicable to CN’s directors, its President and CEO, senior financial officers, other executives and employees, monitoring compliance with such code, approving any waiver from compliance with the code for directors and executive officers and ensuring appropriate disclosure of any such waiver; ensuring the regular performance assessment of the Board, Board committees, Board and committee chairs and individual directors and determining their remuneration; approving the list of Board nominees for election by shareholders and filling Board vacancies; adopting and reviewing orientation and continuing education programs for directors; E. Monitoring Pension Fund Matters • monitoring and reviewing, as appropriate, CN’s pension fund policies and practices, including the investment policies of the Canadian National Railway Pension Trust Funds or any other pension trust fund established in connection with a new pension plan or any other pension plan offered or administered by CN (the “CN’s Pension Trust Funds”); and approving the annual budget of the Investment Division of CN’s Pension Trust Funds. Monitoring Environmental, Safety and Security Matters monitoring and reviewing, as appropriate, CN’s environmental, safety and security policies and practices. • • • • F. • The non-executive Board members meet before or after every Board meeting without the presence of management and under the chairmanship of the Board Chair. If such group includes directors who are not independent, an executive session including only independent directors is held regularly. Board members are expected to demonstrate a high level of professionalism in discharging their responsibilities. They are expected to attend the meetings of the Board and of the Board committees on which they sit and to rigorously prepare for and actively participate in such meetings. They should review all meeting materials in advance. They are also expected to be available to provide advice and counsel to the President and CEO or other corporate officers of CN upon request. The Board annually reviews the adequacy of its mandate. • • • 68 CN MANAGEMENT INFORMATION CIRCULAR 2020 SCHEDULE A

Schedule B | Reports of the Committees The following are reports of each Board committee for the year 2019 and up to March 10, 2020. These reports provide details on the activities of each committee but are not meant to be exhaustive. The Charter of each Committee is available in our Corporate Governance Manual available on our website at www.cn.ca. Report of the Audit Committee The role of the Audit Committee is to assist the Board in fulfilling its oversight responsibilities with respect to the Company’s financial reporting, monitoring risk management, internal controls and internal and external auditors. CURRENT MEMBERS D.J. Carty (Chair), E.E. Holiday, V.M. Kempston Darkes, K.G. Lynch, J.E. O’Connor, L. Stein Highlights The Audit Committee, in accordance with its mandate: Financial Information Internal Auditors • oversaw the Company’s cybersecurity program for Operations and Information Technologies. • reviewed and approved annual and quarterly results, Management’s Discussion and Analysis and the earnings press releases of the Company; reviewed the independent auditors’ reports of the external auditors on the consolidated financial statements and the internal controls over financial reporting of the Company, and on the financial statements of CN’s Pension Trust Funds; reviewed financial information contained in the Annual Information Form, the Form 40-F and other reports requiring Board approval; reviewed and approved the Audit Committee Report and other information appearing in the Management Information Circular; reviewed analysis and communications materials prepared by management, the internal auditors or external auditors setting forth any significant financial reporting issues; reviewed the compliance of management’s certification of financial reports with applicable legislation; reviewed, with the external auditors and management, the quality, appropriateness and disclosure of the Company’s critical accounting principles and policies, underlying assumptions and reporting practices, and any proposed changes thereto; reviewed judgments made in connection with the preparation of the financial statements, if any, including analyses of the effect of alternative generally accepted accounting principles and/ or methods; reviewed with external auditors and management, changes in accounting for CN’s pension plans and other postretirement benefits; and held in camera meetings with certain members of management. • reviewed and approved the internal audit plan and Internal Audit Charter; monitored the internal audit function’s performance, its responsibilities, staffing, budget and the compensation of its members; and held in camera meetings with the Chief, Internal Audit. • Internal Control • received management’s report assessing the adequacy and effectiveness of the Company’s disclosure controls and procedures and systems of internal control; reviewed procedures established for the receipt, retention and treatment of complaints received by the Company regarding accounting, internal accounting controls or auditing matters or employee concerns regarding accounting or auditing matters; and reviewed minutes of the Corporate Disclosure Committee meetings. • • • External Auditors • reviewed and approved the results of the external audit; recommended to the Board the appointment and terms of engagement of the Company’s external auditors; evaluated, remunerated and monitored the qualifications, performance and independence of the external auditors; discussed, approved and oversaw the disclosure of all audit, review and attest services provided by the external auditors; determined which non-audit services the external auditors are prohibited from providing, and pre-approved and oversaw the disclosure of permitted non-audit services by the external auditors to the Company, in accordance with applicable laws and regulations; reviewed the formal statement from the external auditors confirming their independence and reviewed hiring policies for employees or former employees of the Company’s external auditors; and held in camera meetings with external auditors. • • • • • Committee Performance • • • reviewed the processes in place to evaluate the performance of the Audit Committee; and reviewed and approved a forward-looking agenda for the Committee. • • • Other • made recommendations to the Board with respect to the declaration of dividends; reviewed progress report on the implementation of Positive Train Control (PTC), the safety technology mandated by the U.S. Congress; monitored the tax affairs of the Company; and reviewed, on a quarterly basis, expense reports of the Chair of the Board and the President’s Office. • • • • • • • Risk Management • reviewed the Company’s risk assessment and risk management policies including information technology risk management, and Business Interruption management; assisted the Board with the oversight of the Company’s compliance with applicable legal and regulatory requirements; and Submitted by the members of the Audit Committee. • • • 69 CN MANAGEMENT INFORMATION CIRCULAR 2020 SCHEDULE B

Report of the Finance Committee The role of the Finance Committee is to assist the Board in fulfilling its oversight responsibilities with respect to the monitoring and oversight of the Company’s financial policies and strategy and authorizing, approving and recommending certain financial activities. CURRENT MEMBERS R.L. Phillips (Chair), S. Bruder, J. Godin, E.E. Holiday, V.M. Kempston Darkes, J.E. O’Connor, L. Stein Highlights The Finance Committee, in accordance with its mandate: Financial Policies and Strategy Financing Financial Activities • provided oversight with respect to CN’s capital structure, cash flows and key financial ratios; made recommendations to the Board with respect to the Company’s financial policies and practices and financial matters affecting the Company including the Company’s Capital Allocation Strategy and Capital Budget; reviewed and made recommendations to the Board with respect to the Company’s Standing Resolutions on Delegation of Authority; reviewed CN’s strategy regarding distributions to shareholders, including strategy with respect to dividends and share repurchases; reviewed policies regarding financial risk management, short-term investment and credit; and reviewed the Company’s credit ratings and monitored the Company’s activities with respect to credit rating agencies. • reviewed the Company’s liquidity position, including the Company’s capital expenditures, capital structure, financing plan and short-term investments; reviewed and recommended the increase and extension of CN’s credit facilities; reviewed and recommended the increase of the Company’s commercial paper program; approved a shelf prospectus for the issuance of an aggregate principal amount of C$6 billion of debt securities; and approved public debt offerings of C$350 million 3.00% Notes due 2029, C$450 million 3.60% Notes due 2049 and C$450 million 3.05% Notes due 2050. • recommended decisions related to indebtedness of the Company, as well as loans, guarantees or extension of credit; reviewed Treasury and transactional activities; recommended decisions related to derivative financial instruments; reviewed and recommended new share repurchase programs and related progress reports; reviewed and recommended the acquisition of the Massena Line and the Quebec City Terminal Partnership with Hutchison Ports; reviewed and recommended Procurement and Supply Management three-year plan reviewed, recommended and monitored significant capital and other expenditures for strategic projects, equipment and rail infrastructure, as well as material purchases of products and services; and oversaw internal auditors reports on post-completion audits of selected capital projects approved by the Board. • • • • • • • • • • • • • • • • Committee Performance • reviewed the processes in place to evaluate the performance of the Finance Committee; assessed the adequacy of the Finance Committee’s Charter and made a report thereon to the Board; and reviewed and approved a forward-looking agenda for the Committee. • • Other • reviewed a CN investor perception survey. Submitted by the members of the Finance Committee. 70 CN MANAGEMENT INFORMATION CIRCULAR 2020 SCHEDULE B
Report of the Corporate Governance and Nominating Committee The role of the Corporate Governance and Nominating Committee is to assist the Board in fulfilling its oversight responsibilities with respect to corporate governance matters which include developing, reviewing and monitoring criteria for selecting directors and reviewing the corporate governance guidelines applicable to the Company. CURRENT MEMBERS D. Losier (Chair), G.D. Giffin, J. Godin, V. M. Kempston Darkes, K.G. Lynch, R. Pace, R.L. Phillips Highlights The Corporate Governance and Nominating Committee, in accordance with its mandate: Composition of the Board and its Committees Director Compensation Committee Performance • reviewed the compensation of non-executive Board members. • reviewed the processes in place to evaluate the performance of the Corporate Governance and Nominating Committee; and reviewed and approved a forward-looking agenda for the Committee. • reviewed the size and composition of the Board and assisted the Board in determining Board Committee size, composition and mandate; reviewed directors’ independence and financial literacy; reviewed criteria for selecting directors and assessed the competencies and skills of the Board members in relation to the Company’s circumstances and needs; identified candidates qualified to become Board members for evergreen list, and recommended director nominees for the next annual meeting of shareholders; and reviewed director succession and board renewal and evergreen list. Continuing Education for Directors • monitored and reviewed the Company’s orientation and continuing education programs for directors. • • Corporate Governance Initiatives • Submitted by the members of the Corporate Governance and Nominating Committee. • reviewed and recommended changes to the Company’s corporate governance guidelines and monitored disclosure of such guidelines in accordance with applicable rules and regulations; monitored developments, proposed rule changes and amendments to securities laws, disclosure and other regulatory requirements; assisted the Board with the oversight of the Company’s corporate governance and monitored legal and regulatory requirements, as well as best practices; reviewed the Company’s Corporate Governance Manual; reviewed, monitored and oversaw compliance with CN’s Code of Business Conduct; reviewed the annual report of CN’s Ombudsman; reviewed adherence to the Company’s Aircraft Utilization Policy; reviewed the Company’s corporate disclosure, including the Management Information Circular, the Annual Information Form, and the Annual Report; recommended to the Board a date and location for the annual meeting of shareholders; and monitored the Investor Relations Program and reviewed feedback from shareholders and shareholder associations. • • • • Performance of the Board and its Committees • reviewed the performance of the Board, Board Committees, Board and Committee Chairs and Board members, including reviewing the Board, Committee, and Chair evaluation process and the development of Management Information Circular questionnaires. • • • • • • • 71 CN MANAGEMENT INFORMATION CIRCULAR 2020 SCHEDULE B

Report of the Human Resources and Compensation Committee The role of the Human Resources and Compensation Committee is to assist the Board in fulfilling its oversight responsibility of monitoring executive management’s performance assessment, compensation, succession planning and human resources practices. CURRENT MEMBERS K.G. Lynch (Chair), S. Bruder, D.J. Carty, J. Godin, R.L. Phillips, L. Stein Highlights The Human Resources and Compensation Committee, in accordance with its mandate: Succession Planning Executive Compensation Pension Plans • refined critical role success criteria aligned to the identified key value drivers; assessed talent strengths and gaps against critical roles with a focus on optimal fit to ensure the greatest impact on CN’s strategic plan; analyzed succession pipeline to mitigate risk and bring greater emphasis on diverse talent, including in-depth functional talent reviews; reviewed leadership teams and functional organizational structures to ensure strong incumbent fit, including supplementing talent and skills with external hires; increased data driven decision-making through dashboards and scorecards, creating leadership accountability and tracking progress; and identified how best to monitor performance and create key indicators to assess and measure delivery against value allocation. • reviewed the validity of the Company’s benchmark group used in determining the compensation of executives; reviewed the evaluation of executive management’s performance and recommended to the Board executive management’s compensation; examined and reviewed elements of executive compensation and reported on compensation practices; monitored any potential risks that could arise from CN’s compensation programs and practices, while ensuring proper risk identification and mitigation practices were in place; reviewed performance of NEOs and the Company’s annual performance as measured under the AIBP; closely monitored bonus outlook, as well as PSU vesting outlook; reviewed and recommended proposed bonus targets and performance targets related to PSUs; and reviewed and recommended changes to the AIBP and LTI plans. • reviewed and recommended to the Board actuarial valuations and funding of CN’s pension plans; and reviewed and recommended pension plan amendments. • • • Human Resources Initiatives • • closely monitored the labour negotiation process; monitored pension and strategic labour and social issues; reviewed and discussed strategies for hiring, training, engaging, and developing talent; and reviewed and discussed strategies for workforce planning. • • • • • • • • Committee Performance • reviewed the processes in place to evaluate the performance of the Human Resources and Compensation Committee; reviewed and approved a forward-looking agenda for the Committee; and retained the service of independent compensation advisors to help it carry out its responsibilities and approved • • • • President and CEO Compensation • reviewed corporate goals and objectives relevant to the President and CEO, evaluated his mid-year and annual performance based on those goals and objectives and recommended compensation based on this evaluation, for approval by the Independent Board members; and • developed performance objectives in conjunction with the President and CEO. Appointment of Executive Management • recommended the appointment of executive management and approved the terms and conditions of their appointment and termination or retirement; and • launched a search process for the position of Executive Vice-President and Chief Operating Officer (“COO”) and Senior Vice-President and Chief Human Resources Officer (“CHRO”), and appointed a COO and a CHRO. • • Executive Compensation Disclosure appropriate fees for such services. • produced for review and approval by the Board a report on executive compensation for inclusion in the Management Information Circular. Submitted by the members of the Human Resources and Compensation Committee. Compensation Philosophy • monitored the compensation philosophy and policy that rewards the creation of shareholder value and reflects the appropriate balance between the short-and longer-term performance of the Company; and monitored the Company policy relating to the positioning of total direct compensation for executives. • 72 CN MANAGEMENT INFORMATION CIRCULAR 2020 SCHEDULE B

Report of the Environment, Safety and Security Committee The role of the Environment, Safety and Security Committee is to assist the Board in fulfilling its oversight responsibilities with respect to environmental matters, safety and security of the Company’s operations which include overseeing environmental, safety and security policies, practices and procedures, audits and assessments of compliance. CURRENT MEMBERS L. Stein (Chair), S. Bruder, D.J. Carty, G.D. Giffin, J.E. O’Connor, R. Pace, R.L. Phillips Highlights The Environment, Safety and Security Committee, in accordance with its mandate: Environmental, Health and Safety Audits Accounting Accrual Other • oversaw the development and implementation of environmental, safety and security policies, procedures and guidelines; reviewed environmental, health and safety audits and assessments of compliance, taking reasonable steps to ensure that the Company is exercising due diligence; oversaw the review of the Company’s safety performance and related management action plans and ensured safety initiatives are fully aligned with and reinforce CN’s safety culture and its goal of being the safest Class I railroad in North America; reviewed the Company’s business plan to ascertain that environmental, safety and security issues are taken into consideration; ensured appropriate employee training standards and communications are developed and implemented; and reviewed all significant safety and security matters. • monitored accounting accrual for environmental costs in conjunction with the Audit Committee. • reviewed Canadian and U.S. environmental and safety, legal and regulatory developments of importance to the Company; and monitored results from various security initiatives and use of technology in risk mitigation. Environmental Investigations and Judgments • • • reviewed reports in respect of all significant notices, complaints, investigations and proceedings by governmental authorities, and all significant judgments and orders in respect of environmental, safety and security matters. Committee Performance • • reviewed the processes in place to evaluate the performance of the Environment, Safety and Security Committee. Submitted by the members of the Environment, Safety and Security Committee. • • • Report of the Strategic Planning Committee The role of the Strategic Planning Committee is to assist the Board in fulfilling its oversight responsibilities with respect to financial and strategic issues, including the review of the key assumptions, as well as the economic, business, regulatory and competitive conditions underlying the Company’s business plan. CURRENT MEMBERS J.E. O’Connor (Chair), S. Bruder, D.J. Carty, G.D. Giffin, J. Godin, E.E. Holiday, V.M. Kempston Darkes, D. Losier, K.G. Lynch, R. Pace, R.L. Phillips, J.J. Ruest, L. Stein Highlights The Strategic Planning Committee, in accordance with its mandate: Strategic Direction Committee Performance • focused on strategic and financial issues, including the review of key assumptions and external impacts underlying the business plan; reviewed and approved the Company’s strategic direction; reviewed and approved the Company’s business plan and capital budget; and obtained regular briefings and presentations on strategic issues. • reviewed the processes in place to evaluate the performance of the Strategic Planning Committee. Submitted by the members of the Strategic Planning Committee. • • • 73 CN MANAGEMENT INFORMATION CIRCULAR 2020 SCHEDULE B

Report of the Pension and Investment Committee The role of the Pension and Investment Committee is to review pension-related matters broadly, including, reviewing the activities of CNID, reviewing and approving CNID Incentive Plan and award payouts thereunder, advising CNID on investment of assets of CN’s Pension Trust Funds, approving certain of the investments made by CN’s Pension Trust Funds, and being informed of all matters related to pension liabilities or that are otherwise relevant in developing CN’s pension risk management strategy and pension plan design. The Pension and Investment Committee is a mixed committee composed of members of the Board of Directors as well as officers of the Company (not shown here). CURRENT MEMBERS E.E. Holiday (Chair), D.J. Carty, G.D. Giffin, J. Godin, V.M. Kempston Darkes, D. Losier, K.G. Lynch Highlights The Pension and Investment Committee, in accordance with its mandate: • reviewed the activities of CNID and advised CNID on investment of assets of CN’s Pension Trust Funds in accordance with applicable policies and procedures; reviewed and approved the Statements of Investment Policies and Procedures for CN’s pension plans; reviewed and approved the Investment Strategy of CNID; reviewed and approved CNID Incentive Plans and any award payouts thereunder; reviewed and approved the annual budget of CNID; • in conjunction with the President and Chief Executive Officer of CN, oversaw and determined the hiring, compensation, performance assessment, leadership development and succession planning of CNID executives, including the President and CEO of CNID, subject to the approval of the Human Resources & Compensation Committee and the Board; approved the overall pension risk management strategy and reporting thereon to the Board; oversaw implementation of the overall pension risk management strategy by the Pension Advisory Working Committee and CNID; reviewed and recommended, jointly with the Audit Committee, to the Board the financial statements of the CN Pension Trust Funds; • reviewed management’s assessment of the effectiveness of internal controls relating to CN’s pension plans and the CN Pension Trust Funds; reviewed and approved the governance structure of the management Pension Advisory Working Committee; and appointed members of the management Pension Advisory Working Committee and its Chair. • • • • • • Committee Performance • reviewed the processes in place to evaluate the performance of the Pension and Investment Committee. • • Submitted by the members of the Pension and Investment Committee. • Report of the Donations and Sponsorships Committee The role of the Donations and Sponsorships Committee is to assist the Board in fulfilling its oversight responsibilities with respect to developing a donations and sponsorships strategy and reviewing/approving donation and sponsorship requests. The Donations and Sponsorships Committee is a mixed committee composed of members of the Board of Directors as well as officers of the Company (not all shown here). CURRENT MEMBERS R. Pace (Chair), S. Bruder, D. Losier, J.E. O’Connor, J.J. Ruest Highlights The Donations and Sponsorships Committee, in accordance with its mandate: Donations and Sponsorship Strategy Donations and Sponsorship Requests Committee Performance • reviewed and approved the general donations and sponsorships strategy and goals of the Company; reviewed and approved the budget for donations and sponsorships; and reviewed the Railroaders in the Community Program. • reviewed donation requests and approved selected donations by the Company, including those having a total cost of more than $100,000; reviewed and approved sponsorships and recommended to the Board for approval sponsorships by the Company having a total cost of more than $500,000; and reviewed reports from the Vice-President, Public and Government Affairs concerning sponsorships having a total cost of more than $100,000 and donations of more than $50,000 and on other matters. • reviewed committee mandate and processes in place to evaluate the performance of the Donations and Sponsorships Committee. • • Submitted by the members of the Donations and Sponsorships Committee. • • 74 CN MANAGEMENT INFORMATION CIRCULAR 2020 SCHEDULE B

Schedule C | Additional Audit Committee Disclosure National Instrument 52-110 — Audit Committees of the CSA requires issuers to include the charter of their audit committee and disclose information with respect to the composition, education and experience of the members of their audit committees, as well as all fees paid to external auditors in their annual information form. We comply with the requirements regarding composition and responsibilities, as summarized hereinafter, and we refer to our Annual Information Form — section “9.2 Audit Committee Disclosure” and “Schedule A” — available on SEDAR at www.sedar.com and on our website at www.cn.ca, under Investors for a description of the education and relevant experience of the Audit Committee members and with regards to the charter of our Audit Committee. Composition of the Audit Committee The Audit Committee is composed of six independent directors, namely, Donald J. Carty, Chair of the Committee, Edith E. Holiday, V. Maureen Kempston Darkes, Kevin Lynch, James E. O’Connor and Laura Stein. No member of the Audit Committee receives, other than in his or her capacity as a director or member of a Board committee, directly or indirectly, any fee from the Company or any subsidiary of the Company, nor is an affiliated person of the Company, or any subsidiary of the Company. Mandate of the Audit Committee As further described below, the Audit Committee’s responsibilities can be divided into four categories: or employee concerns regarding accounting or auditing matters, while ensuring confidentiality and anonymity. CN has adopted such procedures. Please refer to the Corporate Governance section of our website at www.cn.ca, under Delivering Responsibly/Governance for more details on these procedures. Monitoring Internal Auditors The Audit Committee is responsible for ensuring that the Chief, Internal Audit reports directly to the Audit Committee, and for regularly monitoring the internal audit function’s performance, its responsibilities, staffing, budget and the compensation of its members. It further annually reviews the internal audit plan and ensures that the internal auditors are accountable to the Audit Committee. Monitoring External Auditors The mandate of the Audit Committee states that the Audit Committee is responsible for recommending the retention and, if appropriate, the removal of external auditors, evaluating and remunerating them, and monitoring their qualifications, performance and independence. The Audit Committee is also in charge of approving and overseeing the disclosure of all audit, review and attestation services provided by the external auditors, determining which non-audit services the external auditors are prohibited from providing, and pre-approving and overseeing the disclosure of permitted non-audit services by the external auditors. Regulations in the U.S. and Canada require that the lead engagement partner must change every five years in the U.S. and every seven years in Canada, followed by a five year absence from the audit. At CN, lead engagement partner rotation occurs at least every five years. The Audit Committee is responsible for overseeing the external auditors and discussing with them the quality and not just the acceptability of the Company’s accounting principles, including any material written communications between the Company and the external auditors (including disagreements, if any, with management and the resolution thereof). The Audit Committee also reviews at least annually, the formal written statement from the external auditors stating all relationships the external auditors have with CN and confirming their independence. The mandate of the Audit Committee also provides that the Audit Committee is responsible for reviewing hiring policies for employees or former employees of the Company’s firm of external auditors. The Audit Committee assesses the auditor’s experience and knowledge of the Company’s operations and industry, audit quality and performance, and audit fees, including the results of industry benchmarking. The Audit Committee also considers the results of auditor reviews performed by auditing oversight bodies, including public reports issued by such bodies following their inspections of the firm, as well as other information such as comment letters received periodically from the securities commissions. • • • • overseeing financial reporting; monitoring risk management and internal controls; monitoring internal auditors; and monitoring external auditors. Overseeing Financial Reporting The mandate of the Audit Committee provides that the Audit Committee is responsible for reviewing, with management and the external auditors, the annual and quarterly financial statements of the Company and accompanying information, including the Company’s Management’s Discussion and Analysis disclosure and earnings press releases, prior to their release, filing and distribution. The mandate also provides that the Audit Committee should review the procedures in place for the review of the Company’s disclosure of financial information extracted or derived from the Company’s financial statements and periodically assess the adequacy of those procedures. The Audit Committee is also responsible for reviewing the financial information contained in the Annual Information Form and other reports or documents, financial or otherwise, requiring Board approval. Furthermore, the Audit Committee is in charge of reviewing the results of the external audit, any significant problems encountered in performing the audit, and management’s response and/or action plan related to any issue identified by the external auditors and any significant recommendations relating thereto. Monitoring Risk Management and Internal Controls The Audit Committee is responsible for periodically receiving management’s report assessing the adequacy and effectiveness of CN’s disclosure controls and procedures and systems of internal control. The mandate of the Audit Committee also provides that the Audit Committee must review CN’s risk assessment and risk management policies. The Audit Committee is also responsible for assisting the Board with the oversight of CN’s compliance with applicable legal and regulatory requirements. Additionally, the mandate of the Audit Committee provides that the Audit Committee must establish procedures for the receipt, retention and treatment of complaints received by the Company regarding accounting, internal accounting controls or auditing matters, 75 CN MANAGEMENT INFORMATION CIRCULAR 2020 SCHEDULE C

Furthermore, the mandate of the Audit Committee states that the Audit Committee may retain independent advisors to help it carry out its responsibilities, including fixing such advisors’ fees and retention terms, subject to advising the Board Chair. The Committee makes arrangements for the appropriate funding for payment of the external auditors and any advisors retained by it. Pursuant to its charter, the Audit Committee also has direct communication channels with the internal and external auditors to discuss and review specific issues as appropriate. The internal and external auditors must meet separately with the Audit Committee, without management, twice a year, and more frequently as required. The Audit Committee met five (5) times in 2019 and held in camera sessions at each meeting. The report of the Audit Committee, set forth in Schedule B of this Information Circular, outlines the major subject areas reviewed by the Committee during the year, in compliance with its mandate. Non-Audit Services The mandate of the Audit Committee provides that the Audit Committee determines which non-audit services the external auditors are prohibited from providing, approves audit services and pre-approves permitted non-audit services to be provided by the external auditors. CN’s Audit Committee and the Board of Directors have adopted resolutions prohibiting the Company from engaging KPMG LLP to provide certain non-audit services to the Company and its subsidiaries, including bookkeeping or other services related to the accounting records or financial statements, financial information systems design and implementation, appraisal or valuation services, fairness opinions, contribution in-kind reports, actuarial services, internal audit outsourcing services, management functions or human resources functions, broker or dealer, investment advisor, or investment banking The external auditors are prohibited from providing certain non-audit services. services and legal services and expert services unrelated to the audit. Pursuant to such resolutions, the Company may engage KPMG LLP to provide non-audit services, including tax services, other than the prohibited services listed above, but only if the services have specifically been pre-approved by the Audit Committee. Audit Committee Report Regarding Internal Control Over Financial Reporting The Audit Committee periodically received management’s report assessing the adequacy and effectiveness of our disclosure controls and procedures and systems of internal control in respect of the 2019 fiscal year. The Company’s external auditors, KPMG LLP, are responsible for performing an independent audit of our consolidated financial statements in accordance with Canadian generally accepted auditing standards and the standards of the Public Company Accounting Oversight Board (“PCAOB”) in the U.S., and an independent audit of the effectiveness of internal controls over financial reporting, in accordance with the standards of the PCAOB. These audits serve as a basis for KPMG LLP’s opinions addressing whether the consolidated financial statements fairly present our financial position, results of operations, and cash flows in conformity with U.S. Generally Accepted Accounting Principles (“GAAP”). The Audit Committee has discussed with KPMG LLP the matters required to be discussed by the PCAOB Auditing Standards No. 16 (Communication With Audit Committees) and Chartered Professional Accountants of Canada (“CPA”) Handbook — Assurance Section 260 (Communications With Those Charged With Governance) including matters relating to the conduct of the audit of our financial statements and the assessment of the effectiveness of our internal control over financial reporting under section 404 of the Sarbanes-Oxley Act. KPMG LLP provided the Committee with written disclosures and the letter required by Rule 3526 of the PCAOB. The Audit Committee has discussed with KPMG LLP the firm’s independence from the Company. A formal written statement describing all relationships between KPMG LLP and the Company was remitted to the Audit Committee and it includes a written confirmation that KPMG LLP are independent within the meaning of the relevant rules and related interpretations prescribed by the relevant professional bodies in Canada and any applicable legislation or regulation and are independent public accountants with respect to the Company within the meaning of all relevant U.S. professional and regulatory standards, including the independence rules adopted by the SEC pursuant to the Sarbanes-Oxley Act, and Rule 3520 of the PCAOB. Based on this review and these discussions, the Audit Committee recommended to the Board that the Company’s audited consolidated financial statements be filed with Canadian securities regulators and be included in the Company’s annual report on Form 40-F for the year ended December 31, 2019 filed with the SEC. Education and Relevant Experience of the Audit Committee Members The Board of Directors believes that the composition of the Audit Committee reflects a high level of financial literacy and experience. As required in the charter of the Audit Committee, all members of the Audit Committee are financially literate, as such term is defined under Canadian securities laws and In determining if a director is an “audit committee financial expert”, the Board considers if the director is a person who has: (a) an understanding of generally accepted accounting principles and financial statements; (b) the ability to assess the general application of such accounting principles in connection with the accounting for estimates, accruals and reserves; (c) experience preparing, auditing, analyzing or evaluating financial statements that present a breadth and level of complexity of accounting issues that are generally comparable to the breadth and complexity of issues that can reasonably be expected to be raised by the Company’s financial statements, or experience actively supervising one or more persons engaged in such activities; (d) an understanding of internal controls and procedures for financial reporting; and (e) an understanding of audit committee functions. regulations and the NYSE Standards, and several members of the Committee meet all criteria to be designated as “audit committee financial exper t” under the rules of the SEC. The Board has made such determination based on the education and experience of each Committee member. All members of the Audit Committee are financially literate and several members are audit committee financial experts. 76 CN MANAGEMENT INFORMATION CIRCULAR 2020 SCHEDULE C
The Forest Stewardship Council® (FSC®) is an international certification and labelling system for products that come from responsibly managed forests, and verified recycled sources. Under FSC certification, forests are certified against a set of strict environmental and social standards, and fibre from certified forests is tracked all the way to the consumer through the chain of custody-certification system. CN shows its concern for protecting the environment through the use of certified paper.

cn.ca PRINTED IN CANADA

PROXY FORM ANNUAL MEETING CANADIAN NATIONAL RAILWAY COMPANY WHEN: TUESDAY, APRIL 28, 2020, AT 10:00 A.M. EDT WHERE: WWW.VIRTUALSHAREHOLDERMEETING.COM/CNI2020 CANADIAN NATIONAL RAILWAY COMPANY C/O BROADRIDGE 2601 - 14TH AVENUE MARKHAM, ON L3R 0H9 CANADA JOHN A. 123 ANY ANYCITY SAMPLE STREET PR A1A 1A1 XXXXXXXXXXXXXXXXXXXXXXXXXXXXXXXXXXXX XXXXXXXXXXXXXXXXXXXXXXXXXXXXXXXXXXXX XXXXXXXXXXXXXXXXXXXXXXXXXXXXXXXXXXXX IF YOU VOTE BY MAIL WE NEED TO RECEIVE YOUR VOTING INSTRUCTIONS AT LEAST ONE BUSINESS DAY BEFORE THE PROXY DEPOSIT DATE. CONTROL NO.: PROXY DEPOSIT DATE: APRIL 27, 2020 INSTRUCTIONS: 1. This proxy, solicited by Management, for the annual meeting (the “Meeting”) of the holders (“Shareholders”) of common shares of Canadian National Railway Company. 2. You have the right to appoint a different person or corporation (with appropriate documentation) of your choice, who need not be a Shareholder, to attend and act on your behalf at the Meeting of Canadian National Railway Company. If you wish to appoint a person other than the persons whose names are printed herein, please insert the name of your chosen proxyholder (exact name) and create and provide a unique APPOINTEE IDENTIFICATION NUMBER for your Appointee to access the live webcast meeting in the space provided (see reverse). The Shares represented by this form of proxy may be voted at the discretion of the proxyholder with respect to amendments or variations to the matters identified in the notice of meeting and with respect to other matters that may properly be brought before the meeting. You MUST provide your Appointee the EXACT NAME and EIGHT CHARACTER APPOINTEE IDENTIFICATION NUMBER you created to access the Meeting. Appointees can only be validated at the live webcast meeting using the EXACT NAME and EIGHT CHARACTER APPOINTEE IDENTIFICATION NUMBER you created. IF YOU DO NOT CREATE AN EIGHT CHARACTER APPOINTEE IDENTIFICATION NUMBER, YOUR APPOINTEE WILL NOT BE ABLE TO ACCESS THE LIVE WEBCAST MEETING. This instrument of proxy will not be valid and not be acted upon or voted unless it is completed as outlined herein and delivered to the attention of Proxy Tabulation, P.O. Box 3700, STN Industrial Park, Markham, ON, L3R 9Z9, Canada, by 5:00 p.m. (Eastern Daylight Time), on Monday, April 27, 2020. 3. If the Shares are registered in the name of more than one owner (for example, joint ownership, trustees, executors, etc.), then all those registered should sign this form of proxy. If you are voting on behalf of a corporation or another individual, documentation evidencing your power to sign this form of proxy with signing capacity stated may be required. 4. In order to expedite your vote, you may use a touch-tone telephone or the Internet. To vote by telephone, call toll free 1-800-474-7493 (English) or 1-800-474-7501 (French). You will be prompted to provide your control number located above. The telephone or Internet voting service is not available on the day of the meeting and the telephone system cannot be used if you designate another person to attend on your behalf. To vote via the Internet, go to www.proxyvote.com and follow the instructions. 5. IF YOU VOTE BY TELEPHONE OR THE INTERNET, DO NOT MAIL BACK THIS INSTRUMENT OF PROXY. 6. The form of proxy should be signed in the exact manner as the name appears on the form of proxy. 7. If the form of proxy is not dated, it will be deemed to bear the date on which it was mailed to the Shareholder. 8. Proxy will be voted as directed. If no voting preferences are indicated on the reverse, this form of proxy will be voted as recommended by the Board of Directors. PLEASE SEE OVER 1 OF 2 S91970-81 010 E: C S:3 E:2 1/1 M A:A V: 1 STEP 1 REVIEW YOUR VOTING OPTIONS ONLINE: VOTE AT PROXYVOTE.COM USING YOUR COMPUTER BY TELEPHONE: YOU MAY ENTER YOUR VOTING INSTRUCTIONS BY TELEPHONE OR MOBILE DATA DEVICE. YOUR CONTROL NUMBER ISAT: ENGLISH: 1-800-474-7493 OR FRENCH: 1-800-474-7501 LOCATED BELOW.BY MAIL: THIS PROXY FORM MAY BE RETURNED BY MAIL IN THE ENVELOPE PROVIDED. BY FACSIMILE: 905-507-7793 OR 514-281-8911 SCAN TO VIEW MATERIAL AND VOTE NOW REMINDER: PLEASE REVIEW THE INFORMATION / PROXY CIRCULAR BEFORE VOTING. G-13122017

PROXY FORM CANADIAN NATIONAL RAILWAY COMPANY MEETING TYPE: MEETING DATE: RECORD DATE: PROXY DEPOSIT DATE: ACCOUNT NO: ANNUAL MEETING TUESDAY, APRIL 28, 2020, AT 10:00 A.M. EDT MARCH 6, 2020 * APRIL 27, 2020 CUID: CUSIP: CONTROL NO.: APPOINTEE(S): ROBERT PACE, OR FAILING HIM, JEAN-JACQUES RUEST Change Appointee If you wish to designate another person to attend, vote and act on your behalf at the meeting, or any adjournment or postponement thereof, other than the person(s) specified above, print the name of the other person attending the meeting in the space provided herein (exact name) and provide a unique APPOINTEE IDENTIFICATION NUMBER USING ALL BOXES for your Appointee to access the meeting. You may choose to direct how your Appointee shall vote on matters that may come before the meeting or any adjournment or postponement thereof. Unless you instruct otherwise your Appointee will have full authority to attend, vote, and otherwise act in respect of all matters that may come before the meeting or any adjournment or postponement thereof, even if these matters are not set out in the proxy form or the circular for the meeting. You MUST create and provide your Appointee the EXACT NAME and an EIGHT (8) CHARACTER APPOINTEE IDENTIFICATION NUMBER you created to access the Meeting. Appointees can only be validated at the live webcast Meeting using the EXACT NAME and EIGHT (8) CHARACTER APPOINTEE IDENTIFICATION NUMBER you enter below. CREATE AN EIGHT (8) CHARACTER IDENTIFICATION NUMBER FOR YOUR APPOINTEE PLEASE PRINT APPOINTEE NAME INSIDE THE BOX E-R6 MAXIMUM 22 CHARACTERS - PLEASE PRINT CLEARLY MUST BE EIGHT CHARACTERS IN LENGTH - PLEASE PRINT CLEARLY 01 ELECTION OF DIRECTORS: VOTING RECOMMENDATION: FOR ALL THE NOMINEES PROPOSED AS DIRECTORS (FILL IN ONLY ONE BOX “ “ PER NOMINEE IN BLACK OR BLUE INK) FOR WITHHOLD FOR WITHHOLD FOR WITHHOLD 01 SHAUNEEN BRUDER 07 THE HON. DENIS LOSIER 13 LAURA STEIN 02 DONALD J. CARTY 08 THE HON. KEVIN G. LYNCH 03 AMBASSADOR GORDON D. GIFFIN 09 JAMES E. O’CONNOR 04 JULIE GODIN 10 ROBERT PACE 05 EDITH E. HOLIDAY 11 ROBERT L. PHILLIPS 06 V. MAUREEN KEMPSTON DARKES 12 JEAN-JACQUES RUEST ITEM(S): VOTING RECOMMENDATIONS ARE INDICATED BY HIGHLIGHTED TEXT OVER THE BOXES (FILL IN ONLY ONE BOX “ ” PER ITEM IN BLACK OR BLUE INK) the name of your chosen proxyholder and provide a unique APPOINTEE IDENTIFICATION APPOINTEE IDENTIFICATION NUMBER to access the Meeting. Appointees can only be CHARACTER APPOINTEE IDENTIFICATION NUMBER you enter. 02 APPOINTMENT OF KPMG LLP AS AUDITORS. WITHHOLD 03 NON-BINDING ADVISORY RESOLUTION TO ACCEPT THE APPROACH TO EXECUTIVE COMPENSATION DISCLOSED IN THE MANAGEMENT FOR AGAINST INFORMATION CIRCULAR, THE FULL TEXT OF WHICH RESOLUTION IS SET OUT ON P. 9 OF THE MANAGEMENT INFORMATION CIRCULAR. *NOTE* You have the right to appoint a different person or corporation (with appropriate documentation) of your choice, who need not be a Shareholder, to attend and act on your behalf at the Annual Meeting of Shareholders of National Railway Company. If you wish to appoint a person other than the persons whose names are printed herein, please insert NUMBER for your Appointee to access the live webcast meeting in the space provided. The shares represented by this Proxy Form may be voted at the discretion of the proxyholder with respect to amendments or variations to the matters identified in the notice of meeting and with respect to other matters that may properly be brought before the meeting. You MUST provide your Appointee the EXACT NAME and EIGHT CHARACTER validated at the live webcast meeting using the EXACT NAME and EIGHT IF YOU DO NOT CREATE AN EIGHT CHARACTER APPOINTEE IDENTIFICATION NUMBER, YOUR APPOINTEE WILL NOT BE ABLE TO ACCESS THE LIVE WEBCAST MEETING. MDDYY STEP 4 THIS DOCUMENT MUST BE SIGNED AND DATED SIGNATURE(S) *INVALID IF NOT SIGNED* M FOR STEP 3 COMPLETE YOUR VOTING DIRECTIONS STEP 2 APPOINT A PROXY (OPTIONAL)
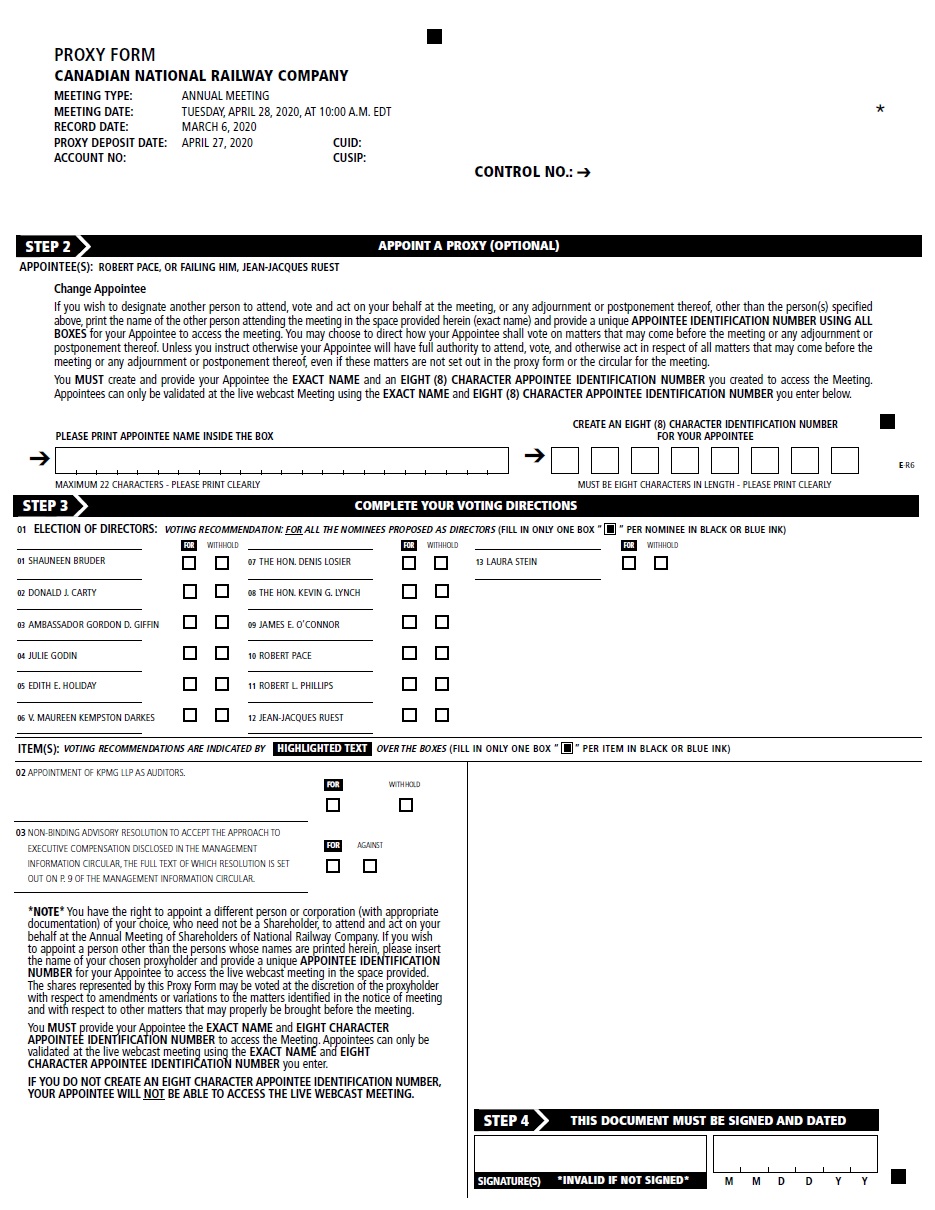
Except where otherwise indicated, all financial information reflected in this document is expressed in Canadian dollars and determined on the basis of United States generally accepted accounting principles (GAAP). Certain statements included in this annual report constitute “forward-looking statements” within the meaning of the United States Private Securities Litigation Reform Act of 1995 and under Canadian securities laws. By their nature, forward-looking statements involve risks, uncertainties and assumptions. The Company cautions that its assumptions may not materialize and that current economic conditions render such assumptions, although reasonable at the time they were made, subject to greater uncertainty. Forward-looking statements may be identified by the use of terminology such as “believes,” “expects,” “anticipates,” “assumes,” “outlook,” “plans,” “targets” or other similar words. Forward-looking statements are not guarantees of future performance and involve risks, uncertainties and other factors that may cause the actual results or performance of the Company to be materially different from the outlook or any future results or performance implied by such statements. Accordingly, readers are advised not to place undue reliance on forward-looking statements. Important risk factors that could affect the forward-looking statements include, but are not limited to, the effects of general economic and business conditions; industry competition; inflation, currency and interest rate fluctuations; changes in fuel prices; legislative and/or regulatory developments; compliance with environmental laws and regulations; actions by regulators; increases in maintenance and operating costs; security threats; reliance on technology and related cybersecurity risk; trade restrictions or other changes to international trade arrangements; transportation of hazardous materials; various events that could disrupt operations, including natural events such as severe weather, droughts, fires, floods and earthquakes; climate change; labour negotiations and disruptions; environmental claims; uncertainties of investigations, proceedings or other types of claims and litigation; risks and liabilities arising from derailments; timing and completion of capital programs; and other risks detailed from time to time in reports filed by CN with securities regulators in Canada and the United States. Reference should be made to “Management’s Discussion and Analysis” in CN’s annual and interim reports, Annual Information Form and Form 40-F, filed with Canadian and U.S. securities regulators and available on CN’s website (www.cn.ca), for a description of major risk factors. Forward-looking statements reflect information as of the date on which they are made. CN assumes no obligation to update or revise forward-looking statements to reflect future events, changes in circumstances, or changes in beliefs, unless required by applicable securities laws. In the event CN does update any forward-looking statement, no inference should be made that CN will make additional updates with respect to that statement, related matters, or any other forward-looking statement. As used herein, “Company” or “CN” refers to Canadian National Railway Company and, as the context requires, its wholly-owned subsidiaries.

TABLE OF CONTENTS Highlights Message from Robert Pace Message from JJ Ruest CN100 – A Moving Celebration Delivering Responsibly for a Sustainable Future Delivering Superior Service for Our Customers Growth through Operational Supply Chain Leadership Taking Precision Scheduled Railroading to New Heights Board of Directors Select Senior Officers of the Company Shareholder and Investor Information II I V V V III X XI V X VI I XX X XI I X X III X XI V F I NAN C I AL S E C T I O N Selected Railroad Statistics – unaudited Management’s Discussion and Analysis Management’s Report on Internal Control over Financial Reporting Report of Independent Registered Public Accounting Firm Consolidated Financial Statements Notes to the Consolidated Financial Statements 1 2 54 55 p h oto a b o v e b y : Tim Stevens, CN Lubricator Maintainer Hinton, AB c o v e r p h oto b y : Matthew Waller, CN Locomotive Engineer Jasper, AB 58 62 C N 20 1 9 AN N U AL R E P O R T I

Hay River Fort Nelson HIGHLIGHTS Reinvesting in the Company Prince Rupert Fort McMurray Prince George $ 3.9B Edmonton CAPITAL E XPENDITU RES Kamloops We completed a record capital expenditure program to increase capacity, particularly in our Western Region, supporting our ability to grow at low incremental cost. Calgary Vancouver Slower revenue growth $14.9B REVENUES 2019 revenues rose by $0.6 billion, or 4%, compared to 2018, which was less than expected due to slower economic growth. Stable earnings $5.83 $ 5.80 ADJ USTED DILUTED EPS1 DILUTED EPS While diluted earnings per share decreased 1% compared to 2018, adjusted diluted EPS1 increased 5%. Improved fuel efficiency 48K EMISSIONS SAVED TONS OF CARBON 2019 fuel efficiency (GTMs per US gallon of fuel consumed) improved 1%, saving approximately 48,000 tons of carbon emissions, and maintaining CN’s fuel efficiency leadership versus the average of Class I North American railways. 1 See the section entitled Adjusted performance measures in the MD&A for an explanation of this non-GAAP measure. II C N 20 1 9 AN N U AL R E P O R T

Sept-Îles Saskatoon Baie-Comeau Matane Hearst Winnipeg Moncton Regina Thunder Bay Quebec Halifax Saint John Montreal Sault Ste. Marie Duluth Stevens Point Chippewa Falls Minneapolis/St. Paul Green Toronto Sarnia Bay Buffalo Arcadia Fond du Lac Detroit Conneaut Sioux City Toledo Joliet East Peoria Pittsburgh Chicago Indianapolis Omaha Springfield East St. Louis Decatur Memphis CN main lines Secondary and feeder lines Shortline partners Ports served by CN Jackson Mobile Pascagoula Gulfport Baton Rouge New Orleans C N 20 1 9 AN N U AL R E P O R T III
MESSAGE FROM ROBERT PACE I feel honoured to serve as Chair of the Board of our magnificent Company, especially now during the 100th anniversary of its founding. Throughout this special year, I’ve had the opportunity to celebrate with thousands of people from coast to coast to coast. C EL EBR AT I N G 100 Y E A R S O F S E R V I C E One of the most notable CN100 events for me was participating in a citizenship ceremony for 11 new Canadians in my hometown of Halifax, NS. The special event took place aboard CN’s historic business car at Pier 1 in Halifax. I had the opportunity to speak to the new citizens about CN’s history and its connections to nation-building. CN was a big part of transporting over one million immigrants from Pier 21 in Halifax between 1925 and 1971. The ceremony was one of the most memorable events I’ve attended in my years with CN. Over the past 100 years, CN has become an iconic brand, synonymous with innovation and operational excellence. Our deep history of innovation includes CNR Radio, North America’s first radio network, which later became the Canadian Broadcasting Corporation. CN also founded Trans-Canada Airlines, which is now Air Canada, and built telecom infrastructure that is still in use today. Among CN’s many operational innovations, we were the first North American railroad to use diesel locomotives in mainline service and, many years later, we pioneered Precision Scheduled Railroading. Today, as we close off our CN100 celebrations, I am proud of our legacy and very encouraged by what the future holds. S T R I V I N G F O R T H E H I G H E S T S TA N D A R D S At CN, we believe an ethical business is a sustainable business. That’s why we strive to continuously improve our culture of integrity and ensure transparency in our communications. CN’s business practices continue to be recognized. In 2019, The Globe and Mail placed CN first in the industrials group and seventh overall among Canadian publicly traded companies for the quality of our governance practices. CN was also ranked as one of Corporate Knights’ 2020 Global 100 Most Sustainable Corporations in the World and CN received Best in Sector – Industrials honours in IR Magazine’s global ranking of investor relations excellence. CN has been listed on the Dow Jones Sustainability World Index for eight consecutive years. Additionally, we continue to be a member of the FTSE4Good Index, Global Challenges Index and Jantzi Social Index, among others. To benefit from a broader range of perspectives and experiences, CN is making strides to increase diversity within the Company and on the Board, where 38% of our directors are women. CN is the first transportation company in Canada to receive the Progressive Aboriginal Relations Bronze Level certification from the Canadian Council for Aboriginal Business. We were also selected as one of Canada’s Best Diversity Employers by The Globe and Mail. I’m proud of the Company’s performance in 2019 and I feel very optimistic as we move ONWARD, together. Sincerely, R E WA R D I N G OU R S H A R E H OL D E R S On behalf of CN’s Board of Directors, I would like to thank our shareholders and other stakeholders for their continued support. In 2019, CN returned $3.2 billion to shareholders in the form of dividends and share repurchases. I am pleased that CN’s dividend has increased on average by 16% every year since our IPO 25 years ago. CN has repurchased over $23 billion of shares through normal course issuer bids since 2000. As a result of another year of solid financial performance despite numerous challenges in 2019, the Board approved a 7% increase in our annual dividend for 2020, the 24th consecutive increase. Robert Pace, d.comm., c.m. Chair of the Board IV C N 20 1 9 AN N U AL R E P O R T

MESSAGE FROM JJ RUEST 2019 was a historic year for CN as we celebrated 100 years on the move. We’ve certainly come a long way in the past century thanks to the support of thousands of dedicated employees, customers, supply chain partners, shareholders and other stakeholders. D E MON S T R AT I N G OU R A B I LIT Y T O A D A P T 2019 was characterized by many challenges that hampered expected revenue growth. The early part of the year saw a prolonged period of very cold temperatures in key segments of our network. Near the end of the year, a strike by 3,200 conductors brought operations to a virtual standstill for nine days. However, the main reason for the slower revenue growth was a weakened economy throughout the second half of 2019. The combination of these factors led to lower overall volumes for the Company. Despite this, I’m proud of how we pulled together as ONE TEAM to remain an industry leader and stay competitive. This speaks to the character and strength of our remarkable team. Overall, compared to 2018, 2019 revenues were up $0.6 billion, or 4%, to a record $14.9 billion. Diluted earnings per share stood at $5.83 and adjusted diluted earnings per share1 increased 5% to $5.80. However, the number of revenue ton miles (RTMs) delivered by CN was down 3% due to the factors described above. C N ’ S C O M P E T IT I V E A D VA N TA G E S For many decades, our competitors were predominantly other railways and other modes of transportation. Today, we compete on a global stage as part of a complex and integrated supply chain working as one across a variety of logistics offerings to deliver our customers’ goods to their customers and end markets. Operating efficiently has long been one of the hallmarks of CN’s success. Today, our focus goes beyond running a railroad in the most efficient way possible. We work hard to understand our customers’ end-to-end supply chains, because we want to be a key factor in enabling their success. To be a supply chain leader requires sustained commitment to building strong working relationships with customers and supply chain partners such as ports, ocean carriers, trucking companies, terminal operators and others. Through partnerships, investments and a dedicated customer mindset, CN is focused on enabling growth. Moreover, we are driving innovation and deploying technologies that will take Precision Scheduled Railroading to the next level by creating new and better ways to deliver safe, reliable and low-carbon transportation solutions. C N 20 1 9 AN N U AL R E P O R T V

CN safely and reliably moves the North American economy and enables global trade by helping customers win and communities prosper.” S A F E T Y I S A C O R E VA L U E AT C N Safety continues to be an area of relentless focus for our Company. Safety is the lens through which we make decisions in all areas of our business, every day. However, we can always do better. It is with a heavy heart that I report the passing of our colleague Imraan Qamar, 27, who was fatally injured on August 15, 2019, at MacMillan Yard in Toronto, ON. Imraan had just started his career at CN, having joined as a conductor trainee in June 2018 and qualified as a conductor in December 2018. My thoughts and prayers are with his family, friends and colleagues. The loss of one member of the CN family deeply affects us all. This tragic accident is a harsh reminder of how unforgiving the railroad environment can be, and how extremely important safety is. That’s why we must always work to improve our safety culture. One way we worked toward this in 2019 was by adopting Life Critical Rules when operating alone, in teams, or as a supervisor of others. These are the safety rules that, if not precisely followed, can lead to death or serious injury. We also continued to leverage recent advances in technology to progress our safety performance. Drawing on innovations from other industries, these cutting-edge technologies will improve, for example, inspection reliability and preventative maintenance. Technology has an important role to play in the rail industry’s future, and CN is a pioneer in making that happen. AC H I E V I N G L O N G -T E R M G R OW T H As part of the economic fabric of North America, we strive to build on our position as a leading rail and multimodal logistics company. Our supply chain expertise is helping us to grow market share with our existing customers as well as gain new customers. We also grow when we partner with and invest in new businesses by bringing them into the CN family. It allows us to offer new services to the market, extend our reach up and down the supply chain and fill the underutilized areas of our network. A great example of this approach is our 2019 acquisition of TransX, one of Canada’s oldest and largest transportation companies. The acquisition positions us to strengthen our intermodal business, expand capacity and foster additional supply chain solutions to continue to create value for customers. We also onboarded a strong entrepreneurial management team with deep expertise in logistics, operations, dispatch and the temperature-controlled supply chain. D E LI V E R I N G A S O N E T E A M At the beginning of this message I mentioned the exceptional character and strength of our remarkable railroaders. Let me take a moment to acknowledge that their work is what defines CN. Together, we redefine “the art of the possible” every day by working toward a common goal as ONE TEAM. CN has a long and proud history of developing the best team of railroaders in the business by attracting talent with diverse industry backgrounds. In this way, we pay tribute to our past of building a great company and contributing to national prosperity. It is our people and their talent who have made CN what it is today, and who continue to differentiate us from our competitors. V I C N 20 1 9 AN N U AL R E P O R T

20 20 OU T L O OK – CA U T IO US LY O P T I M I ST IC 2020 represents another special milestone for our Company as we celebrate 25 years since our IPO. But, CN’s future is what I’m the most passionate about. CN’s strategic agenda is focused on enabling long-term profitable growth, and that means being part of the solutions that enable our partners to continue expanding. In 2020, the economy is expected to remain uncertain. As a result, CN will continue to focus on cost control and asset utilization to align resources with changing demand. Our capital program is reduced to $3.0 billion, following two years of record capacity investments. Importantly, we will maintain our attention on where the economy is going. That means an even greater emphasis on the consumer market and intermodal shipments, and continued focus on network capacity in our fast-growing Western Region. In addition, we continue to keep a close eye on potential acquisitions with a strong focus on opportunities that support incremental volume on our core rail franchise. We are not waiting for the economy to bring the freight to us. We will continue to go after the freight in collaboration with our customers, supply chain partners and other stakeholders. Together, we will enable economic prosperity by providing reliable, competitive and carbon-efficient transportation solutions. As we look to the next century, we are raising our game to deliver for a sustainable future, leading the industry to make a meaningful difference for our people, our customers and the many communities where we operate. Rail has tremendous potential to reduce the environmental impact of transportation. As a mover of the economy, CN is committed to playing a key role in the transition to a lower carbon economy. I’m proud that CN is internationally regarded as one of the best-performing transportation companies. To maintain this enviable position, transformational change is underway within our Company. With our focus on diversifying our talent pool, the introduction of new technologies, and the integration of new companies into our supply chain approach, we are well on our way to achieving our mission of connecting customers with the markets that drive their business success. Let’s move ONWARD, together. Sincerely, JJ Ruest President and Chief Executive Officer 1 See the section entitled Adjusted performance measures in the MD&A for an explanation of this non-GAAP measure. C N 20 1 9 AN N U AL R E P O R T V I I CN’s President and CEO, JJ Ruest, at Thornton Yard in Vancouver, BC. Photo by Stuart McCall/Alpha Presse

CN100 – A Moving Celebration To celebrate our 100th birthday, CN is going on tour! Stopping in cities across North America, CN100 – A Moving Celebration is a travelling exploration of CN’s centenary. It’s a great way for CN’s extended family and friends — employees, pensioners, customers and the communities we serve from coast to coast to coast — to look back on the miles we have covered together and imagine what lies ahead. A day at the celebration site has something for everyone: historical exhibits, shows, music, food and activities. Join us in celebrating 100 years on the move! cn.ca/cn100 CN100 1 2 3 4 5 6 7 Quebec City, QC Edmonton, AB Calgary, AB Vancouver, BC Halifax, NS Winnipeg, MB Regina, SK V III CN 2 0 1 9 AN N U AL R E P O R T 1 2

7 CN 2 0 1 9 AN N U AL R E P O R T IX 3 4 5 6

DELIVERING RESPONSIBLY FOR A SUSTAINABLE FUTURE Delivering Responsibly is at the heart of how CN is building for a sustainable future. It means moving customer goods safely and efficiently, being environmentally responsible, attracting and developing the best railroaders, helping build safer, stronger communities, while adhering to the highest ethical standards. CN is proud to be recognized for its efforts to build a more sustainable future. Five principles anchor our sustainability commitment: Safety, Environment, People, Community and Governance. Safety Governance Environment Community People p h oto b y : Pascale Simard/Alpha Presse Northern Quebec X CN 2 0 1 9 AN N U AL R E P O R T

Our goal is to reduce serious injuries and fatalities to zero at CN. S A F E T Y I S A C O R E VA L U E Absolutely nothing is more important to us than running a safe railroad, because a safe day is the only acceptable kind of day at CN. Our goal remains to be the safest railroad in North America by establishing an unwavering safety culture and implementing a management system designed to minimize risk. We are also leveraging recent advances in technology to improve our safety performance. Safety must permeate every role in the Company and be the lens through which every priority is set and decision made. By means of our company-wide safety culture, where no one will compromise on safety, we strive to safeguard our employees, assets, customers’ goods, neighbouring communities, and the environment. Together, we look out for each other because every day at CN must be a safe day. C N 20 1 9 AN N U AL R E P O R T XI FRA Train Accident Ratio TSB Train Accident Ratio FRA Personal Injury Ratio accidents per million train miles accidents per million train miles injuries per 200,000 person hours 6.957.01 1.832.022.11 1.831.81 1.91 201720182019201720182019201720182019 The FRA train accident ratio includes The TSB accident ratio includes The personal injury ratio was up only derailments or collisions in all accidents and improved 5.5% in 2019 compared to 2018. excess of US$10,700 (C$14,500). 15.5% in 2019 vs. 2018. 5.92 Car Mechanic Terry Rioux (left) and Carman Chance Sterner use a new mobile application for car repair billing. Prince Rupert, BC Photo by Pascale Simard/Alpha Presse

CN is the fuel-efficiency leader in the North American rail industry, consuming approximately 15% gross ton mile less fuel per TAKI N G A C T I O N T O P R O T EC T T H E EN V I R O N M EN T For CN, an environmentally sustainable future means thinking and acting in the interest of generations to come. We are working to build a strong environmental legacy of leadership by means of carbon-efficient operations, conserving resources, and protecting and restoring the rich and diverse natural ecosystems through which our network passes. Our goal is to conduct our operations with minimal environmental impact while providing cleaner, more sustainable transportation services to our customers. In fact, rail is four to five times more fuel efficient than trucks and has tremendous potential to reduce the environmental impact of than the industry average. W O R K I N G A S O N E T E A M CN’s ONE TEAM approach fosters a safe, supportive and diverse work environment where employees can grow to their full potential and be recognized for their contributions to our success. In an increasingly complex global marketplace, we recognize the importance of working as ONE TEAM to make us a stronger and more resilient company. Adopting a ONE TEAM mindset means we are open to learning from each other and drawing on talent from diverse groups, cultures, industries and experiences so we can grow to be more than the sum of our parts. A diverse and respectful workforce enables us to better understand and respond to the needs of our customers and the communities we serve, access a larger talent pool, and increase the effectiveness of our decision-making through a wider range of perspectives, experiences and sensibilities. transportation and play a key role in the climate change solution. Over the past 25 years, we have reduced our locomotive emission intensity by 39%, avoiding 45 million tons of carbon compared to shipping by truck. We are committed to advancing the circular economy in all aspects of our operations. Working collaboratively by engaging employees, customers and suppliers, we continue to find innovative ways to optimize the use of resources and divert approximately 90% of waste from landfills through our reduce-reuse-recycle-renew programs. XI I C N 20 1 9 AN N U AL R E P O R T One of CN’s newly hired conductors, Alysia Davis, with her trainer, Superintendent Joseph Brooks, in Harrison Yard, TN. Photo by Gary Walpole/Alpha Presse

BU I L D I NG S A F E R , S T R O N G E R C O M M U N IT I E S For over 100 years, the employees of CN have been proud to be an important part of the many communities across our 20,000-mile North American network. As neighbours, we are committed to building safer, stronger, more resilient communities together by investing in community development, creating positive socio-economic benefits, and ensuring open, transparent lines of communication. To strengthen community relations and increase the impact of our community investments, CN established Community Boards across the network. The Boards are comprised of local community leaders who provide input on CN’s community investments in the region. We want you to be proud to have CN in your communities. As we do every year, in 2019, CN employees brought critical rail safety information and training to thousands of municipal officials and emergency responders. During our 2019 Rail Safety Week campaign, which aimed to educate communities about rail crossing safety, CN police officers and other employees conducted over 250 activities at schools, community centres, railway stations and level crossings across Canada and the United States. In 2019, to celebrate CN’s 100th anniversary and in conjunction with our travelling CN100 – A Moving Celebration tour, CN and Tree Canada partnered to plant a Legacy Forest in nine cities from coast to coast, each consisting of 100 mature trees. Additional Legacy Forests will be planted in other cities in 2020. Overall, in 2019, CN planted almost 135,000 trees in communities along our rail network. Since 2012, we have planted over two million trees, making CN one of the leading private non-forestry company tree planters in Canada. C O M M IT T E D T O G O O D C O RP O R AT E GO V E RN A N C E As a Canadian reporting issuer with securities listed on the Toronto Stock Exchange (TSX) and the New York Stock Exchange (NYSE), we ensure our corporate governance practices comply with the highest standards and rules adopted by the Canadian Securities Administrators, applicable provisions of the U.S. Sarbanes-Oxley Act of 2002 and related rules of the U.S. Securities and Exchange Commission. We are exempted from complying with many of the NYSE corporate governance rules, provided that we comply with Canadian governance requirements. Except as summarized on our website at www.cn.ca/governance, our governance practices comply with the NYSE corporate governance rules in all significant respects. Consistent with the belief that ethical conduct goes beyond compliance and resides in a solid governance culture, we publish and enforce CN’s Corporate Governance Manual, Code of Business Conduct and Anti-Corruption Policy. Because it is important that any potential wrongdoings be reported, CN has adopted several methods for employees and third parties to anonymously report accounting, auditing and other concerns. CN is committed to diversity and inclusion, not only in principle, but also in practice. CN believes that a diverse board benefits from a broader range of perspectives and relevant experience. The Board-approved Diversity Policy with respect to director and executive positions considers various diverse groups, including gender, when recommending director nominees. The Board has a target of at least one-third representation by women, which it has exceeded. The Board aspires to attain, by the end of 2022, a Board composition in which at least forty percent (40%) of directors are from a broader range of diverse groups. We are a proud signatory to the Catalyst Accord 2022. A 2019 Rail Safety Week participant signs the Rail Safety Pledge. Amite, LA Photo by Scott Saltzman/Alpha Presse C N 20 1 9 AN N U AL R E P O R T X III JJ Ruest and CN executives rang the closing bell at the Toronto Stock Exchange on June 4, 2019 in honour of CN’s 100th anniversary. Toronto, ON Photo by Geoff Parkin-GP Photo

DELIVERING SUPERIOR SERVICE FOR OUR CUSTOMERS Our supply chain leadership brings value to our customers as we partner with them to more successfully serve their customers. We proactively go the extra mile to help our customers and supply chain partners reach farther, open new markets, and win in the global marketplace — because, when our customers win, CN wins, too. T H E T R A N S L O A D S O L U T I O N For companies not located on a rail spur, but want to take advantage of the economics and carbon efficiency of rail, transload is the solution. In November 2019, CN “spotted” the first railcars of our new transload partnership with FLASH Trucking in Green Bay, WI, boosting the economic potential of all northern Wisconsin. Since 2015, two-thirds of grain elevators being built in the Canadian Prairies are being built exclusively on CN’s network. H E L P I N G FA R M E R S M O V E R EC O R D G R A I N C R O P CN’s team of railroaders moved a record 27.8 million metric tons (MMT) of Western Canadian grain during the 2018–2019 crop year, 1.5 MMT (or 6%) more than the previous record. CN also moved over 1 MMT of grain in containers out of Western Canada. XIV CN 2 0 1 9 AN N U AL R E P O R T p h oto b y : Pascale Simard/Alpha Presse Spruce Grove, AB

Photo by Lloyd Sutton/Alpha Presse Calgary Logistics Park, Calgary, AB E N S U R I N G S A F E T Y O F T E M P E R AT U R E - SE N SI T I V E G O O D S CN’s commitment to the efficient movement of temperature-controlled goods and our remote monitoring artificial intelligence (AI) technology are key to food safety. Each CargoCool container offers the power of almost 100 refrigerators and, through ReeferTrak, our dedicated team has real-time visibility of the temperature inside the box, ensuring that perishable cargo is always at the correct temperature. In 2019, we added 300 new reefers to our fleet to handle growth opportunities and develop new markets. With the addition of the TransX and H&R fleets, CN now has over 2,100 reefers running throughout North America. In addition to our domestic reefer fleet, we have a diversified fleet of assets to support the movement of international reefer containers for ocean carriers. CN has 94 IntelliGEN powerpack gensets and 150 clip-on gensets, which provide consistent, uninterrupted power supply for international refrigerated products while moving on CN’s network. EX T EN D I N G I N T ER M O D A L A G R E E M E N T S W IT H O C E A N C A R R I E R S Ocean carriers value CN’s network reach, excellence in supply chain logistics and focus on growth. For example, in September 2019, CN and Evergreen extended their 27-year partnership, with Evergreen calling at the CN-served ports of Vancouver, Prince Rupert and Halifax. Also, in the same month, COSCO Shipping chose CN to be the exclusive rail provider for their cargo at the ports of Vancouver, Prince Rupert, Montreal and Halifax to all CN destinations. Finally, with a global reach to over 100 countries, ZIM Integrated Shipping Services partnered with the 2M Alliance in March 2019 to add Prince Rupert as one of their port destinations. C N A N D G M R E N E W T H E I R L O N G - STA N D I N G R E L AT IO N S H I P In 2019, CN signed a new multiyear agreement with General Motors (GM) for the transport of finished vehicles and parts. GM is the first customer to use our new Autoport facility in Vancouver. Our latest Autoport facility in New Richmond, WI, will be completed in Q4 2020 with GM operations commencing in 2021. Both facilities will provide quicker vehicle deliveries for GM and its customers throughout the northern U.S. Midwest and British Columbia. Photo by Lloyd Sutton/Alpha Presse Port of Vancouver, Vancouver, BC C N 20 1 9 AN N U AL R E P O R T XV

AltaGas Ridley Island Propane Export Terminal Port of Prince Rupert, Prince Rupert, BC Photo by Jan Vozenilek E NAB L I N G N E W E X P OR T S T H R OU G H PR I N C E R U PE R T As part of our growth strategy, CN’s capital investments in Western Canada are creating additional capacity, allowing us to increase operations at the Port of Prince Rupert. For example, in April 2019, CN delivered the first unit train of propane from production facilities northwest of Edmonton, AB, for export via the new AltaGas Ridley Island Propane Export Terminal. In August 2019, Ray-Mont Logistics completed the first phase of its innovative new multi-million-dollar facility for bagging plastic pellets produced in Alberta into containers for export out of the Port of Prince Rupert. OP E N I N G OU R D O O R S T O L E A R N I N G EX P ER I EN C E S CN has two modern training facilities: the Claude Mongeau National Training Centre in Winnipeg, MB, and the CN Campus in Homewood, IL. Thanks to the CN Campus Partnership Program, CN has provided hundreds of customers with a set of safety-focused learning experiences that help instill a safety mindset and ensure safer operations throughout the rail supply chain. CN provided training to more than 200 customers in 2019 at our national training centres in Manitoba and Illinois. R E C O G NI ZI N G CU S T O M E R S A N D S U PPLY CH AI N PA R T N E R S F O R S U S TA I N A B I LIT Y L E A D E R S H I P The CN EcoConnexions Partnership Program celebrates companies who are committed to building a more sustainable future by reducing their environmental footprint and being part of the climate solution. On behalf of 45 EcoConnexions partners and in collaboration with Tree Canada, we planted 120,000 trees in 2019 in Canada and the U.S. X V I C N 20 1 9 AN N U AL R E P O R T Volunteers at a CN100 tree-planting event. Winnipeg, MB Photo by Tree Canada

GROWTH THROUGH OPERATIONAL SUPPLY CHAIN LEADERSHIP At CN, we are committed to creating the network of the future by building the infrastructure, relationships, technologies and expertise that enable us to make those supply chains as safe, efficient, and reliable as possible. We showcase CN’s leadership in the industry by continuing to leverage our unique network to grow with existing customers, with new customers, and by partnering with and investing in new businesses. We have a demonstrated ability to nimbly weather economic downturns when they inevitably occur. of Canada of over $1 billion. These include the completion of Pembina’s liquefied petroleum gas export terminal with a capacity of 25,000 barrels per day, which is expected to begin exports in 2020, with the potential to add another 15,000 barrels per day in 2023. DP World’s Fairview container terminal is expected to increase capacity to 1.8 million TEUs by 2022. Vopak Pacific Canada plans to scale up its bulk liquids terminal from 4 MMT to 12 MMT, with Phase 1 to be completed in 2022. Ray-Mont Logistics and Export Logistics both plan new transload facilities for agricultural, plastic resin, dry bulk, and forest products. Supporting this continued growth is over $350 million in joint infrastructure investment by CN, the Prince Rupert Port Authority and the Government of Canada. These include bridge expansion, double track and new siding projects. P R I N C E R UP E R T C O N T I NUE S R A P I D G R OW T H The Port of Prince Rupert, which is served exclusively by CN, is currently operating close to its maximum capacity of 1.35 million twenty-foot equivalent units (TEUs) as a result of its status as the fastest West Coast gateway into North America. In fact, 11 steamship lines, including all the top five companies in the world, now leverage Prince Rupert’s one-to-two-day sailing advantage to/from Asia. The port also benefits from a wide range of export opportunities to improve round-trip economics for steamship lines and a close partnership with rail operations that drive efficiency and premium customer service. Our supply chain partners at the Port of Prince Rupert are planning public/private investments with the Government p h oto b y : Jan Vozenilek Prince Rupert, BC CN 2 0 1 9 AN N U AL R E P O R T X V I I

with Teck to increase shipments of steelmaking coal from Teck’s four B.C. operations through an expanded Neptune Terminal as well as the recently privatized bulk terminal in Prince Rupert. G3 is building a new grain terminal with a capacity of 8 MMT, which will start operations in mid-2020. GrainsConnect and P&H expect to add 3.5 MMT of capacity at the Fraser Surrey grain terminal by the end of 2020. Fibreco, Kinder Morgan, Cargill and Richardson are also increasing their grain-handling capacities. To improve rail access to accommodate the expected growth, CN, the Port of Vancouver and the Government of Canada signed an agreement in 2019 to jointly fund over $400 million in rail investments to double sections of track and improve tunnel ventilation. E MUL AT I N G P R I N C E R UP E R T MOD E L ON E A S T C O A S T CN’s Canadian East Coast port strategy to leverage our underutilized eastern network is to emulate the success of our Prince Rupert model. Similar advantages exist at Eastern Canadian ports, which aim to capture growth from ultra-large container vessels. Together, we are developing competitive gateways for Asian, European and Mediterranean cargo with end-to-end solutions to Eastern Canada and the U.S. Midwest. To this end, CN is working closely with PSA, a leading global port terminal operator and the new owner of the terminal at the Port of Halifax. Over the past 10 years, the terminal has invested $250 million to build longer and deeper piers as well as upgrade gates and marshalling areas. With the addition of a fifth Super Post-Panamax ship-to-shore crane scheduled to be in service by June 2020, PSA Halifax will be able to handle today’s largest vessels. Another new port operator in the region is Hutchison Ports, the world’s leading port network. CN, Hutchison and the Port of Quebec signed a joint venture agreement in 2019 to work together to open a new, state-of-the-art container terminal that is set to become a cornerstone of this deep-water, year-round port. The new terminal will have a capacity of 700,000 TEUs and will be exclusively served by CN. The opening is scheduled for 2024. Westshore Terminals Deltaport, BC Photo by William Jans/ Vancouver Fraser Port Authority I N V E S T I N G T O S U P P O R T G R O W T H I N VA N C O U V E R The partners we serve at the Port of Vancouver are showing confidence in our supply chain focus and plan to invest $1 billion in the next few years to expand their capacity. In 2020, Global Container Terminals Canada plans to add 215,000 TEUs at Vanterm and another 500,000 TEUs at Deltaport, bringing the capacity at these intermodal terminals to 1.1 million and 2.4 million TEUs, respectively. DP World has begun a project to more than double capacity at Centerm to 1.5 million TEUs, which is scheduled for completion by early 2022. Neptune Terminal has almost doubled its potash capacity from 6 million metric tons (MMT) to 11 MMT and plans to increase its capacity to handle coal from 12.2 MMT to more than 18.5 MMT by 2021. This dovetails perfectly with CN’s long-term agreement X V III C N 20 1 9 AN N U AL R E P O R T

CN has 23 strategically located intermodal terminals, more than double that of our nearest competitor. B U I L D I N G O N O U R A C QU I S I T IO N T R A C K R EC O R D CN continues to pursue inorganic growth opportunities that help our customers get their products to market more efficiently, extend our reach, and increase volume on our network. In 2019, CN made three acquisitions that fit perfectly with this strategic focus. The acquisition of Manitoba-based TransX positions CN to strengthen its intermodal business and allows the Company to expand capacity and foster additional supply chain solutions. We are also expanding our North American rail intermodal supply chain with the acquisition of Alberta-based H&R Transport’s intermodal temperature-controlled transportation division. Finally, pending regulatory review, CN acquired the Massena E X PA N D I N G O U R U N IQU E I N T E R M O D A L N E T W O R K CN’s intermodal business continues to grow due in part to the success of our supply chain collaboration and consistent service that help our partners compete in a global environment. For example, CN’s full membership in the Equipment Management Pool (EMP) since March 2019 is reducing empty container movements and extending our reach. As well, since August 2019, CN and CSX are offering a new intermodal service between CN’s Greater Montreal and Southern Ontario markets, and the CSX-served ports of Philadelphia, New York and New Jersey. We are also investing in our inland terminals to accommodate greater anticipated demand in key consumer markets. These include major investments in Southern Ontario where we are planning to build a new $250-million logistics hub in Milton. CN also welcomed Canada’s first privately operated intermodal terminal located in the Chuka Creek Business Park in Regina, SK, exclusively served by CN, which opened in November 2019. rail line from CSX, which represents more than 220 miles of track between Valleyfield, QC, and Woodard, NY. C N 20 1 9 AN N U AL R E P O R T X IX Photo by TransX Winnipeg, MB

TAKING PRECISION SCHEDULED RAILROADING TO NEW HEIGHTS CN pioneered Precision Scheduled Railroading (PSR) and our vision is to create the network of the future by becoming the first railroad to take PSR to the next level using advanced information technology. The following cost-effective initiatives are expected to improve safety, reliability and customer service. P O S IT I V E T R A I N C O N T R O L ( P T C ) PTC is an innovative safety technology system we are adding across our U.S. network. PTC is designed to prevent certain accidents resulting from human error. The system provides an added level of operational safety by initiating a full brake application to stop a train in the unlikely event that the crew is unable to or does not act. It is the largest technology program ever deployed by CN and is a major step toward safer operations. In November 2019, CN began PTC operation on all required subdivisions, 13 months ahead of the congressionally mandated deadline of December 31, 2020. We continue to work with our Class I, short line and passenger rail partners to ensure interoperability throughout the industry. A U T O M AT E D I N S P E C T I O N P O R TA L S ( A I P s) High-resolution imaging hardware coupled with powerful machine learning software are changing how we inspect our fleet. Our new AIPs feature ultra-high-definition panoramic cameras and infrared lighting that capture a 360° view of a train as it travels at track speed through the portal. The AIPs increase the frequency and quality of inspections and reduce the need for slow roll-by inspections. Our AIPs won a 2019 Rail Safety Award from the Railway Association of Canada and a Digital Transformation Award at the 2019 ICMG Architecture Awards. The first seven AIPs are currently in operation, with more development expected over the next few years. p h oto b y : Pascale Simard/Alpha Presse Automated inspection portal Winnipeg, MB XX CN 2 0 1 9 AN N U AL R E P O R T

A U T ON OMOU S T R A C K I N S P EC T I O N P R O G R A M ( AT I P ) With innovation and safety in mind, CN is putting powerful sensor and AI technology into specially equipped automated railcars used during revenue train service to inspect our tracks at normal train speed. This cutting-edge technology will reduce the number of slow-speed inspection vehicles on the tracks, unlock capacity and improve service reliability by reducing track disruptions. In addition, it will increase inspection frequency and quality, and provide more accurate preventative maintenance data. We currently have eight ATIP railcars in service and plan to add two more in 2020, which together will provide 100% core mainline coverage. S MAR T N E T W O R K CN is developing and systematically deploying an integrated digital scenario analysis and simulation tool to enhance capacity planning. The tool simulates train movements to improve insight on network capacity, cost and fluidity. Stress testing scenario analysis will help identify options/trade-offs to handle anticipated volumes and identify specific pinch points. This is particularly important given the long lead times to add capacity, including infrastructure construction, crews and locomotives. E N T E RP RIS E A U T OM AT I ON CN is building a digitally nimble organization by automating or eliminating labour-intensive and low-value repetitive tasks. CN’s Information and Technology team is leveraging a variety of scalable and repeatable technological tools, including robotic process automation and smart data capture, to enable employees to focus on value-added tasks at low incremental cost. H A N D H E L D T E C H N OL O G Y CN is providing employees with next-generation smartphones and tablets that digitize manual processes, increase safety, improve information flow and accuracy, and drive productivity. This initiative is also a big step towards paperless operations and reduces our environmental footprint. ATIP railcar Oshkosh, WI CN currently has 11,000 mobile devices deployed to Operations employees, with more devices being introduced in 2020. C N 20 1 9 AN N U AL R E P O R T X XI Carman Josh Thomson-Kylie inspects a wheel in Halifax, NS. Photo by Dan Callis/Alpha Presse

BOARD OF DIRECTORS t o p r o w : Gordon Giffin, Shauneen Bruder, Denis Losier, Kevin Lynch, Donald Carty, James O’Connor, Julie Godin, Robert Phillips b ot to m r o w : Edith Holiday, Robert Pace, Maureen Kempston Darkes, Jean-Jacques Ruest, Laura Stein Robert Pace, d.comm., c.m. Chair of the Board Canadian National Railway Company President and Chief Executive Officer The Pace Group committees: 3, 4*, 5, 7 Donald J. Carty, o.c., ll.d. Retired Chairman and Chief Executive Officer American Airlines committees: 1*, 5, 6, 7, 8 The Honourable Denis Losier, p.c., ll.d., c.m. Retired President and Chief Executive Officer Assumption Life committees: 3*, 4, 7, 8 Ambassador Gordon D. Giffin Partner Dentons US LLP committees: 3, 5, 7, 8 Jean-Jacques Ruest President and Chief Executive Officer Canadian National Railway Company committees: 4, 7 The Honourable Kevin G. Lynch, p.c., o.c., ph.d., ll.d. Vice-Chair BMO Financial Group committees: 1, 3, 6*, 7, 8 Julie Godin Co-Chair of the Board, Executive Vice-President, Strategic Planning and Corporate Development CGI Inc. committees: 2, 3, 6, 7, 8 Shauneen Bruder Retired Executive Vice-President, Operations Royal Bank of Canada committees: 2, 4, 5, 6, 7 James E. O’Connor Retired Chairman and Chief Executive Officer Republic Services, Inc. committees: 1, 2, 4, 5, 7* Edith E. Holiday Former General Counsel, United States Treasury Department and Secretary of the Cabinet The White House committees: 1, 2, 7, 8* Robert L. Phillips President R.L. Phillips Investments Inc. committees: 2*, 3, 5, 6, 7 Laura Stein Executive Vice-President, General Counsel & Corporate Affairs The Clorox Company committees: 1, 2, 5*, 6, 7 V. Maureen Kempston Darkes, o.c., d.comm., ll.d. Retired Group Vice-President General Motors Corporation and President GM Latin America, Africa and Middle East committees: 1, 2, 3, 7, 8 X XI I C N 20 1 9 AN N U AL R E P O R T C O M MI T T EE S : 1 Audit 2 Finance 3 Corporate governance and nominating 4 Donations and sponsorships 5 Environment, safety and security 6 Human resources and compensation 7 Strategic planning 8 Pension and investment * Denotes chair of the committee

SELECT OF THE As at December 31, 2019 SENIOR OFFICERS COMPANY Jean-Jacques Ruest President and Chief Executive Officer Ghislain Houle Executive Vice-President and Chief Financial Officer Robert Reilly Executive Vice-President, Chief Operating Officer and Interim Chief Information and Technology Officer Sean Finn Executive Vice-President Corporate Services and Chief Legal Officer James Cairns Senior Vice-President Rail Centric Supply Chain Dorothea Klein Senior Vice-President and Chief Human Resources Officer Doug MacDonald Senior Vice-President Information and Technology Keith Reardon Senior Vice-President Consumer Product Supply Chain Doug Ryhorchuk Senior Vice-President Network Operations Janet Drysdale Vice-President Financial Planning Marlene Puffer President and Chief Executive Officer CN Investment Division Paul Butcher Vice-President Investor Relations C N 20 1 9 AN N U AL R E P O R T X X III

SHAREHOLDER AND INVESTOR INFORMATION Annual meeting The annual meeting of shareholders will be held on April 28, 2020. Please refer to www.cn.ca for meeting details. Shareholder services Shareholders having inquiries concerning their shares, wishing to obtain information about CN, or to receive dividends by direct deposit or in U.S. dollars may obtain detailed information by communicating with: Computershare Trust Company of Canada Shareholder Services 100 University Avenue, 8th Floor Toronto, ON, Canada M5J 2Y1 Telephone: 1-800-564-6253 www.investorcentre.com Annual information form The annual information form may be obtained by writing to: The Corporate Secretary Canadian National Railway Company 935 de La Gauchetière Street West Montreal, QC, Canada H3B 2M9 It is also available on CN’s website (www.cn.ca). Stock exchanges CN common shares are listed on the Toronto and New York stock exchanges. Ticker symbols: CNR Toronto Stock Exchange CNI New York Stock Exchange Transfer agent and registrar Computershare Trust Company of Canada Offices in Canada: Montreal, Quebec Toronto, Ontario Calgary, Alberta Vancouver, British Columbia Telephone: 1-800-564-6253 www.investorcentre.com Investor relations Paul Butcher Vice-President, Investor Relations Telephone: 514-399-0052 Head office Canadian National Railway Company 935 de La Gauchetière Street West Montreal, QC, Canada H3B 2M9 P.O. Box 8100 Montreal, QC, Canada H3C 3N4 Co-transfer agent and co-registrar Computershare Trust Company N.A. Att: Stock Transfer Department Overnight Mail Delivery: 462 South 4th Street, Louisville, KY, United States 40202 Regular Mail Delivery: P.O. Box 505005, Louisville, KY, United States 40233-5005 Telephone: 1-800-962-4284 X XIV C N 20 1 9 AN N U AL R E P O R T de s i g n: Veronica Chin
Selected Railroad Statistics - unaudited 2019 2018 2017 Financial measures Key financial performance indicators (1) Total revenues ($ millions) Freight revenues ($ millions) Operating income ($ millions) Adjusted operating income ($ millions) (2) Net income ($ millions) Adjusted net income ($ millions) (2) Diluted earnings per share ($) Adjusted diluted earnings per share ($) (2) Free cash flow ($ millions) (3) Gross property additions ($ millions) Share repurchases ($ millions) Dividends per share ($) 14,917 14,198 5,593 5,708 4,216 4,189 5.83 5.80 1,992 4,079 1,700 2.15 14,321 13,548 5,493 5,520 4,328 4,056 5.87 5.50 2,514 3,531 2,000 1.82 13,041 12,293 5,243 5,243 5,484 3,778 7.24 4.99 2,778 2,703 2,000 1.65 Financial position (1) Total assets ($ millions) Total liabilities ($ millions) Shareholders' equity ($ millions) 43,784 25,743 18,041 41,214 23,573 17,641 37,629 20,973 16,656 Financial ratios Operating ratio (%) Adjusted operating ratio (%) (2) Adjusted debt-to-adjusted EBITDA (times) (4) Return on invested capital (ROIC) (%) (5) Adjusted ROIC (%) (5) 62.5 61.7 2.02 15.3 15.1 61.6 61.5 1.94 16.7 15.7 59.8 59.8 1.75 22.4 15.9 Operational measures (6) Statistical operating data Gross ton miles (GTMs) (millions) Revenue ton miles (RTMs) (millions) Carloads (thousands) Route miles (includes Canada and the U.S.) Employees (end of year) Employees (average for the year) 482,890 241,954 5,912 19,500 25,975 26,733 490,414 248,383 5,976 19,500 25,720 25,423 469,200 237,098 5,737 19,500 23,945 23,074 Key operating measures Freight revenue per RTM (cents) Freight revenue per carload ($) GTMs per average number of employees (thousands) Operating expenses per GTM (cents) Labor and fringe benefits expense per GTM (cents) Diesel fuel consumed (US gallons in millions) Average fuel price ($/US gallon) GTMs per US gallon of fuel consumed Car velocity (car miles per day) Through dwell (hours) Through network train speed (miles per hour) Locomotive utilization (trailing GTMs per total horsepower) 5.87 2,402 18,063 1.93 0.61 451.4 3.17 1,070 198 7.9 18.5 198 5.45 2,267 19,290 1.80 0.58 462.7 3.32 1,060 188 8.3 18.0 208 5.18 2,143 20,335 1.66 0.54 441.4 2.74 1,063 211 7.7 20.3 225 Safety indicators (7) Injury frequency rate (per 200,000 person hours) Accident rate (per million train miles) 1.91 2.11 1.81 2.02 1.83 1.83 (1) (2) (3) (4) (5) (6) Amounts expressed in Canadian dollars and prepared in accordance with United States generally accepted accountable principles (GAAP), unless otherwise noted. See the section entitled Adjusted performance measures in the MD&A for an explanation of these non-GAAP measures. See the section entitled Liquidity and capital resources - Free cash flow in the MD&A for an explanation of this non-GAAP measure. See the section entitled Liquidity and capital resources - Adjusted debt-to-adjusted EBITDA multiple in the MD&A for an explanation of this non-GAAP measure. See the section entitled Return on invested capital (ROIC) and adjusted ROIC in the MD&A for an explanation of these non-GAAP measures. Statistical operating data, key operating measures and safety indicators are unaudited and based on estimated data available at such time and are subject to change as more complete information becomes available. Definitions of these indicators are provided on CN's website, www.cn.ca/glossary. Based on Federal Railroad Administration (FRA) reporting criteria. (7) CN | 2019 Annual Report 1

Management's Discussion and Analysis Contents Business profile Corporate organization Strategy overview Forward-looking statements Financial outlook Financial highlights 2019 compared to 2018 Non-GAAP measures Adjusted performance measures Constant currency Return on invested capital (ROIC) and adjusted ROIC Revenues Operating expenses Other income and expenses 2018 compared to 2017 Summary of quarterly financial data Summary of fourth quarter 2019 Financial position Liquidity and capital resources Off balance sheet arrangements Outstanding share data Financial instruments Recent accounting pronouncements Critical accounting estimates Business risks Controls and procedures 3 3 3 7 8 8 8 9 9 10 11 12 17 18 19 24 24 25 26 33 33 34 36 37 45 53 2 CN | 2019 Annual Report

Management's Discussion and Analysis This Management's Discussion and Analysis (MD&A) dated January 31, 2020, relates to the consolidated financial position and results of operations of Canadian National Railway Company, together with its wholly-owned subsidiaries, collectively "CN" or the "Company," and should be read in conjunction with the Company's 2019 Annual Consolidated Financial Statements and Notes thereto. All financial information reflected herein is expressed in Canadian dollars and prepared in accordance with United States generally accepted accounting principles (GAAP), unless otherwise noted. CN's common shares are listed on the Toronto and New York stock exchanges. Additional information about CN filed with Canadian securities regulatory authorities and the United States Securities and Exchange Commission (SEC), including the Company's 2019 Annual Information Form and Form 40-F, may be found online on SEDAR at www.sedar.com, on the SEC's website at www.sec.gov through EDGAR, and on the Company's website at www.cn.ca in the Investors section. Printed copies of such documents may be obtained by contacting CN's Corporate Secretary's Office. Business profile CN is engaged in the rail and related transportation business. CN's network of approximately 20,000 route miles of track spans Canada and mid-America, uniquely connecting three coasts: the Atlantic, the Pacific and the Gulf of Mexico. CN's extensive network and efficient connections to all Class I railroads provide CN customers access to Canada, the United States (U.S.) and Mexico. A true backbone of the economy, CN handles over $250 billion worth of goods annually and carries over 300 million tons of cargo, serving exporters, importers, retailers, farmers and manufacturers. CN's freight revenues are derived from seven commodity groups representing a diversified and balanced portfolio of goods transported between a wide range of origins and destinations. This product and geographic diversity better positions the Company to face economic fluctuations and enhances its potential for growth opportunities. For the year ended December 31, 2019, CN's largest commodity group accounted for 25% of total revenues. From a geographic standpoint, 16% of revenues relate to U.S. domestic traffic, 34% transborder traffic, 17% Canadian domestic traffic and 33% overseas traffic. The Company is the originating carrier for over 85%, and the originating and terminating carrier for over 65%, of traffic moving along its network, which allows it both to capitalize on service advantages and build on opportunities to efficiently use assets. Corporate organization The Company manages its rail operations in Canada and the U.S. as one business segment. Financial information reported at this level, such as revenues, operating income and cash flow from operations, is used by the Company's corporate management in evaluating financial and operational performance and allocating resources across CN's network. The Company's strategic initiatives are developed and managed centrally by corporate management and are communicated to its regional activity centers (the Western Region and Eastern Region), whose role is to manage the day-to-day service requirements of their respective territories, control direct costs incurred locally, and execute the strategy and operating plan established by corporate management. See Note 21 – Segmented information to the Company's 2019 Annual Consolidated Financial Statements for additional information on the Company's corporate organization, as well as selected financial information by geographic area. Strategy overview CN's business strategy is anchored on the continuous pursuit of Operational and Service Excellence, an unwavering commitment to safety and sustainability, and the development of a solid team of motivated and competent railroaders. CN's goal is to deliver valuable transportation services for its customers and to grow the business at low incremental cost. A clear strategic agenda, driven by a commitment to innovation, productivity, improving supply chains through collaboration, potential acquisitions and other opportunities, running trains safely, and minimizing environmental impact, drives the Company's efforts to create value for customers. CN thereby creates value for its shareholders by striving for sustainable financial performance through profitable top-line growth, adequate free cash flow and return on invested capital. CN is also focused on returning value to shareholders through dividend payments and share repurchases. CN's success and long-term economic viability depend on the presence of a supportive regulatory and policy environment that drives investment and innovation. CN's success also depends on a stream of capital investments that supports its business strategy. These investments cover a wide range of areas, from track infrastructure and rolling stock, to information and operating technologies, and other CN | 2019 Annual Report 3

Management's Discussion and Analysis equipment and assets that improve the safety, efficiency and reliability of CN's service offering. Investments in track infrastructure enhance the productivity and integrity of the plant, increase the capacity and the fluidity of the network, promote service excellence and support growth at low incremental cost. The acquisition of new locomotives and railcars generates several key benefits. New locomotives increase capacity, fuel productivity and efficiency, and improve the reliability of service. Locomotives equipped with distributed power allow for greater productivity of trains, particularly in cold weather, while improving train handling and safety. Targeted railcar acquisitions aim to tap growth opportunities, complementing the fleet of privately owned railcars that traverse CN's network. CN is also investing in, and deploying, advanced technology. CN pioneered scheduled railroading and its vision is to be the first railroad to take it to the next level, using advanced technology as a driver for safety, customer and shareholder value. Balancing "Operational and Service Excellence" The basic driver of the Company's business is demand for reliable, efficient, and cost effective transportation for customers. As such, the Company's focus is the pursuit of Operational and Service Excellence: striving to operate safely and efficiently while providing a high level of service to customers. CN operates with a mindset that drives cost efficiency and asset utilization. That mindset flows naturally from CN's Precision Railroading model, which focuses on improving every process that affects delivery of customers' goods. It is a highly disciplined process whereby CN handles individual rail shipments according to a specific trip plan and manages all aspects of railroad operations to meet customer commitments efficiently and profitably. This calls for the relentless measurement of results and the use of such results to generate further execution improvements in the service provided to customers. The Company's continuous search for efficiency is best captured in its performance according to key operating metrics such as car velocity, through dwell, through network train speed and locomotive utilization. All are at the center of a highly productive and fluid railroad operation, requiring daily engagement in the field. The Company works hard to run more efficient trains, reduce dwell times at terminals and improve overall network velocity. The railroad is run based on a disciplined operating methodology, executing with a sense of urgency and accountability. This philosophy is a key contributor to CN's operating ratio, earnings growth and return on invested capital (ROIC). CN understands the importance of balancing its drive for productivity with efforts to enhance customer service. The Company's efforts to deliver Operational and Service Excellence are anchored on an end-to-end supply chain mindset, working closely with customers and supply chain partners, as well as involving all relevant areas of the Company in the process. By fostering better end-to-end service performance and encouraging all supply-chain players to continuously improve daily engagement, information sharing, problem solving, and execution, CN aims to help customers achieve greater competitiveness in their own markets. Supply chain collaboration agreements with ports, terminal operators and customers leverage key performance metrics that drive efficiencies across the entire supply chain. The Company is strengthening its commitment to Operational and Service Excellence through a wide range of innovations anchored on its continuous improvement philosophy. CN is building on its industry leadership in terms of fast and reliable hub-to-hub service by continuing to improve across the range of customer touch points. The Company's major push in first-mile/last-mile service is focused on improving the quality of customer interactions – developing a sharper outside-in perspective; better monitoring of traffic forecasts; higher and more responsive car order fulfillment; and proactive customer communication at the local level. CN's broad-based service innovations benefit customers and support the Company's goal to drive top-line growth. CN understands the importance of being the best operator in the business, as well as being the best service innovator. Delivering safely and responsibly CN is committed to the safety of its employees, the communities in which it operates and the environment. Safety consciousness permeates every aspect of CN's operations. The Company's long-term safety improvement is driven by continued significant investments in infrastructure, rigorous safety processes and a focus on employee training and safety awareness. CN continues to strengthen its safety culture by investing significantly in training, coaching, recognition and employee involvement initiatives. CN's Safety Management Plan is the framework for putting safety at the center of its day-to-day operations. This proactive plan is designed to minimize risk, drive continuous improvement in the reduction of injuries and accidents, and engage employees at all levels of the organization. CN believes that the rail industry can enhance safety by working more closely with communities. Under CN's structured Community Engagement program, the Company engages with municipal officers and their emergency responders in an effort to assist them in their emergency response planning. In many cases, this outreach includes face-to-face meetings, during which CN discusses its comprehensive safety programs; its safety performance; the nature, volume and economic importance of dangerous commodities it transports through their communities; a review of emergency response planning; and arranging for training sessions for emergency responders. The outreach builds on CN's involvement in the Transportation Community Awareness and Emergency Response (TRANSCAER®), through which the Company has been working for many years to help communities in Canada and the U.S. understand the movement of hazardous materials and what is required in the event of transportation incidents. 4 CN | 2019 Annual Report

Management's Discussion and Analysis CN has been deepening its commitment to a sustainable operation for many years, and has made sustainability an integral part of its business strategy. The best way in which CN can positively impact the environment is by continuously improving the efficiency of its operations, and reducing its carbon footprint. As part of the Company's comprehensive sustainability action plan and to comply with CN's environmental policy, the Company engages in a number of initiatives, including the use of fuel-efficient locomotives and trucks that reduce greenhouse gas emissions; increasing operational and building efficiencies; investing in energy-efficient data centers and recycling programs for information technology systems; reducing, recycling and reusing waste and scrap at its facilities and on its network; engaging in modal shift agreements that favor low emission transport services; and participating in the Carbon Disclosure Project (CDP) to gain a more comprehensive view of its carbon footprint. The Company combines its expert resources, environmental management procedures, training and audits for employees and contractors, and emergency preparedness response activities to help ensure that it conducts its operations and activities while protecting the natural environment. The Company's environmental activities include monitoring CN's environmental performance in Canada and the U.S., identifying environmental issues inside the Company, and managing them in accordance with CN's environmental policy, which is overseen by the Environment, Safety and Security Committee of the Board of Directors. Certain risk mitigation strategies, such as periodic audits, employee training programs and emergency plans and procedures, are in place to minimize the environmental risks to the Company. The Company's CDP Report, CN's Sustainability Report entitled "Delivering Responsibly" and the Company's Corporate Governance Manual, which outlines the role and responsibilities of the Environment, Safety and Security Committee of the Board of Directors, are available on CN's website in the Delivering Responsibly section. Building a solid team of railroaders CN's ability to develop the best railroaders in the industry has been a key contributor to the Company's success. CN recognizes that without the right people - no matter how good a service plan or business model a company may have - it will not be able to fully execute. CN is taking steps to further align its business and talent strategies by placing a greater emphasis on the identification of specific roles across all functions that drive the greatest impact to the Company's business agenda, and ensuring the right talent are in these critical roles. The Company continues to focus on hiring the right people, onboarding them successfully, helping them build positive relationships with their colleagues, and supporting all employees to grow and develop, while deepening its commitment to develop talent and plan for the future. CN also recognizes the importance of diversity as it provides for a broad range of strengths, perspectives and experiences that makes CN better. It helps the Company attract and retain qualified talent, and it fosters innovation by bringing the best solutions to the table. As part of its strategy to build a solid team of railroaders, the Company leverages its state-of-the-art training facilities in preparing employees to be highly skilled, safety conscious and confident in their work environment. Curricula for technical training and leadership development has been designed to meet the learning needs of CN's railroaders - both current and future. These programs and initiatives provide a solid platform for the assessment and development of the Company's talent pool, and are tightly integrated with the Company's business strategy. Progress made in developing current and future leaders through the Company's leadership development programs is reviewed by the Human Resources and Compensation Committee of the Board of Directors. 2019 Highlights The Company completed a record capital expenditure program, investing approximately $3.9 billion in 2019, with increased spending on initiatives to increase capacity, particularly in the Company’s Western Region, supporting the Company’s ability to grow at low incremental cost. Financial highlights - 2019 compared to 2018 • • • Net income decreased by $112 million, or 3%, to $4,216 million and diluted earnings per share decreased by 1% to $5.83. Adjusted net income increased by $133 million, or 3%, to $4,189 million and adjusted diluted earnings per share increased by 5% to $5.80. (1) Operating income increased by $100 million, or 2%, to $5,593 million and adjusted operating income increased by $188 million, or 3%, to $5,708 million. (1) Operating ratio of 62.5%, an increase of 0.9 points and adjusted operating ratio of 61.7%, an increase of 0.2 points. (1) Revenues increased by $596 million, or 4%, to $14,917 million. Operating expenses increased by $496 million, or 6%, to $9,324 million. ROIC of 15.3%, a decrease of 1.4 points and adjusted ROIC of 15.1%, a decrease of 0.6 points. (2) The Company generated free cash flow of $1,992 million, a 21% decrease. (3) • • • • • (1) (2) (3) See the section of this MD&A entitled Adjusted performance measures for an explanation of these non-GAAP measures. See the section of this MD&A entitled Return on invested capital (ROIC) and adjusted ROIC for an explanation of these non-GAAP measures. See the section of this MD&A entitled Liquidity and capital resources – Free cash flow for an explanation of this non-GAAP measure. CN | 2019 Annual Report 5

Management's Discussion and Analysis Reinvestment in the business In 2019, CN spent approximately $3.9 billion in its capital program, with $1.6 billion invested to maintain the safety and integrity of the network, particularly track infrastructure. CN's capital spending also included $1.2 billion on strategic initiatives to increase capacity, enable growth and improve network resiliency, including line capacity upgrades and information technology initiatives, $0.9 billion on equipment capital expenditures, including the acquisition of 154 new high-horsepower locomotives and 560 new grain hopper cars, and $0.2 billion on implementation of Positive Train Control (PTC), the safety technology system mandated by the U.S. Congress. Acquisitions On December 2, 2019, following satisfaction of all closing conditions, the Company acquired the intermodal temperature-controlled transportation division of the Alberta-based H&R Transport Limited ("H&R"). The acquisition positions CN to expand its presence in moving customer goods by offering more end to end rail supply chain solutions to a wider range of customers. H&R results of operations have been included in the Company's results of operations since the acquisition date, December 2, 2019. H&R revenues are included as freight revenues in the intermodal commodity group. On August 29, 2019, the Company announced it had reached an agreement to acquire the Massena rail line from CSX Corporation, which represents more than 220 miles of track between Valleyfield, Quebec, and Woodard, New York. The acquisition will allow CN to continue to expand its network and foster additional supply chain solutions. The acquisition remains subject to regulatory review. On March 20, 2019, following satisfaction of all closing conditions, the Company acquired the Manitoba-based TransX Group of Companies ("TransX"). TransX provides various transportation and logistics services, including intermodal, truckload, less than truckload and specialized services. The acquisition positions CN to strengthen its intermodal business, and allows the Company to expand capacity and foster additional supply chain solutions, to continue to create value for customers. TransX's results of operations have been included in the Company's results of operations, since the acquisition date, March 20, 2019. TransX’s revenues are included as freight revenues in the intermodal commodity group. The inclusion of TransX’s results of operations impacted the Company’s Revenues and Operating expenses, in particular Purchased services and material and Labor and fringe benefits, for the year ended December 31, 2019 when compared to 2018. See the section of this MD&A entitled Liquidity and capital resources - Investing activities for additional information. Shareholder returns The Company repurchased 14.3 million of its common shares during the year, returning $1.7 billion to its shareholders. CN also increased its quarterly dividend per share by 18% to $0.5375 from $0.4550 in 2018, effective for the first quarter of 2019, and paid $1.5 billion in dividends in 2019. Sustainability The Company's sustainability practices once again earned it a place on the Dow Jones Sustainability World and North American Indices, for the 8th and 11th consecutive year, respectively. CN is the only Canadian company and the only North American railroad listed in the Transportation and Transportation Infrastructure sector World Index. In addition, CN also ranked among Corporate Knights’ 2020 Global 100 Most Sustainable Corporations in the World. 2020 Business outlook and assumptions For 2020, the Company expects growth across a range of commodities, particularly in petroleum crude, intermodal traffic, Canadian coal exports and refined petroleum products; as well as lower volumes of U.S coal exports, U.S. grain, frac sand, and lumber and panels. Underpinning the 2020 business outlook, the Company assumes that North American industrial production will increase in the range of 0.5 to one percent. For the 2019/2020 crop year, the grain crop in Canada was in line with its three-year average and the U.S. grain crop was below its three-year average. The Company assumes that the 2020/2021 grain crops in both Canada and the U.S. will be in line with their respective three-year averages. Future value creation Reinvestment in the business In 2020, CN plans to invest approximately $3.0 billion in its capital program, of which $1.6 billion is targeted toward track and railway infrastructure maintenance to support safe and efficient operations. A further $0.8 billion is expected to be spent on initiatives to increase capacity and enable growth, such as track infrastructure expansion; investments in yards and intermodal terminals; and on information technology to improve safety performance, operational efficiency and customer service. CN's equipment capital expenditures are targeted to reach $0.4 billion in 2020, allowing the Company to tap growth opportunities and improve the quality of the fleet. In order to handle expected traffic increase and improve operational efficiency, CN expects to take delivery of 41 new high-horsepower locomotives and 240 new grain hopper cars. In 2020, the Company plans to invest $0.2 billion associated with the U.S. federal government legislative PTC implementation. 6 CN | 2019 Annual Report

Management's Discussion and Analysis Shareholder returns On January 28, 2020, the Company's Board of Directors approved a new Normal Course Issuer Bid (NCIB) that allows for the repurchase of up to 16 million common shares between February 1, 2020 and January 31, 2021. In addition, on that same day, the Company's Board of Directors approved an increase of 7% to the quarterly dividend to common shareholders, from $0.5375 per share in 2019 to $0.5750 per share in 2020, effective for the first quarter. The forward-looking statements discussed in this section are subject to risks and uncertainties that could cause actual results or performance to differ materially from those expressed or implied in such statements and are based on certain factors and assumptions which the Company considers reasonable, about events, developments, prospects and opportunities that may not materialize or that may be offset entirely or partially by other events and developments. In addition to the assumptions and expectations discussed in this section, reference should be made to the section of this MD&A entitled Forward-looking statements for assumptions and risk factors affecting such statements. Forward-looking statements Certain statements included in this MD&A are "forward-looking statements" within the meaning of the United States Private Securities Litigation Reform Act of 1995 and under Canadian securities laws. By their nature, forward-looking statements involve risks, uncertainties and assumptions. The Company cautions that its assumptions may not materialize and that current economic conditions render such assumptions, although reasonable at the time they were made, subject to greater uncertainty. Forward-looking statements may be identified by the use of terminology such as "believes," "expects," "anticipates," "assumes," "outlook," "plans," "targets" or other similar words. Forward-looking statements include, but are not limited to, those set forth in the table below, which also presents key assumptions used in determining the forward-looking statements. See also the section of this MD&A entitled Strategy overview - 2020 Business outlook and assumptions. Forward-looking statements Key assumptions Statements relating to revenue growth opportunities, including those referring to general economic and business conditions • • North American and global economic growth Long-term growth opportunities being less affected by current economic conditions Statements relating to the Company's ability to meet debt repayments and future obligations in the foreseeable future, including income tax payments, and capital spending • • • • • North American and global economic growth Adequate credit ratios Investment-grade credit ratings Access to capital markets Adequate cash generated from operations and other sources of financing Statements relating to pension contributions • • • Adequate cash generated from operations and other sources of financing Adequate long-term return on investment on pension plan assets Level of funding as determined by actuarial valuations, particularly influenced by discount rates for funding purposes Forward-looking statements are not guarantees of future performance and involve risks, uncertainties and other factors which may cause the actual results or performance of the Company to be materially different from the outlook or any future results or performance implied by such statements. Accordingly, readers are advised not to place undue reliance on forward-looking statements. Important risk factors that could affect the forward-looking statements include, but are not limited to, the effects of general economic and business conditions; industry competition; inflation, currency and interest rate fluctuations; changes in fuel prices; legislative and/or regulatory developments; compliance with environmental laws and regulations; actions by regulators; increases in maintenance and operating costs; security threats; reliance on technology and related cybersecurity risk; trade restrictions or other changes to international trade arrangements; transportation of hazardous materials; various events which could disrupt operations, including natural events such as severe weather, droughts, fires, floods and earthquakes; climate change; labor negotiations and disruptions; environmental claims; uncertainties of investigations, proceedings or other types of claims and litigation; risks and liabilities arising from derailments; timing and completion of capital programs; and other risks detailed from time to time in reports filed by CN with securities regulators in Canada and the U.S., including its Annual Information Form and Form 40-F. See the section entitled Business risks of this MD&A for a description of major risk factors. Forward-looking statements reflect information as of the date on which they are made. CN assumes no obligation to update or revise forward-looking statements to reflect future events, changes in circumstances, or changes in beliefs, unless required by applicable securities CN | 2019 Annual Report 7

Management's Discussion and Analysis laws. In the event CN does update any forward-looking statement, no inference should be made that CN will make additional updates with respect to that statement, related matters, or any other forward-looking statement. Financial outlook During the year, the Company issued and updated its 2019 financial outlook. On December 3, 2019, following the impact of an 8-day conductor strike in late November, CN revised its 2019 financial outlook, remaining focused on continuing to realign its resources in light of the weaker demand. The 2019 actual results were in line with the Company's last 2019 financial outlook. Financial highlights Change Favorable/(Unfavorable) 2019 2018 2017 2019 vs 2018 2018 vs 2017 In millions, except percentage and per share data Revenues Operating income Adjusted operating income (1) Net income Adjusted net income (1) Basic earnings per share Adjusted basic earnings per share (1) Diluted earnings per share Adjusted diluted earnings per share (1) Dividends declared per share Total assets Total long-term liabilities Operating ratio Adjusted operating ratio (1) Free cash flow (2) $ $ $ $ $ $ $ $ $ $ $ $ 14,917 5,593 5,708 4,216 4,189 5.85 5.81 5.83 5.80 2.15 43,784 21,456 62.5% 61.7% 1,992 $ $ $ $ $ $ $ $ $ $ $ $ 14,321 5,493 5,520 4,328 4,056 5.89 5.52 5.87 5.50 1.82 41,214 20,073 61.6% 61.5% 2,514 $ $ $ $ $ $ $ $ $ $ $ $ 13,041 5,243 5,243 5,484 3,778 7.28 5.02 7.24 4.99 1.65 37,629 16,990 59.8% 59.8% 2,778 4% 2% 3% (3%) 3% (1%) 5% (1%) 5% 18% 6% (7%) (0.9)-pts (0.2)-pts (21%) 10% 5% 5% (21%) 7% (19%) 10% (19%) 10% 10% 10% (18%) (1.8)-pts (1.7)-pts (10%) $ $ $ (1) See the section of this MD&A entitled Adjusted performance measures for an explanation of these non-GAAP measures. (2) See the section of this MD&A entitled Liquidity and capital resources – Free cash flow for an explanation of this non-GAAP measure. 2019 compared to 2018 Net income for the year ended December 31, 2019 was $4,216 million, a decrease of $112 million, or 3%, when compared to 2018, and diluted earnings per share decreased by 1% to $5.83. Operating income for the year ended December 31, 2019 increased by $100 million, or 2%, to $5,593 million. The increase mainly reflects increased petroleum and crude and intermodal revenues; partly offset by higher purchased services and material expense, as well as higher depreciation and amortization expense. The operating ratio, defined as operating expenses as a percentage of revenues, was 62.5% in 2019, compared to 61.6% in 2018. Revenues for the year ended December 31, 2019 were $14,917 million compared to $14,321 million in 2018. The increase of $596 million, or 4%, was mainly attributable to freight rate increases, the inclusion of TransX in the intermodal commodity group within the domestic market, the positive translation impact of a weaker Canadian dollar and higher volumes of petroleum crude, natural gas liquids and refined petroleum products in the first nine months. These factors were partly offset by lower volumes of a broad range of forest products, reduced U.S. thermal coal exports via the Gulf Coast and lower shipments of frac sand. Operating expenses for the year ended December 31, 2019 were $9,324 million compared to $8,828 million in 2018. The increase of $496 million, or 6%, was mainly due to increased purchased services and material expense, due to the inclusion of TransX, higher depreciation expense and the negative translation impact of a weaker Canadian dollar; partly offset by lower fuel prices. 8 CN | 2019 Annual Report

Management's Discussion and Analysis Non-GAAP measures This MD&A makes reference to non-GAAP measures including adjusted performance measures, constant currency, ROIC and adjusted ROIC, free cash flow, and adjusted debt-to-adjusted EBITDA multiple that do not have any standardized meaning prescribed by GAAP and therefore, may not be comparable to similar measures presented by other companies. From management's perspective, these non-GAAP measures are useful measures of performance and provide investors with supplementary information to assess the Company's results of operations and liquidity. These non-GAAP measures should not be considered in isolation or as a substitute for financial measures prepared in accordance with GAAP. For further details of these non-GAAP measures, including a reconciliation to the most directly comparable GAAP financial measures, refer to the sections entitled Adjusted performance measures, Constant currency, Return on invested capital (ROIC) and adjusted ROIC, and Liquidity and capital resources. Adjusted performance measures Management believes that adjusted net income, adjusted earnings per share, adjusted operating income and adjusted operating ratio are useful measures of performance that can facilitate period-to-period comparisons, as they exclude items that do not necessarily arise as part of CN's normal day-to-day operations and could distort the analysis of trends in business performance. Management uses adjusted performance measures, which exclude certain income and expense items in its results that management believes are not reflective of CN's underlying business operations, to set performance goals and as a means to measure CN's performance. The exclusion of such income and expense items in these measures does not, however, imply that these items are necessarily non-recurring. These measures do not have any standardized meaning prescribed by GAAP and therefore, may not be comparable to similar measures presented by other companies. For the year ended December 31, 2019, the Company reported adjusted net income of $4,189 million, or $5.80 per diluted share, which excludes employee termination benefits and severance costs related to a workforce reduction program of $31 million, or $23 million after-tax ($0.03 per diluted share) in the fourth quarter; a deferred income tax recovery of $112 million ($0.15 per diluted share or $0.16 per basic share) in the second quarter, resulting from the enactment of a lower provincial corporate income tax rate; and a depreciation expense of $84 million, or $62 million after-tax ($0.09 per diluted share) in the first quarter, related to costs previously capitalized for a PTC back office system following the deployment of a replacement system. For the year ended December 31, 2018, the Company reported adjusted net income of $4,056 million, or $5.50 per diluted share, which excludes employee termination benefits and severance costs related to a workforce reduction program of $27 million, or $20 million after-tax ($0.03 per diluted share) in the fourth quarter and gains on disposal of property of $338 million, or $292 million after-tax ($0.40 per diluted share), consisting of the following: • in the fourth quarter, a gain previously deferred on the 2014 disposal of a segment of the Guelph subdivision located between Georgetown and Kitchener, Ontario, together with the rail fixtures and certain passenger agreements (the "Guelph"), of $79 million, or $70 million after-tax ($0.10 per diluted share); in the third quarter, a gain on disposal of property located in Montreal, Quebec (the "Doney and St-Francois Spurs") of $36 million, or $32 million after-tax ($0.04 per diluted share); and in the second quarter, a gain on transfer of the Company's finance lease in the passenger rail facilities in Montreal, Quebec, together with its interests in related railway operating agreements (the "Central Station Railway Lease"), of $184 million, or $156 million after-tax ($0.21 per diluted share), and a gain on disposal of land located in Calgary, Alberta, excluding the rail fixtures (the "Calgary Industrial Lead"), of $39 million, or $34 million after-tax ($0.05 per diluted share). For the year ended December 31, 2017, the Company reported adjusted net income of $3,778 million, or $4.99 per diluted share, which • • excludes a net deferred income tax recovery of $1,706 million ($2.25 per diluted share or $2.26 per basic share) consisting of the following: • in the fourth quarter, a deferred income tax recovery of $1,764 million ($2.33 per diluted share or $2.34 per basic share) resulting from the enactment of a lower U.S. federal corporate income tax rate due to the Tax Cuts and Jobs Act ("U.S. Tax Reform") and a deferred income tax expense of $50 million ($0.07 per diluted share) resulting from the enactment of higher provincial corporate income tax rates; in the third quarter, a deferred income tax expense of $31 million ($0.04 per diluted share) resulting from the enactment of a higher state corporate income tax rate; in the second quarter, a deferred income tax recovery of $18 million ($0.02 per diluted share) resulting from the enactment of a lower provincial corporate income tax rate; and in the first quarter, a deferred income tax recovery of $5 million ($0.01 per diluted share) resulting from the enactment of a lower provincial corporate income tax rate. • • • CN | 2019 Annual Report 9

Management's Discussion and Analysis The following table provides a reconciliation of net income and earnings per share, as reported for the years ended December 31, 2019, 2018 and 2017, to the adjusted performance measures presented herein: 2019 2018 2017 In millions, except per share data Year ended December 31, Net income Adjustments: Operating expenses Other income Income tax expense (recovery) (1) $ 4,216 $ 4,328 $ 5,484 115 — (142) 27 (338) 39 — — (1,706) Adjusted net income $ 4,189 $ 4,056 $ 3,778 Basic earnings per share Impact of adjustments, per share $ 5.85 (0.04) $ 5.89 (0.37) $ 7.28 (2.26) Adjusted basic earnings per share $ 5.81 $ 5.52 $ 5.02 Diluted earnings per share Impact of adjustments, per share $ 5.83 (0.03) $ 5.87 (0.37) $ 7.24 (2.25) Adjusted diluted earnings per share $ 5.80 $ 5.50 $ 4.99 (1) The tax effect of adjustments reflects tax rates in the applicable jurisdiction and the nature of the item for tax purposes. The following table provides a reconciliation of operating income and operating ratio, as reported for the years ended December 31, 2019, 2018 and 2017, to the adjusted performance measures presented herein: 2019 2018 2017 In millions, except percentage Year ended December 31, Operating income Adjustment: Operating expenses $ 5,593 115 $ 5,493 27 $ 5,243 — Adjusted operating income $ 5,708 $ 5,520 $ 5,243 Operating ratio (1) Impact of adjustment 62.5% (0.8)-pts 61.6% (0.1)-pts 59.8% — Adjusted operating ratio 61.7% 61.5% 59.8% (1) Operating ratio is defined as operating expenses as a percentage of revenues. Constant currency Financial results at constant currency allow results to be viewed without the impact of fluctuations in foreign currency exchange rates, thereby facilitating period-to-period comparisons in the analysis of trends in business performance. Measures at constant currency are considered non-GAAP measures and do not have any standardized meaning prescribed by GAAP and therefore, may not be comparable to similar measures presented by other companies. Financial results at constant currency are obtained by translating the current period results denominated in US dollars at the foreign exchange rates of the comparable period of the prior year. The average foreign exchange rates were $1.33 and $1.30 per US$1.00, for the years ended December 31, 2019 and 2018, respectively. On a constant currency basis, the Company's net income for the year ended December 31, 2019 would have been lower by $65 million ($0.09 per diluted share). 10 CN | 2019 Annual Report
Management's Discussion and Analysis Return on invested capital (ROIC) and adjusted ROIC Management believes ROIC and adjusted ROIC are useful measures of the efficiency in the use of capital funds. The Company calculates ROIC as return divided by average invested capital. Return is defined as net income plus interest expense after-tax, calculated using the Company's effective tax rate. Average invested capital is defined as the sum of total shareholders' equity, long-term debt and current portion of long-term debt less cash and cash equivalents, and restricted cash and cash equivalents, averaged between the beginning and ending balance over a twelve-month period. The Company calculates adjusted ROIC as adjusted return divided by average invested capital. Adjusted return is defined as adjusted net income plus interest expense after-tax, calculated using the Company's effective tax rate, excluding the tax effect of adjustments used to determine adjusted net income. ROIC and adjusted ROIC do not have any standardized meaning prescribed by GAAP and therefore, may not be comparable to similar measures presented by other companies. The following table provides a reconciliation of net income and adjusted net income to return and adjusted return, respectively, as well as the calculation of average invested capital, which have been used to calculate ROIC and adjusted ROIC: 2019 2018 2017 In millions, except percentage As at and for the year ended December 31, Net income Interest expense Tax on interest expense (1) $ 4,216 538 (120) $ 4,328 489 (116) $ 5,484 481 (124) Return $ 4,634 $ 4,701 $ 5,841 Average total shareholders' equity Average long-term debt Average current portion of long-term debt Less: Average cash, cash equivalents, restricted cash and restricted cash equivalents $ 17,841 11,626 1,557 (674) $ 17,149 10,067 1,632 (656) $ 15,749 9,098 1,785 (613) Average invested capital $ 30,350 $ 28,192 $ 26,019 ROIC 15.3% 16.7% 22.4% Adjusted net income (2) Interest expense Adjusted tax on interest expense (3) $ 4,189 538 (131) $ 4,056 489 (120) $ 3,778 481 (124) Adjusted return Average invested capital $ $ 4,596 30,350 $ $ 4,425 28,192 $ $ 4,135 26,019 Adjusted ROIC 15.1% 15.7% 15.9% (1) The effective tax rate for 2019 used to calculate the tax on interest expense was 22.3% (2018 - 23.8%; 2017 - 25.8%). Due to the negative effective tax rate reported by the Company in 2017, tax on interest expense for 2017 was calculated using an adjusted effective tax rate. See the section of this MD&A entitled Adjusted performance measures for an explanation of this non-GAAP measure. The adjusted effective tax rate for 2019 used to calculate the adjusted tax on interest expense was 24.4% (2018 - 24.5%; 2017 - 25.8%). (2) (3) CN | 2019 Annual Report 11

Management's Discussion and Analysis Revenues % Change at constant currency 2019 2018 % Change In millions, unless otherwise indicated Year ended December 31, Freight revenues Other revenues $ 14,198 719 $ 13,548 773 5% (7%) 3% (8%) Total revenues $ 14,917 $ 14,321 4% 3% Freight revenues Petroleum and chemicals Metals and minerals Forest products Coal Grain and fertilizers Intermodal Automotive $ 3,052 1,643 1,808 658 2,392 3,787 858 $ 2,660 1,689 1,886 661 2,357 3,465 830 15% (3%) (4%) —% 1% 9% 3% 13% (5%) (6%) (2%) —% 8% 1% Total freight revenues $ 14,198 $ 13,548 5% 3% Revenue ton miles (RTMs) (millions) Freight revenue/RTM (cents) Carloads (thousands) Freight revenue/carload ($) 241,954 5.87 5,912 2,402 248,383 5.45 5,976 2,267 (3%) 8% (1%) 6% (3%) 6% (1%) 4% Revenues for the year ended December 31, 2019, totaled $14,917 million compared to $14,321 million in 2018. The increase of $596 million, or 4%, was mainly attributable to freight rate increases, the inclusion of TransX in the intermodal commodity group within the domestic market, the positive translation impact of a weaker Canadian dollar and higher volumes of petroleum crude, natural gas liquids and refined petroleum products in the first nine months. These factors were partly offset by lower volumes of a broad range of forest products, reduced U.S. thermal coal exports via the Gulf Coast and lower shipments of frac sand. Fuel surcharge revenues decreased by $31 million in 2019, as a result of lower applicable fuel surcharge rates, partly offset by the positive translation impact of a weaker Canadian dollar. In 2019, RTMs, measuring the weight and distance of freight transported by the Company, declined by 3% relative to 2018. Freight revenue per RTM increased by 8% in 2019 when compared to 2018, mainly driven by freight rate increases, the inclusion of TransX in the intermodal commodity group and the positive translation impact of a weaker Canadian dollar. Petroleum and chemicals % Change at constant currency 2019 2018 % Change Year ended December 31, Revenues (millions) RTMs (millions) Revenue/RTM (cents) Carloads (thousands) $ 3,052 53,989 5.65 688 $ 2,660 50,722 5.24 653 15% 6% 8% 5% 13% 6% 6% 5% The petroleum and chemicals commodity group comprises a wide range of commodities, including chemicals and plastics, refined petroleum products, natural gas liquids, crude oil and sulfur. The primary markets for these commodities are within North America, and as such, the performance of this commodity group is closely correlated with the North American economy as well as oil and gas production. Most of the Company's petroleum and chemicals shipments originate in the Louisiana petrochemical corridor between New Orleans and Baton Rouge; in Western Canada, a key oil and gas development area and a major center for natural gas feedstock and world-scale petrochemicals and plastics; and in eastern Canadian regional plants. For the year ended December 31, 2019, revenues for this commodity group increased by $392 million, or 15%, when compared to 2018, mainly due to higher volumes of petroleum crude, natural gas liquids and refined petroleum products in the first nine months; freight rate increases and the positive translation impact of a weaker Canadian dollar. Revenue per RTM increased by 8% in 2019 when compared to 2018, mainly due to freight rate increases and the positive translation impact of a weaker Canadian dollar. 12 CN | 2019 Annual Report

Management's Discussion and Analysis Percentage of commodity group revenues 2019 2018 Refined petroleum products Chemicals and plastics Crude and condensate Sulfur 38% 36% 22% 4% 36% 39% 21% 4% Metals and minerals % Change at constant currency 2019 2018 % Change Year ended December 31, Revenues (millions) RTMs (millions) Revenue/RTM (cents) Carloads (thousands) $ 1,643 25,449 6.46 1,008 $ 1,689 27,993 6.03 1,030 (3%) (9%) 7% (2%) (5%) (9%) 5% (2%) The metals and minerals commodity group consists primarily of materials related to oil and gas development, steel, iron ore, non-ferrous base metals and ores, construction materials, machinery, railway equipment, and dimensional (large) loads. The Company provides unique rail access to base metals, iron ore and frac sand mining as well as aluminum and steel producing regions, which are among the most important in North America. This strong origin franchise, coupled with the Company's access to port facilities and the end markets for these commodities, has made CN a leader in the transportation of metals and minerals products. The key drivers for this market segment are oil and gas development, automotive production, and non-residential construction. For the year ended December 31, 2019, revenues for this commodity group decreased by $46 million, or 3%, when compared to 2018, mainly due to lower volumes of frac sand and a broad range of metal products; partly offset by freight rate increases and the positive translation impact of a weaker Canadian dollar. Revenue per RTM increased by 7% in 2019 when compared to 2018, mainly due to a decrease in the average length of haul, freight rate increases and the positive translation impact of a weaker Canadian dollar. Percentage of commodity group revenues 2019 2018 Metals Minerals Energy materials Iron ore 30% 27% 26% 17% 30% 24% 30% 16% Forest products % Change at constant currency 2019 2018 % Change Year ended December 31, Revenues (millions) RTMs (millions) Revenue/RTM (cents) Carloads (thousands) $ 1,808 27,187 6.65 375 $ 1,886 29,918 6.30 418 (4%) (9%) 6% (10%) (6%) (9%) 3% (10%) The forest products commodity group includes various types of lumber, panels, paper, wood pulp and other fibers such as logs, recycled paper, wood chips, and wood pellets. The Company has extensive rail access to the western and eastern Canadian fiber-producing regions, which are among the largest fiber source areas in North America. In the U.S., the Company is strategically located to serve both the Midwest and southern U.S. corridors with interline connections to other Class I railroads. The key drivers for the various commodities are: for lumber and panels, housing starts and renovation activities primarily in the U.S.; for fibers (mainly wood pulp), the consumption of paper, pulpboard and tissue in North American and offshore markets; and for newsprint, advertising lineage, non-print media and overall economic conditions, primarily in the U.S. For the year ended December 31, 2019, revenues for this commodity group decreased by $78 million, or 4%, when compared to 2018, mainly due to lower volumes of a broad range of forest products, partly offset by freight rate increases and the positive translation impact of a weaker Canadian dollar. CN | 2019 Annual Report 13
Management's Discussion and Analysis Revenue per RTM increased by 6% in 2019 when compared to 2018, mainly due to freight rate increases and the positive translation impact of a weaker Canadian dollar. Percentage of commodity group revenues 2019 2018 Lumber Pulp Paper Panels 38% 30% 18% 14% 40% 29% 18% 13% Coal % Change at constant currency 2019 2018 % Change Year ended December 31, Revenues (millions) RTMs (millions) Revenue/RTM (cents) Carloads (thousands) $ 658 17,653 3.73 335 $ 661 17,927 3.69 346 —% (2%) 1% (3%) (2%) (2%) —% (3%) The coal commodity group consists of thermal grades of bituminous coal, metallurgical coal and petroleum coke. Canadian thermal and metallurgical coal are largely exported via terminals on the west coast of Canada to offshore markets. In the U.S., thermal coal is transported from mines served in southern Illinois, or from western U.S. mines via interchange with other railroads, to major utilities in the Midwest and Southeast U.S., as well as offshore markets via terminals on the U.S. Gulf Coast. Petroleum coke, a by-product of the oil refining process, is exported to offshore markets via terminals on the west coast of Canada and the U.S. Gulf Coast, as well as shipped to industrial users in domestic markets. The key drivers for this market segment are weather conditions, environmental regulations, global supply and demand conditions, and for U.S. domestic coal, the price of natural gas. For the year ended December 31, 2019, revenues for this commodity group remained flat when compared to 2018, mainly due to lower U.S. thermal coal exports via the Gulf Coast; offset by higher metallurgical and thermal coal exports via west coast ports and freight rate increases. Revenue per RTM increased by 1% in 2019 when compared to 2018, mainly due to freight rate increases. Percentage of commodity group revenues 2019 2018 Canadian coal - export Petroleum coke U.S. coal - export U.S. coal - domestic 40% 22% 19% 19% 30% 21% 33% 16% Grains and fertilizers % Change at constant currency 2019 2018 % Change Year ended December 31, Revenues (millions) RTMs (millions) Revenue/RTM (cents) Carloads (thousands) $ 2,392 55,597 4.30 619 $ 2,357 57,819 4.08 632 1% (4%) 5% (2%) —% (4%) 4% (2%) The grain and fertilizers commodity group depends primarily on crops grown and fertilizers processed in Western Canada and the U.S. Midwest. The grain segment consists of wheat, oats, barley, flaxseed, rye, peas, lentils, corn, ethanol, dried distillers grain, canola seed and canola products, soybeans and soybean products. Production of grain varies considerably from year to year, affected primarily by weather conditions, seeded and harvested acreage, the mix of grains produced and crop yields. Grain exports are sensitive to the size and quality of the crop produced, international market conditions and foreign government policy. The majority of grain produced in Western Canada and moved by CN is exported via the ports of Vancouver, Prince Rupert and Thunder Bay. These rail movements are subject to government regulation that establishes a maximum revenue entitlement that railways can earn. Although railway companies are free to set freight rates for western grain shipments, total revenue is limited based on a formula that takes into account tonnage, length of haul, and a specified price index. Shipments of grain that are exported to the U.S. are not regulated. Grain grown in the U.S. Midwest is exported as well as transported to domestic processing 14 CN | 2019 Annual Report
Management's Discussion and Analysis facilities and feed markets. The Company also serves major producers of potash in Canada, as well as producers of ammonium nitrate, urea and other fertilizers across Canada and the U.S. The key drivers for fertilizers are input prices, demand, government policies, and international competition. For the year ended December 31, 2019, revenues for this commodity group increased by $35 million, or 1%, when compared to 2018, mainly due to freight rate increases, the positive translation impact of a weaker Canadian dollar and higher U.S. soybean exports; partly offset by lower volumes of potash. Revenue per RTM increased by 5% in 2019 when compared to 2018, mainly due to freight rate increases and the positive translation impact of a weaker Canadian dollar. Percentage of commodity group revenues 2019 2018 Canadian grain - regulated U.S. grain - domestic Canadian grain - commercial Fertilizers - potash Fertilizers - other U.S. grain - exports 42% 19% 13% 10% 10% 6% 40% 19% 14% 13% 9% 5% Intermodal % Change at constant currency 2019 2018 % Change Year ended December 31, Revenues (millions) RTMs (millions) Revenue/RTM (cents) Carloads (thousands) $ 3,787 58,344 6.49 2,618 $ 3,465 60,120 5.76 2,634 9% (3%) 13% (1%) 8% (3%) 12% (1%) The intermodal commodity group includes rail and trucking services and is comprised of two markets: domestic intermodal and international intermodal. Domestic intermodal transports consumer products and manufactured goods, serving both retail and wholesale channels, within domestic Canada, domestic U.S., Mexico and transborder, while international intermodal handles import and export container traffic, serving the major ports of Vancouver, Prince Rupert, Montreal, Halifax, New Orleans and Mobile. CN's network of inland intermodal terminals are located near ports and large urban centers, which connects customers to major markets in North America and overseas. Domestic intermodal is driven by consumer markets, with growth generally tied to the economy. International intermodal is driven by North American economic and trade conditions. Revenues for TransX and H&R are included in this commodity group within the domestic market. For the year ended December 31, 2019, revenues for this commodity group increased by $322 million, or 9%, when compared to 2018, mainly due to the inclusion of TransX, higher international container traffic via the Port of Prince Rupert, freight rate increases and the positive translation impact of a weaker Canadian dollar; partly offset by lower international container traffic via the Port of Vancouver and reduced domestic retail volumes, as well as lower applicable fuel surcharge rates. Revenue per RTM increased by 13% in 2019 when compared to 2018, mainly due to the inclusion of TransX, freight rate increases and the positive translation impact of a weaker Canadian dollar. Percentage of commodity group revenues 2019 2018 International Domestic 68% 32% 67% 33% CN | 2019 Annual Report 15
Management's Discussion and Analysis Automotive % Change at constant currency 2019 2018 % Change Year ended December 31, Revenues (millions) RTMs (millions) Revenue/RTM (cents) Carloads (thousands) $ 858 3,735 22.97 269 $ 830 3,884 21.37 263 3% (4%) 7% 2% 1% (4%) 5% 2% The automotive commodity group moves both domestic finished vehicles and parts throughout North America, providing service to certain vehicle assembly plants in Ontario, Michigan and Mississippi. The Company also serves vehicle distribution facilities in Canada and the U.S., as well as parts production facilities in Michigan and Ontario. The Company serves shippers of finished vehicle imports via the ports of Halifax and Vancouver, and through interchange with other railroads. CN's broad network of auto compounds is used to facilitate distribution of vehicles throughout Canada and the U.S. Midwest. The primary drivers for this market are automotive production and sales in North America, which are driven by the average age of vehicles in North America and the price of fuel. For the year ended December 31, 2019, revenues for this commodity group increased by $28 million, or 3%, when compared to 2018, mainly due to higher volumes of domestic finished vehicles and vehicle parts in the first nine months, the positive translation impact of a weaker Canadian dollar and freight rate increases; partly offset by lower import volumes of finished vehicles via the Port of Halifax. Revenue per RTM increased by 7% in 2019 when compared to 2018, mainly due to a decrease in the average length of haul, the positive translation impact of a weaker Canadian dollar and freight rate increases. Percentage of commodity group revenues 2019 2018 Finished vehicles Auto parts 93% 7% 94% 6% Other revenues % Change at constant currency 2019 2018 % Change Year ended December 31, Revenues (millions) $ 719 $ 773 (7%) (8%) Other revenues are derived from non-rail logistics services that support the Company's rail business including vessels and docks, transloading and distribution, automotive logistics, and freight forwarding and transportation management. For the year ended December 31, 2019, Other revenues decreased by $54 million, or 7%, when compared to 2018, mainly due to lower revenues from vessels. Percentage of other revenues 2019 2018 Vessels and docks Other non-rail services Other revenues 47% 44% 9% 50% 42% 8% 16 CN | 2019 Annual Report

Management's Discussion and Analysis Operating expenses Operating expenses for the year ended December 31, 2019, amounted to $9,324 million compared to $8,828 million in 2018. The increase of $496 million, or 6%, was mainly due to increased purchased services and material expense, due to the inclusion of TransX, higher depreciation expense and the negative translation impact of a weaker Canadian dollar; partly offset by lower fuel prices. % Change at constant currency 2019 2018 % Change In millions Year ended December 31, Labor and fringe benefits Purchased services and material Fuel Depreciation and amortization Equipment rents Casualty and other $ 2,922 2,267 1,637 1,562 444 492 $ 2,860 1,971 1,732 1,329 467 469 (2%) (15%) 5% (18%) 5% (5%) (1%) (14%) 8% (16%) 7% (3%) Total operating expenses $ 9,324 $ 8,828 (6%) (4%) Labor and fringe benefits Labor and fringe benefits expense includes wages, payroll taxes and employee benefits such as incentive compensation, including stock-based compensation, health and welfare, current service cost for pensions and postretirement benefits. Certain incentive and stock-based compensation plans are based on financial performance targets and the related expense is recorded in relation to the attainment of such targets. Labor and fringe benefits expense increased by $62 million, or 2%, in 2019 when compared to 2018. The increase was primarily due to the inclusion of TransX, general wage increases and the negative translation impact of a weaker Canadian dollar; partly offset by lower incentive compensation. Purchased services and material Purchased services and material expense includes the cost of services purchased from outside contractors; materials used in the maintenance of the Company's track, facilities and equipment; transportation and lodging for train crew employees; utility costs; and the net costs of operating facilities jointly used by the Company and other railroads. Purchased services and material expense increased by $296 million, or 15%, in 2019 when compared to 2018. The increase was mainly due to the inclusion of TransX, higher repairs, maintenance and materials costs, higher costs for services purchased from outside contractors and the negative translation impact of a weaker Canadian dollar. Fuel Fuel expense includes fuel consumed by assets, including locomotives, vessels, vehicles and other equipment as well as federal, provincial and state fuel taxes. Fuel expense decreased by $95 million, or 5%, in 2019 when compared to 2018. The decrease was primarily due to lower fuel prices, decreased volumes of traffic and increased fuel productivity; partly offset by the negative translation impact of a weaker Canadian dollar. Depreciation and amortization Depreciation and amortization expense includes the costs associated with the use of properties and intangible assets over their estimated service lives. Depreciation expense is affected by capital additions, railroad property retirements from disposal, sale and/or abandonment and other adjustments including asset impairments. Depreciation and amortization expense increased by $233 million, or 18%, in 2019 when compared to 2018. The increase was mainly due to a higher depreciable asset base resulting from increased capital expenditures in recent years, an expense related to costs previously capitalized for a PTC back office system following the deployment of a replacement system and the negative translation impact of a weaker Canadian dollar. CN | 2019 Annual Report 17

Management's Discussion and Analysis Equipment rents Equipment rents expense includes rental expense for the use of freight cars owned by other railroads (car hire) or private companies and for the lease of freight cars, locomotives and intermodal equipment, net of rental income from other railroads for the use of the Company's freight cars (car hire) and locomotives. Equipment rents expense decreased by $23 million, or 5%, in 2019 when compared to 2018. The decrease was primarily due to lower costs for leased locomotives, partly offset by higher car hire expense and the negative translation impact of a weaker Canadian dollar. Casualty and other Casualty and other expense includes expenses for personal injuries, environmental, freight and property damage, insurance, bad debt, operating taxes, and travel expenses. Casualty and other expense increased by $23 million, or 5%, in 2019 when compared to 2018. The increase was mainly due to higher incident costs and the negative translation impact of a weaker Canadian dollar; partly offset by lower legal provisions. Other income and expenses Interest expense In 2019, Interest expense was $538 million compared to $489 million in 2018. The increase was mainly due to a higher average level of debt and the negative translation impact of a weaker Canadian dollar; partly offset by a lower average interest rate. Other components of net periodic benefit income In 2019, Other components of net periodic benefit income was $321 million compared to $302 million in 2018. The increase was mainly due to lower amortization of net actuarial loss, partly offset by higher interest cost. Other income In 2019, Other income was $53 million compared to $376 million in 2018. Included in Other income for 2018 was a gain previously deferred on the 2014 disposal of the Guelph of $79 million, a gain on disposal of the Doney and St-Francois Spurs of $36 million, a gain on the transfer of the Central Station Railway Lease of $184 million, and a gain on disposal of the Calgary Industrial Lead of $39 million. Income tax recovery (expense) On December 22, 2017, the President of the United States signed into law the U.S. Tax Reform, which reduced the U.S. federal corporate income tax rate from 35% to 21% effective as of January 1, 2018. The U.S. Tax Reform also allows for immediate capital expensing of new investments in certain qualified depreciable assets made after September 27, 2017, which will be phased down starting in year 2023. As a result of the U.S. Tax Reform, the Company's net deferred income tax liability decreased by $1,764 million for the year ended December 31, 2017. The U.S. Tax Reform introduced other important changes to U.S. corporate income tax laws including the creation of a new Base Erosion Anti-abuse Tax (BEAT) that subjects certain payments from U.S. corporations to foreign related parties to additional taxes and limitations to the deduction for net interest expense incurred by U.S. corporations. Since the enactment of the U.S. Tax Reform, U.S. authorities have issued various proposed and finalized regulations and guidance interpreting its provisions. These interpretations have been taken into account in calculating the Company's current year income tax provision and tax payments. The U.S. Tax Reform and these regulations are expected to impact the Company's income tax provisions and tax payments in future years. In 2019, the Company recorded an income tax expense of $1,213 million compared to an income tax expense of $1,354 million in 2018. Included in the 2019 figure was a deferred income tax recovery of $112 million recorded in the second quarter, resulting from the enactment of a lower provincial corporate income tax rate. The effective tax rate for 2019 was 22.3% compared to 23.8% in 2018. Excluding the aforementioned deferred income tax recovery, the effective tax rate for 2019 was 24.4% compared to 23.8% in 2018. The increase in the effective tax rate was mainly attributable to lower gains on disposal of property in 2019, taxed at the lower capital gain inclusion rate. For 2020, the Company anticipates the estimated annual effective tax rate to be in the range of 26.0%. The anticipated increase is due to the U.S. Tax Reform, and the related proposed and finalized regulations and interpretations issued as of December 2019. 18 CN | 2019 Annual Report
Management's Discussion and Analysis 2018 compared to 2017 Net income for the year ended December 31, 2018 was $4,328 million, a decrease of $1,156 million, or 21%, when compared to 2017, and diluted earnings per share decreased by 19% to $5.87. The decrease was primarily due to a deferred income tax recovery of $1,764 million ($2.33 per diluted share) resulting from the enactment of a lower U.S. federal corporate income tax rate due to the U.S. Tax Reform in 2017, partly offset by an increase in Operating income and Other income. Operating income for the year ended December 31, 2018 increased by $250 million, or 5%, to $5,493 million. The increase mainly reflects increased revenues from freight rate increases, higher applicable fuel surcharge rates and higher volumes, partly offset by higher costs from higher fuel prices and higher labor costs. The operating ratio was 61.6% in 2018, compared to 59.8% in 2017. Revenues for the year ended December 31, 2018 were $14,321 million compared to $13,041 million in 2017. The increase of $1,280 million, or 10%, was mainly attributable to freight rate increases, higher applicable fuel surcharge rates and higher volumes of petroleum crude, refined petroleum products, coal, international container traffic and Canadian grain. Operating expenses for the year ended December 31, 2018 were $8,828 million compared to $7,798 million in 2017. The increase of $1,030 million, or 13%, was mainly due to higher fuel prices, higher costs as a result of increased volumes of traffic and operating performance below 2017 levels. Constant currency Financial results at constant currency allow results to be viewed without the impact of fluctuations in foreign currency exchange rates, thereby facilitating period-to-period comparisons in the analysis of trends in business performance. Measures at constant currency are considered non-GAAP measures and do not have any standardized meaning prescribed by GAAP and therefore, may not be comparable to similar measures presented by other companies. Financial results at constant currency are obtained by translating the current period results denominated in US dollars at the foreign exchange rates of the comparable period of the prior year. The average foreign exchange rates were $1.296 and $1.298 per US$1.00, for the years ended December 31, 2018 and 2017, respectively. On a constant currency basis, the Company's net income for the year ended December 31, 2018 would have been higher by $4 million ($0.01 per diluted share). Revenues % Change at constant currency 2018 2017 % Change In millions, unless otherwise indicated Year ended December 31, Freight revenues Other revenues $ 13,548 773 $ 12,293 748 10% 3% 10% 3% Total revenues $ 14,321 $ 13,041 10% 10% Freight revenues Petroleum and chemicals Metals and minerals Forest products Coal Grain and fertilizers Intermodal Automotive $ 2,660 1,689 1,886 661 2,357 3,465 830 $ 2,208 1,523 1,788 535 2,214 3,200 825 20% 11% 5% 24% 6% 8% 1% 20% 11% 6% 24% 7% 8% 1% Total freight revenues $ 13,548 $ 12,293 10% 10% Revenue ton miles (RTMs) (millions) Freight revenue/RTM (cents) Carloads (thousands) Freight revenue/carload ($) 248,383 5.45 5,976 2,267 237,098 5.18 5,737 2,143 5% 5% 4% 6% 5% 5% 4% 6% Revenues for the year ended December 31, 2018, totaled $14,321 million compared to $13,041 million in 2017. The increase of $1,280 million, or 10%, was mainly attributable to freight rate increases, higher applicable fuel surcharge rates and higher volumes of petroleum crude, refined petroleum products, coal, international container traffic and Canadian grain. Fuel surcharge revenues increased by $395 million in 2018, as a result of higher applicable fuel surcharge rates. In 2018, RTMs increased by 5% relative to 2017. Freight revenue per RTM increased by 5% in 2018 when compared to 2017, mainly driven by freight rate increases and higher applicable fuel surcharge rates. CN | 2019 Annual Report 19

Management's Discussion and Analysis Petroleum and chemicals % Change at constant currency 2018 2017 % Change Year ended December 31, Revenues (millions) RTMs (millions) Revenue/RTM (cents) Carloads (thousands) $ 2,660 50,722 5.24 653 $ 2,208 44,375 4.98 614 20% 14% 5% 6% 20% 14% 5% 6% For the year ended December 31, 2018, revenues for this commodity group increased by $452 million, or 20%, when compared to 2017, mainly due to higher volumes of petroleum crude due to limited pipeline capacity and increased volumes of refined petroleum products, freight rate increases, and higher applicable fuel surcharge rates; partly offset by lower volumes of condensate. Revenue per RTM increased by 5% in 2018 when compared to 2017, mainly due to freight rate increases and higher applicable fuel surcharge rates; partly offset by an increase in the average length of haul. Metals and minerals % Change at constant currency 2018 2017 % Change Year ended December 31, Revenues (millions) RTMs (millions) Revenue/RTM (cents) Carloads (thousands) $ 1,689 27,993 6.03 1,030 $ 1,523 27,938 5.45 995 11% —% 11% 4% 11% —% 11% 4% For the year ended December 31, 2018, revenues for this commodity group increased by $166 million, or 11%, when compared to 2017, mainly due to freight rate increases; higher volumes of semi-finished steel products, and increased shipments of industrial materials and iron ore; and higher applicable fuel surcharge rates; partly offset by lower volumes of frac sand. Revenue per RTM increased by 11% in 2018 when compared to 2017, mainly due to freight rate increases and higher applicable fuel surcharge rates. Forest products % Change at constant currency 2018 2017 % Change Year ended December 31, Revenues (millions) RTMs (millions) Revenue/RTM (cents) Carloads (thousands) $ 1,886 29,918 6.30 418 $ 1,788 30,510 5.86 424 5% (2%) 8% (1%) 6% (2%) 8% (1%) For the year ended December 31, 2018, revenues for this commodity group increased by $98 million, or 5%, when compared to 2017, mainly due to freight rate increases and higher applicable fuel surcharge rates, partly offset by decreased volumes of lumber and woodpulp. Revenue per RTM increased by 8% in 2018 when compared to 2017, mainly due to freight rate increases and higher applicable fuel surcharge rates. 20 CN | 2019 Annual Report

Management's Discussion and Analysis Coal % Change at constant currency 2018 2017 % Change Year ended December 31, Revenues (millions) RTMs (millions) Revenue/RTM (cents) Carloads (thousands) $ 661 17,927 3.69 346 $ 535 14,539 3.68 303 24% 23% —% 14% 24% 23% —% 14% For the year ended December 31, 2018, revenues for this commodity group increased by $126 million, or 24%, when compared to 2017, mainly due to increased exports of U.S. thermal coal via the Gulf Coast, higher metallurgical coal exports via west coast ports, higher applicable fuel surcharge rates as well as freight rate increases. Revenue per RTM remained flat in 2018 when compared to 2017, mainly due to higher applicable fuel surcharge rates and freight rate increases, offset by an increase in the average length of haul. Grain and fertilizers % Change at constant currency 2018 2017 % Change Year ended December 31, Revenues (millions) RTMs (millions) Revenue/RTM (cents) Carloads (thousands) $ 2,357 57,819 4.08 632 $ 2,214 56,123 3.94 619 6% 3% 4% 2% 7% 3% 4% 2% For the year ended December 31, 2018, revenues for this commodity group increased by $143 million, or 6%, when compared to 2017, mainly due to freight rate increases, higher export volumes of Canadian wheat, peas and lentils, and higher applicable fuel surcharge rates; partly offset by reduced Canadian canola volumes, as well as lower export volumes of U.S. soybeans. Revenue per RTM increased by 4% in 2018 when compared to 2017, mainly due to freight rate increases and higher applicable fuel surcharge rates. Intermodal % Change at constant currency 2018 2017 % Change Year ended December 31, Revenues (millions) RTMs (millions) Revenue/RTM (cents) Carloads (thousands) $ 3,465 60,120 5.76 2,634 $ 3,200 59,356 5.39 2,514 8% 1% 7% 5% 8% 1% 7% 5% For the year ended December 31, 2018, revenues for this commodity group increased by $265 million, or 8%, when compared to 2017, mainly due to higher applicable fuel surcharge rates, increased international container traffic via the ports of Prince Rupert and Montreal, and freight rate increases; partly offset by lower international container traffic via the Port of Vancouver, as well as reduced domestic retail shipments. Revenue per RTM increased by 7% in 2018 when compared to 2017, mainly due to higher applicable fuel surcharge rates and freight rate increases. CN | 2019 Annual Report 21

Management's Discussion and Analysis Automotive % Change at constant currency 2018 2017 % Change Year ended December 31, Revenues (millions) RTMs (millions) Revenue/RTM (cents) Carloads (thousands) $ 830 3,884 21.37 263 $ 825 4,257 19.38 268 1% (9%) 10% (2%) 1% (9%) 11% (2%) For the year ended December 31, 2018, revenues for this commodity group increased by $5 million, or 1%, when compared to 2017, mainly due to higher applicable fuel surcharge rates and freight rate increases; partly offset by lower volumes of domestic finished vehicles. Revenue per RTM increased by 10% in 2018 when compared to 2017, mainly due to a decrease in the average length of haul, higher applicable fuel surcharge rates and freight rate increases. Other revenues % Change at constant currency 2018 2017 % Change Year ended December 31, Revenues (millions) $ 773 $ 748 3% 3% For the year ended December 31, 2018, Other revenues increased by $25 million, or 3%, when compared to 2017, mainly due to higher revenues from freight forwarding and transportation management services, and vessels and docks. Operating expenses Operating expenses for the year ended December 31, 2018 amounted to $8,828 million compared to $7,798 million in 2017. The increase of $1,030 million, or 13%, was mainly due to higher fuel prices, higher costs as a result of increased volumes of traffic and operating performance below 2017 levels. % Change at constant currency 2018 2017 % Change In millions Year ended December 31, Labor and fringe benefits Purchased services and material Fuel Depreciation and amortization Equipment rents Casualty and other $ 2,860 1,971 1,732 1,329 467 469 $ 2,536 1,769 1,362 1,281 418 432 (13%) (11%) (27%) (4%) (12%) (9%) (13%) (11%) (27%) (4%) (12%) (9%) Total operating expenses $ 8,828 $ 7,798 (13%) (13%) Labor and fringe benefits Labor and fringe benefits expense increased by $324 million, or 13%, in 2018 when compared to 2017. The increase was primarily due to higher headcount, general wage increases, higher overtime costs and training costs for new employees, higher pension expense, and employee termination benefits and severance costs related to a workforce reduction program in the fourth quarter. Purchased services and material Purchased services and material expense increased by $202 million, or 11%, in 2018 when compared to 2017. The increase was mainly due to higher costs of services purchased from outside contractors, higher trucking and transload costs, and higher repairs, maintenance and materials costs resulting mainly from increased volumes of traffic. Fuel Fuel expense increased by $370 million, or 27%, in 2018 when compared to 2017. The increase was primarily due to higher fuel prices and increased volumes of traffic. 22 CN | 2019 Annual Report
Management's Discussion and Analysis Depreciation and amortization Depreciation and amortization expense increased by $48 million, or 4%, in 2018 when compared to 2017. The increase was mainly due to net asset additions, partly offset by the favorable impact of depreciation studies. Equipment rents Equipment rents expense increased by $49 million, or 12%, in 2018 when compared to 2017. The increase was primarily due to higher costs for leased locomotives and higher car hire expense. Casualty and other Casualty and other expense increased by $37 million, or 9%, in 2018 when compared to 2017. The increase was mainly due to higher incident costs and higher legal provisions. Other income and expenses Interest expense In 2018, interest expense was $489 million compared to $481 million in 2017. The increase was mainly due to a higher average level of debt, partly offset by a lower average interest rate. Other components of net periodic benefit income In 2018, Other components of net periodic benefit income was $302 million compared to $315 million in 2017. Other income In 2018, Other income was $376 million compared to $12 million in 2017. Included in Other income for 2018 was a gain previously deferred on the 2014 disposal of the Guelph of $79 million, a gain on disposal of the Doney and St-Francois Spurs of $36 million, a gain on the transfer of the Central Station Railway Lease of $184 million, and a gain on disposal of the Calgary Industrial Lead of $39 million. Income tax recovery (expense) In 2018, the Company recorded an income tax expense of $1,354 million compared to an income tax recovery of $395 million in 2017. Included in the 2017 figure was a net deferred income tax recovery of $1,706 million consisting of a deferred income tax recovery of $1,764 million recorded in the fourth quarter, resulting from the enactment of the U.S. Tax Reform; deferred income tax expenses of $50 million recorded in the fourth quarter and $31 million recorded in the third quarter, resulting from the enactment of higher provincial corporate income tax rates and a higher state corporate income tax rate, respectively; and deferred income tax recoveries of $18 million recorded in the second quarter and $5 million recorded in the first quarter, both resulting from the enactment of lower provincial corporate income tax rates. The effective tax rate for 2018 was 23.8% compared to (7.8)% in 2017. Excluding the aforementioned deferred income tax recoveries and expenses, the effective tax rate for 2018 was 23.8% compared to 25.8% in 2017. The decrease in the effective tax rate was mainly attributable to a lower U.S. Federal corporate tax rate and gains on disposal of property taxed at the lower capital gain inclusion rate. 23 CN | 2019 Annual Report

Management's Discussion and Analysis Summary of quarterly financial data 2019 Quarters 2018 Quarters Fourth Third Second First Fourth Third Second First In millions, except per share data Revenues Operating income (1) Net income (1) Basic earnings per share Diluted earnings per share Dividends per share $ $ $ $ $ 3,584 1,218 873 1.22 1.22 $ $ $ $ $ 3,830 1,613 1,195 1.66 1.66 $ $ $ $ $ $ 3,959 1,682 1,362 1.89 1.88 0.5375 $ $ $ $ $ 3,544 1,080 786 1.08 1.08 $ $ $ $ $ $ 3,808 1,452 1,143 1.57 1.56 0.4550 $ $ $ $ $ $ 3,688 1,492 1,134 1.55 1.54 0.4550 $ $ $ $ $ $ 3,631 1,519 1,310 1.78 1.77 0.4550 $ $ $ $ $ $ 3,194 1,030 741 1.00 1.00 0.4550 $ 0.5375 $ 0.5375 $ 0.5375 (1) Certain quarters include items that management believes do not necessarily arise as part of CN's normal day-to-day operations and can distort the analysis of trends in business performance. See the section of this MD&A entitled Adjusted performance measures for additional information on these items. Revenues generated by the Company during the year are influenced by seasonal weather conditions, general economic conditions, cyclical demand for rail transportation, and competitive forces in the transportation marketplace (see the section entitled Business risks of this MD&A). Operating expenses reflect the impact of freight volumes, seasonal weather conditions, labor costs, fuel prices, and the Company's productivity initiatives. Fluctuations in the Canadian dollar relative to the US dollar have also affected the conversion of the Company's US dollar-denominated revenues and expenses and resulted in fluctuations in net income in the rolling eight quarters presented above. Summary of fourth quarter 2019 Fourth quarter 2019 net income was $873 million, a decrease of $270 million, or 24%, when compared to the same period in 2018, and diluted earnings per share decreased by 22% to $1.22. Operating income for the quarter ended December 31, 2019 decreased by $234 million, or 16%, to $1,218 million, when compared to the same period in 2018. The decrease mainly reflects lower revenues across all the commodity groups, other than intermodal. The operating ratio was 66.0% in the fourth quarter of 2019 compared to 61.9% in the fourth quarter of 2018. Revenues for the fourth quarter of 2019 decreased by $224 million, or 6%, to $3,584 million, when compared to the same period in 2018. The decrease was mainly attributable to lower volumes, due to the weakening economic environment and the conductor strike in November; partly offset by the inclusion of TransX in the intermodal commodity group within the domestic market, freight rate increases and higher international container traffic via the Port of Prince Rupert. Fuel surcharge revenues decreased by $64 million in the fourth quarter of 2019, mainly due to lower applicable fuel surcharge rates. Operating expenses for the fourth quarter of 2019 remained flat when compared to the same period in 2018. The increases in purchased services and material expense, due to the inclusion of TransX, and depreciation expense; were offset by lower costs from decreased volumes of traffic and lower incentive compensation. 24 CN | 2019 Annual Report
Management's Discussion and Analysis Financial position The following tables provide an analysis of the Company's balance sheet as at December 31, 2019 as compared to 2018. Assets and liabilities denominated in US dollars have been translated to Canadian dollars using the foreign exchange rate in effect at the balance sheet date. As at December 31, 2019 and 2018, the foreign exchange rates were $1.2990 and $1.3637 per US$1.00, respectively. Variance excluding foreign exchange Foreign exchange impact Explanation of variance, other than foreign exchange impact 2019 2018 In millions December 31, Total assets Variance mainly due to: Properties $ 43,784 $ 41,214 $ (968) $ 3,538 39,669 37,773 (884) 2,780 See the section of this MD&A entitled Liquidity and capital resources - Investing activities, property additions of $4,079 million, partly offset by depreciation of $1,559 million. Increase due to Adoption of ASU 2016-02: Leases and related amendments (Topic 842). Operating lease right-of-use assets 520 — — 520 Pension asset 336 446 — (110) Decrease primarily due to the reduction in the year-end discount rate from 3.77% in 2018 to 3.10% in 2019, partly offset by higher actual returns. Total liabilities Variance mainly due to: Deferred income taxes $ 25,743 $ 23,573 $ (723) $ 2,893 7,844 7,480 (184) 548 Increase due to deferred income tax expense of $569 million recorded in Net income, partly offset by a deferred income tax recovery of $21 million recorded in Other comprehensive income (loss), mostly attributable to new temporary differences generated during the year. Increase primarily due to the reduction in the year-end discount rate from 3.77% in 2018 to 3.10% in 2019, partly offset by higher actual returns. See the section entitled Liquidity and capital resources - Financing activities for debt financing activities in 2019, as well as issuance of finance leases of $214 million. Increase due to Adoption of ASU 2016-02: Leases and related amendments (Topic 842). Pension and other postretirement benefits 733 707 (9) 35 Total long-term debt, including the current portion 13,796 12,569 (501) 1,728 Operating lease liabilities, including the current portion 501 — (16) 517 In millions December 31, 2019 2018 Variance Explanation of variance Total shareholders' equity Variance mainly due to: Accumulated other comprehensive loss $ 18,041 $ 17,641 $ 400 (3,483) (2,849) (634) Increase in Other comprehensive loss due to after-tax amounts of $308 million from net foreign exchange losses and $326 million resulting from net actuarial losses on defined benefit pension and post-retirement benefit plans, net of amortization. 1,011 Increase primarily due to current year net income of $4,216 million, partly offset by share repurchases of $1,627 million and dividends paid of $1,544 million. Retained earnings 17,634 16,623 CN | 2019 Annual Report 25

Management's Discussion and Analysis Liquidity and capital resources The Company's principal source of liquidity is cash generated from operations, which is supplemented by borrowings in the money markets and capital markets. To meet its short-term liquidity needs, the Company has access to various financing sources, including an unsecured revolving credit facility, commercial paper programs, and an accounts receivable securitization program. In addition to these sources, the Company can issue debt securities to meet its longer-term liquidity needs. The strong focus on cash generation from all sources gives the Company increased flexibility in terms of meeting its financing requirements. The Company's primary uses of funds are for working capital requirements, including income tax installments, pension contributions, and contractual obligations; capital expenditures relating to track infrastructure and other; acquisitions; dividends; and share repurchases. The Company sets priorities on its uses of available funds based on short-term operational requirements, expenditures to continue to operate a safe railway and pursue strategic initiatives, while also considering its long-term contractual obligations and returning value to its shareholders; and as part of its financing strategy, the Company regularly reviews its capital structure, cost of capital, and the need for additional debt financing. The Company has a working capital deficit, which is common in the capital-intensive rail industry, and is not an indication of a lack of liquidity. The Company maintains adequate resources to meet daily cash requirements, and has sufficient financial capacity to manage its day-to-day cash requirements and current obligations. As at December 31, 2019 and 2018, the Company had Cash and cash equivalents of $64 million and $266 million, respectively; Restricted cash and cash equivalents of $524 million and $493 million, respectively; and a working capital deficit of $1,457 million and $772 million, respectively. The cash and cash equivalents pledged as collateral for a minimum term of one month pursuant to the Company's bilateral letter of credit facilities are recorded as Restricted cash and cash equivalents. There are currently no specific requirements relating to working capital other than in the normal course of business as discussed herein. The Company's U.S. and other foreign subsidiaries maintain sufficient cash to meet their respective operational requirements. If the Company should require more liquidity in Canada than is generated by its domestic operations, the Company could decide to repatriate funds associated with undistributed earnings of its foreign operations, including its U.S. and other foreign subsidiaries. The impact on liquidity resulting from the repatriation of funds held outside Canada would not be significant as such repatriation of funds would not cause significant tax implications to the Company under the tax laws of Canada and the U.S. and other foreign tax jurisdictions, and the tax treaties currently in effect between them. The Company expects cash from operations and its various sources of financing to be sufficient to meet its ongoing obligations. The Company is not aware of any trends or expected fluctuations in its liquidity that would impact its ongoing operations or financial condition as of the date of this MD&A. The Company adopted Accounting Standards Update (ASU) 2016-02: Leases and related amendments (Topic 842) in the first quarter of 2019 using a modified retrospective approach with no restatement of comparative period financial information. Comparative balances previously referred to as capital leases are now referred to as finance leases. See the section of this MD&A entitled Recent accounting pronouncements for additional information. Available financing sources Shelf prospectus and registration statement During 2019, under its current shelf prospectus and registration statement, the Company issued a total of $1.25 billion of debt securities in the Canadian capital markets. The Company's shelf prospectus and registration statement, under which CN may issue debt securities in the Canadian and U.S. capital markets until March 13, 2020, has remaining capacity of $3.1 billion. The Company's access to long-term funds in the capital markets depends on its credit ratings and market conditions. The Company believes that it continues to have access to the capital markets. If the Company were unable to borrow funds at acceptable rates in the capital markets, the Company could borrow under its credit facilities, draw down on its accounts receivable securitization program, raise cash by disposing of surplus properties or otherwise monetizing assets, reduce discretionary spending or take a combination of these measures to assure that it has adequate funding for its business. Revolving credit facility On March 15, 2019, the Company's revolving credit facility agreement was amended, which extended the term of the credit facility by one year and increased the credit facility from $1.8 billion to $2.0 billion, effective May 5, 2019. The increase in capacity provides the Company with additional financial flexibility. The amended credit facility of $2.0 billion consists of a $1.0 billion tranche maturing on May 5, 2022 and a $1.0 billion tranche maturing on May 5, 2024. The accordion feature included in the credit facility agreement, which provides for an additional $500 million subject to the consent of individual lenders, remains unchanged. The credit facility is available for general corporate purposes, including backstopping the Company's commercial paper programs. As at December 31, 2019 and December 31, 2018, the Company had no outstanding borrowings under its revolving credit facility and there were no draws during the years ended 2019 and 2018. 26 CN | 2019 Annual Report

Management's Discussion and Analysis Non-revolving credit facility On July 25, 2019, the Company entered into an agreement for a non-revolving term loan credit facility in the principal amount of up to US$300 million, secured by rolling stock, which may be drawn upon during the period from July 25, 2019 to March 31, 2020. Term loans made under the facility have a tenor of 20 years, bear interest at a variable rate, and are prepayable at any time without penalty. The credit facility is available for financing or refinancing the purchase of equipment. As at December 31, 2019, the Company had no outstanding borrowings under its non-revolving credit facility and there were no draws during the year ended December 31, 2019. On January 24, 2020, the Company requested a borrowing of US$300 million under its non-revolving credit facility. The funds are expected to be received on February 3, 2020. Commercial paper The Company has a commercial paper program in Canada and in the U.S. Both programs are backstopped by the Company's revolving credit facility. As of May 5, 2019, the maximum aggregate principal amount of commercial paper that could be issued increased from $1.8 billion to $2.0 billion, or the US dollar equivalent, on a combined basis. The commercial paper programs, which are subject to market rates in effect at the time of financing, provide the Company with a flexible financing alternative, and can be used for general corporate purposes. The cost of commercial paper and access to the commercial paper market in Canada and the U.S. are dependent on credit ratings and market conditions. If the Company were to lose access to its commercial paper program for an extended period of time, the Company could rely on its $2.0 billion revolving credit facility to meet its short-term liquidity needs. As at December 31, 2019 and 2018, the Company had total commercial paper borrowings of US$983 million ($1,277 million) and US$862 million ($1,175 million), respectively, presented in Current portion of long-term debt on the Consolidated Balance Sheets. Accounts receivable securitization program The Company has an agreement, expiring on February 1, 2021, to sell an undivided co-ownership interest in a revolving pool of accounts receivable to unrelated trusts for maximum cash proceeds of $450 million. The trusts are multi-seller trusts and the Company is not the primary beneficiary. Funding for the acquisition of these assets is customarily through the issuance of asset-backed commercial paper notes by the unrelated trusts. The Company has retained the responsibility for servicing, administering and collecting the receivables sold. The average servicing period is approximately one month and is renewed at market rates then in effect. Subject to customary indemnifications, each trust's recourse is limited to the accounts receivable transferred. The accounts receivable securitization program provides the Company with readily available short-term financing for general corporate use. In the event the program is terminated before its scheduled maturity, the Company expects to meet its future payment obligations through its various sources of financing including its revolving credit facility and commercial paper program, and/or access to capital markets. As at December 31, 2019, the Company had accounts receivable securitization borrowings of $200 million, secured by and limited to $224 million of accounts receivable, presented in Current portion of long-term debt on the Consolidated Balance Sheet. As at December 31, 2018, the Company had no proceeds received under the accounts receivable securitization program. Bilateral letter of credit facilities The Company has a series of committed and uncommitted bilateral letter of credit facility agreements. On March 15, 2019, the Company extended the maturity date of the committed bilateral letter of credit facility agreements to April 28, 2022. The agreements are held with various banks to support the Company's requirements to post letters of credit in the ordinary course of business. Under the agreements, the Company has the option from time to time to pledge collateral in the form of cash or cash equivalents, for a minimum term of one month, equal to at least the face value of the letters of credit issued. As at December 31, 2019, the Company had outstanding letters of credit of $424 million (2018 - $410 million) under the committed facilities from a total available amount of $459 million (2018 - $447 million) and $149 million (2018 - $137 million) under the uncommitted facilities. As at December 31, 2019, included in Restricted cash and cash equivalents was $429 million (2018 - $408 million) and $90 million (2018 - $80 million) pledged as collateral under the committed and uncommitted bilateral letter of credit facilities, respectively. Additional information relating to the Company's financing sources is provided in Note 13 – Debt to the Company's 2019 Annual Consolidated Financial Statements. Credit ratings The Company's ability to access funding in the debt capital markets and the cost and amount of funding available depends in part on its credit ratings. Rating downgrades could limit the Company's access to the capital markets, or increase its borrowing costs. CN | 2019 Annual Report 27

Management's Discussion and Analysis The following table provides the credit ratings that CN has received from credit rating agencies as of the date of this MD&A: Long-term debt rating Commercial paper rating Dominion Bond Rating Service Moody's Investors Service Standard & Poor's A A2 A R-1 (low) P-1 A-1 These credit ratings are not recommendations to purchase, hold, or sell the securities referred to above. Ratings may be revised or withdrawn at any time by the credit rating agencies. Each credit rating should be evaluated independently of any other credit rating. Cash flows 2019 2018 Variance In millions Year ended December 31, Net cash provided by operating activities Net cash used in investing activities Net cash used in financing activities Effect of foreign exchange fluctuations on cash, cash equivalents, restricted cash, and restricted cash equivalents $ 5,923 (4,190) (1,903) $ 5,918 (3,404) (2,308) $ 5 (786) 405 (1) — (1) Net increase (decrease) in cash, cash equivalents, restricted cash, and restricted cash equivalents $ (171) $ 206 $ (377) Cash, cash equivalents, restricted cash, and restricted cash equivalents, beginning of year 759 553 206 Cash, cash equivalents, restricted cash, and restricted cash equivalents, end of year $ 588 $ 759 $ (171) Operating activities Net cash provided by operating activities increased by $5 million in 2019 due to higher cash earnings and advance consideration received related to a long-term rail freight contract; partly offset by unfavorable changes in working capital. Pension contributions The Company's contributions to its various defined benefit pension plans are made in accordance with the applicable legislation in Canada and the U.S. and such contributions follow minimum and maximum thresholds as determined by actuarial valuations. Pension contributions for the years ended December 31, 2019 and 2018 of $128 million and $92 million, respectively, primarily represent contributions to the CN Pension Plan, for the current service cost as determined under the Company's current actuarial valuations for funding purposes. The increase in pension contributions was mainly due to the Company reducing its current service cost contributions in 2018 for the CN Pension Plan as permitted based on the prevailing actuarial valuations filed for those respective years. The Company expects to make total cash contributions of approximately $135 million for all pension plans in 2020. See the section of this MD&A entitled Critical accounting estimates – Pensions and other postretirement benefits for additional information pertaining to the funding of the Company's pension plans. Additional information relating to the pension plans is provided in Note 15 – Pensions and other postretirement benefits to the Company's 2019 Annual Consolidated Financial Statements. Income tax payments The Company is required to make scheduled installment payments as prescribed by the tax authorities. In Canada, the Company's domestic jurisdiction, tax installments in a given year are generally based on the prior year's taxable income whereas in the U.S., the Company's predominant foreign jurisdiction, they are based on forecasted taxable income of the current year. In 2019, net income tax payments were $822 million (2018 - $776 million). The increase was mainly due to higher required installment payments in both Canada and the U.S. For 2020, the Company's net income tax payments are expected to be approximately $750 million, and include the impacts of the U.S. Tax Reform, and the related proposed and finalized regulations and interpretations issued as of December 2019. The decrease is primarily due to lower required installment payments in Canada in 2020. Investing activities Net cash used in investing activities increased by $786 million in 2019, mainly as a result of higher property additions, primarily locomotives, the acquisitions of TransX and H&R and lower proceeds received from the disposal of property in the current year. 28 CN | 2019 Annual Report

Management's Discussion and Analysis Property additions 2019 2018 In millions Year ended December 31, Track and roadway (1) Rolling stock Buildings Information technology Other $ 2,262 999 87 421 310 $ 2,341 433 95 459 203 Gross property additions Less: Finance leases (2) 4,079 214 3,531 — Property additions (3) $ 3,865 $ 3,531 (1) In 2019, approximately 65% (2018 - 65%) of the Track and roadway property additions were incurred to renew basic infrastructure. Costs relating to normal repairs and maintenance of Track and roadway properties are expensed as incurred, and amounted to approximately 11% of the Company's total operating expenses in 2019 (2018 - 10%). Includes re-measurement of finance leases. Includes $227 million associated with the U.S. federal government legislative PTC implementation in 2019 (2018 - $419 million). (2) (3) Disposal of property In 2019, there were no significant disposals of property. In 2018, cash flows from investing activities included cash proceeds of $194 million, before transaction costs, from the disposals of the Doney and St-Francois spurs, Central Station Railway lease, and Calgary Industrial Lead. Additional information relating to disposals of property is provided in Note 5 – Other income to the Company's 2019 Annual Consolidated Financial Statements. Acquisitions On December 2, 2019, the Company acquired H&R for a total purchase price of $105 million, of which $95 million was paid on the closing date and $10 million, mostly related to funds withheld for the indemnification of claims, will be paid within twenty months of the acquisition date. The preliminary allocation of the purchase price to the assets acquired and liabilities assumed was performed on the basis of their respective fair values. The Company used a third party to assist in establishing the fair values of the assets acquired and liabilities assumed which resulted in the recognition of identifiable net assets of $93 million and goodwill of $12 million. The goodwill acquired through the business combination is mainly attributable to the premium of an established business operation. The Company's purchase price allocation is preliminary and subject to change over the measurement period, which may be up to one year from the acquisition date. The Company's Consolidated Balance Sheet includes the assets and liabilities of H&R as of December 2, 2019, the acquisition date. Since the acquisition date, H&R's results of operations have been included in the Company's results of operations. The Company has not provided pro forma information relating to the pre-acquisition period as it was not material. On March 20, 2019, the Company acquired TransX. The total purchase price of $192 million included an initial cash payment of $170 million, additional consideration of $25 million paid on August 27, 2019 upon achievement of targets, less an adjustment of $3 million in the fourth quarter of 2019 to reflect the settlement of working capital. The preliminary allocation of the purchase price to the assets acquired and liabilities assumed was performed on the basis of their respective fair values. The Company used a third party to assist in establishing the fair values of the assets acquired and liabilities assumed which resulted in the recognition of identifiable net assets of $127 million and goodwill of $65 million. The goodwill acquired through the business combination is mainly attributable to the premium of an established business operation. The Company's purchase price allocation is preliminary and subject to change over the measurement period, which may be up to one year from the acquisition date. The Company's Consolidated Balance Sheet includes the assets and liabilities of TransX as of March 20, 2019, the acquisition date. Since the acquisition date, TransX's results of operations have been included in the Company's results of operations. The Company has not provided pro forma information relating to the pre-acquisition period as it was not material. Additional information relating to the acquisitions is provided in Note 3 - Business combinations to the Company's 2019 Annual Consolidated Financial Statements. CN | 2019 Annual Report 29

Management's Discussion and Analysis 2020 Capital expenditure program In 2020, the Company expects to invest approximately $3.0 billion in its capital program, which will be financed with cash generated from operations or with cash from financing activities as required, as outlined below: • $1.6 billion on track and railway infrastructure maintenance to support safe and efficient operations, including the replacement of rail and ties, bridge improvements, as well as other general track maintenance; $0.8 billion on initiatives to increase capacity and enable growth, such as track infrastructure expansion, investments in yards and intermodal terminals, and on information technology to improve safety performance, operational efficiency and customer service; $0.4 billion on equipment capital expenditures, allowing the Company to tap growth opportunities and improve the quality of the fleet, and in order to handle expected traffic increase and improve operational efficiency, CN expects to take delivery of 41 new high-horsepower locomotives and 240 new grain hopper cars; and $0.2 billion associated with the U.S. federal government legislative PTC implementation. • • • Financing activities Net cash used in financing activities decreased by $405 million in 2019, primarily driven by lower net repayment of debt and lower repurchases of common shares; partly offset by higher dividends paid. Debt financing activities Debt financing activities in 2019 included the following: • On November 1, 2019, issuance of $450 million 3.05% Notes due 2050 in the Canadian capital markets, which resulted in net proceeds of $443 million; On February 8, 2019, issuance of $350 million 3.00% Notes due 2029 and $450 million 3.60% Notes due 2049 in the Canadian capital markets, which resulted in total net proceeds of $790 million; Net issuance of commercial paper of $141 million; Proceeds from the accounts receivable securitization program of $420 million; Repayment of accounts receivable securitization borrowings of $220 million; and Repayment of finance leases of $162 million. • • • • • Debt financing activities in 2018 included the following: • On November 7, 2018, issuance of US$650 million ($854 million) 4.45% Notes due 2049 in the U.S. capital markets, which resulted in net proceeds of $845 million; On August 30, 2018, early redemption of US$550 million 5.55% Notes due 2019 for US$558 million ($720 million), which resulted in a loss of US$8 million ($10 million) that was recorded in Other income; On July 31, 2018, issuance of $350 million 3.20% Notes due 2028 and $450 million 3.60% Notes due 2048 in the Canadian capital markets, which resulted in total net proceeds of $787 million; On July 15, 2018, repayment of US$200 million ($264 million) 6.80% Notes due 2018 upon maturity; On May 15, 2018, repayment of US$325 million ($415 million) 5.55% Notes due 2018 upon maturity; On February 6, 2018, issuance of US$300 million ($374 million) 2.40% Notes due 2020 and US$600 million ($749 million) 3.65% Notes due 2048 in the U.S. capital markets, which resulted in total net proceeds of $1,106 million; Net issuance of commercial paper of $99 million; Proceeds from the accounts receivable securitization program of $530 million; Repayment of accounts receivable securitization borrowings of $950 million; and Repayment of finance leases of $44 million. • • • • • • • • • Cash obtained from the issuance of debt was used for general corporate purposes, including the redemption and refinancing of outstanding indebtedness, share repurchases, acquisitions and other business opportunities. Additional information relating to the Company's outstanding debt securities is provided in Note 13 – Debt to the Company's 2019 Annual Consolidated Financial Statements. Repurchase of common shares The Company may repurchase its common shares pursuant to a NCIB at prevailing market prices plus brokerage fees, or such other prices as may be permitted by the TSX. The Company repurchased 14.1 million common shares under its NCIB effective between February 1, 2019 and January 31, 2020, which allowed for the repurchase of up to 22.0 million common shares. Previous NCIBs allowed for the repurchase of up to 5.5 million common shares between October 30, 2018 and January 31, 2019, and up to 31.0 million common shares between October 30, 2017 and October 29, 2018. 30 CN | 2019 Annual Report

Management's Discussion and Analysis The following table provides the information related to the share repurchases for the years ended December 31, 2019, 2018 and 2017: 2019 2018 2017 Total NCIB In millions, except per share data Year ended December 31, February 2019 - January 2020 NCIB Number of common shares Weighted-average price per share Amount of repurchase 12.8 120.03 1,547 N/A N/A N/A N/A N/A N/A 12.8 120.03 1,547 $ $ $ $ October 2018 - January 2019 NCIB Number of common shares Weighted-average price per share Amount of repurchase 1.5 106.78 153 2.6 109.92 293 N/A N/A N/A 4.1 108.82 446 $ $ $ $ $ $ October 2017 - October 2018 NCIB Number of common shares Weighted-average price per share Amount of repurchase N/A N/A N/A 16.4 104.19 1,707 2.9 102.40 293 19.3 103.92 2,000 $ $ $ $ $ $ Total for the year Number of common shares Weighted-average price per share Amount of repurchase (1) 14.3 118.70 1,700 19.0 104.99 2,000 20.4 98.27 2,000 (1) $ $ $ $ $ $ (1) (1) Includes 2017 repurchases from the October 2016 - October 2017 NCIB, which consisted of 17.5 million common shares, a weighted-average price per share of $97.60 and an amount of repurchase of $1,707 million. Includes repurchases in the first and second quarters of 2017, pursuant to private agreements between the Company and arm's-length third-party sellers. On January 28, 2020, the Board of Directors of the Company approved a new NCIB, which allows for the repurchase of up to 16 million common shares between February 1, 2020 and January 31, 2021. The Company’s NCIB notices may be found online on SEDAR at www.sedar.com and on the SEC's website at www.sec.gov through EDGAR. Printed copies may be obtained by contacting the Corporate Secretary’s Office. Share Trusts The Company's Employee Benefit Plan Trusts ("Share Trusts") purchase CN's common shares on the open market, which are used to deliver common shares under the Share Units Plan and, beginning in 2019, the Employee Share Investment Plan (ESIP). Shares purchased by the Share Trusts are retained until the Company instructs the trustee to transfer shares to participants of the Share Units Plan or the ESIP. Additional information relating to Share Trusts is provided in Note 16 – Share capital to the Company's 2019 Annual Consolidated Financial Statements. The following table provides the information related to the share purchases and settlements by Share Trusts under the Share Units Plan for the years ended December 31, 2019, 2018 and 2017: 2019 2018 2017 In millions, except per share data Year ended December 31, Share purchases by Share Units Plan Share Trusts Number of common shares Weighted-average price per share Amount of purchase Share settlements by Share Units Plan Share Trusts Number of common shares Weighted-average price per share Amount of settlement — — — 0.4 104.87 38 0.5 102.17 55 $ $ $ $ $ $ 0.5 88.23 45 0.4 84.53 31 0.3 77.99 24 $ $ $ $ $ $ For the year ended December 31, 2019, the ESIP Share Trusts purchased 0.3 million common shares for $33 million at a weighted-average price of $118.83 per share. Dividends paid During 2019, the Company paid quarterly dividends of $0.5375 per share amounting to $1,544 million, compared to $1,333 million, at the rate of $0.4550 per share, in 2018. For 2020, the Company's Board of Directors approved an increase of 7% to the quarterly dividend to common shareholders, from $0.5375 per share in 2019 to $0.5750 per share in 2020. CN | 2019 Annual Report 31
Management's Discussion and Analysis Contractual obligations In the normal course of business, the Company incurs contractual obligations. The following table sets forth the Company's contractual obligations for the following items as at December 31, 2019: 2025 & thereafter Total 2020 2021 2022 2023 2024 In millions Debt obligations (1) Interest on debt obligations Finance lease obligations (2) Operating lease obligations (3) Purchase obligations (4) Other long-term liabilities (5) $ 13,662 9,884 138 560 1,621 701 $ 1,871 509 62 135 1,136 104 $ 761 504 72 108 201 56 $ 317 485 1 73 120 47 $ 187 471 — 51 86 46 $ 447 463 — 37 40 34 $ 10,079 7,452 3 156 38 414 Total contractual obligations $ 26,566 $ 3,817 $ 1,702 $ 1,043 $ 841 $ 1,021 $ 18,142 (1) (2) (3) (4) Presented net of unamortized discounts and debt issuance costs and excludes finance lease obligations. Includes $4 million of imputed interest. Includes $70 million related to renewal options reasonably certain to be exercised and $59 million of imputed interest. Includes fixed and variable commitments for rail, information technology services and licenses, locomotives, wheels, engineering services, railroad ties, rail cars, as well as other equipment and services. Costs of variable commitments were estimated using forecasted prices and volumes. Includes expected payments for workers' compensation, postretirement benefits other than pensions, net unrecognized tax benefits, environmental liabilities and pension obligations that have been classified as contractual settlement agreements. (5) Free cash flow Management believes that free cash flow is a useful measure of liquidity as it demonstrates the Company's ability to generate cash for debt obligations and for discretionary uses such as payment of dividends, share repurchases and strategic opportunities. The Company defines its free cash flow measure as the difference between net cash provided by operating activities and net cash used in investing activities, adjusted for the impact of business acquisitions, if any. Free cash flow does not have any standardized meaning prescribed by GAAP and therefore, may not be comparable to similar measures presented by other companies. The following table provides a reconciliation of net cash provided by operating activities, as reported for the years ended December 31, 2019, 2018 and 2017, to free cash flow: 2019 2018 2017 In millions Year ended December 31, Net cash provided by operating activities Net cash used in investing activities $ 5,923 (4,190) $ 5,918 (3,404) $ 5,516 (2,738) Net cash provided before financing activities Adjustment: Acquisitions, net of cash acquired (1) 1,733 259 2,514 — 2,778 — Free cash flow $ 1,992 $ 2,514 $ 2,778 (1) Relates to the acquisitions of H&R Transport Limited ("H&R") and the TransX Group of Companies ("TransX"). See the section of this MD&A entitled Liquidity and capital resources - Investing activities for additional information. 32 CN | 2019 Annual Report

Management's Discussion and Analysis Adjusted debt-to-adjusted EBITDA multiple Management believes that the adjusted debt-to-adjusted earnings before interest, income taxes, depreciation and amortization (EBITDA) multiple is a useful credit measure because it reflects the Company's ability to service its debt and other long-term obligations. The Company calculates the adjusted debt-to-adjusted EBITDA multiple as adjusted debt divided by adjusted EBITDA. These measures do not have any standardized meaning prescribed by GAAP and therefore, may not be comparable to similar measures presented by other companies. The following table provides a reconciliation of debt and net income to the adjusted measures presented below, which have been used to calculate the adjusted debt-to-adjusted EBITDA multiple: 2019 2018 2017 In millions, unless otherwise indicated As at and for the year ended December 31, Debt Adjustments: Operating lease liabilities, including current portion (1) Pension plans in deficiency $ 13,796 $ 12,569 $ 10,828 501 521 579 477 478 455 Adjusted debt $ 14,818 $ 13,625 $ 11,761 Net income Interest expense Income tax expense (recovery) Depreciation and amortization $ 4,216 538 1,213 1,562 $ 4,328 489 1,354 1,329 $ 5,484 481 (395) 1,281 EBITDA Adjustments: Other income Other components of net periodic benefit income Operating lease cost (1) 7,529 7,500 6,851 (53) (321) 171 (376) (302) 218 (12) (315) 191 Adjusted EBITDA $ 7,326 $ 7,040 $ 6,715 Adjusted debt-to-adjusted EBITDA multiple (times) 2.02 1.94 1.75 (1) The Company adopted Accounting Standards Update (ASU) 2016-02: Leases and related amendments (Topic 842) in the first quarter of 2019. The Company now includes operating lease liabilities, as defined by Topic 842, in adjusted debt and excludes operating lease cost, as defined by Topic 842, in adjusted EBITDA. Comparative balances previously referred to as present value of operating lease commitments and operating lease expense have not been adjusted and are now referred to as operating lease liabilities and operating lease cost, respectively. See the section of this MD&A entitled Recent accounting pronouncements for additional information. All forward-looking statements discussed in this section are subject to risks and uncertainties and are based on assumptions about events and developments that may not materialize or that may be offset entirely or partially by other events and developments. See the section of this MD&A entitled Forward-looking statements for a discussion of assumptions and risk factors affecting such forward-looking statements. Off balance sheet arrangements Guarantees and indemnifications In the normal course of business, the Company enters into agreements that may involve providing guarantees or indemnifications to third parties and others, which may extend beyond the term of the agreements. These include, but are not limited to, standby letters of credit, surety and other bonds, and indemnifications that are customary for the type of transaction or for the railway business. As at December 31, 2019, the Company has not recorded a liability with respect to guarantees and indemnifications. Additional information relating to guarantees and indemnifications is provided in Note 19 – Major commitments and contingencies to the Company's 2019 Annual Consolidated Financial Statements. Outstanding share data As at January 31, 2020, the Company had 711.2 million common shares and 3.6 million stock options outstanding. CN | 2019 Annual Report 33

Management's Discussion and Analysis Financial instruments Risk management In the normal course of business, the Company is exposed to various risks from its use of financial instruments. To manage these risks, the Company follows a financial risk management framework, which is monitored and approved by the Company's Finance Committee, with a goal of maintaining a strong balance sheet, optimizing earnings per share and free cash flow, financing its operations at an optimal cost of capital and preserving its liquidity. The Company has limited involvement with derivative financial instruments in the management of its risks and does not hold or issue them for trading or speculative purposes. Credit risk Credit risk arises from cash and temporary investments, accounts receivable and derivative financial instruments. To manage credit risk associated with cash and temporary investments, the Company places these financial assets with governments, major financial institutions, or other creditworthy counterparties, and performs ongoing reviews of these entities. To manage credit risk associated with accounts receivable, the Company reviews the credit history of each new customer, monitors the financial condition and credit limits of its customers, and keeps the average daily sales outstanding within an acceptable range. The Company works with customers to ensure timely payments, and in certain cases, requires financial security, including letters of credit. CN also obtains credit insurance for certain high risk customers. Although the Company believes there are no significant concentrations of customer credit risk, economic conditions can affect the Company's customers and can result in an increase to the Company's credit risk and exposure to business failures of its customers. A widespread deterioration of customer credit and business failures of customers could have a material adverse effect on the Company's results of operations, financial position or liquidity. The Company considers the risk due to the possible non-performance by its customers to be remote. The Company has limited involvement with derivative financial instruments, however from time to time, it may enter into derivative financial instruments to manage its exposure to interest rates or foreign currency exchange rates. To manage the counterparty risk associated with the use of derivative financial instruments, the Company enters into contracts with major financial institutions that have been accorded investment grade ratings. Though the Company is exposed to potential credit losses due to non-performance of these counterparties, the Company considers this risk to be remote. Liquidity risk Liquidity risk is the risk that sufficient funds will not be available to satisfy financial obligations as they come due. In addition to cash generated from operations, which represents its principal source of liquidity, the Company manages liquidity risk by aligning other external sources of funds which can be obtained upon short notice, such as a revolving credit facility, commercial paper programs, and an accounts receivable securitization program. As well, the Company can issue debt securities in the Canadian and U.S. capital markets under its shelf prospectus and registration statement. The Company's access to long-term funds in the debt capital markets depends on its credit ratings and market conditions. The Company believes that its investment grade credit ratings contribute to reasonable access to capital markets. See the section of this MD&A entitled Liquidity and capital resources for additional information relating to the Company's available financing sources and its credit ratings. Foreign currency risk The Company conducts its business in both Canada and the U.S. and as a result, is affected by currency fluctuations. Changes in the exchange rate between the Canadian dollar and the US dollar affect the Company's revenues and expenses. To manage foreign currency risk, the Company designates US dollar-denominated debt of the parent company as a foreign currency hedge of its net investment in foreign operations. As a result, from the dates of designation, foreign exchange gains and losses on translation of the Company's US dollar-denominated debt are recorded in Accumulated other comprehensive loss, which minimizes volatility of earnings resulting from the conversion of US dollar-denominated debt into the Canadian dollar. The Company also enters into foreign exchange forward contracts to manage its exposure to foreign currency risk. As at December 31, 2019, the Company had outstanding foreign exchange forward contracts with a notional value of US$1,088 million (2018 - US$1,465 million). Changes in the fair value of foreign exchange forward contracts, resulting from changes in foreign exchange rates, are recognized in Other income in the Consolidated Statements of Income as they occur. For the year ended December 31, 2019, the Company recorded a loss of $75 million (2018 - gain of $157 million; 2017 - loss of $72 million), related to foreign exchange forward contracts. These gains or losses were largely offset by the re-measurement of US dollar-denominated monetary assets and liabilities recognized in Other income. As at December 31, 2019, the fair value of outstanding foreign exchange forward contracts included in Other current assets and Accounts payable and other was $nil and $24 million, respectively (2018 - $67 million and $nil, respectively). The estimated annual impact on net income of a one-cent change in the Canadian dollar relative to the US dollar is approximately $35 million. 34 CN | 2019 Annual Report
Management's Discussion and Analysis Interest rate risk The Company is exposed to interest rate risk, which is the risk that the fair value or future cash flows of a financial instrument will vary as a result of changes in market interest rates. Such risk exists in relation to the Company's debt. The Company mainly issues fixed-rate debt, which exposes the Company to variability in the fair value of the debt. The Company also issues debt with variable interest rates, which exposes the Company to variability in interest expense. To manage interest rate risk, the Company manages its borrowings in line with liquidity needs, maturity schedule, and currency and interest rate profile. In anticipation of future debt issuances, the Company may use derivative instruments such as forward rate agreements. The Company does not currently hold any significant derivative instruments to manage its interest rate risk. The estimated annual impact on net income of a one-percent change in the interest rate on floating rate debt is approximately $10 million. Commodity price risk The Company is exposed to commodity price risk related to purchases of fuel and the potential reduction in net income due to increases in the price of diesel. Fuel prices are impacted by geopolitical events, changes in the economy or supply disruptions. Fuel shortages can occur due to refinery disruptions, production quota restrictions, climate, and labor and political instability. The Company manages fuel price risk by offsetting the impact of rising fuel prices with the Company's fuel surcharge program. The surcharge applied to customers is determined in the second calendar month prior to the month in which it is applied, and is generally calculated using the average monthly price of On-Highway Diesel, and, to a lesser extent, West-Texas Intermediate crude oil. While the Company's fuel surcharge program provides effective coverage, residual exposure remains given that fuel price risk cannot be completely managed due to timing and given the volatility in the market. As such, the Company may enter into derivative instruments to manage such risk when considered appropriate. Fair value of financial instruments The financial instruments that the Company measures at fair value on a recurring basis in periods subsequent to initial recognition are categorized into the following levels of the fair value hierarchy based on the degree to which inputs are observable: • • • Level 1: Inputs are quoted prices for identical instruments in active markets Level 2: Significant inputs (other than quoted prices included in Level 1) are observable Level 3: Significant inputs are unobservable The carrying amounts of Cash and cash equivalents and Restricted cash and cash equivalents approximate fair value. These financial instruments include highly liquid investments purchased three months or less from maturity, for which the fair value is determined by reference to quoted prices in active markets. The carrying amounts of Accounts receivable, Other current assets, and Accounts payable and other approximate fair value. The fair value of these financial instruments is not determined using quoted prices, but rather from market observable information. The fair value of derivative financial instruments, classified as Level 2, used to manage the Company's exposure to foreign currency risk and included in Other current assets and Accounts payable and other is measured by discounting future cash flows using a discount rate derived from market data for financial instruments subject to similar risks and maturities. The carrying amount of the Company's debt does not approximate fair value. The fair value is estimated based on quoted market prices for the same or similar debt instruments, as well as discounted cash flows using current interest rates for debt with similar terms, company rating, and remaining maturity. The Company classifies debt as Level 2. As at December 31, 2019, the Company's debt, excluding finance leases, had a carrying amount of $13,662 million (2018 - $12,540 million) and a fair value of $15,667 million (2018 - $13,287 million). CN | 2019 Annual Report 35

Management's Discussion and Analysis Recent accounting pronouncements The following recent ASUs issued by the Financial Accounting Standards Board (FASB) were adopted by the Company during the current year: ASU 2016-02 Leases and related amendments (Topic 842) The ASU requires a lessee to recognize a right-of-use asset and a lease liability on the balance sheet for all leases greater than twelve months and requires additional qualitative and quantitative disclosures. The lessor accounting model under the new standard is substantially unchanged. The guidance must be applied using a modified retrospective approach. Entities may elect to apply the guidance to each prior period presented with a cumulative-effect adjustment to retained earnings recognized at the beginning of the earliest period presented or to apply the guidance with a cumulative-effect adjustment to retained earnings recognized at the beginning of the period of adoption. The new standard provides a number of practical expedients and accounting policy elections upon transition. On January 1, 2019, the Company did not elect the package of three practical expedients that permits the Company not to reassess prior conclusions about lease qualification, classification and initial direct costs. Upon adoption, the Company elected the following practical expedients: • • • the use-of-hindsight practical expedient to reassess the lease term and the likelihood that a purchase option will be exercised; the land easement practical expedient to not evaluate land easements that were not previously accounted for as leases under Topic 840; the short-term lease exemption for all asset classes that permits entities not to recognize right-of-use assets and lease liabilities onto the balance sheet for leases with terms of twelve months or less; and the practical expedient to not separate lease and non-lease components for the freight car asset category. The Company adopted this standard in the first quarter of 2019 with an effective date of January 1, 2019 using a modified retrospective • approach with a cumulative-effect adjustment to Retained earnings recognized on January 1, 2019, with no restatement of comparative period financial information. As at January 1, 2019, the cumulative-effect adjustment to adopt the new standard increased the balance of Retained earnings by $29 million, relating to a deferred gain on a sale-leaseback transaction of a real estate property. The initial adoption transition adjustment to record right-of-use assets and lease liabilities for leases over twelve months on the Company's Consolidated Balance Sheet was $756 million to each balance. The initial adoption transition adjustment is comprised of finance and operating leases of $215 million and $541 million, respectively. New finance lease right-of-use assets and finance lease liabilities are a result of the reassessment of leases with purchase options that are reasonably certain to be exercised by the Company under the transition to Topic 842, previously accounted for as operating leases. ASU 2017-04 Intangibles - Goodwill and other (Topic 350): Simplifying the test for goodwill impairment The ASU simplifies the goodwill impairment test by removing the requirement to compare the implied fair value of goodwill with its carrying amount. Under the new standard, goodwill impairment tests are performed by comparing the fair value of a reporting unit with its carrying amount, recognizing an impairment charge for the amount by which the carrying amount exceeds the reporting unit’s fair value, up to the value of goodwill. The guidance must be applied prospectively. The ASU is effective for annual and any interim impairment tests for periods beginning after December 15, 2019. Early adoption is permitted for interim or annual goodwill impairment tests performed on testing dates after January 1, 2017. The Company adopted this standard in the first quarter of 2019 with an effective date of January 1, 2019. The adoption of this standard did not have an impact on the Company’s Consolidated Financial Statements. The following recent ASUs issued by FASB have an effective date after December 31, 2019 and have not been adopted by the Company: ASU 2019-12 Income taxes (Topic 740): Simplifying the accounting for income taxes The ASU adds new guidance to simplify accounting for income taxes, changes the accounting for certain income tax transactions and makes minor improvements to the codification. The ASU introduces new guidance that provides a policy election to not allocate consolidated income taxes when a member of a consolidated tax return is not subject to income tax, and provides guidance to evaluate whether a step-up in tax basis of goodwill relates to a business combination in which book goodwill was recognized or a separate transaction. In addition, the ASU changes the current guidance by making an intraperiod allocation if there is a loss in continuing operations and gains outside of continuing operations; by determining when a deferred tax liability is recognized after an investor in a foreign entity transitions to or from the equity method of accounting; by accounting for tax law changes and year-to-date losses in interim periods; and by determining how to apply the income tax guidance to franchise taxes and other taxes that are partially based on income. The ASU is effective for annual and any interim period beginning after December 15, 2020. Early adoption is permitted. The Company is evaluating the effects that the adoption of the ASU will have on its Consolidated Financial Statements; no significant impact is expected. 36 CN | 2019 Annual Report
Management's Discussion and Analysis ASU 2016-13 Financial instruments - Credit losses (Topic 326): Measurement of credit losses on financial instruments The ASU requires financial assets measured at amortized cost to be presented at the net amount expected to be collected. The new standard replaces the current incurred loss impairment methodology with one that reflects expected credit losses. The adoption of the ASU is not expected to have a significant impact on the Company’s Consolidated Financial Statements. CN will adopt the requirements of the ASU effective January 1, 2020. Other recently issued ASUs required to be applied for periods beginning on or after January 1, 2020 have been evaluated by the Company and will not have a significant impact on the Company's Consolidated Financial Statements. Critical accounting estimates The preparation of financial statements in accordance with GAAP requires management to make estimates, judgments and assumptions that affect the reported amounts of revenues, expenses, assets and liabilities, and the disclosure of contingent assets and liabilities at the date of the financial statements. On an ongoing basis, management reviews its estimates based upon available information. Actual results could differ from these estimates. The Company's policies for income taxes, capital expenditures, depreciation, pensions and other postretirement benefits, personal injury and other claims and environmental matters, require management's more significant judgments and estimates in the preparation of the Company's consolidated financial statements and, as such, are considered to be critical. The following information should be read in conjunction with the Company's 2019 Annual Consolidated Financial Statements and Notes thereto. Management discusses the development and selection of the Company's critical accounting policies, including the underlying estimates and assumptions, with the Audit Committee of the Company's Board of Directors. The Audit Committee has reviewed the Company's related disclosures. Income taxes The Company follows the asset and liability method of accounting for income taxes. Under the asset and liability method, the change in the net deferred income tax asset or liability is included in the computation of Net income or Other comprehensive income (loss). Deferred income tax assets and liabilities are measured using enacted income tax rates expected to apply to taxable income in the years in which temporary differences are expected to be recovered or settled. As a result, a projection of taxable income is required for those years, as well as an assumption of the ultimate recovery/settlement period for temporary differences. The projection of future taxable income is based on management's best estimate and may vary from actual taxable income. On an annual basis, the Company assesses the need to establish a valuation allowance for its deferred income tax assets, and if it is deemed more likely than not that its deferred income tax assets will not be realized, a valuation allowance is recorded. The ultimate realization of deferred income tax assets is dependent upon the generation of sufficient future taxable income, of the necessary character, during the periods in which those temporary differences become deductible. Management considers the scheduled reversals of deferred income tax liabilities, the available carryback and carryforward periods, and projected future taxable income in making this assessment. As at December 31, 2019, in order to fully realize all of the deferred income tax assets, the Company will need to generate future taxable income of approximately $3.0 billion, and, based upon the level of historical taxable income, projections of future taxable income of the necessary character over the periods in which the deferred income tax assets are deductible, and the reversal of taxable temporary differences, management believes, following an assessment of the current economic environment, it is more likely than not that the Company will realize the benefits of these deductible differences. See the section of this MD&A entitled Other income and expenses - Income tax recovery (expense) for information about the U.S. Tax Reform. In addition, Canadian, or domestic, tax rules and regulations, as well as those relating to foreign jurisdictions, are subject to interpretation and require judgment by the Company that may be challenged by the taxation authorities upon audit of the filed income tax returns. Tax benefits are recognized if it is more likely than not that the tax position will be sustained on examination by the taxation authorities. As at December 31, 2019, the total amount of gross unrecognized tax benefits was $62 million, before considering tax treaties and other arrangements between taxation authorities. The amount of net unrecognized tax benefits as at December 31, 2019 was $60 million. If recognized, $7 million of the net unrecognized tax benefits as at December 31, 2019 would affect the effective tax rate. The Company believes that it is reasonably possible that $23 million of the net unrecognized tax benefits as at December 31, 2019 related to Canadian federal and provincial income tax matters, may be recognized over the next twelve months as a result of settlements and a lapse of the applicable statute of limitations, and will not affect the effective tax rate as they relate to temporary differences. The Company's deferred income tax assets are mainly composed of temporary differences related to net operating losses and tax credit carryforwards, the pension liability, lease liabilities, accruals for personal injury and other claims, other postretirement benefits liability, and compensation reserves. The Company's deferred income tax liabilities are mainly composed of temporary differences related to properties, CN | 2019 Annual Report 37

Management's Discussion and Analysis operating lease right-of-use assets, and the pension asset. These deferred income tax assets and liabilities are recorded at the enacted tax rates of the periods in which the related temporary differences are expected to reverse. As a result, fiscal budget changes and/or changes in income tax laws that affect a change in the timing, the amount, and/or the income tax rate at which the temporary difference components will reverse, could materially affect deferred income tax expense as recorded in the Company's results of operations. The reversal of temporary differences is expected at future-enacted income tax rates which could change due to fiscal budget changes and/or changes in income tax laws. As a result, a change in the timing and/or the income tax rate at which the components will reverse, could materially affect deferred income tax expense as recorded in the Company's results of operations. From time to time, the federal, provincial, and state governments enact new corporate income tax rates resulting in either lower or higher tax liabilities. A one-percentage-point change in the Canadian and U.S. statutory federal tax rate would have the effect of changing the deferred income tax expense by $160 million and $140 million in 2019, respectively. For the year ended December 31, 2019, the Company recorded an income tax expense of $1,213 million, of which $569 million was a deferred income tax expense. The deferred income tax expense included a recovery of $112 million resulting from the enactment of a lower provincial corporate income tax rate. For the year ended December 31, 2018, the Company recorded an income tax expense of $1,354 million, of which $527 million was a deferred income tax expense. For the year ended December 31, 2017, the Company recorded total income tax recovery of $395 million, of which $1,195 million was a deferred income tax recovery. The deferred income tax recovery included a net recovery of $1,706 million resulting from the enactment of the U.S. Tax Reform, and changes to provincial and state corporate income tax rates. The Company's net deferred income tax liability as at December 31, 2019 was $7,844 million (2018 - $7,480 million). Additional disclosures are provided in Note 6 – Income taxes to the Company's 2019 Annual Consolidated Financial Statements. Depreciation Properties are carried at cost less accumulated depreciation including asset impairment write-downs. The Company has a process in place to determine whether or not costs qualify for capitalization, which requires judgment. The cost of properties, including those under finance leases, net of asset impairment write-downs, is depreciated on a straight-line basis over their estimated service lives, measured in years, except for rail and ballast whose services lives are measured in millions of gross tons. The Company follows the group method of depreciation whereby a single composite depreciation rate is applied to the gross investment in a class of similar assets, despite small differences in the service life or salvage value of individual property units within the same asset class. The Company uses approximately 40 different depreciable asset classes. For all depreciable assets, the depreciation rate is based on the estimated service lives of the assets. Assessing the reasonableness of the estimated service lives of properties requires judgment and is based on currently available information, including periodic depreciation studies conducted by the Company. The Company's U.S. properties are subject to comprehensive depreciation studies as required by the Surface Transportation Board (STB) and are conducted by external experts. Depreciation studies for Canadian properties are not required by regulation and are conducted internally. Studies are performed on specific asset groups on a periodic basis. Changes in the estimated service lives of the assets and their related composite depreciation rates are implemented prospectively. The studies consider, among other factors, the analysis of historical retirement data using recognized life analysis techniques, and the forecasting of asset life characteristics. Changes in circumstances, such as technological advances, changes to the Company's business strategy, changes in the Company's capital strategy or changes in regulations can result in the actual service lives differing from the Company's estimates. A change in the remaining service life of a group of assets, or their estimated net salvage value, will affect the depreciation rate used to amortize the group of assets and thus affect depreciation expense as reported in the Company's results of operations. A change of one year in the composite service life of the Company's fixed asset base would impact annual depreciation expense by approximately $56 million. Depreciation studies are a means of ensuring that the assumptions used to estimate the service lives of particular asset groups are still valid and where they are not, they serve as the basis to establish the new depreciation rates to be used on a prospective basis. In 2019, the Company completed depreciation studies for track properties and as a result, the Company changed the estimated service lives for various types of track assets and their related composite depreciation rates. The results of these depreciation studies did not materially affect the Company's annual depreciation expense. Given the nature of the railroad and the composition of its network which is made up of homogeneous long-lived assets, it is impractical to maintain records of specific properties at their lowest unit of property. Retirements of assets occur through the replacement of an asset in the normal course of business, the sale of an asset or the abandonment of a section of track. For retirements in the normal course of business, generally the life of the retired asset is within a reasonable range of the expected useful life, as determined in the depreciation studies, and, as such, no gain or loss is recognized under the group method. The asset's cost is removed from the asset account and the difference between its cost and estimated related accumulated depreciation (net of salvage proceeds), if any, is recorded as an adjustment to accumulated depreciation and no gain or loss is recognized. The historical cost of the retired asset is estimated by using deflation factors or indices that closely correlate to the properties comprising the asset classes in combination with the estimated age of the retired asset using a first-in, first-out approach, and applying it to the replacement value of the asset. 38 CN | 2019 Annual Report

Management's Discussion and Analysis In each depreciation study, an estimate is made of any excess or deficiency in accumulated depreciation for all corresponding asset classes to ensure that the depreciation rates remain appropriate. The excess or deficiency in accumulated depreciation is amortized over the remaining life of the asset class. For retirements of depreciable properties that do not occur in the normal course of business, the historical cost, net of salvage proceeds, is recorded as a gain or loss in income. A retirement is considered not to be in the normal course of business if it meets the following criteria: (i) it is unusual, (ii) it is significant in amount, and (iii) it varies significantly from the retirement pattern identified through depreciation studies. A gain or loss is recognized in Other income for the sale of land or disposal of assets that are not part of railroad operations. For the year ended December 31, 2019, the Company recorded total depreciation expense of $1,559 million (2018 - $1,327 million; 2017 - $1,279 million). As at December 31, 2019, the Company had Properties of $39,669 million, net of accumulated depreciation of $13,912 million (2018 - $37,773 million, net of accumulated depreciation of $13,305 million). Additional disclosures are provided in Note 9 – Properties to the Company's 2019 Annual Consolidated Financial Statements. GAAP requires the use of historical cost as the basis of reporting in financial statements. As a result, the cumulative effect of inflation, which has significantly increased asset replacement costs for capital-intensive companies such as CN, is not reflected in operating expenses. Depreciation charges on an inflation-adjusted basis, assuming that all operating assets are replaced at current price levels, would be substantially greater than historically reported amounts. Pensions and other postretirement benefits The Company's plans have a measurement date of December 31. The following table provides the Company's pension asset, pension liability and other postretirement benefits liability as at December 31, 2019, and 2018: 2019 2018 In millions December 31, Pension asset Pension liability Other postretirement benefits liability $ $ $ 336 521 227 $ $ $ 446 477 247 The descriptions in the following paragraphs pertaining to pensions relate generally to the Company's main pension plan, the CN Pension Plan, unless otherwise specified. Calculation of net periodic benefit cost (income) In accounting for pensions and other postretirement benefits, assumptions are required for, among other things, the discount rate, the expected long-term rate of return on plan assets, the rate of compensation increase, health care cost trend rates, mortality rates, employee early retirements, terminations and disability. Changes in these assumptions result in actuarial gains or losses, which are recognized in Other comprehensive income (loss). The Company generally amortizes these gains or losses into net periodic benefit cost (income) over the expected average remaining service life of the employee group covered by the plans only to the extent that the unrecognized net actuarial gains and losses are in excess of the corridor threshold, which is calculated as 10% of the greater of the beginning-of-year balances of the projected benefit obligation or market-related value of plan assets. The Company's net periodic benefit cost (income) for future periods is dependent on demographic experience, economic conditions and investment performance. Recent demographic experience has revealed no material net gains or losses on termination, retirement, disability and mortality. Experience with respect to economic conditions and investment performance is further discussed herein. For the years ended December 31, 2019, 2018 and 2017, the consolidated net periodic benefit cost (income) for pensions and other postretirement benefits were as follows: 2019 2018 2017 In millions Year ended December 31, Net periodic benefit income for pensions Net periodic benefit cost for other postretirement benefits $ $ (183) 7 $ $ (139) 9 $ $ (190) 7 As at December 31, 2019 and 2018, the projected pension benefit obligation and accumulated other postretirement benefit obligation were as follows: 2019 2018 In millions December 31, Projected pension benefit obligation Accumulated other postretirement benefit obligation $ $ 18,609 227 $ $ 17,275 247 CN | 2019 Annual Report 39

Management's Discussion and Analysis Discount rate assumption The Company's discount rate assumption, which is set annually at the end of each year, is determined by management with the aid of third-party actuaries. The discount rate is used to measure the single amount that, if invested at the measurement date in a portfolio of high-quality debt instruments with a rating of AA or better, would provide the necessary cash flows to pay for pension benefits as they become due. For the Canadian pension and other postretirement benefit plans, future expected benefit payments are discounted using spot rates based on a derived AA corporate bond yield curve for each maturity year. A year-end discount rate of 3.10% based on bond yields prevailing at December 31, 2019 (2018 - 3.77%) was considered appropriate by the Company. The Company uses the spot rate approach to measure current service cost and interest cost for all defined benefit pension and other postretirement benefit plans. Under the spot rate approach, individual spot discount rates along the same yield curve used in the determination of the projected benefit obligation are applied to the relevant projected cash flows for current service cost at the relevant maturity. More specifically, current service cost is measured using the cash flows related to benefits expected to be accrued in the following year by active members of a plan and interest cost is measured using the projected cash flows making up the projected benefit obligation multiplied by the corresponding spot discount rate at each maturity. As at December 31, 2019, a 0.25% decrease in the 3.10% discount rate used to determine the projected benefit obligation would have resulted in a decrease of approximately $570 million to the funded status for pensions and would result in a decrease of approximately $25 million to the 2020 projected net periodic benefit income. A 0.25% increase in the discount rate would have resulted in an increase of approximately $540 million to the funded status for pensions and would result in an increase of approximately $25 million to the 2020 projected net periodic benefit income. Expected long-term rate of return assumption The expected long-term rate of return is determined based on expected future performance for each asset class and is weighted based on the investment policy. Consideration is taken of the historical performance, the premium return generated from an actively managed portfolio, as well as current target asset allocations, published market return expectations, economic developments, inflation rates and administrative expenses. Based on these factors, the rate is determined by the Company. For 2019, the Company used a long-term rate of return assumption of 7.00% on the market-related value of plan assets to compute net periodic benefit cost (income). The Company has elected to use a market-related value of assets, whereby realized and unrealized gains/losses and appreciation/depreciation in the value of the investments are recognized over a period of five years, while investment income is recognized immediately. In 2020, the Company will maintain the expected long-term rate of return on plan assets at 7.00% to reflect management's current view of long-term investment returns. The assets of the Company's various plans are primarily held in separate trust funds ("Trusts") which are diversified by asset type, country, sector and investment strategy. Each year, the CN Board of Directors reviews and confirms or amends the Statement of Investment Policies and Procedures ("SIPP") which includes the plans' long-term target asset allocation ("Policy") and related benchmark indices. This Policy is based on the long-term expectations of the economy and financial market returns and considers the dynamics of the plans' benefit obligations. In 2019, the Policy was amended to affect a target asset allocation change to bonds and mortgages, emerging market debt, private debt, absolute return, and investment-related liabilities. These changes were taken into account in the determination of the Company's expected long-term rate of return assumption. In 2019, the Policy was: 3% cash and short-term investments, 35% bonds and mortgages, 1.5% emerging market debt, 1.5% private debt, 40% equities, 4% real estate, 7% oil and gas, 4% infrastructure investments, 10% absolute return investments and negative 6% for investment-related liabilities. Annually, the CN Investment Division ("Investment Manager"), a division of the Company created to invest and administer the assets of the plans, can also implement an investment strategy ("Strategy") which can lead the Plan's actual asset allocation to deviate from the Policy due to changing market risks and opportunities. The Pension and Investment Committee of the Board of Directors ("Committee") regularly compares the actual plan asset allocation to the Policy and Strategy and compares the actual performance of the Company's pension plan assets to the performance of the benchmark indices. The Committee's approval is required for all major investments in illiquid securities. The SIPP allows for the use of derivative financial instruments to implement strategies, hedge and adjust existing or anticipated exposures. The SIPP prohibits investments in securities of the Company or its subsidiaries. The actual, market-related value and expected rates of return on plan assets for the last five years were as follows: 2019 2018 2017 2016 2015 Actual Market-related value Expected 12.2% 6.1% 7.00% (2.4%) 5.7% 7.00% 9.2% 9.1% 7.00% 4.4% 8.2% 7.00% 5.5% 7.0% 7.00% 40 CN | 2019 Annual Report
Management's Discussion and Analysis The Company's expected long-term rate of return on plan assets reflects management's view of long-term investment returns and the effect of a 1% variation in such rate of return would result in a change to the net periodic benefit cost (income) of approximately $100 million. Management's assumption of the expected long-term rate of return is subject to risks and uncertainties that could cause the actual rate of return to differ materially from management's assumption. There can be no assurance that the plan assets will be able to earn the expected long-term rate of return on plan assets. Net periodic benefit income for pensions for 2020 In 2020, the Company expects net periodic benefit income to be $117 million (2019 - $183 million) for all its defined benefit pension plans. Plan asset allocation Based on the fair value of the assets held as at December 31, 2019, the assets of the Company's various plans are comprised of 3% in cash and short-term investments, 36% in bonds and mortgages, 3% in emerging market debt, 3% in private debt, 37% in equities, 2% in real estate, 5% in oil and gas, 3% in infrastructure, 10% in absolute return investments, 1% in risk-factor allocation investments and negative 3% in investment-related liabilities. See Note 15 - Pensions and other postretirement benefits to the Company's 2019 Annual Consolidated Financial Statements for information on the fair value measurements of such assets. A significant portion of the plans' assets are invested in publicly traded equity securities whose return is primarily driven by stock market performance. Debt securities also account for a significant portion of the plans' investments and provide a partial offset to the variation in the pension benefit obligation that is driven by changes in the discount rate. The funded status of the plan fluctuates with market conditions and impacts funding requirements. The Company will continue to make contributions to the pension plans that as a minimum meet pension legislative requirements. Rate of compensation increase The rate of compensation increase is determined by the Company based upon its long-term plans for such increases. For 2019, a basic rate of compensation increase of 2.75% was used to determine the projected benefit obligation and the net periodic benefit cost (income). Mortality The Canadian Institute of Actuaries (CIA) published in 2014 a report on Canadian Pensioners' Mortality ("Report"). The Report contained Canadian pensioners' mortality tables and improvement scales based on experience studies conducted by the CIA. The CIA's conclusions were taken into account in selecting management's best estimate mortality assumption used to calculate the projected benefit obligation as at December 31, 2019, 2018 and 2017. Funding of pension plans The Company's main Canadian defined benefit pension plan, the CN Pension Plan, accounts for 93% of the Company's pension obligation and can produce significant volatility in pension funding requirements, given the pension fund's size, the many factors that drive the plan's funded status, and Canadian statutory pension funding requirements. Adverse changes to the assumptions used to calculate the plan's funding status, particularly the discount rate used for funding purposes, as well as changes to existing federal pension legislation, regulation and guidance could significantly impact the Company's future contributions. For accounting purposes, the funded status is calculated under generally accepted accounting principles for all pension plans. For funding purposes, the funded status is also calculated under going concern and solvency scenarios as prescribed under pension legislation and subject to guidance issued by the CIA and the Office of the Superintendent of Financial Institutions (OSFI) for all registered Canadian defined benefit pension plans. The Company's funding requirements are determined upon completion of actuarial valuations. Actuarial valuations are generally required on an annual basis for all Canadian defined benefit pension plans, or when deemed appropriate by the OSFI. Actuarial valuations are also required annually for the Company's U.S. qualified defined benefit pension plans. The Company's most recently filed actuarial valuations for funding purposes for its Canadian registered defined pension plans conducted as at December 31, 2018 indicated a funding excess on a going concern basis of approximately $3.3 billion and a funding excess on a solvency basis of approximately $0.5 billion, calculated using the three-year average of the plans' hypothetical wind-up ratio in accordance with the Pension Benefit Standards Regulations, 1985. The federal pension legislation requires funding deficits, if any, to be paid over a number of years, as calculated under current pension regulations. Alternatively, a letter of credit can be subscribed to fulfill required solvency deficit payments. The OSFI proposed revisions to its Instruction guide for the Preparation of Actuarial Reports for defined benefit pension plans. If these proposed revisions become final, they would affect the December 31, 2020 actuarial valuations by reducing the solvency status of the Company’s defined benefit pension plans, and may negatively impact the Company’s pension funding requirements starting in year 2021. CN | 2019 Annual Report 41

Management's Discussion and Analysis The Company's next actuarial valuations for funding purposes for its Canadian registered defined benefit pension plans required as at December 31, 2019 will be performed in 2020. These actuarial valuations are expected to identify a funding excess on a going concern basis of approximately $3.5 billion, while on a solvency basis a funding excess of approximately $0.5 billion is expected. Based on the anticipated results of these valuations, the Company expects to make total cash contributions of approximately $135 million for all of the Company's pension plans in 2020. The Company expects cash from operations and its other sources of financing to be sufficient to meet its 2020 funding obligations. Information disclosed by major pension plan The following table provides the Company's plan assets by category, projected benefit obligation at end of year, as well as Company and employee contributions by major defined benefit pension plan: CN Pension Plan BC Rail Pension Plan U.S. and other plans Total In millions December 31, 2019 Plan assets by category Cash and short-term investments Bonds Mortgages Emerging market debt Private debt Public equities Private equities Real estate Oil and gas Infrastructure Absolute return Risk-factor allocation $ 480 6,140 51 490 469 6,333 210 424 879 603 1,729 283 $ 16 316 1 8 10 161 4 9 18 12 28 4 $ 6 165 — 2 2 115 1 2 4 4 8 1 $ 502 6,621 52 500 481 6,609 215 435 901 619 1,765 288 Total investments Investment-related liabilities (1) Other (2) 18,091 (554) (14) 587 (9) 1 310 (2) 14 18,988 (565) 1 Total plan assets $ 17,523 $ 579 $ 322 $ 18,424 Projected benefit obligation at end of year Company contributions in 2019 Employee contributions in 2019 $ $ $ 17,252 81 64 $ $ $ 515 — — $ $ $ 842 24 — $ $ $ 18,609 105 64 (1) Investment-related liabilities include securities sold under repurchase agreements. (2) Other consists of operating assets of $108 million and liabilities of $107 million required to administer the Trusts' investment assets and the plans' benefit and funding activities. Additional disclosures are provided in Note 15 – Pensions and other postretirement benefits to the Company's 2019 Annual Consolidated Financial Statements. Personal injury and other claims In the normal course of business, the Company becomes involved in various legal actions seeking compensatory and occasionally punitive damages, including actions brought on behalf of various purported classes of claimants and claims relating to employee and third-party personal injuries, occupational disease and property damage, arising out of harm to individuals or property allegedly caused by, but not limited to, derailments or other accidents. Canada Employee injuries are governed by the workers' compensation legislation in each province whereby employees may be awarded either a lump sum or a future stream of payments depending on the nature and severity of the injury. As such, the provision for employee injury claims is discounted. In the provinces where the Company is self-insured, costs related to employee work-related injuries are accounted for based on actuarially developed estimates of the ultimate cost associated with such injuries, including compensation, health care and third-party administration costs. An actuarial study is generally performed at least on a triennial basis. For all other legal actions, the Company maintains, and regularly updates on a case-by-case basis, provisions for such items when the expected loss is both probable and can be reasonably estimated based on currently available information. 42 CN | 2019 Annual Report

Management's Discussion and Analysis In 2019, 2018 and 2017 the Company recorded a decrease of $7 million, and an increase of $4 million and $2 million, respectively, to its provision for personal injuries in Canada as a result of actuarial valuations for employee injury claims. As at December 31, 2019, 2018 and 2017, the Company's provision for personal injury and other claims in Canada was as follows: 2019 2018 2017 In millions Beginning of year Accruals and other Payments $ 207 29 (29) $ 183 52 (28) $ 183 38 (38) End of year $ 207 $ 207 $ 183 Current portion - End of year $ 55 $ 60 $ 40 The assumptions used in estimating the ultimate costs for Canadian employee injury claims include, among other factors, the discount rate, the rate of inflation, wage increases and health care costs. The Company periodically reviews its assumptions to reflect currently available information. Over the past three years, the Company has not had to significantly change any of these assumptions. Changes in any of these assumptions could materially affect Casualty and other expense as reported in the Company's results of operations. For all other legal claims in Canada, estimates are based on the specifics of the case, trends and judgment. United States Personal injury claims by the Company's employees, including claims alleging occupational disease and work-related injuries, are subject to the provisions of the Federal Employers' Liability Act (FELA). Employees are compensated under FELA for damages assessed based on a finding of fault through the U.S. jury system or through individual settlements. As such, the provision is undiscounted. With limited exceptions where claims are evaluated on a case-by-case basis, the Company follows an actuarial-based approach and accrues the expected cost for personal injury, including asserted and unasserted occupational disease claims, and property damage claims, based on actuarial estimates of their ultimate cost. An actuarial study is performed annually. For employee work-related injuries, including asserted occupational disease claims, and third-party claims, including grade crossing, trespasser and property damage claims, the actuarial valuation considers, among other factors, the Company's historical patterns of claims filings and payments. For unasserted occupational disease claims, the actuarial valuation includes the projection of the Company's experience into the future considering the potentially exposed population. The Company adjusts its liability based upon management's assessment and the results of the study. On an ongoing basis, management reviews and compares the assumptions inherent in the latest actuarial valuation with the current claim experience and, if required, adjustments to the liability are recorded. Due to the inherent uncertainty involved in projecting future events, including events related to occupational diseases, which include but are not limited to, the timing and number of actual claims, the average cost per claim and the legislative and judicial environment, the Company's future payments may differ from current amounts recorded. In 2019, the Company recorded an increase of $2 million to its provision for U.S. personal injury and other claims attributable to third-party claims, occupational disease claims and non-occupational disease claims pursuant to the 2019 actuarial valuation. In 2018 and 2017, actuarial valuations resulted in an increase of $13 million and $15 million, respectively. The prior years' adjustments from the actuarial valuations were mainly attributable to non-occupational disease claims, third-party claims and occupational disease claims reflecting changes in the Company's estimates of unasserted claims and costs related to asserted claims. The Company has an ongoing risk mitigation strategy focused on reducing the frequency and severity of claims through injury prevention and containment; mitigation of claims; and lower settlements of existing claims. As at December 31, 2019, 2018 and 2017, the Company's provision for personal injury and other claims in the U.S. was as follows: 2019 2018 2017 In millions Beginning of year Accruals and other Payments Foreign exchange $ 139 44 (31) (7) $ 116 41 (28) 10 $ 118 46 (41) (7) End of year $ 145 $ 139 $ 116 Current portion - End of year $ 36 $ 37 $ 25 For the U.S. personal injury and other claims liability, historical claim data is used to formulate assumptions relating to the expected number of claims and average cost per claim for each year. Changes in any one of these assumptions could materially affect Casualty and other expense CN | 2019 Annual Report 43

Management's Discussion and Analysis as reported in the Company's results of operations. A 5% change in the asbestos average claim cost or a 1% change in the inflation trend rate for all injury types would result in an increase or decrease in the liability recorded of approximately $2 million. Environmental matters Known existing environmental concerns The Company is or may be liable for remediation costs at individual sites, in some cases along with other potentially responsible parties, associated with actual or alleged contamination. The ultimate cost of addressing these known contaminated sites cannot be definitively established given that the estimated environmental liability for any given site may vary depending on the nature and extent of the contamination; the nature of anticipated response actions, taking into account the available clean-up techniques; evolving regulatory standards governing environmental liability; and the number of potentially responsible parties and their financial viability. As a result, liabilities are recorded based on the results of a four-phase assessment conducted on a site-by-site basis. A liability is initially recorded when environmental assessments occur, remedial efforts are probable, and when the costs, based on a specific plan of action in terms of the technology to be used and the extent of the corrective action required, can be reasonably estimated. The Company estimates the costs related to a particular site using cost scenarios established by external consultants based on the extent of contamination and expected costs for remedial efforts. In the case of multiple parties, the Company accrues its allocable share of liability taking into account the Company's alleged responsibility, the number of potentially responsible parties and their ability to pay their respective share of the liability. Adjustments to initial estimates are recorded as additional information becomes available. The Company's provision for specific environmental sites is undiscounted and includes costs for remediation and restoration of sites, as well as monitoring costs. Environmental expenses, which are classified as Casualty and other in the Consolidated Statements of Income, include amounts for newly identified sites or contaminants as well as adjustments to initial estimates. Recoveries of environmental remediation costs from other parties are recorded as assets when their receipt is deemed probable. As at December 31, 2019, 2018 and 2017, the Company's provision for specific environmental sites was as follows: 2019 2018 2017 In millions Beginning of year Accruals and other Payments Foreign exchange $ 61 31 (34) (1) $ 78 16 (34) 1 $ 86 16 (23) (1) End of year $ 57 $ 61 $ 78 Current portion - End of year $ 38 $ 39 $ 57 The Company anticipates that the majority of the liability at December 31, 2019 will be paid out over the next five years. Based on the information currently available, the Company considers its provisions to be adequate. Unknown existing environmental concerns While the Company believes that it has identified the costs likely to be incurred for environmental matters based on known information, the discovery of new facts, future changes in laws, the possibility of releases of hazardous materials into the environment and the Company's ongoing efforts to identify potential environmental liabilities that may be associated with its properties may result in the identification of additional environmental liabilities and related costs. The magnitude of such additional liabilities and the costs of complying with future environmental laws and containing or remediating contamination cannot be reasonably estimated due to many factors, including: • • • the lack of specific technical information available with respect to many sites; the absence of any government authority, third-party orders, or claims with respect to particular sites; the potential for new or changed laws and regulations and for development of new remediation technologies and uncertainty regarding the timing of the work with respect to particular sites; and the determination of the Company's liability in proportion to other potentially responsible parties and the ability to recover costs from any third parties with respect to particular sites. • Therefore, the likelihood of any such costs being incurred or whether such costs would be material to the Company cannot be determined at this time. There can thus be no assurance that liabilities or costs related to environmental matters will not be incurred in the future, or will not have a material adverse effect on the Company's financial position or results of operations in a particular quarter or fiscal year, or that the Company's liquidity will not be adversely impacted by such liabilities or costs, although management believes, based on current information, that the costs to address environmental matters will not have a material adverse effect on the Company's financial position or liquidity. Costs related to any unknown existing or future contamination will be accrued in the period in which they become probable and reasonably estimable. 44 CN | 2019 Annual Report

Management's Discussion and Analysis Future occurrences In railroad and related transportation operations, it is possible that derailments or other accidents, including spills and releases of hazardous materials, may occur that could cause harm to human health or to the environment. As a result, the Company may incur costs in the future, which may be material, to address any such harm, compliance with laws and other risks, including costs relating to the performance of clean-ups, payment of environmental penalties and remediation obligations, and damages relating to harm to individuals or property. Regulatory compliance The Company may incur significant capital and operating costs associated with environmental regulatory compliance and clean-up requirements, in its railroad operations and relating to its past and present ownership, operation or control of real property. Environmental expenditures that relate to current operations are expensed unless they relate to an improvement to the property. Expenditures that relate to an existing condition caused by past operations and which are not expected to contribute to current or future operations are expensed. Operating expenses related to regulatory compliance activities for environmental matters for the year ended December 31, 2019 amounted to $25 million (2018 - $22 million; 2017 - $20 million). For 2020, the Company expects to incur operating expenses relating to environmental matters in the same range as 2019. In addition, based on the results of its operations and maintenance programs, as well as ongoing environmental audits and other factors, the Company plans for specific capital improvements on an annual basis. Certain of these improvements help ensure facilities, such as fueling stations, waste water and storm water treatment systems, comply with environmental standards and include new construction and the updating of existing systems and/or processes. Other capital expenditures relate to assessing and remediating certain impaired properties. The Company's environmental capital expenditures for the year ended December 31, 2019 amounted to $25 million (2018 - $19 million; 2017 - $21 million). For 2020, the Company expects to incur capital expenditures relating to environmental matters in the same range as 2019. Business risks In the normal course of business, the Company is exposed to various business risks and uncertainties that can have an effect on the Company's results of operations, financial position, or liquidity. While some exposures may be reduced by the Company's risk management strategies, many risks are driven by external factors beyond the Company's control or are of a nature which cannot be eliminated. The key areas of business risks and uncertainties described in this section are not the only ones that can affect the Company. Additional risks and uncertainties not currently known to management or that may currently not be considered material by management, could nevertheless also have an adverse effect on the Company's business. Competition The Company faces significant competition, including from rail carriers and other modes of transportation, and is also affected by its customers' flexibility to select among various origins and destinations, including ports, in getting their products to market. Specifically, the Company faces competition from Canadian Pacific Railway Company (CP), which operates the other major rail system in Canada and services most of the same industrial areas, commodity resources and population centers as the Company; major U.S. railroads and other Canadian and U.S. railroads; long-distance trucking companies, transportation via the St. Lawrence-Great Lakes Seaway and the Mississippi River and transportation via pipelines. In addition, while railroads must build or acquire and maintain their rail systems, motor carriers and barges are able to use public rights-of-way that are built and maintained by public entities without paying fees covering the entire costs of their usage. Competition is generally based on the quality and the reliability of the service provided, access to markets, as well as price. Factors affecting the competitive position of customers, including exchange rates and energy cost, could materially adversely affect the demand for goods supplied by the sources served by the Company and, therefore, the Company's volumes, revenues and profit margins. Factors affecting the general market conditions for the Company's customers can result in an imbalance of transportation capacity relative to demand. An extended period of supply/demand imbalance could negatively impact market rate levels for all transportation services, and more specifically the Company's ability to maintain or increase rates. This, in turn, could materially and adversely affect the Company's business, results of operations or financial position. The level of consolidation of rail systems in the U.S. has resulted in larger rail systems that are in a position to compete effectively with the Company in numerous markets. There can be no assurance that the Company will be able to compete effectively against current and future competitors in the transportation industry, or that further consolidation within the transportation industry and legislation allowing for more leniency in size and weight for motor carriers will not adversely affect the Company's competitive position. No assurance can be given that competitive pressures will not lead to reduced revenues, profit margins or both. CN | 2019 Annual Report 45

Management's Discussion and Analysis Environmental matters The Company's operations are subject to numerous federal, provincial, state, municipal and local environmental laws and regulations in Canada and the U.S. concerning, among other things, emissions into the air; discharges into waters; the generation, handling, storage, transportation, treatment and disposal of waste, hazardous substances and other materials; decommissioning of underground and aboveground storage tanks; and soil and groundwater contamination. A risk of environmental liability is inherent in railroad and related transportation operations; real estate ownership, operation or control; and other commercial activities of the Company with respect to both current and past operations. As a result, the Company incurs significant operating and capital costs, on an ongoing basis, associated with environmental regulatory compliance and clean-up requirements in its railroad operations and relating to its past and present ownership, operation or control of real property. While the Company believes that it has identified the costs likely to be incurred for environmental matters in the next several years based on known information, the discovery of new facts, future changes in laws, the possibility of releases of hazardous materials into the environment and the Company's ongoing efforts to identify potential environmental liabilities that may be associated with its properties may result in the identification of additional environmental liabilities and related costs. In railroad and related transportation operations, it is possible that derailments or other accidents, including spills and releases of hazardous materials, may occur that could cause harm to human health or to the environment. In addition, the Company is also exposed to potential catastrophic liability risk, faced by the railroad industry generally, in connection with the transportation of toxic inhalation hazard materials such as chlorine and anhydrous ammonia, or other dangerous commodities such as crude oil and propane that the Company may be required to transport as a result of its common carrier obligations. Therefore, the Company may incur costs in the future, which may be material, to address any such harm, compliance with laws or other risks, including costs relating to the performance of clean-ups, payment of environmental penalties and remediation obligations, and damages relating to harm to individuals or property. The environmental liability for any given contaminated site varies depending on the nature and extent of the contamination; the available clean-up techniques; evolving regulatory standards governing environmental liability; and the number of potentially responsible parties and their financial viability. As such, the ultimate cost of addressing known contaminated sites cannot be definitively established. Also, additional contaminated sites yet unknown may be discovered or future operations may result in accidental releases. While some exposures may be reduced by the Company's risk mitigation strategies (including periodic audits, employee training programs, emergency plans and procedures, and insurance), many environmental risks are driven by external factors beyond the Company's control or are of a nature which cannot be completely eliminated. Therefore, there can be no assurance, notwithstanding the Company's mitigation strategies, that liabilities or costs related to environmental matters will not be incurred in the future or that environmental matters will not have a material adverse effect on the Company's results of operations, financial position or liquidity, or reputation. Personal injury and other claims In the normal course of business, the Company becomes involved in various legal actions seeking compensatory and occasionally punitive damages, including actions brought on behalf of various purported classes of claimants and claims relating to employee and third-party personal injuries, occupational disease, and property damage, arising out of harm to individuals or property allegedly caused by, but not limited to, derailments or other accidents. The Company maintains provisions for such items, which it considers to be adequate for all of its outstanding or pending claims and benefits from insurance coverage for occurrences in excess of certain amounts. The final outcome with respect to actions outstanding or pending at December 31, 2019, or with respect to future claims, cannot be predicted with certainty, and therefore there can be no assurance that their resolution will not have a material adverse effect on the Company's results of operations, financial position or liquidity, in a particular quarter or fiscal year. Labor negotiations As at December 31, 2019, CN employed a total of 18,726 employees in Canada, of which 13,447, or 72%, were unionized employees and 7,249 employees in the U.S., of which 6,111, or 84%, were unionized employees. The Company's relationships with its unionized workforce are governed by, amongst other items, collective agreements which are negotiated from time to time. Disputes relating to the renewal of collective agreements could potentially result in strikes, slowdowns and loss of business. Future labor agreements or renegotiated agreements could increase labor and fringe benefits and related expenses. There can be no assurance that the Company will be able to renew and have its collective agreements ratified without any strikes or lockouts or that the resolution of these collective bargaining negotiations will not have a material adverse effect on the Company's results of operations or financial position. Canadian workforce On February 5, 2019, the collective agreement with the United Steelworkers governing track and bridge workers was ratified by its members, renewing the collective agreement for a five-year term expiring on December 31, 2023. On March 22, 2019, CN received notice to commence collective bargaining with the Teamsters Canada Rail Conference (TCRC) to renew the collective agreements covering conductors and yard service employees. On June 26, 2019, the Minister of Labour appointed conciliators to 46 CN | 2019 Annual Report

Management's Discussion and Analysis assist the parties in their negotiations. On August 23, 2019, the parties agreed to extend the conciliation period. On November 19, 2019, the TCRC initiated strike action and on November 26, 2019 a tentative agreement was reached to renew the collective agreements. On January 31, 2020, the collective agreements were ratified by its members, renewing the collective agreements for a three-year term, retroactive from July 23, 2019. On May 10, 2019, the collective agreements with Unifor for three bargaining units covering clerical and intermodal employees, and other classifications, were ratified by its members, renewing the collective agreements for a 45-month term expiring on December 31, 2022. On October 2, 2019, subsequent to the tentative agreement reached with Unifor to renew the collective agreement governing owner-operator truck drivers which was rejected by the membership on May 10, 2019, a revised agreement was ratified by its members, renewing that collective agreement through December 31, 2023. On June 14, 2019, the collective agreement with the TCRC governing rail traffic controllers was ratified by its members, renewing the collective agreements for a four-year term expiring on December 31, 2022. The Company's collective agreements remain in effect until the bargaining process outlined under the Canada Labour Code has been exhausted. U.S. workforce As of January 31, 2020, collective agreements covering all non-operating and operating craft employees at Grand Trunk Western Railroad Company (GTW), companies owned by Illinois Central Corporation (ICC), companies owned by Wisconsin Central Ltd. (WC) and Bessemer & Lake Erie Railroad Company (BLE), and all employees at Pittsburgh and Conneaut Dock Company (PCD) were ratified. The tentative agreement covering the laborers represented by the United Steelworkers at PCD was reached on December 23, 2019 and was ratified by its members on December 27, 2019. Agreements in place have various moratorium provisions, which preserve the status quo in respect of the given collective agreement during the terms of such moratoriums. Where negotiations are ongoing, the terms and conditions of existing agreements generally continue to apply until new agreements are reached or the processes of the Railway Labor Act have been exhausted. The general approach to labor negotiations by U.S. Class I railroads is to bargain on a collective national basis with the industry, which GTW, ICC, WC and BLE currently participate in, for collective agreements covering all non-operating and operating employees. The next national bargaining round has commenced. Regulation Economic regulation – Canada The Company's rail operations in Canada are subject to economic regulation by the Canadian Transportation Agency under the Canada Transportation Act, which provides rate and service remedies, including final offer arbitration, long-haul interswitching rates and mandatory interswitching. It also regulates the maximum revenue entitlement for the movement of regulated grain, charges for railway ancillary services and noise-related disputes. In addition, various Company business transactions must gain prior regulatory approval, with attendant risks and uncertainties, and the Company is subject to government oversight with respect to rate, service and business practice issues. No assurance can be given that any current or future regulatory or legislative initiatives by the Canadian federal government and agencies will not materially adversely affect the Company's results of operations or its competitive and financial position. Economic regulation – U.S. The Company's U.S. rail operations are subject to economic regulation by the STB. The STB serves as both an adjudicatory and regulatory body and has jurisdiction over certain railroad rate and service issues and rail restructuring transactions such as mergers, line sales, line construction and line abandonments. As such, various Company business transactions must gain prior regulatory approval and aspects of its pricing and service practices may be subject to challenge, with attendant risks and uncertainties. Recent proceedings undertaken by the STB in a number of significant matters remain pending. The rail industry had previously challenged as unconstitutional Congress’ delegation in the Passenger Rail Investment and Improvement Act of 2008 (PRIIA) to Amtrak and the Federal Railroad Administration (FRA) of joint authority to promulgate the PRIIA performance standards. On March 23, 2017, the U.S. District Court for the District of Columbia concluded that Section 207 of PRIIA was void and unconstitutional and vacated the performance standards. The Government defendants challenged this decision in the U.S. Court of Appeals for the District of Columbia. On July 20, 2018, the U.S. Court of Appeals for the District of Columbia Circuit reversed the judgment of the District Court and held that the constitutional defect could be appropriately remedied by severing the arbitration provision in Section 207(d). The U.S. Court of Appeals noted that the aspect of the District Court’s decision that vacated the performance standards is final because the Government defendants did not challenge it on appeal. On October 24, 2018, the U.S. Court of Appeals denied the rail industry's petition for rehearing. On June 3, 2019, the U.S. Supreme Court denied the rail industry’s petition for review. As part of PRIIA, U.S. Congress authorized the STB to investigate any railroad CN | 2019 Annual Report 47

Management's Discussion and Analysis over whose track Amtrak operates that fails to meet heightened performance standards preference to Amtrak, the STB is authorized to assess damages against the host railroad. On August 8, 2019, the STB issued interim findings and guidance to National Railroad Passenger Corporation (Amtrak) and the Company regarding the terms and conditions for Amtrak’s use of the Company’s lines. The STB ordered Board-sponsored mediation. In 2019, the STB proposed rules and policy statements and received comments related to the reporting of rail service data, the agency’s methodology for determining the rail industry’s cost of capital, and rate reasonableness standards, in addition to issuing proposals concerning demurrage and accessorial charges. The STB held a hearing to receive comments on a report concerning revenue adequacy and received additional comments in the proceeding relating to the STB's prior notice of proposed rulemaking to revoke previously granted exemptions of five commodities from regulatory oversight. No assurance can be given that these and any other current or future regulatory or legislative initiatives by the U.S. federal government and agencies will not materially adversely affect the Company's results of operations or its competitive and financial position. Safety regulation – Canada The Company's rail operations in Canada are subject to safety regulation by the Minister under the Railway Safety Act as well as the rail portions of other safety-related statutes, which are administered by Transport Canada. The Company may be required to transport toxic inhalation hazard materials as a result of its common carrier obligations and, as such, is exposed to additional regulatory oversight in Canada. The Transportation of Dangerous Goods Act, also administered by Transport Canada, establishes the safety requirements for the transportation of goods classified as dangerous and enables the adoption of regulations for security training and screening of personnel working with dangerous goods, as well as the development of a program to require a transportation security clearance for dangerous goods, the tracking of dangerous goods during transport and the development of an emergency response plan. In 2014, Transport Canada's new Grade Crossings Regulations under the Railway Safety Act came into force, which establish specific standards for new grade crossings and requirements that existing crossings be upgraded to basic safety standards by November 2021, as well as safety related data that must be provided by railway companies on an annual basis. The Company has complied with the information requirements by providing road authorities with specific information respecting public grade crossings. The Company has also initiated the work required to have grade crossings on its network to meet the new standards. On April 26, 2017, the Minister initiated the review of the Railway Safety Act, which was initially scheduled for 2018, and a panel of three persons was appointed to proceed with the review. On May 31, 2018, the Minister tabled in the House of Commons the report of the three-person panel. The Minister has not indicated how and when he will answer to the panel's report. Transport Canada's new regulations aimed at lowering the risk of terrorism on the Canadian rail system, entitled Transportation of Dangerous Goods by Rail Security Regulations were adopted on May 6, 2019 but are coming into force in sequence. The provisions under which rail carriers have to conduct security inspections of certain railway vehicles containing dangerous goods, report potential security threats and concerns to the Canadian Transport Emergency Centre, and employ a rail security coordinator are in force since August 6, 2019. The requirements that all rail carriers proactively engage in security planning processes and manage security risks, by introducing security awareness training for employees, security plans that include measures to address assessed risks, and security plan training for employees with duties related to the security plan or security sensitive dangerous goods will come into force on February 6, 2020. Bill C-49, which came into force on May 23, 2018, contains provisions that amend the Railway Safety Act to prohibit a railway company from operating railway equipment unless the equipment is fitted with prescribed recording instruments and prescribed information is recorded using those instruments, collected and preserved. These changes are not yet in force as regulations detailing their conditions must first be enacted by Transport Canada. On May 24, 2019, Transport Canada published the proposed Locomotive Voice and Video Recorder Regulations ("LVVR") and invited interested parties to comment by July 24, 2019. The LVVR draft regulations, to be adopted pursuant to the Transportation Modernization Act (Bill C-49), will require railway companies to procure and install LVVR equipment within two years after their coming into force. The LVVR regulations set out the technical specifications of the equipment, deal with record keeping, provide for privacy protection and detail how railway companies can access the information on a random basis. LVVR technology will assist in preventing accidents and facilitate investigations to better understand the circumstances of accidents. On July 24, 2019, CN provided its submission. Transport Canada is expected to issue a revised version of the proposed regulations when all comments have been reviewed. On December 20, 2018, the Minister issued an order requesting Canadian railway companies to revise the Work/Rest Rules under the Railway Safety Act to reflect the latest fatigue science and fatigue management practices and address a series of related elements. On April 13, 2019, Transport Canada published proposed new Passenger Rail Security Regulations, these regulations would require passenger railway and host companies to effectively manage their security risks by implementing risk-based security practices, including security awareness training, security risk assessments, security plans, security plan training, the designation of a rail security coordinator, security inspections, security exercises and security incident reporting. 48 CN | 2019 Annual Report

Management's Discussion and Analysis No assurance can be given that these and any other current or future regulatory or legislative initiatives by the Canadian federal government and agencies will not materially adversely affect the Company's results of operations or its competitive and financial position. Safety regulation – U.S. The Company's U.S. rail operations are subject to safety regulation by the FRA under the Federal Railroad Safety Act as well as rail portions of other safety statutes, with the transportation of certain hazardous commodities also governed by regulations promulgated by the Pipeline and Hazardous Materials Safety Administration (PHMSA). PHMSA requires carriers operating in the U.S. to report annually the volume and route-specific data for cars containing these commodities; conduct a safety and security risk analysis for each used route; identify a commercially practicable alternative route for each used route; and select for use the practical route posing the least safety and security risk. In addition, the Transportation Security Administration (TSA) requires rail carriers to provide upon request, within five minutes for a single car and 30 minutes for multiple cars, location and shipping information on cars on their networks containing toxic inhalation hazard materials and certain radioactive or explosive materials; and ensure the secure, attended transfer of all such cars to and from shippers, receivers and other carriers that will move from, to, or through designated high-threat urban areas. On October 16, 2008, the U.S. Congress enacted the Rail Safety Improvement Act of 2008, which required all Class I railroads and intercity passenger and commuter railroads to implement a PTC system by December 31, 2015 on mainline track where intercity passenger railroads and commuter railroads operate and where toxic inhalation hazard materials of certain thresholds are transported. PTC is a collision avoidance technology designed to override locomotive controls and prevent train-to-train collisions, overspeed derailments, misaligned switch derailments, and unauthorized incursions onto established work zones. Pursuant to the Positive Train Control Enforcement and Implementation Act of 2015 and the FAST Act of 2015, Congress extended the PTC installation deadline until December 31, 2018, with the option for a railroad carrier to complete full implementation by no later than December 31, 2020, provided certain milestones were met by the end of 2018. In 2018, the Company completed the milestones required for the extension and the FRA has approved the extension for the Company to complete full implementation by December 31, 2020. CN has received conditional FRA approval to conduct PTC revenue operation, which enables interoperability testing with other railroads. The FRA is reviewing CN's PTC Safety Plan. In 2019, CN initiated PTC revenue operation on its remaining subdivisions where PTC is required and began interoperability testing with tenant railroads. Noncompliance with these or other laws and regulations may subject the Company to fines, penalties and/or service interruptions. The implementation of PTC will result in additional capital expenditures and operating costs. In order to implement PTC, the Company has invested in various information technology applications, including back office systems, aimed to enhance the reliability of PTC operations. The Company continues to evaluate the technical and operational merits of its information technology applications. In the event that such evaluations lead to the identification of better or more reliable technology, the Company may consider implementing such technology, which may result in additional costs. PTC may result in reduced operational efficiency and service levels. On February 28, 2019, in coordination with the FRA, PHMSA issued a final rule for oil spill response plans and information sharing for high-hazard flammable trains for the purpose of improving oil spill response readiness and mitigating the effects of oil-related rail incidents. On March 29, 2019, the Association of American Railroads sought reconsideration from PHMSA of certain aspects of the final rule. On May 29, 2019, PHMSA denied the request for reconsideration. No assurance can be given that these and any other current or future regulatory or legislative initiatives by the U.S. federal government and agencies will not materially adversely affect the Company's results of operations or its competitive and financial position. Regulation – Vessels The Company's vessel operations are subject to regulation by the U.S. Coast Guard and the Department of Transportation, Maritime Administration, which regulate the ownership and operation of vessels operating on the Great Lakes and in U.S. coastal waters. In addition, the Environmental Protection Agency has authority to regulate air emissions from these vessels. CN | 2019 Annual Report 49

Management's Discussion and Analysis Security The Company is subject to statutory and regulatory directives in the U.S. addressing homeland security concerns. In the U.S., safety matters related to security are overseen by the TSA, which is part of the U.S. Department of Homeland Security (DHS) and PHMSA, which, like the FRA, is part of the U.S. Department of Transportation. Border security falls under the jurisdiction of U.S. Customs and Border Protection (CBP), which is part of the DHS. In Canada, the Company is subject to regulation by the Canada Border Services Agency (CBSA). Matters related to agriculture-related shipments crossing the Canada/U.S. border also fall under the jurisdiction of the U.S. Department of Agriculture (USDA) and the Food and Drug Administration (FDA) in the U.S. and the Canadian Food Inspection Agency (CFIA) in Canada. More specifically, the Company is subject to: • • border security arrangements, pursuant to an agreement the Company and CP entered into with the CBP and the CBSA; the CBP's Customs-Trade Partnership Against Terrorism (C-TPAT) program and designation as a low-risk carrier under CBSA's Customs Self-Assessment (CSA) program; regulations imposed by the CBP requiring advance notification by all modes of transportation for all shipments into the U.S. The CBSA is also working on similar requirements for Canada-bound traffic; inspection for imported fruits and vegetables grown in Canada and the agricultural quarantine and inspection (AQI) user fee for all traffic entering the U.S. from Canada; and gamma ray screening of cargo entering the U.S. from Canada, and potential security and agricultural inspections at the Canada/U.S. border. • • • The Company has worked with the AAR to develop and put in place an extensive industry-wide security plan to address terrorism and security-driven efforts by state and local governments seeking to restrict the routings of certain hazardous materials. If such state and local routing restrictions were to go into force, they would be likely to add to security concerns by foreclosing the Company's most optimal and secure transportation routes, leading to increased yard handling, longer hauls, and the transfer of traffic to lines less suitable for moving hazardous materials, while also infringing upon the exclusive and uniform federal oversight over railroad security matters. While the Company will continue to work closely with the CBSA, CBP, and other Canadian and U.S. agencies, as described above, no assurance can be given that these and future decisions by the U.S., Canadian, provincial, state, or local governments on homeland security matters, legislation on security matters enacted by the U.S. Congress or Parliament, or joint decisions by the industry in response to threats to the North American rail network, will not materially adversely affect the Company's results of operations, or its competitive and financial position. Transportation of hazardous materials As a result of its common carrier obligations, the Company is legally required to transport toxic inhalation hazard materials regardless of risk or potential exposure or loss. A train accident involving the transport of these commodities could result in significant costs and claims for personal injury, property damage, and environmental penalties and remediation in excess of insurance coverage for these risks, which may materially adversely affect the Company's results of operations, or its competitive and financial position. Economic conditions The Company is susceptible to changes in the economic conditions of the industries and geographic areas that produce and consume the freight it transports or the supplies it requires to operate. In addition, many of the goods and commodities carried by the Company experience cyclicality in demand. For example, the volatility in domestic and global energy markets could impact the demand for transportation services as well as impact the Company's fuel costs and surcharges. In addition, the volatility in other commodity markets such as coal and iron ore could have an impact on volumes. Many of the bulk commodities the Company transports move offshore and are affected more by global rather than North American economic conditions. Adverse North American and global economic conditions, or economic or industrial restructuring, that affect the producers and consumers of the commodities carried by the Company, including customer insolvency, may have a material adverse effect on the volume of rail shipments and/or revenues from commodities carried by the Company, and thus materially and negatively affect its results of operations, financial position, or liquidity. 50 CN | 2019 Annual Report
Management's Discussion and Analysis Pension funding volatility The Company's funding requirements for its defined benefit pension plans are determined using actuarial valuations. See the section of this MD&A entitled Critical accounting estimates – Pensions and other postretirement benefits for information relating to the funding of the Company's defined benefit pension plans. Adverse changes with respect to pension plan returns and the level of interest rates as well as changes to existing federal pension legislation and regulation may significantly impact future pension contributions and have a material adverse effect on the funding status of the plans and the Company's results of operations. The OSFI proposed revisions to its Instruction guide for the Preparation of Actuarial Reports for defined benefit pension plans. This will affect the December 31, 2020 actuarial valuations by reducing the solvency status of the Company’s defined benefit pension plans, and may negatively impact the Company’s pension funding requirements starting in year 2021. There can be no assurance that the Company's pension expense and funding of its defined benefit pension plans will not increase in the future and thereby negatively impact earnings and/or cash flow. Reliance on technology and related cybersecurity risk The Company relies on information technology in all aspects of its business. While the Company has business continuity and disaster recovery plans, as well as other security and mitigation programs in place to protect its operations, information and technology assets, a cybersecurity attack and significant disruption or failure of its information technology and communications systems could result in service interruptions, safety failures, security violations, regulatory compliance failures or other operational difficulties, leading to possible litigation and regulatory oversight. Security threats are evolving, and can come from nation states, organized criminals, hacktivists and others with malicious intent. A security incident could compromise corporate information and assets, as well as operations. If the Company is unable to restore service or to acquire or implement any needed new technology, it may suffer a competitive disadvantage, which could also have an adverse effect on the Company's results of operations, financial position or liquidity. The Company is investing to meet evolving network and data security expectations and regulations, in an effort to mitigate the impact a security incident might have on the Company's results of operations, financial position or liquidity. The final outcome of a potential security incident cannot be predicted with certainty, and therefore there can be no assurance that its resolution will not have a material adverse effect on the Company's reputation, goodwill, results of operations, financial position or liquidity, in a particular quarter or fiscal year. Trade restrictions Global as well as North American trade conditions, including trade barriers on certain commodities, may interfere with the free circulation of goods across Canada and the U.S. or the cost associated therewith. Following the expiration of the Softwood Lumber Agreement (SLA) between Canada and the U.S., including the expiration of the one year moratorium period preventing the U.S. from launching any trade action against Canadian producers, on January 3, 2018, based on affirmative final determinations by both the U.S. Department of Commerce and the U.S. International Trade Commission, antidumping and countervailing duty orders were imposed on imports of Canadian softwood lumber to the U.S., which Canada responded to the imposition by the U.S. of antidumping and countervailing duties, in connection with lumber and other commodities, by filing a complaint with the World Trade Organization (WTO). In June 2019, Canada appealed the WTO panel ruling of April 2019 that allowed the U.S. to continue to use their current methodology to calculate anti-dumping tariffs on lumber. On November 30, 2018, the U.S., Canada and Mexico signed the United States-Mexico-Canada Agreement (USMCA), a new trade agreement to replace the North American Free Trade Agreement, which was subject to ratification by the legislature of Canada and the U.S., with Mexico having ratified it on June 19, 2019. On May 17, 2019, Canada and the U.S. reached an understanding on tariffs of steel and aluminum to eliminate all tariffs the U.S. imposed on Canadian imports of steel and aluminum, and all tariffs Canada imposed in retaliation for the action taken by the U.S. On December 10, 2019, Canada, U.S. and Mexico announced that an agreement had been reached on the remaining provisions to implement the USMCA. The revised USMCA is still subject to the remaining ratification of the legislature of Canada. It remains too early to assess the potential outcome of other ongoing various trade actions taken by governments and agencies. As such, there can be no assurance that trade actions will not materially adversely affect the volume of rail shipments and/or revenues from commodities carried by the Company, and thus materially and negatively impact earnings and/or cash flow. Terrorism and international conflicts Potential terrorist actions can have a direct or indirect impact on the transportation infrastructure, including railway infrastructure in North America, and can interfere with the free flow of goods. Rail lines, facilities and equipment could be directly targeted or become indirect casualties, which could interfere with the free flow of goods. International conflicts can also have an impact on the Company's markets. Government response to such events could adversely affect the Company's operations. Insurance premiums could also increase significantly or coverage could become unavailable. CN | 2019 Annual Report 51

Management's Discussion and Analysis Customer credit risk In the normal course of business, the Company monitors the financial condition and credit limits of its customers and reviews the credit history of each new customer. Although the Company believes there are no significant concentrations of credit risk, economic conditions can affect the Company's customers and can result in an increase to the Company's credit risk and exposure to the business failures of its customers. A widespread deterioration of customer credit and/or business failures of customers could have a material adverse effect on the Company's results of operations, financial position or liquidity. Liquidity Disruptions in financial markets or deterioration of the Company's credit ratings could hinder the Company's access to external sources of funding to meet its liquidity needs. There can be no assurance that changes in the financial markets will not have a negative effect on the Company's liquidity and its access to capital at acceptable terms and rates. Supplier concentration The Company operates in a capital-intensive industry where the complexity of rail equipment limits the number of suppliers available. The supply market could be disrupted if changes in the economy caused any of the Company's suppliers to cease production or to experience capacity or supply shortages. The supply market could become further concentrated and could result in changes to the product or service offerings by suppliers. This could also result in cost increases to the Company and difficulty in obtaining and maintaining the Company's rail equipment and materials. Since the Company also has foreign suppliers, international relations, trade restrictions and global economic and other conditions may potentially interfere with the Company's ability to procure necessary equipment and materials. Widespread business failures of, or restrictions on suppliers, could have a material adverse effect on the Company's results of operations or financial position. Availability of qualified personnel The Company may experience demographic challenges in the employment levels of its workforce. Changes in employee demographics, training requirements and the availability of qualified personnel, particularly locomotive engineers and conductors, could negatively impact the Company's ability to meet demand for rail service. The Company monitors employment levels and seeks to ensure that there is an adequate supply of personnel to meet rail service requirements. However, the Company's efforts to attract and retain qualified personnel may be hindered by specific conditions in the job market. No assurance can be given that demographic or other challenges will not materially adversely affect the Company's results of operations or its financial position. Fuel costs The Company is susceptible to the volatility of fuel prices due to changes in the economy or supply disruptions. Fuel shortages can occur due to refinery disruptions, production quota restrictions, climate, and labor and political instability. Increases in fuel prices or supply disruptions may materially adversely affect the Company's results of operations, financial position or liquidity. Foreign exchange The Company conducts its business in both Canada and the U.S. and as a result, is affected by currency fluctuations. Changes in the exchange rate between the Canadian dollar and other currencies (including the US dollar) make the goods transported by the Company more or less competitive in the world marketplace and thereby may adversely affect the Company's revenues and expenses. Interest rates The Company is exposed to interest rate risk relating to the Company's debt. The Company mainly issues fixed-rate debt, which exposes the Company to variability in the fair value of the debt. The Company also issues debt with variable interest rates, which exposes the Company to variability in interest expense. Adverse changes to market interest rates may significantly impact the fair value or future cash flows of the Company's financial instruments. There can be no assurance that changes in the market interest rates will not have a negative effect on the Company's results of operations or liquidity. Transportation network disruptions Due to the integrated nature of the North American freight transportation infrastructure, the Company's operations may be negatively affected by service disruptions of other transportation links such as ports and other railroads which interchange with the Company. A significant prolonged service disruption of one or more of these entities could have an adverse effect on the Company's results of operations, financial position or liquidity. Furthermore, deterioration in the cooperative relationships with the Company's connecting carriers could directly affect the Company's operations. 52 CN | 2019 Annual Report

Management's Discussion and Analysis Severe weather The Company's success is dependent on its ability to operate its railroad efficiently. Severe weather and natural disasters, such as extreme cold or heat, flooding, droughts, fires, hurricanes and earthquakes, can disrupt operations and service for the railroad, affect the performance of locomotives and rolling stock, as well as disrupt operations for both the Company and its customers. Business interruptions resulting from severe weather could result in increased costs, increased liabilities and lower revenues, which could have a material adverse effect on the Company's results of operations, financial condition or liquidity. Climate change Climate change, including the impacts of global warming, has the potential physical risks of increasing the frequency of adverse weather events, which can disrupt the Company's operations and damage its infrastructure or properties. It could also affect the markets for, or the volume of, the goods the Company carries or otherwise have a material adverse effect on the Company's results of operations, financial position or liquidity. Government action or inaction to address climate change could also affect CN. The Company is currently subject to climate change and other emissions-related laws and regulations that have been proposed and, in some cases adopted, on the federal, provincial and state levels. While CN is continually focused on efficiency improvements and reducing its carbon footprint, cap and trade systems, carbon taxes, or other controls on emissions of greenhouse gasses imposed by various government bodies could increase the Company's capital and operating costs. The Company may not be able to offset such impacts, including, for example, through higher freight rates. Climate change legislation and regulation could also affect CN's customers; make it difficult for CN's customers to produce products in a cost-competitive manner due to increased energy costs; and increase legal costs related to defending and resolving legal claims and other litigation related to climate change. Controls and procedures The Company's Chief Executive Officer and its Chief Financial Officer, after evaluating the effectiveness of the Company's disclosure controls and procedures (as defined in Exchange Act Rules 13a-15(e) and 15d-15(e)) as of December 31, 2019, have concluded that the Company's disclosure controls and procedures were effective. During the fourth quarter ended December 31, 2019, there was no change in the Company's internal control over financial reporting that has materially affected, or is reasonably likely to materially affect, the Company's internal control over financial reporting. As of December 31, 2019, management has assessed the effectiveness of the Company's internal control over financial reporting using the criteria set forth by the Committee of Sponsoring Organizations of the Treadway Commission in Internal Control – Integrated Framework (2013). Based on this assessment, management has determined that the Company's internal control over financial reporting was effective as of December 31, 2019, and issued Management's Report on Internal Control over Financial Reporting dated January 31, 2020 to that effect. 53 CN | 2019 Annual Report

Management's Report on Internal Control over Financial Reporting Management is responsible for establishing and maintaining adequate internal control over financial reporting. Internal control over financial reporting is a process designed to provide reasonable assurance regarding the reliability of financial reporting and the preparation of financial statements for external purposes in accordance with generally accepted accounting principles. Because of its inherent limitations, internal control over financial reporting may not prevent or detect misstatements. Management has assessed the effectiveness of the Company's internal control over financial reporting as of December 31, 2019 using the criteria set forth by the Committee of Sponsoring Organizations of the Treadway Commission in Internal Control - Integrated Framework (2013). Based on this assessment, management has determined that the Company's internal control over financial reporting was effective as of December 31, 2019. KPMG LLP, an independent registered public accounting firm, has issued an unqualified audit report on the effectiveness of the Company's internal control over financial reporting as of December 31, 2019 and has also expressed an unqualified audit opinion on the Company's 2019 consolidated financial statements as stated in their Reports of Independent Registered Public Accounting Firm dated January 31, 2020. (s) Jean-Jacques Ruest President and Chief Executive Officer January 31, 2020 (s) Ghislain Houle Executive Vice-President and Chief Financial Officer January 31, 2020 54 CN | 2019 Annual Report
Report of Independent Registered Public Accounting Firm To the Shareholders and Board of Directors Canadian National Railway Company: Opinion on the consolidated financial statements We have audited the accompanying consolidated balance sheets of Canadian National Railway Company (the "Company") as of December 31, 2019 and 2018, the related consolidated statements of income, comprehensive income, changes in shareholders' equity and cash flows for each of the years in the three year period ended December 31, 2019, and the related notes (collectively, the "consolidated financial statements"). In our opinion, the consolidated financial statements present fairly, in all material respects, the financial position of the Company as of December 31, 2019 and 2018, and the results of its operations and its cash flows for each of the years in the three year period ended December 31, 2019, in conformity with U.S. generally accepted accounting principles. We also have audited, in accordance with the standards of the Public Company Accounting Oversight Board (United States) ("PCAOB"), the Company's internal control over financial reporting as of December 31, 2019, based on criteria established in Internal Control – Integrated Framework (2013) issued by the Committee of Sponsoring Organizations of the Treadway Commission, and our report dated January 31, 2020 expressed an unqualified opinion on the effectiveness of the Company's internal control over financial reporting. Change in accounting principle As discussed in Note 2 to the consolidated financial statements, the Company has changed its method of accounting for leases as of January 1, 2019 due to the adoption of Accounting Standards Codification Topic 842 Leases, using a modified retrospective adoption approach. Basis for opinion These consolidated financial statements are the responsibility of the Company's management. Our responsibility is to express an opinion on these consolidated financial statements based on our audits. We are a public accounting firm registered with the PCAOB and are required to be independent with respect to the Company in accordance with the U.S. federal securities laws and the applicable rules and regulations of the Securities and Exchange Commission and the PCAOB. We conducted our audits in accordance with the standards of the PCAOB. Those standards require that we plan and perform the audit to obtain reasonable assurance about whether the consolidated financial statements are free of material misstatement, whether due to error or fraud. Our audits included performing procedures to assess the risks of material misstatement of the consolidated financial statements, whether due to error or fraud, and performing procedures that respond to those risks. Such procedures included examining, on a test basis, evidence regarding the amounts and disclosures in the consolidated financial statements. Our audits also included evaluating the accounting principles used and significant estimates made by management, as well as evaluating the overall presentation of the consolidated financial statements. We believe that our audits provide a reasonable basis for our opinion. Critical audit matters The critical audit matters communicated below are matters arising from the current period audit of the consolidated financial statements that were communicated or required to be communicated to the audit committee and that: (1) relate to accounts or disclosures that are material to the consolidated financial statements and (2) involved our especially challenging, subjective or complex judgments. The communication of critical audit matters does not alter in any way our opinion on the consolidated financial statements, taken as a whole, and we are not, by communicating the critical audit matters below, providing separate opinions on the critical audit matters or on the accounts or disclosures to which they relate. Evaluation of income taxes As discussed in Note 6 to the consolidated financial statements, the net deferred income tax liability was $7,844 million as of December 31, 2019 and income tax expense was $1,213 million for the year ended December 31, 2019. The Company operates in different tax jurisdictions which requires the Company to make significant judgments and estimates in relation to its tax positions. We identified the evaluation of the net deferred income tax liability and income tax expense as a critical audit matter due to the magnitude of these tax balances and complexities in the evaluation of the application of the relevant tax regulations applicable to the Company. A higher degree of auditor judgment is required in assessing certain of the Company’s tax positions and balances. CN | 2019 Annual Report 55

Report of Independent Registered Public Accounting Firm The primary procedures we performed to address this critical audit matter included the following. We tested certain internal controls over the Company’s income tax accounting process, including controls related to the Company’s reconciliation and analysis of its deferred income tax balances. We involved income tax and transfer pricing professionals with specialized skills and knowledge to assist in: (1) assessing the Company’s interpretation of the relevant tax regulations, including the impact of the U.S. Tax Cuts and Jobs Act; (2) evaluating the Company’s tax positions and transfer pricing arrangements; (3) analyzing the Company’s deferred income tax balances by comparing prior year tax estimates to actual tax returns filed, and evaluating the Company’s reconciliation of the deferred income tax balances to the underlying temporary differences. Evaluation of capitalization of costs relating to track and railway infrastructure and depreciation related to properties As discussed in Notes 1 and 9 to the consolidated financial statements, capital additions were $3,865 million for the year ended December 31, 2019, of which $1,489 million related to track and railway infrastructure maintenance, including the replacement of rail, ties, bridge improvements, and other general track maintenance. For self-constructed properties, expenditures include direct material, labor, and contracted services, as well as other allocated costs. The Company follows the group method of depreciation whereby a single composite depreciation rate is applied to the gross investment in a class of similar assets. These Notes also discussed that depreciation expense relating to properties was $1,559 million for the year ended December 31, 2019. The Company performs comprehensive Canadian and U.S. depreciation studies on specific asset groups on a periodic basis, which require significant judgment. These studies incorporate numerous assumptions related to the remaining service lives and the U.S. studies involve a third party expert. The depreciation studies consider, among other factors, the analysis of historical retirement data using recognized life analysis techniques, and the forecasting of asset life characteristics. We identified the evaluation of capitalization of costs relating to track and railway infrastructure and depreciation expense related to properties as a critical audit matter. The magnitude and complexities in self-constructed properties, as well as the judgments involved in the determination of the expenditure meeting the Company’s pre-determined capitalization criteria requires subjective auditor judgment. Further, there is a higher degree of auditor judgment required in evaluating the estimated service lives of the respective asset classes. Changes in estimated service lives can significantly impact the amount of depreciation expense. The primary procedures we performed to address this critical audit matter included the following. We tested certain internal controls over the Company’s capital additions process, including controls related to the monitoring of budget versus actual costs on capital projects and the Company’s analysis of projects assessing that the expenditures charged to projects meet the Company’s pre-determined capitalization criteria. We also tested certain internal controls over the Company’s depreciation expense process, including controls related to the Company’s assessment of the Canadian and U.S. depreciation studies. We traced a sample of capital expenditure additions to underlying documentation and assessed whether the expenditure met the Company’s pre-determined capitalization criteria. The testing was performed at a disaggregated level by type of cost (including direct material, labor, and contracted services), and included comparisons to prior period per unit measures by region. We evaluated the key assumptions in determining the estimated service lives in the Company’s Canadian and U.S. depreciation studies by testing the historical data used in the depreciation studies through comparison to underlying documentation. In addition, we compared the Company’s historical retirement patterns to the service lives used in the depreciation studies, and interviewed the Company’s personnel with specialized knowledge of the subject matter and a third party expert. (s) KPMG LLP* We have served as the Company's auditor since 1992. Montréal, Canada January 31, 2020 * CPA auditor, CA, public accountancy permit No. A123145 KPMG LLP is a Canadian limited liability partnership and a member firm of the KPMG network of independent member firms affiliated with KPMG International Cooperative ("KPMG International"), a Swiss entity. KPMG Canada provides services to KPMG LLP. 56 CN | 2019 Annual Report

Report of Independent Registered Public Accounting Firm To the Shareholders and Board of Directors Canadian National Railway Company: Opinion on internal control over financial reporting We have audited the Canadian National Railway Company's (the "Company") internal control over financial reporting as of December 31, 2019, based on criteria established in Internal Control - Integrated Framework (2013) issued by the Committee of Sponsoring Organizations of the Treadway Commission. In our opinion, the Company maintained, in all material respects, effective internal control over financial reporting as of December 31, 2019, based on criteria established in Internal Control - Integrated Framework (2013) issued by the Committee of Sponsoring Organizations of the Treadway Commission. We also have audited, in accordance with the standards of the Public Company Accounting Oversight Board (United States) ("PCAOB"), the consolidated balance sheets of the Company as of December 31, 2019 and 2018, the related consolidated statements of income, comprehensive income, changes in shareholders' equity and cash flows for each of the years in the three-year period ended December 31, 2019, and the related notes (collectively, the "consolidated financial statements"), and our report dated January 31, 2020 expressed an unqualified opinion on those consolidated financial statements. Basis for opinion The Company's management is responsible for maintaining effective internal control over financial reporting and for its assessment of the effectiveness of internal control over financial reporting included in the accompanying Management's Report on Internal Control over Financial Reporting. Our responsibility is to express an opinion on the Company's internal control over financial reporting based on our audit. We are a public accounting firm registered with the PCAOB and are required to be independent with respect to the Company in accordance with the U.S. federal securities laws and the applicable rules and regulations of the Securities and Exchange Commission and the PCAOB. We conducted our audit in accordance with the standards of the PCAOB. Those standards require that we plan and perform the audit to obtain reasonable assurance about whether effective internal control over financial reporting was maintained in all material respects. Our audit of internal control over financial reporting included obtaining an understanding of internal control over financial reporting, assessing the risk that a material weakness exists, and testing and evaluating the design and operating effectiveness of internal control based on the assessed risk. Our audit also included performing such other procedures as we considered necessary in the circumstances. We believe that our audit provides a reasonable basis for our opinion. Definition and limitations of internal control over financial reporting A company's internal control over financial reporting is a process designed to provide reasonable assurance regarding the reliability of financial reporting and the preparation of financial statements for external purposes in accordance with generally accepted accounting principles. A company's internal control over financial reporting includes those policies and procedures that (1) pertain to the maintenance of records that, in reasonable detail, accurately and fairly reflect the transactions and dispositions of the assets of the company; (2) provide reasonable assurance that transactions are recorded as necessary to permit preparation of financial statements in accordance with generally accepted accounting principles, and that receipts and expenditures of the company are being made only in accordance with authorizations of management and directors of the company; and (3) provide reasonable assurance regarding prevention or timely detection of unauthorized acquisition, use, or disposition of the company's assets that could have a material effect on the financial statements. Because of its inherent limitations, internal control over financial reporting may not prevent or detect misstatements. Also, projections of any evaluation of effectiveness to future periods are subject to the risk that controls may become inadequate because of changes in conditions, or that the degree of compliance with the policies or procedures may deteriorate. (s) KPMG LLP* Montréal, Canada January 31, 2020 * CPA auditor, CA, public accountancy permit No. A123145 KPMG LLP is a Canadian limited liability partnership and a member firm of the KPMG network of independent member firms affiliated with KPMG International Cooperative ("KPMG International"), a Swiss entity. KPMG Canada provides services to KPMG LLP. CN | 2019 Annual Report 57
Consolidated Statements of Income In millions, except per share data Year ended December 31, 2019 2018 2017 Revenues (Note 4) $ 14,917 $ 14,321 $ 13,041 Operating expenses Labor and fringe benefits Purchased services and material Fuel Depreciation and amortization (Note 9) Equipment rents Casualty and other 2,922 2,267 1,637 1,562 444 492 2,860 1,971 1,732 1,329 467 469 2,536 1,769 1,362 1,281 418 432 Total operating expenses 9,324 8,828 7,798 Operating income Interest expense Other components of net periodic benefit income (Note 15) Other income (Note 5) 5,593 (538) 321 53 5,493 (489) 302 376 5,243 (481) 315 12 Income before income taxes Income tax recovery (expense) (Note 6) 5,429 (1,213) 5,682 (1,354) 5,089 395 Net income $ 4,216 $ 4,328 $ 5,484 Earnings per share (Note 7) Basic Diluted Weighted-average number of shares (Note 7) Basic Diluted $ $ 5.85 5.83 $ $ 5.89 5.87 $ $ 7.28 7.24 720.1 722.6 734.5 737.7 753.6 757.3 See accompanying notes to consolidated financial statements. Consolidated Statements of Comprehensive Income In millions Year ended December 31, 2019 2018 2017 Net income Other comprehensive income (loss) (Note 18) Net gain (loss) on foreign currency translation Net change in pension and other postretirement benefit plans (Note 15) $ 4,216 $ 4,328 $ 5,484 (256) (440) 403 (759) (197) (224) Other comprehensive loss before income taxes Income tax recovery (expense) (696) 62 (356) 291 (421) (5) Other comprehensive loss (634) (65) (426) Comprehensive income $ 3,582 $ 4,263 $ 5,058 See accompanying notes to consolidated financial statements. 58 CN | 2019 Annual Report

Consolidated Balance Sheets In millions December 31, 2019 2018 Assets Current assets Cash and cash equivalents Restricted cash and cash equivalents (Note 13) Accounts receivable (Note 8) Material and supplies $ 64 524 1,213 611 $ 266 493 1,169 557 Other current assets 418 243 Total current assets Properties (Note 9) Operating lease right-of-use assets (Note 10) (1) Pension asset (Note 15) 2,830 39,669 520 336 2,728 37,773 — 446 Intangible assets, goodwill and other (Note 11) 429 267 Total assets $ 43,784 $ 41,214 Liabilities and shareholders' equity Current liabilities Accounts payable and other (Note 12) $ 2,357 $ 2,316 Current portion of long-term debt (Note 13) 1,930 1,184 Total current liabilities Deferred income taxes (Note 6) Other liabilities and deferred credits (Note 14) Pension and other postretirement benefits (Note 15) Long-term debt (Note 13) Operating lease liabilities (Note 10) (1) Shareholders' equity Common shares (Note 16) Common shares in Share Trusts (Note 16) Additional paid-in capital Accumulated other comprehensive loss (Note 18) 4,287 7,844 634 733 11,866 379 3,500 7,480 501 707 11,385 — 3,650 (163) 403 (3,483) 3,634 (175) 408 (2,849) Retained earnings 17,634 16,623 Total shareholders' equity 18,041 17,641 Total liabilities and shareholders' equity $ 43,784 $ 41,214 (1) The Company adopted Accounting Standards Update (ASU) 2016-02: Leases and related amendments (Topic 842) in the first quarter of 2019 using a modified retrospective approach with a cumulative-effect adjustment to Retained earnings recognized on January 1, 2019, with no restatement of comparative period financial information. The Company now includes Operating lease right-of-use assets and Operating lease liabilities on the Consolidated Balance Sheet. See Note 2 - Recent accounting pronouncements for additional information. See accompanying notes to consolidated financial statements. On behalf of the Board of Directors: (s) Robert Pace Director (s) Jean-Jacques Ruest Director 59 CN | 2019 Annual Report

Consolidated Statements of Changes in Shareholders' Equity Number of common shares Common shares in Share Trusts Accumulated other comprehensive loss Additional paid-in capital Total shareholders' equity Share Trusts Common shares Retained earnings In millions Outstanding Balance at December 31, 2016 762.0 1.8 $ 3,647 $ (137) $ 450 $ (2,358) $ 13,239 $ 14,841 Net income Stock options exercised Settlement of equity settled awards (Note 16) Stock-based compensation expense and other Repurchase of common shares (Note 16) Share purchases by Share Trusts (Note 16) Other comprehensive loss (Note 18) Dividends ($1.65 per share) 5,484 5,484 58 1.2 68 (10) 0.3 (0.3) 24 (84) (22) (82) 78 (3) (1,898) 75 (2,000) (20.4) (102) (0.5) 0.5 (55) (55) (426) (1,239) (426) (1,239) Balance at December 31, 2017 742.6 2.0 3,613 (168) 434 (2,784) 15,561 16,656 Net income Stock options exercised Settlement of equity settled awards (Note 16) Stock-based compensation expense and other Repurchase of common shares (Note 16) Share purchases by Share Trusts (Note 16) Other comprehensive loss (Note 18) Dividends ($1.82 per share) 4,328 4,328 103 1.7 120 (17) 0.4 (0.4) 31 (68) (30) (67) 59 (2) (1,901) 57 (2,000) (19.0) (99) (0.4) 0.4 (38) (38) (65) (1,333) (65) (1,333) Balance at December 31, 2018 725.3 2.0 3,634 (175) 408 (2,849) 16,623 17,641 Net income Stock options exercised Settlement of equity settled awards (Note 16) Stock-based compensation expense and other Repurchase of common shares (Note 16) Share purchases by Share Trusts (Note 16) Other comprehensive loss (Note 18) Dividends ($2.15 per share) Cumulative-effect adjustment from the adoption of ASU 2016-02 (1) 4,216 4,216 77 1.1 89 (12) 0.5 (0.5) 45 (56) (61) (72) 63 (2) (1,627) 61 (1,700) (14.3) (73) (0.3) 0.3 (33) (33) (634) (1,544) (634) (1,544) 29 29 Balance at December 31, 2019 712.3 1.8 $ 3,650 $ (163) $ 403 $ (3,483) $ 17,634 $ 18,041 (1) The Company adopted Accounting Standards Update (ASU) 2016-02: Leases and related amendments (Topic 842) in the first quarter of 2019 using a modified retrospective approach with a cumulative-effect adjustment to Retained earnings recognized on January 1, 2019, with no restatement of comparative period financial information. See Note 2 - Recent accounting pronouncements for additional information. See accompanying notes to consolidated financial statements. 60 CN | 2019 Annual Report

Consolidated Statements of Cash Flows In millions Year ended December 31, 2019 2018 2017 Operating activities Net income $ 4,216 $ 4,328 $ 5,484 Adjustments to reconcile net income to net cash provided by operating activities: Depreciation and amortization Pension income and funding (1) Deferred income taxes (Note 6) Gain on disposal of property (Note 5) Changes in operating assets and liabilities: Accounts receivable Material and supplies Accounts payable and other Other current assets 1,562 (288) 569 — 1,329 (209) 527 (338) 1,281 (286) (1,195) — (7) (60) (498) 5 (91) (120) 379 14 (125) (70) 418 (80) Other operating activities, net (1) 424 99 89 Net cash provided by operating activities 5,923 5,918 5,516 Investing activities Property additions Acquisitions, net of cash acquired (Note 3) Disposal of property (Note 5) (3,865) (259) — (3,531) — 194 (2,673) — — Other investing activities, net (66) (67) (65) Net cash used in investing activities (4,190) (3,404) (2,738) Financing activities Issuance of debt (Note 13) Repayment of debt (Note 13) Change in commercial paper, net (Note 13) Settlement of foreign exchange forward contracts on debt Issuance of common shares for stock options exercised (Note 17) Withholding taxes remitted on the net settlement of equity settled awards (Note 17) Repurchase of common shares (Note 16) Purchase of common shares for settlement of equity settled awards Purchase of common shares by Share Trusts (Note 16) Dividends paid 1,653 (402) 141 2 77 3,268 (2,393) 99 53 103 916 (841) 379 (15) 58 (61) (1,700) (11) (33) (1,544) (51) (2,000) (16) (38) (1,333) (57) (2,016) (25) (55) (1,239) Acquisition, additional cash consideration (Note 3) (25) — — Net cash used in financing activities (1,903) (2,308) (2,895) Effect of foreign exchange fluctuations on cash, cash equivalents, restricted cash, and restricted cash equivalents (1) — (2) Net increase (decrease) in cash, cash equivalents, restricted cash, and restricted cash equivalents Cash, cash equivalents, restricted cash, and restricted cash equivalents, (171) 206 (119) beginning of year 759 553 672 Cash, cash equivalents, restricted cash, and restricted cash equivalents, end of year $ 588 64 $ $ 759 266 $ $ 553 70 Cash and cash equivalents, end of year $ Restricted cash and cash equivalents, end of year 524 493 483 Cash, cash equivalents, restricted cash, and restricted cash equivalents, end of year $ 588 $ 759 $ 553 Supplemental cash flow information Interest paid Income taxes paid (Note 6) $ $ (521) (822) $ $ (488) (776) $ $ (477) (712) (1) In the first quarter of 2019, the Company began presenting Pension income and funding as a separate line on the Consolidated Statements of Cash Flows. Previously pension income and funding was included in Other operating activities, net. Comparative figures have been adjusted to conform to the current presentation. See accompanying notes to consolidated financial statements. CN | 2019 Annual Report 61

Notes to the Consolidated Financial Statements Contents 1 Summary of significant accounting policies 2 Recent accounting pronouncements 3 Business combinations 4 Revenues 5 Other income 6 Income taxes 7 Earnings per share 8 Accounts receivable 9 Properties 63 68 70 71 72 73 75 76 76 77 79 79 80 83 84 91 93 98 99 102 103 104 10 11 12 13 14 15 16 17 18 19 20 21 22 Leases Intangible assets, goodwill and other Accounts payable and other Debt Other liabilities and deferred credits Pensions and other postretirement benefits Share capital Stock-based compensation Accumulated other comprehensive loss Major commitments and contingencies Financial instruments Segmented information Subsequent events 62 CN | 2019 Annual Report

Notes to the Consolidated Financial Statements Canadian National Railway Company, together with its wholly-owned subsidiaries, collectively "CN" or the "Company," is engaged in the rail and related transportation business. CN spans Canada and mid-America, from the Atlantic and Pacific oceans to the Gulf of Mexico, serving the cities and ports of Vancouver, Prince Rupert (British Columbia), Montreal, Halifax, New Orleans and Mobile (Alabama), and the metropolitan areas of Toronto, Edmonton, Winnipeg, Calgary, Chicago, Memphis, Detroit, Duluth (Minnesota)/Superior (Wisconsin) and Jackson (Mississippi), with connections to all points in North America. CN's freight revenues are derived from the movement of a diversified and balanced portfolio of goods, including petroleum and chemicals, grain and fertilizers, coal, metals and minerals, forest products, intermodal and automotive. 1 – Summary of significant accounting policies Basis of presentation These consolidated financial statements are expressed in Canadian dollars, except where otherwise indicated, and have been prepared in accordance with United States generally accepted accounting principles (GAAP) as codified in the Financial Accounting Standards Board (FASB) Accounting Standards Codification (ASC). Principles of consolidation These consolidated financial statements include the accounts of all subsidiaries and variable interest entities for which the Company is the primary beneficiary. The Company is the primary beneficiary of the Employee Benefit Plan Trusts ("Share Trusts") as the Company funds the Share Trusts. The Company's investments in which it has significant influence are accounted for using the equity method and all other investments for which fair value is not readily determinable are accounted for at cost minus impairment, plus or minus observable price changes. Use of estimates The preparation of financial statements in conformity with GAAP requires management to make estimates and assumptions that affect the reported amounts of revenues, expenses, assets and liabilities, and the disclosure of contingent assets and liabilities at the date of the financial statements. On an ongoing basis, management reviews its estimates, including those related to goodwill, intangible assets, identified assets and liabilities acquired in business combinations, income taxes, depreciation, pensions and other postretirement benefits, personal injury and other claims, and environmental matters, based upon available information. Actual results could differ from these estimates. Revenues Nature of services The Company's revenues consist of freight revenues and other revenues. Freight revenues include revenue from the movement of freight over rail and are derived from the following seven commodity groups: • • • • • • • Petroleum and chemicals, which includes chemicals and plastics, refined petroleum products, crude and condensate, and sulfur; Metals and minerals, which includes energy materials, metals, minerals, and iron ore; Forest products, which includes lumber, pulp, paper, and panels; Coal, which includes coal and petroleum coke; Grain and fertilizers, which includes Canadian regulated grain, Canadian commercial grain, U.S. grain, potash and other fertilizers; Intermodal, which includes rail and trucking services for domestic and international traffic; and Automotive, which includes finished vehicles and auto parts. Freight revenues also comprise revenues for optional services beyond the basic movement of freight including asset use, switching, storage, and other services. Other revenues are derived from non-rail logistics services that support the Company's rail business including vessels and docks, transloading and distribution, automotive logistics, and freight forwarding and transportation management. Revenue recognition Revenues are recognized when control of promised services is transferred to customers in an amount that reflects the consideration the Company expects to be entitled to receive in exchange for those services. The Company accounts for contracts with customers when it has approval and commitment from both parties, each party's rights have been identified, payment terms are defined, the contract has commercial substance and collection is probable. For contracts that involve multiple performance obligations, the Company allocates the transaction price to each performance obligation in the contract based on relative standalone selling prices and recognizes revenue when, or as, performance obligations in the contract are satisfied. Revenues are presented net of taxes collected from customers and remitted to governmental authorities. CN | 2019 Annual Report 63

Notes to the Consolidated Financial Statements Freight revenues Freight services are arranged through publicly-available tariffs or customer-specific agreements that establish the pricing, terms and conditions for freight services offered by the Company. For revenue recognition purposes, a contract for the movement of freight over rail exists when shipping instructions are sent by a customer and have been accepted by the Company in connection with the relevant tariff or customer-specific agreement. Revenues for the movement of freight over rail are recognized over time due to the continuous transfer of control to the customer as freight moves from origin to destination. Progress towards completion of the performance obligation is measured based on the transit time of freight from origin to destination. The allocation of revenues between periods is based on the relative transit time in each period with expenses recorded as incurred. Revenues related to freight contracts that require the involvement of another rail carrier to move freight from origin to destination are reported on a net basis. Freight movements are completed over a short period of time and are generally completed before payment is due. Freight receivables are included in Accounts receivable on the Consolidated Balance Sheets. The Company has no material contract assets associated with freight revenues. Contract liabilities represent consideration received from customers for which the related performance obligation has not been satisfied. Contract liabilities are recognized into revenues when or as the related performance obligation is satisfied. The Company includes contract liabilities within Accounts payable and other and Other liabilities and deferred credits on the Consolidated Balance Sheets. Revenues for optional services are recognized at a point in time or over time as performance obligations are satisfied, depending on the nature of the service. Freight contracts may be subject to variable consideration in the form of volume-based incentives, rebates, or other items, which affect the transaction price. Variable consideration is recognized as revenue to the extent that it is probable that a significant reversal in the amount of cumulative revenue recognized will not occur. Variable consideration is accrued on the basis of management's best estimate of the expected amount, which is based on available historical, current and forecasted information. Other revenues Other revenues are recognized at a point in time or over time as performance obligations are satisfied, depending on the nature of the service. Income taxes The Company follows the asset and liability method of accounting for income taxes. Under the asset and liability method, the change in the net deferred income tax asset or liability is included in the computation of Net income or Other comprehensive income (loss). Deferred income tax assets and liabilities are measured using enacted tax rates expected to apply to taxable income in the years in which temporary differences are expected to be recovered or settled. Earnings per share Basic earnings per share is calculated using the weighted-average number of basic shares outstanding during the period. The weighted-average number of basic shares outstanding excludes shares held in the Share Trusts and includes vested equity settled stock-based compensation awards other than stock options. Diluted earnings per share is calculated using the weighted-average number of diluted shares outstanding during the period, applying the treasury stock method. The weighted-average number of diluted shares outstanding includes the dilutive effects of common shares issuable upon exercise of outstanding stock options and nonvested equity settled awards. Foreign currency All of the Company's foreign subsidiaries use the US dollar as their functional currency. Accordingly, the foreign subsidiaries' assets and liabilities are translated into Canadian dollars at the exchange rate in effect at the balance sheet date and the revenues and expenses are translated at the average exchange rates during the year. All adjustments resulting from the translation of the foreign operations are recorded in Other comprehensive income (loss). The Company designates the US dollar-denominated debt of the parent company as a foreign currency hedge of its net investment in foreign operations. Accordingly, foreign exchange gains and losses, from the dates of designation, on the translation of the US dollar-denominated debt are included in Other comprehensive income (loss). Cash and cash equivalents Cash and cash equivalents include highly liquid investments purchased three months or less from maturity and are stated at cost plus accrued interest, which approximates fair value. 64 CN | 2019 Annual Report
Notes to the Consolidated Financial Statements Restricted cash and cash equivalents The Company has the option, under its bilateral letter of credit facility agreements with various banks, to pledge collateral in the form of cash and cash equivalents for a minimum term of one month, equal to at least the face value of the letters of credit issued. Restricted cash and cash equivalents include highly liquid investments purchased three months or less from maturity and are stated at cost plus accrued interest, which approximates fair value. Accounts receivable Accounts receivable are recorded at cost net of billing adjustments and an allowance for doubtful accounts. The allowance for doubtful accounts is based on expected collectability and considers historical experience as well as known trends or uncertainties related to account collectability. When a receivable is deemed uncollectible, it is written off against the allowance for doubtful accounts. Subsequent recoveries of amounts previously written off are credited to bad debt expense in Casualty and other in the Consolidated Statements of Income. Material and supplies Material and supplies, which consist mainly of rail, ties, and other items for construction and maintenance of property and equipment, as well as diesel fuel, are measured at weighted-average cost. Properties Capitalization of costs The Company's railroad operations are highly capital intensive. The Company's properties mainly consist of homogeneous or network-type assets such as rail, ties, ballast and other structures, which form the Company's Track and roadway properties, and Rolling stock. The Company's capital expenditures are for the replacement of existing assets and for the purchase or construction of new assets to enhance operations or provide new service offerings to customers. A large portion of the Company's capital expenditures are for self-constructed properties, including the replacement of existing track and roadway assets and track line expansion, as well as major overhauls and large refurbishments of rolling stock. Expenditures are capitalized if they extend the life of the asset or provide future benefits such as increased revenue-generating capacity, functionality or service capacity. The Company has a process in place to determine whether or not costs qualify for capitalization, which requires judgment. For Track and roadway properties, the Company establishes basic capital programs to replace or upgrade the track infrastructure assets which are capitalized if they meet the capitalization criteria. In addition, for Track and roadway properties, expenditures that meet the minimum level of activity as defined by the Company are also capitalized as follows: • • • • grading: installation of road bed, retaining walls, and drainage structures; rail and related track material: installation of 39 or more continuous feet of rail; ties: installation of 5 or more ties per 39 feet; and ballast: installation of 171 cubic yards of ballast per mile. For purchased assets, the Company capitalizes all costs necessary to make the assets ready for their intended use. For self-constructed properties, expenditures include direct material, labor, and contracted services, as well as other allocated costs. These allocated costs include, but are not limited to, project supervision, fringe benefits, maintenance on equipment used on projects as well as the cost of small tools and supplies. The Company reviews and adjusts its allocations, as required, to reflect the actual costs incurred each year. For the rail asset, the Company capitalizes the costs of rail grinding which consists of restoring and improving the rail profile and removing irregularities from worn rail to extend the service life. The service life of the rail asset is increased incrementally as rail grinding is performed thereon, and as such, the costs incurred are capitalized given that the activity extends the service life of the rail asset beyond its original or current condition as additional gross tons can be carried over the rail for its remaining service life. For the ballast asset, the Company engages in shoulder ballast undercutting that consists of removing some or all of the ballast, which has deteriorated over its service life, and replacing it with new ballast. When ballast is installed as part of a shoulder ballast undercutting project, it represents the addition of a new asset and not the repair or maintenance of an existing asset. As such, the Company capitalizes expenditures related to shoulder ballast undercutting given that an existing asset is retired and replaced with a new asset. Under the group method of accounting for properties, the deteriorated ballast is retired at its historical cost. Costs of deconstruction and removal of replaced assets, referred to herein as dismantling costs, are distinguished from installation costs for self-constructed properties based on the nature of the related activity. For Track and roadway properties, employees concurrently perform dismantling and installation of new track and roadway assets and, as such, the Company estimates the amount of labor and other costs that are related to dismantling. The Company determines dismantling costs based on an analysis of the track and roadway installation process. CN | 2019 Annual Report 65

Notes to the Consolidated Financial Statements Expenditures relating to the Company's properties that do not meet the Company's capitalization criteria are expensed as incurred. For Track and roadway properties, such expenditures include but are not limited to spot tie replacement, spot or broken rail replacement, physical track inspection for detection of rail defects and minor track corrections, and other general maintenance of track infrastructure. Depreciation Properties are carried at cost less accumulated depreciation including asset impairment write-downs. The cost of properties, including those under finance leases, net of asset impairment write-downs, is depreciated on a straight-line basis over their estimated service lives, measured in years, except for rail and ballast whose service lives are measured in millions of gross tons. The Company follows the group method of depreciation whereby a single composite depreciation rate is applied to the gross investment in a class of similar assets, despite small differences in the service life or salvage value of individual property units within the same asset class. The Company uses approximately 40 different depreciable asset classes. For all depreciable asset classes, the depreciation rate is based on the estimated service lives of the assets. Assessing the reasonableness of the estimated service lives of properties requires judgment and is based on currently available information, including periodic depreciation studies conducted by the Company. The Company's United States (U.S.) properties are subject to comprehensive depreciation studies as required by the Surface Transportation Board (STB) and are conducted by external experts. Depreciation studies for Canadian properties are not required by regulation and are conducted internally. Studies are performed on specific asset groups on a periodic basis. Changes in the estimated service lives of the assets and their related composite depreciation rates are implemented prospectively. The service life of the rail asset is based on expected future usage of the rail in its existing condition, determined using railroad industry research and testing (based on rail characteristics such as weight, curvature and metallurgy), factoring in the rail asset's usage to date. The annual composite depreciation rate for the rail asset is determined by dividing the estimated annual number of gross tons carried over the rail by the estimated service life of the rail measured in millions of gross tons. The Company amortizes the cost of rail grinding over the remaining life of the rail asset, which includes the incremental life extension generated by rail grinding. Given the nature of the railroad and the composition of its network which is made up of homogeneous long-lived assets, it is impractical to maintain records of specific properties at their lowest unit of property. Retirements of assets occur through the replacement of an asset in the normal course of business, the sale of an asset or the abandonment of a section of track. For retirements in the normal course of business, generally the life of the retired asset is within a reasonable range of the expected useful life, as determined in the depreciation studies, and, as such, no gain or loss is recognized under the group method. The asset's cost is removed from the asset account and the difference between its estimated historical cost and estimated related accumulated depreciation (net of salvage proceeds and dismantling costs), if any, is recorded as an adjustment to accumulated depreciation and no gain or loss is recognized. The estimated historical cost of the retired asset is estimated by using deflation factors or indices that closely correlate to the properties comprising the asset classes in combination with the estimated age of the retired asset using a first-in, first-out approach, and applying it to the replacement value of the asset. In each depreciation study, an estimate is made of any excess or deficiency in accumulated depreciation for all corresponding asset classes to ensure that the depreciation rates remain appropriate. The excess or deficiency in accumulated depreciation is amortized over the remaining life of the asset class. For retirements of depreciable properties that do not occur in the normal course of business, the historical cost, net of salvage proceeds, is recorded as a gain or loss in income. A retirement is considered not to be in the normal course of business if it meets the following criteria: (i) it is unusual, (ii) it is significant in amount, and (iii) it varies significantly from the retirement pattern identified through depreciation studies. A gain or loss is recognized in Other income for the sale of land or disposal of assets that are not part of railroad operations. Leases The Company engages in short and long-term leases for rolling stock including locomotives and freight cars, equipment, real estate and service contracts that contain embedded leases. The Company determines whether or not a contract contains a lease at inception. Leases with a term of twelve months or less are not recorded by the Company on the Consolidated Balance Sheets. Finance and operating lease right-of-use assets and liabilities are recognized based on the present value of the future lease payments over the lease term at the commencement date. Where the implicit interest rate is not determinable from the lease, the Company uses internal incremental borrowing rates by tenor and currency to initially measure leases in excess of twelve months on the Consolidated Balance Sheets. Operating lease expense is recognized on a straight-line basis over the lease term. The Company's lease contracts may contain termination, renewal, and/or purchase options, residual value guarantees, or a combination thereof, all of which are evaluated by the Company on a quarterly basis. The majority of renewal options available extend the lease term from one to five years. The Company accounts for such contract options when the Company is reasonably certain that it will exercise one of these options. 66 CN | 2019 Annual Report

Notes to the Consolidated Financial Statements Lease contracts may contain lease and non-lease components that the Company generally accounts for separately, with the exception of the freight car asset category for which the Company has elected to not separate the lease and non-lease components. Intangible assets Intangible assets consist mainly of customer contracts and relationships acquired through business acquisitions. Intangible assets are generally amortized on a straight-line basis over their expected useful lives, ranging from 20 to 50 years. If a change in the estimated useful life of an intangible asset is determined, amortization is adjusted prospectively. For the purpose of impairment testing, the Company tests the recoverability of its intangible assets held and used whenever events or changes in circumstances indicate that the carrying amount may not be recoverable, based on future undiscounted cash flows. If the carrying amount of an intangible asset is not recoverable and exceeds the fair value, an impairment loss is recognized for the amount by which the carrying amount of the asset exceeds the fair value. Goodwill The Company recognizes goodwill as the excess of the purchase price over the fair value of identifiable net assets acquired in business combinations. Goodwill is assigned to the reporting units that are expected to benefit from the business acquisition. The carrying amount of goodwill is not amortized; instead, it is tested for impairment annually as of the first day of the fiscal fourth quarter or more frequently if events or changes in circumstances indicate that it is more likely than not that the fair value of a reporting unit is less than the carrying amount. For the purpose of impairment testing, the Company may first assess certain qualitative factors to determine if it is more likely than not that the fair value of a reporting unit is less than its carrying amount, including goodwill, or proceed directly to a quantitative goodwill impairment test. Qualitative factors include but are not limited to, economic, market and industry conditions, cost factors and overall financial performance of the reporting unit, and events such as changes in management or customers. If the qualitative assessment indicates that it is more likely than not that the fair value of a reporting unit is less than its carrying amount, the quantitative impairment test must be performed. The quantitative impairment test is performed by comparing the fair value of a reporting unit with its carrying amount, including goodwill, and an impairment loss is recognized for the amount by which the carrying amount exceeds the reporting unit’s fair value, up to the value of goodwill. The Company defines the fair value of a reporting unit as the price that would be received to sell the reporting unit as a whole in an orderly transaction between market participants as of the impairment date. To determine the fair value of a reporting unit, the Company uses the discounted cash flow method using the pre-tax discount rate that reflects current market assessments of the time value of money and the risks specific to the asset or group of assets. Accounts receivable securitization Based on the structure of its accounts receivable securitization program, the Company accounts for the proceeds received as secured borrowings. Pensions Pension costs are determined using actuarial methods. Net periodic benefit cost (income) includes the current service cost of pension benefits provided in exchange for employee service rendered during the year, which is recorded in Labor and fringe benefits expense. Net periodic benefit cost (income) also includes the following, which are recorded in Other components of net periodic benefit income (cost): • • • the interest cost of pension obligations; the expected long-term return on pension fund assets; the amortization of prior service costs and amendments over the expected average remaining service life of the employee group covered by the plans; and the amortization of cumulative net actuarial gains and losses in excess of 10% of the greater of the beginning of year balances of the projected benefit obligation or market-related value of plan assets, over the expected average remaining service life of the employee group covered by the plans. • The pension plans are funded through contributions determined in accordance with the projected unit credit actuarial cost method. Postretirement benefits other than pensions The Company accrues the cost of postretirement benefits other than pensions using actuarial methods. These benefits, which are funded as they become due, include life insurance programs, medical benefits and, for a closed group of employees, free rail travel benefits. The Company amortizes the cumulative net actuarial gains and losses in excess of 10% of the projected benefit obligation at the beginning of the year, over the expected average remaining service life of the employee group covered by the plan. CN | 2019 Annual Report 67

Notes to the Consolidated Financial Statements Additional paid-in capital Additional paid-in capital includes the stock-based compensation expense on equity settled awards and other items relating to equity settled awards. Upon the exercise of stock options, the stock-based compensation expense related to those awards is reclassified from Additional paid-in capital to Common shares. Upon settlement of all other equity settled awards, the Company reclassifies from Additional paid-in capital to Retained Earnings the excess, if any, of the settlement cost of the awards over the related stock-based compensation expense, with no adjustment to common shares. Stock-based compensation For equity settled awards, stock-based compensation costs are accrued over the requisite service period based on the fair value of the awards at the grant date. The grant date fair value of performance share unit (PSU) awards is dependent on the type of PSU award. The grant date fair value of PSU-ROIC awards is determined using a lattice-based model incorporating a minimum share price condition and the grant date fair value of PSU-TSR awards is determined using a Monte Carlo simulation model. The grant date fair value of equity settled deferred share unit (DSU) awards is determined using the stock price at the grant date. The grant date fair value of stock option awards is determined using the Black-Scholes option-pricing model. For cash settled awards, stock-based compensation costs are accrued over the requisite service period based on the fair value determined at each period-end. The fair value of cash settled DSU awards is determined using their intrinsic value. Personal injury and other claims In Canada, the Company accounts for costs related to employee work-related injuries based on actuarially developed estimates on a discounted basis of the ultimate cost associated with such injuries, including compensation, health care and third-party administration costs. In the U.S., the Company accrues the expected cost for personal injury, property damage and occupational disease claims, based on actuarial estimates of their ultimate cost on an undiscounted basis. For all other legal actions in Canada and the U.S., the Company maintains, and regularly updates on a case-by-case basis, provisions for such items when the expected loss is both probable and can be reasonably estimated based on currently available information. Environmental expenditures Environmental expenditures that relate to current operations, or to an existing condition caused by past operations, are expensed as incurred. Environmental expenditures that provide a future benefit are capitalized. Environmental liabilities are recorded when environmental assessments occur, remedial efforts are probable, and when the costs, based on a specific plan of action in terms of the technology to be used and the extent of the corrective action required, can be reasonably estimated. The Company accrues its allocable share of liability taking into account the Company's alleged responsibility, the number of potentially responsible parties and their ability to pay their respective shares of the liability. Recoveries of environmental remediation costs from other parties are recorded as assets when their receipt is deemed probable. Derivative financial instruments The Company uses derivative financial instruments from time to time in the management of its interest rate and foreign currency exposures. Derivative instruments are recorded on the balance sheet at fair value. The changes in fair value of derivative instruments not designated or not qualified as a hedge are recorded in Net income in the current period. 2 – Recent accounting pronouncements The following recent Accounting Standards Updates (ASUs) issued by FASB were adopted by the Company during the current year: ASU 2016-02 Leases and related amendments (Topic 842) The ASU requires a lessee to recognize a right-of-use asset and a lease liability on the balance sheet for all leases greater than twelve months and requires additional qualitative and quantitative disclosures. The lessor accounting model under the new standard is substantially unchanged. The guidance must be applied using a modified retrospective approach. Entities may elect to apply the guidance to each prior period presented with a cumulative-effect adjustment to retained earnings recognized at the beginning of the earliest period presented or to apply the guidance with a cumulative-effect adjustment to retained earnings recognized at the beginning of the period of adoption. The new standard provides a number of practical expedients and accounting policy elections upon transition. On January 1, 2019, the Company did not elect the package of three practical expedients that permits the Company not to reassess prior conclusions about lease qualification, classification and initial direct costs. Upon adoption, the Company elected the following practical expedients: • • the use-of-hindsight practical expedient to reassess the lease term and the likelihood that a purchase option will be exercised; the land easement practical expedient to not evaluate land easements that were not previously accounted for as leases under Topic 840; 68 CN | 2019 Annual Report

Notes to the Consolidated Financial Statements • the short-term lease exemption for all asset classes that permits entities not to recognize right-of-use assets and lease liabilities onto the balance sheet for leases with terms of twelve months or less; and the practical expedient to not separate lease and non-lease components for the freight car asset category. The Company adopted this standard in the first quarter of 2019 with an effective date of January 1, 2019 using a modified retrospective • approach with a cumulative-effect adjustment to Retained earnings recognized on January 1, 2019, with no restatement of comparative period financial information. As at January 1, 2019, the cumulative-effect adjustment to adopt the new standard increased the balance of Retained earnings by $29 million, relating to a deferred gain on a sale-leaseback transaction of a real estate property. The initial adoption transition adjustment to record right-of-use assets and lease liabilities for leases over twelve months on the Company's Consolidated Balance Sheet was $756 million to each balance. The initial adoption transition adjustment is comprised of finance and operating leases of $215 million and $541 million, respectively. New finance lease right-of-use assets and finance lease liabilities are a result of the reassessment of leases with purchase options that are reasonably certain to be exercised by the Company under the transition to Topic 842, previously accounted for as operating leases. ASU 2017-04 Intangibles - Goodwill and other (Topic 350): Simplifying the test for goodwill impairment The ASU simplifies the goodwill impairment test by removing the requirement to compare the implied fair value of goodwill with its carrying amount. Under the new standard, goodwill impairment tests are performed by comparing the fair value of a reporting unit with its carrying amount, recognizing an impairment charge for the amount by which the carrying amount exceeds the reporting unit’s fair value, up to the value of goodwill. The guidance must be applied prospectively. The ASU is effective for annual and any interim impairment tests for periods beginning after December 15, 2019. Early adoption is permitted for interim or annual goodwill impairment tests performed on testing dates after January 1, 2017. The Company adopted this standard in the first quarter of 2019 with an effective date of January 1, 2019. The adoption of this standard did not have an impact on the Company’s Consolidated Financial Statements. The following recent ASUs issued by FASB have an effective date after December 31, 2019 and have not been adopted by the Company: ASU 2019-12 Income taxes (Topic 740): Simplifying the accounting for income taxes The ASU adds new guidance to simplify accounting for income taxes, changes the accounting for certain income tax transactions and makes minor improvements to the codification. The ASU introduces new guidance that provides a policy election to not allocate consolidated income taxes when a member of a consolidated tax return is not subject to income tax, and provides guidance to evaluate whether a step-up in tax basis of goodwill relates to a business combination in which book goodwill was recognized or a separate transaction. In addition, the ASU changes the current guidance by making an intraperiod allocation if there is a loss in continuing operations and gains outside of continuing operations; by determining when a deferred tax liability is recognized after an investor in a foreign entity transitions to or from the equity method of accounting; by accounting for tax law changes and year-to-date losses in interim periods; and by determining how to apply the income tax guidance to franchise taxes and other taxes that are partially based on income. The ASU is effective for annual and any interim period beginning after December 15, 2020. Early adoption is permitted. The Company is evaluating the effects that the adoption of the ASU will have on its Consolidated Financial Statements; no significant impact is expected. ASU 2016-13 Financial instruments - Credit losses (Topic 326): Measurement of credit losses on financial instruments The ASU requires financial assets measured at amortized cost to be presented at the net amount expected to be collected. The new standard replaces the current incurred loss impairment methodology with one that reflects expected credit losses. The adoption of the ASU is not expected to have a significant impact on the Company’s Consolidated Financial Statements. CN will adopt the requirements of the ASU effective January 1, 2020. Other recently issued ASUs required to be applied for periods beginning on or after January 1, 2020 have been evaluated by the Company and will not have a significant impact on the Company's Consolidated Financial Statements. CN | 2019 Annual Report 69

Notes to the Consolidated Financial Statements 3 – Business combinations 2019 Acquisition of intermodal division of H&R Transport Limited On December 2, 2019, the Company acquired the intermodal temperature-controlled transportation division of the Alberta-based H&R Transport Limited ("H&R"). The acquisition positions CN to expand its presence in moving customer goods by offering more end to end rail supply chain solutions to a wider range of customers. The Company's Consolidated Balance Sheet includes the assets and liabilities of H&R as of December 2, 2019, the acquisition date. Since the acquisition date, H&R’s results of operations have been included in the Company's results of operations. The Company has not provided pro forma information relating to the pre-acquisition period as it was not material. Of the total purchase price of $105 million, $95 million was paid on the closing date and $10 million, mostly related to funds withheld for the indemnification of claims, will be paid within twenty months of the acquisition date. The following table summarizes the consideration transferred to acquire H&R, as well as the preliminary fair value of the assets acquired and liabilities assumed, and goodwill that were recognized at the acquisition date: December 2 2019 In millions Consideration transferred Cash paid at closing Consideration payable $ 95 10 Fair value of total consideration transferred $ 105 Recognized amounts of identifiable assets acquired and liabilities assumed (1) Current assets Non-current assets (2) Non-current liabilities $ 10 84 (1) Total identifiable net assets (3) $ 93 Goodwill (4) $ 12 (1) The Company's purchase price allocation is preliminary, based on information available to the Company to date, and subject to change over the measurement period, which may be up to one year from the acquisition date. Includes identifiable intangible assets of $52 million. Includes operating lease right-of-use assets and liabilities. The goodwill acquired through the business combination is mainly attributable to the premium of an established business operation. The goodwill is deductible for tax purposes. (2) (3) (4) Acquisition of the TransX Group of Companies On March 20, 2019, the Company acquired the Manitoba-based TransX Group of Companies ("TransX"). TransX provides various transportation and logistics services, including intermodal, truckload, less than truckload and specialized services. The acquisition positions CN to strengthen its intermodal business, and allows the Company to expand capacity and foster additional supply chain solutions. The acquisition was subject to a number of conditions, including regulatory review by the Competition Bureau Canada and Canada’s Ministry of Transportation. On March 18, 2019, the Competition Bureau Canada issued a No Action Letter, satisfying the only outstanding condition and allowing the Company to close the transaction. The Company's Consolidated Balance Sheet includes the assets and liabilities of TransX as of March 20, 2019, the acquisition date. Since the acquisition date, TransX's results of operations have been included in the Company's results of operations. The Company has not provided pro forma information relating to the pre-acquisition period as it was not material. The total purchase price of $192 million included an initial cash payment of $170 million, additional consideration of $25 million, less an adjustment of $3 million in the fourth quarter of 2019 to reflect the settlement of working capital. The acquisition date fair value of the additional consideration, recorded as a contingent liability, was estimated based on the expected outcome of operational and financial targets, and remained unchanged since the acquisition date. The fair value measure was based on Level 3 inputs not observable in the market. On August 27, 2019, the additional consideration was paid. 70 CN | 2019 Annual Report

Notes to the Consolidated Financial Statements The following table summarizes the consideration transferred to acquire TransX, as well as the preliminary fair value of the assets acquired and liabilities assumed, and goodwill that were recognized at the acquisition date: March 20 2019 In millions Consideration transferred Cash paid at closing Additional cash consideration and other (1) $ 170 22 Fair value of total consideration transferred $ 192 Recognized amounts of identifiable assets acquired and liabilities assumed (2) Current assets Non-current assets (3) Current liabilities Non-current liabilities $ 85 260 (134) (84) Total identifiable net assets (4) $ 127 Goodwill (5) $ 65 (1) (2) Includes additional cash consideration paid of $25 million less an adjustment of $3 million to reflect the settlement of working capital. The Company's purchase price allocation is preliminary, based on information available to the Company to date, and subject to change over the measurement period, which may be up to one year from the acquisition date. In the fourth quarter of 2019, the fair value of net assets acquired was adjusted to reflect the settlement of working capital and other adjustments. Includes identifiable intangible assets of $34 million. Includes finance and operating lease right-of-use assets and liabilities. The goodwill acquired through the business combination is mainly attributable to the premium of an established business operation. The goodwill is not deductible for tax purposes. (3) (4) (5) 4 – Revenues The following table provides disaggregated information for revenues: 2019 2018 2017 In millions Year ended December 31, Freight revenues Petroleum and chemicals Metals and minerals Forest products Coal Grain and fertilizers Intermodal Automotive $ 3,052 1,643 1,808 658 2,392 3,787 858 $ 2,660 1,689 1,886 661 2,357 3,465 830 $ 2,208 1,523 1,788 535 2,214 3,200 825 Total freight revenues Other revenues 14,198 719 13,548 773 12,293 748 Total revenues (1) (2) $ 14,917 $ 14,321 $ 13,041 (1) As at December 31, 2019, the Company had remaining performance obligations related to freight in-transit, for which revenues of $91 million are expected to be recognized in the next period. (2) See Note 21 - Segmented information for the disaggregation of revenues by geographic area. CN | 2019 Annual Report 71
Notes to the Consolidated Financial Statements Contract liabilities The following table provides a reconciliation of the beginning and ending balances of contract liabilities for the years ended December 31, 2019, and 2018: 2019 2018 In millions Beginning of year Revenue recognized included in the beginning balance Increase due to consideration received, net of revenue recognized $ 3 (3) 211 $ 3 (3) 3 End of year $ 211 $ 3 Current portion - End of year $ 50 $ 3 5 – Other income 2019 2018 2017 In millions Year ended December 31, Gain on disposal of property Gain on disposal of land Other (1) $ — 50 3 $ 338 27 11 $ — 22 (10) Total other income $ 53 $ 376 $ 12 (1) Includes foreign exchange gains and losses related to foreign exchange forward contracts and the re-measurement of foreign currency denominated monetary assets and liabilities. See Note 20 – Financial instruments for additional information. Disposal of property 2018 Guelph On November 15, 2018, the Company recorded a gain of $79 million ($70 million after-tax) in Other income upon transfer of control of a segment of the Guelph subdivision located between Georgetown and Kitchener, Ontario, together with the rail fixtures and certain passenger agreements (the “Guelph”). The gain recognized in 2018 was previously deferred from a 2014 transaction at which time the Company did not transfer control. Doney and St-Francois Spurs On September 5, 2018, the Company completed the sale of property located in Montreal, Quebec (the “Doney and St-Francois Spurs”) for cash proceeds of $40 million. The transaction resulted in a gain of $36 million ($32 million after-tax) that was recorded in Other income on that date. Central Station Railway Lease On April 9, 2018, the Company completed the transfer of its finance lease in the passenger rail facilities in Montreal, Quebec, together with its interests in related railway operating agreements (the “Central Station Railway Lease”), for cash proceeds of $115 million. The transaction resulted in a gain of $184 million ($156 million after-tax) that was recorded in Other income on that date. The gain includes the difference between the net book value of the asset and the cash proceeds, the extinguishment of the finance lease obligation, and the recognition of a gain previously deferred from a sale-leaseback transaction. Calgary Industrial Lead On April 6, 2018, the Company completed the sale of land located in Calgary, Alberta, excluding the rail fixtures (the “Calgary Industrial Lead”), for cash proceeds of $39 million. The transaction resulted in a gain of $39 million ($34 million after-tax) that was recorded in Other income on that date. 72 CN | 2019 Annual Report
Notes to the Consolidated Financial Statements 6 – Income taxes The Company's consolidated effective income tax rate differs from the Canadian, or domestic, statutory federal tax rate. The effective tax rate is affected by recurring items in provincial, U.S. federal, state and other foreign jurisdictions, such as tax rates and the proportion of income earned in those jurisdictions. The effective tax rate is also affected by discrete items such as income tax rate enactments, and lower corporate income tax rates on capital dispositions that may occur in any given year. On December 22, 2017, the President of the United States signed into law the Tax Cuts and Jobs Act ("U.S. Tax Reform"). The U.S. Tax Reform reduces the U.S. federal corporate income tax rate from 35% to 21%, effective as of January 1, 2018. The U.S. Tax Reform also allows for immediate capital expensing of new investments in certain qualified depreciable assets made after September 27, 2017, which will be phased down starting in year 2023. As a result of the U.S. Tax Reform, the Company's net deferred income tax liability decreased by $1,764 million for the year ended December 31, 2017. The U.S. Tax Reform introduced other important changes to U.S. corporate income tax laws including the creation of a new Base Erosion Anti-abuse Tax (BEAT) that subjects certain payments from U.S. corporations to foreign related parties to additional taxes and limitations to the deduction for net interest expense incurred by U.S. corporations. Since the enactment of the U.S. Tax Reform, U.S. authorities have issued various proposed and finalized regulations and guidance interpreting its provisions. These interpretations have been taken into account in calculating the Company's current year income tax provision and tax payments. The U.S. Tax Reform and these regulations are expected to impact the Company's income tax provisions and tax payments in future years. The following table provides a reconciliation of income tax expense (recovery): 2019 2018 2017 In millions Year ended December 31, Canadian statutory federal tax rate Income tax expense at the Canadian statutory federal tax rate Income tax expense (recovery) resulting from: Provincial and foreign income taxes (1) Deferred income tax adjustments due to rate enactments (2) Gain on disposals (3) Other (4) 15% 814 15% 852 15% 763 $ $ $ 551 (112) (6) (34) 535 — (51) 18 536 (1,706) (3) 15 Income tax expense (recovery) $ 1,213 $ 1,354 $ (395) Net cash payments for income taxes $ 822 $ 776 $ 712 (1) (2) (3) (4) Includes mainly the impact of Canadian provincial taxes and U.S. federal and state taxes. Includes the net deferred income tax recovery resulting from the enactment of provincial, U.S. federal, and state corporate income tax laws and/or rates. Relates to the permanent differences arising from lower capital gain tax rates on the gain on disposal of the Company's properties in Canada. Includes adjustments relating to the filing or resolution of matters pertaining to prior years' income taxes, including net recognized tax benefits, excess tax benefits, and other items. The following table provides tax information on a domestic and foreign basis: In millions Year ended December 31, 2019 2018 2017 Income before income taxes Domestic Foreign $ 4,162 1,267 $ 4,400 1,282 $ 3,964 1,125 Total income before income taxes $ 5,429 $ 5,682 $ 5,089 Current income tax expense Domestic Foreign $ 608 36 $ 818 9 $ 758 42 Total current income tax expense $ 644 $ 827 $ 800 Deferred income tax expense (recovery) Domestic Foreign $ 423 146 $ 419 108 $ 349 (1,544) Total deferred income tax expense (recovery) $ 569 $ 527 $ (1,195) CN | 2019 Annual Report 73

Notes to the Consolidated Financial Statements The following table provides the significant components of deferred income tax assets and liabilities: 2019 2018 In millions December 31, Deferred income tax assets Net operating losses and tax credit carryforwards (1) Pension liability Lease liabilities Personal injury and other claims Other postretirement benefits liability Compensation reserves Unrealized foreign exchange losses Other $ 234 137 127 61 59 51 — 69 $ 20 128 — 65 70 74 50 61 Total deferred income tax assets $ 738 $ 468 Deferred income tax liabilities Properties Operating lease right-of-use assets Pension asset Unrealized foreign exchange gains Other $ 8,222 131 88 15 126 $ 7,672 — 120 — 156 Total deferred income tax liabilities $ 8,582 $ 7,948 Total net deferred income tax liability $ 7,844 $ 7,480 Total net deferred income tax liability Domestic Foreign $ 4,184 3,660 $ 3,808 3,672 Total net deferred income tax liability $ 7,844 $ 7,480 (1) As at December 31, 2019, the Company has $937 million net operating loss carryforwards for U.S. federal income tax purposes that arose in 2019, over an indefinite period. The utilization of those U.S. federal net operating loss carryforwards is limited to 80% of taxable income in any given year, as prescribed under the provisions of the U.S. Tax Reform. In addition, the Company has net operating loss carryforwards of $177 million for U.S. state tax purposes, which are available to offset future U.S. state taxable income between the years 2020 and 2039. On an annual basis, the Company assesses the need to establish a valuation allowance for its deferred income tax assets, and if it is deemed more likely than not that its deferred income tax assets will not be realized, a valuation allowance is recorded. The ultimate realization of deferred income tax assets is dependent upon the generation of future taxable income, of the necessary character, during the periods in which those temporary differences become deductible. Management considers the scheduled reversals of deferred income tax liabilities, the available carryback and carryforward periods, and projected future taxable income in making this assessment. As at December 31, 2019, in order to fully realize all of the deferred income tax assets, the Company will need to generate future taxable income of approximately $3.0 billion, and, based upon the level of historical taxable income, projections of future taxable income of the necessary character over the periods in which the deferred income tax assets are deductible, and the reversal of taxable temporary differences, management believes, following an assessment of the current economic environment, it is more likely than not that the Company will realize the benefits of these deductible differences. As at December 31, 2019, the Company has not recognized a deferred income tax asset of $244 million (2018 - $217 million) on the unrealized foreign exchange loss recorded in Accumulated other comprehensive loss relating to its net investment in U.S. subsidiaries, as the Company does not expect this temporary difference to reverse in the foreseeable future. 74 CN | 2019 Annual Report

Notes to the Consolidated Financial Statements The following table provides a reconciliation of unrecognized tax benefits on the Company's domestic and foreign tax positions: 2019 2018 2017 In millions Year ended December 31, Gross unrecognized tax benefits at beginning of year Increases for: Tax positions related to the current year Tax positions related to prior years Decreases for: Tax positions related to prior years Settlements Lapse of the applicable statute of limitations $ 74 $ 74 $ 61 5 — 12 2 13 2 (17) — — (13) (1) — — (1) (1) Gross unrecognized tax benefits at end of year Adjustments to reflect tax treaties and other arrangements 62 (2) 74 (5) 74 (5) Net unrecognized tax benefits at end of year $ 60 $ 69 $ 69 As at December 31, 2019, the total amount of gross unrecognized tax benefits was $62 million, before considering tax treaties and other arrangements between taxation authorities. The amount of net unrecognized tax benefits as at December 31, 2019 was $60 million. If recognized, $7 million of the net unrecognized tax benefits as at December 31, 2019 would affect the effective tax rate. The Company believes that it is reasonably possible that $23 million of the net unrecognized tax benefits as at December 31, 2019 related to Canadian federal and provincial income tax matters, may be recognized over the next twelve months as a result of settlements and a lapse of the applicable statute of limitations, and will not affect the effective tax rate as they relate to temporary differences. The Company recognizes accrued interest and penalties related to gross unrecognized tax benefits in Income tax expense in the Company's Consolidated Statements of Income. For the year ended December 31, 2019, the Company recognized accrued interest and penalties of $1 million (2018 - $3 million; 2017 - $3 million). As at December 31, 2019, the Company had accrued interest and penalties of $11 million (2018 - $10 million). In Canada, the Company's federal and provincial income tax returns filed for the years 2014 to 2018 remain subject to examination by the taxation authorities. An examination of the Company's federal income tax returns for the years 2014 and 2015 is currently in progress and is expected to be completed during 2020. In the U.S., the federal income tax returns filed for the years 2016 to 2018 and the state income tax returns filed for the years 2015 to 2018 remain subject to examination by the taxation authorities. During the year, the Company settled certain state tax audits which resulted in the recognition of tax benefits. Examination of the Company's U.S. federal income tax return for the year 2017 as well as examinations of certain state income tax returns are currently in progress. The Company does not anticipate any significant impacts to its results of operations or financial position as a result of the final resolutions of such matters. 7 – Earnings per share The following table provides a reconciliation between basic and diluted earnings per share: 2019 2018 2017 In millions, except per share data Year ended December 31, Net income $ 4,216 $ 4,328 $ 5,484 Weighted-average basic shares outstanding Dilutive effect of stock-based compensation 720.1 2.5 734.5 3.2 753.6 3.7 Weighted-average diluted shares outstanding 722.6 737.7 757.3 Basic earnings per share Diluted earnings per share $ $ 5.85 5.83 $ $ 5.89 5.87 $ $ 7.28 7.24 Units excluded from the calculation as their inclusion would not have a dilutive effect Stock options Performance share units 0.5 0.2 0.6 0.3 0.4 0.1 CN | 2019 Annual Report 75

Notes to the Consolidated Financial Statements 8 – Accounts receivable 2019 2018 In millions December 31, Freight Non-freight $ 1,008 233 $ 974 221 Gross accounts receivable Allowance for doubtful accounts 1,241 (28) 1,195 (26) Net accounts receivable $ 1,213 $ 1,169 9 – Properties December 31, 2019 December 31, 2018 Depreciation rate Accumulated Depreciation Accumulated Depreciation Cost Net Cost Net In millions Properties including finance leases Track and roadway (1) Rolling stock Buildings Information technology (2) Other 2% 5% 3% 9% 5% $ 39,395 7,538 1,956 1,972 2,720 $ 8,502 2,941 692 688 1,089 $ 30,893 4,597 1,264 1,284 1,631 $ 38,352 6,883 1,924 1,795 2,124 $ 8,276 2,842 668 686 833 $ 30,076 4,041 1,256 1,109 1,291 Total properties including finance leases (3) (4) $ 53,581 $ 13,912 $ 39,669 $ 51,078 $ 13,305 $ 37,773 Finance leases included in properties Track and roadway (5) Rolling stock Buildings Other $ 406 87 27 128 $ 85 2 9 18 $ 321 85 18 110 $ 406 — 27 92 $ 80 — 9 18 $ 326 — 18 74 Total finance leases included in properties $ 648 $ 114 $ 534 $ 525 $ 107 $ 418 (1) (2) (3) As at December 31, 2019, includes land of $2,401 million (2018 - $2,455 million). In 2019, the Company capitalized costs for internally developed software and related licenses of $273 million (2018 - $283 million). In 2019, property additions, net of finance leases, were $3,865 million (2018 - $3,531 million), of which $1,489 million (2018 - $1,547 million) related to track and railway infrastructure maintenance. In 2019, depreciation expense related to properties was $1,559 million (2018 - $1,327 million). As at December 31, 2019, includes right-of-way access of $106 million (2018 - $107 million). (4) (5) In the first quarter of 2019, the Company recognized an expense of $84 million related to costs previously capitalized for a Positive Train Control (PTC) back office system following the deployment of a replacement system. The expense was recognized in Depreciation and amortization on the Consolidated Statements of Income. 76 CN | 2019 Annual Report

Notes to the Consolidated Financial Statements 10 – Leases The following table provides the Company’s lease costs for the year ended December 31, 2019: 2019 In millions Year ended December 31, Finance lease cost Amortization of right-of-use assets Interest on lease liabilities $ 11 8 Total finance lease cost Operating lease cost Short-term lease cost Variable lease cost (1) 19 171 47 63 Total lease cost (2) $ 300 (1) Mainly relates to leases of trucks for the Company's freight delivery service contracts. (2) Includes lease costs from purchased services and material and equipment rents in the Consolidated Statements of Income. Rental expense for operating leases for the years ended December 31, 2018 and 2017 were $218 million and $191 million, respectively. The following table provides the Company's lease right-of-use assets and lease liabilities, and their classification on the Consolidated Balance Sheet as at December 31, 2019: Classification 2019 In millions December 31, Lease right-of-use assets Finance leases Operating leases Properties Operating lease right-of-use assets $ 534 520 Total lease right-of-use assets $ 1,054 Lease liabilities Current Finance leases Operating leases Noncurrent Finance leases Operating leases Current portion of long-term debt Accounts payable and other $ 59 122 Long-term debt Operating lease liabilities 75 379 Total lease liabilities $ 635 The following table provides the remaining lease terms and discount rates for the Company's leases as at December 31, 2019: 2019 December 31, Weighted-average remaining lease term (years) Finance leases Operating leases Weighted-average discount rate (%) Finance leases Operating leases 1.4 7.0 3.21 3.12 CN | 2019 Annual Report 77

Notes to the Consolidated Financial Statements The following table provides additional information for the Company's leases for the year ended December 31, 2019: 2019 In millions Year ended December 31, Cash paid for amounts included in the measurement of lease liabilities Operating cash outflows from operating leases Operating cash outflows from finance leases Financing cash outflows from finance leases $ $ $ 170 6 162 Right-of-use assets obtained in exchange for lease liabilities Operating lease Finance lease $ $ 79 — The following table provides the maturities of lease liabilities for the next five years and thereafter as at December 31, 2019: Operating leases (1) Finance leases In millions 2020 2021 2022 2023 2024 2025 and thereafter $ 62 72 1 — — 3 $ 135 108 73 51 37 156 Total lease payments Less: Imputed interest 138 4 560 59 Present value of lease payments $ 134 $ 501 (1) Includes $70 million related to renewal options that are reasonably certain to be exercised. The following table provides the maturities of lease liabilities under ASC 840 "Leases" for the next five years and thereafter as at December 31, 2018: Capital leases Operating leases In millions 2019 2020 2021 2022 2023 2024 and thereafter $ 10 15 5 — — — $ 190 136 103 64 45 125 Total lease payments Less: Imputed interest $ 30 1 $ 663 Present value of lease payments $ 29 78 CN | 2019 Annual Report

Notes to the Consolidated Financial Statements 11 – Intangible assets, goodwill and other 2019 2018 In millions December 31, Intangible assets Investments (1) Goodwill (Note 3) Deferred costs Long-term receivables Other long-term assets $ 152 84 77 67 31 18 $ 73 70 — 61 26 37 Total intangible assets, goodwill and other $ 429 $ 267 (1) As at December 31, 2019, the Company had $60 million (2018 - $54 million) of investments accounted for under the equity method and $24 million (2018 - $16 million) of investments for which fair value was not readily determinable accounted for at cost minus impairment, plus or minus observable price changes. 12 – Accounts payable and other 2019 2018 In millions December 31, Trade payables Accrued charges Payroll-related accruals Income and other taxes Accrued interest Operating lease liabilities (Note 10) Personal injury and other claims provisions (Note 19) Contract liabilities (Note 4) Environmental provisions (Note 19) Other postretirement benefits liability (Note 15) Other $ 866 318 284 202 161 122 91 50 38 15 210 $ 982 232 436 205 142 — 97 3 39 17 163 Total accounts payable and other $ 2,357 $ 2,316 CN | 2019 Annual Report 79

Notes to the Consolidated Financial Statements 13 – Debt US dollar-denominated amount Maturity 2019 2018 In millions December 31, Notes and debentures (1) Canadian National series: 2-year notes (2) 7-year notes (2) 10-year notes (2) 10-year notes (2) 30-year debentures 10-year notes (2) 10-year notes (2) 10-year notes (2) 30-year notes (2) 10-year notes (2) 10-year notes (2) 30-year debentures (2) 30-year notes (2) 30-year notes (2) Puttable Reset Securities PURSSM (2) 30-year debentures (2) 30-year notes (2) 30-year notes (2) 30-year notes (2) 30-year notes (2) 30-year notes (2) 30-year notes (2) 30-year notes (2) 30-year notes (2) 30-year notes (2) 30-year notes (2) 50-year notes (2) 2.40% 2.75% 2.85% 2.25% 7.63% 2.95% 2.80% 2.75% 6.90% 3.20% 3.00% 7.38% 6.25% 6.20% 6.71% 6.38% 3.50% 4.50% 3.95% 3.20% 3.60% 3.65% 3.60% 4.45% 3.60% 3.05% 4.00% Feb 3, 2020 Feb 18, 2021 Dec 15, 2021 Nov 15, 2022 May 15, 2023 Nov 21, 2024 Sep 22, 2025 Mar 1, 2026 Jul 15, 2028 Jul 31, 2028 Feb 8, 2029 Oct 15, 2031 Aug 1, 2034 Jun 1, 2036 Jul 15, 2036 Nov 15, 2037 Nov 15, 2042 Nov 7, 2043 Sep 22, 2045 Aug 2, 2046 Aug 1, 2047 Feb 3, 2048 Jul 31, 2048 Jan 20, 2049 Feb 8, 2049 Feb 8, 2050 Sep 22, 2065 US$ 300 $ 390 250 520 325 195 455 350 649 617 350 350 260 649 585 325 390 325 325 400 844 500 779 450 844 450 450 100 $ 409 250 546 341 205 477 350 682 648 350 — 273 682 614 341 409 341 341 400 886 500 818 450 886 — — 100 US$ US$ US$ US$ 400 250 150 350 US$ US$ 500 475 US$ US$ US$ US$ US$ US$ US$ 200 500 450 250 300 250 250 US$ 650 US$ 600 US$ 650 Illinois Central series: 7.70%100-year debentures BC Rail series: Non-interest bearing 90-year subordinated notes (3) Sep 15, 2096 US$ 125 162 170 Jul 14, 2094 842 842 Total notes and debentures Other Commercial paper Accounts receivable securitization Finance lease liabilities and other (4) 13,131 12,311 1,277 200 138 1,175 — 29 Total debt, gross Net unamortized discount and debt issuance costs (3) 14,746 (950) 13,515 (946) Total debt (5) Less: Current portion of long-term debt 13,796 1,930 12,569 1,184 Total long-term debt $ 11,866 $ 11,385 (1) (2) The Company's notes and debentures are unsecured. The fixed rate debt securities are redeemable, in whole or in part, at the option of the Company, at any time, at the greater of par and a formula price based on interest rates prevailing at the time of redemption. As at December 31, 2019, these notes were recorded as a discounted debt of $12 million (2018 - $12 million) using an imputed interest rate of 5.75% (2018 - 5.75%). The discount of $830 million (2018 - $830 million) is included in Net unamortized discount and debt issuance costs. Includes $4 million of equipment loans in 2019. See Note 20 - Financial instruments for the fair value of debt. (3) (4) (5) 80 CN | 2019 Annual Report

Notes to the Consolidated Financial Statements Notes and debentures For the year ended December 31, 2019, the Company issued the following: • On November 1, 2019, issuance of $450 million 3.05% Notes due 2050 in the Canadian capital markets, which resulted in net proceeds of $443 million; and On February 8, 2019, issuance of $350 million 3.00% Notes due 2029 and $450 million 3.60% Notes due 2049 in the Canadian capital markets, which resulted in total net proceeds of $790 million. • For the year ended December 31, 2018, the Company issued and repaid the following: • On November 7, 2018, issuance of US$650 million ($854 million) 4.45% Notes due 2049 in the U.S. capital markets, which resulted in net proceeds of $845 million; On August 30, 2018, early redemption of US$550 million 5.55% Notes due 2019 for US$558 million ($720 million), which resulted in a loss of US$8 million ($10 million) that was recorded in Other income; On July 31, 2018, issuance of $350 million 3.20% Notes due 2028 and $450 million 3.60% Notes due 2048 in the Canadian capital markets, which resulted in total net proceeds of $787 million; On July 15, 2018, repayment of US$200 million ($264 million) 6.80% Notes due 2018 upon maturity; On May 15, 2018, repayment of US$325 million ($415 million) 5.55% Notes due 2018 upon maturity; and On February 6, 2018, issuance of US$300 million ($374 million) 2.40% Notes due 2020 and US$600 million ($749 million) 3.65% Notes due 2048 in the U.S. capital markets, which resulted in total net proceeds of $1,106 million. • • • • • Revolving credit facility The Company has an unsecured revolving credit facility with a consortium of lenders, which is available for general corporate purposes, including backstopping the Company's commercial paper programs. On March 15, 2019, the Company's revolving credit facility agreement was amended, which extended the term of the credit facility by one year and increased the credit facility from $1.8 billion to $2.0 billion, effective May 5, 2019. The amended credit facility of $2.0 billion consists of a $1.0 billion tranche maturing on May 5, 2022 and a $1.0 billion tranche maturing on May 5, 2024. Under the amended credit facility, the Company has the option to request an extension once a year to maintain the tenors of three years and five years of the respective tranches subject to the consent of the individual lenders. The accordion feature, which provides for an additional $500 million of credit under the facility, remains unchanged. The credit facility agreement contains customary terms and conditions, which were substantially unchanged by the amendment. The credit facility provides for borrowings at various benchmark interest rates, plus applicable margins, based on CN's debt credit ratings. The credit facility agreement has one financial covenant, which limits debt as a percentage of total capitalization, and with which the Company is in compliance. As at December 31, 2019 and 2018, the Company had no outstanding borrowings under its revolving credit facility and there were no draws during the years ended December 31, 2019 and 2018. Non-revolving credit facility On July 25, 2019, the Company entered into an agreement for a non-revolving term loan credit facility in the principal amount of up to US$300 million, secured by rolling stock, which may be drawn upon during the period from July 25, 2019 to March 31, 2020. Term loans made under the facility have a tenor of 20 years, bear interest at a variable rate, and are prepayable at any time without penalty. The credit facility is available for financing or refinancing the purchase of equipment. As at December 31, 2019, the Company had no outstanding borrowings under its non-revolving credit facility and there were no draws during the year ended December 31, 2019. Commercial paper The Company has a commercial paper program in Canada and in the U.S. Both programs are backstopped by the Company's revolving credit facility. As of May 5, 2019, the maximum aggregate principal amount of commercial paper that could be issued increased from $1.8 billion to $2.0 billion, or the US dollar equivalent, on a combined basis. As at December 31, 2019 and 2018, the Company had total commercial paper borrowings of US$983 million ($1,277 million) and US$862 million ($1,175 million), respectively, at a weighted-average interest rate of 1.77% and 2.47%, respectively, presented in Current portion of long-term debt on the Consolidated Balance Sheets. CN | 2019 Annual Report 81

Notes to the Consolidated Financial Statements The following table provides a summary of cash flows associated with the issuance and repayment of commercial paper: 2019 2018 2017 In millions Year ended December 31, Commercial paper with maturities less than 90 days Issuance Repayment $ 5,069 (5,141) $ 8,292 (8,442) $ 4,539 (4,160) Change in commercial paper with maturities less than 90 days, net $ (72) $ (150) $ 379 Commercial paper with maturities of 90 days or greater Issuance Repayment $ 2,115 (1,902) $ 1,135 (886) $ — — Change in commercial paper with maturities of 90 days or greater, net $ 213 $ 249 $ — Change in commercial paper, net $ 141 $ 99 $ 379 Accounts receivable securitization program The Company has an agreement, expiring on February 1, 2021, to sell an undivided co-ownership interest in a revolving pool of accounts receivable to unrelated trusts for maximum cash proceeds of $450 million. As at December 31, 2019, the Company had accounts receivable securitization borrowings of $200 million at a weighted-average interest rate of 1.90%, secured by and limited to $224 million of accounts receivable, presented in Current portion of long-term debt on the Consolidated Balance Sheet. As at December 31, 2018, the Company had no proceeds received under the accounts receivable securitization program. The following table provides a summary of cash flows associated with the proceeds received and repayment of the accounts receivable securitization program: 2019 2018 2017 In millions Year ended December 31, Beginning of year Proceeds received Repayment Foreign exchange $ — 420 (220) — $ 421 530 (950) (1) $ — 423 — (2) End of year $ 200 $ — $ 421 Bilateral letter of credit facilities The Company has a series of committed and uncommitted bilateral letter of credit facility agreements. On March 15, 2019, the Company extended the maturity date of the committed bilateral letter of credit facility agreements to April 28, 2022. The agreements are held with various banks to support the Company's requirements to post letters of credit in the ordinary course of business. Under these agreements, the Company has the option from time to time to pledge collateral in the form of cash or cash equivalents, for a minimum term of one month, equal to at least the face value of the letters of credit issued. As at December 31, 2019, the Company had outstanding letters of credit of $424 million (2018 - $410 million) under the committed facilities from a total available amount of $459 million (2018 - $447 million) and $149 million (2018 - $137 million) under the uncommitted facilities. As at December 31, 2019, included in Restricted cash and cash equivalents was $429 million (2018 - $408 million) and $90 million (2018 - $80 million) which were pledged as collateral under the committed and uncommitted bilateral letter of credit facilities, respectively. 82 CN | 2019 Annual Report

Notes to the Consolidated Financial Statements Debt maturities The following table provides the debt maturities, excluding finance lease liabilities, as at December 31, 2019, for the next five years and thereafter: Debt (1) In millions 2020 2021 2022 2023 2024 2025 and thereafter $ 1,871 761 317 187 447 10,079 Total Finance lease liabilities (2) 13,662 134 Total debt $ 13,796 (1) Presented net of unamortized discounts and debt issuance costs. (2) See Note 10 - Leases for maturities of finance lease liabilities. Amount of US dollar-denominated debt 2019 2018 In millions December 31, Notes and debentures Commercial paper Finance lease liabilities and other US$ 6,650 983 74 US$ 6,650 862 21 Total amount of US dollar-denominated debt in US$ US$ 7,707 US$ 7,533 Total amount of US dollar-denominated debt in C$ $ 10,011 $ 10,273 14 – Other liabilities and deferred credits 2019 2018 In millions December 31, Personal injury and other claims provisions (Note 19) (1) Contract liabilities (Note 4) (1) Environmental provisions (Note 19) (1) Stock-based compensation liability (Note 17) Deferred credits and other $ 261 161 19 16 177 $ 249 — 22 19 211 Total other liabilities and deferred credits $ 634 $ 501 (1) See Note 12 – Accounts payable and other for the related current portion. CN | 2019 Annual Report 83

Notes to the Consolidated Financial Statements 15 – Pensions and other postretirement benefits The Company has various retirement benefit plans under which substantially all of its employees are entitled to benefits at retirement age, generally based on compensation and length of service and/or contributions. Senior and executive management employees, subject to certain minimum service and age requirements, are also eligible for an additional retirement benefit under their Special Retirement Stipend Agreements, the Supplemental Executive Retirement Plan or the Defined Contribution Supplemental Executive Retirement Plan. The Company also offers postretirement benefits to certain employees providing life insurance, medical benefits and, for a closed group of employees, free rail travel benefits during retirement. These postretirement benefits are funded as they become due. The information in the tables that follow pertains to all of the Company's defined benefit plans. However, the following descriptions relate solely to the Company's main pension plan, the CN Pension Plan, unless otherwise specified. Description of the CN Pension Plan The CN Pension Plan is a contributory defined benefit pension plan that covers the majority of CN employees. It provides for pensions based mainly on years of service and final average pensionable earnings and is generally applicable from the first day of employment. Indexation of pensions is provided after retirement through a gain/loss sharing mechanism, subject to guaranteed minimum increases. An independent trust company is the Trustee of the Company's pension trust funds (which includes the CN Pension Trust Fund). As Trustee, the trust company performs certain duties, which include holding legal title to the assets of the CN Pension Trust Fund and ensuring that the Company, as Administrator, complies with the provisions of the CN Pension Plan and the related legislation. The Company utilizes a measurement date of December 31 for the CN Pension Plan. Funding policy Employee contributions to the CN Pension Plan are determined by the plan rules. Company contributions are in accordance with the requirements of the Government of Canada legislation, the Pension Benefits Standards Act, 1985, including amendments and regulations thereto, and such contributions follow minimum and maximum thresholds as determined by actuarial valuations. Actuarial valuations are generally required on an annual basis for all Canadian defined benefit pension plans, or when deemed appropriate by the Office of the Superintendent of Financial Institutions. These actuarial valuations are prepared in accordance with legislative requirements and with the recommendations of the Canadian Institute of Actuaries for the valuation of pension plans. Actuarial valuations are also required annually for the Company's U.S. qualified defined benefit pension plans. The Company's most recently filed actuarial valuations for funding purposes for its Canadian registered defined benefit pension plans conducted as at December 31, 2018 indicated a funding excess on a going concern basis of approximately $3.3 billion and a funding excess on a solvency basis of approximately $0.5 billion, calculated using the three-year average of the plans' hypothetical wind-up ratio in accordance with the Pension Benefit Standards Regulations, 1985. The federal pension legislation requires funding deficits, if any, to be paid over a number of years, as calculated under current pension regulations. Alternatively, a letter of credit can be subscribed to fulfill required solvency deficit payments. The Company's next actuarial valuations for funding purposes for its Canadian registered defined benefit pension plans required as at December 31, 2019 will be performed in 2020. These actuarial valuations are expected to identify a funding excess on a going concern basis of approximately $3.5 billion, while on a solvency basis a funding excess of approximately $0.5 billion is expected. Based on the anticipated results of these valuations, the Company expects to make total cash contributions of approximately $135 million for all of the Company's pension plans in 2020. As at January 31, 2020 the Company had contributed $59 million to its defined benefit pension plans for 2020. 84 CN | 2019 Annual Report
Notes to the Consolidated Financial Statements Plan assets The assets of the Company's various Canadian defined benefit pension plans are primarily held in separate trust funds ("Trusts") which are diversified by asset type, country, sector and investment strategy. Each year, the CN Board of Directors reviews and confirms or amends the Statement of Investment Policies and Procedures ("SIPP") which includes the plans' long-term target asset allocation ("Policy") and related benchmark indices. This Policy is based on the long-term expectations of the economy and financial market returns and considers the dynamics of the plans' pension benefit obligations. In 2019, the Policy was amended to affect a target asset allocation change to bonds and mortgages, emerging market debt, private debt, absolute return and investment-related liabilities. The CN Investment Division ("Investment Manager"), a division of the Company created to invest and administer the assets of the plan, can also implement an investment strategy ("Strategy") which can lead the Plan's actual asset allocation to deviate from the Policy due to changing market risks and opportunities. The Pension and Investment Committee of the Board of Directors ("Committee") regularly compares the actual plan asset allocation to the Policy and Strategy and compares the actual performance of the Company's pension plan assets to the performance of the benchmark indices. The Company's 2019 Policy and actual asset allocation for the Company's pension plans based on fair value are as follows: Actual plan asset allocation Policy 2019 2018 Cash and short-term investments Bonds and mortgages (1) Emerging market debt (1) Private debt (1) Equities Real estate Oil and gas Infrastructure (1) Absolute return Risk-factor allocation Investment-related liabilities 3 % 35 % 1.5 % 1.5 % 40 % 4 % 7 % 4 % 10 % — % (6)% 3 % 36 % 3 % 3 % 37 % 2 % 5 % 3 % 10 % 1 % (3)% 3 % 35 % 3 % 2 % 33 % 2 % 6 % 4 % 10 % 2% — % Total 100 % 100 % 100 % (1) Certain assets in the 2018 comparative figures have been reclassified from bonds and mortgages and infrastructure to emerging market debt and private debt, respectively, to conform to the current year's presentation. The Committee's approval is required for all major investments in illiquid securities. The SIPP allows for the use of derivative financial instruments to implement strategies, hedge and adjust existing or anticipated exposures. The SIPP prohibits investments in securities of the Company or its subsidiaries. Investments held in the Company's pension plans consist mainly of the following: • Cash and short-term investments consist of highly liquid securities which ensure adequate cash flows are available to cover near-term benefit payments. Short-term investments are mainly obligations issued by Canadian chartered banks. Bonds include bond instruments, issued or guaranteed by governments and non-government entities. As at December 31, 2019, 80% (2018 - 80%) of bonds were issued or guaranteed by Canadian, U.S. or other governments. Mortgages consist of mortgage products which are primarily conventional or participating loans secured by commercial properties. On an exposure basis, the Plan's policy reflects an allocation of 45%, comprising a 35% allocation to bonds and mortgages investments and a 10% allocation to derivative financial instruments. Emerging market debt consists of units invested in mainly open-ended funds whose mandate is to invest in debt instruments of emerging market countries. Private debt includes participations in private debt funds focused on generating steady yields. Equity investments include publicly traded securities diversified by industry sector, country and issuer and investments in mainly energy related private equity funds. As at December 31, 2019, the most significant allocation to an individual issuer of a publicly traded security was 1% (2018 - 2%) and the most significant allocation to an industry sector was 12% (2018 - 22%). Real estate is a diversified portfolio of Canadian land and commercial properties and investments in real estate private equity funds. Oil and gas investments include petroleum and natural gas properties and listed and non-listed securities of oil and gas companies. Infrastructure investments include participations in private infrastructure funds, term loans and notes of infrastructure companies. Absolute return investments are primarily a portfolio of units of externally managed hedge funds, which are invested in various long/short strategies within multi-strategy, fixed income, equity and global macro funds. Managers are monitored on a continuous basis through investment and operational due diligence. • • • • • • • • CN | 2019 Annual Report 85

Notes to the Consolidated Financial Statements • Risk-factor allocation investments are a portfolio of units of externally managed funds and internally managed strategies in order to capture alternative risk premia. Investment-related liabilities include a certain level of financing associated with securities sold under repurchase agreements and other assets. • The plans' Investment Manager monitors market events and risk exposures to foreign currencies, interest rates, market risks, credit risks and liquidity risks daily. When investing in foreign securities, the plans are exposed to foreign currency risk that may be adjusted or hedged; the effect of which is included in the valuation of the foreign securities. Net of the adjusted or hedged amount, the plans were 60% exposed to the Canadian dollar, 21% to the US dollar, 9% to European currencies, 3% to the Japanese Yen and 7% to various other currencies as at December 31, 2019. Interest rate risk represents the risk that the fair value of the investments will fluctuate due to changes in market interest rates. Sensitivity to interest rates is a function of the timing and amount of cash flows of the interest-bearing assets and liabilities of the plans. Derivatives are used from time to time to adjust the plan asset allocation or exposures to interest rates, foreign currencies, market risks or commodity prices of the portfolio or anticipated transactions. Derivatives are contractual agreements whose value is derived from interest rates, foreign exchange rates, and equity or commodity prices. They may include forwards, futures, options and swaps and are included in investment categories based on their underlying exposure. When derivatives are used for hedging purposes, the gains or losses on the derivatives are offset by a corresponding change in the value of the hedged assets. To manage credit risk, established policies require dealing with counterparties considered to be of high credit quality. Adequate liquidity is maintained to cover cash flows by monitoring factors such as fair value, collateral pledged and received, repurchase agreements and securities lending agreements. Overall return in the capital markets and the level of interest rates affect the funded status of the Company's pension plans, particularly the Company's main Canadian pension plan. Adverse changes with respect to pension plan returns and the level of interest rates from the date of the last actuarial valuations may have a material adverse effect on the funded status of the plans and on the Company's results of operations. 86 CN | 2019 Annual Report

Notes to the Consolidated Financial Statements The following tables present the fair value of plan assets by asset class as at December 31, 2019 and 2018: Fair value measurements at December 31, 2019 In millions Total Level 1 Level 2 Level 3 NAV Cash and short-term investments (1) Bonds (2) Canada, U.S. and supranational Provinces of Canada and municipalities Corporate Emerging market debt (3) Mortgages (4) Private debt (5) Public equities (6) Canadian U.S. International Private equities (7) Real estate (8) Oil and gas (9) Infrastructure (10) Absolute return funds (11) Multi-strategy Fixed income Global macro Growth insurance Risk-factor allocation (12) $ 502 $ 92 $ 410 $ — $ — 771 4,503 1,347 500 52 481 — — — — — — 771 4,503 1,347 500 52 — — — — — — — — — — — — 481 338 3,265 3,006 215 435 901 619 338 3,234 3,006 — — 177 — — 31 — — — 17 66 — — — — 329 707 — — — — 215 106 — 553 1,083 175 490 17 288 — — — 17 — — — — — — — — — — — 1,083 175 490 — 288 Total investments (13) $ 18,988 $ 6,864 $ 7,697 $ 1,036 $ 3,391 Investment-related liabilities (14) (565) Other (15) 1 Total plan assets $ 18,424 Fair value measurements at December 31, 2018 In millions Total Level 1 Level 2 Level 3 NAV Cash and short-term investments (1) Bonds (2) Canada, U.S. and supranational Provinces of Canada and municipalities Corporate Emerging market debt (3) Mortgages (4) Private debt (5) Public equities (6) Canadian U.S. International Private equities (7) Real estate (8) Oil and gas (9) Infrastructure (10) Absolute return funds (11) Multi-strategy Fixed income Global macro Risk-factor allocation (12) $ 577 $ 12 $ 565 $ — $ — 1,801 2,987 1,180 540 90 366 — — — — — — 1,801 2,987 1,180 540 90 — — — — — — — — — — — — 366 1,561 447 3,338 274 421 948 704 1,561 447 3,338 — — 202 — — — — — — 18 64 — — — — 321 728 — — — — 274 100 — 640 898 239 480 286 — — — — — — — — — — — — 898 239 480 286 Total investments (13) $ 17,137 $ 5,560 $ 7,245 $ 1,049 $ 3,283 Other (15) 107 Total plan assets $ 17,244 Level 1: Fair value based on quoted prices in active markets for identical assets. Level 2: Fair value based on other significant observable inputs. Level 3: Fair value based on significant unobservable inputs. NAV: Investments measured at net asset value as a practical expedient. Footnotes to the table follow on the next page. CN | 2019 Annual Report 87

Notes to the Consolidated Financial Statements The following table reconciles the beginning and ending balances of the fair value of investments classified as Level 3: Fair value measurements based on significant unobservable inputs (Level 3) Real estate (8) Oil and gas (9) Total In millions Balance at December 31, 2017 Actual return relating to assets still held at the reporting date Purchases Sales Disbursements $ 332 (2) 1 (1) (9) $ 769 (11) — — (30) $ 1,101 (13) 1 (1) (39) Balance at December 31, 2018 Actual return relating to assets still held at the reporting date Purchases Sales Disbursements 321 13 3 (1) (7) 728 7 — — (28) 1,049 20 3 (1) (35) Balance at December 31, 2019 $ 329 $ 707 $ 1,036 (1) (2) Cash and short-term investments with related accrued interest are valued at cost, which approximates fair value, and are categorized as Level 1 and Level 2 respectively. Bonds are valued using mid-market prices obtained from independent pricing data suppliers. When prices are not available from independent sources, the fair value is based on the present value of future cash flows using current market yields for comparable instruments. Emerging market debt funds are valued based on the net asset value which is readily available and published by each fund's independent administrator. Mortgages are valued based on the present value of future net cash flows using current market yields for comparable instruments. Private debt investments are valued based on the net asset value as reported by each fund's manager, generally based on the present value of future net cash flows using current market yields for comparable instruments. The fair value of public equity investments is based on quoted prices in active markets for identical assets. Private equity investments are valued based on the net asset value as reported by each fund's manager, generally using discounted cash flow analysis or earnings multiples. The fair value of real estate investments categorized as Level 3 includes immoveable properties. Land is valued based on the fair value of comparable assets, and income producing properties are valued based on the present value of estimated future net cash flows or the fair value of comparable assets. Independent valuations of all immoveable properties are performed triennially on a rotational basis. The fair value of real estate investments categorized as NAV consists mainly of investments in real estate private equity funds and is based on the net asset value as reported by each fund's manager, generally using a discounted cash flow analysis or earnings multiples. Oil and gas investments categorized as Level 1 are valued based on quoted prices in active markets. Oil and gas participations traded on a secondary market are valued based on the most recent transaction price and are categorized as Level 2. Investments in oil and gas categorized as Level 3 consist of operating oil and gas properties and the fair value is based on estimated future net cash flows that are discounted using prevailing market rates for transactions in similar assets. Estimated future net cash flows are based on forecasted oil and gas prices and projected annual production and costs. The fair value of infrastructure investments categorized as Level 2 is based on the present value of future cash flows using current market yields for comparable instruments. The fair value of infrastructure funds categorized as NAV is based on the net asset value as reported by each fund's manager, generally using a discounted cash flow analysis or earnings multiples. Absolute return investments are valued using the net asset value as reported by each fund's independent administrator. All absolute return investments have contractual redemption frequencies, ranging from monthly to annually, and redemption notice periods varying from 5 to 90 days. Risk-factor allocation investments are valued using the net asset value as reported by each fund's independent administrator or fund manager. All funds have contractual redemption frequencies ranging from daily to annually, and redemption notice periods varying from 5 to 60 days. Derivative financial instruments, which are included in gross investments, are valued using quoted market prices when available and are categorized as Level 1, or based on valuation techniques using market data, when quoted market prices are not available and are categorized as Level 2. Derivatives are included in the investment asset categories based on their underlying exposure. Investment-related liabilities include securities sold under repurchase agreements. The securities sold under repurchase agreement do not meet the conditions to remove from the assets and are therefore maintained on the books with an offsetting liability recorded to represent the financing nature of this transaction. These agreements are recorded at cost, which together with accrued interest approximates fair value due to their short-term nature. Other consists of operating assets of $108 million (2018 - $120 million) and liabilities of $107 million (2018 - $13 million) required to administer the Trusts' investment assets and the plans' benefit and funding activities. Such assets are valued at cost and have not been assigned to a fair value category. (3) (4) (5) (6) (7) (8) (9) (10) (11) (12) (13) (14) (15) 88 CN | 2019 Annual Report
Notes to the Consolidated Financial Statements Obligations and funded status for defined benefit pension and other postretirement benefit plans Pensions Other postretirement benefits 2019 2018 2019 2018 In millions Year ended December 31, Change in benefit obligation Projected benefit obligation at beginning of year Amendments Interest cost Actuarial loss (gain) on projected benefit obligation (1) Current service cost Plan participants' contributions Foreign currency changes Benefit payments, settlements and transfers $ 17,275 — 596 1,611 143 64 (15) (1,065) $ 18,025 — 568 (538) 170 63 25 (1,038) $ 247 — 8 (9) 2 — (3) (18) $ 261 (6) 9 (10) 2 — 8 (17) Projected benefit obligation at the end of the year (2) $ 18,609 $ 17,275 $ 227 $ 247 Component representing future salary increases (253) (266) — — Accumulated benefit obligation at end of year $ 18,356 $ 17,009 $ 227 $ 247 Change in plan assets Fair value of plan assets at beginning of year Employer contributions Plan participants' contributions Foreign currency changes Actual return on plan assets Benefit payments, settlements and transfers $ 17,244 105 64 (11) 2,087 (1,065) $ 18,564 70 63 19 (434) (1,038) $ — — — — — — $ — — — — — — Fair value of plan assets at end of year (2) $ 18,424 $ 17,244 $ — $ — Funded status - Deficiency of fair value of plan assets over projected benefit obligation at end of year $ (185) $ (31) $ (227) $ (247) (1) Substantially all of the pensions' actuarial loss for the year ended December 31, 2019 and actuarial gain for the year ended December 31, 2018 is the result of the change in the end of year discount rate of the current year versus the prior year (67 basis points decrease for 2019 and 26 basis points increase for 2018). (2) For the CN Pension Plan, as at December 31, 2019, the projected benefit obligation was $17,252 million (2018 - $16,004 million) and the fair value of plan assets was $17,523 million (2018 - $16,393 million). The measurement date of all plans is December 31. Amounts recognized in the Consolidated Balance Sheets Pensions Other postretirement benefits 2019 2018 2019 2018 In millions December 31, Noncurrent assets - Pension asset Current liabilities (Note 12) Noncurrent liabilities - Pension and other postretirement benefits $ 336 — (521) $ 446 — (477) $ — (15) (212) $ — (17) (230) Total amount recognized $ (185) $ (31) $ (227) $ (247) Amounts recognized in Accumulated other comprehensive loss (Note 18) Pensions Other postretirement benefits 2019 2018 2019 2018 In millions December 31, Net actuarial gain (loss) Prior service credit (cost) $ $ (4,336) (3) $ $ (3,887) (6) $ $ 14 4 $ $ 8 4 CN | 2019 Annual Report 89

Notes to the Consolidated Financial Statements Information for defined benefit pension plans with an accumulated benefit obligation in excess of plan assets Pensions 2019 2018 In millions December 31, Accumulated benefit obligation (1) Fair value of plan assets (1) $ $ 676 225 $ $ 714 303 (1) All of the Company's other postretirement benefit pension plans have an accumulated benefit obligation in excess of plan assets. Information for defined benefit pension plans with a projected benefit obligation in excess of plan assets Pensions 2019 2018 In millions December 31, Projected benefit obligation Fair value of plan assets $ $ 843 322 $ $ 780 303 Components of net periodic benefit cost (income) for defined benefit pension and other postretirement benefit plans Pensions Other postretirement benefits 2019 2018 2017 2019 2018 2017 In millions Year ended December 31, Current service cost Other components of net periodic benefit cost (income) Interest cost Settlement loss Expected return on plan assets Amortization of prior service cost Amortization of net actuarial loss (gain) $ 143 $ 170 $ 130 $ 2 $ 2 $ 2 596 5 (1,085) 3 155 568 3 (1,083) 3 200 540 — (1,047) 5 182 8 — — — (3) 9 — — — (2) 8 — — — (3) Total Other components of net periodic benefit cost (income) $ (326) $ (309) $ (320) $ 5 $ 7 $ 5 Net periodic benefit cost (income) $ (183) $ (139) $ (190) $ 7 $ 9 $ 7 Weighted-average assumptions used in accounting for defined benefit pension and other postretirement benefit plans Pensions Other postretirement benefits 2019 2018 2017 2019 2018 2017 December 31, To determine projected benefit obligation Discount rate (1) Rate of compensation increase (2) To determine net periodic benefit cost (income) Rate to determine current service cost (3) Rate to determine interest cost (3) Rate of compensation increase (2) Expected return on plan assets (4) 3.10% 2.75% 3.77% 2.75% 3.51% 2.75% 3.14% 2.75% 4.00% 2.75% 3.59% 2.75% 3.93% 3.47% 2.75% 7.00% 3.68% 3.15% 2.75% 7.00% 4.11% 3.15% 2.75% 7.00% 4.25% 3.68% 2.75% N/A 3.83% 3.23% 2.75% N/A 4.43% 3.29% 2.75% N/A (1) The Company's discount rate assumption, which is set annually at the end of each year, is determined by management with the aid of third-party actuaries. The discount rate is used to measure the single amount that, if invested at the measurement date in a portfolio of high-quality debt instruments with a rating of AA or better, would provide the necessary cash flows to pay for pension benefits as they become due. For the Canadian pension and other postretirement benefit plans, future expected benefit payments are discounted using spot rates based on a derived AA corporate bond yield curve for each maturity year. The rate of compensation increase is determined by the Company based upon its long-term plans for such increases. The Company uses the spot rate approach to measure current service cost and interest cost for all defined benefit pension and other postretirement benefit plans. Under the spot rate approach, individual spot discount rates along the same yield curve used in the determination of the projected benefit obligation are applied to the relevant projected cash flows at the relevant maturity. The expected long-term rate of return is determined based on expected future performance for each asset class and is weighted based on the investment policy. For 2019, the Company used a long-term rate of return assumption of 7.00% on the market-related value of plan assets to compute net periodic benefit cost (income). The Company has elected to use a market-related value of assets, whereby realized and unrealized gains/losses and appreciation/depreciation in the value of the investments are recognized over a period of five years, while investment income is recognized immediately. In 2020, the Company will maintain the expected long-term rate of return on plan assets at 7.00% to reflect management's current view of long-term investment returns. (2) (3) (4) 90 CN | 2019 Annual Report

Notes to the Consolidated Financial Statements Expected future benefit payments The following table provides the expected benefit payments for pensions and other postretirement benefits for the next five years and the subsequent five-year period: Other postretirement benefits Pensions In millions 2020 2021 2022 2023 2024 Years 2025 to 2029 $ $ $ $ $ $ 1,056 1,060 1,058 1,053 1,046 5,119 $ $ $ $ $ $ 16 15 14 14 13 60 Defined contribution and other plans The Company maintains defined contribution pension plans for certain salaried employees as well as certain employees covered by collective bargaining agreements. The Company also maintains other plans including a Section 401(k) savings plan for certain U.S. based employees. The Company's contributions under these plans were expensed as incurred and, in 2019, amounted to $23 million (2018 - $22 million; 2017 - $19 million). Contributions to multi-employer plan Under collective bargaining agreements, the Company participates in a multi-employer benefit plan named the Railroad Employees National Early Retirement Major Medical Benefit Plan which provides certain postretirement health care benefits to certain retirees. The Company's contributions under this plan were expensed as incurred and amounted to $12 million in 2019 (2018 - $13 million; 2017 - $15 million). The annual contribution rate for the plan was $164.12 per month per active employee for 2019 (2018 - $176.16). The plan covered 445 retirees in 2019 (2018 - 461 retirees). 16 – Share capital Authorized capital stock The authorized capital stock of the Company is as follows: • • • Unlimited number of Common Shares, without par value Unlimited number of Class A Preferred Shares, without par value, issuable in series Unlimited number of Class B Preferred Shares, without par value, issuable in series Common shares 2019 2018 2017 In millions December 31, Issued common shares Common shares in Share Trusts 714.1 (1.8) 727.3 (2.0) 744.6 (2.0) Outstanding common shares 712.3 725.3 742.6 Repurchase of common shares The Company may repurchase its common shares pursuant to a Normal Course Issuer Bid (NCIB) at prevailing market prices plus brokerage fees, or such other prices as may be permitted by the Toronto Stock Exchange. The Company may repurchase up to 22.0 million common shares between February 1, 2019 and January 31, 2020 under its NCIB. As at December 31, 2019, the Company had repurchased 12.8 million common shares under this NCIB. CN | 2019 Annual Report 91

Notes to the Consolidated Financial Statements The following table provides the information related to the share repurchases for the years ended December 31, 2019, 2018 and 2017: 2019 2018 2017 In millions, except per share data Year ended December 31, Number of common shares repurchased (1) Weighted-average price per share Amount of repurchase 14.3 118.70 1,700 19.0 104.99 2,000 20.4 98.27 2,000 $ $ $ $ $ $ (1) Includes repurchases in the first and second quarters of 2017, pursuant to private agreements between the Company and arm's-length third-party sellers. See Note 22 - Subsequent events for information on the Company's new NCIB. Share Trusts The Company's Share Trusts purchase CN's common shares on the open market, which are used to deliver common shares under either the Share Units or Employee Share Investment Plans (ESIP) (see Note 17 – Stock-based compensation). Shares purchased by the Share Trusts are retained until the Company instructs the trustee to transfer shares to the participants. Common shares purchased by the Share Trusts are accounted for as treasury stock. The Share Trusts may sell shares on the open market to facilitate the remittance of the Company's employee tax withholding obligations. The following table provides the information related to the share purchases and settlements by Share Trusts under the Share Units Plan for the years ended December 31, 2019, 2018 and 2017: 2019 2018 2017 In millions, except per share data Year ended December 31, Share purchases by Share Units Plan Share Trusts Number of common shares Weighted-average price per share Amount of purchase Share settlements by Share Units Plan Share Trusts Number of common shares Weighted-average price per share Amount of settlement — — — 0.4 104.87 38 0.5 102.17 55 $ $ $ $ $ $ 0.5 88.23 45 0.4 84.53 31 0.3 77.99 24 $ $ $ $ $ $ For the year ended December 31, 2019, the ESIP Share Trusts purchased 0.3 million common shares for $33 million at a weighted-average price of $118.83 per share. 92 CN | 2019 Annual Report

Notes to the Consolidated Financial Statements 17 – Stock-based compensation The Company has various stock-based compensation plans for eligible employees. A description of the major plans is provided herein. The following table provides the stock-based compensation expense for awards under all plans, as well as the related tax benefit and excess tax benefit recognized in income, for the years ended December 31, 2019, 2018 and 2017: 2019 2018 2017 In millions Year ended December 31, Share Units Plan Voluntary Incentive Deferral Plan (VIDP) Stock option awards Employee Share Investment Plan (ESIP) $ 26 4 12 15 $ 38 — 12 40 $ 55 7 13 36 Total stock-based compensation expense $ 57 $ 90 $ 111 Income tax impacts of stock-based compensation Tax benefit recognized in income Excess tax benefit recognized in income $ $ 12 23 $ $ 21 13 $ $ 29 13 Share Units Plan The objective of the Share Units Plan is to enhance the Company's ability to attract and retain talented employees and to provide alignment of interests between such employees and the shareholders of the Company. Under the Share Units Plan, the Company grants performance share unit (PSU) awards. PSU-ROIC awards vest dependent upon the attainment of a target level of return on invested capital (ROIC), as defined by the award agreement, over the plan period of three years. Such performance vesting criteria results in a performance vesting factor that ranges from 0% to 200% depending on the level of ROIC attained. Payout is conditional upon the attainment of a minimum share price, calculated using the average of the last three months of the plan period. PSU-TSR awards vest dependent upon the attainment of a total shareholder return (TSR) market condition over the plan period of three years. Such performance vesting criteria result in a performance vesting factor that ranges from 0% to 200% depending on the Company's TSR relative to a Class I Railways peer group and components of the S&P/TSX 60 Index. PSUs are settled in common shares of the Company, subject to the attainment of their respective vesting conditions, by way of disbursement from the Share Trusts (see Note 16 – Share capital). The number of shares remitted to the participant upon settlement is equal to the number of PSUs awarded multiplied by the performance vesting factor less shares withheld to satisfy the participant's withholding tax requirement. For the 2017 grant, the level of ROIC attained resulted in a performance vesting factor of 169%, and the level of TSR attained resulted in a performance vesting factor of 100% for the plan period ended December 31, 2019. The total fair value of the equity settled PSU awards that vested in 2019 was $45 million (2018 - $42 million; 2017 - $43 million). As the respective vesting conditions under each plan and the minimum share price condition for the PSU-ROIC awards were met at December 31, 2019, settlement of approximately 0.4 million shares, net of withholding taxes, is expected to occur in the first quarter of 2020. 93 CN | 2019 Annual Report
Notes to the Consolidated Financial Statements The following table provides a summary of the activity related to PSU awards: PSUs-ROIC (1) PSUs-TSR (2) Weighted-average grant date fair value Weighted-average grant date fair value Units Units In millions In millions Outstanding at December 31, 2018 Granted Settled (3) Forfeited 1.1 0.4 (0.4) (0.1) $ $ $ $ 46.10 70.76 35.11 61.12 0.4 0.1 (0.2) — $ $ $ $ 100.93 128.20 95.31 116.24 Outstanding at December 31, 2019 1.0 $ 58.35 0.3 $ 112.08 Nonvested at December 31, 2018 Granted Vested (4) Forfeited 0.7 0.4 (0.4) (0.1) $ $ $ $ 52.18 70.76 53.19 61.12 0.3 0.1 (0.2) — $ $ $ $ 104.14 128.20 103.36 116.24 Nonvested at December 31, 2019 0.6 $ 61.29 0.2 $ 117.04 (1) The grant date fair value of equity settled PSUs-ROIC granted in 2019 of $26 million is calculated using a lattice-based valuation model. As at December 31, 2019, total unrecognized compensation cost related to all outstanding awards was $15 million and is expected to be recognized over a weighted-average period of 1.6 years. The grant date fair value of equity settled PSUs-TSR granted in 2019 of $16 million is calculated using a Monte Carlo simulation model. As at December 31, 2019, total unrecognized compensation cost related to all outstanding awards was $9 million and is expected to be recognized over a weighted-average period of 1.6 years. Equity settled PSUs-ROIC granted in 2016 met the minimum share price condition for settlement and attained a performance vesting factor of 200%. Equity settled PSUs-TSR granted in 2016 attained a performance vesting factor of 100%. In the first quarter of 2019, these awards were settled, net of the remittance of the participants' withholding tax obligation of $50 million, by way of disbursement from the Share Trusts of 0.5 million common shares. These awards are expected to be settled in the first quarter of 2020. (2) (3) (4) The following table provides the assumptions used in the valuation of PSU-ROIC awards: PSUs-ROIC (1) Year of grant 2019 2018 2017 Assumptions Stock price ($) (2) Expected stock price volatility (%) (3) Expected term (years) (4) Risk-free interest rate (%) (5) Dividend rate ($) (6) Weighted-average grant date fair value ($) 110.41 17 3.0 1.75 2.15 70.76 97.77 18 3.0 1.92 1.82 50.77 91.91 19 3.0 0.98 1.65 53.19 (1) (2) (3) (4) (5) (6) Assumptions used to determine fair value of the equity settled PSU-ROIC awards are on the grant date. Represents the closing share price on the grant date. Based on the historical volatility of the Company's stock over a period commensurate with the expected term of the award. Represents the period of time that awards are expected to be outstanding. Based on the implied yield available on zero-coupon government issues with an equivalent term commensurate with the expected term of the awards. Based on the annualized dividend rate. 94 CN | 2019 Annual Report

Notes to the Consolidated Financial Statements Voluntary Incentive Deferral Plan The Company's Voluntary Incentive Deferral Plan (VIDP) provides eligible senior management employees the opportunity to elect to receive their annual incentive bonus payment in deferred share units (DSU) up to specific deferral limits. A DSU is equivalent to a common share of the Company and also earns dividends when normal cash dividends are paid on common shares. The number of DSUs received by each participant is established at the time of deferral. For each participant, the Company will grant a further 25% of the amount elected in DSUs, which will vest over a period of four years. The election to receive eligible incentive payments in DSUs is no longer available to a participant when the value of the participant's vested DSUs is sufficient to meet the Company's stock ownership guidelines. Equity settled awards DSUs are settled in common shares of the Company at the time of cessation of employment by way of an open market purchase by the Company. The number of shares remitted to the participant is equal to the number of DSUs awarded less shares withheld to satisfy the participant's withholding tax requirement. Cash settled awards The value of each participant's DSUs is payable in cash at the time of cessation of employment. The following table provides a summary of the activity related to DSU awards: Equity settled Cash settled DSUs (1) DSUs (2) Weighted-average grant date fair value Units Units In millions In millions Outstanding at December 31, 2018 Granted Settled (3) 0.8 0.1 (0.2) $ $ $ 79.23 113.59 81.22 0.2 — (0.1) Outstanding at December 31, 2019 (4) 0.7 $ 81.91 0.1 (1) The grant date fair value of equity settled DSUs granted in 2019 of $4 million is calculated using the Company's stock price on the grant date. As at December 31, 2019, the aggregate intrinsic value of all equity settled DSUs outstanding amounted to $77 million. The fair value of cash settled DSUs as at December 31, 2019 is based on the intrinsic value. As at December 31, 2019, the liability for all cash settled DSUs was $16 million (2018 - $19 million). The closing stock price used to determine the liability was $117.47. The total fair value of cash settled DSU awards vested in 2019, 2018 and 2017 was $nil. For the year ended December 31, 2019 the Company purchased 0.1 million common shares for the settlement of equity settled DSUs, net of the remittance of the participants' withholding tax obligation of $11 million. The total fair value of equity settled DSU awards vested, the number of units outstanding that were nonvested, unrecognized compensation cost and the remaining recognition period for cash and equity settled DSUs have not been quantified as they relate to a minimal number of units. (2) (3) (4) 95 CN | 2019 Annual Report
Notes to the Consolidated Financial Statements Stock option awards The Company's stock option plan allows for eligible employees to acquire common shares of the Company upon vesting at a price equal to the market value of the common shares at the grant date. The options issued by the Company are conventional options that vest over a period of time. The right to exercise options generally accrues over a period of four years of continuous employment. Options are not generally exercisable during the first 12 months after the date of grant and expire after 10 years. As at December 31, 2019, 14.9 million common shares remained authorized for future issuances under these plans. During the year ended December 31, 2019, the Company granted 0.9 million (2018 - 1.1 million; 2017 - 1.0 million) stock options. The following table provides the activity of stock option awards during 2019, and for options outstanding and exercisable at December 31, 2019, the weighted-average exercise price: Options outstanding Nonvested options Number of options Weighted-average exercise price Number of options Weighted-average grant date fair value In millions In millions Outstanding at December 31, 2018 (1) Granted (2) Forfeited/Cancelled Exercised (3) Vested (4) 4.2 0.9 (0.2) (1.1) N/A $ $ $ $ 79.73 110.94 102.49 68.15 N/A 2.3 0.9 (0.2) N/A (0.9) $ $ $ 13.84 16.34 15.43 N/A 13.31 $ Outstanding at December 31, 2019 (1) 3.8 $ 86.89 2.1 $ 15.00 Exercisable at December 31, 2019 (1) 1.7 $ 72.22 N/A N/A (1) (2) Stock options with a US dollar exercise price have been translated to Canadian dollars using the foreign exchange rate in effect at the balance sheet date. The grant date fair value of options awarded in 2019 of $15 million ($16.34 per option) is calculated using the Black-Scholes option-pricing model. As at December 31, 2019, total unrecognized compensation cost related to all outstanding awards was $10 million and is expected to be recognized over a weighted-average period of 2.5 years. The total intrinsic value of options exercised in 2019 was $53 million (2018 - $78 million; 2017 - $62 million). The cash received upon exercise of options in 2019 was $77 million (2018 - $103 million; 2017 - $58 million) and the related excess tax benefit realized in 2019 was $3 million (2018 - $3 million and 2017 - $ 5 million). The grant date fair value of options vested in 2019 was $12 million (2018 - 12 million and 2017 - $10 million). (3) (4) The following table provides the number of stock options outstanding and exercisable as at December 31, 2019 by range of exercise price and their related intrinsic value, and for options outstanding, the weighted-average years to expiration. The table also provides the aggregate intrinsic value for in-the-money stock options, which represents the value that would have been received by option holders had they exercised their options on December 31, 2019 at the Company's closing stock price of $117.47. Options outstanding Options exercisable Weighted-average years to expiration Weighted-average exercise price Aggregate intrinsic value Weighted-average exercise price Aggregate intrinsic value Number of options Number of options Range of exercise prices In millions In millions In millions In millions $ $ $ $ 27.33 - $ 45.01 - $ 65.01 - $ 45.00 65.00 85.00 0.2 0.4 0.8 1.5 0.9 1.5 3.3 5.7 7.4 9.1 $ $ $ $ $ 35.95 54.93 74.77 95.00 110.77 $ 16 24 35 33 6 0.2 0.4 0.6 0.5 — $ $ $ $ $ 35.95 54.93 76.01 93.17 115.48 $ 16 24 24 12 — 85.01 - $ 105.00 $ 105.01 - $ 126.35 Balance at December 31, 2019 (1) 3.8 6.7 $ 86.89 $ 114 1.7 $ 72.22 $ 76 (1) Stock options with a US dollar exercise price have been translated to Canadian dollars using the foreign exchange rate in effect at the balance sheet date. The weighted-average years to expiration of exercisable stock options was 5 years. 96 CN | 2019 Annual Report

Notes to the Consolidated Financial Statements The following table provides the assumptions used in the valuation of stock option awards: 2019 2018 2017 Year of grant Assumptions Grant price ($) Expected stock price volatility (%) (1) Expected term (years) (2) Risk-free interest rate (%) (3) Dividend rate ($) (4) Weighted-average grant date fair value ($) 110.94 18 5.5 1.75 2.15 16.34 98.05 18 5.5 2.08 1.82 15.34 92.16 20 5.5 1.24 1.65 14.44 (1) (2) (3) (4) Based on the historical volatility of the Company's stock over a period commensurate with the expected term of the award. Represents the period of time that awards are expected to be outstanding. The Company uses historical data to predict option exercise behavior. Based on the implied yield available on zero-coupon government issues with an equivalent term commensurate with the expected term of the awards. Based on the annualized dividend rate. Stock price volatility The Company's liability for the cash settled VIDP is marked-to-market at each period-end and varies with the Company's share price. Fluctuations in the Company's share price cause volatility to stock-based compensation expense as recorded in Net income. The Company does not currently hold any derivative financial instruments to manage this exposure. Employee Share Investment Plan The Company has an Employee Share Investment Plan (ESIP) giving eligible employees the opportunity to subscribe for up to 10% of their gross salaries to purchase shares of the Company's common stock on the open market and to have the Company invest, on the employees' behalf, a further 35% of the amount invested by the employees, up to 6% of their gross salaries. Beginning January 1, 2019, Company contributions to the ESIP, which consist of shares purchased on the open market, are subject to a one-year vesting period and are forfeited should certain participant contributions be sold or disposed of prior to vesting. Company contributions to the ESIP are held in Share Trusts until vesting, at which time shares are delivered to the employee. The following table provides a summary of the activity related to the ESIP for 2019: ESIP Shares In millions Unvested contributions, December 31, 2018 Company contributions (1) — 0.3 Unvested contributions, December 31, 2019 0.3 (1) The weighted average fair value of the shares contributed was $118.83. The following table provides the number of participants holding shares, the total number of ESIP shares purchased on behalf of employees, including the Company's contributions for the years ended December 31, 2019, 2018 and 2017: 2019 2018 2017 Year ended December 31, Number of participants holding shares Total number of ESIP shares purchased on behalf of employees (millions) 21,674 1.5 22,185 1.8 19,642 1.7 CN | 2019 Annual Report 97

Notes to the Consolidated Financial Statements 18 – Accumulated other comprehensive loss Foreign currency translation adjustments Pension and other postretirement benefit plans Total before tax Income tax recovery (expense) (1) Total net of tax In millions Balance at December 31, 2016 Other comprehensive income (loss) before reclassifications: Foreign exchange loss on translation of net investment in foreign operations Foreign exchange gain on translation of US dollar-denominated debt designated as a hedge of the net investment in foreign operations Actuarial loss arising during the year Amounts reclassified from Accumulated other comprehensive loss: Amortization of net actuarial loss Amortization of prior service costs $ (247) $ (2,898) $ (3,145) $ 787 $ (2,358) (701) (701) — (701) 504 504 (408) (67) 110 437 (298) (408) (2) (47) (3) (1) (3) 179 5 179 5 132 4 (2) Other comprehensive loss (197) (224) (421) (5) (426) Balance at December 31, 2017 Other comprehensive income (loss) before reclassifications: Foreign exchange gain on translation of net investment in foreign operations Foreign exchange loss on translation of US dollar-denominated debt designated as a hedge of the net investment in foreign operations Actuarial loss arising during the year Prior service credit arising during the year Amounts reclassified from Accumulated other comprehensive loss: Amortization of net actuarial loss Amortization of prior service costs Settlement loss arising during the year (444) (3,122) (3,566) 782 (2,784) 1,038 1,038 — 1,038 (635) (635) (969) 6 86 262 (2) (549) (707) 4 (969) 6 (2) (54) (3) 198 3 3 198 3 3 144 3 2 (2) (3) — (2) (1) (3) Other comprehensive income (loss) 403 (759) (356) 291 (65) Balance at December 31, 2018 Other comprehensive income (loss) before reclassifications: Foreign exchange loss on translation of net investment in foreign operations Foreign exchange gain on translation of US dollar-denominated debt designated as a hedge of the net investment in foreign operations Actuarial loss arising during the year Amounts reclassified from Accumulated other comprehensive loss: Amortization of net actuarial loss Amortization of prior service costs Settlement loss arising during the year (41) (3,881) (3,922) 1,073 (2,849) (636) (636) — (636) 380 380 (600) (52) 155 328 (445) (600) (2) (39) (3) (1) (3) (1) (3) 152 3 5 152 3 5 113 2 4 (2) (2) Other comprehensive income (loss) (256) (440) (696) 62 (634) Balance at December 31, 2019 $ (297) $ (4,321) $ (4,618) $ 1,135 $ (3,483) (1) (2) The Company releases stranded tax effects from Accumulated other comprehensive loss to Net income upon the liquidation or termination of the related item. Reclassified to Other components of net periodic benefit income in the Consolidated Statements of Income and included in net periodic benefit cost. See Note 15 - Pensions and other postretirement benefits. Included in Income tax recovery (expense) in the Consolidated Statements of Income. (3) 98 CN | 2019 Annual Report

Notes to the Consolidated Financial Statements 19 – Major commitments and contingencies Purchase commitments As at December 31, 2019, the Company had fixed and variable commitments to purchase rail, information technology services and licenses, locomotives, wheels, engineering services, railroad ties, rail cars, as well as other equipment and services with a total estimated cost of $1,621 million. Costs of variable commitments were estimated using forecasted prices and volumes. Contingencies In the normal course of business, the Company becomes involved in various legal actions seeking compensatory and occasionally punitive damages, including actions brought on behalf of various purported classes of claimants and claims relating to employee and third-party personal injuries, occupational disease and property damage, arising out of harm to individuals or property allegedly caused by, but not limited to, derailments or other accidents. Canada Employee injuries are governed by the workers' compensation legislation in each province whereby employees may be awarded either a lump sum or a future stream of payments depending on the nature and severity of the injury. As such, the provision for employee injury claims is discounted. In the provinces where the Company is self-insured, costs related to employee work-related injuries are accounted for based on actuarially developed estimates of the ultimate cost associated with such injuries, including compensation, health care and third-party administration costs. An actuarial study is generally performed at least on a triennial basis. For all other legal actions, the Company maintains, and regularly updates on a case-by-case basis, provisions for such items when the expected loss is both probable and can be reasonably estimated based on currently available information. In 2019, 2018 and 2017 the Company recorded a decrease of $7 million, and an increase of $4 million and $2 million, respectively, to its provision for personal injuries in Canada as a result of actuarial valuations for employee injury claims. As at December 31, 2019, 2018 and 2017, the Company's provision for personal injury and other claims in Canada was as follows: 2019 2018 2017 In millions Beginning of year Accruals and other Payments $ 207 29 (29) $ 183 52 (28) $ 183 38 (38) End of year $ 207 $ 207 $ 183 Current portion - End of year $ 55 $ 60 $ 40 United States Personal injury claims by the Company's employees, including claims alleging occupational disease and work-related injuries, are subject to the provisions of the Federal Employers' Liability Act (FELA). Employees are compensated under FELA for damages assessed based on a finding of fault through the U.S. jury system or through individual settlements. As such, the provision is undiscounted. With limited exceptions where claims are evaluated on a case-by-case basis, the Company follows an actuarial-based approach and accrues the expected cost for personal injury, including asserted and unasserted occupational disease claims, and property damage claims, based on actuarial estimates of their ultimate cost. An actuarial study is performed annually. For employee work-related injuries, including asserted occupational disease claims, and third-party claims, including grade crossing, trespasser and property damage claims, the actuarial valuation considers, among other factors, the Company's historical patterns of claims filings and payments. For unasserted occupational disease claims, the actuarial valuation includes the projection of the Company's experience into the future considering the potentially exposed population. The Company adjusts its liability based upon management's assessment and the results of the study. On an ongoing basis, management reviews and compares the assumptions inherent in the latest actuarial valuation with the current claim experience and, if required, adjustments to the liability are recorded. Due to the inherent uncertainty involved in projecting future events, including events related to occupational diseases, which include but are not limited to, the timing and number of actual claims, the average cost per claim and the legislative and judicial environment, the Company's future payments may differ from current amounts recorded. In 2019, the Company recorded an increase of $2 million to its provision for U.S. personal injury and other claims attributable to third-party claims, occupational disease claims and non-occupational disease claims pursuant to the 2019 actuarial valuation. In 2018 and 2017, actuarial valuations resulted in an increase of $13 million and $15 million, respectively. The prior years' adjustments from the actuarial valuations were mainly attributable to non-occupational disease claims, third-party claims and occupational disease claims reflecting changes in the Company's estimates of unasserted claims and costs related to asserted claims. The Company has an ongoing risk mitigation strategy focused on CN | 2019 Annual Report 99
Notes to the Consolidated Financial Statements reducing the frequency and severity of claims through injury prevention and containment; mitigation of claims; and lower settlements of existing claims. As at December 31, 2019, 2018 and 2017, the Company's provision for personal injury and other claims in the U.S. was as follows: 2019 2018 2017 In millions Beginning of year Accruals and other Payments Foreign exchange $ 139 44 (31) (7) $ 116 41 (28) 10 $ 118 46 (41) (7) End of year $ 145 $ 139 $ 116 Current portion - End of year $ 36 $ 37 $ 25 Although the Company considers such provisions to be adequate for all its outstanding and pending claims, the final outcome with respect to actions outstanding or pending at December 31, 2019, or with respect to future claims, cannot be reasonably determined. When establishing provisions for contingent liabilities the Company considers, where a probable loss estimate cannot be made with reasonable certainty, a range of potential probable losses for each such matter, and records the amount it considers the most reasonable estimate within the range. However, when no amount within the range is a better estimate than any other amount, the minimum amount in the range is accrued. For matters where a loss is reasonably possible but not probable, a range of potential losses cannot be estimated due to various factors which may include the limited availability of facts, the lack of demand for specific damages and the fact that proceedings were at an early stage. Based on information currently available, the Company believes that the eventual outcome of the actions against the Company will not, individually or in the aggregate, have a material adverse effect on the Company's financial position. However, due to the inherent inability to predict with certainty unforeseeable future developments, there can be no assurance that the ultimate resolution of these actions will not have a material adverse effect on the Company's results of operations, financial position or liquidity. Environmental matters The Company's operations are subject to numerous federal, provincial, state, municipal and local environmental laws and regulations in Canada and the U.S. concerning, among other things, emissions into the air; discharges into waters; the generation, handling, storage, transportation, treatment and disposal of waste, hazardous substances, and other materials; decommissioning of underground and aboveground storage tanks; and soil and groundwater contamination. A risk of environmental liability is inherent in railroad and related transportation operations; real estate ownership, operation or control; and other commercial activities of the Company with respect to both current and past operations. Known existing environmental concerns The Company is or may be liable for remediation costs at individual sites, in some cases along with other potentially responsible parties, associated with actual or alleged contamination. The ultimate cost of addressing these known contaminated sites cannot be definitively established given that the estimated environmental liability for any given site may vary depending on the nature and extent of the contamination; the nature of anticipated response actions, taking into account the available clean-up techniques; evolving regulatory standards governing environmental liability; and the number of potentially responsible parties and their financial viability. As a result, liabilities are recorded based on the results of a four-phase assessment conducted on a site-by-site basis. A liability is initially recorded when environmental assessments occur, remedial efforts are probable, and when the costs, based on a specific plan of action in terms of the technology to be used and the extent of the corrective action required, can be reasonably estimated. The Company estimates the costs related to a particular site using cost scenarios established by external consultants based on the extent of contamination and expected costs for remedial efforts. In the case of multiple parties, the Company accrues its allocable share of liability taking into account the Company's alleged responsibility, the number of potentially responsible parties and their ability to pay their respective share of the liability. Adjustments to initial estimates are recorded as additional information becomes available. The Company's provision for specific environmental sites is undiscounted and includes costs for remediation and restoration of sites, as well as monitoring costs. Environmental expenses, which are classified as Casualty and other in the Consolidated Statements of Income, include amounts for newly identified sites or contaminants as well as adjustments to initial estimates. Recoveries of environmental remediation costs from other parties are recorded as assets when their receipt is deemed probable. 100 CN | 2019 Annual Report

Notes to the Consolidated Financial Statements As at December 31, 2019, 2018 and 2017, the Company's provision for specific environmental sites was as follows: 2019 2018 2017 In millions Beginning of year Accruals and other Payments Foreign exchange $ 61 31 (34) (1) $ 78 16 (34) 1 $ 86 16 (23) (1) End of year $ 57 $ 61 $ 78 Current portion - End of year $ 38 $ 39 $ 57 The Company anticipates that the majority of the liability at December 31, 2019 will be paid out over the next five years. Based on the information currently available, the Company considers its provisions to be adequate. Unknown existing environmental concerns While the Company believes that it has identified the costs likely to be incurred for environmental matters based on known information, the discovery of new facts, future changes in laws, the possibility of releases of hazardous materials into the environment and the Company's ongoing efforts to identify potential environmental liabilities that may be associated with its properties may result in the identification of additional environmental liabilities and related costs. The magnitude of such additional liabilities and the costs of complying with future environmental laws and containing or remediating contamination cannot be reasonably estimated due to many factors, including: • • • the lack of specific technical information available with respect to many sites; the absence of any government authority, third-party orders, or claims with respect to particular sites; the potential for new or changed laws and regulations and for development of new remediation technologies and uncertainty regarding the timing of the work with respect to particular sites; and the determination of the Company's liability in proportion to other potentially responsible parties and the ability to recover costs from any third parties with respect to particular sites. • Therefore, the likelihood of any such costs being incurred or whether such costs would be material to the Company cannot be determined at this time. There can thus be no assurance that liabilities or costs related to environmental matters will not be incurred in the future, or will not have a material adverse effect on the Company's financial position or results of operations in a particular quarter or fiscal year, or that the Company's liquidity will not be adversely impacted by such liabilities or costs, although management believes, based on current information, that the costs to address environmental matters will not have a material adverse effect on the Company's financial position or liquidity. Costs related to any unknown existing or future contamination will be accrued in the period in which they become probable and reasonably estimable. Future occurrences In railroad and related transportation operations, it is possible that derailments or other accidents, including spills and releases of hazardous materials, may occur that could cause harm to human health or to the environment. As a result, the Company may incur costs in the future, which may be material, to address any such harm, compliance with laws and other risks, including costs relating to the performance of clean-ups, payment of environmental penalties and remediation obligations, and damages relating to harm to individuals or property. Regulatory compliance The Company may incur significant capital and operating costs associated with environmental regulatory compliance and clean-up requirements, in its railroad operations and relating to its past and present ownership, operation or control of real property. Operating expenses related to regulatory compliance activities for environmental matters for the year ended December 31, 2019 amounted to $25 million (2018 - $22 million; 2017 - $20 million). In addition, based on the results of its operations and maintenance programs, as well as ongoing environmental audits and other factors, the Company plans for specific capital improvements on an annual basis. Certain of these improvements help ensure facilities, such as fueling stations, waste water and storm water treatment systems, comply with environmental standards and include new construction and the updating of existing systems and/or processes. Other capital expenditures relate to assessing and remediating certain impaired properties. The Company's environmental capital expenditures for the year ended December 31, 2019 amounted to $25 million (2018 - $19 million; 2017 - $21 million). Guarantees and indemnifications In the normal course of business, the Company enters into agreements that may involve providing guarantees or indemnifications to third parties and others, which may extend beyond the term of the agreements. These include, but are not limited to, standby letters of credit, surety and other bonds, and indemnifications that are customary for the type of transaction or for the railway business. CN | 2019 Annual Report 101

Notes to the Consolidated Financial Statements As at December 31, 2019, the Company had outstanding letters of credit of $424 million (2018 - $410 million) under the committed bilateral letter of credit facilities and $149 million (2018 - $137 million) under the uncommitted bilateral letter of credit facilities, and surety and other bonds of $169 million (2018 - $160 million), all issued by financial institutions with investment grade credit ratings to third parties to indemnify them in the event the Company does not perform its contractual obligations. As at December 31, 2019, the maximum potential liability under these guarantee instruments was $742 million (2018 - $707 million), of which $681 million (2018 - $659 million) related to other employee benefit liabilities and workers' compensation and $61 million (2018 - $48 million) related to other liabilities. The guarantee instruments expire at various dates between 2020 and 2022. As at December 31, 2019, the Company had not recorded a liability with respect to guarantees as the Company did not expect to make any payments under its guarantees. General indemnifications In the normal course of business, the Company provides indemnifications, customary for the type of transaction or for the railway business, in various agreements with third parties, including indemnification provisions where the Company would be required to indemnify third parties and others. During the year, the Company entered into various contracts with third parties for which an indemnification was provided. Due to the nature of the indemnification clauses, the maximum exposure for future payments cannot be reasonably determined. To the extent of any actual claims under these agreements, the Company maintains provisions for such items, which it considers to be adequate. As at December 31, 2019, the Company had not recorded a liability with respect to any indemnifications. 20 – Financial instruments Risk management In the normal course of business, the Company is exposed to various risks from its use of financial instruments. To manage these risks, the Company follows a financial risk management framework, which is monitored and approved by the Company's Finance Committee, with a goal of maintaining a strong balance sheet, optimizing earnings per share and free cash flow, financing its operations at an optimal cost of capital and preserving its liquidity. The Company has limited involvement with derivative financial instruments in the management of its risks and does not hold or issue them for trading or speculative purposes. Foreign currency risk The Company conducts its business in both Canada and the U.S. and as a result, is affected by currency fluctuations. Changes in the exchange rate between the Canadian dollar and the US dollar affect the Company's revenues and expenses. To manage foreign currency risk, the Company designates US dollar-denominated debt of the parent company as a foreign currency hedge of its net investment in foreign operations. As a result, from the dates of designation, foreign exchange gains and losses on translation of the Company's US dollar-denominated debt are recorded in Accumulated other comprehensive loss, which minimizes volatility of earnings resulting from the conversion of US dollar-denominated debt into the Canadian dollar. The Company also enters into foreign exchange forward contracts to manage its exposure to foreign currency risk. As at December 31, 2019, the Company had outstanding foreign exchange forward contracts with a notional value of US$1,088 million (2018 - US$1,465 million). Changes in the fair value of foreign exchange forward contracts, resulting from changes in foreign exchange rates, are recognized in Other income in the Consolidated Statement of Income as they occur. For the year ended December 31, 2019, the Company recorded a loss of $75 million (2018 - gain of $157 million; 2017 - loss of $72 million) related to foreign exchange forward contracts. These gains or losses were largely offset by the re-measurement of US dollar-denominated monetary assets and liabilities recognized in Other income. As at December 31, 2019, the fair value of outstanding foreign exchange forward contracts included in Other current assets and Accounts payable and other was $nil and $24 million, respectively (2018 - $67 million and $nil, respectively). Interest rate risk The Company is exposed to interest rate risk, which is the risk that the fair value or future cash flows of a financial instrument will vary as a result of changes in market interest rates. Such risk exists in relation to the Company's debt. The Company mainly issues fixed-rate debt, which exposes the Company to variability in the fair value of the debt. The Company also issues debt with variable interest rates, which exposes the Company to variability in interest expense. To manage interest rate risk, the Company manages its borrowings in line with liquidity needs, maturity schedule, and currency and interest rate profile. In anticipation of future debt issuances, the Company may use derivative instruments such as forward rate agreements. The Company does not currently hold any significant derivative instruments to manage its interest rate risk. 102 CN | 2019 Annual Report

Notes to the Consolidated Financial Statements Fair value of financial instruments The financial instruments that the Company measures at fair value on a recurring basis in periods subsequent to initial recognition are categorized into the following levels of the fair value hierarchy based on the degree to which inputs are observable: • • • Level 1: Inputs are quoted prices for identical instruments in active markets Level 2: Significant inputs (other than quoted prices included in Level 1) are observable Level 3: Significant inputs are unobservable The carrying amounts of Cash and cash equivalents and Restricted cash and cash equivalents approximate fair value. These financial instruments include highly liquid investments purchased three months or less from maturity, for which the fair value is determined by reference to quoted prices in active markets. The carrying amounts of Accounts receivable, Other current assets, and Accounts payable and other approximate fair value. The fair value of these financial instruments is not determined using quoted prices, but rather from market observable information. The fair value of derivative financial instruments, classified as Level 2, used to manage the Company's exposure to foreign currency risk and included in Other current assets and Accounts payable and other is measured by discounting future cash flows using a discount rate derived from market data for financial instruments subject to similar risks and maturities. The carrying amount of the Company's debt does not approximate fair value. The fair value is estimated based on quoted market prices for the same or similar debt instruments, as well as discounted cash flows using current interest rates for debt with similar terms, company rating, and remaining maturity. The Company classifies debt as Level 2. As at December 31, 2019, the Company's debt, excluding finance leases, had a carrying amount of $13,662 million (2018 - $12,540 million) and a fair value of $15,667 million (2018 - $13,287 million). 21 – Segmented information The Company manages its operations as one business segment over a single network that spans vast geographic distances and territories, with operations in Canada and the U.S. Financial information reported at this level, such as revenues, operating income, and cash flow from operations, is used by the Company's management, including its chief operating decision-maker, in evaluating financial and operational performance and allocating resources across CN's network. The Company's strategic initiatives, which drive its operational direction, are developed and managed centrally by management and are communicated to its regional activity centers (the Western Region and Eastern Region). The Company's management is responsible for, among others, CN's marketing strategy, the management of large customer accounts, overall planning and control of infrastructure and rolling stock, the allocation of resources, and other functions such as financial planning, accounting and treasury. The role of each region is to manage the day-to-day service requirements within their respective territories and control direct costs incurred locally. Such cost control is required to ensure that pre-established efficiency standards set at the corporate level are met. The regions execute the overall corporate strategy and operating plan established by the Company's management, as the regions' management of throughput and control of direct costs does not serve as the platform for the Company's decision-making process. Approximately 95% of the Company's freight revenues are from national accounts for which freight traffic spans North America and touches various commodity groups. As a result, the Company does not manage revenues on a regional basis since a large number of the movements originate in one region and pass through and/ or terminate in another region. The regions also demonstrate common characteristics in each of the following areas: • • • each region's sole business activity is the transportation of freight over the Company's extensive rail network; the regions service national accounts that extend over the Company's various commodity groups and across its rail network; the services offered by the Company stem predominantly from the transportation of freight by rail with the goal of optimizing the rail network as a whole; and the Company and its subsidiaries, not its regions, are subject to regulatory regimes in both Canada and the U.S. For the years ended December 31, 2019, 2018, and 2017, no major customer accounted for more than 10% of total revenues and the • largest freight customer represented approximately 3% of total annual freight revenues. CN | 2019 Annual Report 103

Notes to the Consolidated Financial Statements The following tables provide information by geographic area: In millions Year ended December 31, 2019 2018 2017 Revenues Canada U.S. $ 10,167 4,750 $ 9,610 4,711 $ 8,794 4,247 Total revenues $ 14,917 $ 14,321 $ 13,041 Net income Canada U.S. $ 3,131 1,085 $ 3,163 1,165 $ 2,857 2,627 Total net income $ 4,216 $ 4,328 $ 5,484 In millions December 31, 2019 2018 Properties Canada U.S. $ 21,482 18,187 $ 19,737 18,036 Total properties $ 39,669 $ 37,773 22 – Subsequent events Normal course issuer bid On January 28, 2020, the Board of Directors of the Company approved a new NCIB, which allows for the repurchase of up to 16 million common shares between February 1, 2020 and January 31, 2021. Non-revolving credit facility On January 24, 2020, the Company requested a borrowing of US$300 million under its non-revolving credit facility. The funds are expected to be received on February 3, 2020. 104 CN | 2019 Annual Report
Additional copies of this report are available from: La version française du présent rapport est disponible à l’adresse suivante : CN Public Affairs 935 de La Gauchetière Street West Montreal, Quebec H3B 2M9 Telephone: 1-888-888-5909 Email: [email protected] Affaires publiques du CN 935, rue de La Gauchetière Ouest Montréal (Québec) H3B 2M9 Téléphone : 1 888 888-5909 Courriel : [email protected] 30% This report has been printed on 30% post-consumer recycled content.

935 de La Gauchetière Street West Montreal, Quebec H3B 2M9 cn.ca

Serious News for Serious Traders! Try StreetInsider.com Premium Free!
You May Also Be Interested In
- Susquehanna Downgrades Canadian National Railway (CNI) to Neutral
- Susquehanna Upgrades CSX (CSX) to Positive
- Pentair Announces Chief Financial Officer Transition and Provides Preliminary Second Quarter 2026 Financial Results, Revises Full Year 2026 Guidance, and Schedules Second Quarter 2026 Investor Call
Create E-mail Alert Related Categories
SEC FilingsSign up for StreetInsider Free!
Receive full access to all new and archived articles, unlimited portfolio tracking, e-mail alerts, custom newswires and RSS feeds - and more!