



Form 6-K BANCO BILBAO VIZCAYA For: Jun 30
FREE Breaking News Alerts from StreetInsider.com!
StreetInsider.com Top Tickers, 9/13/2026
- S&P 500 ends higher as strong inflation data cements rate-hike bets
- Oracle raises full year profit guidance, stock rises after hours
- Oil falls but head for 8% weekly gain on tight supply; US diesel hits record
- 'No panic anywhere' may be the problem, BofA strategists warn
- Buy Shopify stock at this ’AI-enabled entry point,’ analyst says
- After-Hours Movers: ORCL, CRWV, ADBE, ACVA, CPRT, ZUMZ, PMTS, RH
- After-Hours Movers: COO, AEO, NAVN, AVAV, TORO
- After-Hours Movers: LULU, IOT, PATH, DOCU, ASAN, GWRE, ZS, PL, SWBI, OXM
- After-Hours Movers: AVGO, SNOW, HPE, NTAP, NTSK, CHPT, FIVE, TLYS, PVH, RARE
- After-Hours Movers: DELL, PANW, GTLB, CRDO, MDB, HPE, SMCI
 Tweet
Tweet Share
Share E-mail
UNITED STATES SECURITIES AND EXCHANGE
COMMISSION
WASHINGTON, D.C. 20549
FORM 6-K
REPORT OF FOREIGN PRIVATE ISSUER PURSUANT TO RULE 13a-16 OR 15d-16
UNDER THE SECURITIES EXCHANGE ACT OF 1934
For the month of July, 2026
Commission file number: 1-10110
BANCO BILBAO VIZCAYA ARGENTARIA, S.A.
(Exact name of Registrant as specified in its charter)
BANK BILBAO VIZCAYA ARGENTARIA, S.A.
(Translation of Registrant’s name into English)
Calle Azul, 4
28050 Madrid
Spain
(Address of principal executive offices)
Indicate by check mark whether the registrant files or will file annual reports under cover of Form 20-F or Form 40-F:
Form 20-F [X] | Form 40-F [ ] |
Indicate by check mark if the registrant is submitting the Form 6-K in paper as permitted by Regulation S-T Rule 101(b)(1):
Yes [ ] | No [X] |
Indicate by check mark if the registrant is submitting the Form 6-K in paper as permitted by Regulation S-T Rule 101(b)(7):
Yes [ ] | No [X] |

p.1

Translation of this report originally issued in Spanish. In the event of a discrepancy, the Spanish-language version prevails. | p.2 |
 | January - June 2026 Report |
Main data

BBVA GROUP MAIN DATA (CONSOLIDATED FIGURES) | ||||
30-06-26 | ∆ % | 30-06-25 | 31-12-25 | |
Balance sheet (millions of euros) | ||||
Total assets | 965,426 | 24.3 | 776,974 | 859,576 |
Loans and advances to customers (gross) | 522,544 | 19.2 | 438,285 | 472,697 |
Deposits from customers | 532,981 | 19.0 | 448,018 | 502,501 |
Total customer funds | 776,785 | 19.3 | 651,269 | 726,866 |
Total equity | 63,792 | 4.8 | 60,887 | 61,798 |
Income statement (millions of euros) | ||||
Net interest income | 15,164 | 20.3 | 12,607 | 26,280 |
Gross income | 21,159 | 17.3 | 18,034 | 36,931 |
Operating income | 13,159 | 17.0 | 11,247 | 22,599 |
Net attributable profit (loss) | 6,051 | 11.1 | 5,447 | 10,511 |
The BBVA share and share performance ratios | ||||
Number of shares outstanding (million) | 5,581 | (3.2) | 5,763 | 5,709 |
Share price (euros) | 21.87 | 67.5 | 13.06 | 20.05 |
Adjusted earnings (loss) per share (euros) ⁽¹⁾ | 1.06 | 15.8 | 0.91 | 1.78 |
Earnings (loss) per share (euros) ⁽¹⁾ | 1.04 | 14.1 | 0.91 | 1.76 |
Book value per share (euros) ⁽¹⁾ | 10.71 | 8.5 | 9.87 | 10.19 |
Tangible book value per share (euros) ⁽¹⁾ | 10.14 | 7.6 | 9.43 | 9.69 |
Market capitalization (millions of euros) | 122,061 | 62.2 | 75,269 | 114,465 |
Profitability and efficiency ratios (%) | ||||
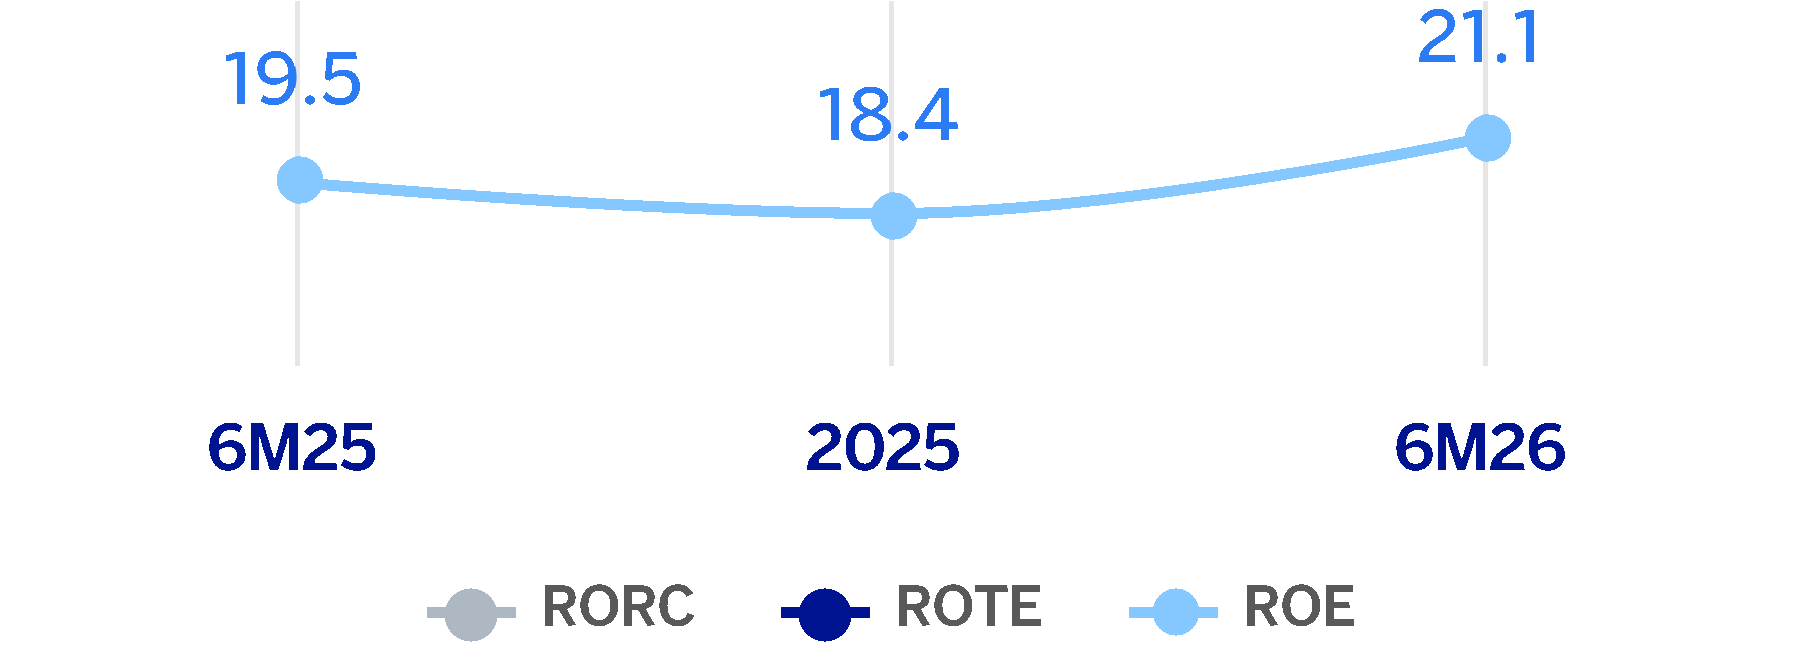
ROE (net attributable profit (loss)/average shareholders' funds +/- average accumulated other comprehensive income) ⁽¹⁾ | 21.1 | 19.5 | 18.4 | |
ROTE (net attributable profit (loss)/average shareholders' funds excluding average intangible assets +/- average accumulated other comprehensive income) ⁽¹⁾ | 22.2 | 20.4 | 19.3 | |
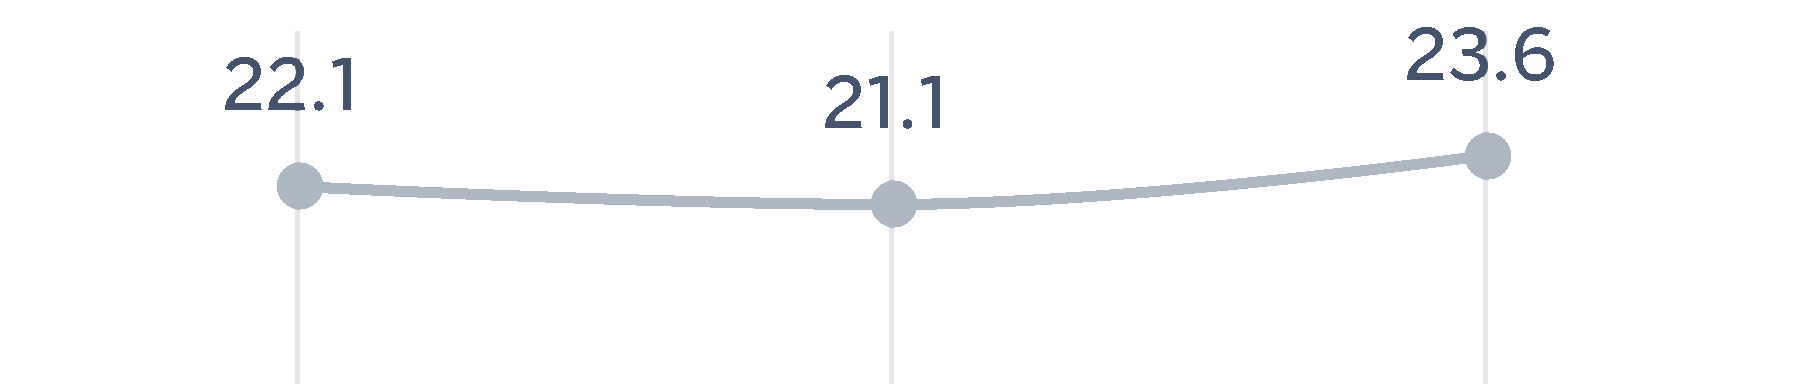
RORC (net attributable profit (loss)/average regulatory capital) ⁽¹⁾ | 23.6 | 22.1 | 21.1 | |
ROA (profit (loss) for the period / average total assets - ATA) ⁽¹⁾ | 1.4 | 1.5 | 1.4 | |
RORWA (profit (loss) for the period / average risk-weighted assets - RWA) ⁽¹⁾ | 3.2 | 2.9 | 2.8 | |
Efficiency ratio ⁽¹⁾ | 37.8 | 37.6 | 38.8 | |
Credit risk indicators (%) | ||||
Cost of risk ⁽¹⁾ | 1.43 | 1.32 | 1.39 | |
NPL ratio ⁽¹⁾ | 2.6 | 2.9 | 2.7 | |
NPL coverage ratio ⁽¹⁾ | 85 | 81 | 85 | |
Capital adequacy ratios (%) ⁽²⁾ | ||||
CET1 ratio | 12.90 | 13.34 | 12.70 | |
Tier 1 ratio | 14.43 | 14.76 | 14.08 | |
Total capital ratio | 17.42 | 17.72 | 17.21 | |
Other information | ||||
Number of active customers (million) ⁽³⁾ | 82.8 | 5.1 | 78.8 | 81.3 |
Number of shareholders ⁽⁴⁾ | 655,706 | (3.8) | 681,425 | 657,193 |
Number of employees | 126,994 | 0.9 | 125,864 | 127,174 |
Number of branches | 5,555 | (2.0) | 5,668 | 5,642 |
Number of ATMs | 30,794 | 1.5 | 30,328 | 31,015 |
⁽¹⁾ For more information, see Alternative Performance Measures at this report. | ||||
⁽²⁾ Preliminary data as of 30-06-2026. | ||||
⁽³⁾ 2025 data has been revised due to the homogenization of computation criteria in the different countries or changes in the origin of information provisioning, which would include the reorganization of the active client databases. | ||||
⁽⁴⁾ See footnote to table of structural distribution of shareholders in the Capital and shareholders chapter of this report. | ||||
Translation of this report originally issued in Spanish. In the event of a discrepancy, the Spanish-language version prevails. | p.3 |
| January - June 2026 Report |
Contents
Translation of this report originally issued in Spanish. In the event of a discrepancy, the Spanish-language version prevails. | p.4 |
| January - June 2026 Report |
Highlights
2025-2029 Strategic Plan
In the first half of 2026, the BBVA Group has continued to make significant progress in the execution of its 2025-2029 Strategic
Plan, which aims to establish a new axis of differentiation by radically incorporating the customer perspective, as well as driving
and strengthening the Group's commitment to growth and value creation.
BBVA is firmly betting on artificial intelligence as a key driver for achieving these goals, amplify their impact, and thus continue to
lead the transformation of the sector. To accelerate this evolution across the organization, the Bank has created the new AI
Transformation unit , an initiative that reinforces its commitment to integrating artificial intelligence across the entire
Organization.

Strategic priorities |
BBVA has established six Strategic Priorities to advance its strategy. These Priorities form the framework for
implementing the 2025–2029 Strategic Plan.

Thanks to the strong execution of the Strategic Plan, BBVA continues to make progress in achieving the financial targets defined
for the 2025-2028 period.

Translation of this report originally issued in Spanish. In the event of a discrepancy, the Spanish-language version prevails. | p.5 |
| January - June 2026 Report |
Results and business activity
The BBVA Group achieved a cumulative result of €6,051 million at the end of the first half of 2026, representing an increase of
11.1% over the previous year, supported by the strong performance of recurring revenues from the banking business.
The profit for the first half has been mainly favored by the solid evolution of net interest income, which increased by 20.3%, with a
positive performance in all business areas. This growth has been able to offset the higher operating expenses, which increased by
17.9%, and the provisions for impairment on financial assets, which grew by 26.6% compared to the accumulated balances as of
June 30, 2025, in a context of loan growth. In addition, net fees and commissions, which together with net interest income make
up the recurring revenues of the banking business, grew at a year-on-year rate of 14.0%.
Regarding activity, during the first half of 2026, loans and advances to customers increased by 10.6%, driven for another quarter
by the dynamism of the wholesale segment. Within this, the increased volume of business loans stands out, growing by 13.0% at
the Group level. Loans to individuals increased by 7.0%, with a favorable evolution across all products.
Customer funds registered an increase of 6.9% so far this year, with a growth of 6.1% in customer deposits, and of 8.7% in off-
balance sheet funds at the Group level.

LOANS AND ADVANCES TO CUSTOMERS AND TOTAL CUSTOMER FUNDS (VARIATION COMPARED TO 31-12-2025) |

(1) The growth of performing loans and advances to customers under
management (excluding repos) stands at 11.2%.
Business areas
According to the accumulated results of the business areas at the end of June 2026, and excluding the evolution of currencies in
each of them, it is worth mentioning:
–Spain generated a net attributable profit of €2,172 million, in the first half of 2026 which is, 2.3% above the result
achieved in the same period of 2025, driven by the evolution of the net interest income, supported by the dynamism of
lending activity in all customer segments and the net trading income (hereinafter NTI).
–BBVA Mexico achieved a net attributable profit of €2,979 million, which represents a year-on-year growth of 8.2%,
explained mainly by the favorable evolution of net interest income, supported by robust lending activity growth and driven
also by the rest of components of gross income.
–Turkey reached a net attributable profit of €532 million, with a year-on-year growth of 29.1%, as a result mainly of the
good performance of recurring income from the banking business (net interest income and fees).
1 The additional pro forma information from CIB excludes the application of hyperinflation accounting and the Group's wholesale business in Venezuela.
Translation of this report originally issued in Spanish. In the event of a discrepancy, the Spanish-language version prevails. | p.6 |
| January - June 2026 Report |
–South America generated a net attributable profit of €556 million, which represents a year-on-year growth of 33.6%,
favored by the evolution of recurring revenues in the banking business.
–Rest of Business achieved a net attributable profit of €508 million in the first half of 2026, 60.0% higher than in the same
period of the previous year, favored by the evolution of the recurring revenues and the NTI.
The Corporate Center recorded in the first half of 2026 a net attributable loss of €-696 million which represents a worsening
compared to the same period of the previous year, associated with the lower contribution of the NTI and higher personnel
expenses.
Lastly, and for a better understanding of the Group's activity and results, supplementary information is provided below for the
wholesale business, Corporate & Investment Banking (CIB), carried out by BBVA in the countries where it operates. CIB generated
a net attributable profit of €2,054 million in the first half of 20261. Excluding the impact of currency fluctuations, this result
represents a 20.7% increase over the previous year, which reflects again the strength of the Group's wholesale businesses, with
the aim of offering a value proposition focused on the needs of its customers.
NET ATTRIBUTABLE PROFIT (LOSS) (MILLIONS OF EUROS) |


+11.1% | |||

NET ATTRIBUTABLE PROFIT BREAKDOWN ⁽¹⁾ (PERCENTAGE. 6M26) |

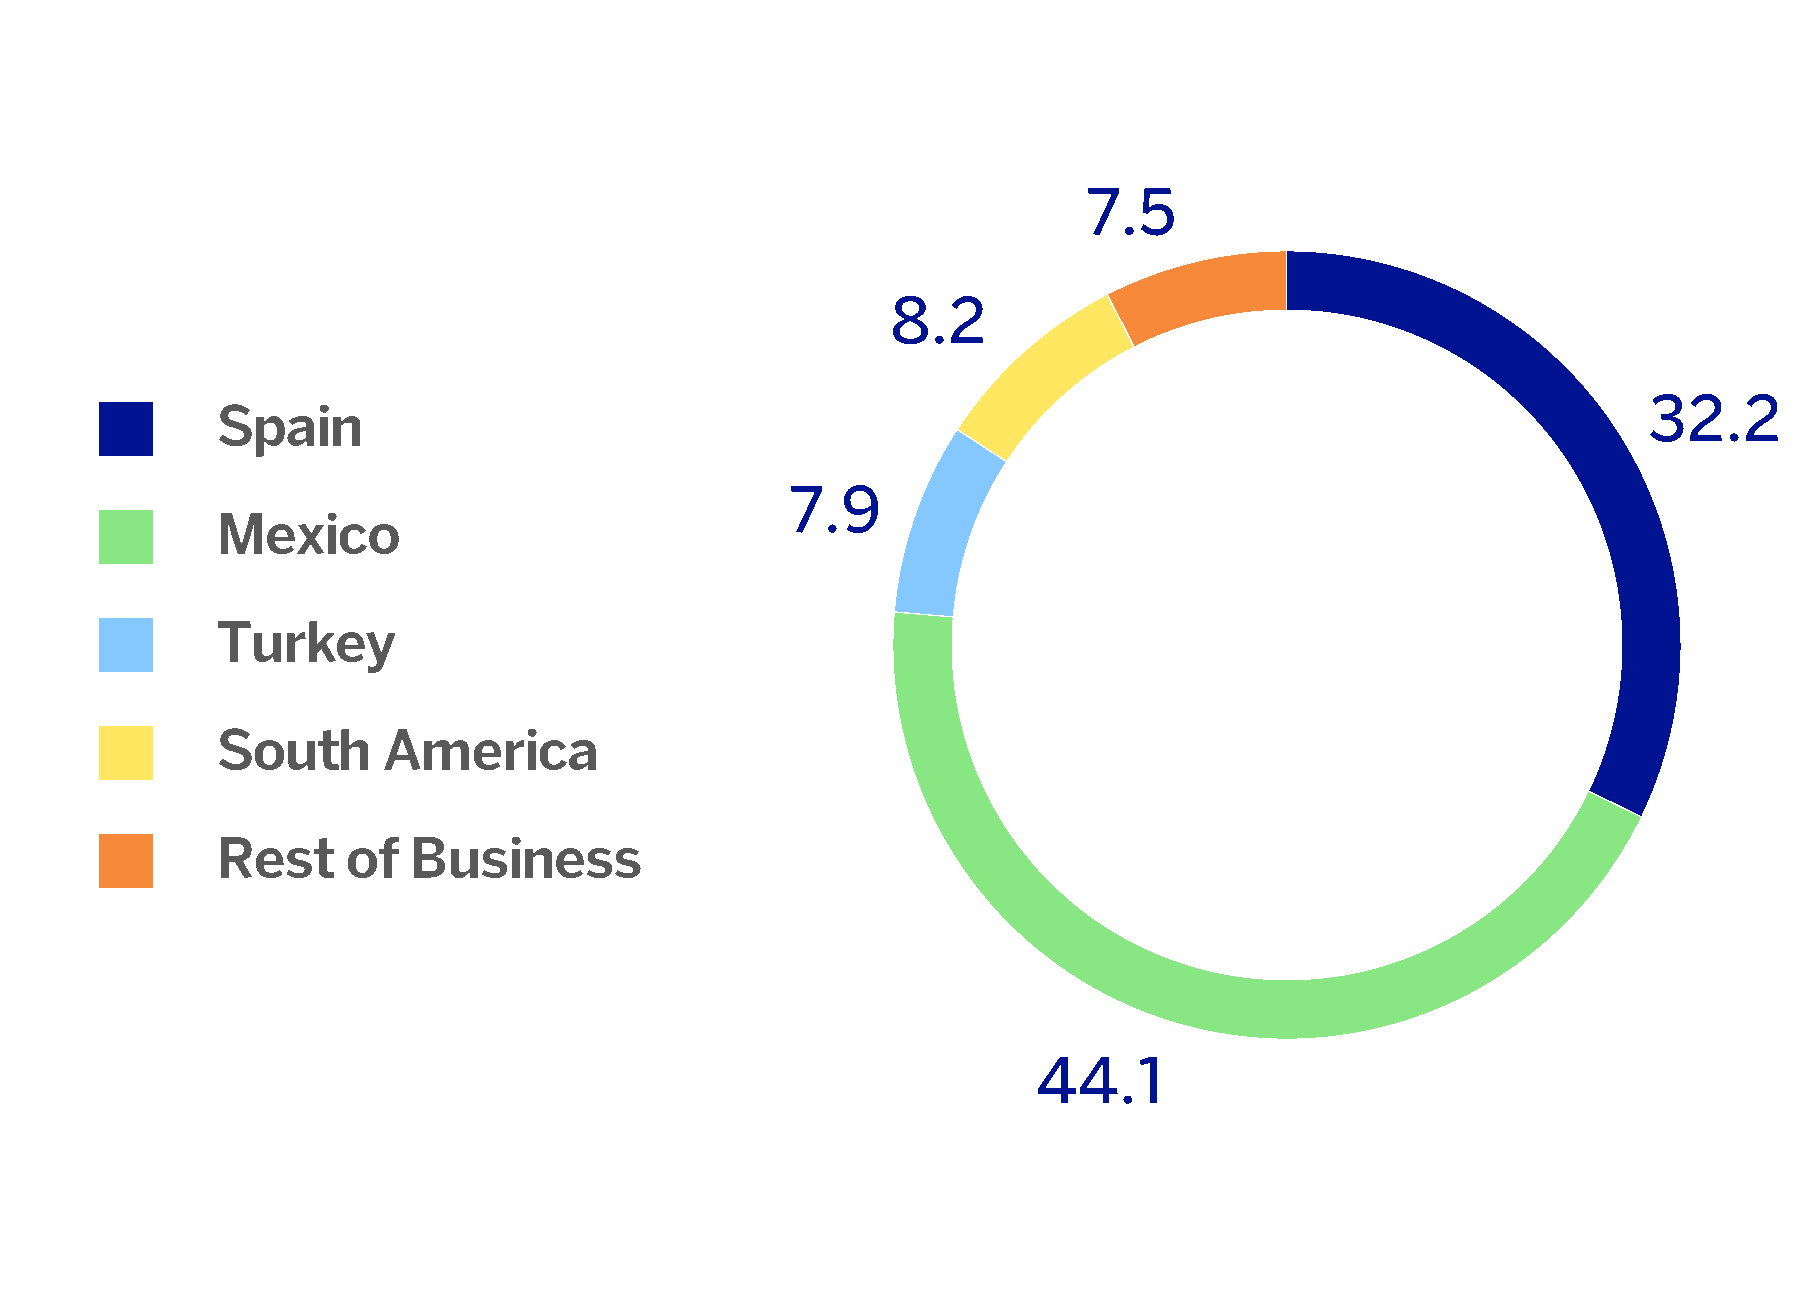
⁽¹⁾ Excludes the Corporate Center.
2 The Goal 2029 includes the channeling of financial flows, cumulatively, in relation with activities, clients or products considered to be sustainable, or promoting
sustainability, in accordance with internal standards inspired by existing regulations, market standards such as the Green Bond Principles, the Social Bond Principles,
the Climate Transition Finance Handbook and Climate Transition Bond Guidelines and the Sustainability Linked Bond Principles of the International Capital Markets
Association, as well as the Green Loan Principles, Social Loan Principles, Guide to Transition Loans and the Sustainability Linked Loan Principles of the Loan Market
Association, and best market practices. The foregoing is understood without prejudice to the fact that said channeling, both at an initial stage or at a later time, may not
be registered on the balance sheet. The products and eligibility and accounting criteria are described in the Guide for Sustainable Business Channeling available on the
BBVA Group's shareholders and investors website (https://shareholdersandinvestors.bbva.com/wp-content/uploads/2026/02/Guia-para-la-canalizacion-de-
negocio-sostenible-050226_ENG.pdf).
Translation of this report originally issued in Spanish. In the event of a discrepancy, the Spanish-language version prevails. | p.7 |
| January - June 2026 Report |
Sustainability
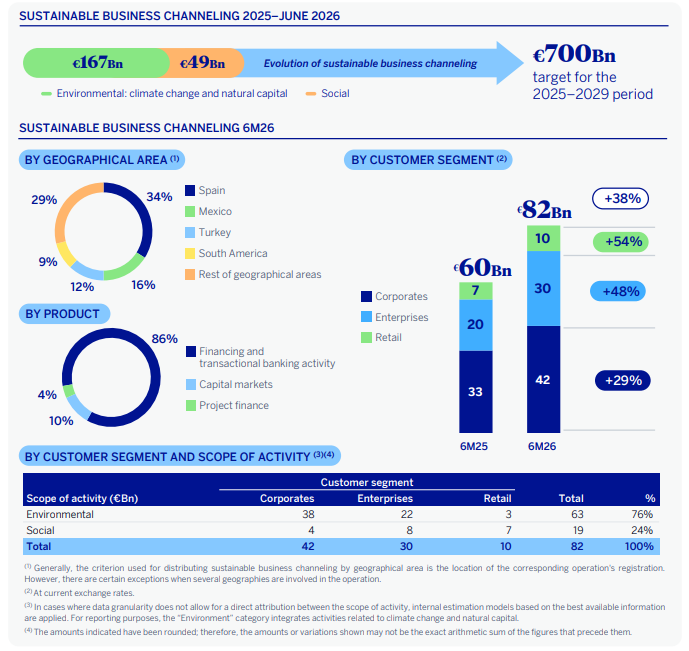
BBVA is driving sustainability as a differential growth engine. Within the framework of its ambitious target of channeling €700
billion into sustainable business for the 2025–2029 period2, the BBVA Group has channeled approximately €82 billion in the first
six months of 2026, bringing the cumulative total to €216 billion since the announcement of this new target.
3 As of June 30, 2026, there were no differences between fully loaded and phased-in ratios given that the impact associated with the transitional adjustments is nil.
4 Considering the latest official updates to the countercyclical capital buffer and the systemic risk buffer, applied on the basis of exposure as of March 31, 2026.
5 For further information, please refer to the "Share buyback programs" section in the "Capital and shareholders" chapter.
Translation of this report originally issued in Spanish. In the event of a discrepancy, the Spanish-language version prevails. | p.8 |
| January - June 2026 Report |
Solvency
The BBVA Group's CET13 ratio stood at 12.90% as of June 30, 2026, which allows it to maintain a large management buffer over
the Group's CET1 requirement as of that date (8.98%4), and is also above the Group's target management range of 11.5% - 12.0%
of CET1.
Shareholder remuneration
The shareholder remuneration policy contemplates that cash distributions may be combined with share buybacks, all subject to
the authorization and approvals applicable at any given time5.
Regarding cash distribution, the Annual General Shareholders´ Meeting of BBVA held on March 20, 2026, approved, under item
1.3 of the Agenda, a cash distribution against the 2025 results as a final dividend for the 2025 financial year, for an amount equal to
€0.60 gross per outstanding BBVA share entitled to participate in this distribution, which was paid on April 10, 2026. Thus, the
total amount of cash distributions for the 2025 financial year, taking into account that in November 2025 a gross amount of €0.32
per share was distributed, stood at €0.92 gross per share.
For its part, the 2026 share buyback programs include an extraordinary program of almost €4,000 million whose execution in
several tranches started in December 2025 and is nearing completion in addition to a new extraordinary share buyback program
of €2,000 million, which will be executed in several tranches, and whose first tranche, amounting to €1,000 million, is scheduled to
begin execution on August 5.
Translation of this report originally issued in Spanish. In the event of a discrepancy, the Spanish-language version prevails. | p.9 |
| January - June 2026 Report |
Macroeconomic environment
The global economy has remained resilient during the second quarter of 2026, despite the high levels of uncertainty and the
prolongation of the conflict between the United States and Iran for longer than initially expected. According to BBVA Research,
global GDP will grow by 3.1% for the full year, just one tenth below what was anticipated in the previous quarter, thanks to the
support provided by the increase in investment in artificial intelligence, the increase in defense spending and the expansionary
nature of fiscal policies.
The relatively strong performance of the U.S. economy and the strength of China in the face of the energy shock linked to tensions
in Iran largely explain the resilience of global growth. In particular, the GDP growth forecast for the United States in 2026 stands at
2.4%, one tenth lower than in the previous scenario, with investment in technology driving domestic spending, while it remains
unchanged for China, at 4.5%, where the dynamism of the external sector is limiting the effects of the adjustment in the real estate
market. However, in the Eurozone, the impact of higher energy commodity prices on its economy is expected to be greater, which
justifies the downward revision of BBVA Research's growth forecast for this year from 1.1% to 0.7%.
For its part, the price increases of energy-intensive goods and the supply chain disruptions associated with the conflict in the
Middle East have raised inflation in the main geographical areas and are expected to keep it above the levels anticipated a quarter
ago for the remainder of the year: in the case of the United States, the headline rate could stand around 3.5%, and in the Eurozone,
above 2.5%. Given this price context, monetary policy will become more restrictive. BBVA Research anticipates that the Fed will
leave benchmark interest rates unchanged at 3.75%, compared to the two cuts expected in the previous scenario, and the ECB will
keep them at 2.25% following the hike carried out in June. In China, monetary conditions will also be somewhat less
accommodative and rates could remain at 2025 levels.
The balance of risks for the global economy has improved following the restoration of trade flows in the Strait of Hormuz and the
correction in oil prices, although uncertainty remains high regarding the definite resolution of the crisis between the United States,
Iran and Israel. Added to this are the protectionist measures in trade and immigration, and the structural challenges facing Europe
and China. Geopolitical tensions in several Middle Eastern countries, the possible revival of the threat of potential actions by the
United States administration in Greenland or Mexico, and uncertainty regarding the reaction of central banks and their impact on
financial markets also constitute sources of risk. On a positive note, it is worth mentioning the boost in investment in artificial
intelligence and its medium-term effect on the productivity of economies that promote its adoption.

GDP GROWTH ESTIMATES IN 2026 (PERCENTAGE. YEAR-ON- YEAR VARIATION) |

Source: BBVA Research estimates.
Translation of this report originally issued in Spanish. In the event of a discrepancy, the Spanish-language version prevails. | p.10 |
| January - June 2026 Report |
Group
Quarterly evolution of results
In the second quarter of 2026, the Group achieved a net attributable profit of €3,062 million, which represents an increase of 2.4%
compared to the previous quarter, mainly driven by the growth of recurring revenues, lower operating expenses and a lower level
of loan-loss provisions.

CONSOLIDATED INCOME STATEMENT: QUARTERLY EVOLUTION (MILLIONS OF EUROS) | ||||||
2026 | 2025 | |||||
2Q | 1Q | 4Q | 3Q | 2Q | 1Q | |
Net interest income | 7,627 | 7,537 | 7,034 | 6,640 | 6,208 | 6,398 |
Net fees and commissions | 2,316 | 2,256 | 2,145 | 2,060 | 1,951 | 2,060 |
Net trading income | 582 | 915 | 694 | 531 | 484 | 948 |
Other operating income and expenses | (19) | (56) | (78) | (128) | 67 | (82) |
Gross income | 10,506 | 10,652 | 9,795 | 9,102 | 8,710 | 9,324 |
Operating expenses | (3,951) | (4,049) | (3,971) | (3,574) | (3,224) | (3,562) |
Personnel expenses | (2,164) | (2,201) | (2,181) | (1,899) | (1,792) | (1,901) |
Other administrative expenses | (1,371) | (1,430) | (1,398) | (1,296) | (1,062) | (1,283) |
Depreciation | (416) | (418) | (393) | (379) | (370) | (378) |
Operating income | 6,555 | 6,604 | 5,823 | 5,528 | 5,485 | 5,762 |
Impairment on financial assets not measured at fair value through profit or loss | (1,677) | (1,820) | (1,745) | (1,567) | (1,377) | (1,385) |
Provisions or reversal of provisions | (31) | (64) | (140) | (99) | (82) | (51) |
Other gains (losses) | 12 | 2 | (4) | 6 | 50 | 22 |
Profit (loss) before tax | 4,859 | 4,722 | 3,934 | 3,868 | 4,076 | 4,348 |
Income tax | (1,578) | (1,534) | (1,269) | (1,206) | (1,160) | (1,466) |
Profit (loss) for the period | 3,281 | 3,189 | 2,665 | 2,662 | 2,916 | 2,882 |
Non-controlling interests | (219) | (199) | (132) | (132) | (167) | (184) |
Net attributable profit (loss) | 3,062 | 2,989 | 2,533 | 2,531 | 2,749 | 2,698 |
Adjusted earnings (loss) per share (euros) ⁽¹⁾ | 0.54 | 0.51 | 0.43 | 0.42 | 0.46 | 0.45 |
Earnings (loss) per share (euros) ⁽¹⁾ | 0.53 | 0.51 | 0.42 | 0.42 | 0.46 | 0.45 |
⁽¹⁾ For more information, see Alternative Performance Measures at this report. | ||||||
Translation of this report originally issued in Spanish. In the event of a discrepancy, the Spanish-language version prevails. | p.11 |
| January - June 2026 Report |
Year-on-year evolution of results
The BBVA Group achieved a cumulative result of €6,051 million at the end of the first half of 2026, representing an increase of
11.1% over the same period last year, supported by the strong performance of recurring revenues from the banking business. If the
exchange rates variation is excluded, this growth stands at 10.0%.

CONSOLIDATED INCOME STATEMENT (MILLIONS OF EUROS) | ||||
∆ % at constant | ||||
6M26 | ∆ % | exchange rates | 6M25 | |
Net interest income | 15,164 | 20.3 | 18.8 | 12,607 |
Net fees and commissions | 4,572 | 14.0 | 15.8 | 4,010 |
Net trading income | 1,498 | 4.6 | 5.5 | 1,431 |
Other operating income and expenses | (75) | n.s. | 140.4 | (15) |
Gross income | 21,159 | 17.3 | 16.9 | 18,034 |
Operating expenses | (8,000) | 17.9 | 17.9 | (6,787) |
Personnel expenses | (4,365) | 18.2 | 18.7 | (3,693) |
Other administrative expenses | (2,801) | 19.4 | 19.3 | (2,345) |
Depreciation | (834) | 11.4 | 10.0 | (749) |
Operating income | 13,159 | 17.0 | 16.2 | 11,247 |
Impairment on financial assets not measured at fair value through profit or loss | (3,497) | 26.6 | 24.2 | (2,761) |
Provisions or reversal of provisions | (95) | (28.4) | (28.8) | (133) |
Other gains (losses) | 14 | (79.9) | (79.5) | 72 |
Profit (loss) before tax | 9,581 | 13.7 | 13.5 | 8,424 |
Income tax | (3,112) | 18.5 | 18.6 | (2,626) |
Profit (loss) for the period | 6,469 | 11.6 | 11.2 | 5,798 |
Non-controlling interests | (418) | 19.0 | 31.4 | (351) |
Net attributable profit (loss) | 6,051 | 11.1 | 10.0 | 5,447 |
Adjusted earnings (loss) per share (euros) ⁽¹⁾ | 1.06 | 0.91 | ||
Earnings (loss) per share (euros) ⁽¹⁾ | 1.04 | 0.91 | ||
⁽¹⁾ For more information, see Alternative Performance Measures at this report. | ||||
Unless expressly indicated otherwise, for a better understanding of the changes under the main headings of the Group's income
statement, the rates of change provided below refer to constant exchange rates. When comparing two dates or periods presented
in this report, the impact of changes in the exchange rates against the euro of the currencies of the countries in which BBVA
operates is sometimes excluded, assuming that exchange rates remain constant. For this purpose, the average exchange rate of
the currency of each geographical area of the most recent period is used for both periods, except for those countries whose
economies have been considered hyperinflationary, for which the closing exchange rate of the most recent period is used.
In the year-on-year evolution of the accumulated net interest income as of the end of the first half of 2026, the same positive
dynamics are maintained in all business areas, although Turkey, Mexico and South America stood out. All in all, the increase in this
line stood at 18.8%.
Translation of this report originally issued in Spanish. In the event of a discrepancy, the Spanish-language version prevails. | p.12 |
| January - June 2026 Report |
Likewise, net fees and commissions experienced a year-on-year growth of 15.8%, with a differential increase in this line in Turkey,
although all areas recorded higher fees in the first half of 2026 compared to the same period of the previous year. By type, fees
from payment methods stood out, and to a lesser extent, asset management fees.
As a result of this favorable evolution of the net interest income and net fees and commissions, recurring revenues from the
banking business have continued to show an upward quarterly trend with a growth of 18.1% compared to the first half of 2025.

NET INTEREST INCOME / AVERAGE TOTAL ASSETS (PERCENTAGE AT CONSTANT EXCHANGE RATES) |

NET INTEREST INCOME PLUS NET FEES AND COMMISSIONS (MILLIONS OF EUROS AT CONSTANT EXCHANGE RATES) |

+18.1% | (1) | |||
16,717 | 19,736 | |

⁽¹⁾ At current exchange rates: +18.8%.
The NTI showed a favorable performance (+5.5% at the end of June 2026), with a positive year-on-year evolution in all business
areas, and where Rest of Business stood out. For its part, the Corporate Center recorded higher losses, originating from exchange
rate hedges.
The other operating income and expenses line accumulated, as of June 30, 2026, higher charges compared to the first half of
2025, mainly due to a more negative impact derived from hyperinflation. The above was partially offset by a better evolution of the
results of the insurance business.
Translation of this report originally issued in Spanish. In the event of a discrepancy, the Spanish-language version prevails. | p.13 |
| January - June 2026 Report |
GROSS INCOME (MILLIONS OF EUROS AT CONSTANT EXCHANGE RATES) |


+16.9% | (1) | |||
18,105 | 21,159 | ||

⁽¹⁾ At current exchange rates: +17.3%.
OPERATING EXPENSES (MILLIONS OF EUROS AT CONSTANT EXCHANGE RATES) |
+17.9% | (1) | ||
6,785 | 8,000 | ||

⁽¹⁾ At current exchange rates: +17.9%.
The year-on-year growth in operating expenses (+17.9%) stems from both higher general expenses, mainly in technology and
taxes (both periods including the impact of the re-estimation of the applied pro-rata on the Value Added Tax at BBVA, S.A.) and
personnel expenses, the latter including the impact of voluntary redundancies in 2026.

EFFICIENCY RATIO (PERCENTAGE) |
+33 | |||
Basis points | |||


OPERATING INCOME (MILLIONS OF EUROS AT CONSTANT EXCHANGE RATES) |


+16.2% | (1) | ||
11,320 | 13,159 | ||

⁽¹⁾ At current exchange rates: +17.0%.
The increase in operating expenses was higher than the increase in gross income, which caused an increase of 33 basis points in
the efficiency ratio. Excluding from the year-on-year comparison the aforementioned re-estimation of the applied pro-rata on the
Value Added Tax, with an impact in both periods, and the voluntary redundancies in 2026, the efficiency ratio would decrease by
77 basis points.
Translation of this report originally issued in Spanish. In the event of a discrepancy, the Spanish-language version prevails. | p.14 |
| January - June 2026 Report |
The impairment on financial assets not measured at fair value through profit or loss (hereinafter, impairment on financial assets)
stood at the end of June 2026 at 24.2% higher than in the same period of the previous year, in a context of activity growth,
although it shows a decrease of 6.5% compared to the previous quarter. This evolution is largely explained by the higher
provisions made mainly in Turkey, South America and Mexico.
IMPAIRMENT ON FINANCIAL ASSETS (MILLIONS OF EUROS AT CONSTANT EXCHANGE RATES) |
+24.2% | (1) | |||
2,815 | 3,497 | ||

⁽¹⁾ At current exchange rates: +26.6%.


The provisions or reversal of provisions line (hereinafter, provisions) registered as of June 30, 2026 lower provisions (-28.8% year-
on-year) in all business areas except for Turkey.
On the other hand, the other gains (losses) line ended in the first half of 2026, 79.5% lower than the same period in 2025.
Income tax includes the accrual corresponding to the first half of 2026 of the tax on net interest income and net fees and
commissions in Spain, which amounts to approximately €149 million, in line with the €150 million accrued in the first half of 2025.
As a result of the above, the BBVA Group reached a net attributable profit of €6,051 million accumulated at the end of the first half
of 2026, showing growth of 10.0% compared to the same period of the previous year. This solid result is based on the strength of
the net interest income, which offsets the increase in operating expenses and the provisions for impairment losses on financial
assets in a context of loan growth.
The net attributable profits, in millions of euros and accumulated at the end of June 2026, for the business areas that compose the
Group were as follows: 2,172 in Spain, 2,979 in Mexico, 532 in Turkey, 556 in South America and 508 in Rest of Business.
Translation of this report originally issued in Spanish. In the event of a discrepancy, the Spanish-language version prevails. | p.15 |
| January - June 2026 Report |
NET ATTRIBUTABLE PROFIT (LOSS) (MILLIONS OF EUROS AT CONSTANT EXCHANGE RATES) |

+10.0% | (1) | |||
5,500 | 6,051 | ||

⁽¹⁾ At current exchange rates: +11.1%.
The Group's excellent performance has also allowed it to continue generating value, as is reflected in the growth of the tangible
book value per share and dividends, which at the end of June 2026 was 17.3% higher than at the same period of the previous year.

Translation of this report originally issued in Spanish. In the event of a discrepancy, the Spanish-language version prevails. | p.16 |
| January - June 2026 Report |
Lastly, the Group’s profitability indicators show BBVA's ability to combine higher growth rates and profitability ratios at high levels
in a way that differentiates it from the market.

ROE, ROTE AND RORC (PERCENTAGE) |


ROA AND RORWA (PERCENTAGE) |


Translation of this report originally issued in Spanish. In the event of a discrepancy, the Spanish-language version prevails. | p.17 |
| January - June 2026 Report |
Balance sheet and business activity
During the first half of 2026, loans and advances to customers increased by 10.6%, driven for another quarter by the dynamism of
the wholesale segment. Within this, the increased volume of business loans stands out, growing by 13.0% at the Group level. Loans
to individuals increased by 7.0%, with a favorable evolution across all products. By business areas, all of them showed higher
lending activity, with Rest of Business standing out once again.
Customer funds registered an increase of 6.9% so far this year, with a growth of 6.1% in customer deposits, and of 8.7% in off-
balance sheet funds at the Group level.
The other assets/other liabilities figure includes, at the end of June 2026, the assets and liabilities of Garanti Bank SA.,
Motoractive IFN SA., and Motoractive Multiservices, SRL, which have been classified as non-current assets and liabilities held for
sale (NCA&L) on the BBVA Group's consolidated balance sheet, once the sale agreement was made public with Raiffeisen Bank -
the Romanian subsidiary of the Austrian bank Raiffeisen Bank International AG (RBI) - to sell 100% of its subsidiary in Romania
was made public. Therefore, the loans and advancements to customers and customer base deposits in the Group's tables and
charts presented here, unless expressly stated otherwise, exclude those corresponding to the subsidiaries covered by the sale
agreement in Romania.

CONSOLIDATED BALANCE SHEET (MILLIONS OF EUROS) | |||
30-06-26 | ∆ % | 31-12-25 | |
Cash, cash balances at central banks and other demand deposits | 64,016 | 8.8 | 58,837 |
Financial assets held for trading | 154,695 | 25.6 | 123,185 |
Non-trading financial assets mandatorily at fair value through profit or loss | 13,171 | 16.9 | 11,272 |
Financial assets designated at fair value through profit or loss | 1,007 | 0.1 | 1,006 |
Financial assets at fair value through accumulated other comprehensive income | 62,205 | 5.8 | 58,809 |
Financial assets at amortized cost | 627,627 | 10.3 | 568,893 |
Loans and advances to central banks and credit institutions | 44,499 | 26.7 | 35,113 |
Loans and advances to customers | 509,424 | 10.6 | 460,401 |
Debt securities | 73,703 | 0.4 | 73,379 |
Investments in joint ventures and associates | 997 | 0.3 | 994 |
Tangible assets | 9,770 | 3.0 | 9,482 |
Intangible assets | 3,123 | 9.3 | 2,856 |
Other assets | 28,816 | 18.9 | 24,243 |
Total assets | 965,426 | 12.3 | 859,576 |
Financial liabilities held for trading | 119,389 | 29.9 | 91,917 |
Other financial liabilities designated at fair value through profit or loss | 21,450 | 16.5 | 18,417 |
Financial liabilities at amortized cost | 725,029 | 10.1 | 658,599 |
Deposits from central banks and credit institutions | 63,554 | 17.7 | 53,997 |
Deposits from customers | 532,981 | 6.1 | 502,501 |
Debt certificates | 106,155 | 29.7 | 81,842 |
Other financial liabilities | 22,339 | 10.3 | 20,258 |
Liabilities under insurance and reinsurance contracts | 13,782 | 8.0 | 12,760 |
Other liabilities | 21,985 | 36.7 | 16,084 |
Total liabilities | 901,635 | 13.0 | 797,778 |
Non-controlling interests | 4,839 | 9.0 | 4,441 |
Accumulated other comprehensive income | (16,661) | (11.7) | (18,871) |
Shareholders’ funds | 75,614 | (0.8) | 76,228 |
Total equity | 63,792 | 3.2 | 61,798 |
Total liabilities and equity | 965,426 | 12.3 | 859,576 |
Memorandum item: | |||
Guarantees given | 82,620 | 11.6 | 74,022 |
Translation of this report originally issued in Spanish. In the event of a discrepancy, the Spanish-language version prevails. | p.18 |
| January - June 2026 Report |

LOANS AND ADVANCES TO CUSTOMERS (MILLIONS OF EUROS) | |||
30-06-26 | ∆ % | 31-12-25 | |
Public sector | 29,929 | 15.5 | 25,905 |
Individuals | 206,026 | 7.0 | 192,524 |
Mortgages | 103,367 | 3.8 | 99,606 |
Consumer | 56,434 | 8.7 | 51,912 |
Credit cards | 31,740 | 10.4 | 28,753 |
Other loans | 14,485 | 18.2 | 12,253 |
Business | 271,144 | 13.0 | 239,922 |
Non-performing loans | 15,444 | 7.7 | 14,346 |
Loans and advances to customers (gross) | 522,544 | 10.5 | 472,697 |
Allowances ⁽¹⁾ | (13,119) | 6.7 | (12,297) |
Loans and advances to customers | 509,424 | 10.6 | 460,401 |
⁽¹⁾ Allowances include valuation adjustments for credit risk throughout the expected residual life in those financial instruments that have been acquired (mainly originating from the acquisition of Catalunya Banc, S.A.). As of June 30, 2026, December 31, 2025 and June 30, 2025 the remaining amount was €46m, €76m and €86m, respectively. | |||

LOANS AND ADVANCES TO CUSTOMERS (BILLIONS OF EUROS) |

+10.6% | (1) | ||

⁽¹⁾ At constant exchange rates: +9.0%.
CUSTOMER FUNDS (BILLIONS OF EUROS) |


+6.9% | (1) | ||

⁽¹⁾ At constant exchange rates: +5.5%.

CUSTOMER FUNDS (MILLIONS OF EUROS) | |||
30-06-26 | ∆ % | 31-12-25 | |
Deposits from customers | 532,981 | 6.1 | 502,501 |
Current accounts | 370,999 | 2.9 | 360,682 |
Time deposits | 136,581 | 7.6 | 126,938 |
Other deposits ⁽¹⁾ | 25,401 | 70.7 | 14,881 |
Other customer funds | 243,803 | 8.7 | 224,365 |
Mutual funds and investment companies and customer portfolios ⁽²⁾ | 198,947 | 8.6 | 183,183 |
Pension funds | 36,354 | 6.0 | 34,306 |
Other off-balance sheet funds | 8,502 | 23.6 | 6,876 |
Total customer funds | 776,785 | 6.9 | 726,866 |
⁽¹⁾ The variation in this line item is primarily due to the increase in reverse repos during the period. | |||
⁽²⁾ Includes the customer portfolios in Spain, Mexico, Peru and Colombia (preliminary data as of 30-06-2026). | |||
6 For the periods shown, there were no differences between fully loaded and phased-in ratios given that the impact associated with the transitional adjustments is nil.
7 Considering the latest official updates to the countercyclical capital buffer and the systemic risk buffer, applied on the basis of exposure as of March 31, 2026.
Translation of this report originally issued in Spanish. In the event of a discrepancy, the Spanish-language version prevails. | p.19 |
| January - June 2026 Report |
Capital and shareholders
Capital base
The BBVA Group's CET1 ratio6 stood at 12.90% as of June 30, 2026, which allows it to maintain a large management buffer over
the Group's CET1 requirement as of that date (8.98%7), and is also above the Group's target management range of 11.5% - 12.0%
of CET1.
Regarding the evolution during the second quarter, the Group’s CET1 increased by 7 basis points with respect to the March level
(12.83%).
In terms of the recurring evolution of the ratio, earnings generation in the second quarter was the main positive driver, contributing
75 basis points. This was partially offset by the dividend accrual and coupon payments on AT1 instruments (CoCos), which
reduced the ratio by -40 basis points, as well as by the organic growth in risk-weighted assets (RWA), which, at constant exchange
rates and net of risk transfer initiatives, consumed -41 basis points. This performance highlights the Group’s capacity to continue
allocating capital to profitable business growth.
The remaining impacts had, overall, a positive contribution of 13 basis points to the ratio. Within this item, the favorable effect
recorded in “Accumulated other comprehensive income” offset the negative impact recognized in the income statement from the
loss on the net monetary position of the financial statements of subsidiaries operating in hyperinflationary economies, together
with favorable effects from exchange rates and other market variables.

QUARTERLY EVOLUTION OF THE CET1 RATIO |

+7 bps | |||

(1) Includes, among others, FX, mark to market of Other financial assets designated at fair value through profit or loss, minority interests, and a positive impact in accumulated other comprehensive income equivalent to the loss on the net monetary position in hyperinflationary economies registered in results. |
The AT1 ratio stood at 1.53%, showing a variation of 17 basis points compared to March 31, 2026. This variation is mainly due to
the issuance, on May 8, of contingent convertible bonds (CoCos) amounting to USD 1 billion. This effect was minimally offset by
the organic growth in RWA and the foreign exchange effect.
8 Considering the latest official updates to the countercyclical capital buffer and the systemic risk buffer, applied on the basis of exposure as of March 31, 2026.
Translation of this report originally issued in Spanish. In the event of a discrepancy, the Spanish-language version prevails. | p.20 |
| January - June 2026 Report |
Meanwhile, the Tier 2 ratio reached 2.99%, experiencing a change of -12 basis points during the quarter, primarily impacted by the
organic growth of the RWA and to a lesser extent, the early redemption of a subordinated debt issuance by BBVA, S.A. amounting
to GBP 300 million.
As a consequence of the foregoing, the consolidated total capital ratio stood at 17.42% as of June 30, 2026, above the total capital
requirements.
Following the latest decision of the SREP (Supervisory Review and Evaluation Process), which came into force on January 1, 2026,
BBVA Group must maintain at consolidated level a total capital ratio of 13.14%8 and a CET1 capital ratio of 8.98%8, including a
Pillar 2 requirement at consolidated level of 1.62% (a minimum of 0.96% must be satisfied with CET1), of which 0.12% is
determined on the basis of the European Central Bank (ECB) prudential provisioning expectations, and must be satisfied by CET1.

CAPITAL RATIOS (PERCENTAGE) |


CAPITAL BASE (MILLIONS OF EUROS) | |||
30-06-26 ⁽¹⁾ | 31-03-26 | 31-12-25 | |
Common Equity Tier 1 (CET1) | 54,626 | 52,464 | 50,446 |
Tier 1 | 61,110 | 58,040 | 55,934 |
Tier 2 | 12,675 | 12,709 | 12,431 |
Total capital (Tier 1 + Tier 2) | 73,785 | 70,748 | 68,365 |
Risk-weighted assets | 423,497 | 408,854 | 397,241 |
CET1 ratio (%) | 12.90 | 12.83 | 12.70 |
Tier 1 ratio (%) | 14.43 | 14.20 | 14.08 |
Tier 2 ratio (%) | 2.99 | 3.11 | 3.13 |
Total capital ratio (%) | 17.42 | 17.30 | 17.21 |
⁽¹⁾ Preliminary data. | |||
As of June 30, 2026, the leverage ratio stood at 6.00%, which represents a decrease of -18 basis points compared to March 2026.

LEVERAGE RATIO | |||
30-06-26 ⁽¹⁾ | 31-03-26 | 31-12-25 | |
Exposure to Leverage Ratio (million euros) | 1,018,949 | 939,629 | 908,869 |
Leverage ratio (%) | 6.00 | 6.18 | 6.15 |
⁽¹⁾ Preliminary data. | |||
9 Calculated at subconsolidated level according to the resolution strategy MPE (“Multiple Point of Entry”) of the BBVA Group, established by the SRB ("Single
Resolution Board"). The resolution group is made up of Banco Bilbao Vizcaya Argentaria, S.A. and subsidiaries that belong to the same European resolution group. That
implies the ratios are calculated under the subconsolidated perimeter of the resolution group. Preliminary MREL ratios as of the date of publication.
10 The subordination requirement in RWA is 13.50%.
11 Considering the latest official updates to the countercyclical capital buffer and the systemic risk buffer, applied on the basis of exposure as of March 31, 2026.
12 The subordination requirement in leverage ratio is 5.56%.
Translation of this report originally issued in Spanish. In the event of a discrepancy, the Spanish-language version prevails. | p.21 |
| January - June 2026 Report |
With respect to the MREL (Minimum Requirement for own funds and Eligible Liabilities) ratios9 achieved as of June 30, 2026, these
were 29.96% and 9.75%, respectively for MREL in RWA and MREL in LR, reaching the subordinated ratios of both 26.83% and
8.73%, respectively. A summarizing table is shown below:

MREL | |||
30-06-26 ⁽¹⁾ | 31-03-26 | 31-12-25 | |
Total own funds and eligible liabilities (million euros) | 64,114 | 61,686 | 59,277 |
Total RWA of the resolution group (million euros) | 213,986 | 207,832 | 205,154 |
RWA ratio (%) | 29.96 | 29.68 | 28.89 |
Total exposure for the Leverage calculation (million euros) | 657,469 | 598,040 | 580,788 |
Leverage ratio (%) | 9.75 | 10.31 | 10.21 |
⁽¹⁾ Preliminary data. | |||
On April 14, 2026, the Group announced that it had received a communication from the Bank of Spain regarding its MREL
requirement, established by the Single Resolution Board (SRB). According to his communication, BBVA must maintain, as from
April 14, 2026, a new MREL requirement in RWA of 23.94%10, without taking into account the current combined capital buffer
requirement (CBR)11 of 3.72%. Additionally, BBVA must maintain, also as of April 14, 2026, a volume of own funds and eligible
liabilities in terms of total exposure for the calculation of the leverage ratio of 8.96% (the "MREL in LR")12.
Given the structure of the resolution group's own funds and eligible liabilities, as of June 30, 2026, the Group meets the
aforementioned requirements.
For more information on these issuances, see "Structural risks" section within the "Risk management" chapter.
Translation of this report originally issued in Spanish. In the event of a discrepancy, the Spanish-language version prevails. | p.22 |
| January - June 2026 Report |
Shareholder remuneration
Cash distributions
The Annual General Shareholders´ Meeting of BBVA held on March 20, 2026, approved, under item 1.3 of the Agenda, a cash
distribution against the 2025 results as a final dividend for the 2025 financial year, for an amount equal to €0.60 gross per
outstanding BBVA share entitled to participate in this distribution, which was paid on April 10, 2026. Thus, the total amount of cash
distributions for the 2025 financial year, taking into account that in November 2025 €0.32 gross per share was distributed, stood
at €0.92 gross per share.
Share buyback program in 2026
On December 19, 2025, and after receiving the required authorization from the ECB, by means of an Inside Information notice
(información privilegiada) BBVA announced that its Board of Directors, at its meeting held on December 18, 2025, had agreed to
carry out the execution of a framework share buyback program, all in accordance with the Regulations, which will be executed in
several tranches for a maximum monetary amount of €3,960 million with the purpose of reducing BBVA's share capital (the
"Framework Program"), without prejudice to the possibility of suspending or terminating the Framework Program early if
circumstances warrant.
First Tranche
As part of the communication of December 19, 2025, it was also announced that the Board of Directors agreed to execute a first
tranche of the Framework Program in compliance with the Regulations, for the purpose of reducing BBVA's share capital for a
maximum monetary amount of €1,500 million (the "First Tranche"). The execution was carried out externally by J.P. Morgan SE.
By means of an Other Relevant Information notice dated March 6, 2026, BBVA announced the completion of the execution of the
First Tranche of the Framework Program, having reached the maximum monetary amount of €1,500 million having acquired,
between December 22, 2025 and March 6, 2026, 74,963,302 own shares representing approximately 1.31% of BBVA's share
capital on that date.
On March 31, 2026, BBVA notified through an Other Relevant Information notice the partial execution of the share capital
reduction resolution adopted by the Annual General Shareholders’ Meeting of BBVA held on March 20, 2026, under item 5 of the
Agenda, through the reduction of BBVA’s share capital in a nominal amount of €36,732,017.98 and the consequent redemption,
charged to unrestricted reserves, of the 74,963,302 BBVA shares of €0.49 par value each acquired derivatively by BBVA in
execution of the First Tranche of the BBVA Framework Program and which were held as treasury shares.
Second Tranche
On March 20, 2026, BBVA announced by means of an Inside Information that its Board of Directors, at its meeting held on such
day, within the scope of the Framework Program, had agreed to execute a second tranche of treasury share buyback in
accordance with the Regulations for the purpose of reducing BBVA's share capital, for a maximum monetary amount of €1,000
million (the "Second Tranche"). The execution was carried out externally through Citigroup Global Markets Europe AG.
By means of an Other Relevant Information notice dated April 17, 2026, BBVA announced the completion of the execution of the
Second Tranche of the Framework Program, having reached the maximum monetary amount of €1,000 million. Between March
23 and April 17, 2026, a total of 52,800,888 own shares, representing approximately 0.94% of BBVA's share capital on that date
were acquired.
On June 24, 2026, BBVA communicated, through an Other Relevant Information notice, the partial execution of the share capital
reduction resolution adopted by the Annual General Shareholders’ Meeting of BBVA held on March 20, 2026, under item 5 of the
Agenda, through the reduction of BBVA’s share capital in a nominal amount of €25,872,435.12 and the consequent redemption,
Translation of this report originally issued in Spanish. In the event of a discrepancy, the Spanish-language version prevails. | p.23 |
| January - June 2026 Report |
charged to unrestricted reserves, of the 52,800,888 BBVA shares of €0.49 par value each acquired derivatively by BBVA in
execution of the Second Tranche of the BBVA Framework Program and which were held as treasury shares.
Third Tranche
On April 30, 2026, BBVA communicated by means of an Inside Information, that its Board of Directors, at its meeting held on April
29, 2026, had agreed to execute a third tranche of treasury share buyback within the Framework Program, in accordance with the
Regulations for the purpose of reducing BBVA's share capital, for a maximum monetary amount of €1,460 million. The execution
started on May 6, 2026, and was carried out externally through Citigroup Global Markets Europe AG. Between May 6 and July 24,
2026, Citigroup Global Markets Europe AG has acquired 63,358,915 BBVA shares within the scope of the Framework Program.

SHARE BUYBACK PROGRAMS CARRIED OUT IN 2025 AND 2026 | |||||
Start date | Completion date | Number of shares | % of share capital* | Disbursement (millions of euros) | |
Ordinary - only | 31-10-2025 | 10-12-2025 | 54,316,765 | 0.93 | 993 |
Extraordinary 1st Tranche | 22-12-2025 | 06-03-2026 | 74,963,302 | 1.31 | 1,500 |
Extraordinary 2nd Tranche | 23-03-2026 | 17-04-2026 | 52,800,888 | 0.94 | 1,000 |
Extraordinary 3rd Tranche | 06-05-2026 | ||||
Total | 182,080,955 | 3,493 | |||
*As of the date of the program closure. | |||||
New Framework Program in 2026
Additionally to the execution of the third tranche of the current Framework Program, on July 30, 2026, and after receiving the
required authorization from the ECB, by means of an Inside Information notice (información privilegiada) BBVA announced that its
Board of Directors had agreed to carry out the execution of a new framework share buyback program, all in accordance with the
Regulations, for a maximum monetary amount of €2,000 million, which will be executed in several tranches, with the purpose of
reducing BBVA's share capital (the "New Framework Program"), without prejudice to the possibility of suspending or terminating
the New Framework Program early if circumstances warrant.
First Tranche
Likewise, it was also announced that the Board of Directors agreed to execute a first tranche of the New Framework Program in
compliance with the Regulations, for the purpose of reducing BBVA's share capital for a maximum monetary amount of €1,000
million, with a maximum number of shares to be acquire of 483,221,729 own shares, which will start on August 5, 2026 and will
finish not earlier than September 14, 2026 and not later than October 9, 2026, and in any event, when the maximum monetary
amount is reached or the maximum number of shares is acquired within that period, and will be carried out externally.
Translation of this report originally issued in Spanish. In the event of a discrepancy, the Spanish-language version prevails. | p.24 |
| January - June 2026 Report |
As of June 30, 2026, BBVA’s share capital amounted to € 2,734,790,209.9 divided into 5,581,204,510 shares.

SHAREHOLDER STRUCTURE (30-06-26) | |||||
Shareholders | Shares outstanding | ||||
Number of shares | Number | % | Number | % | |
Less than 500 | 296,757 | 45.3 | 52,389,073 | 0.9 | |
500 to 5,000 | 283,888 | 43.3 | 493,985,496 | 8.9 | |
5,001 to 10,000 | 40,479 | 6.2 | 283,374,211 | 5.1 | |
10,001 to 50,000 | 31,157 | 4.8 | 596,735,558 | 10.7 | |
50,001 to 100,000 | 2,201 | 0.3 | 150,028,595 | 2.7 | |
100,001 to 500,000 | 980 | 0.1 | 177,405,435 | 3.2 | |
More than 500,001 | 244 | 0.04 | 3,827,286,142 | 68.6 | |
Total | 655,706 | 100 | 5,581,204,510 | 100 | |
Note: in the case of shares held by investors operating through a custodian entity located outside Spain, only the custodian is counted as a shareholder, as it is the entity registered in the corresponding book-entry register. Therefore, the reported number of shareholders does not include these underlying holders. | |||||
Ratings
During the first half of 2026, BBVA's rating continued to show its strength, supported by the solidity of its fundamentals. Following
the upgrades recorded in the final stretch of 2025 by the three major agencies, BBVA's ratings remain at high levels with the A
category. In this context, it is worth noting that the rating agency DBRS revised its outlook to positive from stable on February
2026, affirming the rating at A (high), in recognition of the solidity and resilience of the Group's results. More recently, in May
2026, Fitch Ratings upgraded BBVA's long-term issuer credit rating by one notch from A- to A. This improvement is due to a
methodological change whereby the agency now uses senior preferred debt, instead of senior non-preferred debt, as the reference
for this rating. For their part, S&P and Moody's have maintained their respective ratings and outlooks unchanged during the first
half of 2026, thus consolidating the perception of BBVA's stability and financial strength, supported by its high profitability and the
resilience of its asset quality. The following table shows the credit ratings and outlooks assigned by the agencies:

RATINGS | |||
Rating agency | Long term ⁽¹⁾ | Short term | Outlook |
DBRS | A (high) | R-1 (middle) | Positive |
Fitch | A | F-1 | Stable |
Moody's | A2 | P-1 | Stable |
Standard & Poor's | A+ | A-1 | Stable |
⁽¹⁾ Ratings assigned to long term senior preferred debt. Additionally, Moody’s, Fitch and DBRS assign A1, A+ and A (high) rating, respectively, to BBVA’s long term deposits. | |||
Translation of this report originally issued in Spanish. In the event of a discrepancy, the Spanish-language version prevails. | p.25 |
| January - June 2026 Report |
Risk management
At a global level, although the restoration of trade flows in the Strait of Hormuz and the correction of energy prices have improved
the balance of risks, the persistence of geopolitical tensions keeps uncertainty high and constitutes a relevant risk factor. The
evolution of these international tensions adds complexity to the global macroeconomic environment, potentially generating
additional pressures on inflation, financial conditions, and economic activity. Therefore, the macroeconomic outlook of the
geographical areas in which the Group operates could be influenced by the duration and intensity of these factors, with
differentiated impacts by country.
In Spain, a moderation of growth is expected compared to the previous year, in a context where the evolution of inflation and
interest rates will continue to be relevant, with a sound level of solvency and liquidity in the system. In Mexico, activity has been
weaker than expected, which has led to a downward revision of the growth forecast, in a context in which inflation and the
monetary policy path will continue to be determining factors, with a banking system that continues to show credit growth.
Meanwhile, in Turkey, macroeconomic developments remain conditioned by inflation, the management of monetary and fiscal
policies, and the volatility of the environment. Lastly, in South America, a heterogeneous performance across countries is
expected, in a context of differing trends in growth, inflation, and interest rates.
Within this framework, the Group continuously monitors the evolution of the macroeconomic and geopolitical environment, as well
as its potential impact on the evolution of credit risk, in accordance with the applicable accounting and prudential regulations.
Credit risk metrics
The Group periodically reviews its individual estimates and its models for the collective estimate of expected losses as well as the
effect of macroeconomic scenarios on them. Although these updates incorporate the best information available at any given time,
they may not fully reflect the most recent developments in the economic environment, especially in contexts of high uncertainty
and volatility or very recent events still under development.
For the estimation of expected losses, the models include individual and collective estimates, taking into account the
macroeconomic forecasts as established in IFRS 9. Thus, the estimate at the end of the quarter includes the effect on expected
losses of updating macroeconomic forecasts. The Group may supplement the expected losses to account for the effects that may
not be included in the calculations referred to above, either by considering additional risk factors, or by the incorporation of
sectorial particularities or particularities that may affect a set of operations or borrowers, following a formal internal approval
process established for this purpose.
As of June 30, 2026 and as of December 31, 2025, the Group had not recorded any relevant adjustments to the expected loss
estimation models.
Translation of this report originally issued in Spanish. In the event of a discrepancy, the Spanish-language version prevails. | p.26 |
| January - June 2026 Report |
BBVA Group's credit risk indicators
The following chart shows the evolution of the Group's risk metrics from the first half of 2025:
NPL AND NPL COVERAGE RATIOS AND COST OF RISK (PERCENTAGE) |


The evolution of the Group’s main credit risk indicators is summarized below:
–In terms of asset quality, the NPL ratio stood at 2.62% as of June 30, 2026, which is an improvement of 3 basis points
compared to the previous quarter, and an improvement of 28 basis points when compared to the end of June 2025, both
comparisons driven by the performance of lending, which showed an increase in all business areas.
NON-PERFORMING LOANS (MILLIONS OF EUROS) | PROVISIONS (MILLIONS OF EUROS) |


+9.3% | +14.1% | ||||||||
+5.4% | +3.4% | ||||||||


Translation of this report originally issued in Spanish. In the event of a discrepancy, the Spanish-language version prevails. | p.27 |
| January - June 2026 Report |
–Credit risk increased by 6.4% in the second quarter of the year (+5.5% at constant exchange rates) with generalized
growth in all business areas. In the last twelve months, the growth has exceeded double digits, standing at 20.8%
(+18.8% at constant exchange rates), showing greater dynamism than in the same period of 2025.
–The balance of non-performing loans increased by 5.4% in the second quarter of 2026 at the Group level, and of 9.3% in
year-on year terms (+7.3% at constant exchange rates). At constant exchange rates, the quarterly variation stood at
4.8%, focused on Mexico, Rest of Business and Turkey, as a result of the increase in non-performing loans in the retail
and wholesale portfolio.
–The NPL coverage ratio ended June 2026 at 85%, stable compared to the end of the previous year, with a decrease of 157
basis points compared to the previous quarter (and growth of 356 basis points compared to the end of June 2025).
–The cumulative cost of risk as of June 30, 2026 stood at 1.43%, which represents an increase of 4 basis points compared
to the cost of risk at the end of 2025 and 11 basis points below the end of the previous quarter.

CREDIT RISK ⁽¹⁾ (MILLIONS OF EUROS) | |||||
30-06-26 ⁽²⁾ | 31-03-26 ⁽²⁾ | 31-12-25 | 30-09-25 | 30-06-25 | |
Credit risk | 608,755 | 572,273 | 547,184 | 516,896 | 503,733 |
Stage 1 | 555,789 | 521,734 | 498,750 | 470,097 | 456,385 |
Stage 2 | 36,990 | 35,375 | 33,597 | 32,464 | 32,727 |
Stage 3 (non-performing loans) | 15,976 | 15,163 | 14,837 | 14,335 | 14,621 |
Provisions | 13,527 | 13,077 | 12,604 | 12,031 | 11,859 |
Stage 1 | 2,672 | 2,578 | 2,467 | 2,450 | 2,423 |
Stage 2 | 2,109 | 2,155 | 2,005 | 1,938 | 1,864 |
Stage 3 (non-performing loans) | 8,747 | 8,343 | 8,133 | 7,643 | 7,572 |
NPL ratio (%) | 2.6 | 2.6 | 2.7 | 2.8 | 2.9 |
NPL coverage ratio (%) ⁽³⁾ | 85 | 86 | 85 | 84 | 81 |
⁽¹⁾ Includes gross loans and advances to customers plus guarantees given. | |||||
⁽²⁾ Figures without considering the classification of non-current assets held for sale (NCA&L) reached from the agreement to sell the Romanian subsidiary of Garanti BBVA. | |||||
⁽³⁾ The NPL coverage ratio includes the valuation adjustments for credit risk throughout the expected residual life in those financial instruments that have been acquired (mainly originating from the acquisition of Catalunya Banc, S.A.). If these valuation corrections had not been taken into account, the NPL coverage ratio would have stood at 84% as of June 30, 2026. | |||||

NON-PERFORMING LOANS EVOLUTION (MILLIONS OF EUROS) | |||||
2Q26 ⁽¹⁾ ⁽²⁾ | 1Q26⁽²⁾ | 4Q25 | 3Q25 | 2Q25 | |
Beginning balance | 15,163 | 14,837 | 14,335 | 14,621 | 14,296 |
Entries | 4,094 | 3,359 | 3,450 | 3,600 | 3,219 |
Recoveries | (2,000) | (1,587) | (1,722) | (1,754) | (1,677) |
Net variation | 2,094 | 1,771 | 1,729 | 1,846 | 1,542 |
Write-offs | (1,266) | (1,244) | (1,182) | (1,065) | (957) |
Exchange rate differences and other | (15) | (201) | (45) | (1,067) | (261) |
Period-end balance | 15,976 | 15,163 | 14,837 | 14,335 | 14,621 |
Memorandum item: | |||||
Non-performing loans | 15,521 | 14,709 | 14,346 | 13,813 | 14,131 |
Non performing guarantees given | 455 | 455 | 491 | 522 | 490 |
⁽¹⁾ Preliminary data. | |||||
⁽²⁾ Figures without considering the classification of non-current assets held for sale (NCA&L) reached from the agreement to sell the Romanian subsidiary of Garanti BBVA. | |||||
Translation of this report originally issued in Spanish. In the event of a discrepancy, the Spanish-language version prevails. | p.28 |
| January - June 2026 Report |
Structural risks
Liquidity and funding
Liquidity and funding management at BBVA is aimed at driving sustained growth of the banking business, through access to a wide
variety of alternative sources of funding and assuring optimal term and cost conditions. BBVA's business model, risk appetite
framework and funding strategy are designed to reach a solid funding structure based on stable customer deposits, mainly retail
(granular). As a result of this model, deposits have a high degree of insurance in each geographical area, close to 50% in Spain and
Mexico. It is important to note that, given the nature of BBVA's business, lending is mainly financed through stable customer
funds.
One of the key elements in the BBVA Group's liquidity and funding management is the maintenance of large high-quality liquidity
buffers in all geographical areas. Thus, the Group has maintained during the last 12 months an average volume of high-quality
liquid assets (HQLA) of €129.8 billion, of which 98% corresponded to maximum quality assets (level 1 in the liquidity coverage
ratio, LCR).
Due to its subsidiary-based management model, BBVA is one of the few major European banks that follows a Multiple Point of
Entry (MPE) resolution strategy: the parent company sets the liquidity policies, but the subsidiaries are self-sufficient and
responsible for managing their own liquidity and funding (taking deposits or accessing the market with their own rating). This
strategy limits the spread of a liquidity crisis among the Group's different areas and ensures the adequate transmission of the cost
of liquidity and financing to the price formation process.
The BBVA Group maintains a solid liquidity position in every geographical area in which it operates, with ratios well above the
minimum required:
–The LCR requires banks to maintain a volume of high-quality liquid assets sufficient to withstand liquidity stress for 30
days. BBVA Group's consolidated LCR remained comfortably above 100% during the first half of 2026 and stood at 145%
as of June 30, 2026. It should be noted that, given the MPE nature of BBVA, this ratio limits the numerator of the LCR for
subsidiaries of BBVA S.A. to 100% of their net outflows, therefore, the resulting ratio is below that of the individual units
(the LCR of the main components was 180% in BBVA, S.A., 149% in Mexico and 156% in Turkey). Without considering
this restriction, the Group's LCR ratio was 174%.
–The net stable funding ratio (NSFR) requires banks to maintain a stable funding profile in relation to the composition of
their assets and off-balance sheet activities. The BBVA Group's NSFR ratio stood at 125% as of June 30, 2026.
The breakdown of these ratios in the main geographical areas in which the Group operates is shown below:

LCR AND NSFR RATIOS (PERCENTAGE. 30-06-26) | ||||
BBVA, S.A. | Mexico | Turkey ⁽¹⁾ | South America | |
LCR | 180 | 149 | 156 | All countries >100 |
NSFR | 116 | 129 | 141 | All countries >100 |
⁽¹⁾ Garanti Bank only. | ||||
During the first half of 2026, the conflict in Iran has created an environment of greater uncertainty and volatility in the markets,
with central banks maintaining a cautious stance regarding its potential implications.
In this context, BBVA maintains a solid liquidity position across all its geographic areas, with no signs of stress. As previously
shown, the main liquidity indicators (LCR, NSFR, and internal metrics) remain at comfortable levels, well above regulatory
thresholds. Furthermore, the active and prudent balance sheet management, together with the diversification of funding sources,
strengthens the Group's ability to face different scenarios without compromising its liquidity position.
Translation of this report originally issued in Spanish. In the event of a discrepancy, the Spanish-language version prevails. | p.29 |
| January - June 2026 Report |
Apart from the above, the most relevant aspects related to the main geographical areas are the following:
–BBVA, S.A. has maintained a strong position with a large high-quality liquidity buffer, maintaining at all times the
regulatory liquidity metrics well above the set minimums. During the first half of 2026, significant growth has been
observed in lending activity, driven primarily by the wholesale segment, in an environment of moderate growth in
deposits. This development has not put pressure on the liquidity position.
–BBVA Mexico continues to show a solid liquidity situation, even though the credit gap has widened in the first half of the
year due to the strength of lending, especially in local currency.
–In Turkey, Garanti BBVA maintained an adequate liquidity situation in the first half of 2026. The lending gap has improved
favored by the growth of deposits in the Turkish lira. On the other hand, a deterioration has been observed in the foreign
currency credit gap due to the outflows of deposited balances.
–In South America, the liquidity situation has also remained adequate throughout the region in the first half of 2026. BBVA
Argentina maintains an adequate liquidity position. In the first half, the credit gap improved in local currency thanks to the
growth in deposits in both the retail and wholesale segments. In US dollars, deposit growth has been below credit growth,
which occurred mostly throughout the first quarter. In BBVA Colombia, the liquidity situation remains stable with a
narrowing credit gap, and deposit growth outpaced lending. In BBVA Peru, the liquidity position remains solid, with an
improved credit gap in the half-year thanks mainly to the good performance of retail deposits.
Translation of this report originally issued in Spanish. In the event of a discrepancy, the Spanish-language version prevails. | p.30 |
| January - June 2026 Report |
The main wholesale financing transactions carried out by the BBVA Group during the first half of 2026 are listed below.

Issuer | Type of issue | Date of issue | Nominal (millions) | Currency | Equivalent in euros ⁽¹⁾ | Coupon | Maturity Date | |
BBVA, S.A. | Senior non- preferred | Jan-26 | 1,250 | EUR | 1,250 | 3.750% | Jan-36 | |
Senior non- preferred | Jan-26 | 750 | EUR | 750 | Euribor 3m+55 bps | Jan-29 | ||
Senior non- preferred | Mar-26 | 1,000 | USD | 878 | 4.150% | Mar-29 | ||
Senior non- preferred | Mar-26 | 1,000 | USD | 878 | 5.127% | Mar-36 | ||
Senior non- preferred | Mar-26 | 500 | USD | 439 | SOFR+88 bps | Mar-29 | ||
AT1 ⁽²⁾ | May-26 | 1,000 | USD | 878 | 7.125% | Perpetual | ||
Senior non- preferred | May-26 | 1,250 | USD | 1,097 | 4.968% | May-31 | ||
Covered bond* | Jun-26 | 1,000 | EUR | 1,000 | 3.125% | Jun-33 | ||
Covered bond* | Jun-26 | 1,250 | EUR | 1,250 | 2.875% | Jun-29 | ||
 | Senior non- preferred | Jun-26 | 1,250 | EUR | 1,250 | 3.375% | Jun-31 | |
BBVA Mexico | Senior | Feb-26 | 8,876 | MXN | 446 | 9.260% | Jan-36 | |
Senior | Feb-26 | 6,124 | MXN | 308 | TIIE+32 bps | Jul-29 | ||
Senior USD | Feb-26 | 16 | USD | 14 | 4.190% | Sep-28 | ||
Senior USD | Jun-26 | 1,000 | USD | 878 | 5.400% | Jun-31 | ||
Garanti BBVA | Senior Debt MTNs (Medium term notes) | Several | 1,382 | EUR | 1,382 | Several | Several | |
Syndicated loan | Jun-26 | 33 | USD | 29 | SOFR+125 bps | Jun-27 | ||
Syndicated loan | Jun-26 | 24 | EUR | 24 | Euribor+110 bps | Jun-27 | ||
Syndicated loan | Jun-26 | 105 | USD | 92 | SOFR+175 bps | Jun-28 | ||
Syndicated loan | Jun-26 | 40 | EUR | 40 | Euribor+160 bps | Jun-28 | ||
Syndicated loan | Jun-26 | 88 | USD | 77 | SOFR+200 bps | Jun-29 | ||
BBVA Argentina | Senior Debt | Feb-26 | 37 | USD | 32 | 5.000% | Aug-27 | |
Senior Debt | Mar-26 | 45,457 | ARS | 27 | TAMAR +350 bps | Mar-27 | ||
Senior Debt | May-26 | 48 | USD | 42 | 5.000% | May-28 | ||
Senior Debt | May-26 | 25 | USD | 22 | 3.250% | May-27 | ||
Senior Debt | May-26 | 83,914 | ARS | 50 | TAMAR +325 bps | May-27 | ||
Senior Debt | Jun-26 | 161,298 | ARS | 96 | TAMAR +325 bps | Jun-27 | ||
BBVA Peru | Tier 2 ⁽³⁾ | Mar-26 | 300 | PEN | 77 | 6.750% | Mar-38 |
(1) Equivalent in euros at the closing exchange rate of the period.
(2) First Reset Date in May 2033.
(3) First Reset Date in March 2033.
*On June 16, BBVA, S.A. carried out a dual-tranche issue of mortgage-covered bonds for a total of €2.25 billion. Of the first
tranche, with a maturity of three years, it has placed €1.25 billion, at a price of mid-swap +14 basis points. Of the second tranche,
with a maturity of seven years, it has placed €1 billion, at a price of mid-swap +27 basis points.
13 This sensitivity does not include the cost of capital hedges, which are currently estimated at 1 basis point per quarter for Mexican peso and 1 basis points per quarter
for Turkish lira.
Translation of this report originally issued in Spanish. In the event of a discrepancy, the Spanish-language version prevails. | p.31 |
| January - June 2026 Report |
During the first half of 2026, BBVA, S.A. carried out the early redemption of two issuances. First, on January 15, 2026, it carried out
the early redemption of a green AT1 issuance made on July 15, 2020, for a combined nominal amount of €1 billion, a decision that
was communicated to the market on December 17, 2025. Likewise, on March 24, 2026, BBVA, S.A. carried out the early
redemption of a senior preferred bond issuance originally issued on March 24, 2021, for a total aggregate nominal amount of €1
billion, a decision that was disclosed to the market on February 11, 2026. In addition, on July 15, 2026, the early redemption of a
subordinated bond issuance was carried out for a combined nominal amount of 300 million pounds sterling, a decision that had
been communicated to the market on June 9.
Foreign exchange
Foreign exchange risk management aims to reduce both the sensitivity of the capital ratios to currency movements, as well as the
variability of profit attributed to currency movements.
During the second quarter of 2026, the Group's main currencies showed an uneven performance against the euro. Due to its
relevance for the Group, it should be noted the performance of the Mexican peso, which appreciated by 4.1% against the euro. In
the case of the US dollar, the currency registered a moderate appreciation of 0.9% against the euro. For its part, the Turkish lira
and the Argentine peso depreciated by 3.8% and 4.9% against the euro, respectively (although, in real terms, both currencies
registered an appreciation against the euro), while the currencies of the rest of the main countries in South America closed the
half-year with an appreciation against the euro, of 3.5% in the case of the Peruvian sol, 1.9% in the case of the Chilean peso and
7.5% in the case of the Colombian peso.

EXCHANGE RATES | |||||||
Period-end exchange rates | Average exchange rates | ||||||
Currency/Euro | ∆ % of the currency against | ∆ % of the currency against | ∆ % of the currency against | Currency/Euro | ∆ % of the currency against | ||
30-06-26 | 31-03-26 | 30-06-25 | 31-12-25 | 6M26 | 6M25 | ||
U.S. dollar | 1.1394 | 0.9 | 2.9 | 3.1 | 1.1665 | (6.3) | |
Mexican peso | 19.9030 | 4.1 | 11.0 | 6.1 | 20.3788 | 7.0 | |
Turkish lira ⁽¹⁾ | 53.1642 | (3.8) | (12.4) | (5.0) | — | — | |
Peruvian sol | 3.8876 | 3.5 | 6.5 | 1.6 | 3.9733 | 1.1 | |
Argentine peso ⁽¹⁾ | 1,687.06 | (4.9) | (17.3) | 1.6 | — | — | |
Chilean peso | 1,050.91 | 1.9 | 4.4 | 1.4 | 1,041.65 | 0.2 | |
Colombian peso | 3,923.63 | 7.5 | 21.6 | 12.5 | 4,262.51 | 7.6 | |
⁽¹⁾ According to IAS 21 "The effects of changes in foreign exchange rates", the year-end exchange rate is used for the conversion of the Turkey and Argentina income statement. | |||||||
In relation to the hedging of capital ratios, BBVA aims to hedge between 50% and 70% of the capital excess of the currencies of its
main subsidiaries. The sensitivity of the Group's CET1 ratio to 10% depreciations in major currencies is estimated at: +14 basis
points for the U.S. dollar, -15 basis points for the Mexican peso and -3 basis points for the Turkish lira13. With regard to the hedging
of results, BBVA hedges between 40% and 50% of the aggregate net attributable profit it expects to generate in the next 12
months. For each currency, the final amount hedged depends, among other factors, on its expected future evolution, the costs and
the relevance of the income related to the Group's results as a whole.
14 Structural portfolio managed by the Asset and Liability Committee, designed to mitigate the sensitivity of the balance sheet to interest rate movements.
Translation of this report originally issued in Spanish. In the event of a discrepancy, the Spanish-language version prevails. | p.32 |
| January - June 2026 Report |
Interest rate
Interest rate risk management seeks to limit the impact that BBVA may suffer, both in terms of results (short-term) and economic
value (long-term), from adverse movements in the interest rate curves in the various currencies in which the Group operates.
BBVA carries out this work through an internal procedure, pursuant to the guidelines established by the European Banking
Authority (EBA), with the aim of analyzing the potential impact that could derive from a range of scenarios on the Group's different
balance sheets.
Risk measurement is based on assumptions intended to realistically mimic the behavior of the balance sheet. The assumptions
regarding the behavior of accounts with no explicit maturity and prepayment estimates are especially relevant. These assumptions
are reviewed and adapted, at least once a year according to the evolution in observed behaviors.
At the aggregate level, BBVA continues to maintain a moderate risk profile in line with the target set in the changing interest rate
cycle environment maintaining positive sensitivity to interest rate rises in net interest income.
The first half of 2026 has been marked by the conflict in Iran and the news flow regarding the potential signing of the peace
agreement. This has led to high volatility in the yield curves as well as in the expectations of the decisions that central banks could
make to fight the increase in inflation. In the first six months of the year, there have been spikes in yields in the interest rate curves
in the United States, Europe and Turkey, especially in the short end in the United States and Europe. In Mexico, on the other hand,
the curves fell, as in Argentina, Colombia and Peru, the latter two positively impacted by the outcome of their respective electoral
processes. In this respect, the valuation of ALCO14 portfolios has shown a mixed performance in the first half of 2026.
By geographical areas:
–Spain has a balance sheet characterized by a lending portfolio with a high proportion of variable-rate loans (mortgages
and corporate lending) and liabilities composed mainly by customer demand deposits. The ALCO portfolio acts as a
management lever and hedge for the balance sheet, mitigating its sensitivity to interest rate fluctuations. The exposure of
the net interest income to movements in interest rates remains limited. In June 2026, the ECB carried out its first interest
rate hike in three years, with an increase of 25 basis points. Thus, the benchmark interest rate in the euro area stood at
2.25% at the end of June 2026, the rate on the deposit facility at 2.40% and the rate on the marginal lending facility at
2.65%.
–Mexico continues to show a balance between fixed and variable interest rates balances, which results in a limited
sensitivity to interest rates fluctuations. Among the assets that are most sensitive to interest rate changes, the
commercial portfolio stands out, while consumer and mortgage portfolios are mostly at a fixed rate. With regard to
customer funds, the high proportion of non-interest-bearing deposits, which are insensitive to interest rate movements,
should be highlighted. The ALCO portfolio is invested primarily in fixed-rate sovereign bonds with limited durations. The
monetary policy rate stood at 6.50% at the end of June 2026, 50 basis points below the year-end level for 2025.
–In Turkey, the sensitivity of net interest income to rates remains limited in both local and foreign currencies, thanks to the
bank's management, with a low repricing gap between loans and deposits. The Central Bank of the Republic of Turkey
(CBRT) continued its monetary easing process at the beginning of the year, supported by improved inflation, setting the
monetary policy rate at 37.0% in January 2026 (a decrease of 100 basis points since the end of December 2025).
However, the outbreak of the conflict in Iran led the institution to raise the effective cost of financing toward the upper
limit of its corridor (40%) in response to geopolitical tensions and their inflationary impact, a level at which it remains at
the close of June.
Translation of this report originally issued in Spanish. In the event of a discrepancy, the Spanish-language version prevails. | p.33 |
| January - June 2026 Report |
–In South America, the sensitivity of net interest income continues to be limited, since most of the countries in the area
have a fixed/variable composition stable between assets and liabilities. In addition, in balance sheets with several
currencies, the interest rate risk is managed for each of the currencies, showing a very low level of exposure. Regarding
benchmark interest rates, in Argentina, the central bank abandoned the official interest rate as a monetary anchor and
began to regulate the monetary base using other tools such as setting reserve requirements or intervening in the foreign
exchange market for its management. In Colombia, the reference rate stood at 12% at the end of June 2026, 275 basis
points above the end of 2025, with an increase of 75 basis points in the second quarter of 2026. In Peru, the official
monetary policy rate closed June 2026 at 4.25%, unchanged with respect to the end of the previous year.

INTEREST RATES (PERCENTAGE) | |||||
30-06-26 | 31-03-26 | 31-12-25 | 30-09-25 | 30-06-25 | |
Official ECB rate ⁽¹⁾ | 2.40 | 2.00 | 2.00 | 2.00 | 2.00 |
Euribor 3 months ⁽²⁾ | 2.34 | 2.11 | 2.05 | 2.03 | 1.98 |
Euribor 1 year ⁽²⁾ | 2.80 | 2.57 | 2.27 | 2.17 | 2.08 |
USA Federal rates | 3.75 | 3.75 | 3.75 | 4.25 | 4.50 |
Banxico official rate (Mexico) | 6.50 | 6.75 | 7.00 | 7.50 | 8.00 |
CBRT (Turkey) | 37.00 | 37.00 | 38.00 | 40.50 | 46.00 |
⁽¹⁾ Deposit facility. | |||||
⁽²⁾ Calculated as the month average. | |||||
Translation of this report originally issued in Spanish. In the event of a discrepancy, the Spanish-language version prevails. | p.34 |
| January - June 2026 Report |
Business areas
This section presents the most relevant aspects of the Group's different business areas. Specifically, for each one of them, it
shows a summary of the income statements and balance sheets, the business activity figures and the most significant ratios.
The structure of the business areas reported by the BBVA Group on June 30, 2026 is the same as the one presented at the end of
2025.
The composition of BBVA Group's business areas is summarized below:
–Spain mainly includes the banking, insurance and asset management activities that the Group carries out in this country.
–Mexico includes banking, insurance and asset management activities in this country, as well as the activity that BBVA
Mexico carries out through its Houston agency.
–Turkey reports the activity of the group Garanti BBVA that is mainly carried out in this country and, to a lesser extent, in
Romania and the Netherlands.
–South America includes banking, financial, insurance and asset management activities conducted, mainly, in Argentina,
Chile, Colombia, Peru, Uruguay, Venezuela and Brazil.
–Rest of Business mainly incorporates the wholesale activity carried out in Europe (excluding Spain), the United States,
BBVA’s branches in Asia, as well as the digital banks of the Group in Italy and Germany.
The Corporate Center includes the centralized functions of the Group, including: the costs of the head offices with a corporate
function for the consolidated BBVA Group; structural exchange rate positions management; certain portfolios, such as financial
and industrial holdings; stakes in Funds & Investment Vehicles in tech companies; certain tax assets and liabilities; funds related to
commitments to employees; goodwill and other intangible assets as well as the funding of such portfolios and assets. Finally, in the
description of this aggregate, it is worth mentioning that the Corporate Center's tax expense includes for each interim period the
difference between the effective tax rate in the period of each business area and the expected tax rate of the Group for the year as
a whole.
In addition to these geographical breakdowns, supplementary pro forma information is provided for the wholesale business,
Corporate & Investment Banking (CIB), carried out by BBVA in the countries where it operates. This business is relevant to have a
broader understanding of the Group's activity and results due to the important features of the type of customers served, products
offered and risks assumed, even if this is a pro forma information that does not include the wholesale business of the Group in
Venezuela nor the application of the hyperinflation accounting.
To prepare the information by business areas, which is presented under management criteria based on the financial information
used in the preparation of the financial statements, in general, the lowest level units and/or companies that make up the Group are
taken and assigned to the different areas according to the main region or company group in which they carry out their activity. In
relation to the information related to the business areas, in the first quarter of 2026 the Group carried out the reassignment of
certain activities. Similarly, mainly as a result of an internal resegmentation process within the countries, certain commercial
customers, due to their needs and profile, are managed in CIB in 2026. Therefore, in order to make those year-on-year
comparisons homogeneous, the figures for the 2025 financial year have been restated, which has not affected the consolidated
financial information of the Group.
Regarding the shareholders' funds allocation in the business areas, a capital allocation system based on the consumed regulatory
capital is used.
Translation of this report originally issued in Spanish. In the event of a discrepancy, the Spanish-language version prevails. | p.35 |
| January - June 2026 Report |
Finally, it should be noted that, as usual, in the case of the different business areas of Mexico, Turkey, South America and Rest of
Business, and, additionally, CIB, in addition to the year-on-year variations applying current exchange rates, the variations at
constant exchange rates are also disclosed.

GROSS INCOME ⁽¹⁾, OPERATING INCOME ⁽¹⁾ AND NET ATTRIBUTABLE PROFIT ⁽¹⁾ BREAKDOWN (PERCENTAGE. 6M26) | |||||||
Gross income | Operating income | Net attributable profit | ||


⁽¹⁾ Excludes the Corporate Center.

MAIN INCOME STATEMENT LINE ITEMS BY BUSINESS AREA (MILLIONS OF EUROS) | ||||||||
Business areas | ||||||||
BBVA Group | Spain | Mexico | Turkey | South America | Rest of Business | ∑ Business areas | Corporate Center | |
6M26 | ||||||||
Net interest income | 15,164 | 3,346 | 6,409 | 2,152 | 2,952 | 507 | 15,366 | (202) |
Gross income | 21,159 | 5,147 | 8,565 | 3,372 | 3,308 | 1,197 | 21,589 | (430) |
Operating income | 13,159 | 3,417 | 5,931 | 2,004 | 1,936 | 699 | 13,988 | (829) |
Profit (loss) before tax | 9,581 | 3,080 | 4,195 | 1,288 | 1,189 | 652 | 10,403 | (822) |
Net attributable profit (loss) | 6,051 | 2,172 | 2,979 | 532 | 556 | 508 | 6,748 | (696) |
6M25 | ||||||||
Net interest income | 12,607 | 3,215 | 5,511 | 1,307 | 2,387 | 369 | 12,789 | (182) |
Gross income | 18,034 | 4,990 | 7,349 | 2,409 | 2,719 | 827 | 18,294 | (260) |
Operating income | 11,247 | 3,422 | 5,093 | 1,329 | 1,515 | 448 | 11,807 | (560) |
Profit (loss) before tax | 8,424 | 3,080 | 3,573 | 932 | 970 | 410 | 8,965 | (541) |
Net attributable profit (loss) | 5,447 | 2,124 | 2,571 | 412 | 417 | 314 | 5,837 | (390) |
General note: 2025 balances have been revised due to the reorganization of certain activities effective January 2026. These changes do not affect the Group’s consolidated financial statements. | ||||||||
Translation of this report originally issued in Spanish. In the event of a discrepancy, the Spanish-language version prevails. | p.36 |
| January - June 2026 Report |

MAIN BALANCE-SHEET ITEMS AND RISK-WEIGHTED ASSETS BY BUSINESS AREA (MILLIONS OF EUROS) | ||||||||||
Business areas | ||||||||||
BBVA Group | Spain | Mexico | Turkey | South America | Rest of Business | ∑ Business areas | Corporate Center ⁽¹⁾ | Deletions | NCA&L ⁽²⁾ | |
30-06-26 | ||||||||||
Loans and advances to customers | 509,424 | 201,279 | 108,468 | 59,446 | 57,663 | 86,353 | 513,209 | 672 | (1,711) | (2,745) |
Deposits from customers | 532,981 | 260,326 | 105,290 | 68,614 | 60,780 | 41,027 | 536,037 | 2,037 | (2,126) | (2,967) |
Off-balance sheet funds | 243,803 | 126,530 | 78,957 | 27,669 | 9,864 | 783 | 243,803 | — | — | — |
Total assets/ liabilities and equity | 965,426 | 525,713 | 202,938 | 98,885 | 86,471 | 118,016 | 1,032,023 | 29,109 | (95,706) | — |
RWA | 423,497 | 120,207 | 87,755 | 77,402 | 62,487 | 54,505 | 402,356 | 21,142 | — | — |
31-12-25 | ||||||||||
Loans and advances to customers | 460,401 | 192,959 | 97,259 | 53,745 | 51,235 | 66,418 | 461,618 | 361 | (1,578) | — |
Deposits from customers | 502,501 | 251,430 | 93,855 | 62,984 | 53,375 | 40,932 | 502,577 | 2,001 | (2,077) | — |
Off-balance sheet funds | 224,365 | 119,535 | 69,533 | 26,290 | 8,271 | 736 | 224,365 | — | — | — |
Total assets/ liabilities and equity | 859,576 | 458,090 | 182,654 | 90,702 | 76,624 | 88,354 | 896,424 | 28,969 | (65,817) | — |
RWA | 397,241 | 119,734 | 82,746 | 71,551 | 55,912 | 46,853 | 376,796 | 20,445 | — | — |
General note: Balances highlighted in grey have been revised. | ||||||||||
⁽¹⁾ Excluding deletions. | ||||||||||
⁽²⁾ Non-current assets and liabilities held for sale of Garanti Bank SA, Motoractive IFN SA and Motoractive Multiservices, SRL, subsidiaries of Garanti BBVA in Romania. | ||||||||||

NUMBER OF EMPLOYEES, BRANCHES AND ATMS | |||
Employees | Branches | ATMs | |


Translation of this report originally issued in Spanish. In the event of a discrepancy, the Spanish-language version prevails. | p.37 |
| January - June 2026 Report |
Spain

Highlights for the period January - June 2026
–Lending dynamism continues
–Favorable performance of recurring revenues
–NPL ratio at historical lows
–Quarterly net attributable profit remains above €1 billion

BUSINESS ACTIVITY ⁽¹⁾ (VARIATION COMPARED TO 31-12-25) |

⁽¹⁾ Excluding repos.
NET INTEREST INCOME / AVERAGE TOTAL ASSETS (PERCENTAGE) |


OPERATING INCOME (MILLIONS OF EUROS) |

-0.1% | ||||
3,422 | 3,417 | ||

NET ATTRIBUTABLE PROFIT (LOSS) (MILLIONS OF EUROS) |
+2.3% | ||||
2,124 | 2,172 | |||

Translation of this report originally issued in Spanish. In the event of a discrepancy, the Spanish-language version prevails. | p.38 |
| January - June 2026 Report |

FINANCIAL STATEMENTS AND RELEVANT BUSINESS INDICATORS (MILLIONS OF EUROS AND PERCENTAGE) | |||
Income statement | 6M26 | ∆ % | 6M25 ⁽¹⁾ |
Net interest income | 3,346 | 4.1 | 3,215 |
Net fees and commissions | 1,194 | 2.2 | 1,168 |
Net trading income | 416 | 4.8 | 397 |
Other operating income and expenses | 191 | (8.7) | 209 |
Of which: Insurance activities | 212 | 5.4 | 201 |
Gross income | 5,147 | 3.1 | 4,990 |
Operating expenses | (1,729) | 10.3 | (1,568) |
Personnel expenses | (956) | 10.0 | (869) |
Other administrative expenses | (569) | 11.0 | (512) |
Depreciation | (205) | 9.2 | (187) |
Operating income | 3,417 | (0.1) | 3,422 |
Impairment on financial assets not measured at fair value through profit or loss | (300) | (0.3) | (301) |
Provisions or reversal of provisions and other results | (37) | (8.5) | (40) |
Profit (loss) before tax | 3,080 | — | 3,080 |
Income tax | (907) | (5.1) | (955) |
Profit (loss) for the period | 2,174 | 2.3 | 2,125 |
Non-controlling interests | (2) | 7.9 | (1) |
Net attributable profit (loss) | 2,172 | 2.3 | 2,124 |
Balance sheets | 30-06-26 | ∆ % | 31-12-25 ⁽¹⁾ |
Cash, cash balances at central banks and other demand deposits | 18,023 | (9.6) | 19,929 |
Financial assets designated at fair value | 150,010 | 25.1 | 119,910 |
Of which: Loans and advances | 63,824 | 47.2 | 43,346 |
Financial assets at amortized cost | 276,183 | 4.8 | 263,437 |
Of which: Loans and advances to customers | 201,279 | 4.3 | 192,959 |
Inter-area positions | 75,402 | 56.2 | 48,288 |
Tangible assets | 2,667 | (1.9) | 2,718 |
Other assets | 3,427 | (10.0) | 3,808 |
Total assets/liabilities and equity | 525,713 | 14.8 | 458,090 |
Financial liabilities held for trading and designated at fair value through profit or loss | 109,735 | 32.6 | 82,785 |
Deposits from central banks and credit institutions | 41,334 | 19.5 | 34,582 |
Deposits from customers | 260,326 | 3.5 | 251,430 |
Debt certificates | 75,476 | 41.6 | 53,300 |
Inter-area positions | — | — | — |
Other liabilities | 23,272 | 11.8 | 20,822 |
Allocated regulatory capital | 15,570 | 2.6 | 15,171 |
Relevant business indicators | 30-06-26 | ∆ % | 31-12-25 |
Performing loans and advances to customers under management ⁽²⁾ | 199,557 | 4.5 | 190,943 |
Non-performing loans | 6,595 | (2.4) | 6,759 |
Customer deposits under management ⁽¹⁾⁽²⁾ | 240,476 | 0.9 | 238,447 |
Off-balance sheet funds ⁽¹⁾⁽³⁾ | 126,530 | 5.9 | 119,535 |
Risk-weighted assets ⁽¹⁾ | 120,207 | 0.4 | 119,734 |
RORWA ⁽⁴⁾ | 3.7 | 3.4 | |
Efficiency ratio (%) | 33.6 | 33.3 | |
NPL ratio (%) | 2.9 | 3.0 | |
NPL coverage ratio (%) | 71 | 67 | |
Cost of risk (%) | 0.31 | 0.34 | |
⁽¹⁾ Revised balances. For more information, please refer to the “Business Areas” section. | |||
⁽²⁾ Excluding repos. | |||
⁽³⁾ Includes mutual funds, customer portfolios and pension funds. | |||
⁽⁴⁾ For more information on the calculation methodology, as well as the calculation of the metric at the consolidated Group level, see Alternative Performance Measures at this report. | |||
Translation of this report originally issued in Spanish. In the event of a discrepancy, the Spanish-language version prevails. | p.39 |
| January - June 2026 Report |
Macro and industry trends
The dynamism of economic activity has continued during the first quarter of 2026 and growth expectations going forward remain
favorable. The advance in employment and private consumption, the recovery in residential investment and the resilience of
service exports are expected to continue to act as factors supporting activity, offsetting the effects of higher energy costs, lower
growth in the Eurozone and the more restrictive tone of monetary policy. All in all, BBVA Research leaves its growth forecast for
the full year unchanged at 2.4%, the same advance anticipated in the previous scenario.
For its part, the increase in fuel prices, although contained by fiscal support measures, has placed June inflation at 3.2%, the same
level as in the previous two months. Even if energy prices gradually normalize and no significant second-round effects appear, the
headline rate is expected to remain high during the second half of the year and close the year at 4.3%. Average inflation in 2026
could reach 3.8%, nine tenths above what was forecast a quarter ago.
As for the banking system, with data at the end of May 2026, the volume of credit to the private sector grew by 3.3% year-on-year
(4.2% excluding the consumer credit portfolio for other purposes, which underwent a methodological change in April 2026 by the
Bank of Spain), with higher growth in the portfolios of credit to households at 2.9% (+5.4% excluding the change) than in credit to
non-financial companies (+3.8%). Non-financial sector deposits grew by 5.5% year-on-year in May 2026, due to a 3.7% increase
in time deposits, and 5.9% in demand deposits. The NPL ratio stood at 2.63% in April 2026, 55 basis points lower than in May the
previous year. Additionally, the system maintains comfortable levels of solvency and liquidity.
Activity
The most relevant aspects related to the area's activity during the first half of 2026 were:
–Lending balances were 4.5% higher than at the end of December 2025, mainly driven by the performance of the public
sector (19.7%) and the larger corporate segments (3.9%). The dynamism of consumer credit (+5.2%) also stood out.
–Total customer funds grew by 2.5%, with an increase in off-balance sheet funds (mutual and pension funds) of 5.9%,
favored by the market performance and stability in customer deposits (0.9%).
The most relevant aspects related to the area's activity during the second quarter of 2026 were:
–Lending activity increased by 3.3% compared to the end of March 2026, mainly driven by the seasonal increase in loans
to the public sector (+19.5% due to the advance payment of the extra pension to pensioners) and by the performance of
credit to companies (+2.9% larger companies and +2.2% medium-sized companies), followed by consumer lending
(+2.6%).
–Regarding asset quality, the NPL ratio stood at 2.9%, with a decrease of 8 basis points compared to the end of March,
supported by activity growth and by the sale of a mortgage-backed portfolio. For its part, the NPL coverage ratio
increased by 192 basis points in the quarter, to 71% at the end of June 2026.
–Total customer funds grew by 3.9% in the second quarter of 2026, favored by the growth of the retail segment. By
product, time deposits presented a growth of 5.1%, favored by the evolution of wholesale balances. For their part,
demand deposits increased by 2.2%, and off-balance sheet funds have been favored by a positive market effect,
presenting a growth of 6.3% compared to the end of the previous quarter.
Translation of this report originally issued in Spanish. In the event of a discrepancy, the Spanish-language version prevails. | p.40 |
| January - June 2026 Report |
Results
Spain generated a net attributable profit of €2,172 million in the first half of 2026, which is 2.3% above the result achieved in the
same period of 2025, driven by the evolution of the net interest income, supported by the dynamism of lending activity in all
customer segments , together with higher net fees and commissions and NTI.
The most relevant aspects of the year-on-year evolution of the area's income statement at the end of June 2026 were:
–Net interest income grew by 4.1%, supported by higher lending balances and a higher contribution from the securities
portfolio.
–Net fees and commissions grew by 2.2% compared to the same period of the previous year, driven primarily by the
performance of asset management fees and those from the relationship with wholesale customers.
–Net Trading Income (NTI) showed an increase of 4.8% compared to the first half of the previous year, including higher
results achieved by the Global Markets unit.
–The other operating income and expenses line showed a balance of €191m, which is 8.7% lower than in the same period of
the previous year, as the first half of 2025 included extraordinary income associated with the achievement of certain
milestones set out in the Allianz bancassurance agreement.
–Operating expenses increased by 10.3% compared to the first half of 2025, due to both higher general expenses (mainly
in technology) and personnel expenses, the latter reflecting the impact of voluntary redundancies in the first quarter of
2026. Both periods include, in the general expenses line, the impact of the upward re-estimation of the applied pro-rata
on the Value Added Tax
–The impairment on financial assets stood in line with the first half of the previous year (-0.3%). For its part, the cumulative
cost of risk at the end of June 2026 decreased by 3 basis points compared to the previous quarter and stood at 0.31%, in
line with that of the same period of the previous year.
–Finally, the income tax line includes the accrual corresponding to first semester of 2026, of the tax on net interest income
and net fees and commissions that have amounted to approximately €149 million, in line with the €150 million accrued in
the same period of the previous year.
The net attributable profit generated by Spain in the second quarter of 2026 reached €1,077m, which represents a decrease of
1.6% compared to the previous quarter, mainly due to a decrease in NTI, where the first quarter of the year was favored by the
performance of the insurance portfolio and portfolio sales. Additionally, the evolution of the quarter's result is explained by the
good performance of the net interest income together with lower operating expenses (the previous quarter incorporated voluntary
redundancies) and provisions for impairment on financial assets, mainly as a result of the aforementioned portfolio sale.
Translation of this report originally issued in Spanish. In the event of a discrepancy, the Spanish-language version prevails. | p.41 |
| January - June 2026 Report |
Mexico

Highlights for the period January - June 2026
–Credit growth and favorable evolution of customer funds
–Positive performance of all components of gross income
–Good performance of the insurance business
–Quarterly net attributable profit once again reached high levels and above the previous quarter

BUSINESS ACTIVITY ⁽¹⁾ (VARIATION AT CONSTANT EXCHANGE RATE COMPARED TO 31-12-25) |

⁽¹⁾ Excluding repos.
NET INTEREST INCOME / AVERAGE TOTAL ASSETS (PERCENTAGE AT CONSTANT EXCHANGE RATE) |


OPERATING INCOME (MILLIONS OF EUROS AT CONSTANT EXCHANGE RATE) |
+8.8% | (1) | ||||
5,452 | 5,931 | ||

⁽¹⁾ At current exchange rate: 16.4%.
NET ATTRIBUTABLE PROFIT (LOSS) (MILLIONS OF EUROS AT CONSTANT EXCHANGE RATE) |
+8.2% | (1) | |||
2,753 | 2,979 | |||

⁽¹⁾ At current exchange rate: 15.8%.
Translation of this report originally issued in Spanish. In the event of a discrepancy, the Spanish-language version prevails. | p.42 |
| January - June 2026 Report |

FINANCIAL STATEMENTS AND RELEVANT BUSINESS INDICATORS (MILLIONS OF EUROS AND PERCENTAGE) | ||||
Income statement | 6M26 | ∆ % | ∆ % ⁽¹⁾ | 6M25 ⁽²⁾ |
Net interest income | 6,409 | 16.3 | 8.6 | 5,511 |
Net fees and commissions | 1,314 | 14.9 | 7.3 | 1,144 |
Net trading income | 485 | 21.3 | 13.3 | 400 |
Other operating income and expenses | 356 | 21.6 | 13.7 | 293 |
Gross income | 8,565 | 16.6 | 8.9 | 7,349 |
Operating expenses | (2,634) | 16.8 | 9.1 | (2,255) |
Personnel expenses | (1,214) | 13.7 | 6.3 | (1,067) |
Other administrative expenses | (1,172) | 20.5 | 12.6 | (972) |
Depreciation | (248) | 15.1 | 7.5 | (216) |
Operating income | 5,931 | 16.4 | 8.8 | 5,093 |
Impairment on financial assets not measured at fair value through profit or loss | (1,719) | 15.7 | 8.1 | (1,486) |
Provisions or reversal of provisions and other results | (17) | (50.6) | (53.8) | (35) |
Profit (loss) before tax | 4,195 | 17.4 | 9.7 | 3,573 |
Income tax | (1,215) | 21.5 | 13.5 | (1,001) |
Profit (loss) for the period | 2,979 | 15.8 | 8.2 | 2,572 |
Non-controlling interests | (1) | 14.8 | 7.2 | (0) |
Net attributable profit (loss) | 2,979 | 15.8 | 8.2 | 2,571 |
Balance sheets | 30-06-26 | ∆ % | ∆ % ⁽¹⁾ | 31-12-25 ⁽²⁾ |
Cash, cash balances at central banks and other demand deposits | 12,868 | 23.5 | 16.4 | 10,417 |
Financial assets designated at fair value | 64,091 | 6.6 | 0.4 | 60,136 |
Of which: Loans and advances | 2,773 | (57.5) | (59.9) | 6,523 |
Financial assets at amortized cost | 118,539 | 12.4 | 5.9 | 105,494 |
Of which: Loans and advances to customers | 108,468 | 11.5 | 5.1 | 97,259 |
Tangible assets | 2,174 | 4.4 | (1.6) | 2,081 |
Other assets | 5,266 | 16.4 | 9.7 | 4,525 |
Total assets/liabilities and equity | 202,938 | 11.1 | 4.7 | 182,654 |
Financial liabilities held for trading and designated at fair value through profit or loss | 37,262 | 14.4 | 7.8 | 32,584 |
Deposits from central banks and credit institutions | 5,851 | (2.9) | (8.5) | 6,028 |
Deposits from customers | 105,290 | 12.2 | 5.7 | 93,855 |
Debt certificates | 13,450 | 15.3 | 8.7 | 11,664 |
Other liabilities | 29,312 | 6.6 | 0.4 | 27,507 |
Allocated regulatory capital | 11,773 | 6.9 | 0.7 | 11,015 |
Relevant business indicators | 30-06-26 | ∆ % | ∆ % ⁽¹⁾ | 31-12-25 |
Performing loans and advances to customers under management ⁽³⁾ | 108,705 | 11.2 | 4.8 | 97,744 |
Non-performing loans | 3,181 | 12.9 | 6.4 | 2,817 |
Customer deposits under management ⁽³⁾ | 101,433 | 8.1 | 1.9 | 93,817 |
Off-balance sheet funds ⁽⁴⁾ | 78,957 | 13.6 | 7.0 | 69,533 |
Risk-weighted assets | 87,755 | 6.1 | 0.0 | 82,746 |
RORWA ⁽¹⁾⁽⁵⁾ | 6.9 | 5.8 | ||
Efficiency ratio (%) | 30.8 | 30.5 | ||
NPL ratio (%) | 2.8 | 2.7 | ||
NPL coverage ratio (%) | 118 | 124 | ||
Cost of risk (%) | 3.26 | 3.31 | ||
⁽¹⁾ At constant exchange rate. | ||||
⁽²⁾ Revised balances. For more information, please refer to the “Business Areas” section. | ||||
⁽³⁾ Excluding repos. | ||||
⁽⁴⁾ Includes mutual funds, customer portfolios and other off-balance sheet funds. | ||||
⁽⁵⁾ For more information on the calculation methodology, as well as the calculation of the metric at the consolidated Group level, see Alternative Performance Measures at this report. | ||||
Translation of this report originally issued in Spanish. In the event of a discrepancy, the Spanish-language version prevails. | p.43 |
| January - June 2026 Report |
Macro and industry trends
The Mexican economy has shown a weaker-than-expected performance in the first quarter of 2026 due to a less favorable
evolution of domestic demand - in particular, investment and industry - and a less dynamic labor market. For the second half of the
year, a recovery in activity is expected as uncertainty surrounding the renewal of the trade agreement between Mexico, The United
States, and Canada (USMCA) decreases and infrastructure investment increases. Overall, BBVA Research places GDP growth for
2026 at 1.2%, compared to 1.8% three months ago. For its part, inflation stood at 3.4% in June, below the 4.6% observed in
March, and is expected to remain close to these levels during the coming months, and could close the year at 4.1%, two tenths
above what was contemplated in the previous scenario. Given this growth and price context, BBVA Research leaves its forecast for
benchmark interest rates unchanged, with 6.5% as the closing level for 2026.
Regarding the banking system, with data at the end of May 2026, the volume of credit to the non-financial private sector increases
by 5.5% year-on-year in nominal terms. Generalized growth is observed in all the main portfolios: 11.2% for consumer credit, 4.9%
for mortgage loans, and 3.0% for business loans. The growth of total deposits (demand and time deposits) was slightly higher than
the credit growth (+6.25% year-on-year in May 2026), with greater dynamism in time deposits (+7.0%) than in demand deposits
(+5.8%). For its part, the NPL ratio rose to 2.55% in May 2026, and capital indicators remained comfortable.
Unless expressly stated otherwise, all the comments below on rates of variation, for both activity and results, will be given at
constant exchange rate. These rates, together with variations at current exchange rates, can be found in the attached tables of
financial statements and relevant business indicators.
Activity
The most relevant aspects related to the area's activity during the first half of 2026 were:
–Lending activity (performing loans under management) grew by 4.8% during the first six months of 2026, with a more
dynamic performance in the wholesale portfolio, which grew by 5.7% driven mainly by corporate loans, while the retail
portfolio increased by 4.0%, with a favorable evolution across all products, although consumer and SME loans stand out
once again.
–Customer funds recorded an increase of 4.1% in the first half of 2026, with a growth of 1.9% in customer deposits, thanks
to the commercial boost in a highly competitive environment to attract liabilities. Especially relevant was the 7.0% growth
of off-balance sheet funds.
The most relevant aspects related to the area's activity in the second quarter of 2026 were:
–During the quarter, lending activity recorded an increase of 2.1%, with a balanced growth rate in both portfolios. Thus, the
wholesale portfolio increased at a rate of 2.0%, favored by the dynamism of corporate lending, while the retail portfolio
grew at somewhat higher rate (2.2%), driven by consumer loans and credit cards, favored by e-commerce commercial
campaigns.
–With regard to the asset quality indicators, the NPL ratio stood at 2.8% as of the end of June 2026, practically stable
compared to the end of 2025. Compared to the first quarter of 2026, it recorded an increase of 19 basis points, mainly
explained by the growth in the balance of non-performing loans in the retail portfolio, largely derived from the seasonality
of the first quarter, as well as by NPL inflows from wholesale customers. This performance of the balance of non-
performing loans influenced the evolution of the NPL coverage ratio, which stood at 118% as of the end of June 2026, with
a decrease of 11 percentage points compared to the end of March.
–Customer funds under management stood 1.6% above the March balances, mainly due to the solid growth of mutual
funds and other off-balance sheet funds, which increased by 5.1%. For their part, customer deposits showed an evolution
conditioned by specific outflows from corporate clients.
Translation of this report originally issued in Spanish. In the event of a discrepancy, the Spanish-language version prevails. | p.44 |
| January - June 2026 Report |
Results
BBVA Mexico achieved a net attributable profit of €2,979 million at the end of June 2026, which represents a year-on-year growth
of 8.2%, explained mainly by the favorable evolution of net interest income, supported by robust lending activity growth and, to a
lesser extent, by the evolution of fees, NTI and the insurance business.
The most relevant aspects of the year-on-year evolution in the income statement as of the end of June 2026 are summarized
below:
–Net interest income increased by 8.6%, mainly reflecting the good dynamism of the loan portfolio, with lending volumes
mitigating the decrease in the reference rate by the central bank.
–Net fees and commissions grew by 7.3%, mainly as a result of the higher revenues from asset management (due to higher
balances in mutual funds) and those associated with wholesale operations (administration and advisory).
–The contribution from NTI increased by 13.3% fundamentally due to higher results from Global Markets.
–The other operating income and expenses line item recorded an increase of 13.7%, favored by the good performance of
the insurance business.
–Operating expenses grew by 9.1%, mainly due to the increase in overhead costs (technology expenses and advertising
expenses) and, to a lesser extent, higher personnel expenses.
–Loan-loss provisions increased by 8.1% compared to the first half of 2025, mainly as a result of portfolio growth. Thus, the
cumulative cost of risk at the end of June 2026 stood at 3.26%, in line with the same period of the previous year, with a
decrease of 19 basis points compared to the previous quarter.
In the quarter, and excluding the effect of exchange rate fluctuations, BBVA Mexico generated a net attributable profit of €1,514m,
which represents a variation of +3.4% compared to the previous quarter, driven mainly by the good performance of the net
interest income, with a lower level of expenses.
Translation of this report originally issued in Spanish. In the event of a discrepancy, the Spanish-language version prevails. | p.45 |
| January - June 2026 Report |
Turkey
Highlights for the period January - June 2026
–Growth in lending activity driven by loans in Turkish lira
–Positive performance of recurring revenues
–More negative adjustment for hyperinflation
–Favorable evolution of the net attributable profit

BUSINESS ACTIVITY ⁽¹⁾ (VARIATION AT CONSTANT EXCHANGE RATE COMPARED TO 31-12-25) |

⁽¹⁾ Excluding repos.
NET INTEREST INCOME / AVERAGE TOTAL ASSETS (PERCENTAGE AT CONSTANT EXCHANGE RATE) |


OPERATING INCOME (MILLIONS OF EUROS AT CURRENT EXCHANGE RATE) |
+50.8% | ||||
1,329 | 2,004 | ||

⁽¹⁾ At constant exchange rate: +81.2%.

NET ATTRIBUTABLE PROFIT (LOSS) (MILLIONS OF EUROS AT CURRENT EXCHANGE RATE) |
+29.1% | ||||
412 | 532 | ||

⁽¹⁾ At constant exchange rate: +74.3%.
Translation of this report originally issued in Spanish. In the event of a discrepancy, the Spanish-language version prevails. | p.46 |
| January - June 2026 Report |

FINANCIAL STATEMENTS AND RELEVANT BUSINESS INDICATORS (MILLIONS OF EUROS AND PERCENTAGE) | ||||
Income statement | 6M26 | ∆ % | ∆ % ⁽¹⁾ | 6M25 ⁽²⁾ |
Net interest income | 2,152 | 64.7 | 84.1 | 1,307 |
Net fees and commissions | 1,202 | 13.7 | 28.6 | 1,058 |
Net trading income | 220 | (0.7) | 8.4 | 221 |
Other operating income and expenses | (201) | 14.0 | (14.0) | (177) |
Gross income | 3,372 | 40.0 | 62.8 | 2,409 |
Operating expenses | (1,369) | 26.8 | 41.7 | (1,080) |
Personnel expenses | (796) | 29.3 | 45.4 | (616) |
Other administrative expenses | (438) | 25.2 | 40.8 | (350) |
Depreciation | (135) | 17.7 | 25.3 | (114) |
Operating income | 2,004 | 50.8 | 81.2 | 1,329 |
Impairment on financial assets not measured at fair value through profit or loss | (685) | 68.2 | 90.3 | (407) |
Provisions or reversal of provisions and other results | (31) | n.s. | n.s. | 11 |
Profit (loss) before tax | 1,288 | 38.1 | 70.8 | 932 |
Income tax | (657) | 48.4 | 68.6 | (442) |
Profit (loss) for the period | 631 | 28.8 | 73.3 | 490 |
Non-controlling interests | (99) | 27.5 | 67.9 | (78) |
Net attributable profit (loss) | 532 | 29.1 | 74.3 | 412 |
Balance sheets | 30-06-26 | ∆ % | ∆ % ⁽¹⁾ | 31-12-25 ⁽²⁾ |
Cash, cash balances at central banks and other demand deposits | 8,163 | (9.9) | (6.9) | 9,061 |
Financial assets designated at fair value | 6,209 | 23.9 | 28.8 | 5,010 |
Of which: Loans and advances | 4 | (77.3) | (76.1) | 18 |
Financial assets at amortized cost | 79,300 | 10.1 | 15.0 | 72,047 |
Of which: Loans and advances to customers | 59,446 | 10.6 | 15.7 | 53,745 |
Tangible assets | 2,066 | 8.5 | 12.0 | 1,905 |
Other assets | 3,146 | 17.4 | 21.8 | 2,680 |
Total assets/liabilities and equity | 98,885 | 9.0 | 13.7 | 90,702 |
Financial liabilities held for trading and designated at fair value through profit or loss | 1,818 | 7.6 | 6.2 | 1,690 |
Deposits from central banks and credit institutions | 4,466 | 25.3 | 30.0 | 3,565 |
Deposits from customers | 68,614 | 8.9 | 13.7 | 62,984 |
Debt certificates | 7,546 | 0.6 | 5.7 | 7,502 |
Other liabilities | 6,510 | 13.7 | 17.4 | 5,726 |
Allocated regulatory capital | 9,930 | 7.5 | 12.8 | 9,235 |
Relevant business indicators | 30-06-26 | ∆ % | ∆ % ⁽¹⁾ | 31-12-25 |
Performing loans and advances to customers under management ⁽³⁾ | 58,625 | 10.4 | 15.5 | 53,080 |
Non-performing loans | 3,243 | 16.1 | 22.1 | 2,793 |
Customer deposits under management ⁽³⁾ | 68,188 | 9.0 | 13.8 | 62,535 |
Off-balance sheet funds ⁽⁴⁾ | 27,669 | 5.2 | 10.8 | 26,290 |
Risk-weighted assets | 77,402 | 8.2 | 13.4 | 71,551 |
RORWA ⁽⁵⁾ | 1.7 | 1.4 | ||
Efficiency ratio (%) | 40.6 | 44.4 | ||
NPL ratio (%) | 4.1 | 3.9 | ||
NPL coverage ratio (%) | 75 | 76 | ||
Cost of risk (%) | 2.36 | 1.94 | ||
⁽¹⁾ At constant exchange rate. | ||||
⁽²⁾ Revised balances with no significant impacts. For more information, please refer to the “Business Areas” section. | ||||
⁽³⁾ Excluding repos. | ||||
⁽⁴⁾ Includes mutual funds and pension funds. | ||||
⁽⁵⁾ For more information on the calculation methodology, as well as the calculation of the metric at the consolidated Group level, see Alternative Performance Measures at this report. | ||||
15 The variation rates of loans in Turkish lira and loans in foreign currency (U.S. dollars) are calculated based on local activity data and refer only refer to Garanti Bank
and therefore exclude the subsidiaries of Garanti BBVA, mainly in Romania and Netherlands.
Translation of this report originally issued in Spanish. In the event of a discrepancy, the Spanish-language version prevails. | p.47 |
| January - June 2026 Report |
Macro and industry trends
Economic activity has slowed down during the first months of 2026 mainly due to the impact of the conflict in the Middle East on
energy prices, trade, tourism, and external financing. Even if there is a certain recovery in growth during the second half of the
year, conditional on the easing of geopolitical tensions in the region and the maintenance of selective measures to support activity,
BBVA Research forecasts GDP growth for the full year at 3.0%, one percentage point lower than anticipated three months ago.
Regarding the price environment, inflation stood at 32.1% in June, above the figures for the first quarter of 2026 and in line with a
slower-than-expected disinflation process. Prices are expected to moderate gradually during the second half of the year, so that
the headline rate closes 2026 around 30%, compared to 28-29% in the previous scenario. This would allow a gradual reduction in
benchmark interest rates starting in the third quarter, reaching levels of 36% by the end of the year, one point above what was
forecast in the previous scenario.
The Turkish banking system continues to be affected by the impact of inflation. The total volume of credit in the system increased
by 36.9% year-on-year at the end of May 2026. The stock of credit continues to grow in consumer credit and credit card portfolios
(+43.9% year-on-year), in mortgage loans (+37.7% year-on-year) and business lending (+34,2% year-on-year). Total deposits
grew by 33.2% year-on-year at the end of May 2026, with growth largely evening out between U.S. dollar deposits (+36.5%) and
lira deposits (+31.3%). Dollarization of the system increased slightly to 37.9% in May 2026, from 37.0% a year earlier. As for the
system's NPL ratio, it decreased slightly in May 2026 to 2.69%. For their part, capital indicators remain at comfortable levels on
the same date.
Unless expressly stated otherwise, all comments below on rates of changes for both activity and results will be presented at
constant exchange rates. These rates, together with changes at current exchange rates, can be observed in the attached tables of
the financial statements and relevant business indicators. For the conversion of these figures, the end of period exchange rate as
of June 30, 2026 is used, reflecting the depreciation by the Turkish lira in the last twelve months. Likewise, the balance sheet, Risk-
Weighted Assets (RWA) and the equity are affected. Additionally, the activity, results, and relevant management indicators of the
area include, on an ongoing basis, the contribution of the subsidiaries in Romania included in the sale agreement described in the
"Highlights" section.
Activity15
The most relevant aspects related to the area's activity during the first half of 2026 were:
–Lending activity (performing loans under management) recorded an increase of 15.5% (below the half-year inflation rate,
which stood at 17.8%), driven by the growth in Turkish lira loans (15.3%). This growth was largely supported by the
performance of credit cards (+18.0%). Foreign currency loans (in US dollars) increased slightly by 0.8%.
–Customer deposits (69.4% of the area's total liabilities as of June 30, 2026) remained the main source of funding for the
balance sheet and increased by +13.8% favored by the performance of Turkish lira time deposits (+28.3%), which
represent an 85% of total customer deposits in local currency. Thus, as of June 30, 2026, Turkish lira deposits accounted
for 67% of total customer deposits in the area. For its part, off-balance sheet funds grew by 10.8%.
The most relevant aspects related to the area’s activity in the second quarter of 2026 were:
–Lending activity (performing loans under management) increased by 8.1% (above the quarterly inflation rate, which stood
at +7.0%), mainly driven by the growth in Turkish lira loans (+7.7%, boosted by the growth in credit cards) and, to a lesser
extent, by the slight increase of U.S. dollar loans (+0.5%), boosted by the increase in activity with customers focused on
foreign trade (with natural hedging of exchange rate risk).
Translation of this report originally issued in Spanish. In the event of a discrepancy, the Spanish-language version prevails. | p.48 |
| January - June 2026 Report |
–In terms of asset quality, the NPL ratio remains stable at 4.1% (2 basis points below the level reached at the end of March)
supported by the increase in activity and where NPL entries, mainly from the retail portfolio, have been partially offset by
recoveries and sales of impaired portfolios. On the other hand, the NPL coverage ratio recorded an increase of 136 basis
points during the quarter, standing at 75% as of June 30, 2026.
–In the favorable evolution of customer funds during the quarter (+7.6%), the growth in Turkish lira time deposits
(+20.6%) stood out once again, which comfortably offset the decline in demand deposits in foreign currency.
Results
Turkey reached a net attributable profit of €532 million in the first half of 2026, which compares very favorably with the result
achieved in the same period of the previous year, as a result mainly of the good performance of recurring revenues in banking
business (net interest income and net fees and commissions).
As mentioned above, the year-on-year comparison of the accumulated income statement at the end of June 2026 at current
exchange rate is affected by the depreciation of the Turkish lira over the past twelve months (-12.4%), with a less pronounced drop
in the quarter (-3.8%). To isolate this effect, the highlights of the results of the first half of 2026 at constant exchange rates are
summarized below:
–Net interest income experienced a year-on-year growth, mainly driven by the dynamism of lending activity and the
increased remuneration of certain Turkish lira reserves by the central bank, as well as a decrease in the cost of wholesale
funding.
–Net fees and commissions recorded a significant increase, driven by the solid performance in fees and commissions
associated with payment methods, followed by those related to asset management, insurances, guarantees and
brokerage activity.
–Increase in NTI, originating from higher revenues from derivatives and securities, as well as in Global Markets results,
partially offset by higher losses from the foreign exchange positions.
–The other operating income and expenses line had a balance of €-201 million, which represents a higher expense
compared to the same period of the previous year. This line incorporates, among others, the loss on the net monetary
position, together with its partial offset by the income derived from inflation-linked bonds (CPI linkers). The net impact of
both effects was more negative in the first half of 2026, compared with the same period of 2025 and was partially offset
by the results of certain subsidiaries of Garanti BBVA and the performance of the insurance business, whose contribution
was increased in both cases.
–Operating expenses continued to grow, although below the growth in gross income, with the consequent improvement in
efficiency. In personnel expenses, the increase was centered on fixed remuneration to the staff, associated with salary
reviews in the context of high inflation. For their part, general expenses also grew, highlighting the higher technology
expenses.
–Regarding the impairment on financial assets, higher provisions were recorded, which is explained by the growth of the
activity, higher requirements in retail portfolios and lower releases in the wholesale portfolio. Meanwhile, the accumulated
cost of risk as of June 30, 2026 stood at 2.36%, a decrease of -16 basis points compared to the quarterly cost of risk of
the previous quarter.
In the second quarter of 2026, the net attributable profit of Turkey, at current exchange rates, stood at €269 million, which
represents an improvement compared to the previous quarter, mainly driven by the performance of credit card fees, which offset
the decrease in the net interest income and NTI, as well as higher operating expenses.
Translation of this report originally issued in Spanish. In the event of a discrepancy, the Spanish-language version prevails. | p.49 |
| January - June 2026 Report |
South America

Highlights for the period January - June 2026
–Growth in lending activity and customer funds
–Favorable evolution of recurring revenues in Argentina, Colombia and Peru
–Greater adjustment for hyperinflation compared to the first half of 2025
–Year-on-year increase in the area's net attributable profit, with a standout performance in Colombia

BUSINESS ACTIVITY ⁽¹⁾ (VARIATION AT CONSTANT EXCHANGE RATES COMPARED TO 31-12-25) |

⁽¹⁾ Excluding repos.

NET INTEREST INCOME / AVERAGE TOTAL ASSETS (PERCENTAGE AT CONSTANT EXCHANGE RATES) |


OPERATING INCOME (MILLIONS OF EUROS AT CURRENT EXCHANGE RATES) |
+27.9% | (1) | |||
1,515 | 1,936 | ||

⁽¹⁾ At constant exchange rates: +33.5%.

NET ATTRIBUTABLE PROFIT (LOSS) (MILLIONS OF EUROS AT CURRENT EXCHANGE RATES) |
+33.6% | (1) | |||
417 | 556 | ||

⁽¹⁾ At constant exchange rates: +41.6%.
Translation of this report originally issued in Spanish. In the event of a discrepancy, the Spanish-language version prevails. | p.50 |
| January - June 2026 Report |

FINANCIAL STATEMENTS AND RELEVANT BUSINESS INDICATORS (MILLIONS OF EUROS AND PERCENTAGE) | ||||
Income statement | 6M26 | ∆ % | ∆ % ⁽¹⁾ | 6M25 ⁽²⁾ |
Net interest income | 2,952 | 23.7 | 28.6 | 2,387 |
Net fees and commissions | 544 | 30.3 | 36.7 | 417 |
Net trading income | 310 | (2.9) | 2.8 | 319 |
Other operating income and expenses | (498) | 23.3 | 30.1 | (404) |
Gross income | 3,308 | 21.6 | 26.7 | 2,719 |
Operating expenses | (1,371) | 13.8 | 18.2 | (1,205) |
Personnel expenses | (641) | 20.1 | 25.5 | (534) |
Other administrative expenses | (614) | 8.7 | 13.0 | (565) |
Depreciation | (117) | 9.5 | 9.4 | (106) |
Operating income | 1,936 | 27.9 | 33.5 | 1,515 |
Impairment on financial assets not measured at fair value through profit or loss | (745) | 41.0 | 42.0 | (528) |
Provisions or reversal of provisions and other results | (2) | (85.4) | (82.6) | (16) |
Profit (loss) before tax | 1,189 | 22.5 | 30.3 | 970 |
Income tax | (330) | 13.2 | 21.7 | (291) |
Profit (loss) for the period | 859 | 26.5 | 33.9 | 679 |
Non-controlling interests | (303) | 15.3 | 21.8 | (263) |
Net attributable profit (loss) | 556 | 33.6 | 41.6 | 417 |
Balance sheets | 30-06-26 | ∆ % | ∆ % ⁽¹⁾ | 31-12-25 ⁽²⁾ |
Cash, cash balances at central banks and other demand deposits | 8,666 | 7.3 | 3.5 | 8,073 |
Financial assets designated at fair value | 13,609 | 28.4 | 21.6 | 10,602 |
Of which: Loans and advances | 280 | (5.8) | (16.3) | 297 |
Financial assets at amortized cost | 60,510 | 11.5 | 5.9 | 54,283 |
Of which: Loans and advances to customers | 57,663 | 12.5 | 6.9 | 51,235 |
Tangible assets | 1,270 | 10.6 | 8.7 | 1,149 |
Other assets | 2,416 | (4.0) | (10.6) | 2,517 |
Total assets/liabilities and equity | 86,471 | 12.9 | 7.3 | 76,624 |
Financial liabilities held for trading and designated at fair value through profit or loss | 3,025 | 24.5 | 11.8 | 2,430 |
Deposits from central banks and credit institutions | 3,673 | (4.0) | (7.1) | 3,826 |
Deposits from customers | 60,780 | 13.9 | 8.1 | 53,375 |
Debt certificates | 4,210 | 4.9 | 0.3 | 4,015 |
Other liabilities | 7,088 | 24.2 | 20.8 | 5,707 |
Allocated regulatory capital | 7,694 | 5.8 | 0.6 | 7,271 |
Relevant business indicators | 30-06-26 | ∆ % | ∆ % ⁽¹⁾ | 31-12-25 |
Performing loans and advances to customers under management ⁽³⁾ | 56,873 | 12.5 | 6.9 | 50,566 |
Non-performing loans | 2,564 | 10.8 | 5.2 | 2,314 |
Customer deposits under management ⁽⁴⁾ | 60,780 | 13.9 | 8.1 | 53,375 |
Off-balance sheet funds ⁽⁵⁾ | 9,864 | 19.3 | 13.0 | 8,271 |
Risk-weighted assets | 62,487 | 11.8 | 6.2 | 55,912 |
RORWA ⁽⁶⁾ | 2.9 | 2.1 | ||
Efficiency ratio (%) | 41.5 | 44.4 | ||
NPL ratio (%) | 4.0 | 4.0 | ||
NPL coverage ratio (%) | 89 | 92 | ||
Cost of risk (%) | 2.69 | 2.50 | ||
⁽¹⁾ At constant exchange rate. | ||||
⁽²⁾ Revised balances. For more information, please refer to the “Business Areas” section. | ||||
⁽³⁾ Excluding repos. | ||||
⁽⁴⁾ Excluding repos and including specific marketable debt securities. | ||||
⁽⁵⁾ Includes mutual funds and customer portfolios in Peru and Colombia, with the latter being preliminary as of June 30, 2026. | ||||
⁽⁶⁾ For more information on the calculation methodology, as well as the calculation of the metric at the consolidated Group level, see Alternative Performance Measures at this report. | ||||
Translation of this report originally issued in Spanish. In the event of a discrepancy, the Spanish-language version prevails. | p.51 |
| January - June 2026 Report |

SOUTH AMERICA. DATA PER COUNTRY (MILLIONS OF EUROS) | ||||||||
Operating income | Net attributable profit (loss) | |||||||
Country | 6M26 | ∆ % | ∆ % ⁽¹⁾ | 6M25 | 6M26 | ∆ % | ∆ % ⁽¹⁾ | 6M25 |
Argentina | 526 | 46.8 | n.s. | 359 | 73 | (19.2) | n.s. | 91 |
Colombia | 437 | 43.3 | 33.2 | 305 | 175 | 140.4 | 123.5 | 73 |
Peru | 673 | 12.1 | 10.8 | 601 | 194 | 25.3 | 23.9 | 155 |
Other countries ⁽²⁾ | 300 | 19.8 | 19.8 | 251 | 114 | 15.9 | 15.8 | 98 |
Total | 1,936 | 27.9 | 33.5 | 1,515 | 556 | 33.6 | 41.6 | 417 |
⁽¹⁾ At constant exchange rates. | ||||||||
⁽²⁾ Chile (Forum), Uruguay, Venezuela and Brazil. Additionally, it includes eliminations and other charges. | ||||||||

SOUTH AMERICA. RELEVANT BUSINESS INDICATORS PER COUNTRY (MILLIONS OF EUROS) | ||||||
Argentina | Colombia | Peru | ||||
30-06-26 | 31-12-25 | 30-06-26 | 31-12-25 | 30-06-26 | 31-12-25 | |
Performing loans and advances to customers under management ⁽¹⁾⁽²⁾ | 9,463 | 8,293 | 20,514 | 19,515 | 21,218 | 20,097 |
Non-performing loans ⁽¹⁾ | 665 | 435 | 819 | 894 | 867 | 927 |
Customer deposits under management ⁽¹⁾⁽³⁾ | 11,419 | 10,254 | 22,483 | 20,943 | 22,342 | 21,148 |
Off-balance sheet funds ⁽¹⁾⁽⁴⁾ | 2,847 | 2,119 | 3,507 | 3,359 | 3,508 | 3,250 |
Risk-weighted assets | 12,133 | 10,501 | 22,134 | 19,171 | 21,051 | 19,856 |
RORWA ⁽⁵⁾ | 1.9 | 1.8 | 1.8 | 0.8 | 3.9 | 3.1 |
Efficiency ratio (%) | 46.8 | 51.5 | 41.9 | 46.3 | 38.0 | 38.9 |
NPL ratio (%) | 6.4 | 4.9 | 3.7 | 4.3 | 3.3 | 3.7 |
NPL coverage ratio (%) | 76 | 84 | 85 | 88 | 105 | 99 |
Cost of risk (%) | 7.70 | 5.67 | 2.02 | 2.19 | 1.25 | 1.67 |
⁽¹⁾ Figures at constant exchange rates. | ||||||
⁽²⁾ Excluding repos. | ||||||
⁽³⁾ Excluding repos and including specific marketable debt securities. | ||||||
⁽⁴⁾ Includes mutual funds and customer portfolios (in Peru and Colombia, with the latter being preliminary as of June 30, 2026). | ||||||
⁽⁵⁾ For more information on the calculation methodology, as well as the calculation of the metric at the consolidated Group level, see Alternative Performance Measures at this report. | ||||||
Unless expressly stated otherwise, all the comments below on rates of change, for both activity and results, will be given at
constant exchange rates. These rates, together with the changes at current exchange rates, can be found in the attached tables of
the financial statements and relevant business indicators.
Activity and results
The most relevant aspects related to the area's activity during the first half of 2026 were:
–Lending activity (performing loans under management) increased by 6.9%, with a more dynamic growth in the wholesale
portfolio (+9.0%) and a favorable evolution of all products in the retail portfolio, which grew by 4.5%.
–Customer funds under management grew by 8.8% compared to the closing balances at the end of 2025, where the
evolution of demand deposits (+7.3%) and time deposits (+9.5%) stands out.
Translation of this report originally issued in Spanish. In the event of a discrepancy, the Spanish-language version prevails. | p.52 |
| January - June 2026 Report |
The most relevant aspects related to the area's activity during the second quarter of the year 2026 have been:
–Lending activity increased by 4.2%, mainly supported by the dynamism of corporate loans (+6.4%) and the evolution of
all products in the retail segment (+2.3%).
–With regard to credit quality, the area's NPL ratio stood at 4.0%, which represents a decrease of 18 basis points
compared to the previous quarter, due to the favorable evolution of Peru and Colombia which offset the deterioration in
Argentina and Chile. For its part, the NPL coverage ratio for the area was 89%, representing a decrease of 74 basis points
compared to the end of March, with declines originating mainly in Argentina, and to a lesser extent Colombia and Chile.
–Customer funds under management increased at a rate of 3.2%, thanks to the boost from customer deposits, which
increased by 3.4%.
South America generated a net attributable profit of €556 million in the first half of 2026, which represents a year-on-year growth
of 33.6% at current exchange rates, favored by the evolution of recurring revenues in the banking business. Within the main
countries of the area, the evolution of the net attributable profit in Colombia stood out.
Meanwhile, the impact of the adjustment for hyperinflation of subsidiaries domiciled in Argentina stands out, which implies, among
other effects, the recording of the loss on the monetary position in the item "Other operating income and expenses" in the income
statement. This impact amounted to €279 million in the period January - June 2026, above the €211 million recorded in the period
January - June 2025.
More detailed information on the most representative countries of the business area is provided below.
Argentina
Macro and industry trends
The economic recovery has continued during the first months of 2026, led by the primary sectors and some services, and the
strength of energy exports. The performance of the industrial and construction sectors continues to be weak, as well as formal job
creation. Despite this, BBVA Research leaves its growth forecast for 2026 unchanged at 3.0%. For its part, inflation has hovered
around 33% during the first half of the year (in June it stood at 33.2%) and is expected to moderate going forward, standing at
29% at the end of 2026. Greater exchange rate stability, lower pressure on basic input prices and a gradual normalization of
regulated prices should favor the correction.
The banking system is growing at a rapid pace, although inflation control entails that the credit and deposit volume growth is more
moderate than in previous quarters. With data at the end of June 2026, total lending increased by 45.0% compared to June 2025,
favored by consumer, corporate and, above all, mortgage portfolios, which grew by 31%, 52% and 107% year-on-year,
respectively. For their part, deposits have decelerated their growth and at the end of June recorded a year-on-year growth of 33%.
Finally, the NPL ratio has rebounded due to the growth in household credit defaults, standing at 7.3% at the end of April 2026.
Activity and results
–In the first half of 2026, the lending activity recorded a growth of 14.1% (below the accumulated inflation rate which
reached (+17,0%), while in the second quarter, this increase stood at 8.9% (above the 6.8% quarterly inflation rate), in
both cases favored by the performance of corporate loans. At the end of June 2026, the NPL ratio stood at 6.4%, an
increase of 10 basis points compared to the first quarter, originating from NPL inflows in the retail portfolio and affecting
in turn the NPL coverage ratio, which stood at 76%, representing a decrease of 3 percentage points in the period.
–Customer funds grew by 15.3% in the first half of 2026 (8.6% in the second quarter), with generalized growth across all
products, especially in the corporate segment.
16 At current rates, that is, the impact of exchange rate fluctuations on the profit and loss account is not excluded.
Translation of this report originally issued in Spanish. In the event of a discrepancy, the Spanish-language version prevails. | p.53 |
| January - June 2026 Report |
–Regarding the evolution of the income statement16, the cumulative net attributable profit at the end of June 2026 stood at
€73 million, with growth in recurring revenue, offset, among others, by a more negative impact for hyperinflation
compared to the first half of 2025 and, especially, by an increase in provisions for impairment in financial assets (due to
higher requirements in the retail portfolio, partly affected by a larger portfolio volume). Meanwhile, the accumulated cost
of risk stood at 7.70%, which represents a decrease of 14 basis points compared to the cost of risk of the preceding
quarter. The result of the second quarter reached €46 million, which represents an improvement compared to the
previous quarter, favored mainly by a lower adjustment for hyperinflation and an improvement in NTI.
Colombia
Macro and industry trends
Private consumption and the services sector have continued to support economic activity during the first months of 2026,
offsetting the lack of dynamism in investment. The progressive reduction in the uncertainty associated with the political change
and the effects of the minimum wage increase should help maintain GDP growth going forward. Despite this, BBVA Research
revises its growth forecast for 2026 slightly downwards to 2.6%, two tenths below the previous scenario. Price pressures justify
the restrictive tone of monetary policy. Thus, headline inflation could close 2026 at 7%, compared to 6.1% in June, and benchmark
interest rates could do so at 12.25% (12% in June).
Total credit growth in the banking system stood at 9.1% year-on-year in May 2026, with growth across all portfolios. Thus,
corporate lending, mortgage lending, and consumer lending portfolios showed year-on-year growth rates of 8.0%, 11.9% and
9.8%, respectively, in May 2026. On the other hand, total deposits grew by 11.3% year-on-year at the end of May 2026, with a
performance marked by the growth in demand deposits. Thus, demand and time deposits grew by 14.6% and 7.4% year-on-year
respectively. The system's NPL ratio has improved in the last few months, standing at 3.76% in May 2026, 65 basis points below
the figure for the same month of the previous year.
Activity and results
–Lending activity grew at a rate of 5.1% compared to the end of 2025 (3.3% in the second quarter), favored by the
performance of the corporate banking segment. In terms of asset quality indicators, the NPL ratio stood at 3.7%,
representing a decrease of 34 basis points with respect to the previous quarter and 55 basis points compared to the end
of the previous year, continuing the positive trend of recent quarters. On the other hand, coverage stood at 85%, with a
decrease of 112 basis points compared to the previous quarter.
–Customer funds grew by 6.9% compared to the end of 2025 and 3.4% during the second quarter. In the first six months
of 2026, time deposits increased by 7.7%, demand deposits showed an evolution of 7.0%, and off-balance sheet funds of
4.4%.
–The cumulative net attributable profit at the end of June 2026 stood at €175 million, that is, 123.5% higher than at the
result at the end of the same period of the previous year, favored mainly by growth in the net interest income and lower
loan-loss provisions due to lower requirements in the retail portfolio. For its part, the accumulated cost of risk stood at
2.02% at the end of June 2026, at similar levels to the previous quarter. The net attributable profit of the quarter stood at
€96m, 21.1% above the previous quarter, favored by the growth in net interest income and a lower income tax expense.
Translation of this report originally issued in Spanish. In the event of a discrepancy, the Spanish-language version prevails. | p.54 |
| January - June 2026 Report |
Peru
Macro and industry trends
Economic activity exhibited greater dynamism than expected in the first months of 2026, supported by private consumption and
investment. According to BBVA Research, growth for the full year could reach 3.1%, two tenths above what was forecast in the
previous scenario, conditional on the evolution of the conflict in the Middle East and its impact on oil prices, the effects of the El
Niño climate phenomenon and the political environment. Regarding the price environment, inflation is forecast to remain relatively
high during the second half of the year, closing the year at 4.1%, levels similar to those observed in June. The persistence of
inflation above the central bank's target range makes further benchmark interest rate hikes more likely, bringing rates to 4.75% in
December (4.25% in June).
Total lending in the Peruvian banking system increased by 7.4% year-on-year in May 2026, with positive growth in all portfolios.
Thus, the consumer credit portfolio grew by 14.0% year-on-year, the mortgage portfolio increased by 7.3% and the corporate loan
portfolio increased by 5.2% year-on-year. For their part, the system's total deposits registered a year-on-year growth of 11.6% in
May 2026, thanks to the 15.6% growth in demand deposits and 4.0% in time deposits. Finally, the system's NPL ratio continued on
a downward trend, reaching a rate of 2.83% in May 2026.
Activity and results
–Lending activity grew by 5.6% compared to the end of December 2025 (a 3.3% during the second quarter), driven by
corporate loans, with a growth of 5.8%, followed by 7.4% in consumer loans. Regarding the asset quality indicators, the
NPL ratio improved compared to the end of March 2026 (-21 basis points and -39 basis points compared to the end of the
previous year) placing at 3.3%, reflecting continued strong recovery performance and contained entries. Meanwhile, the
NPL coverage ratio was 105%, which represents an increase of 183 basis points compared to the end of March, supported
by the reduction in non-performing loans.
–Customers funds under management increased during the first semester of 2026 (+5.9%, and stable compared to the
second quarter), thanks to the favorable performance in customer deposits (+5.6%), mainly from retail customers.
–BBVA Peru's cumulative attributable profit stood at €194 million at the end of June 2026, that is, 23.9% above the result
achieved in the first half of the previous year (€155 million). In the period, a growth in net interest income was observed,
associated with a higher profitability and volume of the loan portfolio, as well as higher fees and commissions and NTI
(results from the Global Markets unit) and lower loan-loss provisions. For its part, the cumulative cost of risk at the end of
the second quarter stood at 1.25%, which represents a decrease of 26 basis points compared to the cost of risk of the
previous quarter. The profit of the quarter stood at €113 million, which is a variation of 39.5% compared to the previous
quarter, mainly as a result of lower loan-loss provisions in the wholesale portfolio and the release of provisions for special
funds, with a positive contribution from the net interest income.
Translation of this report originally issued in Spanish. In the event of a discrepancy, the Spanish-language version prevails. | p.55 |
| January - June 2026 Report |
Rest of Business
Highlights for the period January - June 2026
–Dynamism in lending activity and stability of customer funds, driven by growth in the second quarter
–Favorable performance of recurring revenues
–Positive evolution of the efficiency ratio
–Double-digit growth in net attributable profit
BUSINESS ACTIVITY ⁽¹⁾ (VARIATION AT CONSTANT EXCHANGE RATES COMPARED TO 31-12-25) | ||

⁽¹⁾ Excluding repos.
NET INTEREST INCOME / AVERAGE TOTAL ASSETS (PERCENTAGE AT CONSTANT EXCHANGE RATES) |


OPERATING INCOME (MILLIONS OF EUROS AT CONSTANT EXCHANGE RATES) |
+54.3% | (1) | |||
453 | 699 | ||

⁽¹⁾ At current exchange rates: +55.9%.

NET ATTRIBUTABLE PROFIT (LOSS) (MILLIONS OF EUROS AT CONSTANT EXCHANGE RATES) |
+60.0% | (1) | |||
318 | 508 | ||

⁽¹⁾ At current exchange rates: +62.0%.
Translation of this report originally issued in Spanish. In the event of a discrepancy, the Spanish-language version prevails. | p.56 |
| January - June 2026 Report |

FINANCIAL STATEMENTS AND RELEVANT BUSINESS INDICATORS (MILLIONS OF EUROS AND PERCENTAGE) | ||||
Income statement | 6M26 | ∆ % | ∆ % ⁽¹⁾ | 6M25 ⁽²⁾ |
Net interest income | 507 | 37.5 | 36.0 | 369 |
Net fees and commissions | 391 | 41.1 | 41.5 | 277 |
Net trading income | 300 | 66.9 | 66.5 | 180 |
Other operating income and expenses | (1) | n.s. | n.s. | 1 |
Gross income | 1,197 | 44.8 | 44.1 | 827 |
Operating expenses | (498) | 31.6 | 31.9 | (379) |
Personnel expenses | (257) | 28.4 | 28.5 | (200) |
Other administrative expenses | (220) | 37.0 | 37.7 | (160) |
Depreciation | (21) | 18.5 | 18.0 | (18) |
Operating income | 699 | 55.9 | 54.3 | 448 |
Impairment on financial assets not measured at fair value through profit or loss | (51) | 39.4 | 39.5 | (37) |
Provisions or reversal of provisions and other results | 4 | n.s. | n.s. | (2) |
Profit (loss) before tax | 652 | 59.0 | 57.3 | 410 |
Income tax | (143) | 49.3 | 48.4 | (96) |
Profit (loss) for the period | 508 | 62.0 | 60.0 | 314 |
Non-controlling interests | — | — | — | — |
Net attributable profit (loss) | 508 | 62.0 | 60.0 | 314 |
Balance sheets | 30-06-26 | ∆ % | ∆ % ⁽¹⁾ | 31-12-25 ⁽²⁾ |
Cash, cash balances at central banks and other demand deposits | 16,789 | 45.2 | 41.1 | 11,559 |
Financial assets designated at fair value | 2,825 | 46.5 | 43.9 | 1,928 |
Of which: Loans and advances | 2,175 | 60.6 | 57.0 | 1,354 |
Financial assets at amortized cost | 97,298 | 31.0 | 29.4 | 74,292 |
Of which: Loans and advances to customers | 86,353 | 30.0 | 28.4 | 66,418 |
Inter-area positions | — | — | — | — |
Tangible assets | 256 | (1.9) | (3.9) | 261 |
Other assets | 848 | 170.2 | 167.5 | 314 |
Total assets/liabilities and equity | 118,016 | 33.6 | 31.6 | 88,354 |
Financial liabilities held for trading and designated at fair value through profit or loss | 868 | 13.6 | 10.3 | 764 |
Deposits from central banks and credit institutions | 7,288 | 40.7 | 39.5 | 5,181 |
Deposits from customers | 41,027 | 0.2 | (0.7) | 40,932 |
Debt certificates | 2,177 | 21.0 | 19.1 | 1,800 |
Inter-area positions ⁽³⁾ | 58,422 | 79.2 | 75.4 | 32,593 |
Other liabilities ⁽³⁾ | 1,941 | 3.1 | 1.4 | 1,882 |
Allocated regulatory capital | 6,294 | 21.0 | 19.2 | 5,202 |
Relevant business indicators | 30-06-26 | ∆ % | ∆ % ⁽¹⁾ | 31-12-25 |
Performing loans and advances to customers under management ⁽⁴⁾ | 86,234 | 29.8 | 28.1 | 66,457 |
Non-performing loans | 392 | 157.1 | 157.1 | 153 |
Customer deposits under management ⁽⁴⁾ | 41,027 | 0.2 | (0.7) | 40,932 |
Off-balance sheet funds ⁽⁵⁾ | 783 | 6.4 | 6.4 | 736 |
Risk-weighted assets | 54,505 | 16.3 | 14.6 | 46,853 |
RORWA ⁽¹⁾⁽⁶⁾ | 2.1 | 1.7 | ||
Efficiency ratio (%) | 41.6 | 49.0 | ||
NPL ratio (%) | 0.3 | 0.2 | ||
NPL coverage ratio (%) | 89 | 172 | ||
Cost of risk (%) | 0.14 | 0.15 | ||
⁽¹⁾ At constant exchange rate. | ||||
⁽²⁾ Revised balances. For more information, please refer to the “Business Areas” section. | ||||
⁽³⁾ Revised balances in 2025. | ||||
⁽⁴⁾ Excluding repos. | ||||
⁽⁵⁾ Includes pension funds. | ||||
⁽⁶⁾ For more information on the calculation methodology, as well as the calculation of the metric at the consolidated Group level, see Alternative Performance Measures at this report. | ||||
Translation of this report originally issued in Spanish. In the event of a discrepancy, the Spanish-language version prevails. | p.57 |
| January - June 2026 Report |
Unless expressly stated otherwise, all the comments below on rates of change, for both activity and results, will be given at
constant exchange rates. These rates, together with the changes at current exchange rates, can be found in the attached tables of
the financial statements and relevant business indicators. Comments that refer to Europe exclude Spain.
Activity
The most relevant aspects of the evolution of BBVA Group's Rest of Business activity during the first half of 2026 were:
–Lending activity (performing loans under management) showed a growth of 28.1%, driven by the dynamism of corporate
loans from the New York branch, followed by Asia and Europe.
–Customer funds under management remained stable compared to the closing balances at the end of December (-0.6%).
The most relevant aspects of the evolution of BBVA Group's Rest of Business activity during the second quarter of 2026 were:
–In the second quarter of 2026, lending activity (performing loans under management) registered a growth of 13.8%, also
favored by corporate loans. By geographical areas, growth in the New York branch stood out, followed to a lesser extent
by Asia and Europe.
–For its part, compared to the end of March, the NPL ratio increased by 18 basis points to stand at 0.3%, while the NPL
coverage ratio decreased by 108 percentage points to 89%, which is explained in both cases by the deterioration of two
wholesale customers.
–Customer funds under management increased by 7.5%, mainly driven by customer deposits in New York and Asia.
Results
Rest of Business achieved a net attributable profit of €508 million in the first half of 2026, 60.0% higher than in the same period of
the previous year, favored by the evolution of the recurring revenues and the NTI, which more than offset the increase in operating
expenses.
In the year-on-year evolution of the main lines of the area's income statement at the end of June 2026, the following was
particularly noteworthy:
–Net interest income grew by 36.0% as a result of increased activity volume, particularly in investment banking, as well as
transactional business.
–Net fees and commissions had an excellent performance and increased by 41.5%, thanks to relevant operations in project
finance and corporate loans. By geographical area, fee generation was concentrated in Europe and the United States.
–NTI grew by 66.5%, benefiting from the contribution of the United States and, to a lesser extent, Europe and Asia, driven
mainly by commercial activity, highlighting the operations in interest rates and equities.
–Increase in operating expenses of 31.9% explained by both higher general (technology and services provided by third
parties) and personnel expenses, due to new hires. By geographical areas, growth was focused in Europe.
–The impairment on financial assets line at the end of June 2026 recorded a balance of €-51 million, a figure which is higher
than in the same period of the previous year, mainly originated in higher provisions linked to specific exposures in the
United States and Europe. For its part, the cumulative cost of risk at the end of June stood at 0.14%, at similar levels to
the end of the previous year.
In the second quarter of 2026, and excluding the effect of the exchange rates fluctuations, the Group's Rest of Businesses as a
whole generated a net attributable profit of €271 million, 14.5% higher than the result of the first quarter of 2026, favored by the
growth of net interest income and a lower level of loan-loss provisions.
Translation of this report originally issued in Spanish. In the event of a discrepancy, the Spanish-language version prevails. | p.58 |
| January - June 2026 Report |
Corporate Center

FINANCIAL STATEMENTS (MILLIONS OF EUROS AND PERCENTAGE) | |||
Income statement | 6M26 | ∆ % | 6M25 ⁽¹⁾ |
Net interest income | (202) | 10.9 | (182) |
Net fees and commissions | (74) | 35.8 | (54) |
Net trading income | (232) | 173.2 | (85) |
Other operating income and expenses | 78 | 25.6 | 62 |
Gross income | (430) | 65.7 | (260) |
Operating expenses | (399) | 32.9 | (300) |
Personnel expenses | (501) | 22.8 | (408) |
Other administrative expenses | 211 | (1.6) | 215 |
Depreciation | (109) | 1.9 | (107) |
Operating income | (829) | 48.1 | (560) |
Impairment on financial assets not measured at fair value through profit or loss | 5 | n.s. | (2) |
Provisions or reversal of provisions and other results | 2 | (87.9) | 20 |
Profit (loss) before tax | (822) | 51.9 | (541) |
Income tax | 139 | (12.7) | 160 |
Profit (loss) for the period | (683) | 79.0 | (381) |
Non-controlling interests | (14) | 56.6 | (9) |
Net attributable profit (loss) | (696) | 78.5 | (390) |
Balance sheets ⁽¹⁾ | 30-06-26 | ∆ % | 31-12-25 ⁽²⁾ |
Cash, cash balances at central banks and other demand deposits | 499 | (3.4) | 516 |
Financial assets designated at fair value | 6,452 | (4.2) | 6,737 |
Of which: Loans and advances | — | — | — |
Financial assets at amortized cost | 5,201 | 25.4 | 4,146 |
Of which: Loans and advances to customers | 672 | 86.2 | 361 |
Inter-area positions | — | — | — |
Tangible assets | 1,823 | (1.7) | 1,855 |
Other assets | 15,134 | (3.7) | 15,714 |
Total assets/liabilities and equity | 29,109 | 0.5 | 28,969 |
Financial liabilities held for trading and designated at fair value through profit or loss | 254 | 82.4 | 139 |
Deposits from central banks and credit institutions | 4,208 | 10.9 | 3,793 |
Deposits from customers | 2,037 | 1.8 | 2,001 |
Debt certificates | 3,698 | (4.9) | 3,888 |
Inter-area positions | 1,682 | n.s. | 398 |
Other liabilities | 4,700 | (3.0) | 4,847 |
Allocated regulatory capital | (51,261) | 7.0 | (47,895) |
Total equity | 63,792 | 3.2 | 61,798 |
⁽¹⁾ Excluding deletions. | |||
⁽²⁾ Revised balances. For more information, please refer to the “Business Areas” section. | |||
Results
The Corporate Center recorded in the first half of 2026 a net attributable loss of €696 million, representing a deterioration of
78.5% compared to the €-390 million recorded in the same period of the previous year. The evolution of this aggregate is largely
explained by the recording of a more negative NTI in the first half of 2026, originating from exchange rate hedges, mainly due to
the appreciation of the Mexican peso in the year. Additionally, operating expenses include, in the personnel expenses line of the
first half of 2026, the impact of the voluntary redundancies and, in the general expenses line in both periods, the impact of the re-
estimation of the applied pro-rata on the Value Added Tax.
Translation of this report originally issued in Spanish. In the event of a discrepancy, the Spanish-language version prevails. | p.59 |
| January - June 2026 Report |
Additional pro forma information: Corporate & Investment Banking

Highlights for the period January - June 2026
–Credit growth with stability in customer deposits
–Positive evolution of recurring revenues
–Strength of gross income in all business divisions
–Increase in net attributable profit
BUSINESS ACTIVITY ⁽¹⁾ (VARIATION AT CONSTANT EXCHANGE RATES COMPARED TO 31-12-25) | ||

⁽¹⁾ Excluding repos.
RECURRING REVENUES / AVERAGE TOTAL ASSETS (PERCENTAGE AT CONSTANT EXCHANGE RATES) |


OPERATING INCOME (MILLIONS OF EUROS AT CONSTANT EXCHANGE RATES) |
+23.4% | (1) | |||
2,553 | 3,150 | ||

⁽¹⁾ At current exchange rates: +20.5%.

NET ATTRIBUTABLE PROFIT (LOSS) (MILLIONS OF EUROS AT CONSTANT EXCHANGE RATES) |

+20.7% | (1) | ||||
1,702 | 2,054 | ||

⁽¹⁾ At current exchange rates: +18.2%.
The additional pro forma information from CIB excludes the application of hyperinflation accounting and the Group's wholesale business in Venezuela.
Translation of this report originally issued in Spanish. In the event of a discrepancy, the Spanish-language version prevails. | p.60 |
| January - June 2026 Report |

FINANCIAL STATEMENTS AND RELEVANT BUSINESS INDICATORS (MILLIONS OF EUROS AND PERCENTAGE) | ||||
Income statement | 6M26 | ∆ % | ∆ % ⁽¹⁾ | 6M25 ⁽²⁾ |
Net interest income | 2,119 | 23.6 | 26.2 | 1,714 |
Net fees and commissions | 894 | 27.1 | 26.9 | 704 |
Net trading income | 1,278 | 15.8 | 18.4 | 1,103 |
Other operating income and expenses | (40) | 64.3 | 60.8 | (24) |
Gross income | 4,251 | 21.6 | 23.7 | 3,497 |
Operating expenses | (1,101) | 24.7 | 24.5 | (883) |
Personnel expenses | (521) | 20.8 | 21.2 | (431) |
Other administrative expenses | (501) | 28.6 | 27.8 | (390) |
Depreciation | (79) | 27.8 | 26.6 | (62) |
Operating income | 3,150 | 20.5 | 23.4 | 2,614 |
Impairment on financial assets not measured at fair value through profit or loss | (9) | n.s. | n.s. | 55 |
Provisions or reversal of provisions and other results | 5 | (55.9) | (56.6) | 11 |
Profit (loss) before tax | 3,146 | 17.4 | 20.6 | 2,680 |
Income tax | (902) | 18.3 | 21.8 | (762) |
Profit (loss) for the period | 2,244 | 17.0 | 20.1 | 1,918 |
Non-controlling interests | (190) | 5.7 | 14.1 | (180) |
Net attributable profit (loss) | 2,054 | 18.2 | 20.7 | 1,738 |
General note: For the translation of the income statement in those countries where hyperinflation accounting is applied, the punctual exchange rate as of June 30, 2026. | ||||
Balance sheets | 30-06-26 | ∆ % | ∆ % ⁽¹⁾ | 31-12-25 ⁽²⁾ |
Cash, cash balances at central banks and other demand deposits | 16,952 | 12.2 | 9.6 | 15,106 |
Financial assets designated at fair value | 168,612 | 29.1 | 27.5 | 130,559 |
Of which: Loans and advances | 66,595 | 47.2 | 46.9 | 45,254 |
Financial assets at amortized cost | 184,537 | 19.3 | 17.5 | 154,718 |
Of which: Loans and advances to customers | 153,599 | 18.6 | 16.8 | 129,459 |
Inter-area positions | — | — | — | — |
Tangible assets | 265 | (1.6) | (3.8) | 269 |
Other assets | 3,886 | 6.8 | 4.8 | 3,640 |
Total assets/liabilities and equity | 374,252 | 23.0 | 21.2 | 304,292 |
Financial liabilities held for trading and designated at fair value through profit or loss | 127,800 | 30.7 | 29.5 | 97,798 |
Deposits from central banks and credit institutions | 47,614 | 14.0 | 13.2 | 41,780 |
Deposits from customers | 106,121 | 0.3 | (1.0) | 105,751 |
Debt certificates | 17,287 | 25.6 | 24.4 | 13,766 |
Inter-area positions | 52,722 | 91.5 | 80.9 | 27,535 |
Other liabilities | 7,153 | 104.9 | 107.4 | 3,490 |
Allocated regulatory capital | 15,557 | 9.8 | 8.0 | 14,171 |
Relevant business indicators | 30-06-26 | ∆ % | ∆ % ⁽¹⁾ | 31-12-25 ⁽²⁾ |
Performing loans and advances to customers under management ⁽³⁾ | 153,374 | 21.3 | 19.5 | 126,424 |
Non-performing loans | 878 | 45.1 | 50.0 | 605 |
Customer deposits under management ⁽³⁾ | 99,918 | 1.4 | 0.3 | 98,567 |
Off-balance sheet funds ⁽⁴⁾ | 2,438 | (44.5) | (47.6) | 4,394 |
Risk-weighted assets | 127,771 | 7.0 | 5.3 | 119,382 |
RORWA ⁽⁵⁾ | 3.7 | 3.4 | ||
Efficiency ratio (%) | 25.9 | 26.9 | ||
⁽¹⁾ At constant exchange rates. | ||||
⁽²⁾ Revised balances. For more information, please refer to the “Business Areas” section. | ||||
⁽³⁾ Excluding repos. | ||||
⁽⁴⁾ Includes mutual funds, customer portfolios and other off-balance sheet funds. | ||||
⁽⁵⁾ For more information on the calculation methodology, as well as the calculation of the metric at the consolidated Group level, see Alternative Performance Measures at this report. | ||||
17 The additional pro forma information from CIB excludes the application of hyperinflation accounting and the Group's wholesale business in Venezuela.
Translation of this report originally issued in Spanish. In the event of a discrepancy, the Spanish-language version prevails. | p.61 |
| January - June 2026 Report |
Unless expressly stated otherwise, all the comments below on rates of change, for both activity and results, will be given at
constant exchange rates. For the conversion of these figures in those countries in which accounting for hyperinflation is applied,
the end of period exchange rate as of June 30, 2026 is used. These rates, together with changes at current exchange rates, can be
found in the attached tables of financial statements and relevant business indicators. When making comments referring to Europe
in this area, Spain is excluded.
Activity
The most relevant aspects related to the area's activity in the first half of 2026 were:
–Lending activity in the Group's wholesale businesses recorded a solid performance, with balances growing by 19.5% over
the end of 2025. This dynamism was driven by the United States, Europe and Asia (Rest of Business) highlighting the
activity in project finance and corporate lending.
–Customer funds decreased by 1.8% in the first half, mainly due to the evolution of off-balance sheet funds in Mexico.
The most relevant aspects related to the area's activity in the second quarter of 2026 were:
–Lending stood at the end of June 2026, 9.4% above the balance at March 31, 2026, continuing the upward trend of recent
quarters. Growth was observed in both transactional banking and Investment Banking & Finance (IB&F), driven primarily
by the performance of the countries compromising the Rest of Business area, particularly the United States and Asia.
–Customer funds grew by 4.0% during the second quarter of 2026, mainly in Rest of Business.
Results
CIB generated a net attributable profit of €2,054 million in the first six months of 202617. Excluding the impact of currency
fluctuations, this result represents a 20.7% increase over the previous year, which reflects again the strength of the Group's
wholesale businesses, with the aim of offering a value proposition focused on the needs of its customers.
All business divisions posted double-digit revenue growth: Global Markets with good behavior in all its products, particularly in
interest rates and equities; Global Transaction Banking (GTB), thanks to the positive evolution of recurring revenues, mainly net
interest income; excellent results in IB&F, with relevant operations that have generated commission income and a positive
evolution of net interest income. All business divisions showed growth in net attributable profit to shareholders.
The evolution of this aggregate is largely explained by the performance of the Group's wholesale businesses in the United States,
Europe (excluding Spain) and Asia. The most relevant aspects of the year-on-year income statement evolution as of the end of
June 2026 are summarized below:
–Net interest income increased by 26.2%, thanks to the continued growth of the portfolio both in 2025 and in the first half
of 2026, in both GTB and IB&F.
–Net fees and commissions recorded an increase of 26.9%, mainly driven by the strong performance of Project Finance
and Corporate Lending in IB&F as well as by the guarantee activity associated with Working Capital and Trade Finance in
GTB.
–Growth in the NTI line (+18.4%) was driven by commercial activity, with significant performance in interest rates, credit
and equities.
Translation of this report originally issued in Spanish. In the event of a discrepancy, the Spanish-language version prevails. | p.62 |
| January - June 2026 Report |
–Operating expenses grew by 24.5% driven by higher personnel expenses, associated with strategic plans and new
capacities, together with the impact of the voluntary redundancies in the first quarter of 2026, and higher general
expenses (mainly in technology).
–The impairment on financial assets line recorded a provision of €-9 million, which contrasts with the releases of the first
half of 2025, mainly originated in Turkey.
In the second quarter of 2026 and excluding the effect of the variation in exchange rates, the Groups wholesale businesses
generated a net attributable profit of €979m, which represents a decrease of 9.0% compared to the previous quarter. This
evolution is mainly impacted by lower net fees and commissions and NTI, which were very high in the previous quarter.
18 With the exception, mainly, of those countries whose economies have been considered hyperinflationary, for which the closing exchange rate of the most recent
period will be used.
Translation of this report originally issued in Spanish. In the event of a discrepancy, the Spanish-language version prevails. | p.63 |
| January - June 2026 Report |
Alternative Performance Measures
(APMs)
BBVA presents its results in accordance with the International Financial Reporting Standards (EU-IFRS). Additionally, the Group
also considers that some Alternative Performance Measures (hereinafter APMs) provide useful additional financial information
that should be taken into account when evaluating performance. They are considered complementary information and do not
replace the financial information drafted according to the EU-IFRS. These APMs are also used when making financial, operational
and planning decisions within the Entity. The Group firmly believes that they give a true and fair view of its financial information.
These APMs are generally used in the financial sector as indicators for monitoring the assets, liabilities and economic and financial
situation of entities.
BBVA Group's APMs are given below. They are presented in accordance with the European Securities and Markets Authority
(ESMA) guidelines, published on October 5, 2015 (ESMA/2015/1415en). The guideline mentioned before is aimed at promoting
the usefulness and transparency of APMs included in prospectuses or regulated information in order to protect investors in the
European Union. In accordance with the indications given in the aforementioned guideline, BBVA Group's APMs:
–Include clear and readable definitions of the APMs.
–Disclose the reconciliations to the most directly reconcilable line item, subtotal or total presented in the financial
statements of the corresponding period, separately identifying and explaining the material reconciling items.
–Are standard measures generally used in the financial industry, so their use provides comparability in the analysis of
performance between issuers.
–Do not have greater preponderance than measures directly stemming from financial statements.
–Are accompanied by comparatives for previous periods.
–Are consistent over time.
Constant exchange rates
When comparing two dates or periods in this report, the impact of changes in the exchange rates against the euro of the
currencies of the countries in which BBVA operates is sometimes excluded, assuming that exchange rates remain constant. This is
done for the amounts in the income statement by using the average exchange rate against the euro in the most recent period for
each currency18 of the geographical areas in which the Group operates, and applying it to both periods; for amounts in the balance
sheet and activity, the closing exchange rates in the most recent period are used.
During the year 2025 and the first half of 2026, there were no corporate transactions, non-recurring impacts or other types of
adjustments for management purposes that determine a net attributable profit or a profit for the period different from those
disclosed in the Consolidated Financial Statements. For this reason, as there are no differences between the Consolidated
Financial Statements and the consolidated management results statement, no reconciliation is presented for the periods disclosed
in this report. For the same reason, the Group does not present among its Alternative Performance Measures shown below an
adjusted profit for the period nor an adjusted net attributable profit, neither does it present the profitability ratios derived from
them: that is, adjusted ROE, adjusted ROTE, adjusted RORC, adjusted ROA and adjusted RORWA.
Translation of this report originally issued in Spanish. In the event of a discrepancy, the Spanish-language version prevails. | p.64 |
| January - June 2026 Report |
Regarding the consideration of the sale of the subsidiaries in Romania in the Alternative Performance Measures presented below,
these have been calculated on a continuity basis, that is, without taking into account the classification of these companies as
NCA&L on the Group's consolidated balance sheet.
Profitability and efficiency ratios
ROE
The ROE (return on equity) ratio measures the accounting return obtained on an entity's shareholders' funds plus accumulated
other comprehensive income. It is calculated as follows:

Net attributable profit (loss) |
Average shareholders' funds + Average accumulated other comprehensive income |
Explanation of the formula: the numerator is the net attributable profit (loss) of the Group's consolidated income statement. If the
metric is presented on a date before the close of the fiscal year, the numerator will be annualized.
Average shareholders' funds are the weighted moving average of the shareholders' funds at the end of each month of the period
analyzed, adjusted to take into account the execution of the "Dividend-option" at the closing dates on which it was agreed to
deliver this type of dividend prior to the publication of the Group´s results.
Average accumulated other comprehensive income is the moving weighted average of "Accumulated other comprehensive
income", which is part of the equity on the Entity's balance sheet and is calculated in the same way as average shareholders’ funds
(above).
Relevance of its use: this ratio is very commonly used not only in the banking sector but also in other sectors to measure the return
obtained on shareholders' funds.

ROE | |||||
Jan.-Jun.2026 | Jan.-Dec.2025 | Jan.-Jun.2025 | |||
Numerator (Millions of euros) | = | Net attributable profit (loss) annualized | 12,203 | 10,511 | 10,985 |
Denominator (Millions of euros) | + | Average shareholders' funds | 75,936 | 75,270 | 73,986 |
+ | Average accumulated other comprehensive income | (18,117) | (18,147) | (17,675) | |
= | ROE | 21.1% | 18.4% | 19.5% | |
ROTE
The ROTE (return on tangible equity) ratio measures the accounting return on an entity's shareholders' funds, plus accumulated
other comprehensive income, and excluding intangible assets. It is calculated as follows:

Net attributable profit (loss) |
Average shareholders' funds + Average accumulated other comprehensive income - Average intangible assets |
Explanation of the formula: the numerator "Net attributable profit (loss)" and the items in the denominator "Average intangible
assets" and "Average accumulated other comprehensive income" are the same items and are calculated in the same way as
explained for ROE.
19 The target fully loaded CET1 ratio considered for the purposes of this metric has been placed at 12%, at the top of the Group's established target management range
of 11.5-12.0% of CET1.
Translation of this report originally issued in Spanish. In the event of a discrepancy, the Spanish-language version prevails. | p.65 |
| January - June 2026 Report |
Average intangible assets are the intangible assets on the Group's consolidated balance sheet, including goodwill and other
intangible assets. The average balance is calculated in the same way as explained for shareholders funds in ROE.
Relevance of its use: this metric is generally used not only in the banking sector but also in other sectors to measure the return
obtained on shareholders' funds, not including intangible assets.

ROTE | |||||
Jan.-Jun.2026 | Jan.-Dec.2025 | Jan.-Jun.2025 | |||
Numerator (Millions of euros) | = | Net attributable profit (loss) annualized | 12,203 | 10,511 | 10,985 |
Denominator (Millions of euros) | + | Average shareholders' funds | 75,936 | 75,270 | 73,986 |
+ | Average accumulated other comprehensive income | (18,117) | (18,147) | (17,675) | |
- | Average intangible assets | 2,955 | 2,596 | 2,509 | |
= | ROTE | 22.2% | 19.3% | 20.4% | |
RORC
The RORC (return on regulatory capital) measures the return on regulatory capital necessary to meet the CET1 fully loaded target
ratio19. It is calculated as follows:

Net attributable profit (loss) |
Average regulatory capital of the Group |
Explanation of the formula: the numerator is the net attributable profit (loss), described above. The denominator is the average
regulatory capital of the Group, defined as the Risk Weighted Assets multiplied by the CET1 fully loaded target ratio plus regulatory
deductions plus the perimeter differences between regulatory and accounting own funds less Solvency minority interests. If the
described metric is presented on a date prior to the end of the year, the numerator will be presented on an annualized basis.
Relevance of its use: this metric is generally used in the banking sector.

RORC | |||||
Jan.-Jun.2026 | Jan.-Dec.2025 | Jan.-Jun.2025 | |||
Numerator (Millions of euros) | = | Net attributable profit (loss) annualized | 12,203 | 10,511 | 10,985 |
Denominator (Millions of euros) | = | Average regulatory capital of the Group | 51,694 | 49,736 | 49,791 |
= | RORC | 23.6% | 21.1% | 22.1% | |
Translation of this report originally issued in Spanish. In the event of a discrepancy, the Spanish-language version prevails. | p.66 |
| January - June 2026 Report |
ROA
The ROA (return on assets) ratio measures the accounting return obtained on an entity's assets. It is calculated as follows:

Profit (loss) for the period |
Average total assets |
Explanation of the formula: the numerator is the profit (loss) for the period of the Group's consolidated income statement. If the
metric is presented on a date before the close of the fiscal year, the numerator must be annualized.
Average total assets are taken from the Group’s consolidated balance sheet. The average balance is calculated as explained for
average shareholders' funds in the ROE.
Relevance of its use: this ratio is generally used not only in the banking sector but also in other sectors to measure the return
obtained on assets.

ROA | ||||
Jan.-Jun.2026 | Jan.-Dec.2025 | Jan.-Jun.2025 | ||
Numerator (Millions of euros) | Profit (loss) for the period annualized | 13,046 | 11,126 | 11,693 |
Denominator (Millions of euros) | Average total assets | 928,324 | 817,040 | 791,760 |
= | ROA | 1.4% | 1.4% | 1.5% |
RORWA
The RORWA (return on risk-weighted assets) ratio measures the accounting return obtained on average risk-weighted assets. It is
calculated as follows:

Profit (loss) for the period |
Average risk-weighted assets |
Explanation of the formula: the numerator "Profit (loss) for the period" is the same and is calculated in the same way as explained
for ROA.
Average risk-weighted assets (RWA) are the moving weighted average of the RWA at the end of each month of the period under
analysis.
Relevance of its use: this ratio is generally used in the banking sector to measure the return obtained on RWA.

RORWA | ||||
Jan.-Jun.2026 | Jan.-Dec.2025 | Jan.-Jun.2025 | ||
Numerator (Millions of euros) | Profit (loss) for the period annualized | 13,046 | 11,126 | 11,693 |
Denominator (Millions of euros) | Average RWA | 412,954 | 397,508 | 400,302 |
= | RORWA | 3.2% | 2.8% | 2.9% |
Translation of this report originally issued in Spanish. In the event of a discrepancy, the Spanish-language version prevails. | p.67 |
| January - June 2026 Report |
Efficiency ratio
This measures the percentage of gross income consumed by an entity's operating expenses. It is calculated as follows:

Operating expenses |
Gross income |
Explanation of the formula: both "Operating expenses" and "Gross income" are taken from the Group’s consolidated income
statement. Operating expenses are the sum of the administration costs (personnel expenses plus other administrative expenses)
plus depreciation. Gross income is the sum of net interest income, net fees and commissions, net trading income dividend income,
share of profit or loss of entities accounted for using the equity method, other operating income and expenses, and income from
assets and expenses from liabilities under insurance and reinsurance contracts. For a more detailed calculation of this ratio, the
graphs on "Results" section of this report should be consulted, one of them with calculations with figures at current exchange rates
and another with the data at constant exchange rates.
Relevance of its use: this ratio is generally used in the banking sector.

EFFICIENCY RATIO | |||||
Jan.-Jun.2026 | Jan.-Dec.2025 | Jan.-Jun.2025 | |||
Numerator (Millions of euros) | + | Operating expenses | 8,000 | 14,332 | 6,787 |
Denominator (Millions of euros) | + | Gross income | 21,159 | 36,931 | 18,034 |
= | Efficiency ratio | 37.8% | 38.8% | 37.6% | |
Other ratios
Earnings (loss) per share
The earnings (loss) per share is calculated in accordance to the criteria established in the IAS 33 “Earnings per share”.

EARNINGS (LOSS) PER SHARE | |||||
Jan.-Jun.2026 | Jan.-Dec.2025 | Jan.-Jun.2025 | |||
(Millions of euros) | + | Net attributable profit (loss) | 6,051 | 10,511 | 5,447 |
(Millions of euros) | - | Remuneration related to the Additional Tier 1 securities (CoCos) | 211 | 397 | 200 |
Numerator (millions of euros) | = | Net attributable profit (loss) ex.CoCos remuneration | 5,841 | 10,114 | 5,247 |
Denominator (millions) ⁽¹⁾ | + | Weighted average number of shares of the period | 5,669 | 5,762 | 5,763 |
- | Average treasury shares of the period | 7 | 9 | 10 | |
- | Share buyback program (average) | 48 | 5 | — | |
= | Earnings (loss) per share (euros) | 1.04 | 1.76 | 0.91 | |
⁽¹⁾ Earnings per share is calculated using the weighted average number of ordinary shares outstanding during the period, taking into account the impact of share buybacks and redemptions of shares. | |||||
Additionally, for management purposes, the adjusted earnings (loss) per share is presented.
Translation of this report originally issued in Spanish. In the event of a discrepancy, the Spanish-language version prevails. | p.68 |
| January - June 2026 Report |

ADJUSTED EARNINGS (LOSS) PER SHARE | |||||
Jan.-Jun.2026 | Jan.-Dec.2025 | Jan.-Jun.2025 | |||
Numerator (millions of euros) | = | Net attributable profit (loss) ex. CoCos remuneration | 5,841 | 10,114 | 5,247 |
Denominator (millions) ⁽¹⁾ | + | Number of shares | 5,581 | 5,709 | 5,763 |
- | Treasury shares | 6 | 10 | 8 | |
- | Shares buyback program ⁽²⁾ | 45 | 7 | — | |
= | Adjusted earnings (loss) per share (euros) | 1.06 | 1.78 | 0.91 | |
⁽¹⁾ Adjusted earnings per share is calculated using the number of ordinary shares outstanding at the end of each period, net of treasury shares. | |||||
⁽²⁾ For the period January - June 2026, the buyback program includes the shares acquired between May 6 and June 30, 2026, corresponding to the Third Tranche of the share buyback program. | |||||
Book value per share
The book value per share determines the value of a company on its books for each share held. It is calculated as follows:

Shareholders' funds + Accumulated other comprehensive income |
Number of shares outstanding net of treasury shares |
Explanation of the formula: the figures for both "Shareholders' funds" and "Accumulated other comprehensive income" are taken
from the balance sheet. Shareholders' funds are adjusted to take into account the execution of the "Dividend-option" at the closing
dates on which it was agreed to deliver this type of dividend prior to the publication of the Group´s results. The denominator
includes the final number of outstanding shares, net of own shares (treasury shares) and net of the shares corresponding to share
buyback programs. In addition, the denominator is also adjusted to include the capital increase resulting from the execution of the
dividend options explained above. Both the numerator and the denominator take into account period-end balances.
Relevance of its use: it shows the company's book value for each share issued. It is a generally used ratio, not only in the banking
sector but also in others.

BOOK VALUE PER SHARE | |||||
30-06-26 | 31-12-25 | 30-06-25 | |||
Numerator (Millions of euros) | + | Shareholders' funds | 75,614 | 76,228 | 75,724 |
+ | Accumulated other comprehensive income | (16,661) | (18,871) | (18,896) | |
Denominator (Millions of shares) ⁽¹⁾ | + | Number of shares | 5,581 | 5,709 | 5,763 |
- | Treasury shares | 6 | 10 | 8 | |
- | Share buyback program ⁽²⁾ | 71 | 73 | — | |
= | Book value per share (euros / share) | 10.71 | 10.19 | 9.87 | |
⁽¹⁾ Book value per share is calculated using the number of ordinary shares outstanding at the end of each period, net of treasury shares. | |||||
⁽²⁾ As of June 30, 2026, includes the shares acquired from May 6, 2026, to June 30, 2026 corresponding to the third tranche of the share buyback program, which began on May 6, 2026, as well as the estimate, based on market prices, of number of shares pending execution from the same buyback program. | |||||
Translation of this report originally issued in Spanish. In the event of a discrepancy, the Spanish-language version prevails. | p.69 |
| January - June 2026 Report |
Tangible book value per share
The tangible book value per share determines the value of the company on its books for each share held by shareholders in the
event of liquidation. It is calculated as follows:

Shareholders' funds + Accumulated other comprehensive income - Intangible assets |
Number of shares outstanding net of treasury shares |
Explanation of the formula: the figures for "Shareholders' funds", "Accumulated other comprehensive income" and "Intangible
assets" are all taken from the balance sheet and additionally, the "Intangible Assets" of subsidiaries in Romania classified as
NCA&L are considered. Shareholders' funds are adjusted to take into account the execution of the "Dividend-option" at the closing
dates on which it was agreed to deliver this type of dividend prior to the publication of the Group´s results. The denominator
includes the final number of shares outstanding, net of own shares (treasury shares) and net of the shares corresponding to share
buyback programs which are deducted from the shareholders' funds. In addition, the denominator is also adjusted to include the
result of the capital increase resulting from the execution of the dividend options explained above. Both the numerator and the
denominator take into account period-end balances.
Relevance of its use: it shows the company's book value for each share issued, after deducting intangible assets. It is a generally
used ratio, not only in the banking sector but also in others.

TANGIBLE BOOK VALUE PER SHARE | |||||
30-06-26 | 31-12-25 | 30-06-25 | |||
Numerator (Millions of euros) | + | Shareholders' funds | 75,614 | 76,228 | 75,724 |
+ | Accumulated other comprehensive income | (16,661) | (18,871) | (18,896) | |
- | Intangible assets | 3,123 | 2,856 | 2,563 | |
Denominator (Millions of shares) ⁽¹⁾ | + | Number of shares | 5,581 | 5,709 | 5,763 |
- | Treasury shares | 6 | 10 | 8 | |
- | Share buyback program ⁽²⁾ | 71 | 73 | — | |
= | Tangible book value per share (euros / share) | 10.14 | 9.69 | 9.43 | |
⁽¹⁾ Tangible book value per share is calculated using the number of ordinary shares outstanding at the end of each period, net of treasury shares. | |||||
⁽²⁾ As of June 30, 2026, includes the shares acquired from May 6, 2026, to June 30, 2026 corresponding to the third tranche of the share buyback program, which began on May 6, 2026, as well as the estimate, based on market prices, of number of shares pending execution from the same buyback program. | |||||
Credit risk indicators
In order to more accurately reflect the evolution of the Group's credit risk, BBVA updated in 2025 the definition of the risk
indicators presented here, including them to the business model whose objective is to receive contractual cash flows and sale of
the financial assets.
In this context, the indicators incorporate, in both the numerator and the denominator, loans and advances classified at fair value
with changes in other comprehensive income, managed under a Held to Collect and Sell business model, together with the assets
at amortized cost and the corresponding contingent risk.
This update allows risk metrics to more accurately represent the credit risk actually managed, avoiding distortions that do not
respond to a deterioration of risk, but to strategic balance sheet management decisions.
20 IFRS 9 classifies financial instruments into three stages, which depend on the evolution of their credit risk from the moment of initial recognition. The stage 1 includes
operations when they are initially recognized, stage 2 comprises operations for which a significant increase in credit risk has been identified since their initial recognition
and, stage 3, impaired operations.
Translation of this report originally issued in Spanish. In the event of a discrepancy, the Spanish-language version prevails. | p.70 |
| January - June 2026 Report |
Non-performing loan (NPL) ratio
It is the ratio between the risks classified for accounting purposes as non-performing loans and the total credit risk balance. It is
calculated as follows:

Non-performing loans |
Total credit risk |
Explanation of the formula: non-performing loans and the credit risk balance are gross, meaning they are not adjusted by
associated accounting provisions.
Non-performing loans are calculated as the sum of “loans and advances at amortized cost”, "the fair value loan portfolio through
other comprehensive income" and the “contingent risk” in stage 320 and the following counterparties:
•other financial entities
•public sector
•non-financial institutions
•households, excluding central banks and other credit institutions.
The credit risk balance is calculated as the sum of "loans and advances at amortized cost", "the fair value loan portfolio through
other comprehensive income" and "contingent risk" in stage 1 + stage 2 + stage 3 of the previous counterparts.
This indicator is shown, as others, at a business area level.
Relevance of its use: this is one of the main indicators used in the banking sector to monitor the current situation and changes in
credit risk quality, and specifically, the relationship between risks classified in the accounts as non-performing loans and the total
balance of credit risk, with respect to customers and contingent liabilities.

NON-PERFORMING LOANS (NPLS) RATIO | ||||
30-06-26 | 31-12-25 | 30-06-25 | ||
Numerator (Millions of euros) | NPLs | 15,976 | 14,837 | 14,621 |
Denominator (Millions of euros) | Credit Risk | 608,755 | 547,184 | 503,733 |
= | Non-Performing Loans (NPLs) ratio | 2.6% | 2.7% | 2.9% |
NPL coverage ratio
This ratio reflects the degree to which the impairment of non-performing loans has been covered in the accounts via allowances. It
is calculated as follows:

Provisions |
Non-performing loans |
Explanation of the formula: it is calculated as "Provisions" from stage 1 + stage 2 + stage 3, divided by non-performing loans,
formed by “credit risk” from stage 3.
Provisions understood as the value adjustments associated with loans and advances to customers at amortized cost and fair value
with changes in other comprehensive income, together with the provisions associated with contingent risks, of the counterparties
included in the non-performing loans balance.
Translation of this report originally issued in Spanish. In the event of a discrepancy, the Spanish-language version prevails. | p.71 |
| January - June 2026 Report |
This indicator is shown, as others, at a business area level.
Relevance of its use: this is one of the main indicators used in the banking sector to monitor the situation and changes in the
quality of credit risk, reflecting the degree to which the impairment of non-performing loans has been covered in the accounts via
value adjustments.

NPL COVERAGE RATIO | ||||
30-06-26 | 31-12-25 | 30-06-25 | ||
Numerator (Millions of euros) | Provisions | 13,527 | 12,604 | 11,859 |
Denominator (Millions of euros) | NPLs | 15,976 | 14,837 | 14,621 |
= | NPL coverage ratio | 85% | 85% | 81% |
Cost of risk
This ratio indicates the current situation and changes in credit-risk quality through the annual cost in terms of impairment losses
(accounting loan-loss provisions) of each unit of loans and advances to customers (gross). It is calculated as follows:

Loan-loss provisions |
Average loans and advances to customers (gross) |
Explanation of the formula: "Loans to customers (gross)" refers to the "Loans and advances at amortized cost" and the "fair value
loan portfolio through other comprehensive income" portfolios with the following counterparts:
•other financial entities
•public sector
•non-financial institutions
•households, excluding central banks and other credit institutions.
Average loans to customers (gross) is calculated by using the average of the period-end balances of each month of the period
analyzed plus the previous month. If the metric is presented on a date before the close of the fiscal year, the numerator will be
annualized. By doing this, "Annualized loan-loss provisions" are calculated by accumulating and annualizing the loan-loss
provisions of each month of the period under analysis (based on days passed).
Loan-loss provisions refer to the aforementioned loans and advances at amortized cost and the fair value loan portfolio through
other comprehensive income portfolios.
This indicator is shown, as others, at a business area level.
Relevance of its use: this is one of the main indicators used in the banking sector to monitor the situation and changes in the
quality of credit risk through the cost over the year.

COST OF RISK | ||||
Jan.-Jun.2026 | Jan.-Dec.2025 | Jan.-Jun.2025 | ||
Numerator (Millions of euros) | Loan-loss provisions annualized | 7,054 | 6,115 | 5,643 |
Denominator (Millions of euros) | Average loans to customers (gross) | 493,408 | 439,525 | 428,545 |
= | Cost of risk | 1.43% | 1.39% | 1.32% |
Translation of this report originally issued in Spanish. In the event of a discrepancy, the Spanish-language version prevails. | p.72 |
| January - June 2026 Report |
Legal disclaimer
This document is provided for informative purposes only and is not intended to provide financial advice and, therefore, does not constitute, nor
should it be interpreted as, an offer to sell, exchange or acquire, or an invitation for offers to acquire securities issued by any of the aforementioned
companies, or to contract any financial product. Any decision to purchase or invest in securities or contract any financial product must be made
solely and exclusively on the basis of the information made available to such effects by the relevant company in relation to each such specific
matter. The information contained in this document is subject to and should be read in conjunction with all other publicly available information of
the issuer.
This document contains forward-looking statements that constitute or may constitute “forward-looking statements” (within the meaning of the
“safe harbor” provisions of the United States Private Securities Litigation Reform Act of 1995) with respect to intentions, objectives, expectations
or estimates as of the date hereof, including those relating to future targets of both a financial and non-financial nature (such as environmental,
social or governance (“ESG”) performance targets).
Forward-looking statements may be identified by the fact that they do not refer to historical or current facts and include words such as “believe”,
“expect”, “estimate”, “project”, “anticipate”, “duty”, “intend”, “likelihood”, “risk”, “VaR”, “purpose”, “commitment”, “goal”, “target” and similar
expressions or variations of those expressions. They include, for example, statements regarding future growth rates or the achievement of future
targets, including those relating to ESG performance.
The information contained in this document reflects our current expectations, estimates and targets, which are based on various assumptions,
judgments and projections, including non-financial considerations such as those related to sustainability, which may differ from and not be
comparable to those used by other companies. Forward-looking statements are not guarantees of future results, and actual results may differ
materially from those anticipated in the forward-looking statements as a result of certain risks, uncertainties and other factors. These factors
include, but are not limited to, (1) market conditions, macroeconomic factors, domestic and international stock market conditions, exchange rates,
inflation and interest rates, geopolitical tensions and tariff policies; (2) regulatory, oversight, political, governmental, social and demographic
factors; (3) changes in the financial condition, creditworthiness or solvency of our clients, debtors or counterparties, such as changes in default
rates, as well as changes in consumer spending, savings and investment behavior, and changes in our credit ratings; (4) competitive pressures and
actions we take in response thereto; (5) performance of our IT, operations and control systems and our ability to adapt to technological changes;
(6) climate change and the occurrence of natural or man-made disasters, such as an outbreak or escalation of hostilities; (7) our ability to
appropriately address any ESG expectations or obligations (related to our business, management, corporate governance, disclosure or otherwise),
and the cost thereof; and (8) our ability to successfully complete and integrate acquisitions. In the particular case of certain targets related to our
ESG performance, such as, decarbonization targets or alignment of our portfolios, the achievement and progress towards such targets will depend
to a large extent on the actions of third parties, such as clients, governments and other stakeholders, and may therefore be materially affected by
such actions, or lack thereof, as well as by other exogenous factors that do not depend on BBVA (including, but not limited to, new technological
developments, regulatory developments, military conflicts, the evolution of climate and energy crises, etc.). Therefore, these targets may be
subject to future revisions.
The factors mentioned in the preceding paragraphs could cause actual future results to differ substantially from those set forth in the forecasts,
intentions, objectives, targets or other forward-looking statements included in this document or in other past or future documents. Accordingly,
results, including those related to ESG performance targets, among others, may differ materially from the statements contained in the forward-
looking statements.
Recipients of this document are cautioned not to place undue reliance on such forward-looking statements.
Past performance or growth rates are not indicative of future performance, results or share price (including earnings per share). Nothing in this
document should be construed as a forecast of results or future earnings.
BBVA does not intend, and undertakes no obligation, to update or revise the contents of this or any other document if there are any changes in the
information contained therein, or including the forward-looking statements contained in any such document, as a result of events or circumstances
after the date of such document or otherwise except as required by applicable law.
SIGNATURE
Pursuant to the requirements of the Securities Exchange Act of 1934, the registrant has duly caused this report to be signed on
its behalf by the undersigned, thereunto duly authorized.
Banco Bilbao Vizcaya Argentaria, S.A. | ||||||
Date: July 30, 2026 | By: | /s/ MªÁngeles Peláez Morón | ||||
Name: | MªÁngeles Peláez Morón | |||||
Title: | Head of Accounting & Regulatory Reporting | |||||
Serious News for Serious Traders! Try StreetInsider.com Premium Free!
You May Also Be Interested In
- Banco Bilbao Vizcaya Argentaria SA (BBVA:SM) (BBVA) PT Raised to EUR27.10 at JPMorgan
- JD.com’s 7Fresh Kitchen: “Chef Transformer” is coming!
- Roche’s collaborator MediLink announces phase III data for Tam-Peli showing significantly improved overall survival in Chinese patient population with relapsed small-cell lung cancer
Create E-mail Alert Related Categories
SEC FilingsSign up for StreetInsider Free!
Receive full access to all new and archived articles, unlimited portfolio tracking, e-mail alerts, custom newswires and RSS feeds - and more!
