



Form 6-K Avolon Holdings Ltd For: Aug 05
 Tweet
Tweet Share
Share E-mail
UNITED STATES
SECURITIES AND EXCHANGE COMMISSION
Washington, D.C. 20549
Form 6-K
REPORT OF FOREIGN PRIVATE ISSUER
PURSUANT TO RULE 13a-16 OR 15d-16
UNDER THE SECURITIES EXCHANGE ACT OF 1934
| For the month of August 2015 | Commission File Number 001-36767 |
AVOLON HOLDINGS LIMITED
(Translation of Registrant’s Name into English)
The Oval, Building 1
Shelbourne Road
Ballsbridge, Dublin 4
Ireland
Telephone: +353 (1) 231 5800
(Address of Principal Executive Office)
Indicate by check mark whether the registrant files or will file annual reports under cover of Form 20-F or Form 40-F.
Form 20-F x Form 40-F ¨
Indicate by check mark if the registrant is submitting the Form 6-K in paper as permitted by Regulation S-T Rule 101(b)(1): ¨
Note: Regulation S-T Rule 101(b)(1) only permits the submission in paper of a Form 6-K if submitted solely to provide an attached annual report to security holders.
Indicate by check mark if the registrant is submitting the Form 6-K in paper as permitted by Regulation S-T Rule 101(b)(7) ): ¨
Note: Regulation S-T Rule 101(b)(7) only permits the submission in paper of a Form 6-K if submitted to furnish a report or other document that the registrant foreign private issuer must furnish and make public under the laws of the jurisdiction in which the registrant is incorporated, domiciled or legally organized (the registrant’s “home country”), or under the rules of the home country exchange on which the registrant’s securities are traded, as long as the report or other document is not a press release, is not required to be and has not been distributed to the registrant’s security holders, and, if discussing a material event, has already been the subject of a Form 6-K submission or other Commission filing on EDGAR.
On August 5, 2015, Avolon Holdings Limited announced the results for the second quarter ended June 30, 2015.
Exhibits
| 99.1 | Avolon Holdings Limited Press Release | |
| 99.2 | Avolon Holdings Limited Earnings Presentation | |
2
SIGNATURES
Pursuant to the requirements of the Securities Exchange Act of 1934, the registrant has duly caused this report to be signed on its behalf by the undersigned, thereunto duly authorized.
| AVOLON HOLDINGS LIMITED | ||||
| By: | /s/ Ed Riley | |||
| Name: | Ed Riley | |||
| Title: | General Counsel and Company Secretary | |||
Date: August 5, 2015
3
EXHIBIT INDEX
| 99.1 | Avolon Holdings Limited Press Release | |
| 99.2 | Avolon Holdings Limited Earnings Presentation | |
4
Exhibit 99.1

2015 Second Quarter Results
83% Increase in Q2 Adjusted Net Income; Q2 Adjusted ROE of 16%
Dublin | August 5, 2015: Avolon (NYSE: AVOL), the international aircraft leasing company, today announced results for the second quarter of 2015 (“Q2”) and the first six months of 2015.
2015 Second Quarter | Financial Highlights
| • | Net Income up 133% to $56 million versus Q2 2014 |
| • | Adjusted Net Income up 83% to $62 million versus Q2 20141 |
| • | Sold three aircraft in Q2 with a net book value of $170 million at a gain of $23 million or 13.3% premium to net book value |
| • | $622 million of new sale and leaseback commitments in Q2 |
| • | 730 basis point year-on-year increase in Return on Equity from 7.1% in Q2 2014 to 14.4% |
| • | 600 basis point increase in Adjusted Return on Equity from 10.0% in Q2 2014 to 16.0% |
| • | Undrawn debt of $849 million at end Q2; further reduction in average interest rate2 to 3.5% at end of Q2 |
| • | Post quarter end, Bohai Leasing made a tender offer to acquire a 20% interest in Avolon at $26 per share |
| • | SLB agreement with Hainan Airlines for five Boeing 787-9 aircraft, subject to completion of tender offer |
2015 Second Quarter | Key Performance Measures
| Three Months Ended June 30 |
Six Months Ended June 30 |
|||||||||||||||
| $’000 except where indicated | 2014 | 2015 | 2014 | 2015 | ||||||||||||
| Total Revenue |
133,095 | 183,908 | 268,849 | 359,636 | ||||||||||||
| Net Income |
23,929 | 55,619 | 60,350 | 104,973 | ||||||||||||
| Adjusted Net Income1 |
33,567 | 61,598 | 79,488 | 123,302 | ||||||||||||
| ROE |
7.1 | % | 14.4 | % | 9.0 | % | 13.6 | % | ||||||||
| Adjusted ROE1 |
10.0 | % | 16.0 | % | 11.8 | % | 16.0 | % | ||||||||
| Diluted EPS ($) |
0.31 | 0.68 | 0.77 | 1.29 | ||||||||||||
| Adjusted EPS1 |
0.41 | 0.75 | 0.97 | 1.50 | ||||||||||||
| Weighted Average Shares Outstanding Diluted |
78,307,618 | 81,227,419 | 78,332,823 | 81,174,750 | ||||||||||||
| Issued Shares |
81,681,131 | 3 | 82,428,607 | 4 | 81,681,131 | 3 | 82,428,607 | 4 | ||||||||
| 1 | Throughout this release, we use adjusted metrics. See Non-GAAP reconciliation for the three months and six months ended June 30, 2015 on page 9 together with reconciliation for 2015 guidance. |
| 2 | Annualised Cost of Funds at end of period does not include the effect of up-front fees, undrawn fees, issuance cost amortization or fair value gains / losses on derivative financial instruments. |
| 3 | Issued shares as at December 31, 2014 including 2014 LTIP grant |
| 4 | Issued shares as at June 30, 2015 including 2014 and 2015 LTIP grant |
| Avolon | Q2 2015 | Page 1 |
2015 Second Quarter | Portfolio Highlights
| • | Owned and managed fleet of 152 aircraft at end of Q2; Owned, managed and committed fleet of 260 aircraft |
| • | At end of Q2, average age of owned fleet of 2.6 years; average remaining lease term of 7.2 years |
| • | Delivered 14 new aircraft to 10 airlines based in 10 countries in Q2 |
| • | Placement of first aircraft from Avolon’s Boeing 737 MAX order; letter of intent signed for three MAX aircraft |
| • | Avolon’s 2016 commitments now stand at almost $1.4 billion; excluding three Boeing 787-9 aircraft which would deliver in 2016 under the five aircraft sale and leaseback transaction with Hainan Airlines |
| • | All new deliveries placed through July 2018 |
Outlook
| • | Re-affirm 2015 full year expectations to deliver aircraft with a net book value of $1.67 billion |
| • | Upgrading guidance on aircraft trading for 2015 full year - expected full year Net Trading Gains for 2015 of $60 million to $65 million increased from $55 million to $60 million range as at March 31, 2015 |
| • | Guidance on 2015 returns unchanged: expected to deliver Adjusted Return on Equity of 14.7% to 15.0%1 or a Return on Equity of 12.8% to 13.1% |
| • | Costs associated with Bohai Leasing investment of c. $5 million to $6 million in Q3 2015 |
Dómhnal Slattery, Avolon, CEO commented:
“Avolon has again delivered double-digit growth against key financial and operating performance metrics in the second quarter. We have added significant commitments to our pipeline, upgraded our 2015 full year aircraft trading guidance and recorded an adjusted ROE of 16%. Post quarter-end, we have also announced two important developments with the launch of a tender offer by Bohai Leasing for a 20% stake in Avolon at $26 per share and, subject to the completion of that offer, a significant sale and leaseback transaction with Hainan Airlines.
We are particularly pleased with our continued execution of both sale and leaseback transactions and the sale of aircraft in the quarter. This is testament to the strength of our team and our network of relationships. We delivered $622 million of new commitments reflecting our proven ability to secure growth through sale and leasebacks in both the contested and uncontested markets. We have now secured close to $1.4 billion of delivery commitments for 2016 which locks in substantial growth for the business in the year ahead.
The second quarter also marks twelve consecutive quarters of profitable aircraft trading for Avolon. As a result of our consistent execution, we expect to exceed our prior full year trading volume target and have upgraded our profit guidance for this segment of our business.
We believe we have the right team and right business model, together with best-in-class risk management systems, to continue to deliver superior growth with lower risk, which will ultimately drive returns for our shareholders. We re-affirm our 2015 guidance and look forward to the continued growth of the business into 2016.”
| Avolon | Q2 2015 | Page 2 |
Conference Call and Webcast
Avolon will host a conference call and live webcast at 8.30am ET (1.30pm BST) today, August 5, 2015. Dial in details are outlined below and the webcast will be available on: www.avolon.aero
| US: | +1 718 873 9077 | |
| Europe: | +44 203 139 4830 | |
| Asia: | +86 400 681 5421 | |
| Passcode: | 14641153# |
A copy of the related slide presentation is available on the Avolon website. An audio archive and transcript of the event will be available on the website shortly following the call. A conference call replay will also be available for 30 days on US: 1 866 535 8030 or UK: +44 20 3426 2807. Passcode is 660654#
Avolon Portfolio
| June 30, 2014 | June 30, 2015 | |||||||
| Owned aircraft |
116 | 143 | ||||||
| Managed aircraft |
12 | 9 | ||||||
| Committed aircraft |
74 | 108 | ||||||
|
|
|
|
|
|||||
| Total |
202 | 260 | ||||||
|
|
|
|
|
|||||
| Average age of owned fleet* (years) |
2.4 | 2.6 | ||||||
| Average remaining lease term* (years) |
6.8 | 7.2 | ||||||
| * | Weighted by net book value. |
Avolon Owned Managed & Committed Portfolio at June 30, 2015
| Aircraft Type |
Owned | Managed | Committed | Total | ||||||||||||
| A319ceo |
1 | — | — | 1 | ||||||||||||
| A320ceo |
49 | 3 | 16 | 68 | ||||||||||||
| A321ceo |
10 | 1 | 11 | 22 | ||||||||||||
| A320neo |
— | — | 20 | 20 | ||||||||||||
| A330neo |
— | — | 15 | 15 | ||||||||||||
| A330-200/300 |
10 | — | — | 10 | ||||||||||||
|
|
|
|
|
|
|
|
|
|||||||||
| B737-800 |
61 | 3 | 18 | 82 | ||||||||||||
| B737 MAX |
— | — | 20 | 20 | ||||||||||||
| B787-8/9 |
3 | — | 8 | 11 | ||||||||||||
| Boeing B777-300ER |
3 | — | — | 3 | ||||||||||||
| B777-200LRF |
— | 2 | — | 2 | ||||||||||||
|
|
|
|
|
|
|
|
|
|||||||||
| E190 |
6 | — | — | 6 | ||||||||||||
|
|
|
|
|
|
|
|
|
|||||||||
| TOTAL |
143 | 9 | 108 | 260 | ||||||||||||
|
|
|
|
|
|
|
|
|
|||||||||
| Avolon | Q2 2015 | Page 3 |
2015 Second Quarter and First Half Performance
3 Months Ended June 30, 2015
Lease Revenue
Lease revenue increased by $38.0 million, or 30.9%, to $161.1 million for the three months ended June 30, 2015 compared to $123.1 million for the three months ended June 30, 2014, primarily as a result of an increase in the size of our portfolio while maintaining an Annualized Lease Rate of 10.8% as of June 30, 2014 and June 30, 2015. Our owned portfolio continued its expansion during the three months ended June 30, 2015, building from 116 aircraft delivered as of June 30, 2014 to 143 aircraft as of June 30, 2015. As a result, our Aggregate Net Book Value rose from $5,001.4 million at June 30, 2014 to $6,359.6 million at June 30, 2015, an increase of 27.2%. Lease revenue benefited from 36 new aircraft deliveries during the 12 months ended December 31, 2014 and 22 new aircraft deliveries during the six months ended June 30, 2015, which together resulted in an increase in lease revenue of $52.1 million for the three months ended June 30, 2015 as compared to June 30, 2014. This increase was offset in part by the disposal of nine aircraft during the 12 months ended December 31, 2014 and five aircraft during the six months ended June 30, 2015, which together resulted in a decrease in lease revenue of $12.9 million and a $0.6 million decrease due to amendments to lease rentals, three early terminated leases and lease revenue for aircraft on floating rate leases for the three months ended June 30, 2015 as compared to June 30, 2014. All of the aircraft in our fleet were on lease during the three months ended June 30, 2014 and as at June 30, 2015 The supplemental maintenance rent income for the three months ended June 30, 2015 includes $2.7 million supplemental maintenance rent income reversal due to the extension of the lease term for one aircraft.
Net Gain on Disposal of Flight Equipment
Net gain on disposal of flight equipment increased by $13.3 million, or 144.6%, to $22.5 million for the three months ended June 30, 2015 compared to $9.2 million for the three months ended June 30, 2014, as a result of our program of aircraft sales. During the three months ended June 30, 2015 we sold two single-aisle aircraft and one twin-aisle aircraft compared to two single-aisle aircraft sold during the three months ended June 30, 2014. The increase in net gain on disposal of flight equipment on a per aircraft basis was primarily due to the difference in cost between a twin-aisle aircraft and a single aisle aircraft.
Expenses
Depreciation
Depreciation expense increased by $13.7 million, or 31.7%, to $56.9 million for the three months ended June 30, 2015 compared to $43.2 million for the three months ended June 30, 2014. The increase in depreciation was attributable to 36 new aircraft deliveries in 2014 and 22 new aircraft deliveries during the six months ended June 30, 2015, which resulted in an increase in depreciation of $17.8 million for the three months ended June 30, 2015 as compared to June 30, 2014. This increase was offset in part by the disposal of nine aircraft during 2014 and five aircraft during the six months ended June 30, 2015, which resulted in a decrease in depreciation of $4.1 million for the three months ended June 30, 2015 as compared to June 30, 2014.
| Avolon | Q2 2015 | Page 4 |
Interest Expense
Interest expense increased by $2.4 million, or 4.9%, to $51.2 million (including $2.9 million positive fair value adjustment on derivative financial instruments) for the three months ended June 30, 2015 compared to $48.8 million (including $5.3 million adverse fair value adjustment on derivative financial instruments) for the three months ended June 30, 2014. The increase was primarily the result of an increase in debt outstanding to $5,098.6 million as of June 30, 2015 from $4,097.8 million as of June 30, 2014, an increase of 24.4%. This increase was offset in part by the reduction in the weighted average interest rate (not including the effect of upfront fees, undrawn fees, issuance cost amortization or fair value gains/losses on derivative financial instruments) from 4.1% at June 30, 2014 to 3.5% at June 30, 2015. This reduction in the weighted average interest rate was primarily driven by additional drawdowns of debt at lower interest rates in addition to repayment of debt at higher interest rates during the 12 months ended June 30, 2015.
Maintenance Expenses
Maintenance expenses increased by $0.6 million to $0.6 million for the three months ended June 30, 2015 compared to zero for the three months ended June 30, 2014. The increase was due to maintenance expenses being incurred during the three months ended June 30, 2015 in respect of three aircraft which the Company, on a consensual basis with the lessees, early terminated the leases. These three aircraft were delivered to new lessees during the three months ended June 30, 2015 and were on lease as of June 30, 2015.
Selling, General and Administrative Expenses
Selling, general and administrative expenses decreased by $0.7 million, or 4.3%, to $15.5 million for the three months ended June 30, 2015 compared to $16.2 million for the three months ended June 30, 2014. The decrease was due to one-off costs incurred relating to a one-time discretionary bonus payment to our chief executive officer and the preparation of the Company’s 2014 initial public offering which amounted to $5.1m during the three months ended June 30, 2014. This decrease was offset in part due to both increased variable costs associated with a larger delivered fleet, an increase in headcount and share based compensation expenses incurred in relation to our Long Term Incentive Plan during the three months ended June 30, 2015. Our selling, general and administrative expenses (excluding the one-off expenses outlined above) as a percentage of total revenue remained constant at approximately 8% for the three months ended June 30, 2015 and June 30, 2014.
Taxes
The effective tax rate for the three months ended June 30, 2015 was 7.6% compared to 3.4% for the three months ended June 30, 2014. The Company is incorporated in the Cayman Islands and domiciled in Ireland, whereas its predecessor, Avolon Investments S.à r.l. was incorporated in Luxembourg. The statutory rate of tax in Ireland is 12.5% and the statutory rate of tax in Luxembourg was 29.2% for the year ended December 31, 2014. The increase to the effective tax rate in the current period was due to an increase in pretax income in Irish taxable entities while the tax benefit of non-taxable income stayed relatively constant.
Net Income
Net income increased by $31.7 million, or 132.6%, to $55.6 million for the three months ended June 30, 2015 compared to $23.9 million for the three months ended June 30, 2014. The increase in net income was primarily attributable to the acquisition and leasing of additional aircraft, an increase in the net gain on disposal of flight equipment, a decrease in the weighted average interest rate of the Company and a positive fair value adjustment on derivative financial instruments. This increase was offset in part by the increase in depreciation attributable to the acquisition and leasing of additional aircraft and an increase in interest expense as a result of an increase in debt outstanding.
| Avolon | Q2 2015 | Page 5 |
6 Months Ended June 30, 2015
Lease Revenue
Lease revenue increased by $80.6 million, or 33.4%, to $321.9 million for the six months ended June 30, 2015 compared to $241.3 million for the six months ended June 30, 2014, primarily as a result of an increase in the size of our portfolio while maintaining an Annualized Lease Rate of 10.8% as of June 30, 2014 and June 30, 2015. Our owned portfolio continued its expansion during the six months ended June 30, 2015, building from 116 aircraft delivered as of June 30, 2014 to 143 aircraft as of June 30, 2015. As a result, our Aggregate Net Book Value rose from $5,001.4 million at June 30, 2014 to $6,359.6 million at June 30, 2015, an increase of 27.2%. Lease revenue benefited from 36 new aircraft deliveries during the 12 months ended December 31, 2014 and 22 new aircraft deliveries during the six months ended June 30, 2015, which together resulted in an increase in lease revenue of $102.8 million for the six months ended June 30, 2015 as compared to June 30, 2014. In addition to this, our lease revenue included $1.9 million of a termination fee generated following the early termination of two leases on a consensual basis with the lessee during the six months ended June 30, 2015, which had been on lease throughout the year ended December 31, 2014. This increase was offset in part by the disposal of nine aircraft during the 12 months ended December 31, 2014 and five aircraft during the six months ended June 30, 2015, which together resulted in a decrease in lease revenue of $26.2 million and a $2.1 million decrease due to amendments to lease rentals, three early terminated leases and the reduced lease revenue for aircraft on floating rate leases for the six months ended June 30, 2015 as compared to June 30, 2014. All of the aircraft in our fleet were on lease during the six months ended June 30, 2014. In respect of one aircraft which was on lease during the six months ended June 30, 2014, the Company, on a consensual basis with the lessee, early terminated the lease during the year ended December 31, 2014. This aircraft was on lease with a new lessee as of June 30, 2015. Our lease revenues for the six months ended June 30, 2015 included supplemental maintenance rent income of $6.2 million and $2.0 million in the six months ended June 30, 2014. The supplemental maintenance rent income for the six months ended June 30, 2015 includes $4.5 million of supplemental maintenance rent income recognized as lease revenue for two aircraft where, the Company, on a consensual basis with the lessee, agreed to early terminate two leases during 2015. This was offset in part by a $2.7 million supplemental maintenance rent income reversal due to the extension of the lease term for one aircraft.
Net Gain on Disposal of Flight Equipment
Net gain on disposal of flight equipment increased by $11.1 million, or 42.7%, to $37.1 million for the six months ended June 30, 2015 compared to $26.0 million for the six months ended June 30, 2014, as a result of our program of aircraft sales. During the six months ended June 30, 2015 we sold three single-aisle aircraft and two twin-aisle aircraft compared to two single-aisle aircraft and one twin-aisle aircraft sold during the six months ended June 30, 2014. The increase in net gain on disposal of flight equipment was primarily due to a larger volume of aircraft sold in the six months ended June 30, 2015.
Expenses
Depreciation
Depreciation expense increased by $27.7 million, or 33.3%, to $110.8 million for the six months ended June 30, 2015 compared to $83.1 million for the six months ended June 30, 2014. The increase in depreciation was attributable to 36 new aircraft deliveries in 2014 and 22 new aircraft deliveries during the six months ended June 30, 2015, which resulted in an increase in depreciation of $34.7 million for the six months ended June 30, 2015 as compared to June 30, 2014. In addition, new office equipment and furniture were acquired during the year ended December 31, 2014 which resulted in an increase in depreciation of $0.3 million during the six months ended June 30, 2015. This increase was offset in part by the disposal of nine aircraft during 2014 and five aircraft during the six months ended June 30, 2015, which resulted in a decrease in depreciation of $7.3 million for the six months ended June 30, 2015 as compared to June 30, 2014.
| Avolon | Q2 2015 | Page 6 |
Interest Expense
Interest expense increased by $9.2 million, or 9.5%, to $106.1 million (including $3.0 million adverse fair value adjustment on derivative financial instruments) for the six months ended June 30, 2015 compared to $96.9 million (including $9.5 million adverse fair value adjustment on derivative financial instruments) for the six months ended June 30, 2014. The increase was primarily the result of an increase in debt outstanding to $5,098.6 million as of June 30, 2015 from $4,097.8 million as of June 30, 2014, an increase of 24.4%. This increase was offset in part by the reduction in the weighted average interest rate (not including the effect of upfront fees, undrawn fees, issuance cost amortization or fair value gains/losses on derivative financial instruments) from 4.1% at June 30, 2014 to 3.5% at June 30, 2015. This reduction in the weighted average interest rate was primarily driven by additional drawdowns of debt at lower interest rates in addition to repayment of debt at higher interest rates during the 12 months ended June 30, 2015.
Maintenance Expenses
Maintenance expenses increased by $0.9 million to $0.9 million for the six months ended June 30, 2015 compared to $Nil million for the six months ended June 30, 2014. The increase was due to maintenance expenses being incurred during the six months ended June 30, 2015 in respect of three aircraft the Company, on a consensual basis with the lessee, early terminated the leases. These three aircraft were delivered to new lessees during the six months ended June 30, 2015 and were on lease as of June 30, 2015.
Selling, General and Administrative Expenses
Selling, general and administrative expenses increased by $3.4 million, or 13.0%, to $29.6 million for the six months ended June 30, 2015 compared to $26.2 million for the six months ended June 30, 2014. The increase was due to both increased variable costs associated with a larger delivered fleet, an increase in headcount, share based compensation expenses incurred in relation to our Long Term Incentive Plan. One-off costs were relating to a one-time discretionary bonus payment to our chief executive officer and the preparation of the Company’s 2014 initial public offering which amounted to $5.1m during the six months ended June 30, 2014. Our selling, general and administrative expenses (excluding the one-off expenses outlined above) as a percentage of total revenue remained constant at approximately 8% for the six months ended June 30, 2015 and June 30, 2014.
Taxes
The effective tax rate for the six months ended June 30, 2015 was 7.0% compared to 3.6% for the six months ended June 30, 2014. The Company is incorporated in the Cayman Islands and domiciled in Ireland, whereas its predecessor, Avolon Investments S.à r.l. was incorporated in Luxembourg. The statutory rate of tax in Ireland is 12.5% and the statutory rate of tax in Luxembourg was 29.2% for the year ended December 31, 2014. The increase to the effective tax rate in the current period was due to an increase in pretax income in Irish taxable entities while the tax benefit of non-taxable income stayed relatively constant.
Net Income
Net income increased by $44.6 million, or 73.8%, to $105.0 million for the six months ended June 30, 2015 compared to $60.4 million for the six months ended June 30, 2014. The increase in net income was primarily attributable to the acquisition and leasing of additional aircraft, an increase in the net gain on disposal of flight equipment, a decrease in the weighted average interest rate of the Company and a positive fair value adjustment on derivative financial instruments. This increase was offset in part by the increase in depreciation attributable to the acquisition and leasing of additional aircraft and an increase in interest expense as a result of an increase in debt outstanding.
| 1 | Annualised Cost of Funds at end of period does not include the effect of up-front fees, undrawn fees, issuance cost amortization or fair value gains / losses on derivative financial instruments. |
| Avolon | Q2 2015 | Page 7 |
About Avolon Holdings Limited (“Avolon”)
Avolon is an international aircraft leasing company, headquartered in Ireland, with regional offices in China, Dubai, Singapore and the United States. Avolon provides aircraft leasing and lease management services. At June 30, 2015, Avolon had an owned, managed and committed fleet of 260 aircraft serving 56 customers in 33 countries.
www.avolon.aero
Contacts
| Dónal O’Neill | T: +353 1 231 5843 | M: +353 87 251 1799 | [email protected] | |||
| Jonathan Neilan | T: +353 1 663 3686 | M: +353 86 231 4135 | [email protected] | |||
| Jennifer Peters | T: +353 1 663 3684 | M: +353 87 178 7021 | [email protected] |
Note Regarding Forward-Looking Statements
This document includes forward-looking statements, beliefs or opinions, including statements with respect to Avolon’s business, financial condition, results of operations and plans. These forward-looking statements involve known and unknown risks and uncertainties, many of which are beyond our control and all of which are based on our management’s current beliefs and expectations about future events. Forward-looking statements are sometimes identified by the use of forward-looking terminology such as “believe,” “expects,” “may,” “will,” “could,” “should,” “shall,” “risk,” “intends,” “estimates,” “aims,” “plans,” “predicts,” “continues,” “assumes,” “positioned” or “anticipates” or the negative thereof, other variations thereon or comparable terminology or by discussions of strategy, plans, objectives, goals, future events or intentions. These forward-looking statements include all matters that are not historical facts. Forward-looking statements may and often do differ materially from actual results. No assurance can be given that such future results will be achieved.
These risks, uncertainties and assumptions include, but are not limited to, the following: general economic and financial conditions; the financial condition of our lessees; our ability to obtain additional capital to finance our growth and operations on attractive terms; decline in the value of our aircraft and market rates for leases; the loss of key personnel; lessee defaults and attempts to repossess aircraft; our ability to regularly sell aircraft; our ability to successfully re-lease our existing aircraft and lease new aircraft; our ability to negotiate and enter into profitable leases; periods of aircraft oversupply during which lease rates and aircraft values decline; changes in the appraised value of our aircraft; changes in interest rates; competition from other aircraft lessors; and the limited number of aircraft and engine manufacturers. These and other important factors, including those discussed under “Item 3. Key Information—Risk Factors” included in our Annual Report on Form 20-F filed with the U.S. Securities and Exchange Commission on March 3, 2015, may cause our actual events or results to differ materially from any future results, performances or achievements expressed or implied by the forward-looking statements contained in this document. Such forward-looking statements contained in this document speak only as of the date of this document. We expressly disclaim any obligation or undertaking to update these forward-looking statements contained in this document to reflect any change in our expectations or any change in events, conditions, or circumstances on which such statements are based unless required to do so by applicable law.
The financial information included herein includes financial information that is not presented in accordance with generally accepted accounting principles in the United States (“GAAP”), including adjusted net income, adjusted earnings per share and adjusted return on equity. The reconciliation below includes a reconciliation of adjusted net income, adjusted earnings per share and adjusted return on equity with the most directly comparable financial measures calculated in accordance with GAAP.
More detailed information about these and other factors is set forth in the Annual Report on Form 20-F which is available on the Avolon website, www.avolon.aero and has also been filed with the U.S. Securities and Exchange Commission.
| Avolon | Q2 2015 | Page 8 |
Reconciliation of Non-GAAP Measures
| Three Months Ended June 30 |
Six Months Ended June 30 |
|||||||||||||||
| 2014 | 2015 | 2014 | 2015 | |||||||||||||
| Net Income |
23,929 | 55,619 | 60,350 | 104,973 | ||||||||||||
| Amortization of debt issuance costs |
4,670 | 7,188 | 10,381 | 12,814 | ||||||||||||
| Unrealized loss on derivatives |
5,332 | (2,964 | ) | 9,466 | 2,931 | |||||||||||
| Share based compensation |
— | 2,076 | — | 3,631 | ||||||||||||
| Tax effect |
(364 | ) | (321 | ) | (709 | ) | (1,047 | ) | ||||||||
| Adjusted net income |
33,567 | 61,598 | 79,488 | 123,302 | ||||||||||||
| Three Months Ended June 30 |
Six Months Ended June 30 |
|||||||||||||||
| 2014 | 2015 | 2014 | 2015 | |||||||||||||
| Net Income |
23,929 | 55,619 | 60,350 | 104,973 | ||||||||||||
| Weighted Average Shares Outstanding Diluted |
78,307,618 | 81,227,419 | 78,332,823 | 81,174,750 | ||||||||||||
| Diluted EPS |
0.31 | 0.68 | 0.77 | 1.29 | ||||||||||||
| Amortization of debt issuance costs |
0.06 | 0.09 | 0.13 | 0.16 | ||||||||||||
| Unrealized loss on derivatives |
0.07 | (0.04 | ) | 0.12 | 0.04 | |||||||||||
| Share based compensation |
0.00 | 0.03 | 0.00 | 0.04 | ||||||||||||
| Tax effect |
(0.00 | ) | (0.00 | ) | (0.01 | ) | (0.01 | ) | ||||||||
| Effect of number of issued shares |
(0.02 | ) | (0.01 | ) | (0.04 | ) | (0.02 | ) | ||||||||
| Adjusted EPS |
0.41 | 0.75 | 0.97 | 1.50 | ||||||||||||
| Three Months Ended June 30 |
Six Months Ended June 30 |
2015 Year End Guidance | ||||||||||||||||||||||
| 2014 | 2015 | 2014 | 2015 | 2015 | 2015 | |||||||||||||||||||
| ROE |
7.1 | % | 14.4 | % | 9.0 | % | 13.6 | % | 12.8 | % | 13.1 | % | ||||||||||||
| Amortization of debt issuance costs |
1.4 | % | 1.9 | % | 1.5 | % | 1.7 | % | 1.4 | % | 1.4 | % | ||||||||||||
| Unrealized loss on derivatives |
1.6 | % | (0.8 | %) | 1.4 | % | 0.4 | % | — | — | ||||||||||||||
| Share based compensation |
0.0 | % | 0.5 | % | 0.0 | % | 0.5 | % | 0.6 | % | 0.6 | % | ||||||||||||
| Tax effect |
(0.1 | %) | (0.1 | %) | (0.1 | %) | (0.1 | %) | (0.1 | %) | (0.1 | %) | ||||||||||||
| Adjusted ROE |
10.0 | % | 16.0 | % | 11.8 | % | 16.0 | % | 14.7 | % | 15.0 | % | ||||||||||||
| Avolon | Q2 2015 | Page 9 |
Avolon Holdings Limited
Unaudited Condensed Consolidated Interim Financial Statements
As of December 31, 2014 and June 30, 2015 and for the three and six months ended June 30, 2014 and 2015
| Avolon | Q2 2015 | Page 10 |
Avolon Holdings Limited
Unaudited Condensed Consolidated Interim Financial Statements
Table of Contents
| Page | ||||
| Unaudited Condensed Consolidated Balance Sheets as of December 31, 2014 and June 30, 2015 |
F-2 | |||
| Unaudited Condensed Consolidated Statements of Comprehensive Income for the three and six months ended June 30, 2014 and 2015 |
F-4 | |||
| Unaudited Condensed Consolidated Statements of Changes in Shareholders’ Equity for the six months ended June 30, 2015 |
F-5 | |||
| Unaudited Condensed Consolidated Statements of Cash Flows for the six months ended June 30, 2014 and 2015 |
F-6 | |||
| Notes to the Unaudited Condensed Consolidated Interim Financial Statements |
F-8 | |||
Avolon Holdings Limited
Unaudited Condensed Consolidated Balance Sheets
December 31, 2014 and June 30, 2015
(In US$ thousands except share and per share data)
| December 31, 2014 |
June 30, 2015 |
|||||||
| Assets |
||||||||
| Cash and cash equivalents |
111,392 | 151,717 | ||||||
| Restricted cash |
195,095 | 159,697 | ||||||
| Accounts receivable |
11,010 | 7,869 | ||||||
| Flight equipment, net |
5,606,556 | 6,359,649 | ||||||
| Derivative financial assets |
8,137 | 8,483 | ||||||
| Deposits on flight equipment |
199,514 | 164,918 | ||||||
| Deferred issuance costs, net |
105,952 | 104,504 | ||||||
| Deferred income taxes |
18,996 | 11,060 | ||||||
| Investment in unconsolidated equity investees |
16,453 | 17,166 | ||||||
| Other assets |
53,002 | 44,215 | ||||||
|
|
|
|
|
|||||
| Total Assets including US$6,326,107 as of December 31, 2014 and US$7,029,278 as of June 30, 2015 representing collateral of VIE entities |
6,326,107 | 7,029,278 | ||||||
|
|
|
|
|
|||||
| Liabilities and Shareholders’ Equity |
||||||||
| Accounts payable |
203 | 4,832 | ||||||
| Accrued expenses and other liabilities |
27,223 | 18,622 | ||||||
| Income tax payable |
434 | 249 | ||||||
| Deferred revenue |
35,193 | 41,070 | ||||||
| Accrued maintenance liabilities |
180,526 | 213,684 | ||||||
| Lease deposits liability |
82,677 | 92,090 | ||||||
| Debt financing, including debt financing of VIEs of US$1,385,762 as of December 31, 2014 and US$1,039,645 as of June 30, 2015 that do not have recourse to the general credit of the Company |
4,465,187 | 5,020,890 | ||||||
| Capital lease obligation |
83,261 | 77,690 | ||||||
| Deferred income taxes |
17,006 | 17,006 | ||||||
| Derivative financial liabilities |
1,400 | 1,720 | ||||||
|
|
|
|
|
|||||
| Total Liabilities |
4,893,110 | 5,487,853 | ||||||
|
|
|
|
|
|||||
The accompanying notes are an integral part of these unaudited condensed consolidated interim financial statements.
| Avolon | Financial Statements | F - 2 |
Avolon Holdings Limited
Unaudited Condensed Consolidated Balance Sheets (continued)
December 31, 2014 and June 30, 2015
(In US$ thousands except share and per share data)
| December 31, 2014 |
June 30, 2015 |
|||||||
| Shareholders’ Equity |
||||||||
| Common shares: US$0.000004 par value |
||||||||
| Authorized: 750,000,000 shares; |
||||||||
| Issued and outstanding: 80,960,882 and 80,960,882 shares at December 31, 2014 and June 30, 2015, respectively |
— | — | ||||||
| Additional paid-in-capital |
1,421,864 | 1,425,319 | ||||||
| Retained earnings |
11,133 | 116,106 | ||||||
|
|
|
|
|
|||||
| Total Shareholders’ Equity |
1,432,997 | 1,541,425 | ||||||
|
|
|
|
|
|||||
| Total Liabilities and Shareholders’ Equity |
6,326,107 | 7,029,278 | ||||||
|
|
|
|
|
|||||
The accompanying notes are an integral part of these unaudited condensed consolidated interim financial statements.
| Avolon | Financial Statements | F - 3 |
Avolon Holdings Limited
Unaudited Condensed Consolidated Statements of Comprehensive Income
Three and six months ended June 30, 2014 and 2015
(In US$ thousands, except per share data)
| Three months ended June 30, |
Six months ended June 30, |
|||||||||||||||
| 2014 | 2015 | 2014 | 2015 | |||||||||||||
| Revenues |
||||||||||||||||
| Lease revenue |
123,072 | 161,096 | 241,295 | 321,864 | ||||||||||||
| Management fee revenue |
563 | 280 | 917 | 576 | ||||||||||||
| Net gain on disposal of flight equipment |
9,219 | 22,496 | 26,045 | 37,121 | ||||||||||||
| Interest income |
241 | 36 | 592 | 75 | ||||||||||||
|
|
|
|
|
|
|
|
|
|||||||||
| Total revenues |
133,095 | 183,908 | 268,849 | 359,636 | ||||||||||||
|
|
|
|
|
|
|
|
|
|||||||||
| Expenses |
||||||||||||||||
| Depreciation |
(43,173 | ) | (56,940 | ) | (83,127 | ) | (110,839 | ) | ||||||||
| Interest expense |
(48,806 | ) | (51,197 | ) | (96,869 | ) | (106,138 | ) | ||||||||
| Maintenance expense |
— | (571 | ) | — | (948 | ) | ||||||||||
| Selling, general and administrative costs |
(16,198 | ) | (15,527 | ) | (26,185 | ) | (29,584 | ) | ||||||||
|
|
|
|
|
|
|
|
|
|||||||||
| Total expenses |
(108,177 | ) | (124,235 | ) | (206,181 | ) | (247,509 | ) | ||||||||
|
|
|
|
|
|
|
|
|
|||||||||
| Income before income tax and interest in earnings/(loss) from unconsolidated equity investees |
24,918 | 59,673 | 62,668 | 112,127 | ||||||||||||
| Income tax expense |
(857 | ) | (4,553 | ) | (2,239 | ) | (7,867 | ) | ||||||||
| Income/(loss) from unconsolidated equity investees, net of tax |
(132 | ) | 499 | (79 | ) | 713 | ||||||||||
|
|
|
|
|
|
|
|
|
|||||||||
| Net income and total comprehensive income |
23,929 | 55,619 | 60,350 | 104,973 | ||||||||||||
|
|
|
|
|
|
|
|
|
|||||||||
| Net income per share of: |
||||||||||||||||
| Basic |
0.31 | 0.69 | 0.77 | 1.30 | ||||||||||||
| Diluted |
0.31 | 0.68 | 0.77 | 1.29 | ||||||||||||
| Weighted average number of shares outstanding: |
||||||||||||||||
| Basic |
78,297,109 | 80,960,882 | 78,322,314 | 80,960,882 | ||||||||||||
| Diluted |
78,307,618 | 81,227,419 | 78,332,823 | 81,174,750 | ||||||||||||
The accompanying notes are an integral part of these unaudited condensed consolidated interim financial statements.
| Avolon | Financial Statements | F - 4 |
Avolon Holdings Limited
Unaudited Condensed Consolidated Statement of Changes in Shareholders’ Equity
Six months ended June 30, 2015
(In US$ thousands)
| Common shares |
Additional paid in capital |
Retained earnings |
Total | |||||||||||||
| Shares | US$’000 | US$’000 | US$’000 | |||||||||||||
| Balance at December 31, 2014 |
80,960,882 | 1,421,864 | 11,133 | 1,432,997 | ||||||||||||
| Net income and total comprehensive income |
— | — | 104,973 | 104,973 | ||||||||||||
| Settlement of restricted share units |
— | (175 | ) | — | (175 | ) | ||||||||||
| Share-based compensation |
— | 3,630 | — | 3,630 | ||||||||||||
|
|
|
|
|
|
|
|
|
|||||||||
| Balance at June 30, 2015 |
80,960,882 | 1,425,319 | 116,106 | 1,541,425 | ||||||||||||
|
|
|
|
|
|
|
|
|
|||||||||
The accompanying notes are an integral part of these unaudited condensed consolidated interim financial statements.
| Avolon | Financial Statements | F - 5 |
Avolon Holdings Limited
Unaudited Condensed Consolidated Statements of Cash Flows
Six months ended June 30, 2014 and 2015
(In US$ thousands)
| Six months ended June 30, | ||||||||
| 2014 | 2015 | |||||||
| Cash flows provided by operating activities |
||||||||
| Net income |
60,350 | 104,973 | ||||||
| Adjustments to reconcile net income to net cash provided by operating activities: |
||||||||
| Depreciation |
83,127 | 110,839 | ||||||
| Net gain on disposal of flight equipment |
(26,045 | ) | (37,121 | ) | ||||
| Amortization of debt issuance costs |
10,381 | 12,814 | ||||||
| Deferred income tax provision |
1,473 | 8,026 | ||||||
| Share based compensation |
— | 3,630 | ||||||
| Loss/(earnings) from unconsolidated equity investees |
79 | (713 | ) | |||||
| Unrealised loss on derivatives |
9,466 | 2,931 | ||||||
| Changes in operating assets and liabilities: |
||||||||
| (Increase)/decrease in receivables |
(4,827 | ) | 3,141 | |||||
| Decrease in other assets |
7,182 | 8,222 | ||||||
| Increase in deferred revenue |
4,216 | 5,877 | ||||||
| Decrease in accounts payable, accrued expenses and other liabilities |
(13,920 | ) | (5,156 | ) | ||||
|
|
|
|
|
|||||
| Net cash provided by operating activities |
131,482 | 217,463 | ||||||
|
|
|
|
|
|||||
| Cash flows from investing activities |
||||||||
| Acquisition of flight equipment |
(969,623 | ) | (1,128,969 | ) | ||||
| Investment in unconsolidated equity investees |
(4,395 | ) | — | |||||
| Deposits for flight equipment purchases |
(36,944 | ) | (22,572 | ) | ||||
| Proceeds from disposal of flight equipment |
213,754 | 359,801 | ||||||
|
|
|
|
|
|||||
| Net cash used in investing activities |
(797,208 | ) | (791,740 | ) | ||||
|
|
|
|
|
|||||
| Cash flows from financing activities |
||||||||
| Decrease in restricted cash |
13,854 | 35,398 | ||||||
| Purchase of ordinary shares and settlement of restricted share units |
(5,591 | ) | (175 | ) | ||||
| Drawdown of debt |
911,505 | 1,423,168 | ||||||
| Repayment of debt |
(351,251 | ) | (872,155 | ) | ||||
| Debt issuance costs paid |
(18,593 | ) | (11,248 | ) | ||||
| Acquisition of interest rate caps |
(5,084 | ) | (2,957 | ) | ||||
| Maintenance payments received |
31,351 | 40,700 | ||||||
| Maintenance payments returned |
— | (7,542 | ) | |||||
| Security deposits received |
17,252 | 19,426 | ||||||
| Security deposits returned |
(6,160 | ) | (10,013 | ) | ||||
|
|
|
|
|
|||||
| Net cash provided by financing activities |
587,283 | 614,602 | ||||||
|
|
|
|
|
|||||
| Net (decrease)/increase in cash and cash equivalents |
(78,443 | ) | 40,325 | |||||
| Cash at beginning of period |
177,924 | 111,392 | ||||||
|
|
|
|
|
|||||
| Cash at end of period |
99,481 | 151,717 | ||||||
|
|
|
|
|
|||||
| Avolon | Financial Statements | F - 6 |
Avolon Holdings Limited
Unaudited Condensed Consolidated Statements of Cash Flows (continued)
Six months ended June 30, 2014 and 2015
(In US$ thousands)
| Six months ended June 30, | ||||||||
| 2014 | 2015 | |||||||
| Supplemental cash flow information: |
||||||||
| Cash paid for interest including amounts capitalized of US$1.6m, and US$0.7m for the six months ended June 30, 2014 and 2015, respectively |
81,611 | 94,137 | ||||||
| Cash paid for income taxes |
73 | 344 | ||||||
|
|
|
|
|
|||||
| Supplemental disclosures of non-cash investing and financing activities: |
||||||||
| Security deposits, maintenance liabilities and other liabilities settled on sale of flight equipment |
2,309 | 17,988 | ||||||
|
|
|
|
|
|||||
| Advance lease rentals, security deposits and maintenance reserves assumed in asset acquisitions |
17,267 | 2,920 | ||||||
|
|
|
|
|
|||||
The accompanying notes are an integral part of these unaudited condensed consolidated interim financial statements.
| Avolon | Financial Statements | F - 7 |
Avolon Holdings Limited
Notes to the Unaudited Condensed Consolidated Interim Financial Statements
Six months ended June 30, 2014 and 2015
(In US$ thousands, except as otherwise stated)
| (1) | Organization |
Avolon Holdings Limited (“Avolon Holdings” or the “Company”), is a publicly traded company whose shares trade on the NYSE market under the trading symbol “AVOL”. The Company was incorporated in the Cayman Islands on June 5, 2014 for the purpose of an initial public offering (“IPO”) of the Company’s common shares. The Company historically conducted its business through Avolon Investment S.à r.l. (“Avolon S.à r.l.”). The Company is a global aircraft leasing company focused on acquiring, managing and selling commercial aircraft. These unaudited condensed consolidated interim financial statements comprise the Company and its subsidiaries and the Company’s investment in unconsolidated equity investees. The Company is primarily involved in acquiring, leasing and selling commercial jet aircraft to various airlines and lessees and acting as servicer for third party aircraft owners.
| (2) | Basis of preparation |
The unaudited condensed consolidated interim financial statements are presented in United States dollars (“US$”) and have been prepared pursuant to the rules and regulations of the Securities and Exchange Commission (the “SEC”) for interim financial reporting and in accordance with the United States Generally Accepted Accounting Principles (“US GAAP”). As permitted by the rules and regulations of the SEC, certain information and footnote disclosures required by US GAAP for complete annual financial statements have been omitted, however, we believe that the disclosures are adequate to make the information presented not misleading. These unaudited condensed consolidated interim financial statements should be read in conjunction with the Company’s audited consolidated financial statements for the year ended December 31, 2014 included in the Company’s Form 20-F filed with the SEC on March 3, 2015.
In the opinion of management, these financial statements contain all adjustments, consisting of normal recurring accruals, necessary to present fairly the financial position, results of operations and cash flows for the periods indicated. Results of operations for the periods presented are not necessarily indicative of results of operations that may be expected for the entire year.
| (3) | Principles of consolidation |
The Company consolidates all entities in which it has a controlling financial interest, including the accounts of any variable interest entities (“VIE”) in which the Company has a controlling financial interest and for which it is the primary beneficiary. All intercompany balances are eliminated on consolidation.
| (4) | Use of estimates |
The preparation of the unaudited condensed consolidated interim financial statements in conformity with US GAAP requires management to make judgments, estimates and assumptions that affect the application of policies and reported amounts of assets and liabilities, revenue and expenses. The estimates and associated assumptions are based on historical experience and various other factors that are believed to be reasonable under the circumstances, the results of which form the basis of making the judgments about carrying values of assets and liabilities that are not readily apparent from other sources. While the Company believes that the estimates and related assumptions used in the preparation of the consolidated financial statements are appropriate, actual results could differ from those estimates.
The most significant estimates are those in relation to the residual value of flight equipment, the impairment of flight equipment, the proportion of supplemental maintenance rent that will not be reimbursed and the valuation allowance recognized against deferred tax assets.
| Avolon | Financial Statements | F - 8 |
Avolon Holdings Limited
Notes to the Unaudited Condensed Consolidated Interim Financial Statements
Six months ended June 30, 2014 and 2015
(In US$ thousands, except as otherwise stated)
| (5) | Accounting standards issued but not yet adopted |
In May 2014, the FASB issued ASU 2014-09, Revenue from Contracts with Customers (Topic 606). The new standard is effective for reporting periods beginning after December 15, 2016 and early adoption is not permitted. The comprehensive new standard will supersede existing revenue recognition guidance and require revenue to be recognized when promised goods or services are transferred to customers in amounts that reflect the consideration to which the Company expects to be entitled in exchange for those goods or services. Adoption of the new rules could affect the timing of revenue recognition for certain transactions. The guidance permits two implementation approaches, one requiring retrospective application of the new standard with restatement of prior years and one requiring prospective application of the new standard with disclosure of results under old standards. The new standard will be effective January 1, 2018 and the Company is currently evaluating the effects of adoption on the Company’s consolidated financial statements.
In February 2015, the FASB issued ASU 2015-02, Amendments to the Consolidation Analysis (Topic 810). The new standard is effective for fiscal years, and interim periods within those fiscal years, beginning after December 15, 2015. The ASU significantly changes the consolidation analysis required under US GAAP. Amendments include the inclusion of limited partnerships as variable interest entities, changes the effect fees paid to a decision maker or service provider have on a consolidation analysis, amends how variable interests held by a reporting entity’s related parties or de facto agents affects its consolidation conclusion and for entities other than limited partnerships, clarifies how to determine whether the equity holders (as a group) have power over the entity. These changes could result in the deconsolidation of entities and reporting entities will be required to re-evaluate all previous consolidation conclusions. The Company is currently in the process of evaluating the impact of adoption of this ASU on the Company’s consolidated financial statements.
In April 2015, the FASB issued ASU 2015-03, Interest—Imputation of Interest. The standard will require debt issuance costs to be presented in the balance sheet as a direct deduction from the related debt liability rather than as an asset. Amortization of the costs will be reported as interest expense. Entities will be required to apply the new guidance retrospectively to all prior periods presented. ASU 2015-03 will be effective for annual periods beginning after December 15, 2015, and interim periods within those fiscal years. Early application is permitted. The Company expects new guidance will reduce total assets and debt financing on its consolidated balance sheets by amounts currently classified as deferred issuance costs, but does not expect this update to have any other effect on its consolidated financial statements.
| (6) | Flight equipment |
Flight equipment and related accumulated depreciation are as follows:
| December 31, 2014 |
June 30, 2015 |
|||||||
| Flight equipment - aircraft |
6,036,199 | 6,890,269 | ||||||
| Less accumulated depreciation |
(429,643 | ) | (530,620 | ) | ||||
|
|
|
|
|
|||||
| Total flight equipment, net |
5,606,556 | 6,359,649 | ||||||
|
|
|
|
|
|||||
| Avolon | Financial Statements | F - 9 |
Avolon Holdings Limited
Notes to the Unaudited Condensed Consolidated Interim Financial Statements
Six months ended June 30, 2014 and 2015
(In US$ thousands, except as otherwise stated)
| (6) | Flight equipment (continued) |
At June 30, 2015 the Company owned 143 aircraft (December 31, 2014: 126 aircraft). During the three and six months ended June 30, 2015, the Company sold 3 and 5 aircraft, respectively (12 months to December 31, 2014: 9 aircraft). In addition the Company purchased 14 and 22 aircraft during the three and six months ended June 30, 2015, respectively (12 months to December 31, 2014: 36 aircraft).
At June 30, 2015, the Company had 2 aircraft (December 31, 2014: 2 aircraft) held under capital lease. The carrying value of these aircraft at June 30, 2015 was US$134.7m (December 31, 2014: US$137.6m). The gross amount of these aircraft at June 30, 2015 was US$158.6m (December 31, 2014: US$158.6m).
The accumulated depreciation relating to the aircraft held under capital lease at June 30, 2015 was US$23.9m (December 31, 2014: US$21m). The depreciation charge for the three and six month periods ended June 30, 2015 relating to these aircraft was US$1.4m and US$2.9m (three and six month periods ended June 30, 2014: US$1.4m and US$2.9m).
The Company’s obligations under its secured bank loans are secured by charges over, amongst other things, the Company’s aircraft and related assets with a carrying value as of June 30, 2015 US$6.4bn (December 31, 2014: US$5.6bn).
| (7) | Deposits for flight equipment purchases |
| December 31, 2014 |
June 30, 2015 |
|||||||
| Balance at beginning of period |
206,781 | 199,514 | ||||||
| Increase in purchase deposits |
76,365 | 19,264 | ||||||
| Capitalized interest |
7,430 | 3,276 | ||||||
| Capitalized expenses |
222 | 32 | ||||||
| Deposits applied against the purchase of flight equipment |
(91,284 | ) | (57,168 | ) | ||||
|
|
|
|
|
|||||
| Balance at end of the period |
199,514 | 164,918 | ||||||
|
|
|
|
|
|||||
It is the Company’s policy to capitalise specific aircraft acquisition related interest costs and to depreciate these costs in line with the respective flight equipment over its useful life.
| Avolon | Financial Statements | F - 10 |
Avolon Holdings Limited
Notes to the Unaudited Condensed Consolidated Interim Financial Statements
Six months ended June 30, 2014 and 2015
(In US$ thousands, except as otherwise stated)
| (8) | Other assets |
| December 31, 2014 |
June 30, 2015 |
|||||||
| Deferred lease incentive, net of amortization |
43,566 | 35,602 | ||||||
| Other property, plant and equipment, net of depreciation US$0.5m (December 31, 2014: US$0.6m) |
2,876 | 2,653 | ||||||
| Deposits paid |
453 | 129 | ||||||
| Prepayments |
2,310 | 2,124 | ||||||
| Deferred tax asset |
3,797 | 3,707 | ||||||
|
|
|
|
|
|||||
| 53,002 | 44,215 | |||||||
|
|
|
|
|
|||||
| (9) | Lease deposits liability |
At June 30, 2015, lessee security deposits amounted to US$92.1m (December 31, 2014: US$82.7m). This related to cash security received of US$74.4m (December 31, 2014: US$70.2m) with respect to 77 aircraft currently on lease (December 31, 2014: 66) and US$17.7m (December 31, 2014: US$12.5m) which was received from lessees who have signed a letter of intent with the Company. Lessee security deposits are generally refundable at the end of the contract lease period after all lease obligations have been met by the lessee.
Furthermore, the Company held security on lease obligations for other aircraft in the form of letters of credit in the amount of US$164.8m as of June 30, 2015 (December 31, 2014: US$145.7m).
| Avolon | Financial Statements | F - 11 |
Avolon Holdings Limited
Notes to the Unaudited Condensed Consolidated Interim Financial Statements
Six months ended June 30, 2014 and 2015
(In US$ thousands, except as otherwise stated)
| (10) | Debt financing and capital lease obligations |
The Company’s debt obligations are summarized below:
| At December 31, 2014 |
At June 30, 2015 |
Average Nominal Interest Rate as of June 30, 2015 |
Undrawn debt facilities |
Maturity | ||||||||||||||||
| Type of Debt |
||||||||||||||||||||
| Non-recourse term facilities |
797,305 | 470,951 | 4.32 | % | — | 2015-2025 | ||||||||||||||
| Full recourse term facilities |
1,973,891 | 2,892,414 | 3.48 | % | 269,398 | 2015-2026 | ||||||||||||||
| Securitization |
588,457 | 568,694 | 4.89 | % | — | 2015-2020 | ||||||||||||||
| ECA and EXIM backed facilities |
725,113 | 694,221 | 2.50 | % | — | 2015-2026 | ||||||||||||||
| Warehouse facility |
170,863 | 195,298 | 2.64 | % | 354,702 | 2015-2018 | ||||||||||||||
| Lines of credit |
198,006 | 188,719 | 3.03 | % | 225,000 | 2015-2017 | ||||||||||||||
| Loan interest accrued but not paid |
11,552 | 10,593 | N/A | — | N/A | |||||||||||||||
|
|
|
|
|
|
|
|||||||||||||||
| 4,465,187 | 5,020,890 | 849,100 | ||||||||||||||||||
|
|
|
|
|
|
|
|||||||||||||||
| Capital lease obligation |
||||||||||||||||||||
| Capital lease |
82,906 | 77,375 | 4.07 | % | — | 2015-2021 | ||||||||||||||
| Capital lease interest accrued but not paid |
355 | 315 | N/A | — | N/A | |||||||||||||||
|
|
|
|
|
|
|
|||||||||||||||
| 83,261 | 77,690 | — | ||||||||||||||||||
|
|
|
|
|
|
|
|||||||||||||||
| 4,548,448 | 5,098,580 | 849,100 | ||||||||||||||||||
|
|
|
|
|
|
|
|||||||||||||||
| Avolon | Financial Statements | F - 12 |
Avolon Holdings Limited
Notes to the Unaudited Condensed Consolidated Interim Financial Statements
Six months ended June 30, 2014 and 2015
(In US$ thousands, except as otherwise stated)
| (10) | Debt financing and capital lease obligations (continued) |
Maturities
The anticipated aggregate principal and interest repayments due for its debt financing for each of the fiscal years subsequent to June 30, 2015, are as follows:
| Principal | Interest | Total | ||||||||||
| 2015 |
259,969 | 88,110 | 348,079 | |||||||||
| 2016 |
381,004 | 164,620 | 545,624 | |||||||||
| 2017 |
532,297 | 147,580 | 679,877 | |||||||||
| 2018 |
665,900 | 128,488 | 794,388 | |||||||||
| 2019 |
501,676 | 107,475 | 609,151 | |||||||||
| Thereafter |
2,670,695 | 215,639 | 2,886,334 | |||||||||
|
|
|
|
|
|
|
|||||||
| 5,011,541 | 851,912 | 5,863,453 | ||||||||||
|
|
|
|
|
|
|
|||||||
Capital lease obligation
The anticipated aggregate principal and interest repayments due for its capital lease obligations for each of the fiscal years subsequent to June 30, 2015, are as follows:
| Principal | Interest | Total | ||||||||||
| 2015 |
5,629 | 1,570 | 7,199 | |||||||||
| 2016 |
11,585 | 2,787 | 14,372 | |||||||||
| 2017 |
12,029 | 2,306 | 14,335 | |||||||||
| 2018 |
12,510 | 1,785 | 14,295 | |||||||||
| 2019 |
12,991 | 1,263 | 14,254 | |||||||||
| Thereafter |
22,631 | 890 | 23,521 | |||||||||
|
|
|
|
|
|
|
|||||||
| 77,375 | 10,601 | 87,976 | ||||||||||
|
|
|
|
|
|
|
|||||||
At December 31, 2014 and June 30, 2015 the Company was in compliance with the covenants in its credit agreements. The Company’s debt facilities contain customary covenants and events of default; included within certain debt facilities are covenants that limit the ability of the Company to incur additional indebtedness and create liens, covenants that limit the ability of the Company to consolidate, merge or dispose of all or substantially all of its assets and enter into transactions with affiliates and covenants that limit the ability of the Company to pay dividends.
Full Recourse Term Facilities
In the period to June 30, 2015, the Company drew down on new facilities totalling US$970.2m and made repayments totalling US$76.2m for the six months period to June 30, 2015. During the period to June 30, 2015, a number of the Company’s existing debt facilities have changed from non-recourse term facilities to Full Recourse facilities totalling US$24.5m. Each of these loans contains provisions that require the payment of principal and interest throughout the terms of the loans.
| Avolon | Financial Statements | F - 13 |
Avolon Holdings Limited
Notes to the Unaudited Condensed Consolidated Interim Financial Statements
Six months ended June 30, 2014 and 2015
(In US$ thousands, except as otherwise stated)
| (10) | Debt financing and capital lease obligations (continued) |
Non-Recourse Term Facilities
In the period to June 30, 2015, the Company made repayments totalling US$301.9m for the six months period to June 30, 2015. During the period to June 30, 2015, a number of the Company’s existing debt facilities have changed from Non-Recourse term facilities to Full Recourse facilities totalling US$24.5m Each of these loans contains provisions that require the payment of principal and interest throughout the terms of the loans.
A detailed summary of the principal terms of our indebtedness can be found in our 2014 annual financial statements. There have been no material changes, except for Full Recourse term facilities and Non-Recourse term facilities as described above, to the indebtedness since December 31, 2014. During the period to June 30, 2015, the Company drew down on new facilities totalling US$452.9m and made repayments totalling US$474.0m for the six months period to June 30, 2015 in relation to the other debt facilities not mentioned above.
| (11) | Income taxes |
The effective tax rate was 7.6% and 7.0% for the three and six months ended June 30, 2015 compared to 3.4% and 3.6% for the three and six months ended June 30, 2014. The Company is incorporated in the Cayman Islands and domiciled in Ireland, whereas its predecessor, Avolon S.à r.l. was incorporated in Luxembourg. The statutory rate of tax in Ireland is 12.5% and the statutory rate of tax in Luxembourg was 29.2% for the year ended December 31, 2014.
| (12) | Derivative financial instruments |
Gains/(losses) from changes in fair values of derivatives are recognized in the consolidated statement of comprehensive income as a component of interest expense. These amounts are shown in the table below for the six months ended June 30, 2014 and 2015.
| Six months ended June 30, | ||||||||
| 2014 | 2015 | |||||||
| Interest Rate Contracts: |
||||||||
| Unrealised (loss) on derivatives |
(9,466 | ) | (2,931 | ) | ||||
| Realised (loss) on derivatives |
— | (378 | ) | |||||
The table below shows the notional amounts of the Company’s outstanding derivative instruments and credit risk amounts associated with outstanding or unsettled derivative instruments as of December 31, 2014 and June 30, 2015. These amounts are considered indicative of the Company’s derivative transaction volume during each of the respective years presented.
| December 31, 2014 |
June 30, 2015 |
|||||||
| Interest rate contracts: |
||||||||
| Interest Rate Swaps |
32,629 | 97,519 | ||||||
| Interest Rate Caps |
361,816 | 471,646 | ||||||
| Avolon | Financial Statements | F - 14 |
Avolon Holdings Limited
Notes to the Unaudited Condensed Consolidated Interim Financial Statements
Six months ended June 30, 2014 and 2015
(In US$ thousands, except as otherwise stated)
| (13) | Offsetting disclosure |
In connection with its derivative activities, the Company enters into master netting agreements and collateral agreements with its counterparties. These agreements provide the Company with the right, in the event of a default by the counterparty (such as bankruptcy or a failure to pay or perform), to net a counterparty’s rights and obligations under the agreement and to liquidate and set off collateral against any net amount owed by the counterparty. However, in certain circumstances: the Company may not have such an agreement in place; the relevant insolvency regime (which is based on the type of counterparty entity and the jurisdiction of organization of the counterparty) may not support the enforceability of the agreement; or the Company may not have sought legal advice to support the enforceability of the agreement. In cases where the Company has not determined an agreement to be enforceable, the related amounts are not offset in the tabular disclosures below. The Company’s policy is generally to recognise all derivative assets and derivative liabilities on a gross basis on the consolidated balance sheet. The following tables present information about the offsetting of derivative instruments.
| At December 31, 2014 | ||||||||||||||||||||
| Gross Amounts |
Amounts offset in the consolidated balance sheets |
Net Amounts Presented in the consolidated balance sheets |
Financial instruments not offset in the consolidated balance sheets |
Net Exposure |
||||||||||||||||
| Derivative Assets |
14,021 | (5,884 | ) | 8,137 | — | 8,137 | ||||||||||||||
| Derivative Liabilities |
(7,284 | ) | 5,884 | (1,400 | ) | — | (1,400 | ) | ||||||||||||
| At June 30, 2015 | ||||||||||||||||||||
| Gross Amounts |
Amounts offset in the consolidated balance sheets |
Net Amounts Presented in the consolidated balance sheets |
Financial instruments not offset in the consolidated balance sheets |
Net Exposure |
||||||||||||||||
| Derivative Assets |
19,468 | (10,985 | ) | 8,483 | — | 8,483 | ||||||||||||||
| Derivative Liabilities |
(12,705 | ) | 10,985 | (1,720 | ) | — | (1,720 | ) | ||||||||||||
| Avolon | Financial Statements | F - 15 |
Avolon Holdings Limited
Notes to the Unaudited Condensed Consolidated Interim Financial Statements
Six months ended June 30, 2014 and 2015
(In US$ thousands, except as otherwise stated)
| (14) | Lease revenue |
At June 30, 2015 the Company had contracted to receive the following minimum cash lease rentals under non-cancellable operating leases:
| 2015 |
343,426 | |||
| 2016 |
681,460 | |||
| 2017 |
653,789 | |||
| 2018 |
599,359 | |||
| 2019 |
528,236 | |||
| Thereafter |
1,885,582 | |||
|
|
|
|||
| 4,691,852 | ||||
|
|
|
The Company recognised supplemental maintenance rent for the three month and six month periods ended June 30, 2015 of US$(0.2)m and US6.2m (three month and six month periods ended June 30, 2014 of $1.6m and $2.0m) which is included in lease revenue.
| (15) | Interest income / (expense) |
| Three months ended June 30, |
Six months ended June 30, |
|||||||||||||||
| 2014 | 2015 | 2014 | 2015 | |||||||||||||
| Interest income on cash and cash equivalents |
69 | 36 | 177 | 75 | ||||||||||||
| Other interest income |
172 | — | 415 | — | ||||||||||||
|
|
|
|
|
|
|
|
|
|||||||||
| Interest income |
241 | 36 | 592 | 75 | ||||||||||||
|
|
|
|
|
|
|
|
|
|||||||||
| Interest on borrowing |
(46,011 | ) | (45,561 | ) | (90,713 | ) | (96,600 | ) | ||||||||
| Amortization of debt issuance costs |
(4,670 | ) | (7,188 | ) | (10,381 | ) | (12,814 | ) | ||||||||
| Less interest capitalized |
1,875 | 1,552 | 4,225 | 3,276 | ||||||||||||
|
|
|
|
|
|
|
|
|
|||||||||
| Net interest expense |
(48,806 | ) | (51,197 | ) | (96,869 | ) | (106,138 | ) | ||||||||
|
|
|
|
|
|
|
|
|
|||||||||
| Avolon | Financial Statements | F - 16 |
Avolon Holdings Limited
Notes to the Unaudited Condensed Consolidated Interim Financial Statements
Six months ended June 30, 2014 and 2015
(In US$ thousands, except as otherwise stated)
| (16) | Segment information |
The Company manages its business, analyzes and reports its results of operations on the basis of one operating segment – leasing and selling of commercial flight equipment. The Board of Directors is the chief operating decision maker.
| (17) | Commitments and contingencies |
Capital commitments
As at June 30, 2015 the Company had committed to purchasing 108 aircraft scheduled to deliver from 2015 through 2022. All of these commitments are based upon fixed price agreements with the manufacturers or sale-leaseback transactions with airlines, which are adjusted for inflation and include price escalation formulas. The capital commitments includes 30 aircraft under non-binding letters of intent to the amount of $1.3bn. Capital commitments amount to US$6.9bn at June 30, 2015 and are as follows:
| June 30, 2015 | ||||
| 2015 |
492,404 | |||
| 2016 |
1,391,860 | |||
| 2017 |
526,893 | |||
| 2018 |
595,525 | |||
| 2019 |
1,243,086 | |||
| Thereafter |
2,638,539 | |||
|
|
|
|||
| Total |
6,888,307 | |||
|
|
|
|||
Guarantees
The Company is financed by a number of limited recourse loans, totalling US$5.1bn (December 31, 2014: US$4.6bn) and at an average nominal interest rate of 3.5%. These loans are secured by some or all of a mortgage on the flight equipment, share pledge over the flight equipment owning entity, assignment of lease contracts and in some cases a limited guarantee from Avolon Aerospace Leasing Limited and Avolon Investments S.à r.l.. Based on the projected cash flows from the assets, the directors of the Company believe that these loans will continue to perform for the foreseeable future.
As of June 30, 2015 the Company has US$849m (December 31, 2014: US$1,176m) in undrawn debt facilities. The conditions of availability of the undrawn debt facilities vary between debt facilities. The Company has US$225m of unsecured debt facility with limited restrictions to its availability. The Company can avail of US$624m of secured debt facilities where the availability period is between 2015 to 2017. The Company is charged an interest rate between 0.5% to 1% on undrawn balances. The conditions attributable to the utilization of some of these facilities are permitted aircraft types, country and region limits and age limits.
As at June 30, 2015 there were no contingent liabilities.
| Avolon | Financial Statements | F - 17 |
Avolon Holdings Limited
Notes to the Unaudited Condensed Consolidated Interim Financial Statements
Six months ended June 30, 2014 and 2015
(In US$ thousands, except as otherwise stated)
| (18) | Fair value measurements |
The following table presents our assets and liabilities that are measured at fair value and are categorized using the fair value hierarchy:
| As at December 31, 2014 | ||||||||||||
| Level 1 | Level 2 | Level 3 | ||||||||||
| Assets |
||||||||||||
| Derivative financial assets |
— | 8,137 | — | |||||||||
|
|
|
|
|
|
|
|||||||
| Total Assets |
— | 8,137 | — | |||||||||
|
|
|
|
|
|
|
|||||||
| Liabilities |
||||||||||||
| Derivative financial liabilities |
— | 1,400 | — | |||||||||
|
|
|
|
|
|
|
|||||||
| Total Liabilities |
— | 1,400 | — | |||||||||
|
|
|
|
|
|
|
|||||||
| As at June 30, 2015 | ||||||||||||
| Level 1 | Level 2 | Level 3 | ||||||||||
| Assets |
||||||||||||
| Derivative financial assets |
— | 8,483 | — | |||||||||
|
|
|
|
|
|
|
|||||||
| Total Assets |
— | 8,483 | — | |||||||||
|
|
|
|
|
|
|
|||||||
| Liabilities |
||||||||||||
| Derivative financial liabilities |
— | 1,720 | — | |||||||||
|
|
|
|
|
|
|
|||||||
| Total Liabilities |
— | 1,720 | — | |||||||||
|
|
|
|
|
|
|
|||||||
| Avolon | Financial Statements | F - 18 |
Avolon Holdings Limited
Notes to the Unaudited Condensed Consolidated Interim Financial Statements
Six months ended June 30, 2014 and 2015
(In US$ thousands, except as otherwise stated)
| (18) | Fair value measurements (continued) |
There were no transfers between Levels 1, 2 and 3 during the periods presented. The fair values and related carrying values of financial instruments that are not required to be remeasured at fair value on the consolidated balance sheets were as follows:
| As at December 31, 2014 | ||||||||||||||||||||
| Carrying Value |
Fair Value | Level 1 | Level 2 | Level 3 | ||||||||||||||||
| Cash and cash equivalents |
111,392 | 111,392 | — | 111,392 | — | |||||||||||||||
| Restricted cash |
195,095 | 195,095 | — | 195,095 | — | |||||||||||||||
| Trade and other receivables |
11,010 | 11,010 | — | 11,010 | — | |||||||||||||||
|
|
|
|
|
|
|
|
|
|
|
|||||||||||
| Total |
317,497 | 317,497 | — | 317,497 | — | |||||||||||||||
|
|
|
|
|
|
|
|
|
|
|
|||||||||||
| Liabilities |
||||||||||||||||||||
| Debt financing |
4,465,187 | 4,572,515 | — | 4,572,515 | — | |||||||||||||||
| Capital lease obligation |
83,261 | 84,235 | — | 84,235 | — | |||||||||||||||
|
|
|
|
|
|
|
|
|
|
|
|||||||||||
| Total |
4,548,448 | 4,656,750 | — | 4,656,750 | — | |||||||||||||||
|
|
|
|
|
|
|
|
|
|
|
|||||||||||
| As at June 30, 2015 | ||||||||||||||||||||
| Carrying Value |
Fair Value | Level 1 | Level 2 | Level 3 | ||||||||||||||||
| Cash and cash equivalents |
151,717 | 151,717 | — | 151,717 | — | |||||||||||||||
| Restricted cash |
159,697 | 159,697 | — | 159,697 | — | |||||||||||||||
| Trade and other receivables |
7,869 | 7,869 | — | 7,869 | — | |||||||||||||||
|
|
|
|
|
|
|
|
|
|
|
|||||||||||
| Total |
319,283 | 319,283 | — | 319,283 | — | |||||||||||||||
|
|
|
|
|
|
|
|
|
|
|
|||||||||||
| Liabilities |
||||||||||||||||||||
| Debt financing |
5,020,890 | 5,116,789 | — | 5,116,789 | — | |||||||||||||||
| Capital lease obligation |
77,690 | 81,356 | — | 81,356 | — | |||||||||||||||
|
|
|
|
|
|
|
|
|
|
|
|||||||||||
| Total |
5,098,580 | 5,198,145 | — | 5,198,145 | — | |||||||||||||||
|
|
|
|
|
|
|
|
|
|
|
|||||||||||
Level 2 Valuations – Significant other observable inputs
The fair value of debt financing and derivative financial liabilities are calculated using Level 2 observable inputs as defined by ASC 820, which includes quoted prices for similar assets or liabilities, and market-corroborated inputs. The fair value for debt financing and capital lease obligations includes the fair value of the unsecured notes which is determined based on market information provided by third parties. The fair value of derivatives is based on estimated amounts the Company would receive or have to pay to terminate the agreements, taking into account the current interest rate environment or current foreign currency forward rates. The Company develops internal fair value for such instruments and considers other inputs as broker quotes in developing fair value. The carrying value of the other financial instruments, which are measured at other than fair value, approximate fair value due to the short terms to maturity.
| Avolon | Financial Statements | F - 19 |
Avolon Holdings Limited
Notes to the Unaudited Condensed Consolidated Interim Financial Statements
Six months ended June 30, 2014 and 2015
(In US$ thousands, except as otherwise stated)
| (18) | Share based payments |
During the three months ended June 30, 2015, no equity awards were granted under the Equity Incentive Plan. In February 2015, 690,673 share options and 41,650 restricted share units were granted under the Equity Incentive Plan. These share awards have a seven year term and a nominal exercise price. Of these share awards, 45% will vest in equal instalments on December 31 of each year for a three year period beginning in 2015 and 55% will be subject to performance-based vesting requirements over stated periods.
At June 30, 2015, 1,279,999 share options and 83,727 restricted share units were outstanding and were all subject to future time and/or performance-based vesting criteria or restrictions, as applicable. 3,916 options were exercised during the six months ended June 30, 2015 at an exercise price of $24.13. The Company recognized a share based compensation in respect of the Equity Incentive Plan of $2.1m and $3.6m for the three and six month period ended June 30, 2015. As at June 30, 2015, there was approximately $14.3m of total unrecognized compensation costs related to the Incentive Plan. These costs are expected to be recognized over a weighted average of two years. The Company used a Black Scholes pricing model to determine the grant date fair value of the awards.
| (20) | Related party transactions |
The Company received revenue of US$0.1m and US$0.3m for the three and six month periods to June 30, 2015 (June 30, 2014: US$0.2m and US$0.4m for the three and six month periods) from a related party, OH Aircraft Acquisitions, LLC.; an affiliate of Oak Hill Capital Partners II, LP for the servicer management of 2 aircraft during the period ended June 30, 2015 (June 30, 2014: 5 aircraft). The Company received revenue of US$0.1m and US$0.3m for the three and six months period to June 30, 2015 (June 30, 2014: US$0.5m for the three and six month periods) from a related party, Avolon Capital Partners Limited for the servicer management of 7 aircraft (June 30, 2014: 4).
The Company paid directors’ fees and expenses to the members of the Board of US$0.2 m and US$0.4m for the three and six month periods to June 30, 2015 (June 30, 2014: nil). The Company paid monitoring fees to CVC Capital Partners of US$0.1m for the three and six month periods to June 30, 2015 (June 30, 2014: Nil).
| Avolon | Financial Statements | F - 20 |
Exhibit 99.2
AVOLON
2015 Second
Quarter | Earnings Presentation
August 5, 2015
Disclaimer
Concerning
Forward-Looking Statements and Non-GAAP Information
AVOLON
This document
includes forward-looking statements, beliefs or opinions, including statements with respect to Avolon’s business, financial condition, results of operations and plans. These forward-looking statements involve known and unknown risks and
uncertainties, many of which are beyond our control and all of which are based on our management’s current beliefs and expectations about future events. Forward-looking statements are sometimes identified by the use of forward-looking
terminology such as “believe,” “expects,” “may,” “will,” “could,” “should,” “shall,” “risk,” “intends,” “estimates,” “aims,”
“plans,” “predicts,” “continues,” “assumes,” “positioned” or “anticipates” or the negative thereof, other variations thereon or comparable terminology or by discussions of strategy, plans,
objectives, goals, future events or intentions. These forward-looking statements include all matters that are not historical facts. Forward-looking statements may and often do differ materially from actual results. No assurance can be given that
such future results will be achieved.
These risks, uncertainties and assumptions include, but are not limited to, the following: general economic and financial
conditions; the financial condition of our lessees; our ability to obtain additional capital to finance our growth and operations on attractive terms; decline in the value of our aircraft and market rates for leases; the loss of key personnel;
lessee defaults and attempts to repossess aircraft; our ability to regularly sell aircraft; our ability to successfully re-lease our existing aircraft and lease new aircraft; our ability to negotiate and enter into profitable leases; periods of
aircraft oversupply during which lease rates and aircraft values decline; changes in the appraised value of our aircraft; changes in interest rates; competition from other aircraft lessors; and the limited number of aircraft and engine
manufacturers. These and other important factors, including those discussed under “Item 3. Key Information—Risk Factors” included in our Annual Report on Form 20-F filed with the U.S. Securities and Exchange Commission on March 3,
2015, may cause our actual events or results to differ materially from any future results, performances or achievements expressed or implied by the forward-looking statements contained in this document. Such forward-looking statements contained in
this document speak only as of the date of this document. We expressly disclaim any obligation or undertaking to update these forward-looking statements contained in this document to reflect any change in our expectations or any change in events,
conditions, or circumstances on which such statements are based unless required to do so by applicable law.
The financial information included herein includes
financial information that is not presented in accordance with generally accepted accounting principles in the United States (“GAAP”), including adjusted net income, adjusted return on equity (“adjusted ROE”) and adjusted
earnings per share. The Appendix to this presentation includes a reconciliation of adjusted net income, adjusted ROE and adjusted earnings per share with the most directly comparable financial measures calculated in accordance with GAAP. See slides
15 to 17 .
Avolon | Slide 2
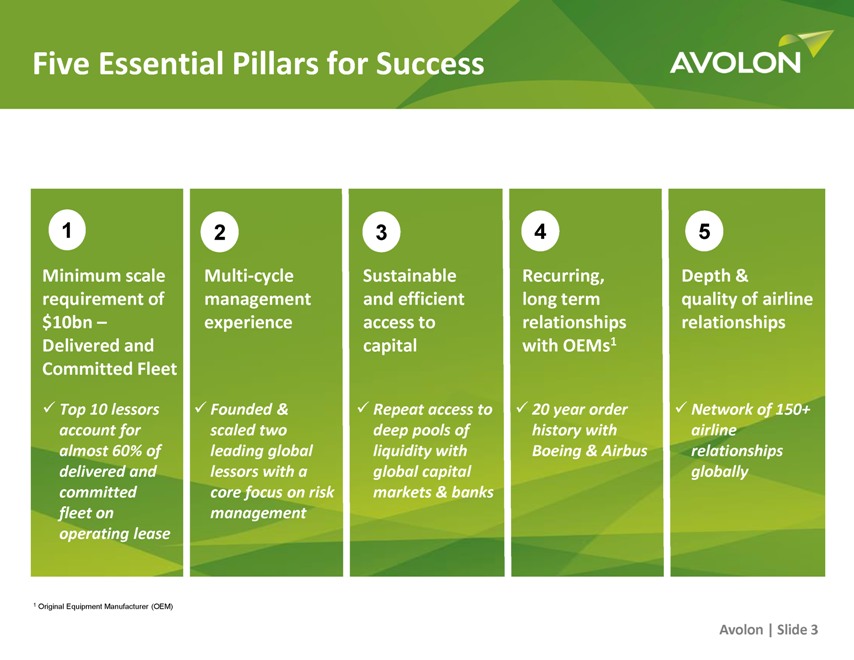
Five Essential Pillars for Success
AVOLON
1 Minimum scale requirement of $10bn – Delivered and Committed Fleet Top 10
lessors account for almost 60% of delivered and committed fleet on operating lease
2 Multi-cycle management experience Founded & scaled two leading global
lessors with a core focus on risk management
3 Sustainable and efficient access to capital Repeat access to deep pools of liquidity with global capital markets
& banks
4 Recurring, long term relationships with OEMs1 20 year order history with Boeing & Airbus
5 Depth & quality of airline relationships Network of 150+ airline relationships globally
1 Original Equipment Manufacturer (OEM)
Avolon | Slide 3
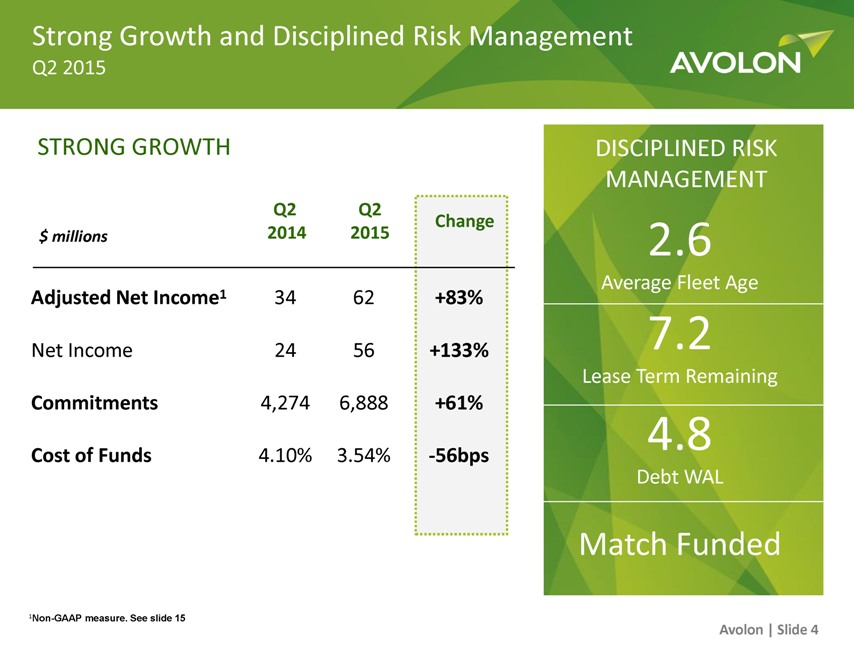
Strong Growth and Disciplined Risk Management
Q2 2015
AVOLON
STRONG GROWTH
$ millions Adjusted Net Income1 Net Income Commitments Cost of Funds
Q2 2014 34 24 4,274 4.10%
Q2 2015 62 56 6,888 3.54%
Change +83% +133% +61% -56bps
DISCIPLINED RISK MANAGEMENT 2.6 Average Fleet Age 7.2 Lease Term
Remaining 4.8 Debt WAL Match Funded
1Non-GAAP measure. See slide 15 Avolon | Slide 4
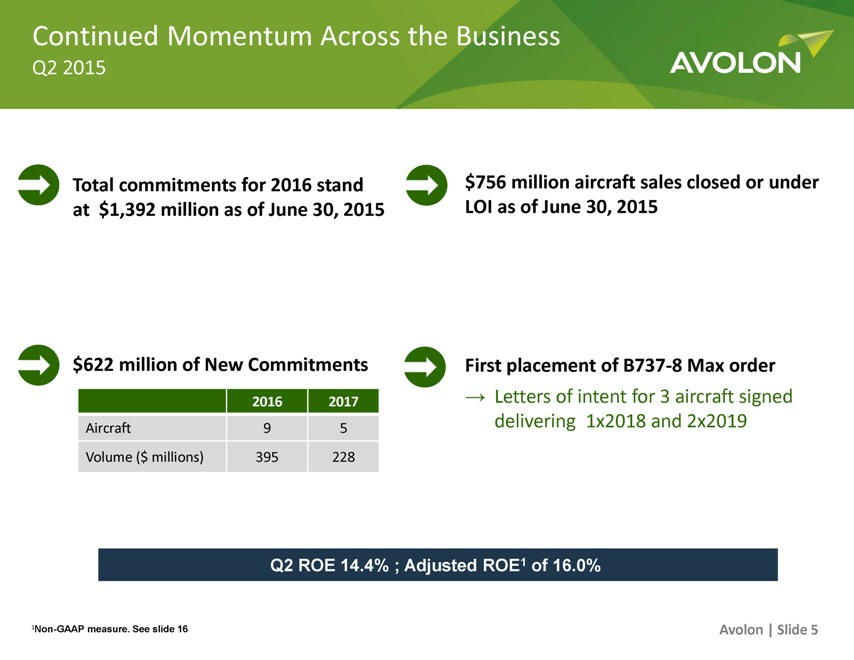
Continued Momentum Across the Business
Q2 2015
AVOLON
Total commitments for 2016 stand at $1,392 million as of June 30, 2015
$756 million aircraft
sales closed or under LOI as of June 30, 2015
$622 million of New Commitments First placement of B737-8 Max order
Letters of intent for 3 aircraft signed delivering 1x2018 and 2x2019
Aircraft Volume ($
millions)
2016 9 395
2017 5 228
Q2 ROE 14.4% ; Adjusted ROE1 of 16.0%
1Non-GAAP measure. See slide 16 Avolon | Slide 5
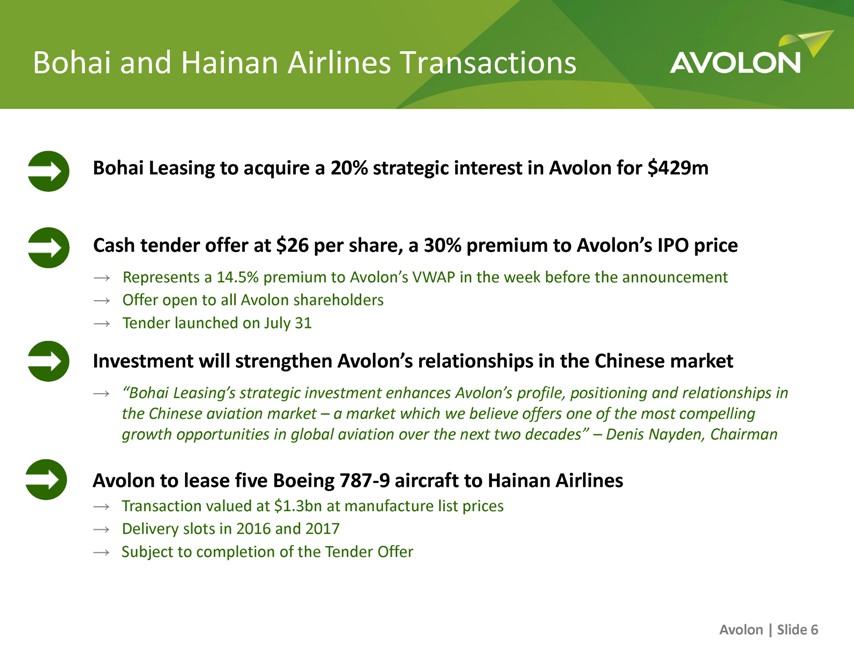
Bohai and Hainan Airlines Transactions AVOLON
Bohai Leasing to acquire a 20% strategic interest in Avolon for $429m
Cash tender offer at $26
per share, a 30% premium to Avolon’s IPO price
Represents a 14.5% premium to Avolon’s VWAP in the week before the announcement
Offer open to all Avolon shareholders
Tender launched on July 31
Investment will strengthen Avolon’s relationships in the Chinese market
“Bohai
Leasing’s strategic investment enhances Avolon’s profile, positioning and relationships in the Chinese aviation market – a market which we believe offers one of the most compelling growth opportunities in global aviation over the next
two decades” – Denis Nayden, Chairman
Avolon to lease five Boeing 787-9 aircraft to Hainan Airlines
Transaction valued at $1.3bn at manufacture list prices
Delivery slots in 2016 and 2017
Subject to completion of the Tender Offer
Avolon | Slide 6

AVOLON
FINANCIAL
HIGHLIGHTS
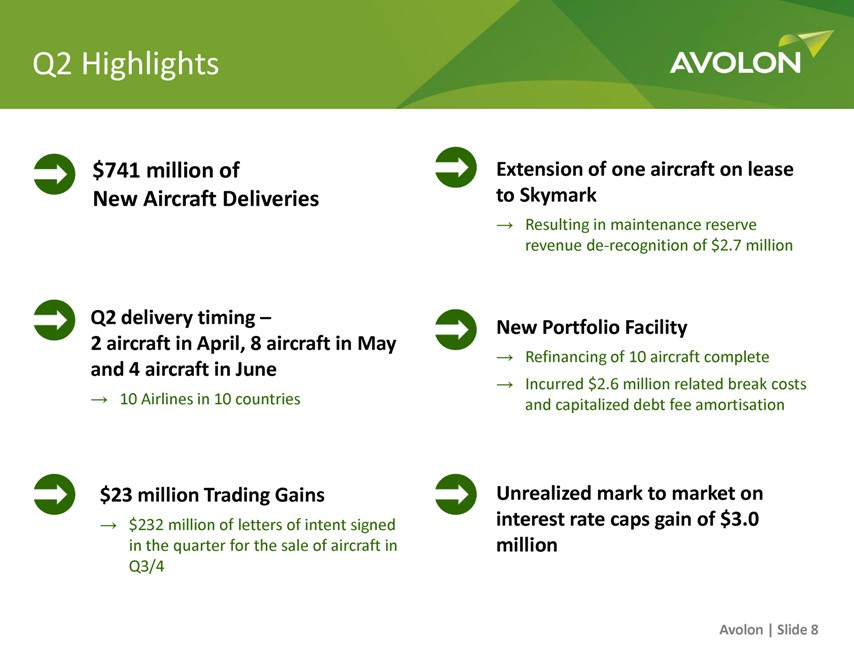
Q2 Highlights
AVOLON
$741 million of New Aircraft Deliveries
Q2 delivery timing – 2 aircraft
in April, 8 aircraft in May and 4 aircraft in June
10 Airlines in 10 countries
$23 million Trading Gains
$232 million of letters of intent signed in the
quarter for the sale of aircraft in Q3/4
Extension of one aircraft on lease to Skymark
Resulting in maintenance reserve revenue de-recognition of $2.7 million
New Portfolio Facility
Refinancing of 10 aircraft complete
Incurred $2.6 million related break costs
and capitalized debt fee amortisation
Unrealized mark to market on interest rate caps gain of $3.0 million
Avolon | Slide 8
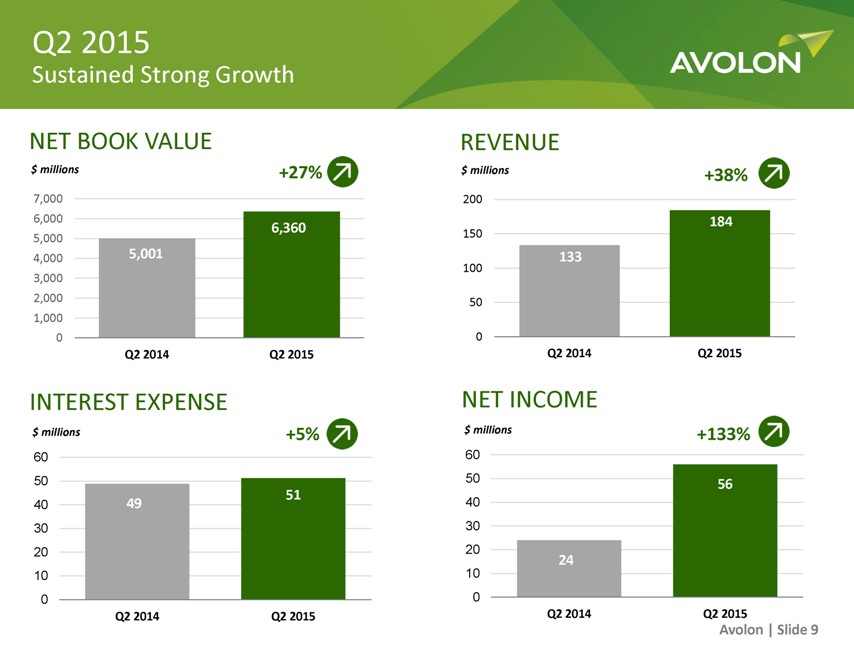
Q2 2015
Sustained Strong
Growth
AVOLON
NET BOOK VALUE
$ millions +27%
7,000
6,000 6,360
5,000
4,000 5,001
3,000
2,000
1,000
0
Q2 2014
Q2 2015
INTEREST EXPENSE
$ millions
+5%
60
50 51
40 49
30
20
10
0
Q2 2014
Q2 2015
REVENUE
$ millions
+38%
200 184
150 133
100
50
0
Q2
2014
Q2 2015
NET INCOME
$ millions
+133%
60
50
56
40
30
20
24
10
0
Q2 2014
Q2 2015
Avolon | Slide 9
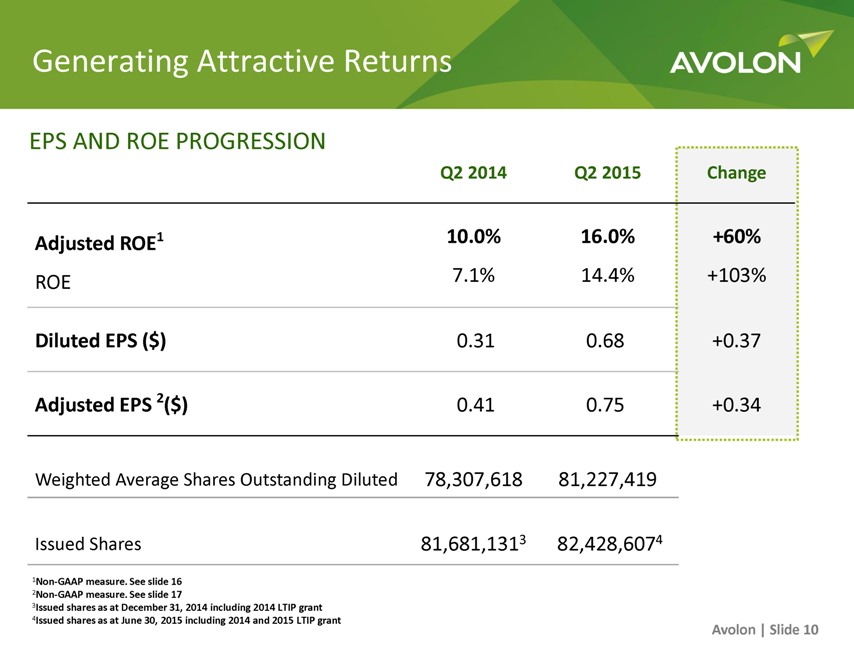
Generating Attractive Returns AVOLON
EPS AND ROE PROGRESSION
Q2 2014 Q2 2015 Change
Adjusted ROE1 10.0% 16.0% +60%
ROE 7.1% 14.4% +103%
Diluted EPS ($) 0.31 0.68 +0.37
Adjusted EPS 2($) 0.41 0.75 +0.34
Weighted Average Shares Outstanding Diluted 78,307,618 81,227,419
Issued Shares 81,681,1313
82,428,6074
1Non-GAAP measure. See slide 16
2Non-GAAP measure. See slide 17
3Issued shares as at December 31, 2014 including 2014 LTIP grant
4Issued
shares as at June 30, 2015 including 2014 and 2015 LTIP grant
Avolon | Slide 10
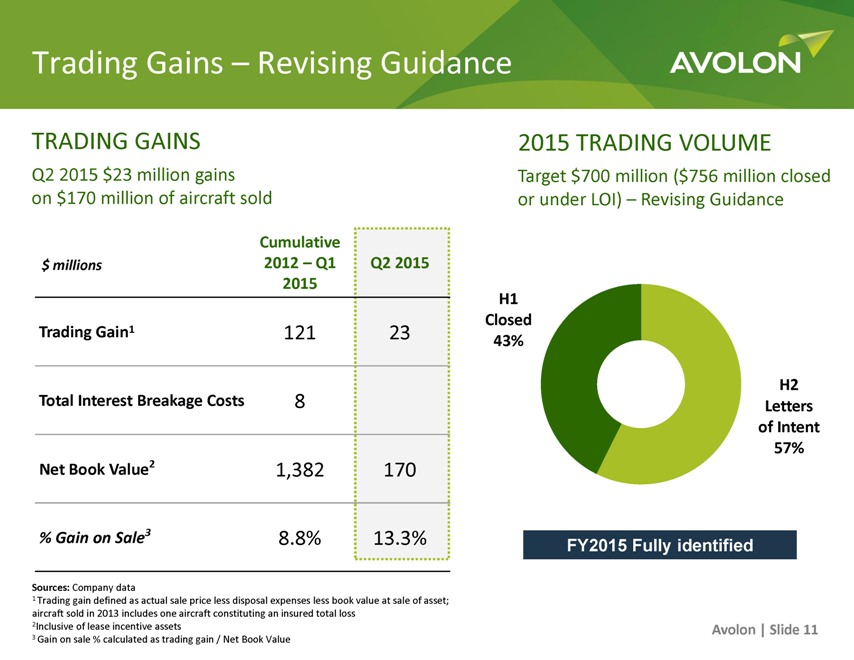
Trading Gains – Revising Guidance
AVOLON
TRADING GAINS
Q2 2015 $23 million gains on $170 million of aircraft sold
$ millions
Cumulative 2012 – Q1 2015
Q2 2015
Trading Gain1 121 23
Total Interest Breakage Costs 8
Net Book Value2 1,382 170
% Gain on Sale3 8.8% 13.3%
Sources: Company data
1 Trading gain defined as actual sale price less disposal expenses less
book value at sale of asset; aircraft sold in 2013 includes one aircraft constituting an insured total loss
2Inclusive of lease incentive assets
3 Gain on sale % calculated as trading gain / Net Book Value
2015 TRADING VOLUME
Target $700 million ($756 million closed or under LOI) – Revising Guidance
H1 Closed 43%
H2 Letters of Intent 57%
FY2015 Fully identified
Avolon | Slide 11
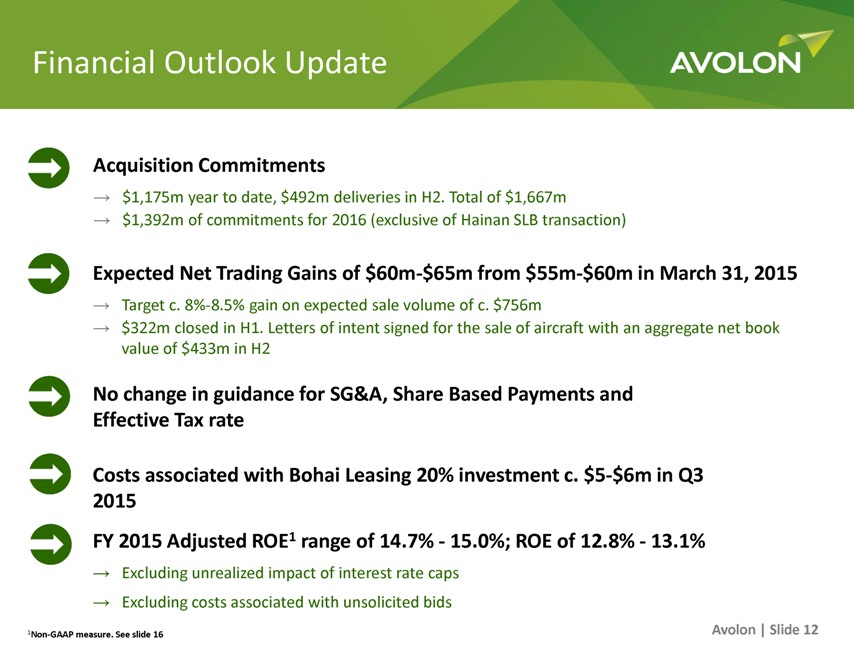
Financial Outlook Update
AVOLON
Acquisition Commitments
$1,175m year to date, $492m deliveries in H2. Total of $1,667m
$1,392m of commitments for 2016
(exclusive of Hainan SLB transaction)
Expected Net Trading Gains of $60m-$65m from $55m-$60m in March 31, 2015
Target c. 8%-8.5% gain on expected sale volume of c. $756m
$322m closed in H1. Letters of
intent signed for the sale of aircraft with an aggregate net book value of $433m in H2
No change in guidance for SG&A, Share Based Payments and Effective Tax
rate
Costs associated with Bohai Leasing 20% investment c. $5-$6m in Q3 2015
FY 2015 Adjusted ROE1 range of 14.7% - 15.0%; ROE of 12.8% - 13.1%
Excluding
unrealized impact of interest rate caps
Excluding costs associated with unsolicited bids
1Non-GAAP measure. See slide 16
Avolon | Slide 12
AVOLON
APPENDIX
Find out more at www.avolon.aero
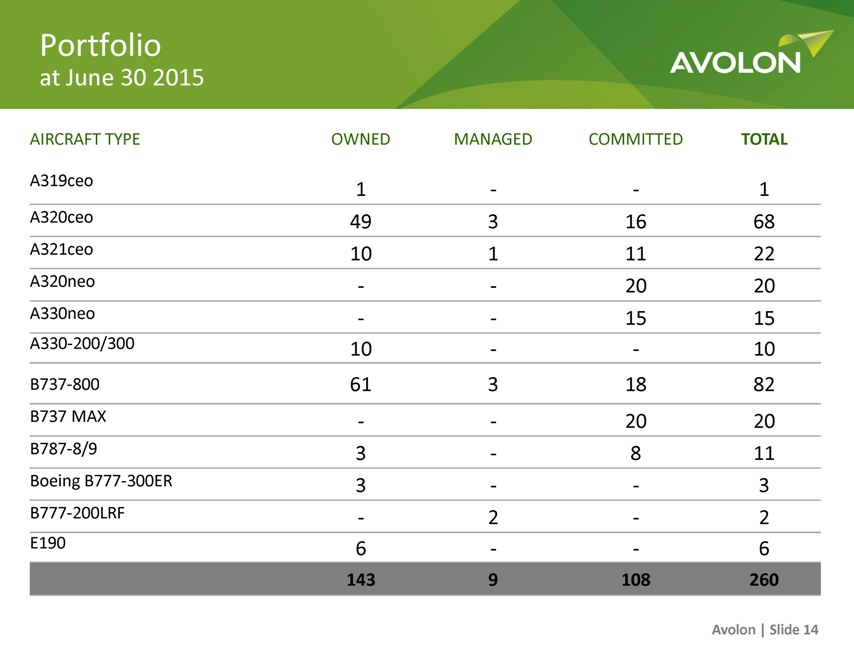
Portfolio
at June 30
2015
AVOLON
AIRCRAFT TYPE OWNED MANAGED COMMITTED TOTAL
A319ceo 1 - -1
A320ceo 49 3 16 68
A321ceo 10 1 11 22
A320neo - - 20 20
A330neo - - 15 15
A330-200/300 10 - - 10
B737-800 61 3 18 82
B737 MAX - - 20 20
B787-8/9 3 - 8 11
Boeing B777-300ER 3 - - 3
B777-200LRF - 2 - 2
E190 6 - - 6
143 9 108 260
Avolon | Slide 14
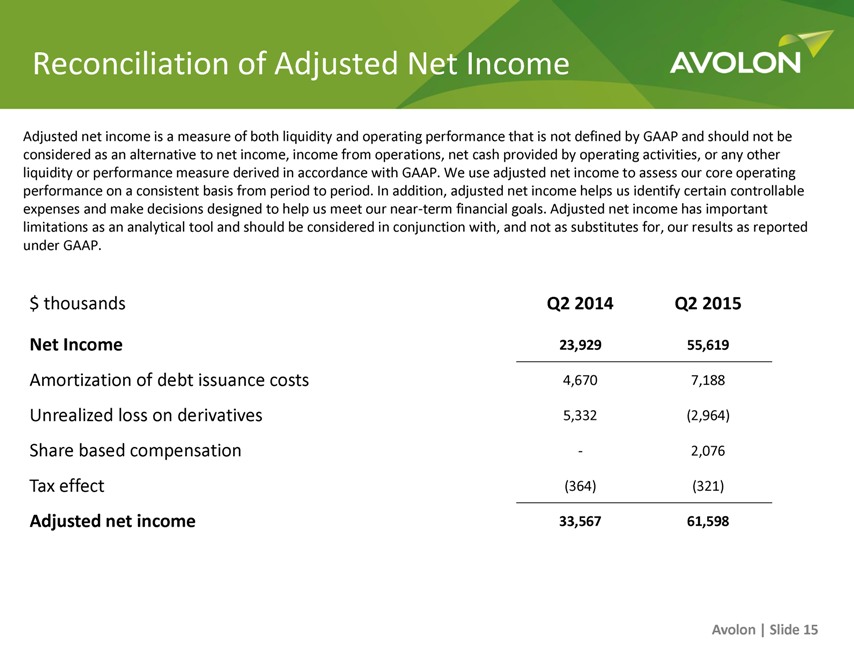
Reconciliation of Adjusted Net Income
AVOLON
Adjusted net income is a measure of both liquidity and operating performance that is
not defined by GAAP and should not be considered as an alternative to net income, income from operations, net cash provided by operating activities, or any other liquidity or performance measure derived in accordance with GAAP. We use adjusted net
income to assess our core operating performance on a consistent basis from period to period. In addition, adjusted net income helps us identify certain controllable expenses and make decisions designed to help us meet our near-term financial goals.
Adjusted net income has important limitations as an analytical tool and should be considered in conjunction with, and not as substitutes for, our results as reported under GAAP.
$ thousands Q2 2014 Q2 2015
Net Income 23,929 55,619
Amortization of debt issuance costs 4,670 7,188
Unrealized loss on derivatives 5,332 (2,964)
Share based compensation - 2,076
Tax effect (364) (321)
Adjusted net income 33,567 61,598
Avolon | Slide 15
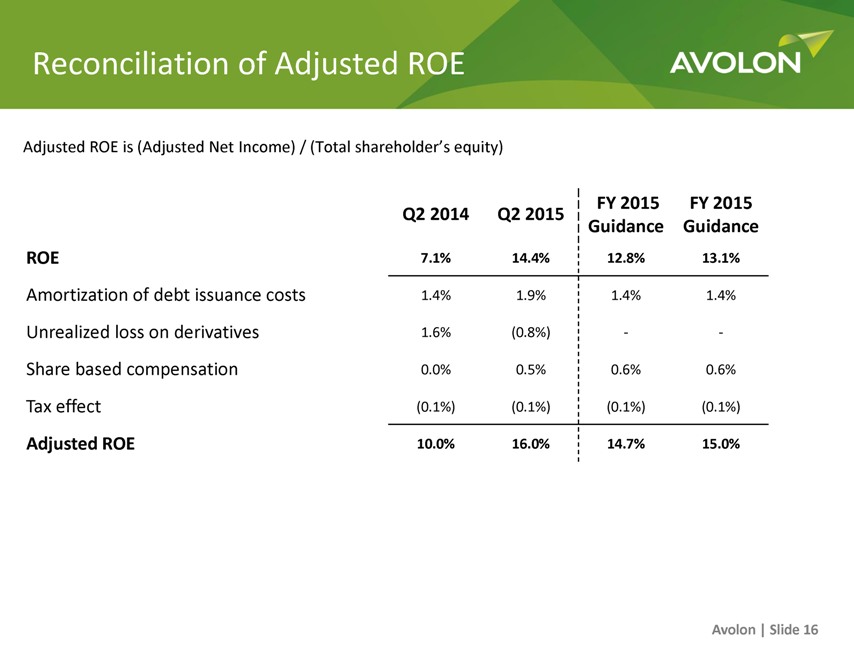
Reconciliation of Adjusted ROE
AVOLON
Adjusted ROE is (Adjusted Net Income) / (Total shareholder’s equity)
Q2 2014 Q2 2015
FY 2015 Guidance FY 2015 Guidance
ROE 7.1% 14.4% 12.8% 13.1%
Amortization of debt issuance costs 1.4% 1.9% 1.4% 1.4%
Unrealized loss on derivatives 1.6% (0.8%) - -
Share based compensation 0.0% 0.5% 0.6% 0.6%
Tax effect (0.1%) (0.1%) (0.1%) (0.1%)
Adjusted ROE 10.0% 16.0% 14.7% 15.0%
Avolon | Slide 16
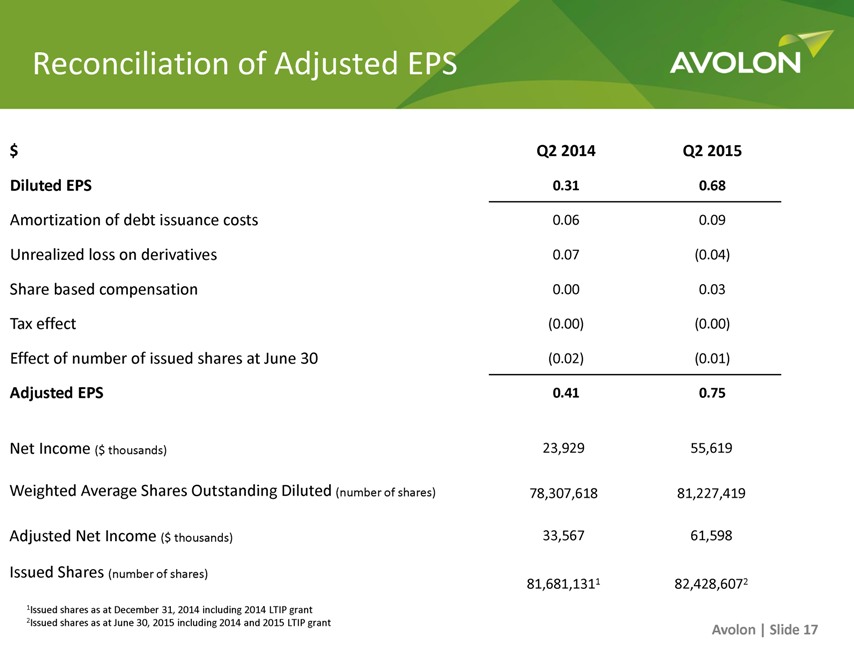
Reconciliation of Adjusted EPS
AVOLON
$ Q2 2014 Q2 2015
Diluted EPS 0.31 0.68
Amortization of debt issuance costs 0.06 0.09
Unrealized loss on derivatives 0.07 (0.04)
Share based compensation 0.00 0.03
Tax effect (0.00) (0.00)
Effect of number of issued shares at June 30 (0.02) (0.01)
Adjusted EPS 0.41 0.75
Net Income ($ thousands) 23,929 55,619
Weighted Average Shares Outstanding Diluted (number of shares) 78,307,618 81,227,419
Adjusted
Net Income ($ thousands) 33,567 61,598
Issued Shares (number of shares) 81,681,1311 82,428,6072
1 Issued shares as at December 31, 2014 including 2014 LTIP grant
2 Issued shares as at
June 30, 2015 including 2014 and 2015 LTIP grant
Avolon | Slide 17

AVOLON
THANK YOU
Find out more at www.avolon.aero
Serious News for Serious Traders! Try StreetInsider.com Premium Free!
You May Also Be Interested In
- Kultura Brands Establishes Authorized Share Ceiling and Next Phase of Capital Structure Reform
- Freedom Gold Corp. Announces Closing of First Tranche of Private Placement Offering of Units
- ScottsMiracle-Gro Brings America250’s “Our American Story” to ScottsMiracle-Gro Field
Create E-mail Alert Related Categories
SEC FilingsSign up for StreetInsider Free!
Receive full access to all new and archived articles, unlimited portfolio tracking, e-mail alerts, custom newswires and RSS feeds - and more!
