




Form 6-K Atento S.A. For: Sep 30

FREE Breaking News Alerts from StreetInsider.com!
StreetInsider.com Top Tickers, 10/25/2026
- Wall Street closes lower to end rocky week
- Meta's capital-raising plans expose a major weakness in the AI boom
- Oil prices jump $3 on Houthi attacks, oil spill, highest settlement since April
- BofA flags further downside risk for stocks, yields and dollar
- SpaceX cell-site ambitions lift tower stocks and weigh on carriers
 Tweet
Tweet Share
Share E-mail
Table of Contents
UNITED STATES
SECURITIES AND EXCHANGE COMMISSION
Washington, D.C. 20549
FORM 6-K
Report of Foreign Private Issuer
Pursuant to Rule 13a-16 or 15d-16
of the Securities Exchange Act of 1934
For the month of September, 2015
Commission File Number 001-36671
Atento S.A.
(Translation of Registrant’s name into English)
4 rue Lou Hemmer, L-1748 Luxembourg Findel
Grand Duchy of Luxembourg
(Address of principal executive office)
Indicate by check mark whether the registrant files or will file annual reports under cover of Form 20-F or Form 40-F.
Form 20-F: x Form 40-F: ¨
Indicate by check mark if the registrant is submitting the Form 6-K in paper as permitted by Regulation S-T Rule 101(b)(1):
Yes: ¨ No: x
Note: Regulation S-T Rule 101(b)(1) only permits the submission in paper of a Form 6-K if submitted solely to provide an attached annual report to security holders.
Indicate by check mark if the registrant is submitting the Form 6-K in paper as permitted by Regulation S-T Rule 101(b)(7):
Yes: ¨ No: x
Note: Regulation S-T Rule 101(b)(7) only permits the submission in paper of a Form 6-K if submitted to furnish a report or other document that the registrant foreign private issuer must furnish and make public under the laws of the jurisdiction in which the registrant is incorporated, domiciled or legally organized (the registrant’s “home country”), or under the rules of the home country exchange on which the registrant’s securities are traded, as long as the report or other document is not a press release, is not required to be and has not been distributed to the registrant’s security holders, and, if discussing a material event, has already been the subject of a Form 6-K submission or other Commission filing on EDGAR.
Table of Contents
ATENTO S.A.
Financial Information
For the Three and Nine Months Ended September 30, 2015
Table of Contents
PART I - PRESENTATION OF FINANCIAL AND OTHER INFORMATION
Atento S.A. (“Atento”, the “Company”, “we” or the “Organization”) was formed as a direct subsidiary of Atalaya Luxco Topco S.C.A. (“Topco”). In April 2014, Topco also incorporated Atalaya Luxco PIKCo S.C.A. (“PikCo”) and on May 15, 2014 Topco contributed to PikCo: (i) all of its equity interests in its then direct subsidiary, Atalaya Luxco Midco S.à.r.l. (“Midco”), the consideration for which was an allocation to PikCo’s account “capital contributions not remunerated by shares” (the “Reserve Account”) equal to €2 million, resulting in Midco becoming a direct subsidiary of PikCo; and (ii) all of its debt interests in Midco (comprising three series of preferred equity certificates (the “Original Luxco PECs”)), the consideration for which was the issuance by PikCo to Topco of preferred equity certificates having an equivalent value. On May 30, 2014, Midco authorized the issuance of, and PikCo subscribed for, a fourth series of preferred equity certificates (together with the Original Luxco PECs, the “Luxco PECs”).
In connection with the completion of Atento’s initial public offering (the “IPO”) in October 2014, Topco transferred its entire interest in Midco (€31,000 of share capital) to PikCo, the consideration for which was an allocation of €31,000 to PikCo’s Reserve Account. PikCo then contributed all of the Luxco PECs to Midco (the “Contribution”), the consideration for which was an allocation to Midco’s Reserve Account equal to the value of the Luxco PECs immediately prior to the Contribution. Upon completion of the Contribution, the Luxco PECs were capitalized by Midco. PikCo then transferred the remainder of its interest in Midco (€12,500 of share capital) to the Company, in consideration for which the Company issued two new shares of its capital stock to PikCo. The difference between the nominal value of these shares and the value of Midco’s net equity will be allocated to the Company’s share premium account. As a result of this transfer, Midco became a direct subsidiary of the Company. The Company completed a share split (the “Share Split”) whereby it issued approximately 2,219.212 ordinary shares for each ordinary share outstanding as of September 3, 2014. The foregoing is collectively referred as the “Reorganization Transaction”.
On October 7, 2014, we closed our IPO and issued 4,819,511 ordinary shares at a price of $15.00 per share. As a result of the IPO, the Share Split and the Reorganization Transaction, we have 73,619,511 ordinary shares outstanding and owns 100% of the issued and outstanding share capital of Midco, as of November 9, 2015.
On August 4, 2015, the Board approved a share capital increase through the issuance of 131,620 shares. Therefore the share capital increased from 73,619,511 to 73,751,131.
For further information about the Company, see the “Interim Consolidated Financial Statements for the Nine Months Ended September 30, 2015” accompanying this Interim Report.
In this Interim Report, all references to “U.S. dollar” and “$” are to the lawful currency of the United States and all references to “euro” or “€” are to the single currency of the participating member states of the European and Monetary Union of the Treaty Establishing the European Community, as amended from time to time. In addition, all references to Brazilian Reais (BRL), Mexican Peso (MXN), Chilean Peso (CLP), Argentinean Peso (ARS), Colombian Peso (COP) and Peruvian Nuevos Soles (PEN) are to the lawful currencies of Brazil, Mexico, Chile, Argentina, Colombia and Peru, respectively.
Comparative information of the unaudited consolidated interim financial statements refer to the three and nine months period ended September 30, 2014 and 2015, except for the statement of financial position, which compares information as of December 31, 2014 and September 30, 2015.
A reclassification was made in the Income Statements and the Statements of Cash Flow for the purpose of best presentation of the financial result. The reclassification refers to the exchange net impact on the fair value of derivatives and it is demonstrated below for the last three quarters and accumulated for the nine months:
Income Statements
| Three months ended March 31, 2014 | ||||||||||||
| Previous classification |
Reclassification | Adjusted balance |
||||||||||
| Finance income |
2,931 | (54 | ) | 2,877 | ||||||||
| Finance expense |
(34,555 | ) | 2,729 | (31,826 | ) | |||||||
| Net exchange differences |
(1,267 | ) | (2,675 | ) | (3,942 | ) | ||||||
|
|
|
|
|
|
|
|||||||
| Total |
(32,891 | ) | — | (32,891 | ) | |||||||
3
Table of Contents
| Three months ended June 30, 2014 | ||||||||||||
| Disclosed | Reclassification | Adjusted balance |
||||||||||
| Finance income |
4,171 | (2,147 | ) | 2,024 | ||||||||
| Finance expense |
(43,272 | ) | 7,041 | (36,231 | ) | |||||||
| Net exchange differences |
4,876 | (4,894 | ) | (18 | ) | |||||||
|
|
|
|
|
|
|
|||||||
| Total |
(34,225 | ) | — | (34,225 | ) | |||||||
| Three months ended September 30, 2014 | ||||||||||||
| Disclosed | Reclassification | Adjusted balance |
||||||||||
| Finance income |
21,243 | (12,798 | ) | 8,445 | ||||||||
| Finance expense |
(30,311 | ) | (2,069 | ) | (32,380 | ) | ||||||
| Net exchange differences |
(22,014 | ) | 14,867 | (7,147 | ) | |||||||
|
|
|
|
|
|
|
|||||||
| Total |
(31,082 | ) | — | (31,082 | ) | |||||||
| Nine months ended September 30, 2014 | ||||||||||||
| Disclosed | Reclassification | Adjusted balance |
||||||||||
| Finance income |
28,345 | (14,999 | ) | 13,346 | ||||||||
| Finance expense |
(108,138 | ) | 7,701 | (100,437 | ) | |||||||
| Net exchange differences |
(18,405 | ) | 7,298 | (11,107 | ) | |||||||
|
|
|
|
|
|
|
|||||||
| Total |
(98,198 | ) | — | (98,198 | ) | |||||||
Cash Flow
| Three months ended September 30, 2014 | ||||||||||||
| Disclosed | Reclassification | Adjusted balance |
||||||||||
| Gains/(losses) on disposal of financial assets |
345 | (345 | ) | — | ||||||||
| Finance income |
(8,445 | ) | — | (8,445 | ) | |||||||
| Finance expense |
32,026 | 354 | 32,380 | |||||||||
| Net exchange differences |
22,015 | (14,868 | ) | 7,147 | ||||||||
| Change in fair value of financial instruments |
(14,858 | ) | 14,858 | — | ||||||||
|
|
|
|
|
|
|
|||||||
| Total |
31,083 | (1 | ) | 31,082 | ||||||||
| Nine months ended September 30, 2014 | ||||||||||||
| Disclosed | Reclassification | Adjusted balance |
||||||||||
| Gains/(losses) on disposal of financial assets |
1,001 | (1,001 | ) | — | ||||||||
| Finance income |
(13,346 | ) | — | (13,346 | ) | |||||||
| Finance expense |
99,404 | 1,033 | 100,437 | |||||||||
| Net exchange differences |
18,405 | (7,298 | ) | 11,107 | ||||||||
| Change in fair value of financial instruments |
(7,266 | ) | 7,266 | — | ||||||||
|
|
|
|
|
|
|
|||||||
| Total |
98,198 | — | 98,198 | |||||||||
4
Table of Contents
SELECTED HISTORICAL FINANCIAL INFORMATION
We present our historical financial information under International Financial Reporting Standards (“IFRS”) as issued by the International Accounting Standards Board (the “IASB”). The unaudited interim financial statements for the nine months ended September 30, 2015 (the “interim financial statements”) have been prepared in accordance with International Accounting Standard (IAS) 34 “Interim Financial Reporting”.
As described in Note 4 of the interim financial statements, included elsewhere in this Interim Report, the accounting policies adopted in preparation of the interim financial statements for the nine months ended September 30, 2015 are consistent with those followed in the preparation of the consolidated annual financial statements for December 31, 2014, except for change in functional currency at Atento Luxco 1 S.A. (Luxembourg) from Euro to U.S. dollar, since 2015.
Rounding
Certain numerical figures set out in this Interim Report, including financial data presented in millions or thousands and percentages, have been subject to rounding adjustments, and, as a result, the totals of the data in this Interim Report may vary slightly from the actual arithmetic totals of such data. Percentages and amounts reflecting changes over time periods relating to financial and other data set forth in “Selected Historical Financial Information” and “Management’s Discussion and Analysis of Financial Condition and Results of Operations” are calculated using the numerical data in the financial statements or the tabular presentation of other data (subject to rounding) contained in this Interim Report, as applicable, and not using the numerical data in the narrative description thereof.
5
Table of Contents
SUMMARY CONSOLIDATED HISTORICAL FINANCIAL INFORMATION
The following table presents a summary of the unaudited interim consolidated historical financial information for the periods as of the dates indicated and should be read in conjunction with the section of this Interim Report entitled “Management’s Discussion and Analysis of Financial Condition and Results of Operations” and “Selected Historical Financial Information” as well as with the interim financial statements included elsewhere in this Interim Report.
| For the three months ended September 30, |
Change (%) |
Change excluding FX (%) |
For the nine months ended September 30, |
Change (%) |
Change excluding FX (%) |
|||||||||||||||||||||||||||
| ($ millions) | 2014 | 2015 | 2014 | 2015 | ||||||||||||||||||||||||||||
| (unaudited) | (unaudited) | |||||||||||||||||||||||||||||||
| Revenue |
589.6 | 476.2 | (19.2 | ) | 9.0 | 1,743.3 | 1,507.8 | (13.5 | ) | 9.5 | ||||||||||||||||||||||
| EBITDA (1) |
77.5 | 59.4 | (23.4 | ) | 6.2 | 171.4 | 172.9 | 0.9 | 30.6 | |||||||||||||||||||||||
| Adjusted EBITDA (1) |
88.2 | 65.8 | (25.4 | ) | 4.2 | 219.8 | 186.2 | (15.3 | ) | 10.0 | ||||||||||||||||||||||
| Adjusted Earnings (2) |
32.8 | 22.5 | (31.4 | ) | 35.4 | 62.1 | 53.6 | (13.7 | ) | 16.4 | ||||||||||||||||||||||
| Adjusted Earnings per share (in U.S. dollars) (3) |
0.45 | 0.31 | (31.4 | ) | 35.4 | 0.84 | 0.73 | (13.7 | ) | 16.4 | ||||||||||||||||||||||
| Capital Expenditure (4) |
(24.8 | ) | (16.2 | ) | (34.7 | ) | (4.4 | ) | (65.4 | ) | (83.1 | ) | 27.1 | 67.6 | ||||||||||||||||||
| Payments for acquisition of property, plant, equipment and intangible assets (5) |
(36.0 | ) | (23.4 | ) | (35.0 | ) | (17.8 | ) | (81.2 | ) | (60.7 | ) | (25.2 | ) | (6.8 | ) | ||||||||||||||||
| Total Debt excluding PECs |
703.2 | 572.7 | (18.6 | ) | (1.3 | ) | 703.2 | 572.7 | (18.6 | ) | (1.3 | ) | ||||||||||||||||||||
| Cash and cash equivalents and short-term financial investments |
243.3 | 174.7 | (28.2 | ) | (12.0 | ) | 243.3 | 174.7 | (28.2 | ) | (12.0 | ) | ||||||||||||||||||||
| Net debt with third parties (6) |
459.9 | 398.0 | (13.5 | ) | 4.3 | 459.9 | 398.0 | (13.5 | ) | 4.3 | ||||||||||||||||||||||
| (1) | In considering the financial performance of the business, our management analyzes the financial performance measures of EBITDA and Adjusted EBITDA at a company and operating segment level, to facilitate decision making. EBITDA is defined as profit/(loss) for the period from continuing operations before net finance costs, income taxes and depreciation and amortization. Adjusted EBITDA is defined as EBITDA adjusted to exclude acquisition and integration related costs, restructuring costs, sponsor management fees, assets impairments, site relocations costs, financing and IPO fees, and other items which are not related to our core results of operations. EBITDA and Adjusted EBITDA are not measures defined by IFRS. The most directly comparable IFRS measure to EBITDA and Adjusted EBITDA is profit/(loss) for the period from continuing operations. |
We believe EBITDA and Adjusted EBITDA are useful metrics for investors to understand our results of continuing operations and profitability because they permit investors to evaluate our recurring profitability from underlying operating activities. We also use these measures internally to establish forecasts, budgets and operational goals to manage and monitor our business, as well as to evaluate our underlying historical performance. We believe EBITDA facilitates comparisons of operating performance between periods and among other companies in industries similar to ours because it removes the effect of variances in capital structures, taxation, and non-cash depreciation and amortization charges, which may differ between companies for reasons unrelated to operating performance. We believe Adjusted EBITDA better reflects our underlying operating performance because it excludes the impact of items which are not related to our core results of continuing operations.
EBITDA and Adjusted EBITDA measures are frequently used by securities analysts, investors and other interested parties in their evaluation of companies comparable to us, many of which present EBITDA-related performance measures when reporting their results.
EBITDA and Adjusted EBITDA have limitations as analytical tools. These measures are not presentations made in accordance with IFRS, are not measures of financial condition or liquidity and should not be considered in isolation or as alternatives to profit or loss for the period from continuing operations or other measures determined in accordance with IFRS. EBITDA and Adjusted EBITDA are not necessary comparable to similarly titled measures used by other companies.
See below under the heading “Reconciliation of EBITDA and Adjusted EBITDA to profit/(loss)” for a reconciliation of profit/(loss) for the period from continuing operations to EBITDA and Adjusted EBITDA.
| (2) | In considering the Company’s financial performance, our management analyzes the performance measure of Adjusted Earnings. Adjusted Earnings is defined as profit/(loss) for the period from continuing operations adjusted for acquisition and integration related costs, amortization of acquisition related intangible assets, restructuring costs, sponsor management fees, assets impairments, site relocation costs, financing fees, PECs interest expenses, other non-ordinary expenses, net foreign exchange impacts and their tax effects. Adjusted Earnings is not a measure defined by IFRS. The most directly comparable IFRS measure to Adjusted Earnings is profit/(loss) for the period from continuing operations. |
6
Table of Contents
We believe Adjusted Earnings, is a useful metric to investors and is used by our management for measuring profitability because it represents a group measure of performance which excludes the impact of certain non-cash charges and other charges not associated with the underlying operating performance of the business, while including the effect of items that we believe affect shareholder value and in-year return, such as income-tax expense and net finance costs.
Our management uses Adjusted Earnings/(loss) to (i) provide senior management with monthly reports of our operating results; (ii) prepare strategic plans and annual budgets; and (iii) review senior management’s annual compensation, in part, using adjusted performance measures.
Adjusted Earnings is defined to exclude items that are not related to our core results of operations. Adjusted Earnings/(loss) measures are frequently used by securities analysts, investors and other interested parties in their evaluation of companies comparable to us, many of which present an Adjusted Earnings related performance measure when reporting their results.
Adjusted Earnings has limitations as an analytical tool. Adjusted Earnings is neither a presentation made in accordance with IFRS nor a measure of financial condition or liquidity, and should not be considered in isolation or as an alternative to profit or loss for the period from continuing operations or other measures determined in accordance with IFRS. Adjusted Earnings is not necessarily comparable to similarly titled measures used by other companies.
See below under the heading “Reconciliation of Adjusted Earnings to profit/loss” for a reconciliation of Adjusted Earnings to our profit/(loss) for the period from continuing operations.
| (3) | Excluding the impact of a previously disclosed one-time tax benefit related the amortization of goodwill related to a contract with Telefónica in the nine month of fiscal 2014, adjusted EPS grew 119.9%. Adjusted Earnings per share is calculated based on 73,648,760 ordinary shares outstanding as of September 30, 2015. The weighted average number of ordinary shares for the period ended September 30, 2014 was not considered in this calculation. |
| (4) | We define “capital expenditure” as the sum of the additions to property, plant and equipment and the additions to intangible assets during the period. |
Capital expenditures for the nine months ended September 30, 2015 reflect the acquisition by Atento of the rights to use certain software for $39.6 million. This intangible asset has a useful life of five years.
| (5) | Payments for acquisition of property, plant, equipment and intangible assets represent the cash disbursement for the period. |
| (6) | In considering our financial condition, our management analyzes Net debt with third parties, which is defined as Total Debt less cash, cash equivalents (net of any outstanding bank overdrafts) and short-term financial investments. |
Net debt with third parties has limitations as an analytical tool. Net debt with third parties is neither a measure defined by or presented in accordance with IFRS nor a measure of financial performance, and should not be considered in isolation or as an alternative financial measure determined in accordance with IFRS. Net debt with third parties is not necessarily comparable to similarly titled measures used by other companies.
See “Selected Historical Financial Information” for a reconciliation of Total Debt to Net debt with third parties utilizing IFRS reported balances obtained from the financial information included elsewhere in this Interim Report. The most directly comparable IFRS measure to Net debt with third parties is Total Debt.
7
Table of Contents
Consolidated Statements of Financial Position as at December 31, 2014 and September 30, 2015
(THOUSANDS OF U.S. DOLLARS, UNLESS OTHERWISE INDICATED)
| December 31, 2014 |
September 30, 2015 |
|||||||
| (audited) | (unaudited) | |||||||
| ASSETS |
||||||||
| NON-CURRENT ASSETS |
942,140 | 765,324 | ||||||
|
|
|
|
|
|||||
| Intangible assets |
293,078 | 234,897 | ||||||
| Goodwill |
169,471 | 135,272 | ||||||
| Property, plant and equipment |
237,196 | 173,642 | ||||||
| Non-current financial assets |
92,258 | 113,367 | ||||||
| Deferred tax assets |
150,137 | 108,146 | ||||||
|
|
|
|
|
|||||
| CURRENT ASSETS |
715,761 | 642,034 | ||||||
|
|
|
|
|
|||||
| Trade and other receivables |
475,759 | 465,966 | ||||||
| Other current financial assets |
28,562 | 1,412 | ||||||
| Cash and cash equivalents |
211,440 | 174,656 | ||||||
|
|
|
|
|
|||||
| TOTAL ASSETS |
1,657,901 | 1,407,358 | ||||||
|
|
|
|
|
|||||
| EQUITY AND LIABILITIES |
||||||||
| EQUITY ATTRIBUTABLE TO EQUITY HOLDERS OF THE PARENT |
464,866 | 415,675 | ||||||
|
|
|
|
|
|||||
| NON-CURRENT LIABILITIES |
818,205 | 682,091 | ||||||
|
|
|
|
|
|||||
| Deferred tax liabilities |
83,132 | 58,445 | ||||||
| Interest bearing-debt |
636,549 | 547,836 | ||||||
| Derivative financial instruments |
1,193 | 300 | ||||||
| Non-current provisions |
94,774 | 58,557 | ||||||
| Non-current non trade payables |
961 | 15,948 | ||||||
| Other non-current payables to public administrations |
1,596 | 1,005 | ||||||
|
|
|
|
|
|||||
| CURRENT LIABILITIES |
374,830 | 309,592 | ||||||
|
|
|
|
|
|||||
| Interest bearing-debt |
16,761 | 24,730 | ||||||
| Trade and other payables |
339,560 | 272,423 | ||||||
| Current provisions |
18,509 | 12,439 | ||||||
|
|
|
|
|
|||||
| TOTAL EQUITY AND LIABILITIES |
1,657,901 | 1,407,358 | ||||||
|
|
|
|
|
|||||
8
Table of Contents
Consolidated Income Statements for the Three and Nine Months Ended September 30, 2014 and 2015
(THOUSANDS OF U.S. DOLLARS, UNLESS OTHERWISE INDICATED)
| For the three months ended September 30, |
Change excluding FX (%) |
For the nine months ended September 30, |
Change excluding FX (%) |
|||||||||||||||||||||
| 2014 | 2015 | 2014 | 2015 | |||||||||||||||||||||
| (unaudited) | (unaudited) | |||||||||||||||||||||||
| Revenue |
589,646 | 476,209 | 9.0 | 1,743,264 | 1,507,844 | 9.5 | ||||||||||||||||||
| Other operating income |
904 | 703 | — | 1,760 | 2,015 | 33.3 | ||||||||||||||||||
| Own work capitalized |
202 | 1 | N.M. | 413 | (15 | ) | N.M. | |||||||||||||||||
| Other gains |
(403 | ) | — | N.M. | 34,478 | — | N.M. | |||||||||||||||||
| Operating expenses: |
||||||||||||||||||||||||
| Supplies |
(27,106 | ) | (20,359 | ) | 1.1 | (79,240 | ) | (59,819 | ) | (3.2 | ) | |||||||||||||
| Employee benefit expense |
(403,030 | ) | (338,327 | ) | 12.4 | (1,246,353 | ) | (1,093,393 | ) | 10.4 | ||||||||||||||
| Depreciation |
(14,894 | ) | (11,969 | ) | 11.4 | (44,420 | ) | (38,439 | ) | 10.1 | ||||||||||||||
| Amortization |
(15,123 | ) | (12,362 | ) | 11.9 | (47,220 | ) | (40,399 | ) | 9.5 | ||||||||||||||
| Changes in trade provisions |
100 | (421 | ) | N.M. | (199 | ) | (925 | ) | N.M. | |||||||||||||||
| Other operating expenses |
(83,169 | ) | (58,488 | ) | (3.4 | ) | (250,227 | ) | (182,714 | ) | (6.8 | ) | ||||||||||||
| Impairment charges |
387 | — | N.M. | (32,479 | ) | — | N.M. | |||||||||||||||||
| Total operating expenses |
(542,835 | ) | (441,926 | ) | 9.6 | (1,700,138 | ) | (1,415,689 | ) | 5.1 | ||||||||||||||
|
|
|
|
|
|
|
|
|
|
|
|
|
|||||||||||||
| Operating profit |
47,514 | 34,987 | 2.5 | 79,777 | 94,155 | 54.4 | ||||||||||||||||||
|
|
|
|
|
|
|
|
|
|
|
|
|
|||||||||||||
| Finance income |
8,445 | 4,855 | (10.6 | ) | 13,346 | 12,677 | 29.9 | |||||||||||||||||
| Finance costs |
(32,380 | ) | (17,934 | ) | (23.8 | ) | (100,437 | ) | (58,019 | ) | (26.2 | ) | ||||||||||||
| Net foreign exchange gain/(loss) |
(7,147 | ) | 3,546 | N.M. | (11,107 | ) | 14,616 | N.M. | ||||||||||||||||
|
|
|
|
|
|
|
|
|
|
|
|
|
|||||||||||||
| Net finance expense |
(31,082 | ) | (9,533 | ) | (64.3 | ) | (98,198 | ) | (30,726 | ) | (58.5 | ) | ||||||||||||
|
|
|
|
|
|
|
|
|
|
|
|
|
|||||||||||||
| Profit/(loss) before tax |
16,432 | 25,454 | 129.3 | (18,421 | ) | 63,429 | N.M. | |||||||||||||||||
|
|
|
|
|
|
|
|
|
|
|
|
|
|||||||||||||
| Income tax benefit/(expense) |
(8,423 | ) | (8,771 | ) | 41.7 | 2,120 | (19,685 | ) | N.M. | |||||||||||||||
| Profit/(loss) for the period |
8,009 | 16,683 | 221.3 | (16,301 | ) | 43,744 | N.M. | |||||||||||||||||
|
|
|
|
|
|
|
|
|
|
|
|
|
|||||||||||||
| Adjusted basic result per share (in U.S. dollars) (*) |
0.11 | 0.23 | 221.3 | (0.22 | ) | 0.59 | N.M. | |||||||||||||||||
|
|
|
|
|
|
|
|
|
|
|
|
|
|||||||||||||
| (*) | The adjusted basic and diluted result per share, for the period presented in the table above, were calculated based on the number of ordinary shares of 73,648,760 as of September 30, 2015. For the period ended September 30, 2014 the number of ordinary shares was 73,619,511. |
9
Table of Contents
Consolidated Statements of Cash Flow for the Three and Nine Months Ended September 30, 2014 and 2015
(THOUSANDS OF U.S. DOLLARS, UNLESS OTHERWISE INDICATED)
| Three months ended September 30, | Nine months ended September 30, | |||||||||||||||
| 2014 | 2015 | 2014 | 2015 | |||||||||||||
| (unaudited) | ||||||||||||||||
| Operating activities |
||||||||||||||||
| Profit/(loss) before tax |
16,432 | 25,454 | (18,421 | ) | 63,429 | |||||||||||
| Adjustments to profit/(loss): |
||||||||||||||||
| Amortization and depreciation |
30,017 | 24,331 | 91,640 | 78,838 | ||||||||||||
| Impairment allowances |
(487 | ) | 421 | 32,678 | 925 | |||||||||||
| Change in provisions |
10,303 | 1,580 | 33,969 | 1,463 | ||||||||||||
| Grants released to income |
— | (119 | ) | — | (365 | ) | ||||||||||
| Gains/(losses) on disposal of fixed assets |
577 | 28 | 139 | 506 | ||||||||||||
| Finance income |
(8,445 | ) | (4,855 | ) | (13,346 | ) | (12,677 | ) | ||||||||
| Finance expense |
32,380 | 17,934 | 100,437 | 58,019 | ||||||||||||
| Net exchange differences |
7,147 | 14,042 | 11,107 | (573 | ) | |||||||||||
| Change in fair value of financial instruments |
— | (17,588 | ) | — | (14,043 | ) | ||||||||||
| Own work capitalized |
(202 | ) | (1 | ) | (413 | ) | 15 | |||||||||
| Other gains |
818 | — | (34,478 | ) | 1,033 | |||||||||||
|
|
|
|
|
|
|
|
|
|||||||||
| 72,108 | 35,773 | 221,733 | 113,141 | |||||||||||||
| Changes in working capital: |
||||||||||||||||
| Changes in trade and other receivables |
28,190 | (6,035 | ) | 34,832 | (98,188 | ) | ||||||||||
| Changes in trade and other payables |
(31,854 | ) | 6,929 | (13,586 | ) | (65 | ) | |||||||||
| Other assets/(payables) |
3,870 | (5,899 | ) | (11,252 | ) | (23,528 | ) | |||||||||
|
|
|
|
|
|
|
|
|
|||||||||
| 206 | (5,005 | ) | 9,994 | (121,781 | ) | |||||||||||
| Other cash flow from operating activities |
||||||||||||||||
| Interest paid |
(20,055 | ) | (14,683 | ) | (68,396 | ) | (48,032 | ) | ||||||||
| Interest received |
4,104 | 6,866 | 13,346 | 15,242 | ||||||||||||
| Income tax paid |
(6,031 | ) | (5,571 | ) | (15,998 | ) | (12,972 | ) | ||||||||
| Other payments |
(23,228 | ) | (4,136 | ) | (32,859 | ) | (12,300 | ) | ||||||||
|
|
|
|
|
|
|
|
|
|||||||||
| (45,210 | ) | (17,524 | ) | (103,907 | ) | (58,062 | ) | |||||||||
|
|
|
|
|
|
|
|
|
|||||||||
| Net cash flow from/(used in) operating activities |
43,536 | 38,698 | 109,399 | (3,273 | ) | |||||||||||
|
|
|
|
|
|
|
|
|
|||||||||
| Investment activities |
||||||||||||||||
| Payments for acquisition of intangible assets |
(6,162 | ) | (2,806 | ) | (13,412 | ) | (15,137 | ) | ||||||||
| Payments for acquisition of property, plant and equipment |
(29,853 | ) | (20,587 | ) | (67,765 | ) | (45,556 | ) | ||||||||
| Payments for financial instruments |
(6,373 | ) | — | (66,562 | ) | — | ||||||||||
| Disposals of intangible assets |
— | 196 | 99 | 732 | ||||||||||||
| Disposals of property, plant and equipment |
— | 1,217 | 886 | 1,631 | ||||||||||||
| Disposals of financial instruments |
11,644 | — | 14,000 | 26,866 | ||||||||||||
|
|
|
|
|
|
|
|
|
|||||||||
| Net cash flow from/(used in) investment activities |
(30,744 | ) | (21,980 | ) | (132,754 | ) | (31,464 | ) | ||||||||
|
|
|
|
|
|
|
|
|
|||||||||
| Financing activities |
||||||||||||||||
| Proceeds from borrowing from third parties |
34,103 | — | 70,912 | 29,239 | ||||||||||||
| Proceeds from borrowing from group companies |
— | — | 88,319 | — | ||||||||||||
| Repayment of borrowing from third parties |
(35,038 | ) | (1,723 | ) | (158,992 | ) | (1,723 | ) | ||||||||
|
|
|
|
|
|
|
|
|
|||||||||
| Net cash flow from/(used in) financing activities |
(935 | ) | (1,723 | ) | 239 | 27,516 | ||||||||||
|
|
|
|
|
|
|
|
|
|||||||||
| Exchange differences |
590 | (13,421 | ) | 321 | (29,563 | ) | ||||||||||
|
|
|
|
|
|
|
|
|
|||||||||
| Net increase/(decrease) in cash and cash equivalents |
12,447 | 1,574 | (22,795 | ) | (36,784 | ) | ||||||||||
|
|
|
|
|
|
|
|
|
|||||||||
| Cash and cash equivalents at beginning of period |
178,249 | 173,082 | 213,491 | 211,440 | ||||||||||||
|
|
|
|
|
|
|
|
|
|||||||||
| Cash and cash equivalents at end of period |
190,696 | 174,656 | 190,696 | 174,656 | ||||||||||||
|
|
|
|
|
|
|
|
|
|||||||||
| Cash and cash equivalents and short term financial investments at end of period | 243,326 | 174,656 | 243,326 | 174,656 | ||||||||||||
|
|
|
|
|
|
|
|
|
|||||||||
10
Table of Contents
Reconciliation of EBITDA and Adjusted EBITDA to profit/(loss):
| For the three months ended September 30, |
For the nine months ended September 30, |
|||||||||||||||
| ($ in millions) | 2014 | 2015 | 2014 | 2015 | ||||||||||||
| (unaudited) | ||||||||||||||||
| Profit/(loss) for the period |
8.0 | 16.7 | (16.3 | ) | 43.7 | |||||||||||
|
|
|
|
|
|
|
|
|
|||||||||
| Net finance expense |
31.1 | 9.5 | 98.2 | 30.7 | ||||||||||||
| Income tax expense |
8.4 | 8.8 | (2.1 | ) | 19.7 | |||||||||||
| Depreciation and amortization |
30.0 | 24.4 | 91.6 | 78.8 | ||||||||||||
|
|
|
|
|
|
|
|
|
|||||||||
| EBITDA (non-GAAP) |
77.5 | 59.4 | 171.4 | 172.9 | ||||||||||||
|
|
|
|
|
|
|
|
|
|||||||||
| Acquisition and integration related costs (a) |
2.3 | — | 7.7 | 0.1 | ||||||||||||
| Restructuring costs (b) |
2.3 | 4.1 | 23.8 | 7.8 | ||||||||||||
| Sponsor management fees (c) |
2.5 | — | 7.3 | — | ||||||||||||
| Site relocation costs (d) |
0.4 | — | 1.4 | 0.5 | ||||||||||||
| Financing and IPO fees (e) |
3.5 | — | 11.1 | 0.3 | ||||||||||||
| Asset impairments and Other (f) |
(0.3 | ) | 2.3 | (2.9 | ) | 4.6 | ||||||||||
|
|
|
|
|
|
|
|
|
|||||||||
| Adjusted EBITDA (non-GAAP) |
88.2 | 65.8 | 219.8 | 186.2 | ||||||||||||
|
|
|
|
|
|
|
|
|
|||||||||
| (a) | Acquisition and integration related costs incurred for the three months ended September 30, 2014 primarily resulted from consulting fees incurred in connection with the full strategy review including our growth implementation plan and operational set-up with a leading consulting firm. During the three months ended September 30, 2015, we have no cost related to acquisition and integration process. These projects were substantially completed by the end of 2014. |
Acquisition and integration costs incurred for the nine months ended September 30, 2014 primarily resulted from consulting fees incurred in connection with the full strategy review including our growth implementation plan and operational set-up with a leading consulting firm, improving the efficiency in procurement and IT transformation projects. Acquisition and integration related costs incurred for the nine months ended September 30, 2015 are costs associated primarily with financial and operational improvements related to SAP IT transformation project cost incurred during the three months ended March 31, 2015.
| (b) | Restructuring costs incurred for the three months ended September 30, 2014 primarily relate to headcount restructuring activities in Spain, restructuring cost in Argentina and the relocation of corporate headquarters. Restructuring costs incurred for the three months ended September 30, 2015 primarily relates to labor force optimization in Brazil to adapt the structure to business requirement and in EMEA as a consequence of a reduction in activity levels during 2015. |
| (c) | Sponsor management fees represent the annual advisory fee paid to Bain Capital Partners, LLC that were expensed. The advisory agreement was terminated in connection with the initial public offering. |
| (d) | Site relocation costs incurred for the three and nine months ended September 30, 2014 and 2015 include costs associated with our current strategic initiative of relocating call centers from tier 1 cities to tier 2 cities in Brazil in order to achieve efficiencies through rental cost reduction and attrition and absenteeism improvement. |
| (e) | Financing and IPO fees for the three and nine months ended September 30, 2014 primarily relate to non-core professional fees incurred by us during the initial public offering process, including advisory, auditing and legal expenses among others. Financing and IPO fees for the three and nine months ended September 30, 2015 relate to remaining cost incurred during the three months ended March 31, 2015 in connection with the initial public offering process. |
| (f) | Asset impairment and other costs for the three and nine months ended September 30, 2014 mainly relate to the goodwill and other intangible asset impairment relating to our operation in Czech Republic (divested in December 2014) of $3.7 million and Spain $28.8 million, offset by the amendment of the MSA with Telefónica, by which the minimum revenue commitment for Spain was reduced against a $34.5 million penalty fee compensated by Telefónica. |
Asset impairment and other costs for the three and nine months ended September 30, 2015 mainly refer to costs in Brazil, Spain and Mexico ($2.5 million) of efficiency projects, fees incurred during the three months ended March 31, 2015, related to Czech Republic divested operation in December 2014 ($2.5 million).
11
Table of Contents
Reconciliation of Adjusted Earnings to profit/(loss):
| For the three months ended September 30, |
For the nine months ended September 30, |
|||||||||||||||
| ($ in millions, except percentage changes) | 2014 | 2015 | 2014 | 2015 | ||||||||||||
| (unaudited) | ||||||||||||||||
| Profit/(loss) attributable to equity holders of the parent |
8.0 | 16.7 | (16.3 | ) | 43.7 | |||||||||||
|
|
|
|
|
|
|
|
|
|||||||||
| Acquisition and integration related Costs (a) |
2.3 | — | 7.7 | 0.1 | ||||||||||||
| Amortization of acquisition related intangible assets (b) |
8.9 | 7.0 | 28.5 | 21.6 | ||||||||||||
| Restructuring costs (c) |
2.3 | 4.1 | 23.8 | 7.8 | ||||||||||||
| Sponsor management fees (d) |
2.5 | — | 7.3 | — | ||||||||||||
| Site relocation costs (e) |
0.4 | — | 1.4 | 0.5 | ||||||||||||
| Financing and IPO fees (f) |
3.5 | — | 11.1 | 0.3 | ||||||||||||
| PECs interest expense (g) |
7.2 | — | 25.8 | — | ||||||||||||
| Asset impairments and Other (h) |
(0.3 | ) | 2.3 | (2.9 | ) | 4.6 | ||||||||||
| Net foreign exchange gain on financial instruments (i) |
— | — | — | (14.0 | ) | |||||||||||
| Net foreign exchange impacts (j) (restated) |
7.2 | (3.5 | ) | 11.1 | (0.6 | ) | ||||||||||
| Tax effect (k) |
(9.2 | ) | (4.1 | ) | (35.4 | ) | (10.4 | ) | ||||||||
|
|
|
|
|
|
|
|
|
|||||||||
| Adjusted Earnings (non-GAAP) (unaudited) |
32.8 | 22.5 | 62.1 | 53.6 | ||||||||||||
|
|
|
|
|
|
|
|
|
|||||||||
| Adjusted basic Earnings per share (in U.S. dollars) (unaudited) (*) |
0.45 | 0.31 | 0.84 | 0.73 | ||||||||||||
|
|
|
|
|
|
|
|
|
|||||||||
| (a) | Acquisition and integration related costs incurred for the three months ended September 30, 2014 primarily resulted from consulting fees incurred in connection with the full strategy review including our growth implementation plan and operational set-up with a leading consulting firm. During the three months ended September 30, 2015, we have no cost related to acquisition and integration process. These projects were substantially completed by the end of 2014. |
Acquisition and integration costs incurred for the nine months ended September 30, 2014 primarily resulted from consulting fees incurred in connection with the full strategy review including our growth implementation plan and operational set-up with a leading consulting firm, improving the efficiency in procurement and IT transformation projects. Acquisition and integration related costs incurred for the nine months ended September 30, 2015 are costs associated primarily with financial and operational improvements related to SAP IT transformation project cost incurred during the three months ended March 31, 2015.
| (b) | Amortization of Acquisition related intangible assets represents the amortization expense of intangible assets resulting from the Acquisition and has been adjusted to eliminate the impact of the amortization arising from the Acquisition which is not in the ordinary course of our daily operations and distorts comparison with peers and results for prior periods. Such intangible assets primarily include contractual relationships with clients, for which the useful life has been estimated at primarily nine years. |
| (c) | Restructuring costs incurred for the three months ended September 30, 2014 primarily relate to headcount restructuring activities in Spain, restructuring cost in Argentina and the relocation of corporate headquarters. Restructuring costs incurred for the three months ended September 30, 2015 primarily relates to labor force optimization in Brazil to adapt the structure to business requirement and in EMEA as a consequence of a reduction in activity levels during 2015. |
| (d) | Sponsor management fees represent the annual advisory fee paid to Bain Capital Partners, LLC that were expensed. The advisory agreement was terminated in connection with the initial public offering. |
| (e) | Site relocation costs incurred for the three and nine months ended September 30, 2014 and 2015 include costs associated with our current strategic initiative of relocating call centers from tier 1 cities to tier 2 cities in Brazil in order to achieve efficiencies through rental cost reduction and attrition and absenteeism improvement. |
| (f) | Financing and IPO fees for the three and nine months ended September 30, 2014 primarily relate to non-core professional fees incurred by us during the initial public offering process, including advisory, auditing and legal expenses among others. Financing and IPO fees for the three and nine months ended September 30, 2015 relate to remaining cost incurred during the three months ended March 31, 2015 in connection with the initial public offering process. |
12
Table of Contents
| (g) | PECs interest expense represents accrued interest on the preferred equity certificates. In the fourth quarter of 2014, the PECs were capitalized in connection with the IPO. |
| (h) | Asset impairment and other costs for the three and nine months ended September 30, 2014 mainly relate to the goodwill and other intangible asset impairment relating to our operation in Czech Republic (divested in December 2014) of $3.7 million and Spain $28.8 million, offset by the amendment of the MSA with Telefónica, by which the minimum revenue commitment for Spain was reduced against a $34.5 million penalty fee compensated by Telefónica. |
Asset impairment and other costs for the three and nine months ended September 30, 2015 mainly refer to costs in Brazil, Spain and Mexico ($2.5 million) related to efficiency projects, fees incurred during the three months ended March 31, 2015, related to Czech Republic divested operation in December 2014 ($2.5 million).
| (i) | As of April 1, 2015, the Company designated the foreign currency risk on certain of its subsidiaries as net investment hedges using financial instruments as the hedging items. As a consequence, any gain or loss on the hedging instrument, related to the effective portion of the hedge will be recognized in other comprehensive income (equity) as from that date. The gain or loss related to the ineffective portion will be recognized in the income statement. Cumulative net foreign exchange gain of such instruments was reversed from Equity to profit/(loss) in the three months ended March 31, 2015 in the amount of $13.0 million in the three months ended September 30, 2015 an amount of $1.0 million. For comparability, this one off adjustment was added back to calculate adjusted earnings. |
| (j) | As of 2015, management analyzes the Company financial condition performance excluding net foreign exchange impacts, which eliminates the volatility to foreign exchange variances from our operational results. For comparability purposes, 2014 adjusted earnings was restated by the net foreign exchange non-cash results from currency fluctuations impacting loans between group companies and other minor effects. |
| (k) | The tax effect represents the tax impact of the total adjustments based on a tax rate of 34.3% for the period from July 1, 2014, to September 30, 2014 and 30.4% for the period from July 1, 2015, to September 30, 2015, 34.5% for the period from January 1, 2014, to September 30, 2014 and 29.4% for the period from January 1, 2015 to September 30, 2015. |
| (*) | The adjusted earnings per share, for the period presented in the table above, were calculated considering the number of ordinary shares of 73,648,760 (weighted average number of ordinary shares) as of September 30, 2015. For the period ended September 30, 2014 the number of ordinary shares was 73,619,511. |
13
Table of Contents
Adjusted Earnings in Consolidated Income Statement
For the purpose of best presentation of adjusted earnings, the adjustments are demonstrated below in each line of Consolidated Income Statement for the three and nine months ended September 30, 2014 and 2015:
| ($ in millions, except percentage changes) | For the three months ended September 30, | Change | Change excluding |
|||||||||||||||||||||||||||||
| 2014 | Adjustments | Adjusted | 2015 | Adjustments | Adjusted | (%) | FX (%) | |||||||||||||||||||||||||
| (unaudited) | ||||||||||||||||||||||||||||||||
| Revenue |
589.6 | — | 589.6 | 476.2 | — | 476.2 | (19.2 | ) | 9.0 | |||||||||||||||||||||||
| Other operating income |
0.9 | — | 0.9 | 0.8 | — | 0.8 | (11.1 | ) | — | |||||||||||||||||||||||
| Own work capitalized |
0.2 | — | 0.2 | — | — | — | N.M. | N.M. | ||||||||||||||||||||||||
| Other gains |
(0.4 | ) | — | (0.4 | ) | — | — | — | N.M. | N.M. | ||||||||||||||||||||||
| Operating expenses: |
||||||||||||||||||||||||||||||||
| Supplies |
(27.1 | ) | — | (27.1 | ) | (20.4 | ) | — | (20.4 | ) | (24.7 | ) | 1.1 | |||||||||||||||||||
| Employee benefit expense (a) |
(403.0 | ) | 2.3 | (400.7 | ) | (338.3 | ) | 4.1 | (334.2 | ) | (16.6 | ) | 11.5 | |||||||||||||||||||
| Depreciation |
(14.9 | ) | — | (14.9 | ) | (12.0 | ) | — | (12.0 | ) | (19.5 | ) | 11.4 | |||||||||||||||||||
| Amortization (b) |
(15.1 | ) | 8.9 | (6.2 | ) | (12.4 | ) | 7.0 | (5.4 | ) | (12.9 | ) | 29.0 | |||||||||||||||||||
| Changes in trade provisions |
0.1 | — | 0.1 | (0.4 | ) | — | (0.4 | ) | N.M. | N.M. | ||||||||||||||||||||||
| Other operating expenses (c) |
(83.2 | ) | 8.4 | (74.8 | ) | (58.5 | ) | 2.3 | (56.2 | ) | (24.9 | ) | 2.9 | |||||||||||||||||||
| Impairment charges |
0.4 | — | 0.4 | — | — | — | N.M. | N.M. | ||||||||||||||||||||||||
|
|
|
|
|
|
|
|
|
|
|
|
|
|
|
|
|
|||||||||||||||||
| Total operating expenses |
(542.8 | ) | 19.6 | (523.2 | ) | (442.0 | ) | 13.4 | (428.6 | ) | (18.1 | ) | 10.1 | |||||||||||||||||||
|
|
|
|
|
|
|
|
|
|
|
|
|
|
|
|
|
|||||||||||||||||
| Operating profit |
47.5 | 19.6 | 67.1 | 35.0 | 13.4 | 48.4 | (27.9 | ) | 0.1 | |||||||||||||||||||||||
|
|
|
|
|
|
|
|
|
|
|
|
|
|
|
|
|
|||||||||||||||||
| Finance income |
8.5 | — | 8.5 | 4.9 | — | 4.9 | (42.4 | ) | (10.6 | ) | ||||||||||||||||||||||
| Finance costs (d) |
(32.4 | ) | 7.2 | (25.2 | ) | (17.9 | ) | — | (17.9 | ) | (29.0 | ) | (2.0 | ) | ||||||||||||||||||
| Net foreign exchange gain/(loss) (e) |
(7.2 | ) | 7.2 | — | 3.5 | (3.5 | ) | — | N.M. | N.M. | ||||||||||||||||||||||
|
|
|
|
|
|
|
|
|
|
|
|
|
|
|
|
|
|||||||||||||||||
| Net finance expense |
(31.1 | ) | 14.4 | (16.7 | ) | (9.5 | ) | (3.5 | ) | (13.0 | ) | (22.2 | ) | (69.5 | ) | |||||||||||||||||
|
|
|
|
|
|
|
|
|
|
|
|
|
|
|
|
|
|||||||||||||||||
| Profit/(loss) before tax |
16.4 | 34.0 | 50.4 | 25.5 | 9.9 | 35.4 | (29.8 | ) | 23.2 | |||||||||||||||||||||||
|
|
|
|
|
|
|
|
|
|
|
|
|
|
|
|
|
|||||||||||||||||
| Income tax benefit/(expense) (f) |
(8.4 | ) | (9.2 | ) | (17.6 | ) | (8.8 | ) | (4.1 | ) | (12.9 | ) | (26.7 | ) | 0.6 | |||||||||||||||||
| Profit/(loss) for the period from continuing operations |
8.0 | 24.8 | 32.8 | 16.7 | 5.8 | 22.5 | (31.4 | ) | 35.4 | |||||||||||||||||||||||
|
|
|
|
|
|
|
|
|
|
|
|
|
|
|
|
|
|||||||||||||||||
| Profit/(loss) for the period attributable to equity holders of the parent |
8.0 | 24.8 | 32.8 | 16.7 | 5.8 | 22.5 | (31.4 | ) | 35.4 | |||||||||||||||||||||||
|
|
|
|
|
|
|
|
|
|
|
|
|
|
|
|
|
|||||||||||||||||
| Basic result per share |
0.11 | 0.45 | 0.23 | 0.31 | (31.4 | ) | 35.4 | |||||||||||||||||||||||||
N.M. means not meaningful
14
Table of Contents
| ($ in millions, except percentage changes) | For the nine months ended September 30, | Change | Change excluding |
|||||||||||||||||||||||||||||
| 2014 | Adjustments | Adjusted | 2015 | Adjustments | Adjusted | (%) | FX (%) | |||||||||||||||||||||||||
| (unaudited) | ||||||||||||||||||||||||||||||||
| Revenue |
1,743.3 | — | 1,743.3 | 1,507.8 | — | 1,507.8 | (13.5 | ) | 9.5 | |||||||||||||||||||||||
| Other operating income |
1.8 | — | 1.8 | 2.0 | — | 2.0 | 11.1 | 33.3 | ||||||||||||||||||||||||
| Own work capitalized |
0.4 | — | 0.4 | — | — | — | N.M. | N.M. | ||||||||||||||||||||||||
| Other gains |
34.5 | — | 34.5 | — | — | — | N.M. | N.M. | ||||||||||||||||||||||||
| Operating expenses: |
||||||||||||||||||||||||||||||||
| Supplies |
(79.2 | ) | — | (79.2 | ) | (59.8 | ) | — | (59.8 | ) | (24.5 | ) | (3.2 | ) | ||||||||||||||||||
| Employee benefit expense (a) |
(1,246.4 | ) | 23.8 | (1,222.6 | ) | (1,093.4 | ) | 7.8 | (1,085.6 | ) | (11.2 | ) | 11.7 | |||||||||||||||||||
| Depreciation |
(44.4 | ) | — | (44.4 | ) | (38.4 | ) | — | (38.4 | ) | (13.5 | ) | 10.1 | |||||||||||||||||||
| Amortization (b) |
(47.2 | ) | 28.5 | (18.7 | ) | (40.4 | ) | 21.6 | (18.8 | ) | 0.5 | 32.1 | ||||||||||||||||||||
| Changes in trade provisions |
(0.2 | ) | — | (0.2 | ) | (0.9 | ) | — | (0.9 | ) | N.M. | N.M. | ||||||||||||||||||||
| Other operating expenses (c) |
(250.3 | ) | 24.6 | (225.7 | ) | (182.8 | ) | 5.5 | (177.3 | ) | (21.4 | ) | 0.2 | |||||||||||||||||||
| Impairment charges |
(32.5 | ) | — | (32.5 | ) | — | — | — | N.M. | N.M. | ||||||||||||||||||||||
|
|
|
|
|
|
|
|
|
|
|
|
|
|
|
|
|
|||||||||||||||||
| Total operating expenses |
(1,700.2 | ) | 76.9 | (1,623.3 | ) | (1,415.7 | ) | 34.9 | (1,380.8 | ) | (14.9 | ) | 7.4 | |||||||||||||||||||
|
|
|
|
|
|
|
|
|
|
|
|
|
|
|
|
|
|||||||||||||||||
| Operating profit |
79.8 | 76.9 | 156.7 | 94.1 | 34.9 | 129.0 | (17.7 | ) | 7.3 | |||||||||||||||||||||||
|
|
|
|
|
|
|
|
|
|
|
|
|
|
|
|
|
|||||||||||||||||
| Finance income |
13.4 | — | 13.4 | 12.7 | — | 12.7 | (5.2 | ) | 29.9 | |||||||||||||||||||||||
| Finance costs (d) |
(100.5 | ) | 25.8 | (74.7 | ) | (58.0 | ) | — | (58.0 | ) | (22.4 | ) | (0.7 | ) | ||||||||||||||||||
| Net foreign exchange gain/(loss) (e) |
(11.1 | ) | 11.1 | — | 14.6 | (14.6 | ) | — | N.M | N.M. | ||||||||||||||||||||||
|
|
|
|
|
|
|
|
|
|
|
|
|
|
|
|
|
|||||||||||||||||
| Net finance expense |
(98.2 | ) | 36.9 | (61.3 | ) | (30.7 | ) | (14.6 | ) | (45.3 | ) | (26.1 | ) | (7.3 | ) | |||||||||||||||||
|
|
|
|
|
|
|
|
|
|
|
|
|
|
|
|
|
|||||||||||||||||
| Profit/(loss) before tax |
(18.4 | ) | 113.8 | 95.4 | 63.4 | 20.3 | 83.7 | (12.3 | ) | 16.7 | ||||||||||||||||||||||
|
|
|
|
|
|
|
|
|
|
|
|
|
|
|
|
|
|||||||||||||||||
| Income tax benefit/(expense) (f) |
2.1 | (35.4 | ) | (33.3 | ) | (19.7 | ) | (10.4 | ) | (30.1 | ) | (9.6 | ) | 17.1 | ||||||||||||||||||
| Profit/(loss) for the period from continuing operations |
(16.3 | ) | 78.4 | 62.1 | 43.7 | 9.9 | 53.6 | (13.7 | ) | 16.4 | ||||||||||||||||||||||
|
|
|
|
|
|
|
|
|
|
|
|
|
|
|
|
|
|||||||||||||||||
| Profit/(loss) for the period attributable to equity holders of the parent |
(16.3 | ) | 78.4 | 62.1 | 43.7 | 9.9 | 53.6 | (13.7 | ) | 16.4 | ||||||||||||||||||||||
|
|
|
|
|
|
|
|
|
|
|
|
|
|
|
|
|
|||||||||||||||||
| Basic result per share |
(0.22 | ) | 0.84 | 0.59 | 0.73 | (13.7 | ) | 16.4 | ||||||||||||||||||||||||
N.M. means not meaningful
Adjusted Earnings footnotes reference:
| (a) | “Employee Benefit Expenses” adjustment is disclosed on footnote (c) “Reestructuring Costs”. |
| (b) | “Amortization” adjustment is related to footnote (a) “Amortization of acquisition of intangible assets”. |
| (c) | “Other operating expenses” adjustment includes adjustments detailed in footnotes (a) Acquisition and Integration relates costs, (d) Sponsor Management Fees, (e) Site Relocation costs, (f) Financing and IPO Fees, (h) Asset Impairment and others. |
| (d) | “Finance costs” adjustment is related to footnote (g) “PECs Interest Expenses”. |
| (e) | “Net foreign exchange gain/(loss)” adjustment refers to footnotes (i) and (j) Net Foreign Exchange gain on Financial Instruments and Net Foreign Exchange Impacts. |
| (f) | “Income tax benefit/(expense)” adjustment is related to footnote (k) “Tax Effect”. |
15
Table of Contents
Financing Arrangements
Certain debt agreements contain financial ratios as an instrument to monitor the Company’s financial condition and requirements transactions (e.g. new debts, permitted payments). The following is a brief description of the financial ratios.
| 1. | Gross Leverage Ratio (applies to Atento S.A.) – measure the level of gross debt to EBITDA, as defined in the debt agreements. The contractual ratio indicates that the gross debt should not surpass 2.75 times the EBITDA for the last twelve months. As of September 30, 2015, the current ratio was 2.11. |
| 2. | Fixed Charge Coverage Ratio (applies to Restricted Group) – measure the company ability to pay interest expenses and dividends (fixed charge) in relation to EBITDA, as described in the debt agreements. The contractual ratio indicates that the EBITDA for the last twelve months should represent at least 2 times the fixed charge of the same period. As of September 30, 2015, the current ratio was 3.9. |
| 3. | Net Debt Brazilian Leverage Ratio (applies only to Brazil) – measures the level of net debt (gross debt, less cash, cash equivalents and short-term investments) to EBITDA, as defined in the Debenture indenture. The contractual ratio indicates that Brazil net debt should not surpass 3.0 times the Brazilian EBITDA. As of September 30, 2015, the current ratio was 1.6. This is the only ratio considered as a financial covenant. |
The company monitors regularly all financial ratios under the debt agreements. As of September 30, 2015, we were in compliance with the terms of our covenants.
| As of September 30, | ||||||||||||||||
| 2014 | 2015 | |||||||||||||||
| ($ in million, except Net Debt/Adj. EBITDA LTM) | Actual | As Adjusted (1) | Pro Forma | |||||||||||||
| (unaudited) | ||||||||||||||||
| Cash and cash equivalents |
190.7 | 190.7 | 190.7 | 174.7 | ||||||||||||
| Short term financial investments |
52.6 | 52.6 | 52.6 | — | ||||||||||||
| Debt: |
||||||||||||||||
| 7.375% Sr. Sec. Notes due 2020 |
294.4 | 294.4 | 294.4 | 295.9 | ||||||||||||
| Brazilian Debentures |
267.7 | 267.7 | 267.7 | 172.4 | ||||||||||||
| Vendor Loan Note (1) |
29.3 | 29.3 | — | — | ||||||||||||
| Contingent Value Instrument |
36.1 | 36.1 | 36.1 | 35.5 | ||||||||||||
| Preferred Equity Certificates |
578.8 | — | — | — | ||||||||||||
| Finance Lease Payables |
8.7 | 8.7 | 8.7 | 4.7 | ||||||||||||
| Other Borrowings |
67.0 | 67.0 | 67.0 | 64.2 | ||||||||||||
| Total Debt |
1,282.0 | 703.2 | 673.9 | 572.7 | ||||||||||||
| Net Debt with third parties (2) (unaudited) |
459.9 | 430.6 | 398.0 | |||||||||||||
| Adjusted EBITDA LTM (3) (non-GAAP) (unaudited) |
305.4 | 305.4 | 271.8 | |||||||||||||
| Net Debt/Adjusted EBITDA LTM (non-GAAP) (unaudited) |
1.5x | 1.4x | 1.5x | |||||||||||||
| (1) | Reflects the prepayment to Telefónica of the entire indebtedness under the Vendor Loan Note. The loan was liquidated in connection with the IPO. |
| (2) | In considering our financial condition, our management analyzes net debt with third parties, which is defined as total debt less cash, cash equivalents, and short-term financial investments. Net debt with third parties is not a measure defined by IFRS and it has limitations as an analytical tool. Net debt is neither a measure defined by or presented in accordance with IFRS nor a measure of financial performance, and should not be considered in isolation or as an alternative financial measure determined in accordance with IFRS. Net debt is not necessarily comparable to similarly titled measures used by other companies. |
16
Table of Contents
| (3) | Adjusted EBITDA LTM (Last Twelve Months) is defined as EBITDA adjusted to exclude acquisition and integration related costs, restructuring costs, sponsor management fees, asset impairments, site-relocation costs, financing fees, IPO costs and other items, which are not related to our core results of operations for the last twelve months. |
17
Table of Contents
CAUTIONARY NOTE REGARDING FORWARD LOOKING STATEMENTS
This Form 6-K providing quarterly information contains “forward-looking statements” within the meaning of Section 27A of the Securities Act of 1933, Section 21E of the Securities Exchange Act of 1934, and the Private Securities Litigation Reform Act of 1995, relating to our operations, expected financial position, results of operation, and other business matters that are based on our current expectations, assumptions, and projections with respect to the future, and are not a guarantee of performance. In this Interim Report, when we use words such as “may,” “believe,” “plan,” “will,” “anticipate,” “estimate,” “expect,” “intend,” “project,” “would,” “could,” “target,” or similar expressions, or when we discuss our strategy, plans, goals, initiatives, or objectives, we are making forward-looking statements.
We caution you not to rely unduly on any Forward-Looking statements. Actual results may differ materially from what is expressed in the forward-looking statements, and you should review and consider carefully the risks, uncertainties and other factors that affect our business and may cause such differences.
The forward-looking statements are based on information available as of the date that this Form 6-K furnished with the United States Securities and Exchange Commission (“SEC”) and we undertake no obligation to update them. They are based on numerous assumptions and developments that are not within our control. Although we believe these forward-looking statements are reasonable, we cannot assure you they will turn out to be correct.
For additional detail see the sections entitled “Risk Factors” and Cautionary Statements with respect to “Forward-looking Statements” in our Annual Form 20-F (the “20-F”).
MANAGEMENT’S DISCUSSION AND ANALYSIS OF FINANCIAL CONDITION AND RESULTS OF OPERATIONS
The following discussion and analysis of our financial condition and results of operations is based upon and should be read in conjunction with the interim consolidated financial statements and the related notes included herein. The interim consolidated financial statements have been prepared in accordance with IAS 34 Interim Financial Reporting.
Factors which could cause or contribute to such difference, include, but are not limited to, those discussed elsewhere in this Interim Report, particularly under “Cautionary Statement with respect to Forward Looking Statements” and the section entitled “Risk Factors” in the Form 20-F.
Overview
Atento is the largest provider of customer-relationship management and business-process outsourcing (“CRM BPO”) services and solutions in Latin America (“LatAm”) and Spain, and among the third largest provider by revenue globally. Atento’s tailored CRM BPO solutions are designed to enable our client’s ability to deliver a high-quality product by creating a best-in-class experience for their costumers, enabling our clients to focus on operating their core businesses. Atento utilizes its industry expertise commitment to customer care, and consultative approach, to offer superior and scalable solutions across the entire value chain for customer care, each solution customized for the individual client’s needs.
We offers a comprehensive portfolio of customizable, and scalable, solutions including front and back-end services ranging from sales and, applications-processing, to customer care and credit-management. We leverage our deep industry knowledge and capabilities to provide industry-leading solutions to our clients. We provide our solutions to over 400 clients via over 163,000 highly engaged customer care specialists facilitated by our best-in-class technology infrastructure and multi-channel delivery platform. We believe we bring a differentiated combination of scale, capacity for processing client’s transactions, and industry expertise to our client’s customer care operations, which allow us to provide higher-quality and lower cost customer care services than our clients could deliver on their own.
Our number of workstations increased 9.0% as of September 30, 2015 from 83,920 to 91,467. Since we lease all of our call center facilities, which increases our operating expenses and does not result in a depreciation expense, our EBITDA performance has historically differed from competitors who own their buildings and equipment, as related financings have generally resulted in higher depreciation expenses for those competitors and have increased such competitors EBITDA.
As a part of our strategy to improve cost and efficiencies we continued to migrate a portion of our call centers from Tier 1 to Tier 2 cities. These cities, which tend to be smaller lower cost locations, allow us to optimize our lease expenses and reduce labor costs. By being a preferred employer we are able to then draw from new and larger pools of talent and reduce turnover and absenteeism. We have completed many successful site transfers in Brazil, Colombia and Argentina. In Brazil, for example, the
18
Table of Contents
percentage of total workstations located in tier 2 cities increased 4.3% percentage points year to date, from 54.1% for the nine months period ended September 30, 2014 to 56.4% for the nine months period ended September 30, 2015, due to the new sites opened outside Sao Paulo and Rio de Janeiro. As demand for our services and solutions grows, and their complexity continues to increase, we have opportunities to evaluate and adjust our site footprint even further to create the most competitive combination of quality and cost effectiveness for our costumers.
As of September 30, 2015, we had 91,467 workstations globally, with 49,379 in Brazil, 34,474 in the Americas (excluding Brazil) and 7,614 in EMEA. As of September 30, 2014, we had 83,920 workstations globally, with 43,350 in Brazil, 32,644 in the Americas (excluding Brazil) and 7,926 in EMEA. As of September 30, 2015, we had 98 delivery centers globally, 33 in Brazil, 47 in the Americas (excluding Brazil) and 18 in EMEA. As of September 30, 2014, we had 94 delivery centers globally, 29 in Brazil, 44 in the Americas (excluding Brazil) and 21 in EMEA.
The following table shows the number of delivery centers and workstations in each of the jurisdictions in which we operated as at September 30, 2014 and 2015.
| Number of Workstations | Number of Service Delivery Centers (1) |
|||||||||||||||
| 2014 | 2015 | 2014 | 2015 | |||||||||||||
| (unaudited) | ||||||||||||||||
| Brazil |
43,350 | 49,379 | 29 | 33 | ||||||||||||
| Americas |
32,644 | 34,474 | 44 | 47 | ||||||||||||
|
|
|
|
|
|
|
|
|
|||||||||
| Argentina (2) |
3,831 | 3,705 | 11 | 11 | ||||||||||||
| Central America(3) |
2,653 | 2,445 | 3 | 5 | ||||||||||||
| Chile |
2,398 | 2,279 | 2 | 2 | ||||||||||||
| Colombia |
5,403 | 6,306 | 6 | 8 | ||||||||||||
| Mexico |
9,656 | 9,676 | 17 | 15 | ||||||||||||
| Peru |
7,569 | 8,753 | 2 | 3 | ||||||||||||
| United States(4) |
1,134 | 1,310 | 3 | 3 | ||||||||||||
| EMEA |
7,926 | 7,614 | 21 | 18 | ||||||||||||
|
|
|
|
|
|
|
|
|
|||||||||
| Czech Republic(5) |
470 | — | 15 | — | ||||||||||||
| Morocco |
2,042 | 2,039 | 4 | 4 | ||||||||||||
| Spain |
5,414 | 5,575 | 2 | 14 | ||||||||||||
|
|
|
|
|
|
|
|
|
|||||||||
| Total |
83,920 | 91,467 | 94 | 98 | ||||||||||||
|
|
|
|
|
|
|
|
|
|||||||||
| (1) | Includes service delivery centers at facilities operated by us and those owned by our clients where we provide operations personnel and workstations. |
| (2) | Includes Uruguay. |
| (3) | Includes Guatemala, El Salvador, Nicaragua and Costa Rica. |
| (4) | Includes Puerto Rico. |
| (5) | Operations in Czech Republic were divested in Q4 2014 – see details in our annual financial statements as of December 31, 2014. |
For the three and nine months ended September 30, 2015 revenue generated from our fifteen largest client groups represented 83.4% and 83.9%, respectively, of our revenue as compared to 83.1% and 82.2%, in the same period in prior year. Excluding revenue generated from the Telefónica Group, our next 15 largest client groups represented in aggregate 39.1% and 39.2% of our revenue for the three and nine months ended September 2015 as compared to 37.2% and 36% of our revenue in the same period in prior year.
Our vertical industry expertise in telecommunications, financial services and multi-sector companies allows us to adapt our services and solutions for our clients, further embedding us into their value chain while delivering effective business results and increasing the portion of our client’s services related to CRM BPO. For the nine months ended September 30, 2015, CRM BPO solutions and individual services comprised approximately 23.8% and 76.2% of our revenue, respectively. For the same period in 2014, CRM BPO solutions and individual services comprised approximately 24.3% and 75.7% of our revenue, respectively. For the three months ended September 30, 2015 CRM BPO solutions and individuals services comprised approximately 23.9% and 76.1% of our revenue, respectively. For the same period in 2014, CRM BPO solutions and individuals services comprised approximately 26.7% and 73.3% of our revenue, respectively.
During the nine months period ended September 30, 2015, telecommunications represented 49.6% of our revenue and financial services represented 35.2% of our revenue, compared to 48.4% and 36.0%, respectively, for the same period in 2014. During the nine months ended September 30, 2014 and 2015 the sales by service were represented as follows:
19
Table of Contents
| For the nine months ended September 30, |
||||||||
| 2014 | 2015 | |||||||
| Customer Service |
49.5 | % | 47.9 | % | ||||
| Sales |
17.8 | % | 18.2 | % | ||||
| Collection |
10.8 | % | 10.4 | % | ||||
| Back Office |
8.7 | % | 9.6 | % | ||||
| Technical Support |
10.6 | % | 10.6 | % | ||||
| Service Desk |
0.2 | % | 0.1 | % | ||||
| Others |
2.4 | % | 3.2 | % | ||||
|
|
|
|
|
|||||
| Total |
100.0 | % | 100.0 | % | ||||
|
|
|
|
|
|||||
During the three months period ended September 30, 2015, telecommunications represented 49.4% of our revenue and financial services represented 36.0% of our revenue, compared to 46.3% and 36.0%, respectively, for the same period in 2014. During the three months ended September 30, 2014 and 2015 the sales by service were represented as follows:
| For the three months ended September 30, |
||||||||
| 2014 | 2015 | |||||||
| Customer Service |
49.5 | % | 47.0 | % | ||||
| Sales |
17.9 | % | 18.2 | % | ||||
| Collection |
10.5 | % | 10.9 | % | ||||
| Back Office |
8.9 | % | 10.2 | % | ||||
| Technical Support |
10.9 | % | 10.5 | % | ||||
| Service Desk |
0.2 | % | 0.1 | % | ||||
| Others |
2.1 | % | 3.1 | % | ||||
|
|
|
|
|
|||||
| Total |
100.0 | % | 100.0 | % | ||||
|
|
|
|
|
|||||
We operate in 14 countries worldwide and organize our business into the following three geographic markets: (i) Brazil, (ii) Americas, excluding Brazil (“Americas”) and (iii) EMEA. For the nine months ended September 30, 2015, Brazil accounted for 48.9% of our revenue, Americas accounted for 38.9% of our revenue and EMEA accounted for 12.3% of our revenue (in each case, before holding company level revenue and consolidation adjustments). For the three months ended September 30, 2015, Brazil accounted for 45.5% of our revenue, Americas accounted for 42.1% of our revenue and EMEA accounted for 12.6% of our revenue (in each case, before holding company level revenue and consolidation adjustments).
20
Table of Contents
Consolidated Income Statements for the Three and Nine Months Ended September 30, 2014 and 2015
| ($ in millions, except percentage changes) | For the three months ended September 30, |
Change (%) | Change excluding FX (%) |
For the nine months ended September 30, |
Change (%) | Change excluding FX (%) |
||||||||||||||||||||||||||
| 2014 | 2015 | 2014 | 2015 | |||||||||||||||||||||||||||||
| (unaudited) | (unaudited) | |||||||||||||||||||||||||||||||
| Revenue | 589.6 | 476.2 | (19.2 | ) | 9.0 | 1,743.3 | 1,507.8 | (13.5 | ) | 9.5 | ||||||||||||||||||||||
| Other operating income | 0.9 | 0.8 | (11.1 | ) | — | 1.8 | 2.0 | 11.1 | 33.3 | |||||||||||||||||||||||
| Own work capitalized | 0.2 | — | N.M. | N.M. | 0.4 | — | N.M. | N.M. | ||||||||||||||||||||||||
| Other gains | (0.4 | ) | — | N.M. | N.M. | 34.5 | — | N.M. | N.M. | |||||||||||||||||||||||
| Operating expenses: | ||||||||||||||||||||||||||||||||
| Supplies | (27.1 | ) | (20.4 | ) | (24.7 | ) | 1.1 | (79.2 | ) | (59.8 | ) | (24.5 | ) | (3.2 | ) | |||||||||||||||||
| Employee benefit expense | (403.0 | ) | (338.3 | ) | (16.1 | ) | 12.4 | (1,246.4 | ) | (1,093.4 | ) | (12.3 | ) | 10.4 | ||||||||||||||||||
| Depreciation | (14.9 | ) | (12.0 | ) | (19.5 | ) | 11.4 | (44.4 | ) | (38.4 | ) | (13.5 | ) | 10.1 | ||||||||||||||||||
| Amortization | (15.1 | ) | (12.4 | ) | (17.9 | ) | 11.9 | (47.2 | ) | (40.4 | ) | (14.4 | ) | 9.5 | ||||||||||||||||||
| Changes in trade provisions | 0.1 | (0.4 | ) | N.M. | N.M. | (0.2 | ) | (0.9 | ) | N.M. | N.M. | |||||||||||||||||||||
| Other operating expenses | (83.2 | ) | (58.5 | ) | (29.7 | ) | (3.4 | ) | (250.3 | ) | (182.7 | ) | (27.0 | ) | (6.8 | ) | ||||||||||||||||
| Impairment charges | 0.4 | — | N.M. | N.M. | (32.5 | ) | — | N.M. | N.M. | |||||||||||||||||||||||
|
|
|
|
|
|
|
|
|
|
|
|
|
|
|
|
|
|||||||||||||||||
| Total operating expenses | (542.8 | ) | (442.0 | ) | (18.6 | ) | 9.6 | (1,700.2 | ) | (1,415.6 | ) | (16.7 | ) | 5.1 | ||||||||||||||||||
|
|
|
|
|
|
|
|
|
|
|
|
|
|
|
|
|
|||||||||||||||||
| Operating profit | 47.5 | 35.0 | (26.3 | ) | 2.5 | 79.8 | 94.2 | 18.0 | 54.4 | |||||||||||||||||||||||
|
|
|
|
|
|
|
|
|
|
|
|
|
|
|
|
|
|||||||||||||||||
| Finance income | 8.5 | 4.9 | (42.4 | ) | (10.6 | ) | 13.4 | 12.7 | (5.2 | ) | 29.9 | |||||||||||||||||||||
| Finance costs | (32.4 | ) | (17.9 | ) | (44.8 | ) | (23.8 | ) | (100.5 | ) | (58.0 | ) | (42.3 | ) | (26.2 | ) | ||||||||||||||||
| Net foreign exchange gain/(loss) | (7.2 | ) | 3.5 | N.M. | N.M. | (11.1 | ) | 14.6 | N.M. | N.M. | ||||||||||||||||||||||
|
|
|
|
|
|
|
|
|
|
|
|
|
|
|
|
|
|||||||||||||||||
| Net finance expense | (31.1 | ) | (9.5 | ) | (69.5 | ) | (64.3 | ) | (98.2 | ) | (30.7 | ) | (68.7 | ) | (58.5 | ) | ||||||||||||||||
|
|
|
|
|
|
|
|
|
|
|
|
|
|
|
|
|
|||||||||||||||||
| Profit/(loss) before tax | 16.4 | 25.5 | 55.5 | 129.3 | (18.4 | ) | 63.4 | N.M. | N.M. | |||||||||||||||||||||||
|
|
|
|
|
|
|
|
|
|
|
|
|
|
|
|
|
|||||||||||||||||
| Income tax benefit/(expense) | (8.4 | ) | (8.8 | ) | 4.8 | 41.7 | 2.1 | (19.7 | ) | N.M. | N.M. | |||||||||||||||||||||
| Profit/(loss) for the period from continuing operations | 8.0 | 16.7 | 108.8 | 221.3 | (16.3 | ) | 43.7 | N.M. | N.M. | |||||||||||||||||||||||
|
|
|
|
|
|
|
|
|
|
|
|
|
|
|
|
|
|||||||||||||||||
| Profit/(loss) for the period attributable to equity holders of the parent | 8.0 | 16.7 | 108.8 | 221.3 | (16.3 | ) | 43.7 | N.M. | N.M. | |||||||||||||||||||||||
|
|
|
|
|
|
|
|
|
|
|
|
|
|
|
|
|
|||||||||||||||||
| Other financial data: | ||||||||||||||||||||||||||||||||
| EBITDA(1) (unaudited) | 77.5 | 59.4 | (23.4 | ) | 6.2 | 171.4 | 172.9 | 0.9 | 30.6 | |||||||||||||||||||||||
| Adjusted EBITDA(1) (unaudited) | 88.2 | 65.8 | (25.4 | ) | 4.2 | 219.8 | 186.2 | (15.3 | ) | 10.0 | ||||||||||||||||||||||
| (1) | For reconciliation with IFRS as issued by IASB, see section “Reconciliation of EBITDA and Adjusted EBITDA to profit/(loss)” as above. |
N.M. means not meaningful
21
Table of Contents
Consolidated Income Statements by Segment for the Three and Nine Months Ended September 30, 2014 and 2015
| ($ in millions, except percentage changes) | For the three months ended September 30, |
Change (%) |
Change Excluding FX (%) |
For the nine months ended September 30, |
Change (%) |
Change Excluding FX (%) |
||||||||||||||||||||||||||
| 2014 | 2015 | 2014 | 2015 | |||||||||||||||||||||||||||||
| (unaudited) | (unaudited) | |||||||||||||||||||||||||||||||
| Revenue: |
||||||||||||||||||||||||||||||||
| Brazil |
307.7 | 216.5 | (29.6 | ) | 9.0 | 906.2 | 737.6 | (18.6 | ) | 11.7 | ||||||||||||||||||||||
| Americas |
204.3 | 200.3 | (2.0 | ) | 15.9 | 576.7 | 585.9 | 1.6 | 16.6 | |||||||||||||||||||||||
| EMEA |
77.7 | 59.8 | (23.0 | ) | (8.4 | ) | 260.8 | 185.7 | (28.8 | ) | (13.5 | ) | ||||||||||||||||||||
| Other and eliminations(1) |
(0.1 | ) | (0.4 | ) | N.M. | N.M. | (0.4 | ) | (1.4 | ) | N.M. | N.M. | ||||||||||||||||||||
| Total revenue |
589.6 | 476.2 | (19.2 | ) | 9.0 | 1,743.3 | 1,507.8 | (13.5 | ) | 9.5 | ||||||||||||||||||||||
| Operating expense: |
||||||||||||||||||||||||||||||||
| Brazil |
(277.1 | ) | (198.9 | ) | (28.2 | ) | 11.0 | (833.6 | ) | (682.2 | ) | (18.2 | ) | 12.1 | ||||||||||||||||||
| Americas |
(181.2 | ) | (182.5 | ) | 0.7 | 18.7 | (530.1 | ) | (538.6 | ) | 1.6 | 16.4 | ||||||||||||||||||||
| EMEA |
(76.6 | ) | (59.2 | ) | (22.7 | ) | (8.0 | ) | (311.2 | ) | (189.1 | ) | (39.2 | ) | (26.2 | ) | ||||||||||||||||
| Other and eliminations(1) |
(7.9 | ) | (1.4 | ) | (82.3 | ) | (79.7 | ) | (25.3 | ) | (5.7 | ) | (77.5 | ) | (73.9 | ) | ||||||||||||||||
| Total operating expenses. |
(542.8 | ) | (442.0 | ) | (18.6 | ) | 9.6 | (1,700.2 | ) | (1,415.6 | ) | (16.7 | ) | 5.1 | ||||||||||||||||||
| Operating profit/(loss): |
||||||||||||||||||||||||||||||||
| Brazil |
30.7 | 17.6 | (42.7 | ) | (9.4 | ) | 72.9 | 55.6 | (23.7 | ) | 7.4 | |||||||||||||||||||||
| Americas |
24.0 | 18.3 | (23.8 | ) | (7.5 | ) | 47.8 | 48.5 | 1.5 | 19.2 | ||||||||||||||||||||||
| EMEA |
1.2 | 0.8 | (33.3 | ) | (25.0 | ) | (49.2 | ) | (2.9 | ) | (94.1 | ) | (92.7 | ) | ||||||||||||||||||
| Other and eliminations(1) |
(8.4 | ) | (1.7 | ) | (79.8 | ) | (73.8 | ) | 8.3 | (7.0 | ) | N.M. | N.M. | |||||||||||||||||||
| Total operating profit |
47.5 | 35.0 | (26.3 | ) | 2.5 | 79.8 | 94.2 | 18.0 | 54.4 | |||||||||||||||||||||||
| Net finance expense: |
||||||||||||||||||||||||||||||||
| Brazil |
(8.6 | ) | (2.4 | ) | (72.1 | ) | (57.0 | ) | (36.4 | ) | (17.7 | ) | (51.4 | ) | (34.9 | ) | ||||||||||||||||
| Americas |
(7.0 | ) | (1.0 | ) | (85.7 | ) | (80.0 | ) | (9.4 | ) | (10.3 | ) | 9.6 | 29.8 | ||||||||||||||||||
| EMEA |
(3.3 | ) | (2.8 | ) | (15.2 | ) | — | (10.3 | ) | (8.9 | ) | (13.6 | ) | 5.8 | ||||||||||||||||||
| Other and eliminations(1) |
(12.2 | ) | (3.3 | ) | (73.0 | ) | (77.9 | ) | (42.1 | ) | 6.2 | N.M. | N.M. | |||||||||||||||||||
| Total net finance expense |
(31.1 | ) | (9.5 | ) | (69.5 | ) | (64.3 | ) | (98.2 | ) | (30.7 | ) | (68.7 | ) | (58.5 | ) | ||||||||||||||||
| Income tax benefit/(expense): |
||||||||||||||||||||||||||||||||
| Brazil |
(7.6 | ) | (3.9 | ) | (48.7 | ) | (18.4 | ) | (12.5 | ) | (12.2 | ) | (2.4 | ) | 37.6 | |||||||||||||||||
| Americas |
(6.6 | ) | (6.9 | ) | 4.5 | 24.2 | (14.4 | ) | (17.1 | ) | 18.8 | 36.8 | ||||||||||||||||||||
| EMEA |
1.1 | 0.8 | (27.3 | ) | (18.2 | ) | 17.4 | 3.3 | (81.0 | ) | (76.4 | ) | ||||||||||||||||||||
| Other and eliminations(1) |
4.7 | 1.2 | (74.5 | ) | (66.0 | ) | 11.6 | 6.3 | (45.7 | ) | (34.5 | ) | ||||||||||||||||||||
| Total income tax benefit/(expense) |
(8.4 | ) | (8.8 | ) | 4.8 | 41.7 | 2.1 | (19.7 | ) | N.M. | N.M. | |||||||||||||||||||||
| Profit/(loss) for the period: |
||||||||||||||||||||||||||||||||
| Brazil. |
14.5 | 11.4 | (21.4 | ) | 24.1 | 24.0 | 25.8 | 7.5 | 55.8 | |||||||||||||||||||||||
| Americas |
10.4 | 10.3 | (1.0 | ) | 21.2 | 24.0 | 21.1 | (12.1 | ) | 5.0 | ||||||||||||||||||||||
| EMEA |
(1.0 | ) | (1.3 | ) | 30.0 | 60.0 | (42.1 | ) | (8.4 | ) | (80.0 | ) | (75.3 | ) | ||||||||||||||||||
| Other and eliminations(1) |
(15.9 | ) | (3.7 | ) | (76.7 | ) | (79.2 | ) | (22.2 | ) | 5.2 | N.M. | N.M. | |||||||||||||||||||
| Profit/(loss) for the period |
8.0 | 16.7 | 108.8 | 221.3 | (16.3 | ) | 43.7 | N.M. | N.M. | |||||||||||||||||||||||
| Other financial data: |
||||||||||||||||||||||||||||||||
| EBITDA(2): |
||||||||||||||||||||||||||||||||
| Brazil |
45.0 | 29.2 | (35.1 | ) | 1.8 | 115.0 | 94.1 | (18.2 | ) | 14.1 | ||||||||||||||||||||||
| Americas |
34.8 | 27.4 | (21.3 | ) | (4.0 | ) | 80.3 | 78.0 | (2.9 | ) | 13.9 | |||||||||||||||||||||
| EMEA |
5.8 | 4.2 | (27.6 | ) | (13.8 | ) | (33.0 | ) | 7.3 | N.M. | N.M. | |||||||||||||||||||||
| Other and eliminations(1) |
(8.1 | ) | (1.4 | ) | (82.7 | ) | (76.5 | ) | 9.1 | (6.5 | ) | (171.4 | ) | (184.7 | ) | |||||||||||||||||
| Total EBITDA (unaudited) |
77.5 | 59.4 | (23.4 | ) | 6.2 | 171.4 | 172.9 | 0.9 | 30.6 | |||||||||||||||||||||||
| Adjusted EBITDA(2): |
||||||||||||||||||||||||||||||||
| Brazil |
46.8 | 33.6 | (28.2 | ) | 13.2 | 123.7 | 100.0 | (19.2 | ) | 13.4 | ||||||||||||||||||||||
| Americas |
35.5 | 28.2 | (20.6 | ) | (3.1 | ) | 85.2 | 79.9 | (6.2 | ) | 9.9 | |||||||||||||||||||||
| EMEA |
6.5 | 5.3 | (18.5 | ) | (3.1 | ) | 17.4 | 11.7 | (32.8 | ) | (18.2 | ) | ||||||||||||||||||||
| Other and eliminations(1) |
(0.6 | ) | (1.3 | ) | 116.7 | 200.0 | (6.5 | ) | (5.4 | ) | (16.9 | ) | 0.1 | |||||||||||||||||||
| Total Adjusted EBITDA (unaudited) |
88.2 | 65.8 | (25.4 | ) | 4.2 | 219.8 | 186.2 | (15.3 | ) | 10.0 | ||||||||||||||||||||||
| (1) | Included revenue and expenses at the holding-company level (such as corporate expenses and acquisition related expenses), as applicable, as well as consolidation adjustments. |
| (2) | For reconciliation with IFRS as issued by IASB, see section “Reconciliation of EBITDA and Adjusted EBITDA to profit/(loss)” as above. |
N.M. means not meaningful
22
Table of Contents
Three Months ended September 30, 2014 compared to Three Months ended September 30, 2015
Revenue
Revenue decreased by $113.4 million, or 19.2%, from $589.6 million for the three months ended September 30, 2014 to $476.2 million for the three months ended September 30, 2015. Excluding the impacts of foreign exchange and the sale of the operations in Czech Republic, revenue increased by 9.4% driven primarily by strong performances in Brazil and the Americas, largely offsetting a decline in EMEA. Revenue in LatAm, increased 11.7% excluding the impact of foreign exchange.
Revenue from Telefónica, excluding the impact of foreign exchange, increased by 1.2%.
Excluding the impact of foreign exchange and the sale of the operations in Czech Republic, revenue from non-Telefónica clients increased by 16.6% due to strong double-digit growth in Americas and Brazil. As of the three months ended September 30, 2015, revenue from non-Telefónica clients equaled 55.2% of total revenue, compared to 53.6% for the three months ended September 30, 2014, an increase of 1.6 percentage points. We have continued our strategy to increase our revenue diversification from Telefónica with significant clients wins in the telecommunication industry, multisector segments in Brazil, and higher volumes with current clients, primarily in the finance industry. The strong growth in the Americas was driven by Peru, Colombia, Argentina and offshore business from United States. This growth was partially offset by a decline in EMEA Multisector due to the reduction of Public Administration service.
The following chart sets forth a breakdown of revenue based on geographical region for the three months ended September 30, 2014 and September 30, 2015 and as a percentage of revenue and the percentage change between those periods with and net of foreign exchange effects.
| For the three months ended September 30, | ||||||||||||||||||||||||
| ($ in millions, except percentage changes) | 2014 | (%) | 2015 | (%) | Change (%) | Change excluding FX (%) |
||||||||||||||||||
| (unaudited) | (unaudited) | |||||||||||||||||||||||
| Brazil |
307.7 | 52.2 | 216.5 | 45.5 | (29.6 | ) | 9.0 | |||||||||||||||||
| Americas |
204.3 | 34.7 | 200.3 | 42.1 | (2.0 | ) | 15.9 | |||||||||||||||||
| EMEA |
77.7 | 13.2 | 59.8 | 12.6 | (23.0 | ) | (8.4 | ) | ||||||||||||||||
| Other and eliminations (1) |
(0.1 | ) | (0.1 | ) | (0.4 | ) | (0.2 | ) | N.M. | N.M. | ||||||||||||||
|
|
|
|
|
|
|
|
|
|
|
|
|
|||||||||||||
| Total |
589.6 | 100.0 | 476.2 | 100.0 | (19.2 | ) | 9.0 | |||||||||||||||||
|
|
|
|
|
|
|
|
|
|
|
|
|
|||||||||||||
| (1) | Included revenue and expenses at the holding-company level (such as corporate expenses and acquisition related expenses), as applicable, as well as consolidation adjustments. |
Brazil
Revenue in Brazil for the three months ended September 30, 2014 and September 30, 2015 was $307.7 million and $216.5 million, respectively. Revenue decreased in Brazil by $91.2 million, or 29.6%. Excluding the impact of foreign exchange, revenue increased by 9.0%. Excluding the impact of foreign exchange, revenue from Telefónica decrease 2.4%, principally due to lower volumes. Revenue from non-Telefónica clients, excluding the impact of foreign exchange, increased by 16.9%, mainly due to new clients including the CBCC business acquisition (see Note 1d in the “Interim Consolidated Financial Statements”), and the introduction of new services with existing clients in the financial services sector.
Americas
Revenue in Americas for the three months ended September 30, 2014 and September 30, 2015 was $204.3 million and $200.3 million, respectively, a decrease of $4.0 million, or 2.0%. Excluding the impact of foreign exchange, revenue increased by 15.9%. Excluding the impact of foreign exchange, revenue from Telefónica increased by 8.2%. Excluding the impact of foreign exchange, revenue from non-Telefónica clients increased by 23.1% due to strong growth in most markets supported by new and existing clients, particularly in Argentina, Peru, Colombia, Central America, Mexico, nearshore business volume increase in United States and new client wins.
23
Table of Contents
EMEA
Revenue in EMEA for the three months ended September 30, 2014 and September 30, 2015 was $77.7 million and $59.8 million, respectively, a decrease of $17.9 million, or 23.0%. Excluding the foreign exchange impact and sale of operations in Czech Republic, revenue decreased 5.5%. Excluding the impacts of foreign exchange and the sale of operations in Czech Republic, revenue from Telefónica decreased 3.6% primarily due to a decline in Telefónica’s telecommunications business in Spain. Excluding the impact of foreign exchange and the sale of operations in Czech Republic, revenue from non-Telefónica clients decreased 8.6%. This decline was largely driven by the reduction of Public Administration services.
Other operating income
Other operating income decreased from $0.9 million for the three months ended September 30, 2014 to $0.8 million, for the period ended September 30, 2015, or by $0.1 million. Excluding the impact of foreign exchange, other operating income was unchanged.
Other Gains
In May 2014, the Master Service Agreement (“MSA”) with Telefónica, which requires the Telefónica Group companies to meet pre-agreed minimum annual revenue commitments to us through 2021, was amended to adjust such minimum revenue commitments in relation to Spain and Morocco, to reflect the expected lower level of activities in these geographies. The provisions of the MSA require Telefónica to compensate the Company in case of shortfalls in these revenue commitments. As such, Telefónica agreed to compensate the Company with a non-cash penalty fee amounting to €25.4 million (equivalent to $34.9 million for the period ended June 30, 2014). This non-cash compensation was recorded in the consolidated income statement for the period ended June 30, 2014 as other gains.
Total operating expenses
Total operating expenses decreased by $100.8 million, or 18.6%, from $542.8 million for the three months ended September 30, 2014 to $442.0 million for the three months ended September 30, 2015. Excluding the impact of foreign exchange, operating expenses increased by 9.6%. As a percentage of revenue, operating expenses represented 92.1% and 92.8% for the three months ended September 30, 2014 and 2015, respectively. The $100.8 million decrease in operating expenses resulted from the following items:
Supplies: Supplies decreased by $6.7 million, or 24.7%, from $27.1 million for the three months ended September 30, 2014 to $20.4 million for the three months ended September 30, 2015. Excluding the impact of foreign exchange, supplies expense increased by1.1%. The increase was mainly due to higher activity in Brazil and Americas. As a percentage of revenue, supplies represent 4.6% and 4.3% for the three months period ended September 30, 2014 and 2015, respectively.
Employee benefits expenses: Employee benefits expenses decreased by $64.7 million, or 16.1%, from $403.0 million for the three months ended September 30, 2014 to $338.3 million for the three months ended September 30, 2015. Excluding the impact of foreign exchange, employee benefits expenses increased by 12.4%. As a percentage of the revenue, employee benefits expenses represented 68.4% and 71.0% for the three months periods ended September 30, 2014 and 2015, respectively. This increase in the percentage over revenue is due to the volume decrease in Brazil and Spain, generation restructuring costs to adapt the labor force to the new volumes.
Depreciation and amortization: Depreciation and amortization expense decreased by $5.6 million, or 18.7%, from $30.0 million for the three months ended September 30, 2014 to $24.4 million for the three months ended September 30, 2015. Excluding the impact of foreign exchange, depreciation and amortization expense increased by 11.7%, mainly due to the growth in capacity to deliver the new services captured, mainly in Brazil.
Changes in trade provisions: Changes in trade provisions increased by $0.5 million, from a positive figure of $0.1 million for the three months ended September 30, 2014 to a negative figure of $0.4 million for the three months ended September 30, 2015. As a percentage of revenue, no changes in trade provisions occurred representing less than 0.1% for the three months ended September 30, 2014 and 2015.
Other operating expenses: Other operating expenses decreased $24.7 million, or 29.7%, from $83.2 million for the three months ended September 30, 2014 to $58.5 million for the three months ended September 30, 2015. Excluding the impact of foreign exchange, other operating expenses decreased 3.4%, principally due a decline in non-recurring expenses and a decline in business activity in EMEA. As a percentage of revenue, other operating expenses were 14.1% and 12.3% for the three months ended September 30, 2014 and 2015, respectively.
Impairment charges: As of June 30, 2014, we performed an impairment test on the carrying amount of customer-relationship intangible assets, goodwill and property, plant and equipment, as a result of the amendment to the MSA which impacted the amount of expected revenue and also in consideration of the changes in expected revenue in certain countries. The impairment test was performed using assumptions revised in accordance with the amendments to the MSA and with updated management expectations on cash flow generation from the different countries where we operate. The result of the test performed was an impairment charge of $28.0 million of the intangible asset related to the customer relationship with Telefónica in connection with the MSA. Impairment charges of $1.1 million of goodwill in Spain and of $3.8 million of goodwill in the Czech Republic were recognized during the year ended December 31, 2014, as a result of this impairment test.
24
Table of Contents
Brazil
Total operating expenses in Brazil decreased by $78.2 million, or 28.2%, from $277.1 million for the three months ended September 30, 2014 to $198.9 million for the three months ended September 30, 2015. Excluding the impact of foreign exchange, operating expenses in Brazil increased by 11.0%. Excluding the corporate expenses, operating expenses as a percentage of revenue increased from 88.6% to 90.8%, for the three months ended September 30, 2014 and 2015, respectively, in constant currency mainly driven by costs to adapt labor force to new volume levels. Excluding the impact of this effect, operating expenses as a percentage of revenue would have increased from 88.6% to 88.7%.
Americas
Total operating expenses in the Americas increased by $1.3 million, or 0.7%, from $181.2 million for the three months ended September 30, 2014 to $182.5 million for the three months ended September 30, 2015. Excluding the impact of foreign exchange, operating expenses in the Americas increased 18.7%. Excluding the corporate expenses, operating expenses as a percentage of revenue increased from 87.7% to 89.3%, for the three months ended September 30, 2014 and 2015, respectively, in constant currency, mainly driven by unfavorable service mix.
EMEA
Total operating expenses in EMEA decreased by $17.4 million, or 22.7%, from $76.6 million for the three months ended September 30, 2014 to $59.2 million for the three months ended September 30, 2015. Operating expenses as a percentage of revenue increased from 98.6% to 99.0%. Excluding the impact of foreign exchange, operating expenses decreased 8.0%, slightly lower than revenue decrease. The decrease in operating expenses was primarily attributable to lower employee benefit expenses in line with the reduction of activity levels during 2015.
Operating profit
Operating profit decreased $12.5 million, or 26.3%, from $47.5 million for the three months ended September 30, 2014 to $35.0 million for the three months ended September 30, 2015. Excluding the impact of foreign exchange, operating profit increased $1.2 million. Operating profit margin decreased from 8.1% for the period ended September 30, 2014 to 7.3% for the period ended on September 30, 2015. The decrease is mainly due to unfavorable service mix and retroactive price increase in Argentina booked in the three months ended September 30, 2014 and costs incurred in Brazil to adapt labor force to new volume levels.
Brazil
Operating profit in Brazil decreased $13.1 million, or 42.7%, from $30.7 million for the three months ended on September 30, 2014 to $17.6 million for the three months ended September 30, 2015. Excluding the impact of foreign exchange, operating profit decreased 9.4%. Excluding the corporate expenses, operating profit margin in Brazil decreased from 11.4% for the three months ended on September 30, 2014 to 9.2% for the period ended September 30, 2015, in constant currency. The decrease in operating profit is driven by lower Telefónica volumes and costs to adapt labor force to new volume levels during the three months ended September 30, 2015. Excluding the impact of this effect during the three months ended September 30, 2015, operating profit margin decreased from 11.4% to 11.3%.
Americas
Operating profit in the Americas decreased $5.7 million, or 23.8%, from $24.0 million for the three months ended on September 30, 2014 to $18.3 million for the period ended September 30, 2015. Excluding the impact of foreign exchange, operating profit decreased 7.5%. Excluding corporate expenses, operating profit margin decreased from 12.8% for the period ended September 30, 2014 to 11.0% for the three months ended September 30, 2015, in constant currency. The decrease is mainly due to unfavorable service mix and retroactive price increase in Argentina booked in the three months ended September 30, 2014.
EMEA
Operating profit in EMEA decreased by $0.4 million, from of $1.2 million for the three months ended September 30, 2014 to a of $0.8 million for the period ended September 30, 2015. Excluding the impact of foreign exchange operating profit margin decreased from a margin of 1.5% to a margin of 1.3%. Excluding the impact of foreign exchange and corporate expenses, operating profit as a percentage of revenue for the three months ended September 30, 2014 and 2015 stabilize at a level of 1.6%.
25
Table of Contents
Finance income
Finance income decreased by $3.6 million, from $8.5 million for the three months ended September 30, 2014 to $4.9 million for the three months ended September 30, 2015. Excluding the impact of foreign exchange, finance income decreased by $0.9 million during the period ended September 30, 2015.
Finance costs
Finance costs decreased by $14.5 million, or 44.8%, from $32.4 million for the three months ended September 30, 2014 to $17.9 million for the period ended September 30, 2015. Excluding the impact of foreign exchange, finance costs decreased by 23.8% during the period ended September 30, 2015. The decline in finance costs was mainly due to the overlap of the capitalization of PECs in 2014, in connection with the IPO, and the earlier payment of Brazilian Debentures.
Net foreign exchange gain/(loss)
Net foreign exchange gain/(loss) increased by $10.7 million, from a loss of $7.2 million for the three months ended September 30, 2014 to a gain of $3.5 million for the period ended September 30, 2015. This increase was principally due to the impact of the financial instruments designated in foreign currency in its subsidiary Atento Luxco 1 during 2014 that will not occur from 2015 due to the change in the functional currency of Atento Luxco 1.
Income tax benefit/(expense)
Income tax expense for the three months ended September 30, 2014 and September 30, 2015 was $8.4 million and $8.8 million, respectively. This increase is due to the higher profit before tax in 2015 and due to the non-deductible costs/expenses recognized mainly in Mexico.
Profit/(loss) for the period
Profit/(loss) for the three months ended September 30, 2014 and September 30, 2015 was a gain of $8.0 million and a gain of $16.7 million, respectively, as a result of the items disclosed above.
EBITDA and Adjusted EBITDA
EBITDA decreased by $18.1 million, or 23.4%, from $77.5 million for the three months ended September 30, 2014 to $59.4 million for the period ended September 30, 2015. Adjusted EBITDA decreased by $22.4 million, or 25.4% from $88.2 million for the same period ended on September 30, 2014 to $65.8 million for the period ended September 30, 2015. The difference between EBITDA and Adjusted EBITDA is due to the exclusion of items that were not related to our core results of operations. Our Adjusted EBITDA is defined as EBITDA adjusted to exclude the acquisition and integration related costs, restructuring costs, sponsor management fees, asset impairments, site relocation costs, financing and IPO fees and other items which are not related to our core results of operations. See “Selected Historical Financial Information” for a reconciliation of EBITDA and Adjusted EBITDA to profit/(loss).
Excluding the impact of foreign exchange, EBITDA increased by 6.2% and Adjusted EBITDA increased by 4.2% mainly due to revenue growth and the positive performance in Brazil.
Brazil
EBITDA in Brazil decreased by $15.8 million, or 35.1%, from $45.0 million for the three months ended September 30, 2014 to $29.2 million for the period ended September 30, 2015. Adjusted EBITDA decreased by $13.2 million, or 28.2%, from $46.8 million for the three months period ended on September 30, 2014 to $33.6 million for the period ended September 30, 2015. Excluding the impact of foreign exchange, EBITDA and Adjusted EBITDA increased by 1.8% and 13.2%, respectively. Excluding corporate expenses, EBITDA decreased 1.3% and Adjusted EBITDA increased 9.3%, during the three months ended September 30, 2014 and 2015, respectively, in constant currency.
Americas
EBITDA in the Americas decreased by $7.4 million, or 21.3%, from $34.8 million for the three months ended September 30, 2014 to $27.4 million for the period ended September 30, 2015. Adjusted EBITDA decreased by $7.3 million, or 20.6%, from $35.5 million for the period ended on September 30, 2014 to $28.2 million for the three month period ended September 30, 2015. Excluding the impact of foreign exchange, EBITDA and Adjusted EBITDA decreased during this period by 4.0% and 3.1%, respectively. Excluding corporate expenses, EBITDA and Adjusted EBITDA increased by 0.8% and 1.6%, respectively, in constant currency, due to the strong growth mainly in Peru and Argentina, and Adjusted EBITDA margin was reduced by 2.3 percentage points mainly due to unfavorable service mix and retroactive price increase in Argentina booked in the three months ended September 30, 2014.
26
Table of Contents
EMEA
EBITDA in EMEA decreased by $1.6 million, from of $5.8 million for the three month period ended September 30, 2014 to $4.2 million for the period ended on September 30, 2015. Adjusted EBITDA in EMEA decreased by 18.5%, from $6.5 million for the three months ended September 30, 2014 to $5.3 million for the period ended on September 30, 2015. The Adjusted EBITDA margin grew 0.5 percentage points.
Nine Months Ended September 30, 2014 Compared to Nine Months Ended September 30, 2015
Revenue
Revenue decreased by $235.5 million, or 13.5%, from $1,743.3 million for the nine months ended September 30, 2014 to $1,507.8 million for the nine months ended September 30, 2015. Excluding the impact of foreign exchange and the sale of the operations in Czech Republic, revenue increased by 10.0% driven primarily by a strong performance in Brazil and the Americas, largely offsetting a decline in EMEA. Revenue in LatAm, increased 13.6% excluding the impact of foreign exchange.
Revenue from Telefónica, excluding the impact of foreign exchange, increased by 3.5%, driven primarily by a strong performance in the Americas, in particular, in Peru as a result of the increase in offshore business from Argentina, in Chile due to the finalization of the implementation of a new business model implemented in 2014 and new services, in addition to price adjustments in Argentina. This positive performance in the Americas largely offset a decline in EMEA caused by adverse Telefónica situation in the Spanish telecom sector.
Excluding the impact of foreign exchange and the sale of the operations in Czech Republic, revenue from non-Telefónica clients increased by 15.7% due to the strong double digit growth in all regions, except from EMEA. As of September 30, 2015, revenue from non-Telefónica clients equaled 54.8% of total revenue, an increase of 1.4 percentage points over the prior year. We have continued our strategy to increase our revenue diversification from Telefónica with significant clients wins in the telecommunication sector in Brazil and multisector segments, and higher volumes with current clients, primarily in the finance sector. The strong growth in the Americas was driven mainly by Peru, Colombia, Chile, Argentina and nearshore business volume increase in United States and new client wins. This growth partially offset by a decline in EMEA Multisector due to some Public Administration service terminations.
The following chart sets forth a breakdown of revenue based on geographical region for the nine months ended September 30, 2014 and September 30, 2015 and as a percentage of revenue and the percentage change between those periods with and net of foreign exchange effects.
| For the nine months ended September 30, | ||||||||||||||||||||||||
| ($ in millions, except percentage changes) | 2014 | (%) | 2015 | (%) | Change (%) |
Change excluding FX (%) |
||||||||||||||||||
| (unaudited) | (unaudited) | |||||||||||||||||||||||
| Brazil |
906.2 | 52.0 | 737.6 | 48.9 | (18.6 | ) | 11.7 | |||||||||||||||||
| Americas |
576.7 | 33.1 | 585.9 | 38.9 | 1.6 | 16.6 | ||||||||||||||||||
| EMEA |
260.8 | 15.0 | 185.7 | 12.3 | (28.8 | ) | (13.5 | ) | ||||||||||||||||
| Other and eliminations (1) |
(0.4 | ) | (0.1 | ) | (1.4 | ) | (0.1 | ) | N.M. | N.M. | ||||||||||||||
|
|
|
|
|
|
|
|
|
|
|
|
|
|||||||||||||
| Total |
1,743.3 | 100.0 | 1,507.8 | 100.0 | (13.5 | ) | 9.5 | |||||||||||||||||
|
|
|
|
|
|
|
|
|
|
|
|
|
|||||||||||||
| (1) | Included revenue and expenses at the holding-company level (such as corporate expenses and acquisition related expenses), as applicable, as well as consolidation adjustments. |
Brazil
Revenue in Brazil for the nine months ended September 30, 2014 and September 30, 2015 was $906.2 million and $737.6 million, respectively. Revenue decreased in Brazil by $168.6 million, or 18.6%. Excluding the impact of foreign-exchange, revenue increased by 11.7%. Excluding the impact of foreign exchange, revenue from Telefónica increased 2.3%, principally due to the introduction of new services in Brazil. Revenue from non-Telefónica clients, excluding the impact of foreign exchange, increased by 18.5%, mainly due to volume growth and the introduction of new services with existing clients, mainly in the financial sector, in addition to significant clients wins in the telecom sector where we now provide services to all major operators.
27
Table of Contents
Americas
Revenue in the Americas for the nine months ended September 30, 2014 and September 30, 2015 was $576.7 million and $585.9 million, respectively, an increase of $9.2 million, or 1.6%. Excluding the impact of foreign exchange, revenue increased by 16.6%. Excluding the impact of foreign exchange, revenue from Telefónica increased by 14.8%, due to strong performances across the region aided by price adjustments in Argentina, the implementation of new business model in Chile with Telefónica, and in Peru due to the increase in offshore business from Argentina and new services. Excluding the impact of foreign exchange, revenue from non-Telefónica clients increased by 18.2%, due to strong growth in most markets supported by new and existing clients, particularly in Argentina, Peru, Colombia, Central America and nearshore business volume increase in the United States.
EMEA
Revenue in EMEA for the nine months ended September 30, 2014 and September 30, 2015 was $260.8 million and $185.7 million, respectively, a decrease of $75.1 million, or 28.8%. Excluding the impact of foreign exchange and sale of operations in Czech Republic, revenue decreased 10.8%. Excluding the impact of foreign exchange, revenue from Telefónica decreased by 12.9% primarily due to a decline in Telefónica’s telecommunications business in Spain. Excluding the impact of foreign exchange and the sale of operations in Czech Republic, revenue from non-Telefónica clients decreased 7.1%. This decline was largely driven by the termination of some Public Administration services.
Other operating income
Other operating income increased from $1.8 million for the nine months ended September 30, 2014 to $2.0 million for the nine months ended September 30, 2015, or by $0.2 million. Excluding the impact of foreign exchange, other operating income increased by 33.3% principally due to subsidies received in Spain for hiring disabled employees.
Other gains
In May 2014, the Master Service Agreement (“MSA”) with Telefónica, which requires the Telefónica Group to meet pre-agreed minimum annual revenue commitments to us through 2021, was amended to adjust minimum revenue commitments in relation to Spain and Morocco, to reflect the expected lower level of activities in these countries. The provisions of the MSA require Telefónica to compensate us in case of shortfalls in these revenue commitments. Based on the above, Telefónica agreed to compensate us with a penalty fee amounting to €25.4 million (equivalent to $34.5 million at September 30, 2014).
Total operating expenses
Total operating expenses decreased by $284.6 million, or 16.7%, from $1,700.2 million for the nine months ended September 30, 2014 to $1,415.6 million for the nine months ended September 30, 2015. Excluding the impact of foreign exchange, operating expenses increased by 5.1%. As a percentage of revenue, operating expenses constituted 97.5% and 93.9% for the nine months ended September 30, 2014 and 2015, respectively. This decreased was principally due to the impairment charges recognized, a decrease in employee benefit expenses due to restructuring costs and other operating expenses incurred as a result of the IPO process. Adjusting for these items, operating expenses as a percentage of revenues would have constituted 94.8% and 93.0% of revenue for the nine months ended September 30, 2014 and 2015 respectively.
The $284.6 million decrease in operating expenses during the nine months ended September 30, 2015 resulted from the following components:
Supplies: Supplies decreased by $19.4 million, or 24.5%, from $79.2 million for the nine months ended September 30, 2014 to $59.8 million for the nine months ended September 30, 2015. Excluding the impact of foreign exchange, supplies expense decreased by 3.2%. The decrease was principally caused by the lower activity in the EMEA region and efficiencies generated in Americas. As a percentage of revenue, supplies constituted 4.5% and 4.0% for the nine months ended September 30, 2014 and 2015, respectively.
Employee benefit expenses: Employee benefit expenses decreased by $153.0 million, or 12.3%, from $1,246.4 million for the nine months ended September 30, 2014 to $1,093.4 million for the nine months ended September 30, 2015. Excluding the impact of foreign exchange, employee benefits expenses increased by 10.4%. This increase was principally due to growth in business activity. As a percentage of our revenue, employee benefits expenses constituted 71.5% and 72.5% for the nine months ended September 30, 2014 and 2015, respectively. This slight increase in the percentage over revenue is due to the ramp up of the new wins, in addition to wage inflation not yet fully translated to price, mainly in Brazil and Americas, offset by the efficiencies generated.
28
Table of Contents
Depreciation and amortization: Depreciation and amortization expense decreased by $12.8 million, or 14.0%, from $91.6 million for the nine months ended September 30, 2014 to $78.8 million for the nine months ended September 30, 2015. Excluding the impact of foreign exchange, depreciation and amortization expense increased by 9.8%, principally due to the growth in capacity to deliver the new services captured, mainly in Brazil.
Changes in trade provisions: Changes in trade provisions totaled a negative figure of $0.9 million for the nine months ended September 30, 2015, increased of $0.7 million over the nine months ended September 30, 2014. This increase was principally due to the collection, of some receivables that had previously been impaired. As a percentage of revenue, changes in trade provisions constituted less than 0.0% and 0.1% for the nine months ended September 30, 2014 and 2015.
Other operating expenses: Other operating expenses decreased by $67.6 million, or 27.0%, from $250.3 million for the nine months ended September 30, 2014 to $182.7 million for the nine months ended September 30, 2015. Excluding the impact of foreign exchange, other operating expenses decreased by 6.8%, principally due to financing and IPO fees incurred during the IPO process, in addition to the lower activity in EMEA. As a percentage of revenue, other operating expenses constituted 14.4% and 12.1% for the nine months ended September 30, 2014 and 2015, respectively.
Impairment charges: Asset impairment for the nine months ended September 30, 2014 relates to charges associated to projects for inventory control in Brazil which are not related to our core results of operations.
As of June 30, 2014, we performed an impairment test on the carrying amount of customer-relationship intangible assets, goodwill and property, plant and equipment, as a result of the amendment to the MSA which impacted the amount of expected revenue and also in consideration of the changes in expected revenue in certain countries. The impairment test was performed using assumptions revised in accordance with the amendments to the MSA and with updated management expectations on cash flow generation from the different countries where we operate. The result of the test performed was an impairment charge of $27.7 million of the intangible asset related to the customer relationship with Telefónica in connection with the MSA.
Brazil
Total operating expenses in Brazil decreased by $151.4 million, or 18.2%, from $833.6 million for the nine months ended September 30, 2014 to $682.2 million for the nine months ended September 30, 2015. Excluding the impact of foreign exchange, operating expenses in Brazil increased by 12.1%. Excluding the corporate expenses, operating expenses as a percentage of revenue slightly increased from 91.2% to 91.5%. Cost efficiencies achieved from our margin transformation programs result impacted by country inflationary pressure and the increase in costs to adapt labor force to new volume levels.
Americas
Total operating expenses in the Americas increased by $8.5 million, or 1.6%, from $530.1 million for the nine months ended September 30, 2014 to $538.6 million for the nine months ended September 30, 2015. Excluding the impact of foreign exchange, operating expenses in the Americas increased by 16.4%, below the increase in revenues. Excluding the corporate expenses, operating expenses as a percentage of revenue decreased from 91.4% to 90.4% in the nine months ended September 30, 2015, mainly explained by efficiency gains in Argentina, Peru and Chile.
EMEA
Total operating expenses in EMEA decreased by $122.1 million, or 39.2%, from $311.2 million for the nine months ended September 30, 2014 to $189.1 million for the nine months ended September 30, 2015. Excluding the impact of foreign exchange, operating expenses in EMEA decreased by 26.2%. Excluding the corporate expenses, operating expenses as a percentage of revenue decreased from 119.3% to 101.8%. The decrease in operating expenses in the nine months ended September 30, 2015 was primarily attributable to impairment charges and restructuring costs booked in 2014. Excluding the impact of these two effects amounting to 50.4 million, operating expenses as a percentage of revenue would have reached 100.0% in the nine months ended September 30, 2014 compared to 99.5% in the nine months ended September 30, 2015, excluding as well the non-recurring expenses booked in this period.
Operating profit
Operating profit increased by $14.4 million, or 18.0%, from $79.8 million for the nine months ended September 30, 2014 to $94.2 million for the nine months ended September 30, 2015. Excluding the impact of foreign exchange, operating profit increased by 54.4%. Operating profit margin increased from 4.6% for the nine months ended September 30, 2014 to 6.2% for the nine months ended September 30, 2015. This increase was driven by a broad based improvement in efficiencies as well as lower non-recurring expenses.
29
Table of Contents
Brazil
Operating profit in Brazil decreased by $17.3 million, or 23.7%, from $72.9 million for the nine months ended September 30, 2014 to $55.6 million for the nine months ended September 30, 2015. Excluding the impact of foreign exchange, operating profit increased by 7.4% in 2015. Excluding the corporate expenses, operating profit increased by 9.1% for the nine months ended September 30, 2015, in constant currency. The increase in operating profit is due to strong growth in revenue with existing clients and new clients, in addition to improved operational efficiencies.
Americas
Operating profit in the Americas increased by $0.7 million, or 1.5%, from $47.8 million for the nine months ended September 30, 2014 to $48.5 million for the nine months ended September 30, 2015. Excluding the impact of foreign exchange, operating profit increased by 19.2%. Excluding corporate expenses, operating profit margin increased from 8.8% for the nine months ended September 30, 2014 to 9.8% for the nine months ended September 30, 2015, in constant currency. The increase in operating profit was mainly attributed to the strong performance in Peru, Chile and Argentina.
EMEA
Operating profit in EMEA improved by $46.3 million, from a loss of $49.2 million for the nine months ended September 30, 2014 to a loss of $2.9 million for the nine months ended September 30, 2015. Excluding the impact of foreign exchange, operating profit increased by $45.6 million in 2015. Excluding corporate expenses, operating profit margin decreased from a loss of 18.9% for the nine months ended September 30, 2014 to a loss of 1.5% for the nine months ended September 30, 2015, principally due to the non-recurring expenses booked in the nine months ended September 30, 2014. Excluding non-recurring impacts operating profit margin would have increased from a gain of 0.5% to a gain of 0.9%.
Finance income
Finance income decreased by $0.7 million, from $13.4 million for the nine months ended September 30, 2014 to $12.7 million for the nine months ended September 30, 2015. Excluding the impact of foreign exchange, finance income increased by $4.0 million during the nine months ended September 30, 2015.
Finance costs
Finance costs decreased by $42.5 million, or 42.3%, from $100.5 million for the nine months ended September 30, 2014 to $58.0 million for the nine months ended September 30, 2015. Excluding the impact of foreign exchange, finance costs decreased by 26.2% during the nine months ended September 30, 2015. This decrease in finance costs was mainly due to the overlap of the capitalization of PECs in 2014, in connection with the IPO, and the earlier payment of Brazilian Debentures.
Net foreign exchange gain/(loss)
Net foreign exchange gain/(loss) increased by $25.7 million, from a loss of $11.1 million for the nine months ended September 30, 2014 to a gain of $14.6 million for the nine months ended September 30, 2015. This increase was principally due to net foreign exchange loss resulting from liabilities denominated in foreign currencies which depreciated against the U.S. dollar during the 2014 period and the functional currency change in Atento Luxco1.
Income tax benefit/(expense)
Income tax benefit/(expense) for the nine months ended September 30, 2014 and September 30, 2015 was a benefit of $2.1 million and an expense of $19.7 million. This variation is due to the higher profit before tax in 2015 and due to the non-deductible costs/expenses recognized mainly in Mexico.
Profit/(loss) for the period
Profit/(loss) for the nine months ended September 30, 2014 and September 30, 2015 was a loss of $16.3 million and a gain of $43.7 million, respectively, as a result of the factors discussed above.
EBITDA and Adjusted EBITDA
30
Table of Contents
EBITDA increased by $1.5 million, or 0.9%, from $171.4 million for the nine months ended September 30, 2014 to $172.9 million for the nine months ended September 30, 2015. Adjusted EBITDA decreased by $33.6 million, or 15.3%, from $219.8 million for the nine months ended September 30, 2014 to $186.2 million for the nine months ended September 30, 2015. The difference between EBITDA and Adjusted EBITDA was due to the exclusion of items that were not related to our core results of operations. Our Adjusted EBITDA is defined as EBITDA adjusted to exclude the acquisition and integration related costs, restructuring costs, sponsor management fees, asset impairments, site relocation costs, financing and IPO fees and other items which are not related to our core results of operations. See “Selected Historical Financial Information” for a reconciliation of EBITDA and Adjusted EBITDA to profit/(loss).
Excluding the impact of foreign exchange, EBITDA increased by 30.6% and Adjusted EBITDA increased by 10.0% mainly due to revenue growth and solid performance in Brazil and Americas, more than offsetting reduced activity in EMEA.
Brazil
EBITDA in Brazil decreased by $20.9 million, or 18.2%, from $115.0 million for the nine months ended September 30, 2014 to $94.1 million for the nine months ended September 30, 2015. Adjusted EBITDA decreased by $23.7 million, or 19.2%, from $123.7 million for the nine months ended September 30, 2014 to $100.0 million for the nine months ended September 30, 2015. Excluding the impact of foreign exchange, EBITDA and Adjusted EBITDA increased by 14.1% and 13.4%, respectively. Excluding corporate expenses, EBITDA and Adjusted EBITDA increased by 14.8% and 14.1% respectively. This solid performance at EBITDA and Adjusted EBITDA level during the nine months ended September 30, 2015, in constant currency, is mainly due to strong growth in revenue with existing clients and new clients, including CBCC acquisition, as well as operating efficiencies achieved from our margin transformational programs.
Americas
EBITDA in the Americas decreased by $2.3 million, or 2.9%, from $80.3 million for the nine months ended September 30, 2014 to $78.0 million for the nine months ended September 30, 2015. Adjusted EBITDA decreased by $ 5.3 million, or 6.2%, from $ 85.2 million for the nine months ended September 30, 2014 to $ 79.9 million for the nine months ended September 30, 2015. Excluding the impact of foreign exchange, EBITDA and Adjusted EBITDA increased during the nine months ended September 30, 2015 by 13.9% and 9.9%, respectively. Excluding corporate expenses, EBITDA and Adjusted EBITDA increased by 20.5% and 16.3%, respectively, in constant currency, due to the strong growth mainly in Chile, Peru and Argentina.
EMEA
EBITDA in EMEA improved by $40.3 million, from a loss of $33.0 million for the nine months ended September 30, 2014 to a gain of $7.3 million for the nine months ended September 30, 2015. Adjusted EBITDA decreased by $5.7 million, from $17.4 million for the nine months ended September 30, 2014 to $11.7 million for the nine months ended September 30, 2015. Excluding the impact of foreign exchange, EBITDA increased $ 41.8 million and Adjusted EBITDA decreased $ 3.2 million during the nine months ended September 30, 2015. The decrease in Adjusted EBITDA, was mainly due to the revenue reduction. Excluding the corporate expenses, the Adjusted EBITDA margin was reduced from 6.7% to 6.4%.
Liquidity and Capital Resources
As of September 30, 2015, our outstanding debt amounted to $572.7 million, which includes $295.9 million of our 7.375% Senior Secured Notes due 2020, $172.4 million equivalent amount of Brazilian Debentures, $64.0 million of financing provided by BNDES, $35.5 million of CVIs, $4.7 million of finance lease payables and $0.2 million of other bank borrowings.
During the nine months ended September 30,2015, BNDES disbursed BRL 90.0 million (equivalent to $22.7 million of U.S. dollars as of September 30, 2015) of the facility.
During the three months ended September 30, 2015, our cash flow provided by operating activities totaled $38.7 million, which includes interest paid of $14.7 million. As such, our cash flow from operating activities, before giving effect to the payment of interests, amounted to $53.4 million.
During the nine months ended September 30, 2015, our cash flow used in operating activities totaled $3.3 million, which includes interest paid of $48.0 million. As such, our cash flow from operating activities, before giving effect to the payment of interest, amounted to $44.8 million.
31
Table of Contents
Cash Flow
As of September 30, 2015, we had cash and cash equivalents (net of any outstanding bank overdrafts) of approximately $174.7 million. We believe that our current cash flow used in operating activities and financing arrangements will provide us with sufficient liquidity to meet our working capital needs.
| For the three months ended September 30, |
For the nine months ended September 30, |
|||||||||||||||
| ($ in millions) | 2014 | 2015 | 2014 | 2015 | ||||||||||||
| (unaudited) | ||||||||||||||||
| Cash from/(used in) operating activities |
43.5 | 38.7 | 109.4 | (3.3 | ) | |||||||||||
| Cash provided by/(used in) investment activities |
(30.7 | ) | (22.0 | ) | (132.8 | ) | (31.5 | ) | ||||||||
| Cash provided by/(used in) financing activities |
(0.9 | ) | (1.7 | ) | 0.2 | 27.5 | ||||||||||
| Effect of changes in exchanges rates |
0.6 | (13.4 | ) | 0.3 | (29.6 | ) | ||||||||||
| Net increase/(decrease) in cash and cash equivalents |
12.4 | 1.6 | (22.8 | ) | (36.8 | ) | ||||||||||
Cash From/(used in) Operating Activities
Three and Nine Months Ended September 30, 2014 Compared to Three and Nine Months Ended September 30, 2015
Cash provided by operating activities was $38.7 million for the three months ended September 30, 2015 compared to the cash provided by operating activities of $43.5 million for the three months ended September 30, 2014. For the nine months ended September 30, 2015 cash used in operating activities was $3.3 million compared to cash provided by operating activities of $109.4 million for the same period in the prior year. The decrease from cash used in operating activities resulted from unfavorable changes in working capital as a result of higher DSO (Days Sales Outstanding).
Cash (used in) Investment Activities
Three Months Ended September 30, 2014 Compared to Three Months Ended September 30, 2015
Cash used in investment activities was $22.0 million for the three months ended September 30, 2015 compared to cash used in investment activities of $30.7 million for the three months ended September 30, 2014. Cash used in investment activities for the three months ended September 30, 2015 mainly include payments for capital expenditure of $23.4 million, compared to payments for capital expenditures of $36.0 million and payment for financial instruments of $6.4 million in the three months ended September 30, 2014.
Nine Months Ended September 30, 2014 Compared to Nine Months Ended September 30, 2015
Cash used in investment activities was $31.5 million for the nine months ended September 30, 2015 compared to cash used in investment activities of $132.8 million for the nine months ended September 30, 2014. Cash used in investment activities for the nine months ended September 30, 2015 mainly include payments for capital expenditure of $60.7 million, and redemption of $26.9 million from financial instruments (short term investment), compared to payments for capital expenditures of $81.2 million and USD denominated short-term investment (Export Notes) of $66.6 million in the nine months ended September 30, 2014.
Cash Provided by/(used in) Financing Activities
Three and Nine Months Ended September 30, 2014 Compared to Three and Nine Months Ended September 30, 2015
32
Table of Contents
Cash used in financing activities was $1.7 million for the three months ended September 30, 2015 compared to the cash used in financing activities of $0.9 million for the three months ended September 30, 2014. For the nine months cash provided by financing activities was $27.5 million compared to cash provided by financing activities of $0.2 million for the same period in the prior year.
Free Cash Flow
Our Management uses free cash flow to assess our liquidity and the cash flow generation of our operating subsidiaries. We define free cash flow as net cash flows from operating activities less cash payments for acquisition of property, plant, equipment and intangible assets for the period. We believe that free cash flow is useful to investors because it adjusts our operating cash flow by the capital that is invested to continue and improve business operations.
Free cash flow has limitations as an analytical tool. Free cash flow is not a measure defined by IFRS and should not be considered in isolation from, or as an alternative to, cash flow from operating activities or other measures as determined in accordance with IFRS. Additionally, free cash flow does not represent the residual cash flow available for discretionary expenditures as it does not incorporate certain cash payments, including payments made on finance lease obligations or cash payments for business acquisitions. Free cash flow is not necessarily comparable to similarly titled measures used by other companies.
| ($ in millions) | For the three months ended September 30, |
For the nine months ended September 30, |
||||||||||||||
| 2014 | 2015 | 2014 | 2015 | |||||||||||||
| (unaudited) | ||||||||||||||||
| Net cash flow from/(used in) operating activities |
43.5 | 38.7 | 109.4 | (3.3 | ) | |||||||||||
| Cash payments for acquisition of property plant, and equipment and intangible assets |
(36.0 | ) | (23.4 | ) | (81.2 | ) | (60.7 | ) | ||||||||
|
|
|
|
|
|
|
|
|
|||||||||
| Free cash flow (non-GAAP) (unaudited) |
7.5 | 15.3 | 28.2 | (64.0 | ) | |||||||||||
|
|
|
|
|
|
|
|
|
|||||||||
Three and Nine Months Ended September 30, 2014 Compared to Three and Nine Months Ended September 30, 2015
Free cash flow for the three months ended September 30, 2015 was a positive of $15.3 million compared to a positive of $7.5 million for the same period in the prior year. For the nine months free cash flow was a deficit of $64.0 million compared to positive $28.2 million for the same period in the prior year. The decrease in free cash flow was driven by higher working capital mainly due to strong revenue growth and higher DSO (Days Sales Outstanding).
Finance Leases
The Company holds the following assets under finance leases:
| As of December 31, 2014 |
As of September 30, 2015 |
|||||||
| ($ in millions) | Net carrying amount of asset |
Net carrying amount of asset |
||||||
| (audited) | (unaudited) | |||||||
| Finance leases |
||||||||
| Plant and machinery |
— | 1.8 | ||||||
| Furniture, tools and other tangible assets |
7.7 | 6.0 | ||||||
|
|
|
|
|
|||||
| Total |
7.7 | 7.8 | ||||||
|
|
|
|
|
|||||
The present value of future finance lease payments is as follow:
| As of December 31, 2014 |
As of September 30, 2015 |
|||||||
| ($ in millions) | Net carrying amount of asset |
Net carrying amount of asset |
||||||
| (unaudited) | ||||||||
| Up to 1 year |
4.7 | 2.2 | ||||||
| Between 1 and 5 years |
4.3 | 2.5 | ||||||
|
|
|
|
|
|||||
| Total |
9.0 | 4.7 | ||||||
|
|
|
|
|
|||||
33
Table of Contents
Capital Expenditures
Our business has significant capital expenditure requirements, including for the construction and initial fit-out of our service delivery centers; improvements and refurbishment of leased facilities for our service delivery centers; acquisition of various items of property, plant and equipment, mainly comprised of furniture, computer equipment and technology equipment; and acquisition and upgrades of our software or specific customer’s software.
The funding of the majority of our capital expenditures is covered by existing cash and EBITDA generation. The table below sets forth our historic capital expenditures by segment for the three and nine months ended September 30, 2014 and 2015.
| For the three months ended September 30, |
For the nine months ended September 30, |
|||||||||||||||
| 2014 | 2015 | 2014 | 2015 | |||||||||||||
| ($ in millions) | (unaudited) | (unaudited) | ||||||||||||||
| Brazil |
18.4 | 10.0 | 46.6 | 52.5 | ||||||||||||
| Americas |
6.0 | 5.9 | 15.7 | 25.1 | ||||||||||||
| EMEA |
0.2 | 0.4 | 2.7 | 5.2 | ||||||||||||
| Other and eliminations |
0.2 | (0.1 | ) | 0.4 | 0.3 | |||||||||||
|
|
|
|
|
|
|
|
|
|||||||||
| Total capital expenditures |
24.8 | 16.2 | 65.4 | 83.1 | ||||||||||||
|
|
|
|
|
|
|
|
|
|||||||||
34
Table of Contents
QUANTITATIVE AND QUALITATIVE DISCLOSURES ABOUT MARKET RISK
The Brazilian Congress approved the Bill 4330/04 on April 22, 2015 that intends to regulate outsourcing in Brazil and focuses on the technical specialization of hired companies. The bill provides protection to our business sector overall, but there are clauses that are cause for concern and which we will continue to monitor with respect to how we interact with our unions. In particular, if enacted, the bill could require that we be subject to the same rules and regulations as our unions, including salary and other benefits, which could be costly for us to comply with. The bill is currently in the Senate with the number 30/15, for analysis by its committees and approval. Due to the controversial nature of the bill, it is unclear how long it will take for the Senate to complete its analysis and schedule the vote.
Law No. 12,546/2011 provided that companies providing certain services or in certain industrial sectors contribute to the social security regime based on gross revenue, as opposed to payroll. In 2015, the government launched Provisional Measure 669 to increase the contribution rate to 4.5%, however this measure did not receive final approval. A new initiative, Bill 863/2015, would increase the rate to 3% of gross revenue for call center companies; the bill was approved by the Chamber of Deputies and is now awaiting Senate approval, which is believed to occur later this year.
35
Table of Contents
ATENTO S.A. AND SUBSIDIARIES
(FORMERLY ATENTO FLOATCO S.A., AND SUBSIDIARIES)
INTERIM CONSOLIDATED FINANCIAL STATEMENTS FOR THE NINE MONTHS ENDED SEPTEMBER 30, 2015
36
Table of Contents
ATENTO S.A. AND SUBSIDIARIES
(FORMERLY ATENTO FLOATCO S.A., AND SUBSIDIARIES)
INTERIM CONSOLIDATED STATEMENTS OF FINANCIAL POSITION
As at December 31, 2014 and September 30, 2015
(In thousands of U.S. dollars, unless otherwise indicated)
| ASSETS |
Notes | December 31, 2014 |
September 30, 2015 |
|||||||
| (audited) | (unaudited) | |||||||||
| NON-CURRENT ASSETS |
942,140 | 765,324 | ||||||||
|
|
|
|
|
|||||||
| Intangible assets |
7 | 293,078 | 234,897 | |||||||
| Goodwill |
7 | 169,471 | 135,272 | |||||||
| Property, plant and equipment |
7 | 237,196 | 173,642 | |||||||
| Non-current financial assets |
92,258 | 113,367 | ||||||||
| Trade and other receivables |
9 | 10,503 | 5,837 | |||||||
| Other receivables from public administrations |
4,851 | 4,375 | ||||||||
| Other non-current financial assets |
9 | 44,639 | 38,756 | |||||||
| Derivative financial instruments |
5.2 and 9 | 32,265 | 64,399 | |||||||
| Deferred tax assets |
150,137 | 108,146 | ||||||||
|
|
|
|
|
|||||||
| CURRENT ASSETS |
715,761 | 642,034 | ||||||||
|
|
|
|
|
|||||||
| Trade and other receivables |
475,759 | 465,966 | ||||||||
| Trade and other receivables |
9 | 451,394 | 442,067 | |||||||
| Current income tax receivables |
13,603 | 13,393 | ||||||||
| Other receivables from public administrations |
10,762 | 10,506 | ||||||||
| Other current financial assets |
28,562 | 1,412 | ||||||||
| Other financial assets |
9 | 28,562 | 1,412 | |||||||
| Cash and cash equivalents |
9 | 211,440 | 174,656 | |||||||
|
|
|
|
|
|||||||
| TOTAL ASSETS |
1,657,901 | 1,407,358 | ||||||||
|
|
|
|
|
|||||||
The accompanying Notes 1 to 18 are an integral part of the interim consolidated financial statements.
37
Table of Contents
ATENTO S.A. AND SUBSIDIARIES
(FORMERLY ATENTO FLOATCO S.A., AND SUBSIDIARIES)
INTERIM CONSOLIDATED STATEMENTS OF FINANCIAL POSITION
As at December 31, 2014 and September 30, 2015
(In thousands of U.S. dollars, unless otherwise indicated)
| EQUITY AND LIABILITIES |
Notes | December 31, 2014 |
September 30, 2015 |
|||||||
| (audited) | (unaudited) | |||||||||
| EQUITY ATTRIBUTABLE TO EQUITY HOLDERS OF THE PARENT |
464,866 | 415,675 | ||||||||
|
|
|
|
|
|||||||
| Share capital |
8 | 48 | 48 | |||||||
| Net investment/Share premium |
8 | 639,435 | 639,435 | |||||||
| Retained earnings |
8 | (102,811 | ) | (59,067 | ) | |||||
| Translation differences |
(71,750 | ) | (183,992 | ) | ||||||
| Cash flow hedge |
8 | (640 | ) | 16,346 | ||||||
| Stock-based compensation |
8 | 584 | 2,905 | |||||||
| NON-CURRENT LIABILITIES |
818,205 | 682,091 | ||||||||
|
|
|
|
|
|||||||
| Deferred tax liabilities |
83,132 | 58,445 | ||||||||
| Interest-bearing debt |
10 | 636,549 | 547,836 | |||||||
| Derivative financial instruments |
10 | 1,193 | 300 | |||||||
| Non-current provisions |
11 | 94,774 | 58,557 | |||||||
| Non-current non trade payables |
10 | 961 | 15,948 | |||||||
| Other non-current payables to public administrations |
1,596 | 1,005 | ||||||||
|
|
|
|
|
|||||||
| CURRENT LIABILITIES |
374,830 | 309,592 | ||||||||
|
|
|
|
|
|||||||
| Interest bearing-debt |
10 | 16,761 | 24,730 | |||||||
| Trade and other payables |
339,560 | 272,423 | ||||||||
| Trade payables |
10 | 105,766 | 81,724 | |||||||
| Current income tax payable |
7,351 | 7,493 | ||||||||
| Other current payables to public administrations |
74,516 | 65,117 | ||||||||
| Other non-trade payables |
10 | 151,927 | 118,089 | |||||||
| Current provisions |
11 | 18,509 | 12,439 | |||||||
|
|
|
|
|
|||||||
| TOTAL EQUITY AND LIABILITIES |
1,657,901 | 1,407,358 | ||||||||
|
|
|
|
|
|||||||
The accompanying Notes 1 to 18 are an integral part of the interim consolidated financial statements.
38
Table of Contents
ATENTO S.A. AND SUBSIDIARIES
(FORMERLY ATENTO FLOATCO S.A., AND SUBSIDIARIES)
INTERIM CONSOLIDATED INCOME STATEMENTS
For the nine months ended September 30, 2014 and 2015
(In thousands of U.S. dollars, unless otherwise indicated)
| Nine months ended September 30, | ||||||||||
| Notes | 2014 | 2015 | ||||||||
| (Unaudited) | ||||||||||
| Revenue |
6 | 1,743,264 | 1,507,844 | |||||||
| Other operating income |
1,760 | 2,015 | ||||||||
| Own work capitalized |
413 | (15 | ) | |||||||
| Other gains |
34,478 | — | ||||||||
| Supplies |
(79,240 | ) | (59,819 | ) | ||||||
| Employee benefit expense |
(1,246,353 | ) | (1,093,393 | ) | ||||||
| Depreciation and amortization |
(91,640 | ) | (78,838 | ) | ||||||
| Changes in trade provisions |
(199 | ) | (925 | ) | ||||||
| Other operating expenses |
(250,227 | ) | (182,714 | ) | ||||||
| Impairment charges |
(32,479 | ) | — | |||||||
|
|
|
|
|
|||||||
| OPERATING PROFIT |
79,777 | 94,155 | ||||||||
|
|
|
|
|
|||||||
| Finance income |
13,346 | 12,677 | ||||||||
| Finance costs |
(100,437 | ) | (58,019 | ) | ||||||
| Net foreign exchange gain/(loss) |
(11,107 | ) | 14,616 | |||||||
|
|
|
|
|
|||||||
| NET FINANCE EXPENSE |
(98,198 | ) | (30,726 | ) | ||||||
|
|
|
|
|
|||||||
| PROFIT/(LOSS) BEFORE TAX |
(18,421 | ) | 63,429 | |||||||
|
|
|
|
|
|||||||
| Income tax benefit/(expense) |
13 | 2,120 | (19,685 | ) | ||||||
|
|
|
|
|
|||||||
| PROFIT/(LOSS) FOR THE PERIOD ATTRIBUTABLE TO EQUITY HOLDERS OF THE PARENT |
(16,301 | ) | 43,744 | |||||||
|
|
|
|
|
|||||||
|
|
|
|
|
|||||||
| Basic result per share (per U.S. dollars) |
14 | (0.22 | ) | 0.59 | ||||||
|
|
|
|
|
|||||||
| Diluted result per share (per U.S. dollars) |
14 | (0.22 | ) | 0.59 | ||||||
|
|
|
|
|
|||||||
The accompanying Notes 1 to 18 are an integral part of the interim consolidated financial statements.
39
Table of Contents
ATENTO S.A. AND SUBSIDIARIES
(FORMERLY ATENTO FLOATCO S.A., AND SUBSIDIARIES)
INTERIM CONSOLIDATED STATEMENTS OF OTHER COMPREHENSIVE INCOME
For the nine months ended September 30, 2014 and 2015
(In thousands of U.S. dollars, unless otherwise indicated)
| Nine months ended September 30, | ||||||||
| 2014 | 2015 | |||||||
| (unaudited) | ||||||||
| Profit/(loss) for the period |
(16,301 | ) | 43,744 | |||||
|
|
|
|
|
|||||
| Other comprehensive income/(loss) |
||||||||
| Items that may subsequently be reclassified to profit and loss |
||||||||
| Cash flow hedge |
(5,582 | ) | 18,273 | |||||
| Tax effect |
1,332 | (1,287 | ) | |||||
| Translation differences |
17,325 | (112,242 | ) | |||||
|
|
|
|
|
|||||
| Other comprehensive (loss), net of taxes |
13,075 | (95,256 | ) | |||||
|
|
|
|
|
|||||
| Total comprehensive (loss) |
(3,226 | ) | (51,512 | ) | ||||
|
|
|
|
|
|||||
The accompanying Notes 1 to 18 are an integral part of the interim financial statements.
40
Table of Contents
ATENTO S.A. AND SUBSIDIARIES
(FORMERLY ATENTO FLOATCO S.A., AND SUBSIDIARIES)
INTERIM CONSOLIDATED STATEMENTS OF CHANGES IN EQUITY
For the nine months ended September 30, 2014 and 2015
(In thousands of U.S. dollars, unless otherwise indicated)
| Share capital |
Net Investment/ Share Premium |
Retained earnings |
Translation differences |
Cash flow hedge |
Stock-based compensation |
Total equity |
||||||||||||||||||||||
| Balance at January 1, 2014 |
— | 2,579 | (60,659 | ) | (77,513 | ) | 1,627 | — | (133,966 | ) | ||||||||||||||||||
|
|
|
|
|
|
|
|
|
|
|
|
|
|
|
|||||||||||||||
| Comprehensive loss for the period |
— | — | (16,301 | ) | 17,325 | (4,250 | ) | — | (3,226 | ) | ||||||||||||||||||
| Loss for the period |
— | — | (16,301 | ) | — | — | — | (16,301 | ) | |||||||||||||||||||
| Other comprehensive income/(loss) |
— | — | — | 17,325 | (4,250 | ) | — | 13,075 | ||||||||||||||||||||
|
|
|
|
|
|
|
|
|
|
|
|
|
|
|
|||||||||||||||
| Balance at September 30, 2014 (*) |
— | 2,579 | (76,960 | ) | (60,188 | ) | (2,623 | ) | — | (137,192 | ) | |||||||||||||||||
|
|
|
|
|
|
|
|
|
|
|
|
|
|
|
|||||||||||||||
| Share capital |
Net Investment/ Share Premium |
Retained earnings |
Translation differences |
Cash flow hedge |
Stock-based compensation |
Total equity |
||||||||||||||||||||||
| Balance at January 1, 2015 |
48 | 639,435 | (102,811 | ) | (71,750 | ) | (640 | ) | 584 | 464,866 | ||||||||||||||||||
|
|
|
|
|
|
|
|
|
|
|
|
|
|
|
|||||||||||||||
| Comprehensive income/loss for the period |
— | — | 43,744 | (112,242 | ) | 16,986 | — | (51,512 | ) | |||||||||||||||||||
| Loss for the period |
— | — | 43,744 | — | — | — | 43,744 | |||||||||||||||||||||
| Other comprehensive income/(loss) |
— | — | — | (112,242 | ) | 16,986 | — | (95,256 | ) | |||||||||||||||||||
| Stock-based compensation (Note 8) |
— | — | — | — | — | 2,321 | 2,321 | |||||||||||||||||||||
|
|
|
|
|
|
|
|
|
|
|
|
|
|
|
|||||||||||||||
| Balance at September 30, 2015 (*) |
48 | 639,435 | (59,067 | ) | (183,992 | ) | 16,346 | 2,905 | 415,675 | |||||||||||||||||||
|
|
|
|
|
|
|
|
|
|
|
|
|
|
|
|||||||||||||||
The accompanying Notes 1 to 18 are an integral part of the interim financial statements.
| (*) | unaudited |
41
Table of Contents
ATENTO S.A. AND SUBSIDIARIES
(FORMERLY ATENTO FLOATCO S.A., AND SUBSIDIARIES)
INTERIM CONSOLIDATED STATEMENTS OF CASH FLOW
For the nine months ended September 30, 2014 and 2015
(In thousands of U.S. dollars, unless otherwise indicated)
| Nine months ended September 30, | ||||||||
| 2014 | 2015 | |||||||
| (unaudited) | ||||||||
| Operating activities |
||||||||
| Profit/(loss) before tax |
(18,421 | ) | 63,429 | |||||
| Adjustments to profit/(loss): |
||||||||
| Amortization and depreciation |
91,640 | 78,838 | ||||||
| Impairment allowances |
32,678 | 925 | ||||||
| Change in provisions |
33,969 | 1,463 | ||||||
| Grants released to income |
— | (365 | ) | |||||
| Gains/(losses) on disposal of fixed assets |
139 | 506 | ||||||
| Finance income |
(13,346 | ) | (12,677 | ) | ||||
| Finance expense |
100,437 | 58,019 | ||||||
| Net exchange differences |
11,107 | (573 | ) | |||||
| Change in fair value of financial instruments |
— | (14,043 | ) | |||||
| Own work capitalized |
(413 | ) | 15 | |||||
| Other gains |
(34,478 | ) | 1,033 | |||||
|
|
|
|
|
|||||
| 221,733 | 113,141 | |||||||
| Changes in working capital: |
||||||||
| Changes in trade and other receivables |
34,832 | (98,188 | ) | |||||
| Changes in trade and other payables |
(13,586 | ) | (65 | ) | ||||
| Other assets/(payables) |
(11,252 | ) | (23,528 | ) | ||||
|
|
|
|
|
|||||
| 9,994 | (121,781 | ) | ||||||
| Other cash flow from operating activities |
||||||||
| Interest paid |
(68,396 | ) | (48,032 | ) | ||||
| Interest received |
13,346 | 15,242 | ||||||
| Income tax paid |
(15,998 | ) | (12,972 | ) | ||||
| Other payments |
(32,859 | ) | (12,300 | ) | ||||
|
|
|
|
|
|||||
| (103,907 | ) | (58,062 | ) | |||||
|
|
|
|
|
|||||
| Net cash flow from/(used in) operating activities |
109,399 | (3,273 | ) | |||||
|
|
|
|
|
|||||
| Investment activities |
||||||||
| Payments for acquisition of intangible assets |
(13,412 | ) | (15,137 | ) | ||||
| Payments for acquisition of property, plant and equipment |
(67,765 | ) | (45,556 | ) | ||||
| Payments for financial instruments |
(66,562 | ) | — | |||||
| Disposals of intangible assets |
99 | 732 | ||||||
| Disposals of property, plant and equipment |
886 | 1,631 | ||||||
| Disposals of financial instruments |
14,000 | 26,866 | ||||||
|
|
|
|
|
|||||
| Net cash flow from/(used in) investment activities |
(132,754 | ) | (31,464 | ) | ||||
|
|
|
|
|
|||||
| Financing activities |
||||||||
| Proceeds from borrowing from third parties |
70,912 | 29,239 | ||||||
| Proceeds from borrowing from group companies |
88,319 | — | ||||||
| Repayment of borrowing from third parties |
(158,992 | ) | (1,723 | ) | ||||
|
|
|
|
|
|||||
| Net cash flow from/(used in) financing activities |
239 | 27,516 | ||||||
|
|
|
|
|
|||||
| Exchange differences |
321 | (29,563 | ) | |||||
|
|
|
|
|
|||||
| Net increase/(decrease) in cash and cash equivalents |
(22,795 | ) | (36,784 | ) | ||||
|
|
|
|
|
|||||
| Cash and cash equivalents at beginning of period |
213,491 | 211,440 | ||||||
|
|
|
|
|
|||||
| Cash and cash equivalents at end of period |
190,696 | 174,656 | ||||||
|
|
|
|
|
|||||
The accompanying Notes 1 to 18 are an integral part of the interim consolidated financial statements.
42
Table of Contents
SELECTED EXPLANATORY NOTES TO THE INTERIM CONSOLIDATED FINANCIAL STATEMENTS FOR THE NINE MONTHS ENDED SEPTEMBER 30, 2015
1. COMPANY ACTIVITY AND CORPORATE INFORMATION
(a) Description of business
Atento S.A., formerly Atento Floatco S.A. (hereinafter the “Company”), and its subsidiaries (hereinafter “Atento Group”) are a group of companies that offer contact management services to their clients throughout the entire contract life cycle, through contact centers or multichannel platforms.
The Company was incorporated on March 5, 2014 under the laws of the Grand-Duchy of Luxembourg, with its registered office in Luxembourg at 4, Rue Lou Hemmer.
The Atento Group was acquired in 2012 by Bain Capital Partners, LLC (hereinafter “Bain Capital”). Bain Capital is a private investment fund that invests in companies with a high growth potential. Notable among its investments in the Customer Relationship Management (hereinafter “CRM”) sector is its holding in Bellsystem 24, a leader in customer service in Japan, and Genpact, the largest business management services company in the world.
In December 2012, Bain Capital reached a definitive agreement with Telefónica, S.A. for the transfer of nearly 100% of the CRM business carried out by Atento Group companies (hereinafter the “Acquisition”), the parent company of which was Atento Inversiones y Teleservicios, S.A. (hereinafter “AIT”). The Venezuela based subsidiaries of the group headed by AIT, and AIT, except for some specific assets and liabilities, were not included in the Acquisition. Control was transferred for the purposes of creating the consolidated Atento Group on December 1, 2012. Until that time, the Company had been idle and the consolidated Atento Group did not exist. For this reason, these consolidated financial statements are presented since December 1, 2012, date the Atento Group was incorporated.
Note 3t of the annual financial statements contains a list of the companies which make up the Atento Group, as well as pertinent information thereon.
The majority direct shareholder of the Company is a company incorporated under the laws of the Grand-Duchy of Luxembourg, ATALAYA Luxco PIKCo, S.C.A. (Luxembourg).
The Company’s corporate purpose is to hold business stakes of any kind in companies in Luxembourg and abroad, purchase and sell, subscribe or any other format, and transfer through sale, swap or otherwise of securities of any kind, and administration, management, control and development of the investment portfolio.
The Company may also act as the guarantor of loans and securities, as well as assisting companies in which it holds direct or indirect interests or that form part of its group. The Company may secure funds, with the exception of public offerings, through any kind of lending, or through the issuance of bonds, securities or debt instruments in general.
The Company may also carry on any commercial, industrial, financial, real estate business or intellectual property related activity that it deems necessary to meet the aforementioned corporate purposes.
The corporate purpose of its subsidiaries, with the exception of the intermediate holding companies, is to establish, manage and operate Customer Relationship Management (“CRM”) centers through multichannel platforms; provide telemarketing, marketing and “call center” services through service agencies or in any other format currently existing or which may be developed in the future by the Atento Group; provide telecommunications, logistics, telecommunications system management, data transmission, processing and internet services and to promote new technologies in these areas; offer consultancy and advisory services to clients in all areas in connection with telecommunications, processing, integration systems and new technologies, and other services related to the above. Atento S.A. trades (under “ATTO”) on NYSE since October 3, 2014.
(b) Atento S.A. reorganization transaction
Atento S.A. was formed as a direct subsidiary of Atalaya Luxco Topco S.C.A. (“Topco”). In April 2014, Topco also incorporated Atalaya Luxco PIKCo S.C.A. (“PikCo”) and on May 15, 2014 Topco contributed to PikCo: (i) all of its equity interests in its then direct subsidiary, Atalaya Luxco Midco S.à.r.l. (“Midco”), the consideration for which was an allocation to PikCo’s account “capital contributions not remunerated by shares” (the “Reserve Account”) equal to €2 million, resulting in Midco becoming a direct subsidiary of PikCo; and (ii) all of its debt interests in Midco (comprising three series of Preferred Equity Certificates (the “Original Luxco PECs”)), the consideration for which was the issuance by PikCo to Topco of Preferred Equity Certificates having an equivalent value. On May 30, 2014, Midco authorized the issuance of, and PikCo subscribed for, a fourth series of Preferred Equity Certificates (referred to, together with the Original Luxco PECs, as the “Luxco PECs”.
43
Table of Contents
In October 2014, in connection with the completion of Atento S.A.’s initial public offering (the “IPO”) in October 2014, Topco transferred its entire interest in Midco (€31,000 of share capital) to PikCo, the consideration for which was an allocation of €31,000 to PikCo’s Reserve Account. PikCo then contributed all of the Luxco PECs to Midco (the “Contribution”), the consideration for which was an allocation to Midco’s Reserve Account equal to the value of the Luxco PECs immediately prior to the Contribution. The Luxco PECs amounted to €460.0 million (approx. 576.2 million of U.S. dollars as at the capitalization date on October 3). Upon completion of the Contribution, the Luxco PECs were capitalized by Midco. PikCo then transferred the remainder of its interest in Midco (€12,500 of share capital) to Atento S.A., in consideration for which Atento S.A. issued two new shares of its capital stock to PikCo. The difference between the nominal value of these shares and the value of Midco’s net equity was allocated to Atento S.A.’s share premium account. As a result of this transfer, Midco became a direct subsidiary of the Company. The Company completed a share split (the “Share Split”) whereby it issued 2,219.212 ordinary shares for each ordinary share outstanding. This entire process is collectively referred to as the “Reorganization Transaction”.
On October 7, 2014, we closed our IPO and issued 4,819,511 ordinary shares without nominal value at a price to the public of $15.00 per share, representing proceeds of 72,293 thousand U.S. dollars. Giving effect to the completion of the IPO, Atento S.A. has 73,619,511 ordinary shares outstanding and owns 100% of the issued and outstanding share capital of Midco, as of November 9, 2015.
Pursuant to the Reorganization Transaction, Midco became a wholly-owned subsidiary of Atento S.A., a newly-formed company incorporated under the laws of Luxembourg with assets and liabilities for the purpose of facilitating the IPO, and which did not conduct any operations prior to the completion of the IPO. Following the Reorganization Transaction and the IPO, the financial statements present the consolidated results of Midco’s operations. The consolidated financial statements of Midco are substantially the same as the consolidated financial statements of the Atento S.A. prior to the IPO, adjusted to reflect the Reorganization Transaction. Upon consummation, the Reorganization Transaction was retroactively reflected in Atento’s earnings per share calculations.
The net proceeds of the IPO, together with cash on hand, were used to repay the entire outstanding amount due under the Vendor Loan Note issued to an affiliate of Telefónica in connection with the Acquisition, of which €23.3 million (29.5 million U.S. dollars at the exchange rate prevailing as at October 7, 2014) and to pay fees and expenses incurred in connection with the IPO, including fees payable to Bain Capital Partners, LLC (“Bain”), totaling 24.5 million U.S. dollars.
On August 4, 2015, the Board approved a share capital increase in the amount of EUR 59.30 through the issuance of 131,620 shares, each with an accounting par value of EUR 0.0004506. Therefore, the share capital increased from EUR 33,173.72 to EUR 33,233.02.
(c) Divestment transaction
On December 9, 2014, Atento S.A. through its indirect subsidiary, Atento Spain Holdco, S.L.U., a sole-shareholder subsidiary of Atento Luxco 1, S.A. has entered into an agreement with the Italian company COMDATA S.P.A., for the sale of the 100% of the share capital of ATENTO CESKÁ REPUBLIKA S.A., which owns our operations in the Czech Republic. The transaction did not have a material impact. This divestment was not considered as a discontinued operation under IFRS 5 because it is not a relevant geographical area. The consolidation of this operation, in the financial statements of Atento S.A. occurred until November 30, 2014.
(d) Acquisition transaction
On December 30, 2014, the Company, through its wholly owned subsidiary Atento Brasil S.A. acquired 100% of the share capital of Casa Bahia Contact Center Ltda. (“CBCC”), a call center services provider located in Brazil. As a result of the acquisition, the Atento Group is expected to strengthen its presence in the Brazilian market. At December 30, 2014, this company has been renamed Atento Brasil 1, Ltda. On July 1, 2015, CBCC was incorporated in Atento Brazil, see Note 18.
2. BASIS OF PRESENTATION OF THE INTERIM CONSOLIDATED FINANCIAL STATEMENTS
The interim consolidated financial statements as of and for the nine months ended September 30, 2015 (the “interim financial statements”) have been prepared in accordance with International Accounting Standard (IAS) 34 “Interim Financial Reporting”. Therefore, they do not contain all the information and disclosures required in a complete annual consolidated financial statements and, for adequate interpretation, should be read in conjunction with the Atento Group’s consolidated annual financial statements for the year ended December 31, 2014.
The figures in these interim consolidated financial statements are expressed in thousands of dollars, unless indicated otherwise. U.S. Dollar is the Atento Group’s presentation currency.
44
Table of Contents
These interim financial consolidated statements have been prepared on a historical cost basis, except for derivative financial instruments and Contingent Value Instruments (see Note 10), which have been measured at fair value.
3. COMPARATIVE INFORMATION
Comparative information in the interim consolidated financial statements refer to the nine months period ended September 30, 2014 and 2015, except for the statement of financial position, which compares information as of September 30, 2015, and December 31, 2014.
During the nine months ended September 30, 2015 there have not been any changes in the consolidation scope.
3.1. Reclassification of prior periods
3.1.1. Income Statements and Statements of Cash Flow
A reclassification was made in the Income Statements and the Statements of Cash Flow for the purpose of best presentation of the financial result. The reclassification refers to the exchange net impact on the fair value of derivatives and it is demonstrated below:
Income Statements
| Nine months ended September 30, 2014 | ||||||||||||
| Disclosed | Reclassification | Adjusted balance |
||||||||||
| Finance income |
28,345 | (14,999 | ) | 13,346 | ||||||||
| Finance costs |
(108,138 | ) | 7,701 | (100,437 | ) | |||||||
| Net foreign exchange gains/(loss) |
(18,405 | ) | 7,298 | (11,107 | ) | |||||||
|
|
|
|
|
|
|
|||||||
| Total |
(98,198 | ) | — | (98,198 | ) | |||||||
Cash Flow
| Nine months ended September 30, 2014 | ||||||||||||
| Disclosed | Reclassification | Adjusted balance |
||||||||||
| Gains/(losses) on disposal of financial assets |
1,001 | (1,001 | ) | — | ||||||||
| Finance income |
(13,346 | ) | — | (13,346 | ) | |||||||
| Finance expense |
99,404 | 1,033 | 100,437 | |||||||||
| Net exchange differences |
18,405 | (7,298 | ) | 11,107 | ||||||||
| Change in fair value of financial instruments |
(7,266 | ) | 7,266 | — | ||||||||
|
|
|
|
|
|
|
|||||||
| Total |
98,198 | — | 98,198 | |||||||||
4. ACCOUNTING POLICIES
The accounting policies adopted in the preparation of the interim financial statements for the nine months ended September 30, 2015 are consistent with those followed in the preparation of the consolidated annual financial statements for the year ended December 31, 2014. Except for:
| 1) | Change in Functional Currency: The functional currency of Luxco 1 S.A. (Luxembourg) changed from Euro to U.S. dollar in 2015 due to a reorganization of the group and issuance of shares on IPO in the U.S. in the last quarter of 2014, which increased exposure of the Company to the U.S. economic environment, such as for dividend receipt and distribution obligations and U.S. dollar loans. |
| 2) | Derivative financial instruments and hedging activities: derivative financial instruments are initially recognized at fair value on the date on which they are contractually arranged and are subsequently re-measured at their fair value at each reporting date. The method of recognizing the resulting gain or loss depends on whether the derivative is designated as a hedging instrument, and if so, the nature of the item being hedged. |
45
Table of Contents
The Atento Group designates certain derivatives as either:
| • | hedges of a particular risk associated with a recognized asset or liability or a highly probable forecast transaction (cash flow hedge); or |
| • | hedges of a net investment in a foreign operation (net investment hedge). |
At the inception of the hedge, the Atento Group documents the relationship between the hedging instruments and the hedged items, as well as the risk management objectives and the strategy for groups of hedges. The Atento Group also documents its assessment, both at the inception of the hedge and throughout the term thereof, of whether the derivatives used are highly effective at offsetting changes in the fair value or cash flow of the hedged items.
The fair values of various derivative instruments used for hedging purposes are disclosed in Note 10. Movements on the hedging reserve in other comprehensive income are shown in Note 8. The full fair value of a hedging derivative is classified as a non-current asset or liability, as applicable, if the remaining maturity of the hedged item exceeds twelve months; otherwise it is classified as a current asset or liability.
(i) Cash flow hedges
The effective portion of the fair value of derivatives designated and classified as cash flow hedges is recognized in equity. Gains or losses in respect of the ineffective portion are taken to the income statement as incurred.
Amounts accumulated in equity are reclassified to the income statement in the periods in which the hedged item affects profit or loss.
When a hedging instrument matures or is sold, or when the requirements for hedge accounting are no longer met, any gain or loss accumulated in equity up until that moment remains in equity until the forecast transaction is definitively recognized in the income statement.
(ii) Net investment hedge
Hedges of net investments in foreign operations are accounted similarly to cash flow hedges.
Any gain or loss on the hedging instrument relating to the effective portion of the hedge is recognized in other comprehensive income. The gain or loss relating to the ineffective portion is recognized in the income statement. Gains and losses accumulated in equity are included in the income statement when the foreign operation is partially disposed of or sold.
(iii) Derivatives which are not considered as hedging instruments
Variations in the fair value of derivative financial instruments that are not considered as hedging derivatives are recorded in the income statement.
| a) | New and amended standards and interpretations |
There are no new standards and interpretations published by the IASB other than those presented in the consolidated annual financial statements for the year ended December 31, 2014.
| b) | Standards and interpretations published by the IASB, but not yet applicable in this period |
At the date of publication of these interim financial statements, the following standards and amendments had been issued by the IASB, but its application was not mandatory for adoption before their effective date:
| • | Amendments to IAS 16 and IAS 38, “Clarification of Acceptable Methods of Depreciation and Amortization”—effective for annual periods beginning on or after January 1, 2016. |
| • | Annual Improvements to IFRS 2012-2014 Cycle—effective for annual periods beginning on or after January 1, 2016. |
| • | IFRS 15, “Revenue from Contracts with Customers”—effective for annual periods beginning on or after July 1, 2017. |
| • | IFRS 9, “Financial Instruments”—effective for annual periods beginning on or after January 1, 2018. |
The Atento Group is currently assessing the impact of the application of these standards and amendments. Pursuant to the analyses conducted to date, the Atento Group estimates that the application of these amendments will not have a material impact on the Group consolidated financial statements in the period of its initial application.
46
Table of Contents
5. MANAGEMENT OF FINANCIAL RISK
5.1 Financial risk factors
The Atento Group’s activities are exposed to the following financial risks: market risk (including currency risk, interest rate risk and country risk), credit risk and liquidity risk. The Atento Group’s global risk management policy aims to minimize the potential adverse effects of these risks on the Atento Group’s financial returns. The Atento Group also uses derivative financial instruments to hedge certain risk exposures.
These unaudited interim financial statements do not include all financial risk management information and disclosures required in the annual financial statements and therefore they should be read in conjunction with the Atento Group’s annual financial statements as of and for the year ended December 31, 2014. During the nine months ended September 30, 2015 there have not been changes in any risk management policies.
Country Risk
To manage or mitigate country risk, we repatriate the funds generated in the America and Brazil that are not required for the pursuit of new business opportunities in the region and subject to the restrictions of our financing agreements. The capital structure of the Atento Group comprises two separate ring-fenced financings: (i) the Brazilian Debenture and (ii) the 300,000 thousand U.S. dollars 7.375% Senior Secured Notes due 2020, together with the €50,000 thousand (56,016 thousand U.S. dollars as of September 30, 2015) in Revolving Credit Facility.
The object of combining a Brazilian term loan with a USD bond is to create a natural hedge for the interest payments on the Brazilian loan, which are serviced with cash flow from Atento Brazil, denominated in Brazilian Reais.
Argentinean subsidiaries are not party to these two separate ring-fenced financings, and we do not rely on cash flows from these operations to serve our debt commitments entered into in connection with the Acquisition.
Interest Rate Risk
Interest rate risk arises mainly as a result of changes in interest rates which affect: finance costs of debt bearing interest at variable rates (or short-term maturity debt expected to be renewed), as a result of fluctuations in interest rates, and the value of non-current liabilities that bear interest at fixed rates. Our exposure to interest rate risk arises principally from interest on our indebtedness. As of September 30, 2015, we had total consolidated indebtedness of 572,566 thousand U.S. dollars, of which approximately 40.5% (excluding CVIs and the effect of financial derivative instruments) bears interest at variable rates. As of December 31, 2014, we had total consolidated indebtedness of 653,310 thousand U.S. dollars, of which approximately 48.0% (excluding CVIs and the effect of financial derivative instruments) bears interest at variable rates.
As of September 30, 2015, the estimated fair value of the interest rate hedging instruments related to the Brazilian Debentures totaled 11,628 thousand U.S. dollars, which was recorded as a financial asset. Based on our total indebtedness of 572,566 thousand U.S. dollars as of September 30, 2015 and not taking into account the impact of our interest rate hedging instruments referred to above, a 1% change in interest rates would impact our net interest expense by 1,835 thousand U.S. dollars.
As of December 31, 2014, the estimated fair value of the interest rate hedging instruments related to the Brazilian Debentures totaled 10,916 thousand U.S. dollars, which was recorded as a financial asset. Based on our total indebtedness of 653,310 thousand U.S. dollars as of December 31, 2014 and not taking into account the impact of our interest rate hedging instruments referred to above, a 1% change in interest rates would impact our net interest expense by 3,241 thousand U.S. dollars.
Foreign Currency Risk
Our exposure to market risk arises principally from exchange rate risk. While the U.S. dollar is our reporting currency, approximately 96.0% of our revenue for the nine months period ended September 30, 2015 was generated in local currencies other
47
Table of Contents
than the U.S. dollar. In addition to the U.S. dollar, we also generate significant revenues in Brazilian reais, Euros and Mexican pesos. The exchange rates among the U.S. dollar and these local currencies have changed substantially in recent years and may fluctuate substantially in the future. Our exchange rate risk arises from our local currency revenues, receivables and payables. We benefit to a certain degree from the fact that the revenue we collect in each country, in which we have operations, is generally denominated in the same currency as the majority of the expenses we incur in earning this revenue.
In accordance with our risk management policy, whenever we deem it appropriate, we manage foreign currency risk by using derivatives to hedge any debts incurred in currencies other than those of the countries where the companies taking on the debt are domiciled.
Upon closing of the Senior Secured Notes issued in U.S. dollars, we entered into cross-currency swaps pursuant to which we exchanged an amount of U.S. dollars equal to the face amount of the Senior Secured Notes for an amount of Euro, Mexican Pesos, Colombian Pesos and Peruvian Soles. The Company designated these cross-currency swaps as a hedging instrument in a net investment hedging relationship. As at September 30, 2015, the estimated net fair value of the hedge instruments related to the cross-currency swaps entered into to hedge the net investment totaled an asset of 52,471 thousand U.S. dollars (asset of 20,155 thousand U.S. dollars, as of December 31, 2014), of which 300 thousand U.S. dollars (1,193 thousand U.S. dollars as of December 31, 2014) was recorded as Derivative Financial Instruments - non-current liability and 52,771 thousand U.S. dollars (21,349 thousand U.S. dollars as of December 31, 2014) was recorded as Derivative Financial Instruments - non-current assets.
Credit Risk
Financial instruments that potentially subject us to credit risk consist mainly of accounts receivable, cash and cash equivalents, and long-term financial assets. Our maximum exposure to credit risk on financial assets is the carrying amount of said assets. Our commercial credit risk management approach is based on continuous monitoring of the risk assumed and the financial resources necessary to manage our various units, in order to optimize the risk-reward relationship in the development and implementation of the business plans of our various units in their ordinary management. Accounts receivable are typically unsecured and are derived from revenue earned from clients primarily in Latin America and EMEA. Additionally, we carry out significant transactions with the Telefónica Group. At September 30, 2015, accounts receivable from the Telefónica Group amounted to 213,692 thousand U.S. dollars (236,950 thousand U.S. dollars as of December 31, 2014).
Credit risk arising from cash and cash equivalents is managed by placing cash surpluses in high quality and highly liquid money-market assets. These placements are regulated by a master agreement revised annually on the basis of conditions prevailing in the markets and the countries where we operate. The master agreement establishes: (i) the maximum amounts to be invested per counterparty, based on their ratings (long- and short-term debt rating); (ii) the maximum period of the investment; and (iii) the instruments in which the surpluses may be invested.
Liquidity Risk
The Atento Group seeks to match its debt maturity schedule to its capacity to generate cash flow to meet the payments falling due, factoring in a degree of cushion. In practice, this has meant that the Atento Group’s average debt maturity must be longer than the length of time we require to generate cash flows to pay our debt (assuming that internal projections are met).
At September 30, 2015, the average term to maturity of our debt with third parties (572,566 thousand U.S. dollars) was 3.9 years. In addition, we had current assets of 642,034 thousand U.S. dollars at such date, which includes cash and cash equivalents of 174,656 thousand U.S. dollars, of which 10,374 thousand U.S. dollars are located in Argentina and subject to restrictions on our ability to transfer them out of the country.
At December 31, 2014, the average term to maturity of our debt with third parties (653,310 thousand U.S. dollars) was 4.6 years. In addition, we had current assets of 715,761 thousand U.S. dollars at such date, which includes short term financial investments of 26,894 thousand U.S. dollars and cash and cash equivalents of 211,440 thousand U.S. dollars, of which 8,048 thousand U.S. dollars were located in Argentina and subject to restrictions on our ability to transfer them out of the country.
Capital Management
48
Table of Contents
Our capital management goal is to determine the financial resources necessary to continue our recurring activities and maintain a capital structure that optimizes own and borrowed funds. Additionally, we set an optimal debt level in order to maintain a flexible and comfortable medium-term borrowing structure in order to carry out our routine activities under normal conditions and to address new opportunities for growth. We strive to maintain debt levels in line with forecasted future cash flows and with quantitative restrictions imposed under financing contracts.
In addition to these general guidelines, we take into account other considerations and specifics when determining our financial structure, such as country risk, tax efficiency and volatility in cash flow generation.
At the date of these interim financial statements, we are compliant with the terms of covenants established in our financing contracts. In order to monitor our compliance with our financing contracts (covenants), we regularly monitor figures for net financial debt with third parties and EBITDA.
5.2 Fair value estimation
The table below shows an analysis of the financial instruments measured at fair value, classified according to the valuation method used. The Atento Group has defined the following valuation levels:
Prices (unadjusted) quoted in active markets for identical assets and liabilities (Level 1).
Data other than the Level 1 quoted price that are observable for the asset or liability, either directly (i.e. prices) or indirectly (i.e. price derivatives) (Level 2).
Data for the asset or liability that are not based on observable market data (Level 3).
The Atento Group’s assets and liabilities measured at fair value as of December 31, 2014 and September 30, 2015 are as follow:
| Thousands of U.S. dollars | ||||||||||||||||
| December 31, 2014 (audited) |
Level 1 | Level 2 | Level 3 | Total balance | ||||||||||||
| Assets |
||||||||||||||||
| Derivatives |
— | 32,265 | — | 32,265 | ||||||||||||
|
|
|
|
|
|
|
|
|
|||||||||
| Total assets |
— | 32,265 | — | 32,265 | ||||||||||||
|
|
|
|
|
|
|
|
|
|||||||||
| Liabilities |
||||||||||||||||
| Derivatives |
— | (1,193 | ) | — | (1,193 | ) | ||||||||||
| CVIs |
— | — | (36,379 | ) | (36,379 | ) | ||||||||||
|
|
|
|
|
|
|
|
|
|||||||||
| Total liabilities |
— | (1,193 | ) | (36,379 | ) | (37,572 | ) | |||||||||
|
|
|
|
|
|
|
|
|
|||||||||
| Thousands of U.S. dollars | ||||||||||||||||
| September 30, 2015 (unaudited) |
Level 1 | Level 2 | Level 3 | Total balance | ||||||||||||
| Assets |
||||||||||||||||
| Derivatives |
— | 64,399 | — | 64,399 | ||||||||||||
|
|
|
|
|
|
|
|
|
|||||||||
| Total assets |
— | 64,399 | — | 64,399 | ||||||||||||
|
|
|
|
|
|
|
|
|
|||||||||
| Liabilities |
||||||||||||||||
| Derivatives |
— | (300 | ) | — | (300 | ) | ||||||||||
| CVIs |
— | — | (35,492 | ) | (35,492 | ) | ||||||||||
|
|
|
|
|
|
|
|
|
|||||||||
| Total liabilities |
— | (300 | ) | (35,492 | ) | (35,792 | ) | |||||||||
|
|
|
|
|
|
|
|
|
|||||||||
There were no transfers between the different levels during the period.
49
Table of Contents
The following table reflects the movements of the Atento Group’s Contingent Value Instruments (“CVI”) measured at fair value using significant unobservable inputs for the nine months ended September 30, 2015:
| Thousands of U.S. dollars | ||||
| Fair value as of December 31, 2014 (audited) |
(36,379 | ) | ||
| Change in Fair Value |
(4,319 | ) | ||
| Translation differences |
5,206 | |||
|
|
|
|||
| Fair value as of September 30, 2015 (unaudited) |
(35,492 | ) | ||
|
|
|
|||
6. SEGMENT INFORMATION
The following tables present financial information for the Atento Group’s operating segments for the nine months ended September 30, 2014 and 2015 (in thousands U.S. dollars):
Nine months ended September 30, 2014
| (unaudited) |
EMEA | Americas | Brazil | Others and eliminations |
Total Group | |||||||||||||||
| Sales to other companies |
99,298 | 303,861 | 527,125 | — | 930,284 | |||||||||||||||
| Sales to Telefónica Group |
161,400 | 272,484 | 379,096 | — | 812,980 | |||||||||||||||
| Sales to other group companies |
60 | 335 | — | (395 | ) | — | ||||||||||||||
| Other operating income and expense |
(293,762 | ) | (496,392 | ) | (791,159 | ) | 9,466 | (1,571,847 | ) | |||||||||||
| EBITDA |
(33,004 | ) | 80,288 | 115,062 | 9,071 | 171,417 | ||||||||||||||
| Depreciation and amortization |
(16,185 | ) | (32,459 | ) | (42,198 | ) | (798 | ) | (91,640 | ) | ||||||||||
| Operating profit |
(49,189 | ) | 47,829 | 72,864 | 8,273 | 79,777 | ||||||||||||||
| Financial results |
(10,265 | ) | (9,388 | ) | (36,396 | ) | (42,149 | ) | (98,198 | ) | ||||||||||
| Income tax |
17,374 | (14,360 | ) | (12,452 | ) | 11,558 | 2,120 | |||||||||||||
| Profit/(loss) for the period |
(42,080 | ) | 24,081 | 24,016 | (22,318 | ) | (16,301 | ) | ||||||||||||
| EBITDA |
(33,004 | ) | 80,288 | 115,062 | 9,071 | 171,417 | ||||||||||||||
| Acquisition and integration related costs |
— | 39 | 6,820 | 821 | 7,680 | |||||||||||||||
| Restructuring costs |
17,914 | 4,788 | 287 | 824 | 23,813 | |||||||||||||||
| Sponsor management fees |
— | — | — | 7,285 | 7,285 | |||||||||||||||
| Site relocation costs |
— | — | 1,367 | — | 1,367 | |||||||||||||||
| Financing fees |
— | — | 795 | 10,365 | 11,160 | |||||||||||||||
| Asset impairments and Other |
32,502 | 85 | (596 | ) | (34,882 | ) | (2,891 | ) | ||||||||||||
| Adjusted EBITDA |
17,412 | 85,200 | 123,735 | 6,516 | 219,831 | |||||||||||||||
| Capital expenditure (as of December 31, 2014) |
2,534 | 9,703 | 28,184 | 167 | 40,588 | |||||||||||||||
| Fixed assets and intangibles (as of December 31, 2014) |
76,081 | 257,322 | 363,103 | 3,239 | 699,745 | |||||||||||||||
| Allocated assets (as of December 31, 2014) |
456,829 | 658,054 | 813,004 | (269,986 | ) | 1,657,901 | ||||||||||||||
| Allocated liabilities (as of December 31, 2014) |
312,676 | 378,782 | 611,560 | (109,983 | ) | 1,193,035 | ||||||||||||||
50
Table of Contents
Nine months ended September 30, 2015
| (unaudited) |
EMEA | Americas | Brazil | Others and eliminations |
Total Group | |||||||||||||||
| Sales to other companies |
67,521 | 302,640 | 453,553 | — | 823,714 | |||||||||||||||
| Sales to Telefónica Group |
118,173 | 281,911 | 284,027 | — | 684,111 | |||||||||||||||
| Sales to other group companies |
31 | 1,307 | — | (1,319 | ) | 19 | ||||||||||||||
| Other operating income and expense |
(178,386 | ) | (507,816 | ) | (643,488 | ) | (5,161 | ) | (1,334,851 | ) | ||||||||||
| EBITDA |
7,339 | 78,042 | 94,092 | (6,480 | ) | 172,993 | ||||||||||||||
| Depreciation and amortization |
(10,253 | ) | (29,496 | ) | (38,449 | ) | (640 | ) | (78,838 | ) | ||||||||||
| Operating profit |
(2,914 | ) | 48,546 | 55,643 | (7,120 | ) | 94,155 | |||||||||||||
| Financial results |
(8,879 | ) | (10,320 | ) | (17,677 | ) | 6,150 | (30,726 | ) | |||||||||||
| Income tax |
3,344 | (17,090 | ) | (12,153 | ) | 6,214 | (19,685 | ) | ||||||||||||
| Profit/(loss) for the period |
(8,449 | ) | 21,136 | 25,813 | 5,244 | 43,744 | ||||||||||||||
| EBITDA |
7,339 | 78,042 | 94,092 | (6,480 | ) | 172,993 | ||||||||||||||
| Acquisition and integration related costs |
— | 108 | — | — | 108 | |||||||||||||||
| Restructuring costs |
4,138 | 639 | 3,050 | — | 7,827 | |||||||||||||||
| Sponsor management fees |
— | — | — | — | — | |||||||||||||||
| Site relocation costs |
— | 27 | 499 | — | 526 | |||||||||||||||
| Financing and IPO fees |
— | — | — | 313 | 313 | |||||||||||||||
| Asset impairments and Other |
262 | 1,147 | 2,334 | 767 | 4,510 | |||||||||||||||
| Adjusted EBITDA |
11,739 | 79,963 | 99,975 | (5,400 | ) | 186,277 | ||||||||||||||
| Capital expenditure (as of September 30, 2015) |
5,173 | 25,095 | 52,467 | 407 | 83,142 | |||||||||||||||
| Fixed assets and intangibles (as of September 30, 2015) |
65,141 | 222,950 | 253,140 | 2,580 | 543,811 | |||||||||||||||
| Allocated assets (as of September 30, 2015) |
431,888 | 616,138 | 610,191 | (250,859 | ) | 1,407,358 | ||||||||||||||
| Allocated liabilities (as of September 30, 2015) |
291,210 | 345,515 | 451,529 | (96,571 | ) | 991,683 | ||||||||||||||
7. INTANGIBLE ASSETS, PROPERTY, PLANT AND EQUIPMENT AND GOODWILL
There were no changes in the context of the note, and Company’s Managements considered the variations of amounts related to the period ended September 30, 2015 in relation to the period ended December 31, 2014, not relevant, except for the acquisition of software.
At January 2, 2015, Atento Brazil S.A. entered into a Master Agreements regarding the acquisition of rights to use Microsoft Software from Software One commerce and Computer Services Ltda. (“Contractor”), in which the contractor provides Microsoft Software licenses to Atento and its affiliates in Brazil, Colombia, Corporation, El Salvador, Peru, Guatemala, Mexico and United States of America (“U.S.A.”).
Acquisition prices stated in the agreements, which will be paid in 3 (three) annual payments due on 2015, 2016 and 2017. The total amount on March 31, 2015 is 39,550 thousand U.S. dollars. The software licenses have five years useful life.
8. EQUITY ATTRIBUTABLE TO EQUITY HOLDERS OF THE PARENT
Share capital
Following the Reorganization Transaction and the IPO, our financial statements present the results of Atento’s operations. The consolidated financial statements of Atento are substantially the same as the consolidated financial statements of the Company prior to the IPO, as adjusted for the Reorganization Transaction. Upon consummation, the Reorganization Transaction was reflected retroactively in the Company’s earnings per share calculations.
51
Table of Contents
On August 4, 2015, the board members approved to increase the share capital of the Company an amount of EUR 59.30 to bring it from its of EUR 33,173.72 up to EUR 33,233.02 through the issuance of 131,620 shares, each having an accounting par value of EUR 0.0004506.
As at September 30, 2015 share capital stood at 48 thousand U.S. dollars, divided into 73,648,760 shares. Atalaya PikCo S.C.A. owns 85.1% of ordinary shares of Atento S.A. As at December 30, 2014 share capital was 48 thousand U.S. dollars, divided into 73,619,511 shares.
Share premium
The share premium refers to the difference between the subscription price that the shareholders paid for the shares and their nominal value. Since this is a capital reserve, it can only be used to increase capital, offset losses, redeem, reimburse or repurchase shares.
Legal reserve
According to commercial legislation in Luxembourg, Atento S.A. must transfer 5% of its year profits to a legal a reserve until the amount reaches 10% of share capital. The legal reserve cannot be distributed.
As of December 31, 2014 and September 30, 2015, no legal reserve had been established, mainly due to the losses incurred by Atento S.A.
Retained earnings
Movements in retained earnings during the nine months ended September 30, 2015 are as follow:
| Thousands of U.S. dollars | ||||
| At December 31, 2014 (audited) |
(102,811 | ) | ||
| Result for the period |
43,744 | |||
|
|
|
|||
| At September 30, 2015 (unaudited) |
(60,695 | ) | ||
|
|
|
|||
Translation differences
Translation differences reflect the differences arising on account of exchange rate fluctuations when converting the net assets of fully consolidated foreign companies from local currency into Atento Group’s presentation currency (U.S. dollars) by the full consolidation method.
As mentioned on Note 4, Atento Luxco 1 S.A. (Luxembourg) changed its functional currency from Euro to U.S. dollar, starting on 2015.
Stock-based compensation
a) Description of share-based payment arrangements
In the year of 2014, Atento granted two share-based payments to directors, officers and other employees, for the Company and its subsidiaries. The share-based payments are Time Restricted Stock Units (“RSU”) and Performance RSU. A reference is made to the annual financial statements for December 31, 2014, for a description of the arrangement and their vesting conditions.
b) Measurement of fair value
The fair value of the RSUs, for both arrangements, has been measured using the Black-Scholes model. As both programs are equity settled, fair value of the RSUs is measured at grant date and not remeasured subsequently. For the inputs used in the Black-Scholes model, a reference is made to the annual financial statements.
52
Table of Contents
c) Outstanding RSUs
As at September 30, 2015, there are 251,017 Time RSUs outstanding and 889,235 Performance RSUs outstanding. Holders of RSUs will receive the equivalent in shares of Atento S.A. without cash settlement of stock values when the RSUs vest.
| Time RSU | Performance RSU |
|||||||
| Outstanding December 31, 2014 |
256,134 | 931,189 | ||||||
| Forfeited |
(5,117 | ) | (41,954 | ) | ||||
|
|
|
|
|
|||||
| Outstanding September 30, 2015 |
251,017 | 889,235 | ||||||
|
|
|
|
|
|||||
d) Expense recognized in Profit or Loss
In the nine months ended of September 30, 2015, 2,316 thousand U.S. dollars related to stock-based compensation were recorded as Personnel expenses - Stock-based compensation.
Cash Flow Hedge
Movements in valuation adjustments in the nine months ended September 30, 2015 were as follow:
| Thousands of U.S. dollars |
||||
| At December 31, 2014 (audited) |
(640 | ) | ||
| Cash flow hedges |
16,986 | |||
|
|
|
|||
| At September 30, 2015 (unaudited) |
16,346 | |||
|
|
|
|||
Refer to Note 10. Financial liabilities - Derivatives for further details.
9. FINANCIAL ASSETS
The breakdown of the Company’s financial assets by category as of December 31, 2014 and September 30, 2015 is as follow:
| Thousands of U.S. dollars | ||||||||||||
| December 31, 2014 (audited) |
Loans and receivables | Derivatives | Total | |||||||||
| Trade and other receivables |
10,503 | — | 10,503 | |||||||||
| Other financial assets |
44,639 | — | 44,639 | |||||||||
| Financial derivative instruments (Note 10) |
— | 32,265 | 32,265 | |||||||||
|
|
|
|
|
|
|
|||||||
| Non-current financial assets |
55,142 | 32,265 | 87,407 | |||||||||
|
|
|
|
|
|
|
|||||||
| Trade and other receivables (*) |
447,683 | — | 447,683 | |||||||||
| Other financial assets |
28,562 | — | 28,562 | |||||||||
| Cash and cash equivalents |
211,440 | — | 211,440 | |||||||||
|
|
|
|
|
|
|
|||||||
| Current financial assets |
687,685 | — | 687,685 | |||||||||
|
|
|
|
|
|
|
|||||||
| TOTAL FINANCIAL ASSETS |
742,827 | 32,265 | 775,092 | |||||||||
|
|
|
|
|
|
|
|||||||
| (*) | Excluding advance payments and non-financial assets. |
53
Table of Contents
| Thousands of U.S. dollars | ||||||||||||
| September 30, 2015 (unaudited) |
Loans and receivables | Derivatives | Total | |||||||||
| Trade and other receivables (*) |
5,716 | — | 5,716 | |||||||||
| Other financial assets |
38,756 | — | 38,756 | |||||||||
| Financial derivative instruments (Note 10) |
— | 64,399 | 64,399 | |||||||||
|
|
|
|
|
|
|
|||||||
| Non-current financial assets |
44,472 | 64,399 | 108,871 | |||||||||
|
|
|
|
|
|
|
|||||||
| Trade and other receivables (*) |
435,581 | — | 435,581 | |||||||||
| Other financial assets |
1,412 | — | 1,412 | |||||||||
| Cash and cash equivalents |
174,656 | — | 174,656 | |||||||||
|
|
|
|
|
|
|
|||||||
| Current financial assets |
611,649 | — | 611,649 | |||||||||
|
|
|
|
|
|
|
|||||||
| TOTAL FINANCIAL ASSETS |
656,121 | 64,399 | 720,520 | |||||||||
|
|
|
|
|
|
|
|||||||
| (*) | Excluding advance payments and non-financial assets. |
As at September 30, 2015, Atento Teleservicios España S.A., Atento Chile S.A. and Atento Brasil S.A. have entered into factoring agreements without recourse, whose anticipated value was 61.8 million U.S. dollars, and as a consequence of this, the related trade receivables were written off.
Details of other financial assets as of December 31, 2014 and September 30, 2015 are as follow:
| Thousands of U.S. dollars | ||||||||
| 12/31/2014 (audited) |
09/30/2015 (unaudited) |
|||||||
| Other non-current receivables |
5 | 7,595 | ||||||
| Non-current guarantees and deposits |
44,634 | 31,161 | ||||||
|
|
|
|
|
|||||
| Total non-current |
44,639 | 38,756 | ||||||
|
|
|
|
|
|||||
| Other current receivables |
27,782 | 662 | ||||||
| Current guarantees and deposits |
780 | 750 | ||||||
|
|
|
|
|
|||||
| Total current |
28,562 | 1,412 | ||||||
|
|
|
|
|
|||||
| Total |
73,201 | 40,168 | ||||||
|
|
|
|
|
|||||
“Guarantees and deposits” as of December 31, 2014 and September 30, 2015 primarily comprise deposits posted with the courts in respect of legal disputes with employees of the subsidiary Atento Brasil, S.A. and for litigation underway with the Brazilian social security authority (Instituto Nacional do Seguro Social).
“Other current receivables” comprised short term financial investments held by the subsidiary Atento Brasil, S.A. In 2015, the subsidiary Atento Brasil S.A. redeemed the total amount of the short term investment.
54
Table of Contents
The breakdown of “Trade and other receivables” as of December 31, 2014 and September 30, 2015 is as follow:
| Thousands of U.S. dollars | ||||||||
| 12/31/2014 (audited) |
09/30/2015 (unaudited) |
|||||||
| Non-current trade receivables |
10,503 | 5,716 | ||||||
|
|
|
|
|
|||||
| Total non-current |
10,503 | 5,716 | ||||||
|
|
|
|
|
|||||
| Current trade receivables |
424,395 | 412,683 | ||||||
| Other receivables |
9,978 | 12,875 | ||||||
| Prepayments |
3,711 | 6,290 | ||||||
| Personnel |
13,310 | 10,023 | ||||||
|
|
|
|
|
|||||
| Total current |
451,394 | 441,871 | ||||||
|
|
|
|
|
|||||
| Total |
461,897 | 447,587 | ||||||
|
|
|
|
|
|||||
For the purpose of the interim financial statements of cash flows, cash and cash equivalents are comprised of the following:
| Thousands of U.S. dollars | ||||||||
| 12/31/2014 (audited) |
09/30/2015 (unaudited) |
|||||||
| Cash at banks |
185,024 | 139,760 | ||||||
| Cash equivalents |
26,416 | 34,896 | ||||||
|
|
|
|
|
|||||
| Total |
211,440 | 174,656 | ||||||
|
|
|
|
|
|||||
“Cash equivalents” comprises short-term fixed-income securities in Brazil, which mature in less than 90 days and accrue interest pegged to the CDI.
10. FINANCIAL LIABILITIES
The breakdown of the Company’s financial liabilities by category as of December 31, 2014 and September 30, 2015 is as follow:
| Thousands of U.S. dollars | ||||||||||||||||
| December 31, 2014 (audited) |
Liabilities through profit and loss |
Derivatives | Other financial liabilities at amortized cost |
Total | ||||||||||||
| Debentures and bonds |
— | — | 534,988 | 534,988 | ||||||||||||
| Bank borrowings |
— | — | 60,919 | 60,919 | ||||||||||||
| Finance lease payables |
— | — | 4,263 | 4,263 | ||||||||||||
| CVIs |
36,379 | — | — | 36,379 | ||||||||||||
| Derivative financial instruments |
— | 1,193 | — | 1,193 | ||||||||||||
| Trade and other payable (*) |
— | — | 560 | 560 | ||||||||||||
|
|
|
|
|
|
|
|
|
|||||||||
| Non-current financial liabilities |
36,379 | 1,193 | 600,730 | 638,302 | ||||||||||||
|
|
|
|
|
|
|
|
|
|||||||||
| Debentures and bonds |
— | — | 11,213 | 11,213 | ||||||||||||
| Bank borrowings |
— | — | 801 | 801 | ||||||||||||
| Finance lease payables |
— | — | 4,747 | 4,747 | ||||||||||||
| Trade and other payables (*) |
— | — | 255,558 | 255,558 | ||||||||||||
|
|
|
|
|
|
|
|
|
|||||||||
| Current financial liabilities |
— | — | 272,319 | 272,319 | ||||||||||||
|
|
|
|
|
|
|
|
|
|||||||||
| TOTAL FINANCIAL LIABILITIES |
36,379 | 1,193 | 873,049 | 910,621 | ||||||||||||
|
|
|
|
|
|
|
|
|
|||||||||
| (*) | Excluding deferred income and non-financial liabilities |
55
Table of Contents
| Thousands of U.S. dollars | ||||||||||||||||
| September 30, 2015 (unaudited) |
Liabilities through profit and loss |
Derivatives | Other financial liabilities at amortized cost |
Total | ||||||||||||
| Debentures and bonds |
— | — | 455,663 | 455,663 | ||||||||||||
| Bank borrowings |
— | — | 54,224 | 54,224 | ||||||||||||
| Finance lease payables |
— | — | 2,457 | 2,457 | ||||||||||||
| CVIs |
35,492 | — | — | 35,492 | ||||||||||||
| Financial derivative instruments |
— | 300 | — | 300 | ||||||||||||
| Trade and other payables (*) |
— | — | 15,226 | 15,226 | ||||||||||||
|
|
|
|
|
|
|
|
|
|||||||||
| Non-current financial liabilities |
35,492 | 300 | 527,570 | 563,362 | ||||||||||||
|
|
|
|
|
|
|
|
|
|||||||||
| Debentures and bonds |
— | — | 12,568 | 12,568 | ||||||||||||
| Bank borrowings |
— | — | 9,931 | 9,931 | ||||||||||||
| Finance lease payables |
— | — | 2,231 | 2,231 | ||||||||||||
| Trade and other payables (*) |
— | — | 198,503 | 198,503 | ||||||||||||
|
|
|
|
|
|
|
|
|
|||||||||
| Current financial liabilities |
— | — | 223,233 | 223,233 | ||||||||||||
|
|
|
|
|
|
|
|
|
|||||||||
| TOTAL FINANCIAL LIABILITIES |
35,492 | 300 | 750,803 | 786,595 | ||||||||||||
|
|
|
|
|
|
|
|
|
|||||||||
| (*) | Excluding deferred income and non-financial liabilities |
Interest-bearing debt as of December 31, 2014 and September 30, 2015 is as follow:
| Thousands of U.S. dollars | ||||||||
| 12/31/2014 | 09/30/2015 | |||||||
| (audited) | (unaudited) | |||||||
| Senior Secured Notes |
290,927 | 292,049 | ||||||
| Brazilian bonds – Debentures |
244,061 | 163,614 | ||||||
| Bank borrowings |
60,919 | 54,224 | ||||||
| CVIs |
36,379 | 35,492 | ||||||
| Finance lease payables |
4,263 | 2,457 | ||||||
|
|
|
|
|
|||||
| Total non-current |
636,549 | 547,836 | ||||||
|
|
|
|
|
|||||
| Senior Secured Notes |
9,342 | 3,810 | ||||||
| Brazilian bonds – Debentures |
1,871 | 8,758 | ||||||
| Bank borrowings |
801 | 9,931 | ||||||
| Finance lease payables |
4,747 | 2,231 | ||||||
|
|
|
|
|
|||||
| Total current |
16,761 | 24,730 | ||||||
|
|
|
|
|
|||||
| TOTAL INTEREST-BEARING DEBT |
653,310 | 572,566 | ||||||
|
|
|
|
|
|||||
Debentures
There were no changes in the context of the note, and Company’s Management considers the variations of amounts related to the period ended September 30, 2015 in relation to the period ended December 31, 2014, not relevant, except for the payment of interest of 50,591 thousands of Brazilian reais (16,301 thousands of U.S. dollars) on June 11, 2015 the interest accrued in the period and the exchange rate impact.
Bank borrowings
During 2015 BNDES disbursed BRL 90.0 million (equivalent to 22.7 million of U.S. dollars as of September 30, 2015) of the credit facility granted on February 3, 2014 to the subsidiary Atento Brasil S.A. This facility is divided into five tranches in the following amounts and subject to the following interest rate:
56
Table of Contents
| Tranche |
Interest Rate |
Total Credity Facility | Drawn Balance as of September 30, 2015 |
|||||||
| Tranche A |
TJLP + 2.5% per year | BRL | 182.3 million | BRL | 158.6 million | |||||
| Tranche B |
SELIC + 2.5% per year | BRL | 45.6 million | BRL | 38.4 million | |||||
| Tranche C |
4.0% per year | BRL | 64.7 million | BRL | 54.5 million | |||||
| Tranche D |
6.0% per year | BRL | 5.3 million | BRL | 4.5 million | |||||
| Tranche E |
TJLP | BRL | 2.1 million | BRL | 0.6 million | |||||
| TOTAL |
BRL | 300 million | BRL | 251.6 million | ||||||
Atento Brasil S.A. paid interests of 3,805 thousands of Brazilian reais (1,226 thousands of U.S. dollars) in May 15, 2015 and 5,475 thousands of Brazilian reais (1,378 thousands of U.S. dollars) in August 17, 2015.
Derivatives
The derivatives instruments can be summarized and categorized as follows:
| Thousands of U.S. dollars | ||||||||||||||||
| 12/31/2014 | 9/30/2015 | |||||||||||||||
| Assets | Liabilities | Assets | Liabilities | |||||||||||||
| Interest rate swaps - cash flow hedges |
10,916 | — | 11,628 | — | ||||||||||||
| Cross-currency swaps - cash flow hedge |
3,837 | — | 52,771 | 300 | ||||||||||||
| Cross-currency swaps - that do not meet the criteria for hedge accounting |
17,512 | (1,193 | ) | — | — | |||||||||||
|
|
|
|
|
|
|
|
|
|||||||||
| Total |
32,265 | (1,193 | ) | 64,399 | 300 | |||||||||||
|
|
|
|
|
|
|
|
|
|||||||||
| Non-current portion |
32,265 | (1,193 | ) | 64,399 | 300 | |||||||||||
| Current portion |
— | — | — | — | ||||||||||||
The Atento Group has contracted interest rate swaps to hedge fluctuations in interest rates in respect of debentures issued in Brazil.
As of September 30, 2015, the notional amount of principal arrangements in the interest rate swaps equals to 553 million Brazilian reals equivalent to 139 million U.S. dollars (553 million Brazilian reals equivalent to 208 million U.S. dollars as of December 31, 2014).
As mentioned on Note 4, Atento Luxco 1 S.A. (Luxembourg) changed its functional currency from Euro to U.S. dollar, starting on 2015. As a result of this change, the U.S. dollar denominated Senior Secured Notes that was previously designed as a hedged item in a cash flow hedge relationship could no longer be designated as a hedge item for foreign currency risk. Therefore, the cash flow hedge was discontinued by the Atento Group as of January 1, 2015 and the amount recognized in OCI was released to the income statement.
As from April 1, 2015, the Company started a hedge accounting program for net investment hedge related to exchange risk between the U.S. dollar and foreign operations in Euro, Mexican Peso (MXN), Colombian Peso (COP) and Peruvian Nuevo Sol (PEN).
57
Table of Contents
As of September 30, 2015 details of cross-currency swaps that are designated and qualified as net investment hedge were as follows:
| Bank |
Maturity | Purchase currency |
Selling currency |
Notional (thousands) |
Fair value assets |
Fair value liability |
Other comprehensive income |
Income statement |
||||||||||||||||||||||||
| D/(C) | D/(C) | D/(C) | D/(C) | |||||||||||||||||||||||||||||
| Santander |
20-Jan | USD | EUR | 20,000 | 3,645 | — | 529 | (12 | ) | |||||||||||||||||||||||
| Santander |
20-Jan | USD | MXN | 11,111 | 4,579 | (45 | ) | (1,626 | ) | (42 | ) | |||||||||||||||||||||
| Goldman Sachs |
20-Jan | USD | EUR | 48,000 | 8,742 | — | 1,271 | (30 | ) | |||||||||||||||||||||||
| Goldman Sachs |
20-Jan | USD | MXN | 40,000 | 16,538 | (160 | ) | (5,847 | ) | (150 | ) | |||||||||||||||||||||
| Nomura International |
20-Jan | USD | MXN | 23,889 | 9,887 | (95 | ) | (3,491 | ) | (90 | ) | |||||||||||||||||||||
| Nomura International |
20-Jan | USD | EUR | 22,000 | 3,954 | — | 585 | (14 | ) | |||||||||||||||||||||||
| Goldman Sachs |
18-Jan | USD | PEN | 13,800 | 562 | — | (76 | ) | (3 | ) | ||||||||||||||||||||||
| BBVA |
18-Jan | USD | PEN | 55,200 | 2,260 | — | (305 | ) | (13 | ) | ||||||||||||||||||||||
| Goldman Sachs |
18-Jan | USD | COP | 7,200 | 520 | — | (152 | ) | (6 | ) | ||||||||||||||||||||||
| BBVA |
18-Jan | USD | COP | 28,800 | 2,083 | — | (609 | ) | (22 | ) | ||||||||||||||||||||||
|
|
|
|
|
|
|
|
|
|||||||||||||||||||||||||
| 52,770 | (300 | ) | (9,721 | ) | (382 | ) | ||||||||||||||||||||||||||
During the nine months ended September 30, 2015, variances in fair value of the derivative financial instruments that are not considered as hedging accounting derivatives recorded under the income statement amount to a net gain of 17,798 thousand U.S. dollars (net gain of 10,529 thousand U.S. dollars in the nine months ended September 30, 2014).
11. PROVISIONS AND CONTINGENCIES
The Atento has contingent liabilities arising from lawsuits in the normal course of its business. Contingent liabilities with a probable likelihood of loss are fully recorded as liabilities.
All changes in provisions which occurred during the first semester of 2015 are demonstrated in the table below:
| Thousands of U.S. dollars | ||||||||||||||||||||||||||||
| 12/31/2014 (audited) |
Allocation | Application | Reversals | Transfers | Translation differences |
09/30/2015 (unaudited) |
||||||||||||||||||||||
| Non-current |
||||||||||||||||||||||||||||
| Provisions for Liabilities |
56,889 | 2,371 | — | (8,225 | ) | — | (17,331 | ) | 33,704 | |||||||||||||||||||
| Provisions for taxes |
21,717 | 2,544 | — | (5,079 | ) | — | (6,983 | ) | 12,199 | |||||||||||||||||||
| Provisions for dismantling |
15,949 | 2,040 | — | — | — | (5,474 | ) | 12,515 | ||||||||||||||||||||
| Other provisions |
219 | 98 | (12 | ) | (144 | ) | — | (22 | ) | 139 | ||||||||||||||||||
|
|
|
|
|
|
|
|
|
|
|
|
|
|
|
|||||||||||||||
| Total Non-Current |
94,774 | 7,053 | (12 | ) | (13,448 | ) | — | (29,810 | ) | 58,557 | ||||||||||||||||||
|
|
|
|
|
|
|
|
|
|
|
|
|
|
|
|||||||||||||||
| Current |
||||||||||||||||||||||||||||
| Provisions for Liabilities |
6,699 | 1,856 | (607 | ) | 9 | (46 | ) | (620 | ) | 7,291 | ||||||||||||||||||
| Provisions for taxes |
946 | 44 | 1 | — | — | (72 | ) | 919 | ||||||||||||||||||||
| Provisions for dismantling |
63 | 1 | — | — | — | (21 | ) | 43 | ||||||||||||||||||||
| Other provisions |
10,801 | 3,239 | (3,889 | ) | (5,082 | ) | 46 | (929 | ) | 4,186 | ||||||||||||||||||
|
|
|
|
|
|
|
|
|
|
|
|
|
|
|
|||||||||||||||
| Total Current |
18,509 | 5,140 | (4,495 | ) | (5,073 | ) | — | (1,642 | ) | 12,439 | ||||||||||||||||||
|
|
|
|
|
|
|
|
|
|
|
|
|
|
|
|||||||||||||||
58
Table of Contents
“Provisions for liabilities” primarily relate to provisions for legal claims underway in Brazil. Atento Brasil, S.A. has made payments in escrow related to legal claims from ex-employees and the Brazilian social security authority (Instituto Nacional do Seguro Social) amounting to 41,838 thousand U.S. dollars and 28,692 thousand U.S. dollars as at December 31, 2014 and September 30, 2015, respectively.
“Provisions for taxes” mainly relates to probable contingencies in Brazil in respect to social security payments, which could be subject to various interpretations by the social security authorities in that country.
The amount recognized under “Provision for dismantling” corresponds to the necessary cost of covering the dismantling process of the installations held under operating leases for those entities contractually required to do so.
Considering the nature of contingencies, it is not possible for the Company’s Management, the estimate of the payment terms of these provisions, except those amounts recognized as current, where was considered the dates for the completion of court hearings and the stage of each lawsuit.
As of September 30, 2015, the core values of the lawsuits that are pending in the courts of each country, according to the nature of claims, can be summarized as follow:
At September 30, 2015, Atento Brasil was involved in approximately 10,569 labor-related disputes (10,022 labor disputes as of December 31, 2014), filed by Atento’s employees or ex-employees for various reasons, such as dismissals or differences over employment conditions in general. The total amount of these claims was 63,245 thousand U.S. dollars (100,863 thousand U.S. dollars in December 31, 2014), of which 30,751 thousand U.S. dollars are classified by the Company’s internal and external lawyers as probable (53,931 thousand U.S. dollars in December 31, 2014), 28,826 thousand U.S. dollars are classified as possible (38,257 thousand U.S. dollars in December 31, 2014), and 3,668 thousand U.S. dollars are classified as remote (4,996 thousand U.S. dollars in December 31, 2014).
Moreover, as of September 30, 2015 Atento Brazil was party to 10 civil public actions filed by the Labor Prosecutor’s Office due to alleged irregularities mainly concerning daily and general working routine, lack of overtime control and improper health and safety conditions in the workplace. The total amount involved in these claims was approximately BRL 68.2 million, of which BRL 2.4 million relate to claims that have been classified as probable by our internal and external lawyers, for which amount Atento Brazil has established a reserve, as indicated in paragraph above. We expect that our ultimate liability for these claims, if any, will be substantially less than the full amount claimed. These claims are generally brought with respect to specific jurisdictions in Brazil, and it is possible that in the future similar claims could be brought against us in additional jurisdictions. We cannot assure that these current claims or future claims brought against us will not result in liability to the Company, and that such liability would not have a material adverse effect on our business, financial condition and results of operations.
Atento Brasil, S.A. has 28 civil lawsuits ongoing for various reasons (26 in December 31, 2014). The total amount of these claims is approximately 2,435 thousand U.S. dollars (3,199 thousand U.S. dollars in December 31, 2014). According to the Company’s external attorneys, materialization of the risk event is possible.
In addition, at September 30, 2015 Atento Brasil, S.A. has 30 disputes ongoing with the tax authorities and social security authorities, for various reasons relating to infraction proceedings filed (29 in December 31, 2014). The total amount of these claims is approximately 24,101 thousand U.S. dollars (33,796 thousand U.S. dollars in December 31, 2014). According to the Company’s external attorneys, risk of material loss is possible.
Furthermore, it is important to stand out that the Superior Labor Court of Appeals (Tribunal Superior do Trabalho) during the month of August 2015 decided to alter the factor of indexation related to labor contingencies. The decision alter the Reference Rate Index (Taxa Referencial - TR) usually used as act of restating the amount of the contingencies to the Special Broad Consumer Price Index (Indice de Preços ao Consumidor Amplo Especial – IPCA-E). There are several questions about this matter, especially the period to which change should be applied as well as if the new index is appropriate. In addition, during October, the Supreme Court (STF) issued a “writ of Mandamus” to the Federation of Brazilian Banks (FEBRABAN) suspending the application of the new index (IPCA-E). The Company´s external lawyers’ opinion considered the likelihood of loss in an eventual dispute as possible. The amount involved in the period from June 30, 2009 through August 31, 2015 is approximately 5,371 thousand U.S. dollars and in the period from August 31, 2015 through September 30, 2015 is approximately 1,501 thousand U.S. dollars. We will monitor this matter during the last quarter of 2015.
Lastly, there are other contingencies which are classified as possible by the Company, amounting to 4,870 thousands U.S. dollars.
59
Table of Contents
At September 30, 2015 Teleatento del Perú, S.A.C. has a lawsuit underway with the Peruvian tax authorities amounting to 8,189 thousand U.S. dollars (8,509 thousand U.S. dollars in December 31, 2014). According to the Company’s external attorneys, risk of material loss is possible.
At September 30, 2015 Atento Teleservicios España S.A.U. and our other Spanish companies were party to labor-related disputes filed by Atento employees or former employees for different reasons, such as dismissals and disagreements regarding employment conditions, totaling 2,765 thousand U.S. dollars (4,401 thousand U.S. dollars in December 31, 2014). According to the Company’s external lawyers, materialization of the risk event is possible.
At September 30, 2015 Atento México S.A. de CV was a party to labor-related disputes filed by Atento employees or former employees for different reasons, such as dismissals and disagreements regarding employment conditions, totaling 6,859 thousand U.S. dollars (5,897 thousand U.S. dollars in December 31, 2014). According to the Company’s external lawyers, risk of material loss is possible.
12. AVERAGE NUMBER OF GROUP EMPLOYEES
The average headcount in the Atento Group in the nine months ended September 30, 2014 and 2015, is presented as follows:
| Average headcount | ||||||||
| September 30, | ||||||||
| 2014 | 2015 | |||||||
| (unaudited) | ||||||||
| Brazil |
82,384 | 89,374 | ||||||
| Central America |
3,939 | 4,537 | ||||||
| Chile |
4,572 | 4,563 | ||||||
| Colombia |
6,193 | 8,111 | ||||||
| Spain |
12,344 | 10,451 | ||||||
| Morocco |
1,394 | 1,249 | ||||||
| Mexico |
20,086 | 19,952 | ||||||
| Peru |
12,276 | 15,736 | ||||||
| Puerto Rico |
700 | 879 | ||||||
| United States |
397 | 640 | ||||||
| Czech Republic (*) |
679 | — | ||||||
| Argentina and Uruguay |
8,024 | 7,681 | ||||||
| Corporate |
77 | 144 | ||||||
|
|
|
|
|
|||||
| Total |
153,065 | 163,317 | ||||||
|
|
|
|
|
|||||
| (*) | Operations in Czech Republic were divested in the last quarter of 2014. |
13. INCOME TAX
The breakdown of the Atento Groups’s income tax expense is as follow:
| Thousands of U.S. dollars | ||||||||
| Nine months ended September 30, | ||||||||
| 2014 | 2015 | |||||||
| (unaudited) | ||||||||
| Income taxes |
||||||||
| Current tax expense |
(23,890 | ) | (17,857 | ) | ||||
| Deferred tax |
26,047 | (1,825 | ) | |||||
| Others |
(37 | ) | (3 | ) | ||||
|
|
|
|
|
|||||
| Total income tax benefit/(expense) |
2,120 | (19,685 | ) | |||||
|
|
|
|
|
|||||
The effective tax rate on the Atento Group’s consolidated earnings in the nine months ended September 30, 2015 was 32.0%. This rate is distorted because of the recognition of non-deductible expenses in Mexico and the contribution of losses in the holding
60
Table of Contents
companies comprising the Group to Atento’s pre-tax result. Stripping out the effect caused by the contribution of losses in the holding companies, pre-tax profit would have stood at 73,936 thousand U.S. dollars, with an income tax expense of 30,284 thousand U.S. dollars. Consequently, the aggregate rate excluding the Group’s holding companies is 41.0%.
The effective tax rate on the Atento Group’s consolidated earnings in the nine months ended September 30, 2014 was 11.5%. This rate is distorted because of the contribution of losses in the holding companies comprising the Group to Atento’s pre-tax result and the tax effect of the impairment. Stripping out this effect, pre-tax profit would have stood at 85,425 thousand U.S. dollars, with an income tax expense of 29,446 thousand U.S. dollars. Consequently, the consolidated rate excluding the Group’s holding companies is 34.5%.
14. EARNINGS PER SHARE
Basic earnings per share are calculated by dividing the profits attributable to equity holders of the Company by the weighted average number of ordinary shares outstanding during the periods, as demonstrated below:
| For the nine months period ended September 30, |
||||||||
| 2014 | 2015 | |||||||
| (unaudited) | ||||||||
| Result attributable to equity holders of the Company |
||||||||
| Atento’s Profit/(loss) attributable to equity holders of the parent (in thousands of U.S. dollars) |
(16,301 | ) | 43,744 | |||||
| Weigthed average number of ordinary shares (2) |
73,619,511 | 73,648,760 | ||||||
|
|
|
|
|
|||||
| Basic result per thousand shares (in. U.S. dollars) |
(0.22 | ) | 0.59 | |||||
|
|
|
|
|
|||||
| Effect of share-based plan (1) |
— | 948,349 | ||||||
|
|
|
|
|
|||||
| Adjusted number of ordinary shares (2) |
73,619,511 | 74,597,109 | ||||||
|
|
|
|
|
|||||
| Diluted result per thousand shares (in. U.S. dollars) |
(0.22 | ) | 0.59 | |||||
|
|
|
|
|
|||||
| (1) | Since a value close to nil will be paid for the ordinary shares in connection with the stock option plan there is no adjustment to net loss for the period. |
| (2) | The weighted average number of shares was calculated considering the conversion of ordinary shares for the IPO had occurred at the beginning of 2014. |
15. RELATED PARTIES
Directors
The Members of Atento Board of Directors, at the date on which the financial statements were prepared are Alejandro Reynal, Francisco Tosta Valim Filho, Melissa Bethell, Vishal Jugdeb, Mark Foster, Stuart Gent, Devin O´Reilly and Thomas Iannotti.
As of September 30, 2015 the Members of Board of Directors have the right on the stock-based compensation as described in Note 8.
Key management personnel
Key management personnel include those persons empowered and responsible for planning, directing and controlling the Atento Group’s activities, either directly or indirectly.
Key management personnel with executive duties in the Atento Group, in the nine months ended September 30, 2015 is the same to previous publications.
61
Table of Contents
The following table shows the total remuneration paid to the Atento Group’s key management personnel in the nine months ended September 30, 2014 and 2015:
| Thousands of U.S. dollars | ||||||||
| 2014 | 2015 | |||||||
| (unaudited) | ||||||||
| Total remuneration paid to key management personnel |
8,059 | 7,103 | ||||||
The breakdown of the total remuneration shown above is as follows:
| Thousands of U.S. dollars | ||||||||
| 2014 | 2015 | |||||||
| (unaudited) | ||||||||
| Salaries and variable remuneration |
7,644 | 6,114 | ||||||
| Salaries |
3,310 | 2,962 | ||||||
| Variable remuneration |
4,334 | 3,152 | ||||||
| Payment in kind |
415 | 989 | ||||||
| Medical insurance |
7 | 109 | ||||||
| Life insurance premiums |
64 | 8 | ||||||
| Other |
344 | 872 | ||||||
|
|
|
|
|
|||||
| Total |
8,059 | 7,103 | ||||||
|
|
|
|
|
|||||
16. CONSOLIDATED SCHEDULES
The following consolidating financial information presents Consolidated Income Statement for the nine months ended September 30, 2014 and 2015, Consolidated Statement of Financial Position as of December 30, 2014 and September 30, 2015 and Consolidated Statements of Cash Flow for the nine months ended September 30, 2014 and 2015 for: (i) (Atento S.A.) (the “Parent”); (ii) (Luxco 1) (the “Subsidiary Issuers”); (iii) the guarantor subsidiaries; (iv) the non-guarantor subsidiaries; (v) elimination entries necessary to consolidate the Parent with the Subsidiary Issuers, the guarantor and non-guarantor subsidiaries; and (vi) the Company on a consolidated basis. The Subsidiary Issuers and the guarantor and non-guarantor subsidiaries are 100% owned by the Parent, either directly or indirectly. All guarantees are full and unconditional and joint and several. This financial information is being presented in relation to the Company’s guarantee of the payment of principal, premium (if any) and interest on the notes issued by BC Luxco 1 S.A. Refer to Note 10 “Financial Liabilities” for further information of these guaranteed notes. The principal elimination entries relates to investments in subsidiaries and intercompany balances and transactions.
62
Table of Contents
Consolidated Income Statement (thousands of U.S. dollars)
For the Nine Months Ended September 30, 2014
| GUARANTORS | ||||||||||||||||||||||||||||||||
| Parent (Atento S.A.) |
Subsidiary Issuer (Luxco1) |
Guarantor (MIDCO) |
Guarantor (Restricted Group*) |
Total | Non- Guarantor (Other**) |
Eliminations | Consolidated (Atento S.A.) |
|||||||||||||||||||||||||
| Revenue |
— | — | — | 729,064 | 729,064 | 1,016,716 | (2,516 | ) | 1,743,264 | |||||||||||||||||||||||
| Other operating income |
— | — | — | 1,485 | 1,485 | 505 | (230 | ) | 1,760 | |||||||||||||||||||||||
| Own work capitalized |
— | — | — | 220 | 220 | 193 | — | 413 | ||||||||||||||||||||||||
| Other gains |
— | 34,478 | — | 34,478 | 34,478 | — | (34,478 | ) | 34,478 | |||||||||||||||||||||||
| Supplies |
— | — | — | (36,018 | ) | (36,018 | ) | (43,455 | ) | 233 | (79,240 | ) | ||||||||||||||||||||
| Employee benefit expenses |
— | — | (7 | ) | (541,192 | ) | (541,199 | ) | (702,709 | ) | (2,445 | ) | (1,246,353 | ) | ||||||||||||||||||
| Depreciation and amortization |
— | — | — | (47,377 | ) | (47,377 | ) | (29,953 | ) | (14,310 | ) | (91,640 | ) | |||||||||||||||||||
| Changes in trade provisions |
— | — | — | 22 | 22 | (219 | ) | (2 | ) | (199 | ) | |||||||||||||||||||||
| Other operating expenses |
— | (7,642 | ) | (1,604 | ) | (101,088 | ) | (102,692 | ) | (151,885 | ) | 11,992 | (250,227 | ) | ||||||||||||||||||
| Impairment charges |
— | — | — | (32,488 | ) | (32,488 | ) | — | 9 | (32,479 | ) | |||||||||||||||||||||
|
|
|
|
|
|
|
|
|
|
|
|
|
|
|
|
|
|||||||||||||||||
| OPERATING PROFIT/(LOSS) |
— | 26,836 | (1,611 | ) | 7,106 | 5,495 | 89,193 | (41,747 | ) | 79,777 | ||||||||||||||||||||||
|
|
|
|
|
|
|
|
|
|
|
|
|
|
|
|
|
|||||||||||||||||
| Finance income |
— | 41,626 | 25,523 | 984 | 26,507 | 14,164 | (68,951 | ) | 13,346 | |||||||||||||||||||||||
| Finance costs |
— | (45,330 | ) | (29,762 | ) | (46,537 | ) | (76,299 | ) | (51,462 | ) | 72,654 | (100,437 | ) | ||||||||||||||||||
| Net foreign exchange gains/(loss) |
— | (5,059 | ) | — | (10,388 | ) | (10,388 | ) | (720 | ) | 5,060 | (11,107 | ) | |||||||||||||||||||
|
|
|
|
|
|
|
|
|
|
|
|
|
|
|
|
|
|||||||||||||||||
| NET FINANCE EXPENSE |
— | (8,763 | ) | (4,239 | ) | (55,941 | ) | (60,180 | ) | (38,018 | ) | 8,763 | (98,198 | ) | ||||||||||||||||||
|
|
|
|
|
|
|
|
|
|
|
|
|
|
|
|
|
|||||||||||||||||
| PROFIT/(LOSS) BEFORE TAX |
— | 18,073 | (5,850 | ) | (48,835 | ) | (54,685 | ) | 51,175 | (32,984 | ) | (18,421 | ) | |||||||||||||||||||
|
|
|
|
|
|
|
|
|
|
|
|
|
|
|
|
|
|||||||||||||||||
| Income tax benefit/(expenses) |
— | (1,169 | ) | (4 | ) | 15,191 | 15,187 | (18,024 | ) | 6,126 | 2,120 | |||||||||||||||||||||
|
|
|
|
|
|
|
|
|
|
|
|
|
|
|
|
|
|||||||||||||||||
| LOSS FOR THE PERIOD ATTRIBUTABLE TO EQUITY HOLDERS OF THE PARENT |
— | 16,904 | (5,854 | ) | (33,644 | ) | (39,498 | ) | 33,151 | (26,858 | ) | (16,301 | ) | |||||||||||||||||||
|
|
|
|
|
|
|
|
|
|
|
|
|
|
|
|
|
|||||||||||||||||
| * | Restricted Group has been adjusted to remove the operations of Atento’s indirect subsidiaries in Brazil, Argentina, and its direct subsidiaries Atalaya Luxco 2 S.à.r.l. and Atalaya Luxco 3 S.à.r.l. The column includes Luxco 1 as parent of this “Guarantor Restricted Group”. |
| ** | Other is Atento’s indirect subsidiaries in Brazil, Argentina, and its direct subsidiaries Atalaya Luxco 2 S.à.r.l. and Atalaya Luxco 3 S.à.r.l. |
63
Table of Contents
For the Nine Months Ended September 30, 2015
| GUARANTORS | ||||||||||||||||||||||||||||||||
| Parent (Atento S.A.) |
Subsidiary Issuer (Luxco1) |
Guarantor (MIDCO) |
Guarantor (Restricted Group*) |
Total | Non- Guarantor (Other**) |
Eliminations | Consolidated (Atento S.A.) |
|||||||||||||||||||||||||
| Revenue |
— | — | — | 648,410 | 648,410 | 859,496 | (62 | ) | 1,507,844 | |||||||||||||||||||||||
| Other operating income |
— | — | — | 1,783 | 1,783 | 296 | (64 | ) | 2,015 | |||||||||||||||||||||||
| Own work capitalized |
— | — | — | (15 | ) | (15 | ) | — | — | (15 | ) | |||||||||||||||||||||
| Supplies |
— | — | — | (24,297 | ) | (24,297 | ) | (35,510 | ) | (12 | ) | (59,819 | ) | |||||||||||||||||||
| Employee benefit expenses |
— | — | (11 | ) | (485,990 | ) | (486,001 | ) | (607,452 | ) | 60 | (1,093,393 | ) | |||||||||||||||||||
| Depreciation and amortization |
— | — | — | (38,269 | ) | (38,269 | ) | (40,569 | ) | — | (78,838 | ) | ||||||||||||||||||||
| Changes in trade provisions |
— | — | — | (648 | ) | (648 | ) | (277 | ) | — | (925 | ) | ||||||||||||||||||||
| Other operating expenses |
(1,779 | ) | (1,145 | ) | (102 | ) | (70,801 | ) | (70,903 | ) | (110,108 | ) | 1,221 | (182,714 | ) | |||||||||||||||||
| OPERATING PROFIT/(LOSS) |
(1,779 | ) | (1,145 | ) | (113 | ) | 30,173 | 30,060 | 65,876 | 1,143 | 94,155 | |||||||||||||||||||||
|
|
|
|
|
|
|
|
|
|
|
|
|
|
|
|
|
|||||||||||||||||
| Finance income |
— | 36,717 | 20,352 | 1,099 | 21,451 | 14,440 | (59,931 | ) | 12,677 | |||||||||||||||||||||||
| Finance costs |
— | (41,020 | ) | (753 | ) | (43,276 | ) | (44,029 | ) | (37,007 | ) | 64,037 | (58,019 | ) | ||||||||||||||||||
| Net foreign exchange gains/(loss) |
689 | 12,356 | — | 13,281 | 13,281 | 647 | (12,357 | ) | 14,616 | |||||||||||||||||||||||
|
|
|
|
|
|
|
|
|
|
|
|
|
|
|
|
|
|||||||||||||||||
| NET FINANCE EXPENSE |
689 | 8,053 | 19,599 | (28,896 | ) | (9,297 | ) | (21,920 | ) | (8,251 | ) | (30,726 | ) | |||||||||||||||||||
|
|
|
|
|
|
|
|
|
|
|
|
|
|
|
|
|
|||||||||||||||||
| PROFIT/(LOSS) BEFORE TAX |
(1,090 | ) | 6,908 | 19,486 | 1,277 | 20,763 | 43,956 | (7,108 | ) | 63,429 | ||||||||||||||||||||||
|
|
|
|
|
|
|
|
|
|
|
|
|
|
|
|
|
|||||||||||||||||
| Income tax benefit/(expenses) |
(4 | ) | (4 | ) | (4 | ) | (4,640 | ) | (4,644 | ) | (15,038 | ) | 5 | (19,685 | ) | |||||||||||||||||
|
|
|
|
|
|
|
|
|
|
|
|
|
|
|
|
|
|||||||||||||||||
| LOSS FOR THE PERIOD ATTRIBUTABLE TO EQUITY HOLDERS OF THE PARENT |
(1,094 | ) | 6,904 | 19,482 | (3,363 | ) | 16,119 | 28,918 | (7,103 | ) | 43,744 | |||||||||||||||||||||
|
|
|
|
|
|
|
|
|
|
|
|
|
|
|
|
|
|||||||||||||||||
| * | Restricted Group has been adjusted to remove the operations of Atento’s indirect subsidiaries in Brazil, Argentina, and its direct subsidiaries Atalaya Luxco 2 S.à.r.l. and Atalaya Luxco 3 S.à.r.l. The column includes Luxco 1 as parent of this “Guarantor Restricted Group”. |
| ** | Other are Atento’s indirect subsidiaries in Brazil, Argentina, and its direct subsidiaries Atalaya Luxco 2 S.à.r.l. and Atalaya Luxco 3 S.à.r.l. |
64
Table of Contents
Consolidated Statement of Financial Position (thousands of U.S. dollars)
As of December 31, 2014
| GUARANTORS | ||||||||||||||||||||||||||||||||
| Parent (Atento S.A.) |
Subsidiary Issuer (Luxco1) |
Guarantor (MIDCO) |
Guarantor (Restricted Group*) |
Total | Non- Guarantor (Other**) |
Eliminations | Consolidated (Atento S.A.) |
|||||||||||||||||||||||||
| ASSETS |
||||||||||||||||||||||||||||||||
| NON-CURRENT ASSETS |
644,398 | 945,359 | 643,112 | 651,622 | 1,294,734 | 523,375 | (2,465,726 | ) | 942,140 | |||||||||||||||||||||||
|
|
|
|
|
|
|
|
|
|
|
|
|
|
|
|
|
|||||||||||||||||
| Intangible assets |
— | — | — | 143,946 | 143,946 | 34,559 | 114,573 | 293,078 | ||||||||||||||||||||||||
| Goodwill |
— | — | — | 62,316 | 62,316 | 80,099 | 27,056 | 169,471 | ||||||||||||||||||||||||
| Property, plant and equipment |
— | — | — | 85,237 | 85,237 | 151,959 | — | 237,196 | ||||||||||||||||||||||||
| Investments |
644,398 | 249,986 | 26,170 | 218,547 | 244,717 | 79,846 | (1,218,947 | ) | — | |||||||||||||||||||||||
| Non-current financial assets |
— | 695,373 | 616,942 | 82,186 | 699,128 | 88,181 | (1,390,424 | ) | 92,258 | |||||||||||||||||||||||
| Trade and other receivables |
— | — | — | 39 | 39 | 10,507 | (43 | ) | 10,503 | |||||||||||||||||||||||
| Other receivables from public administrations |
— | — | — | 29 | 29 | 4,851 | (29 | ) | 4,851 | |||||||||||||||||||||||
| Other non-current financial assets |
— | 674,024 | 616,942 | 60,769 | 677,711 | 61,907 | (1,369,003 | ) | 44,639 | |||||||||||||||||||||||
| Derivative financial instruments |
— | 21,349 | — | 21,349 | 21,349 | 10,916 | (21,349 | ) | 32,265 | |||||||||||||||||||||||
| Deferred tax assets |
— | — | — | 59,390 | 59,390 | 88,731 | 2,016 | 150,137 | ||||||||||||||||||||||||
|
|
|
|
|
|
|
|
|
|
|
|
|
|
|
|
|
|||||||||||||||||
| CURRENT ASSETS |
9,689 | 40,856 | 1,600 | 402,350 | 403,950 | 340,826 | (79,560 | ) | 715,761 | |||||||||||||||||||||||
|
|
|
|
|
|
|
|
|
|
|
|
|
|
|
|
|
|||||||||||||||||
| Trade and other receivables |
356 | 7,886 | 1,535 | 256,563 | 258,098 | 256,098 | (46,679 | ) | 475,759 | |||||||||||||||||||||||
| Trade and other receivables |
342 | 6,734 | 1,527 | 240,055 | 241,582 | 248,263 | (45,527 | ) | 451,394 | |||||||||||||||||||||||
| Current income tax receivables |
4 | 10 | 8 | 8,469 | 8,477 | 5,122 | (10 | ) | 13,603 | |||||||||||||||||||||||
| Other receivables from public administrations |
10 | 1,142 | — | 8,039 | 8,039 | 2,713 | (1,142 | ) | 10,762 | |||||||||||||||||||||||
| Other current financial assets |
— | 3,643 | — | 643 | 643 | 27,919 | (3,643 | ) | 28,562 | |||||||||||||||||||||||
| Other financial assets |
— | 3,643 | — | 643 | 643 | 27,919 | (3,643 | ) | 28,562 | |||||||||||||||||||||||
| Cash and cash equivalents |
9,333 | 29,327 | 65 | 145,144 | 145,209 | 56,809 | (29,238 | ) | 211,440 | |||||||||||||||||||||||
|
|
|
|
|
|
|
|
|
|
|
|
|
|
|
|
|
|||||||||||||||||
| TOTAL ASSETS |
654,087 | 986,215 | 644,712 | 1,053,972 | 1,698,684 | 864,201 | (2,545,286 | ) | 1,657,901 | |||||||||||||||||||||||
|
|
|
|
|
|
|
|
|
|
|
|
|
|
|
|
|
|||||||||||||||||
| * | Restricted Group has been adjusted to remove the operations of Atento’s indirect subsidiaries in Brazil, Argentina, and its direct subsidiaries Atalaya Luxco 2 S.à.r.l. and Atalaya Luxco 3 S.à.r.l. The column includes Luxco 1 as parent of this “Guarantor Restricted Group”. |
| ** | Other is Atento’s indirect subsidiaries in Brazil, Argentina, and its direct subsidiaries Atalaya Luxco 2 S.à.r.l. and Atalaya Luxco 3 S.à.r.l. |
65
Table of Contents
| GUARANTORS | ||||||||||||||||||||||||||||||||
| Parent (Atento S.A.) |
Subsidiary Issuer (Luxco1) |
Guarantor (MIDCO) |
Guarantor (Restricted Group*) |
Total | Non- Guarantor (Other**) |
Eliminations | Consolidated (Atento S.A.) |
|||||||||||||||||||||||||
| EQUITY AND LIABILITIES |
||||||||||||||||||||||||||||||||
| EQUITY ATTRIBUTABLE TO EQUITY HOLDERS OF THE PARENT |
644,210 | 46,956 | 611,541 | (99,256 | ) | 512,285 | 149,230 | (887,815 | ) | 464,866 | ||||||||||||||||||||||
|
|
|
|
|
|
|
|
|
|
|
|
|
|
|
|
|
|||||||||||||||||
| Share capital |
45 | 119 | 96 | 119 | 215 | 216,709 | (217,040 | ) | 48 | |||||||||||||||||||||||
| Net investment / Share premium |
639,451 | 22,770 | 630,687 | 22,770 | 653,457 | (3 | ) | (676,240 | ) | 639,435 | ||||||||||||||||||||||
| Retained earnings |
(19,884 | ) | (42,673 | ) | (1,712 | ) | (115,166 | ) | (116,878 | ) | 66,860 | 9,764 | (102,811 | ) | ||||||||||||||||||
| Translation differences |
24,014 | 74,585 | (17,530 | ) | 866 | (16,664 | ) | (141,541 | ) | (12,144 | ) | (71,750 | ) | |||||||||||||||||||
| Cash flow hedge |
— | (7,845 | ) | — | (7,845 | ) | (7,845 | ) | 7,205 | 7,845 | (640 | ) | ||||||||||||||||||||
| Stock-based compensation |
584 | — | — | — | — | — | — | 584 | ||||||||||||||||||||||||
|
|
|
|
|
|
|
|
|
|
|
|
|
|
|
|
|
|||||||||||||||||
| NON-CURRENT LIABILITIES |
— | 916,374 | 31,578 | 970,711 | 1,002,289 | 498,274 | (1,598,732 | ) | 818,205 | |||||||||||||||||||||||
|
|
|
|
|
|
|
|
|
|
|
|
|
|
|
|
|
|||||||||||||||||
| Deferred tax liabilities |
— | — | — | 36,367 | 36,367 | 31,647 | 15,118 | 83,132 | ||||||||||||||||||||||||
| Interest-bearing debt |
— | 290,927 | — | 295,255 | 295,255 | 341,294 | (290,927 | ) | 636,549 | |||||||||||||||||||||||
| Non-current payables to Group companies |
— | 624,254 | 31,578 | 635,565 | 667,143 | 26,550 | (1,317,947 | ) | — | |||||||||||||||||||||||
| Derivative financial instruments |
— | 1,193 | — | 1,193 | 1,193 | — | (1,193 | ) | 1,193 | |||||||||||||||||||||||
| Non-current provisions |
— | — | — | 1,940 | 1,940 | 92,834 | — | 94,774 | ||||||||||||||||||||||||
| Non-current non trade payables |
— | — | — | 391 | 391 | 4,353 | (3,783 | ) | 961 | |||||||||||||||||||||||
| Other non-current payables to public administrations |
— | — | — | — | — | 1,596 | — | 1,596 | ||||||||||||||||||||||||
|
|
|
|
|
|
|
|
|
|
|
|
|
|
|
|
|
|||||||||||||||||
| CURRENT LIABILITIES |
9,877 | 22,885 | 1,594 | 182,518 | 184,112 | 216,694 | (58,738 | ) | 374,830 | |||||||||||||||||||||||
|
|
|
|
|
|
|
|
|
|
|
|
|
|
|
|
|
|||||||||||||||||
| Interest-bearing debt |
— | 10,385 | — | 13,294 | 13,294 | 4,808 | (11,726 | ) | 16,761 | |||||||||||||||||||||||
| Current payables to Group companies |
— | 10,459 | — | — | — | — | (10,459 | ) | — | |||||||||||||||||||||||
| Trade and other payables |
9,877 | 2,041 | 1,594 | 156,202 | 157,796 | 206,399 | (36,553 | ) | 339,560 | |||||||||||||||||||||||
| Trade payables |
1,443 | 906 | 59 | 62,172 | 62,231 | 66,596 | (25,410 | ) | 105,766 | |||||||||||||||||||||||
| Current income tax payable |
3 | 8 | 8 | 4,797 | 4,805 | 2,543 | (8 | ) | 7,351 | |||||||||||||||||||||||
| Other current payables to public administrations |
289 | 747 | — | 37,131 | 37,131 | 37,096 | (747 | ) | 74,516 | |||||||||||||||||||||||
| Other non-trade payables |
8,142 | 380 | 1,527 | 52,102 | 53,629 | 100,164 | (10,388 | ) | 151,927 | |||||||||||||||||||||||
| Current provisions |
— | — | — | 13,022 | 13,022 | 5,487 | — | 18,509 | ||||||||||||||||||||||||
|
|
|
|
|
|
|
|
|
|
|
|
|
|
|
|
|
|||||||||||||||||
| TOTAL EQUITY AND LIABILITIES |
654,087 | 986,215 | 644,713 | 1,053,973 | 1,698,686 | 864,198 | (2,545,285 | ) | 1,657,901 | |||||||||||||||||||||||
|
|
|
|
|
|
|
|
|
|
|
|
|
|
|
|
|
|||||||||||||||||
| * | Restricted Group has been adjusted to remove the operations of Atento’s indirect subsidiaries in Brazil, Argentina, and its direct subsidiaries Atalaya Luxco 2 S.à.r.l. and Atalaya Luxco 3 S.à.r.l. The column includes Luxco 1 as parent of this “Guarantor Restricted Group”. |
| ** | Other is Atento’s indirect subsidiaries in Brazil, Argentina, and its direct subsidiaries Atalaya Luxco 2 S.à.r.l. and Atalaya Luxco 3 S.à.r.l. |
66
Table of Contents
As of September 30, 2015
| GUARANTORS | ||||||||||||||||||||||||||||||||
| Parent (Atento S.A.) |
Subsidiary Issuer (Luxco1) |
Guarantor (MIDCO) |
Guarantor (Restricted Group*) |
Total | Non- Guarantor (Other**) |
Eliminations | Consolidated (Atento S.A.) |
|||||||||||||||||||||||||
| ASSETS |
||||||||||||||||||||||||||||||||
| NON-CURRENT ASSETS |
558,021 | 935,078 | 615,917 | 625,263 | 1,241,180 | 352,162 | (2,321,117 | ) | 765,324 | |||||||||||||||||||||||
|
|
|
|
|
|
|
|
|
|
|
|
|
|
|
|
|
|||||||||||||||||
| Intangible assets |
— | — | — | 123,364 | 123,364 | 111,533 | — | 234,897 | ||||||||||||||||||||||||
| Goodwill |
— | — | — | 55,181 | 55,181 | 4,485 | 75,606 | 135,272 | ||||||||||||||||||||||||
| Property, plant and equipment |
— | — | — | 70,613 | 70,613 | 103,029 | — | 173,642 | ||||||||||||||||||||||||
| Investments |
558,021 | 233,720 | 26,177 | 206,769 | 232,946 | — | (1,024,687 | ) | — | |||||||||||||||||||||||
| Non-current financial assets |
— | 701,358 | 589,740 | 109,727 | 699,467 | 84,578 | (1,372,036 | ) | 113,367 | |||||||||||||||||||||||
| Trade and other receivables |
— | 61 | — | 97 | 97 | 6,133 | (454 | ) | 5,837 | |||||||||||||||||||||||
| Other receivables from public administrations |
— | — | — | — | — | 4,375 | — | 4,375 | ||||||||||||||||||||||||
| Other non-current financial assets |
— | 648,526 | 589,740 | 56,860 | 646,600 | 62,442 | (1,318,812 | ) | 38,756 | |||||||||||||||||||||||
| Derivative financial instruments |
— | 52,771 | — | 52,770 | 52,770 | 11,628 | (52,770 | ) | 64,399 | |||||||||||||||||||||||
| Deferred tax assets |
— | — | — | 59,609 | 59,609 | 48,537 | — | 108,146 | ||||||||||||||||||||||||
|
|
|
|
|
|
|
|
|
|
|
|
|
|
|
|
|
|||||||||||||||||
| CURRENT ASSETS |
6,269 | 35,691 | 1,672 | 373,283 | 374,955 | 297,240 | (72,121 | ) | 642,034 | |||||||||||||||||||||||
|
|
|
|
|
|
|
|
|
|
|
|
|
|
|
|
|
|||||||||||||||||
| Trade and other receivables |
258 | 7,781 | 1,657 | 275,584 | 277,241 | 224,977 | (44,291 | ) | 465,966 | |||||||||||||||||||||||
| Trade and other receivables |
241 | 6,722 | 1,650 | 257,975 | 259,625 | 218,726 | (43,247 | ) | 442,067 | |||||||||||||||||||||||
| Current income tax receivables |
7 | 9 | 7 | 9,643 | 9,650 | 3,721 | 6 | 13,393 | ||||||||||||||||||||||||
| Other receivables from public administrations |
10 | 1,050 | — | 7,966 | 7,966 | 2,530 | (1,050 | ) | 10,506 | |||||||||||||||||||||||
| Other current financial assets |
— | 3,361 | — | 358 | 358 | 1,054 | (3,361 | ) | 1,412 | |||||||||||||||||||||||
| Other financial assets |
— | 3,361 | — | 358 | 358 | 1,054 | (3,361 | ) | 1,412 | |||||||||||||||||||||||
| Cash and cash equivalents |
6,011 | 24,549 | 15 | 97,341 | 97,356 | 71,209 | (24,469 | ) | 174,656 | |||||||||||||||||||||||
|
|
|
|
|
|
|
|
|
|
|
|
|
|
|
|
|
|||||||||||||||||
| TOTAL ASSETS |
564,290 | 970,769 | 617,589 | 998,546 | 1,616,135 | 649,402 | (2,393,238 | ) | 1,407,358 | |||||||||||||||||||||||
|
|
|
|
|
|
|
|
|
|
|
|
|
|
|
|
|
|||||||||||||||||
| * | Restricted Group has been adjusted to remove the operations of Atento’s indirect subsidiaries in Brazil, Argentina, and its direct subsidiaries Atalaya Luxco 2 S.à.r.l. and Atalaya Luxco 3 S.à.r.l. The column includes Luxco 1 as parent of this “Guarantor Restricted Group”. |
| ** | Other is Atento’s indirect subsidiaries in Brazil, Argentina, and its direct subsidiaries Atalaya Luxco 2 S.à.r.l. and Atalaya Luxco 3 S.à.r.l. |
67
Table of Contents
| GUARANTORS | ||||||||||||||||||||||||||||||||
| Parent (Atento S.A.) |
Subsidiary Issuer (Luxco1) |
Guarantor (MIDCO) |
Guarantor (Restricted Group*) |
Total | Non- Guarantor (Other**) |
Eliminations | Consolidated (Atento S.A.) |
|||||||||||||||||||||||||
| EQUITY AND LIABILITIES |
||||||||||||||||||||||||||||||||
| EQUITY ATTRIBUTABLE TO EQUITY HOLDERS OF THE PARENT |
556,711 | 55,563 | 585,904 | (93,707 | ) | 492,197 | 142,122 | (830,918 | ) | 415,675 | ||||||||||||||||||||||
|
|
|
|
|
|
|
|
|
|
|
|
|
|
|
|
|
|||||||||||||||||
| Share capital |
45 | 43 | 96 | (9 | ) | 87 | 216,677 | (216,804 | ) | 48 | ||||||||||||||||||||||
| Net investment / Share premium |
639,550 | 34,181 | 625,624 | 34,181 | 659,805 | — | (694,101 | ) | 639,435 | |||||||||||||||||||||||
| Retained earnings |
(1,094 | ) | 6,904 | 19,482 | (3,363 | ) | 16,119 | 31,258 | (112,254 | ) | (59,067 | ) | ||||||||||||||||||||
| Translation differences |
(84,695 | ) | 14,435 | (59,298 | ) | (124,522 | ) | (183,820 | ) | (112,442 | ) | 182,530 | (183,992 | ) | ||||||||||||||||||
| Cash flow hedge |
— | — | — | — | — | 6,629 | 9,717 | 16,346 | ||||||||||||||||||||||||
| Stock-based compensation |
2,905 | — | — | 6 | 6 | — | (6 | ) | 2,905 | |||||||||||||||||||||||
|
|
|
|
|
|
|
|
|
|
|
|
|
|
|
|
|
|||||||||||||||||
| NON-CURRENT LIABILITIES |
— | 899,376 | 29,897 | 945,264 | 975,161 | 319,178 | (1,511,624 | ) | 682,091 | |||||||||||||||||||||||
|
|
|
|
|
|
|
|
|
|
|
|
|
|
|
|
|
|||||||||||||||||
| Deferred tax liabilities |
— | — | — | 28,648 | 28,648 | 29,797 | — | 58,445 | ||||||||||||||||||||||||
| Interest-bearing debt |
— | 292,049 | — | 294,621 | 294,621 | 217,722 | (256,556 | ) | 547,836 | |||||||||||||||||||||||
| Non-current payables to Group companies |
— | 607,027 | 29,897 | 614,347 | 644,244 | — | (1,251,271 | ) | — | |||||||||||||||||||||||
| Derivative financial instruments |
— | 300 | — | 300 | 300 | — | (300 | ) | 300 | |||||||||||||||||||||||
| Non-current provisions |
— | — | — | 2,234 | 2,234 | 56,323 | — | 58,557 | ||||||||||||||||||||||||
| Non-current non trade payables |
— | — | — | 5,114 | 5,114 | 14,331 | (3,497 | ) | 15,948 | |||||||||||||||||||||||
| Other non-current payables to public administrations |
— | — | — | — | — | 1,005 | — | 1,005 | ||||||||||||||||||||||||
|
|
|
|
|
|
|
|
|
|
|
|
|
|
|
|
|
|||||||||||||||||
| CURRENT LIABILITIES |
7,579 | 15,830 | 1,788 | 146,989 | 148,777 | 188,102 | (50,696 | ) | 309,592 | |||||||||||||||||||||||
|
|
|
|
|
|
|
|
|
|
|
|
|
|
|
|
|
|||||||||||||||||
| Interest-bearing debt |
— | 5,096 | — | 7,784 | 7,784 | 19,035 | (7,185 | ) | 24,730 | |||||||||||||||||||||||
| Current payables to Group companies |
— | 9,120 | — | — | — | — | (9,120 | ) | — | |||||||||||||||||||||||
| Trade and other payables |
7,579 | 1,614 | 1,788 | 131,381 | 133,169 | 164,452 | (34,391 | ) | 272,423 | |||||||||||||||||||||||
| Trade payables |
723 | 469 | 55 | 44,214 | 44,269 | 60,873 | (24,610 | ) | 81,724 | |||||||||||||||||||||||
| Current income tax payable |
7 | 7 | 7 | 7,335 | 7,342 | 129 | 8 | 7,493 | ||||||||||||||||||||||||
| Other current payables to public administrations |
155 | 1,123 | 240 | 35,275 | 35,515 | 29,448 | (1,124 | ) | 65,117 | |||||||||||||||||||||||
| Other non-trade payables |
6,694 | 15 | 1,486 | 44,557 | 46,043 | 74,002 | (8,665 | ) | 118,089 | |||||||||||||||||||||||
| Current provisions |
— | — | — | 7,824 | 7,824 | 4,615 | — | 12,439 | ||||||||||||||||||||||||
|
|
|
|
|
|
|
|
|
|
|
|
|
|
|
|
|
|||||||||||||||||
| TOTAL EQUITY AND LIABILITIES |
564,290 | 970,769 | 617,589 | 998,546 | 1,616,135 | 649,402 | (2,393,238 | ) | 1,407,358 | |||||||||||||||||||||||
|
|
|
|
|
|
|
|
|
|
|
|
|
|
|
|
|
|||||||||||||||||
| * | Restricted Group has been adjusted to remove the operations of Atento’s indirect subsidiaries in Brazil, Argentina, and its direct subsidiaries Atalaya Luxco 2 S.à.r.l. and Atalaya Luxco 3 S.à.r.l. The column includes Luxco 1 as parent of this “Guarantor Restricted Group”. |
| ** | Other is Atento’s indirect subsidiaries in Brazil, Argentina, and its direct subsidiaries Atalaya Luxco 2 S.à.r.l. and Atalaya Luxco 3 S.à.r.l. |
68
Table of Contents
Consolidated Statements of Cash Flow (thousands of U.S. dollars)
For the Nine Months Ended September 30, 2014
| GUARANTORS | ||||||||||||||||||||||||||||||||
| Parent (Atento S.A.) |
Subsidiary Issuer (Luxco1) |
Guarantor (Midco) |
Guarantor (Restricted Group*) |
Total | Non- Guarantor (Other**) |
Eliminations | Consolidated (Atento S.A.) |
|||||||||||||||||||||||||
| Operating activities |
||||||||||||||||||||||||||||||||
| Profit/(loss) before tax |
— | 18,073 | (5,850 | ) | (48,835 | ) | (54,685 | ) | 51,175 | (32,984 | ) | (18,421 | ) | |||||||||||||||||||
| Adjustments to profit/(loss): |
||||||||||||||||||||||||||||||||
| Amortization and depreciation |
— | — | — | 47,377 | 47,377 | 29,953 | 14,310 | 91,640 | ||||||||||||||||||||||||
| Impairment allowances |
— | — | — | 32,678 | 32,678 | — | — | 32,678 | ||||||||||||||||||||||||
| Change in provisions |
— | — | — | 19,015 | 19,015 | 15,095 | (141 | ) | 33,969 | |||||||||||||||||||||||
| Gains/(losses) on disposal of fixed assets |
— | — | — | 423 | 423 | (284 | ) | — | 139 | |||||||||||||||||||||||
| Finance income |
— | (41,626 | ) | (25,523 | ) | (984 | ) | (26,507 | ) | (14,164 | ) | 68,951 | (13,346 | ) | ||||||||||||||||||
| Finance expense |
— | 45,330 | 29,762 | 46,537 | 76,299 | 51,462 | (72,654 | ) | 100,437 | |||||||||||||||||||||||
| Net exchange differences |
— | 5,059 | — | 10,388 | 10,388 | 720 | (5,060 | ) | 11,107 | |||||||||||||||||||||||
| Own work capitalized |
— | — | — | (220 | ) | (220 | ) | (193 | ) | — | (413 | ) | ||||||||||||||||||||
| Other gains |
— | (34,478 | ) | — | (34,258 | ) | (34,258 | ) | — | 34,258 | (34,478 | ) | ||||||||||||||||||||
|
|
|
|
|
|
|
|
|
|
|
|
|
|
|
|
|
|||||||||||||||||
| — | (25,715 | ) | 4,239 | 120,956 | 125,195 | 82,589 | 39,664 | 221,733 | ||||||||||||||||||||||||
| Changes in working capital: |
||||||||||||||||||||||||||||||||
| Changes in trade and other receivables |
— | (1,494 | ) | — | (10,225 | ) | (10,225 | ) | 46,199 | 352 | 34,832 | |||||||||||||||||||||
| Changes in trade and other payables |
— | (4,211 | ) | (1,509 | ) | 1,583 | 74 | (22,896 | ) | 13,447 | (13,586 | ) | ||||||||||||||||||||
| Other assets/(payables) |
— | 52,100 | 3,062 | (20,768 | ) | (17,706 | ) | 35,102 | (80,748 | ) | (11,252 | ) | ||||||||||||||||||||
|
|
|
|
|
|
|
|
|
|
|
|
|
|
|
|
|
|||||||||||||||||
| — | 46,395 | 1,553 | (29,410 | ) | (27,857 | ) | 58,405 | (66,949 | ) | 9,994 | ||||||||||||||||||||||
| Other cash flow from operating activities |
||||||||||||||||||||||||||||||||
| Interest paid |
— | (39,473 | ) | — | (39,673 | ) | (39,673 | ) | (39,292 | ) | 50,042 | (68,396 | ) | |||||||||||||||||||
| Interest received |
— | 12,393 | — | 12,815 | 12,815 | 3,310 | (15,172 | ) | 13,346 | |||||||||||||||||||||||
| Income tax paid |
— | (5 | ) | — | (14,122 | ) | (14,122 | ) | (1,876 | ) | 5 | (15,998 | ) | |||||||||||||||||||
| Other payments |
— | — | — | (15,977 | ) | (15,977 | ) | (16,882 | ) | — | (32,859 | ) | ||||||||||||||||||||
|
|
|
|
|
|
|
|
|
|
|
|
|
|
|
|
|
|||||||||||||||||
| — | (27,085 | ) | — | (56,957 | ) | (56,957 | ) | (54,740 | ) | 34,875 | (103,907 | ) | ||||||||||||||||||||
|
|
|
|
|
|
|
|
|
|
|
|
|
|
|
|
|
|||||||||||||||||
| Net cash flow from/(used in) operating activities |
— | 11,668 | (58 | ) | (14,246 | ) | (14,304 | ) | 137,429 | (25,394 | ) | 109,399 | ||||||||||||||||||||
|
|
|
|
|
|
|
|
|
|
|
|
|
|
|
|
|
|||||||||||||||||
69
Table of Contents
| Investment activities |
||||||||||||||||||||||||||||||||
| Payments for acquisition of intangible assets |
— | — | — | (3,032 | ) | (3,032 | ) | (11,610 | ) | 1,230 | (13,412 | ) | ||||||||||||||||||||
| Payments for acquisition of property, plant and equipment |
— | — | — | (30,563 | ) | (30,563 | ) | (56,713 | ) | 19,511 | (67,765 | ) | ||||||||||||||||||||
| Payments for financial instruments |
— | — | — | — | — | (66,562 | ) | — | (66,562 | ) | ||||||||||||||||||||||
| Disposals of intangible assets |
— | — | — | 97 | 97 | — | 2 | 99 | ||||||||||||||||||||||||
| Disposals of property, plant and equipment |
— | — | — | 1,058 | 1,058 | 284 | (456 | ) | 886 | |||||||||||||||||||||||
| Disposals of financial instruments |
— | — | — | — | 14,000 | — | 14,000 | |||||||||||||||||||||||||
|
|
|
|
|
|
|
|
|
|
|
|
|
|
|
|
|
|||||||||||||||||
| Net cash flow used in investment activities |
— | — | — | (32,440 | ) | (32,440 | ) | (120,601 | ) | 20,287 | (132,754 | ) | ||||||||||||||||||||
|
|
|
|
|
|
|
|
|
|
|
|
|
|
|
|
|
|||||||||||||||||
| Financing activities |
||||||||||||||||||||||||||||||||
| Proceeds from borrowing from third parties |
— | — | — | — | — | 70,912 | — | 70,912 | ||||||||||||||||||||||||
| Proceeds from borrowing from group companies |
— | — | 86,908 | 13,548 | 100,456 | — | (12,137 | ) | 88,319 | |||||||||||||||||||||||
| Repayment of borrowing from third parties |
— | — | (86,908 | ) | (516 | ) | (87,424 | ) | (71,568 | ) | — | (158,992 | ) | |||||||||||||||||||
|
|
|
|
|
|
|
|
|
|
|
|
|
|
|
|
|
|||||||||||||||||
| Net cash flow from/(used in) financing activities |
— | — | — | 13,032 | 13,032 | (656 | ) | (12,137 | ) | 239 | ||||||||||||||||||||||
|
|
|
|
|
|
|
|
|
|
|
|
|
|
|
|
|
|||||||||||||||||
| Exchange differences |
— | (2,264 | ) | (20 | ) | 22 | 2 | (5,233 | ) | 7,816 | 321 | |||||||||||||||||||||
|
|
|
|
|
|
|
|
|
|
|
|
|
|
|
|
|
|||||||||||||||||
| Net increase/(decrease) in cash and cash equivalents |
— | 9,404 | (78 | ) | (33,632 | ) | (33,710 | ) | 10,939 | (9,428 | ) | (22,795 | ) | |||||||||||||||||||
|
|
|
|
|
|
|
|
|
|
|
|
|
|
|
|
|
|||||||||||||||||
| Cash and cash equivalents at beginning of period |
— | 25,850 | 227 | 151,456 | 151,683 | 61,687 | (25,729 | ) | 213,491 | |||||||||||||||||||||||
|
|
|
|
|
|
|
|
|
|
|
|
|
|
|
|
|
|||||||||||||||||
| Cash and cash equivalents at end of period |
— | 35,254 | 149 | 117,824 | 117,973 | 72,626 | (35,157 | ) | 190,696 | |||||||||||||||||||||||
|
|
|
|
|
|
|
|
|
|
|
|
|
|
|
|
|
|||||||||||||||||
| * | Restricted Group has been adjusted to remove the operations of Atento’s indirect subsidiaries in Brazil, Argentina, and its direct subsidiaries Atalaya Luxco 2 S.à.r.l. and Atalaya Luxco 3 S.à.r.l. The column includes Luxco 1 as parent of this “Guarantor Restricted Group”. |
| ** | Other is Atento’s indirect subsidiaries in Brazil, Argentina, and its direct subsidiaries Atalaya Luxco 2 S.à.r.l. and Atalaya Luxco 3 S.à.r.l. |
70
Table of Contents
For the Nine Months Ended September 30, 2015
| GUARANTORS | ||||||||||||||||||||||||||||||||
| Parent (Atento S.A.) |
Subsidiary Issuer (Luxco1) |
Guarantor (Midco) |
Guarantor (Restricted Group*) |
Total | Non- Guarantor (Other**) |
Eliminations | Consolidated (Atento S.A.) |
|||||||||||||||||||||||||
| Operating activities |
||||||||||||||||||||||||||||||||
| Profit/(loss) before tax |
(1,090 | ) | 6,908 | 19,486 | 1,277 | 20,763 | 43,956 | (7,108 | ) | 63,429 | ||||||||||||||||||||||
| Adjustments to profit/(loss): |
||||||||||||||||||||||||||||||||
| Amortization and depreciation |
— | — | — | 38,269 | 38,269 | 40,569 | — | 78,838 | ||||||||||||||||||||||||
| Impairment allowances |
— | — | — | 648 | 648 | 277 | — | 925 | ||||||||||||||||||||||||
| Change in provisions |
— | — | — | 369 | 369 | 1,094 | — | 1,463 | ||||||||||||||||||||||||
| Grants released to income |
— | — | — | (365 | ) | (365 | ) | — | — | (365 | ) | |||||||||||||||||||||
| Gains/(losses) on disposal of fixed assets |
— | — | — | 39 | 39 | 467 | — | 506 | ||||||||||||||||||||||||
| Finance income |
— | (36,717 | ) | (20,352 | ) | (1,099 | ) | (21,451 | ) | (14,440 | ) | 59,931 | (12,677 | ) | ||||||||||||||||||
| Finance expense |
— | 41,020 | 753 | 43,276 | 44,029 | 37,007 | (64,037 | ) | 58,019 | |||||||||||||||||||||||
| Net exchange differences |
(689 | ) | 1,687 | — | 762 | 762 | (647 | ) | (1,686 | ) | (573 | ) | ||||||||||||||||||||
| Change in fair value of financial instruments |
— | (14,043 | ) | — | (14,043 | ) | (14,043 | ) | — | 14,043 | (14,043 | ) | ||||||||||||||||||||
| Own work capitalized |
— | — | — | 15 | 15 | — | — | 15 | ||||||||||||||||||||||||
| Other gains |
— | — | — | — | — | (397 | ) | 1,430 | 1,033 | |||||||||||||||||||||||
|
|
|
|
|
|
|
|
|
|
|
|
|
|
|
|
|
|||||||||||||||||
| (689 | ) | (8,053 | ) | (19,599 | ) | 67,871 | 48,272 | 63,930 | 9,681 | 113,141 | ||||||||||||||||||||||
| Changes in working capital: |
||||||||||||||||||||||||||||||||
| Changes in trade and other receivables |
74 | (48 | ) | (240 | ) | (80,896 | ) | (81,136 | ) | (53,682 | ) | 36,604 | (98,188 | ) | ||||||||||||||||||
| Changes in trade and other payables |
(1,560 | ) | (426 | ) | 317 | 7,754 | 8,071 | 13,347 | (19,497 | ) | (65 | ) | ||||||||||||||||||||
| Other assets/(payables) |
668 | (3,260 | ) | (5 | ) | 8,785 | 8,780 | (24,876 | ) | (4,840 | ) | (23,528 | ) | |||||||||||||||||||
|
|
|
|
|
|
|
|
|
|
|
|
|
|
|
|
|
|||||||||||||||||
| (818 | ) | (3,734 | ) | 72 | (64,357 | ) | (64,285 | ) | (65,211 | ) | 12,267 | (121,781 | ) | |||||||||||||||||||
| Other cash flow from operating activities |
||||||||||||||||||||||||||||||||
| Interest paid |
— | (22,128 | ) | — | (22,582 | ) | (22,582 | ) | (25,450 | ) | 22,128 | (48,032 | ) | |||||||||||||||||||
| Interest received |
— | (376 | ) | — | (72 | ) | (72 | ) | 15,313 | 377 | 15,242 | |||||||||||||||||||||
| Income tax paid |
(4 | ) | (59 | ) | (4 | ) | (11,267 | ) | (11,271 | ) | (1,697 | ) | 59 | (12,972 | ) | |||||||||||||||||
| Other payments |
— | — | — | (3,895 | ) | (3,895 | ) | (8,404 | ) | (1 | ) | (12,300 | ) | |||||||||||||||||||
|
|
|
|
|
|
|
|
|
|
|
|
|
|
|
|
|
|||||||||||||||||
| (4 | ) | (22,563 | ) | (4 | ) | (37,816 | ) | (37,820 | ) | (20,238 | ) | 22,563 | (58,062 | ) | ||||||||||||||||||
|
|
|
|
|
|
|
|
|
|
|
|
|
|
|
|
|
|||||||||||||||||
| Net cash flow from/(used in) operating activities |
(2,601 | ) | (27,442 | ) | (45 | ) | (33,025 | ) | (33,070 | ) | 22,437 | 37,403 | (3,273 | ) | ||||||||||||||||||
|
|
|
|
|
|
|
|
|
|
|
|
|
|
|
|
|
|||||||||||||||||
71
Table of Contents
| Investment activities |
||||||||||||||||||||||||||||||||
| Payments for acquisition of intangible assets |
— | — | — | (4,971 | ) | (4,971 | ) | (10,166 | ) | — | (15,137 | ) | ||||||||||||||||||||
| Payments for acquisition of property, plant and equipment |
— | — | — | (13,090 | ) | (13,090 | ) | (32,466 | ) | — | (45,556 | ) | ||||||||||||||||||||
| Disposals of intangible assets |
— | — | — | 353 | 353 | 379 | — | 732 | ||||||||||||||||||||||||
| Disposals of property, plant and equipment |
— | — | — | 885 | 885 | 746 | — | 1,631 | ||||||||||||||||||||||||
| Disposals of financial instruments |
— | — | — | (10 | ) | (10 | ) | 26,876 | — | 26,866 | ||||||||||||||||||||||
|
|
|
|
|
|
|
|
|
|
|
|
|
|
|
|
|
|||||||||||||||||
| Net cash flow used in investment activities |
— | — | — | (16,833 | ) | (16,833 | ) | (14,631 | ) | — | (31,464 | ) | ||||||||||||||||||||
|
|
|
|
|
|
|
|
|
|
|
|
|
|
|
|
|
|||||||||||||||||
| Financing activities |
||||||||||||||||||||||||||||||||
| Proceeds from borrowing from third parties |
— | — | — | — | — | 29,239 | — | 29,239 | ||||||||||||||||||||||||
| Proceeds from borrowing from group companies |
— | 14,139 | — | 14,139 | 14,139 | 1 | (28,279 | ) | — | |||||||||||||||||||||||
| Repayment of borrowing from third parties |
— | — | — | (159 | ) | (159 | ) | (1,564 | ) | — | (1,723 | ) | ||||||||||||||||||||
| Repayment of borrowing from group companies |
— | 8,525 | — | — | — | (4,178 | ) | (4,347 | ) | — | ||||||||||||||||||||||
|
|
|
|
|
|
|
|
|
|
|
|
|
|
|
|
|
|||||||||||||||||
| Net cash flow from/(used in) financing activities |
— | 22,664 | — | 13,980 | 13,980 | 23,498 | (32,626 | ) | 27,516 | |||||||||||||||||||||||
|
|
|
|
|
|
|
|
|
|
|
|
|
|
|
|
|
|||||||||||||||||
| Exchange differences |
(721 | ) | — | (5 | ) | (11,926 | ) | (11,931 | ) | (16,904 | ) | (7 | ) | (29,563 | ) | |||||||||||||||||
|
|
|
|
|
|
|
|
|
|
|
|
|
|
|
|
|
|||||||||||||||||
| Net increase/(decrease) in cash and cash equivalents |
(3,322 | ) | (4,778 | ) | (50 | ) | (47,804 | ) | (47,854 | ) | 14,400 | 4,770 | (36,784 | ) | ||||||||||||||||||
|
|
|
|
|
|
|
|
|
|
|
|
|
|
|
|
|
|||||||||||||||||
| Cash and cash equivalents at beginning of period |
9,333 | 29,327 | 65 | 145,144 | 145,209 | 56,810 | (29,239 | ) | 211,440 | |||||||||||||||||||||||
|
|
|
|
|
|
|
|
|
|
|
|
|
|
|
|
|
|||||||||||||||||
| Cash and cash equivalents at end of period |
6,011 | 24,549 | 15 | 97,341 | 97,356 | 71,210 | (24,470 | ) | 174,656 | |||||||||||||||||||||||
|
|
|
|
|
|
|
|
|
|
|
|
|
|
|
|
|
|||||||||||||||||
| * | Restricted Group has been adjusted to remove the operations of Atento’s indirect subsidiaries in Brazil, Argentina, and its direct subsidiaries Atalaya Luxco 2 S.à.r.l. and Atalaya Luxco 3 S.à.r.l. The column includes Luxco 1 as parent of this “Guarantor Restricted Group”. |
| ** | Other is Atento’s indirect subsidiaries in Brazil, Argentina, and its direct subsidiaries Atalaya Luxco 2 S.à.r.l. and Atalaya Luxco 3 S.à.r.l. |
72
Table of Contents
17. OTHER INFORMATION
| a. | Guarantees and commitments |
At September 30, 2015, the Company has guarantees and commitments with third parties amounting to 231,820 thousand U.S. dollars (234,990 thousand U.S. dollars at December 31, 2014).
The Company’s directors consider that no contingencies will arise from these guarantees in addition to those already recognized.
There has not been any material instance of a guarantee being drawn upon for the periods indicated, nor does management anticipate any liability as a result of a draw upon a guarantee in the future.
The total amount of operating lease expenses recognized in the interim consolidated income statement for the nine months ended September 30, 2015 was 57,753 thousand U.S. dollars (79,381 thousand U.S. dollars at September 30, 2014).
There are no contingent payments on operating leases recognized in the interim consolidated income statements for the three months ended September 30, 2014 and 2015.
The operating leases where the Company acts as lessee are mainly on premises intended for use as call centers. These leases have various termination dates, with the latest terminating in 2025. As of September 30, 2015, the payment commitment for the early cancellation of these leases is 123,784 thousand U.S. dollars (141,779 thousand U.S. dollars at December 31, 2014).
18. EVENTS AFTER THE REPORTING PERIOD
A total of 125,509 Time RSUs of the Time Restricted Stock Unit Award Agreement became vested as of October 1, 2015. The impact of this transaction on the fourth quarter financial information profit and loss is not material.
73
Table of Contents
See Note 5 to the Interim Consolidated Financial Statements.
There were no material changes to the risk factors described in section “Risk Factors” in our Annual Form 20-F, for the year ended December 31, 2014.
74
Table of Contents
SIGNATURES
Pursuant to the requirements of the Securities Exchange Act of 1934, the registrant has duly caused this report to be signed on its behalf by the undersigned, thereunto duly authorized.
| ATENTO S.A. | ||||||
| Date: November 09, 2015 |
||||||
| By: |
/s/ Alejandro Reynal | |||||
| Name: |
Alejandro Reynal | |||||
| Title: |
Chief Executive Officer | |||||
| By: |
/s/ Mauricio Montilha | |||||
| Name: |
Mauricio Montilha | |||||
| Title: |
Chief Financial Officer | |||||
75
Exhibit 99.1

PRESS RELEASE
Atento Reports Third Quarter Fiscal 2015 Results
9.4% Growth in Revenue Increases Leadership Position in LatAm CRM/BPO Market
| • |
Growth in revenue led by double-digit gains in Latin America |
| • |
Improvement in adjusted EBITDA driven by revenue growth, increased productivity and efficiencies |
| • |
Adjusted EPS of $0.31, up 35.4% |
| • |
Positive free cash flow and strong liquidity enhance financial flexibility |
NEW YORK, NY, November 9, 2015 – Atento S.A. (NYSE: ATTO), the largest provider of customer relationship management and business process outsourcing services in Latin America and Spain, drove growth in both revenue and key profitability measures during the company’s fiscal-2015 third quarter ended September 30, 2015. All comparisons are on a constant currency (CCY) basis and year-over-year unless noted otherwise.
Summary
| ($ in millions) |
Q3 2015 | Q3 2014 | 9M 2015 | 9M 2014 | ||||||||||||
| Revenue |
476.2 | 589.6 | 1,507.8 | 1,743.3 | ||||||||||||
| CCY growth (1) |
9.4 | % | 10.0 | % | ||||||||||||
| Adjusted EBITDA |
65.8 | 88.2 | 186.2 | 219.8 | ||||||||||||
| Margin |
13.8 | % | 15.0 | % | 12.3 | % | 12.6 | % | ||||||||
| CCY growth |
4.2 | % | 10.0 | % | ||||||||||||
| Adjusted EPS(2) |
$ | 0.31 | $ | 0.45 | $ | 0.73 | $ | 0.84 | ||||||||
| CCY growth |
35.4 | % | 16.4 | % | ||||||||||||
| Leverage (x) (3) |
1.5 | 1.4 | 1.5 | 1.4 | ||||||||||||
| (1) |
Constant currency revenue growth from continuing operations excludes the Czech Republic, which was divested in December 2014. |
| (2) |
Adjusted earnings per share, for the period ended September 30, 2015, were calculated considering the number of ordinary shares of 73,648,760. For the period ended September 30, 2014 the number of ordinary shares was 73,619,511. |
| (3) |
Considered the pro-forma Net Debt adjusted to give effect to the Reorganization Transaction, regarding Preferred Equity Certificates. |
“We achieved solid sustained, balanced growth and profitability in the third quarter despite operating in a challenging macroeconomic environment. We continue to deliver more value to our clients and provide them with the best and most efficient customer experience solutions,” said Alejandro Reynal, Atento´s Chief Executive Officer. “At the same time, we have further enhanced our overall financial strength and flexibility, by generating $15.3 million in free cash flow, and ending the quarter with $230 million in liquidity and a net leverage of 1.5 times. This strong financial position makes Atento an even more reliable partner for our clients, especially in this challenging environment.”
Mr. Reynal said that although not immune to current macroeconomic headwinds and its future uncertainties, the Company is extending its CRM/BPO leadership in Latin America. Atento is best positioned to continue gaining new business and market share thanks to its unique value proposition, scale, vertical expertise and long lasting client relationships. As a result, the Company is reaffirming its guidance for Fiscal 2015.
All growth rates are in constant currency and year-over-year unless noted otherwise
1
PRESS RELEASE
Consolidated Operating Results
Revenue for the quarter, excluding the Czech Republic which was divested in December 2014, increased 9.4%. This growth was driven by a 9.0% increase in Brazil, a 15.9% increase in the Americas, and improvement in sequential growth in EMEA. On a reported basis, revenue declined 19.2%.
Adjusted EBITDA increased 4.2% while adjusted EBITDA margin declined 120 basis points to 13.8%. This decline was driven by a shift in the mix of countries (particularly Brazil) due to material devaluation of currencies, and a shift in timing of pass through of wage inflation into price increases in Argentina, which had a neutral impact year-to-date. On a constant currency basis adjusted EBITDA margin was down 70 basis points to 14.3% in the quarter, and up 10 basis points to 12.7% year-to-date.
Adjusted EPS increased 35.4% to $0.31, driven by the increase in adjusted EBITDA, a decline in net interest expense and lower tax expense.
In the quarter, the Company generated $15.3 million in free cash flow.
Adjusted quarterly earnings and EBITDA are non-GAAP financial measures and are reconciled to their most directly comparable GAAP measures in the accompanying financial tables.
Segment Reporting
| Q3 2015 | Q3 2014 | 9M 2015 | 9M 2014 | |||||||||||||
| Brazil Region |
||||||||||||||||
| Revenue |
216.5 | 307.7 | 737.6 | 906.2 | ||||||||||||
| CCY growth |
9.0 | % | 11.7 | % | ||||||||||||
| Adjusted EBITDA |
33.6 | 46.8 | 100.0 | 123.7 | ||||||||||||
| Margin |
15.5 | % | 15.2 | % | 13.6 | % | 13.7 | % | ||||||||
| CCY growth |
13.2 | % | 13.4 | % | ||||||||||||
|
|
|
|
|
|
|
|
|
|||||||||
| Americas Region |
||||||||||||||||
| Revenue |
200.3 | 204.3 | 585.9 | 576.7 | ||||||||||||
| CCY growth |
15.9 | % | 16.6 | % | ||||||||||||
| Adjusted EBITDA |
28.2 | 35.5 | 79.9 | 85.2 | ||||||||||||
| Margin |
14.1 | % | 17.4 | % | 13.6 | % | 14.8 | % | ||||||||
| CCY growth |
-3.1 | % | 9.9 | % | ||||||||||||
|
|
|
|
|
|
|
|
|
|||||||||
| EMEA Region |
||||||||||||||||
| Revenue |
59.8 | 77.7 | 185.7 | 260.8 | ||||||||||||
| CCY growth(1) |
-5.5 | % | -10.8 | % | ||||||||||||
| Adjusted EBITDA |
5.3 | 6.5 | 11.7 | 17.4 | ||||||||||||
| Margin |
8.9 | % | 8.4 | % | 6.3 | % | 6.7 | % | ||||||||
| CCY growth |
-3.1 | % | -18.2 | % | ||||||||||||
|
|
|
|
|
|
|
|
|
|||||||||
| (1) |
Constant currency revenue growth from continuing operations excludes the Czech Republic, which was divested in December 2014 |
2
PRESS RELEASE
Brazil Region
Revenue for the Brazil region increased 9.0% driven by a 16.9% increase in revenue from non-Telefónica clients. This growth was supported by new clients, increased share of wallet with existing clients, particularly in financial services, and an increase in the mix of higher value-added solutions. Revenue from Telefónica declined 2.4% due to macro-driven declines in volume. On a reported basis, revenue declined 29.6%.
Adjusted EBITDA improved 13.2% while margin increased 30 basis points to 15.5%. This improvement in profitability was driven by the strong growth in revenue and cost and efficiency initiatives, which were partially offset by the ramp of new clients and the increasing adverse macro-economic conditions. Excluding the impact of corporate cost allocations, adjusted EBITDA was $55.9 million and margin decreased 30 basis points to 16.3%.
Americas Region
Revenue for the Americas region increased 15.9% supported by a 23.1% increase in revenue from non-Telefónica clients and an 8.2% increase in revenue from Telefónica. The strong growth with non-Telefónica clients was supported by new and existing clients, especially in Peru, Colombia and U.S. nearshore. Growth in revenue from Telefónica was driven by Mexico, Peru and Argentina. On a reported basis revenue decreased 2.0%.
Adjusted EBITDA declined 3.1% and margin declined 330 basis points to 14.1%. Excluding the impact of corporate cost allocations, adjusted EBITDA was $38.2 million and margin decreased 270 basis points to 15.7%. The decline in profitability was mostly driven by a shift in the timing of the pass through of wage inflation into price increases in Argentina, which had a neutral impact year-to-date, as well as a shift in country mix.
EMEA Region
Revenue for the EMEA region declined 5.5%, driven by an 8.6% decrease in revenue from non-Telefónica clients. These declines were attributed to lower volumes from Public Administration contracts in Spain, which more than offset stronger growth from private sector clients. Revenue from Telefónica declined 3.6%. On a reported basis, revenue declined 23.0%.
Adjusted EBITDA declined 3.1%, largely driven by the decline in revenue, while adjusted EBITDA margin increased 50 basis points to 8.9%. The growth in adjusted EBITDA margin was driven by cost and efficiency initiatives partially offset by the ramp of new clients and shifts in revenue mix. Excluding the impact of corporate cost allocations, adjusted EBITDA was $6.5 million and margin increased 70 basis points to 9.1%.
Strong Balance Sheet and Ample Liquidity Enhancing Financial Flexibility
At September 30, 2015, the Company had cash, cash equivalents and short-term financial investments totaling $174.7 million, undrawn revolving credit facilities of €50 million and total net debt with third parties of $398.0 million, a decline of $32.6 million. The Company’s LTM adjusted EBITDA to net debt with third parties decreased to 1.5x.
During the third quarter of 2015, the Company invested $16.2 million, or 3.4% of revenue, in cash capital expenditures related to investments in maintenance and growth.
3
PRESS RELEASE
Fiscal 2015 Outlook
The Company reiterated its previously disclosed fiscal 2015 revenue growth target of 6% to 9%, and adjusted EBITDA margin in the range of 13% to 13.5%, both in constant currency. Given the increasing adverse effects of the negative macro-economic environment in Brazil, and shifts in business mix, the Company believes it will be at the low end of this margin range. The Company is targeting capex as a percent of revenue of 6% as it invests in the growth of new clients, net interest expense between $72 and $76 million, an effective tax rate of approximately 32%, and a fully diluted share count of approximately 73.8 million shares.
This guidance assumes no acquisitions or changes in the current operating environment, capital structure or exchange rates movements on the translation of our financial statements in USD.
Conference Call
Atento will host a conference call and webcast for analysts on Monday, November 9, 2015 at 8:00 am ET to discuss the financial results. The conference call can be accessed by dialing: +1 (877) 407-3982 toll free domestic, UK: (+44) 0 800 756 3429 toll free, Brazil: (+55) 0 800 891 6221 toll free, or Spain: (+34) 900 834 236 toll free. All other international callers can access the conference call by dialing: +1 (201) 493-6780 toll free. No passcode is required. Individuals who dial in will be asked to identify themselves and their affiliations. The conference call will also be webcasted through a link on Atento’s Investor Relations website at investors.atento.com. A web-based archive of the conference call will also be available at the above website.
About Atento
Atento is the largest provider of customer relationship management and business process outsourcing (CRM BPO) services in Latin America and among the top three providers globally, based on revenues. Atento is also a leading provider for U.S.-based companies nearshoring CRM/BPO services to Latin America. Since 1999, the Company has developed its business model in 14 countries where it employs over 160,000 people. Atento has over 400 clients to whom it offers a wide range of CRM BPO services across multiple channels. Atento’s clients are mostly leading multinational corporations in sectors such as telecommunications, banking and financial services, media and technology, health, retail and public administrations, among others. Atento’s shares trade under the symbol ATTO on the New York Stock Exchange (NYSE). For more information visit www.atento.com.
Investor Relations
Lynn Antipas Tyson + 1 914 485 1150
Media
Maite Cordero + 34 917 40 74 47
4
PRESS RELEASE
Forward-Looking Statements
This press release contains forward-looking statements. Forward-looking statements can be identified by the use of words such as “may,” “should,” “expects,” “plans,” “anticipates,” “believes,” “estimates,” “predicts,” “intends,” “continue” or similar terminology. These statements reflect only Atento’s current expectations and are not guarantees of future performance or results. These statements are subject to risks and uncertainties that could cause actual results to differ materially from those contained in the forward-looking statements. These risks and uncertainties include, but are not limited to, competition in Atento’s highly competitive industries; increases in the cost of voice and data services or significant interruptions in these services; Atento’s ability to keep pace with its clients’ needs for rapid technological change and systems availability; the continued deployment and adoption of emerging technologies; the loss, financial difficulties or bankruptcy of any key clients; the effects of global economic trends on the businesses of Atento’s clients; the non-exclusive nature of Atento’s client contracts and the absence of revenue commitments; security and privacy breaches of the systems Atento uses to protect personal data; the cost of pending and future litigation; the cost of defending Atento against intellectual property infringement claims; extensive regulation affecting many of Atento’s businesses; Atento’s ability to protect its proprietary information or technology; service interruptions to Atento’s data and operation centers; Atento’s ability to retain key personnel and attract a sufficient number of qualified employees; increases in labor costs and turnover rates; the political, economic and other conditions in the countries where Atento operates; changes in foreign exchange rates; Atento’s ability to complete future acquisitions and integrate or achieve the objectives of its recent and future acquisitions; future impairments of our substantial goodwill, intangible assets, or other long-lived assets; and Atento’s ability to recover consumer receivables on behalf of its clients. In addition, Atento is subject to risks related to its level of indebtedness. Such risks include Atento’s ability to generate sufficient cash to service its indebtedness and fund its other liquidity needs; Atento’s ability to comply with covenants contained in its debt instruments; the ability to obtain additional financing; the incurrence of significant additional indebtedness by Atento and its subsidiaries; and the ability of Atento’s lenders to fulfill their lending commitments. Atento is also subject to other risk factors described in documents filed by the company with the United States Securities and Exchange Commission.
These forward-looking statements speak only as of the date on which the statements were made. Atento undertakes no obligation to update or revise publicly any forward-looking statements, whether as a result of new information, future events or otherwise.
SELECTED FINANCIAL DATA
The following selected financial information should be read in conjunction with the interim consolidated financial statements and the section entitled “Management’s Discussion and Analysis of Financial Condition and Results of Operations” presented elsewhere in the Form 6-K.
5
PRESS RELEASE
Consolidated Income Statement
| For three months ended September 30, |
Change excluding |
For nine months ended September 30, |
Change excluding |
|||||||||||||||||||||
| 2015 | 2014 | FX (%) | 2015 | 2014 | FX (%) | |||||||||||||||||||
| (unaudited) | (unaudited) | |||||||||||||||||||||||
| Revenue |
476.2 | 589.6 | 9.0 | 1,507.8 | 1,743.3 | 9.5 | ||||||||||||||||||
| Other operating income |
0.8 | 0.9 | — | 2.0 | 1.8 | 33.3 | ||||||||||||||||||
| Own work capitalized |
— | 0.2 | N.M. | — | 0.4 | N.M. | ||||||||||||||||||
| Other gains |
— | (0.4 | ) | N.M. | — | 34.5 | N.M. | |||||||||||||||||
| Supplies |
(20.4 | ) | (27.1 | ) | 1.1 | (59.8 | ) | (79.2 | ) | (3.2 | ) | |||||||||||||
| Employee benefit expenses |
(338.3 | ) | (403.0 | ) | 12.4 | (1,093.4 | ) | (1,246.4 | ) | 10.4 | ||||||||||||||
| Depreciation |
(12.0 | ) | (14.9 | ) | 11.4 | (38.4 | ) | (44.4 | ) | 10.1 | ||||||||||||||
| Amortization |
(12.4 | ) | (15.1 | ) | 11.9 | (40.4 | ) | (47.2 | ) | 9.5 | ||||||||||||||
| Changes in trade provisions |
(0.4 | ) | 0.1 | N.M. | (0.9 | ) | (0.2 | ) | N.M. | |||||||||||||||
| Other operating expenses |
(58.5 | ) | (83.2 | ) | (3.4 | ) | (182.7 | ) | (250.3 | ) | (6.8 | ) | ||||||||||||
| Impairment charges |
— | 0.4 | N.M. | — | (32.5 | ) | N.M. | |||||||||||||||||
|
|
|
|
|
|
|
|
|
|
|
|
|
|||||||||||||
| Total Operating Expenses |
(442.0 | ) | (542.8 | ) | 9.6 | (1,415.6 | ) | (1,700.2 | ) | 5.1 | ||||||||||||||
|
|
|
|
|
|
|
|
|
|
|
|
|
|||||||||||||
| OPERATING PROFIT/(LOSS) |
35.0 | 47.5 | 2.7 | 94.2 | 79.8 | 54.5 | ||||||||||||||||||
|
|
|
|
|
|
|
|
|
|
|
|
|
|||||||||||||
| Finance income |
4.9 | 8.5 | (9.4 | ) | 12.7 | 13.4 | 30.6 | |||||||||||||||||
| Finance costs |
(17.9 | ) | (32.4 | ) | (15.4 | ) | (58.0 | ) | (100.5 | ) | (23.5 | ) | ||||||||||||
| Net foreign exchange gains/(loss) |
3.5 | (7.2 | ) | N.M. | 14.6 | (11.1 | ) | N.M. | ||||||||||||||||
|
|
|
|
|
|
|
|
|
|
|
|
|
|||||||||||||
| NET FINANCE EXPENSE |
(9.5 | ) | (31.1 | ) | (55.9 | ) | (30.7 | ) | (98.2 | ) | (55.8 | ) | ||||||||||||
|
|
|
|
|
|
|
|
|
|
|
|
|
|||||||||||||
| PROFIT/(LOSS) BEFORE TAX |
25.5 | 16.4 | 114.0 | 63.4 | (18.4 | ) | (534.2 | ) | ||||||||||||||||
|
|
|
|
|
|
|
|
|
|
|
|
|
|||||||||||||
| Income tax expenses |
(8.8 | ) | (8.4 | ) | 45.2 | (19.7 | ) | 2.1 | N.M. | |||||||||||||||
| PROFIT/(LOSS) FOR THE PERIOD ATTRIBUTABLE TO EQUITY HOLDERS OF THE PARENT |
16.7 | 8.0 | 186.3 | 43.7 | (16.3 | ) | N.M. | |||||||||||||||||
| Adjusted Basic result per share (per U.S. dollars) |
0.23 | 0.11 | 186.3 | 0.59 | (0.22 | ) | N.M. | |||||||||||||||||
6
PRESS RELEASE
Reconciliation of EBITDA and Adjusted EBITDA to Profit/(Loss) for the Period from Continuing Operations
| For the three months ended September 30, |
For the nine months ended September 30, |
|||||||||||||||
| ($ in millions) |
2015 | 2014 | 2015 | 2014 | ||||||||||||
| (unaudited) | (unaudited) | |||||||||||||||
| Profit/(loss) for the period |
16.7 | 8.0 | 43.7 | (16.3 | ) | |||||||||||
|
|
|
|
|
|
|
|
|
|||||||||
| Net finance expense |
9.5 | 31.1 | 30.7 | 98.2 | ||||||||||||
| Income tax expense |
8.8 | 8.4 | 19.7 | (2.1 | ) | |||||||||||
| Depreciation and amortization |
24.4 | 30.0 | 78.8 | 91.6 | ||||||||||||
|
|
|
|
|
|
|
|
|
|||||||||
| EBITDA(2) (non-GAAP) |
59.4 | 77.5 | 172.9 | 171.4 | ||||||||||||
|
|
|
|
|
|
|
|
|
|||||||||
| Acquisition and integration related costs(a) |
— | 2.3 | 0.1 | 7.7 | ||||||||||||
| Restructuring costs(b) |
4.1 | 2.3 | 7.8 | 23.8 | ||||||||||||
| Sponsor management fees(c) |
— | 2.5 | — | 7.3 | ||||||||||||
| Site relocation costs(d) |
— | 0.4 | 0.5 | 1.4 | ||||||||||||
| Financing and IPO fees (e) |
— | 3.5 | 0.3 | 11.1 | ||||||||||||
| Asset impairments and Others (f) |
2.3 | (0.3 | ) | 4.6 | (2.9 | ) | ||||||||||
|
|
|
|
|
|
|
|
|
|||||||||
| Adjusted EBITDA(2) (non-GAAP) |
65.8 | 88.2 | 186.2 | 219.8 | ||||||||||||
|
|
|
|
|
|
|
|
|
|||||||||
| (a) |
Acquisition and integration related costs incurred for the three months ended September 30, 2014 primarily resulted from consulting fees incurred in connection with the full strategy review including our growth implementation plan and operational set-up with a leading consulting firm. During the three months ended September 30, 2015, we have no cost related to acquisition and integration process. These projects were substantially completed by the end of 2014. |
Acquisition and integration costs incurred for the nine months ended September 30, 2014 primarily resulted from consulting fees incurred in connection with the full strategy review including our growth implementation plan and operational set-up with a leading consulting firm, improving the efficiency in procurement and IT transformation projects. Acquisition and integration related costs incurred for the nine months ended September 30, 2015 are costs associated primarily with financial and operational improvements related to SAP IT transformation project cost incurred during the three months ended March 31, 2015.
| (b) |
Restructuring costs incurred for the three months ended September 30, 2014 primarily relate to headcount restructuring activities in Spain, restructuring cost in Argentina and the relocation of corporate headquarters. Restructuring costs incurred for the three months ended September 30, 2015 primarily relates to labor force optimization in Brazil to adapt the structure to business requirement and in EMEA as a consequence of a reduction in activity levels during 2015. |
| (c) |
Sponsor management fees represent the annual advisory fee paid to Bain Capital Partners, LLC that were expensed. The advisory agreement was terminated in connection with the initial public offering. |
7
PRESS RELEASE
| (d) |
Site relocation costs incurred for the three and nine months ended September 30, 2014 and 2015 include costs associated with our current strategic initiative of relocating call centers from tier 1 cities to tier 2 cities in Brazil in order to achieve efficiencies through rental cost reduction and attrition and absenteeism improvement. |
| (e) |
Financing and IPO fees for the three and nine months ended September 30, 2014 primarily relate to non-core professional fees incurred by us during the initial public offering process, including advisory, auditing and legal expenses among others. Financing and IPO fees for the three and nine months ended September 30, 2015 relate to remaining cost incurred during the three months ended March 31, 2015 in connection with the initial public offering process. |
| (f) |
Asset impairment and other costs for the three and nine months ended September 30, 2014 mainly relate to the goodwill and other intangible asset impairment relating to our operation in Czech Republic (divested in December 2014) of $3.7 million and Spain $28.8 million, offset by the amendment of the MSA with Telefónica, by which the minimum revenue commitment for Spain was reduced against a $34.5 million penalty fee compensated by Telefónica. |
Asset impairment and other costs for the three and nine months ended September 30, 2015 mainly refer to costs in Brazil, Spain and Mexico ($2.5 million) of efficiency projects, fees incurred during the three months ended March 31, 2015, related to Czech Republic divested operation in December 2014 ($2.5 million).
8
PRESS RELEASE
Reconciliation of Adjusted Earnings to Earnings/(Loss) for the Period from Continuing Operations
| For the three months ended September 30, |
For the nine months ended September 30, |
|||||||||||||||
| ($ in millions, except percentage changes) |
2015 | 2014 | 2015 | 2014 | ||||||||||||
| (unaudited) | (unaudited) | |||||||||||||||
| Profit/(Loss) attributable to equity holders of the parent |
16.7 | 8.0 | 43.7 | (16.3 | ) | |||||||||||
|
|
|
|
|
|
|
|
|
|||||||||
| Acquisition and integration related Costs (a) |
— | 2.3 | 0.1 | 7.7 | ||||||||||||
| Amortization of Acquisition related Intangible assets (b) |
7.0 | 8.9 | 21.6 | 28.5 | ||||||||||||
| Restructuring Costs (c) |
4.1 | 2.3 | 7.8 | 23.8 | ||||||||||||
| Sponsor management fees (d) |
— | 2.5 | — | 7.3 | ||||||||||||
| Site relocation costs (e) |
— | 0.4 | 0.5 | 1.4 | ||||||||||||
| Financing and IPO fees (f) |
— | 3.5 | 0.3 | 11.1 | ||||||||||||
| PECs interest expense (g) |
— | 7.2 | — | 25.8 | ||||||||||||
| Asset impairments and Others (h) |
2.3 | (0.3 | ) | 4.6 | (2.9 | ) | ||||||||||
| Net foreign exchange gain of financial instruments (i) |
— | — | (14.0 | ) | — | |||||||||||
| Net foreign exchange impacts (j) |
(3.5 | ) | 7.2 | (0.6 | ) | 11.1 | ||||||||||
| Tax effect (k) |
(4.1 | ) | (9.2 | ) | (10.2 | ) | (35.4 | ) | ||||||||
|
|
|
|
|
|
|
|
|
|||||||||
| Adjusted Earnings (non-GAAP) (unaudited) |
22.5 | 32.8 | 53.6 | 62.1 | ||||||||||||
|
|
|
|
|
|
|
|
|
|||||||||
| Adjusted Earnings per share - Basic (in U.S. dollars) (*) |
0.31 | 0.45 | 0.73 | 0.84 | ||||||||||||
|
|
|
|
|
|
|
|
|
|||||||||
| (a) |
Acquisition and integration related costs incurred for the three months ended September 30, 2014 primarily resulted from consulting fees incurred in connection with the full strategy review including our growth implementation plan and operational set-up with a leading consulting firm. During the three months ended September 30, 2015, we have no cost related to acquisition and integration process. These projects were substantially completed by the end of 2014. |
Acquisition and integration costs incurred for the nine months ended September 30, 2014 primarily resulted from consulting fees incurred in connection with the full strategy review including our growth implementation plan and operational set-up with a leading consulting firm, improving the efficiency in procurement and IT transformation projects. Acquisition and integration related costs incurred for the nine months ended September 30, 2015 are costs associated primarily with financial and operational improvements related to SAP IT transformation project cost incurred during the three months ended March 31, 2015.
| (b) |
Amortization of Acquisition related intangible assets represents the amortization expense of intangible assets resulting from the Acquisition and has been adjusted to eliminate the impact of the amortization arising from the Acquisition which is not in the ordinary course of our daily operations and distorts comparison with peers and results for prior periods. Such intangible assets primarily include contractual relationships with clients, for which the useful life has been estimated at primarily nine years. |
| (c) |
Restructuring costs incurred for the three months ended September 30, 2014 primarily relate to headcount restructuring activities in Spain, restructuring cost in Argentina and the relocation of corporate headquarters. Restructuring costs incurred for the three months ended September 30, 2015 primarily relates to labor force |
9
PRESS RELEASE
optimization in Brazil to adapt the structure to business requirement and in EMEA as a consequence of a reduction in activity levels during 2015.
| (d) |
Sponsor management fees represent the annual advisory fee paid to Bain Capital Partners, LLC that were expensed. The advisory agreement was terminated in connection with the initial public offering. |
| (e) |
Site relocation costs incurred for the three and nine months ended September 30, 2014 and 2015 include costs associated with our current strategic initiative of relocating call centers from tier 1 cities to tier 2 cities in Brazil in order to achieve efficiencies through rental cost reduction and attrition and absenteeism improvement. |
| (f) |
Financing and IPO fees for the three and nine months ended September 30, 2014 primarily relate to non-core professional fees incurred by us during the initial public offering process, including advisory, auditing and legal expenses among others. Financing and IPO fees for the three and nine months ended September 30, 2015 relate to remaining cost incurred during the three months ended March 31, 2015 in connection with the initial public offering process. |
| (g) |
PECs interest expense represents accrued interest on the preferred equity certificates. In the fourth quarter of 2014, the PECs were capitalized in connection with the IPO. |
| (h) |
Asset impairment and other costs for the three and nine months ended September 30, 2014 mainly relate to the goodwill and other intangible asset impairment relating to our operation in Czech Republic (divested in December 2014) of $3.7 million and Spain $28.8 million, offset by the amendment of the MSA with Telefónica, by which the minimum revenue commitment for Spain was reduced against a $34.5 million penalty fee compensated by Telefónica. |
Asset impairment and other costs for the three and nine months ended September 30, 2015 mainly refer to costs in Brazil, Spain and Mexico ($2.5 million) of efficiency projects, fees incurred during the three months ended March 31, 2015, related to Czech Republic divested operation in December 2014 ($2.5 million).
| (i) |
As of April 1, 2015, the Company designated the foreign currency risk on certain of its subsidiaries as net investment hedges using financial instruments as the hedging items. As a consequence, any gain or loss on the hedging instrument, related to the effective portion of the hedge will be recognized in other comprehensive income (equity) as from that date. The gain or loss related to the ineffective portion will be recognized in the income statement. Cumulative net foreign exchange gain of such instruments was reversed from Equity to profit/(loss) in the three months ended March 31, 2015 in the amount of $13.0 million in the three months ended September 30, 2015 an amount of $1.0 million. For comparability, this one off adjustment was added back to calculate adjusted earnings. |
| (j) |
As of 2015, management analyzes the Company financial condition performance excluding net foreign exchange impacts, which eliminates the volatility to foreign exchange variances from our operational results. For comparability purposes, 2014 adjusted earnings was restated by the net foreign exchange non-cash results from currency fluctuations impacting loans between group companies and other minor effects. |
| (k) |
The tax effect represents the tax impact of the total adjustments based on a tax rate of 34.3% for the period from July 1, 2014, to September 30, 2014 and 30.4% for the period from July 1, 2015, to September 30, 2015, 34.5% for the period from January 1, 2014, to September 30, 2014 and 29.4% for the period from January 1, 2015 to September 30, 2015. |
| (*) |
The adjusted earnings per share, for the period presented in the table above, were calculated considering the |
10
PRESS RELEASE
| number of ordinary shares of 73,648,760 (weighted average number of ordinary shares) as of September 30, 2015. For the period ended September 30, 2014 the number of ordinary shares was 73,619,511. |
11
PRESS RELEASE
Reconciliation of Total Debt to Net Debt with Third Parties
| As of September 30, | ||||||||
| (unaudited) | ||||||||
| ($ in millions, except Net Debt/Adj. EBITDA LTM) |
2015 | 2014 | ||||||
| Cash and cash equivalents |
174.7 | 190.7 | ||||||
| Short term financial investments |
— | 52.6 | ||||||
| Debt: |
||||||||
| 7.375% Sr. Sec. Notes due 2020 |
295.9 | 294.4 | ||||||
| Brazilian Debentures |
172.4 | 267.7 | ||||||
| Vendor Loan Note (1) |
— | — | ||||||
| Contingent Value Instrument |
35.5 | 36.1 | ||||||
| Preferred Equity Certificates |
— | — | ||||||
| Finance Lease Payables |
4.7 | 8.7 | ||||||
| Other Borrowings |
64.2 | 67.0 | ||||||
|
|
|
|
|
|||||
| Total Debt |
572.7 | 673.9 | ||||||
|
|
|
|
|
|||||
| Preferred Equity Certificates |
— | — | ||||||
|
|
|
|
|
|||||
| Total Debt excluding PECs |
572.7 | 673.9 | ||||||
|
|
|
|
|
|||||
| Net Debt with third parties (2) (unaudited) |
398.0 | 430.6 | ||||||
|
|
|
|
|
|||||
| Adjusted EBITDA LTM (3) (non - GAAP) (unaudited) |
271.8 | 305.4 | ||||||
|
|
|
|
|
|||||
| Net Debt/Adjusted EBITDA LTM (4) (non-GAAP) (unaudited) |
1.5x | 1.4x | ||||||
| (1) |
Reflects the prepayment to Telefónica of the entire indebtedness under the Vendor Loan Note. The loan was liquidated in connection with the IPO. |
| (2) |
In considering our financial condition, our management analyzes net debt with third parties, which is defined as total debt less cash, cash equivalents, and short-term financial investments. Net debt with third parties is not a measure defined by IFRS and it has limitations as an analytical tool. Net debt is neither a measure defined by or presented in accordance with IFRS nor a measure of financial performance, and should not be considered in isolation or as an alternative financial measure determined in accordance with IFRS. Net debt is not necessarily comparable to similarly titled measures used by other companies. |
| (3) |
Adjusted EBITDA LTM (Last Twelve Months) is defined as EBITDA adjusted to exclude acquisition and integration related costs, restructuring costs, sponsor management fees, asset impairments, site-relocation costs, financing fees, IPO costs and other items, which are not related to our core results of operations for the last twelve months. |
12
PRESS RELEASE
Free Cash Flow
| ($ in millions) |
For the three months ended September 30, |
For the nine months ended September 30, |
||||||||||||||
| 2015 | 2014 | 2015 | 2014 | |||||||||||||
| (unaudited) | (unaudited) | |||||||||||||||
| Net cash flow from operating activities |
38.7 | 43.5 | (3.3 | ) | 109.4 | |||||||||||
| Cash payments for acquisition of property, plant, equipment and intangible assets |
(23.4 | ) | (36.0 | ) | (60.7 | ) | (81.2 | ) | ||||||||
|
|
|
|
|
|
|
|
|
|||||||||
| Free cash flow (non-GAAP) (unaudited) |
15.3 | 7.5 | (64.0 | ) | 28.2 | |||||||||||
|
|
|
|
|
|
|
|
|
|||||||||
13

Atento Fiscal 2015 Third Quarter Results November 9, 2015 Lynn Antipas Tyson Vice President Investor Relations +1-914-485-1150 [email protected]
Disclaimer This presentation has been prepared by Atento. The information contained in this presentation is for informational purposes only. The information contained in this presentation is not investment or financial product advice and is not intended to be used as the basis for making an investment decision. This presentation has been prepared without taking into account the investment objectives, financial situation or particular needs of any particular person. This presentation contains forward-looking statements within the meaning of the U.S. federal securities laws, that are subject to risks and uncertainties. All statements other than statements of historical fact included in this presentation are forward-looking statements. Forward-looking statements give our current expectations and projections relating to our financial condition, results of operations, plans, objectives, future performance and business. Forward-looking statements can be identified by the use of words such as "may," "should," "expects," "plans," "anticipates," "believes," "estimates," "predicts," "intends," "continue“, the negative thereof and other words and terms of similar meaning in connection with any discussion of the timing or nature of future operating or financial performance or other events. These forward-looking statements are based on assumptions that we have made in light of our industry experience and on our perceptions of historical trends, current conditions, expected future developments and other factors we believe are appropriate under the circumstances. As you consider this presentation, you should understand that these statements are not guarantees of performance or results. They involve risks, uncertainties (some of which are beyond our control) and assumptions. Although we believe that these forward-looking statements are based on reasonable assumptions, you should be aware that many factors could affect our actual financial results and cause them to differ materially from those anticipated in the forward-looking statements. Other factors that could cause our results to differ from the information set forth herein are included in the reports that we file with the U.S. Securities and Exchange Commission. We refer you to those reports for additional detail, including the section entitled “Risk Factors” in our Annual Report on Form 20-F. Because of these factors, we caution that you should not place undue reliance on any of our forward-looking statements. Further, any forward-looking statement speaks only as of the date on which it is made. New risks and uncertainties arise from time to time, and it is impossible for us to predict those events or how they may affect us. We have no duty to, and do not intend to, update or revise the forward-looking statements in this presentation after the date of this presentation. The historical and projected financial information in this presentation includes financial information that is not presented in accordance with International Financial Reporting Standards (“IFRS”). We refer to these measures as “non-GAAP financial measurers.” The non-GAAP financial measures may not be comparable to other similarly titled measures of other companies and have limitations as analytical tools and should not be considered in isolation or as a substitute for analysis of our operating results as reported under IFRS. Additional information about Atento can be found at www.atento.com.

Presenters: Alejandro Reynal, CEO Mauricio Montilha, CFO

Strategic Overview and Third Quarter Highlights
Key Topics Important milestone - one year since IPO. Significant progress made in the execution of our long-term strategy and the strengthening of our competitive position. Measurable and sustained progress against our strategic initiatives through our commitments to growth, best-in-class operations, and our people. Macro-economic headwinds are a reality. We are applying our business model to grow market share and achieve the optimal mix of growth, profitability and liquidity. Long-term strategy remains on track. A clear roadmap to selectively make investments that strengthen our competitive advantage for the long term, and deliver sustainable value for our shareholders.
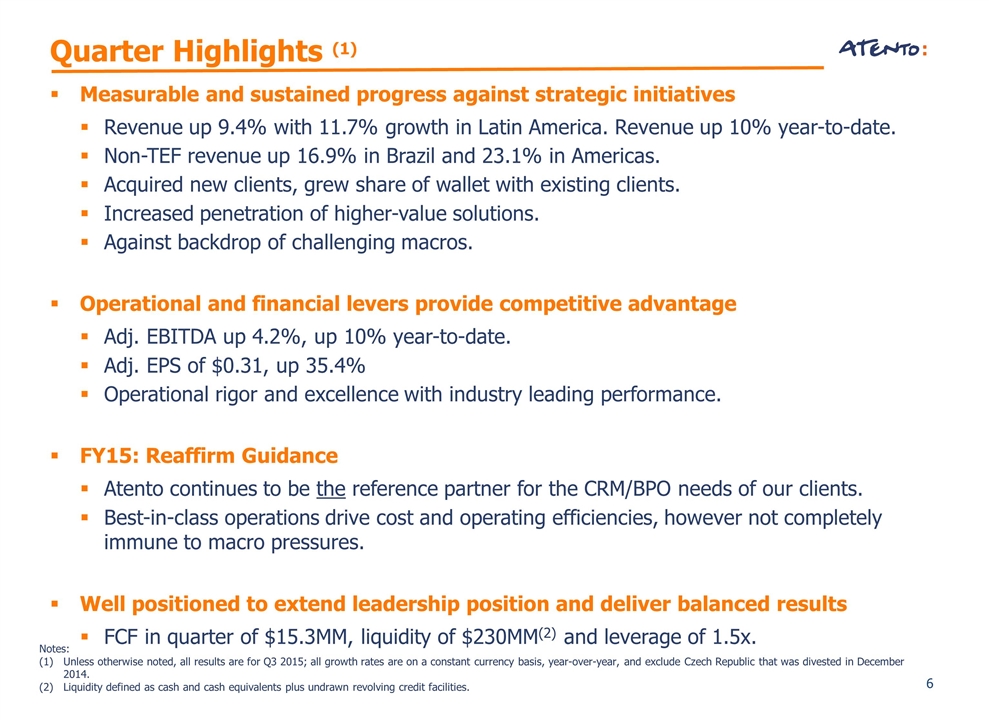
Quarter Highlights (1) Notes: Unless otherwise noted, all results are for Q3 2015; all growth rates are on a constant currency basis, year-over-year, and exclude Czech Republic that was divested in December 2014. Liquidity defined as cash and cash equivalents plus undrawn revolving credit facilities. Measurable and sustained progress against strategic initiatives Revenue up 9.4% with 11.7% growth in Latin America. Revenue up 10% year-to-date. Non-TEF revenue up 16.9% in Brazil and 23.1% in Americas. Acquired new clients, grew share of wallet with existing clients. Increased penetration of higher-value solutions. Against backdrop of challenging macros. Operational and financial levers provide competitive advantage Adj. EBITDA up 4.2%, up 10% year-to-date. Adj. EPS of $0.31, up 35.4% Operational rigor and excellence with industry leading performance. FY15: Reaffirm Guidance Atento continues to be the reference partner for the CRM/BPO needs of our clients. Best-in-class operations drive cost and operating efficiencies, however not completely immune to macro pressures. Well positioned to extend leadership position and deliver balanced results FCF in quarter of $15.3MM, liquidity of $230MM(2) and leverage of 1.5x.
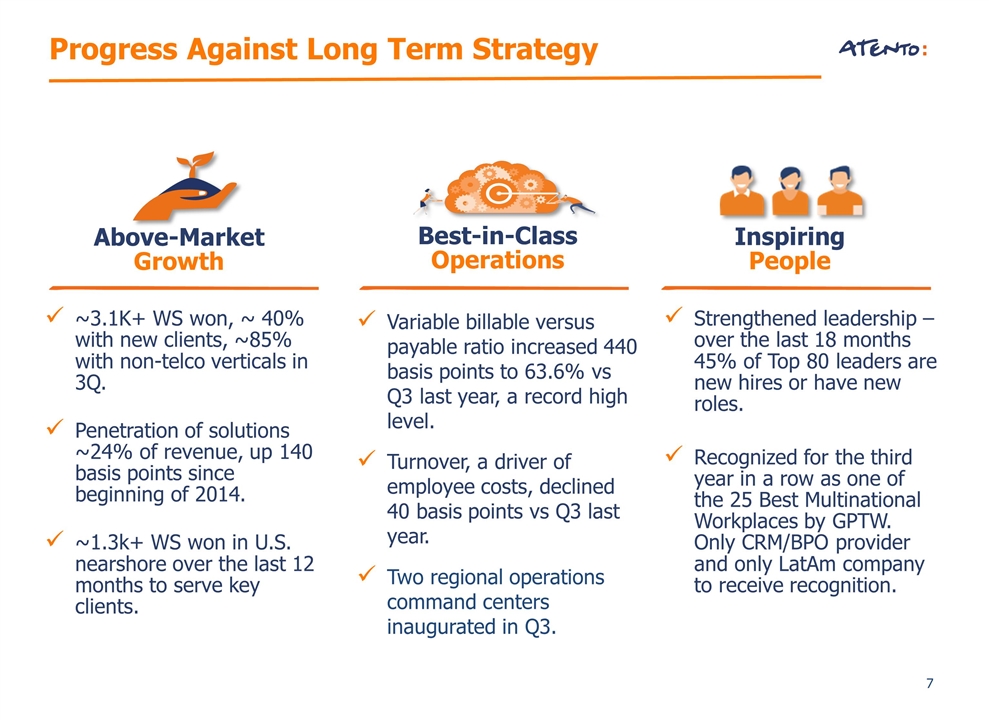
Progress Against Long Term Strategy Above-Market Growth Best-in-Class Operations Inspiring People ~3.1K+ WS won, ~ 40% with new clients, ~85% with non-telco verticals in 3Q. Penetration of solutions ~24% of revenue, up 140 basis points since beginning of 2014. ~1.3k+ WS won in U.S. nearshore over the last 12 months to serve key clients. Variable billable versus payable ratio increased 440 basis points to 63.6% vs Q3 last year, a record high level. Turnover, a driver of employee costs, declined 40 basis points vs Q3 last year. Two regional operations command centers inaugurated in Q3. Strengthened leadership – over the last 18 months 45% of Top 80 leaders are new hires or have new roles. Recognized for the third year in a row as one of the 25 Best Multinational Workplaces by GPTW. Only CRM/BPO provider and only LatAm company to receive recognition.
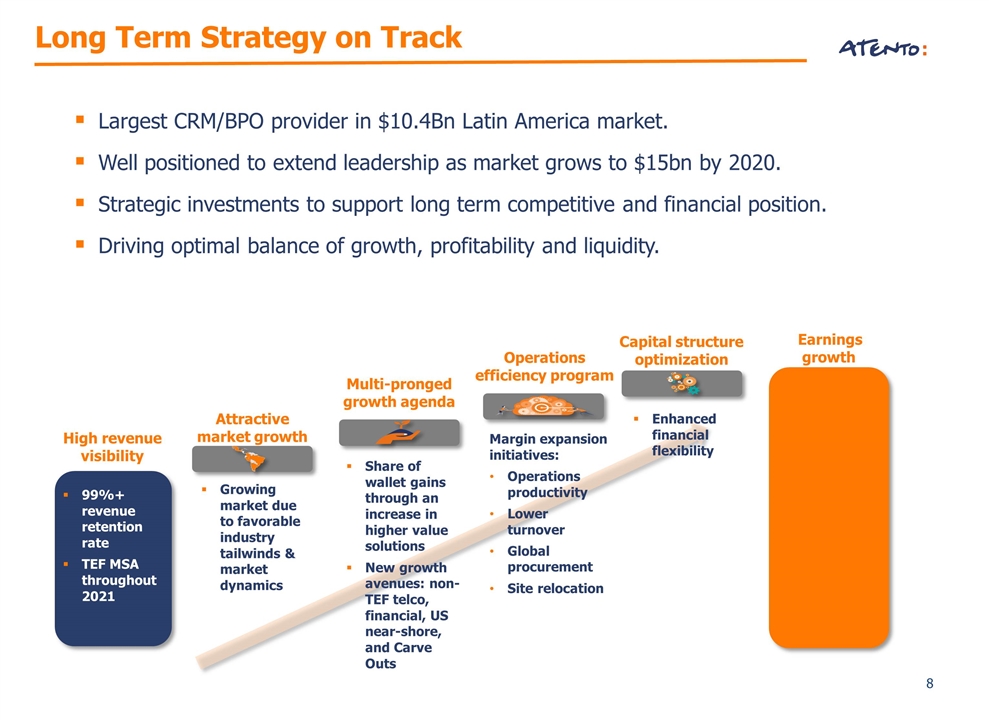
Long Term Strategy on Track Earnings growth High revenue visibility 99%+ revenue retention rate TEF MSA throughout 2021 Multi-pronged growth agenda Share of wallet gains through an increase in higher value solutions New growth avenues: non-TEF telco, financial, US near-shore, and Carve Outs Operations efficiency program Margin expansion initiatives: Operations productivity Lower turnover Global procurement Site relocation Capital structure optimization Enhanced financial flexibility Attractive market growth Growing market due to favorable industry tailwinds & market dynamics Largest CRM/BPO provider in $10.4Bn Latin America market. Well positioned to extend leadership as market grows to $15bn by 2020. Strategic investments to support long term competitive and financial position. Driving optimal balance of growth, profitability and liquidity.

Third Quarter Financial Performance
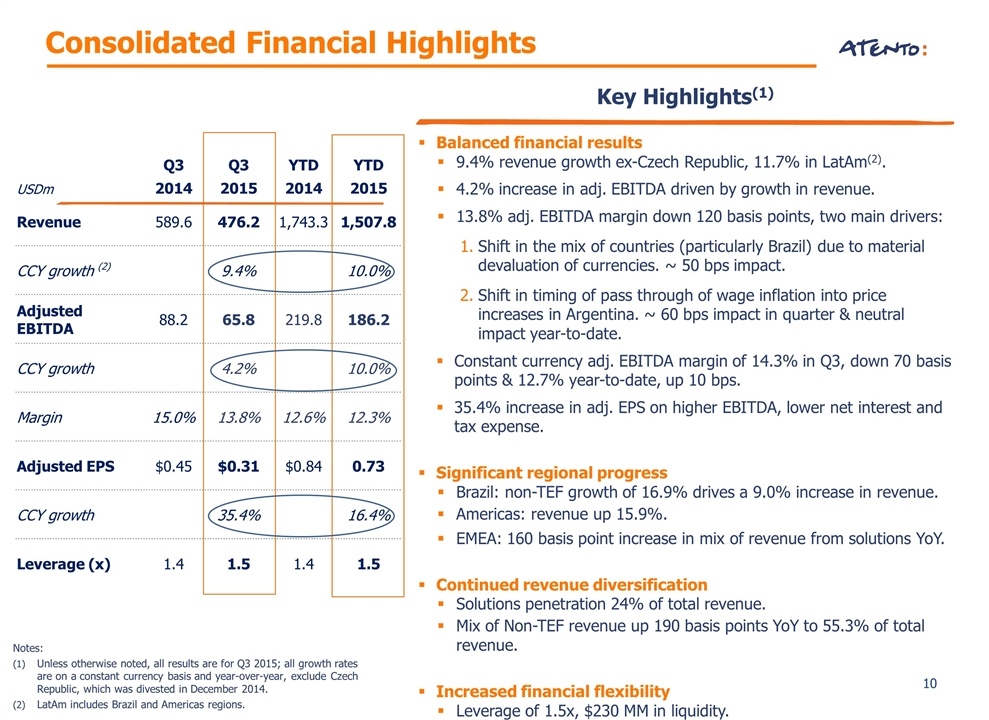
Q3 Q3 YTD YTD USDm 2014 2015 2014 2015 Revenue 589.6 476.2 1,743.3 1,507.8 CCY growth (2) 9.4% 10.0% Adjusted EBITDA 88.2 65.8 219.8 186.2 CCY growth 4.2% 10.0% Margin 15.0% 13.8% 12.6% 12.3% Adjusted EPS $0.45 $0.31 $0.84 0.73 CCY growth 35.4% 16.4% Leverage (x) 1.4 1.5 1.4 1.5 Consolidated Financial Highlights Key Highlights(1) Balanced financial results 9.4% revenue growth ex-Czech Republic, 11.7% in LatAm(2). 4.2% increase in adj. EBITDA driven by growth in revenue. 13.8% adj. EBITDA margin down 120 basis points, two main drivers: Shift in the mix of countries (particularly Brazil) due to material devaluation of currencies. ~ 50 bps impact. Shift in timing of pass through of wage inflation into price increases in Argentina. ~ 60 bps impact in quarter & neutral impact year-to-date. Constant currency adj. EBITDA margin of 14.3% in Q3, down 70 basis points & 12.7% year-to-date, up 10 bps. 35.4% increase in adj. EPS on higher EBITDA, lower net interest and tax expense. Significant regional progress Brazil: non-TEF growth of 16.9% drives a 9.0% increase in revenue. Americas: revenue up 15.9%. EMEA: 160 basis point increase in mix of revenue from solutions YoY. Continued revenue diversification Solutions penetration 24% of total revenue. Mix of Non-TEF revenue up 190 basis points YoY to 55.3% of total revenue. Increased financial flexibility Leverage of 1.5x, $230 MM in liquidity. Notes: Unless otherwise noted, all results are for Q3 2015; all growth rates are on a constant currency basis and year-over-year, exclude Czech Republic, which was divested in December 2014. LatAm includes Brazil and Americas regions.
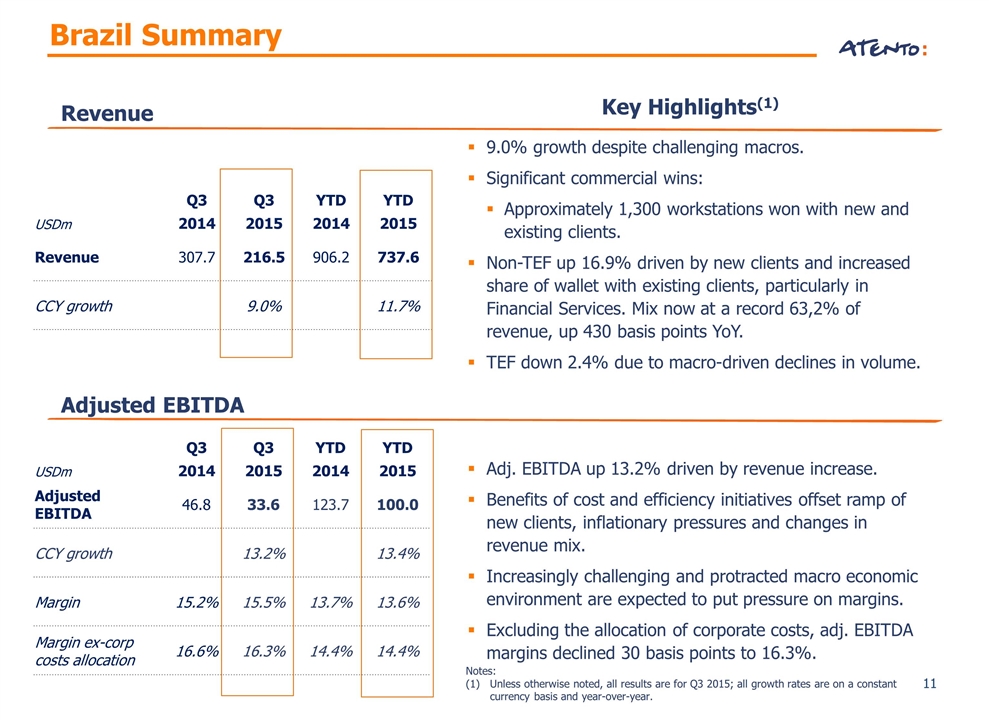
Brazil Summary Revenue 9.0% growth despite challenging macros. Significant commercial wins: Approximately 1,300 workstations won with new and existing clients. Non-TEF up 16.9% driven by new clients and increased share of wallet with existing clients, particularly in Financial Services. Mix now at a record 63,2% of revenue, up 430 basis points YoY. TEF down 2.4% due to macro-driven declines in volume. Adjusted EBITDA Adj. EBITDA up 13.2% driven by revenue increase. Benefits of cost and efficiency initiatives offset ramp of new clients, inflationary pressures and changes in revenue mix. Increasingly challenging and protracted macro economic environment are expected to put pressure on margins. Excluding the allocation of corporate costs, adj. EBITDA margins declined 30 basis points to 16.3%. Notes: Unless otherwise noted, all results are for Q3 2015; all growth rates are on a constant currency basis and year-over-year. Key Highlights(1) Q3 Q3 YTD YTD USDm 2014 2015 2014 2015 Revenue 307.7 216.5 906.2 737.6 CCY growth 9.0% 11.7% Q3 Q3 YTD YTD USDm 2014 2015 2014 2015 Adjusted EBITDA 46.8 33.6 123.7 100.0 CCY growth 13.2% 13.4% Margin 15.2% 15.5% 13.7% 13.6% Margin ex-corp costs allocation 16.6% 16.3% 14.4% 14.4%
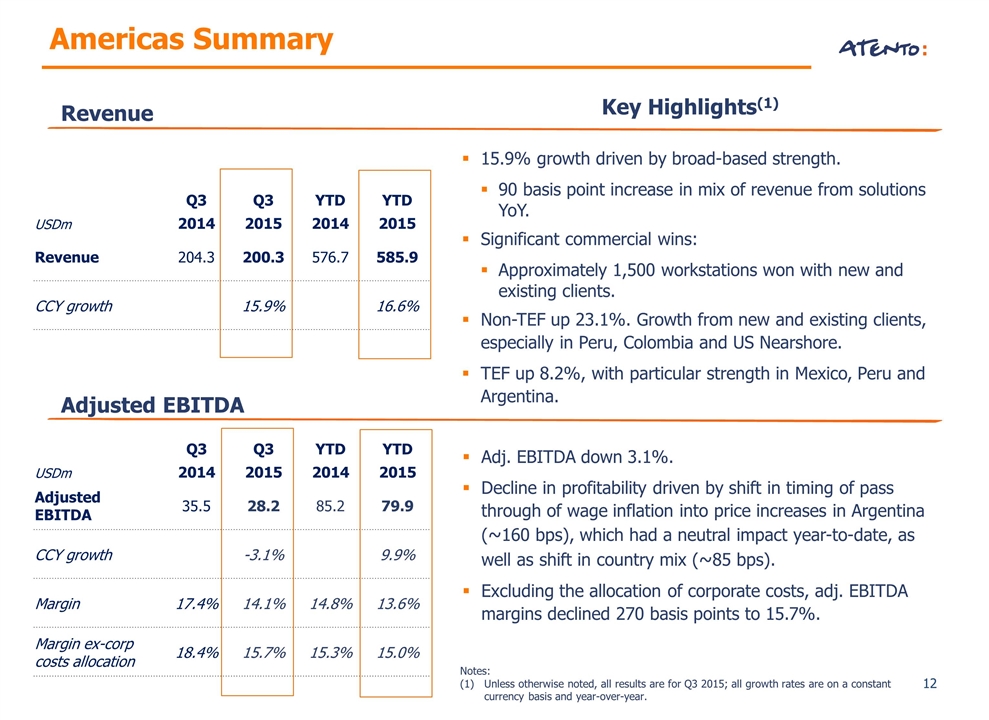
Q3 Q3 YTD YTD USDm 2014 2015 2014 2015 Adjusted EBITDA 35.5 28.2 85.2 79.9 CCY growth -3.1% 9.9% Margin 17.4% 14.1% 14.8% 13.6% Margin ex-corp costs allocation 18.4% 15.7% 15.3% 15.0% Adj. EBITDA down 3.1%. Decline in profitability driven by shift in timing of pass through of wage inflation into price increases in Argentina (~160 bps), which had a neutral impact year-to-date, as well as shift in country mix (~85 bps). Excluding the allocation of corporate costs, adj. EBITDA margins declined 270 basis points to 15.7%. Americas Summary Revenue 15.9% growth driven by broad-based strength. 90 basis point increase in mix of revenue from solutions YoY. Significant commercial wins: Approximately 1,500 workstations won with new and existing clients. Non-TEF up 23.1%. Growth from new and existing clients, especially in Peru, Colombia and US Nearshore. TEF up 8.2%, with particular strength in Mexico, Peru and Argentina. Adjusted EBITDA Key Highlights(1) Notes: Unless otherwise noted, all results are for Q3 2015; all growth rates are on a constant currency basis and year-over-year. Q3 Q3 YTD YTD USDm 2014 2015 2014 2015 Revenue 204.3 200.3 576.7 585.9 CCY growth 15.9% 16.6%
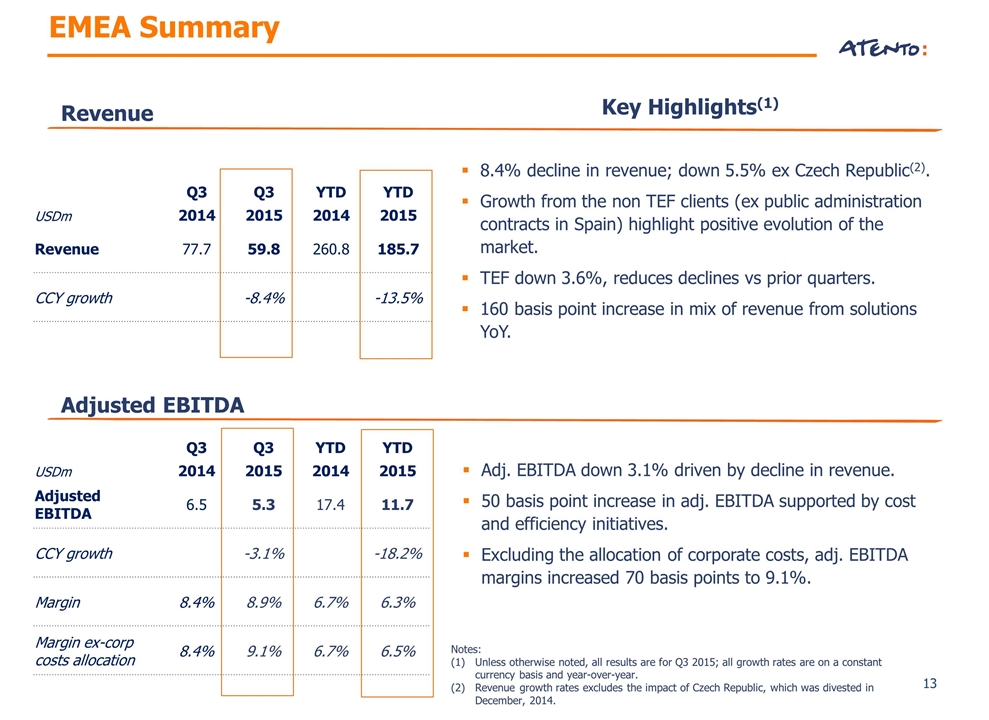
EMEA Summary Revenue Adjusted EBITDA Notes: Unless otherwise noted, all results are for Q3 2015; all growth rates are on a constant currency basis and year-over-year. Revenue growth rates excludes the impact of Czech Republic, which was divested in December, 2014. Key Highlights(1) 8.4% decline in revenue; down 5.5% ex Czech Republic(2). Growth from the non TEF clients (ex public administration contracts in Spain) highlight positive evolution of the market. TEF down 3.6%, reduces declines vs prior quarters. 160 basis point increase in mix of revenue from solutions YoY. Adj. EBITDA down 3.1% driven by decline in revenue. 50 basis point increase in adj. EBITDA supported by cost and efficiency initiatives. Excluding the allocation of corporate costs, adj. EBITDA margins increased 70 basis points to 9.1%. Q3 Q3 YTD YTD USDm 2014 2015 2014 2015 Adjusted EBITDA 6.5 5.3 17.4 11.7 CCY growth -3.1% -18.2% Margin 8.4% 8.9% 6.7% 6.3% Margin ex-corp costs allocation 8.4% 9.1% 6.7% 6.5% Q3 Q3 YTD YTD USDm 2014 2015 2014 2015 Revenue 77.7 59.8 260.8 185.7 CCY growth -8.4% -13.5%
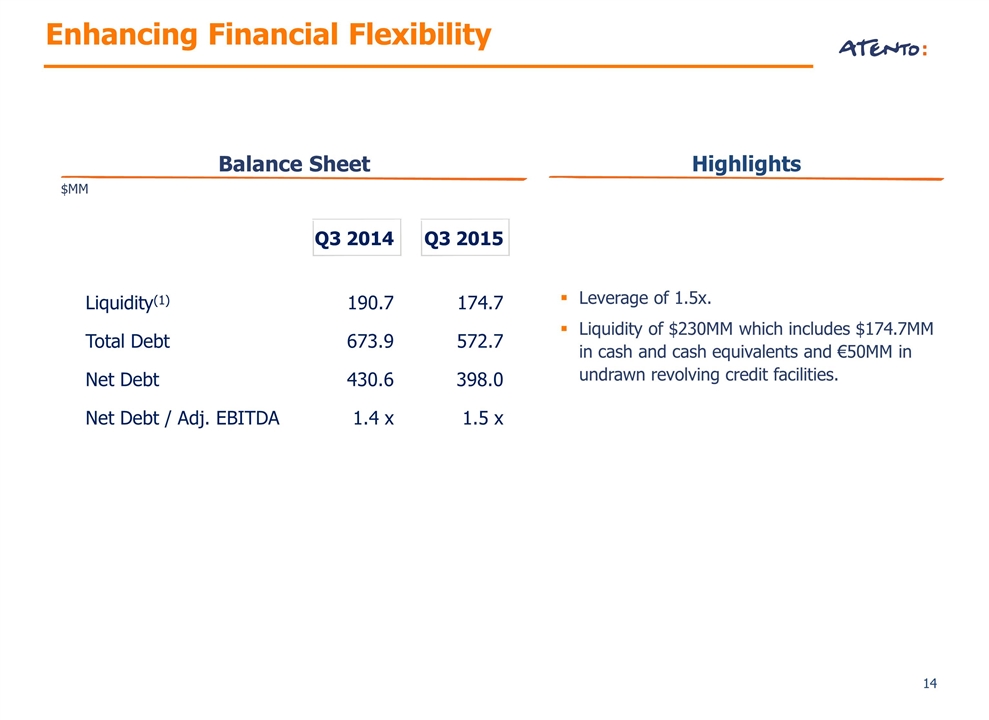
Balance Sheet Highlights $MM Leverage of 1.5x. Liquidity of $230MM which includes $174.7MM in cash and cash equivalents and €50MM in undrawn revolving credit facilities. Enhancing Financial Flexibility Q3 2014 Q3 2015 Liquidity(1) 190.7 174.7 Total Debt 673.9 572.7 Net Debt 430.6 398.0 Net Debt / Adj. EBITDA 1.4 x 1.5 x
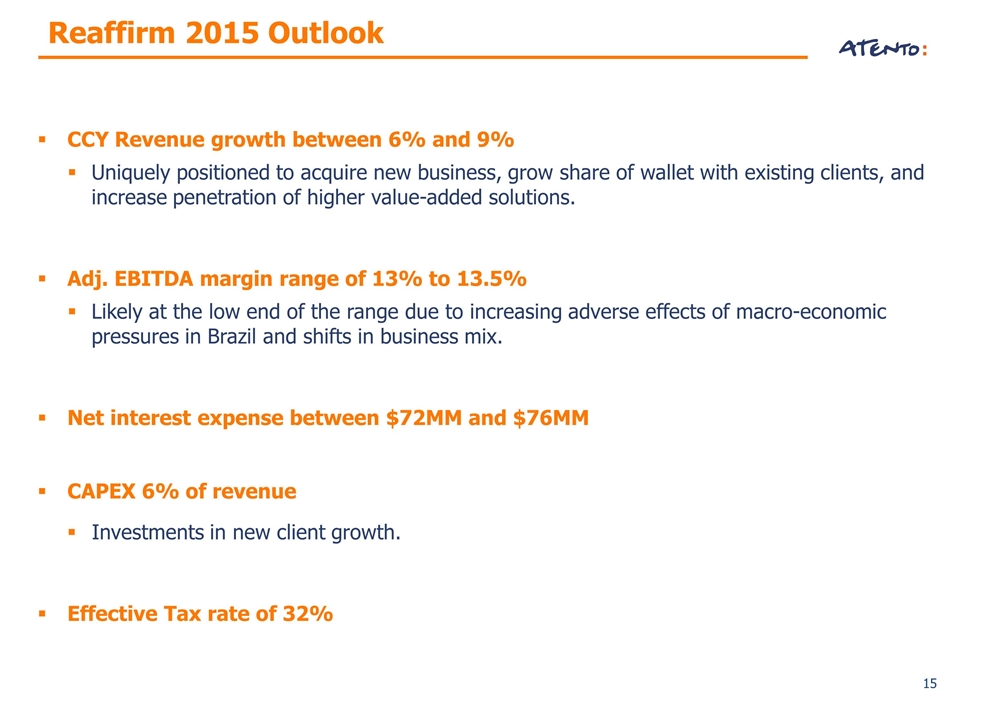
Reaffirm 2015 Outlook CCY Revenue growth between 6% and 9% Uniquely positioned to acquire new business, grow share of wallet with existing clients, and increase penetration of higher value-added solutions. Adj. EBITDA margin range of 13% to 13.5% Likely at the low end of the range due to increasing adverse effects of macro-economic pressures in Brazil and shifts in business mix. Net interest expense between $72MM and $76MM CAPEX 6% of revenue Investments in new client growth. Effective Tax rate of 32%
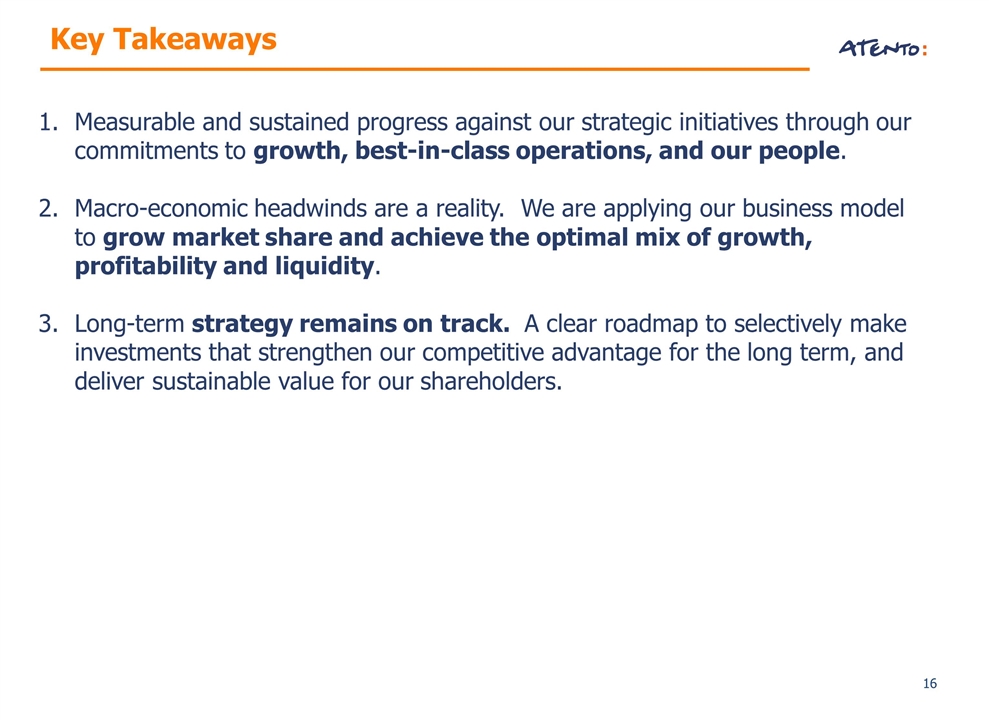
Key Takeaways Measurable and sustained progress against our strategic initiatives through our commitments to growth, best-in-class operations, and our people. Macro-economic headwinds are a reality. We are applying our business model to grow market share and achieve the optimal mix of growth, profitability and liquidity. Long-term strategy remains on track. A clear roadmap to selectively make investments that strengthen our competitive advantage for the long term, and deliver sustainable value for our shareholders.

Appendix About Atento Financial Reconciliations Debt Information Glossary of Terms

About Atento
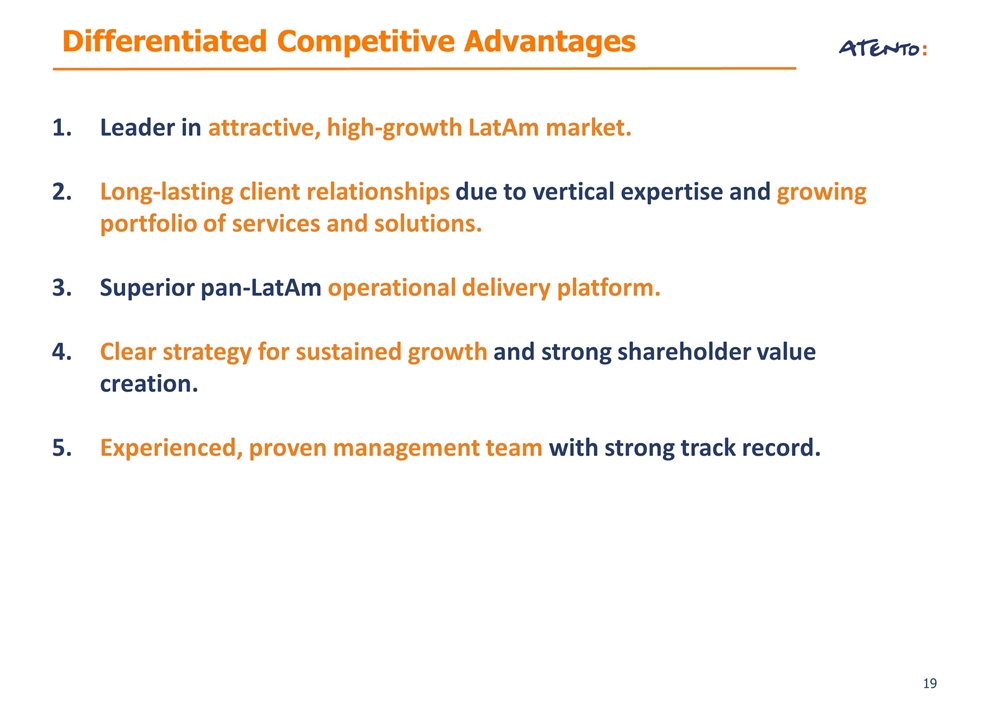
Leader in attractive, high-growth LatAm market. Long-lasting client relationships due to vertical expertise and growing portfolio of services and solutions. Superior pan-LatAm operational delivery platform. Clear strategy for sustained growth and strong shareholder value creation. Experienced, proven management team with strong track record. Differentiated Competitive Advantages
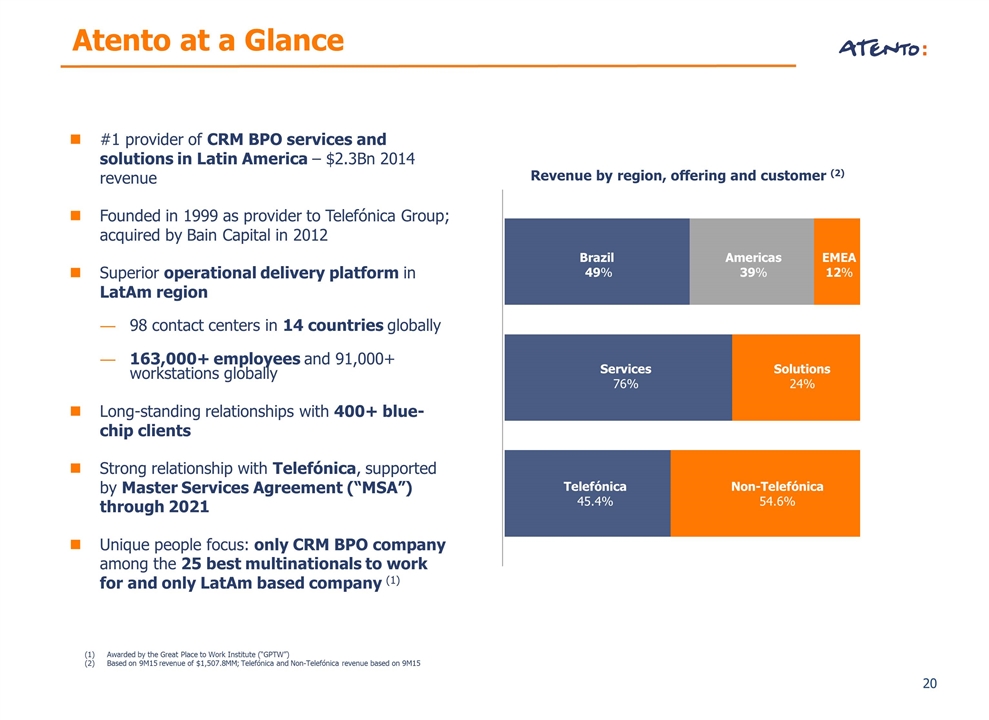
Awarded by the Great Place to Work Institute (“GPTW”) Based on 9M15 revenue of $1,507.8MM; Telefónica and Non-Telefónica revenue based on 9M15 #1 provider of CRM BPO services and solutions in Latin America – $2.3Bn 2014 revenue Founded in 1999 as provider to Telefónica Group; acquired by Bain Capital in 2012 Superior operational delivery platform in LatAm region 98 contact centers in 14 countries globally 163,000+ employees and 91,000+ workstations globally Long-standing relationships with 400+ blue-chip clients Strong relationship with Telefónica, supported by Master Services Agreement (“MSA”) through 2021 Unique people focus: only CRM BPO company among the 25 best multinationals to work for and only LatAm based company (1) Revenue by region, offering and customer (2) Brazil 49% Americas 39% EMEA 12% Services 76% Solutions 24% Non-Telefónica 54.6% Telefónica 45.4% Atento at a Glance
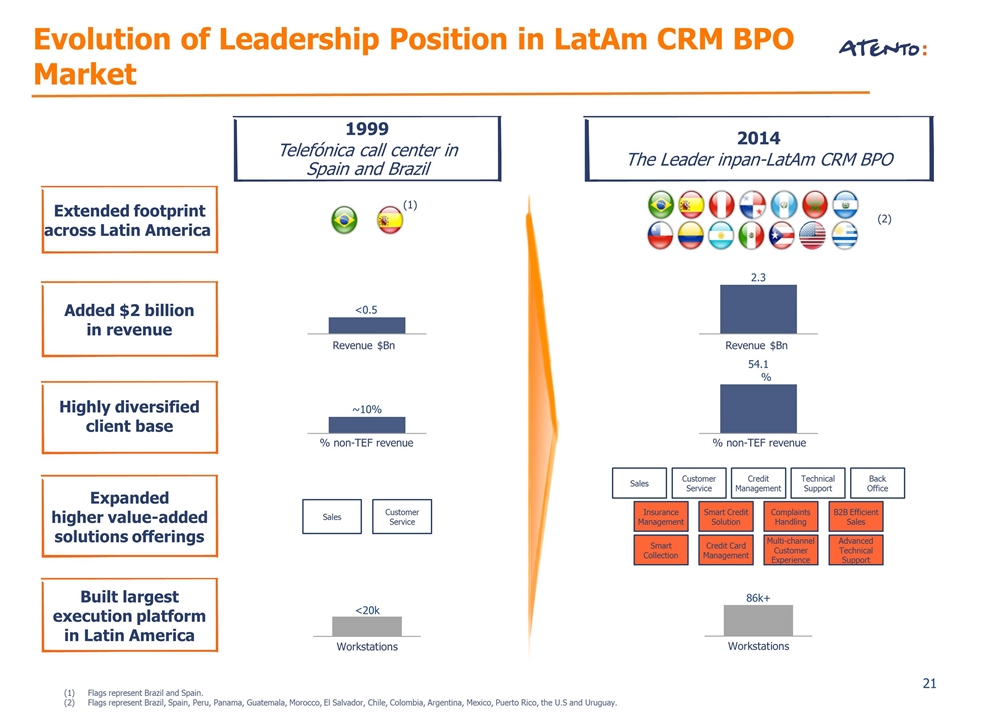
1999 Telefónica call center in Spain and Brazil Flags represent Brazil and Spain. Flags represent Brazil, Spain, Peru, Panama, Guatemala, Morocco, El Salvador, Chile, Colombia, Argentina, Mexico, Puerto Rico, the U.S and Uruguay. (1) 2014 The Leader inpan-LatAm CRM BPO (2) <0.5 2.3 <20k 86k+ ~10% 54.1% Customer Service Sales Extended footprint across Latin America Expanded higher value-added solutions offerings Added $2 billion in revenue Built largest execution platform in Latin America Highly diversified client base Revenue $Bn Revenue $Bn % non-TEF revenue % non-TEF revenue Customer Service Sales Back Office Technical Support Credit Management Smart Credit Solution Complaints Handling Multi-channel Customer Experience Smart Collection Credit Card Management B2B Efficient Sales Insurance Management Advanced Technical Support Evolution of Leadership Position in LatAm CRM BPO Market
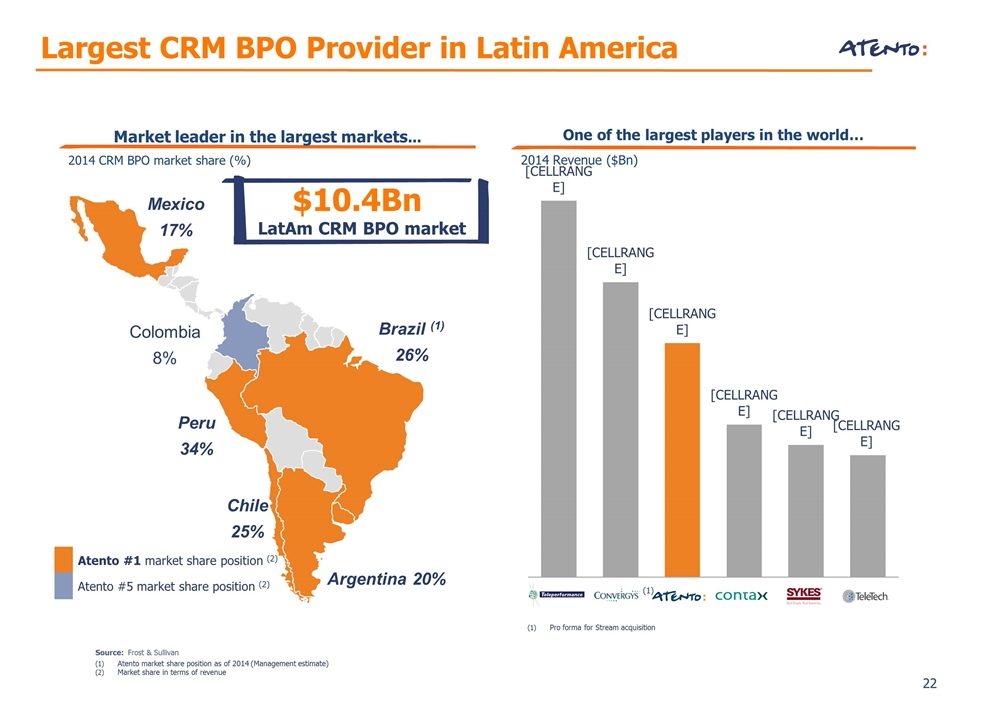
Source: Frost & Sullivan Atento market share position as of 2014 (Management estimate) Market share in terms of revenue Largest CRM BPO Provider in Latin America 2014 CRM BPO market share (%) Mexico 17% Brazil (1) 26% Argentina 20% Chile 25% Peru 34% Colombia 8% Atento #1 market share position (2) Atento #5 market share position (2) Market leader in the largest markets... $10.4Bn LatAm CRM BPO market One of the largest players in the world… 2014 Revenue ($Bn) Pro forma for Stream acquisition (1)
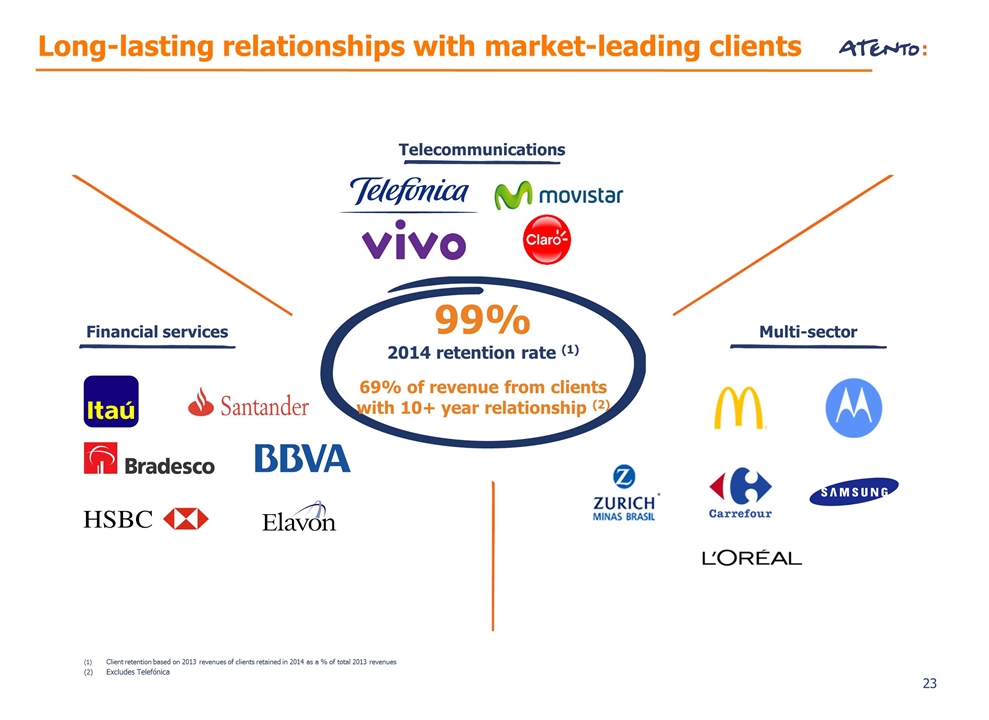
Long-lasting relationships with market-leading clients Client retention based on 2013 revenues of clients retained in 2014 as a % of total 2013 revenues Excludes Telefónica 99% 2014 retention rate (1) 69% of revenue from clients with 10+ year relationship (2) Multi-sector Financial services Telecommunications
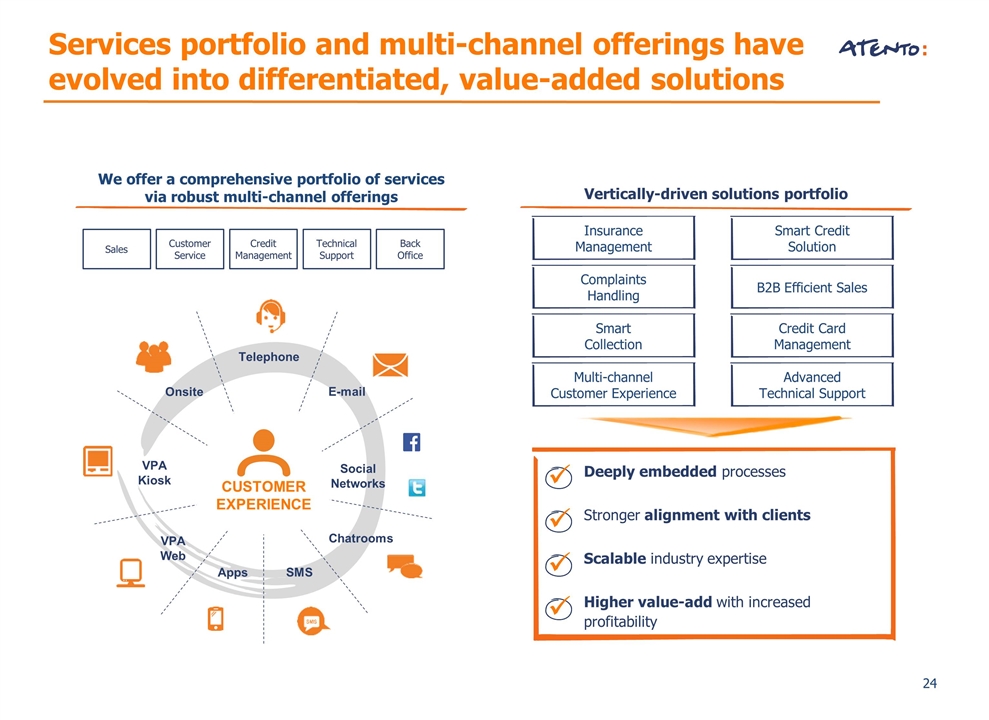
Services portfolio and multi-channel offerings have evolved into differentiated, value-added solutions Vertically-driven solutions portfolio Deeply embedded processes Stronger alignment with clients Scalable industry expertise Higher value-add with increased profitability We offer a comprehensive portfolio of services via robust multi-channel offerings Telephone E-mail Social Networks Chatrooms SMS Apps VPA Kiosk Onsite CUSTOMER EXPERIENCE VPA Web Customer Service Sales Back Office Technical Support Credit Management Insurance Management Smart Credit Solution Complaints Handling B2B Efficient Sales Smart Collection Credit Card Management Multi-channel Customer Experience Advanced Technical Support
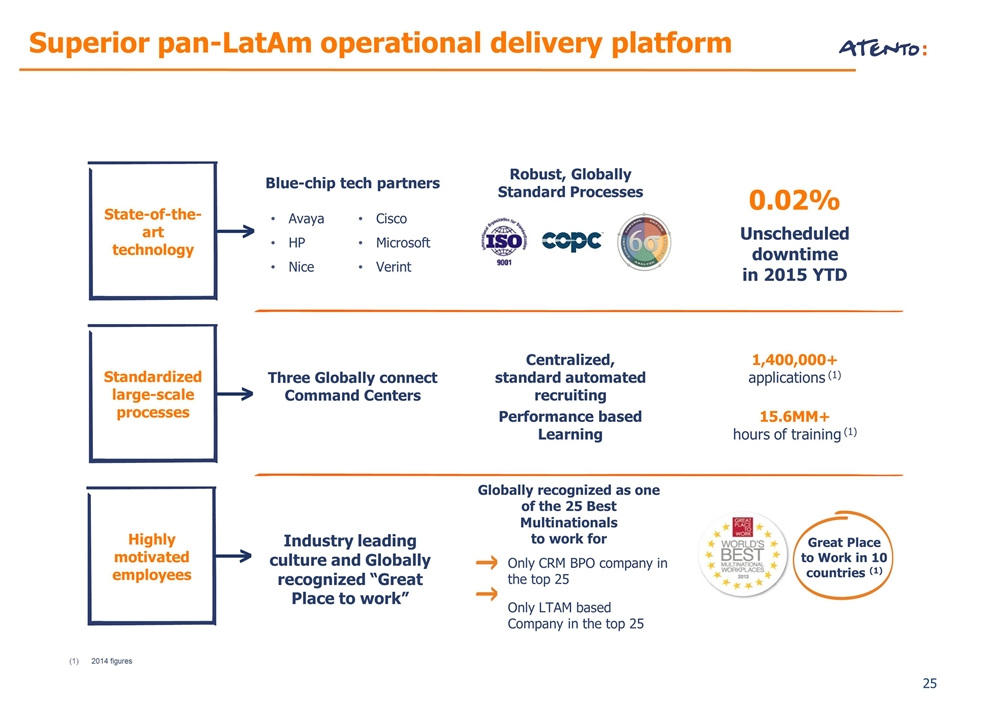
Superior pan-LatAm operational delivery platform State-of-the-art technology 0.02% Unscheduled downtime in 2015 YTD Standardized large-scale processes Three Globally connect Command Centers Highly motivated employees Industry leading culture and Globally recognized “Great Place to work” Great Place to Work in 10 countries (1) 2014 figures Blue-chip tech partners Avaya HP Nice Cisco Microsoft Verint Globally recognized as one of the 25 Best Multinationals to work for Only CRM BPO company in the top 25 Only LTAM based Company in the top 25 Robust, Globally Standard Processes Centralized, standard automated recruiting Performance based Learning 1,400,000+ applications (1) 15.6MM+ hours of training (1)
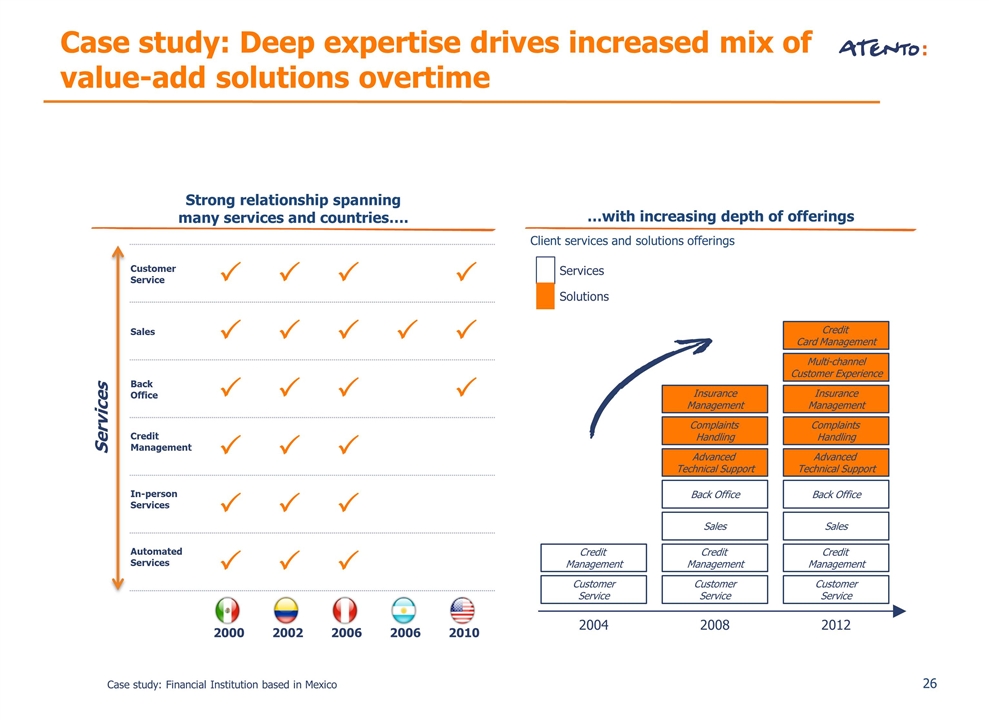
Client services and solutions offerings Services Solutions 2004 Customer Service Credit Management 2008 Back Office Sales Customer Service Credit Management Complaints Handling Insurance Management Advanced Technical Support Case study: Deep expertise drives increased mix of value-add solutions overtime Customer Service P P P P Sales P P P P P Back Office P P P P Credit Management P P P In-person Services P P P Automated Services P P P Strong relationship spanning many services and countries…. …with increasing depth of offerings 2000 2002 2006 2006 2010 Case study: Financial Institution based in Mexico 2012 Back Office Sales Customer Service Credit Management Complaints Handling Insurance Management Advanced Technical Support Multi-channel Customer Experience Credit Card Management Services
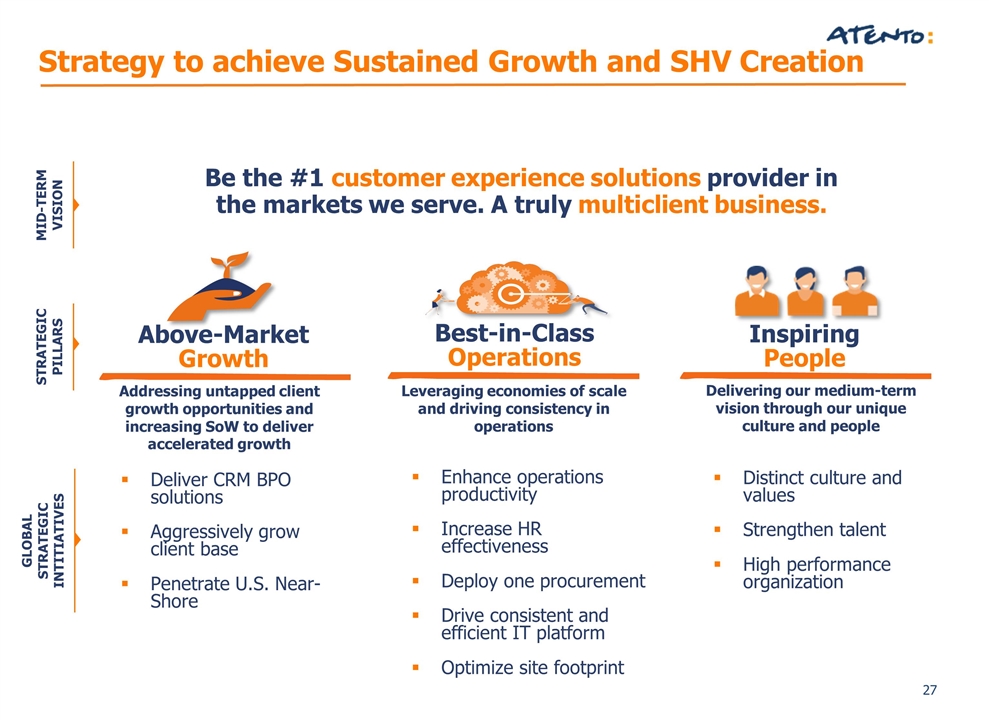
Strategy to achieve Sustained Growth and SHV Creation STRATEGIC PILLARS GLOBAL STRATEGIC INTITIATIVES Deliver CRM BPO solutions Aggressively grow client base Penetrate U.S. Near-Shore Above-Market Growth Addressing untapped client growth opportunities and increasing SoW to deliver accelerated growth Enhance operations productivity Increase HR effectiveness Deploy one procurement Drive consistent and efficient IT platform Optimize site footprint Best-in-Class Operations Leveraging economies of scale and driving consistency in operations Distinct culture and values Strengthen talent High performance organization Inspiring People Delivering our medium-term vision through our unique culture and people MID-TERM VISION Be the #1 customer experience solutions provider in the markets we serve. A truly multiclient business.
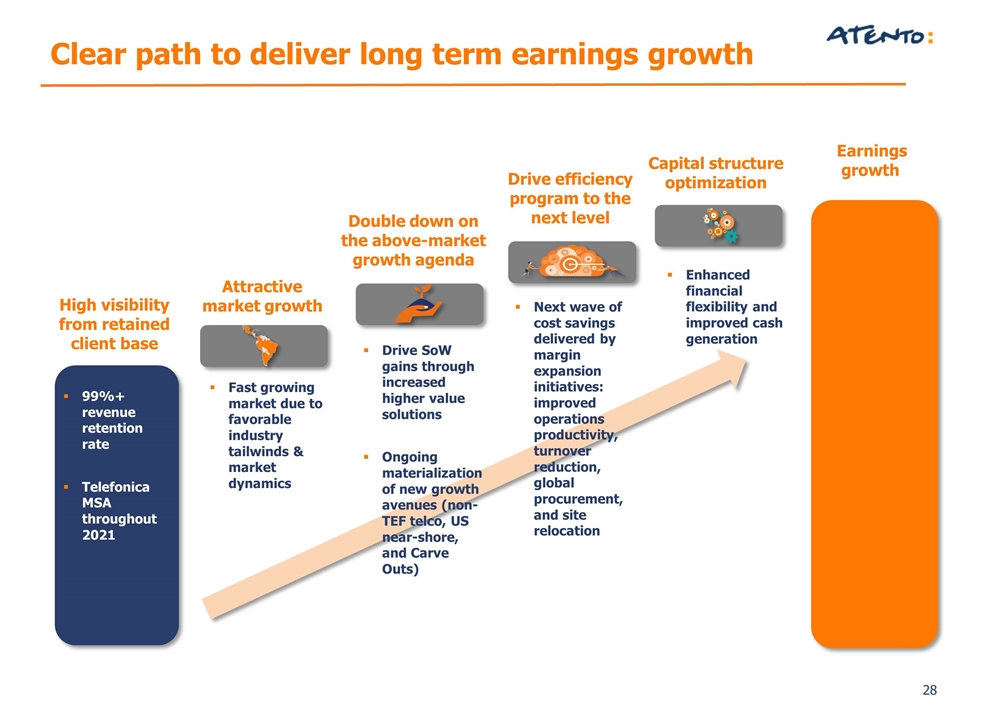
Earnings growth High visibility from retained client base 99%+ revenue retention rate Telefonica MSA throughout 2021 Double down on the above-market growth agenda Drive SoW gains through increased higher value solutions Ongoing materialization of new growth avenues (non-TEF telco, US near-shore, and Carve Outs) Drive efficiency program to the next level Next wave of cost savings delivered by margin expansion initiatives: improved operations productivity, turnover reduction, global procurement, and site relocation Capital structure optimization Enhanced financial flexibility and improved cash generation Attractive market growth Fast growing market due to favorable industry tailwinds & market dynamics Clear path to deliver long term earnings growth
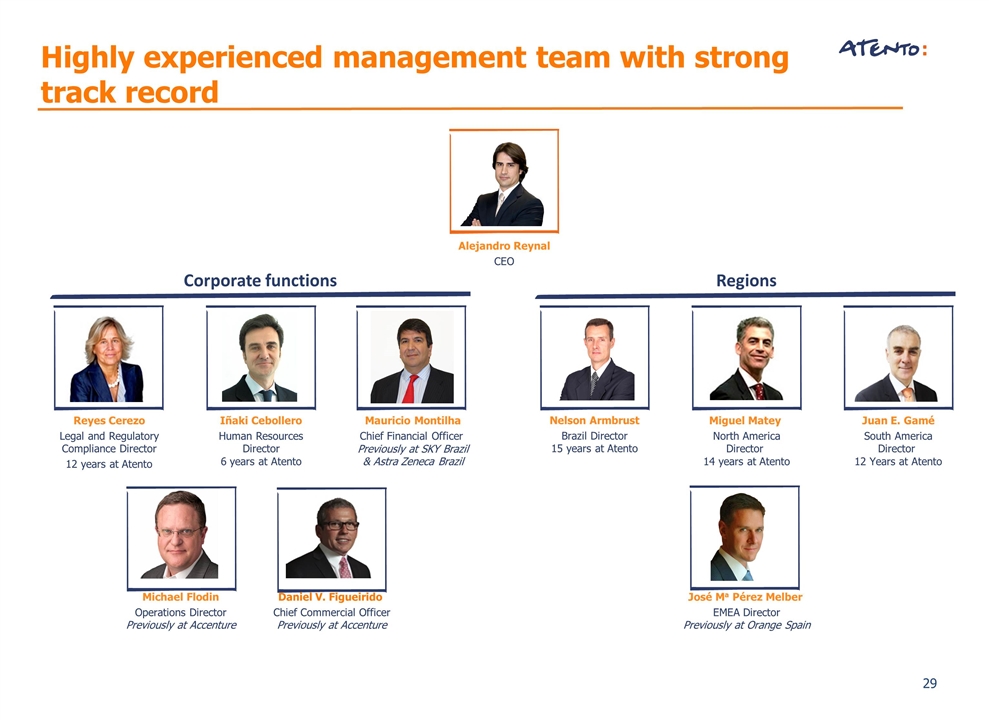
Highly experienced management team with strong track record Reyes Cerezo Legal and Regulatory Compliance Director 12 years at Atento Iñaki Cebollero Human Resources Director 6 years at Atento Mauricio Montilha Chief Financial Officer Previously at SKY Brazil & Astra Zeneca Brazil Michael Flodin Operations Director Previously at Accenture Daniel V. Figueirido Chief Commercial Officer Previously at Accenture Alejandro Reynal CEO Nelson Armbrust Brazil Director 15 years at Atento Miguel Matey North America Director 14 years at Atento Juan E. Gamé South America Director 12 Years at Atento José Ma Pérez Melber EMEA Director Previously at Orange Spain Corporate functions Regions
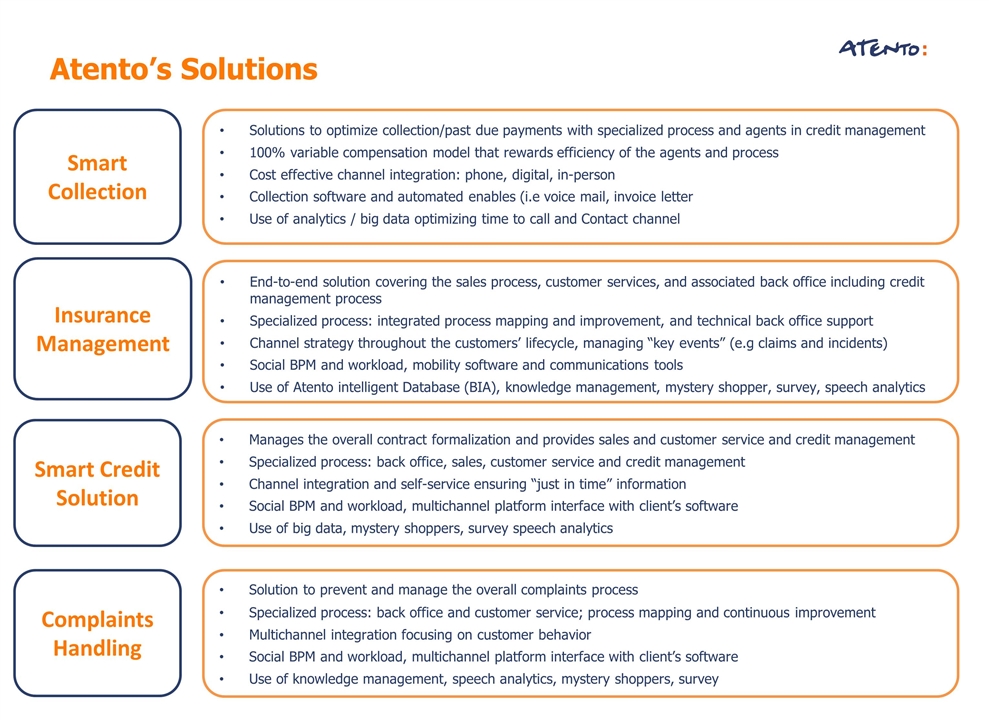
Atento’s Solutions Smart Collection Solutions to optimize collection/past due payments with specialized process and agents in credit management 100% variable compensation model that rewards efficiency of the agents and process Cost effective channel integration: phone, digital, in-person Collection software and automated enables (i.e voice mail, invoice letter Use of analytics / big data optimizing time to call and Contact channel Insurance Management End-to-end solution covering the sales process, customer services, and associated back office including credit management process Specialized process: integrated process mapping and improvement, and technical back office support Channel strategy throughout the customers’ lifecycle, managing “key events” (e.g claims and incidents) Social BPM and workload, mobility software and communications tools Use of Atento intelligent Database (BIA), knowledge management, mystery shopper, survey, speech analytics Smart Credit Solution Complaints Handling Manages the overall contract formalization and provides sales and customer service and credit management Specialized process: back office, sales, customer service and credit management Channel integration and self-service ensuring “just in time” information Social BPM and workload, multichannel platform interface with client’s software Use of big data, mystery shoppers, survey speech analytics Solution to prevent and manage the overall complaints process Specialized process: back office and customer service; process mapping and continuous improvement Multichannel integration focusing on customer behavior Social BPM and workload, multichannel platform interface with client’s software Use of knowledge management, speech analytics, mystery shoppers, survey
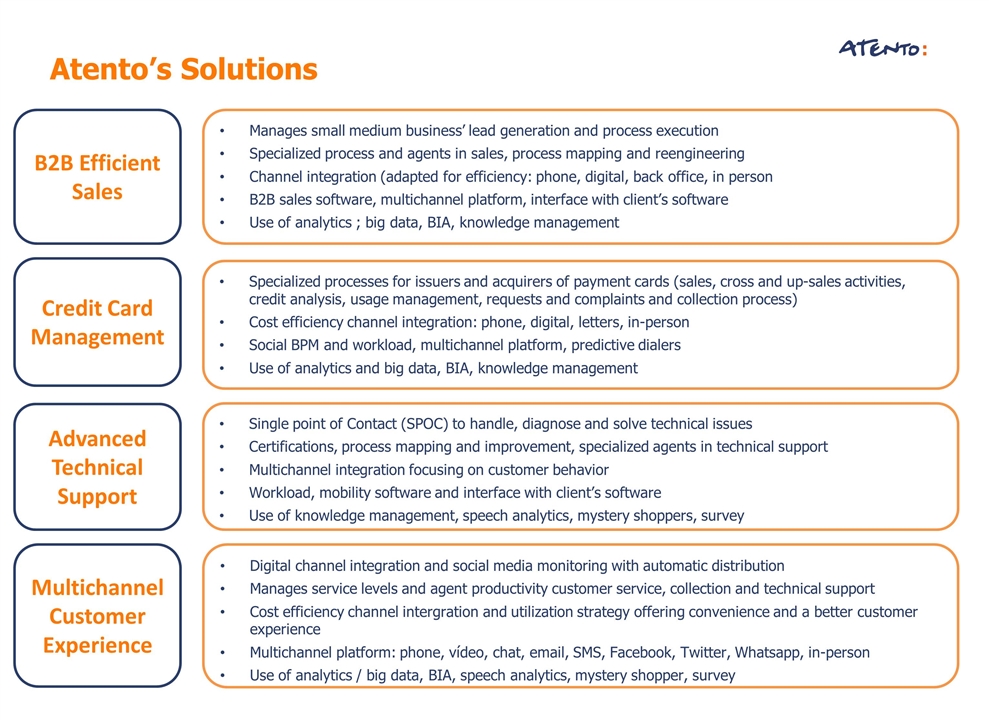
Atento’s Solutions B2B Efficient Sales Manages small medium business’ lead generation and process execution Specialized process and agents in sales, process mapping and reengineering Channel integration (adapted for efficiency: phone, digital, back office, in person B2B sales software, multichannel platform, interface with client’s software Use of analytics ; big data, BIA, knowledge management Credit Card Management Specialized processes for issuers and acquirers of payment cards (sales, cross and up-sales activities, credit analysis, usage management, requests and complaints and collection process) Cost efficiency channel integration: phone, digital, letters, in-person Social BPM and workload, multichannel platform, predictive dialers Use of analytics and big data, BIA, knowledge management Advanced Technical Support Multichannel Customer Experience Single point of Contact (SPOC) to handle, diagnose and solve technical issues Certifications, process mapping and improvement, specialized agents in technical support Multichannel integration focusing on customer behavior Workload, mobility software and interface with client’s software Use of knowledge management, speech analytics, mystery shoppers, survey Digital channel integration and social media monitoring with automatic distribution Manages service levels and agent productivity customer service, collection and technical support Cost efficiency channel intergration and utilization strategy offering convenience and a better customer experience Multichannel platform: phone, vídeo, chat, email, SMS, Facebook, Twitter, Whatsapp, in-person Use of analytics / big data, BIA, speech analytics, mystery shopper, survey

Financial Reconciliations
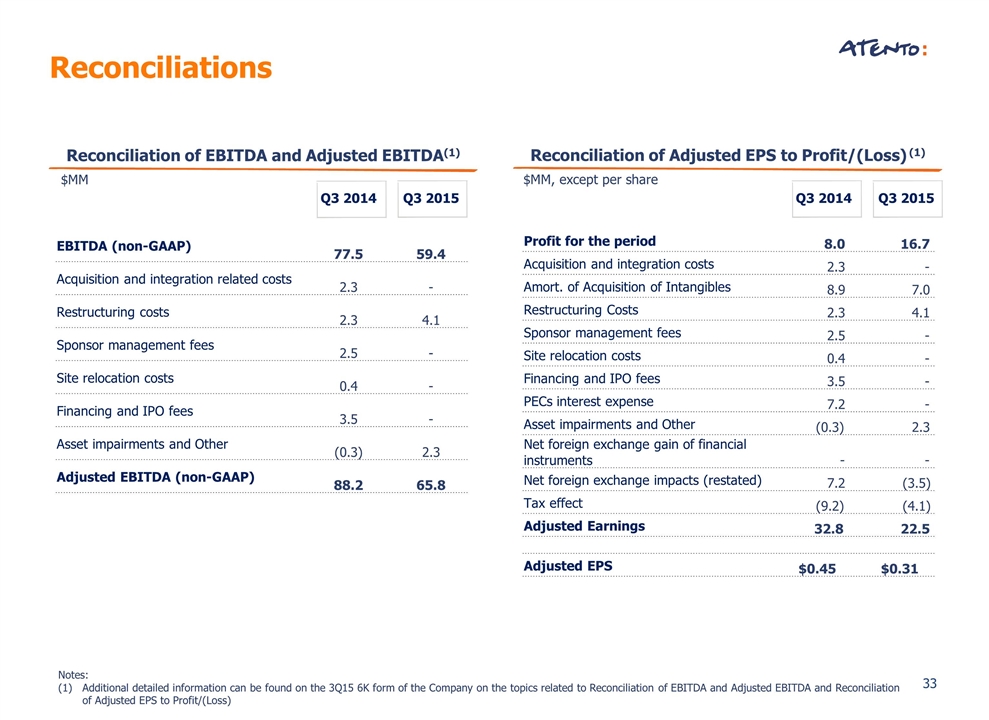
Q3 2014 Q3 2015 EBITDA (non-GAAP) 77.5 59.4 Acquisition and integration related costs 2.3 - Restructuring costs 2.3 4.1 Sponsor management fees 2.5 - Site relocation costs 0.4 - Financing and IPO fees 3.5 - Asset impairments and Other (0.3) 2.3 Adjusted EBITDA (non-GAAP) 88.2 65.8 Reconciliations Reconciliation of EBITDA and Adjusted EBITDA(1) $MM Q3 2014 Q3 2015 Profit for the period 8.0 16.7 Acquisition and integration costs 2.3 - Amort. of Acquisition of Intangibles 8.9 7.0 Restructuring Costs 2.3 4.1 Sponsor management fees 2.5 - Site relocation costs 0.4 - Financing and IPO fees 3.5 - PECs interest expense 7.2 - Asset impairments and Other (0.3) 2.3 Net foreign exchange gain of financial instruments - - Net foreign exchange impacts (restated) 7.2 (3.5) Tax effect (9.2) (4.1) Adjusted Earnings 32.8 22.5 Adjusted EPS $0.45 $0.31 Reconciliation of Adjusted EPS to Profit/(Loss) (1) $MM, except per share Notes: Additional detailed information can be found on the 3Q15 6K form of the Company on the topics related to Reconciliation of EBITDA and Adjusted EBITDA and Reconciliation of Adjusted EPS to Profit/(Loss)

Debt Information
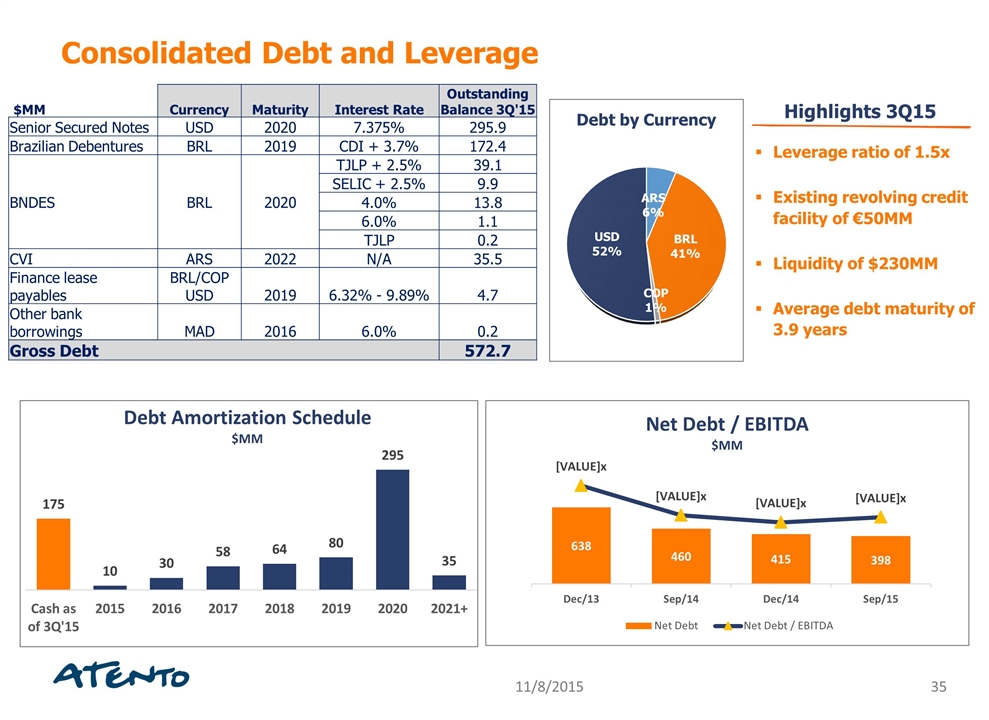
Consolidated Debt and Leverage $MM Currency Maturity Interest Rate Outstanding Balance 3Q'15 Senior Secured Notes USD 2020 7.375% 295.9 Brazilian Debentures BRL 2019 CDI + 3.7% 172.4 BNDES BRL 2020 TJLP + 2.5% 39.1 SELIC + 2.5% 9.9 4.0% 13.8 6.0% 1.1 TJLP 0.2 CVI ARS 2022 N/A 35.5 Finance lease payables BRL/COP USD 2019 6.32% - 9.89% 4.7 Other bank borrowings MAD 2016 6.0% 0.2 Gross Debt 572.7 Leverage ratio of 1.5x Existing revolving credit facility of €50MM Liquidity of $230MM Average debt maturity of 3.9 years Highlights 3Q15
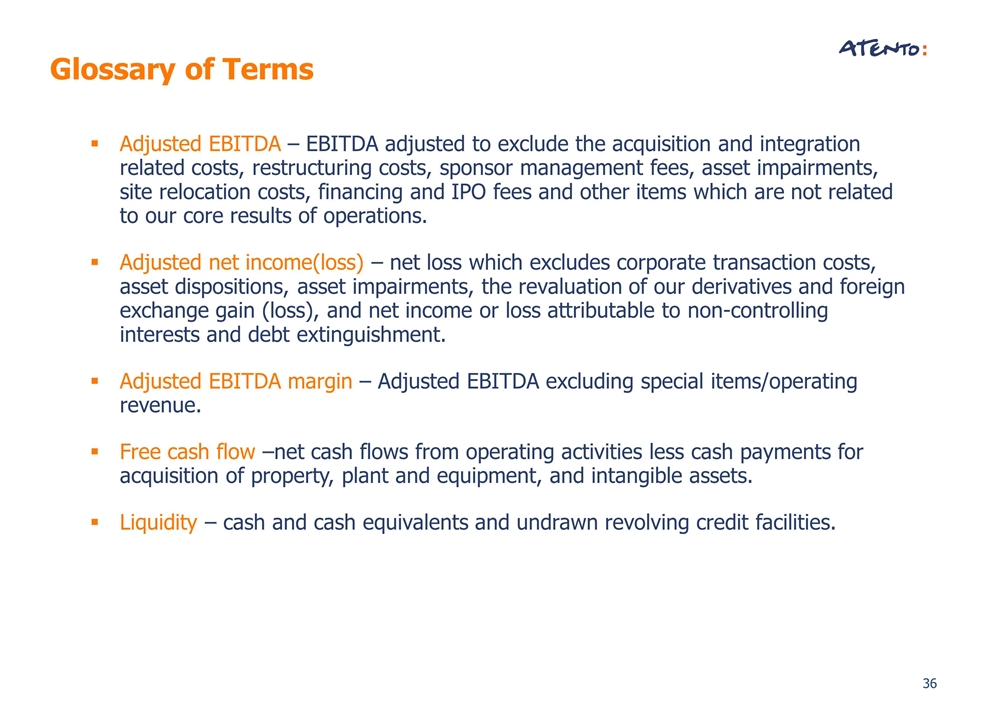
Glossary of Terms Adjusted EBITDA – EBITDA adjusted to exclude the acquisition and integration related costs, restructuring costs, sponsor management fees, asset impairments, site relocation costs, financing and IPO fees and other items which are not related to our core results of operations. Adjusted net income(loss) – net loss which excludes corporate transaction costs, asset dispositions, asset impairments, the revaluation of our derivatives and foreign exchange gain (loss), and net income or loss attributable to non-controlling interests and debt extinguishment. Adjusted EBITDA margin – Adjusted EBITDA excluding special items/operating revenue. Free cash flow –net cash flows from operating activities less cash payments for acquisition of property, plant and equipment, and intangible assets. Liquidity – cash and cash equivalents and undrawn revolving credit facilities.
Serious News for Serious Traders! Try StreetInsider.com Premium Free!
You May Also Be Interested In
- Next Crypto to Make You Rich: Pepeto’s Call Pulls Buyers Away From XRP and Cardano
- New Cryptocurrency Picks This Week: Can Solana or Zcash Match the Gains Analysts See in Pepeto?
- Solana Price Drops Over 2% Despite Upgrade as SOL Whales Rush Into AlphaPepe Presale For 200x
Create E-mail Alert Related Categories
SEC FilingsSign up for StreetInsider Free!
Receive full access to all new and archived articles, unlimited portfolio tracking, e-mail alerts, custom newswires and RSS feeds - and more!
