

Form 6-K Alio Gold Inc. For: Jun 12
 Tweet
Tweet Share
ShareUNITED STATES
SECURITIES AND EXCHANGE COMMISSION
Washington, D.C.
20549
FORM 6-K
REPORT OF FOREIGN PRIVATE ISSUER
PURSUANT TO RULE
13a-16 OR 15d-16
OF THE SECURITIES EXCHANGE ACT OF 1934
For the month of June, 2017
Commission File Number 001-35329
Alio Gold Inc.
(Translation of registrant’s name into English)
700 West Pender Street, Suite 615, Vancouver, British
Columbia V6C 1G8
(Address of principal executive
offices)
Indicate by check mark whether the registrant files or will file annual reports under cover of Form 20-F or Form 40-F:
Form 20-F [ ] Form 40-F [X]
Indicate by check mark if the registrant is submitting the Form 6-K in paper as permitted by Regulation S-T Rule 101(b)(1): [ ]
Indicate by check mark if the registrant is submitting the Form 6-K in paper as permitted by Regulation S-T Rule 101(b)(7): [ ]
Signatures
Pursuant to the requirements of the Securities Exchange Act of 1934, the registrant has duly caused this report to be signed on its behalf by the undersigned, thereunto duly authorized.
| ALIO GOLD INC. | ||
| Date: June 12, 2017 | By: | (signed) Greg McCunn |
| Greg McCunn | ||
| Chief Executive Officer |
EXHIBIT INDEX
| ANA PAULA PROJECT |
| FORM 43-101F1 TECHNICAL REPORT |
DATE AND SIGNATURES PAGE
This report is dated effective 16 May 2017. See Appendix A, Pre-Feasibility Contributors and Professional Qualifications, for certificates of qualified persons. These certificates are considered the date and signature of this report in accordance with Form 43-101F1.
 |
i |
| ANA PAULA PROJECT |
| FORM 43-101F1 TECHNICAL REPORT |
ANA PAULA PROJECT
FORM 43-101F1 TECHNICAL REPORT
PRELIMINARY FEASIBILITY STUDY
TABLE OF CONTENTS
|
|
ii |
| ANA PAULA PROJECT |
| FORM 43-101F1 TECHNICAL REPORT |
|
|
iii |
| ANA PAULA PROJECT |
| FORM 43-101F1 TECHNICAL REPORT |
|
|
iv |
| ANA PAULA PROJECT |
| FORM 43-101F1 TECHNICAL REPORT |
|
|
v |
| ANA PAULA PROJECT |
| FORM 43-101F1 TECHNICAL REPORT |
|
|
vi |
| ANA PAULA PROJECT |
| FORM 43-101F1 TECHNICAL REPORT |
|
|
vii |
| ANA PAULA PROJECT |
| FORM 43-101F1 TECHNICAL REPORT |
|
|
viii |
| ANA PAULA PROJECT |
| FORM 43-101F1 TECHNICAL REPORT |
|
|
ix |
| ANA PAULA PROJECT |
| FORM 43-101F1 TECHNICAL REPORT |
|
|
x |
| ANA PAULA PROJECT |
| FORM 43-101F1 TECHNICAL REPORT |
LIST OF FIGURES AND ILLUSTRATIONS
|
xi |
| ANA PAULA PROJECT |
| FORM 43-101F1 TECHNICAL REPORT |
|
xii |
| ANA PAULA PROJECT |
| FORM 43-101F1 TECHNICAL REPORT |
|
xiii |
| ANA PAULA PROJECT |
| FORM 43-101F1 TECHNICAL REPORT |
|
xiv |
| ANA PAULA PROJECT |
| FORM 43-101F1 TECHNICAL REPORT |
LIST OF TABLES
|
xv |
| ANA PAULA PROJECT |
| FORM 43-101F1 TECHNICAL REPORT |
|
xvi |
| ANA PAULA PROJECT |
| FORM 43-101F1 TECHNICAL REPORT |
|
xvii |
| ANA PAULA PROJECT |
| FORM 43-101F1 TECHNICAL REPORT |
|
|
xviii |
| ANA PAULA PROJECT |
| FORM 43-101F1 TECHNICAL REPORT |
|
xix |
| ANA PAULA PROJECT |
| FORM 43-101F1 TECHNICAL REPORT |
LIST OF APPENDICES
| APPENDIX | DESCRIPTION |
| A | Pre-Feasibility Study Contributors and Professional Qualifications |
| • Certificate of Qualified Person (“QP”) |
|
xx |
| ANA PAULA PROJECT |
| FORM 43-101F1 TECHNICAL REPORT |
1 SUMMARY
Alio Gold, Inc. (Alio Gold) has completed a preliminary feasibility study (PFS) of its wholly owned Ana Paula Project (“Ana Paula” or “the Project”), which is a gold resource development project located in the Guerrero Gold Belt in Guerrero, Mexico. This amended report replaces and supersedes the previous PFS for the Ana Paula Project in its entirety. The previous PFS was filed on the SEDAR website on May 26, 2017 and had an effective date of May 16, 2017. The highlights of the PFS include the following:
-
Proven & Probable Mineral Reserves of 13.4 million tonnes at 2.36 grams of gold per tonne for 1,021,000 contained ounces of gold
-
NPV5% = $223 million and IRR of 34% after taxes at $1,250 per ounce of gold
-
Initial Capital Cost of $137.2 million
-
First quartile operating costs with cash costs of $489 per ounce of gold and site All-in Sustaining Costs of $524 per ounce of gold
-
Gold recovery of 85%
-
Mine life of 7.5 years from an open pit producing 868,000 ounces of gold
-
Underground potential highlighted with Measured & Indicated Resources below the proposed pit of 3.0 million tonnes at 2.8 grams of gold per tonne for 266,700 contained ounces
-
Feasibility Study to start in July and take approximately 9 months to complete
1.1 INTRODUCTION
M3 Engineering & Technology Corp. (M3) was commissioned by Alio Gold Inc. to carry out a preliminary feasibility study (PFS) pursuant to Canadian Securities Administrators’ National Instrument 43-101 and Form 43-101F1 standards (collectively, “NI 43-101”) of the Ana Paula Project which is a gold resource development project located in Guerrero State, Mexico. The Project encompasses several gold occurrences within an exploration concession covering an area of more than 600 km2.
1.2 PROPERTY DESCRIPTION AND LOCATION
The Ana Paula Project is located in the north central part of the State of Guerrero in southern Mexico, roughly half way between the major cities of Mexico City and the Port of Acapulco. The Project centroid is located at UTM Q14N, WGS84, 409,027.8E and 1,997,632.6N or 99° 51’ 34.4 west longitude and 18° 3’ 55.2” north latitude near the municipality of Cuetzala del Progresos and Apaxtla del Castregon. The Project lies within the Sierra Madre mountain range where topography can range from moderate to rugged with elevations varying from 900 to over 1,460 meters above sea level (masl). The Balsas River, which divides the Sierra Madre Mountains into north and south ranges, flows just south of the project area.
The climate in the region is warm and humid, with temperatures ranging from 17º to 45º Celsius (ºC). Precipitation averages at 835 millimeters (mm) per year, mostly occurring between June and October during the monsoonal season, which is influenced by hurricanes from both the Atlantic and Pacific oceans. According to Mexican regulation NOM-141 SEMARNAT-2003, the Ana Paula site falls under seismic region C, where seismic events are common.
Alio Gold
(then Timmins Gold Corp.), acquired Newstrike Capital Inc. in an arrangement
that closed on May 26th, 2015. With the arrangement, Timmins Gold acquired
ownership of all of the issued and outstanding common shares of Newstrike
Capital Inc. its Canadian subsidiary Aurea Mining Inc. and its Mexican
subsidiary Minera Aurea S.A. de CV.
|
|
1 |
| ANA PAULA PROJECT |
| FORM 43-101F1 TECHNICAL REPORT |
The Ana Paula Project area is contained within two concessions, Aplaxta 3 and Tembo, which total 4,238 hectares (ha). The concessions are owned by Alio Gold’s Mexican subsidiary Minera Aurea S.A. de CV (Minera Aurea). In addition to the Aplaxta 3 and Tembo concessions Minera Aurea holds eleven concessions surrounding the Ana Paula Project totaling 46,278 ha that form the Aurea Norte Property and two non-contiguous concessions totaling 4,293 ha which form the Aurea Sur Property.
Alio Gold, through its Mexican operating subsidiary Minera Aurea, entered an agreement to acquire a 100% interest in certain mineral rights and concessions from Desarrollos Mineros San Luis, S.A. de C.V. and Minera San Luis S.A. de C.V., wholly owned Mexican subsidiaries of Goldcorp Inc. for CAD 2.1 Million in cash and shares. In addition, the Company granted Goldcorp a three percent net smelter return (NSR) royalty. Alio Gold will have the right to purchase one third of the Goldcorp royalty upon completion of an NI 43-101 feasibility study.
As of May 15, 2017, Minera Aurea controls surface rights to 2,442 hectares overlying and surrounding the Ana Paula Project area, where 1,283 hectares are owned outright and approximately 154 hectares are under contract in 30-year access agreements. An additional 1,005 hectares are under exploration access agreements. Negotiations regarding surface rights agreements for the remaining land required for the Ana Paula Project are ongoing with the landowners and the communities.
1.3 GEOLOGY AND MINERALIZATION
Mineralization in the Guerrero Gold Belt (GGB) is characterized as a skarn porphyry mineralization related to an early Tertiary intrusive event. Ana Paula is located along the northwesterly trend of the GGB where it straddles a boundary between two older tectonic sub-terranes; a volcanic-volcaniclastic arc assemblage to the west and a thick carbonate platform sequence overlain by younger marine deposits to the east.
The stratigraphy of both sub-terranes was deformed during the compressive Laramide orogeny and subsequently intruded by a ±62-66 million year calc-alkali magmatic event that is currently thought to be associated with the timing of mineralization responsible for the gold deposits and showings of the GGB.
The geologic units underlying the Ana Paula project are primarily sedimentary rocks composed of an interbedded limestone and shale unit and a carbonaceous limestone unit that have been intruded by intermediate sills, dikes and stocks. Six principal geological domains within Ana Paula Deposit have been recognized: (1) Complex Breccia domain that sits in the core of the main Ana Paula deposit is a steeply dipping sub-vertical plug stretched gently in an east-west direction and dipping to south. (2) Intrusive suite domain is a package of several different intrusive phases that in a general sense appear to be similar in composition and age. (3) Monolithic breccia domain is essentially a brecciated intrusion composed of mostly monolithic fragments in a silica rich matrix with mixed sulphide-oxide mineralogy. It is located in the southern part of the deposit. (4) Sediments domain is characterized by light brown weathering, platy outcrops, with distinct gray and brown limestone beds which range from a few centimeters to as much as 25 centimeters thick. Also a massive to thin bedded laminated carbonaceous limestone is present in this domain. The sediments domain is located in the eastern part of the deposit. (5) Skarn-Hornfels domain is found in the deeper zones of the deposits and shows a down dip zonation from unaltered sedimentary limestone-shale to skarn-hornfels metamorphic rock. (6) Semi-massive sulphide domain is very localized and narrow, and it develops at the contacts between the skarn-hornfels domain and the intrusive suite domain.
In general, four gold depositional settings are recognized at Ana Paula, including:
| 1. |
Quartz-sulphide and quartz-carbonate-sulphide veinlets, stockworks with sulphide clots and disseminations in both intrusions and hornfels. | |
| 2. |
Narrow semi-massive sulphide contact replacement of limestone or hornfels/skarn at the intrusion contacts. |
|
|
2 |
| ANA PAULA PROJECT |
| FORM 43-101F1 TECHNICAL REPORT |
| 3. |
Sulphide clots, rims and masses in narrow contact replacement of breccia hosted in intrusions at or near the sedimentary contacts and/or fault contacts (detachment faults). | |
| 4. |
Associated with a sulphide constituent within breccia matrix and with sulphide replacement textures within structurally controlled breccia formed oblique to the dominant northerly trending westerly dipping stratigraphy. |
The veinlets, stockwork, clots and disseminated mineralization, along with the contact replacement textures (settings 1, 2 and 3 above) are commonly observed contained within the intrusive and sediments domains that collectively make up a corridor of structurally controlled northerly trending and westerly dipping marine sediment and intrusive sill/dike stratigraphy that is host to a lower grade mineralization.
The bulk of the high-grade mineralization at Ana Paula occurs in the Complex Breccia domain. This lithological unit consists of a core of multi-lithic breccia in a steeply south plunging column surrounded by an alteration halo bearing high grade mineralization which is characterized by veins, fracture zones, and massive sulfide contact replacements. The vertical extent of the Complex Breccia has been modelled to a depth of 950 m below surface and it is currently limited by drilling. Horizontally, the high-grade mineralization extends between 200 m to 250 m away from the center of the Complex Breccia near surface. The horizontal extent gradually reduces at depth, down to between 20 m to 30 m at the lower extremity of the Breccia. Mineralization is continuous, and grade tends to be highest from the center of the complex breccia and extend into the sediments, intrusive, and hornfels lithology. Outside the halo, the mineralization is lower grade and occurs in stockwork, with sulphide clots and disseminations mainly in hornfeld and intrusive.
1.4 EXPLORATION AND DRILLING
Active exploration of the Ana Paula project began in 2005 and has taken place continuously since 2010. Exploration activities include surface mapping and sampling, geophysical surveys, and drilling. Surface mapping and sampling has been thorough and ongoing. Outcrop and road cut locations are registered on handheld GPS (WGS84 datum) and recorded along with lithologic, structure, mineralization, alteration and other relevant details on field map sheets of the same 1:2000 scale that are then transferred first by hand then digitally to the final map sheets. Geophysical surveys of the area have included aeromagnetics, airborne radiometrics (K, Th, U), induced polarization (IP), and an airborne Z-axis tipper electromagnetic (ZTEM) survey.
Upon acquiring the property in 2015, Alio Gold carried out an extensive review of the data delivered by Newstrike including field review of the existing geological maps by Alio Gold personnel and re-logging of 113 drill holes located in the vicinity of the pit design area and extending below the pit design. A total of 49,968.89 meters of core were re-logged by Alio Gold to provide detailed information across the entire mineralization system and unified lithological, structural and mineralized criteria with the goal to improve support for the geological model.
The primary means of exploration has been by core drilling from the surface. Drilling began with Goldcorp in 2005, continued with Newstrike 2010-2015, and continues with Alio Gold to the present. Table 1-1 shows the drilling.
Table 1-1: Drill Hole Summary by Year and Company
| Year | Company | Number of holes | Total length |
| 2005 | Goldcorp | 11 | 3,689.25 |
| 2010 | Newstrike | 12 | 5,227.02 |
| 2011 | Newstrike | 57 | 29,697.26 |
| 2012 | Newstrike | 72 | 41,260.24 |
| 2013 | Newstrike | 78 | 33,925.25 |
| 2014 | Newstrike | 2 | 1,517.90 |
| 2015 | Alio | 10 | 2,008.05 |
| 2016 | Alio | 31 | 7,304.07 |
| 2017 | Alio | 12 | 2,539.10 |
|
3 |
| ANA PAULA PROJECT |
| FORM 43-101F1 TECHNICAL REPORT |
The average drill hole spacing is approximately 50 m in the main part of the Ana Paula deposit, with a range of from 20-50 m in the high-grade Breccia Zone and 50-150 m to the north and south pit extremities.
Drilling by Alio at the Ana Paula property consisted of a program in 2015 with two components: confirmation drilling and infill drilling. The 2015 program was followed by a major program in 2016-17 consisting of three main components: infill drilling, geotechnical drilling, and condemnation drilling.
The 2015 confirmation drilling consisted of a total of 606 m of core in three twinned drill holes. The results from the confirmation drilling were consistent with those from previous programs. The infill drilling consisted of 1,403 m of core from seven drill holes. All drilling was completed with HQ (63.5/93.5 mm) diameter diamond drill core rods.
The infill drilling results were very encouraging, as they continued to display Ana Paula’s high-grade gold mineralization and allowed for a greater understanding of the deposit.
The 2016-2017 infill drilling consisted of approximately 9,663 m of core in 37 holes. The infill drilling program significantly increased the delineation of the high-grade breccia zone and the mineralization halo surrounding the high-grade breccia.
1.5 METALLURGY
A series of metallurgical test programs were conducted on Ana Paula material in support of this study. New composites were selected by Alio Gold personnel to be representative of the main lithological domains: intrusive suite (granodiorite, GD); complex breccia (high-grade breccia, HGB); sediments + skarn-hornfels mix (LS); monolithic breccia (low-grade breccia, LGB). These composites were subjected to a variety of metallurgical tests including comminution testing, gravity concentration, whole ore flotation, whole ore cyanidation and pre-oxidation.
1.5.1 Comminution Tests
Comminution results suggest that Ana Paula material is moderately hard to hard. Comminution testwork consisted of JK RBT Lite tests, Bond Ball Work Index Tests, SMC tests and Abrasion index tests. Results are presented in Table 1-2. The SMC results indicate the material is somewhat harder than that suggested by the JK RBT Lite work. The SMC results therefore represent a more conservative approach to grinding circuit design. Abrasion testing results indicate that the Ana Paula material is mildly abrasive and that mill liner wear will not be extreme.
Table 1-2: Comminution Test Results
| Domain Composite | JK RBT Lite Unscaled
Parameter (A x b) |
SMC Results (Axb) | BWI (kWh/t) | Abrasion Index (Ai)
|
| Granodiorite (GD) | 43.3 | 34.8 | 19.4 | 0.189 |
| 0.203 | ||||
| High Grade Breccia (HGB) | 44.0 | 33.3 | 16.0 | 0.194 |
| Limestone Shale (LS) | 39.6 | N/A | 15.1 | 0.078 |
| Low Grade Breccia (LGB) | 55.6 | N/A | 16.2 | 0.081 |
1.5.2 Flotation Tests
A comprehensive flotation testwork program was completed on the three predominant domains (GD, LGB, and LS). The study evaluated the impacts of primary grind size, reagent scheme, pH, retention time, and pulp density. The following outcomes are summarized from this study.
- Gold recoveries ranged from 93% for LS to 96% for GD and HGB.
|
|
4 |
| ANA PAULA PROJECT |
| FORM 43-101F1 TECHNICAL REPORT |
-
Primary grinds ranging from 75 to 160 micrometers (µm) were evaluated. The primary grind size had no impact on final flotation recoveries so the coarsest primary grind, 80% passing (P80) 160 µm, was selected for the process design criteria.
-
All composites required the addition of copper sulphate for pyrite and arsenopyrite activation. Copper sulphate was added at the rate of 100 grams per tonne of material (g/t).
-
Potassium Amyl Xanthate (PAX) was added as the primary sulphide mineral collector. Optimum dosage rates ranged from 60 to 110 g/t. PAX was necessary to ensure maximum gold recovery. Tests conducted with alternate primary collectors resulted in lower overall recovery.
-
3418A was added to the GD and HGB composites as a secondary collector. Highest recoveries were noted when dosage rates ranged from 40 to 50 g/t.
-
F-131A was identified as the preferred frother. Optimum dosages ranged from 64 to 128 g/t.
1.5.3 Gravity Gold Recovery
Ana Paula material responded well to gravity concentration. Extended Gravity Recoverable Gold (EGRG) tests were conducted on each domain composite. These tests are conducted with successively finer grind sizes culminating with a final grind of 80% passing 75 µm. Anticipated gravity circuit performance is dictated by grinding and gravity circuit design. Given that the primary grind size required for adequate flotation was 160 µm one may expect that gold recovery to gravity concentrate will be somewhat less than that reported by the EGRG results. Modelling of the gravity circuit was conducted by FLSmidth-Knelson and suggests that the average life-of-mine recovery of gold to the gravity concentrate will be approximately 20% at a P80 grind size of 160 µm, assuming the treatment of a 36% circulating load through the gravity circuit.
1.5.4 Whole Ore Cyanidation
A comprehensive set of whole ore cyanidation tests were conducted on the three main domain composites (GD, HGB and LS). This test program evaluated the effects of primary grind size, cyanide concentration, lead nitrate addition, dissolved oxygen content, pre-aeration, and residence time. Leach recoveries ranged from 59% to 70% for GD, 62% to 68% for HGB and 6% to 50% for LS. Preg-robbing carbonaceous material identified in the LS composite was used to explain the low gold recoveries in initial testing. LS recoveries improved to the mid- to high-40% range through the addition of activated carbon. The impact of this carbon addition is illustrated in Figure 1-1.

Figure 1-1: Effect of Carbon Addition during Whole Ore Cyanidation
|
|
5 |
| ANA PAULA PROJECT |
| FORM 43-101F1 TECHNICAL REPORT |
Ana Paula’s material was largely insensitive to primary grind size, residence time, cyanide concentration, lead nitrate addition and preaeration. The whole ore leach tests underscore the fact that gold recovery is limited by the refractory gold content in the material.
1.5.5 Pre-Oxidation Tests
The primary sulphide minerals at Ana Paula, pyrite and arsenopyrite, were both identified as being carriers of refractory gold. Increasing overall gold recovery requires breaking down the crystal structure of the sulphides by oxidation to make the gold available to the cyanide solution. Pressure oxidation and atmospheric oxidation were evaluated and compared to select the preferred process for recovery of the refractory gold.
Acidic pressure oxidation of both whole ore and flotation concentrates displayed overall gold recoveries in excess of 95%. Sulphide oxidation in these tests ranged from 96% to 98%. Due to the amount of acid consuming carbonate present in Ana Paula material, an alkaline pressure oxidation test was conducted, but alkaline oxidation up 50% less complete and gold recovery was limited to 75%.
An atmospheric oxidation process was tested at ambient pressure and temperature of 75ºC in open tanks with a sodium based neutralizing agent. An initial screening program highlighted that overall gold recovery from the atmospheric oxidation process would yield an average overall gold recovery of approximately 85% to 86% using soda ash as the neutralizing agent. M3 Engineering completed a trade-off study comparing pressure oxidation of flotation concentrates to atmospheric oxidation of flotation concentrates. The higher capital cost, and additional technical complexity of pressure oxidation did not support the added recovery benefit. The atmospheric oxidation flowsheet was selected for further optimization.
Additional atmospheric oxidation testwork was focused on determining the optimum soda ash addition rates, verifying the concentrate regrind size and studying the effect of residence time on sulphide oxidation and gold recovery. A preliminary evaluation of domain specific oxidation tests was also carried out.
Soda ash addition had a direct relationship to gold recovery. This is highlighted in Figure 1-2 below. In the sample tested, which had a sulphur grade of 9.9%, 150 kg/t was sufficient to maintain a pH at the discharge of the oxidation test of approximately 7, suggesting that this dosage is sufficient to neutralize the acid produced. When lower soda ash dosages were applied, the pH within the oxidation circuit dropped below 7 for periods of time, and lower gold recoveries were noted. Carbonate, likely calcite, present in the flotation concentrate will dissolve in acidic conditions. The free calcium ions it will release likely precipitate as gypsum in the sulphate rich environment. This gypsum precipitate coats the sulphide particles resulting in their passivation and reducing the overall sulphide oxidation and gold recovery.

Figure 1-2: Relationship of Soda Ash Dosage and Gold Leach
Recovery of Gravity Tail/Flotation
Concentrates (25µm regrind size)
|
|
6 |
| ANA PAULA PROJECT |
| FORM 43-101F1 TECHNICAL REPORT |
The impact of regrinding was tested at three soda ash addition levels. Other parameters, such as temperature and residence time were held constant. Finer regrind size yielded higher overall gold recoveries. This influence is stronger at lower soda ash dosages, possibly due to the passivating influence of insufficient soda ash, as shown in Figure 1-3.

Figure 1-3: Effect of Regrind Size on Gold Leach Recovery of Gravity Tail/Flotation Concentrates
Oxidation kinetics are relatively quick. An oxidation versus recovery profile was generated using the standard 150 kg/t soda ash dosage, with temperature and regrind size held constant at 75°C and 25µm respectively. Gold recovery was measured from carbon-in-leach bottle rolls that were conducted on samples that had been oxidized for 8, 24, 48 and 72 hours. Gold recovery increased from 83% after 8 hours of oxidation to 88% after 48 hours. No additional recovery was recorded from the 72-hour residence time, indicating that 48 hours of retention time is sufficient.
1.5.6 Overall Metallurgical Flowsheet
Based on the testwork described above the Ana Paula process flowsheet includes the following:
-
Primary grinding to 80% passing 160 µm
-
Gravity concentration
-
Intensive Leaching of Gravity Concentrates
-
Flotation
-
Regrinding of flotation concentrates to 80% passing 25µm
-
Atmospheric Oxidation of flotation concentrates
-
Carbon-in-Leach
-
Carbon Elution
-
Gold Electrowinning and smelting
Approximately 20% of the gold is expected to be recovered in the gravity circuit. The remainder of the ground material will feed a flotation plant where approximately 20% of the mass and 95% of the remaining gold will be recovered to concentrate. This concentrate is reground to 80% passing 25µm prior to being treated through the atmospheric oxidation circuit. Soda ash will be added to maintain the oxidation pH above 7. Following oxidation, the pH will be adjusted to 10.5 with lime, prior to the addition of cyanide in a Carbon-in-Leach (CIL) circuit. Gold will be recovered from loaded carbon through a standard elution process. This flowsheet is expected to yield an average overall gold recovery of 85%.
|
|
7 |
| ANA PAULA PROJECT |
| FORM 43-101F1 TECHNICAL REPORT |
1.6 MINERAL RESOURCE ESTIMATE
The Ana Paula updated Mineral Resource Estimate (MRE) was developed in conformance with the CIM Mineral Resource definitions referred to in the NI 43-101 Standards of Disclosure for Mineral Projects. This mineral resource estimate is an update of the May 26, 2016 estimate completed by JDS Energy and Mining Inc. for the Ana Paula project.
The estimate was completed based on the concept of a small to medium scale open pit, with a possible resource for an underground operation for the material remaining below the pit bottom.
The Ana Paula drill database was thoroughly validated prior to the resource estimate and was found to be error free. All drill core samples were analyzed at internationally recognized and accredited laboratories which were independent from the company. Core handling, chain of custody, quality control and quality assurance were found to adhere to industry best practice.
The Ana Paula grade models were interpolated using 276 core holes completed by Goldcorp in 2005, Newstrike Capital from 2010 through 2015, and Alio Gold since 2015. The database totaled 123,268 m of core and contained 86,013 assays.
The 3D wireframes developed to control the grade interpolation of the resource model were based primarily on lithology with a probabilistic approach used for the high-grade mineralized halo and the high-grade zones in the lithologies outside the halo. The deposit has been modeled using an Ordinary Krige applied to 3 m gold and silver drill hole composite lengths which respected lithology units.
Densities were determined from a suite of 5,946 representative core samples using industry standard methods. The density was then interpolated in areas where the data was sufficiently abundant to honor localized variations. For the remaining areas, the average density for each of the lithological domains was applied.
The block model matrix size of 5 m x 5 m x 6 m (width x length x height) was selected in consultation with the engineering team from AGP, and was based on the size deemed suitable for a small to moderate open pit mining scenario with possible underground mining components below the pit.
The interpolation was carried out in multiple passes with increasing search ellipsoid dimensions. The classification was based primarily on the pass number and the average distance to the composites, followed by an adjustment based on diamond drilling density (core area), and the krige efficiency.
Under CIM definitions, Mineral Resources should have a reasonable prospect of economic extraction. A gold price of $1,350/ounce and a silver price of $17/ounce was used for the cut-off determination. For open pit resources, a cut-off of 0.6 g/t gold was used.
To further assess reasonable prospects of economic extraction, a Lerchs-Grossman optimized shell was generated to constrain the potential open pit material. Parameters used to generate this shell included:
-
49.5° overall slopes for the pit shell
-
USD $2.25/t mining, USD $19/t milling, USD $2.49/t G&A operating costs
-
88% gold recovery, and 30% silver recovery
|
|
8 |
| ANA PAULA PROJECT |
| FORM 43-101F1 TECHNICAL REPORT |
-
Gold price of $1,350/ounce and $17/ounce silver price
-
Above criteria was applied to Measured, Indicated, and Inferred materials
To further assess reasonable prospects of economic extraction for the material below the resource constraining shell, a break-even cut-off of 1.65 g/t gold was selected based on the following parameters:
-
USD $36/t mining, USD $19/t milling, USD $2.49/t G&A operating costs
-
88% gold recovery and 30% silver recovery
-
Gold price of $1,350/ounce and $17/ounce silver price
-
Dilution considered for cut-off determination 5%
-
Above criteria was applied to Measured, Indicated, and Inferred materials
Based on the geometry of the deposit, the material amenable to underground extraction will possibly be using a bulk mining method such as long-hole or modified Avoca mining method. The break-even cut-off stated above is only applicable to the material in the vicinity of the mineralized HALO due to increase in development cost reaching blocks further away. A mining plan does not exist for the material amenable to underground extraction; therefore, stope size, level spacing and other underground mining criteria have not yet been established.
With an effective date of May 16, 2017 and based on the above criteria, a summary of the mineral resource is presented in Table 1-3, tabulated at a cut-off of 0.6 g/t gold within the resource constraining shell and 1.65 g/t gold below the shell.
Table 1-3: Ana Paula Resource Statement Effective May 16, 2017
| Area | Category | Cut-off (Au g/t) |
Tonnes | Au (g/t) |
Gold (ounces) |
Ag (g/t) |
Silver (ounces) |
| Resources
amenable to open pit extraction |
Measured | 0.6 | 7,541,000 | 2.43 | 590,000 | 5.1 | 1,236,000 |
| Indicated | 10,491,000 | 1.79 | 605,000 | 4.8 | 1,629,000 | ||
| Measured &
Indicated |
18,032,000 | 2.06 | 1,195,000 | 4.9 | 2,865,000 | ||
| Inferred* | 249,000 | 1.27 | 10,000 | 8.8 | 70,000 | ||
| Resources
amenable to underground extraction |
Measured | 1.65 | 41,000 | 2.07 | 2,800 | 4.3 | 6,000 |
| Indicated | 2,925,000 | 2.81 | 264,000 | 4.2 | 398,000 | ||
| Measured &
Indicated |
2,967,000 | 2.80 | 266,700 | 4.2 | 404,000 | ||
| Inferred* | 621,000 | 2.07 | 41,400 | 3.9 | 79,000 | ||
| Total Resources | Measured | OP 0.6
and UG 1.65 |
7,582,000 | 2.43 | 592,800 | 5.1 | 1,242,000 |
| Indicated | 13,416,000 | 2.01 | 869,000 | 4.7 | 2,027,000 | ||
| Measured &
Indicated |
20,998,000 | 2.17 | 1,461,800 | 4.8 | 3,269,000 | ||
| Inferred* | 870,000 | 1.84 | 51,400 | 5.3 | 149,000 |
The quantity and grade of reported Inferred resources in this
estimation are conceptual in nature, and are estimated based on limited
geological evidence and sampling. Geological evidence is sufficient to imply but
not verify geological and grade or quality continuity. For these reasons, an
Inferred Mineral Resources has a lower level of confidence than an Indicated
Mineral Resources and it is reasonably expected that the majority of Inferred
Mineral Resources could be upgraded to Indicated Mineral Resources with
continued exploration. Mineral Resources that are not
|
|
9 |
| ANA PAULA PROJECT |
| FORM 43-101F1 TECHNICAL REPORT |
Mineral Reserves do not have demonstrated economic viability. Rounding of tonnes as required by reporting guidelines may result in apparent differences between tonnes, grade, and contained metal content.
1.7 MINERAL RESERVE ESTIMATE
The reserves for Ana Paula are based on the conversion of the Measured and Indicated resources within the current Technical Report mine plan. Measured resources are converted directly to Proven Reserves and Indicated resources to Probable Reserves. The total reserves for Ana Paula are shown in Table 1-4.
Table 1-4: Proven and Probable Reserves – Ana Paula
| Category | Tonnes (kt) | Gold Grade (g/t) | Gold (ounces) | Silver Grade (g/t) | Silver (ounces) |
| Proven | 6,533 | 2.62 | 550,000 | 5.31 | 1,115,000 |
| Probable | 6,907 | 2.12 | 471,000 | 5.13 | 1,139,000 |
| Total | 13,440 | 2.36 | 1,021,000 | 5.22 | 2,254,000 |
The reserves are based solely on the Ana Paula open pit. The underground resources have not been converted and remain resources only for this Technical report.
1.8 MINING
The Ana Paula project will be mined by open pit methods with a contractor using conventional truck and loader production equipment. Pit optimization and mine planning was carried out on that basis to support a plant capacity of 5,000 tonnes-per-day. The mine design work used only measured and indicated resources provided in the latest resource model dated May 16, 2017. Inferred material was considered as waste with zero grade applied.
A series of pit optimizations were examined at various metal prices with a base price of US$1200/oz for gold. Metal prices lower than this were examined to determine the best mixture of resource utilization, strip ratio and project economics. The pit design was created using a gold price of US$984/oz after completing the analysis.
The geologic model provided was a whole block, internally diluted grade model. AGP considered that contact dilution would also play a role in the ore sent to the mill. Dilution is calculated for each contact side using a 0.5 m contact dilution distance. If one side of the block is touching waste, then it is estimated that dilution of 9.1% would result. If two sides are contacting, it would rise to 16.7%, three sides are 23.1% and four sides is 28.6% . Four sides represent an isolated block of ore. The model was examined and the appropriate dilution percentage added to the model blocks at the contact dilution grade. Comparison of the in-situ to the diluted value for the design pit optimization shell showed ore tonnage dilution of 5.1% and gold grade dilution of 4.2% and silver grade dilution of 1.9% . Tonnes and grade for the pit designs and reserves are reported with the diluted tonnes and grade.
Three pit phases were designed for Ana Paula. Due to the topography present at the project site, access to each of the phases was considered crucial and was incorporated into the designs. Slopes for the pit design were based on Knight Piésold recommendations. They have safety benches of 8.1 m in width every 18 m vertically with an 80 degree bench face angle. This provides for a 58 degree inter-ramp angle in all sectors of the pit.
Equipment sizing for ramps and working benches is based on the use of 63 t rigid frame trucks although the final contractor will use 56t trucks. Single lane access is 17.8 m (2 x operating width plus berm and ditch) and double lane widths are 23.5 m (3 x operating width plus berm and ditch). Ramp gradients are 10% in the pit for uphill gradients and 8% uphill on the dump access roads. Working benches are designed for 35 to 40 m minimum on push backs.
The project life will extend over a period of 10 years, including two years of pre-stripping followed by 8-years of production operations as shown in the mine production schedule provided in Table 1-5. The cut-off for the mine schedule are based on a gold only cut-off of 0.67 g/t gold. The LOM schedule delivers 13.44 Mt of ore grading 2.36 g/t gold and 5.13 g/t silver. Waste totals 43.74 Mt for a LOM strip ratio of 3.25:1.
|
|
10 |
| ANA PAULA PROJECT |
| FORM 43-101F1 TECHNICAL REPORT |
Table 1-5: Mine Production Schedule by Year
| Year | Mill Feed
(Mt) |
Au (g/t) |
Ag (g/t) |
Waste (Mt) |
Mine to Mill
(Mt) |
Mine to Stock
(Mt) |
Stock to
Mill (Mt) |
Total Material (Mt) |
Strip Ratio
(W:O) |
| -2 | - | - | - | 2.27 | - | 0.12 | - | 2.39 | - |
| -1 | - | - | - | 4.94 | - | 0.33 | - | 5.27 | - |
| 1 | 1.70 | 2.09 | 6.92 | 7.26 | 1.38 | 0.36 | 0.31 | 9.31 | 4.17 |
| 2 | 1.80 | 1.96 | 5.67 | 7.15 | 1.79 | 0.07 | 0.01 | 9.01 | 3.85 |
| 3 | 1.80 | 2.59 | 6.86 | 7.40 | 1.60 | - | 0.20 | 9.20 | 4.61 |
| 4 | 1.80 | 2.13 | 5.06 | 7.35 | 1.65 | - | 0.15 | 9.15 | 4.45 |
| 5 | 1.80 | 3.11 | 5.50 | 4.53 | 1.80 | - | - | 6.33 | 2.52 |
| 6 | 1.80 | 1.82 | 3.32 | 2.19 | 1.80 | - | - | 3.99 | 1.21 |
| 7 | 1.80 | 2.97 | 3.63 | 0.55 | 1.80 | - | - | 2.35 | 0.31 |
| 8 | 0.94 | 2.09 | 4.56 | 0.10 | 0.74 | - | 0.21 | 1.05 | 0.14 |
| Total | 13.44 | 2.36 | 5.13 | 43.74 | 12.56 | 0.88 | 0.88 | 58.06 | 3.25 |
The plant is anticipated to take 3 months to commission in Year 1. Lower grade material will be sent initially as the plant starts. Month 4 will see the plant at full capacity. Ore grades will fluctuate monthly depending on material available in the pit. Higher grade material is direct shipped to the mill with lower grade material stockpiled for later use to maximize the feed grade to the plant in the early years.
All mine equipment is modelled as provided by contractors. Total material movement peaks at approximately 9.3 million tonnes per year, which requires a modest production fleet of up to 8 conventional 56-tonne class haul trucks and two 6.4 m3 class wheel loaders. Drilling can be completed with two DTH drill rigs a single rotary machine capable of drilling 127 mm diameter holes.
During the mine life, two stockpiles will be required to manage the mill throughput. One will be a temporary location on the Valley WRF to be used in Year 1. The second will be located adjacent to the primary crusher for use as required during the mine life.
Underground mining was not considered for this PFS but warrants further investigation. It has the potential to add additional high grade tonnage to the mine plan. Alio has taken steps to develop an underground drift to allow access to the material beneath the design pit. This is proposed to be started in Q3 2017 with development, drilling and evaluation to follow.
1.9 MINE ROCK MANAGEMENT
Rock management facilities (RMF) will be constructed during operations in various locations surrounding the open pit. As required, material mined in year 1 and onwards will also be used for tailing management facility (TMF) embankment construction. The various RMF will be designed at later stages to be reclaimed concurrent with operations to reduce ultimate liability upon mine closure.
In pre-production 7.2 million tonnes of mine rock and 0.45 million tonnes of mill-feed will be pre-stripped. Life- of-mine (LOM), a total of 43.7 million tonnes of mine rock will be moved at a strip ratio of 3.25 to 1.
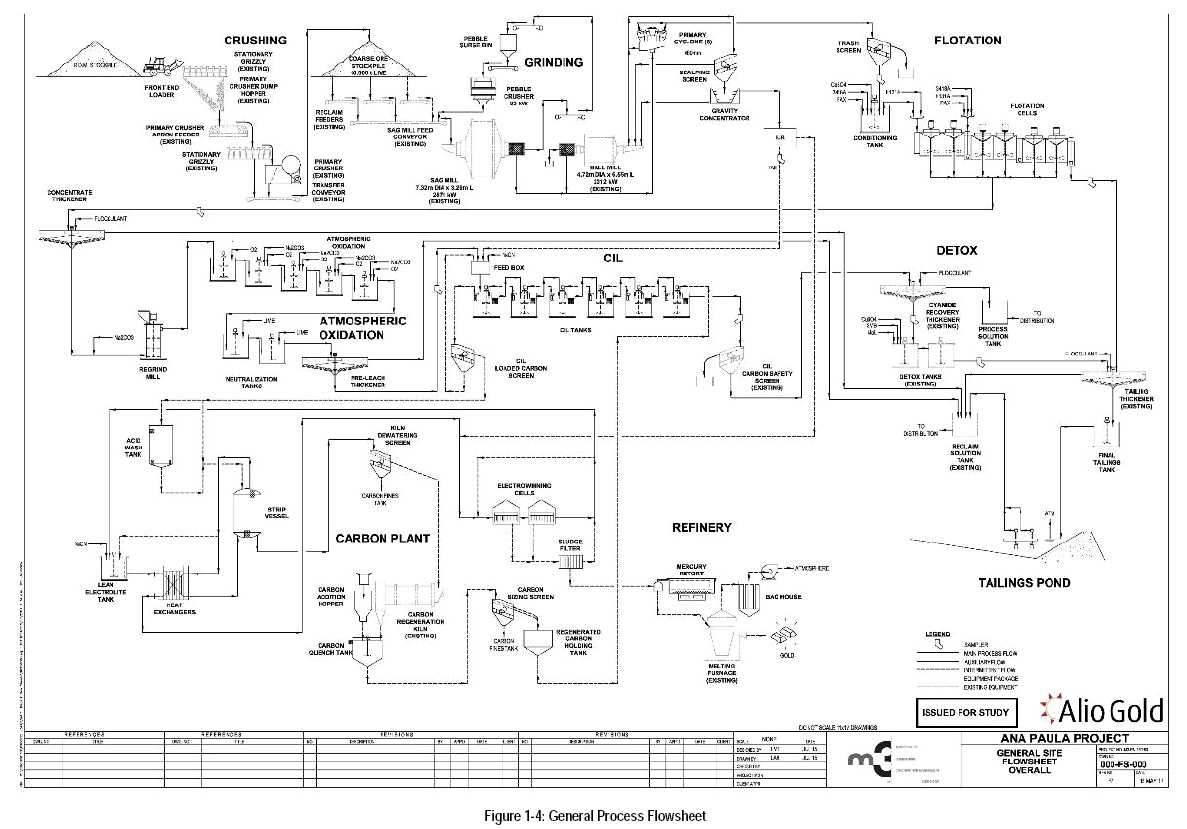
1.10 RECOVERY METHODS
The Ana Paula processing facility will recover gold and silver by gravity concentration, flotation, oxidation of flotation concentrate and cyanidation of the oxidized concentrate by the carbon-in-leach process. The mill is designed at a nominal capacity of 5,000 t/d at 92% availability. Gold and silver adsorbed on activated carbon are desorbed into solution and then recovered by electrowinning. The recovered metals are smelted into doré bullions, which are the final product of the operations.
|
|
11 |
| ANA PAULA PROJECT |
| FORM 43-101F1 TECHNICAL REPORT |
Figure 1-4 is a simplified schematic of the process for the Ana Paula process plant. The design of the plant and sizing of equipment were aided by the process mass balance that was developed using MetSim software.
|
|
12 |
| ANA PAULA PROJECT |
| FORM 43-101F1 TECHNICAL REPORT |
|
|
13 |
| ANA PAULA PROJECT |
| FORM 43-101F1 TECHNICAL REPORT |
1.10.1 Comminution and Stockpile
Run-of-Mine is delivered to the 42” x 48” Kolberg-Pioneer jaw crusher (187 kW or 250 hp) for primary crushing at a closed-side setting of 150 mm. Oversized rocks are removed from the feed with a stationary grizzly (opening: 800 mm). This is followed by a scalping grizzly, which bypasses rocks smaller than 100 mm to the transfer conveyor. The oversize of the second grizzly reports to the primary crusher, to where the crushed ore is discharged.
The transfer conveyor is also the stacking conveyor feeding the coarse-ore stockpile. The live capacity of the stockpile is 10,500 tonnes, which is nominally two days’ worth of feed to the mill.
Crushed ore is reclaimed via a reclaim tunnel beneath the stockpile, with three reclaim feeders (two operating and one standby) onto the SAG mill feed conveyor.
1.10.2 Grinding and Pebble Crushing
The grinding circuit for the Ana Paula Project is a conventional SABC circuit with one SAG mill, a pebble wash screen, one ball mill, one cyclone cluster, and a pebble crusher. The SAG mill is in a closed circuit with the screen and pebble crushing. The ball mill is in a closed circuit with the hydrocyclone cluster.
The SAG mill is an FFE Minerals mill, 7.32 m diameter by 2.74 m effective grinding length (24 ft x 9 ft EGL), powered by a new 2,872 kW (3,850 hp) drives on VFD. The ball mill was also supplied by FFE Minerals, 4.72 m diameter and 6.55 m long, driven by a fixed-speed 2,313 kW (3,100 hp) motor. Pebbles from the SAG mill is crushed by a cone crusher similar to a Metso HP100.
The SAG mill and ball mill share a common discharge sump. The combined discharge slurry is pumped from this sump to the hydrocyclone cluster by a 260-kW (350-hp) centrifugal pump on variable frequency drive. A second pump is installed as standby. The hydrocyclone cluster has five 26-inch hydrocyclones, with four operating and one on standby. The target grind size for the grinding circuit product is 80 percent finer than 160 microns.
1.10.3 Gravity Concentration
A split from the hydrocyclones overflow is processed for gold recovery by gravity concentration and intensive cyanidation. Gravity concentration is achieved using a centrifugal concentrator (Knelson KC-QS40 or equivalent). The gravity concentrate is then leached with cyanide in the presence of an oxidizer using an intensive leach package (Acacia CS200 ore equivalent). The pregnant solution produced is sent to the same electrowinning circuit serving the oxidized concentrate leach circuit.
1.10.4 Flotation
Sulfides in the ore is floated at the ore’s natural pH using potassium amyl-xanthate (PAX) as collector, AERO 3418A as promoter, copper sulfate as activator, and F131A as frother.
Flotation of sulfides is accomplished by single-stage rougher flotation. Cyclone overflow is first sent to a 41.2 m3 conditioning tank, then to a bank of six 70 m3 tank flotation cells. Each flotation cell mechanism is driven by a 93 kW (125 hp) motor through a gear reducer. Flotation air is supplied by a 70 kW (94 hp) blower, which can deliver 95 Nm3/min of air.
The tailing is pumped to one flotation tailing thickener (28 m
diameter high-rate thickener) to be thickened to 55% solids, in preparation for
pumping to the tailing storage facility.
|
|
14 |
| ANA PAULA PROJECT |
| FORM 43-101F1 TECHNICAL REPORT |
1.10.5 Concentrate Thickening and Regrind
Concentrate from the rougher flotation circuit is dewatered in the 10.5 m diameter high-rate thickener to a pulp density of 55% solids. Underflow from the concentrate thickener is pumped using variable speed horizontal centrifugal slurry pumps to the regrind mill feed box. The thickener overflow, is pumped to the reclaim solution tank.
The concentrate regrind mill is a 900-kW tower mill with ceramic grinding media. It operates in open circuit while being monitored by an online particle size analyzer. The target grind of 80% finer than 25 microns is attained by controlling mill speed with a variable speed drive. The reground concentrate is pumped to the atmospheric oxidation feed box.
1.10.6 Atmospheric Oxidation
Atmospheric oxidation (AOX) of the sulfide concentrate is conducted in five agitated tanks. Each tank is 9 meters in diameter and 10 meters high (operating volume of 608 m3), made of 2205 duplex stainless steel. Each agitator is powered by a 56 kW (75 hp) motor through a gear reducer. Oxygen is injected into each tank through fine-bubble spargers.
The reaction kinetics was found to be optimized in the laboratory at around 75 oC. It is exothermic and expected to be autothermic if the feed concentrate grade is kept at 10% sulfide sulfur or higher. However, during cold startup, for example after a long shutdown, pulp in the first, and possibly the second AOX tank, will need to be preheated to get the reaction started and provide its own heat. The preheat temperature may be as low as 50 oC up to the actual minimum reaction temperature of 75 oC. The required preheat temperature will have to be established at the start of actual operation.
1.10.7 Carbon-in-Leach (Cyanidation)
The oxidized slurry neutralized to pH 10 to 10.5 with milk of lime. The neutralized slurry is then pumped to a pre-leach thickener (10.5 m diameter) to increase the pulp density to 55% solids. Once thickened, slurry is pumped to the carbon-in-leach feed tank where it combines dilution water, sodium cyanide reagent feed, and other process streams, into the first CIL tank.
Cyanide leaching is achieved in six CIL tanks (9.8 m diameter, 9.8 m high, 696 m3 operating capacity) for 48 hours. Each equipped with 30 kW (40 hp) agitators with two narrow-blade hydrofoil impellers. Air is delivered by a pipe under an inverted cone located directly below the agitator. After leaching, loaded activated carbon is sent to the carbon plant for stripping and electrowinning.
1.10.8 Carbon Handling Plant – Carbon Elution and Metal Recovery by Electrowinning
Loaded carbon is first acid washed with a dilute solution of hydrochloric acid to remove scale from the carbon, rinsed, and then pumped to the carbon stripping vessel. Five tonnes of carbon is stripped per batch, following the pressure Zadra procedure. Hot strip solution (135 oC) is introduced at the bottom of the carbon bed and overflows at the top of the vessel, carrying with it gold and silver that desorbs from the loaded carbon. Because of the elevated temperature, the strip vessel is kept at about 550 kPa to prevent boiling. The filtered residue is finally dried in retorts to remove and collect any mercury, and smelted in a tilting furnace. Metallic gold and silver melt is then poured into bullion molds to produce the final product of the operations – doré bullions.
1.10.9 Cyanide Destruction
Residual weak-acid dissociable (WAD) cyanide in the leach tailing is destroyed (detoxified) by oxidation using oxygen (from air) and sodium metabisulfite. Milk-of-lime is added to maintain a slurry pH in the range of 8.0 to 8.5. The reaction is catalyzed by copper (5 ppm), which will need to be supplied if the ore does not contain enough cyanide-soluble copper. The detoxified slurry is sampled prior to thickening to ensure that the WAD cyanide content meets the target discharge level (<50 ppm WAD cyanide, per the Cyanide Code).
|
|
15 |
| ANA PAULA PROJECT |
| FORM 43-101F1 TECHNICAL REPORT |
Slurry discharged from the detoxification circuit overflows into a discharge box, from where it is pumped to the tailing thickener (28 m diameter thickener)
1.10.10 Tailing Slurry Transport
Thickened tailing are discharged to a final tailing tank, from which the slurry is pumped to the tailing storage facility (TSF). The tailing pipeline will be a DN250/PN16 PE100 HDPE pipe, which is 2,700 m long, 250 mm bore, and will distribute tailing to Zone A spigots as well as to the dump spigot. This pipe connects to a 600 m long, 150 mm bore DN150/PN10 PE100 HDPE distribution header that will deposit tailing through Zones B and C spigots.
Solution from the pond reservoir is reclaimed by barge-mounted turbine pumps, one operating, and one standby to the reclaim solution tank) through a 700-m long DN225/PN20 PE100 HDPE pipe.
1.10.11 Sodium Carbonate Handling
Sodium carbonate is delivered to the site by trucks and off loaded to two 1700-tonne silo system. The aim is to provide enough storage capacity to supply 28 days of operation. This would provide sufficient buffer capacity for the supply and transport of sodium carbonate from the supplier to the mine site.
Sodium carbonate is added as a solution to the regrind ball mill and to the oxidation tanks, sodium carbonate is diluted in an automatic dilution system located bellow the silos.
1.10.12 Mill Power Consumption
The average total power consumption in the process plant is 733 million kWh. This translates to about 35.6 kWh/tonne of ore processed.
1.11 PROJECT INFRASTRUCTURE
1.11.1 Roads
The current mine access road is off of the main road between Cuetzala del Progresso and Nuevo Balsas. The access road is approximately 4.5 km from the main road to the plant site. The road from Cuetzala to the mine site will need to be improved to provide access for the larger loads required to construct the project.
1.11.2 Process Plant Facilities
The process plant is located east of the waste rock management
(WRM) facilities and southeast of the mine pit. Process facilities include the
laydown area, initial crushed ore stockpile, primary crusher, mine support
buildings, mill area, gravity concentrator, reagents area, flotation, regrind,
concentrate thickener, atmospheric oxidation (AOX) leach tanks, carbon-in-leach
(CIL) tanks, carbon plant, refinery, cyanide treatment, tailing thickener,
oxygen plant, generator area, and electrical substation. Adequate warehouse and
office space have been accounted for along with sewage treatment and potable
water treatment facilities.
|
|
16 |
| ANA PAULA PROJECT |
| FORM 43-101F1 TECHNICAL REPORT |
1.11.3 Camp and Ancillaries
Support and ancillary buildings for the site include a covered, partially enclosed equipment maintenance shop, administration office building, fuel storage/dispensing system, truck scale, warehouse, security gate and guard house. Some additional facilities may be brought in by the contract miner.
Mine support buildings include a warehouse, truck shop, and two mine shops.
The mine scenario evaluated in this study includes the construction of an on-site camp capable of housing up to approximately 790 people. The site camp area is intended to be developed initially for the construction camp and evolve into the permanent operations camp.
1.11.4 Power
Line power is available within 2.5 km of the proposed plant site and is supplied via a 115 kV line running generally east-west adjacent to the site property. A 1.5 km power line will be constructed with appropriate tie-ins and switching to deliver power at 115 kV to a substation that will be constructed in close proximity to the plant site. The substation will drop the supply voltage to 4,160 V for general distribution around the site and for distribution to the large motor loads such as the crusher facilities. Design power load has been estimated at approximately 15 megawatts (MW). The power supply for the operation of the well system will be carried out by an existing 34.5 kV overhead line.
1.11.5 Water
An average of 84 m3/h of raw water will be required, which will comprise 31.6 m3/h from the well field and 53.2 m3/h from the rainfall diversion channel runoff.
Well water will be used for camp site potable water (4.9 m3/h), mine dust suppression (10 m3/h), gland seal water (12.5 m3/h), cyanide recovery (2.2 m3/h), and crushing dust suppression (2 m3/h). Fire protection water is stored is also derived from well water.
All runoff water is used as mill makeup water. It is introduced to the mill through the tailing thickener and reaches the reclaim water tank with the tailing thickener overflow.
A waste water treatment plant will handle sewer discharge; the effluent will discharge to the tailing storage facility. A smaller specialized treatment system will be installed at the food preparation facilities to mitigate oils and food solids entering the waste water treatment plant.
1.11.6 Tailing Storage Facility
The tailings storage facility was designed to contain tailings
and storm water runoff. It has been sized to provide storage capacity for
approximately 15.5 million tonnes of tailings and the 0.1 percent chance of
exceedance water volume. The maximum height of the dam will be approximately 100
m, which will be constructed in four stages over the life of the mine. The dam
will be a zoned earthfill/rockfill structure, with the upstream face lined with
80-mil HDPE geomembrane. The dam will be constructed using conventional
downstream methods, and the zone behind the upstream 80-mil HDPE geomembrane
liner will consist of, from upstream to downstream: (1) Core zone, (2)
Filter/drain zone, (3) Transition zone, and (4) Rockfill Zone. Both upstream and
downstream slopes will be 2H:1V. Based on the geochemical characterization and a
preliminary surface geology assessment, the basin is not expected to require a
liner; however, characteristics of leached concentrate tailings are needed prior
to finalizing management needs of these materials. Geotechnical analysis shows
that the structure will be stable under static conditions and will suffer
acceptable deformations under design seismic events.
|
|
17 |
| ANA PAULA PROJECT |
| FORM 43-101F1 TECHNICAL REPORT |
1.11.7 Waste Rock Facility
Two waste rock facilities (WRFs) have been located downgradient and south of the pit area which will have sufficient capacity to store 53 million tonnes of waste rock. Configurations for the WRFs (East and West WRFs) were developed by AGP Mining Consultants Inc. based on the mine plan for the project. The East facility will have the downstream toe at 840 meters above sea level (masl) and will reach a final elevation of 980 masl. The West facility will have the downstream toe at 848 masl and will reach a final elevation of 1,050 masl. Waste rock material in both facilities will be placed to form slopes of approximately 1.4H:1V. Slope stability and deformation analyses confirm that the proposed configurations meet commonly accepted minimum factors of safety and the estimated seismic-induced deformations for both facilities are acceptable. Geochemical analysis of waste rock samples tested indicate that this material will contain an excess of neutralization potential (NP) over acid potential (AP), with capacity to neutralize potential production of acid solutions; in addition, seepage from the waste rock is unlikely to contain mobilized metals at levels of concern; based on this the WRFs will not need a liner or containment system.
1.12 ENVIRONMENTAL CONSIDERATIONS AND PERMITTING
In April 2017, the Secretaría de Medio Ambiente y Recursos Naturales (SEMARNAT) approved the “Manifestación de Impacto Ambiental” (MIA), Environmental Impact Statement, submitted by Minera Aurea.
In September 2016, Mc. Terra Emprendimientos Sustentables (Terra) commenced the environmental baseline study for the Ana Paula Project. The study is expected to be completed in mid-2017.
No known environmental condition exists that would preclude development of the project.
1.13 CAPITAL COSTS
M3 Engineering & Technology Corp. was engaged by Alio Gold to compile the PFS, including estimation of the capital and operating costs. The capital cost estimate was completed by obtaining budgetary quotations for major equipment not already owned by Alio Gold. Installation costs were based on M3’s experience building mines in Guerrero State. The estimate is considered a Class 3 estimate which implies a level of accuracy of -10% to +30%. The capital cost estimate is shown in Table 1-6.
Table 1-6: Capital Cost Estimate
| Area | Capital (US$M) |
| Process Plant, General, Site Utilities | $67.2 |
| Indirects* | $9.6 |
| Tailings/Waste Facilities | $12.7 |
| Camps | $4.0 |
| EPCM | $12.9 |
| Owner’s Costs** | $8.3 |
| Pre-Strip and Mine Establishment | $19.9 |
| Contingency*** | $15.9 |
| Total Capital | $150.5 |
| Less Capital Spend in Year 1 | ($13.3) |
| Upfront Capital | $137.2 |
* Bussing, Mobilization, Construction
Camp Operating, Freight
** Used equipment refurbishment and transport to
site, misc. other owner’s costs
***Contingency calculated as 15% of Directs
+ Indirects + EPCM
|
|
18 |
| ANA PAULA PROJECT |
| FORM 43-101F1 TECHNICAL REPORT |
1.14 OPERATING COSTS
The operating cost estimates are based on a combination of first-principles build-up, reference projects, budgetary quotes and factors as appropriate for a preliminary study.
These costs include direct mining and re-handle by a contractor, and processing and disposal of the mineralized feed to the plant including doré produced on-site and transportation and refining charges, Table 1-7.
Table 1-7: Operating Costs Summary
| Operating Cost | $/t processed | LOM $M |
| Mining | 8.01 | 107.7 |
| Processing | 20.25 | 272.2 |
| G&A | 2.56 | 34.4 |
| Total | 32.53 | 418.7 |
‡Mining Cost is based on $2.17/t mined
1.15 ECONOMIC ANALYSIS
An engineering economic model was developed to estimate annual cash flows and sensitivities of the project. Pre-tax estimates of project values were prepared for comparative purposes, while after-tax estimates were developed to approximate the true investment value. It must be noted that tax estimates involve many complex variables that can only be accurately calculated during operations and, as such, the after-tax results are approximations to represent an indicative value of the after-tax cash flows of the project.
Mineral resources that are not mineral reserves do not have demonstrated economic viability. It includes Inferred Mineral Resources that are considered too speculative geologically to have the economic considerations applied to them that would enable them to be categorized as mineral reserves. There is no certainty that the preliminary economic assessment will be realized.
The results of the economic analysis are shown in Table 1-8.
|
|
19 |
| ANA PAULA PROJECT |
| FORM 43-101F1 TECHNICAL REPORT |
Table 1-8: Results of the Economic Analysis
| Summary of Results | Unit | Value |
| Mine Life | Years | 7.5 |
| Total Reserve | M tonnes | 13.4 |
| Total Waste | M tonnes | 36.5 |
| Total Capitalized Waste | M tonnes | 7.2 |
| Total Mined | M tonnes | 57.2 |
| Strip Ratio (Operations) | w:o | 2.81 |
| Mining Rate (Maximum) | t/d | 24,658 |
| Plant Throughput (Maximum) | t/d | 4,932 |
| Average Head Grades | ||
| Au | g/t | 2.36 |
| Ag | g/t | 5.22 |
| Metal produced | ||
| Au | LOM k oz | 868 |
| k oz/yr | 116 | |
| Ag | LOM k oz | 1,240 |
| k oz/yr | 166 | |
| NSR (Net of Royalties) | $M | 1,081 |
| $/t processed | 80.67 | |
| Operating Costs | $M | 445.4 |
| $/t processed | 33.14 | |
| Au Cash Cost | $/Au oz | 513 |
| Au Cash Cost (Net of By-Product) | $/Au oz | 489 |
| Capital Costs | ||
| Initial Capital excluding Contingency | $M | 134.6 |
| Initial Capital Contingency | $M | 15.9 |
| Total Initial Capital | $M | 150.5 |
| $/t processed | 11.20 | |
| Sustaining & Closure Capital | $M | 30.2 |
| Sustaining & Closure Contingency | $M | 0.0 |
| Total Sustaining & Closure Capital | $M | 30.2 |
| $/t processed | 2.25 | |
| Total Capital Costs Incl. Contingency | $M | 180.7 |
| $/t processed | 13.45 | |
| Pre-Tax Cash Flow | $M | 479.9 |
| Taxes | $M | 161.9 |
| After-Tax Cash Flow | $M | 318.0 |
| Economic Results | ||
| Pre-Tax NPV5% | $M | 347.2 |
| Pre-Tax IRR | % | 44% |
| Pre-Tax Payback | Years | 2.3 |
| After-Tax NPV5% | $M | 223.4 |
| After-Tax IRR | % | 34% |
| After-Tax Payback | Years | 2.6 |
Sensitivity analyses were performed on the Base Case economics
to determine which factors most affected the project performance. The analysis
revealed that the project is most and equally sensitive to metal prices and head
grades, followed by operating costs.
|
|
20 |
| ANA PAULA PROJECT |
| FORM 43-101F1 TECHNICAL REPORT |
![]()
Figure 1-5: Sensitivity Results for Base Case Scenario
1.16 CONCLUSIONS
It is the conclusion of the Qualified Persons preparing this technical report that the information contained within adequately supports the positive economic results obtained for the Ana Paula project. The project contains 13.4 million tonnes of gold-bearing sulphide mineralization that can be mined by open pit methods and recovered using common processing methods consisting of milling, gravity, flotation, atmospheric oxidation and cyanide leaching of flotation concentrates.
Based on the information contained in this report, the project is technically and economically viable; further study at a feasibility level should be performed in order to verify these conclusions.
As with any mining project, there are risks that could affect the economic viability of the project, as well as opportunities to improve the economics, timing, and/or permitting potential of the project. These risks and opportunities are detailed in Section 25 of this Technical Report.
1.17 RECOMMENDATIONS
M3 recommends that the Ana Paula project advance to a feasibility-level study, including associated test work, engineering and exploration. These recommendations, as provided by the Qualified Persons, are detailed in Section 26 of this Technical Report.
The feasibility study (FS) would encompass the following items:
-
Metallurgical testwork including pilot plant testing described herein to optimize the process flowsheet and quantify operating parameters and reagent consumptions.
-
Complete TSF and WRF engineering including hydrology model and site wide water balance.
-
Optimization studies on WRF (waste rock facility) design and sequencing should be completed, including design updates based on further geochemical and geotechnical information.
|
|
21 |
| ANA PAULA PROJECT |
| FORM 43-101F1 TECHNICAL REPORT |
-
Alio should strongly consider exploring the underground mineralization beneath the proposed pit. The high grade breccia mineralization extends to depth with multiple intercepts with grade sufficient to support underground mining.
-
A surface exploration drilling program should be carried out to the north-east section of the proposed pit where potential resources have been identified.
It is recommended that environmental baseline study be completed and a socio-economic program also be initiated.
Further hydrologic studies including well tests to define water resources and make application for their use should be conducted.
Geochemical characterization of cyanide leach tailings must be completed to generate a basis for further engineering of storage methods and design.
Detailed costs of the recommended work are included in Section 26. Estimated costs for a FS-level study specific to the project total $16.59M and itemized in Table 1-9.
Table 1-9: Feasibility Study Estimated Costs
| Item | Cost in k$ | Description |
| Metallurgical Test Work | 1,280 |
Metallurgical Core Sampling, Pilot Plant Test Work, Analysis, and Interpretation |
| Tailings Management and Waste Rock, Facilities and Water Supply | 570 |
Geotechnical and Design Engineering for Tailing Management and Waste Rock Facilities. Hydrogeology and Geochemical |
| FS Engineering & Services | 700 |
FS-Level Mine, Infrastructure and Process Designs |
| Environment and Social Studies | 900 |
Geochemistry, Environmental and Social Impact Studies. |
| Other Studies | 386 |
Mining, Geology & Peer Review |
| Local Infrastructure Engineering | 350 |
Access Roads, Power Studies |
| EPCM Engineering | 750 |
Infrastructure & Plant Design and Engineering |
|
| ||
| Underground Exploration | 7,500 |
Underground Exploration Adit |
| Surface Exploration | 875 |
Delineation of High Grade Breccia |
| Hydrology Drilling | 640 |
Well Testing |
| Site G&A | 1,140 |
|
|
| ||
| Subtotal | 15,090 |
|
| Contingency (10%) | 1,500 |
|
| Total | 16,590 |
Excludes Owner’s Costs and Permitting Fees |
|
22 |
| ANA PAULA PROJECT |
| FORM 43-101F1 TECHNICAL REPORT |
2 INTRODUCTION
2.1 BASIS OF TECHNICAL REPORT
This Technical Report was compiled by M3 Engineering & Technology Corporation (M3) for Alio Gold Inc. (Alio), formerly Timmins Gold Corp. The Ana Paula Project is controlled by Minera Aurea, S.A. de C.V. This technical report summarizes the results of the Preliminary Feasibility Study (PFS) and was prepared following the guidelines of the Canadian Securities Administrators’ National Instrument 43-101 and Form 43-101F1.
2.2 TERMS OF REFERENCE
The previous Technical Report on the Project, entitled “Preliminary Economic Assessment on the Ana Paula Project, Guerrero State, Mexico”, was authored by JDS Mining & Energy Inc. and was issued by Timmins Gold Corp. (now Alio Gold) with an effective date of February 2, 2016. That Technical Report was filed on the System for Electronic Document Analysis and Retrieval (SEDAR, www.sedar.com), which is an electronic filing system developed for the Canadian Securities Administrators (CSA), and on its US equivalent, the System for Electronic Data Gathering, Analysis and Retrieval (EDGAR), developed for the US Securities and Exchange Commission.
All drill hole, geological and other technical information in the current Report is effective through May 16, 2017, which is the date of the Company’s press release outlining the Ana Paula PFS results.
2.3 SCOPE OF WORK
This report summarizes the work carried out by the Consultants, some of which are associated or affiliated with Alio Gold. The scope of work for each company is listed below. Combined, this comprises the total Project scope.
M3’s scope of work included:
-
Compile the technical report which includes the data and information provided by other consulting companies.
-
Design required site infrastructure, identify proper sites, plant facilities and other ancillary facilities.
-
Estimate OPEX and CAPEX for the Project.
-
Interpret the results and make conclusions that lead to recommendations to improve value and reduce risks.
Blue Coast Research’s (BCR) scope of work included:
- Designing and carrying out the metallurgical test program and flowsheet development program.
Knight Piésold’s (KP) scope of work included:
-
Design of the waste rock management and tailings storage facilities.
-
Design and oversee the pit slope stability (geotechnical) study.
-
Carrying out the site-wide water balance.
-
Design and oversee the geochemical characterization of waste / tails testing program.
|
|
23 |
| ANA PAULA PROJECT |
| FORM 43-101F1 TECHNICAL REPORT |
Alio Gold’s scope of work included:
-
Compile the environmental studies, permitting and social impact chapter using reports prepared by external consultants.
-
Prepare a financial model and conduct an economic evaluation, including sensitivity and Project risk analysis.
AGP Mining Consultants, Inc. (AGP) scope of work included:
-
Reviewing the Company’s drilling and exploration programs, including sample preparation, analysis, security and data verification protocols.
-
Preparing the Mineral Reserve & Resource Estimate Mine planning.
-
Pit design, optimization, and production schedule.
-
Mining equipment selection.
-
Establishing potentially mineable resources.
2.4 QUALIFIED PERSON RESPONSIBILITIES AND SITE INSPECTIONS
The Qualified Persons (QPs) preparing this technical report are specialists in the fields of geology, exploration, mineral resource and mineral reserve estimation and classification, geotechnical, environmental, permitting, metallurgical testing, mineral processing, processing design, capital and operating cost estimation, and mineral economics.
None of the QPs or any associates employed in the preparation of this report are insiders, associates, or affiliates or have any beneficial interest in Alio Gold with the exception of Mr. Taj Singh, who is subject to the terms of Alio Gold. The results of this technical report are not dependent upon any prior agreements concerning the conclusions to be reached, nor are there any undisclosed understandings concerning any future business dealings between Alio Gold and the QPs. The QPs are being paid a fee for their work in accordance with normal professional consulting practice.
The following individuals, by virtue of
their education, experience and professional association, are considered QPs as
defined in the NI 43-101, and are members in good standing of appropriate
professional institutions. The QPs are responsible for specific sections as
follows:
|
|
24 |
| ANA PAULA PROJECT |
| FORM 43-101F1 TECHNICAL REPORT |
Table 2-1: Qualified Person Responsibilities
| Qualified Person | Company | Site Visit Date | Report Section(s) of Responsibility |
| Daniel H. Neff | M3 | N/A | Sections 1.1, 1.2, 1.11, 1.14, 1.16, 1.17, 2, 3, 4, 18, 19, 21.1, 21.1.2, 21.1.3, 21.2.2, 21.2.3, 23, 24, 25.1, 25.2, and 27 |
| Art Ibrado | M3 | N/A | Sections 1.10 and 17 |
| Taj Singh | Alio Gold | Multiple visits, 2015-16 | Sections 1.12, 1.13, 1.15, 20, 21.1.1, 21.2.1, 22, and 26.6 |
| Andrew Kelly | Blue Coast | N/A | Sections 1.5, 13, 25.5, and 26.5 |
| Gordon Zurowski | AGP | December 2016 | Sections 1.7, 1.8, 1.9, 15, 16.1, 16.2, 16.4-16.11, 25.4, and 26.3 |
| Pierre DeSautels | AGP | December 2016 | Sections 1.3, 1.4, 1.6, 5, 6, 7, 8, 9, 10, 11, 12, 14, 25.3, 26.1, and 26.2 |
| Gilberto Dominguez | Knight Piésold | N/A | Sections 18.2, 18.3, 21.1.3, and 26.4 |
| James Cremeens | Knight Piésold | September 2016 | Sections 16.3, 16.12, 25.4, and 26.3 |
2.5 UNITS OF MEASURE, CURRENCY, AND ROUNDING
This study was conducted using mainly metric units following the International System of Units (SI) for unit terms and prefixes where possible. Unless otherwise noted, all weights are reported on a dry basis. Gold and silver grades are expressed in grams per metric ton (g/t).
2.6 UNITS, CURRENCY AND ROUNDING
Unless otherwise specified or noted, the units used in this technical report are metric. Every effort has been made to clearly display the appropriate units being used throughout this technical report. Currency is in United States dollars (US$ or $). Exchange rates are current as of the first quarter of 2017.
Table 2-2 below summarizes the units of measure used in this
report. Table 2-3 is a glossary of terms used in this report.
|
|
25 |
| ANA PAULA PROJECT |
| FORM 43-101F1 TECHNICAL REPORT |
Table 2-2: Units of Measure
| Prefixes | M | mega | million |
| k | kilo | thousand | |
| c | centi | one hundredth | |
| m | milli | one thousandth | |
| µ | micro | one millionth | |
| Weight | g | gram | |
| kg | kilogram | 1,000 grams | |
| t | tonne, metric, dry basis | 1,000 kilograms | |
| st | short tonne, dry basis | 2,000 pounds | |
| kt | kilotonne | 1,000 tonnes, metric | |
| g/t | grams/tonne (metric) | ||
| oz | troy ounce | 31.103477 grams | |
| koz | kilo ounce | 1,000 troy ounces | |
| Moz | Million ounce | ||
| lb | US pound | ||
| klbs | kilo pounds | 1,000 US pounds | |
| Mlb | million pound | 1,000,000 US pounds | |
| Length | m | meter | |
| km | kilometer | 1,000 meters | |
| Volume | li | liter | 1,000 ml or cm3 |
| m3 | cubic meter | 1,000 liters | |
| Temperature | oC | degrees Celsius | |
| Pressure | Pa | pascal | |
| kPa | kilopascal | ||
| MPa | megapascal | ||
| psi | pounds per square inch | ||
| Power & Energy | W | watts | |
| kW | kilowatt | 1,000 watts | |
| MW | Megawatt | 1,000,000 watts | |
| kWh | Kilowatt-hour |
Table 2-3: Glossary of Terms
|
TERM |
DESCRIPTION |
|
% |
Percent |
|
< |
Less than |
|
> |
More than |
|
± |
More or less |
|
#N |
UTM grid measurement in meters north of the equator |
|
#E |
UTM grid measurement in meters east of the central Meridian |
|
Ag, As, Au, Bi, Co, Cu, Fe, Hg, K, Mo, Pb, Sb, Te, U, and Zn |
Chemical symbols from the periodic group of elements. silver (Ag), arsenic (As), gold (Au), bismuth (Bi), cobalt (Co), copper (Cu), iron (Fe), mercury (Hg), potassium (K), molybdenum (Mo), lead (Pb), antimony (Sb), tellurium (Te), uranium (U) and zinc (Zn). |
|
AuEq |
Equivalent gold. calculated as g/t gold + g/t silver/160, with the silver divisor calculated from the cost, price and recovery data listed |
|
ALS Chemex |
ALS Chemex, a division of ALS Global Ltd through Chemex De Mexico, S.A. De C.V., the primary analytical laboratory for the Ana Paula Project located in Guadalajara, Mexico. |
|
|
26 |
| ANA PAULA PROJECT |
| FORM 43-101F1 TECHNICAL REPORT |
|
TERM |
DESCRIPTION |
|
Alteration |
Physical and chemical changes to the original composition of rocks due to the introduction of hydrothermal fluids, of ore forming solutions, to changes in the confining temperature and pressures or to any combination of these. The original rock composition is considered “altered” by these changes, and the product of change is considered an “alteration”. (From Hacettepe University online dictionary, after AGI) |
|
Ana Paula Project |
The area inside the boundaries of the two contiguous mineral rights concessions known as the Tembo and Apaxtla 3 concessions, accruing 4,238 Ha in total. Referred to also as “Ana Paula” and the “Project”. |
|
ANFO |
Ammonium Nitrate and Fuel Oil |
|
Anomalous (anomaly) |
a. A departure from the expected or normal. b. The difference between an observed value and the corresponding computed value (background value). c. A geological feature, esp. in the subsurface, distinguished by geological, geophysical, or geochemical means, which is different from the general surroundings and is often of potential economic value; e.g., a magnetic anomaly. (From Hacettepe University online dictionary, after AGI) |
|
Minera Aurea |
Minera Aurea, S.A. De C.V., Alio Gold’s wholly owned Mexican operating subsidiary |
|
Aurea Norte Property |
Means the contiguous group of claims totaling 46,228 hectares and including the claims named: Tembo Dos (T225486), Tembo Tres (T231106), El Coyote (T222224), Cosmos I (T244793), Cosmos II (T244794), La Morinita (T224383), Don Jesus (T231103), R. Estefania (T244792), Estafania Frac. I (T2331105), R. Coyopancho (T244795), R. Cuetzala (T244796). |
|
Aurea Sur Property |
Means the contiguous group of claims totaling 5,819 hectares and including the claims named: Ottawa (T221781), El Consorcio (T222399), R. Coyopancho (T244795), R. Cuetzala (T244796). |
|
Background |
A measured or calculated geochemical, geophysical, petrological or other threshold considered representative of an area. The “Normal” or “not anomalous”. |
|
Breccia |
Means fragmental rocks whose components are angular and, therefore, as distinguished from conglomerates as not water worn. May be sedimentary or formed by crushing or grinding along faults or by hydrothermal explosions. |
|
CAD$ US$ |
Canadian dollars, United States of America dollars |
|
Calc Hd |
Calculated head grade |
|
calc-silicate alteration |
An alteration consisting mainly of calc-silicate minerals |
|
Constancia de Vigencia |
An official “statement of good standing” provided by the Mexican Government as a confirmation to holders of mineral concessions that the mineral rights and concessions are active and in good standing according to Mexican Mining Law as published in the Official Mexican public journal (“Diario Official”) dated October 12, 2012 |
|
CRM, SGM |
Consejo de Recursos Minerales (also Coremi). The former Mexican Geological Survey now renamed the Servicio Geológico Mexicana or “SGM” |
|
Consp |
Consumption |
|
DCF |
Discounted Cash Flow |
|
E14A87, E14C17 |
Mapping index system for Mexico |
|
epithermal |
Said of a hydrothermal mineral deposit formed within about 1 km of the Earth’s surface and in the temperature range of 50 to 200 degrees C, occurring mainly as veins. Also, said of that depositional environment. |
|
FeOx |
Iron oxide |
|
G&A |
General and Administrative [Operating Costs] |
|
GGB |
The Guerrero Gold Belt. A linear array of gold iron skarn and gold skarn developed at the contacts between platform carbonate rocks and early Tertiary intrusions. |
|
g/t |
Grams per Tonne. Where a gramme (also gram) is a unit of measure equal to 1/1000th of a kilogram. A Tonne is a metric Tonne having a unit weight of 1,000 kilograms. |
|
GPS |
An electronic device that records the data transmitted by the geographic positioning satellite system. |
|
|
27 |
| ANA PAULA PROJECT |
| FORM 43-101F1 TECHNICAL REPORT |
|
TERM |
DESCRIPTION |
|
High Grade Breccia Zone |
A discrete structurally controlled body of irregular dimensions including a structurally controlled core breccia that trends oblique to the stratigraphic fabric and that is surrounded by a mineralized alteration halo of sediment, intrusions and other breccia, that is delineated in drill core and tends to host a higher-grade mineralization with a composite average grade of 5.38 grams per tonne gold and 6.49 grams per tonne silver |
|
Higher grade gold/ higher grade mineralization |
Averages greater than or equal to 2.0 grams per tonne gold (“High grade”), unless specifically specified |
|
IMC |
Independent Mining Consultants Inc. of Tucson, Arizona |
|
JV |
Joint venture |
|
l/m |
liters per minute |
|
Ltd, Inc |
Limited, Incorporated |
|
Low Grade Breccia |
A discrete structurally controlled intrusion hosted breccia body of irregular dimensions delineated in drill core and that tends to host a lower grade gold mineralization with a composite average grade of 0.92 grams per tonne gold and 5.1 grams per tonne silver. |
|
lower grade gold |
Averages less than or equal to 1.0 grams per tonne gold (“Low grade”), unless specifically specified |
|
M, Ma, Mt, Moz |
million, million years, million tonnes, million ounce |
|
M3 |
M3 Engineering & Technology Corporation |
|
Mex$ |
Mexican Peso |
|
MIA |
Manifestación de Impacto Ambiental |
|
Mineralization (mineralizing) |
The presence of minerals of possible economic value – and the process by which concentration of economic minerals occurs. |
|
N, S, E, W, NW, NE, etc. |
North, south, east, west, northwest, northeast etc. |
|
No. |
Number |
|
NQ, HQ Core |
Specifies the diameter of a cylinder of drill core, HQ has a 54mm diameter. NQ has a 45 mm diameter. |
|
NAG |
Non-Acid Generating |
|
NI 43-101 |
National Instrument 43-101 Standards of Disclosure for Mineral Projects of the Canadian Securities Administrators |
|
Nonels |
Non-Electric Blasting Cap |
|
North-South Corridor |
A 1.5 by 0.7 kilometer North-South trending corridor of stratigraphic and structurally controlled mineralization that collectively make up a lower grade mineralization with a composite average grade of 1.0 grams per tonne gold and 3.9 grams per tonne silver. Corresponds to the sediment-intrusive domain described in Section 7.3.2. |
|
NSR |
Net Smelter Return |
|
nT |
Nano Tesla. The international unit for measuring magnetic flux density |
|
PFS |
Preliminary Feasibility Study |
|
ProDeMin |
Prospección y Desarrollo Minero del Norte S.A. de C.V. |
|
QAQC, QA/QC |
A quality assurance and quality control program |
|
QP |
Qualified Person |
|
S.A de C.V |
Sociedad Anónima de Capital Variable |
|
SEDAR |
System for Electronic Document Analysis and Retrieval |
|
SEMARNAT |
Secretaría de Medio Ambiente y Recursos Naturales |
|
SGS |
SGS SA, the secondary laboratory for the Ana Paula Project through SGS de México located in Durango, Mexico. |
|
showing |
A location where alteration and/or mineralization occurs at surface. |
|
28 |
| ANA PAULA PROJECT |
| FORM 43-101F1 TECHNICAL REPORT |
|
TERM |
DESCRIPTION |
|
skarn |
A metamorphic rock rich in calcium bearing silicate minerals (calc-silicates), commonly formed at or near intrusive rock contacts by the introduction of silica rich hydrothermal fluids into a carbonate rich country host rock such as limestone and dolomite. Also, part of an alteration process for the introduction and formation of mineralized material forming mineralization and a common host for mineralization/ore. |
|
SRK |
Steffen, Roberts & Kirsten Consulting of Denver Colorado |
|
target |
A focus or loci for exploration |
|
threshold |
In geochemical prospecting, the limiting anomalous value below which variations represent only normal background effects and above which they have significance in terms of possible mineral deposits. (From Hacettepe University online dictionary, after Hawkes) |
|
TSF |
Tailing Storage Facility |
|
UTM |
Universal Transverse Mercator |
|
WGS84 |
An ellipsoid modal of the earth |
|
WRF |
Waste Rock Facilities |
|
29 |
| ANA PAULA PROJECT |
| FORM 43-101F1 TECHNICAL REPORT |
3 RELIANCE ON OTHER EXPERTS
The QPs of this report relied upon contributions from other consultants as well as Alio Gold. The QPs have reviewed the work of the other contributors and find that this work has been performed to normal and acceptable industry and professional standards. The authors are not aware of any reason why the information provided by these contributors cannot be relied upon. An independent verification of mineral tenure and royalties was not performed. The QPs have not verified the legality of any underlying agreement(s) that may exist concerning the license or other agreement(s) between third parties. Likewise, Alio Gold has provided data for and verified claim (mineral) ownership. The following document was referred to with respect to mineral ownership rights:
- A legal opinion of title, prepared by Alio Gold’s counsel, Diaz, Bouchot and Raya of Mexico City concerning the ownership and status of the Ana Paula Project.
This information is used in sections 4 and 5 of this technical
report.
|
|
30 |
| ANA PAULA PROJECT |
| FORM 43-101F1 TECHNICAL REPORT |
4 PROPERTY DESCRIPTION AND LOCATION
4.1 LOCATION
The Ana Paula Project is located in the north central part of the State of Guerrero in southern Mexico, roughly half way between the major cities of Mexico City and the Port of Acapulco. The Ana Paula Project centroid is defined by UTM Q14N, WGS84, 409,027.8E and 1,997,632.6N or by 99° 51’ 34.4 west longitude and 18° 3’ 55.2 north latitude, Figure 4-1.
Figure 4-2 shows the location of the Ana Paula Project in relation to other mines, deposits and concession holdings in the Guerrero Gold Belt. Figure 4-3 shows Alio’s GGB mineral rights concession holdings, including the Ana Paula Project location.
![]()
Figure 4-1: Alio’s Property Location and Access Map, Guerrero State, Mexico
The Ana Paula project (red) is internal to Minera Aurea’s (Alio
Gold) mineral concessions (blue).
|
|
31 |
| ANA PAULA PROJECT |
| FORM 43-101F1 TECHNICAL REPORT |

Figure 4-2: Property and Mineral Showings Location Map
The Ana Paula Project is highlighted in red. Stars denote the location of operating mines and active projects.
4.2 MINERAL TITLES
The Ana Paula Project comprises two mining concessions held by Minera Aurea, S.A. de C.V. comprising 4,238 ha. In addition, Minera Aurea, S.A. de C.V. holds nine concessions surrounding the project area which form the Aurea Norte Property plus an additional four concessions south of the project area which form the Aurea Sur Property. The Ana Paula project area and surrounding concessions comprises a total area of 56,334 ha. A map of the mining concessions is shown in Figure 4-3.
Mexico is a constituted federation of independent states that has been a party to the North American Free Trade Agreement (NAFTA) since it was signed it into law in December, 1993 and effective on January 1, 1994; as such it is governed by a tax and trade regime comparable to the USA and Canada.
The Mexican Constitution maintains a direct non-transferable
ownership of the nation’s mineral wealth (considered a national resource) that
is governed under established Mining Law. The use and exploitation of such
national resources is provided for through clear title to a mineral rights
concession (lot or concession) that is granted by the Federal Executive Branch
for a fee and under prescribed conditions. Mining concessions are only granted
to Mexican companies and nationals or ejidos, (agrarian communities, communes,
and indigenous communities). Foreign companies can hold mining concessions
through their 100% owned Mexican-domiciled companies. A number of Government
agencies have responsibility for enforcing mining laws and its applicable
regulations that must be complied with; non-compliance may result in
cancellation of a concession.
|
|
32 |
| ANA PAULA PROJECT |
| FORM 43-101F1 TECHNICAL REPORT |
Mining concessions confer rights with respect to all mineral substances as listed in their Registry document (the title) provided the concessions are kept in good standing. The main obligations to maintain title to a concession in good standing are performance of work expenditures, payment of mining fees and compliance with environmental laws. Mineral rights fees are paid bi-annually in January and July, and annual proof of exploration work expenditures is done via a work report filed by the end of May of the following year (assessment report or “comprobación de obras”). The amount of the mineral rights fees and the amount of expenditures required varies each year. It is calculated based on a per hectare rate that typically increases annually in line with annual inflation rates. The new rates are published each year in advance in the Official Gazette of the Mexican Federation (Diario Oficial).
The application process to acquire mineral rights is established under the Mining Law. Title is granted following a due diligence investigation of a mineral rights application as filed by the qualified party. Mineral rights fees and assessment works are required as of the date a concession title is issued. Following changes to the Mining Law in 2006, there is no longer any difference in Mexico between an exploration concession and a mining concession. The term of a mineral rights concession is 50 years, with the term commencing on the date recorded by the Public Registry of Mining, which is the date the title is granted. A second 50-year term can be granted if the applicant has abided by all appropriate regulations, and makes the application within five years prior to the expiration date of the original title. Title to the Ana Paula Project concessions is owned by Minera Aurea, S.A. de C.V, the 100 percent owned Mexican subsidiary of the Company, with underlying royalties as described in the Section 4.2.1 of this report.
The Mining Department in Mexico issued new Regulations, by Presidential decree, regarding mining concessions effective from January 1, 2006, whereby all the Exploration and Exploitation mining claims that existed in good standing under the old system were automatically transformed to a unique type of Mining Concession valid for 50 years, beginning from the date of their registration in the Mining Public Registry.
Because of this decree, the expiry dates of the mining concessions acquired from Goldcorp, including those concessions comprising the Ana Paula Project that were initially titled as exploration concessions in 2002, and 2003 were automatically
extended to conform with the new decree and will now expire in 2052 and 2053 respectively. See Table 4-1 for the expiry date for all mineral concessions. Under the new decree, all claims in good standing are renewable for an additional 50-year term.
|
|
33 |
| ANA PAULA PROJECT |
| FORM 43-101F1 TECHNICAL REPORT |

Figure 4-3: Minera Aurea Mineral Rights Concession Map
4.2.1 Nature and Extent of Issuer’s Interest
Minera Aurea, S.A. de C.V. is 100% owner of the 15 mining
concessions. Table 4-1 contains the list of the mining concessions, area
covered, title number, expiration date and ownership.
|
|
34 |
| ANA PAULA PROJECT |
| FORM 43-101F1 TECHNICAL REPORT |
Table 4-1: Minera Aurea Mining Concessions
| CLAIM | HECTARES | TITLE | EXPIRATION | OWNER |
| Ana Paula Project | ||||
| TEMBO | 2,243 | 220693 | 29/09/2053 | Minera Aurea, S.A. de C. V |
| APAXTLA 3 | 1,995 | 217559 | 30/07/2052 | Minera Aurea, S.A. de C. V |
| Subtotal | 4,238 | |||
| Aurea Norte Property | ||||
| TEMBO DOS | 563 | 225486 | 12/09/2055 | Minera Aurea, S.A. de C. V |
| TEMBO TRES | 2,822 | 231106 | 16/01/2058 | Minera Aurea, S.A. de C. V |
| El COYOTE | 13,536 | 222224 | 14/06/2054 | Minera Aurea, S.A. de C. V |
| COSMOS I | 3,480 | 244793 | 13/06/2055 | Minera Aurea, S.A. de C. V |
| COSMOS II | 3,765 | 244794 | 13/06/2055 | Minera Aurea, S.A. de C. V |
| LA MORINITA | 200 | 224383 | 02/05/2055 | Minera Aurea, S.A. de C. V |
| DON JESUS | 1,519 | 231103 | 16/01/2058 | Minera Aurea, S.A. de C. V |
| R. ESTEFANIA | 8,177 | 244792 | 16/01/2058 | Minera Aurea, S.A. de C. V |
| ESTAFANIA FRAC. I | 100 | 231105 | 16/01/2058 | Minera Aurea, S.A. de C. V |
| R. COYOPANCHO | 3,834 | 244795 | 02/02/2055 | Minera Aurea, S.A. de C. V |
| R. CUETZALA | 8,282 | 244796 | 13/06/2055 | Minera Aurea, S.A. de C. V |
| Sub-Total | 46,278 | |||
| Aurea Sur Property | ||||
| OTTAWA | 3,452 | 221781 | 25/03/2054 | Minera Aurea, S.A. de C. V |
| El CONSORCIO | 2,367 | 222399 | 05/07/2054 | Minera Aurea, S.A. de C. V |
| Sub-Total | 5,819 | |||
| TOTAL | 56,334 | |||
4.3 ROYALTIES, AGREEMENTS AND ENCUMBRANCES
Minera Aurea, S.A. de C.V. exercised an agreement, dated May 11, 2010, (held by Newstrike Capital Inc., now Alio Gold) for a 100% interest in the concessions Aplaxtla 3, Tembo, Tembo Dos, and Tembo Tres from Desarrollos Mineros San Luis, S.A. de C.V. and Minera San Luis S.A. de C.V., wholly owned Mexican subsidiaries of Goldcorp Inc. The final documentation was submitted for registration in Mexico City on June 24, 2010.
Minera Aurea, S.A. de C.V. has the obligations set forth below for the maintenance of the four concessions.
Payment of a three percent net smelter royalty (NSR) from the proceeds from the sale of any ores, concentrates, metals or any other material of commercial value produced by and from the Mining Concessions remaining after deducting costs. Minera Aurea, S.A. de C.V. will have the right, upon completion of a feasibility study as defined by NI 43-101, to purchase one third of the NSR for a consideration of US$2.00 per ounce of gold classified as proven and probable reserves and measured and indicated resources in the feasibility study to a maximum of US$6 million.
Minera Aurea, S.A. de C.V. has a 2.5% NSR payable to Industrias Miral, S.A. de C.V. and others for the remaining mining concessions in the Aurea Norte and Area Sur areas. These concessions are not part of the Ana Paula Project Area.
Tax Reform changes in Mexico became effective January 1, 2014
and affect operating mining companies in Mexico. The changes include: the
corporate income tax remaining at 30 percent; a new mining royalty fee of 7.5
percent on income before tax, depreciation and interest; an extraordinary
governmental fee on precious metals, including gold and silver, of 0.5 percent
of gross revenues; and changes affecting the timing of various e
|
|
35 |
| ANA PAULA PROJECT |
| FORM 43-101F1 TECHNICAL REPORT |
Title to mineral properties involves certain inherent risks due to the difficulties of determining the validity of certain claims as well as the potential for problems arising from the frequently ambiguous conveyance history characteristic of many mineral properties. Minera Aurea S.A. de C.V. has investigated the title to all of its mineral properties and maintains them in accordance with Mexican mining law, which provides for the rights to carry out the works and development required for mining and related activities.
Mexican Mining Law requires mineral rights payments to be paid each January and July. The required amounts are subject to modification as annual fee schedules are released for publication by the Mines Office. The 2017 first term mineral rights payment of $402,683 was completed January 31st, 2017, a second payment is due on July 31st, 2017.
Also required is an annual minimum exploration work obligation which is filed each May for the preceding year. The required annual assessment report (Comprobante de Obras) was filed on May 30, 2016.
Minera Aurea, S.A. de C.V. has assumed all environmental liabilities related to the concessions.
Alio Gold recognizes surface access as a potential risk to maintaining unencumbered entry to their mineral exploration properties and cannot guarantee to have continual access. As part of the Company’s policy of good corporate citizenship in the communities in which it operates and with the objective of Project sustainability, the Company seeks to reduce potential risk to exploration and development through long term or permanent surface access agreements with affected surface owners prior to initiation of those activities.
Mining concession licenses do not automatically grant surface access rights, which are treated separately under Mexican law. Permission for surface access must be negotiated with the relevant communities and individuals who hold surface titles to the areas affected by the mining concessions. These negotiations typically provide for the purchase or lease of the surface rights. Surface rights in Mexico are held as individually titled parcels or communally owned lands (ejidos) that overlie the mineral rights concessions that are granted separately by the Federal Government. These are separate legal estates where individually titled parcels are governed under Mexican property laws. Ejido surface rights are governed under Mexico’s Agrarian Laws while Mineral Rights are administered under established Mining Laws that have precedence over Agrarian laws.
As of May 15, 2017, Minera Aurea, S.A. de C.V. controls surface access to 2,442 hectares overlying and surrounding the Ana Paula Project area, where 1,283 hectares are owned outright and approximately 154 hectares are under contract in 30-year access agreements. An additional 1,005 hectares are under exploration access agreements.
Negotiations regarding surface rights agreements for the remaining land required for the Ana Paula Project are ongoing with the landowners and the communities.
4.4 ENVIRONMENTAL LIABILITIES AND PERMITTING
4.4.1 Environmental Liabilities
All permissions and applications required for the exploration
process are being performed in accordance with the applicable Mexican Official
Laws and Standards (Normas Oficiales Mexicanas). According to Mexican Federal
Law for the Protection of the Environment, existing environmental conditions
caused by past operations are not liabilities for the Ana Paula Project or its
present owners. Minera Aurea’s Ana Paula Project does not fall within any
protected area or special jurisdiction and there are no known existing
environmental liabilities located on the Project other than those associated
with exploration activities.
|
|
36 |
| ANA PAULA PROJECT |
| FORM 43-101F1 TECHNICAL REPORT |
4.4.2 Required Permits and Status
Aurea has an approved MIA, from the Secretariat of Environment and Natural Resources (SEMARNAT), for the operation of the mine, plant and power line. The MIA was approved in April 2017.
The major remaining permits required for the Ana Paula Project are shown in Table 4-2.
Table 4-2: Remaining Major Permits and Status
| Permit | Relevant to | Status |
| The Preventative Notice (Informe Preventivo) | Transitional | Ready to be filed |
| The Permit for Change of Land Use in Forested Area issued by the State Delegations of Secretariat of Environment and Natural Resources (SEMARNAT) | Transitional | Ready to be filed |
| The Risk Study (Estudio de Riesgo) | Development | Pending a development decision |
| A PPA (Accident Prevention Program) | Development | Pending a development decision |
| Explosives Permit (Secretaría de la Defensa Nacional); | Development | Pending a development decision |
| The Environmental Impact Assessment (Manifestación de Impacto Ambiental) | Development | Pending a development decision |
| A water use permit (Comisión Nacional del Agua) | Development | Pending a development decision |
| An archaeological land ‘liberation’ based on authorization by the Instituto Nacional de Antropología e Historia (INAH) | Development | Pending a development decision |
| Notice to state and municipal authorities (i.e., construction permits, land use change | Development | Pending a development decision |
Source: Alio (2017)
4.5 OTHER SIGNIFICANT FACTORS AND RISKS
The Ana Paula Project is located in the Guerrero Gold Belt, which includes operating mines including the Torex’s ELG mine and Leagold’s Los Filos mine both located within 40 km of the project site. The Project site is easily and safely accessed and exploration is operating normally. The company has good relations with the local communities and the social license is considered more than adequate for the pre-construction activities. During the feasibility stage the company will study alterative access routes and develop and implement a construction ready community and social relations (CSR) program that includes a trained CSR team.
Land use negotiations are proceeding well with all the
remaining surface rights requirements having entered the negotiation phase.
|
|
37 |
| ANA PAULA PROJECT |
| FORM 43-101F1 TECHNICAL REPORT |
5 ACCESSIBILITY, CLIMATE, LOCAL RESOURCES, INFRASTRUCTURE AND PHYSIOGRAPHY
5.1 TOPOGRAPHY, CLIMATE, PHYSIOGRAPHY
The Ana Paula Project is located in the Sierra Madre mountain range of southern Mexico where topography can range from moderate to rugged with elevations varying from 900 to over 1,460 meters above sea level (masl). The Company’s exploration drilling activities are conducted primarily between 900 to 1,200 masl. The Project lies north of the Balsas River, which divides the Sierra Madre Mountains into north and south ranges.
The climate in the region is classified as warm and humid, with an average temperature of 28 degrees Celsius (ºC) (range of 17º to 45º C) and average precipitation of 835 mm per year. Rainfall occurs from June through October during a monsoonal tropical wet season that includes the influence of hurricanes from both the Atlantic and Pacific oceans. Winters are dry with occasional light rains in February.
Knight Piésold (KP) completed a preliminary site-specific seismic hazard assessment for the project. According to the Mexican norm, NOM-141 SEMARNAT-2003, the Ana Paula site is classified under seismic region D where seismic events are common, including major historical earthquakes (SEMARNAT 2003, Norma Oficial Mexicana, NOM-141). A Probabilistic Seismic Hazard Analysis (PSHA) was conducted for the site by GeoPentech, which considered earthquakes on active seismic sources within 200 km of the site, including subduction interface, deep intraslab, and shallow crustal sources. The results of the PSHA were used to calculate the mean horizontal uniform hazard spectra for the site at various average return periods.
5.2 VEGETATION
Thorny plants and cacti dominate the vegetation at the Project at low elevations, giving way uphill to a patchy oak forest above 1400 masl. Vegetation is barren and desert-like during the dry winter months, with tropical growth during the wet summer season. Vegetation is mixed with no dominant species. The project area is classified in the neotropical realm. Surface land use in the immediate area of exploration interest within the Ana Paula Project is devoted to cattle grazing and limited agriculture but is primarily non-arable and is uninhabited.
5.3 ACCESSIBILITY
The town of Iguala, with a population of about 200,000, is a three-hour drive from Mexico City and about four hours from the port city of Acapulco (Figure 5-1). The Ana Paula Project concessions are accessible from Iguala via paved highways and good quality all season unpaved roads. Driving time from Iguala is about 1.25 hours to the Ana Paula Project headquarters located at Cuetzala del Progreso. The Company maintains offices, residences, and storage facilities in Cuetzala del Progreso. Access to the Project site is via a series of secondary unpaved roads, built and maintained by the Company and many are passable by two-wheel drive vehicles year-round. Four-wheel drive vehicles are required on drill access roads during rainy periods. All exploration and potential mining activities are carried out year-round.
Alio Gold has operated the Ana Paula project without interruption since the Project was acquired in June of 2010.
5.4 LOCAL RESOURCES AND INFRASTRUCTURE
The area offers an established infrastructure with a good road network, and an available unskilled and skilled work force. All major supplies and services are available from the cities of Iguala (1.25 hours by road), Cuernavaca (2.5 hours by road), and Chilpancingo, the State capital which is a three-hour drive from the Project (Figure 5-1).
Basic supplies are available from the towns of Nuevo Balsas and Cuetzala del Progreso, among other small town suppliers. The nearest available international airport is in Cuernavaca with a landing strip suitable for large aircraft (a 45 by 2,772 m airstrip), with major international airports located at Acapulco and Mexico City. The Mexico City Airport is a four to five hour drive depending on traffic.
|
|
38 |
| ANA PAULA PROJECT |
| FORM 43-101F1 TECHNICAL REPORT |
A small craft gravel airstrip is located in nearby Apetlanca, 20 minutes from Cuetzala del Progreso. Iguala has a paved airstrip suitable for small aircraft (1,685 m in length). Alio Gold employs several semi-technical and nontechnical residents of Cuetzala del Progreso where the Project headquarters and field offices are located. Skilled labor and heavy equipment are available in Iguala. Several geologists are sourced from the nearby town of Taxco el Viejo, where the Universidad Autónoma de Guerrero maintains a satellite university within 15 minutes of Iguala devoted to the earth sciences. The economy has been dominated by small scale agriculture and agriculture related services. The local economy is improving as mining projects including Rey de Plata, Campo Morado-G9, Morelos, Los Filos, and Terex became the principal regional employers.

Figure 5-1: Project Location Road map in Guerrero State, Mexico
5.5 INFRASTRUCTURE AVAILABILITY AND SOURCES
5.5.1 Power
The nearby Balsas River is a source of hydroelectric power and
115 kV high tension lines transect the Ana Paula Project site. The 115 kV power
line is approximately 2.5 km from the plant site.
|
|
39 |
| ANA PAULA PROJECT |
| FORM 43-101F1 TECHNICAL REPORT |
Aurea requires permission from the Centro Nacional de Control de Energía (CENACE), the Mexican power Authority, to connect to the National Grid. Three engineering studies are required, namely a load study “Estudio Indicativo”, System Impact Study, “Estudio Impacto en el Sistema” and the Installation study “Estudio de Instalaciones”. Permissions are obtained after the submission of each study. Following the acceptance of the Installation Study, a contract phase is required. The total CENACE review time including the contract phase is 85 days as per published guidelines.
5.5.2 Water
Process plant water demand is estimated to be 140 m3/h to 175 m3/h based on production rates. Plant water supply will be primarily from the TSF (75-80%) with water supplemented by wells during the dry season. On average, supplemental flows ranging from 10 m3/h to 90 m3/h may be required to operate the plant. Make-up water supply would be via a 2.5 km overland pipeline from the wellhead to the plant site.
5.5.3 Mining Personnel
In 2016, Mexico was listed as the eighth largest gold producing country after China, Australia, Russia, United States, Canada, Peru and South Africa. Mine activities in Mexico date back more than 1,000 years. As a result of Mexico’s long history of mining activities, skilled mining personnel are available in Mexico. The mine operation is planned to use contract miners with quotations received from three contractors.
Minera Aurea currently employs 46 workers from the local
communities. There is a locally accepted process for labor hiring opportunities
in the project.
|
|
40 |
| ANA PAULA PROJECT |
| FORM 43-101F1 TECHNICAL REPORT |
6 HISTORY
The Ana Paula Project is within the Guerrero Gold Belt which has been mined commercially for gold and silver since the early 1920’s. Today, the trend includes producing gold mines, several known deposits in various stages of development and exploration, and numerous early stage exploration prospects. Since modern exploration began 20 years ago in response to changes in Mexican foreign ownership and mining laws, and signing of the North American Free Trade Act (NAFTA), the trend has evolved into one of Mexico’s most prolific gold producing belts.
The Ana Paula Project area is contained within two concessions, namely Aplaxta 3 and Tembo.
6.1 PRIOR OWNERSHIP AND OWNERSHIP CHANGES
In July 2002, the concession Aplaxta 3 was issued to Nafta S.A. de C.V., a subsidiary of Miranda Mining Corp.
In September 2003, the concession Tembo was issued to Miralpaz S.A. de CV., a subsidiary of Miranda Mining Corp.
Wheaton River Minerals Inc. (Wheaton) purchased 100% of Miranda Mining Corp. in 2003, thereby acquiring a 100% interest in the concessions.
Goldcorp’s acquisition of Wheaton in 2005 included acquisition and transfer of the concessions to Goldcorp’s operating subsidiary Desarrollos Mineros San Luis, S.A. de C.V.
On July 30, 2010 Newstrike Capital Inc., operating through its 100% Canadian owned subsidiary Aurea Mining Inc., through its 100 percent owned Mexican operating subsidiary Minera Aurea, S.A. de C.V., acquired a 100 percent interest in the concessions from Desarrollos Mineros San Luis, S.A. de C.V. a wholly owned Mexican subsidiary of Goldcorp Inc. Minera Aurea S.A.de C.V. is the current holder of the concessions.
Alio Gold (formally Timmins Gold Corp.), acquired Newstrike Capital Inc. in an arrangement that closed on May 26th, 2015. With the arrangement, Timmins Gold acquired ownership of all of the issued and outstanding common shares of Newstrike Capital Inc., its Canadian subsidiary Aurea Mining Inc., and its Mexican subsidiary Minera Aurea S.A. de CV; Newstrike Capital Inc. and subsidiary companies are now wholly-owned subsidiaries of Alio Gold.
6.2 PREVIOUS EXPLORATION AND DEVELOPMENT RESULTS
6.2.1 SGM (1970-2002)
The 47,600 hectare Morelos National Mineral Reserve, which was located to the west and outside of the Project Area, was created during the Administration of President Miguel de la Madrid. The Consejo de Recursos Minerales (the “CRM”, today known as the “SGM”) carried out exploration throughout the Reserve and surrounding areas. The exploration campaign included regional and detailed mapping, airborne and ground geophysics, geochemical sample programs, and drilling. In 1979, SGM built an access road to the artisanal Guadalupana gold mine located on the Ana Paula Project.
6.2.2 Miranda Mining Corp. (2002-2004)
In 1998, Miranda collected 726 regional stream sediment samples
west of the Morelos Mineral Reserve, including samples from the Project area.
Results from the sampling campaign led to the staking of the claims.
|
|
41 |
| ANA PAULA PROJECT |
| FORM 43-101F1 TECHNICAL REPORT |
6.2.3 Goldcorp (2005-2010)
Goldcorp conducted the first detailed exploration on the Tembo and Apaxtla 3, as well as the non-contiguous concessions Tembo Dos and Tembo Tres, between 2005 and 2009. The Goldcorp work represents the first detailed exploration within the Project Area.
Work programs included regional and detailed geologic mapping (1:1,000, 1:5,000, and 1:10,000 scale), road building, stream sediment sampling, trench and road cut sampling, age dating of the intrusion, an airborne multispectral and magnetic survey, a ground pole-dipole induced polarization survey, portable infrared mineral analyzer (PIMA) alteration mapping, structural interpretation, petrologic and microprobe studies.
Reconnaissance Exploration and Trenching
Goldcorp conducted trench and road cut sampling during 2005. Goldcorp’s work outlined a 1- by 2-km exploration target in the Ana Paula Project area defined by anomalous outcrop gold geochemistry (>0.2 to 49.9 g/t) returned from grid and road-cut samples with coincident underlying geophysical anomalies, as shown in Figure 6-1.
Samples collected from road cuts at San Jerónimo (within Ana Paula) include intervals of up to 70 m of 1.1 g/t Au and 120 m of 2.01 g/t Au (Medina, 2010).
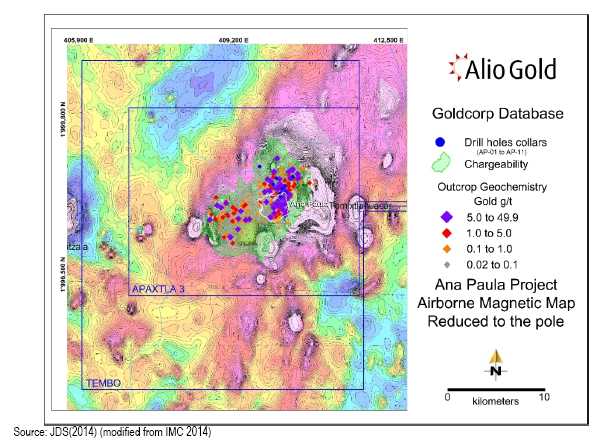
Figure 6-1: Coincident Geophysical and Geochemical Anomalies as Defined by Goldcorp
|
|
42 |
| ANA PAULA PROJECT |
| FORM 43-101F1 TECHNICAL REPORT |
Studies and Surveys
In 2005, 11 rock samples were collected for petrographic study within, just north and west of the Apaxtla 3 concession. The igneous suite was reported to mainly consist of aphanitic rocks with porphyritic textures and was classified as dacite porphyry, granodiorite, and porphyritic basaltic trachyandesite. Porphyritic rocks contain phenocrysts of plagioclase, quartz and biotite, and exhibit potassic alteration, which consists of secondary K-feldspar with replacement of the sample matrix as well as the plagioclase phenocrysts (Mauler and Thompson, 2005). McPHAR Geoservices (Phil.), Inc. (based in Manila, Philippines) to complete an aeromagnetic and radiometric (K, Th, U) survey (30 m elevation, 100 m lines, 1.5 km in length) covering a 225 km2 area.
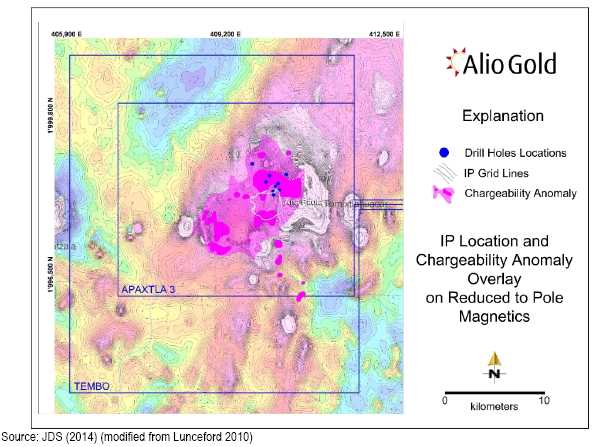
Figure 6-2: IP Chargeability Anomaly over RTP Magnetic Anomaly
Systematic and expanded litho-geochemical sampling continued in
2006. Additionally, SJ Geophysics Ltd. was contracted to provide an Induced
Polarization (3 dimensional) geophysical survey (Figure 6-2). Survey parameters
included 3.5 km long lines oriented northwest, every 200 m with 100 m dipole
spacing. Road construction, road-cut sampling (Figure 6-3), and geologic mapping
(1:1000, 1:5000) continued (Figure 6-4). Intrusive samples were submitted for
age dating. Petrographic and microprobe studies were conducted on a suite of
volcanic and intrusive rocks and a structural interpretation utilizing satellite
imagery was completed.
|
|
43 |
| ANA PAULA PROJECT |
| FORM 43-101F1 TECHNICAL REPORT |

Figure 6-3: Outcrop grid, Geochemical Sampling Ana Paula Project
In 2007 Dr. Victor Valencia of the University of Arizona
(Tucson) conducted U-Th-Pb age dating on zircons collected from granodiorite
exposures in and around the San Jerónimo area. All samples indicated age dates
ranging from 66.0 to 66.7 (+ 0.7 to 1.8 Ma) (Valencia-Gomez and Ruiz, 2008).
Geologic mapping indicated linear breccias along contacts within quartz
monzonite and monzonite including a large elliptical body up to 150 m in
diameter west of San Jerónimo. The breccias exhibit strong argillic alteration,
stockwork, disseminated sulphide, and elevated gold mineralization (Medina,
2010).
|
|
44 |
| ANA PAULA PROJECT |
| FORM 43-101F1 TECHNICAL REPORT |
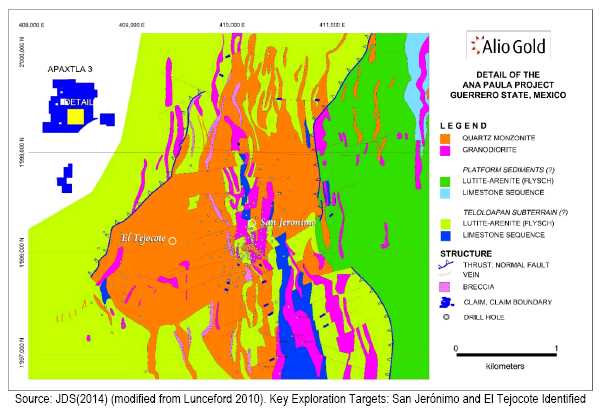
Figure 6-4: 1:5000 Scale Geological Map
In 2008, work activities were reduced because of protracted negotiations with surface owners. Interpretive, schematic cross sections were constructed on a 1:5000 geologic map base to augment drill hole planning. Grid sampling (to 100 m) was completed on parts of the Tembo and Tembo Dos concessions. Litho- and stream sediment sampling continued. Additional samples were collected for PIMA analysis. Core was re-logged to reconcile alteration nomenclature with geochemical and geologic map bases. Goldcorp suspended work on the Ana Paula Property in June 2008.
In summary, 6,764 geochemical samples were collected, including 5,965 channel chips and regional outcrop litho-geochemical samples, 690 grid geochemical samples of intrusive rocks, and 109 stream sediment samples.
6.2.4 Newstrike (2008-2015)
Newstrike exploration activity is considered current and therefore described in section 9 of this report.
6.3 HISTORICAL MINERAL RESOURCE ESTIMATES
The 2013 and 2014 mineral resource estimates described in this
section are now considered historical in nature. They are provided here for
historical context only. The qualified person is not treating these historical
estimates as current mineral resources or reserves and has not undertaken any
independent investigation of the resource estimates; therefore, the resource
estimates in Table 6-2 and Table 6-4 should not be relied upon. These historical
resource estimates are no longer current and have been superseded by the
resource estimate described in Section 14 of this report.
|
|
45 |
| ANA PAULA PROJECT |
| FORM 43-101F1 TECHNICAL REPORT |
6.3.1 2013 Newstrike Resource Estimate
In 2013, H. E. Welhener, R. A. Lunceford, & Winckers, issued a Technical Report and Initial Resource Estimate for the Ana Paula Project and included an initial resource estimate. The resource estimate was based on 130 diamond core drill holes aggregating 67,943 meters and containing 45,512 assay intervals, of which effectively were all assayed for gold and silver.
The estimated resources were based on an internal cut-off of 0.45 g/t gold equivalent (AuEq). The calculation of AuEq includes the gold and silver prices and recoveries presented in Table 6-1.
The Ana Paula deposit was modeled using an inverse distance to the tenth power (ID10) operator applied to 10 m equal length gold and silver composites. Grade estimation was constrained by lithologic domain boundaries. Model blocks were classified as measured, indicated or inferred based on kriging variance, the number of holes inside the search ellipsoid and distance from the closest hole. Tonnages were estimated using density data supplied by Newstrike.
Table 6-1: Input Parameters to Define the 2013 Mineral Resources in Floating Cone Pit Shape
| Process Recovery | Metal Price | |
| Gold Price | 85% | $1450/oz. |
| Silver Price | 27.3% | $28/oz. |
| Costs: | ||
| Process + General and Administrative | $17.27/t | |
| Mining | $2.05/t, plus $0.02/t per bench below 900 m elevation | |
| Pit overall slope angles | 45 to 55 degrees depending on aspect | |
Source: H. E. Welhener, R. A. Lunceford, & Winckers (2013)
The resources were constrained within a floating cone shell. Parameters for the shell assumed that all of the mineralization at Ana Paula occurs in the form of sulfide. The 2013 resource estimate shown in Table 6-2 was the first published estimate for the Ana Paula Project. The 2013 Newstrike resources are no longer current since they have been superseded by the resources presented in section 14 of this report.
Table 6-2: Ana Paula Historical Resource Estimate
| Category | Tonnage & Grades >= 0.46 g/t AuEq Cut off | Contained Ounces (000,000’s) | |||
| Mtonnes | Au, g/t | Ag, g/t | Gold | Silver | |
| Measured | 18.4 | 2.21 | 6.2 | 1.31 | 3.7 |
| Indicated | 24.6 | 1.13 | 7.6 | 0.89 | 6.0 |
| Sum M&I | 43.0 | 1.59 | 7.0 | 2,20 | 9.7 |
| Inferred | 1.8 | 0.78 | 18.7 | 0.05 | 1.1 |
Source: H. E. Welhener, R. A. Lunceford, & Winckers (2013)
6.3.2 2014 Newstrike Resource Estimate
In August 2014, JDS Energy and Mining issued an NI-43-101
Technical Report entitled “Preliminary Economic Assessment on the Ana Paula
Project, Guerrero State Mexico” and incorporated an estimate of the mineral
resource. The mineral resources used for the study had an effective date of
August 8, 2014. The estimated resources were based on an internal cut-off of
0.46 g/t gold equivalent (AuEq) based on the gold and silver prices and
recoveries presented in Table 6-3. The AuEq is calculated by adding the gold
grade to the silver grade multiplied by a factor of 0.011.
|
|
46 |
| ANA PAULA PROJECT |
| FORM 43-101F1 TECHNICAL REPORT |
Table 6-3: Input Parameters to Define the 2014 Mineral Resource Open Pit Shell Geometry
| Process Recovery | Metal Price | |
| Gold Price | 80% | $1450/oz. |
| Silver Price | 55% | $23/oz. |
| Costs: | ||
| Process | $15.60/t | |
| General and Administrative | $1.65/t | |
| Mining | $1.85/t, plus $0.02/t per bench below 900m elevation | |
| Pit overall slope angles | 55 degrees on west 45 degrees on all others |
|
Source: H. E. Welhener, R. A. Lunceford, & Winckers (2014)
The resource estimate was based on 113,535 m of drilling aggregating 85,523 assay intervals in 230 diamond core drill holes aggregating 113,535 m and containing 85,523 assay intervals, of which effectively all were assayed for gold and silver. The resource shown in Table 6-4 was constrained within a resource constraining shell using parameters listed in Table 6-3.
Table 6-4: 2014 Ana Paula Measured, Indicated, and Inferred Historical Resource Estimate
| Category | Tonnage & Grades >= 0.46 g/t AuEq Cut-off | Contained Ounces (000’s) | |||
| ktonnes | Au, g/t | Ag, g/t | Gold | Silver | |
| Measured | 22,767 | 1.608 | 4.9 | 1,177 | 3,587 |
| Indicated | 18,243 | 1.163 | 5.95 | 682 | 3,489 |
| Sum M&I | 41,010 | 1.41 | 5.37 | 1,859 | 7,076 |
| Inferred | 1,904 | 1.113 | 10.85 | 68 | 664 |
Source: JDS (2014)
The 2014 Newstrike resources are no longer current since they have been superseded by the resources presented in Section 14 of this report.
6.3.3 2016 Timmins Resource Estimate (in the Preliminary Economic Assesment Study)
The 2014 Preliminary Economic Assessment was updated in 2016 to account for CAPEX changes. The published resource remained unchanged from that presented in Section 6.3.2 and are no longer current since they have been superseded by the resources presented in section 14 of this report.
6.3.4 Previous Production
No significant production occurred on the project site. Some
small scale artisanal extraction took place during the period between 1950–1980.
|
|
47 |
| ANA PAULA PROJECT |
| FORM 43-101F1 TECHNICAL REPORT |
7 GEOLOGICAL SETTING AND MINERALIZATION
7.1 TECTONIC SETTING
Southern Mexico is underlain by a basement stratigraphy that includes the greenschist facies Early Jurassic Tierra Caliente Metamorphic Complex. This mega-terrane includes two major sub-terranes in the Project area, the Mixteca Terrane comprising the Morelos-Guerrero Platform sediments as a sub-terrane (Platform), and the Guerrero-Composite Terrane, which includes submarine arc rocks of the Teloloapan Sub-terrane (Teloloapan). The eastern boundary of the Teloloapan sub-terrane is in contact with the western Platform Sub-terrane, as shown in Figure 7-1.
A discussion of the nature of the contact between the two sub-terranes is not within the scope of this report; however, both are thought to have been highly deformed during Laramide Compressional Orogeny (Laramide), and share a common basement in the Guerrero terrane based on 206Pb/204Pb versus 87Sr/86Sr isotopic studies (Valencia and Ruiz, 2008). A series of intrusions and sub-volcanic rocks were emplaced during or following this orogenic event along a northwesterly trend. The intrusions are interpreted to share a common provenance in a deep seated plutonic body derived from a mixing of two possible magma sources: a depleted mantle and an enriched crust (Valencia and Ruiz, 2008). A trace element study completed in 2003 proposed the pluton formed within a post collision tectonic framework of a volcanic arc related to the interaction between the Farallon and North America plates (Gonzalez-Partida et al, 2003, 2004).

Figure 7-1: Geologic Map of Southwestern Mexico
|
|
48 |
| ANA PAULA PROJECT |
| FORM 43-101F1 TECHNICAL REPORT |
A simplified geology map that shows the Mixteca, Teloloapan, Arcelia, and Zihuatanejo Sub-Terranes. The red square shows the location of the Guerrero Gold Belt within the Tectono-Stratigraphic Terranes of southwestern Mexico, (Alio Gold 2017 modify from 2008 Geological Society of America).

Figure 7-2: Stratigraphic Column
7.2 REGIONAL GEOLOGY
Ana Paula lies along the northwestern extension of the GGB and straddles the proposed tectonic boundary between the Teloloapan and Morelos Guerrero platform sub-terranes, as shown in Figure 7-3. The following discussion of regional geology is reliant on Werre-Keeman et al., 1999; Valencia-Gomez, et al., 2001; Levresse et al., 2004; Centeno-García et al., 2008; and Valencia and Ruiz, 2008.
The regional geology includes stratigraphy belonging to the two proposed tectonic sub-terranes. The stratigraphy of the Teloloapan sub-terrane includes a volcanic-volcaniclastic arc assemblage that overlies a basement schist of the Guerrero composite terrane, both of Upper Jurassic to Lower Cretaceous age. This assemblage is in turn overlain by an undifferentiated limestone, shale, and sandstone sedimentary sequence of Cretaceous age that, on the scale of the Project, forms a North-South trending corridor separating in apparent fault contact the Morelos Guerrero Platform sediments on the east from the Teloloapan volcanic-volcaniclastic belt on the west. The volcanic sequence associated with the Teloloapan sub-terrane is observed to outcrop immediately outside the western boundary of the Ana Paula Project. The stratigraphy attributed to the Morelos Guerrero platform includes a thick carbonate sequence of thick- to thin-bedded limestone and dolomite overlain by younger thinly bedded flysch-like deposits. Outcrops of this stratigraphic assemblage are observed outside the boundaries of the Ana Paula Project, underlying the eastern portion of the surrounding Aurea Norte Property.
|
|
49 |
| ANA PAULA PROJECT |
| FORM 43-101F1 TECHNICAL REPORT |
The stratigraphy of both sub-terranes was intruded by at least two intrusive events. The earliest is a ±62-66 million years (Ma) calc-alkali intrusive complex that is related to the Laramide Orogeny and the mineralizing event recognized as the Guerrero Gold Belt. These intrusive bodies are observed to outcrop for at least 55 km through the district on a northwesterly trend. Zirconium 206Pb/238U age dating of the intrusions at Ana Paula show they average 66.0 -66.8Ma ± 1.8Ma in age, placing them within the same intrusive event as the Filos, Filos Deep and Morelos projects (Valencia-Gomez et al., 2001 and Valencia-Gomez and Ruiz, 2008).
The second intrusive event are ±30Ma calc alkali to alkali volcanic rocks related to the onset of continental volcanism that may be associated with overprinting of an epithermal style mineralization observed within the Project. Quaternary volcanic units and lacustrine sediments outcrop regionally as local eroded remnants that overlie all older stratigraphy.
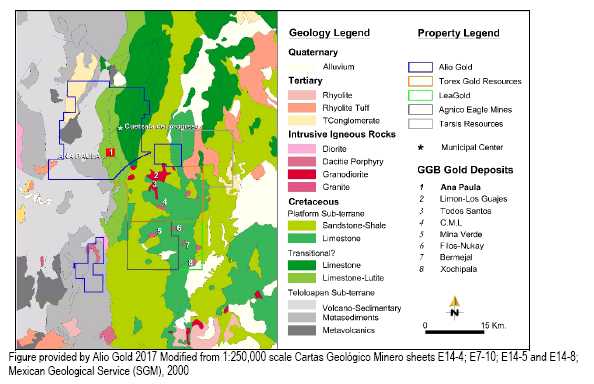
Figure 7-3: Regional Geologic and Property Location Map
7.3 PROJECT GEOLOGY
The geologic units underlying the Ana Paula project are primarily sedimentary rocks composed of an interbedded limestone and shale unit and a carbonaceous limestone unit that have been intruded by intermediate sills, dikes and stocks, as shown in Figure 7-4. A large body of intrusive rocks underlies the Ana Paula deposit as currently defined in quadrants A2, B1, and B2 in Figure 7-4. Six principal geological domains within Ana Paula Deposit have been recognized:
(1) Complex Breccia domain that sits in the core of the main Ana Paula deposit. This domain is a sub-vertical plug elongated in the east-west direction and steeply dipping to south. (2) Intrusive suite domain is a package of several different intrusive phases that in a general sense appear to be similar in composition and age and host the majority of the ore grade of the Ana Paula deposit. (3) Monolithic breccia domain is essentially a brecciated intrusion composed of mostly monolithic fragments in a silica rich matrix with mixed sulphide-oxide mineralogy. It is located in the southern part of the deposit. (4) Sediments domain is characterized by light brown weathering, platy outcrops, with distinct gray and brown limestone beds which range from a few centimeters to as much as 25 centimeters thick. Also, a massive thin bedded laminated carbonaceous limestone is present in this domain. The sediments domain is located in the eastern part of the deposit. (5) Skarn-Hornfels domain is found in the deeper zones of the deposits and shows a down dip zonation from unaltered sedimentary limestone-shale to skarn-hornfels metamorphic rock. (6) Semi-massive sulphide domain is very localized and narrow, and it develops at the contacts between the skarn-hornfels domain and the intrusive suite domain.
|
|
50 |
| ANA PAULA PROJECT |
| FORM 43-101F1 TECHNICAL REPORT |
![]()
Figure 7-4: Ana Paula Project Geology Map
7.3.1 Sedimentary Rocks
Geologic mapping by Newstrike completed during 2010 to 2013 has
shown that the sedimentary rocks underlying the Ana Paula deposit are dominantly
carbonaceous limestone within a more regionally extensive unit of interbedded
limestone, shale and sandstone. These sedimentary rocks generally strike
northerly and dip westerly and are distinct from the Morelos platform sediments,
which lie outside of the eastern Project boundary, and from the volcaniclastic
sediments of the Teloloapan Sub-terrane which lie to the west.
|
|
51 |
| ANA PAULA PROJECT |
| FORM 43-101F1 TECHNICAL REPORT |
7.3.1.1 Limestone-Shale (LS-SH)
A unit of Inter-bedded shale and limestone surrounds the deposit area. This unit is characterized by light brown weathering, platy outcrops, with distinct gray and brown limestone beds ranging from a few centimeters to as much as 25 centimeters thick. Sandstone layers may be present in this unit, Figure 7-5.

Figure 7-5: Limestone-Shale Unit
Drillhole AP-10-16
from 52.44 - 59.15 m; no significant assay.
7.3.1.2 Carbonaceous Limestone (LS)
Massive to thin-bedded, fine- to medium-laminated carbonaceous limestone is present in the area of the main Ana Paula deposit where it is the dominant sedimentary lithology. In drill core the unit locally presents a phyllitic to schistose deformation that varies from strongly carbonaceous to locally graphitic. This unit is known to include local pockets of breccia, stockwork or contact replacement mineralization but is generally not mineralized, Figure 7-6.

Figure 7-6: Carbonaceous Limestone Unit
Drillhole
AP-10-16 from 272.78 - 279.55 m; no significant assay.
7.3.2 Intrusive Domain
Intrusive phases within this domain include a series of dikes and/or sills that coalesce to form a stock-like body that has been drilled over an area approximately 1.2 km by 1.2 km. Rafts or slivers of limestone-shale and hornfels intersected in drill core do not necessarily outcrop at surface. Several intrusive phases are observed in drill core that are essentially similar to those of the sediment intrusive domain. The main intrusive phase is a plagioclase-biotite porphyry, locally with small amounts (< 1%) partly resorbed quartz, in a fine-grained groundmass. Samples studied to date have pervasively altered groundmass so the original composition could not be determined. Amphibole is also reported as phenocrysts. Plagioclase phenocrysts are commonly large, as much as 5-7 mm in largest dimension, but a wide range of grain sizes and phenocryst percentages is observed. Intrusive contacts between fine and coarse phases have been observed, mainly in core, but have not been mapped or traced over appreciable distances. In addition, several different phases are observed, including a fine-grained intrusive phase that commonly exhibits apparent flow banding, and locally resembles a stratified unit such as a tuff (Figure 7-8). Another phase that appears unique to this domain is a dense, silicified intrusive breccia unit that is host to a consistent low-grade mineralization (Figure 7-9).
|
|
52 |
| ANA PAULA PROJECT |
| FORM 43-101F1 TECHNICAL REPORT |
Observed minerals in this domain include primarily pyrite and arsenopyrite, with traces of pyrrhotite, sphalerite, and native gold and/or gold tellurides. Magnetite, galena, stibnite, realgar and bismuthinite are observed rarely. Chalcopyrite and bornite are identified in thin section.
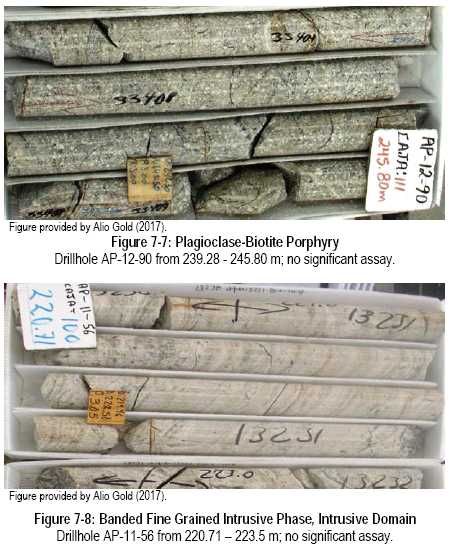
|
|
53 |
| ANA PAULA PROJECT |
| FORM 43-101F1 TECHNICAL REPORT |

7.3.3 Metamorphic Rocks
7.3.3.1 Hornfels-Skarn
The sediments are locally metamorphosed to hornfels and skarn (Figure 7-10 and Figure 7-11), occurring frequently as narrow contact replacement of the sediment-intrusive contacts. More regional scale hornfels crops out to the northeast of the project area and is encountered in most drill holes at increasing depth to the southwest. The altered rock is often transitional and termed hornfels where individual mineral grains are not recognizable and termed skarn where they are coarser and garnet and pyroxene become visually identifiable at a macroscopic scale. Skarn tends to be more common at depth to the southwest.
The mineralogy is composed of calc-silicate minerals (garnet, wollastonite, tremolite-actinolite, diopside, and idocrase) and is termed “silication”, and is generally not silicification (Gibson, 2012). They are both a common host to replacement disseminated to massive sulfides (arsenopyrite + pyrite/marcasite ± pyrrhotite) mineralization that can contain high gold grades over narrow intervals (Figure 7-12 and Figure 7-13).
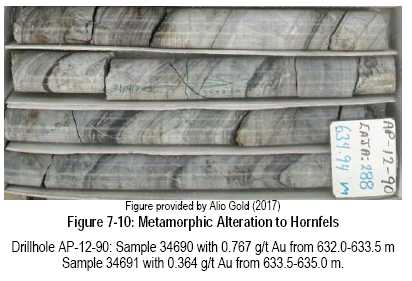
|
|
54 |
| ANA PAULA PROJECT |
| FORM 43-101F1 TECHNICAL REPORT |

|
|
55 |
| ANA PAULA PROJECT |
| FORM 43-101F1 TECHNICAL REPORT |
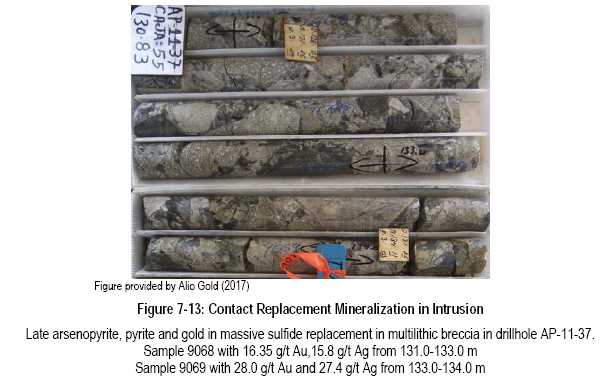
7.3.4 Breccias
Two main breccias were identified at Ana Paula deposit that contains ore grade mineralization. The complex breccia which host high-grade gold mineralization and the monolithic breccia which contains lower grade gold mineralization. These two breccias do not appear spatially connected and are currently interpreted as separate entities in the Ana Paula Deposit. For that reason, they are logged a distinct lithologies Additionally, logging of breccias was designed to be more descriptive, such as monolithic and complex breccia and in general, Alio Gold geologists avoid terms with genetic connotations.
7.3.4.1 Complex Breccia
The complex breccia consists of a core of multilithic breccia (Figure 7-14) in a steeply south-plunging column surrounded by a halo of mineralization and alteration characterized by veins, fracture zones, and massive sulfide contact replacements in country rock that includes limestone, hornfels and intrusive rocks along with other breccia. The breccia core and the surrounding alteration have the same sulfide assemblage as matrix filling breccia, replacements of the breccia fragments, as well as stockwork mineralization in the surrounding altered wallrock. Late quartz and quartz-carbonate veins crosscut the entire unit and may represent a late or a second mineral event.
This breccia, Figure 7-14, consists of angular to rounded
plagioclase-biotite porphyry and angular fragments of hornfels, limestone, shale
and other very fine-grained to aphanitic fragments range from less than a
centimeter to over 10 cm in size. Brecciation appears to be relatively high
energy but non-dynamic, exhibiting strong fracturing and angular fragmentation
(locally crackle) and no obvious fault features such as gouge. Rock fragments
are variably cemented within a matrix of silica (locally chalcedonic) and
sulfide minerals (mostly arsenopyrite and pyrite/marcasite). In some areas, the
matrix appears to be finely ground rock or intrusive material; the latter may be
more prevalent with the deeper drill intersections.
|
|
56 |
| ANA PAULA PROJECT |
| FORM 43-101F1 TECHNICAL REPORT |
The breccia core occurs near a change in orientation or jogs in the stratigraphic and structural fabric of the surrounding sediment-intrusive domain, and is interpreted as being partly controlled by the intersection of at least two planar structures, forming a steeply plunging body that obliquely crosses the main structural grain. The Breccia Zone comes to surface around UTM grid line 1998050 mN at the center of the pit, and extends at least 700 m vertically from surface where it remains open at depth. Insufficient drilling has been completed to fully delineate the breccia at depth. The complex breccia core is irregular in its dimensions, average width is about 55 m – 80 m, and plunges southerly. The breccia core appears to be tapering at depth however this could be due to lack of drilling.
The alteration halo surrounding the lithologic breccia extends laterally between 100 m to 180 m from the breccia core, is also irregular in shape and is hosted within the altered limestone and intrusions. The orientation of the mineralized halo is dominantly controlled by the steeply dipping structural intersection of the breccia core, and partly controlled by existing stratigraphy and structures, especially along contacts. Grades in the mineralized halo typically decrease away from the high-grade core breccia unit.
7.3.4.2 Monolithic Breccia
This breccia (Figure 7-15) has a dense siliceous matrix with locally abundant sulfide minerals, mainly pyrite/marcasite and arsenopyrite, and these minerals are observed to rim or react with the breccia clasts. Fragments may be angular or rounded and there may be evidence of rock flour and brittle fracturing. Hydrothermal brecciation can occur in all rock types but is dominantly observed in intrusive rocks and is locally observed to re-brecciate the Complex breccia.
The breccia may be part autobreccia developed during intrusion emplacement and crackle breccia is locally dominant. The alteration style is distinct from the rest of the mineralization at Ana Paula with strong clay alteration and local advanced argillic mineralogy. This breccia zone requires further delineation as mineralization remains open.

|
|
57 |
| ANA PAULA PROJECT |
| FORM 43-101F1 TECHNICAL REPORT |

7.3.5 Mineralization
At least two and possibly three mineralizing events are observed at the scale of the property, but the relationships and timing of these events is not currently known.
7.3.5.1 Mineral Deposition
In general, four gold depositional sites are recognized at Ana Paula:
| 1. |
Quartz-sulfide and quartz-carbonate-sulfide veinlets, stockworks with sulfide clots and disseminations in both intrusions and hornfels. | |
| 2. |
Narrow semi-massive sulfide contact replacement of limestone or hornfels/skarn at the intrusion contacts. | |
| 3. |
Sulfide clots, rims and masses in narrow contact breccias hosted in intrusions at or near the sedimentary contacts and/or fault contacts. | |
| 4. |
Mineralization associated with a sulfide constituent within breccia matrix and with sulfide replacement textures within structurally controlled breccia formed oblique to the dominant northerly trending westerly dipping stratigraphy. |
Mineralization at Ana Paula occurred during at least two different events or stages. The first event is characterised by gold-arsenic-(bismuth-tellurium), (or Au-As-(Bi-Te), where mineralization is associated with intermediate intrusions emplaced into limestone. The second event locally cuts the first, and is characterized by gold-silver-lead-zinc-mercury-antimony (or “Au-Ag-Pb-Zn-Hg-Sb”), containing locally zoned coarse sphalerite. There are also various quartz-calcite veins with epithermal textures, but the relative timing of these veins remains unclear.
7.3.6 Structures
The boundary between the Teloloapan and Platform terranes
underlies the Ana Paula and surrounding mineral concessions. Medina (2010)
described the contact zone as characterized by intense deformation and faulting,
and placed the boundary on the eastern margin of the Ana Paula Project where it
is interpreted as a north-striking left-lateral fault. Detailed structural work
to verify this interpretation is currently underway.
|
|
58 |
| ANA PAULA PROJECT |
| FORM 43-101F1 TECHNICAL REPORT |
Several structural observations may be important (Gibson, 2012).
| 1. |
Sedimentary rocks strike north to north-northwest with westerly dips of 45º to 75º. | |
| 2. |
Intrusive contacts are generally parallel to bedding in the sedimentary rocks. | |
| 3. |
Most of the structures observed at the surface in the area of drilling consist of folds in sedimentary rocks that are surrounded by intrusive rock. | |
| 4. |
Apparently minor faults are common at low angles to the bedding, in many cases located along contacts between sedimentary and intrusive rocks. | |
| 5. |
Larger-scale faults are not observed at surface nor have they been intersected in core, other than the faults commonly seen at and parallel to sedimentary-intrusive contacts. | |
| 6. |
Larger northeast and easterly trending structures (breccia, veins) are observed northeast of the main Ana Paula mineralization. |
A structural orientation analysis of veinlets and mineralized contacts was undertaken by collecting structural information at the site of mineralized outcrop chip samples (n, being the number of observations) that revealed patterns described in the following (Johnson, 2014). All measurements are in azimuth and use the right hand rule for dips.
| 1. |
A rose diagram of the strikes of all veinlets (n=812) show that there are more veinlets in the NE and SW quadrants of the project area than in the NW and SE quadrants (Section 9.0, Figure 9-1), with maximum frequency in the (diametrically opposite) ranges 000°-030° and 180°-210° (Figure 7-16a). Only a few veinlets strike in the minimum-frequency ranges 120°-150° and 300°-330°. Veinlets that carry anomalous gold (>200 parts per billion [ppb]) show well-defined northeasterly strikes and near-vertical dips. This includes everything in the range 200 ppb to 5000 ppb Au. In contrast, veinlets and mineralized contacts at sample sites that returned assays of more than 5000 ppb Au mostly strike north-south and dip steeply west. | |
| 2. |
A rose diagram of all sampled veinlets with anomalous gold (n=318) shows a well-defined NE-SW strike maximum (Figure 7-16b), and the data have a statistical mean orientation of 231°, 88°. The NE-SW strike is especially prominent in the range 750 to 5000 ppb Au, as shown by a more-detailed analysis not illustrated here. | |
| 3. |
For samples with >5000 ppb Au (n=32), a rose diagram shows a generally N-S strike maximum and a slightly weaker E-W spike (Figure 7-16c). | |
| 4. |
A spherical projection of poles to the 32 veinlets and mineralized contacts in this category shows a prominent point maximum corresponding to a strike and dip of 178°, 75° (Figure 7-16d). This steep westerly dip is similar to the orientation of most contacts between the sedimentary rocks and intrusions and of bedding in the sedimentary units, suggesting that the highest-grade gold is controlled by contacts and layering. The second, weaker cluster of poles corresponds to a strike and dip of approximately 080°, 85°. |
|
|
59 |
| ANA PAULA PROJECT |
| FORM 43-101F1 TECHNICAL REPORT |
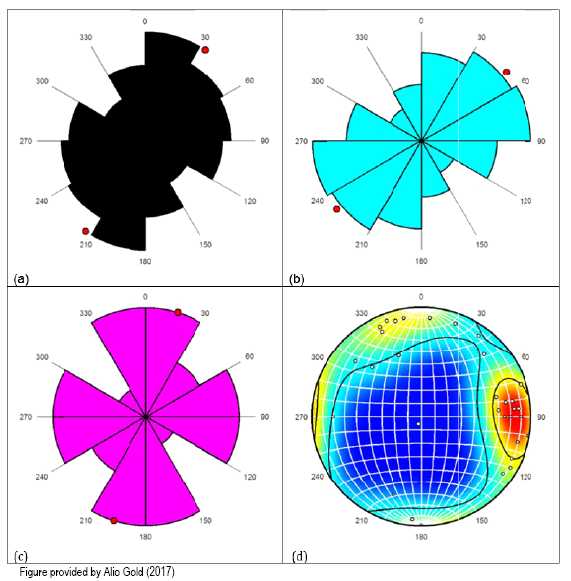
(a) Rose diagram showing the strikes of all veinlets (n=812) at sites of surface rock-chip samples in the Ana Paula and Tejocote areas; (b) Rose diagram of all sampled veinlets with anomalous gold (n=318); (c) Rose diagram of sampled veinlets with >5000 ppb gold (n=32), and; (d) Equal-area spherical projection of poles to sampled veinlets with >5000 ppb gold (n=32). All diagrams in this section were produced using Orient 2.1.2 software (Vollmer, 2012).
Figure 7-16: Structural Assessments of Mineralized Veins
7.3.7 Alteration
All lithology’s underlying the Project exhibit some degree of alteration. A study undertaken by Mauler and Thompson (2005) on a suite of specimens submitted in 2005 identified skarn alteration that is patchy, selective, and comprised aggregates of garnet, calcite-hematite replacing K-feldspar and muscovite or chlorite or clay replacing biotite and commonly fracture controlled calcite. They also describe a main alteration phase within intrusive rocks that includes replacement of plagioclase phenocrysts and matrix K-feldspar by carbonate and minor sericite. Biotite phenocrysts are altered to carbonate ± chlorite ± pyrite ± titanite with minor muscovite, clay and rutile. Mauler and Thompson (2005) concluded that corrosion of quartz phenocrysts and hornblende rims suggest a compositional imbalance of the system during crystallization, possibly caused by assimilation or contamination of the host rocks and/or by a flow of magma (magma mixing). Furthermore, they conclude that the high titanium oxide content in biotite suggests a basic source of magma, suggesting the granitoid rocks originated in a Type-I arc environment. The composition of the samples submitted for the 2005 study is meta-aluminous, calc-alkaline and is high in potassium. Silica varies from 58-65%, placing the magma as diorite to granodiorite in composition.
|
|
60 |
| ANA PAULA PROJECT |
| FORM 43-101F1 TECHNICAL REPORT |
Newstrike collected 34 mineralized samples from drill core that were submitted to Vancouver Petrographics Ltd of Langley, BC, Canada for petrographic study in 2012. The samples were selected to determine the alteration and mineral associations for each rock type submitted. A representative selection of results is presented in Table 7-1.
The intrusion samples display various alteration, mineralogy and textural characteristics. Within the intrusive domain quartz-sericite alteration tends to highlight the porphyritic texture of intrusive rocks (bleaching); and argillic alteration, represented by feldspar phenocrysts altered to clay, locally swelling clay, appears to overprint other alteration types. Vancouver Petrographics also identified free gold in polished section where gold was precipitated on the boundary between euhedral arsenopyrite and the silica matrix. This agrees with early work by Thompson (2008), who determined that gold is associated with arsenopyrite as free grains on or around the grains of arsenopyrite (Figure 7-17).
Within the monolithic breccia strong argillic alteration is observed with some petrological evidence for advanced argillic alteration present in the finer grained intrusive units (Colombo, 2012). Staining of these samples highlighted the presence of
abundant potassium-bearing minerals, however, the very fine-grained nature of the groundmass/matrix hampered the identification of the minerals and some doubts remained between K-feldspar and illite in some of the samples. Short wave infrared (SWIR)
spectroscopy was used to verify this fine-grained assemblage, and the results are highlighted in Table 7-2. The analysis was carried out with a Terraspec 4 at the Mineral Deposit Research Unit (MDRU), Department of Earth and Oceanic Sciences –
University of British Columbia, Vancouver. The interpretation of the SWIR-reflectance spectroscopy was conducted by Colombo (2012) with dedicated software (Specmin-ASD).
|
|
61 |
| ANA PAULA PROJECT |
| FORM 43-101F1 TECHNICAL REPORT |
Table 7-1: Selected Petrology Results
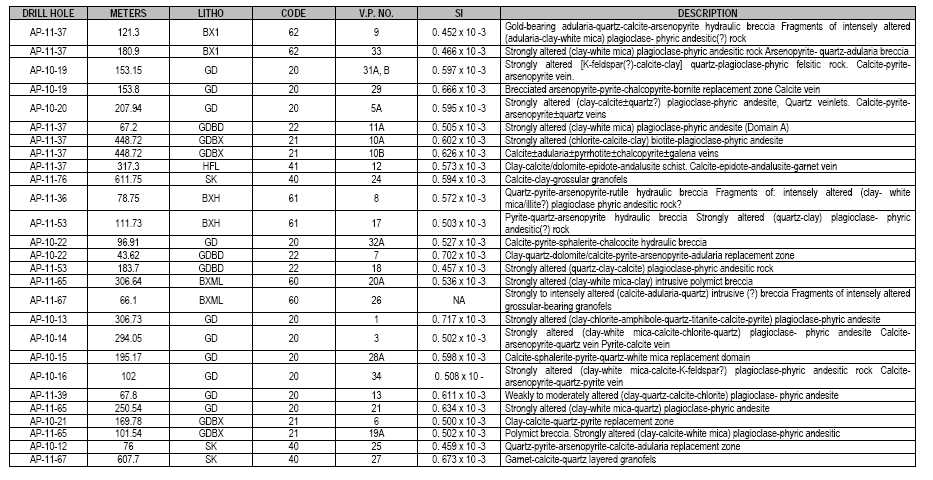
|
|
62 |
| ANA PAULA PROJECT |
| FORM 43-101F1 TECHNICAL REPORT |
Table 7-2: Summary of the Mineral Analysis with SWIR-Spectroscopy
| V.P. No | Mineral 1 | Mineral 2 | Mineral 3 | Mineral 4 |
| 1 | Illite | Actinolite | Calcite | Chlorite |
| 2a | Illite | Kaolinite | Muscovite | Chlorite |
| 3 | Illite | Muscovite | Chlorite | Calcite |
| 5a | Illite | Kaolinite | Calcite | Chlorite |
| 6 | Illite | Kaolinite | Calcite | |
| 7 | Illite | Dickite? | ||
| 8 | Kaolinite | Illite/Smectite | ||
| 9 | Illite | Dickite? | Calcite | |
| 10a | Chlorite | Calcite | Illite/Smectite? | |
| 11a | Illite | Smectite | Muscovite | |
| 14 | Kaolinite | Illite/Smectite | Muscovite | |
| 15a | Illite | Kaolinite/Dickite, Calcite? | ||
| 16 | Illite | Kaolinite/Dickite | ||
| 17a | Illite | Kaolinite | ||
| 18 | Kaolinite/Dickite | Illite? |
Table provided by Alio Gold (2017)
In some of the samples the alteration paragenesis indicated low-sulfidation epithermal conditions. In one case, the gold mineralization was associated with the alteration within a gold-bearing adularia-quartz-calcite arsenopyrite hydraulic breccia (AP-11-37, 121.30 m) (Figure 7-17(a) and (b) and Table 7-1). In another sample, a contact metamorphic assemblage was characterized by calcite-epidote-andalusite-garnet (AP-11- 37, 317.30 m) (Figure 7-17(c) and (d) and Table 7-1). In some cases, the alteration was overprinted by adularia-bearing assemblages (adularia-calcite-quartz±pyrite±arsenopyrite). In one of the samples affected by this alteration, gold was spatially associated with arsenopyrite which in most of its occurrences tends to replace pre-existing pyrite, Figure 7-18.
Colombo (2012) observed that it seems evident that the
mineralization is associated with hydraulic brecciation, intense alteration, and
precipitation of pyrite and arsenopyrite. The sulfide deposition is typically
accompanied by a strong alteration (clay-calcite±quartz) which selectively
replaces plagioclase phenocrysts within the plagioclase-phyric intermediate
rock. White mica and clay replaced the biotite, which in some rare cases was
observed as relict within the less intensely altered samples. The groundmass was
intensely replaced by illite±kaolinite±smectites±calcite±quartz.
|
|
63 |
| ANA PAULA PROJECT |
| FORM 43-101F1 TECHNICAL REPORT |
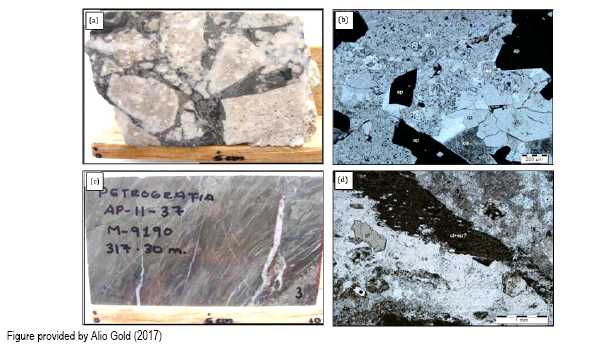
(a) High grade breccia longitudinal split core hand specimen, AP-11-37, 121.30 m, 18.6 g/t Au and 17.5 g/t Ag, Sample #9063; (b) Photomicrograph of (a) shows the contact between the intensely altered rock fragment and the quartz-calcite-arsenopyrite infill (qz, ca, and ap) is populated by rhombic adularia (ad). Plane polarized transmitted light; (c) Hornfels, AP-11-37, 317.30 m, longitudinal split core hand specimen; 0.192 g/t Au, 0.2 g/t Ag, Sample #9190; and; (d) Photomicrograph of (c) shows clay-epidote(?)-rich septa occurs within the calcite-rich vein (ca) which crosscuts the clay-rich schist and hosts andalusite (an) and garnet (gt) crystals. Plane polarized transmitted light.
Figure 7-17: Petrographic Sections

Figure 7-18: Gold Grain (Au) Located Between Euhedral Arsenopyrite (ap) and Quartz
|
|
64 |
| ANA PAULA PROJECT |
| FORM 43-101F1 TECHNICAL REPORT |
8 DEPOSIT TYPES
Numerous gold deposits are located in present or ancient subduction zones of plate boundaries. Gold deposit types associated with convergent plate boundaries include: Au porphyry, sediment hosted, intrusion related, epithermal, and orogenic gold deposits.
Orogenic deposits are characterized by a strong structural control of the gold deposits and orebodies at all scales. Veins in the orogenic gold deposits are dominated by quartz with subsidiary carbonate and sulphide minerals. Gold occurs in the veins and in adjacent wallrocks and is usually intimately associated with sulphide minerals, including pyrite, pyrrhotite chalcopyrite, galena, sphalerite, and arsenopyrite. In greenschist and amphibolite grade host rocks, pyrite and pyrrhotite are the most common sulphide minerals while arsenopyrite is the predominant sulphide mineral in ores hosted by sedimentary rocks.
The orogenic deposit model for gold mineralization in the Guerrero Gold Belt (GGB) is considered to be associated with a Pacific Rim style of mineralization as described by Corbett (1998, 2009) and shown in Figure 8-1. GGB mineralization is related to a late Cretaceous to Early Tertiary age skarn porphyry continuum emplaced during a 62 to 66 million year old intrusive event associated with Laramide Compressional Orogeny. Early-stage, essentially barren calc-silicate skarn alteration associated with one or more intrusive phases is thought to have developed as a contact metamorphic aureole surrounding hydrated intrusive bodies.
Gold deposition at Ana Paula tends to occur, both contemporaneous with and post intrusion, exhibiting at least two mineralizing events. The earliest consists of Au-As-(Bi-Te) disseminated mineralization characterized by progressive mineralization over time through deposition of gold in breccias, stockworks, contact skarn (both endoskarn and exoskarn) and other replacement bodies.
The second mineralization event (Au-Ag-Pb-Zn-Hg-Sb) perhaps related to the epithermal style of alteration discussed in Section 7.3.7 may be a later hydrothermal phase of the earliest intrusive event or may be younger.
The exact timing of gold deposition and the mechanism of deposition within the GGB and at Ana Paula are not yet fully understood and appears to vary among the known deposits, where each deposit shares important characteristics and differences. Intrusions at Ana Paula have been dated at 66.0 – 66.7Ma ± 0.7 -1.8Ma (Valencia et al, 2008), which may also date the earliest onset on mineralization.
Results from Ana Paula suggest that the bulk of the gold deposition occurs with the dominant Au- As-(Bi-Te) mineralization, and is largely hosted in a northerly trending and westerly dipping corridor of intrusive rocks, at the contacts with sedimentary rocks and hornfels, and within important breccia bodies. Gold deposition within the high-grade core of the deposit is structurally controlled, located at the intersection of at least two fault structures and the host stratigraphy described in Section 7. Both skarn type massive and disseminated sulphide (arsenopyrite + pyrite) replacements and some epithermal overprinting have occurred but the extent and relationship to the oldest intrusive rocks have not been studied in detail.
Economically significant gold deposits in the GGB are hosted
within a variety of structural, lithological and/or geochemical traps and
frequently occur in clusters about a northwesterly trend of intrusions of
similar age and provenance which are defined by a co-incident northwest trend of
magnetic anomalies. The trend is known to exceed 55 km along strike and has
become known the Guerrero Gold Belt.
|
|
65 |
| ANA PAULA PROJECT |
| FORM 43-101F1 TECHNICAL REPORT |

Figure 8-1: A Pacific Rim Model of Mineralization
This diagram illustrates the different styles of mineralization
in a magmatic arc porphyry and epithermal Cu- Au-Mo-Ag system (Corbett, 2008).
|
|
66 |
| ANA PAULA PROJECT |
| FORM 43-101F1 TECHNICAL REPORT |
9 EXPLORATION
Since exploration began in 2010-2014 by previous operator and from 2017 to present by Alio Gold, a total of 103,349 samples have been collected from road cuts, outcrop chip and channel samples, stream and soil samples, drill core and from RC drilling. This number includes blanks and standards. In addition, various samples for metallurgy, density measurements and quality assurance and quality control (“QAQC”) were collected for geochemical assay (Table 9-1).
Table 9-1: Sample Inventory
| Year | Audit | Surface | Drill | QA/QC | Metallurgy | Density | Overlimits | Total | ||||
| Rejects |
Pulps (Checks) |
Duplicates |
Blanks |
Standards | ||||||||
| 2010 | 587 | 44 | 3,149 | 695 | 196 | 174 | 27 | 163 | 460 | 5,495 | ||
| 2011 | 2,380 | 18,877 | 524 | 1,011 | 1,015 | 271 | 844 | 1,688 | 26,610 | |||
| 2012 | 1,379 | 29,476 | 498 | 172 | 28 | 451 | 1,222 | 788 | 1,905 | 35,919 | ||
| 2013 | 1,326 | 26,059 | 832 | 263 | 369 | 1,068 | 171 | 417 | 30,505 | |||
| 2014 | 291 | 1,238 | 1,516 | 17 | 50 | 3,112 | ||||||
| 2015 | 1,403 | 70 | 47 | 48 | 54 | 207 | 1,310 | 116 | 3,255 | |||
| 2016 | 4,110 | 205 | 40 | 126 | 192 | 78 | 610 | 108 | 5,469 | |||
| 2017 | 1,267 | 30 | 39 | 50 | 43 | 19 | 150 | 1 | 1,599 | |||
| Total | 587 | 5,420 | 85,579 | 4,065 | 1,947 | 1,343 | 1,359 | 3,636 | 475 | 5,423 | 2,130 | 111,964 |
This section summarizes the exploration work carried out by Newstrike and Alio Gold. Goldcorp exploration effort prior to Newstrike is considered historic and described in Section 6 of this report.
9.1 EXPLORATION WORK – NEWSTRIKE (2010-2015)
The following exploration work programs were completed on the Ana Paula Project by Newstrike from 2010 to 2014:
- Regional and semi-detailed outcrop mapping and sampling.
- Road cut outcrop mapping and sampling.
- ZTEM and airborne magnetic geophysical surveys, modelling and interpretation.
- 111,627.67 m of core drilling in 221 drillholes, from AP-10-12 started October 22, 2010 through AP-13-232 completed on July, 2014.
- 3,353 On-site density measurements have been completed from 123 drillholes.
- 96,212 geochemical samples from surface and core, including QAQC and check samples.
- Orthophotography and topographic contouring (to 1 m contours).
- Petrographic and short-wave infrared (SWIR) spectroscopic studies of 34 core samples.
- Structural and alteration studies.
- Environmental studies including water quality and weather monitoring.
- Pit slope, metallurgical, process design and other engineering studies.
- Deposit modelling.
|
|
67 |
| ANA PAULA PROJECT |
| FORM 43-101F1 TECHNICAL REPORT |
Geologic outcrop mapping was conducted continuously since June 2010 to December 2014. A local map sheet grid was devised across the Project that is used to systematically plot all Project data, informally subdividing the Project area into nine 1:2000 scale map sheets, designated from north to south and west to east as A1-A2-A3, B1-B2-B3, and C1-C2-C3. The local grid covers an area defined by UTM coordinates 408,000-413,000 m Easting by 1,985,000-2,000,000 m northing (WGS 84 datum), Figure 9-1. Virtually all sampling, geologic mapping and drilling has been conducted within the A1-A2 and B1-B2 map sheets, informally described sometimes as the northwest, northeast, southwest and southeast quadrants respectively. These four map sheets cover the approximately two by two km exploration target area defined in Section 6.2, Figure 6-1.
9.1.1 Surface Mapping and Sampling Methodology
Surface mapping and sampling methods and protocols have remained the same since work on the Project began in mid-2010. Outcrop and road cut locations are registered on handheld GPS (WGS84 datum) and recorded along with lithologic, structure, mineralization, alteration and other relevant details on field map sheets of the same 1:2000 scale that are then transferred first by hand then digitally to the final map sheets. These map sheets are composited into the final Project-wide geologic map shown previously in Figure 7-4.
Prior to sampling, road cut and outcrop exposures are carefully cleaned and intervals to be sampled are measured, numbered with paint, and marked with an aluminium tag. Road cut samples are collected as continuous channels and/or as representative chips, carefully collected along intervals of 1.5 m or less depending on structural/lithologic breaks. Outcrop samples are collected as random or selective chips or panel samples depending on the exposure. Sample material is placed in plastic bags along with a sample tag, which is numbered and sealed at the site, and then double bagged with the corresponding sample number to prevent tearing and sample loss during transport. Samples are transported to the Company’s field offices and secure storage facilities where the individual sample bags are put into appropriately labeled rice sacks, about 5 to 10 per sack to await transport.
Storage facilities are enclosed and kept under 24 hour security. Samples are picked up at scheduled intervals directly by trucks sent from the two respective contracted analytical laboratories, ALS Chemex and SGS. All descriptive data collected in the field is recorded daily into the company’s database under the supervision and control of a database manager. Hand drawn and digital maps are prepared as a permanent record. Once geochemical assay results are received from the laboratory the assay certificates are digitally merged with the descriptive database and verified by the geologist.
9.1.2 Road Cut Outcrop Mapping and Sampling
Road cuts are outcroppings of rock exposed during road building
activities. Road cut exposures are systematically mapped and cataloged using the
same methodology described in Section 9.1.1. The greatest density of road cuts
from existing and new road building has occurred over map sheets A2 and B2 where
drill density is also greatest. The objective of the road cut mapping and
sampling is to identify new areas of potential mineralization and to refine
structural and lithologic controls to mineralization and new road cuts are
mapped and systematically sampled as they are built. If warranted, newly
identified zones of possible gold mineralization resulting from this program are
then proposed for testing by core drilling. An outcrop sample location map
showing anomalous gold distribution is shown on Figure 9-1.
|
|
68 |
| ANA PAULA PROJECT |
| FORM 43-101F1 TECHNICAL REPORT |

Figure 9-1: Road Cut and Outcrop Sample Map
None of the outcrop and roadcut samples have been used in the resource estimation they are use solely for exploration activity.
9.1.3 Geophysics
In 2012 Newstrike contracted SJS Geophysics Ltd (SJS) of Vancouver, Canada to undertake certain 3 dimensional modelling interpretations using the existing database acquired from Goldcorp to compare it with the results of drilling. The database includes an aeromagnetic and radiometric (K, Th, U) survey by McPHAR Geoservices Inc. of Manila, Philippines that covers a 225 km2 area over the Ana Paula Project area, and an Induced Polarization (3 dimensional) geophysical survey by SJS Geophysics of Vancouver, Canada. Results of this interpretation indicate a strong correlation between mineralization and resistivity and magnetic responses (Figure 9-2).
In 2013, Geotech Ltd of Aurora, Ontario, Canada was contracted to complete a Z-axis tipper electromagnetic (ZTEM) survey of approximately 250 km2 encompassing 1,298 flight line km flown at a line spacing of 200 m. The survey area encompassed the entire Ana Paula Project area and the eastern portion of the surrounding Aurea Norte Property, also owned 100% by Newstrike. The ZTEM survey is recognized for its ability to map resistivity contrasts associated with the structure and alteration typically associated with porphyry-skarn deposits or with structurally controlled epithermal deposits. ZTEM is capable of penetrating to depth that can exceed 1-2 km and is useful in identifying “blind” exploration targets (a buried target that does not outcrop at surface).
The objective of the survey was to locate potentially buried
intrusive bodies associated with the GGB mineralization model and to confirm
controlling structures along the mineralized San Luis Trend. The new anomalies
identified by the ZTEM survey (Figure 9-3) include resistivity contrasts typical
of buried silicified intrusions and with alteration commonly associated with
skarn-porphyry and epithermal style deposits (Legault, 2013).
|
|
69 |
| ANA PAULA PROJECT |
| FORM 43-101F1 TECHNICAL REPORT |
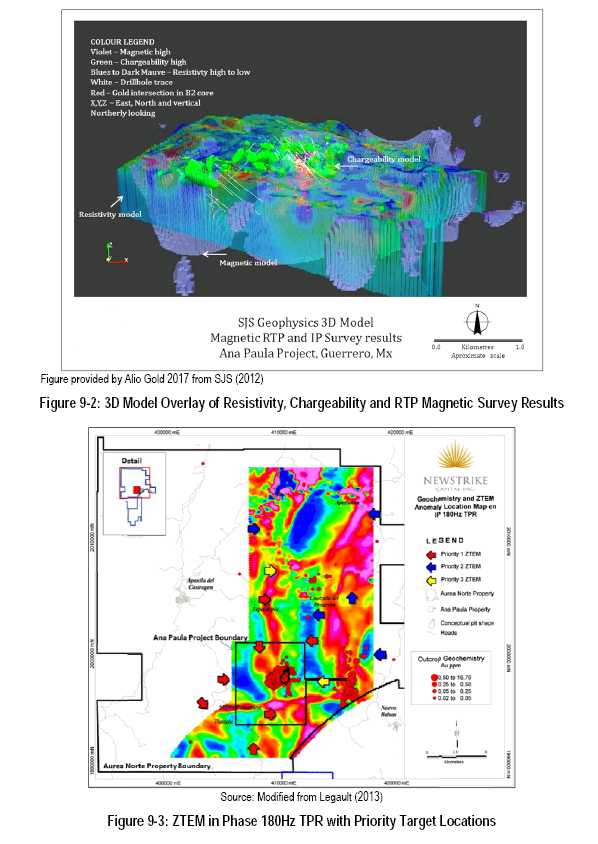
|
|
70 |
| ANA PAULA PROJECT |
| FORM 43-101F1 TECHNICAL REPORT |
9.2 EXPLORATION WORK ALIO GOLD (2015-PRESENT)
Upon acquiring the property in 2015, Alio carried out an extensive review of the data delivered by Newstrike and includes:
-
Field review of the existing geological maps by Alio personnel.
-
Re-logging of 113 drill holes located in the vicinity of pit design area and extending below the pit design. A total of 49,968.89 meters of core was re-logged by Alio to provide detailed information across the entire mineralized system and unified lithological, structural and mineralized criteria with the goal to improve support for the geological model (Figure 9-4 and Figure 9-5).
-
Alio has conducted two drilling campaigns: 2015 drill campaign of 2,008.05 m of core in 10 drill holes which includes 3 twin holes drilled to collected samples for the metallurgical testwork.
-
From October 2016 to February 2017 Alio started the second drilling campaign of 9,663.17 m of in 43 drill holes. This infill drilling program allowed the delineation of the high-grade complex breccia zone and the mineralization halo surrounding the breccia.
-
From March, 2017 to April 2017 Alio Gold completed 5,960 m of reverse circulation condemnation drilling in 20 drill holes at designs plant, waste dumps and tailings areas.
-
From March, 2017 to April 2017 Alio Gold completed 1,895.00 meters of geotechnical drilling was conducted in 6 pit sectors defined by the Knight Piésold using HQ3-size drilling tools.
-
3D geological re-interpretation of Ana Paula deposit was performed by Alio Gold which is the base for the resource model. The wireframes were constructed in LeapFrogTM software using the logged lithologies.
-
In 2016, an assessment of the drill holes geochemical data over the main Ana Paula deposit was performed by Alio personnel to provide detailed geochemical information across the deposit. The geochemistry approach was mainly aimed at investigating the possible stages of mineralization, and the dispersion mineralized halos from the main ore body.
|
|
71 |
| ANA PAULA PROJECT |
| FORM 43-101F1 TECHNICAL REPORT |
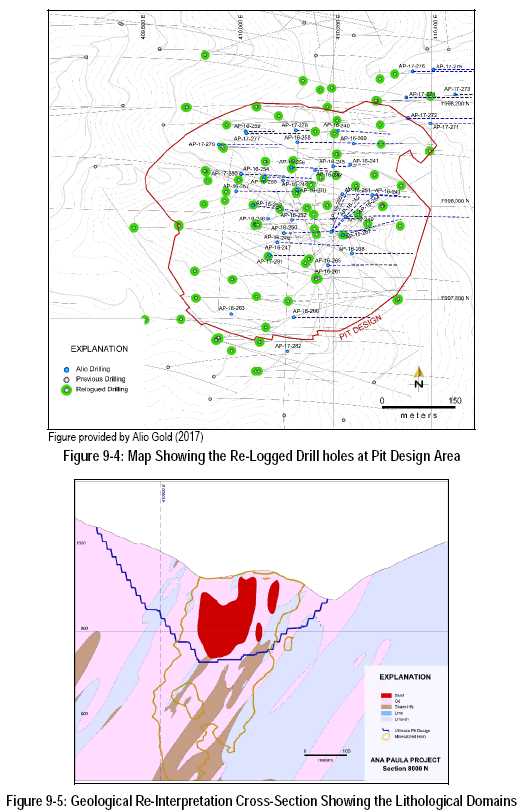
|
|
72 |
| ANA PAULA PROJECT |
| FORM 43-101F1 TECHNICAL REPORT |
9.3 C. GIBSON, P.GEO, PH.D. FIELD INSPECTION AND DATA VALIDATION (SEPTEMBER 2014)
The following is a summary of the data validation carried by Mr. C. Gibson P.Geo, Ph.D. prior to completing the Newstrike 2014 estimate.
At the time, the Ana Paula database was being maintained by Newstrike in a set of Excel spreadsheets which was regularly updated as new information became available. It is reported that Newstrike forwarded its master assay file to Independent Mining Consultants (IMC) for use. IMC reportedly does internal checks on the database as it converts it into the IMC software. As part of the data validation, IMC reviewed 11 percent of the drill holes in the Ana Paula database against the assay certificates. This represented about 13 percent of the assayed intervals and at that time it was found that the data in the database was the same as the data on the assay certificates. IMC also reviewed the results of assays for standard and check samples and found them to be within acceptable industry standards.
9.3.1 Assays Certificate Check
For the 2016 PEA study, 25 drill holes were selected from the Ana Paula database for certificate checks covering holes that were drilled from 2005 through to 2013. This sub-set of the database was analyzed by three different laboratories, namely ALS Chemex, SGS, and ACME. The data was sorted by the laboratories and results of the comparison between the certificate value and the database value indicated the following:
-
There was no error for gold, silver, copper, and zinc for samples analyzed at ALS Chemex. It was noted that over limits for arsenic and lead were obtained from Inspectorate Laboratories.
-
For assays analyzed at the SGS laboratory, IMC noted that detection limit values for silver were truncated to 0.2 (silver detection limit is 0.5, ½ of this value is 0.25). As with the ALS Chemex comparison, some values for arsenic and lead have been set to the Inspectorate lab value. Silver assays showed a few minor errors (< 0.35% of the data reviewed) related to selecting the values from the less precise analytical method. No other errors existed in the data reviewed.
-
One drill hole had Acme listed as its primary lab. Gold was assayed by Acme using two different methods (G6-50 – fire Assay/AAS with over-limits method G6Gr-50 – fire assay/gravimetric and 1F30 fire assay/ICP- ES). During the review of the assays, it was found that the database contained the value of the assay method which had the greatest gold value instead of using the value from the best analytical method.
9.3.2 QA/QC Verification
During the Newstrike drill campaign, control samples consisting of standard pulps and blanks were inserted into the drill sample stream every 20th sample. The control samples were numbered consecutively and generally consisted of alternating four standards and blanks. The data provided to IMC consisted of 4,725 sample analyses of the fourteen standards that were used during the Newstrike drilling program (holes AP-10-12 through AP-13-230), representing the insertion of a standard into the sample stream approximately once every 24th sample.
Result of the analysis indicated the following:
-
Gold compared within 5% in all cases except for Acme on 3 of the standards (AP-03, AP-06, and AP-07). These three Acme comparisons totaled 20 samples thus representing 0.6% of the total checks on standards.
-
The silver comparisons however, were within 5% in only 17 of the 30 cases listed. It was noted by IMC that silver is not a large contributor to the overall project economics.
|
|
73 |
| ANA PAULA PROJECT |
| FORM 43-101F1 TECHNICAL REPORT |
For blanks, the data provided consisted of 1,108 sample analyses of blank material during the Newstrike drilling program, representing the insertion of a blank into the sample stream approximately once every 70th sample. At the time, the protocol for blank insertion included alternating blanks and standards every 20th sample, as well as insertion of a blank within or immediately after mineralized zones. Blank material consisted of ½ or ¼ core duplicates originating in zone(s) previously assayed as near or below detection limit. There were numerous failures for gold and silver that were related to the type of material used for the blanks. At the time, Newstrike preferred to use this material as a ‘blank’ so that it had an appearance similar to the other material being assayed. Unfortunately, the material often returned values greater than a true blank, due to the grade variability of the deposit.
For ¼ core duplicate, the data provided to IMC consisted of 1,214 sample analyses of duplicate samples prepared by ALS Chemex and SGS representing one duplicate assay approximately every 20th sample. IMC found that the level of scatter on XY plots of duplicate versus original assays, was large and IMC concluded that it would be doubtful that a bias would be detectable even if one were present.
Newstrike conducted a check assay program consisting of re-submitting pulps and rejects. A total of 2,642 assays originally analyzed at ALS Chemex, were re-submitted to ALS Chemex (65%), SGS (12%), Acme (4%), and inspectorate (29%). Additionally, a total of 1,608 assays originally analyzed at SGS samples were re-submitted to SGS (68%) and ALS Chemex (33%). At the time, IMC considered a check/original mean grade comparison within 5% or less to be acceptable; all the comparisons met this criterion except for ALS vs ALS rejects. IMC noted that the check assays run on rejects acted as an independent check on the primary lab's sample preparation procedures of generating a well homogenized sample, as well as its analytical procedures.
9.3.3 Goldcorp Holes (2005)
Since no QA/QC data was available for these earlier holes, IMC compared 5 m composites of gold and silver grades in the Gold Corp. holes versus 5 m composites in adjacent Newstrike holes with a separation distance of less that 30 m. The resulting data was compared on probability plots and IMC concluded that the grade distribution showed no evidence of systematic bias.
9.3.4 Conclusions and Recommendations (IMC/Gibson September 2014)
IMC concluded that the gold and silver assays in the data base supplied, meet criteria for use in developing a NI 43-101 compliant resource estimate in support of the initial 2016 PEA study by JDS. IMC noted however, that no check assay was available for several holes. Samples from Goldcorp holes AP-05-01 through 11 were assayed by ALS Chemex and IMC considered these assays were compliant but recommended to confirm by running additional check assays.
The blank material used by Newstrike, was found not to be entirely blank, and IMC recommended efforts should be made to ensure the material is as barren as possible.
The basic purpose of duplicate assays is to demonstrate that core-splitting procedures are not biasing first split grades relative to second-split grades. Because of high levels of scatter, IMC concluded the duplicate samples were not capable of detecting such biases and therefore recommend the program be discontinued.
It was also recommended that check assays be conducted on fresh pulps prepared by the Umpire Laboratory from rejects in order to validate both the primary lab's sample preparation and the analytical procedures. Submission of blanks or standards along with the check assay samples was deemed not necessary. Mr. Gibson recommended the following sample submission guidelines:
- one standard every 20th sample alternating with blanks
|
|
74 |
| ANA PAULA PROJECT |
| FORM 43-101F1 TECHNICAL REPORT |
-
additional blanks inserted after or within visibly mineralized intervals
-
one check assay every 20th sample on new pulp material
Lastly, it was recommended that drill holes that have been
assayed by Acme Laboratory should have the gold values set to the G6-50 assay
value, except when an overage occurs (au value > 10), then the gold value
should be set to the G6Gr-50 value, if it exists.
|
|
75 |
| ANA PAULA PROJECT |
| FORM 43-101F1 TECHNICAL REPORT |
10 DRILLING
10.1 DRILL SUMMARY
The updated database that forms the basis of this resource estimate includes 128,570 total meters in 285 diamond drill holes aggregating results from 93,564 sample intervals with an average length of 1.4 m. Virtually all samples were assayed for gold and silver. This includes drillholes from Goldcorp, Newstrike and Alio Gold (Timmins Gold) (Table 10-1).
Table 10-1: Drill Hole Summary by Year and Company
| Year | Company | Number of holes | Total length |
| 2005 | Goldcorp | 11 | 3,689 |
| 2010 | Newstrike | 12 | 5,227 |
| 2011 | Newstrike | 57 | 29,697 |
| 2012 | Newstrike | 72 | 41,260 |
| 2013 | Newstrike | 78 | 33,925 |
| 2014 | Newstrike | 2 | 1,518 |
| 2015 | Alio | 10 | 2,008 |
| 2016 | Alio | 31 | 7,304 |
| 2017 | Alio | 12 | 2,539 |
The average drill hole spacing is approximately 50 m in the main part of the Ana Paula deposit, with a range of from 20-50 m in the high-grade Breccia Zone and 50-150 m to the north and south pit extremities
10.2 DRILL METHODOLOGY
The Company’s drilling and sampling program were planned and executed by experienced professionals under the supervision of a qualified person as defined by NI43-101. Drill hole nomenclature was originally designed by Goldcorp and has continued in the same fashion consecutively between subsequent operators. Hole naming uses a AP prefix which refers to the Ana Paula Project followed by two digits for the year and two or more digits for the consecutive drill hole number. For example, AP-05-11, indicates that it was drilled in 2005, and would have been the 11th hole drilled on the project; AP-10-12, was drilled in 2010, and would have been the 12th hole drilled on the project. All core is store at the core logging facility along with pulps and coarse laboratory rejects. The facility is locked and monitored 24-7 by security guard.
Goldcorp and Newstrike (2005-2015)
The drill holes were collared with HQ diameter core rods with a 77.8 mm inner diameter, reducing to NQ diameter core rods, a 60.3 mm inner diameter, only if downhole conditions warrant.
After the core was pulled from the drill rod, it was boxed and
transported via flatbed truck to a secure core logging facility. Top boxes were
secured with strong rubber retention straps to prevent spillage. At the logging
facility, the core was geologically described, and recovery (percentage), and
rock quality designation (RQD) were recorded. Geologic logging was conducted at
a graphical scale of 1:100. The core was then marked for sampling with wax
crayons and sample characteristics (lithology, alteration, structures,
mineralization, gangue, etc.) were coded for later digital compilation. Samples
were marked during the core logging procedure and sample divisions were based on
geologic features. Within homogeneous zones, samples were divided into
relatively equivalent lengths of 1 to 2 m, with 0.5 m samples taken when
mineralization characteristics warranted. Insertion of quality control samples
was also planned at this stage.
|
|
76 |
| ANA PAULA PROJECT |
| FORM 43-101F1 TECHNICAL REPORT |
Alio Gold (2015 – Present)
Prior to initiating a drill campaign at Ana Paula, an audit of historic drill results was completed by Newstrike in 2010 on all drill and surface data collected prior to 2010 by Goldcorp. The audit included statistically proportional re-sampling of selected pulps, rejects, ¼ core splits and in some cases ½ core splits, to verify Goldcorp’s reported drill results and for QA/QC purposes to serve as check assays on Goldcorp’s drill results.
All drillholes are planned and sited based on cross section and plan projections using a UTM based local grid system with east trending grid lines stepping out every 50 m to 100 m to the north as shown on Figure 10-1, Figure 10-2, Figure 10-3 and Figure 10-4. The final drill site is adjusted in the field depending on topography or local conditions and paint is used to mark the specific collar location in the field. Each drill hole is assigned a specific sequential number and the location is marked with an azimuth, and length. Following completion of the drill hole, the final drill hole location is recorded in the field using a Trimble GPS R6 Model 1 noting UTM location co-ordinates as northerly, eastwardly, and elevation.
The drilling programs were carried out using drill contractor AP Explore Drilling for infill drilling and Globexplore for condemnation drilling. All drilling was supervised by Alio Gold Technical staff and general industry standards in all matters were followed.
Drill holes are mostly inclined east at angles of 45º or 60º varying to 90º (vertical). All drilling was completed with HQ (63.5/96.9 mm) diameter diamond core drill core rods, reducing to NQ (45.0/75.7mm) diameter core barrels if needed. Deeper drill holes (greater than 1,000 m) used PQ (85.0/122.6 mm) diameter core rods reducing to HQ or NQ diameter as necessary. Core rod dimensions given include inner and outer rod diameters in mm. Core recovery averages 97%. Ground conditions in general are very good and few holes were lost or reduced due to poor ground conditions.
Down hole inclination and azimuth are recorded every 50 m with a REFLEX EZ-shot that also includes temperature and magnetic measurements. A geologist supervises the drilling operation, completing a “quick log”, including visible mineralized zones, structures, and lithology units. A geologist is always present at the planned completion of the drill hole to avoid terminating the hole in a mineralized interval. Drill core is boxed and secured before it is transported at the end of each 12-hour drill shift to the Company’s secure core logging facility for processing by personnel of the Company or their contractors.
10.3 TRUE WIDTH
True thickness is defined as the distance measured
perpendicular to the upper and lower contact of a tabular unit. Outside the
complex breccia and surrounding halo, the true thickness can be calculated by
using a predominant strike of 000 degree and a westerly dip -60 degree. Table
10-2 shows the adjustment factor that can be applied to the interval length to
estimate the true width of the intersection.
|
|
77 |
| ANA PAULA PROJECT |
| FORM 43-101F1 TECHNICAL REPORT |
Table 10-2: True Width Factor for Holes Not Targeting the Mineralized Halo
| Drill Collar Azimuth Range |
Drill Angle Range |
Nb of Holes in the Azimuth and Dip Range |
Percent of Total Number of Holes |
True Width Adjustment
Factor |
| North Az. (300 – 359 and 000 - 045) |
>= -45 to < -60 | 12 | 4.2% | 0.37 |
| >= -60 to < -80 | 9 | 3.2% | 0.41 | |
| >= -80 | 40 | 14.0% | 0.50 | |
| East Az. (045- 120) |
>= -45 to < -60 | 107 | 37.5% | 0.95 |
| >= -60 to < -80 | 78 | 27.4% | 0.80 | |
| >= -80 | 10 | 3.5% | 0.61 | |
| South Az (120- 210) |
>= -45 to < -60 | 7 | 2.5% | 0.56 |
| >= -60 to < -80 | 3 | 1.1% | 0.65 | |
| West Az (210- 300) |
>= -45 to < -60 | 11 | 3.9% | 0.22 |
| >= -60 to < -80 | 7 | 2.5% | 0.15 | |
| >= -80 | 1 | 0.4% | 0.34 |
Alio Gold’s preferred drill angle is due east between -45 to -80 dip and are designed to cut approximately perpendicular to stratigraphy, which yield a true width adjustment factor of 0.80 to 0.95 (80% to 95% of the interval length is true width). Unfortunately, for the complex breccia/surrounding halo mineralization and the monolithic breccia, the calculation of a true width is inappropriate since these units are not tabular. Therefore, the true width adjustment factor in Table 10-2 is valid only for drill holes outside the complex breccia/mineralized halo and outside the monolithic breccia.
In the Alio Gold database, several holes targeting the complex breccia and halo mineralization were collared outside the halo and were oriented to target the center of the complex breccia plug. Due to the steeply dipping plug, the holes are generally considered to be drill “down the plunge” of the mineralization. Consequently, the mineralized interval length tends to be long and the QP cautions the reader that these intersects are reflective of the overall vertical extent of the complex breccia and halo mineralization which have a limited horizontal span of 230 m or less.
10.4 DRILL RESULTS
10.4.1 2005 Drilling
In 2005 Goldcorp completed 3,687 m of diamond core drilling in
11 holes focusing on the San Jeronimo target which lies within the Ana Paula
area. These drill holes remain relevant to the resource estimate described in
Section 14 of this report and therefore are considered current by the QP. Drill
holes varied from 184.25 m to 520.25 m in depth; In total 2,854 core samples
were submitted for analysis. All drill holes intercepted frequently tightly
folded, thick, sedimentary sequences invaded by intrusive sills and sill-like
bodies. Significant intervals with weighted averages greater than 1.0 g/t gold
over downhole intervals of 5.0 m or greater (> 1.0 g/t Au and >5.0 m) are
summarized in Table 10-3 below.
|
|
78 |
| ANA PAULA PROJECT |
| FORM 43-101F1 TECHNICAL REPORT |
Table 10-3: Selected Drill Intersections for 2005 Goldcorp Diamond Drill holes
| Drillhole | Depth (m) | Angle | Az | Mineral Drill Intersections | |||
| From | To | Interval (m) | Au g/t | ||||
| AP-05-01 | 252.1 | -48 | 90 | 62.35 | 75.65 | 13.3 | 2.049 |
| AP-05-02 | 300.76 | -65 | 90 | 91 | 104.1 | 13.1 | 1.195 |
| AP-05-03 | 398.5 | -65 | 90 | 20.25 | 29.15 | 8.9 | 1.244 |
| AP-05-05 | 413.3 | -65 | 305 | 41.7 | 49.9 | 8.2 | 1.489 |
| 62.4 | 73.5 | 11.1 | 5.55 | ||||
| 120 | 128.55 | 8.55 | 1.336 | ||||
| 136 | 141.12 | 5.12 | 1.56 | ||||
| 197.45 | 203.25 | 5.8 | 4.358 | ||||
| 230.25 | 211.9 | 8.65 | 1.223 | ||||
| AP-05-09 | 327.85 | -65 | 90 | 250.5 | 277.1 | 26.6 | 1.175 |
Source: Alio Gold (2017)
10.4.2 2010-2013 Drilling
Newstrike commenced drilling on October 15, 2010 and discovery hole AP-10-19 was drilled in December of the same year, with assay results announced by Company press release on January 18, 2011. This led to an expanded drill campaign that resulted in publication of the Company’s initial resource estimate on March 27, 2013 The mineral resource estimate has an effective date of February 26, 2013 and is titled “Ana Paula Project - Technical Report and Initial Resource Estimate, Municipalities of Cuetzala Del Progreso and Apaxtla del Castregon, Guerrero State, Mexico”.
Table 10-4, which provides a selection of the best calculated
grade-width intersections showing all drill core assay results with greater than
50 gram-meters gold, defined as the weighted gold grade intersection in grams
per tonne multiplied by the downhole length of the same intersection and whose
sum is equal to, or greater than, 50. Intersections may include barren internal
intervals and are reported according to protocol. Holes targeting the
mineralized halo and complex breccia are appropriately identified in the table.
|
|
79 |
| ANA PAULA PROJECT |
| FORM 43-101F1 TECHNICAL REPORT |
Table 10-4: Selected Drill Intersections for AP-12-131 through AP-13-232, Ana Paula Project
| Drillhole | Depth (m) | Angle | Az | Section Line |
Mineral Drill Intersections | ||||
| From | To | Interval (m) | Au g/t | Ag g/t | |||||
| AP-12-137 (HALO) | 427.05 | -60 | 330 | 7850 | 224.4 | 368.18 | 143.78 | 2.57 | 2.8 |
| includes | 320.6 | 368.18 | 47.58 | 5.45 | 4.1 | ||||
| and | 322.14 | 342.26 | 20.12 | 11 | 5.5 | ||||
| AP-13-162 (HALO) | 1407.9 | -77 | 161 | 8050 | 3.85 | 217.3 | 213.45 | 3.45 | 6.9 |
| includes | 23 | 171 | 148 | 4.67 | 7 | ||||
| and | 123 | 143 | 20 | 16.92 | 7.6 | ||||
| 243.82 | 285.75 | 41.93 | 2.54 | 2.7 | |||||
| includes | 249.43 | 281.54 | 32.11 | 3.21 | 3.4 | ||||
| 417.35 | 550.22 | 132.87 | 1.5 | 1.1 | |||||
| includes | 418.32 | 505.4 | 87.08 | 2.08 | 1.4 | ||||
| and | 479.4 | 502.82 | 23.42 | 4.15 | 2.6 | ||||
| and | 479.4 | 485.2 | 5.8 | 11.14 | 3.8 | ||||
| 621.8 | 713.1 | 91.3 | 0.74 | 1.6 | |||||
| AP-13-170 | 686.5 | -45 | 80 | 7400 | 378.94 | 430 | 51.06 | 1 | 2.6 |
| AP-13-174 | 525.45 | -90 | 0 | 8250 | 305.79 | 341.45 | 35.66 | 1.44 | 1.1 |
| AP-13-185 | 415.6 | -65 | 87 | 8200 | 414.2 | 415.6 | 1.4 | 46 | 10.4 |
| AP-13-186 (HALO) | 296.95 | -90 | 0 | 8200 | 0 | 64.4 | 64.4 | 4.32 | 5 |
| includes | 8.99 | 20.06 | 11.07 | 12.4 | 6.8 | ||||
| and | 12.06 | 13.14 | 1.08 | 52.8 | 19.1 | ||||
| AP-13-188 (HALO) | 1049.35 | -70 | 288 | 7800 | 107.5 | 155 | 47.5 | 1.39 | 12.7 |
| 162.26 | 183.05 | 20.79 | 2.85 | 13.1 | |||||
| includes | 164.23 | 174 | 9.77 | 5.42 | 24.3 | ||||
| AP-13-190 (HALO) | 87.5 | -90 | 0 | 8000 | 25.4 | 87.5 | 62.1 | 3.13 | 5.2 |
| includes | 73.83 | 87.5 | 13.67 | 6.82 | 5.9 | ||||
| AP-13-192 (HALO) | 354.55 | 90 | 0 | 8050 | 134.74 | 158.38 | 23.64 | 2.25 | 6.6 |
| AP-13-193 | 460.4 | -80 | 270 | 8150 | 403.15 | 458.5 | 55.35 | 1.24 | 2.9 |
| includes | 428.69 | 432.5 | 3.81 | 0.12 | 0.7 | ||||
| AP-13-211 | 208.4 | -60 | 90 | 8200 | 7 | 42.5 | 35.5 | 1.72 | 9.4 |
| includes | 9.8 | 19.85 | 10.05 | 5.06 | 18.6 | ||||
| AP-13-213 | 416.35 | -50 | 90 | 7750 | 5.35 | 109.2 | 103.85 | 0.78 | 4.8 |
| AP-13-215 (HALO) | 990.15 | -50 | 0 | 7450 | 574.1 | 598.6 | 24.5 | 2.15 | 3.2 |
| 675.75 | 747.94 | 72.19 | 3.92 | 5.9 | |||||
| includes | 677.1 | 716.49 | 39.39 | 6.42 | 9.7 | ||||
| and | 680.4 | 681.82 | 1.42 | 43.82 | 35.4 | ||||
| AP-13-219 (HALO) | 519.65 | -70 | 90 | 7850 | 316 | 342.57 | 26.57 | 1.98 | 3.7 |
| includes | 325.15 | 327.37 | 2.22 | 0.09 | 1.9 | ||||
| and | 328.48 | 330.73 | 2.25 | 0.14 | 2.2 | ||||
| AP-13-229 (HALO) | 415.85 | -90 | 0 | 7950 | 263 | 303.24 | 40.24 | 1.92 | 2.8 |
| includes | 266.88 | 295.4 | 28.52 | 2.45 | 0.1 | ||||
Source: Alio Gold (2017)
The reported mineralized intervals in core tend to be separated
by barren intervals that may or may not contain narrow anomalous sections and
local high-grade spikes that are not included in the calculations of mineralized
intervals. Unless specified otherwise, reported intersections are calculated
according to an established written protocol that uses a 0.20 g/t Au cut off for
bounding and internal assays. Reported grade intervals are based on the original
uncut assay certificates as received from the assay labs.
|
|
80 |
| ANA PAULA PROJECT |
| FORM 43-101F1 TECHNICAL REPORT |
10.4.3 2015 Drilling
In 2015, shortly after acquiring the Ana Paula project, Alio Gold carried out confirmation drilling (to verify results of previous programs) and infill drilling. As part of the verification process, Alio Gold twinned three existing core holes. Half of the length of the core was sent for analyses and assays verification and the other half length of the core was archived for metallurgical testing. These three twin holes totalling 606 m were drilled at the center of the Ana Paula deposit, and were representative of the life-of-mine plan as described in the 2014 Preliminary Economic Assessment (years1 to 8).
Hole APM-15-01 twinned hole AP-12-101, hole APM-15-02 twinned hole AP-10-19 and hole APM-15-03 twinned hole AP-11-37. Results from this limited twinned drill hole program indicated that the twinned hole replicated the grade seen in the original hole reasonably well.
Approximately 1,403 m of infill drilling was conducted in seven holes at the Ana Paula deposit with the goal of upgrading Inferred resources to Indicated (and Indicated to Measured), and to confirm the approximate dimensions of the high-grade breccia zone. Figure 10-1 shows the significant gold intercepts from both the twin and infill drilling, above an internal cut-off grade of 0.63 g/t Au.
All drilling was completed with HQ (63.5/96.9 mm) diameter diamond core drill core rods. Core recovery averaged plus 95%. Ground conditions in general are very good to excellent, collars are surveyed using GPS Trimble R6 Model 1. To note, the inclination of the hole AP-15-237 was changed 25° azimuth with objectives to test the true thickness of the complex breccia.
![]()
Figure 10-1: Ana Paula Plan View showing the 2015 Drill Program
|
|
81 |
| ANA PAULA PROJECT |
| FORM 43-101F1 TECHNICAL REPORT |
Table 10-5: Significant Mineral Interceptions of the Core Drilling Program Ana Paula, 2015
| Drill Hole Number | Depth (m) |
Angle | Az | Section Line |
Mineral Drill Interceptions | ||||
| From (m) |
To (m) | Width (m) |
Au g/t | Ag g/t |
|||||
| AP-15-233 (HALO) | 150.00 | -70° | 90° | 8050 | 13.40 | 62.50 | 49.10 | 3.293 | 4.2 |
| And | 76.00 | 98.50 | 22.50 | 0.920 | 1.2 | ||||
| And | 106.65 | 107.65 | 1.00 | 3.360 | 16.3 | ||||
| AP-15-234 | 121.25 | -90° | 70° | 8000 | 80.00 | 86.00 | 6.00 | 0.6645 | 22.7 |
| AP-15-235 (HALO) | 200.75 | -90° | 70° | 8050 | 11.00 | 21.50 | 10.50 | 0.948 | 5.1 |
| and | 87.00 | 166.40 | 79.40 | 1.248 | 2.5 | ||||
| Includes | 87.00 | 107.00 | 20.00 | 2.473 | 2.7 | ||||
| AP-15-236 (HALO) | 286.15 | -60° | 25° | 7950 | 27.50 | 29.00 | 1.50 | 1.545 | 35.2 |
| And | 52.20 | 53.35 | 1.15 | 3.500 | 11.9 | ||||
| And | 80.25 | 202.50 | 122.25 | 4.452 | 10.1 | ||||
| And | 214.50 | 237.00 | 22.50 | 1.486 | 8.6 | ||||
| And | 255.00 | 284.00 | 29.00 | 2.864 | 6.9 | ||||
| AP-15-237 (HALO) | 252.10 | -70° | 70° | 7950 | 14.50 | 16.30 | 1.80 | 0.734 | 14.3 |
| And | 35.00 | 36.50 | 1.50 | 2.540 | 50.7 | ||||
| And | 50.00 | 108.50 | 58.50 | 1.963 | 16.5 | ||||
| And | 143.00 | 250.00 | 107.00 | 1.977 | 5.6 | ||||
| AP-15-238 | 151.85 | -90° | 0° | 7950 | 33.00 | 35.00 | 2.00 | 6.570 | 289.0 |
| And | 53.00 | 59.00 | 6.00 | 0.981 | 2.0 | ||||
| And | 74.00 | 95.00 | 21.00 | 1.107 | 2.1 | ||||
| And | 134.50 | 136.00 | 1.50 | 1.045 | 2.2 | ||||
| And | 142.00 | 143.50 | 1.50 | 3.250 | 8.4 | ||||
| AP-15-239 (HALO) | 240.40 | -70° | 90° | 8000 | 34.50 | 157.50 | 123.00 | 5.337 | 11.1 |
| And | 178.00 | 227.50 | 49.50 | 1.340 | 4.8 | ||||
10.4.4 2016-2017 Drilling
The 2016-17 drilling was a major program with three main components: (1) Infill Drilling (2) Geotechnical Drilling, and (3) Condemnation Drilling.
Infill Drilling
Infill drilling was carried out to support an updated, significantly more robust, resource estimate for the planned pre-feasibility study subject of this report. The infill drilling program significantly increased the delineation of the high-grade breccia zone and the surrounding mineralization halo. Approximately 9,663 m of infill drilling was completed in 37 holes at the Ana Paula deposit with the goal of upgrading the classification model, and to confirm and refine the dimensions and location of the high-grade breccia zone.
Table 10-6 shows the significant gold intercepts from both the
twin and infill drilling, above an internal cut-off grade of 0.63 g/t Au and
using a pit shell gold price of US$1,200 ounce.
|
|
82 |
| ANA PAULA PROJECT |
| FORM 43-101F1 TECHNICAL REPORT |
Table 10-6: Significant Mineral Interceptions of the Core Drill Program Ana Paula, 2016-2017
| Drill Hole Number | Depth (m) |
Angle | Az | Section Line |
Mineral Drill Interceptions | |||
| From (m) | To (m) | Width (m) | Au g/t | |||||
| AP-16-243 (HALO) | 133.00 | -55 | 90 | 8025 N | 0.00 | 33.20 | 33.20 | 1.225 |
| 47.50 | 74.55 | 27.05 | 1.866 | |||||
| AP-16-244 (HALO) | 202.65 | -70 | 90 | 8050 N | 61.60 | 85.00 | 23.40 | 1.069 |
| 118.00 | 144.95 | 26.95 | 1.157 | |||||
| 154.50 | 201.00 | 46.50 | 2.760 | |||||
| AP-16-246 (HALO) | 374.75 | -90 | 0 | 7975 N | 104.55 | 143.10 | 38.55 | 5.190 |
| 161.10 | 183.10 | 22.00 | 2.211 | |||||
| 238.84 | 256.50 | 17.66 | 0.789 | |||||
| 364.60 | 373.60 | 9.00 | 0.744 | |||||
| AP-16-247 (HALO) | 276.90 | -90 | 0 | 7925 N | 63.00 | 66.00 | 3.00 | 4.533 |
| 123.45 | 127.40 | 3.95 | 3.930 | |||||
| 135.40 | 149.40 | 14.00 | 1.255 | |||||
| 165.40 | 231.40 | 66.00 | 1.320 | |||||
| 241.40 | 251.65 | 10.25 | 1.505 | |||||
| 263.50 | 274.15 | 10.65 | 0.896 | |||||
| AP-16-249 (HALO) | 350.00 | -45 | 90 | 7975 N | 22.30 | 27.00 | 4.70 | 1.381 |
| 56.30 | 96.15 | 39.85 | 2.722 | |||||
| 157.40 | 166.70 | 9.30 | 4.195 | |||||
| AP-16-250 (HALO) | 302.00 | -50 | 90 | 7950 N | 48.17 | 53.30 | 5.13 | 2.182 |
| 74.95 | 81.10 | 6.15 | 2.905 | |||||
| 109.10 | 131.95 | 22.85 | 1.490 | |||||
| 151.90 | 183.30 | 31.40 | 1.180 | |||||
| 209.95 | 250.80 | 40.85 | 4.083 | |||||
| 269.70 | 300.55 | 30.85 | 2.230 | |||||
| AP-16-251 (HALO) | 193.40 | -55 | 90 | 8025 N | 2.00 | 79.00 | 77.00 | 2.680 |
| 139.60 | 162.00 | 22.40 | 0.806 | |||||
| AP-16-252 (HALO) | 285.20 | -50 | 90 | 7975 N | 53.50 | 61.00 | 7.50 | 1.959 |
| 69.00 | 75.00 | 6.00 | 0.750 | |||||
| 87.00 | 89.00 | 2.00 | 16.350 | |||||
| 97.00 | 128.40 | 31.40 | 2.376 | |||||
| 135.65 | 184.05 | 48.40 | 12.156 | |||||
| 216.84 | 225.24 | 8.40 | 1.793 | |||||
| 250.87 | 272.10 | 21.23 | 1.843 | |||||
| AP-16-253 (HALO) | 261.60 | -70 | 95 | 8000 N | 4.15 | 28.32 | 24.17 | 0.601 |
| 105.00 | 256.07 | 151.07 | 8.089 | |||||
| Including | ||||||||
| 156.00 | 233.10 | 77.10 | 15.149 | |||||
| AP-16-255 (HALO) | 281.30 | -70 | 90 | 8050 N | 87.60 | 195.60 | 108.00 | 1.153 |
| 217.30 | 220.30 | 3.00 | 2.353 | |||||
| 243.30 | 252.30 | 9.00 | 1.820 | |||||
| AP-16-257 (HALO) | 236.20 | -60 | 90 | 8025 N | 116.95 | 131.25 | 14.30 | 5.413 |
| 150.00 | 236.20 | 86.20 | 2.214 | |||||
| AP-16-259 | 182.50 | -70 | 90 | 8150 N | 124.50 | 179.70 | 55.20 | 1.110 |
| AP-16-260 (HALO) | 200.90 | -60 | 20 | 7950 N | 19.00 | 30.00 | 11.00 | 0.656 |
| 94.50 | 197.00 | 102.50 | 3.803 | |||||
| Including | ||||||||
| 123.00 | 164.00 | 41.00 | 8.091 | |||||
| AP-16-262 (HALO) | 252.10 | -70 | 45 | 7950 N | 70.80 | 86.80 | 16.00 | 1.019 |
| 124.52 | 156.00 | 31.48 | 3.365 | |||||
| Including | ||||||||
| 147.63 | 156.00 | 8.37 | 9.680 | |||||
| 166.00 | 170.00 | 4.00 | 2.805 | |||||
| 183.03 | 219.85 | 36.82 | 7.323 | |||||
| Including | ||||||||
| 183.03 | 201.77 | 18.74 | 13.622 | |||||
| AP-16-264 (HALO) | 256.30 | -60 | 50 | 7950 N | 90.60 | 93.30 | 2.70 | 2.880 |
|
|
83 |
| ANA PAULA PROJECT |
| FORM 43-101F1 TECHNICAL REPORT |
| Drill Hole Number | Depth (m) |
Angle | Az | Section Line |
Mineral Drill Interceptions | |||
| From (m) | To (m) | Width (m) | Au g/t | |||||
| 110.20 | 139.05 | 28.85 | 11.591 | |||||
| Including | ||||||||
| 110.20 | 122.00 | 11.80 | 26.508 | |||||
| 149.00 | 188.00 | 39.00 | 2.478 | |||||
| 233.50 | 241.50 | 8.00 | 0.875 | |||||
| AP-16-270 (HALO) | 222.60 | -70 | 90 | 8025 N | 4.00 | 41.60 | 37.60 | 3.874 |
| 67.00 | 93.25 | 26.25 | 11.938 | |||||
| Including | ||||||||
| 82.50 | 91.22 | 8.72 | 32.62 | |||||
| 121.20 | 164.00 | 42.80 | 4.78 | |||||
| Including | ||||||||
| 121.20 | 133.40 | 12.20 | 12.44 | |||||
| 203.00 | 213.46 | 10.46 | 1.308 | |||||
| AP-17-278 | 160.7 | -80 | 90 | 8150 N | 75.15 | 96.85 | 21.70 | 2.200 |
| Including | ||||||||
| 93.80 | 94.85 | 1.05 | 12.400 | |||||
| AP-17-280 | 255.4 | -90 | 0 | 8075 N | 226.00 | 255.40 | 29.40 | 0.935 |
| AP-17-281 (HALO) | 210.1 | -70 | 90 | 7700 N | 161.00 | 181.00 | 20.00 | 0.913 |
| AP-17-282 | 102.1 | -90 | 0 | 7900 N | 81.00 | 96.48 | 15.48 | 1.682 |
|
|
84 |
| ANA PAULA PROJECT |
| FORM 43-101F1 TECHNICAL REPORT |
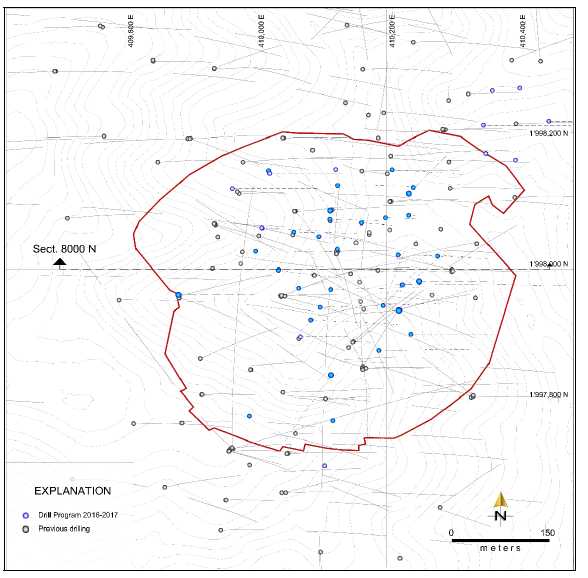
Figure 10-2: Ana Paula Plan View showing the 2016-2017 Drill Program
|
|
85 |
| ANA PAULA PROJECT |
| FORM 43-101F1 TECHNICAL REPORT |
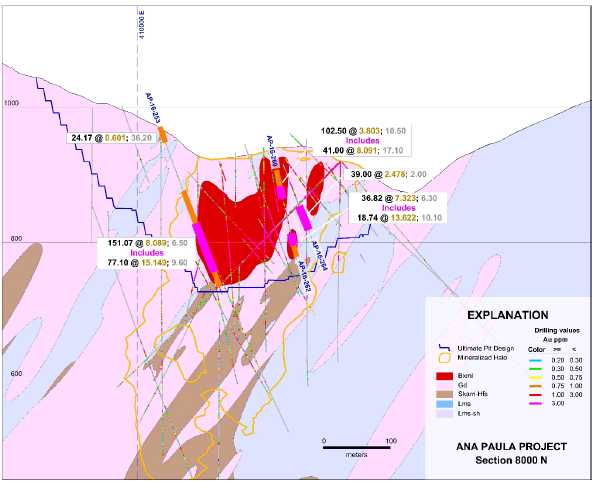
Figure 10-3: Geological Interpretation and Drill Section on Section 8000N
Geotechnical Drilling
Pit slope design analyses were based on field data collected by Knight Piésold personnel. Geotechnical drilling of 1,895 m was conducted in six pit sectors defined by the Knight Piésold. The figure below includes collar locations and horizontal traces of the geotechnical core-holes drilled that were logged and sampled by Knight Piésold personnel. Figure 10-4 shows the location of the geotechnical drilling.
The core-holes logged by Knight Piésold personnel were drilled using HQ3-size drilling tools. A 1.5 m long, triple tube core barrel was used for the intervals drilled using HQ-size drilling. The core oriented tool used for the entire length of the core-hole (every run) was the REFLEX ACT II.
The core had been transported to the core facility from the drilling locations by Knight Piésold personnel. The core was logged at the drill rig before the core was transferred from the split tubes.
The information logged by Knight Piésold personnel included
rock type, alteration type and degree, rock strength, and discontinuity spacing.
The geotechnical data was used by Knight Piésold to facilitate rock mass
characterization in support of the development of a geotechnical model suitable
for a pit slope evaluation.
|
|
86 |
| ANA PAULA PROJECT |
| FORM 43-101F1 TECHNICAL REPORT |
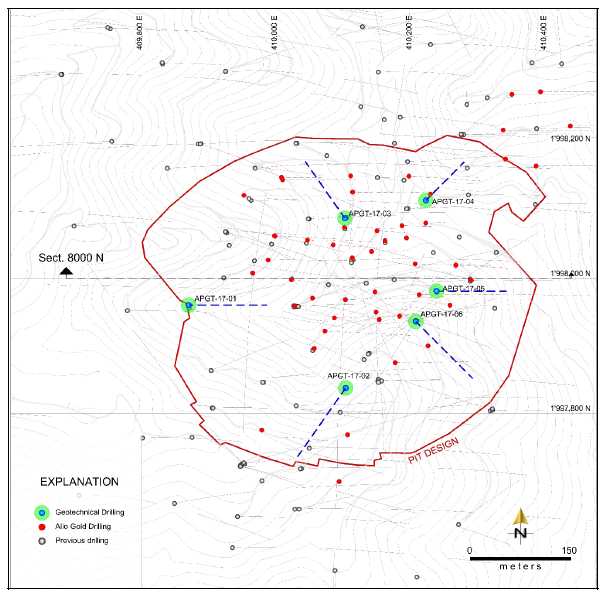
Figure 10-4: Ana Paula Plan View showing the Pit Slopes Geotechnical Drilling
Condemnation Drilling
Approximately 5,060 m of condemnation drilling was conducted in
20 reverse circulation holes (RC) at the Ana Paula Project. Drillholes were
planned using an east-west cross-section set stepping out every 100 m with
collar centers between holes of approximately 150 m. The orientation of the
drilling, primarily inclined to 90° azimuth at angles of 45º to 55° degrees, and
average depths of 250 m, with the objective of intercepting the contact between
the intrusive sill and the sedimentary rocks at approximately 150 m below the
surface. The negative results allowed Alio Gold to construct plant facilities,
tailings dam, and waste dumps in the current layout located in the south east at
the Ana Paula open pit design.
|
|
87 |
| ANA PAULA PROJECT |
| FORM 43-101F1 TECHNICAL REPORT |

Figure 10-5: Ana Paula Plan View showing the Waste, Tailings and Plant Condemnation Drilling
10.5 QUALIFIED PERSON’S COMMENTS
The drill hole orientation was found to be appropriate for the deposit style and the orientation of the mineralization.
Drill spacing in the pit area is less than 25 m and and is deemed sufficient to adequately define the grade of the mineralization and the spatial grade distribution. Outside the pit area and to the north, the spacing increases to 50 m or more, and requires more in-fill. The south west portion of the property could not be estimated because the spacing is currently too wide. This area remains an exploration target for Alio Gold.
Drill core logging is appropriate for the mineralization style
and carried out to industry standards. Drill core handling, surveying, and chain
of custody from the rig to the core logging facility was found to meet or exceed
industry standards.
|
|
88 |
| ANA PAULA PROJECT |
| FORM 43-101F1 TECHNICAL REPORT |
11 SAMPLE PREPARATION, ANALYSES AND SECURITY
11.1 SAMPLING METHODS
11.1.1 Goldcorp and Newstrike (2005-2015)
All core samples marked during the logging procedure and sample divisions were based on geologic features. Within homogeneous zones, samples were divided into relative lengths of 1 to 2 m, with 0.5 m samples taken when mineralization characteristics warranted. Insertion of quality control samples was also planned at this stage.
After logging and sample marking was completed, the core was photographed in grouping of three in the core boxes and then sawed longitudinally in half according to the sample intervals marked by the geologist. A one half split was double bagged in plastic sample bags, and secured with plastic ties. The remaining half core split was retained in the original core box, ordered by drill hole number and stored in the enclosed core facility in metal storage racks.
Quality control samples were inserted into the sample stream, and the samples were bagged in rice sacks labelled with the company name, project name, drill hole number, and sample numbers. A laboratory transmittal sheet was prepared listing the number of bags, and included samples.
ProDeMin geologists, on behalf of Newstrike, were responsible for the collection and preparation of all core prior to pick up. Core was collected directly from the Ana Paula core logging facility, by the analytical laboratory that transported the samples directly to their sample preparation facilities and who were responsible for all subsequent security following collection from site.
11.1.2 Alio Gold (2015-Present)
The sampling methodology is similar for the core processed by Newstrike. All samples collected by Alio staff during drill programs were subjected to a quality control procedure that ensured a best practice in the handling, sampling, analysis and storage of the drill core. All drill cores were sampled and collected on a timely basis. Samples intervals were selected by the field geologist and most typically varied between 1.0 and 2.0 m in length. Sample intervals were not less than 0.50 m on specific, narrow geological features, and not greater than 2.0 m on wide intervals of barren granodiorite and/or limestone-shale.
Samples of drill core were cut by a diamond blade rock saw, with half of the sawn core placed in individual sealed plastic bags with a zip tie with the remaining half placed back in the original core box. Samples were prepared by local contract workers trained and supervised by Alio personnel, at Cuetzala del Progreso. Once logged and split, the core was stored on racks in a secure storage facility in a secure building at the Cuetzala del Progreso.
Condemnation reverse circulation (RC) chip samples were collected, at the drill site and then sealed in plastic bags. The RC drill samples were collected continuously at 1.5 m intervals. The splitter was cleaned between each sample with a compressed air hose. The RC drill samples were taken by Alio personnel with supervision of Alio geologist. From the RC drilling, a portion of the material generated for each sample interval was retained in a plastic specimen tray created specifically for the reverse circulation program. The samples in specimen trays constitute the primary reference for the hole. The specimen tray was marked with the drill hole number and each compartment within the tray was marked with both the interval and number for the respective sequential sample. Tray chip samples are stored at Cuetzala del Progreso in a secure building.
Company geologists and technicians are now responsible for
collection and shipment preparation of the core to the laboratories. Similar to
the Newstrike program, core sample shipment bags are collected directly from the
Ana Paula core logging facility, by the analytical laboratory that transports
the samples directly to their sample preparation facilities and who were
responsible for all subsequent security following collection from site.
|
|
89 |
| ANA PAULA PROJECT |
| FORM 43-101F1 TECHNICAL REPORT |
ALS-Chemex shipped the collected core to their preparation laboratories in Guadalajara, Jalisco, Mexico. After these samples were processed, the pulps were sent to Vancouver, Canada ALS-Chemex Lab for analysis. Rejects and pulps are returned to the project site and stored at the Alio Gold, Cuetzala del Progreso core logging facility. No problem was encountered in transport during the program. Notification of receipt of sample shipments by the laboratory is confirmed by electronic mail.
11.2 ANALYTICAL AND TEST LABORATORIES
11.2.1 Goldcorp and Newstrike (2005-2015)
ALS Global Ltd., through Chemex De Mexico, S.A. De C.V was the primary analytical laboratory for the Ana Paula Project. ACME laboratory at Guadalajara, Mexico was used as a primary laboratory for 11 holes during the 2013 drill campaign. SGS SA, (SGS) was the secondary laboratory for the Ana Paula Project through SGS de México located in Durango, Mexico.
BSI Inspectorate was used for the preparation and/or verification of blanks, standards and for check assay works. All laboratories are internationally recognized and accredited to ISO 17025 or ISO 9001:2008 or better.
11.2.2 Alio Gold (2015 - present)
ALS Global Ltd., through Chemex De Mexico, S.A. De C.V is still the primary analytical laboratory for the Ana Paula Project. Bureau Veritas laboratory, located in Hermosillo, Sonora, Mexico, is now the secondary laboratory for check samples.
11.3 SAMPLE PREPARATION AND ANALYSIS
11.3.1 Goldcorp and Newstrike (2005-2015)
ALS Chemex prepared samples at its lab facility in Guadalajara, Mexico. Individual core samples typically ranged from 4 to 8 kg in weight. The entire sample was crushed to 2 mm size. Approximately a 250 g split is pulverized. Coarse reject is bagged and stored. From Guadalajara, prepared sample pulps were shipped by air to ALS Chemex’s Vancouver laboratory for analysis.
All core samples and geochemical samples were assayed using the multi-element inductively coupled plasma-optical emission spectroscopy (ICP-OES) assay 41-element assay method (ME-ICP41), with gold assayed by fire assay with an AA finish (Au-AA24), using a 50 gram aliquot. Mercury was analyzed separately by (code CV41), since the detection limit in the ICP analysis is too high to be meaningful.
A small proportion of the samples was sent to SGS Laboratory in Durango, Mexico. Individual core samples typically ranged from 4 to 8 kg in weight. The entire sample was crushed to 2 mm size. Approximately a 250 g split is pulverized. Coarse reject is bagged and stored. Samples were analyzed at the SGS Laboratory in Durango.
SGS also employed a fire assay/atomic adsorption spectrophotometry (AAS) determination for gold and an ICP-OES analysis to determine multi-element values. The 50 g aliquots were analyzed by fire assay with an atomic absorption finish (Au-FAA515). Assays grading over 10 g/t were re-assayed by fire assay with a gravimetric finish using a 30g aliquot (Au-FAG303). Samples were also analyzed with an aqua regia digestion and a combination of inductively coupled plasma emission spectrometry (ICP-OES) to provide a multi-element analyses.
A small number of samples were also prepared at ACME at
Guadalajara, Mexico and Inspectorate Laboratory.
|
|
90 |
| ANA PAULA PROJECT |
| FORM 43-101F1 TECHNICAL REPORT |
ACME Laboratory used 50 g aliquots analyzed by fire assay with an atomic absorption finish (G6-50) with samples assaying greater than 10 g/t Au and then re-assayed by fire assay with a gravimetric finish (G6Gr-50).
11.3.2 Alio Gold (2015 - present)
ALS Chemex prepared samples at its facility in Guadalajara, Mexico. Individual core samples typically ranged from 4 to 8 kg in weight, while RC chip samples ranged from 4 kg to 10 kg. The entire sample was crushed to 2 mm size. Approximately a 250 g split is pulverized. Coarse reject is bagged and stored. From Guadalajara, prepared sample pulps were shipped by air to ALS Chemex’s Vancouver laboratory for analysis.
At ALS Chemex, 50 g aliquots were analyzed by fire assay with an atomic absorption finish (Au-AA24) with samples assaying greater than 10 g/t Au, and then re-assayed by fire assay with a gravimetric finish (Au-GRAV22) using a 30g aliquot).. Samples were also analyzed with an aqua regia digestion and a combination of inductively coupled plasma emission spectrometry (ICP-OES) and/or inductively coupled plasma mass spectrometry (ICP-MS) to provide a multi-element analyses. The elements As, Cu, Pb, and Zn were determined by ore grade assay for samples that returned values >10,000 ppm by ICP analysis. Final certificates were issued electronically and delivered to Alio via email. These assay certificates arrived in Excel™ or as comma-separated text (.csv) format and were merged electronically into the database and verified for accuracy. A hard copy of all certified assay certificates was delivered by courier to the company office where they are kept on file for review.
11.4 QUALITY ASSURANCE AND QUALITY CONTROL
11.4.1 Goldcorp and Newstrike (2005-2015)
Quality control samples included standards for gold and other elements and blanks. Standard reference materials (“SRM”) originated from pulps, and are from two sources: (1) commercially prepared and certified samples from CND Laboratory; and (2) those provided by ProDeMin which is a geological services contractor engaged by Newstrike. ProDeMin provided two types of SRM: (1) in-house SRM derived from material obtained in unrelated projects; and (2) in-house SRM made from Ana Paula mineralized rock and analyzed by a number of certified laboratories.
11.4.1.1 Blank
A total of 1,108 blank samples were inserted during the Newstrike drilling program (holes AP-10-12 through AP-13-230), representing the insertion of a blank into the sample stream approximately once every 70th sample. The protocol for blank insertion included alternating blanks and standards every 20th sample, as well as insertion of a blank within or immediately after mineralized zones. The blanks are numbered sequentially, and samples of quartered or half core with low or below detection limit values were used so that the preparation facility could not identify the sample as a blank. For the most current drilling campaign (AP-12-131 to AP-13-230) there were 499 blank samples, which represents the insertion of a blank into the sample stream approximately once every 70th sample. No data were available for Goldcorp holes AP-05-01 through AP-05-11 or for two short Newstrike holes that did not include a blank, AP-13-183, AP-13-189.
Assays on blank samples should ideally return grades at or
below the lower detection limit, but even allowing for outliers (again probably
a result of mislabelling or data entry errors) approximately 35 percent of the
ALS Chemex gold assays, 45 percent of the SGS gold assays and 40 percent of the
Acme gold assays exceed the 0.005 g/t gold detection limit. Results for Silver
indicated the same problem. It was noted that the fact that all three labs, ALS
Chemex, Acme, and SGS show comparable exceedances for gold indicates that the
problem lies with the blank material and not with the assays. The blank sample
material used during the Newstrike campaign originated from from Ana Paula core
material previously assayed as below detection and is not a certified blank
material. This material will return values greater than a true blank due to the
inherent grade variability of the deposit.
|
|
91 |
| ANA PAULA PROJECT |
| FORM 43-101F1 TECHNICAL REPORT |
11.4.1.2 Quarter Core Duplicate
A total of 1,217 assays on duplicate samples prepared by ALS Chemex and SGS from second-split core from holes AP-10-12 through AP-12-81, representing one duplicate assay approximately every 20th sample. No data were available for Goldcorp holes AP-05-01 through AP-05-11 or for Newstrike holes AP-12-82 through AP-13-230.
Result from this program indicated that the mean duplicate gold grade for all samples is 14% higher than the mean original gold grade (0.33 versus 0.38 g/t) and the silver grade is 2% higher (4.0 versus 4.1 g/t). This suggests that the first splits may be biased low relative to the second splits, but assay1>assay2 counts meet criteria for randomness, suggesting that there is no bias between the splits. The level of scatter on XY plots of duplicate versus original assays, however, is large and it is doubtful that a bias would be detectable even if one were present.
11.4.1.3 Standards
During the Newstrike drill campaign, control samples, consisting of standard pulps and blanks, were inserted into the drill sample stream every 20th sample. The control samples were numbered consecutively and generally consisted of alternating 4 standards and blanks. A total of 3,297 assays were run on the fourteen standards that were used during the Newstrike drilling program (holes AP-10-12 through AP-14-232), representing the insertion of a standard into the sample stream approximately once every 24th sample. No data were available for Goldcorp holes AP-05-01 through AP-05-11.
Results of the program indicated that gold compares to within 5% in all cases except for Acme on standards AP-03, AP-06, and AP-07. These three Acme comparisons are a total of 20 samples thus representing 0.6% of the total checks on standards. The silver comparisons, however, are within 5% in only seventeen of the thirty cases listed. Silver is not a large contributor to the overall project economics. The repeatability of standard assays with time was also investigated, Gold remains stable with time and the assays exhibited low scattered. Silver also remains stable with time, but the assays exhibit considerable scatter and are not a good match to the standard mean grades
11.4.1.4 Check Assays from the Umpire Laboratory
A total of 5,707 check assays from holes AP-10-12 through AP-14-232, representing a check assay at an average of approximately once every 14th sample. No check assays were available for the Goldcorp holes AP-05-01 through AP-05-11, although some samples were re-analyzed by Newstrike during its audit program. Check assays were also missing for drill holes AP-11-41, AP-13-162, AP-13-168, AP-13-171, AP-13-172, AP-13-174, AP-13-176, AP-13-177, AP-13-182, AP-13-187, AP-13-189, AP-13-190 and AP-13-221. No check assays were available for the Goldcorp holes AP-05-01 through AP-05-11, although some samples were re-analyzed by Newstrike during its audit program.
Gold and silver check assays were run by ALS Chemex. Inspectorate, and SGS on pulps or rejects supplied by SGS when SGS was the primary laboratory and by SGS, Inspectorate, Acme and ALS Chemex on pulps or rejects supplied by ALS Chemex when ALS Chemex was the primary laboratory, generating ten separate comparisons for gold and eight for silver.
11.4.2 Alio Gold (2015 - present)
Alio Gold routinely insert quality control/quality assurance samples (“QA/QC”) in the sampling chain to monitor cross contamination, precision and repeatability of the assays. QA/QC samples are generally inserted at a rate of 1 sample in 20 approximately for each of the QA/QC sample types amounting to a 5% insertion rate or 10%.
Four types of QA/QC samples are used by Alio Gold.
|
|
92 |
| ANA PAULA PROJECT |
| FORM 43-101F1 TECHNICAL REPORT |
11.4.2.1 Blank
Blanks consist of non-mineralized basalt rock chip that are suitable for monitoring cross contamination at the sample preparation step. The blanks were inserted into the sequences approximately every 20 samples. Additionally, blanks were specifically added following zones with expected gold grades.
A total of 224 blanks were analyzed during the 2015-2017 drill program. The result of this analysis is presented below in Figure 11-1.

Figure 11-1: Blank Correlation for Ana Paula Samples
The samples below the detection limit of 0.005 g/t Au were set at 0.0025 g/t Au (half the detection limit). Values are accepted within five times the detection limit (0.025 g/t Au). Results from the blanks indicated 7 failures exceeding the 5 times the lower detections limits and all were not clustered in a specific batch that indicates that the assays were likely free of cross-contamination.
11.4.2.2 Quarter Core Duplicate
Filed duplicates consist of quarter cores duplicate directly
collected from core boxes. They are collected every 25 samples. A total of 126
duplicates were analyzed during the 2015-2017 drill program. The result of this
analysis is presented in Figure 11-2.
|
|
93 |
| ANA PAULA PROJECT |
| FORM 43-101F1 TECHNICAL REPORT |

Figure 11-2: Field Duplicate Correlation for Ana Paula Samples
11.4.2.3 Standard
A number of different standards from CDN Resource Laboratories Ltd. were used. The standards purchased include: CDN-CM-36, CDN-GS-1P5K, and CDN-ME-1101.
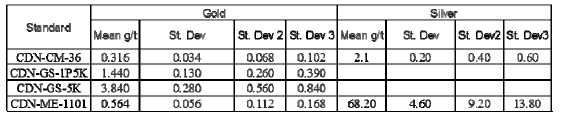
The standards were inserted into the sequences approximately
every 20 samples. Additionally, standards were specifically added to zones with
expected gold grades. A total of 289 standards were analyzed between 2015-2017.
The QA/QC results are given in Figure 11-3 to Figure 11-6.
|
|
94 |
| ANA PAULA PROJECT |
| FORM 43-101F1 TECHNICAL REPORT |

|
|
95 |
| ANA PAULA PROJECT |
| FORM 43-101F1 TECHNICAL REPORT |

Figure 11-5: QA/QC Results of Standard Samples from Ana Paula
11.4.2.4 Check Assays from the Umpire Laboratory
Additional pulps samples were sent to a secondary laboratory as
a check on the primary laboratory. Samples assayed at ALS-Chemex lab were sent
to a secondary laboratory Bureau Veritas lab. Samples for the check assaying
program were selected randomly and were analyzed by fire assay with an atomic
absorption finish (FA-430). Assays grading over 10 g/t were re-assayed by fire
assay with a gravimetric finish using a 30g aliquot (FA530). Samples were also
analyzed with an aqua regia digestion and a combination of inductively coupled
plasma emission spectrometry (ICP-OES) to provide a multi-element analyses.
These results were paired with the original assays from the primary laboratory
and plotted on relative difference plots and scatter diagrams to look for
evidence of bias.
|
|
96 |
| ANA PAULA PROJECT |
| FORM 43-101F1 TECHNICAL REPORT |

Figure 11-6: Relative Error Diagram – Pulp Duplicates
11.4.3 QA/QC Results
Two major failures outside the blanks safe value were encounteredfound on batches GU16215927 and GU17026523. For the GU16215927 batch, the failure was a result laboratory preparation contamination and for the GU17026523 batch, the failure resulted from a sample mix-up In both cases, the laboratory was requested to do formal investigation for both batches were re-assayed. The laboratory re-issued the assays certificated and the new results were incorporated to database.
11.5 DENSITY DETERMINATION
Bulk density samples are to be measured on a regular basis and, consisted of approximately one density sample every 10 m in mineralized sections and one in every 20 m in un-mineralized wall rock. The drill core sample is cut to a length of 10-15 cm. The sample is dried in an oven for about 15 minutes (230°F) then after cooling is wrapped in plastic. The sample is weighed dry and wet on a scale and both measurements are registered on a spreadsheet.
11.6 AGP QUALITY CONTROL AND QUALITY ASSURANCE VALIDATION
Prior to the resource estimate, AGP reviewed the results of the QA/QC program provided by Alio Gold.
11.6.1 Blanks
AGP reviewed a total of 1,361 blank samples from all drill campaigns from 2010 to 2017. From this total, 75 blank samples exceeded 5x the detection limit, amounting to 6% of the total. AGP notes that the blank material used prior to the 2015 data was not considered totally “blank” as reported by IMC.
Of the 75 blanks exceeding 5x detection, only 9 of the samples
were inserted immediately after a high-grade sample which could be indicative of
a cross-contamination. AGP did not identify a reproducible pattern of cross
contamination in the data reviewed. For the 2015-2017 dataset, blanks were found
to be inserted at a rate of approximately 1 in 28 samples (3.6% of the assays).
|
|
97 |
| ANA PAULA PROJECT |
| FORM 43-101F1 TECHNICAL REPORT |
11.6.2 Duplicates
A total of 1,217 duplicate samples were collected from the 2010-2014 drill campaigns and are shown in Figure 12-2 below; 9 outliers were removed. For the 2015-2017 dataset, quarter core duplicates were found to be inserted at a rate of approximately 1 in 31 samples (3.2% of the assays). The protocol for duplicates of this type generally calls for no more than 10% of samples outside of specification (OOS). The percentage of OOS duplicate pairs for gold were within the 10% limit where 9 out of 1,217 pairs are considered OOS.
The program was reportedly discontinued (Gibson 2016) however, during the 2015 -2017 drill campaigns a total of 203 duplicate samples were collected indicating that Alio Gold re-started this QA/QC protocol.

Figure 11-7: Gold 1/4 Core Duplicate – 2010-2014
Results shown indicate the percentage of OOS duplicate pairs
for gold were within the 10% limit where 3 out of 203 pairs are considered as
OOS.
|
|
98 |
| ANA PAULA PROJECT |
| FORM 43-101F1 TECHNICAL REPORT |

Figure 11-8: Gold 1/4 Core Duplicate – 2015-2017
Once a few outliers were removed, the plots indicated a reasonable agreement between the original and duplicate value considering that a ¼ core duplicate typically shows more drift than a pulp or crush reject duplicate. The scatter about the parity line is good. The slope of regression is close to 1 indicating no material bias. AGP noted that with the outliers, the slope of regression is not as good; the 2010-2014 data indicated a R2 of 0.75 and a slope of 1.11 and for the 2015-2017 data the regression showed a R2 of 0.88 and a slope of 0.82.
11.6.3 Standards
Throughout the years, Ana Paula employed several standards.
Standard AP01 to AP08 were internally prepared by ProDeMine during the Newstrike
drill campaign. The mean grades for these standards were determined from assays
run at the ALS Chemex, SGS, Inspectorate Vancouver, and Inspectorate Reno
laboratories and standard deviations are calculated from the assay means
measured by these laboratories. Standard AP09 through to AP13 were commercially
produced standard reference materials (SRM or Standards) originating from CND
laboratory. These Standards are summarized in Table 11-1.
|
|
99 |
| ANA PAULA PROJECT |
| FORM 43-101F1 TECHNICAL REPORT |
Table 11-1: Summary of Standard Reference Materials
Standard Name |
Manufacturer |
Au (ppm) Value |
Conf. Limit |
No. Sample |
Nb of samples in excess of 2x Stdev |
% of samples in excess of 2x Stdev |
| 2015 – 2017 Drill Programs | ||||||
| AP-1 | ProDeMine/Newstrike | 0.317 | 0.016 | 300 | 9 | 3.00% |
| AP-2 | ProDeMine/Newstrike | 0.536 | 0.026 | 255 | 12 | 4.70% |
| AP-3 | ProDeMine/Newstrike | 0.689 | 0.02 | 190 | 7 | 3.70% |
| AP-4 | ProDeMine/Newstrike | 1.283 | 0.112 | 50 | 2 | 4.00% |
| AP-5 | ProDeMine/Newstrike | 0.32 | 0.006 | 567 | 6 | 1.10% |
| AP-6 | ProDeMine/Newstrike | 0.493 | 0.026 | 693 | 26 | 3.80% |
| AP-7 | ProDeMine/Newstrike | 0.863 | 0.035 | 255 | 16 | 6.30% |
| AP-8 | ProDeMine/Newstrike | 1.225 | 0.057 | 72 | 5 | 6.90% |
| AP-9 | CDN Resource Laboratories Ltd. | 0.564 | 0.56 | 392 | 18 | 4.60% |
| AP-10 | CDN Resource Laboratories Ltd. | 0.62 | 0.062 | 314 | 11 | 3.50% |
| AP-11 | CDN Resource Laboratories Ltd. | 0.564 | 0.056 | 63 | 3 | 4.80% |
| AP-12 | CDN Resource Laboratories Ltd. | 0.62 | 0.062 | 66 | 3 | 4.50% |
| AP-13 | CDN Resource Laboratories Ltd ? | 0.799 | 0.05 | 26 | 0 | 0.00% |
| 1F | Early standard – origin unknown | 1.17 | 0.117 | 9 | 0 | 0.00% |
| EXM-STD-1 | Early standard – origin unknown | 1.17 | 0.117 | 22 | 1 | 4.50% |
| EXM-STD-2 | Early standard – origin unknown | 0.76 | 0.076 | 15 | 1 | 6.70% |
| EXM-STD-3 | Early standard – origin unknown | 0.34 | 0.034 | 18 | 1 | 5.60% |
| P2 | Early standard – origin unknown | 0.5448 | 0.054 | 7 | 0 | 0.00% |
| P7B | Early standard – origin unknown | 0.85 | 0.085 | 8 | 0 | 0.00% |
| 2015 – 2017 Drill Programs | ||||||
| CDN-CM-36 | CDN Resource Laboratories Ltd. | 0.316 | 0.034 | 115 | 7 | 6.10% |
| CDN-GS-1P5K | CDN Resource Laboratories Ltd. | 1440 | 0.13 | 37 | 0 | 0.00% |
| CDN-ME-1101 | CDN Resource Laboratories Ltd. | 0.56 | 0.056 | 125 | 7 | 5.60% |
| CDN-GS-5K | CDN Resource Laboratories Ltd. | 3.84 | 0.28 | 17 | 0 | 0.00% |
The results were plotted in chronological order on graphs for each standard depicting the ‘recommended value’ as well as plus/minus two and three times the standard deviation of the dataset. This provides a check of the precision of the assays. For the 2015-2017 dataset, standards were found to be inserted on average, at a rate of approximately 1 in 27 samples (3.7% of the assays).
Although some failures (of greater than 3 standard deviations) have occurred, there were generally no two consecutive failures observed; except in the Standard CDN-CM-36 where two instances of two consecutive failures existed. Standards were underestimated in both instances.
11.7 COMMENT ON SECTION 11
AGP is of the opinion that the QAQC protocols and verification of the results, meet or exceed industry norms and believe the data verification is adequate for this type of deposit. Insertion rate for QA/QC samples for the 2015-2017 drill program conducted by Alio Gold is within industry standard.
Prior insertion rate during the early Newstrike drill program was low since the QA/QC sample insertion rate was quoted in the literature as 1 in 20 alternating between QA/QC sample types. This equated to a rate of 1 in 60 for each of the QA/QC type.
Additional protocols including the blind submission of pulps
and reject in the sampling chain could be added to enhance the QA/QC program.
|
|
100 |
| ANA PAULA PROJECT |
| FORM 43-101F1 TECHNICAL REPORT |
12 DATA VERIFICATION
Field inspection and database validation was previously carried out by C. Gibson P.Geo., Ph.D. of ProDeMin as part of the PEA study authored by JDS. A summary of the field inspection and data validation carried out prior to the AGP site visit on December 13, 2016 can be reviewed in Section 9.3 of this report.
12.1 AGP FIELD INSPECTION – DECEMBER 2017
Mr. Pierre Desautels, P. Geo. visited the property December 13 - 14, 2016. Drilling was in progress at the time of the visit. The 2017 site visit entailed brief reviews of the following:
-
overview of the geology and exploration history of the property
-
management of the exploration program on the property
-
drill hole collar locations
-
description of the drill rig procedures including core handling
-
sample collection protocols at the core logging facility
-
discussion on the sample transportation and sample chain of custody and security
-
core recovery
-
QA/QC program (insertion of standards, blanks, duplicates etc.)
-
monitoring of the QA/QC program
-
review of diamond drill core, core logging sheets, and core logging procedures (the review included commentary on typical lithologies, alteration and mineralization styles, and contact relationships at the various lithological boundaries)
-
specific gravity sample collection
During the 2016 site visit, AGP collected six character samples. AGP personally packaged the samples which were subsequently shipped via FedEx directly to Activation Laboratories Ltd. at 41 Bittern Street, Ancaster ON. The sample analysis was intended to allow an independent laboratory to confirm the presence of gold and silver in the deposit, and assess differences in terms of grade ranges. Samples were analyzed for gold using procedure code FA-INAA, silver with procedure code ICP-OES and 9 other elements using procedure code ICP-OES. The FA-INAA method is a fire assay with Instrumental Neutron Activation Analysis (INAA) finish. INAA is described by ActLabs as follows:
"INAA (Instrumental Neutron Activation Analysis) is an analytical technique dependent on measuring gamma radiation induced in the sample by irradiation with neutrons. A 30-g aliquot, is encapsulated in a polyethylene vial and irradiated in a nuclear reactor. After a suitable decay period, samples are measured for the emitted gamma ray fingerprint."
For silver, the inductively coupled plasma atomic emission spectroscopy (ICP-OES) is a common analytical technique used for the detection of trace metals. This methodology is similar to what was used at ALS Chemex or SGS Laboratory for Alio Gold’s samples.
The independent check samples collected by AGP prove the
presence of the metal of interest at the Ana Paula project and the value
obtained by the independent laboratory correlates well with the analytical
results from Alio Gold (Table 12-1).
|
|
101 |
| ANA PAULA PROJECT |
| FORM 43-101F1 TECHNICAL REPORT |
Table 12-1: Independent Character Sample Results versus Alio Gold
| Hole-ID | Interval | AGP Sample result | Alio Gold Sample result | Sample Type | |||
| From (m) | To (m) | Sample Nb. | Au (ppm) | Sample Nb. | Au (ppm) | ||
| AP-12-81 | 164.5 | 165.25 | 83651 | 8.85 | 23854 | 9.99 | 1/4 core duplicate |
| AP-12-115 | 44.7 | 45.7 | 83652 | 16.5 | 50450 | 11.48 | 1/4 core duplicate |
| AP-15-236 | 114.2 | 115.4 | 83653 | 2.68 | 113991 | 2.63 | 1/4 core duplicate |
| AP-11-35 | 553.3 | 553.6 | 83654 | 1.89 | 7504 | 1.86 | 1/4 core duplicate |
| AP-15-236 | 127.4 | 128.6 | 83655 | 3.3 | 114003 | 3.05 | Pulp |
| AP-15-236 | 128.6 | 130 | 83656 | 3.37 | 114004 | 2.90 | Pulp |
Assay results on the AGP check samples also revealed three other anomalous elements shown in Table 12-2.
Table 12-2: Anomalous Elements on AGP Check Samples
| AGP Sample Nb | Cu (%) | As (%) | Zn (%) |
| 83651 | 0.087 | 8.92 | 0.008 |
| 83652 | 0.026 | 4.64 | 0.006 |
| 83653 | 0.042 | 6.52 | 0.005 |
| 83654 | 0.034 | 0.64 | 0.125 |
| 83655 | 0.042 | 3.61 | 0.006 |
| 83656 | 0.019 | 5.71 | 0.004 |
The drilling program was in progress during the AGP site visit. The CSD 1800X drill rig, operated by AP. Explore Drilling with a head office in San Luis, Potosi, Mexico was located on hole AP-16-270. Core size for the 2016 drill program was HQ or 63.5 mm in diameter. Drill pads were all accessible via a network for road allowing 4-wheel drive vehicles to reach the drill site.
The down-the-hole surveys were carried out using a Reflex instrument. This instrument uses a magnetic compass that is susceptible to magnetic interference. Because of the use of a magnetic compass, the azimuth recorded by the instrument requires a magnetic declination correction to provide the true azimuth.
The drill core was delivered daily to the core logging facility located in the municipality of Cuetzala del Progreso, Mexico. The core boxes were opened, laid out on the core logging table, and then measured and marked for sampling.
The core was logged in the core logging facility on paper logs and transcribed to a database. Items logged are rock description, lithology coding, veining, alteration, sulphide minerals, and oxide minerals. A graphic log of the lithology and mineralization was also maintained on the logging sheet.
Bulk density was measured using a using a traditional Sauter TB-2610 triple beam scale, equipped with an under hook to allow the samples to be weighed dry on the platen, and then re-weighed suspended in water. A consumer toaster oven was used for drying the core pieces. Core samples were solid with no vugs and did not require coating with paraffin or shellac.
For the drill holes inspected, AGP found the core was properly
marked. Sampling intervals were approximately 1.5 m in length. The HQ sized core
is cut longitudinally with an electric power diamond blade core saw. The cut
line is marked by a geologist and great care was taken to ensure the cut line
did not introduce a sample bias.
|
|
102 |
| ANA PAULA PROJECT |
| FORM 43-101F1 TECHNICAL REPORT |
At the time of the site visit, cooling water was re-circulated from the saw tray which can introduce cross contamination between samples. The use of fresh water to cool the blade is ideal, however in areas where water consumption is an issue, a larger volume of water (40 liters or more) can be re-circulated, as long as the system incorporates a decant tank and the pump is located half way down the decanted water barrel. With this system, a periodic change of water is still recommended to minimize cross sample contamination.
In the core inspected during the site visit, the high-grade mineralization occurs as disseminated specs of arsenopyrite, and also in veins and veinlets. No visible gold was observed even in the high-grade Complex Breccia lithology shown in Figure 12-1.
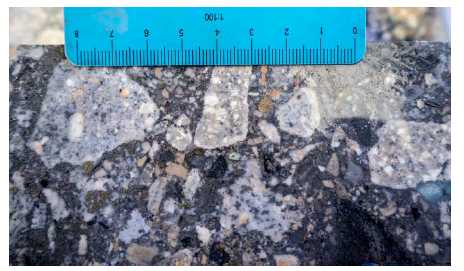
Figure 12-1: Complex Breccia
Inspection of the grade distribution at the high grade/waste boundaries were found to be relatively sharp with very little transition for all contact zones observed during the site visit.
The QA/QC samples consisted of reference material, blank material, and core duplicates. AGP notes that Alio Gold uses a crushable blank capable of monitoring cross contamination at the crushing stage of the sample preparation.
One QA/QC sample is inserted every 20th sample or thereabouts. The samples alternate between a blank, duplicate or standard. Alio Gold currently uses commercially available standard reference material from CDN Laboratory which is discussed in detail in Section 11 of this report.
The core, rejects, and pulps are stored at the core logging facility. The facility, one of the best that AGP inspected, is fully fenced and considered secure.
In the field, the drill holes are clearly marked with a white
plastic pipe embedded in a cement marker bearing the hole ID, azimuth, and dip.
Figure 12-2 shows a few photographs taken during AGP’s site visit.
|
|
103 |
| ANA PAULA PROJECT |
| FORM 43-101F1 TECHNICAL REPORT |
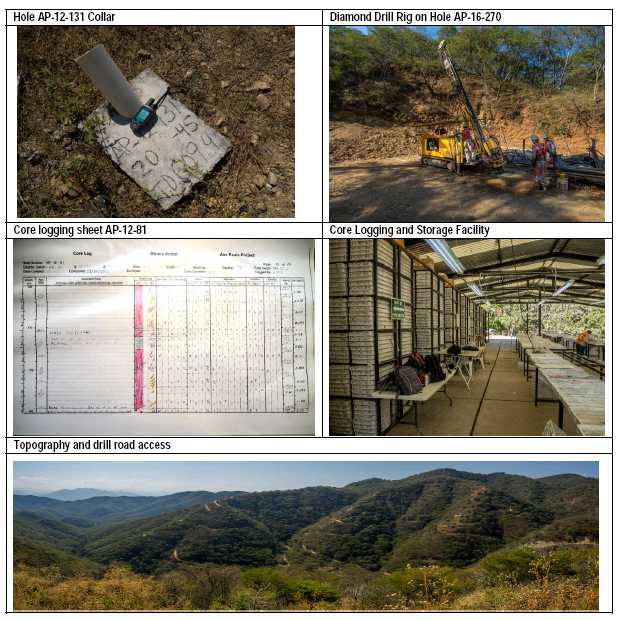
Figure 12-2: 2016 Site
Visit Photographs by AGP
Overall, AGP concludes the logging, sampling, sample preparation, security, and chain of custody procedures reviewed during the site visit are to industry standards and adequate to support the resource estimate. AGP recommends using fresh water for the core saw.
12.2 DATABASE VALIDATION
Following the site visit and prior to the resource evaluation,
AGP carried out an internal validation of the drill holes in the Alio Gold
database.
|
|
104 |
| ANA PAULA PROJECT |
| FORM 43-101F1 TECHNICAL REPORT |
12.2.1 Collar Coordinate Validation
All holes drilled by Alio Gold are laid out in the field using a hand-held GPS unit. Once the holes are completed, the collar is surveyed using a high precision Trible R6 instrument.
During the site visit, seven collar coordinates were validated by AGP with the aid of a hand-held Garmin GPS Map, Model 60CSx. Collars were randomly selected and the GPS position was recorded. The difference with the GEMS database was calculated as an X-Y 2-D plane using the following formula:

As shown in Table 12-3, results indicated an average difference in the X-Y plane of 1.60 m. On the Z plane, an average difference of 61 m was recorded.
Table 12-3: Collar Coordinate Field Validation
| Hole-ID | GPS-East | GPS-North | GPS-Elev. | DB-East | DB-North | DB-Elev. | X-Y Plane Diff. | Elev. Diff. |
| AP-12-107 | 410331 | 1997804 | 1043 | 410329.9 | 1997803.5 | 959.3 | 1.27 | 84 |
| AP-12-131 | 410513 | 1998423 | 1144 | 410514.0 | 1998423.3 | 1075.7 | 1.01 | 68 |
| AP-12-135 & 127 | 410161 | 1997848 | 1150 | 410162.9 | 1997847.8 | 1046.4 | 1.89 | 103 |
| AP-16-270 (Drill rig) | 410121 | 1998023 | 997 | 410120.6 | 1998024.2 | 920.5 | 1.21 | 77 |
| AP-11-59 | 409964 | 1997724 | 1106 | 409963.7 | 1997726.6 | 1094.0 | 2.62 | 12 |
| AP-12-145 | 410888 | 1998002 | 964 | 410887.6 | 1998000.4 | 939.6 | 1.62 | 24 |
| Average Difference | 1.60 | 61.44 | ||||||
APG notes that at the AP-11-59 drill hole location, 6 other holes were drilled from that same location within 2 m of the AP-11-59 set-up. (AP-10-96, AP-12-99, AP-12-109, AP-12-94, AP-11-55, AP-11-56).
Collar elevations were also validated by AGP against the topography surface provided by Alio Gold and no adjustment was made to the elevation of the holes.
12.2.2 Down-hole Survey Data
During the validation process, the down hole survey data was found to have an incorrect magnetic declination applied to the drill rig Reflex azimuth data. Alio Gold corrected all the azimuth measurements prior to the resource estimate. The corrected data now considers the changes in the magnetic declination for the year the hole was drilled. For the 2017 drill holes, the magnetic declination used is 5° and 5 minutes at the project latitude of 18° and 5 minutes and longitude of 99° and 50 minutes.
With the corrected data, AGP reviewed the down-hole deviation data comparing each entry with the previous ones. There was no obvious erroneous entry noted on the holes inspected.
12.2.3 AGP Assay Certificate Validation prior to the 2017 Resource Estimate
In addition to the verifications by the previous author, AGP validated the gold and silver assays prior to interpolating the resource estimate. The selection of the certificates was heavily weighted toward the highest-grade assays in the database. The selection also ensures that all years were covered by the selection. In total, 268 certificates were requested from Alio Gold, and 256 were used in the validation. The signed Adobe Acrobat Portable Document Format (PDF) was provided along with a copy of the data in comma delimited format (CSV) ready for manipulation using Microsoft ExcelTM. Several certificates in CSV format were cross referenced with the signed PDF version to ensure they were the same. In total, 38% of the assay database was validated as indicated in Table 12-4.
|
|
105 |
| ANA PAULA PROJECT |
| FORM 43-101F1 TECHNICAL REPORT |
Table 12-4: Assay Validation by Year
| Year | Assays Validated | Assays Not Validated | Percent Validated |
| 2005 | 0 | 2,862 | 0% |
| 2010 | 1,788 | 1,369 | 57% |
| 2011 | 9,316 | 9,561 | 49% |
| 2012 | 7,995 | 21,481 | 27% |
| 2013 | 9,314 | 16,745 | 36% |
| 2014 | 197 | 1,041 | 16% |
| 2015 | 1,322 | 81 | 94% |
| 2016 | 3,226 | 884 | 78% |
| 2017 | 764 | 503 | 60% |
| Total | 33,922 | 54,527 | 38% |
For gold, the validation indicated several errors related to the selection of the best value for the ACME certificate as noted by the previous author (Gibson 2014). AGP requested the assays be corrected with the best analytical technique regardless of the grade. This work was completed prior to the resource estimate. Out of the 33,922 assays validated, 18 gold assays showed a discrepancy with the certificate value. These were investigated, and the issue was related to the samples that were re-assayed, and the results received on a different certificate. In the final database used for the resource described in this report, no gold assays were found to be erroneously entered in the database for the 33,922 samples reviewed. For silver, a total of 143 certificate values were different than the value in the database. These were investigated and the issue was related to the samples that were re-assayed by Inspectorate Laboratory and the results which were received on a different certificate. In total, no silver assays were found to be erroneously entered in the database however, Alio Gold commented that the 148 silver assays in the database will be reverted to the SGS or ALS Chemex assays in the near future.
12.2.4 Opinion
Core logging field procedures observed during the site visit meet or exceeded industry standard. The only issue noted was the core saw using recycled water for the core cutting procedures.
Following the corrections of some of the problems related to
the downhole survey azimuths and the ACME laboratory results, there is no other
material issue related to sampling and assaying that was identified during the
review of the drill data and accompanying assays. The QP finds the data
collected by Alio Gold adequately represents the style of mineralization present
on the Anna Paula property without a restriction on resource classification. The
error rate in the Ana Paula drill database, for the data that was validated by
the QP, was found to be non-existent.
|
|
106 |
| ANA PAULA PROJECT |
| FORM 43-101F1 TECHNICAL REPORT |
13 MINERAL PROCESSING AND METALLURGICAL TESTING
Metallurgical testwork for this study is based primarily on testwork conducted at Blue Coast Research Ltd. (BCR) of Parksville, BC. Mineralogical analysis was conducted at Process Mineralogical Consultants of Maple Ridge, BC. An analysis of submicroscopic gold was conducted by Surface Science Western of London, ON. Grindability testwork was performed at BCR, Autec Innovative Extractive Solutions of Vancouver, BC, and ALS Minerals of Kamloops, BC. FLSmidth Knelson of Langley, BC modelled the response of the gravity circuit. A detailed summary of all the testwork may be found in the BCR report, as referenced in Section 27.
13.1 SAMPLES AND COMPOSITE CHARACTERIZATION
Samples from the four main lithological domains (“domains”) present within the Ana Paula mine plan were selected by Alio Gold and arrived at Blue Coast Research in July 2016. The domain composites, and the corresponding metallurgical sample codes and approximate weight proportions (%) in the mine plan are shown in Table 13-1.
Table 13-1: Domain Composites, Sample Codes and Approximate Life-of-Mine Proportions
| Domain composite | Metallurgical Sample Code |
Approximate Proportion LOM |
| Intrusive suite (Granodiorite) | GD | 65-70% |
| Complex Breccia (High-grade Breccia) | HGB | 15-20% |
| Sediments (Limestone-Shale) + Skarn/Hornfels | LS | ~10% |
| Monolithic Breccia (Low-grade Breccia) | LGB | <5% |
These composites formed the basis of the prefeasibility level metallurgical testwork. Chemical characterization was performed at Blue Coast Research (Au, Ag, As Fe) and Autec Innovative Extractive Solutions (Sulphur, Carbon speciation). Gold content was measured by fire assay with an atomic adsorption finish. Silver, arsenic and iron were measured with an aqua regia digestion followed by an atomic adsorption finish. Sulphur and carbon analysis was measured through a LECO analysis. Careful attention was paid to ensure the average gold grades of the composite lots lined up as close as possible to the average gold grades of each domain in the mine plan. A summary of the composite head assays is summarized in Table 13-2 through Table 13-5:
Table 13-2: GD Composite Head Assays
| Head Assay GD | Au | Ag | As | Fe | S | C(tot) | C(inorg) | C(org) |
| (g/t) | (g/t) | (%) | (%) | (%) | (%) | (%) | (%) | |
| GD - 1 | 1.69 | 5.70 | 1.03 | 3.07 | 1.73 | 1.35 | 1.34 | 0.01 |
| GD - 2 | 1.44 | 5.87 | 1.00 | 3.07 | 1.59 | |||
| GD - 3 | 1.63 | 7.00 | 0.99 | 2.97 | 1.55 | |||
| Average | 1.59 | 6.19 | 1.00 | 3.04 | 1.62 |
Table 13-3: HGB Composite Head Assays
| Head Assay HGB | Au | Ag | As | Fe | S | C(tot) | C(inorg) | C(org) |
| (g/t) | (g/t) | (%) | (%) | (%) | (%) | (%) | (%) | |
| HGB - 1 | 4.44 | 9.10 | 3.47 | 7.17 | 4.99 | 1.43 | 1.40 | 0.03 |
| HGB - 2 | 4.84 | 8.30 | 3.47 | 7.18 | 5.05 | |||
| HGB - 3 | 5.05 | 8.40 | 3.36 | 7.02 | 4.95 | |||
| Average | 4.78 | 8.60 | 3.43 | 7.12 | 5.00 |
|
|
107 |
| ANA PAULA PROJECT |
| FORM 43-101F1 TECHNICAL REPORT |
Table 13-4: LS Composite Head Assays
| Head Assay LS | Au | Ag | As | Fe | S | C(tot) | C(inorg) | C(org) |
| (g/t) | (g/t) | (%) | (%) | (%) | (%) | (%) | (%) | |
| LS - 1 | 2.92 | 9.42 | 2.26 | 7.32 | 5.56 | 4.48 | 4.37 | 0.11 |
| LS - 2 | 3.5 | 8.63 | 2.27 | 7.33 | 5.43 | |||
| LS - 3 | 3.37 | 9.10 | 2.33 | 7.48 | 5.81 | |||
| LS - 4 | 2.92 | |||||||
| LS - 5 | 3.50 | |||||||
| LS - 6 | 3.78 | |||||||
| LS - 7 | 2.96 | |||||||
| Average | 3.29 | 9.05 | 2.29 | 7.38 | 5.60 |
Table 13-5: LGB Composite Head Assays
| Head Assay LGB | Au | Ag | As | Fe | S | C(tot) | C(inorg) | C(org) |
| (g/t) | (g/t) | (%) | (%) | (%) | (%) | (%) | (%) | |
| LGB - 1 | 0.89 | 17.10 | 0.71 | 4.83 | 3.9 | 0.59 | 0.54 | 0.05 |
| LGB - 2 | 0.95 | 17.50 | 0.75 | 5.28 | 4.22 | |||
| LGB - 3 | 0.94 | 20.90 | 0.75 | 5.44 | 4.4 | |||
| Average | 0.92 | 18.50 | 0.74 | 5.18 | 4.17 |
Modal mineralogy of the three composites (GD, HGB, LS) was completed by Process Mineralogy Consultants (PMC) of Maple Ridge, BC. Arsenopyrite and pyrite are the major sulphide species in each of the composites. Non-sulphide gangue was dominated by feldspars and quartz. Carbonates were detected in each composite, but were a markedly greater proportion of the limestone shale (29.6%) compared to the granodiorite (7.8%) and high grade breccia (7.0%) composites.
Table 13-6: Modal Mineralogy of GD, LS and HGB Composites
| Mineral Mass | GD Comp | LS Comp | HGB Comp |
| Arsenopyrite | 3.64 | 7.40 | 8.03 |
| Pyrite | 1.55 | 6.59 | 4.77 |
| Sphalerite | 0.05 | 0.24 | 0.04 |
| Galena | 0.10 | 0.03 | 0.02 |
| Chalcopyrite | 0.01 | 0.05 | 0.04 |
| Tetrahedrite | 0.00 | 0.00 | 0.04 |
| FeTi-Oxides | 0.74 | 0.87 | 0.61 |
| Mica | 6.47 | 5.90 | 4.7 |
| Quartz | 16.5 | 20.0 | 20.5 |
| Feldspars | 56.2 | 17.8 | 47.38 |
| Mg-Silicates | 4.13 | 7.34 | 3.52 |
| Other minerals | 2.07 | 4.00 | 3.10 |
| Carbonates | 7.95 | 29.57 | 7.01 |
| Phosphates-Sulphates | 0.52 | 0.18 | 0.00 |
| Total | 100 | 100 | 100 |
Samples of flotation concentrates were sent to Surface Science Western Ltd. where they were analyzed by Dynamic SIMS for colloidal and solid solution gold content. This technique allows for an understanding of the refractory gold content. To expose this gold for ultimate recovery the sulphide minerals must be broken down, often by oxidation of the sulphides. A total of 270 measurements were conducted across the three domain composites and the following findings are presented:
|
|
108 |
| ANA PAULA PROJECT |
| FORM 43-101F1 TECHNICAL REPORT |
-
Optical microscopy scans on polished section mounts and the D-SIMS profiles revealed the presence of significant numbers of visible gold grains and high grade colloidal gold inclusions in both the pyrite and arsenopyrite mineral phases.
-
Both pyrite and arsenopyrite were found to be carriers of submicroscopic gold, and the pyrite/arsenopyrite was grouped into three categories; coarse, porous and microcrystalline, each containing various ppm levels of gold per the summary tables.
-
Arsenopyrite contained higher concentrations of gold than pyrite. The findings were consistent across each rock type and morphology.
Combining the modal mineralogy with the solid solution gold content shown in Table 13-7 indicates that roughly 61% to 71% of the gold should be cyanide soluble with the balance present as refractory gold.
Table 13-7: Concentrations of Gold in Pyrite and Arsenopyrite
| Concentrate Morphology Pyrite Au (ppm) Arsenopyrite Au (ppm) | |||
| GD Flotation Concentrate | Coarse | 7.34 | 14.03 |
| Porous | 8.28 | 22.77 | |
| Microcrystalline | 6.25 | 11.49 | |
| HGB Flotation Concentrate | Coarse | 6.09 | 15.10 |
| Porous | 4.20 | 9.26 | |
| Microcrystalline | 4.80 | 20.11 | |
| LS Flotation Concentrate | Coarse | 4.82 | 10.32 |
| Porous | 5.10 | 10.43 | |
| Microcrystalline | 3.14 | 9.73 | |
13.2 GRINDABILITY TESTWORK
Grindability testing consisted of JK RBT Lite and Bond Ball Mill work index testwork. JK RBT Lite results suggest ore that is moderately hard to hard.
Table 13-8: JK RBT Lite and Bond Ball Work Index Test Results
| Sample ID |
JK RBT Lite Un-Scaled Parameters | BWI (kWh/t) |
||
| A | b | A x b | ||
| GD | 50.8 | 0.85 | 43.3 | 19.4 |
| HGB | 58.5 | 0.75 | 44.0 | 16.0 |
| LS | 61.1 | 0.65 | 39.6 | 15.1 |
| LGB | 82.7 | 0.67 | 55.6 | 16.2 |
Additionally, JK RBT Lite rejects were used to conduct Abrasion Index tests and SMC tests at ALS Minerals in Kamloops, BC. These results are presented in the Table 13-9 and Table 13-10.
Table 13-9: SMC Test Results
| Sample ID | SMC Results (Axb) |
| GD | 34.8 |
| HGB | 33.3 |
|
|
109 |
| ANA PAULA PROJECT |
| FORM 43-101F1 TECHNICAL REPORT |
The SMC results indicate the material is somewhat harder than that suggested by JK RBT Lite work. The SMC samples therefore represent a more conservative approach to grinding circuit design.
Table 13-10: Abrasion Index Test Results
| Sample ID | Abrasion Index (Ai) |
| GD-1 | 0.189 |
| GD-2 | 0.203 |
| HGB | 0.194 |
| LGB | 0.081 |
| LS | 0.078 |
Abrasion testing results indicate that the Ana Paula material is mildly abrasive and that mill liner wear will not be extreme.
13.3 FLOTATION
A comprehensive flotation program was completed on the three predominant domains (GD, HGB and LS). The study evaluated the impacts of primary grind size, reagent scheme, pH, retention time and pulp density. The following outcomes are summarized from this study:
-
Gold recoveries ranged from 93% for LS to 96% for GD and HGB.
-
Primary grinds ranging from 75µm to 160 µm were evaluated. The primary grind size had no impact on final flotation recoveries, and the coarsest primary grind was selected; 80% passing 160 µm.
-
All composites required the addition of copper sulphate for pyrite and arsenopyrite activation. Copper sulphate was added at 100 g/t. Tests conducted without copper sulphate saw slightly lower flotation gold recoveries, with the impact being most pronounced for the LS composite.
-
Potassium Amyl Xanthate (PAX) was added as the primary sulphide mineral collector. Optimum dosage rates ranged from 60-110 g/t. PAX was necessary to ensure maximum gold recovery. Tests conducted with alternate primary collectors saw lower overall recovery.
-
3418A was added to the GD and HGB composites as a secondary collector. Highest recoveries were noted when dosage rates ranged from 40 -50 g/t.
-
F-131A was identified as the preferred frother. Optimum dosages ranged from 64-128 g/t.
Table 13-11 summarizes the optimum whole ore flotation response from each of the three domains.
Table 13-11: Optimum Whole Ore Flotation Response
| Flotation Conditions | |||||||||||
| Domain | Test ID | Au Rec (%) |
Mass Pull (%) |
Grind p80 (µm) |
CuSO4 (g/t) |
PAX (g/t) |
3418A (g/t) |
F131A (g/t) |
pH | Pulp Density (%) |
Ret. Time (mins) |
| GD | F-17 | 96 | 20 | 160 | 100 | 80 | 50 | 128 | Natural | 22 | 16 |
| HGB | F-55 | 96 | 20 | 160 | 100 | 60 | 40 | 78 | Natural | 22 | 7 |
| LS | F-30 | 93 | 21 | 160 | 100 | 110 | - | 64 | Natural | 22 | 12 |
13.4 GRAVITY GOLD RECOVERY
Ana Paula material responds well to gravity concentration methods. Extended gravity recoverable gold (E-GRG) tests were conducted on each domain with recoveries to gravity concentrates of 53%, 49%, 40% and 12% for GD, HGB, LS and LGB respectively. The EGRG tests may be considered best case tests as they treat material through successively finer grind sizes culminating with a final grind size of 80% passing 75 µm. Given that primary grinds necessary for adequate flotation were much coarser at 160µm, one may expect that deportment of gold to gravity concentrate would be somewhat lower than the EGRG tests report.
|
|
110 |
| ANA PAULA PROJECT |
| FORM 43-101F1 TECHNICAL REPORT |
To this end, a modelling exercise was conducted by FLSmidth Knelson. This exercise evaluated the recovery to gravity concentrate at differing treatment volumes, specified as a percent of the ball mill circulating load, and differing grind sizes. Lower recovery to gravity concentrates is predicted at coarser grind sizes as some of the gravity recoverable gold is not liberated at the coarser grind size. Table 13-12 is extracted from the FLSmidth Knelson report and summarizes the modelling results.
Table 13-12: Modelled Gold Recovery to Gravity Concentrate at Specified Grind Sizes
| % circulating load to gravity |
Domain | Gold Recovery (%) | ||
| 100 µm | 125 µm | 160 µm | ||
| 36 | GD | 40 | 29 | 23 |
| HGB | 25 | 19 | 16 | |
| LS | 15 | 11 | 9 | |
| 50 | GD | 42 | 32 | 26 |
| HGB | 28 | 21 | 18 | |
| LS | 17 | 12 | 10 | |
| 93 | GD | 46 | 36 | 30 |
| HGB | 31 | 25 | 22 | |
| LS | 20 | 16 | 13 | |
![]()
Figure 13-1: Cumulative Uncorrected Gravity Recovery from Ana Paula Domain Composites
|
|
111 |
| ANA PAULA PROJECT |
| FORM 43-101F1 TECHNICAL REPORT |
13.5 WHOLE ORE CYANIDATION
A battery of whole ore cyanidation tests was conducted, examining the leach response of the domain composites. Each bottle roll test maintained pH between 10.5 and 11 and a standard pulp density of 40% solids was used. Parameters including primary grind size, cyanide concentration, lead nitrate addition, dissolved oxygen content, preaeration and residence time were investigated.
Leach recoveries ranged from 59% to 70% for GD, 62% to 68% for HGB and 6% to 50% for LS. Preg-robbing carbon was identified in the LS composite, explaining the low initial recoveries. LS recoveries improved to the mid to high 40% through the addition of activated carbon. As highlighted in Table 13-13 through Table 13-15, gold and silver recoveries were largely insensitive to primary grind size, residence time, cyanide concentration, preaeration, lead nitrate addition or elevated dissolved oxygen. Some scatter was observed in the data, likely as a result of the presence of some coarse gold and the resultant “nugget effect”.
The whole ore leach tests highlight that gold recovery is limited by the refractory gold content in the material. There is broad agreement between the amount of solid solution gold associated with pyrite and arsenopyrite and the whole ore leach recoveries reported above.
Table 13-13: Whole Ore Cyanidation Recoveries – GD Composite
| Test ID |
Grind P80 (µm) |
NaCN Dosage (g/L) |
Residence Time (hrs) |
NaCN Consumed (Kg/t) |
CaO Consumed (Kg/t) |
PbNO3 (g/t) |
Carbon (g/L) |
O2 Sparging? |
Pre aeration? |
Au Recovery (%) |
Ag Recovery (%) |
| CN-1 | 160 | 1.00 | 48 | 1.88 | 0.80 | - | - | - | - | 70.1 | 32.9 |
| CN-2 | 125 | 1.00 | 48 | 2.78 | 0.46 | - | - | - | - | 61.1 | 30.7 |
| CN-3 | 75 | 1.00 | 48 | 3.15 | 0.55 | - | - | - | - | 61.8 | 30.3 |
| CN-4 | 160 | 0.50 | 48 | 0.98 | 0.85 | - | - | - | - | 63.8 | 29.6 |
| CN-5 | 125 | 0.50 | 48 | 0.98 | 0.85 | - | - | - | - | 66.0 | 35.1 |
| CN-6 | 75 | 0.50 | 48 | 1.50 | 0.86 | - | - | - | - | 68.3 | 31.8 |
| CN-7 | 160 | 1.00 | 192 | 2.30 | 2.04 | 400 | - | - | 0.5hr | 64.4 | N/A |
| CN-8 | 160 | 1.00 | 72 | 2.14 | 2.38 | 400 | - | - | 0.5hr | 63.9 | 38.2 |
| CN-9 | 160 | 1.00 | 48 | 2.14 | 1.44 | - | 15.0 | - | - | 58.9 | 31.9 |
| CN-70 | 160 | 1.00 | 48 | 1.30 | 0.88 | - | - | Yes | - | 63.1 | 31.4 |
| CN-71 | 160 | 3.34 | 48 | 1.27 | 0.78 | - | - | - | - | 61.9 | 32.3 |
| CN-72 | 160 | 1.00 | 72 | 1.92 | 1.00 | 100.0 | - | Yes | 4hr | 62.4 | N/A |
Table 13-14: Whole Ore Cyanidation Recoveries – HGB Composite
| Test ID |
Grind P80 (µm) |
NaCN Dosage (g/L) |
Residence Time (hrs) |
NaCN Consumed (Kg/t) |
CaO Consumed (Kg/t) |
PbNO3 (g/t) |
Carbon (g/L) |
O2 Sparging? |
Pre aeration? |
Au Recovery (%) |
Ag Recovery (%) |
| CN-45 | 160 | 1.0 | 48 | 3.67 | 0.96 | - | - | - | - | 66.5 | 20.9 |
| CN-46 | 125 | 1.0 | 48 | 4.27 | 0.95 | - | - | - | - | 67.4 | 20.3 |
| CN-47 | 75 | 1.0 | 48 | 4.19 | 0.98 | - | - | - | - | 65.8 | 19.3 |
| CN-48 | 160 | 0.5 | 48 | 1.43 | 1.49 | - | - | - | - | 65.0 | 17.0 |
| CN-49 | 125 | 0.5 | 48 | 1.59 | 1.54 | - | - | - | - | 66.5 | 18.2 |
| CN-50 | 75 | 0.5 | 48 | 1.82 | 1.69 | - | - | - | - | 65.2 | 18.5 |
| CN-51 | 160 | 1.0 | 192 | 3.04 | 2.36 | - | - | - | 0.5hr | 64.2 | N/A |
| CN-52 | 160 | 1.0 | 72 | 2.06 | 1.98 | 400 | - | Yes | 0.5hr | 62.2 | 21.3 |
| CN-53 | 160 | 1.0 | 48 | 2.07 | 1.44 | - | 15 | - | - | 67.5 | 29.3 |
|
|
112 |
| ANA PAULA PROJECT |
| FORM 43-101F1 TECHNICAL REPORT |
Table 13-15: Whole Ore Cyanidation Recoveries – LS Composite
| Test ID |
Grind P80 (µm) |
NaCN Dosage (g/L) |
Residence Time (hrs) |
NaCN Consumed (Kg/t) |
CaO Consumed (Kg/t) |
PbNO3 (g/t) |
Carbon (g/L) |
O2 Sparging? |
Pre aeration? |
Au Recovery (%) |
Ag Recovery (%) |
| CN-23 | 160 | 1.0 | 48 | 2.53 | 1.32 | - | - | - | 8.16 | 20.4 | |
| CN-24 | 125 | 1.0 | 48 | 4.51 | 1.01 | - | - | - | - | 8.34 | 22.0 |
| CN-25 | 75 | 1.0 | 48 | 4.28 | 0.99 | - | - | - | - | 8.78 | 22.5 |
| CN-26 | 160 | 0.5 | 48 | 1.54 | 1.51 | - | - | - | - | 6.69 | 17.4 |
| CN-27 | 125 | 0.5 | 48 | 1.77 | 1.44 | - | - | - | - | 7.36 | 18.6 |
| CN-28 | 75 | 0.5 | 48 | 1.93 | 1.37 | - | - | - | - | 7.47 | 19.0 |
| CN-29 | 160 | 1.0 | 192 | 3.88 | 1.83 | - | 15 | Yes | - | 41.9 | N/A |
| CN-30 | 160 | 1.0 | 72 | 2.55 | 1.58 | 400 | 15 | Yes | 0.5 hr | 47.7 | 76.6 |
| CN-31 | 160 | 1.0 | 48 | 2.21 | 1.62 | - | 15 | - | 0.5 hr | 49.7 | 35.1 |
13.6 PRE-OXIDATION TESTWORK
The presence of refractory gold in solid solution with pyrite and arsenopyrite (noted in Table 13-7) limits overall gold recovery. Improving the overall gold recovery requires breaking down the pyrite/arsenopyrite matrix to expose the gold and enable its recovery through conventional cyanidation. Two processes were evaluated:
| 1. | Pressure oxidation of whole ore or flotation concentrates. The material is treated at elevated pressure and temperature in the presence of oxygen to oxidize the sulphide mineral and expose the gold. A series of benchtop autoclave tests and corresponding bottle rolls were conducted at Autec Innovative Extractive Solutions in Vancouver, BC. |
|
| 2. | Atmospheric oxidation of flotation concentrates. The material is treated at atmospheric pressures and temperatures in the presence of oxygen and a non-calcium neutralizing agent. Atmospheric oxidation testwork was conducted at Blue Coast Research Ltd., in Parksville, BC. |
Initial screening tests were conducted to evaluate both pressure and atmospheric oxidation. These tests were conducted on blended composite representing life-of-mine averages of each of the respective domains.
Table 13-16: Composition of Life-of-Mine Blend
| Domain | Proportion of Life-of-Mine Blend (%) |
| Granodiorite (GD) | 70% |
| High Grade Breccia (HGB) | 15% |
| Sediments (Limestone-Shale) + Skarn/Hornfels (LS) | 10% |
| Low Grade Breccia (LGB) | 5% |
| Total | 100% |
13.6.1 Pressure Oxidation Screening Tests
The pressure oxidation work evaluated both acid and alkaline conditions. Each test was conducted in a 2 litre laboratory autoclave for 60 minutes at 100 psi of oxygen overpressure. Gold recovery was evaluated with a 24 hour bottle roll conducted on autoclave residue with 1.5g/L NaCN and 20 g/L of carbon addition. Acidic pressure oxidation resulted in extremely high sulphide oxidation values for both rougher concentrate and whole ore feed. In turn, gold recoveries in excess of 95% were observed.
Due to the quantity of carbonate present in the life-of-mine blend (measured at 8.25%), an alkaline pressure oxidation test was conducted. Unlike acid pressure oxidation, this carbonate does not have to be pre-treated with acid prior to being fed to the autoclave. This has the benefit of acid cost savings; however, passivating layers may form on sulphide mineral surfaces slowing down the overall oxidation reaction. As a result, alkaline pressure oxidation will often have a lower sulphide oxidation extent. Alkaline oxidation of Ana Paula material resulted in 50% sulphide oxidation and a corresponding gold recovery of 75%.
|
|
113 |
| ANA PAULA PROJECT |
| FORM 43-101F1 TECHNICAL REPORT |
Table 13-17: Pressure Oxidation Screening Tests
| Test ID |
Test Type |
Sample Description |
Grind Size (µm) |
Pulp Density (%) |
Temp (°C) |
Acid Addition (kg/t) |
Sulphide Oxidation (%) |
Au Recovery (%) |
Ag Recovery (%) |
| T1 | Acid POX | Whole Ore | 54 | 45 | 220 | 131.53 | 98.0 | 95.1 | 3.6 |
| T4 | Alkaline POX | Whole Ore | 54 | 45 | 225 | N/A | 50.2 | 75.0 | N/A |
| T3 | Acid POX | Whole Ore | 173 | 45 | 220 | 121.76 | 96.8 | 95.9 | 11.0 |
| T2 | Acid POX | Rougher Conc | 94 | 45 | 220 | 113.00 | 96.9 | 96.6 | 8.8 |
13.6.2 Atmospheric Oxidation Screening Tests
Atmospheric oxidation takes place in open tanks using a
non-calcium neutralizing agent. Oxygen is injected into a pulp and sulphide
minerals react to form sulphuric acid in the process. The acid is consumed by
the neutralizing agent and the pulp pH is generally maintained above 7. An
initial atmospheric oxidation screening program was conducted which evaluated
different neutralizing agents (soda ash, trona and limestone) as well as
differing grind sizes (25 and 53 µm). pH was maintained above 7 during each of
these tests, however some tests were conducted with excess alkali and
accordingly these should be considered unoptimized results. The testwork was
conducted in a 3 litre stirred reactor. Oxygen was injected at 0.1 l/min through a ceramic porous media sparger and the temperature was
maintained with a heating jacket. Pulp density during the screening tests was
30% solids. Results of these initial screening tests are presented in Table
13-18.
Table 13-18: Atmospheric Oxidation Screening Tests
| Test ID |
Alkali Type |
Alkali Dose (kg/t conc) |
Regrind Size (µm) |
Temperature (°C) |
Sulphide Oxidation (%) |
Au Recovery (%) |
| AO-2 / CN-75 | Trona | 475 | 53 | 80 | 71 | 80 |
| AO-3 / CN-76 | Soda ash | 296 | 53 | 80 | 72 | 90 |
| AO-4 / CN-77 | Limestone | 200 | 53 | 80 | 42 | 64 |
| AO-5 / CN-78 | Soda ash | 296 | 75 | 80 | 43 | 74 |
| AO-6 / CN-79 | Soda ash | 296 | 25 | 80 | 57 | 86 |
| AO-7 / CN-80 | Soda ash | 148 | 53 | 80 | 46 | 85 |
This initial round of testwork identified the following points:
-
Limestone did not yield any additional gold recovery, confirming that calcium present in the neutralizing agent results in passivation of sulphide surfaces.
-
Soda ash (sodium carbonate) was identified as the preferred neutralizing agent. It provided the best overall recovery and was readily available in the local area.
-
Gold recovery appeared to be favored at finer regrind sizes.
-
Gravity gold was not removed prior to this initial testwork. The presence of free gold in the oxidation tests resulted in some scatter in the results. In subsequent optimization work, testing was conducted on flotation concentrate with gravity gold removed, thus allowing for a better study of the impact of the refractory gold component.
M3 Engineering conducted a trade-off study between pressure and
atmospheric oxidation. The higher capital cost associated with the pressure
oxidation circuit did not support the additional recovery benefit and as a
result the atmospheric oxidation flowsheet was selected for further
optimization.
|
|
114 |
| ANA PAULA PROJECT |
| FORM 43-101F1 TECHNICAL REPORT |
13.6.3 Atmospheric Oxidation Optimization
An optimization program was completed to further refine the atmospheric oxidation process and to gain a preliminary understanding of some of the variability between the major domains. Feed for the optimization program was first treated by gravity concentration and then flotation using the basic flowsheet identified during the previous flotation program. Removal of free, gravity recoverable gold results in oxidation test feed that contains a higher proportion of refractory gold. This enables a better understanding of the factors which influence the refractory gold recovery. Recovery of gold to the laboratory gravity concentrator during these tests averaged 41%. A chemical characterization of this concentrate is presented in Table 13-19. Table 13-20 provides a summary of test conditions and results observed during this optimization program.
Table 13-19: Gravity Tail/Flotation Concentrate Characteristics of Atmospheric Oxidation Optimization Program
| Sample ID | Au | Ag | As | S(tot) |
| 1 of 3 (A) | 5.44 | 29.7 | 5.36 | 9.92 |
| 2 of 3 (B) | 5.47 | 30.6 | 5.46 | 9.82 |
| 3 of 3 (C) | 5.45 | 30.1 | 5.41 | 9.85 |
| Average | 5.45 | 30.1 | 5.41 | 9.86 |
Table 13-20: Summary of Atmospheric Oxidation Optimization Program Test Results on Gravity Tail/Flotation Concentrates
| AO Test ID |
CN Test ID |
Conditions | S2- Oxidation |
Au Leach Recovery* |
Ag Leach Recovery* |
|||
| Feed |
Soda Ash |
Grind Size |
Retention Time |
|||||
| (kg/t) | (µm) | (Hours) | % | % | % | |||
| AO-10 | CN-84 | LOM | 100 | ~25 | 48 | 44 | 79 | 55 |
| AO-11 | CN-85 | LOM | 50 | ~25 | 48 | 26 | 63 | N/A |
| AO-12 | CN-86 | LOM | 50 | ~53 | 48 | 10 | 56 | N/A |
| AO-13 | CN-87 | LOM | 0 | ~25 | 48 | 10 | 49 | N/A |
| AO-14 | CN-88 | LOM | 150 | ~25 | 48 | 53 | 86 | 54 |
| AO-15 | CN-89 | LOM | 150 | ~25 | 8 | 48 | 83 | N/A |
| AO-16 | CN-90 | LOM | 150 | ~25 | 24 | 50 | 86 | N/A |
| AO-17 | CN-91 | LOM | 150 | ~25 | 48 | 58 | 88 | 55 |
| AO-18 | CN-92 | LOM | 150 | ~25 | 72 | 50 | 88 | 54 |
| AO-19 | CN-93 | LOM | 150 | ~53 | 48 | 47 | 84 | N/A |
| AO-20 | CN-94 | LOM | 100 | ~53 | 48 | 35 | 75 | N/A |
| AO-21 | CN-95 | GD | 150 | ~25 | 48 | 80 | 88 | N/A |
| AO-22 | CN-96 | HGB | 280 | ~25 | 48 | 42 | 84 | N/A |
| AO-23 | CN-97 | LS | 220 | ~25 | 48 | 33 | 78 | N/A |
*Note: Leach recoveries shown are on gravity tail/flotation concentrates. Total calculated leach recoveries will be higher with inclusion of leached gravity concentrates.
13.6.3.1 Effect of Soda Ash Addition
A significant focus of the optimization program was allocated
to understanding the relationship between soda ash addition and metal recovery.
Tests were conducted with standard conditions of 75°C, a regrind size of 25µm
and 48 hour oxidation residence time. Figure 13-2 highlights this relationship
and shows that higher soda ash dosages result in higher gold recovery. At soda
ash dosages of 150 kg/t recoveries range between 86% and 88%, while zero soda
ash addition saw a recovery of 49%. Gold recovery from the zero soda ash
addition test was less than the whole ore leach results due to the removal of a
substantial portion of the free, gravity recoverable gold prior to this
testwork.
|
|
115 |
| ANA PAULA PROJECT |
| FORM 43-101F1 TECHNICAL REPORT |
At 150 kg/t the soda ash dosage is high enough to ensure that the oxidation product has a neutral pH of about 7. Dosages less than this amount result in periods where the pH drops below 7, however upon conclusion of the test the pH increased again to neutral. Given that some carbonates are present in the concentrate it is postulated that with insufficient soda ash dosages acid generated through the oxidation reaction will consume some of the naturally occurring carbonate. This carbonate, likely present as calcite, will release free calcium which subsequently precipitates as gypsum in the sulphate rich environment. The gypsum precipitate coats the sulphide particles resulting in their passivation and reducing the overall sulphide oxidation and gold recovery. The extreme of this scenario was observed with the zero soda ash addition test, where sulphide oxidation was limited to 10% and gold extraction was low at 49%.
Figure 13-2: Relationship of Soda Ash Dosage and Gold Leach Recovery of Gravity Tail/Flotation Concentrates (25µm regrind size)
Given the interplay between naturally occurring carbonates and oxidation products it is important to note that the relationship described in Figure 13-2 is valid for a given range of sulphide to carbonate ratios. Concentrates with higher sulphur grades will require additional soda ash, or lower recoveries may be expected.
13.6.3.2 Effect of Regrind Size
The impact of regrinding was tested at three soda ash addition
levels. Other parameters, such as temperature and residence time were held
constant. Prior to each test, concentrate was reground in a laboratory jar mill.
Figure 13-3 shows that a finer regrind size yields higher overall gold
recoveries. This influence is stronger at lower soda ash dosages, possibly due
to the passivating influence of insufficient soda ash. Passivation of coarser
particles would leave larger particle cores unoxidized and subject to lower
recovery.
|
|
116 |
| ANA PAULA PROJECT |
| FORM 43-101F1 TECHNICAL REPORT |
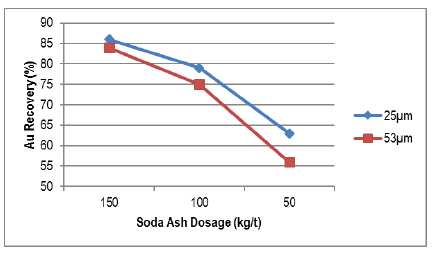
Figure 13-3: Effect of Regrind Size on Gold Leach Recovery of Gravity Tail/Flotation Concentrates
13.6.3.3 Effect of Residence Time
An oxidation versus recovery profile was conducted using the standard 150 kg/t soda ash dosage, with temperature and regrind size held constant at 75°C and 25µm respectively. Gold recovery was measured from carbon-in-leach bottle rolls that were conducted on samples that had been oxidized for 8, 24, 48 and 72 hours. Gold recovery increased from 83% after 8 hours of oxidation to 88% after 48 hours. No additional recovery was recorded from the 72-hour residence time. These results are highlighted in Figure 13-4.

Figure 13-4: Effect of Oxidation Time on Gold Leach Recovery of Gravity Tail/Flotation Concentrates
13.6.3.4 Domain Oxidation Results
Three domain specific tests were conducted on GD, HGB and LS material to evaluate how each separate domain will respond to atmospheric oxidation. Tests were conducted using the 150 kg/t as a baseline soda ash dosage, however additional soda ash was added as necessary to maintain a pH greater than 7. Gold recovery from GD and HBG was 88% and 84% respectively. This recovery range bounds the LOM performance and provides additional confidence in those results. Higher sulphur content in the HGB concentrate (18.8%) required significantly more soda ash (280 kg/t) to maintain pH above 7. Likewise, the LS concentrate, with a sulphur grade of 20.3%, also required more soda ash (220 kg/t). The GD composite by comparison had a slight excess of soda ash, observed by a discharge pH of 7.6 at the conclusion of the test. These results highlight the fact that soda ash requirements are determined primarily by the sulphur content available for oxidation. Higher sulphur feeds require more soda ash.
|
|
117 |
| ANA PAULA PROJECT |
| FORM 43-101F1 TECHNICAL REPORT |
13.7 OVERALL METALLURGICAL PERFORMANCE
Based on the metallurgical test results described above an overall gold recovery of 85% is reasonable. The basis for this is:
| • | Primary grind of 160µm. |
|
| • | Corrected extended gravity recoverable gold (GRG) at 160µm is 40%. |
|
| • | Treatment of 36% of mill circulating load resulting in 20% gold recovery to gravity concentrate. |
|
| • | Gravity recoverable gold (GRG) is cyanide soluble. Free gold which does not report to the gravity circuit will still achieve comparable gold extraction in the downstream CIL circuit. |
|
| • | Intensive leach extraction of gravity concentrates of 98%. |
|
| • | Gold recovery to flotation concentrate of 95%. |
|
| • | Leach recovery of 81% based on soda ash addition rates of 120 kg/t, on gold that is not gravity recoverable. |
|
| • | Total gold recovery of 85% is thus reconciled as: |
| o | 20% GRG to gravity / intensive leach x 98% leach recovery ≈ 20% | |
| o | 20% GRG to flotation concentrate x 95% flotation recovery x 98% leach recovery ≈ 19% | |
| o | 60% gold to flotation concentrate x 95% flotation recovery x 81% leach recovery ≈ 46% |
Figure 13-5 describes the overall process flowsheet developed for Ana Paula.
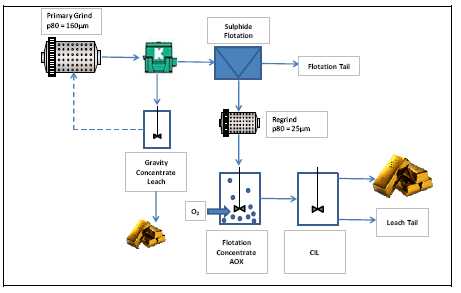
Figure 13-5: Ana Paula Process Flow Diagram
|
|
118 |
| ANA PAULA PROJECT |
| FORM 43-101F1 TECHNICAL REPORT |
13.8 RECOMMENDED FUTURE TESTWORK
The following testwork is recommended as part of the feasibility study:
| • | Additional grindability testing including the following: |
| o | JK Drop Weight tests on each major domain | |
| o | Variability SMC Tests | |
| o | Variability Bond Ball Work Index tests |
| • | Variability flotation testing for each major domain | |
| • | Atmospheric oxidation testing of composites based on production years | |
| • | Piloting scale testing of the flotation / atmospheric oxidation circuits | |
| • | Cyanide destruction testwork | |
| • | Thickening and rheology testwork |
The estimated cost for this testwork is expected to be
approximately $575,000 USD.
|
|
119 |
| ANA PAULA PROJECT |
| FORM 43-101F1 TECHNICAL REPORT |
14 MINERAL RESOURCE ESTIMATES
AGP completed an updated Mineral Resource Estimate of the Ana Paula Project held by Alio Gold Corp. (Alio). The project is located in Guerrero State, Mexico approximately 58 km southwest of the city of Iguala. Geovia's GEMS Version 6.7.4™ software was used for the resource estimate. The metals of interest at the Ana Paula Project are gold and silver, with minor quantities of copper that were not estimated for this pre-feasibility model.
14.1 DATA
On March 15, 2017, Alio provided AGP with a project database consisting of:
| • | Drill data for the Ana Paula project comprising the following: |
| o | collar data | |
| o | down the hole survey | |
| o | logged lithology | |
| o | geochemistry/assays | |
| o | mineralization | |
| o | alteration | |
| o | structure | |
| o | veining |
| • | Select suites of assay certificates as requested by AGP | |
| • | Specific density data | |
| • | Quality assurance and quality control data file | |
| • | Three dimensional wireframes for the lithological units | |
| • | Topography as a three-dimensional surface |
During the data validation, issues with the downhole survey data and the gold assays analyzed at ACME Laboratory were uncovered. Corrections were made to the database and the drill data was updated along with the lithological wireframes on April 13, 2017.
All data was checked for overlapping, missing, and negative length intervals. No erroneous data was detected affecting the primary database table used in the resource estimation. Data was fully validated before being used in the resource estimate (described in Section 12 of this report).
No further additions were made to the database after March 15, 2017 which constitutes the official data cut-off date for this resource estimate. For the Ana Paula Project, a total of 285 core holes exist in the database; of these, 276 core holes contributed to the grade estimation.
Table 14-1 below shows a summary of the number of holes and
assays used in the resource estimate.
|
|
120 |
| ANA PAULA PROJECT |
| FORM 43-101F1 TECHNICAL REPORT |
Table 14-1: Summary of Number of Holes used in the Resource Estimate
Zone |
Type |
Number of Holes |
Total Length (m) |
Number of Assays |
Comment |
| Holes used in resource estimation | |||||
| Ana Paula | Core hole | 276 | 123,268 | 86,013 | |
| Holes not used in the resource estimate | |||||
| Ana Paula | Core hole | 5 | 2796 | 1772 | Outside the block model extent |
| Ana Paula | Core hole | 4 | 923 | 664 | Twin holes – Met hole removed |
| Subtotal | 9 | 3,719 | 2,436 | ||
| Total in Database | |||||
| Grand Total | 285 | 126,986 | 88,449 | ||
14.1.1 Sampling Length
Alio preferentially samples the drill core in either 1.5 m or 2 m intervals. For the Ana Paula lithological domains, sampling intervals ranged from 1.17 m to 1.46 m in the Complex Breccia (CBX), Intrusive suite (INTRS), Monolithic Breccia (MBX), Skarn-Hornfeld (SKNHF), and Sulphide (SULPH) lithologies. Sampling intervals are longer in the low grade/waste Sediment (SED) domain which averaged 1.71 m. The upper third quartile of the sampling interval population is 2.0 m for the SED and approximately 1.5 m for the remaining domains.
14.2 GEOLOGICAL INTERPRETATION
At Ana Paula, the bulk of the mineralization is clustered in and around the CBX lithological unit. This lithological unit consists of a core of multilithic breccia in a steeply south plunging column which is surrounded by a halo of mineralization and alteration characterized by veins, fracture zones, and massive sulfide contact replacements in country rock that include limestone, hornfels, and intrusive rocks, along with other breccias.
The 3D lithological wireframes developed to control the grade interpolation of the resource model were based primarily on the logged lithologies. A second wireframe was created to model the mineralized HALO. Procedures used in the development of these wireframes are as follows:
| 1. | The lithological wireframes were constructed by Alio Gold geologists using the logged lithologies and LeapfrogTM software. AGP validated the wireframes against the logged lithologies in the database. While there was some minor mixing of lithologies, the wireframes provided honoured the core logging information in the database to a high degree of accuracy (Table 14-2). Inspection of the domains, on sections and plans, showed a good correlation. The 3D model features a strong northerly trend coupled with a steep dip to the west which is in part, due to the parameters entered in Leapfrog to generate the 3D mesh. The trends displayed by the wireframes correlate well with the geological surface map provided for the area east of coordinate 409,700; however, it does not correlate with the north-easterly trend displayed by the mapping in the south west portion of the deposit. AGP notes that this issue does not affect the resource model since no blocks were interpolated west of coordinate 409,575. |
|
|
121 |
| ANA PAULA PROJECT |
| FORM 43-101F1 TECHNICAL REPORT |
Table 14-2: Lithological Domains versus Logged Lithologies
| Lithological Domains | Logged Lithologies | |||||
| BXH + BXML + BXOMC |
GD + GDBD + BDBX + GDF |
HFL + SK | LS-SH + LS | Sulph | Others | |
| Complex Breccia (CBX) | 77% | 13% | 4% | 1% | 5% | 0% |
| Skarn-Hornfeld (SKNHF) | 1% | 4% | 91% | 3% | 1% | 0% |
| Intrusive suites (INTRS) | 2% | 96% | 1% | 1% | 0% | 0% |
| Monolithic Breccia (MBX) | 74% | 25% | 0% | 0% | 0% | 1% |
| Sediments (SED) | 0% | 4% | 2% | 93% | 0% | 1% |
| Sulphide (SULPH) | 3% | 3% | 10% | 10% | 73% | 1% |
| 2. | The bulk of the high-grade mineralization at Ana Paula is centered on the CBX lithology which is surrounded by a high-grade mineralized halo that displays a strong relationship to bismuth (Bi) and iron-arsenic-sulphur (Fe-As-S) combination (Figure 14-2). In order to control the spread of the high-grade values, a 3D wireframe was modelled surrounding the CBX unit. This model was created within a coarse block model matrix of 10 m x 10 m x 12 m using 12 m bench composites to reduce variability. Steps taken to create the model are as follows: |
| a. | Create a probability model for bismuth using a threshold of 5.7 ppm. |
|
| b. | Create a probability model for gold using a threshold of 0.5 ppm. |
|
| c. | Create a probability for Fe + S + As using a threshold of 4.5%. |
|
| d. | The average probability was computed and then a reduction factor, based on the distance from the center, was applied to the average. The reduction factor ensures the “halo probability” is reduced to zero beyond 230 m from the center of the CBX. The resulting “adjusted probability” model bears a value between 0 and 1 representing the probability of each individual block to be located within the Halo. |
|
| e. | The "adjusted probability" model was examined against the bench contour maps of the various elements and a probability threshold value was selected to coincide within reason with the bismuth, gold, and iron contours depicting the extent of the Halo. Blocks above the threshold value were converted to a code of 50. A block groomer was used to eliminated isolated blocks. The resulting model was used as a guideline to wireframe HALO conventionally with polylines on each of 12 m bench. |
|
| f. | The completed 3D shape fully encloses the CBX lithological domain. The resulting model is shown in Figure 14-1. |
| 3. | In addition to the HALO wireframe, a high-grade probability model was constructed within the INTERS, SKNHF, and SED lithology outside the HALO in order to prevent the smearing of the occasional higher grade values with the surrounding low grade. The probability model was constructed using 3.0 m composites. A threshold grade of 0.3 ppm Au was selected based on the start of the inflexion seen in the raw assays probability plot and a visual examination of the high-grade assays. All blocks above a probability value of 0.45 (representing 45% chance of the block being above 0.3 ppm Au) were flagged as blocks belonging to a high grade sub-domain. The high-grade probability model only applies to the material outside the mineralized HALO. |
|
| 4. | Topography was provided by Alio Gold as a 3D surface. It was derived from orthophotography and topographic contouring surveyed by PhotoSatTM. Precision should be in the order of 20 cm accuracy with 1 m elevation grids and 1 m contours. |
|
| 5. | The overburden thickness was evaluated, and it was determined that 179 drill holes were collared in bedrock. Twenty-three holes showed 4 m of poor recovery at the collar, which could be a combination of weathered zone or alluvial material. The remaining 106 holes showed an average of 5 m of alluvial material. |
|
|
122 |
| ANA PAULA PROJECT |
| FORM 43-101F1 TECHNICAL REPORT |
Overall, the average alluvial cover was estimated to be 2 m and was deemed too thin to be significant for the purpose of the resource model. |
||
| 6. | The oxidation layer (leach zone) at Ana Paula is not considered material to the resource. Staff at the mine report that within the weathering zone, sulphides are routinely visible with a small oxidation rim. The depths of the oxidation layer within the pit shell average 9.2 m with a median of 6.3 m. The 25th percentile is 2.6 m and the 75th percentile is 12.8 m. |

Figure 14-1: Isometric View of the 3D Lithological Model, CBX and HALO
|
|
123 |
| ANA PAULA PROJECT |
| FORM 43-101F1 TECHNICAL REPORT |
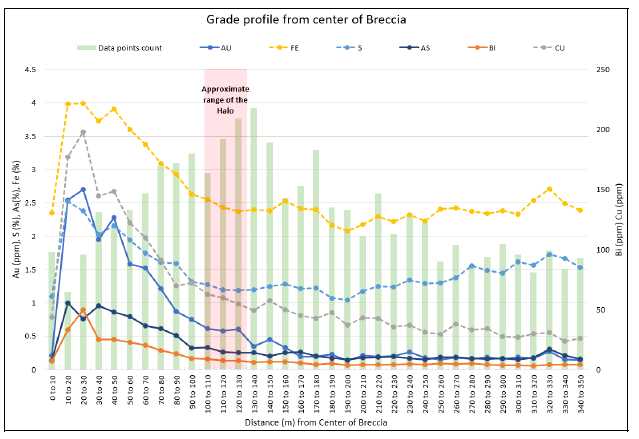
Figure 14-2: Grade Profile of Various Elements surrounding the CBX Center
14.3 EXPLORATION DATA ANALYSIS
Exploratory data analysis is the application of various statistical tools to characterize the statistical behaviour or grade distributions of the data set. In this case, the objective is to understand the population distribution of the grade elements in the various domains using such tools as histograms, descriptive statistics, and probability plots.
14.3.1 Assays
The raw assay statistics were evaluated, grouping all assays
intersecting the various lithologies in and out of the HALO. Table 14-3 provides
descriptive statistics for raw, uncapped, gold values while Table 14-4 provides
descriptive statistics for raw, uncapped, silver values.
|
|
124 |
| ANA PAULA PROJECT |
| FORM 43-101F1 TECHNICAL REPORT |
Table 14-3: Gold Descriptive Statistics
| Domain | ALL | INTRS | MBX | SED | SKNHF | SULPH | CBX | INTRS | SED | SKNHF | SULPH |
| Outside the Halo | Inside the Halo | ||||||||||
| Valid cases | 86243 | 50943 | 1257 | 15689 | 7202 | 40 | 2754 | 5736 | 739 | 1746 | 137 |
| Mean (ppm) | 0.45 | 0.19 | 0.41 | 0.09 | 0.34 | 2.21 | 3.55 | 1.42 | 1.46 | 2.29 | 9.81 |
| Variance | 16.54 | 0.62 | 0.26 | 0.86 | 5.03 | 5.16 | 68.57 | 55.63 | 44.25 | 409.22 | 249.27 |
| Variation Coefficient | 9.13 | 4.18 | 1.22 | 10.59 | 6.60 | 1.03 | 2.33 | 5.24 | 4.56 | 8.83 | 1.61 |
| Minimum | 0.00 | 0.00 | 0.00 | 0.00 | 0.00 | 0.02 | 0.00 | 0.00 | 0.00 | 0.00 | 0.00 |
| Maximum | 760 | 98 | 4 | 50 | 123 | 9 | 158 | 439 | 95 | 760 | 105 |
| 1st percentile | 0.00 | 0.00 | 0.00 | 0.00 | 0.00 | ---- | 0.01 | 0.01 | 0.00 | 0.01 | 0.00 |
| 5th percentile | 0.00 | 0.00 | 0.01 | 0.00 | 0.00 | 0.02 | 0.04 | 0.03 | 0.00 | 0.04 | 0.09 |
| 10th percentile | 0.00 | 0.01 | 0.02 | 0.00 | 0.01 | 0.02 | 0.07 | 0.05 | 0.00 | 0.07 | 0.29 |
| 25th percentile | 0.01 | 0.02 | 0.06 | 0.00 | 0.02 | 0.25 | 0.24 | 0.13 | 0.01 | 0.15 | 1.27 |
| Median | 0.06 | 0.06 | 0.26 | 0.00 | 0.06 | 1.60 | 0.72 | 0.33 | 0.04 | 0.36 | 4.08 |
| 75th percentile | 0.19 | 0.16 | 0.56 | 0.01 | 0.17 | 3.74 | 3.00 | 0.98 | 0.36 | 1.09 | 11.91 |
| 90th percentile | 0.58 | 0.37 | 0.96 | 0.06 | 0.50 | 6.21 | 10.05 | 2.82 | 2.34 | 3.37 | 26.36 |
| 95th percentile | 1.32 | 0.64 | 1.38 | 0.16 | 1.12 | 7.50 | 16.46 | 5.37 | 6.97 | 6.80 | 35.14 |
| 99th percentile | 7.36 | 2.08 | 2.55 | 1.65 | 4.90 | ---- | 33.95 | 16.65 | 26.96 | 29.75 | 99.76 |
Statistically, the SULPH domain bears the highest gold grade but the volume in the model is very small which is reflected in the number of valid cases in Table 14-3. The CBX has the next highest grade and, despite the high grade, the coefficient of variation (CV) indicates low variability in the assay distribution. From the CV values observed in the table, it appears that capping of outliers is required. Silver behaves similarly; the high-grade silver assays in the SULPH are likely due to the lead-zinc association (Table 14-4).
Table 14-4: Silver Descriptive Statistics
| Domain | ALL | INTRS | MBX | SED | SKNHF | SULPH | CBX | INTRS | SED | SKNHF | SULPH |
| Outside the Halo | Inside the Halo | ||||||||||
| Valid cases | 86243 | 50943 | 1257 | 15689 | 7202 | 40 | 2754 | 5736 | 739 | 1746 | 137 |
| Mean (ppm) | 2.9 | 2.9 | 5.0 | 1.7 | 3.2 | 40.9 | 5.8 | 3.0 | 4.8 | 3.9 | 18.1 |
| Variance | 175 | 182 | 108 | 121 | 278 | 11073 | 109 | 46 | 525 | 116 | 535 |
| Std. Deviation | 13.2 | 13.5 | 10.4 | 11.0 | 16.7 | 105.2 | 10.4 | 6.8 | 22.9 | 10.8 | 23.1 |
| Variation Coefficient | 4.5 | 4.6 | 2.1 | 6.5 | 5.2 | 2.6 | 1.8 | 2.3 | 4.8 | 2.8 | 1.3 |
| Minimum | 0.0 | 0.0 | 0.1 | 0.0 | 0.1 | 0.1 | 0.1 | 0.0 | 0.1 | 0.1 | 0.1 |
| Maximum | 1120 | 1120 | 141 | 595 | 603 | 628 | 140 | 194 | 353 | 141 | 156 |
| 1st percentile | 0.1 | 0.1 | 0.2 | 0.1 | 0.1 | ---- | 0.1 | 0.1 | 0.1 | 0.1 | 0.2 |
| 5th percentile | 0.1 | 0.2 | 0.4 | 0.1 | 0.1 | 0.2 | 0.2 | 0.2 | 0.1 | 0.1 | 0.6 |
| 10th percentile | 0.2 | 0.3 | 0.6 | 0.1 | 0.1 | 0.2 | 0.2 | 0.3 | 0.1 | 0.2 | 1.0 |
| 25th percentile | 0.4 | 0.5 | 1.1 | 0.3 | 0.3 | 1.5 | 0.5 | 0.6 | 0.3 | 0.3 | 3.4 |
| Median | 1.0 | 1.0 | 2.0 | 0.5 | 0.8 | 10.6 | 1.8 | 1.2 | 0.6 | 0.7 | 11.9 |
| 75th percentile | 2.1 | 2.3 | 4.2 | 1.0 | 1.9 | 28.0 | 7.0 | 2.8 | 1.7 | 1.9 | 21.6 |
| 90th percentile | 5.0 | 5.0 | 11.0 | 2.1 | 4.8 | 108.6 | 15.7 | 6.1 | 6.5 | 9.9 | 45.7 |
| 95th percentile | 9.5 | 8.8 | 21.0 | 3.5 | 10.0 | 214.6 | 23.6 | 10.5 | 20.4 | 21.9 | 72.5 |
| 99th percentile | 34.2 | 31.0 | 52.5 | 18.2 | 41.9 | ---- | 48.9 | 30.0 | 80.6 | 51.6 | 135.1 |
|
|
125 |
| ANA PAULA PROJECT |
| FORM 43-101F1 TECHNICAL REPORT |
14.4 OUTLIER CONTROL
A combination of decile analysis and a review of probability plots was used to determine the potential risk of grade distortion from higher grade assays. A decile is any of the nine values that divide the sorted data into ten equal parts, such that each part represents one tenth of the sample or population. In a mining project, high-grade outliers can contribute excessively to the total metal content of the deposit.
Typically, in a decile analysis, capping is warranted if:
-
the last decile has more than 40% metal
-
the last decile contains more than 2.3 times the metal quantity contained in the penultimate decile
-
the last centile contains more than 10% metal
-
the last centile contains more than 1.75 times the metal quantity contained in the penultimate centile
The decile analysis results indicated that grade capping was warranted, although AGP noted that all domains (except SULPH and MBX), fell under the exception rule which was interpreted by the QP as domains not requiring aggressive controls on outliers. After conducting a careful examination of the data set, AGP elected to use a two-fold approach:
-
apply a high hard cap on the raw assay prior to compositing to reduce extreme high grade assays
-
impose a sample search restriction on the “mild” outlier’s population to control the range of influence.
The grade capping strategy used has the benefit of limiting grade distortion from extreme outliers while restricting the range of influence of the “mild” high-grade outliers, and applying the principle that true outliers generally have restricted physical continuity and do not extend much beyond a short distance from where they are located. In summary, the high-grade values are acknowledged in the model, but their spatial influences are limited.
14.4.1 Raw Assay Capping
Table 14-5 and Table 14-6 show a summary of the treatment of
high-grade outliers during the interpolation. The cap value selected for gold
was generally above the 99.5 th percentile of the raw assay
distribution. For silver, the cap value selected was closer to the
99th percentile. The raw assay capping scenario for gold reduced the
CV by about 30% on average (Table 14-7). The CV of the gold and silver capped
raw assays remains high for linear interpolation methods for the INTRS, SED and
SKNHF domains. Once that data was composited at 3.0 m (as described below) the
CV was further reduced.
|
|
126 |
| ANA PAULA PROJECT |
| FORM 43-101F1 TECHNICAL REPORT |
Table 14-5: Cap Levels for Gold and Search Restriction Grade Threshold by Domains
Domain (Domain Code) |
Cap Level Au (g/t) |
Total Number of Assay Affected |
Total Number of Assays |
Percent of Assays Affected (%) |
Composite Grade Threshold Au (g/t) |
Number of Composite Affected |
Total Number of Composites |
Percent of Composite Affected (%) |
| INTRS (2000) | 10 | 29 | 50,943 | 0.1% | 4.5 | 20 | 22,806 | 0.1% |
| MBX (6100) | 3.5 | 2 | 1,257 | 0.2% | Not Needed | |||
| SED (1200) | 7.5 | 24 | 15,689 | 0.2% | 1.8 | 60 | 8,877 | 0.7% |
| SKNHF (4000) | 7 | 42 | 7,202 | 0.6% | 4 | 12 | 3,276 | 0.4% |
| SULPH (6500) | 7 | 2 | 40 | 5.0% | Not Needed | |||
| CBX_Halo (6050) | 55 | 12 | 2,754 | 0.4% | Not Needed | |||
| INTRS_Halo (2050) | 50 | 10 | 5,736 | 0.2% | 20 | 7 | 2,830 | 0.2% |
| SED_Halo (1250) | 25 | 8 | 739 | 1.1% | 7 | 15 | 431 | 3.5% |
| SKNHF_Halo (4050) | 30 | 17 | 1,746 | 1.0% | 11 | 14 | 814 | 1.7% |
| SULPH_Halo (6550) | 35 | 6 | 137 | 4.4% | Not Needed | |||
Table 14-6: Cap Levels for Silver
| Domain (Domain Code) |
Cap Level Ag (g/t) |
Total Number of Assay Affected |
Total Number of Assays |
Percent of Assays Affected (%) |
| INTRS (2000) | 120 | 71 | 50,943 | 0.1% |
| MBX (6100) | 60 | 8 | 1,257 | 0.6% |
| SED (1200) | 60 | 53 | 15,689 | 0.3% |
| SKNHF (4000) | 80 | 39 | 7,202 | 0.5% |
| SULPH (6500) | 200 | 2 | 40 | 5.0% |
| CBX_Halo (6050) | 50 | 25 | 2,754 | 0.9% |
| INTRS_Halo (2050) | 60 | 14 | 5,736 | 0.2% |
| SED_Halo (1250) | 50 | 12 | 739 | 1.6% |
| SKNHF_Halo (4050) | 60 | 8 | 1,746 | 0.5% |
| SULPH_Halo (6550) | 75 | 4 | 137 | 2.9% |
14.4.2 Search Restriction Threshold Grade and Range
The search restriction for mild gold outliers was applied to domains where the composite CV was above 2.0. For silver, the composite CV was sufficiently low that a high-grade search restriction was deemed unnecessary.
The threshold grade used was selected based on degradation
analysis of the composite data. The values used are shown in Table 14-5. The
maximum range of influence for composites above the threshold was 40 m for
domain with a CV less than 2.5 and 40 m for domains with a CV higher than 2.5.
|
|
127 |
| ANA PAULA PROJECT |
| FORM 43-101F1 TECHNICAL REPORT |
Table 14-7: CV Tracking between Assays and Composites by Domain for Gold and Silver
| Domain (Domain Code) | Gold | Silver | ||||
| CV before Assay Capping |
CV after Assay Capping |
CV after Compositing |
CV before Assay Capping |
CV after Assay Capping |
CV after Compositing |
|
| INTRS (2000) | 4.2 | 2.8 | 2.0 | 4.6 | 2.8 | 2.0 |
| MBX (6100) | 1.2 | 1.2 | 1.1 | 2.1 | 1.8 | 1.4 |
| SED (1200) | 10.6 | 6.6 | 4.6 | 6.5 | 3.4 | 2.4 |
| SKNHF (4000) | 6.6 | 2.9 | 2.2 | 5.2 | 3.0 | 2.3 |
| SULPH (6500) | 1.0 | 1.0 | 0.9 | 2.6 | 1.7 | 1.4 |
| CBX_Halo (6050) | 2.3 | 2.0 | 1.8 | 1.8 | 1.6 | 1.4 |
| INTRS_Halo (2050) | 5.2 | 2.8 | 2.1 | 2.3 | 2.0 | 1.4 |
| SED_Halo (1250) | 4.6 | 3.3 | 2.8 | 4.8 | 2.6 | 2.1 |
| SKNHF_Halo (4050) | 8.8 | 2.6 | 2.0 | 2.8 | 2.5 | 2.0 |
| SULPH_Halo (6550) | 1.6 | 1.2 | 1.0 | 1.3 | 1.1 | 1.1 |
14.4.3 Total Metal Affected by the Treatment of Outliers
The total metal affected by the treatment of outliers was evaluated in the final model. At the selected 0.6% Au cut off, the outlier control strategy removed 17% of the gold ounces and 14% of the silver ounces in the combined Measured and Indicated category (Table 14-8). AGP notes that only a small percentage of the assays and composites were affected by the treatment of outliers yet the amount of metal removed is deemed substantial.
Table 14-8: Metal Removed by Capping Strategy (Meas, + Ind. category)
| Grade Cut-off Bins Au (g/t) |
Gold Ounces Removed % Change |
Silver Ounces Removed % Change |
| >1.50 | -429,000 / -27% | -423,000 / -17% |
| >0.80 | -462,000 / -20% | -986,000 / -18% |
| >0.60 | -453,000 / -17% | -1,016,000 / -14% |
| >0.01 | -436,000 / -11% | -1,655,000 / -7% |
14.5 COMPOSITES
From the sampling length statistics, AGP elected to use a composite length of 3.0 m. The composite size selected is above the third quartile, and allows grade variations to be represented while reducing the variance.
Assays were length-weight averaged, and any grade capping was applied to the raw assay data prior to compositing. True gaps in sampling, and samples below detectable limits, were composited at zero grade. There was no stope void, drift, or other underground excavation that needed to be considered while compositing the raw assays.
The 3.0 m composite intervals were created moving downward from
the collar of the holes toward the hole bottoms. Composite lengths are
automatically adjusted by the software to leave no remnants. The adjustment
resulted in composite lengths ranging between 1.51 m and 4.49 m, with mean and
median of 3.0 m, and a standard deviation of 0.11. Table 14-9 and Table 14-10
show the descriptive statistics for gold and silver composites within the
various domains.
|
|
128 |
| ANA PAULA PROJECT |
| FORM 43-101F1 TECHNICAL REPORT |
Table 14-9: Gold Composite Statistics by Domains
| Domain |
ALL |
INTRS | MBX | SED | SKNHF | SULPH | CBX | INTRS | SED | SKNHF | SULPH |
| Outside the Halo | Inside the Halo | ||||||||||
| Valid cases | 40820 | 22806 | 607 | 8877 | 3276 | 11 | 1115 | 2830 | 431 | 814 | 53 |
| Mean | 0.33 | 0.17 | 0.40 | 0.04 | 0.23 | 1.37 | 3.08 | 1.11 | 0.76 | 1.23 | 8.21 |
| Variance | 1.96 | 0.11 | 0.19 | 0.04 | 0.26 | 1.56 | 31.57 | 5.33 | 4.40 | 6.31 | 61.46 |
| Std. Deviation | 1.40 | 0.34 | 0.44 | 0.20 | 0.51 | 1.25 | 5.62 | 2.31 | 2.10 | 2.51 | 7.84 |
| Variation Coefficient | 4.2 | 2.0 | 1.1 | 4.6 | 2.2 | 0.9 | 1.8 | 2.1 | 2.8 | 2.0 | 1.0 |
| Minimum | 0.00 | 0.00 | 0.00 | 0.00 | 0.00 | 0.04 | 0.01 | 0.00 | 0.00 | 0.01 | 0.00 |
| Maximum | 47.80 | 7.41 | 3.08 | 5.82 | 6.57 | 4.23 | 47.80 | 45.76 | 14.34 | 29.90 | 35.00 |
| 1st percentile | 0.00 | 0.00 | 0.00 | 0.00 | 0.00 | ---- | 0.01 | 0.02 | 0.00 | 0.02 | ---- |
| 5th percentile | 0.00 | 0.01 | 0.01 | 0.00 | 0.01 | ---- | 0.05 | 0.06 | 0.00 | 0.07 | 0.01 |
| 10th percentile | 0.00 | 0.01 | 0.02 | 0.00 | 0.01 | 0.04 | 0.10 | 0.09 | 0.00 | 0.10 | 0.92 |
| 25th percentile | 0.01 | 0.03 | 0.08 | 0.00 | 0.03 | 0.19 | 0.29 | 0.18 | 0.01 | 0.20 | 2.08 |
| Median | 0.06 | 0.08 | 0.28 | 0.01 | 0.08 | 1.30 | 0.80 | 0.43 | 0.05 | 0.45 | 6.30 |
| 75th percentile | 0.20 | 0.17 | 0.56 | 0.02 | 0.20 | 1.91 | 2.77 | 1.06 | 0.33 | 1.20 | 11.53 |
| 90th percentile | 0.58 | 0.37 | 0.92 | 0.06 | 0.53 | 3.91 | 9.99 | 2.51 | 1.94 | 2.79 | 19.44 |
| 95th percentile | 1.16 | 0.59 | 1.32 | 0.15 | 0.97 | ---- | 15.16 | 4.37 | 4.33 | 4.92 | 28.15 |
| 99th percentile | 5.09 | 1.51 | 2.16 | 0.89 | 2.61 | ---- | 27.38 | 10.77 | 12.99 | 13.62 | ---- |
Table 14-10: Silver Composite Statistics by Domains
| Domain | ALL | INTRS | MBX | SED | SKNHF | SULPH | CBX | INTRS | SED | SKNHF | SULPH |
| Outside the Halo | Inside the Halo | ||||||||||
| Valid cases | 40820 | 22806 | 607 | 8877 | 3276 | 11 | 1115 | 2830 | 431 | 814 | 53 |
| Mean | 2.3 | 2.5 | 4.7 | 1.1 | 2.2 | 27.1 | 5.0 | 2.6 | 2.5 | 2.9 | 18.2 |
| Variance | 24.3 | 26.4 | 44.7 | 7.4 | 26.8 | 1400.0 | 48.2 | 14.3 | 28.6 | 31.9 | 350.3 |
| Std. Deviation | 4.9 | 5.1 | 6.7 | 2.7 | 5.2 | 37.4 | 6.9 | 3.8 | 5.3 | 5.6 | 18.7 |
| Variation Coefficient | 2.1 | 2.0 | 1.4 | 2.4 | 2.3 | 1.4 | 1.4 | 1.4 | 2.1 | 2.0 | 1.0 |
| Minimum | 0.0 | 0.0 | 0.1 | 0.0 | 0.1 | 0.2 | 0.1 | 0.1 | 0.1 | 0.1 | 0.6 |
| Maximum | 110.7 | 110.7 | 45.4 | 60.0 | 80.0 | 105.8 | 48.4 | 43.2 | 44.2 | 45.7 | 102.9 |
| 1st percentile | 0.1 | 0.1 | 0.2 | 0.1 | 0.1 | ---- | 0.1 | 0.1 | 0.1 | 0.1 | ---- |
| 5th percentile | 0.1 | 0.2 | 0.4 | 0.1 | 0.1 | ---- | 0.2 | 0.2 | 0.1 | 0.1 | 0.8 |
| 10th percentile | 0.2 | 0.3 | 0.7 | 0.1 | 0.2 | 0.2 | 0.3 | 0.3 | 0.1 | 0.2 | 1.9 |
| 25th percentile | 0.4 | 0.6 | 1.3 | 0.3 | 0.3 | 0.5 | 0.5 | 0.7 | 0.3 | 0.3 | 6.1 |
| Median | 1.0 | 1.2 | 2.3 | 0.5 | 0.8 | 7.0 | 1.8 | 1.4 | 0.7 | 0.8 | 12.4 |
| 75th percentile | 2.2 | 2.5 | 4.4 | 1.0 | 2.0 | 54.7 | 6.8 | 3.0 | 1.8 | 2.1 | 20.4 |
| 90th percentile | 4.9 | 5.1 | 12.4 | 2.0 | 4.8 | 101.4 | 14.5 | 5.7 | 6.1 | 8.0 | 48.5 |
| 95th percentile | 8.5 | 8.4 | 18.7 | 3.5 | 8.4 | ---- | 19.9 | 8.6 | 13.8 | 14.7 | 52.5 |
| 99th percentile | 24.5 | 24.7 | 38.3 | 12.1 | 25.2 | ---- | 30.2 | 21.4 | 28.9 | 29.2 | ---- |
The final composites coded use for the interpolation were
created by adding the lithology code, halo code and high grade probabilistic
model code.
|
|
129 |
| ANA PAULA PROJECT |
| FORM 43-101F1 TECHNICAL REPORT |
14.6 BULK DENSITY
Ana Paula provided 5,946 useable bulk density measurements. Samples were weighted using a traditional Sauter TB-2610 triple beam scale, equipped with an under hook to allow the samples to be weighed dry on the platen and then re-weighed suspended in water. Core samples were reportedly solid and did not require coating with paraffin or shellac.
The 5,946 samples collected, averaged 2.45 g/cm3 in alluvial and between 2.51 g/cm3 and 2.81 g/cm3 in rock with sulphide being the exception at 3.36 g/cm3. The mineralized zones contain significant sulphide minerals in various lithologies, and it was therefore deemed prudent to investigate the average bulk density for each of the lithological units. Since gold is in part related to sulphide, it is therefore not surprising that the density generally increased with the gold values and the bulk densities were found to be higher in the mineralized halo. The use of a regression, to calculate the bulk density based on the gold values, was not advisable due to the low regression R2. Since the bulk density data is well distributed throughout the model, AGP elected to assign a base bulk density for each domain and then interpolate a bulk density to honour local variations. Table 14-11 shows the base bulk density assigned to the domains. The interpolated bulk density relied on an inverse distance squared methodology carried out in one pass using a minimum of 4 samples / maximum of 15 samples, and a maximum of 3 samples originating from a single drill hole. The sample search ellipsoid was oriented at 355 azimuths with a 60-degree dip to the west. The maximum range was 90 m. Using these parameters, a total of 936,003 blocks were interpolated representing 4.3% of the model.
Table 14-11: Bulk Density by Domains
| Domain (Domain Code) |
Bulk Density (g/cm3) |
| INTRS (2000) | 2.60 |
| MBX (6100) | 2.52 |
| SED (1200) | 2.66 |
| SKNHF (4000) | 2.79 |
| SULPH (6500) | 3.31 |
| CBX_Halo (6050) | 2.78 |
| INTRS_Halo (2050) | 2.61 |
| SED_Halo (1250) | 2.70 |
| SKNHF_Halo (4050) | 2.74 |
| SULPH_Halo (6550) | 3.31 |
14.7 SPATIAL ANALYSIS – VARIOGRAPHY
Geostatisticians use a variety of tools to describe the pattern of spatial continuity, or strength of the spatial similarity of a variable with separation distance and direction. If we compare samples that are close together, it is common to observe that their values are quite similar. As the distance between samples increases, there is likely to be less similarity in the values. The experimental variogram mathematically describes this process. It is commonly represented as a graph that shows the variance in measurements with distance between all pairs of sampled locations.
In all semi-variograms, the distance where the model first flattens out is known as the range. Sample locations separated by distances closer than the range are believed to be spatially auto-correlated. The sill is the value on the Y-axis where the model attains the range, while the nugget is the value at the location where the model intercepts the Y-axis. The nugget typically represents variation at a micro scale that can be attributed to measurement errors, sources of variation at distances smaller than the sampling interval, or both. Therefore, the shape of the semi-variogram describes the pattern of spatial continuity. A very rapid decrease near the origin indicates short-scale variability. A more gradual decrease moving away from the origin suggests longer-scale continuity.
|
|
130 |
| ANA PAULA PROJECT |
| FORM 43-101F1 TECHNICAL REPORT |
Various semi-variogram types exist; using Geovia GEMS™ software, experimental pair-wise relative variograms for gold and silver were computed for the various lithological domains.
The resulting anisotropy models generated were visually inspected in GEMS 6.7.4™ to ensure the ellipsoid model corresponded well with the expected orientation of the deposit.
For gold, the effective range at 97% of the sill along the apparent plunge of the mineralization averaged 80 m. The nugget effect is moderate, at about 40% of the sill value. At 100% of the sill, the maximum range is estimated to be between 74 m and 118 m. The definition of the variogram, near the origin, is good when the lag distances are adjusted to the drill angle. Figure 14-3 illustrates one example of a final variogram model, along with a plan view of the ellipsoid generated by GEMS software (Figure 14-3). The direction and plunge represented by the variogram coincide with the known interpreted plunge of the mineralization. The variography is considered representative of the trend of the mineralization. As a result, AGP elected to interpolate the grade model using ordinary kriging. For silver, the effective range is somewhat longer.
![]()
Figure 14-3: Example Variogram INTRS Gold Domain
Table 14-12 and Table 14-13 list the variogram parameters used
in the model for gold and silver respectively. The variograms were fitted using
the GEMS “Azimuth-Dip-Azimuth” rotation method which is independent of the block
model orientation. This method relies on the three axes to be orthogonal to each
other. The first and second axis rotations represent true azimuth and dip of the
Ax axis. The dip angle is non-zero and a negative figure points downward. The
third rotation represents the azimuth of the Ay axis.
|
|
131 |
| ANA PAULA PROJECT |
| FORM 43-101F1 TECHNICAL REPORT |
Table 14-12: Gold Variogram Parameters
| Domain Code | Model | Nugget | C1 | C2 | ADA (degree) | C1 Range (m) | C2 Range (m) |
| 1200, 1201 | Spherical | 0.334 | 0.255 | 0.210 | 297, -79, 265 | 23.4, 19.2, 18.0 | 105.6, 86.6, 81 |
| 2000, 2001, 6500 | Spherical | 0.372 | 0.273 | 0.249 | 14, 54, 144 | 22.8, 20.6, 14.1 | 108, 97.7, 67 |
| 4000, 4001 | Spherical | 0.851 | 0.309 | 1.051 | 346, -54, 206 | 26.3, 26.3, 9.9 | 121.2, 121.2, 45.6 |
| 6050 | Spherical | 0.491 | 0.702 | 0.607 | 26, 68, 163 | 25.3, 19.6, 20.7 | 122.7, 95.4, 100.3 |
| 1250, 2050, 4050, 6550, 6100 | Spherical | 0.369 | 0.209 | 0.298 | 20, 63, 78 | 19.2, 14.2, 9.2 | 81.9, 60.4, 39.2 |
Table 14-13: Silver Variogram Parameters
| Domain Code | Model | Nugget | C1 | C2 | ADA (degree) | C1 Range (m) | C2 Range (m) |
| 1200, 1201 | Spherical | 0.142 | 0.295 | 0.133 | 304, -63, 282 | 51, 49.6, 44.5 | 165.9, 161.4, 144.8 |
| 2000, 2001, 6500 | Spherical | 0.218 | 0.153 | 0.172 | 45, 76, 159 | 22.9, 20.1, 9.7 | 96.3, 84.4, 40.8 |
| 4000, 4001 | Spherical | 0.300 | 0.258 | 0.109 | 315, -76, 171 | 47.8, 39.3, 25.5 | 114.1, 93.8, 60.8 |
| 6050 | Spherical | 0.267 | 0.141 | 0.174 | 12, 49, 132 | 26.9, 26.9, 11.8 | 143.4, 143.4, 63 |
| 1250, 2050, 4050, 6550, 6100 | Spherical | 0.288 | 0.215 | 0.210 | 26, 68, 72 | 24.8, 14.1, 15.8 | 136.9, 77.9, 86.8 |
14.8 SEARCH ELLIPSOID DIMENSION AND ORIENTATION
While it is common to use the variogram model as a guide to set the search ellipsoids’ ranges and attitudes, the geologist modelling the deposit must consider the strike and dip of the mineralized horizon, and the drill hole spacing and distribution. For this model, AGP used the overall geometry as confirmed by the variography as guiding principles to set the search ellipsoid orientation.
The first pass maximum range was sized to reach at least the next drill section. A 1.8 x multiplier (from Pass 1) was used to set the range of the second pass. The maximum range for the second interpolation pass was set to be close to the range displayed by the variogram at 97% of the sill. Lastly, a 2.0 x multiplier (from Pass 2) was used to set the range for the third interpolation pass, which typically exceeded the maximum range displayed by the variograms.
The search ellipsoids dimension and orientation applied for both the gold and silver interpolation plan, was also kept consistent for all domains located within the high-grade HALO.
Table 14-14 lists the final values used in the resource model for the range of the major, semi-major, and minor axes. Rotation angles are based on the GEMS ZXZ methodology, which uses a conventional right-hand rule.
Table 14-14: Search Ellipsoid Dimensions and Orientation
| Domain Code | ZXZ (degrees) | Pass 1 (m) | Pass 2 (m) | Pass 3 (m) |
| SED (1200) | -70, 60, -45 | 42, 35, 32 | 76, 63, 58 | 151, 125, 117 |
| SED in Halo (1250) | 12, -10, 0 | 30 20, 37 | 60, 40, 74 | 120, 80, 148 |
| INTRS (2000) | -78, 60, 40 | 38, 43, 27 | 74, 82, 51 | 149, 164, 102 |
| INTRS in Halo (2050) | 12, -10, 0 | 30, 20, 47 | 60, 40, 74 | 120, 80, 148 |
| SKNHF (4000) | -85, 60, -45 | 52, 52, 19 | 94, 94, 35 | 187, 187, 70 |
| SKNHF in Halo (4000) | 12, -10, 0 | 30, 20, 27 | 60, 40, 74 | 120, 80, 148 |
| CBX (6050) | 12, -10, 0 | 38, 38, 50 | 68, 68, 89 | 136, 136, 178 |
| MBX (6100) | 12, -10, 0 | 38, 38, 50 | 68, 68, 89 | 136, 136, 178 |
| SULPH (6500) | 12, -10, 0 | 38, 38, 50 | 68, 68, 89 | 136, 136, 178 |
| SULPH in Halo (6550) | 12, -10, 0 | 38, 38, 50 | 68, 68, 89 | 136, 136, 178 |
|
|
132 |
| ANA PAULA PROJECT |
| FORM 43-101F1 TECHNICAL REPORT |
14.9 RESOURCE BLOCK MODEL MATRIX
The block model was constructed using GEMS 6.7.4™ . An equidistant block size of 5 m horizontally by 5 m across by 6 m vertically was selected based on mining selectivity considerations and the density of the dataset. This block matrix size assumed a small to mid-size open pit operation and is also suitable for long hole underground operation. The block matrix size is adequate for the area covering the resource constraining shell. Further away from the shell, the drill pattern is too wide to support the small matrix size. This will likely be resolved in the future with increased coverage of in-fill drilling.
The block model was defined on the project coordinate system with a 0-degree rotation. Table 14-15 lists the upper southeast corner of the model, and is defined on the block edge.
The final domain codes controlling the interpolation were coded by adding the lithological code with the Halo code and the high grade probabilistic code.
Table 14-15: Block Model Definition (Block Edge)
| Resource Model Items | Parameters |
| Easting | 408,400 |
| Northing | 1,997,000 |
| Top relative elevation | 1,406 |
| Rotation angle (counterclockwise) | 0 |
| Block size (X, Y, Z in meters) | 5 x 5 x 6 |
| Number of blocks in the X direction | 500 |
| Number of blocks in the Y direction | 440 |
| Number of blocks in the Z direction | 276 |
Originally, the entire block model matrix was to be estimated in order to evaluate the upside potential of the south- west portion of the deposit. However, the drill density west of coordinate 409,550 was not sufficient to reliably estimate a grade. Additionally, there is an apparent change in the direction of the lithologies in the western portion of the deposit that was not yet represented with the wireframes received from Alio Gold. As a result, the western part of the block model matrix remains un-interpolated. The interpolated blocks were flagged with a code of 1 in the model name “Interpolated blocks”. Non-interpolated blocks were flagged with a code of 2.
14.10 INTERPOLATION PLAN
The resource model was created in GEMS 6.7.4™ with a single folder setup, using ordinary kriging for interpolating the gold and silver grade. A nearest neighbor (NN) model and inverse distance to the power of two (ID2) were also interpolated to be used for validation. The interpolation was carried out in a multi-pass approach, with an increasing search dimension coupled with decreasing sample restrictions.
-
Pass 1 used an ellipsoid search with 7 minimum / 15 maximum samples. A maximum of 3 samples per hole was imposed on the data selection, forcing a minimum of 3 holes to be used in the search.
-
Pass 2 used an ellipsoid search with 5 minimum / 15 maximum samples. A maximum of 3 samples per hole was imposed on the data selection, forcing a minimum of 2 holes to be used in the search.
-
Pass 3 used an ellipsoid search with 4 minimum / 18 maximum samples. A maximum of 3 samples per hole was imposed on the data selection, forcing a minimum of 2 holes to be used in the search.
Contact profiles for the MBX domain indicated a gradational contact with the SED and INTRS domains. The contact profiles also revealed that the boundary at the edge of the HALO displayed a short gradational contact with the lithologies outside the halo. This was assumed by AGP to affect the high-grade composites for the lithologies outside the halo. Therefore, for Pass 1 only, the interpolation plan blended the composite as indicated in Table 14-16.
|
|
133 |
| ANA PAULA PROJECT |
| FORM 43-101F1 TECHNICAL REPORT |
Table 14-16: Boundary Treatment
| Interpolated Domain Code | Pass 1 Composite Code Visible | Pass 2 or 3 Composite Code Visible | ||
| SED (1200) | 1200 | 6100 | 1200 | |
| SED in High grade prob model (1201) | 1201 | 1250 | 1201 | |
| SED in Halo (1250) | 1250 | 1201 | 1250 | |
| INTRS (2000) | 2000 | 6100 | 2000 | |
| INTRS in High grade prob model (2001) | 2001 | 2050 | 2001 | |
| INTRS in halo (2050) | 2050 | 2001 | 2050 | |
| SKNHF (4000) | 4000 | 4000 | ||
| SKHHF in high grade probability model (4001) | 4001 | 4050 | 4001 | |
| SKNHF in Halo (4050) | 4050 | 4001 | 4050 | |
| CBX (6050) | 6050 | 6050 | ||
| MBX (6100) | 6100 | 1200 | 2000 | 6100 |
| SULPH (6500) | 6500 | 6500 | ||
| SULPH in Halo (6550) | 6550 | 6550 | ||
The interpolation plan mitigates high grade searing in the relatively un-restricted lithological domains outside the halo, while acknowledging the location halo boundary is somewhat arbitrary. The plan also prevents blending of the composites as the sample search ellipsoid size increases since this would reflect a true soft boundary which was not seen in the contact profile. The boundary treatment was assumed to be the same for gold and silver for this prefeasibility model however, additional work is required to validate this assumption.
14.11 MINERAL RESOURCE CLASSIFICATION
Several factors are considered in the definition of a resource classification:
-
Canadian Institute of Mining (CIM) requirements and guidelines (2014)
-
experience with similar deposits
-
spatial continuity
-
confidence limit analysis
-
geology
No environmental, permitting, legal, title, taxation, socioeconomic, marketing, or other relevant issues are known to the author that may currently affect the estimate of mineral resources. Mineral resources, which are not mineral reserves, do not have demonstrated economic viability. Mineral reserves can only be estimated based on an economic evaluation used in a prefeasibility or feasibility study of a mineral project and are a subset of the mineral resources.
Typically, the confidence level for a grade in the block model is reduced with the increase in the search ellipsoid size, along with the diminishing restriction on the number of samples used for the grade interpolation. This is essentially controlled by the pass number of the interpolation plan, as described in the previous section. A common technique is to categorize a model based on the pass number and distance to the closest sample. For the Ana Paula deposit, in addition to using the pass number and the average distance to the composites, AGP adjusted the classification based on several factors such as kriging efficiency and proximity to surface exposures. Lastly, a core area model was used to adjust the classification outside the most densely drilled area. In this context, the core area is an area well covered by drilling (typically < 60 m drill spacing) where the QP believes the continuity of the mineralization has been well demonstrated.
|
|
134 |
| ANA PAULA PROJECT |
| FORM 43-101F1 TECHNICAL REPORT |
Three confidence categories exist in the model. The usual CIM guideline classes of Measured, Indicated, and Inferred are coded 1, 2, and 3, respectively. A special Code 4, represents material that was outside of the criteria used to classified the resources. The assigned code 4 was kept in the resource model files solely to aid Alio Gold staff in conducting its exploration activity. Table 14-17 lists the parameters used to code the classification model, and Figure 14-4 illustrates a representative section of the block classification of the Fox deposit.
Table 14-17: Classification Parameters
| Pass Number | Retained As | Downgraded To |
| Pass 1 | Measured in areas within 75 meter of surface or average distance to composites < 40 m |
Indicated if below 575m elevation or average distance to composites is > 40m and < 75m or kriging efficiency is < 0 or kriging efficiency outside the Halo is < 0.20 |
| Pass 2 | Indicated if average distance to composites is <75 m |
Inferred if average distance to composites is ≥75 m and <150 m or if the krige efficiency is < -0.15 |
| Pass 3 | Inferred if average distance to composites is <150 m |
Assigned Code 4 if the average distance to composites is ≥150 m or if the krige efficiency is <-0.15. These blocks were removed from the resources. |
Additional modifiers were used in addition to the above parameters:
-
indicated blocks supported only by two drill holes were downgraded to Inferred
-
blocks located outside the core area were downgrade from Indicated to Inferred and Inferred were removed from the resources
Final adjustments to the classification of individual block values are often required to create areas suitable for mine planning. This is accomplished by using a GEMS™ Cypress-enabled script that adjusts, or “grooms”, the confidence category of isolated blocks to create contiguous resource blocks with reasonably smooth class values. The classifications of isolated blocks were upgraded or downgraded depending on the classifications of the 26 surrounding blocks. AGP validated the final block classification visually. AGP also generated histograms of the distance to the closest composites versus the class model value to evaluate the class model for reasonability. During the validation process, it was noted several areas of isolated pockets of Measured blocks exist in the model. While these areas have excellent data support, it is recommended for the feasibility model, that these areas be evaluated separately and manually cleaned up if necessary.
Within the eastern area of the model, 11% of the blocks were
classified as Measured, Indicated, or Inferred. The remaining blocks were either
interpolated and coded 4 or not be interpolated and therefore bore no grade. For
the blocks classed as Measured, Indicated, and Inferred the proportion of each
category is 3.5% Measured, 45.9% Indicated, and 50.5% Inferred (Figure 14-4).
|
|
135 |
| ANA PAULA PROJECT |
| FORM 43-101F1 TECHNICAL REPORT |

Figure 14-4: Model Classification
14.12 BLOCK MODEL VALIDATION
The Ana Paula grade models were validated by four methods:
-
visual comparison of colour-coded block model grades with composite grades on sections and plans
-
comparison of the global mean block grades for OK, ID2, NN models, composite, and raw assay grades
-
comparison using grade profiles to investigate local bias in the estimate
-
naïve cross-validation tests with composite grade versus block model grade
14.12.1 Visual Comparison
The visual comparison of block model grades on sections and plans indicated a good correlation between drill hole grade and resource model grade (Figure 14-5) especially near the CBX and surrounding HALO.
While the grade correlation is good, visually the gold grade model appears somewhat boxed in by the lithological contacts. This is in part due to the grade transition at the boundaries which are driven by the contact profile. Within the HALO, the grade interpolation is carried out independently for each lithology, which also promotes a reduction of the grade smoothing. For the feasibility study, AGP recommends revisiting the grade contact profile and investigating if a revised high-grade probabilistic model may be used as a surrogate to the HALO, subsequently simplifying the procedure. This may allow the model to breathe more, resulting in a smoother grade distribution.
|
|
136 |
| ANA PAULA PROJECT |
| FORM 43-101F1 TECHNICAL REPORT |
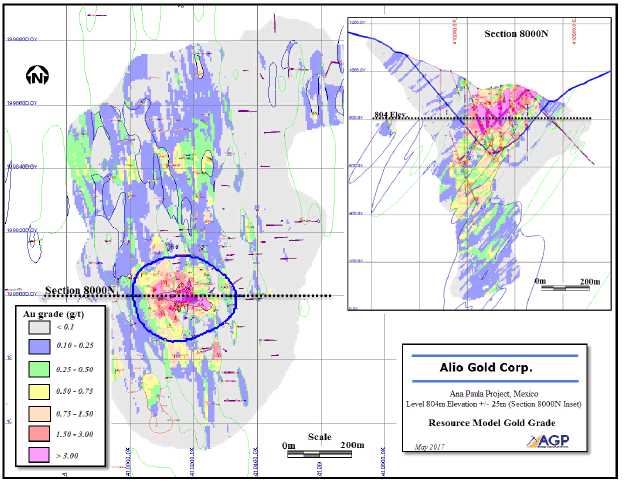
Figure 14-5: Gold Grade Model Distribution
14.12.2 Global Comparison
Table 14-18 shows the grade statistics for the raw assays, composites, NN, ID2, and OK models. Statistics for the gold and silver composite mean grades compare well to the raw assay grades, with a normal reduction in values due to smoothing, related to volume variance. The block model mean grade, when compared against the composites, showed a normal reduction in values. More importantly, the grade of the NN, ID2, and OK models are within 2% of each other, indicating the methodology used did not introduce a bias into the estimate.
Table 14-18: Global Comparisons (Measured, Indicated, and Inferred)
Methodology |
Au (g/t) @ > 0.0 cut-off (Class 1-3) |
Ag (g/t) @ > 0.0 cut-off (Class 1-3) |
| Raw assays uncapped at 0.0 Cut-off (clustered/declustered) | 0.517/0.238 | 3.03/2.69 |
| Composite capped at 0.0 Cut-off (clustered/declustered) | 0.376/0.184 | 2.40/2.28 |
| Nearest neighbour (NN) | 0.180 | 2.00 |
| Inverse distance squared using true distance (ID) | 0.177 | 1.99 |
| Ordinary krige | 0.178 | 2.02 |
|
|
137 |
| ANA PAULA PROJECT |
| FORM 43-101F1 TECHNICAL REPORT |
14.12.3 Local Comparisons – Grade Profiles
Comparison of the grade profiles (swath plots) of the raw assay, composites, and estimated grades allow for a visual verification of an over or under estimation of the block grades at the global and local scales. A qualitative assessment of the smoothing and variability of the estimates can also be observed from the plots. The output consists of three swath plots, generated at 50 m intervals in the X direction, 50 m in the Y direction, and 50 m vertically.
The OK and ID2 estimates should be smoother than the NN estimate; the NN estimate should fluctuate around the OK and ID2 estimates on the plots, or display a slightly higher grade. The composite line is generally located between the assay and the interpolated grade. A model with good composite distribution should show very few crossovers between the composite and the interpolated grade line on the plots. In the fringes of the deposit, as composite data points become sparse, crossovers are often unavoidable. The swath size also controls this effect to a certain extent; if the swaths are too small, fewer composites will be encountered, which usually results in erratic lines on the plots.
In general, the swath plots show good agreement, with the three methodologies showing no major local bias. The peaks and valleys on the assay and composite lines are well represented, but more subdued in the resource model due to smoothing. The effect of capping the assays is readily visible in the plots, and the search restrictions on the mild outliers appear to have normalized the grade. Grade profiles for gold are presented in Figure 14-6 and Figure 14-7. The profile for the Z chart was omitted.

Figure 14-6: X-Axis Grade Profile
|
|
138 |
| ANA PAULA PROJECT |
| FORM 43-101F1 TECHNICAL REPORT |

Figure 14-7: Y Axis Grade Profile
14.12.4 Naïve Cross-Validation Test
A comparison of the average grade of the composites within a block with the estimated grade of that block provides an assessment of the estimation process close to measured data. Pairing of these grades on a scatter plot gives a statistical valuation of the estimates. This methodology is distinct from “jackknifing,” which replaces a composite with a pseudo-block at the same location, and evaluates and compares the estimated grade of the pseudo-block against that of the composite grade.
With the naïve cross validation test, it is anticipated the estimated block grades should be similar (while not exactly the same value) to the composited grades within the block. This is especially true with deposits bearing a higher nugget component.
A high correlation coefficient (R2) indicates satisfactory interpolation process results, while a medium to low correlation coefficient indicates larger differences in the estimates, or a low data density, which would suggest a further review of the interpolation process. Results from the pairing of the composited and estimated grades within blocks pierced by a drill hole are presented in Figure 14-8. Following the removal of 183 outliers (out of 24,711 pairs), the R2 value is considered high for a gold deposit, at 0.88 R2 (0.76 R2 before outlier’s removal).
The regression residuals are the differences, on a case-by-case
basis, between the actual Y values and the values calculated by the best-fit
equation. These can be evaluated for normality and randomness. The inset image
in Figure 14-8 shows the residual distribution. The chart shows a normal
distribution with a small negative bias.
|
|
139 |
| ANA PAULA PROJECT |
| FORM 43-101F1 TECHNICAL REPORT |

Figure 14-8: Naïve Cross Validation Test Results
14.13 MINERAL RESOURCE TABULATION
Effective May 16, 2017, AGP completed an update of the May 26, 2016 estimate completed by JDS Energy and Mining Inc. for the Ana Paula project located near the municipalities of Cuetzala del Progresos, and Apaxtla del Castregon, Guerrero State, Mexico. The mineral resource presented herein is in conformance with the CIM Mineral Resource definitions referred to in NI 43-101 Standards of Disclosure for Mineral Projects.
The Ana Paula model was interpolated using 276 core holes completed by Goldcorp Corporation in 2005, Newstrike Capital from 2010 through 2015 and Timmins Gold (now Alio Gold Corp.) since 2015. The database totaled 123,268 m of core and 86,013 assays. The estimate takes into account all data that was available prior to March 15, 2017.
The estimate was completed based on the concept of a small to medium scale open pit, with a possible resource for an underground operation for the material remaining below the pit bottom.
The resource estimate consists of a combination of Measured, Indicated, and Inferred resources. Based on current exploration drilling data, the bulk of the mineralization is clustered in and around the CBX lithological unit. This lithological unit consists of a core of multi-lithic breccia in a steeply south plunging column surrounded by an alteration halo bearing high grade mineralization which is characterized by veins, fracture zones, and massive sulfide contact replacements. Grade tends to be highest from the center of the complex breccia and extending from 100 m to 150 m into the sediments, intrusive, and hornfels lithology. The vertical extent of the Complex Breccia has been modelled to a depth of 950 m below surface and it is currently limited by drilling.
From the geometry described, the deposit is amenable to open
pit extraction followed by a potential underground operation, likely using a
bulk mining method such as long-hole or modified Avoca mining method, with or
without backfill.
|
|
140 |
| ANA PAULA PROJECT |
| FORM 43-101F1 TECHNICAL REPORT |
14.13.1 Marginal Cut-off Grade for Resource Estimate
Under CIM definitions, Mineral Resources should have a reasonable prospect of economic extraction. A gold price of US$1,350/ounce and a silver price of US$17/ounce was used for the cut-off determination. For open pit resources, a cut-off of 0.6 g/t gold was used. Resources below the open pit shell used a cut-off of 1.65 g/t gold to define possible underground resources. The economic calculation to support this estimate is provided in Table 14-19.
Table 14-19: Breakeven Cut-off Grade for Resource
| Ana Paula Project | Unit | Gold | Silver |
| World Price | US$/ounce | $1,350 | $17.00 |
| Payables | % | 99% | 99% |
| Refining, transportation | US/ounce | $20.00 | $0.25 |
| Royalty | % | 2.5% | 2.5% |
| Net Price | US$/ounce | $1,138.80 | $15.20 |
| Unit | Open Pit | Underground | |
| Mining | US$/t moved | $2.25 | $36.00 |
| Milling | US$/t mill feed | $19.00 | $19.00 |
| G&A | $/t mill feed | $2.49 | $2.49 |
| Process Recovery | |||
| Gold | % | 88% | 88% |
| Silver | % | 30% | 30% |
| Wall Slopes (inter-ramp/overall) | |||
| Sector A | degrees | 56/50 | - |
| Sector B | degrees | 58/49 | - |
| Sector C | degrees | 58/49 | - |
| Sector D | degrees | 58/49 | - |
| Sector E | degrees | 58/50 | - |
| Sector F | degrees | 58/51 | - |
| Dilution considered for cutoff | % | 0% | 5% |
| Breakeven Cut-off | g/t Au | 0.60 | 1.65 |
14.13.2 Mineral Resource Amenable to Open Pit Extraction
To further assess reasonable prospects of economic extraction, a Lerchs-Grossman optimized shell was generated to constrain the potential open pit material. Parameters used to generate this shell included:
-
Average of 49.5° overall slopes for the pit shell
-
USD $2.25/t mining, USD $19/t milling, USD $2.49/t G&A operating costs
-
88% gold recovery, 30% silver recovery
-
Gold price of $1,350/ounce and $17/ounce silver price
-
Above criteria was applied to Measured, Indicated, and Inferred materials
14.13.3 Mineral Resource Amenable to Underground Extraction
As mentioned above, from the geometry described, the material amenable to underground extraction will likely be using a bulk mining method such as long-hole or modified Avoca mining method, with or without backfill. In order to asses the reasonable prospects of economic extraction below the resource constraining shell, blocks grading above 1.65 g/t Au break-even cut-off were selected based on the economic parameters shown in table 14-19. The break-even cut-off stated is only applicable to the material in the vicinity of the mineralized HALO due to increase in development cost reaching blocks further away. For this reason, all blocks of a nominal 5m x 5m horizontal dimension and 6m vertically that werelocated beyond 180 m from the center of the CBX were eliminated from the set. The remaining blocks were groomed to eliminate as much as possible single isolated blocks. The majority of the remaining blocks coalesced into bulk mineable shapes with some minor exceptions (Figure 14-9).
|
|
141 |
| ANA PAULA PROJECT |
| FORM 43-101F1 TECHNICAL REPORT |
Lastly, the QP would like to caution the reader that no mining plan exists for the material amenable to underground extraction and therefore stope size, level spacing and other underground mining criteria have not yet been established.
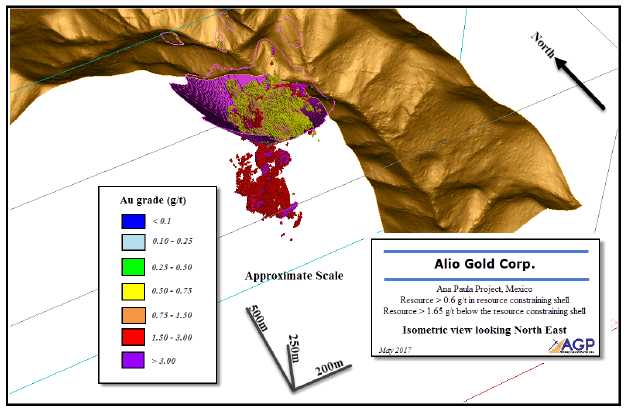
Figure 14-9: Resource Blocks
14.13.4 Mineral Resource
Within the resource constraining shell, at the greater than 0.6 g/t Au cut-off selected, the updated model returns a total of 7,541,000 Measured tonnes grading at 2.43 g/t Au and 5.1 g/t Ag containing 590,000 ounces of gold and 1,236,000 ounces of silver. Indicated tonnes amounted to 10,491,000 tonnes grading at 1.79 g/t Au and 4.8 g/t Ag containing 605,000 ounces of gold and 1,629,000 ounces of silver. The total Measured and Indicated resources within the constraining shell amounted to 18,032,000 tonnes grading at 2.06 g/t Au and 4.9 g/t silver containing 1,195,000 ounces of gold and 2,865,000 silver ounces.
Below the constraining shell, and reported at a greater than
1.65g/t Au, the updated model returns 41,000 tonnes of Measured resources
grading at 2.07 g/t Au and 4.3 g/t Ag containing 2,800 ounces of gold and 6,000
ounces of silver. Indicated resources amounted to 2,925,000 tonnes grading 2.81
g/t Au and 4.2 g/t Ag containing 264,000 ounces of gold and 398,000 ounces of
silver. The total Measured and Indicated resources below the constraining shell
amounted to 2,967,000 tonnes grading at 2.80 g/t Au and 4.2 g/t Ag containing
266,700 ounces of gold and 404,000 ounces of silver.
|
|
142 |
| ANA PAULA PROJECT |
| FORM 43-101F1 TECHNICAL REPORT |
Inferred resources within the resource constraining shell, and reported at greater than 0.6 g/t Au, amounted to 249,000 tonnes grading at 1.27 g/t Au and 8.8 g/t Ag containing 10,000 ounces of gold and 70,000 ounces of silver.
Below the constraining shell, and reported at a greater than 1.65 g/t Au cut-off, the updated model returned 621,000 tonnes of Inferred resources grading at 2.07 g/t Au and 3.9 g/t Ag containing 41,400 ounces of gold and 79,000 ounces of silver.
14.13.5 Ana Paula Total Resources
The Ana Paula Project total Measured resources amounted to 7,582,000 tonnes grading at 2.43 g/t Au and 5.1 g/t Ag containing 592,800 ounces of gold and 1,242,000 ounces of silver. Indicated resources amounted to an additional 13,416,000 tonnes grading 2.01 g/t Au and 4.7 g/t Ag containing 869,000 ounces of gold and 2,027,000 ounces of silver. The total Measured and Indicated resources amounted to 20,998,000 tonnes grading at 2.17 g/t Au and 4.8 g/t Ag containing 1,461,800 ounces of gold and 3,269,000 ounces of silver. Inferred resources added an additional 870,000 tonnes grading 1.84 g/t Au and 5.3 g/t Ag containing 51,400 gold ounces and 149,000 ounces of silver (Table 14-20).
Table 14-20: Ana Paula Resource Statement Effective May 16, 2017
| Area | Category | Cut-off (Au g/t) |
Tonnes | Au (g/t) |
Gold (ounces) |
Ag (g/t) |
Silver (ounces) |
| Resources amenable to open pit extraction |
Measured | 0.6 | 7,541,000 | 2.43 | 590,000 | 5.1 | 1,236,000 |
| Indicated | 10,491,000 | 1.79 | 605,000 | 4.8 | 1,629,000 | ||
| Measured & Indicated |
18,032,000 | 2.06 | 1,195,000 | 4.9 | 2,865,000 | ||
| Inferred* | 249,000 | 1.27 | 10,000 | 8.8 | 70,000 | ||
| Resources amenable to underground extraction |
Measured | 1.65 | 41,000 | 2.07 | 2,800 | 4.3 | 6,000 |
| Indicated | 2,925,000 | 2.81 | 264,000 | 4.2 | 398,000 | ||
| Measured & Indicated |
2,967,000 | 2.80 | 266,700 | 4.2 | 404,000 | ||
| Inferred* | 621,000 | 2.07 | 41,400 | 3.9 | 79,000 | ||
| Total Resources | Measured | OP 0.6 and UG 1.65 |
7,582,000 | 2.43 | 592,800 | 5.1 | 1,242,000 |
| Indicated | 13,416,000 | 2.01 | 869,000 | 4.7 | 2,027,000 | ||
| Measured & Indicated |
20,998,000 | 2.17 | 1,461,800 | 4.8 | 3,269,000 | ||
| Inferred* | 870,000 | 1.84 | 51,400 | 5.3 | 149,000 |
AGP is required to inform the public that the quantity and grade of Inferred resources reported above are conceptual in nature, and are estimated on the basis of limited geological evidence and sampling. Geological evidence is sufficient to imply but not verify geological and grade or quality continuity. For these reasons, an Inferred Mineral Resources has a lower level of confidence than an Indicated Mineral Resources and it is reasonably expected that the majority of Inferred Mineral Resources could be upgraded to Indicated Mineral Resources with continued exploration. Mineral Resources that are not Mineral Reserves do not have demonstrated economic viability. Rounding of tonnes as required by reporting guidelines may result in apparent differences between tonnes, grade, and contained metal content.
Table 14-21 shows the sensitivity of the model to changes in
cut-off within the resource constraining shell. Table 14-22 shows the
sensitivity of the model to changes in cut-off for the material amenable to
underground extraction. The base case cut-off of 0.6 g/t Au and 1.65 g/t Au is
highlighted in the tables.
|
|
143 |
| ANA PAULA PROJECT |
| FORM 43-101F1 TECHNICAL REPORT |
Table 14-21: Model Sensitivity to Cut-off within the Resource Constraining Shell
| Area | Category | Cut-off (Au g/t) |
Tonnes (million) |
Au (g/t) |
Gold (oz x1000) |
Ag (g/t) |
Silver (oz x1000) |
| Amenable to Open Pit extraction |
Measured | > 1.0 | 4.9 | 3.33 | 524 | 5.6 | 883 |
| > 0.9 | 5.4 | 3.12 | 539 | 5.5 | 944 | ||
| > 0.8 | 6.0 | 2.90 | 555 | 5.3 | 1,015 | ||
| > 0.7 | 6.7 | 2.67 | 572 | 5.2 | 1,111 | ||
| > 0.6 | 7.5 | 2.43 | 590 | 5.1 | 1,236 | ||
| > 0.5 | 8.5 | 2.21 | 608 | 5.0 | 1,382 | ||
| Indicated | > 1.0 | 5.8 | 2.61 | 490 | 5.5 | 1,033 | |
| > 0.9 | 6.6 | 2.42 | 514 | 5.3 | 1,131 | ||
| > 0.8 | 7.6 | 2.22 | 540 | 5.1 | 1,251 | ||
| > 0.7 | 8.9 | 2.01 | 571 | 5.0 | 1,415 | ||
| > 0.6 | 10.5 | 1.79 | 605 | 4.8 | 1,629 | ||
| > 0.5 | 12.4 | 1.60 | 639 | 4.7 | 1,886 | ||
| Measured + Indicated |
> 1.0 | 10.7 | 2.94 | 1,015 | 5.6 | 1,916 | |
| > 0.9 | 12.0 | 2.74 | 1,052 | 5.4 | 2,074 | ||
| > 0.8 | 13.5 | 2.52 | 1,095 | 5.2 | 2,266 | ||
| > 0.7 | 15.5 | 2.29 | 1,143 | 5.1 | 2,526 | ||
| > 0.6 | 18.0 | 2.06 | 1,195 | 4.9 | 2,865 | ||
| > 0.5 | 20.9 | 1.85 | 1,247 | 4.9 | 3,268 | ||
| Inferred | > 1.0 | 0.1 | 2.61 | 6 | 12.9 | 31 | |
| > 0.9 | 0.1 | 2.48 | 6 | 12.7 | 33 | ||
| > 0.8 | 0.1 | 2.05 | 7 | 12.0 | 42 | ||
| > 0.7 | 0.1 | 1.81 | 8 | 11.5 | 49 | ||
| > 0.6 | 0.2 | 1.27 | 10 | 8.8 | 70 | ||
| > 0.5 | 0.3 | 1.16 | 11 | 8.0 | 76 |
|
|
144 |
| ANA PAULA PROJECT |
| FORM 43-101F1 TECHNICAL REPORT |
Table 14-22: Model Sensitivity to Cut-off Below the Resource Constraining Shell
| Area | Category | Cut-off (Au g/t) |
Tonnes (million) |
Au (g/t) |
Gold (oz x1000) |
Ag (g/t) |
Silver (oz x1000) |
| Amenable to Underground extraction |
Measured | > 4.0 | - | 4.81 | - | 4.1 | - |
| > 3.0 | 0.0 | 3.36 | - | 5.5 | - | ||
| > 2.0 | 0.0 | 2.41 | 1 | 4.9 | 3 | ||
| > 1.8 | 0.0 | 2.20 | 2 | 4.5 | 4 | ||
| > 1.7 | 0.0 | 2.11 | 3 | 4.3 | 5 | ||
| > 1.65 | 0.0 | 2.07 | 3 | 4.3 | 6 | ||
| Indicated | > 4.0 | 0.4 | 5.47 | 65 | 6.1 | 73 | |
| > 3.0 | 0.8 | 4.31 | 117 | 5.7 | 155 | ||
| > 2.0 | 2.1 | 3.20 | 216 | 4.8 | 321 | ||
| > 1.8 | 2.5 | 2.98 | 242 | 4.5 | 362 | ||
| > 1.7 | 2.8 | 2.86 | 257 | 4.3 | 386 | ||
| > 1.65 | 2.9 | 2.81 | 264 | 4.2 | 398 | ||
| Measured + Indicated |
> 4.0 | 0.4 | 5.47 | 65 | 6.1 | 73 | |
| > 3.0 | 0.8 | 4.31 | 117 | 5.7 | 156 | ||
| > 2.0 | 2.1 | 3.19 | 217 | 4.8 | 324 | ||
| > 1.8 | 2.6 | 2.97 | 244 | 4.5 | 366 | ||
| > 1.7 | 2.8 | 2.85 | 259 | 4.3 | 392 | ||
| > 1.65 | 3.0 | 2.80 | 267 | 4.2 | 404 | ||
| Inferred | > 4.0 | 0.0 | 5.50 | 1 | 6.8 | 1 | |
| > 3.0 | 0.0 | 3.96 | 1 | 5.9 | 2 | ||
| > 2.0 | 0.3 | 2.38 | 23 | 4.5 | 44 | ||
| > 1.8 | 0.4 | 2.24 | 30 | 4.3 | 58 | ||
| > 1.7 | 0.6 | 2.12 | 38 | 4.0 | 71 | ||
| > 1.65 | 0.6 | 2.07 | 41 | 3.9 | 79 |
14.14 COMPARISON TO PREVIOUS ESTIMATE
Comparing this new resource estimate against the prior resource model effective February 15, 2016, and authored by JDS, reveals a decrease of 49% in the Measured and Indicated tonnes. Despite the increase in the resource grade from 1.41 g/t Au to 2.17 g/t Au, it was insufficient to account for the lower tonnages, consequently the resource yields a reduction of 21% in gold ounces.
The change in the Inferred resource amounted to 54% less tonnes. Grade is significantly higher from 0.113 g/t Au to 1.84 g/t Au. Total gold ounces decreased by 24% (Table 14-23).
Table 14-23: Resource Statement compared with Previous Estimate
| May 16th, 2017 | JDS Feb2nd, 2016 | ||||||||
| Cut-off | > 0.6 g/t Au OP and > 1.65 g/t Au UG | > 0.46 g/t AuEq OP only | |||||||
| Classification |
Tonnage | Au | Gold | Tonnage | Au | Gold | Tonnage | Grade | Ounces |
| (T) | (g/t) | (Ounces) | (T) | (g/t) | (Ounces) | % Diff. | Diff (g/t) | % Diff | |
| Measured | 7,582,000 | 2.43 | 592,800 | 22,767,000 | 1.608 | 1,177,000 | -67 | 0.82 | -50 |
| Indicated | 13,416,000 | 2.01 | 869,000 | 18,243,000 | 1.163 | 682,000 | -26 | 0.85 | 27 |
| Mea. + Ind. | 20,999,000 | 2.17 | 1,461,700 | 41,010,000 | 1.410 | 1,859,000 | -49 | 0.76 | -21 |
| Inferred | 870,000 | 1.84 | 51,400 | 1,904,000 | 1.113 | 68,000 | -54 | 0.73 | -24 |
|
|
145 |
| ANA PAULA PROJECT |
| FORM 43-101F1 TECHNICAL REPORT |
AGP notes that the May 16, 2017 estimate reports the resources at a much higher cut-off which produces lower tonnes at a higher grade when compared to the JDS estimate.
For comparison, the new resource models were reported within the same constraining shell used in the JDS February 2, 2016 resource estimate and reported at the same 0.46 g/t AuEq cut-off (Table 14-24). JDS described the AuEq calculation as having been based on gold and silver prices of USD $1450 and USD $23, respectively, and recoveries of 80% for gold and 55% for silver. In the JDS report, AuEQ equals gold grade + 0.011 x silver grade. AGP notes that these prices and recovery are no longer valid and they were used here only to offer a comparison with the previous resource estimate.
Results from this comparison show the new resource returns 11% less tonnes in the Measured and Indicated categories. The grade is slightly lower from 1.410 g/t Au in the JDS estimate to 1.380 g/t Au in this resource which produced a 13% decrease in gold ounces.
In the Inferred category, the new resource returns 15% less tonnes. The Inferred grade is much lower from 1.113 g/t Au in the JDS estimate down to 0.696 g/t Au in this resource. Consequently, there was a reduction of 47% in the Inferred gold ounces.
Table 14-24 shows the model comparison within the JDS February 2, 2016 resource constraining shell at the greater than 0.46 g/t AuEq cut-off.
Table 14-24: Percent Difference – 2017 Resource vs 2016 Resource within JDS Shell at 0.46 g/t AuEq cut-off
| Cut-off |
0.46 g/t AuEq within the JDS resource constraining shell |
||
| Classification |
Tonnage | Grade | Ounces |
| % Diff. | Diff. | % Diff | |
| Measured | -54% | 0.31 (g/t) | -45% |
| Indicated | 43% | 0.00 (g/t) | 43% |
| Measured + Indicated | -11% | -0.03 (g/t) | -13% |
| Inferred | -15% | -0.42 (g/t) | -47% |
The major contributor to the changes in the resources are
mostly related to the outlier restrictions which are more aggressive than the
100 g/t Au cap value used in the JDS study and to a lesser extent, a reduction
in the grade of the 3,279 corrected ACME assays from the 2013 drill campaign.
The addition of the high grade probabilistic model to control the smearing of
the high grade is also a contributor, although it would mostly affect the
resources outside of the resource constraining shell.
|
|
146 |
| ANA PAULA PROJECT |
| FORM 43-101F1 TECHNICAL REPORT |
15 MINERAL RESERVE ESTIMATES
15.1 SUMMARY
The reserves for Ana Paula are based on the conversion of the Measured and Indicated resources within the current Technical Report mine plan. Measured resources are converted directly to Proven Reserves and Indicated resources to Probable Reserves. The total reserves for Ana Paula are shown in Table 15-1.
Table 15-1: Proven and Probable Reserves – Ana Paula
| Category | Tonnes (kt) | Gold Grade (g/t) | Gold (ounces) | Silver Grade (g/t) | Silver (ounces) |
| Proven | 6,533 | 2.62 | 550,000 | 5.31 | 1,115,000 |
| Probable | 6,907 | 2.12 | 471,000 | 5.13 | 1,139,000 |
| Total | 13,440 | 2.36 | 1,021,000 | 5.22 | 2,254,000 |
Note: This mineral reserve estimate is as of May 16, 2017 and is based on the new mineral resource estimate dated May 16, 2017. The mineral reserve calculation was completed under the supervision of Gordon Zurowski, P.Eng of AGP Mining Consultants Inc., who is a Qualified Person as defined under NI 43-101. Mineral reserves are stated within the final design pit based on a US$984 /ounce gold price pit shell with a US$1,200 /ounce gold price for revenue. The cutoff grade was 0.67 g/t Au for all pit areas. The mining cost averaged $2.38/tonne mined, processing averages US$19.00/tonne milled and G&A was US$2.49/tonne milled. The process recovery for gold averaged 88% and the silver recovery was 30%. The exchange rate assumption applied was Mex$18.59 equal to US$1.00.
The reserves are based solely on the Ana Paula open pit. The underground resources have not been converted and remain resources only for this Technical report.
The QP has not identified any known legal, political, environmental, or other risks that would materially affect the potential development of the Mineral Reserves. The risk of not being able to secure the necessary permits from the government for development and operation of the project exist but the QP is not aware of any issues that would prevent those permits from being withheld per the normal permitting process.
15.2 MINING METHODS AND MINING COSTS
The Ana Paula project is amenable to extraction by open pit methods. Preliminary costs were developed based on expected contractor mining.
The potential for underground development beneath the open pit has not been examined as part of this Technical Report. Areas of higher grade gold resources are present beneath the current design pit and are being considered for potential inclusion in future evaluations. Alio Gold is advancing a plan to develop an exploration drift to further define the nature of the potential underground resource and examine possible opportunities to exploit these resources via underground methods.
Only Measured and Indicated Resources were used for the study and all Inferred resources were considered to be waste.
This section discusses the development and parameters employed to declare reserves for the current PFS pit design.
15.2.1 Geotechnical Considerations
Knight Piésold completed slope stability analysis for the Ana Paula pit to develop prefeasibility level parameters for the pit design. The various pit slope design parameters, including geotechnical considerations, are discussed in detail in Section 16 of this report.
Various design sectors were determined for the Ana Paula pit. Slope stability analyses were undertaken on each sector to determine achievable slope parameters. For all sectors, these parameters included the use of an 80- degree bench face angle, 8.1 meter berm and berms spaced every 18 meters vertically. This yielded an inter-ramp angle of 58 degrees. AGP reduced the inter-ramp angle in Sector A by two degrees to provide a slightly larger berm in case of toppling. No other geotechnical berms were recommended or included in the design.
|
|
147 |
| ANA PAULA PROJECT |
| FORM 43-101F1 TECHNICAL REPORT |
For the economic pit shell development, the inclusion of ramps was considered to provide overall slopes of between 49 and 51 degrees.
15.2.2 Economic Pit Shell Development
The final pit design was based on pit shells developed using the Lerch-Grossman procedure in MineSight. The parameters for the shells are shown in Table 15-2.
Table 15-2: Pit Optimization Parameters
| Parameter | Unit | Gold | Silver |
| World Price | US$/oz | $1,200.00* | $16.00** |
| Payables | % | 99% | 99% |
| Transportation, Refining | US$/oz | $20.00 | $0.25 |
| Royalty | % | 2.5% | 2.5% |
| Net Value for Pit Shell | US$/oz | $1,138.80 | $15.59 |
| US$/gram | $36.61 | $0.49 | |
| Metallurgical Recovery | % | 88% | 30% |
| Processing Cost | US$/t | $19.00 | $19.00 |
| G&A Costs | US$/t | $2.49 | $2.49 |
| Mining Cost | US$/t mined | $2.38 | $2.38 |
| Pit Slopes | Inter-ramp | Overall | |
| Sector A | Degrees | 56 | 50 |
| Sector B | Degrees | 58 | 49.4 |
| Sector C | Degrees | 58 | 48.7 |
| Sector D | Degrees | 58 | 49.3 |
| Sector E | Degrees | 58 | 49.9 |
| Sector F | Degrees | 58 | 51.3 |
*Au Price: three-year trailing average
$1220 as of April 27th, 2017
**Ag Price: three-year trailing
average $17.06 as of April 27th, 2017
The metallurgical recoveries were updated after the pit design by the technical team. The gold recovery was reduced to 85% to be somewhat conservative while the silver recovery was increased to 55%. An additional $1200 gold pit shell was run for comparison and it was noted that the reduced gold recovery resulted in 0.7% drop in feed tonnage and a 0.3% drop in contained gold. The contained silver increased by 1%. This was deemed to be non-material and the final pit design was not modified from what is shown in this Technical Report.
A series of nested shells were generated using a revenue factor(rf). Initially these were varied between a gold price of US$492 (rf=0.41) and US$1200 (rf=1.0) to examine the deposit sensitivity to gold prices and outline the higher value areas. Due to the high-grade nature of the deposit, the smallest pit was considered to be too large as a starter pit. The gold value was dropped to a price of US$250 and shells generated at US$25 increments up to the US$492 price shells. This information was graphed and the various phases and final shell determined based on a net revenue curve.
The final pit is based on the US$984/oz gold price shell with
phasing at the US$275/oz gold shell and US$400/oz gold shell.
|
|
148 |
| ANA PAULA PROJECT |
| FORM 43-101F1 TECHNICAL REPORT |
15.2.3 Cut-off Grade
For determining the tonnes and grade in the pit, the marginal cutoff grade was used. The marginal cutoff grade, or milling cutoff, is defined as the minimum grade that would make a profit by processing the material in the mill. This material is already planned to be mined as part of the economic calculations therefore the mining cost is not applicable.
With the cost parameters considered for the project, this equated to a gold only value of 0.67 g/t. This value was also used to determine mill feed or waste for the dilution calculation.
15.2.4 Dilution
The geologic model was a whole block, fully diluted grade model. This means that the grade from the wireframes was diluted over the full volume of the block to arrive at a diluted block grade. AGP also believes that contact dilution would play a role in the material sent to the mill. To determine the amount of dilution and the grade of the dilution the size of the block in the model was examined. The block model is 5 m along strike (X axis), 5 m thick (Y axis) and 6 m high (Z axis).
The percentage of dilution is calculated for each contact side using an assumed 0.5 m contact dilution distance. If one side of a mill feed block is touching waste, then it is estimated that dilution of 9.1% would result. If two sides are contacting, it would rise to 16.7% . Three sides would be 23.1%, and four sides 28.6% . Four sides represent an isolated block of mill feed.
The number of diluting sides was calculated with a MineSight routine and the dilution percentage determined. Comparing the in situ to the diluted value for the design pit showed a mill feed tonnage dilution of 5.1%, a gold grade dilution of 4.2% and a silver grade dilution of 1.9% . The grade dilutions are lower as a result of the waste blocks containing some mineralization. Tonnes and grade for the pit designs and reserves are reported with the diluted tonnes and grade.
15.2.5 Pit Design
The detailed pit design utilized the pit shells developed earlier to provide guidance on the phasing and final pit. Wall slopes for the inter-ramp were per the Knight Piésold recommendations.
Equipment sizing for ramps and working benches is based on the use of 63 t rigid frame trucks. The ramp width is sized for the smaller capacity 56 t rigid frame units, as they are slightly wider than the 63 t rigid frame versions. The operating width used for the truck is 5.7 m. This means that single lane access is 17.8 m (2x operating width plus berm and ditch) and double lane widths are 23.5 m (3x operating width plus berm and ditch). Ramp gradients are 10% in the pit for uphill gradients and 8% downhill on the dump access roads. Working benches were designed for 35 to 40 m minimum on pushbacks.
Ana Paula is designed with three phases. The first phase is a starter phase designed to provide early higher-grade material for the plant and minimize strip ratio. The second phase expands on the first targeting the larger portion of the ore body. The final phase requires a significant push back from the upper elevations due to local topography.
15.2.6 Mine Reserves Statement
The reserves for Ana Paula are based on the conversion of the Measured and Indicated resources within the current Technical Report mine plan. Measured resources are converted directly to Proven Reserves and Indicated resources to Probable Reserves. These were prepared under the supervision of Gordon Zurowski, P.Eng of AGP Mining Consultants Inc. who is a qualified person as defined under NI43-101. The reserves are based solely on the Ana Paula open pit. The underground resources have not been converted and remain resources only for this Technical report.
|
|
149 |
| ANA PAULA PROJECT |
| FORM 43-101F1 TECHNICAL REPORT |
This estimate is as of May 16, 2017. The total reserves for Ana Paula are shown in Table 15-3.
Table 15-3: Ana Paula Mine Reserves
| Category | Tonnes (kt) | Gold Grade (g/t) | Gold (ounces) | Silver Grade (g/t) | Silver (ounces) |
| Proven | 6,533 | 2.62 | 550,000 | 5.31 | 1,115,000 |
| Probable | 6,907 | 2.12 | 471,000 | 5.13 | 1,139,000 |
| Total | 13,440 | 2.36 | 1,021,000 | 5.22 | 2,254,000 |
Note: Mineral reserves are included within Mineral Resources.
|
|
150 |
| ANA PAULA PROJECT |
| FORM 43-101F1 TECHNICAL REPORT |
16 MINING METHODS
16.1 INTRODUCTION
Mine design and planning for the Ana Paula project is based on the AGP resource model, as detailed in Section 14 of this report. Mine planning and optimization results are based on measured and indicated resources for gold and silver.
Open pit mining was selected as the method to examine the development of the Ana Paula Project at this time. This is based on the size of the resource, tenor of the grade, grade distribution and topography.
The potential for underground development beneath the open pit has not been examined as part of this Technical Report. Areas of higher grade gold resources are present beneath the current design pit and are being considered for potential inclusion in future evaluations. Alio Gold is advancing a plan to develop an exploration drift to further define the nature of the potential underground resource and examine possible opportunities to exploit these resources via underground methods.
This section discusses the development and parameters employed to develop the PFS pit design.
16.2 OVERVIEW
The deposit will be a conventional, open pit, truck-and-shovel operation. A mill feed of approximately 5,000 t/d is planned over an approximate 8-year mine life. There will be pre-strip material in Year -1, with a full production ramp- up in year 1.
The mine planning and cut-off grade reporting was completed using the MineSight TM software. Using the Lerchs-Grossman (LG) algorithm within the software, the optimization performs a series of nested shells by varying revenue factors. The ultimate pit and phases were then selected and used to develop the life of mine plan (LOM).
The waste rock, acid base accounting testing was not yet available at the time of this study; the next level of study will include management of waste as it is categorized. Initial indicators are that the material will not be acid generating.
Table 16-1 shows the key results from the LOM plan. Waste material mined and associated strip ratio includes pre-stripping activities in Year -2 and Year -1.
Table 16-1: LOM Plan Key Results
| Description | Units | Value |
| Ore Material Mined | Mtonnes | 13.44 |
| Average Gold Grade | g/t | 2.36 |
| Average Silver Grade | g/t | 5.13 |
| Waste Material Mined | Mtonnes | 43.74 |
| Strip Ratio | w:o | 3.25 |
| Milling Rate | t/d | 5,000 |
| Mine Life | years | 8 |
|
|
151 |
| ANA PAULA PROJECT |
| FORM 43-101F1 TECHNICAL REPORT |
16.3 GEOTECHNICAL
16.3.1 Pit Slope Evaluation
Knight Piésold and Co. (Knight Piésold) conducted a pit slope stability evaluation for Alio Gold for the proposed Ana Paula Pit. This section of the report provides a summary of the geotechnical evaluation and pit slope recommendations.
The primary objective of this evaluation is to provide Alio Gold with optimum pit slope angle recommendations to be used in development of the proposed Ana Paula Pit. Optimum pit slope angles are those that allow for maximum resource extraction, minimum waste rock handling, global pit slope stability and an acceptable level of pit slope maintenance.
The following tasks were completed by Knight Piésold:
-
Reviewed pertinent information, including previous reports
-
Developed and conducted a geotechnical investigation program including geotechnical core logging of six geotechnical coreholes, discontinuity orientation (oriented core) and core sampling to support Rock Mass Rating (Bieniawski 1989) calculations
-
Installed vibrating wire piezometers (VWP) to collect groundwater information
-
Developed and managed a rock mechanics laboratory testing program
-
Conducted probability based pit slope stability analyses to provide overall global, interramp, and bench scale recommendations
-
Developed pit slope geometry recommendations for the proposed Ana Paula Pit
16.3.1.1 Geology
A geologic block model was provided to Knight Piésold by Alio Gold. This model is comprised of four lithologies including Granodiorite, Limestone-Shale, and minor occurrences of Hornblende and Breccia. The weathering states of all lithologies are primarily fresh/unaltered. The Granodiorite is typically massive. The Limestone-Shale has a primary foliation but in many occurrences, this unit appears to have been re-worked and small-scale chaotic folding is present with numerous calcite veins. The Hornblende occurrence is minor and often inter-laminated with the Limestone-Shale unit. Breccia occurrences are also minor. These lithologies were used as the Engineering Lithologies delineated within the geotechnical model discussed in Section 16.1.2.
Geologic structure data were collected using the Reflex ACT III core orienting tool. Core orientation data were analyzed using the CODES commercially available software. Geologic structure is dominated by a pervasive foliation herein termed Set 1 which has a mean dip direction of 258.9 degrees and a mean dip of 58.7 degrees. Structure Set 2 is a low-angle set with a mean dip direction of 47.7 degrees and a mean dip of 21.4 degrees. Structure Set 3 has a mean dip direction of 164.6 degrees and a mean dip of 68.1 degrees.
16.3.1.2 Geotechnical Model
A geotechnical model was developed to facilitate pit slope
stability analyses. The pit was divided into six primary sectors (Sectors A
through F) based on overall slope height, dip direction of the slope face, and
the orientation of Structure Set 1 (prominent foliation). Dip direction of the
slope face was consistent across each design sector, except in the case of
Sectors D and F, where the design sectors were further subdivided to capture
changes in the slope face dip directions as they relate to orientation of the
major geologic structures.
|
|
152 |
| ANA PAULA PROJECT |
| FORM 43-101F1 TECHNICAL REPORT |
Design Sector D was subdivided into Subsectors D1, D2 and D3 because pit slope dip directions varied across this design sector and Subsector D2 is oriented sub-parallel to Structure Set 1. Minor changes to the pit shape will allow for Sector D2 to be designed with the same
recommendations as Sectors D1 and D3. Sector F also contains changes in pit slope dip direction and was divided into Subsectors F1 and F2 so that trials for backbreak analysis could be conducted. However, no viable plane shear or wedge failures were
revealed for Sector F so the recommendations across subsectors F1 and F2 are identical. Figure 16-1 shows the traces of the geotechnical coreholes and their orientation information. The design sectors are shown on Figure 16-2.
|
|
153 |
| ANA PAULA PROJECT |
| FORM 43-101F1 TECHNICAL REPORT |
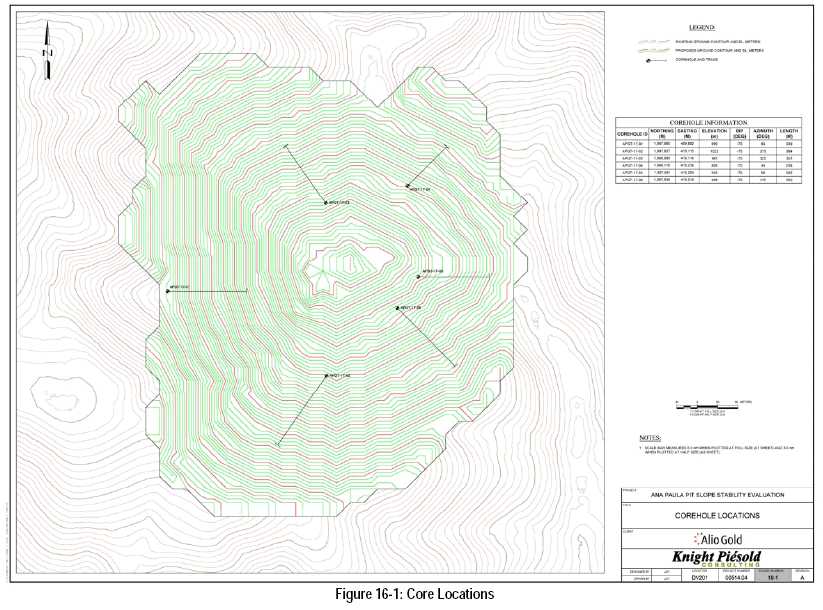
|
|
154 |
| ANA PAULA PROJECT |
| FORM 43-101F1 TECHNICAL REPORT |
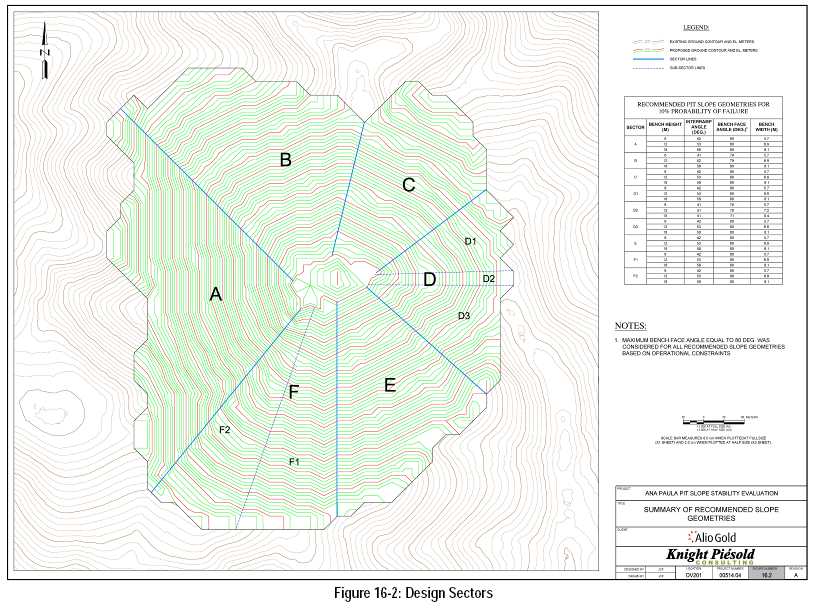
|
|
155 |
| ANA PAULA PROJECT |
| FORM 43-101F1 TECHNICAL REPORT |
16.3.1.3 Laboratory Testing
Laboratory unconfined compressive strength (UCS) testing, point load testing (PLT), and small scale direct shear (SSDS) testing were conducted. The laboratory UCS data were used in conjunction with the point load data to develop a large set of UCS data. The direct shear test data were used for bench scale (backbreak) analyses. Table 16-2 presents the results of the UCS testing. Table 16-3 presents the results of the SSDS testing.
Table 16-2: UCS Results Summary

|
|
156 |
| ANA PAULA PROJECT |
| FORM 43-101F1 TECHNICAL REPORT |
Table 16-3: SSDS Results Summary

16.3.1.4 Groundwater
At the time of the pit slope analyses, the VWPs had not yet equilibrated, and some were yet to be installed. Knight Piésold used a conservative initial groundwater level based on information from reverse circulation (RC) drilling. Steady state phreatic surfaces were developed using the Slide 6.0 (Rocscience 2011) software.
16.3.1.5 Hoek-Brown Failure Criterion
A shear strength vs. normal stress relationship for the rock mass was developed for each engineering lithology described, using the Generalized Hoek-Brown failure criteria (Marinos and Hoek 2002). The shear strength vs. normal stress relationship describes the ultimate shear strength available at a given point within the slope as a function of the normal stress acting upon that point. This relationship is defined using Primary and Secondary Hoek-Brown parameters. The Primary and Secondary Hoek-Brown parameters were incorporated into the geotechnical model used for limit equilibrium stability analyses.
Primary Hoek-Brown Parameters
Primary input parameters for the jointed rock mass criterion
include Geological Strength Index (GSI), a material constant (mi) and a
disturbance factor (D) as defined by Marinos and Hoek (2002). For the analyses,
a probability density function was selected to represent a statistical
distribution of each of these primary input parameters for each of the
engineering lithologies. The Crystal Ball (Oracle 2008) software was used
to conduct a large number of Monte Carlo simulations (typically 10,000) that
randomly sampled each of the three probability density functions (GSI, mi, and
D) during each simulation. The Primary Hoek-Brown parameters are presented by
engineering lithology in Table 16-4.
|
|
157 |
| ANA PAULA PROJECT |
| FORM 43-101F1 TECHNICAL REPORT |
Table 16-4: Primary Hoek-Brown Parameters

Secondary Hoek-Brown Parameters
For each set of Primary Hoek-Brown parameters sampled (typically 10,000) representative equations were solved resulting in a large number (typically 10,000) of Secondary Hoek-Brown parameters. These sets of Secondary Hoek-Brown parameters were used to fit a probability density function to represent each of the three parameters (m b, s and a). Probability density functions representing the mean and variation in m b, s, a, and UCS for each engineering lithology were defined using a mathematical, "best-fit" technique conducted using the Crystal Ball software. The distribution types and parameters defining the shape of the probability density functions (i.e., mean and standard deviation) selected for the analyses are presented in Table 16-5.
Table 16-5: Secondary Hoek-Brown Parameters

16.3.2 Slope Stability Evaluation
Three separate analyses are required for the stability evaluation of each design sector of the open pit including:
-
Interramp Analyses
-
Bench Face Analyses
-
Rockfall Catchment Analyses
|
|
158 |
| ANA PAULA PROJECT |
| FORM 43-101F1 TECHNICAL REPORT |
The interramp analyzes provide optimized interramp angles (IRA), which correspond to the angles of the open pit slopes measured from the toe to the crest of the pit slope that is not interrupted by haul roads, step-outs, or other mine infrastructures. The interramp angle can also be defined as the slope angle from bench crest to bench crest. The overall slope angle is defined as the slope angle measured from the crest of the pit to the bottom of the pit, including haul roads, step-outs or other infrastructure.
The bench face analyses provide optimized bench face angles (BFA) and includes backbreak analyses and bench scale limit equilibrium analyses. The rockfall catchment analyses provide the minimum acceptable bench width (BW) for the catchment of rockfall. Figure 16-3 presents an explanation of the IRA, BFA and BW terminology.

Figure 16-3: Pit Slope Geometry
The interramp and bench scale analyses require the use of two probability based methods. These include the limit equilibrium method and the backbreak method. Both methods are used at the pit slope and bench level for the interramp and bench scale analyses. The Limit Equilibrium method is conducted using the commercially available slope stability evaluation software Slide 6.0 (Rocscience 2013). The backbreak method evaluates the sliding potential of the rock masses along discontinuities such as joints and faults at the bench scale using the Backbreak software. The recommended slope angles, IRA and BFA, are the most critical angles defined by the three methods of analysis.
16.3.2.1 Methods of Analysis
Probabilistic Limit Equilibrium Method
Slope stability software Slide 6.0 (Rocscience 2011) was used to conduct probabilistic limit equilibrium analyses for the IRA and BFA. Slide is a two-dimensional probabilistic (and deterministic) slope stability analysis program that analyzes the stability of a slope by various methods of slices. Spencer’s method (of slices) was selected for the limit equilibrium analyses conducted for this evaluation. Spencer’s (method of analysis) is considered a rigorous solution to slope stability calculations due to its balancing of both force and moment equilibrium.
|
|
159 |
| ANA PAULA PROJECT |
| FORM 43-101F1 TECHNICAL REPORT |
Slide allows for simulation of earthquake loading by application of static forces that represent seismic inertial forces resulting from potential ground accelerations caused by a seismic event. This method, known as pseudostatic analysis, simulated seismic forces in terms of horizontal acceleration expressed as a coefficient (or percent) of gravity (g). At the Ana Paula project site, the design earthquake based on a return period of 475 years gives a Peak Ground Acceleration (PGA) of 0.5 g (USGS per GeoPentec 2017). For slopes that can tolerate up to 1 m of earthquake-induced deformation, such as pit slopes, it is common practice to reduce the PGA by a factor of 0.33 to 0.50 according to research conducted by the U.S. Army Corps of Engineers (Hynes-Griffen and Franklin 1984). In recognition of this guidance, Knight Piésold used a horizontal acceleration coefficient which is 50 percent less than the PGA for the area. Pseudostatic analyses for the Ana Paula Pit incorporated a horizontal acceleration coefficient of 0.25g which is reasonably conservative and technically appropriate.
Parameters describing the statistical distributions of each of the rock mass parameters (UCS, m b, s, and a) for each engineering lithology were directly input into the slope stability modeling software Slide along the most critical cross section for each design sector. These parameters define the shape of the statistical distributions and are dependent upon the type of distribution that yielded the best fit. For each of the 10,000 simulations, Slide uses the Monte Carlo technique to randomly sample a set of primary and secondary Hoek-Brown parameters for each material type, based on the probability density functions, yielding a normal stress/shear strength envelope for each set of parameters for each engineering lithology. For each of the strength envelopes generated, a search for a critical circular failure surface was conducted by Slide to evaluate the ratio of available resisting forces to driving forces (i.e., factor of safety) for each valid trial surface. The critical trial surface (surface with the lowest factor of safety) was established for each set of randomly generated strength parameters. These factors of safety were recorded and as a result of the simulation, the mean factor of safety and the probability of failure of the slope were estimated. The probability of failure of a slope is defined as the number of critical surfaces yielding a safety factor of less than 1.0 divided by the total number of samples that resulted in a valid critical surface. Invalid trial surfaces generally include those that do not intersect the external boundary within the defined slope limits.
Probabilistic Backbreak Method
Failure mechanisms controlled by geologic structures are generally simplified into plane shear failure and wedge failure geometries. In either case, geologic structure controlled failure is only possible if the spatial occurrence of discontinuities results in a potential failure mass, and if the mass is unconstrained at the slope face. Once it had been established that a viable potential failure mass exists, as was the case for Design Sectors B, C, and D2, the likelihood of geologic structure controlled failure was assessed. This was achieved within the Backbreak program by evaluating if the maximum shearing resistance which can develop along the potential failure surface or surfaces is greater than the driving forces tending to destabilize the rock mass. The likelihood that shearing resistance could be exceeded was calculated by a Monte Carlo sampling of the distributions of friction angle, fracture spacing, fracture length, dip and dip direction for each of the plane shear and wedge geometries sampled.
Backbreak is a probabilistic slope stability routine used to optimize IRA and BFA with respect to structurally controlled failure mechanisms. Backbreak evaluates the likelihood that planar and/or wedge discontinuities will daylight into the pit, coupled with the probability that the shear strength of daylighted discontinuities will be exceeded. The slope stability analysis was conducted with the Backbreak routine using the Monte Carlo sampling simulation applications of Crystal Ball. Inputs into the Backbreak program include the probability density functions of the friction angle, dip and dip direction of the geologic structures, discontinuity spacing (the inverse of fracture frequency), discontinuity length, as well as pit slope orientation. Statistical distributions describing these probabilistic parameters were developed from corehole data (with the exception of fracture length) using the Crystal Ball software for each geologic structure and design sector. Fracture length was characterized by analyzing exponential distributions with mean structure lengths of 5 m, 10 m, 25 m, and 50 m.
|
|
160 |
| ANA PAULA PROJECT |
| FORM 43-101F1 TECHNICAL REPORT |
Using Monte Carlo sampling from the probability density functions of each probabilistic backbreak parameter, 10,000 trial bench geometries were mathematically simulated for each of the six sectors analyzed. The distribution of the most likely plane shear bench face angle from each simulation was then calculated for each design sector. Similarly, bench face simulations were conducted for potential wedge failure geometries.
Composited plane shear and wedge failure backbreak distributions were calculated for 6m, 12m, and 18m bench heights by assuming representative probabilities of 20 percent, 50 percent, 25 percent, and 5 percent, for 5m, 10m, 25m, and 50m mean lengths, respectively. These composited results were used to produce distributions of effective bench face angles for plane shear and wedge failure modes for each design sector with viable failure orientations. These include Design Sectors B, C, and D2.
Slope Stability Analyses
Slope stability analyses conducted for the Ana Paula Pit Slope Evaluation are comprised of three distinct analyses, the interramp analysis, the bench face analysis, and the rockfall catchment analysis as previously discussed. The interramp and bench face analyses were conducted for each sector using both the limit equilibrium method and the backbreak method. For each design sector the controlling method corresponds to the method that yielded the lowest slope angle. Recommendations developed by Knight Piésold based on the results of the slope stability analyses are presented in Section 16.3.2.
The results of the slope stability analyses are presented as a probability or likelihood of instability rather than a single, deterministic factor of safety. Based on Knight Piésold’s experience, slope angles that yield a probability of failure of about 30 percent for slopes with low consequence of failure and about 10 percent for slopes with high failure consequences are suitable for an open pit mining application. Slopes that have a high consequence of instability are those that are critical to mine operations such as slopes containing major haul roads, access points, or infrastructure. Knight Piésold has provided 10% probability of failure recommendations for each design sector so that the slope recommendations will be applicable to sectors with haul roads and infrastructure.
Interramp Analyses
Interramp analyses were conducted using both the limit equilibrium and the backbreak methods. The limit equilibrium method was used for the Ana Paula Pit slopes to evaluate the entire pit slope height in terms of mean factors of safety and probabilities of failure. These analyses were completed for all design sectors of the proposed Ana Paula Pit. The backbreak method was used for each design sector that contained a viable failure mass using the two geologic structure sets identified to evaluate the entire pit slope height in terms of mean factors of safety and probabilities of failure. Plane shear evaluation was conducted for Design Sectors B and D2. Wedge failure evaluation was conducted for Design Sector C. Contrary to the results of the limit equilibrium method used for interramp analyses, the results of the backbreak method depends on the bench height.
Bench Face Analyses
Bench face analyses were conducted using both the limit equilibrium method and the backbreak method. These analyses were conducted to evaluate the expected performance of bench faces, which are by design steeper than interramp slopes. The limit equilibrium method was used to evaluate the stability of 6 m, 12 m, and 18 m bench heights in terms of mean factors of safety and probabilities of failure. These analyses were completed for all design sectors of the proposed Ana Paula Pit. The backbreak method was used for each design sector that contained a viable failure geometry using the three geologic structure sets identified for this evaluation. Plane shear backbreak analyses were conducted for Design Sectors B and D2. Wedge failure evaluation was conducted for Design Sector C.
|
|
161 |
| ANA PAULA PROJECT |
| FORM 43-101F1 TECHNICAL REPORT |
Rockfall Catchment Analyses
Once interramp and bench face analyses were completed, Knight Piésold used two analytical methods to evaluate rockfall catchment potential for the design bench width. These analytical methods are the Modified Ritchie method (Call and Savely 1990) and MROKS. The MROKS method was developed by Paul Visca. The MROKS method is a mathematical combination of the Modified Ritchie (Call and Savely 1990) method and the Oregon Department of Transportation (Pierson et. al. for ODOT& FHA 2001) criteria. Knight Piésold used the Modified Ritchie method for the Ana Paula Pit bench width evaluation because the results were slightly less conservative compared to the results of MROKS and the 6 m benches were under the minimum valid height criteria of MROKS. Rockfall catchment analysis indicated a minimum 8.1 m bench width for recommended 18 m bench heights.
16.4 GEOLOGIC MODEL IMPORTATION
AGP developed the resource models using Gemcom software. This was converted to MineSight for use in the mine planning. The resources dated May 16, 2017 form the basis for the work completed in this Technical Report and are shown in Table 16-6 below. Further detail on the resource development is discussed in Section 14 of this report.
Table 16-6: Ana Paula Resource Statement – Effective May 16, 2017
| Area | Category | Cut-off (Au g/t) |
Tonnes | Au (g/t) |
Gold (ounces) |
Ag (g/t) |
Silver (ounces) |
| Resources amenable to open pit extraction |
Measured | 0.6 | 7,541,000 | 2.43 | 590,000 | 5.1 | 1,236,000 |
| Indicated | 10,491,000 | 1.79 | 605,000 | 4.8 | 1,629,000 | ||
| Measured & Indicated |
18,032,000 | 2.06 | 1,195,000 | 4.9 | 2,865,000 | ||
| Inferred* | 249,000 | 1.27 | 10,000 | 8.8 | 70,000 | ||
| Resources amenable to underground extraction |
Measured | 1.65 | 41,000 | 2.07 | 2,800 | 4.3 | 6,000 |
| Indicated | 2,925,000 | 2.81 | 264,000 | 4.2 | 398,000 | ||
| Measured & Indicated |
2,967,000 | 2.80 | 266,700 | 4.2 | 404,000 | ||
| Inferred* | 621,000 | 2.07 | 41,400 | 3.9 | 79,000 | ||
| Total Resources | Measured | OP 0.6 and UG 1.65 |
7,582,000 | 2.43 | 592,800 | 5.1 | 1,242,000 |
| Indicated | 13,416,000 | 2.01 | 869,000 | 4.7 | 2,027,000 | ||
| Measured & Indicated |
20,998,000 | 2.17 | 1,461,800 | 4.8 | 3,269,000 | ||
| Inferred* | 870,000 | 1.84 | 51,400 | 5.3 | 149,000 |
*Notes: Open Pit Mineral Resources are inclusive of Mineral
Reserves and have an effective date of May 16, 2017. The Mineral Resources are
stated at $1,350/oz gold using a gold cut-off of 0.60 g/t gold for Open Pit and
1.65 for Underground. The quantity and grade of reported Inferred resources in
this estimation are conceptual in nature,and are estimated on the basis of
limited geological evidence and sampling. Geological evidence is sufficient to
imply but not verify geological and grade or quality continuity. For these
reasons, an Inferred Mineral Resource has a lower level of confidence than an
Indicated Mineral Resources and it is reasonably expected that the majority of
Inferred Mineral Resources could be upgraded to Indicated Mineral Resources with
continued exploration. Mineral Resources that are not Mineral Reserves do not
have demonstrated economic viability. Rounding of tonnes as required by
reporting guidelines may result in apparent differences between tonnes, grade,
and contained metal content.The Mineral Resource Estimate was compiled using
three pass ordinary kriging. Grade capping was applied differently by domain,
but generally was capped at 55 g/t gold inside the breccia structure and halo
and 20 g/t outside the main mineralization. Assay intervals were composited on 3
meter composites to build a resource model based on 5m x 5m x 6m blocks. A
search restriction was also applied to limit the influence of high grade
intercepts. Classification of the Resource into Measured, Indicated and Inferred
was determined based on pass number and distance to the closest composite.
|
|
162 |
| ANA PAULA PROJECT |
| FORM 43-101F1 TECHNICAL REPORT |
The 2017 Mineral Resource model is a whole block model. The block models contain the topography, rock type, density, gold and silver grades and classification. The mining model created by AGP in MineSight uses the same model dimensions as the original resource model with added items used for mine planning purposes. MineSight was used for the mining portion of the Project to take advantage of the included Lerchs-Grossman routine for economic pit shell development. The boundaries for the models are the same as the geology resource model.
The grade in each block is a fully diluted grade. This means that the block has one gold grade for the entire tonnage of the block. No ore percentages are considered in the block model provided. All the block model items remain the same as in the geologic model.
Only Measured and Indicated Resources were used for the Study. All Inferred Resources were considered as waste.
16.5 OPEN PIT MINING
16.5.1 Economic Pit Shell Development
To determine the potential size of the open pit, various input parameters were required including estimates of the expected mining, processing, and G&A costs. As well, metallurgical recoveries, pit slopes and reasonable long term metal price assumptions. The parameters defined and outlined in Table 16-7 were estimated using the current available information. No capital costs were considered at the time of this study for the pit shells. Optimizations were run using measured, and indicated mineral resources only.
Table 16-7: Pit Optimization Parameters
| Parameter | Unit | Gold | Silver |
| World Price | US$/oz | $1,200.00* | $16.00** |
| Payables | % | 99% | 99% |
| Transportation, Refining | US$/oz | $20.00 | $0.25 |
| Royalty | % | 2.5% | 2.5% |
| Net Value for Pit Shell | US$/oz | $1,138.80 | $15.59 |
| US$/gram | $36.61 | $0.49 | |
| Metallurgical Recovery | % | 88% | 30% |
| Processing Cost | US$/t | $19.00 | $19.00 |
| G&A Costs | US$/t | $2.49 | $2.49 |
| Mining Cost | US$/t mined | $2.38 | $2.38 |
| Pit Slopes | Inter-ramp | Overall | |
| Sector A | Degrees | 56 | 50 |
| Sector B | Degrees | 58 | 49.4 |
| Sector C | Degrees | 58 | 48.7 |
| Sector D | Degrees | 58 | 49.3 |
| Sector E | Degrees | 58 | 49.9 |
| Sector F | Degrees | 58 | 51.3 |
*Au Price: three-year trailing average
$1220 as of April 27th, 2017
**Ag Price: three-year trailing
average $17.06 as of April 27th, 2017
The metallurgical recoveries were updated after the pit design by the technical team. The gold recovery was reduced to 85% to be somewhat conservative while the silver recovery was increased to 55%. The $1200 pit shell was run for comparison and it was noted that the reduced gold recovery resulted in 0.7% drop in ore tonnage and a 0.3% drop in contained gold. The contained silver increased by 1%. This was deemed to be not material and the final pit design was not modified from what is shown in this Technical Report.
The royalty was based on a 2% royalty to Goldcorp and a 0.5%
Mexican Environmental Erosion fee.
|
|
163 |
| ANA PAULA PROJECT |
| FORM 43-101F1 TECHNICAL REPORT |
The process and G&A costs were provided by Alio Gold for use in the study based on work by the other members of the technical team.
The mining costs were based on a blended rate of contract mining costs received for this study based on a previous internal design. The costs considered the current dump configuration complete with access road development.
The overall angles by wall slope sector used the provided inter-ramp angles with consideration for haulroads. All the sectors included a minimum of 2 full width ramps of 23.5 m double lane width. Five of the six sectors also included the width of 1 single lane ramp width of 17.8 meters.
Series of nested shells were generated using a revenue factor(rf). Initially these were varied between a gold price of US$492 (rf=0.41) and US$1200 (rf=1.0) to examine the deposit sensitivity to gold prices and outline the higher value areas. Due to the high grade nature of the deposit, the smallest pit was considered to be too large as a starter pit. The gold value was dropped to a price of US$250 and shells generated at US$25 increments up to the US$492 price shells.
The waste, mill feed and net revenue were plotted to determine reasonable pit shapes and potential phasing. This graph is shown in Figure 16-4.
The graph illustrates the various break points in the pit shells. The first point picked and shown as Ph1, this represents the US$275/oz gold shell (Pit 45). It provides 3.6 million tonnes of mill feed, or approximately two years of mining with a strip ratio of 1.79:1 (W:O). The net profit at that point is US$253 million.
The second point selected is for Phase 2 and uses a US$400/oz gold shell price (Pit 50). This provided a cumulative mill feed tonnage of 7.7 million tonnes at total strip ratio to that point 2.41:1 (W:O). Cumulative net profit to that point is US$506 million.
The final phase uses the US$984/oz gold shell price (Pit 141). Total cumulative mill feed is 12.7 million tonnes with an overall strip ratio of 3.15:1 (W:O). Cumulative net profit is US$631 million. Beyond this point an additional US$3.1 million in net profit is possible but only increases the mill feed by 1.4 million tonnes.
As shown, the majority of the pit value (80%) is obtained within the first two phases. Due to increasing strip ratios, beyond the final phase, limited value is generated.
These three shells were used for detailed pit design development.
|
|
164 |
| ANA PAULA PROJECT |
| FORM 43-101F1 TECHNICAL REPORT |

Figure 16-4: Economic Pit Shells
16.5.2 Dilution Calculation
The geologic model was a whole block, fully diluted grade model. This means that the grade from the wireframes was diluted over the full volume of the block to arrive at a diluted block grade. AGP also believes that contact dilution would play a role in the material sent to the mill. To determine the amount of dilution and the grade of the dilution the size of the block in the model was examined. The block model is 5 m along strike (X axis), 5 m thick (Y axis) and 6 m high (Z axis).
The pit optimization process calculates two block model values: value per block (VLB) and value per tonne (VLT). VLB is used in the Lerch-Grossman pit optimization routine to determine the economic shell that corresponds to the given pit optimization parameters or is comparable to what is referred to as the mining cutoff. This is the value contained within each block and includes the mining cost as part of the overall calculation.
The VLT calculation does not include the mining cost and represents the “milling cutoff”, where the material is within the mining cutoff pit shell and needs to be moved but will still turn a profit to the mill if this value is above zero. AGP uses the VLT calculation to determine the ore cutoff for the mill. If the VLT is greater than US$0.01/t, then it is sent to the mill ultimately. The exact item used in the calculations was titled VLT5, which resulted from the final pit optimization run using the US $1,200 gold price. This VLT5 value is equivalent to the milling cutoff and that value is stored within each block. This cutoff was also used to define ore and waste blocks for the dilution calculation. If VLT5 is greater than US$0.01/t, then the block was deemed ore as it would make a profit. The VLT was only calculated on blocks with classification of Measured or Indicated. Inferred material was considered as waste and no value assigned other than a negative waste movement cost.
The percentage of dilution is calculated for each contact side using an assumed 0.5 m contact dilution distance. If one side of the block is touching waste, then it is estimated that dilution of 9.1% would result. If two sides are contacting, it would rise to 16.7% . Three sides would be 23.1%, and four sides 28.6% . Four sides represent an isolated block of ore.
|
|
165 |
| ANA PAULA PROJECT |
| FORM 43-101F1 TECHNICAL REPORT |
Because the geologic model was a whole block already, the percentage of dilution could be estimated and then included in a block ore percentage item. The mining model was modified to include an ore percent item, and any blocks with a VLT greater than US$0.01/t were assigned an ore percent of 100% or it was deemed entirely ore.
MineSight has a routine that enables the user to query surrounding blocks against a set of conditions. For the dilution percentage calculation, the procedure was run to determine how many ore blocks contacted a waste block, which determined the dilution percentage to apply. This was stored in the waste block and the waste block grade used as the diluting value. If a waste block was surrounded by other waste blocks, the dilution percentage was zero.
In this manner, the contact blocks could be included in the tonnage and grade calculation of ore tonnes. The ore tonnage was then run with the block model Ore% item (Dore%) to report out the proper tonnes and grade.
Comparing the in situ to the diluted value for the design pit optimization shell showed a mill feed tonnage dilution of 5.1%, a gold grade dilution of 4.2% and a silver grade dilution of 1.9% . The grade dilutions are lower as a result of the waste blocks containing some mineralization. Tonnes and grade for the pit designs and reserves are reported with the diluted tonnes and grade.
16.5.3 Pit Design and Phase Development
Pit phase designs were developed for Ana Paula using the three pit optimization shells selected earlier (Pits 45, 50, 141). Geotechnical parameters described earlier in Section 16 were used in the detailed design.
In sector D, Knight Piésold highlighted a concern with a particular joint set. This required a square corner in this area rather than a rounded corner to prevent this joint set from daylighting. This was incorporated into the design as well. All sectors used an 80 degree bench face angle and an 8.1 meter berm spaced every 18 meters to provide an inter-ramp angle of 58 degrees. No other geotechnical berms were recommended or included in the design.
Equipment sizing for ramps and working benches is based on the use of 63 t rigid frame trucks. The sizing of the ramp is actually sized for the smaller capacity 56 t rigid frame units, as they are slightly wider than the 63 t rigid frame versions. The operating width used for the truck is 5.7 m. This means that single lane access is 17.8 m (2x operating width plus berm and ditch) and double lane widths are 23.5 m (3x operating width plus berm and ditch). Ramp gradients are 10% in the pit for uphill gradients and 8% downhill on the dump access roads. Working benches were designed for 35 to 40 m minimum on pushbacks.
Ana Paula is designed with three phases. The first phase is a starter phase designed to provide early higher grade material for the plant and minimize strip ratio. The second phase expands on the first targeting the larger portion of the ore body. The final phase requires a significant push back from the upper elevations due to local topography. The final design phase tonnages and grades are shown in Table 16-8.
Table 16-8: Final Design – Phase Tonnages and Grades
| Phase | Mill Feed (Mt) |
Au (g/t) |
Ag (g/t) |
Waste (Mt) |
Total Material (Mt) | Strip Ratio (W:O) |
| 1 | 4.24 | 2.41 | 6.86 | 7.97 | 12.21 | 1.88 |
| 2 | 3.10 | 2.94 | 5.63 | 8.64 | 11.75 | 2.78 |
| 3 | 6.10 | 2.04 | 3.86 | 27.12 | 33.22 | 4.45 |
| Total | 13.44 | 2.36 | 5.22 | 43.74 | 57.18 | 3.25 |
|
|
166 |
| ANA PAULA PROJECT |
| FORM 43-101F1 TECHNICAL REPORT |
The cutoff used was the VLT5 value stored in the block model. This varies due to the block location and contained grades but is approximately equal to a gold only cutoff of 0.67 g/t.
Mine access roads from the plant are critical to the design. One road extends to the north and climbs to the top of the project for access to Phases 2 and 3. This road also acts as a diversion for surface runoff and minimizes contact with mining activity. The water is discharged near the primary crusher.
The second major road goes from the primary crusher downwards to the valley bottom and provides the long term ore haulroad. From the valley bottom, the road winds up the topography to the top of Phase 1. This provides access for the mining of that phase plus longer term access for the phases to the waste storage area to the south in the valley.
Phase 1 reaches a depth of 830 masl. It establishes the longer term access road along the northeast side and prepares the northern side of the pit for Phase 2 and 3 access roads.
Phase 2 expands the pit to the west and deepens the pit to the depth of 788 masl. The ore haulage switches to the north side of the pit. This access will be used by Phase 3 later in the mine life. The square corner on the east side is maintained to ensure issues with a particular joint set will not arise.
Phase 3 advances even further to the west to start the pit. Final pit depth is 728 masl.
The phase designs are shown in detail in Figure 16-5 to Figure 16-7.
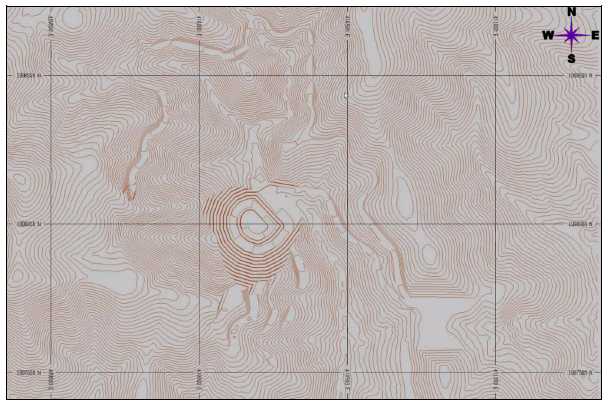
Figure 16-5: Phase 1 Design
|
|
167 |
| ANA PAULA PROJECT |
| FORM 43-101F1 TECHNICAL REPORT |

|
|
168 |
| ANA PAULA PROJECT |
| FORM 43-101F1 TECHNICAL REPORT |
16.5.4 Mine Production Schedule
The mining production schedule was developed based on a maximum mill capacity of approximately 5000 t/d. The Ana Paula project life is 10 years, including two years of pre-stripping followed by 8-years of operations. The throughput rate is assumed to have a three-month ramp in Year 1 then full capacity afterwards. Table 16-9 outlines the mine production schedule by year.
Table 16-9: Mine Production Schedule by Year
| Year | Mill Feed (Mt) |
Au (g/t) |
Ag (g/t) |
Waste (Mt) |
Mine to Mill (Mt) |
Mine to Stock (Mt) |
Stock To Mill (Mt) |
Total
Material (Mt) |
Strip
Ratio (W:O) |
| -2 | - | - | - | 2.27 | - | 0.12 | - | 2.39 | - |
| -1 | - | - | - | 4.94 | - | 0.33 | - | 5.27 | - |
| 1 | 1.70 | 2.09 | 6.92 | 7.26 | 1.38 | 0.36 | 0.31 | 9.31 | 4.17 |
| 2 | 1.80 | 1.96 | 5.67 | 7.15 | 1.79 | 0.07 | 0.01 | 9.01 | 3.85 |
| 3 | 1.80 | 2.59 | 6.86 | 7.40 | 1.60 | - | 0.20 | 9.20 | 4.61 |
| 4 | 1.80 | 2.13 | 5.06 | 7.35 | 1.65 | - | 0.15 | 9.15 | 4.45 |
| 5 | 1.80 | 3.11 | 5.50 | 4.53 | 1.80 | - | - | 6.33 | 2.52 |
| 6 | 1.80 | 1.82 | 3.32 | 2.19 | 1.80 | - | - | 3.99 | 1.21 |
| 7 | 1.80 | 2.97 | 3.63 | 0.55 | 1.80 | - | - | 2.35 | 0.31 |
| 8 | 0.94 | 2.09 | 4.56 | 0.10 | 0.74 | - | 0.21 | 1.05 | 0.14 |
| Total | 13.44 | 2.36 | 5.13 | 43.74 | 12.56 | 0.88 | 0.88 | 58.06 | 3.25 |
During the mine scheduling exercise, the goal was to mine the highest-grade material first, while deferring the pre-stripping requirements until later. This would allow for early payback and to help improve the economics of this deposit. Only 7.21 Mt of waste will be required to be moved during pre-striping.
Approximately 0.88 million tonnes of rehandled material will required during the mine life from stockpiles. This will be required to manage the mill throughput and to ensure the plant capacity is achieved in the final years as the pit becomes smaller. The first stockpile will be located on top of a waste area below the primary crusher and the second on a pad near the primary crusher. The material on the lower stockpile will be rehandled in Year 1 to make room for addition waste storage.
Mining in Year -2 is primarily the development of the stockpile pad by the primary crusher, establishment of the various roads and development of the lower waste dump at the 880 level. Phase 1 is initiated and a small amount of Phase 2 is started.
Year -1 brings further development of Phase 1 and Phase 2, extension of the 880 level of the waste dump in the valley and development of the upper west dump at the 955 level. A small stockpile is placed on the 880 level for temporary storage of ore prior to plant commissioning.
Year 1 has Phase 3 under development, plus continued development of Phases 1 and 2. An access road is prepared with waste material to allow the tailings dam to be built with mine waste in the future. The upper (1050) dump platform is expanded, the lower 955 dump platform is expanded and the valley dump is also extended.
Year 2, Phase 1 and 2 are developed together at the same level and Phase 3 is further advanced. A new dump platform is established at the 970 level placing material over the 890 level. The 890 level is the previous 880 level with a 10 meter lift applied.
Year 3 Phase 1 is advanced slightly over Phase 2 to provide
additional high grade feed material. A new platform, 940 is created over the 890
level in addition to a dump access road. The road shortens the ore haul for
Phase 3 material to the plant.
|
|
169 |
| ANA PAULA PROJECT |
| FORM 43-101F1 TECHNICAL REPORT |
Year 4, Phase 1 is complete, Phase 2 is advancing deeper and providing the bulk of the mill feed. Phase 3 has linked access ramps with Phase 2 and is widening the pit. Waste haul from the pit uses the same access to the plant as the ore haul but then ties into the waste bridge to expand the dump platform 950.
In Year 5, waste material from the pit is hauled up to the 970 level to avoid encroaching on the mill site and further expansion of the 950 level alongside the plant. Phase 2 is almost complete and Phase 3 is the primary mill feed source.
Years 6, 7 and 8 are Phase 3 only with waste going onto the 950 level and adding additional lifts. The toe of the dump alongside the plant maintains a channel to avoid rock impacting the plant site.
|
|
170 |
| ANA PAULA PROJECT |
| FORM 43-101F1 TECHNICAL REPORT |
16.5.5 End of Period Plans
![]()
|
|
171 |
| ANA PAULA PROJECT |
| FORM 43-101F1 TECHNICAL REPORT |
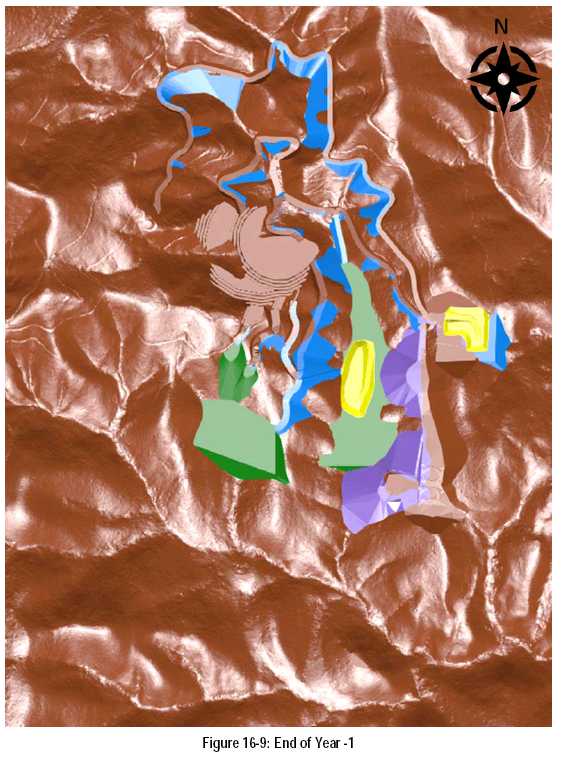
|
|
172 |
| ANA PAULA PROJECT |
| FORM 43-101F1 TECHNICAL REPORT |

|
|
173 |
| ANA PAULA PROJECT |
| FORM 43-101F1 TECHNICAL REPORT |
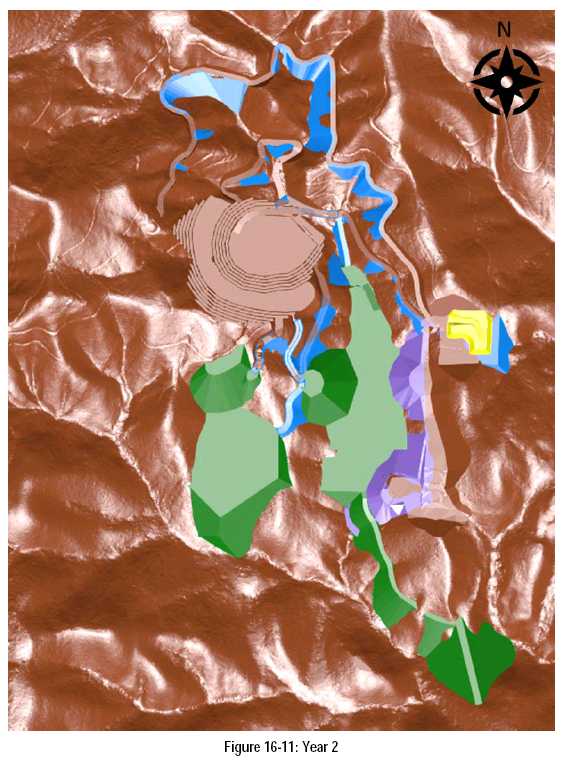
|
|
174 |
| ANA PAULA PROJECT |
| FORM 43-101F1 TECHNICAL REPORT |

|
|
175 |
| ANA PAULA PROJECT |
| FORM 43-101F1 TECHNICAL REPORT |

|
|
176 |
| ANA PAULA PROJECT |
| FORM 43-101F1 TECHNICAL REPORT |
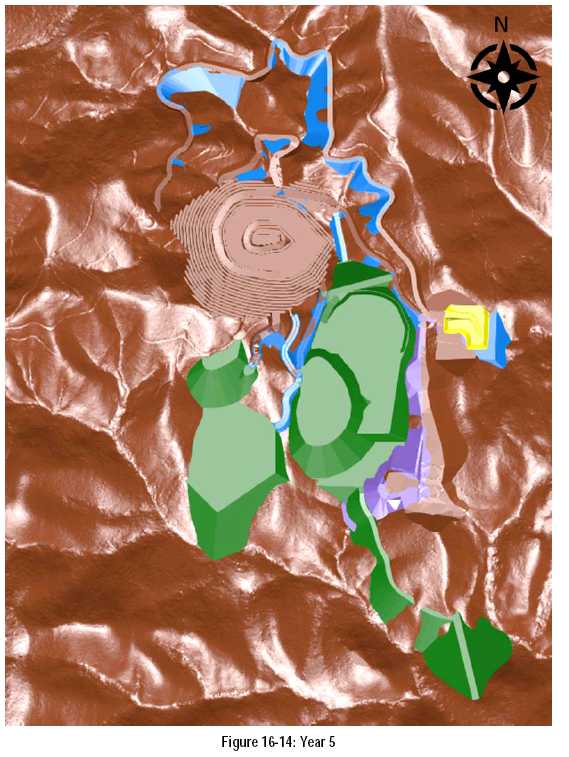
|
|
177 |
| ANA PAULA PROJECT |
| FORM 43-101F1 TECHNICAL REPORT |
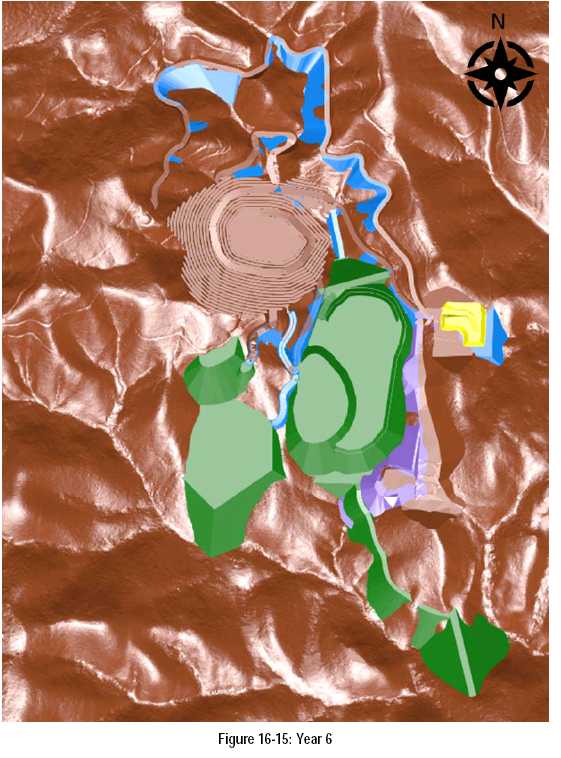
|
|
178 |
| ANA PAULA PROJECT |
| FORM 43-101F1 TECHNICAL REPORT |
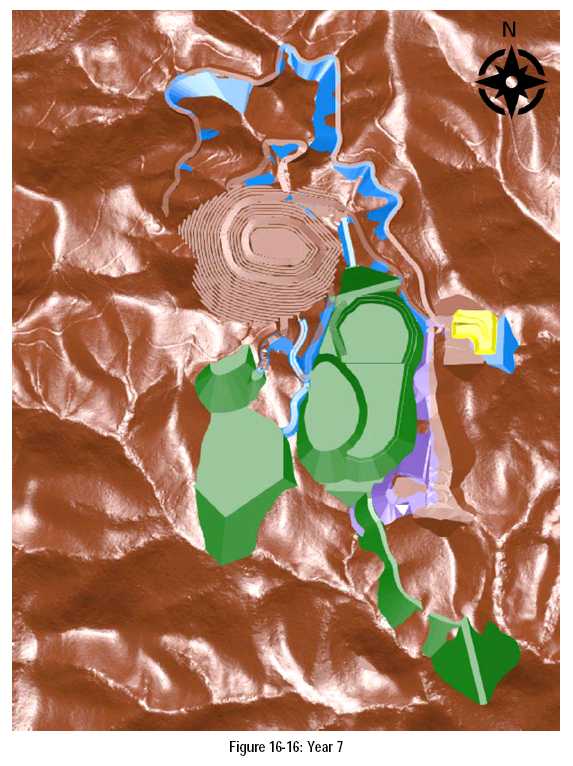
|
|
179 |
| ANA PAULA PROJECT |
| FORM 43-101F1 TECHNICAL REPORT |

|
|
180 |
| ANA PAULA PROJECT |
| FORM 43-101F1 TECHNICAL REPORT |
16.6 ORE CONTROL
Grade control is an item that was considered from the beginning of the mine planning sequence. Blasthole sampling may be possible as a method of ore definition but a gold deportment study needs to be completed to confirm whether blasthole samples will be representative for the Ana Paula ore body. That may be considered in the Feasibility Study.
Other operations around the world are using a reverse circulation program in advance of mining on tight inclined drillhole spacing, to accurately define the ore/waste contacts. This is typically done when the mineralized zone is more dispersed or inclined towards the horizontal as it is at Ana Paula. This information is then built into the short range models and used to guide the loading equipment. This practice is widespread in Australia with great success and in Canada and Brazil.
The method involves using a dedicated grade control drill rig and crew in the pit to drill a series of shallow vertical holes drilled in a pattern similar to the blast hole pattern. The pattern for drilling will be a 5 m spacing and a 4 m burden with samples taken every 1 m in presumed mineralized zones as outlined by both previous ore control drilling and the exploration drilling. Holes will be included 70 degrees to intersect the ore zone at right angles. The volume of the sample to be assayed and sample intervals will be determined in a grade deportation study. An additional 25% will be drilled along the contacts to ensure that unknown structures are not missed in the saprolite. These “waste” samples will be drilled with the same 5 m spacing and 4 m burden and sampled over 6 m.
The amount of reverse circulation drilling peaks in Year 2 at 42,800 m then levels of averaging 36,100 m/a from Year 3 until Year 8. This is only for the reverse circulation drilling rig.
The reverse circulation drills will operate for 16 h/d to minimize disturbance and be in advance of mine operations with the information. A three-man crew per drill is required; one driller and two drill helpers. In addition, geologists will provide guidance throughout the day and be on call if unknown issues arise.
The drill penetration rate is estimated at 25 m/h with setups, sampling, etc. Overall, the cost for the drill without labour will be US$155/h or about US$6.20/m drilled. From an overall mine operating cost perspective, the reverse circulation drill sampling program costs US$0.10/t mined. The cost of not sampling and mistaking waste for ore or ore for waste easily is repaid in proper ore: waste definition.
The data from the grade control drilling is then interpreted by the geologist and the ore is then remodeled. The production drilling and blasting will then be designed to mine the ore material separately from the waste.
16.7 MINE ROCK MANAGEMENT
Over the life of mine, the open pit will produce approximately 43.7 Mt of waste rock. Testwork is underway to verify that the mine rock can be categorized as non-acid generating (NAG) but for this study it has been assumed to be NAG.
Two main waste storage facilities and two minor facilities are developed as part of the overall mine plan:
| 1) | West Facility – 11.2 Mt capacity |
|
| 2) | Valley Facility – 29.1 Mt capacity |
|
| 3) | Tailings Road – 0.6 Mt capacity |
|
| 4) | Tailings Dam – 3.1 Mt capacity |
|
|
181 |
| ANA PAULA PROJECT |
| FORM 43-101F1 TECHNICAL REPORT |
Excess capacity exists in the Valley and West facilities. These have been designed at 35 degree slopes to be reclaimed at the end of the mine life.
Drainage from the waste storage facilities is all located in the tailings basin drainage. This will act as the settling area for the waste storage facilities.
16.8 CONTRACT MINING
All mine and support mine equipment will be provided by contractors. The equipment description in this section provides general information of the size and/or capacity of the selected equipment.
This operation will be a conventional, open pit, truck-and-loader operation. The Contractor will be using 56 t rigid mining trucks loaded by 6.4 m3 wheel loaders.
A track-mounted DTH drill is proposed for blasthole drilling, capable of drilling 110-203 mm diameter holes. Due to the size of the operation, all equipment on site will be diesel powered.
The mine will operate 24 hours per day, 365 days per year.
16.8.1 Contractor Mine Equipment Requirements
Major mine equipment provided by contractors has been estimated based on the equipment parameters above. They are listed in Table 16-10 below.
Table 16-10: Major Mine Equipment Requirements
| Equipment Type | Model | Number |
| Drill rig | Atlas Copco FlexiROC D65 | 2 |
| Wheel Loader 6.4 m3 | Komatsu WA600-7 | 2 |
| Truck 56 t | Komatsu HD465-7 | 8 |
| Dozer | CAT D8T | 1 |
| Wheel dozer | CAT 824H | 1 |
| Grader | CAT 16M | 1 |
| Water truck | Scania / Volvo | 1 |
| Fuel / Lube truck | Scania / Volvo | 1 |
| Excavator | CAT 336 | 1 |
Contract support mine equipment will consist of:
- 6 t Crane Truck
- Telehandler
- Man lift
- Lighting plants
- 4x4 Pickup Trucks
- Bus
- Welder
16.9 CONTRACTOR EXPLOSIVES
Alio Gold will hold the explosives license and be responsible
for the storage of explosives and bulk products on site. Loading of explosives
will be contracted out to a specialist explosives supplier. Bulk explosives will
be used for blasting and will be mixed on site with an explosives mixing truck.
|
|
182 |
| ANA PAULA PROJECT |
| FORM 43-101F1 TECHNICAL REPORT |
Blast designs are based on 6 m benches, using a powder factor of 0.29 kg/t. Over the life of mine, the project will use approximately 19.9 Mkg of bulk emulsion with an average use of 2.05 Mkg/yr during years 1 through 8.
The project will use conventional blasting products: bulk emulsion, nonels, detonating cords, delays and boosters.
Owner mine operations personnel will be responsible for the blasting pattern design and the contractor personnel for loading holes and tie-ins.
Pre-shear holes will be drilled on triple benches (18 m length holes) at a spacing of 1.4 m. The total length of the wall for pre-shear drilling is 18,460 m.
16.10 MINE PERSONNEL – OWNER AND CONTRACTOR
The management staff, technical personnel will only operate on a single 12-hour day shift, on 4 days in, 3 days out, as where contractor mine crews will operate on two 12-hour shifts per day, 365 days per year. This will require four mining and maintenance crews. Crews will work a standard rotation of two weeks on, two weeks off. Personnel requirements are estimated based on the peak number of equipment units operating. Peak mine personnel requirements are estimated and summarized in Table 16-11 to Table 16-13.
Table 16-11: Mine Supervision Personnel Summary – Owner
| Position | Quantity | Hourly/Salary |
| Mine Operations Superintendent | 1 | Salary |
| Senior Engineer | 1 | Salary |
| Open Pit Planning Engineer | 2 | Salary |
| Surveyor/Mining Technician | 1 | Salary |
| Clerk/Secretary | 1 | Salary |
| Senior Geologist | 1 | Salary |
| Grade Control Geologist | 2 | Salary |
| Sampling Technician | 2 | Salary |
| General Mine Laborer | 2 | Hourly |
| TOTAL | 13 |
Table 16-12: Mine and Maintenance Operations Personnel Summary – Contractors
| Position | Quantity |
| Project Manager | 1 |
| Mine Supervisor | 3 |
| Safety Supervisor | 3 |
| Project Controller | 1 |
| Surveyor | 2 |
| Project Assistant | 1 |
| Maintenance Superintendent | 1 |
| Maintenance Supervisor | 1 |
| Administrator / HR | 1 |
| Admin Assistant | 1 |
| Logistic Assistant | 1 |
| Dispatcher | 2 |
| Cleaner | 1 |
| Driver (support equipment) | 3 |
| Mechanic | 3 |
| Electrician | 2 |
| Welder | 2 |
|
|
183 |
| ANA PAULA PROJECT |
| FORM 43-101F1 TECHNICAL REPORT |
| Position | Quantity |
| Tire worker | 2 |
| Mechanic helper | 3 |
| Drill rig operator | 3 |
| Drill rig helper | 3 |
| Loader operator | 6 |
| Truck operator | 22 |
| Dozer operator | 6 |
| Grader operator | 3 |
| Water truck operator | 3 |
| Diesel / lube truck operator | 3 |
| Excavator operator | 3 |
| Project Manager | 1 |
| Mine Supervisor | 3 |
| Safety Supervisor | 3 |
| Project Controller | 1 |
| TOTAL | 86 |
Table 16-13: Total Mine Personnel Summary
| Team | Personnel |
| Supervision - Owners | 13 |
| Operations and Maintenance Contractors | 86 |
| Total Mine Personnel | 99 |
16.11 COMMENTS ON SECTION 16
-
The open pit design is comprised of three phases for Ana Paula.
-
Mill feed totals 13.4 Mt grading 2.36 g/t Au diluted and 5.22 g/t Ag diluted.
-
Waste tonnage over the mine life will total 43.7 Mt for a strip ratio of 3.25:1 LOM.
-
Contact dilution of the ore body resulted in a 5.1% increase in ore tonnage and 4.2% drop in gold feed grade and 1.9% drop in the silver feed grade. This is based on 0.5 m of block contact dilution.
-
The open pit mine life is expected to be 10 years; 2 years of pre-production stripping and 8 years of mine production.
-
Mine production will be preceded by two years of pre-production stripping, completed by contractor. This will be used to establish roads, an ore stockpile and initiate mining in Phases 1 and 2.
-
Waste rock facilities are the south of the pit up on the slope (West WRF) and down in the valley (Valley WRF).
-
No ARD potential appears to exist but testing is underway to confirm this. This will be completed either in the feasibility study or in basic engineering prior to plant start-up.
-
Underground potential beneath the open pit offers opportunity for sending higher grade feed to the mill. It may also provide the opportunity avoid stripping the higher strip ratio Phase 3. This will be determined prior to plant operation as the underground decline is not expected to start until Q3 2017.
-
Contract mining is used in the cost estimate for the open pit mine.
|
|
184 |
| ANA PAULA PROJECT |
| FORM 43-101F1 TECHNICAL REPORT |
16.12 RECOMMENDATIONS FOR PIT SLOPE GEOMETRIES
Recommendations for the Ana Paula Pit slope geometries are presented in Table 16-14 and are discussed in this section. Pit slope angle recommendations consist of interramp angles, bench face angles and bench widths. The method of analysis that results in the highest probability of failure and (typically) the lowest Factor of Safety is generally selected as the basis for recommendations because those results represent the most critical and hence most conservative results. As previously mentioned, Knight Piésold uses three methods of analysis to develop pit slope angle recommendations.
Table 16-14: Recommended Pit Slope Geometries for 10% Probability of Failure
| Design Sector | Bench Height (m) | Interramp Angle (deg) | Bench Face Angle (deg) | Bench Width (m) |
| A | 18 | 58 | 80 | 8.1 |
| B | 18 | 58 | 80 | 8.1 |
| C | 18 | 58 | 80 | 8.1 |
| D1 | 18 | 58 | 80 | 8.1 |
| D2 | 18 | 51 | 71 | 8.4 |
| D3 | 18 | 58 | 80 | 8.1 |
| E | 18 | 58 | 80 | 8.1 |
| F1 | 18 | 58 | 80 | 8.1 |
| F2 | 18 | 58 | 80 | 8.1 |
The limit equilibrium method is used to evaluate interramp and bench face slope stability based on rock mass parameters. Bench scale recommendations are also analyzed for backbreak using the Backbreak routine, which is an analysis of the influence of geologic structures on bench face angle. Bench width is analyzed to evaluate for adequate rockfall containment. The results of the most critical method are used to adjust the other recommendations, along with operational considerations. Operational considerations include equipment limitations as well as experience with other mines. The pit slope recommendations are relatively steep compared to many gold deposits. This is because of the fresh/unaltered character of the lithologies.
The recommendations presented in this report are based upon Knight Piésold’s current understanding of the conditions that will influence pit slope performance at the proposed Ana Paula Pit. These conditions should be assessed during pit development. Any significant deviations from the geotechnical model used to develop the recommendations presented in this report should prompt re-evaluation of these recommendations.
A program of geotechnical data collection should be undertaken during pit development to verify consistency with the geotechnical model. At a minimum, this program should include the following:
| 1. | Geotechnical mapping to document geologic structure and rock mass strength conditions |
|
| 2. | Survey monitoring and inspection of the slopes for indications of displacement |
|
| 3. | Documentation of any slope failures |
|
| 4. | Documentation of groundwater inflows |
|
| 5. | Periodic inspection of the pit slopes during development by a geotechnical engineer experienced in pit slope design |
With the exception of Item No. 5, these activities can be
largely undertaken by mine staff as part of the ongoing mine engineering
program.
|
|
185 |
| ANA PAULA PROJECT |
| FORM 43-101F1 TECHNICAL REPORT |
These pit slope recommendations are also made with the assumption that controlled blasting techniques will be practiced. Controlled blasting techniques should be designed with pit slope damage as an important factor, along with fragmentation and casting.
Knight Piésold also recommends that the shape of the pit be altered in Design Sector D such that a pit face with a dip direction of 270 degrees (+/- 15 degrees) is avoided. This will reduce the potential for plane shear backbreak in Sector D.
Knight Piésold also recommends that Alio Gold consider conducting a numerical simulation of moment-driven slope failure for Sector A (west slopes). This is because the combination of the pervasive high angle foliation (Set 1) which dips into
the pit walls at the west side of the pit, and the low angle Set 2 which dips out of the west pit wall provides a geometry that has the kinematic potential for moment driven failure. Moment driven failure is similar to toppling, except that topping
refers to a smaller scale specific failure mode whereas moment driven failure involves large scale blocks and different failure criteria.
|
|
186 |
| ANA PAULA PROJECT |
| FORM 43-101F1 TECHNICAL REPORT |
17 RECOVERY METHODS
17.1 PROCESS DESCRIPTION
Metallurgical tests and mineralogical analyses have been performed on composites of the Ana Paula ore. The results show an average-hardness ore with a portion of gold content being refractory due to encapsulation in iron sulfides. The rest of the gold can be liberated with normal grinding and recovered by gravity concentration or direct cyanidation.
A process flowsheet has been developed that is suitable for the mineralogy of the Ana Paula ore and its response to metallurgical treatment. Run-of-mine ore is crushed and ground to 80 percent finer than 160 microns, processed by froth flotation to recover sulfides and free gold, atmospheric oxidation of the sulfide concentrate, and cyanide leaching of the oxidized slurry.
Figure 17-1 is a simplified schematic of the overall process for the Ana Paula plant. This provides the basis for the process description that follows.
17.2 PROCESS DESIGN CRITERIA
Alio Gold tasked M3 to design a process plant for the Ana Paula project with a nameplate capacity of 5,000 t/d. The current mine plan developed for the project is based on a 365-day calendar year, totalling 1,825,000 tonnes of ore per year.
For the design, M3 uses an overall mill availability of 92%, except for the primary crusher, for which the availability is 75% and pebble crusher, which has an availability of 85%. These design availabilities are common for current and recent projects at M3 and in-line with general vendor specifications.
For simplicity, M3 defines “availability” as the estimated actual run time of equipment. This would, therefore, include both “mechanical availability” and “use of mechanical availability” in an operating plant. Nomenclature and tracking parameters may vary from operation to operation.
The mass balance was developed for the Ana Paula process using MetSim software. The process simulation assumed overall grades and recoveries for gold, and silver as shown in Table 17-1. The MetSim balance forms the basis for equipment sizing, including pipes and pumps, as well as sumps or pump boxes, and defines the parameters used in the process design criteria.
Table 17-1: Head Grades and Recoveries Used for Mass Balance Simulation
| Metal | Head Grade | Flotation Recovery, % |
| Au | 2.24 g/t | 95 |
| Ag | 6.89 g/t | 89 |
| Flotation Mass Pull | 20% |
Table 17-2 is a summary of the main components of the process design criteria used for the study. A detailed process design criteria document has been prepared and is listed as one of the references in Section 27.
In September 2015, Timmins Gold (now Alio Gold) acquired from
Goldcorp Inc. the processing plant and facilities used in Goldcorp’s El Sauzal
Mine operation in Chihuahua, Mexico. The design of the Ana Paula plant considers
the available equipment from this purchase.
|
|
187 |
| ANA PAULA PROJECT |
| FORM 43-101F1 TECHNICAL REPORT |

|
|
188 |
| ANA PAULA PROJECT |
| FORM 43-101F1 TECHNICAL REPORT |
Table 17-2: Process Design Criteria Highlights
| Description | Design |
| Capacity | |
| Tonnes per day, nominal | 5,000 |
| Tonnes per year | 1,825,000 |
| Availability/Use of Availability | |
| General | 92% |
| Primary Crushing | 75% |
| Pebble Crushing | 85% |
| Primary Crushing | |
| Feed F80, mm | 500 |
| Product P80, mm | 126 |
| Crushing work index, kWh/t (assumed) | 13 |
| SAG Mill Grinding | |
| Feed F80, mm | 126 |
| SAG Mill JKSimMet Parameters, Median | |
| A | 54.58 |
| b | 0.806 |
| ta | 0.424 |
| Ore SG | 2.7 |
| Ball Mill Grinding | |
| Feed T80, microns | 1,893 |
| Feed F80, microns | 2,908 |
| Product P80, microns | 160 |
| Ball Mill Work Index, kWh/t, Average | 18.3 |
| Bond Abrasion Index, g, Average | 0.1782 |
| Flotation | |
| Laboratory Flotation Time, min | 16 |
| Air Hold-up factor | 1.15 |
| Scale-up factor | 2 |
| Plant Flotation Time, min | 37 |
| Design Mass Pull | 20% |
| Atmospheric Alkaline Oxidation | |
| Pulp Density, % Solids | 25 – 35 |
| Temperature, minimum, oC (oF ) | 75 (167) |
| Oxidation Time, h | 24 |
| Sulfide-Sulfur Oxidation, % | ~100 |
| Trona Consumption, kg/t conc | 120 |
| Cyanidation | |
| Leach Time, h | 48 |
| % Solids | 40 |
17.3 COMMINUTION PLANT DESIGN
Primary crushing and pebble crushing was designed using Metso’s
Bruno simulator. SAG milling was simulated using JKSimMet and the ball mill
capacity was calculated using standard Bond equations, with and without taking
credit for SAG mill slimes that bypass the ball mill. As shown in Section 13,
grindability parameters were measured for only four composites, each
representing an ore type. With the limited number of data, the average or median
hardness and the 80th percentile hardness were very close to each
other. In addition, the A and b JK parameters were measured using the JK Rotary
Breakage Tests (JKRBT) and have not been calibrated with full drop-weight tests.
|
|
189 |
| ANA PAULA PROJECT |
| FORM 43-101F1 TECHNICAL REPORT |
17.3.1 Primary Crushing Simulations
The primary crusher included in the El Sauzal purchase is a 42” x 48” Kolberg-Pioneer jaw crusher with a 186 kW (250 hp) drive. The performance of this crusher was simulated by Metso’s Bruno Process Simulation software using a Metso C125 jaw crusher as a model. The run-of-mine (ROM) ore fragmentation used in the simulation was assumed to be similar to Metso’s standard 800 mm coarse size distribution, which is finer than 800 mm and has P80 of approximately 500 mm. The actual mine fragmentation may be different from this, depending on the rock type and blasting design.
If the 4248 jaw crusher is similar to a C125, it is expected to be adequate to crush the ore in preparation for the SAG mill. With a closed side setting of 125 mm, the crusher is estimated to produce a crushed ore that is 80% finer than 126 mm and practical top size of 190 mm (Bruno’s “max stone”). The particle size distribution of this crushed product was entered into JKSimMet as the fresh feed to the SAG mill. The full size distribution is included in the particle size distribution plots for the SAG mill in the next subsection.
17.3.2 Grinding Simulations
Grinding at Ana Paula will be accomplished with a SAG mill that is 7.3 m in diameter and 3.2 m in length flange-to-flange (24’ x 10.5’ F/F), and a ball mill that is 4.72 m in diameter and 6.55 m in length (15.5’ x 21.5’) . Both mills were obtained with 2,313 kW (3,100 hp) drives. Several JKSimMet simulations using average or median hardness indicates that these mills will be able to process 5,000 t/d (92% availability), as the SAG drive is increased to 2,872 kW (3,850 hp).
JKSimMet simulations for the SAG mill was performed using the following parameters:
- Bruno-predicted feed particle-size distribution
- Median hardness: A=54.58, b=0.806, ta =0.424
- 74.2 % critical speed
- 12 % ball charge (133 mm steel balls)
- 38 mm grates
- 11 mm opening SAG screen
- Pebble crushing at a closed side setting of 13 mm
Figure 17-2 illustrates the results of the JKSimMet simulations, which shows that the target capacity of 5,000 t/d can be achieved at median hardness. The power draw is calculated to be 2,274 kW (3,048 hp), including JKSimMet voids correction and 6.5% drive losses from a single pinion drive. This power draw essentially maxes out the rating of the old drive that came with the SAG mill. With the new larger drive, the mill will have enough power to perform the average duty as well as respond to fluctuations in ore fragmentation and hardness. It will also have a sufficient power range to control the mill.
Figure 17-3 is a plot of the particle size distribution of the
process streams in the SAG milling circuit.
|
|
190 |
| ANA PAULA PROJECT |
| FORM 43-101F1 TECHNICAL REPORT |
![]()
|
|
191 |
| ANA PAULA PROJECT |
| FORM 43-101F1 TECHNICAL REPORT |
17.4 PRIMARY CRUSHING AND COARSE ORE STOCKPILE
ROM ore will be transported by 56-tonne haul trucks from the mine to the primary crusher and dumped into the primary crusher dump hopper with an approximate 120-tonne live capacity (2 truckloads) through a stationary grizzly (opening: 800 mm). An apron feeder moves the ore from the hopper to another stationary grizzly (opening: 100 mm). The oversize reports to the primary crusher while the undersize reports directly to the transfer conveyor, bypassing the primary crusher. The primary crusher is a 42” x 48” Kolberg-Pioneer jaw crusher, with a closed-side setting of 150 mm, powered by a 187 kW (250 hp) motor.
The crushed ore is discharged to the transfer conveyor, which is also the stacking conveyor feeding the coarse-ore stockpile. A self-cleaning magnet followed by a metal detector are provided to remove any tramp steel before stockpiling.
The coarse ore stockpile has a live capacity of 10,500 tonnes and a total capacity of 50,650 tonnes. The live capacity is equivalent to 2 days of SAG mill feed at the nominal capacity.
The crushed ore is reclaimed via a reclaim tunnel beneath the stockpile, with three reclaim feeders (two operating and one standby) onto the SAG mill feed conveyor. Each reclaim feeder is 1,067 mm wide and 6.5 m long, powered by an 11 kW (15 hp) drive on variable frequency drives. The feeders are also part of the El Sauzal equipment purchase. The crushed ore is reclaimed from the stockpile at a design rate of 226.4 t/h.
Dust suppression is accomplished by water sprays at the crusher dump hopper, jaw crusher, and at the discharge points of the feeders. A belt scale is included on the SAG mill feed conveyor after the feeders and before the point of addition of SAG mill balls.
17.5 GRINDING AND PEBBLE CRUSHING
The grinding circuit for the Ana Paula Project consists of a conventional SAG-mill, ball-mill, pebble-crushing system, commonly referred to by the acronym SABC. The grinding line comprises one SAG mill, a pebble wash screen, one ball mill, one cyclone cluster, and a pebble crusher. The SAG mill is in a closed circuit with the screen and pebble crushing. The ball mill is in a closed circuit with the hydrocyclone cluster.
The SAG feed conveyor will feed ore to the SAG mill, which is an FFE Minerals mill, 7.32 m diameter by 2.74 m effective grinding length (24 ft x 9 ft EGL), powered by a new 2,872 kW (3,850 hp) drives on VFD. The SAG mill product will discharge to a pebble wash screen.
The pebbles separated by the SAG mill discharge screen are conveyed to the pebble crusher feed bin and crushed with a Metso HP100 cone crusher set at a closed-side setting of 13 mm. The crushed pebbles are returned to the SAG mill via the SAG mill feed conveyor.
The undersize of the SAG mill discharge screen drops into the cyclone feed pump box. This will constitute fresh feed to the ball mill. It will mix with the discharge from the ball mill and dilution water (to adjust the pulp density). The mixed slurry will then be pumped to a cluster of five 26-inch hydrocyclones (4 operating, 1 standby). Pumping will be by a 260 kW (350 hp) Warman pump. A second pump is installed as standby. Both motors are controlled by medium-voltage variable frequency drives.
The cyclone underflows will flow by gravity to the ball mill,
4.72 m diameter by 6.55 m length by FFE Minerals. It is driven by a fixed-speed
2,313 kW (3,100 hp) motor by TECO-Westinghouse. The cyclone overflows will
constitute the product of the grinding circuit and will be fed to the flotation
circuit. The target size for distribution is 80 percent finer than 160 microns.
|
|
192 |
| ANA PAULA PROJECT |
| FORM 43-101F1 TECHNICAL REPORT |
17.6 GRAVITY CONCENTRATION
A split from the hydrocyclone overflow is processed for gold recovery by gravity concentration and intensive cyanidation. Gravity concentration is achieved using a centrifugal concentrator (Knelson KC-QS40 or equivalent). The gravity concentrate is then leached with cyanide in the presence of an oxidizer using an intensive leach package (Acacia CS200 ore equivalent). The pregnant solution produced is sent to the same electrowinning circuit serving the oxidized concentrate leach circuit.
17.7 GRAVITY GOLD RECOVERY
Based on test work (Section 13), approximately 40% of the gold is gravity recoverable. In the current design, 36% of the circulating load gets treated in the gravity concentration and intensive cyanidation section of the plant. This corresponds to approximately 20% of the gold being recovered by the gravity circuit.
The gravity concentrator will be a centrifugal gravity concentrator, a Knelson KC-QS40 or equivalent unit, that will be fed from the undersize of a vibrating screen – a 1.8 m x 4.8 m screening module. The gravity machine spins the slurry at a high velocity, collecting heavy particles on the inside ribs. The machine is operated in batch mode, on a set cycle to concentrate and then flush heavy materials to a downstream leach system. Tailing from the gravity operation is discharged to the ball mill feed chute with the cyclone underflow.
The gravity concentrate is fed to an intensive cyanidation package, a Consep Acacia CS200 or equivalent package, through a reactor feed tank. The pregnant solution is pumped to the electrowinning cells that mainly process pregnant solution from the carbon-in-leach (CIL) process included in this plant. Tailing from the intensive cyanidation reactor are pumped to the CIL process.
17.8 FLOTATION
Sulfides in the ore will be floated at the ore’s natural pH using potassium amyl-xanthate (PAX) as collector, AERO 3418A as promoter, copper sulfate as activator, and F131A as frother.
The average laboratory rougher flotation time determined during several bench-scale tests is 16 minutes. With a scale-up factor of 2 and 15% aeration at 30% solids, this will require 36.8 minutes of plant residence time and a total volume of 377 m3. This calls for 6 units of 70 m3 flotation cells.
Flotation of sulfides will be accomplished by single-stage rougher flotation. Cyclone overflow is first sent to a 41.2 m3 conditioning tank, then to a bank of six 70 m3 tank flotation cells. Each flotation cell mechanism is driven by a 93 kW (125 hp) motor through a gear reducer. Flotation air is supplied by a 70 kW (94 hp) blower, which can deliver 95 Nm3/min of air.
Flotation concentrates will advance to the concentrate thickener and then to the regrind mill.
The tailing is pumped to one flotation tailing thickener (28 m diameter high-rate thickener) to be thickened to 55% solids, in preparation for pumping to the tailing storage facility.
17.9 CONCENTRATE THICKENING AND REGRIND
Concentrate from the rougher flotation circuit is dewatered in the 10.5 m diameter high-rate thickener to a pulp density of 55% solids. Flocculant is added to the thickener feed to aid in settling. The withdrawal rate of settled solids is controlled by one of two underflow pump to maintain either thickener underflow density or thickener solids loading. Each pump is driven by a 30 kW (40 hp) motor on variable frequency controller to deliver a nominal maximum of 65 m3/h. Underflow from the concentrate thickener is pumped using variable speed horizontal centrifugal slurry pumps to the regrind mill feed box.
|
|
193 |
| ANA PAULA PROJECT |
| FORM 43-101F1 TECHNICAL REPORT |
Concentrate thickener overflow, is pumped to the reclaim solution tank using two fixed speed horizontal centrifugal pumps, one operating and one standby, each driven by a 30 kW (40 hp) motor with a nominal capacity of 100 m3/h.
The high rate concentrate thickener is mounted on steel legs on foundations. A concrete containment area with slab on grade and cast-in-place walls will contain rain runoff and process spills. The floor is sloped to sumps that will pump the contained liquids and solids back to the process.
From the regrind mill feed box, the thickened concentrate is pumped to the regrind mill with two the variable speed feed pumps, one operating and one standby. Each pump is driven by a 45 kW (60 hp) motor to deliver a nominal maximum flowrate of 81 m3/h.
The concentrate regrind mill is a 900 kW tower mill with ceramic grinding media. It will operate in open circuit while being monitored by an online particle size analyzer. The target grind of 80% finer than 25 microns is attained by controlling mill speed with a variable speed drive.
The regrind mill discharge is pumped using two horizontal centrifugal pumps, one operating and one standby, from the regrind mill discharge box to the atmospheric oxidation feed box. The pumps are fixed speed, with 30 kW (40 hp) drives.
17.10 ATMOSPHERIC OXIDATION
Atmospheric oxidation (AOX) of the sulfide concentrate is conducted in five agitated tanks. Each tank is 9 meters in diameter and 10 meters high (operating volume of 608 m3), made of 2205 duplex stainless steel. Slurry is fed to each tank through a downcomer and overflows to the next tank or a pump box at the end of the series. Each agitator is powered by a 56 kW (75 hp) motor through a gear reducer. Oxygen is injected into each tank through fine-bubble spargers.
The reaction kinetics was found to be optimized in the laboratory at around 75 oC. It is exothermic and expected to be autothermic if the feed concentrate grade is kept at 10% sulfide sulfur or higher.
While the reaction is exothermic, the rate of reaction is very slow at room temperature. At steady state conditions with enough sulfide sulfur, the atmospheric oxidation plant will support itself thermally. However, during cold startup, for example after a long shutdown, pulp in the first, and possibly the second AOX tank, will need to be preheated to get the reaction started and provide its own heat. The preheat temperature may be as low as 50 oC up to the actual minimum reaction temperature of 75 oC. The required preheat temperature will have to be established at the start of actual operation.
17.11 CARBON-IN-LEACH (CYANIDATION)
The oxidized slurry flows to two neutralization tanks (6 m diameter, 7 m high, 185 m3 operating capacity) where lime is added to increase the pH to 10 to 10.5. The neutralized slurry is then pumped to a pre-leach thickener (10.5 m diameter) to increase the pulp density to 55% solids. Once thickened, slurry is pumped to the carbon-in-leach feed tank where it combines dilution water, sodium cyanide reagent feed, and other process streams, into the first CIL tank.
Cyanide leaching is achieved in six CIL tanks (9.8 m diameter,
9.8 m high, 696 m3 operating capacity) each equipped with 30 kW (40
hp) agitators with two narrow-blade hydrofoil impellers. The tanks are built
with epoxy-coated mild steel. Air is delivered by a pipe under an inverted cone
located directly below the agitator.
|
|
194 |
| ANA PAULA PROJECT |
| FORM 43-101F1 TECHNICAL REPORT |
Based on leaching test results, a residence time of 48 hours is sufficient to achieve the target recovery for both gold and silver. After leaching, loaded activated carbon is sent to the carbon plant for stripping and electrowinning.
17.12 CARBON HANDLING PLANT – CARBON ELUTION AND METAL RECOVERY BY ELECTROWINNING
Once the loaded carbon is screened from the leached slurry, it is transported to the carbon handling plant. Loaded carbon is first acid washed with a dilute solution of hydrochloric acid to remove scale from the carbon, rinsed, and then pumped to the carbon stripping vessel. The carbon strip vessel is a pressure vessel, with a capacity to strip 5 tonnes of carbon per batch. The stripping process follows the pressure Zadra procedure developed by the US Bureau of Mines. It involves contacting a hot solution of cyanide and caustic (0.15 % cyanide, 1.25 % caustic) at a rate of 2 bed volumes per hour. The solution is introduced at the bottom of the carbon bed and overflows at the top of the vessel through one of more cylindrical Johnson screens. The solution is preheated to 135oC by heat exchangers. Because of the elevated temperature, the strip vessel is kept at about 550 kPa to prevent boiling.
During stripping, gold and silver adsorbed on activated carbon desorbs into the strip solution. This loaded strip solution is then sent to electrowinning cells through a heat exchanger. In the electrowinning cells, gold and silver are deposited by electrolysis to a stainless-steel cathode. The anode is typically a stainless-steel wire mesh.
When enough is deposited on the cathodes, gold and silver is pressure washed off the cathodes and collected as sludge at the bottom of the electrowinning cells. The sludge is discharged to a tank and filtered through a plate-and-frame filter press.
The filtered residue is finally dried in retorts to remove and collect any mercury, and smelted in a tilting furnace. Metallic gold and silver melt is then poured into bullion molds to produce the final product of the operations – doré bullions.
17.13 CYANIDE DESTRUCTION
Residual weak-acid dissociable (WAD) cyanide in the leach tailing is destroyed (detoxified) by oxidation using oxygen (from air) and sodium metabisulfite. Milk-of-lime is added to maintain a slurry pH in the range of 8.0 to 8.5. The reaction is catalyzed by copper (5 ppm), which will need to be supplied if the ore does not contain enough cyanide-soluble copper.
Cyanide is oxidized first to cyanate, which eventually decomposes to carbon dioxide and nitrogen gas. The more stable iron cyanides are precipitated from solution as insoluble ferrocyanide compounds. The cyanide levels in solution are thereby reduced to an environmentally acceptable level (<50 ppm WAD cyanide, per the Cyanide Code). The detoxified slurry is sampled prior to thickening to ensure that the WAD cyanide content meets the target discharge level.
The detoxification reactors are two agitated tanks, operated in series. The two tanks will have a total volume of 315 cubic meters, and will provide a total residence time of approximately 3 hours.
Slurry discharged from the detoxification circuit will overflow into a discharge box, from where it is pumped to the tailing thickener (28 m diameter thickener) by two 56 kW (75 hp) horizontal centrifugal pumps, one operating and one standby.
A concrete containment slab on grade and containment walls will
contain rain runoff and process spills. A sump pump will transfer the solution
and solids back to the process.
|
|
195 |
| ANA PAULA PROJECT |
| FORM 43-101F1 TECHNICAL REPORT |
17.14 WATER BALANCE AND SOLUTION MANAGEMENT
A water balance was developed for the Ana Paula project as part of the mass balance model using MetSim modeling software. The water and solution management scheme is illustrated in Figure 17-4 below.
The estimated fresh water requirement of the Ana Paula project is 84 m3/h, of which 69 m3/h is for mill operations, 5 m3/h for potable water use and the equivalent flowrate of 10 m3/h for mine dust control. Raw water supply will comprise 31 m3/h from the well field and 52.8 m3/h from the rainfall diversion channel runoff.
Well water use in the mill includes 11.9 m3/h for
gland seal, 2.2 m3/h for cyanide recovery and 2 m3/h for
crushing plant dust control. Fire protection water is also derived from well
water. All the runoff water is used as mill makeup water. It is introduced to
the mill through the tailing thickener and stored in the reclaim water tank with
the tailing thickener overflow.
|
|
196 |
| ANA PAULA PROJECT |
| FORM 43-101F1 TECHNICAL REPORT |
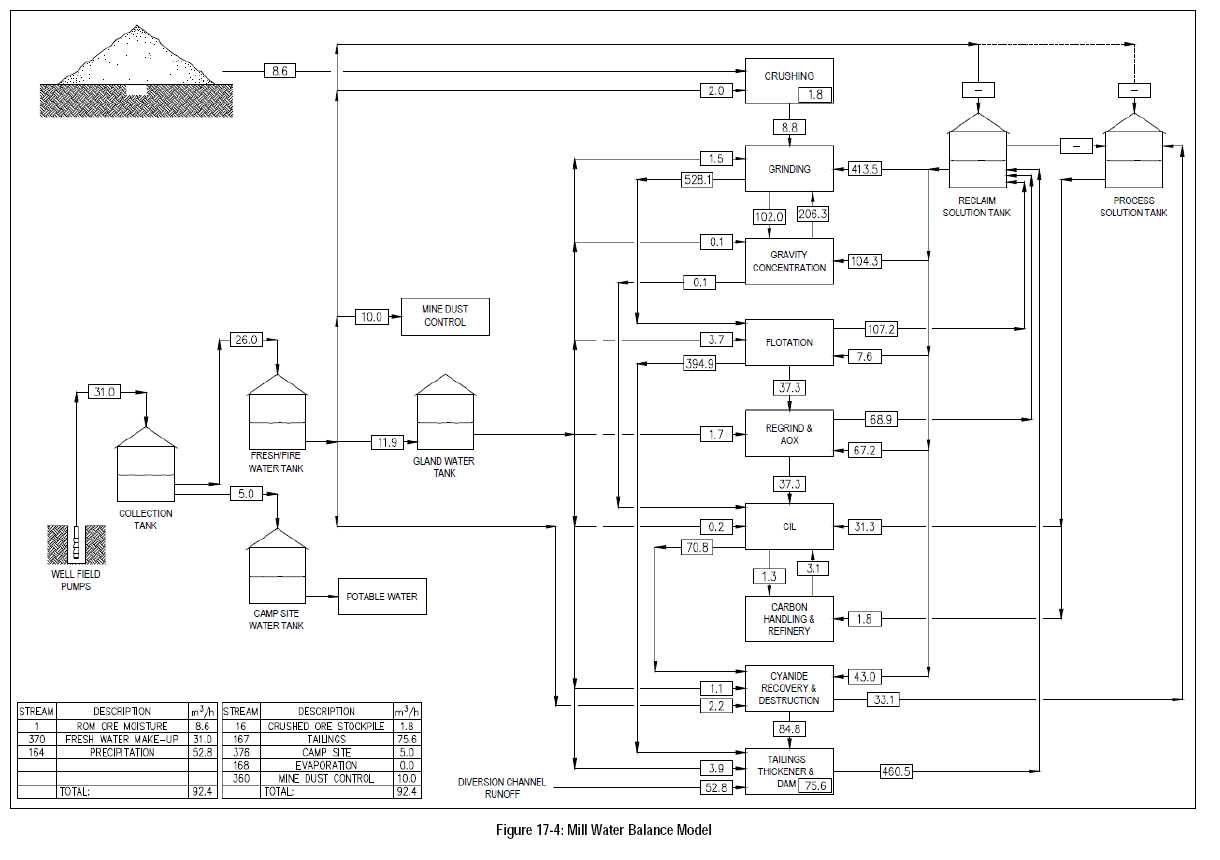
|
|
197 |
| ANA PAULA PROJECT |
| FORM 43-101F1 TECHNICAL REPORT |
Mill operations use a total of 681.9 m3/h of water, of which 90% (613 m3/h) is water recycled from the TSF, the tailing thickener, cyanide recovery thickener overflow, the preleach thickener overflow, and the concentrate thickener overflow. Table 17-3 below is a list of water sources for the mill operations.
Table 17-3: Summary of Water Sources for the Mill
| Water Source | Flow (m3/h) | % of Requirement |
| Recycle Water Sources | ||
| Tailing Storage Facility Reclaim | 166.4 | 24.4% |
| Concentrate Thickener Overflow | 107.2 | 15.7% |
| Preleach Thickener Overflow | 68.9 | 10.1% |
| Cyanide Recovery Overflow | 33.1 | 4.9% |
| Tailing Thickener (Recycle Portion) | 237.4 | 34.8% |
| Total Recycle Water | 613 | 89.9% |
| Raw Water Sources | ||
| Tailing Thickener (Runoff Water Portion) | 52.8 | 7.7% |
| Gland Seal Water (Well Water) | 11.9 | 1.8% |
| Cyanide Recovery Wash Water (Well Water) | 2.2 | 0.32% |
| Crushing Dust Control (Well Water) | 2 | 0.29% |
| Total Raw Water | 68.9 | 10.1% |
| Total | 681.9 |
Water from well field is pumped to the fresh/fire water tank (534 m3 capacity) and to the camp site water tank (78 m3 capacity). Both tanks will include fire water reserves in the event of an emergency. Fresh water system is designed to prevent contamination with cyanide-containing solutions.
Recycled water is segregated into two tanks. The process water tank is for cyanide-containing solution, while the reclaim solution tank stores the rest of the recycled water that is not contaminated with cyanide.
The process water tank (170 m3 capacity) stores solution from the cyanide recovery thickener overflow, which includes some well water used as wash water in thickener. Process water is pumped to the CIL area and to the cyanide dilution system by two horizontal centrifugal pumps, one operating and one standby, each with a capacity of 26 m3/h and driven by a 22 kW (30 hp) motor.
The reclaim solution tank (800 m3 capacity) is supplied with tailing pond reclaim solution, concentrate thickener overflow, pre-leach thickener overflow, tailing thickener overflow, and raw water. Process water is pumped by two horizontal centrifugal process water pumps, one operating and one standby, each powered by 150 kW motors. Process water is supplied to the grinding circuit, flotation circuit, concentrate oxidation circuit, process water tank as make-up, refinery scrubber, and to the flocculant systems.
17.15 TAILING SLURRY TRANSPORT
Thickened tailing are discharged to a final tailing tank, from
which the slurry is pumped using two fixed speed horizontal centrifugal pumps,
one operating and one standby, (56 kW, 274 m3/h), to the tailing
storage facility (TSF). The tailing pipeline is a DN250/PN16 PE100 HDPE pipe,
which is 2,700 m long, 250 mm bore, and will distribute tailing to Zone A
spigots as well as to the dump spigot. This pipe connects to a 600 m long, 150
mm bore DN150/PN10 PE100 HDPE distribution header that will deposit tailing
through Zones B and C spigots.
|
|
198 |
| ANA PAULA PROJECT |
| FORM 43-101F1 TECHNICAL REPORT |
Solution from the pond reservoir is reclaimed by two 75 kW barge-mounted turbine pumps, one operating, and one standby. The reclaim solution is pumped to the reclaim solution tank (800 m3 capacity) through a 700-m long DN225/PN20 PE100 HDPE pipe.
A concrete containment slab on grade and containment walls will contain rain runoff and process spills.
17.15.1 Sodium Carbonate Handling
Sodium carbonate is delivered to the site by trucks and off loaded to two 1700-tonne silo system. The aim is to provide enough storage capacity to supply 28 days of operation. This would provide sufficient buffer capacity for the supply and transport of sodium carbonate from the supplier to the mine site.
Sodium carbonate is added as a solution to the regrind ball mill and to the oxidation tanks, sodium carbonate is diluted in an automatic dilution system located bellow the silos.
17.16 MILL POWER CONSUMPTION
The average power consumption in the process plant is tabulated in Table 17-4 with a total consumption of 733 million kWh. This translates to about 35.6 kWh/tonne of ore processed.
Table 17-4: Summary of Average Annual Mill Power Consumption.
(excluding first and last years of operation)
| Area No | Mill Area | Annual kWh |
| 100 | Primary Crusher | 1,466,463 |
| 200 | Grinding | 39,803,779 |
| 210 | Gravity Concentration | 713,625 |
| 250 | Pebble Crushing | 897,786 |
| 300 | Rougher Flotation | 4,494,337 |
| 350 | Regrind | 6,537,967 |
| 400 | Concentrate Oxidation | 3,143,754 |
| 500 | CIL | 2,184,624 |
| 600 | Tailing Diposal | 2,416,596 |
| 700 | Carbon Handling & Refinery | 348,315 |
| 800 | Reagents | 354,391 |
| 900 | Raw Water And Plant Services | 2,568,750 |
| Total | 64,930,388 |
17.17 PROCESS CONTROL SYSTEM
A central control room (CCR) is provided in the concentrator grinding facility core, which is the main operating control center for the complex. From the CCR control consoles, primary crushing, material handling systems, grinding and flotation, reagents, tailing, and utility systems is monitored and/or controlled.
A computer room, located adjacent to the CCR will contain engineering workstations, a supervisory computer, historical trend system, management information systems (MIS) server, programming terminal, network and communications equipment, and documentation printers. This is primarily used for Distributed Control System (DCS) development and support activities by plant and control systems engineers.
Although the facilities will normally be controlled from the CCR, local video display terminals are selectively provided on the plant floor for occasional monitoring and control of certain process areas. Any local control panels that are supplied by equipment vendors are interfaced with the DCS for remote monitoring and/or control from the related control room.
|
|
199 |
| ANA PAULA PROJECT |
| FORM 43-101F1 TECHNICAL REPORT |
The DCS will use an Industrial Data Center (IDC), Programmable Logic Controllers (PLC) and Thin Clients or personal computers connected together with a fiber optic network using the Ethernet protocol. A RIO cabinet with an adequate number of I/O ports on field and a PLC cabinet is in each electrical room. The interaction with these PLCs is through of virtual servers on IDC, using Thin Clients or personal computers running a Virtual Machine with the appropriate Human Machine Interface (HMI) programs. Interactive screens on the monitors will allow process control.
The basic system will incorporate an IDC in server room, PLCs in each electrical room, and two personal computers in the main control room in the grinding area. The remote systems such as well field are controlled from the main control room using a fiber optic or radio communication system.
A supervisory expert system will not be incorporated at this time.
17.18 MOBILE EQUIPMENT
Table 17-5 lists the mobile equipment that is provided in the project capital cost estimate. The cost for this equipment is included in Owner’s Costs. In addition, Minera Aurea has mobile equipment available as part of the El Sauzal plant purchase.
Table 17-5: Mobile Equipment List
| Description | Qty | Duty |
| Fire Truck | 1 | Emergency |
| Ambulance | 1 | Emergency |
| Water Truck | 1 | General Maintenance |
| Maintenance Service Truck | 3 | General Maintenance |
| 20t telescopic crane | 1 | General Maintenance |
| 150t all terrain crane | 1 | General Maintenance |
| Manlift | 1 | General Maintenance |
| Telehandler | 1 | General Maintenance |
| Mini Loader | 3 | General Maintenance |
| Fork Lifts | 2 | Warehouse & General |
17.19 PRODUCTION ESTIMATE
Production by project year is tabulated in Table 17-6 showing recovered gold and silver.
Table 17-6: Ana Paula Projected Metal Production
| Production Year | Au, kOz | Ag, kOz |
| 1 | 96.8 | 207.5 |
| 2 | 96.5 | 180.4 |
| 3 | 127.4 | 218.3 |
| 4 | 104.7 | 161.1 |
| 5 | 152.9 | 174.9 |
| 6 | 89.6 | 105.7 |
| 7 | 146.0 | 115.6 |
| 8 | 54.1 | 76.2 |
| Grand Total | 868.0 | 1,239.7 |
|
|
200 |
| ANA PAULA PROJECT |
| FORM 43-101F1 TECHNICAL REPORT |
18 PROJECT INFRASTRUCTURE
18.1 SITE ACCESS
The Ana Paula project is located in the state of Guerrero, Mexico, approximately 170 km southwest of Mexico City, roughly equidistant between Mexico City and Acapulco. The project is accessible from Highway 51 along a stretch of gravel roads that will require some improvement to enable access for the larger trucks carrying heavy mine equipment and supply loads for the mine site. The mine site lies approximately 30 km south of Highway 51, and this section of gravel road can be relatively easily upgraded to service the project. Iguala is the nearest major city and is serviced by direct airline flights from several major Mexican cities.
The current mine access road is off of the main road between Cuetzala del Progresso and Nuevo Balsas. The access road is approximately 4.5 km from the main road to the plant site. The road from Cuetzala to the mine site will need to be improved to provide access for the larger loads required to construct the project.
The mine and process facilities are planned to lie between the open pit and the tailings storage facility and at a higher elevation. A crusher station and conveyor will be placed adjacent to the lower saddle point closer to the pit ramp and will deliver the crushed rock to the mill, where further processing will be accomplished.
18.2 TAILINGS STORAGE FACILITY
Tailings will be transported and deposited via conventional sub-aerial deposition methods, in a valley-type tailings storage facility (TSF), located immediately downstream of the waste management facilities and plant area. The TSF will be contained behind an embankment that will be constructed across a narrow outlet of the valley to reduce construction quantities and costs. Figure 18-1 shows the site plan for the TSF and WRF.
The TSF was sized to contain tailings and storm water runoff. Specifically, the TSF was sized to provide storage capacity for approximately 10.3 million m3 of tailings (15.5 million tonnes) and the 0.1 percent chance of exceedance water volume. The maximum height of the dam will be approximately 100 m, and the dam will be constructed in four stages over the life of the mine, as presently envisioned. The starter dam (Stage 1) crest will reach elevation 841 (meters above sea level) and the next three stages will reach crest elevations of 849, 855, and 862.
The dam will be a zoned earthfill/rockfill structure, with the
upstream face lined with 80-mil HDPE geomembrane. The dam will be constructed
using conventional downstream methods, and the zone behind the upstream 80-mil
HDPE geomembrane liner will consist of, from upstream to downstream: (1) Core
zone, (2) Filter/drain zone, (3) Transition zone, and (4) Rockfill Zone. Both
upstream and downstream slopes will be 2H:1V; however, based on rock quality
materials slopes may be optimized to reduce construction costs. Figure 18-2
shows sections and details of the tailings dam.
|
|
201 |
| ANA PAULA PROJECT |
| FORM 43-101F1 TECHNICAL REPORT |

|
|
202 |
| ANA PAULA PROJECT |
| FORM 43-101F1 TECHNICAL REPORT |
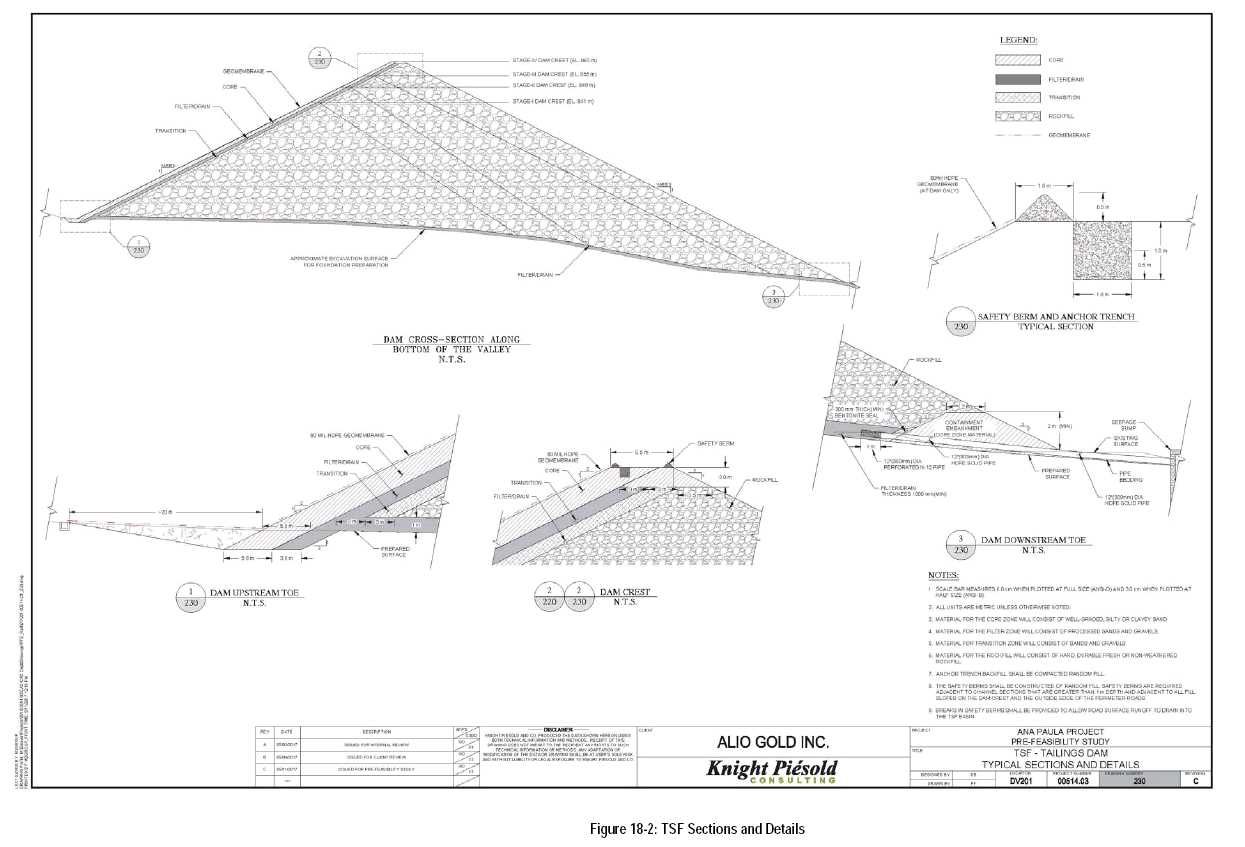
|
|
203 |
| ANA PAULA PROJECT |
| FORM 43-101F1 TECHNICAL REPORT |
Geochemical characterization was completed for the mine materials, including ore samples, waste rock, and flotation tailings, to determine if the materials would require special waste management practices to prevent environmental impacts. It should be noted that two types of tailings will be generated; about 80% will be flotation tailings and about 20 percent will be leached tailings. Laboratory testing results for flotation tailings samples show relatively low contents of sulfide and considerable excess neutralization potential (NP). Seepage from the flotation tailings are not predicted to contain metals at levels of concern. Based on these conclusions, and a preliminary surface geology assessment, the basin is not expected to require lining with geomembrane; and therefore, preparation will be limited to vegetation and topsoil removal only. Characteristics of leached concentrate tailings have not been confirmed yet; once samples are available, testing of this material should be completed prior to finalizing management needs of these materials.
Design of the TSF dam was conducted using the dam safety guidelines developed by the Canadian Dam Association (CDA) for “mining dams”. Based on CDA guidelines, the TSF dam was classified as a “high hazard dam”, which is a common designation for dams of similar characteristics. Based on this, all design work for the TSF completed to date, including geotechnical analysis and water management, was designed accordingly.
A probabilistic water balance model was developed to perform life-of-mine simulations, including estimations of water transfers and storages. Storage facilities’ volume capacity requirements were estimated using deterministic and probabilistic methods. The method that produces the largest storage volume (deterministic or probabilistic) was selected for the design. The dam crest elevation was set based on the 0.1 percent chance of exceedance wet condition, which is a more conservative volume, and could range from 4.3 Mm3 to 6.8 Mm3 over the operational life. An emergency spillway has been considered for the last year of operation which would be used as part of the closure plan for the facility.
Two diversion channels upstream of the TSF were included in the design and water balance model (Pit Channel and West Channel). The Pit Channel has been designed to collect natural ground runoff from the contributing area upgradient of the open pit and TSF. The West Channel has been designed to collect natural ground runoff from the contributing area upgradient, and west of the TSF.
According to the Mexican norm, NOM-141 SEMARNAT-2003, the Ana Paula site is classified as in a seismic region. In response, a Probabilistic Seismic Hazard Analysis (PSHA) was conducted for the site and the results were used to calculate the peak ground accelerations at the following return periods: 475-yr; 975-yr; 2,475-yr; 5,000-yr; and 10,000-yr. A Deterministic Seismic Hazard Analysis (DSHA) was also completed for the significant seismic sources near the site. The DSHA produced response spectra for 50th percentile (median) and 84th percentile ground motions estimated for the Maximum Credible Earthquake (MCE) that can be expected to occur at the site, based on currently-available information. The maximum design earthquake (MDE) for the TSF was preliminarily selected based on the site conditions and CDA dam safety guidelines, as having a Peak Horizontal Ground Acceleration (PHGA) of 0.7 g corresponding to a 2,475-yr return period event (g is the acceleration of gravity) .
Geotechnical analyses for the TSF included limit-equilibrium stability analyses and deformation analyses for the dam. The analyses were carried out to confirm that the minimum acceptable Factor of Safety (FoS) would be achieved. Simplified seismic-induced deformation analyses were also performed. Based on the geotechnical analyses results, the TSF meets commonly accepted minimum factors of safety and estimated seismic-induced deformations are considered to be acceptable.
For the tailings delivery system, preliminary hydraulic evaluations indicate that a 10-inch diameter HDPE pipe will be required for the main pipeline. Tailings deposition will take place in three zones through a spigot system to meet requirements of overall deposition plans. A single point discharge is included at the north end of the facility to discharge tailings when the downstream tailings pipeline around the facility is out of commission and/or being raised to the next level. The tailings supernatant pond will be located in the northwest side of the TSF remote from the dam, from where the reclaimed water will be pumped back to the plant. The pumps (one duty and one standby) will be housed on a single barge or two connected barges.
|
|
204 |
| ANA PAULA PROJECT |
| FORM 43-101F1 TECHNICAL REPORT |
Material take offs were completed for the 4 proposed stages of the TSF. Initial and sustaining capital expenditures were estimated based on unit prices provided by M3. Indirect costs for contingency and engineering were not included, but added to the total direct costs by M3.
18.3 WASTE ROCK FACILITIES
Two waste rock facilities (WRFs) have been located downgradient and south of the pit area. The two WRFs will have sufficient capacity to store 53 million tonnes of waste rock at an estimated density of 1.8 t/m3. Configurations for the WRFs (East and West WRFs) were developed by AGP Mining Consultants Inc. based on the mine plan for the project. The East facility will have the downstream toe at 840 meters above sea level (masl) and will reach a final elevation of 980 masl. The West facility will have the downstream toe at 848 masl and will reach a final elevation of 1,050 masl. Construction cost estimates for the WRFs were prepared which were limited to foundation preparation. Figure 18-3 shows the WRF sections.
The waste rock material in both facilities will be placed to form slopes of approximately 1.4H:1V. The foundation for the waste rock facilities will be prepared by removing vegetation and topsoil from the area. Slope stability and deformation analyses were completed for the WRFs; based on the results of these analyses, the waste rock facilities meet commonly accepted minimum factors of safety. The estimated seismic-induced deformations for both facilities are acceptable.
Waste rock materials are mostly classified as granodiorite and
sediment comprising hard compacted particles. Geochemical analysis results for
the waste rock samples tested indicate that it will contain an excess of
neutralization potential (NP) over acid potential (AP), with capacity to
neutralize potential production of acid solutions. Seepage from the waste rock
is unlikely to contain mobilized metals at levels of concern.
|
|
205 |
| ANA PAULA PROJECT |
| FORM 43-101F1 TECHNICAL REPORT |
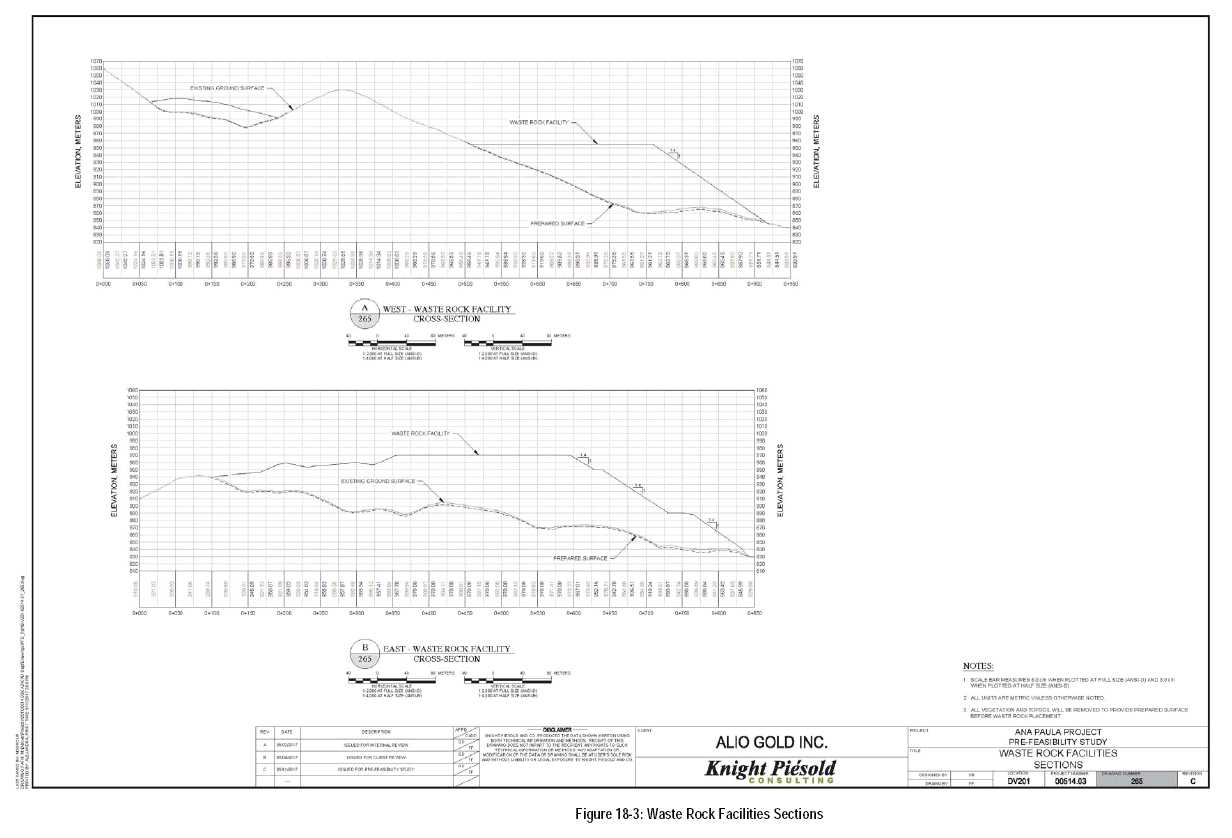
|
|
206 |
| ANA PAULA PROJECT |
| FORM 43-101F1 TECHNICAL REPORT |
18.4 PROCESS PLANT
The process plant is located east of the waste rock management (WRM) facilities and southeast of the mine pit (Figure 18-4 and Figure 18-6). Process facilities include the laydown area, initial crushed ore stockpile, primary crusher, mine support buildings, mill area, gravity concentrator, reagents area, flotation, regrind, concentrate thickener, atmospheric oxidation (AOX) leach tanks, carbon-in-leach (CIL) tanks, carbon plant, refinery, cyanide treatment, tailing thickener, oxygen plant, generator area, and electrical substation, as shown in Figure 18-5, Figure 18-7, and Figure 18-8. Adequate warehouse and office space have been accounted for along with sewage treatment and potable water treatment facilities.
18.5 MINE SUPPORT AND ANCILLARY BUILDINGS
Support and ancillary buildings for the site include a covered, partially enclosed equipment maintenance shop, administration office building, fuel storage/dispensing system, truck scale, warehouse, security gate and guard house. The warehouse, permanent laydown area, laboratory, and administration offices are in the southeast corner of the plant area (Figure 18-5). Some additional facilities may be brought in by the contract miner.
Mine support buildings including a warehouse, truck shop, and two mine shops are located in the northern end of the plant area, just east of the primary crusher. The mine service area is located to be near the pit and is next to the stockpile area east of the crusher (Figure 18-5).
The mine scenario evaluated in this study includes the
construction of an on-site camp capable of housing up to approximately 790
people, located along the mine access road (Figure 18-4). The site camp area is
intended to be developed initially for the construction camp and evolve into the
permanent operations camp.
|
|
207 |
| ANA PAULA PROJECT |
| FORM 43-101F1 TECHNICAL REPORT |

Figure 18-4: Site Layout
|
|
208 |
| ANA PAULA PROJECT |
| FORM 43-101F1 TECHNICAL REPORT |
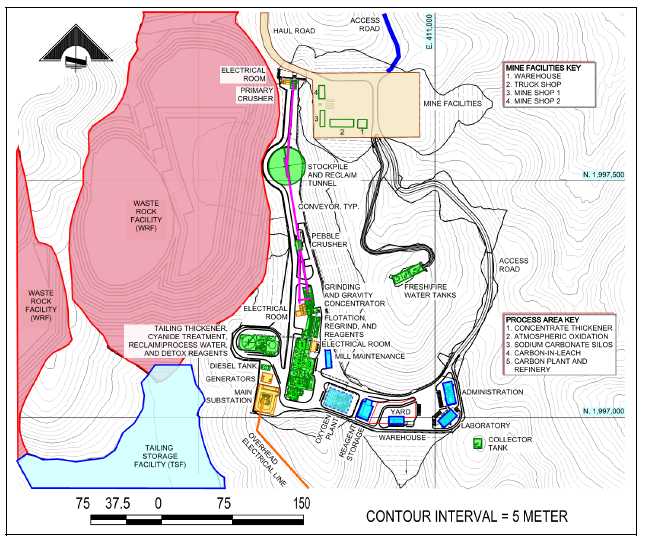
Figure 18-5: Plant Layout
18.6 POWER SUPPLY AND DISTRIBUTION
Line power is available within 2.5 km of the proposed plant site and is supplied via a 115 kV line running generally east-west adjacent to the site property (Figure 18-4). A 1.5 km power line will be constructed with appropriate tie-ins and switching to deliver power at 115 kV to a substation that will be constructed in close proximity to the plant site. The substation will drop the supply voltage to 4,160 V for general distribution around the site and for distribution to the large motor loads such as the crusher facilities. Design power load has been estimated at approximately 15 megawatts (MW).
18.7 WELL FIELD
The power supply for the operation of the well system will be
carried out by an existing 34.5 kV overhead line that runs parallel to the
Tomixtlacuan road.
|
|
209 |
| ANA PAULA PROJECT |
| FORM 43-101F1 TECHNICAL REPORT |
18.8 WATER SYSTEMS
Details of the water requirements and management are discussed in Section 17. An average of 84 m3/h of raw water will be required, which will comprise 31.6 m3/h from the well field and 53.2 m3/h from the rainfall diversion channel runoff.
Well water will be used for camp site potable water (4.9 m3/h), mine dust suppression (10 m3/h), gland seal water (12.5 m3/h), cyanide recovery (2.2 m3/h), and crushing dust suppression (2 m3/h). Fire protection water is stored is also derived from well water.
All the runoff water is used as mill makeup water. It is introduced to the mill through the tailing thickener and reaches the reclaim water tank with the tailing thickener overflow.
18.8.1 Fresh and Fire Water
The fresh water supplied to the plant site will come from a well field located approximately 2.5 km from the current proposed plant site. Water will be extracted from two wells by two 37.3 kW (50-hp) pumps through an overland pipe to a collector water tank located at the southeast area of the plant. The collector water tank area will house a grid-based power transformer and diesel generator to supply power to distribution pumps. The collector tank will allow for fluctuations in the well pump system. The collector pumps will pump the water to a centralized fresh and fire water tank, raw water, and potable water tanks. The potable water tank will have an additional line to feed the site camp area head tank.
The Fresh/Fire Water Tank will have grid-based power and a backup diesel generator to supply power to electric distribution pumps. The fresh and fire water are stored in the same tank with fresh water being drawn from the upper portion of the tank and fire water drawn from the bottom portion of tank with a sufficient reserved volume dedicated to fire suppression needs. The fire suppression water pump system will also have a diesel fire pump backup system to provide adequate flow and pressure plant fire hydrants in the event of a fire during a power outage.
Potable water will be produced with use of local chlorination system at the plant site. The potable water supplied to the camp area will have designated water treatment systems for living quarters and food preparation areas. Drinking water is presumed to be imported bottled water.
18.8.2 Reclaim Water
Most of the water used in the process plant will be reclaimed from the TSF and pumped to the Reclaim Solution Tank. Make-up water will be added, as needed from the Fresh/Fire Water Tank. Reclaimed water includes water from the tailings slurry and stormwater runoff that is captured in the TSF.
Total anticipated reclaim water for the plant water system is expected to range from 140 to 175 m³/h, while also considering an evaporation rate of 5 m³/h.
Water which comes into contact with the plant site shall be considered contact water. This water is expected to report to a series of channels, sumps, and drains to a small event pond located south of the processing facility. This pond will be designed to handle the required volume of all plant area watersheds. Contact water will be pumped out of the event pond after the fines settle to either the TSF or Process Solution Tank.
18.8.3 Process Water
Process water is reclaimed after cyanide addition in the CIL leach circuit and is therefore unsuitable for discharge to the TSF. Process water containing cyanide is recovered from the Cyanide Recovery Thickener and pumped to the Process Solution Tank. Process water is used as make-up water for cyanide leach solution dilution, lean electrolyte tank, detox feed box, and cyanide mix tank.
|
|
210 |
| ANA PAULA PROJECT |
| FORM 43-101F1 TECHNICAL REPORT |
18.9 SEWAGE TREATMENT
The sewage discharge at the process plant and ancillary facilities is anticipated to report to a centralized waste water treatment plant (WWTP) just south of the process facilities. The WWTP is anticipated to have the effluent discharge to the TSF.
The sewage discharge at the construction and permanent camp facilities is anticipated to report to a centralized waste water treatment plant (WWTP) just north of the campus. A smaller specialized treatment system will be installed at the food preparation facilities to mitigate oils and food solids entering the WWTP.
The WWTP will be designed to meet the demand of the final
man-counts and conform to local governing agencies.
|
|
211 |
| ANA PAULA PROJECT |
| FORM 43-101F1 TECHNICAL REPORT |
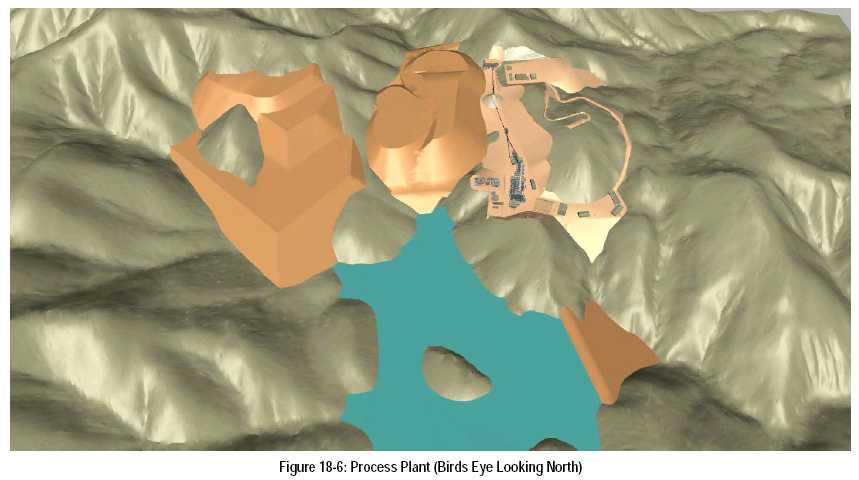
|
|
212 |
| ANA PAULA PROJECT |
| FORM 43-101F1 TECHNICAL REPORT |
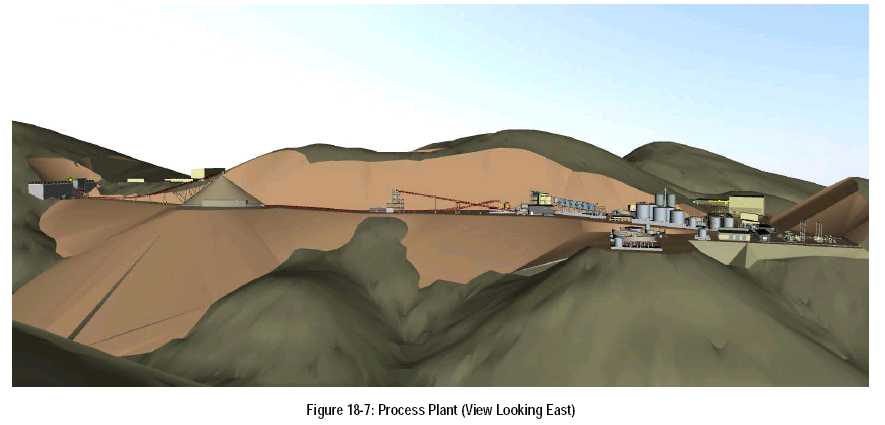
|
|
213 |
| ANA PAULA PROJECT |
| FORM 43-101F1 TECHNICAL REPORT |
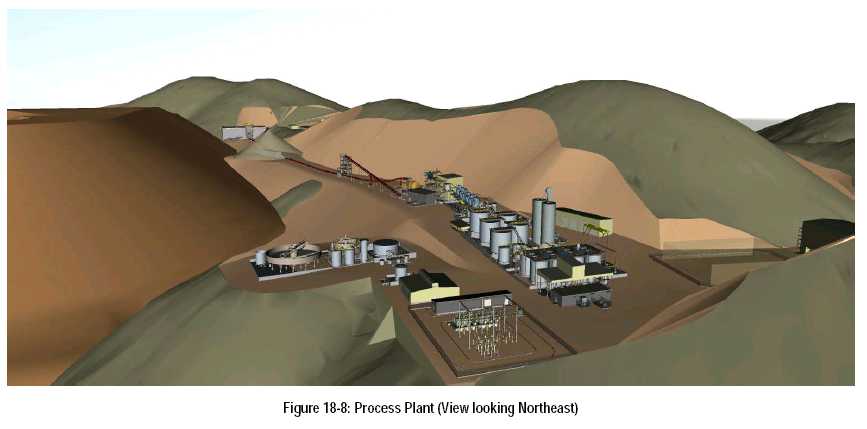
|
|
214 |
| ANA PAULA PROJECT |
| FORM 43-101F1 TECHNICAL REPORT |
19 MARKET STUDIES AND CONTRACTS
19.1 MARKET STUDIES
At this time, no market studies have been completed, as the gold to be produced at Ana Paula can be readily sold in the open market. Gold refining and transport charges were assumed to be $4.00/oz gold equivalent, based on experience from Alio’s other Mexican gold producing operations.
19.2 CONTRACTS
No contractual arrangements for concentrate trucking, port usage, shipping, smelting or refining exist at this time. Furthermore, no contractual arrangements have been made for the sale of gold doré at this time.
19.3 ROYALTIES
The project economic evaluation utilized the following royalties:
-
2.0 percent NSR Royalty to Goldcorp
-
0.5 percent NSR royalty for Mexican Precious Metals Tax (also known an “environmental erosion fee”)
19.4 METAL PRICES
The base and precious metal markets benefit from terminal markets around the world (London, New York, Tokyo, Hong Kong) and fluctuate on an almost continuous basis. Historical metal prices for gold and silver are shown in Table 19-1 and demonstrate the change in metal price from 2000 through to 2017.
Table 19-1: Metal Prices
| Year | Gold Price | Silver Price | ||||
| High (USD) | Low (USD) | Cumulative Average |
High (USD) | Low (USD) | Cumulative Average |
|
| 2000 | 312.70 | 263.80 | 279.11 | 5.45 | 4.57 | 4.95 |
| 2001 | 278.85 | 255.95 | 271.04 | 4.82 | 4.07 | 4.37 |
| 2002 | 349.30 | 277.75 | 309.73 | 4.85 | 4.20 | 4.60 |
| 2003 | 416.25 | 319.90 | 363.38 | 5.96 | 4.37 | 4.88 |
| 2004 | 454.20 | 375.00 | 409.72 | 7.83 | 5.49 | 6.67 |
| 2005 | 536.50 | 411.10 | 444.74 | 9.23 | 6.39 | 7.32 |
| 2006 | 725.00 | 524.75 | 603.46 | 14.94 | 8.83 | 11.55 |
| 2007 | 841.10 | 608.30 | 695.39 | 15.82 | 11.67 | 13.38 |
| 2008 | 1,011.25 | 712.50 | 871.96 | 20.92 | 8.88 | 14.99 |
| 2009 | 1,212.50 | 810.0 | 972.35 | 10.51 | 19.18 | 14.67 |
| 2010 | 1,421.00 | 1,058.00 | 1,224.53 | 15.14 | 28.55 | 20.19 |
| 2011 | 1,895.00 | 1,319.00 | 1,571.52 | 26.68 | 48.70 | 35.12 |
| 2012 | 1,791.75 | 1,540.00 | 1,668.98 | 37.23 | 26.67 | 31.15 |
| 2013 | 1,693.75 | 1,192.00 | 1,411.23 | 31.11 | 18.61 | 23.79 |
| 2014 | 1,385.00 | 1,142.00 | 1,266.40 | 22.05 | 15.28 | 19.08 |
| 2015 | 1,295.75 | 1,049.40 | 1,160.06 | 18.23 | 13.71 | 15.68 |
| 2016 | 1,366.25 | 1,077.00 | 1,250.74 | 20.71 | 13.58 | 17.14 |
| 2017* | 1,284.15 | 1,151.00 | 1230.74 | 18.56 | 15.95 | 17.41 |
Base Case pricing is based on a gold price of $1,250/oz gold
and $17.00/oz silver. For mine planning, $1,200/oz gold and $16.00/oz silver was
used.
|
|
215 |
| ANA PAULA PROJECT |
| FORM 43-101F1 TECHNICAL REPORT |
20 ENVIRONMENTAL STUDIES, PERMITTING AND SOCIAL OR COMMUNITY IMPACT
Mining in Mexico is subject to a well-developed system of environmental regulation that applies from the period of mine exploration, to mine development, operation and ultimately through mine closure.
In April 2017 the Secretaría de Medio Ambiente y Recursos Naturales (SEMARNAT) approved the “Manifestación de Impacto Ambiental” (MIA), Environmental Impact Statement, submitted by Minera Aurea.
There are presently no known environmental issues that could materially impact Minera Aurea’s ability to extract the mineral resources and process material.
The only known environmental liabilities are associated with the exploration site activities and access roads. Remediation of surface disturbances and removal of residues is required as part of the exploration environmental permits. Exploration activities are ongoing and closure will be incorporated into the mine closure plan.
20.1 ENVIRONMENTAL STUDIES
In September, 2016 Mc. Terra Emprendimientos Sustentables (Terra) commenced the environmental baseline study for the Ana Paula Project. The study is expected to be completed in mid 2017. The project site is located in a mining district in the Sierra Madre del Sur mountain range in southern Mexico. Vegetation of the area is primarily tropical deciduous forest. The project area is not within a known environmental protection area.
Minera Aurea has installed a site-specific weather station at the coordinates W 0411703 N 2004037. Local data for precipitation and temperature have been collected since 2000, plus wind speed and wind direction have been collected since 2012. The area is subject to summer storms and hurricanes.
20.1.1 Water Quality
Geochemical characterization of waste rock is ongoing by Knight Piésold. Based on the results obtained to date the following conclusions have been reached.
-
Waste rock is unlikely to produce acid and there is sufficient excess neutralizing capacity to neutralize the acid should any be produced.
-
Seepage from the waste rock is unlikely to contain mobilized metals and the concentrations of any metals released is expected to be at low concentrations and far below their metal leaching potentials.
-
No special handling, such as a liner, is considered necessary for the waste rock facility.
Geochemical characterization of flotation tailings is ongoing by Knight Piésold. Based on the results obtained to date the following conclusions have been reached.
-
The flotation tailings are non-acid generating.
-
Seepage from the flotation tailings will not contain metals at levels of concern.
-
A liner for the flotation tailings management facility is not needed based on geochemistry and is not needed to control seepage.
Geochemical testing of the detoxed, leached concentrate
tailings will be conducted during the feasibility stage.
|
|
216 |
| ANA PAULA PROJECT |
| FORM 43-101F1 TECHNICAL REPORT |
20.1.2 Water Quantity
Process water will be supplied primarily from the rain water collected in the tailings facility with a make-up water supply sourced via a well cluster located approximately 2.5 km from the plant site. Potable water for the mining operation is planned to come from the local well cluster.
A hydrologic study is required to characterize the local groundwater conditions. A permit to take water is required from the Comision National del Agua (CNA).
20.2 PERMITTING
Guidance for the federal environmental requirements, including conservation of soils, water quality, flora and fauna, noise emissions, air quality, and hazardous waste management, derives primarily from the Ley General del Equilibrio Ecológico y la Protección al Ambiente (“LGEEPA”), the Ley General para la Prevención y Gestión Integral de los Residuos and the Ley de Aguas Nacionales (“LAN”). Article 28 of the LGEEPA specifies that SEMARNAT must issue prior approval to parties intending to develop a mine and mineral processing plant. On June 7, 2013, the Federal Law of Environmental Liability (Ley Federal de Responsabilidad Ambiental) was enacted. Per this law, any person or entity that by its action or omission, directly or indirectly, causes damage to the environment will be liable and obliged to repair the damage, or to pay compensation in the event that the repair is not possible. This liability is in addition to penalties imposed under any other judicial, administrative or criminal proceeding.
Environmental permitting in the mining industry in Mexico is mainly administered by the federal government body SEMARNAT, the federal regulatory agency that establishes the minimum standards for environmental compliance. SEMARANT has set regulatory standards for air emissions, discharges, biodiversity, noise, mining wastes, tailings, hazardous wastes, and soils. The regulatory standards apply to construction and operation activities.
There are three main SEMARNAT permits required prior to construction and development of a mining project. An Environmental Impact Statement (by Mexican regulations called a Manifestación de Impacto Ambiental, or “MIA”) is the document that must be filed with SEMARNAT for its evaluation and, if applicable, further approval by SEMARNAT through the issuance of an Environmental Impact Authorization. In addition, the Ley General de Desarrollo Forestal Sustentable indicates that authorizations must be granted by SEMARNAT for land use changes to industrial purposes. An application for change in land use or Cambio de Uso de Suelo Forestal, must be accompanied by a technical study that supports the environmental permit application (Estudio Técnico Justificativo or “ETJ”). In cases requiring a change in forestry land use, a Land Use Environmental Impact Assessment is also required. Mining projects also need to include a risk analysis for the use of regulated substances (Análisis de Riesgo) and an accident prevention program, which are reviewed and authorized by an interministerial governmental body.
Following the receipt of the Change of
Land Use Authorization, there are several permits that need to be acquired from
various federal agencies. The Land Use Authorization is required by the Comisión
Nacional del Agua (“CNA”), an agency within SEMARNAT, to issue water extraction
and discharge concessions, and specifies certain requirements to be met by
applicants. Key permits include approval from the National Water Commission for
construction of the tailings dam in creek basins that are considered to be
federal zones; an archaeological release letter is required from the National
Institute of Anthropology and History (“INAH”); an explosives permit is required
from the Ministry of Defense (“SEDENA”) before construction begins. Mexico
recognizes water as a national resource and regulates the use of water through
the Comisión Nacional del Agua (CNA). The aquifer targeted for supply of the
needed groundwater for the Ana Paula project site will require a new water
concession application to be made with the CNA. A water concession will need to
be granted by CNA based on a permit application. The permit application will
need to be supported by a technical study demonstrating that water availability
and sufficient quantity exist in the area. A water discharge and usage must be
granted by the CNA.
|
|
217 |
| ANA PAULA PROJECT |
| FORM 43-101F1 TECHNICAL REPORT |
A project-specific environmental license (Licencia Ambiental Única or “LAU”,), which states the operational conditions and requirements to be met, is issued by SEMARNAT when the agency has approved the project operations. A construction permit is required from the local municipality. Other local permits regarding non-hazardous waste handling and municipal safety and operating authorizations may also be required. The permitting process requires that the mining company has acquired the necessary surface titles, rights and agreements for the land to be used for the project.
Hazardous wastes from the mining industry are highly regulated and specific handling requirements must be met once they are generated, such as hazardous waste generator documentation, log books and handling manifests. Hazardous waste storage areas must comply with federal requirements.
Minera Aurea submitted an MIA for the Ana Paula Project in December 2016 with approval granted in April 2017.
The key permits and the stages at which they are required are summarised in Table 20-1.
Table 20-1: Key Remaining Permits Required
| Permit | Mining Stage | Agency |
| Land Use Change – ETJ & Land Use MIA | Construction/Operation | SEMARNAT |
| Risk Analysis | Construction/Operation | SEMARNAT |
| Construction Permit | Construction | Municipality |
| Explosive & Storage Permits | Construction/Operation | SEDENA |
| Archaeological Release | Construction | INAH |
| Water Use Concession | Construction/Operation | CNA |
| Water Discharge Permit | Operation | CNA |
| Project-specific License (LAU) | Operation | SEMARNAT |
| Accident Prevention Plan | Operation | SEMARNAT |
Source: Alio (2017)
20.3 SOCIAL AND COMMUNITY IMPACT
The first phase of the social economic baseline study was completed by Terra in the area of influence defined by the municipality of Cuetzala de Progresso. Metrics measured by field survey included current economic situation, way of life and family and social environment. The statistical analysis of the survey data has commenced.
The estimated population of the area of influence is about 5,000 inhabitants. The surrounding land supports subsistence-level agriculture, including production of corn, beans, cattle and mangoes. It is a rural area with small towns that has a high level of social programs for the underprivileged. The largest town in the area is Cuetzala del Progreso with a population of around 2,500 located 7.5 km from the mine site. The populations of the towns located in the project area given in Table 20-2. There are no communities under direct physical impact from the future mine operations.
Different social processes like those related to land
acquisition and hiring local labor have not created conflict or opposition from
local stakeholders.
|
|
218 |
| ANA PAULA PROJECT |
| FORM 43-101F1 TECHNICAL REPORT |
Table 20-2: Towns and Populations in the Ana Paula Project Area
| MUNICIPALITY | TOWN | TOTAL POPULATION |
| CUETZALA DEL PROGRESO | MICHAPA | 44 |
| CUETZALA DEL PROGRESO | TOMIXTLAHUACAN | 278 |
| CUETZALA DEL PROGRESO | SAN LUIS | 132 |
| CUETZALA DEL PROGRESO | OJO DE AGUA | 71 |
| CUETZALA DEL PROGRESO | CUETZALA DEL PROGRESO | 2451 |
| CUETZALA DEL PROGRESO | TIANQUIZOLCO | 905 |
| CUETZALA DEL PROGRESO | APETLANCA | 1112 |
| TOTAL | 4993 |
Data from INEGI, National Institute of Statistics & Geography Mexico
Local personnel for the prefeasibility stage activities are sourced primarily from Cuetzala del Progreso. Minera Aurea employs 46 workers from the local communities. There is a locally accepted process for labor hiring opportunities in the project. It is anticipated that about 35 percent of the area’s population is actively working, and could be employed in the proposed mining operations as general labor, domestic help, technicians and office employees.
Minera Aurea has direct ownership and/or land access agreements in terms of 35 year leases for over 85% of the land required for the project. Depending on the land package agreements are negotiated with individual landowner’s or with community groups. The remaining community based land negotiation is now under one group composed by ejidatarios (agrarian communities, communes, and indigenous communities) whereas previously the project team had to negotiate with the groups independently which resulted in delays. Negotiations regarding surface rights agreements for the remaining land required for the Ana Paula Project are ongoing with the landowners and the communities.
Minera Aurea interacts directly with the municipal president of Cuetzala del Progreso for local permitting and to provide support to the community.
Minera Aurea maintains a small community relations team on site. Activities carried out as part of the community relations have included economic support and material support to the unions, Christmas holiday parties for the workers, participation and representation in annual sporting events in Cuetzala del Progreso, support to schools in the way of machinery and materials, sports uniforms, prizes, and of donation of medical supplies. Minera Aurea has commenced work on the establishment of a stakeholder engagement system which will be initiated during the feasibility stage of the project. Minera Aurea’s internal policy for social responsibility and community relations is based on respect and equality and transparent communication with stakeholders.
20.4 CLOSURE AND RECLAMATION
Knight Piésold consultants have developed a conceptual closure plan for the TSF and WRFs. The conceptual closure plan components for the TSF and WRFs are presented in Figure 20-1. In general, the closure components include:
| • | Installation of a closure cover for the tailings surface and growth media soil layer (topsoil) for the dam downstream slope and waste rock slopes. The cover system for the tailings surface shall be durable and chemically stable and reduce wind erosion and animals burrowing into the tailings material. |
|
| • | Placement of a growth media soil layer to facilitate revegetation for the designated disturbed areas. |
|
| • | Partial grading on the TSF basin to promote positive drainage for runoff toward the spillway. |
|
| • | TSF basin will retain a pond in the north side of the facility which will capture runoff from the up gradient catchment areas, including the reclaimed tailings surface and WRFs’ slopes. |
|
|
219 |
| ANA PAULA PROJECT |
| FORM 43-101F1 TECHNICAL REPORT |
| • | A spillway constructed for the final year of operation will be used for closure to release water during flood periods. |
|
| • | Rainfall on the WRFs will infiltrate. Runoff from slopes will be captured in the retained TSF pond located at the north end of the tailings facility. |
|
| • | Site access and perimeter protection will be planned as part of the site-wide closure, but access roads to the facilities will be closed off using berms. |
|
| • | The seepage sump will be retained as part of the post-closure monitoring program. |
M3 consultants have developed a conceptual closure plan for the plant site and ancillary works. In general, the closure components include:
| • | Decommissioning |
| o | Internal closure planning, as well as closure-related engineering and characterization studies and permitting activities, in the 1- to 3-year period prior to closure. |
|
| o | The decommissioning process would initiate at the early stages of closure and would include the decommissioning of all cyanide materials and equipment. |
|
| o | Equipment associated with the mill site and other facilities will be removed from the site to be used in other projects, recycled, or disposed of in an approved landfill. Appropriate methods would be put in place for decommissioning procedures for hazardous materials and equipment. |
|
| o | Lubricants, oils and other industrial materials will be disposed of in accordance with applicable regulations. |
| • | Demolition |
o |
Unless required for another use, building foundations will be demolished, covered or removed from the site as per Mexican regulatory requirements applicable at the time of closure. If the foundations are required to remain for another use, management will be part of closure activities. |
|
| o | Power lines feeding electricity to the process plant will be decommissioned and removed. |
| • | Rehabilitation |
| o | Breaking/perforating and backfilling foundations and sumps, recontouring for positive drainage, covering disturbed areas with growth media, re-establishing natural drainages, and revegetating with native species. |
|
|
||
| o | The process site will be graded to promote surface water drainage. This includes earthworks for waste storage facilities, and plant area, as needed, to shed storm water and re-establish natural drainages. |
|
|
||
| o | Reclamation and re-vegetation of disturbed land will follow. |
| • | Post-closure environmental monitoring and maintenance will follow. | |
| • | The areas of the open pits, tailings, and former plant site will be restricted from public access. | |
• |
The site closure and reclamation activities are estimated to take approximately three years assuming some concurrent reclamation. |
Knight Piésold and M3 Engineering estimated a closure cost of
$8.83 M.
|
|
220 |
| ANA PAULA PROJECT |
| FORM 43-101F1 TECHNICAL REPORT |
It is assumed that reclamation will take place concurrent with mining activities to the extent practical. Closure and reclamation planning will be incorporated into the mine and tailings ultimate designs, and implemented during operation to minimize
end-of-mine closure liabilities. See Figure 20-1.
|
|
221 |
| ANA PAULA PROJECT |
| FORM 43-101F1 TECHNICAL REPORT |
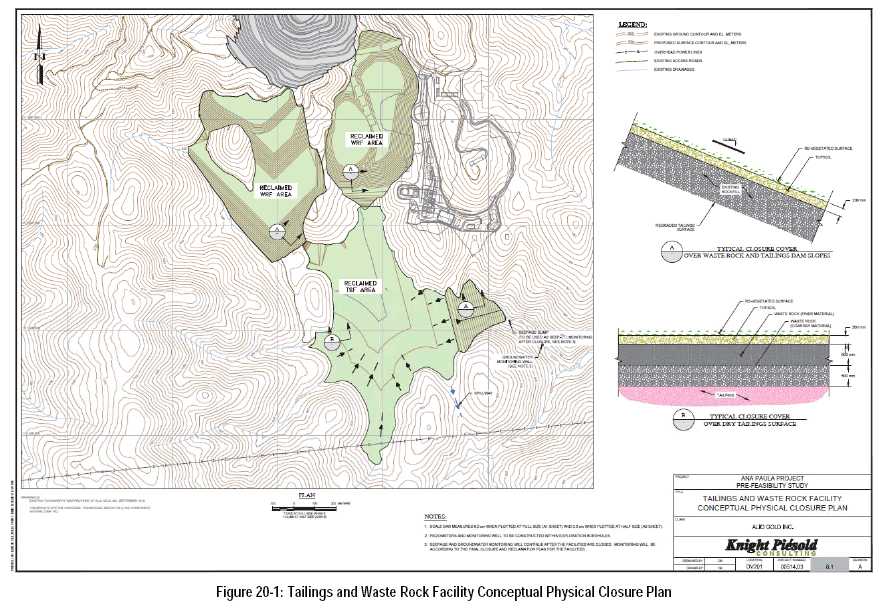
|
|
222 |
| ANA PAULA PROJECT |
| FORM 43-101F1 TECHNICAL REPORT |
21 CAPITAL AND OPERATING COSTS
21.1 CAPITAL COST
The capital cost estimate (CAPEX) is based on a combination of first-principles build-up, experience, reference projects, budgetary quotes and factors as appropriate with a Prefeasibility Study.
The CAPEX estimate includes the costs required to develop, sustain, and close the operation for the planned 8-year mine life. The construction schedule is based on an approximate 1.75 -year build period. The intended accuracy of this estimate is +/-10% to +30% percent. The CAPEX estimate summary is shown in Table 21-1.
Table 21-1: Capital Costs
| Area | Capital (US$M) |
| Process Plant, General, Site Utilities | $67.2 |
| Indirects* | $9.6 |
| Tailings/Waste Facilities | $12.7 |
| Camps | $4.0 |
| EPCM | $12.9 |
| Owner’s Costs** | $8.3 |
| Pre-Strip and Mine Establishment | $19.9 |
| Contingency*** | $15.9 |
| Total Capital | $150.5 |
| Less Capital Spend in Year 1 | ($13.3) |
| Upfront Capital | $137.2 |
* Bussing, Mobilization, Construction
Camp Operating, Freight
** Used equipment refurbishment and transport to
site, misc. other owner’s costs
***Contingency calculated as 15% of Directs
+ Indirects + EPCM
21.1.1 Mine Capital Cost
Mining for the Prefeasibility Study is based on engaging a local contractor to perform the mining and maintenance operations at Ana Paula. This minimizes Alio’s mining equipment capital requirements. Contractors have the ability to quickly mobilize and contract mining has been successful at Alio’s San Francisco operation.
The mine capital costs are summarized in Table 21-2. All costs are expressed in Q2 2017 US$. The Mexican Peso to United States Dollar exchange rate was assumed to be 18.59 Mex$ to US$1.00 for this estimate.
Table 21-2: Capital Cost Summary – Mining
| Capital Category | Preproduction Capital Year -2, -1 US$M |
Sustaining Capital US$M |
Total Capital US$M |
| Pre-Production Stripping | 17.1 | - | 17.1 |
| Mining Equipment | 0.5 | 1.0 | 1.4 |
| Miscellaneous Mine Capital | 2.3 | 2.0 | 4.3 |
| Total | 19.9 | 2.9 | 22.8 |
Initial capital requirements (pre-production) are estimated to
be US$19.9 million and include pre-production mining which is capitalized. The
pre-production activities for the contractor include drilling, blasting, mining
of ore and waste, road construction, stockpile creation and other mine services.
Alio will be responsible for ore control and dewatering and therefore will
require an ore control RC drill and a dewatering pump service truck. The RC
drill is rented initially then purchased in the production period.
|
|
223 |
| ANA PAULA PROJECT |
| FORM 43-101F1 TECHNICAL REPORT |
Table 21-3 shows the open pit capital unit costs by equipment.
Table 21-3: Mining Capital by Period
| Equipment | Total US$ |
Preproduction Year -2, -1 US$ |
Sustaining US$ |
| Mining Equipment | |||
| Ore Control Drill | 545,000 | - | 545,000 |
| Pump Truck | 250,000 | 250,000 | - |
| Pickup Trucks | 648,000 | 216,000 | 432,000 |
| Subtotal | 1,443,000 | 466,000 | 977,000 |
| Miscellaneous Mine Capital | |||
| Engineering Office Equipment | 300,000 | 300,000 | - |
| Dewatering System – pumps/piping | 65,000 | 32,500 | 32,500 |
| RC Drill Rental | 150,000 | 150,000 | |
| Pit Access Roads | 3,764,500 | 1,855,800 | 1,908,700 |
| Subtotal | 4,279,500 | 2,338,300 | 1,941,200 |
| Contractor (Year -2 and -1 Stripping) | 17,104,800 | 17,104,800 | - |
| Total Mine Capital | 22,827,300 | 19,909,100 | 2,918,200 |
21.1.1.1 Miscellaneous Mine Capital
The miscellaneous mine capital includes various separate line items in the costing:
-
Engineering Office Equipment
-
Pit Access Road Construction and Upgrading
-
Contractor Pre-stripping
-
Dewatering Pumps and piping
The engineering office equipment includes such items as desktop computers, plotter, digitizer, licenses for mining and geology software and survey equipment with associated peripherals. This cost is estimated at US$300,000 with the majority of the cost being the mining software.
Proper road construction is considered imperative to maintaining efficient mining. This was quoted by the contractor for both single and double lane widths. Proper road construction includes compaction, and crushed rock. An estimate of US$211,000/km is used for 23.5 m wide roads and US$462,000/km for 17.8 m wide roads based on actual design locations. The single lane roads are in difficult terrain and are used primarily for access to the upper benches of each phase.
Dewatering is a key component of stable wall slopes. This will be accomplished with pumps and piping to remove the water from the pit. The dewatering system is a set of pumps in the pit with piping which takes water to the surface storage ponds. An amount of US$65,000 is allocated for dewatering with the cost split evenly between Year – 2 and Year 1. The capital cost estimate for the dewatering system is US$32,500 in Year -2 and another US$32,500 in Year 1. This includes the cost of pumps and piping.
The fleet of equipment proposed by the Contractor is shown in
Table 21-4.
|
|
224 |
| ANA PAULA PROJECT |
| FORM 43-101F1 TECHNICAL REPORT |
Table 21-4: Contractor Mining Equipment by Period
| Equipment | Capacity | Units in Preproduction Year -2, -1 |
Units Year 1 to 9 |
| Production Drill | DTH, 110 - 203 mm Bit Size | 2 | 2 |
| Wheel Loader | 6.4–7.0 m3 Bucket | 2 | 2 |
| Haul Trucks | 56.0 t Payload | 8 | 8 |
| Tracked Dozer | 39.4 t Operating Wt. 271 kW Engine Power - SAE J1995 |
1 | 1 |
| Wheel Dozer | 28.7 t Operating Wt. 299 kW Gross Power |
1 | 1 |
| Grader | 4.9 m Blade Width | 1 | 1 |
| Water Truck | Not Specified | 1 | 1 |
| Fuel / Lube Truck | Not Specified | 1 | 1 |
| Excavator | 1.8 m3 Bucket. 33.8 t Operating Wt. | 1 | 1 |
Budgetary quotations from three local contractors were used to determine a contract mining cost of US$1.98/t moved.
21.1.1.2 Pre-Production Stripping
The mine is scheduled to initiate mining in Year -2. The material moved will be used to develop the mine roads and provide ore for the stockpile. A total of 7.7 Mt of ore and waste will be mined by a contractor during Years -2 and -1.
This is expected to cost US$15.2 million or US$1.98/t material moved for the contractor, and an additional US$1.9 million for the Alio Gold functions for a total cost of US$2.23/t moved in Years -2 and -1. This includes all costs associated with Alio Gold management, dewatering, engineering and geology department labour and ore control.
The mining during this time includes the development of the quarry near the primary crusher. This quarry is used to provide rock for construction purposes and capping of mine haul roads. Phase 1 development for ore release is also part of this early mining activity.
These construction activities have typically less productive hauls due to narrower working conditions, and longer hauls than normally scheduled for the waste material. The narrow roads mean that the trucks will have to turn around on narrow road widths requiring back and forth movement to negotiate the turns. This plus extended reversing of the loaded trucks to the dumping point results in longer truck cycle times. This has been factored into the haulage times.
21.1.2 Process Plant and General & Site Utilities Capital Cost
Process capital costs were based on the flowsheet developed by testwork. Major equipment items were based on budgetary quotations or recent database. All capital costs are based in US$, Table 21-5. Allowance for piping, electrical were utilized to build up the direct cost estimate.
All major equipment items, including mills, crushers, tanks,
thickeners were calculated based on parameters from testwork results or
calculated based on estimated parameters from similar projects. Existing
equipment purchased from El Sauzal was used when possible. General and site
utilities include power line, substation blowers, oxygen plant support
facilities, mass excavation, etc. The complete details are included in the
detailed CAPEX produced by M3.
|
|
225 |
| ANA PAULA PROJECT |
| FORM 43-101F1 TECHNICAL REPORT |
Table 21-5: Process Plant and General & Site Utilities Direct Capital Costs
| Area | Description | Total (US$) |
| PROCESS PLANT | ||
| 100 | Primary Crushing | $3,387,945 |
| 200 | Grinding | $5,940,851 |
| 210 | Gravity Concentration | $2,104,191 |
| 250 | Pebble Crushing | $2,757,187 |
| 300 | Flotation | $2,847,669 |
| 350 | Regrind | $4,433,391 |
| 400 | Atmospheric Oxidation | $7,901,137 |
| 500 | CIL | $4,722,057 |
| 600 | Detox Reagents (M3 Costs) | $2,953,731 |
| 610 | Tailings (Knight Piésold Costs) | $12,681,517 |
| 700 | ADR & Refinery | $3,956,159 |
| 800 | Reagents | $7,180,695 |
| 900 | Ancillaries | $1,623,045 |
| Subtotal PROCESS PLANT DIRECTS | $49,808,058 | |
| GENERAL & SITE UTILITIES | ||
| 000 | Master General | $11,839,794 |
| 010 | Switching Substation | $1,811,951 |
| 905 | Guardhouse | $175,000 |
| 910 | Laboratory | $360,080 |
| 915 | Construction Camp (per client quote) | $0 |
| 920 | Warehouse | $676,332 |
| 930 | Reagent Storage | $570,665 |
| 940 | Mill Maintenance | $669,323 |
| 950 | Administration Offices | $350,775 |
| 960 | Mine Maintenance | $611,031 |
| 970 | Truck Scale | $282,605 |
| 975 | First Aid Clinic (included in Permanent Camp quote) | $0 |
| Subtotal GENERAL & SITE UTILITIES DIRECTS | $17,347,556 | |
| Subtotal PROCESS PLANT, GENERAL & SITE UTILITIES DIRECTS | $67,155,614 |
21.1.3 Tailings Storage Facility (TSF) and Waste Rock Facility (WRF) Capital
Tailings storage facility consists of 4 stages plus closure and
reclamation. Material take-offs were done by Knight Piésold and include
Mobilization and Demobilization, TSF Dam consturction, TSF basin, Tailings
distribution system, Perimeter Roads, Diversion channels and spillway, crushing
and screening of material, instrumentation and closure and reclamation. M3
prepared the cost estimate based on these material takeoffs using M3’s
historical unit costs. Summary of TSF capital and sustaining capital is shown in
Table 21-6.
|
|
226 |
| ANA PAULA PROJECT |
| FORM 43-101F1 TECHNICAL REPORT |
Table 21-6: Tailings Storage & Waste Rock Facilities Capital and Sustaining Capital
| Activity Description | Stage-I (Year-0) |
Stage-II (Year-2) |
Stage-III (Year-4) |
Stage-IV (Year-6) |
Closure/ Reclamation |
Totals |
| TSF | ||||||
| Mobilization & Demobilization | $950,163 | $320,997 | $385,040 | $516,510 | $625,255 | $2,797,964 |
| TSF Dam | $8,254,949 | $1,791,691 | $3,559,213 | $3,756,923 | $10,440 | $17,373,217 |
| TSF Basin | $461,780 | $73,316 | $64,512 | $83,353 | $0 | $682,960 |
| Tailings Distribution System | $740,304 | $363,946 | $406,727 | $634,000 | $0 | $2,144,976 |
| Water Reclaim System | $326,588 | $0 | $0 | $0 | $0 | $326,588 |
| Perimeter Roads, Diversion | ||||||
| Channels, & Spillway | $503,313 | $1,130,738 | $0 | $936,999 | $0 | $2,571,050 |
| Crushing & Screening | $121,287 | $18,862 | $15,614 | $21,895 | $0 | $177,658 |
| Instrumentation | $20,073 | $8,185 | $16,371 | $16,371 | $0 | $61,000 |
| Closure and Reclamation | $0 | $0 | $0 | $0 | $5,615,320 | $5,615,320 |
| WRF | ||||||
| Mobilization & Demobilization | $22,196 | $0 | $0 | $0 | $174,115 | $196,311 |
| WRF Foundation Preparation | $911,500 | $0 | $0 | $0 | $0 | $911,500 |
| Closure and Reclamation | $0 | $0 | $0 | $0 | $2,146,900 | $2,146,900 |
| QA/QC & Surveying | $369,365 | $110,927 | $133,058 | $178,490 | $257,160 | $1,049,000 |
| Total Costs (USD) = | $12,681,517 | $3,818,662 | $4,580,535 | $6,144,539 | $8,829,191 | $36,054,444 |
21.2 OPERATING COSTS
The operating cost estimates are based on a combination of first-principles build-up, reference projects, budgetary quotes and factors as appropriate for a preliminary study.
These costs include direct mining and re-handle by a contractor, and processing and disposal of the mineralized feed to the plant including dore produced on-site and transportation and refining charges, Table 21-7.
Table 21-7: Operating Costs Summary
| Operating Cost | $/t processed | LOM $M |
| Mining | 8.01 | 107.7 |
| Processing | 20.25 | 272.2 |
| G&A | 2.56 | 34.4 |
| Total | 32.53 | 418.7 |
‡Mining Cost is based on $2.17/t mined
21.2.1 Mining Operating Costs
Mine operating costs are estimated from base principles by the contractors. The exchange rate for the Mexican Peso to US Dollar is set at 18.59 Mex$:1 US$.
Fuel is estimated from quotations provided by Alio Gold. A value of US$0.740/L of diesel is used in the operating cost calculations net of taxes.
Labour costs for the various job classifications were obtained
from Alio Gold and compared to other labour costs in the AGP database and
reviewing other operations. These rates were used and included the appropriate
burden for each category to cover items such as health care, vacation and
federal holidays. The mine labour is based on a 12-hour shift schedule.
|
|
227 |
| ANA PAULA PROJECT |
| FORM 43-101F1 TECHNICAL REPORT |
The mine staff labour is to provide a supervisory and support role to the contractor. After initial recruitment in the preproduction period (Year -2), the level remains constant at 11 staff and 2 hourly, but reduces slightly after Year 6 during the later years of mining. The Staff positions include a Mine Operations Superintendent, Engineering and Geology, while the hourly employees will be responsible for dewatering operations. The staff workforce for Year -2, is shown in Table 21-8. This includes the loaded annual salary for each position.
Table 21-8: Alio Staff and Hourly Requirements (Year-2) with Annual Salaries
| Alio Staff Position | Employees | Annual Salary US$/a |
| Mine Operations | ||
| Mine Operations Superintendent | 1 | 119,800 |
| Mine Engineering | ||
| Senior Engineer | 1 | 43,100 |
| Open Pit Planning Engineer | 1 | 37,400 |
| Surveyor/Mining Technician | 2 | 24,000 |
| Clerk/Secretary | 1 | 16,300 |
| Geology | ||
| Senior Geologist | 1 | 43,100 |
| Grade Control Geologist/Modeler | 2 | 24,400 |
| Sampling/Geology Technician | 2 | 19,800 |
| Mine General | ||
| General Mine Labourer | 2 | 15,400 |
| Total Staff and Hourly | 13 |
The proposed contractor workforce is shown in Table 21-9 and is the same for the pre-production and mining (Years 1 – 9). Table 21-9 shows the requirements for day shift, night shift and the shift on leave; however, the average number of personnel required per day is only 60.
Table 21-9: Proposed Contractor Personnel Requirements
| Contractor Position | Employees |
| Project Manager | 1 |
| Mine Supervisor | 3 |
| Safety Supervisor | 3 |
| Project Controller | 1 |
| Surveyor | 2 |
| Project Assistant | 1 |
| Maintenance Superintendent | 1 |
| Maintenance Supervisor | 1 |
| Administrator / HR | 1 |
| Admin Assistant | 1 |
| Logistic Assistant | 1 |
| Dispatcher | 2 |
| Cleaner | 1 |
| Driver (support equipment) | 3 |
| Mechanic | 3 |
| Electrician | 2 |
| Welder | 2 |
| Tire worker | 2 |
| Mechanic helper | 3 |
| Drill rig operator | 3 |
| Drill rig helper | 3 |
|
|
228 |
| ANA PAULA PROJECT |
| FORM 43-101F1 TECHNICAL REPORT |
| Contractor Position | Employees |
| Loader operator | 6 |
| Truck operator | 22 |
| Dozer operator | 6 |
| Grader operator | 3 |
| Water truck operator | 3 |
| Diesel / lube truck operator | 3 |
| Excavator operator | 3 |
| Total | 86 |
Haulage profiles were determined for each pit phase for the primary crusher or the waste rock management facility destinations. These profiles were provided to the contractor for use in their estimation of haulage costs.
To avoid confusion and potential conflicts, the contractor’s bids were based on bank cubic meters (BCM’s) rather than by tonnage. Payment will also be based on BCM.
21.2.1.1 Grade Control
Grade control is an item that was considered from the beginning of the mine planning sequence. Blast hole sampling may be employed in the future depending on the results of a future gold deportment study but for this estimate are not considered. A reverse circulation program in advance of mining using tight inclined drillhole spacing to accurately define the ore/waste contacts has been included in the cost estimate. This ore-waste boundary information is then built into the short range models and then marked in the field to guide the loading equipment. This practice is widespread and has had great success in Australia, Canada and Brazil.
The method involves using a dedicated grade control drill rig and crew in the pit to drill a series of shallow inclined holes at approximately 70 degrees. The pattern for drilling will be a 5 m spacing and a 4 m burden with samples taken every 1 m in presumed mineralized zones as outlined by both previous ore control drilling and the exploration drilling. The samples spacing is to be verified with a gold deportation study to be completed in the future. An additional 25% will be drilled along the waste contacts to ensure that unknown structures are not missed in the saprolite. These waste samples will be drilled with the same 5 m spacing and 4 m burden and sampled over 6 m. The amount of reverse circulation drilling peaks in Year 2 at 38,000 m then drops off after that averaging 32,000 m/a from Year 2 until Year 8. This is only for the reverse circulation drilling rig.
The reverse circulation drills will operate for 16 h/d to minimize disturbance and be in advance of mine operations with the information. A three-person crew per drill is required; one driller and two drill helpers. In addition, geologists will provide guidance throughout the day and be on call if unknown issues arise.
The drill penetration rate is estimated at 25 m/h with set-ups, sampling, etc. Overall, the cost for the drill without labour will be US$155/h or about US$6.20/m drilled. From an overall mine operating cost perspective, the reverse circulation drill sampling program costs $0.10/t mined.
The data from the grade control drilling is then interpreted by the geologist and the ore is contacts / zone are remodelled. Where possible, the production drilling and blasting is then sequenced to excavate the ore material separate from the waste.
21.2.1.2 Dewatering
Pit dewatering will be an important function at the Ana Paula Mine. Groundwater is not present, but precipitation averages 835 mm per year. Rainfall occurs from June through October during a monsoonal tropical wet season that includes the influence of hurricanes from both the Atlantic and Pacific oceans. Winters are dry with occasional light rains in February.
|
|
229 |
| ANA PAULA PROJECT |
| FORM 43-101F1 TECHNICAL REPORT |
The dewatering cost estimate is broken into two components:
-
In-pit.
-
Ex-pit.
In-pit includes the pumps, sumps, pipelines responsible for moving water from the pit to the pit rim and beyond plus any additional items. Two general mine labourer positions and a pump service truck have been included to perform dewatering activities.
Ex-pit pumps will pick-up the water from the storage ponds and push it to the various discharge points around the mine property.
21.2.1.3 Contract Services
Three local contractors have provided budgetary quotations for contract mining services at Ana Paula. The main responsibilities of the contractor and client are summarized as follows:
Contractor
-
Drilling ore and waste.
-
Loading and hauling ore and waste, including stockpile rehandle.
-
Provide and maintain all equipment required to fulfil the contract.
-
Provide a camp for contractor personnel, to be located on the mining property. Contractor to provide their own meals.
-
Building and maintaining haul and access roads.
-
Crushing material for road base.
-
Manage all waste according to regulations and best practice.
-
Provide site security.
Owner (Alio Gold)
-
Provide a workshop.
-
Provide diesel, power and water.
-
Hold the explosives licence, supply explosives, supply magazines, load explosives and conduct the blasting. A third party will be contracted to supply these services.
-
Ore control and well drilling.
-
Pit dewatering activities.
-
Geotechnical monitoring.
|
|
230 |
| ANA PAULA PROJECT |
| FORM 43-101F1 TECHNICAL REPORT |
Based on various quotations received from contractors during the preparation of the Technical Report, a contract mining cost of US$1.98/t moved is applied to all tonnes in both preproduction (Years -2 and -1) and production (Years 1 to 8) periods.
The contract mining costs in Years -2 and -1 were capitalized, for mining 7.7 Mt of material. Costs associated with the ore control and dewatering are to Alio Gold’s account and also capitalized in Years -2 and -1.
21.2.1.4 Total Mine Operating Costs
The total life of mine operating costs per tonne material mined and per tonne of ore processed are shown below in Table 21-10. Drilling, blasting, loading and hauling costs are included in the Contract Services rate.
Table 21-10: Open Pit Mine Operating Costs ($/t Total Material)
| Open Pit Operating Category |
Unit | Year 1 - 8 Average Cost |
| General Mine & Engineering | US$/t | 0.08 |
| Drilling | US$/t | - |
| Blasting | US$/t | - |
| Loading | US$/t | - |
| Hauling | US$/t | - |
| Support | US$/t | 0.02 |
| Grade Control | US$/t | 0.10 |
| Dewatering | US$/t | - |
| Contract Services | US$/t | 1.98 |
| Total | US$/t | 2.17 |
21.2.2 Processing Operating Costs
Operating costs were based on the design criteria calculated
from testwork, labor rates (2 shifts at 12 hours/day) from previous projects,
quotations and estimates for chemicals and grid power. The total annual cost for
operating the process plant is $36,498 when operating at full load or
$20.25/tonne processed.
|
|
231 |
| ANA PAULA PROJECT |
| FORM 43-101F1 TECHNICAL REPORT |
Table 21-11: Labor Costs
Operations |
Staff |
Annual Cost (US$000) |
| Mill Superintendent | 1 | $120 |
| Metallurgist | 1 | $90 |
| Plant Technician | 2 | $41 |
| Shift Foreman | 4 | $207 |
| Mill Clerk | 1 | $21 |
| Control Room Operators | 4 | $124 |
| Loader Operators | 4 | $95 |
| Crushing Operators | 4 | $95 |
| Grinding Operators | 4 | $95 |
| Flotation Operators | 4 | $95 |
| Conc Oxidation/CIL Operators | 4 | $95 |
| ADR Operator | 4 | $95 |
| Gold Room Operator | 2 | $58 |
| Tailings Operator | 4 | $95 |
| Lab Manager | 1 | $94 |
| Lab Metallurgical Technician | 2 | $41 |
| Assay Technicians - Senior | 2 | $41 |
| Assay Technicians - Junior | 4 | $66 |
| Sample Prep Labours | 4 | $66 |
| Total | 56 | $1,637 |
| Maintenance | ||
| Mill Maintenance Superintendent | 1 | $120 |
| Mill Maintenance Foremen | 2 | $104 |
| Planner/Schedular/Reliability | 1 | $50 |
| Mechanics | 8 | $207 |
| Electrician | 4 | $108 |
| Instrument Technicians | 4 | $124 |
| Crane / Equipment Operators | 2 | $48 |
| Helpers- Elec/Mechanical | 8 | $132 |
| 30 | $892 | |
| Total | 86 | $2,529 |
Reagent costs are based on quotations from vendors. Sodium
hydroxide and hydrochloric acid unit costs are estimates. Consumption rates are
calculated from testwork or estimated based on common factors. Soda ash
consumption rate is taken directly from testwork. The soda ash reagent cost is a
vendor quotation. All reagent costs are subject to change based on market
conditions.
|
|
232 |
| ANA PAULA PROJECT |
| FORM 43-101F1 TECHNICAL REPORT |
Table 21-12: Reagents Costs
| Reagents | kg/t ore | $/kg | US$/t ore | Yearly Cost (US$) |
| Flotation | ||||
| Frother | 0.114 | $0.41 | $ 0.05 | $84,132 |
| 3418A | 0.043 | $11.86 | $ 0.51 | $917,964 |
| Copper Sulfate | 0.100 | $1.20 | $ 0.12 | $216,000 |
| PAX | 0.079 | $2.71 | $ 0.21 | $385,362 |
| Atmospheric Oxidation/CIL | ||||
| Cyanide | 0.240 | $1.85 | $ 0.44 | $799,200 |
| Flocculant | 0.040 | $4.00 | $ 0.16 | $288,000 |
| Carbon | 0.040 | $2.36 | $ 0.09 | $169,920 |
| Antiscalant | 0.015 | $2.90 | $ 0.04 | $78,300 |
| HCI | 0.010 | $0.55 | $ 0.01 | $9,900 |
| NaOH | 0.012 | $0.50 | $ 0.01 | $10,800 |
| Lime | 5.100 | $0.16 | $ 0.82 | $1,468,800 |
| Soda Ash | 24.000 | $0.35 | $ 8.40 | $15,120,000 |
| Oxygen | 31.140 | $0.06 | $ 1.75 | $3,150,122 |
| Detox | ||||
| Lime | 0.064 | $0.16 | $ 0.01 | $18,432 |
| Cyanide | 0.140 | $1.85 | $ 0.26 | $466,200 |
| SMBS | 0.390 | $0.56 | $ 0.22 | $393,120 |
| Copper Sulfate | 0.007 | $1.20 | $ 0.01 | $15,120 |
| TOTAL | $ 13.11 | $23,591,373 |
Infrastructure to support the process plant includes access to grid power. The total power consumption for the Ana Paula Plant is estimated based on an equipment list developed from the flowsheet with equipment sizing based on a calculated mass balance. Major equipment sizing calculations were performed to provide power associated with crushers, mills, agitators, and pumps. Miscellaneous lighting and small power is included in estimate at 2% of annual kWh consumed.
Table 21-13: Power Usage and Cost
| kWh/t | $/kW | $/t | Yearly Cost |
| 36.1 | 0.080 | $2.89 | $5,194,431 |
Steel consumption is based on estimates for liner replacements and ball consumption of similar sized plants with high rock hardness.
Table 21-14: Mill and Crusher Liners and Grind Media Costs
| Liners | US$/t ore | Yearly Cost US$000 |
| Crusher | $0.07 | $123 |
| SAG Mill | $0.35 | $627 |
| Ball Mill | $0.11 | $192 |
| Pebble Crusher | $0.01 | $15 |
| Regrind Mill | $0.05 | $82 |
| Grinding Media | ||
| SAG Mill | $0.50 | $905 |
| Ball Mill | $0.38 | $684 |
| Regrind Mill | $0.21 | $371 |
| TOTAL | $1.63 | $2,999 |
|
|
233 |
| ANA PAULA PROJECT |
| FORM 43-101F1 TECHNICAL REPORT |
Maintenance parts, service and labor cost was estimated as an allowance of 5% of Plant equipment cost per year. A fixed yearly cost was estimated for supplies. Summary of maintenance cost is shown in Table 21-15.
Table 21-15: Supplies & Maintenance Costs
| Area | US$/t ore | Yearly Cost (US$000) |
| Crushing | $0.08 | $142,333 |
| Grinding | $0.59 | $1,061,497 |
| Flotation | $0.20 | $368,279 |
| Atmospheric Oxidation & CIL | $0.30 | $532,577 |
| Tailings | $0.10 | $171,483 |
| ADR & Refinery | $0.11 | $192,624 |
| Ancillaries | $0.34 | $607,613 |
| Total Maintenance | $1.71 | $3,076,407 |
21.2.3 General and Administration Operating Costs
G&A labor is comprised of 39 administrative staff for the following functions:
-
Management
-
Accounting
-
Human Resources
-
Safety
-
Medical
-
Community Relations
-
Environment
-
Purchasing
-
Training
Costs for G&A are summarized in Table 21-16.
Table 21-16: Costs for G&A
| Cost Area | US$/t ore | US$000/y |
| Labor & Fringes | $0.97 | $1,745,000 |
| Property & Business Interruption Insurance | $0.28 | $500,000 |
| Administrative | $0.11 | $200,000 |
| Accounting | $0.08 | $150,000 |
| Human Resources | $0.08 | $150,000 |
| Community Relations | $0.11 | $200,000 |
| Safety and Environmental | $0.08 | $150,000 |
| Purchasing | $0.08 | $150,000 |
| Travel Expenses | $0.06 | $100,000 |
| Vehicles | $0.08 | $150,000 |
| Camp Operation Cost | $0.61 | $1,095,000 |
| Total | $2.55 | $4,590,000 |
|
|
234 |
| ANA PAULA PROJECT |
| FORM 43-101F1 TECHNICAL REPORT |
22 ECONOMIC ANALYSIS
An engineering economic model was developed to estimate annual cash flows and sensitivities of the project. Pre-tax estimates of project values were prepared for comparative purposes, while after-tax estimates were developed and are likely to approximate the true investment value. It must be noted, however, that tax estimates involve many complex variables that can only be accurately calculated during operations and, as such, the after-tax results are only approximations.
Sensitivity analyses were performed for variations in metal prices, head grades, operating costs, capital costs, and discount rates to determine their relative importance as project value drivers.
This technical report contains forward-looking information regarding projected mine production rates, construction schedules and forecasts of resulting cash flows as part of this study. The mill head grades are based on sufficient sampling that is reasonably expected to be representative of the realized grades from actual mining operations. Factors such as the ability to obtain permits to construct and operate a mine, or to obtain major equipment or skilled labour on a timely basis, to achieve the assumed mine production rates at the assumed grades, may cause actual results to differ materially from those presented in this economic analysis.
The estimates of capital and operating costs have been developed specifically for this project and are summarized in Section 21 of this report (presented in 2017 US dollars). The economic analysis has been run with no inflation (constant dollar basis).
22.1 ASSUMPTIONS
One metal price scenario was utilized to prepare the economic analysis. However a sensitivity analysis on the metal prices was completed and outlined in Section 22.8.
All costs, metal prices and economic results are reported in US dollars unless stated otherwise. LOM plan tonnage and grade estimates are demonstrated in Table 22-1. Mexican Peso exposure is estimated at 15%, the MXN:USD rate used is 18.59 :1.
Table 22-1: LOM Plan Summary
| Mine Life | Years | 7.5 |
| Total Reserve | M tonnes | 13.4 |
| Total Waste | M tonnes | 36.5 |
| Total Capitalized Waste | M tonnes | 7.2 |
| Total Mined | M tonnes | 57.2 |
| Strip Ratio (Operations) | w:o | 2.81 |
| Mining Rate (Maximum) | t/d | 24,658 |
| Plant Throughput (Maximum) | t/d | 4,932 |
| Pre-Strip/Capitalized Waste | M tonnes | 7.2 |
| Average Head Grades | ||
| Au | g/t | 2.36 |
| Ag | g/t | 5.22 |
| Metal Produced | ||
| Au | LOM k oz | 868 |
| k oz/yr | 116 | |
| Ag | LOM k oz | 1,240 |
| k oz/yr | 166 |
|
|
235 |
| ANA PAULA PROJECT |
| FORM 43-101F1 TECHNICAL REPORT |
Economic factors include the following:
-
Discount rate of five percent (sensitivities using other discount rates have been calculated for each scenario).
-
Reclamation & Closure cost of $8.8 million was considered.
-
Nominal 2017 US dollars.
-
Revenues, costs, taxes are calculated for each period in which they occur rather than actual outgoing/incoming payment.
-
Results are presented on 100 percent ownership.
-
No management fees or financing costs (equity fund-raising was assumed).
-
Exclusion of all pre-development and sunk costs up to the start of detailed engineering (i.e. exploration and resource definition costs, engineering fieldwork and studies costs, environmental baseline studies costs, etc.).
Table 22-2 outlines the metal price assumptions used in economic analysis. This pricing used in the parameters established for mine planning were $1,200/oz gold and $16.00/oz silver.
The reader is cautioned that the gold prices used in this study are only estimates based on recent historical performance and there is absolutely no guarantee that they will be realized if the project is taken into production. The metal prices are based on many complex factors and there are no reliable long-term predictive tools.
Table 22-2: Metal Prices used in the Economic Analysis Scenarios
| Parameter | Unit | Base Case |
| Gold Price | US$/oz | 1,250 |
| Silver Price | US$/oz | 17.00 |
22.2 REVENUES & NSR PARAMETERS
Mine revenue is derived from the sale of doré into the international marketplace. No contractual arrangements for refining exist at this time. Details regarding the terms used for the economic analysis can be found in the Market Studies Section 19 of this report. Table 22-3 indicates the NSR parameters that were used in the economic analysis. Figure 22-1 and Figure 22-2 show breakdowns of the amount of gold and silver recovered during the mine life – a total of 868 koz of gold and 1,240 koz of silver is produced during the mine life.
Table 22-3: NSR Parameters Used in Economic Analysis
| Inputs & Assumptions | ||
| Operating Days | days per year | 365 |
| Recoveries | ||
| Au Recovery | 85.0% | |
| Ag Recovery | 55.0% | |
| NSR Parameters | ||
| Au Payable | 99.80% | |
| Ag Payable | 99.80% | |
| Treatment & Refining Charge | US$/oz | $4.00 |
| NSR Royalty | 2.0% |
|
|
236 |
| ANA PAULA PROJECT |
| FORM 43-101F1 TECHNICAL REPORT |
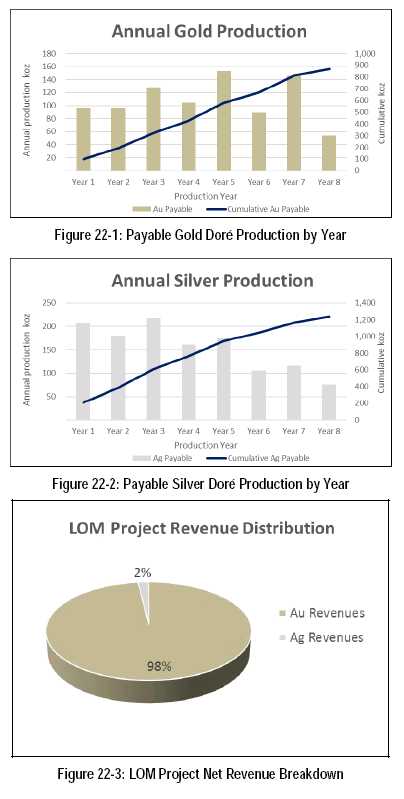
|
|
237 |
| ANA PAULA PROJECT |
| FORM 43-101F1 TECHNICAL REPORT |
22.3 SUMMARY OF CAPITAL COST ESTIMATE
The initial capital costs amount to $150.5M. This includes costs for pre-stripping, site development, processing plant, on-site infrastructure, tailings management facility, etc. A contingency is included in the initial capital costs which is 15% of the sum of Directs (Process Plant, General & Site Utilities, Tailings Storage & Waste Rock Facilities, Camps), Indirects and EPCM. A breakdown of the initial capital costs is shown in Table 22-4.
Sustaining and closure capital cost estimates amount to $30.2M and were assumed to occur from Year 1 to Year 8. A breakdown of the sustaining and capital costs is shown in Table 22-4.
Details on the capital costs can be found in Section 21 of this report.
Table 22-4: Summary of LOM Capital Costs
| Capital costs | Initial Capital ($M) |
Sustaining Capital ($M) |
| Process Plant, General & Site Utilities | 67.2 | 4.0 |
| Indirects | 9.6 | |
| Tailings Storage & Waste Rock Facilities | 12.7 | 14.5 |
| Camps | 4.0 | |
| EPCM | 12.9 | |
| Owner’s Costs | 8.3 | |
| Contingency | 15.9 | |
| Pre-Strip and Mine Establishment | 19.9 | |
| Mining Equipment | 2.9 | |
| Reclamation & Closure | 8.8 | |
| Sub-total Capital | 150.5 | 30.2 |
| Initial Capital Spent in Year 1 | (13.3) | 13.3 |
| Total Capital | 137.2 | 43.5 |
22.4 SUMMARY OF OPERATING COST ESTIMATES
Total LOM operating costs amount to $445.4M. The total LOM operating costs translate to an average cost of $33.14/tonne processed. A breakdown of these costs is outlined in Table 22-5 and Figure 22-4. Additionally, section 22.5 provides further details of the royalties, treatment and refining charges included in operating costs.
Table 22-5: Summary of Operating Costs
| Operating Cost | $/t processed | LOM $M | $M/yr |
| Mining* | 8.01 | 107.7 | 13.4 |
| Processing | 20.25 | 272.2 | 34.0 |
| G&A | 2.56 | 34.4 | 4.3 |
| Total | 30.82 | 414.3 | 51.8 |
*Mining cost is based on $2.17/t mined.
|
|
238 |
| ANA PAULA PROJECT |
| FORM 43-101F1 TECHNICAL REPORT |
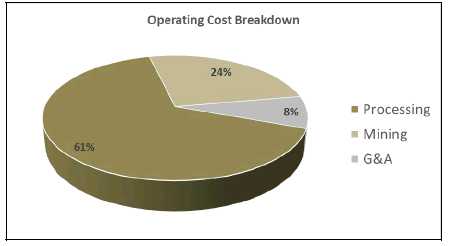
Figure 22-4: Breakdown of Operating Costs
22.5 ROYALTIES, TREATMENT & REFINING CHARGES
The economic analysis for the project accounts for the following royalties:
-
2.0 percent NSR royalty to Goldcorp.
-
0.5 percent NSR royalty as an environmental erosion fee for Mexican precious metals companies
-
Treatment and refining charges estimated at $4/ounce of gold sold.
Total NSR royalties, treatment and refining charges for the LOM amount to $31.1M.
22.6 TAXES
The project has been evaluated on an after-tax basis in order to provide a more indicative, but still approximate, value of the potential project economics. Ana Paula’s tax model is prepared on the same basis as Alio Gold’s San Francisco mine, which is reviewed periodically by external auditors. The tax model contains the following assumptions:
-
30 percent federal income tax rate
-
7.5 percent EBITDA royalty (Special Mining Duty) tax
-
Straight-line depreciation of capital assets utilizing a 7.5-year useful life.
Total taxes for the project amount to $161.9M.
22.7 ECONOMIC RESULTS
The project is economically viable with an after-tax internal
rate of return (IRR) of 34 percent and a net present value using a five percent
discount rate (NPV5%) of $223.4M using the Base Case metal prices. For NPV
calculation purposes, the discount starting point is halfway through Year -1, to
align with the construction period being 18 months. Table 22-6 summarizes the
economic results of each scenario evaluated.
|
|
239 |
| ANA PAULA PROJECT |
| FORM 43-101F1 TECHNICAL REPORT |
The break-even gold price for the project’s Base Case is approximately US$598/oz, based on the LOM plan presented herein. Figure 22-5 shows the projected cash flows for the project used in the different scenarios of the economic analysis.
Table 22-6: Summary of Results for Base Case Scenario – Au $1,250/oz; Ag $17/oz
| Summary of Results | Unit | Value |
| Mine Life | Years | 7.5 |
| Total Reserve | M tonnes | 13.4 |
| Total Waste | M tonnes | 36.5 |
| Total Capitalized Waste | M tonnes | 7.2 |
| Total Mined | M tonnes | 57.2 |
| Strip Ratio (Operations) | w:o | 2.81 |
| Mining Rate (Maximum) | t/d | 24,658 |
| Plant Throughput (Maximum) | t/d | 4,932 |
| Average Head Grades | ||
| Au | g/t | 2.36 |
| Ag | g/t | 5.22 |
| Metal Produced | ||
| Au | LOM k oz | 868 |
| k oz/yr | 116 | |
| Ag | LOM k oz | 1,240 |
| k oz/yr | 166 | |
| NSR (Net of Royalties) | $M | 1,081 |
| $/t processed | 80.67 | |
| Operating Costs | $M | 445.4 |
| $/t processed | 33.14 | |
| Au Cash Cost | $/Au oz | 513 |
| Au Cash Cost (Net of By-Product) | $/Au oz | 489 |
| Capital Costs | ||
| Initial Capital excluding Contingency | $M | 134.6 |
| Initial Capital Contingency | $M | 15.9 |
| Total Initial Capital | $M | 150.5 |
| $/t processed | 11.20 | |
| Sustaining & Closure Capital | $M | 30.2 |
| Sustaining & Closure Contingency | $M | 0.0 |
| Total Sustaining & Closure Capital | $M | 30.2 |
| $/t processed | 2.25 | |
| Total Capital Costs Incl. Contingency | $M | 180.7 |
| $/t processed | 13.45 | |
| Pre-Tax Cash Flow | $M | 479.9 |
| Taxes | $M | 161.9 |
| After-Tax Cash Flow | $M | 318.0 |
| Economic Results | ||
| Pre-Tax NPV5% | $M | 347.2 |
| Pre-Tax IRR | % | 44% |
| Pre-Tax Payback | Years | 2.3 |
| After-Tax NPV5% | $M | 223.4 |
| After-Tax IRR | % | 34% |
| After-Tax Payback | Years | 2.6 |
|
|
240 |
| ANA PAULA PROJECT |
| FORM 43-101F1 TECHNICAL REPORT |
![]()
Figure 22-5: Annual After-Tax Cash Flows for Base Case Scenario
22.8 SENSITIVITIES
A sensitivity analysis was performed on the Base Case metal pricing scenarios to determine which factors most affected the project economics. The analysis revealed that the project is most sensitive to metal prices, followed by head grade and operating costs. The project showed the least sensitivity to capital costs. Table 22-7 along with Figure 22-6 outline the results of the sensitivity tests performed on after-tax NPV5% for the Base Case evaluated.
In addition, various scenarios were evaluated showing the project’s sensitivity to gold and silver price. Table 22-8 shows the economic results of the project using various gold and silver prices.
The project was also tested under various discount rates. The results of these tests for the Base Case are demonstrated in Table 22-7.
Table 22-7: Sensitivity Results for Base Case Scenario
| After-Tax NPV5 % ($M) | |||
| Variable | -15% | 100% | +15 |
| Metal Prices | 140.2 | 223.4 | 306.2 |
| Head Grade | 140.5 | 223.4 | 305.9 |
| Operating Costs | 255.8 | 223.4 | 190.8 |
| Capital Costs | 243.4 | 223.4 | 203.4 |
|
|
241 |
| ANA PAULA PROJECT |
| FORM 43-101F1 TECHNICAL REPORT |

Figure 22-6: Sensitivity Results for Base Case Scenario
Table 22-8: Project Sensitivity to Gold Prices
| Gold Price (US$/oz) | 1,000 | 1,100 | 1,200 | 1,300 | 1,400 | 1,500 |
| Pre-Tax NPV5% ($M) | 180 | 247 | 314 | 381 | 448 | 514 |
| After-Tax NPV5% ($M) | 115 | 158 | 202 | 245 | 288 | 332 |
| Pre-Tax IRR | 27% | 34% | 41% | 48% | 54% | 60% |
| After-Tax IRR | 21% | 26% | 32% | 36% | 41% | 46% |
| Pre-Tax Payback (Yrs) | 3.4 | 2.8 | 2.5 | 2.2 | 2.0 | 1.8 |
| After-Tax Payback (Yrs) | 3.9 | 3.1 | 2.8 | 2.5 | 2.3 | 2.1 |
Table 22-9: Base Case Scenario Discount Rate Sensitivity
| Discount Rate | Pre-Tax NPV $M | After-Tax NPV $M |
| 0% | 479.9 | 318.0 |
| 5% | 347.2 | 223.4 |
| 7% | 305.4 | 193.6 |
| 10% | 252.0 | 155.5 |
| 12% | 221.5 | 133.8 |
|
|
242 |
| ANA PAULA PROJECT |
| FORM 43-101F1 TECHNICAL REPORT |

|
|
243 |
| ANA PAULA PROJECT |
| FORM 43-101F1 TECHNICAL REPORT |
23 ADJACENT PROPERTIES
Figure 23-1 below provides a property location map including known mines, deposits and showings for the area surrounding the Alio Gold Ana Paula Project, the Aurea Norte and Aurea Sur properties located in the Guerrero Gold Belt.
The information presented in this section is from publically available information referenced below. No information is available to the authors to permit verification of this data. The information below is not necessarily indicative of the mineralization on the Ana Paula Project and surrounding concessions.
The Los Filos mine was acquired by Goldcorp in 2005 through the purchase of Wheaton River Minerals Ltd, completed March 1st, 2005, and through the purchase of the Bermejal deposit from Minera El Bermejal, S. de R.L. de C.V. (Minera Bermejal), a joint venture of Industrias Peñoles S.A. de C.V. (“Peñoles”) and Newmont Mining Corporation announced March 22, 2005. The two acquisitions became the Filos Project with a combined inferred resource of 4.92 million ounces that became the Filos Mine when Goldcorp Inc. (“Goldcorp”), put it into production three years later in 2008. The mine is currently still operating. In 2014, 2015 and up to September 30, 2016, Filos produced 259,000, 273,000, and 194,000 ounces of gold, respectively, and was operated by Goldcorp. In the fourth quarter of 2016, Goldcorp sold Los Filos to Leagold Mining Corporation (“Leagold”) who are the currently owners of the property. The mine is located on the trend of the Guerrero Gold Belt about 20 km southeasterly of Ana Paula (Numbers 14 through 16, Figure 23-1). The Reserves and Resources as of December 31, 2016 are shown in Table 23-1.

Figure 23-1: Adjacent Properties, Projects, and Mineral Deposits
|
|
244 |
| ANA PAULA PROJECT |
| FORM 43-101F1 TECHNICAL REPORT |
Table 23-1: Los Filos Mine Reserves, Resources and Inferred
| MINERAL RESERVES | |||
Class |
Tonnes (Million) |
Au (g/t) |
Au Moz |
| Proven & Probable | 40.7 | 1.12 | 1.47 |
| MINERAL RESOURCES | |||
| Measured and Indicated | 422.5 | 0.85 | 11.48 |
| Inferred | 162.7 | 0.76 | 4.00 |
Source: Leagold website. Effective date December 31st, 2016.
The Morelos project owned by Torex Gold Resources Inc. (“Torex") was acquired in 2009 as a 3.2 million ounce inferred gold resource within the Limon and Los Guajes deposits and located about eight km southeast of Ana Paula, (Numbers 10 and 11, Figure 23-1). The Morelos project shares the southeastern boundary with Alio Gold’s Aurea Norte Project, Figure 23-1. In 2012, Torex completed a bankable feasibility study for the El-Limon Guajes open-pit mine in 2012 and completed construction in 2015. First gold was poured in December 2015 and commercial production was declared in March 2016. Additionally, in 2015 Torex released a Preliminary Economic Assessement for a nearby underground deposit, the Media Luna Gold-Copper Project. The current reserves and resources for Torex’s projects adjacent to Ana Paula are shown in Table 23-2 and Table 23-3.
Table 23-2: El Limon Guajes Mine Reserves and Resources
| MINERAL RESERVES | |||||
Class |
Tonnes (Million) |
Au (g/t) |
Au Moz |
Ag (g/t) |
Ag Moz |
| P&P | 43.11 | 2.62 | 3.63 | 3.93 | 5.45 |
| MINERAL RESOURCES | |||||
| M&I | 48.35 | 2.65 | 4.12 | 4.37 | 6.79 |
| Inferred | 5.96 | 1.86 | 0.36 | 3.45 | 0.66 |
Source: Torex Gold website. Effective date December 31, 2015.
Table 23-3: Media Luna Deposit Inferred Mineral Resource Estimate at a 2.0 g/t Au Eq. Cut-off Grade
| Deposit |
Resource Category |
Tonnes (Mt) |
Gold Eq. Grade (g/t) |
Contained Gold Eq. (Moz) |
Gold Grade (g/t) |
Contained Gold (Moz) |
Silver Grade (g/t) |
Contained Silver (Moz) |
Copper Grade (%) |
Contained Copper (Mlb) |
| Media Luna | Inferred | 51.5 | 4.48 | 7.42 | 2.40 | 3.98 | 26.59 | 44.02 | 0.99 | 1,129 |
Source: Torex Gold website. Effective date June 3, 2015.
|
|
245 |
| ANA PAULA PROJECT |
| FORM 43-101F1 TECHNICAL REPORT |
24 OTHER RELEVANT DATA AND INFORMATION
Additional relevant information not presented elsewhere in the report includes details concerning the evaluation and refurbishment cost associated with purchased used equipment and a plan for project execution.
24.1 USED EQUIPMENT
Process equipment formerly used at the El Sauzal Mine in Chihuahua was purchased for use in developing the Ana Paula Project. The equipment is presently stored in Los Mochis, Sinaloa. The equipment has been inspected and evaluated for potential use for the Ana Paula Project by M3 and Alio Gold. The equipment available for the project includes the primary crushing and grinding circuits, tailings thickener, portions of the reagent systems, kiln system, tankage, and substation transformer.
Alio Gold has obtained cost estimates for refurbishment of the primary crusher and reclaim system, conveyor systems, grinding mills, and substation transformer. A cost estimate has also been obtained for the transportation of this equipment to the refurbishment location and from there to the mine site. These cost estimates are summarized in Table 24-1.
Table 24-1: Refurbishment and Transportation Cost Estimates (in USD)
| Item | Estimated Cost |
| Primary Crushing system | $ 550,000 |
| Stockpile and Conveyor system | $ 800,000 |
| SAG and Ball Mill systems | $ 1,500,000 |
| Substation Transformer | $ 130,000 |
| Transportation (existing equipment in Los Mochis to be re-used at Ana Paula) | $ 1,450,000 |
| Total | $ 4,430,000 |
24.2 PROJECT SCHEDULE
A sequence of effort has been developed from this study with a prospective schedule by which the project will likely proceed. The schedule includes Owner Activities, Engineering, Contracts, Procurement, Construction, Remaining Site Work, Site Pre-Commissioning, and Site Commissioning activities and is presented as Figure 24-1.
The schedule assumes that the feasibility study will be
completed by the end of Q1 2018. Basic engineering is expected to begin Q1 of
2018 concurrent with preliminary site works and construction of the access road.
Mine equipment will be procured and assembled in starting Q2 of 2018 and
continue through Q3 of 2019.
|
|
246 |
| ANA PAULA PROJECT |
| FORM 43-101F1 TECHNICAL REPORT |

|
|
247 |
| ANA PAULA PROJECT |
| FORM 43-101F1 TECHNICAL REPORT |
24.3 PROJECT EXECUTION PLAN
A Project Execution Plan will be developed for Ana Paula as
part of future study and engineering work. This plan will provide a high-level
description of how the project will be executed. This plan contains an overall
description of what the main work focuses are, project organization, the
estimated schedule, and where important aspects of the project will be carried
out. Key plans to be developed include, Health and Safety, Environment and
Social Management, Engineering, Procurement, Construction and Construction
Management, Contracting, Inspection, Expediting, Project Services, Quality
Management and Commissioning.
|
|
248 |
| ANA PAULA PROJECT |
| FORM 43-101F1 TECHNICAL REPORT |
25 INTERPRETATION AND CONCLUSIONS
It is the conclusion of the Qualified Persons preparing this technical report that the information contained within adequately supports the positive economic results obtained for the Ana Paula project. The project contains 13.4 million tonnes of gold-bearing sulphide mineralization that can be mined by open pit methods and recovered using common processing methods consisting of milling, gravity, flotation, atmospheric oxidation and cyanide leaching of flotation concentrates.
As demonstrated by the information contained in this report, the project is economically viable and should proceed to the feasibility study stage.
25.1 PROJECT RISKS
As with any mining project, there are risks that could affect the economic viability of the project. Many of these risks are based on lack of detailed knowledge and can be managed as more sampling, testing, design, and engineering are conducted at the next study stages. Table 25-1 identifies what are currently deemed to be the most significant internal project risks, potential impacts, and possible mitigation approaches.
The most significant potential risks associated with the project are lower gold recoveries than those projected, unanticipated mining dilution, operating and capital cost escalation, permitting and environmental compliance, unforeseen schedule delays, changes in regulatory requirements, ability to raise financing and metal price. These risks are common to most mining projects, many of which can be mitigated with adequate engineering, planning and pro-active management.
External risks are, to a certain extent, beyond the control of the project proponents and are much more difficult to anticipate and mitigate, although, in many instances, some risk reduction can be achieved. External risks are things such as the political situation in the project region, metal prices, exchange rates and government legislation. These external risks are generally applicable to all mining projects. Negative variance to these items from the assumptions made in the economic model would reduce the profitability of the mine and the mineral resource and reserve estimates.
Table 25-1: Potential Risk Impacts and Mitigation
| Risk | Explanation/Potential Impact | Possible Risk Mitigation |
| Water Supply | Additional hydrogeological studies are needed to determine if suitable ground water quantity and quality exists to supply the mine. | Well tests will be conducted at the identified wellhead location. |
| Mining Dilution | Dilution can impact project economics. Standard blasthole sampling may not be sufficient to minimize dilution. | A well planned and executed grade control plan is necessary immediately upon commencement of mining. |
| Metallurgical Recoveries | Changes to metallurgical assumptions could lead to reduced metal recovery, increased processing costs, and/or changes to the processing circuit design. If LOM gold recovery is lower than assumed, the project economics would be negatively impacted. | A pilot plant test program should be carried out to verify the metallurgical assumptions. |
| CAPEX and OPEX | The ability to achieve the estimated CAPEX and OPEX costs are important elements of project success. | Further cost estimation accuracy with the next level of study, as well as the active investigation of potential cost-reduction measures would assist in the support of reasonable cost estimates. |
|
|
249 |
| ANA PAULA PROJECT |
| FORM 43-101F1 TECHNICAL REPORT |
| Risk | Explanation/Potential Impact | Possible Risk Mitigation |
| Permit Acquisition | The ability to secure all of the permits to build and operate the project is of paramount importance. Failure to secure the necessary permits could stop or delay the project. | Permitting plan will developed during the feasibility stage. |
| Geochemistry and Water Management | The impoundment tailings storage facility is assumed to be unlined based on testing carried out during the PFS. Geochemical testing of leached / detoxed flotation concentrates has not been completed yet. | Confirmatory geochemical testing of leached detoxed flotation concentrates to be carried out during the feasibility stage. |
| Development Schedule | The project development could be delayed for a number of reasons and could impact project economics. A change in schedule would alter the project economics. | Development of a level 3 schedule during the feasibility stage along with identification of schedule risks and mitigation plans for any risks identified. |
| Ability to Attract Experienced Professionals | The ability to attract and retain competent, experienced professionals is a key success factor for the project. High turnover or the lack of appropriate technical and management staff at the project could result in difficulties meeting project goals. | The early search for professionals as well as competitive salaries and benefits identify, attract and retain critical people. |
25.2 OPPORTUNITIES
There are also significant opportunities that could improve the economics, timing, and/or permitting potential of the project. The major opportunities that have been identified at this time are summarized in Table 25-2, excluding those typical to all mining projects, such as changes in metal prices, exchange rates, and etcetera. Further information and assessments are needed before these opportunities should be included in the project economics, however.
Table 25-2: Potential Opportunities
| Opportunity | Explanation | Potential Benefit |
| Metallurgical Recovery Increases | Potential to optimize the atmospheric oxidation process (e.g. through grind size, reagent consumption, residence time) which would improve the leachability of the concentrate. | Potential of up to 5 percent increase in overall gold recovery. |
| Resource Increase | Potential resources identified north east of the pit and underground. | Increase to the mineral resource, extending mine life. |
| Operating Cost Reduction | Further mine planning and process design work has potential to reduce operating costs as plans are further refined. | Reduce operating costs and increase revenue. |
| Project Strategy and Optimization | With additional detailed planning and a series of strategic option reviews the project may be able to add value. | Capital cost savings. |
| Attracting an experienced and skilled construction work force. | Construction has potential to begin as other projects in the region are nearing completion. | A supply of experienced skilled workers looking for employment as this project begins has potential to reduce construction costs and shorten the construction period. Costs would be reduced accordingly. |
25.3 GEOLOGY & RESOURCE MODEL
Ana Paula lies along the north-western extension of the
Guerrero Gold Belt and straddles the proposed tectonic boundary between the
Teloloapan and the Morelos Guerrero platform sub-terranes. The Teloloapan
volcanic-volcaniclastic belt on the west of the property and to the east, the
Morelos Guerrero platform, includes a thick carbonate sequence of bedded
limestone and dolomite overlain by younger, thinly bedded flysch-like deposits.
The
|
|
250 |
| ANA PAULA PROJECT |
| FORM 43-101F1 TECHNICAL REPORT |
Ana Paula geology project consists of a sedimentary-intrusive mixed domain, located in the eastern half of the exploration area, and an intrusive dominant domain located in the western half of the exploration area. The contact between these domains is interpreted to be a local fault. The Ana Paula deposit is hosted mostly in the sedimentary-intrusive domain. The sediments are locally metamorphosed to hornfels and skarn, occurring frequently as narrow contact replacement to the sediment intrusive contacts. In addition to the principal sediment and intrusive lithologies several different breccia units, important to gold mineralization, are developed in the local stratigraphy. The most important breccias at the project are multilithic and hydrothermal types. The multilithic breccia consists of angular to rounded plagioclase-biotite porphyry, and angular fragments of hornfels, limestone, shale, and other very fine grained to aphanitic fragments. The hydrothermal breccia has a dense siliceous matrix with locally abundant sulphide minerals, mainly pyrite/marcasite and arsenopyrite. Hydrothermal brecciation can occur in all rock types but is dominantly observed in intrusive rocks and is locally observed to re-brecciate the multilithic breccia.
The Ana Paula exploration area is in the sediment-intrusive domain that includes limestone, hornfels and intrusive rocks along with two discrete structurally controlled breccia bodies of irregular dimensions. The most important breccia body is the high-grade breccia zone (complex breccia) which consists of a core of multilithic breccia, in a steeply south plunging column surrounded by a halo of mineralization and alteration characterized by veins, fracture zones, and massive sulfide contact replacements. The high-grade breccia zone and surrounding halo contain the bulk of the mineralization within the Ana Paula pit.
Based on the review of the QA/QC, data validation, and statistical analysis, the following conclusions were made:
-
The methods and procedures to collect and compile geological, geotechnical, and assaying information for the Ana Paula project were found to be suitable for the style of mineralization found on the property and meet accepted industry standards.
-
The mineralization on the Ana Paula project were sampled with surface sampling of outcrops and core drilling. Only the core drilling was used in the resource estimate.
-
Samples were primarily prepared at ALS Chemex located in Guadalajara, Mexico and SGS Laboratory located in Durango, Mexico. A small number of samples were prepared at ACME Laboratory in Guadalajara, Mexico and Inspectorate Laboratory. All laboratories are internationally recognized and accredited to ISO 17025 and/or ISO 9001:2008 standards, or better.
-
Samples were analyzed for gold by fire assay with an atomic absorption finish with samples assaying greater than 10 g/t gold, re-assayed by fire assay with a gravimetric. Samples were also analyzed with an aqua regia digestion, and a combination of inductively coupled plasma emission spectrometry (ICP-OES) and/or inductively coupled plasma mass spectrometry (ICP-MS) to provide a multi-element analyses.
-
The quality control and quality assurance programs consist of insertion of blanks, standard reference material, quarter core duplicates, and reject/pulp checks at a second laboratory. Submission rates meet the industry accepted practice for each of the QA/QC type of samples. The QA/QC program was found to be well monitored by the exploration staff. The sampling procedures, analytical methods, and QA/QC procedures undertaken by Alio Gold indicate reasonable accuracy of the sample data and no obvious cross contamination at the sample preparation level.
-
Data verification was originally performed by IMC and later by AGP through site visits, collection of independent character samples, and a database audit. The drill database was found to be error free and suitable to be used for a resource estimate.
-
Core handling, core storage, and chain of custody are consistent with industry standards.
Based on the above conclusions and effective May 16, 2017, the Ana Paula updated Mineral Resource Estimate (MRE) was developed in conformance with the CIM Mineral Resource definitions referred to in the NI 43-101 Standards of Disclosure for Mineral Projects. This mineral resource estimate is an update of the May 26, 2016 estimate completed by JDS Energy and Mining Inc. for the Ana Paula project located near the municipalities of Cuetzala del Progresos and Apaxtla del Castregon, Guerrero State, Mexico.
|
|
251 |
| ANA PAULA PROJECT |
| FORM 43-101F1 TECHNICAL REPORT |
The estimate was completed based on the concept of a small to medium scale open pit, with a possible resource for an underground operation for the material remaining below the pit bottom.
The Ana Paula grade models were interpolated using 276 core holes completed by Goldcorp in 2005, Newstrike Capital from 2010 through 2015 and Alio Gold since 2015. The database totaled 123,268 m of core and contained 86,013 assays.
The 3D wireframes developed to control the grade interpolation of the resource model were based primarily on lithology with a probabilistic approach use for the high-grade mineralized halo and the high-grade zones in the lithologies outside the halo. The deposit has been modeled using an Ordinary Krige applied to 3 m gold and silver drill hole composite lengths which respected lithology units.
Densities were determined from a suite of 5,946 representative core samples using industry standard methods. The density was then interpolated in areas where the data was sufficiently dense to honour localized variations. For the remaining areas, the average density for each of the lithological domains was applied.
The block model matrix size of 5 m x 5 m x 6 m (width x length x height) was selected in consultation with the engineering team from AGP, and was based on the size deemed suitable for a small to moderate open pit mining scenario with possible underground mining components below the pit.
The interpolation was carried out in multiple passes with increasing search ellipsoid dimensions. The classification was based primarily on the pass number and the average distance to the composites, followed by an adjustment based on diamond drilling density (core area), and the krige efficiency.
Under CIM definitions, Mineral Resources should have a reasonable prospect of economic extraction. A gold price of $1,350/ounce and a silver price of $17/ounce was used for the cut-off determination. For open pit resources, a cut-off of 0.6 g/t gold was used.
To further assess reasonable prospects of economic extraction, a Lerchs-Grossman optimized shell was generated to constrain the potential open pit material. Parameters used to generate this shell included:
-
49.5° overall slopes for the pit shell
-
USD $2.25/t mining, USD $19/t milling, USD $2.49/t G&A operating costs
-
88% gold recovery, and 30% silver recovery
-
Gold price of $1,350/ounce and $17/ounce silver price
-
Above criteria was applied to Measured, Indicated, and Inferred materials
To further assess reasonable prospects of economic extraction for the material below the resource constraining shell, a break-even cut-off of 1.65 g/t gold was selected based on the following parameters:
-
USD $36/t mining, USD $19/t milling, USD $2.49/t G&A operating costs
-
88% gold recovery, and 30% silver recovery
-
Gold price of $1,350/ounce and $17/ounce silver price
|
|
252 |
| ANA PAULA PROJECT |
| FORM 43-101F1 TECHNICAL REPORT |
-
Dilution considered for cut-off determination 5%
-
Above criteria was applied to Measured, Indicated, and Inferred materials
Based on the geometry of the deposit, the material amenable to underground extraction will likely be using a bulk mining method such as long-hole or modified Avoca mining method. The break-even cut-off stated is only applicable to the material in the vicinity of the mineralized HALO due to increase in development cost reaching blocks further away and no mining plan exist for the material amenable to underground extraction and therefore stope size, level spacing and other underground mining criteria have not yet been established.
With an effective date of May 16, 2017 and based on the above criteria, a summary of the mineral resource is presented in Table 25-3, tabulated at a cut-off of 0.6 g/t gold within the resource constraining shell and 1.65 g/t gold below the shell.
Table 25-3: Ana Paula Resource Statement Effective May 16, 2017
| Area | Category | Cut-off (Au g/t) |
Tonnes | Au (g/t) |
Gold (ounces) |
Ag (g/t) |
Silver (ounces) |
| Resources amenable
to open pit extraction |
Measured | 0.6 | 7,541,000 | 2.43 | 590,000 | 5.1 | 1,236,000 |
| Indicated | 10,491,000 | 1.79 | 605,000 | 4.8 | 1,629,000 | ||
| Measured & Indicated |
18,032,000 | 2.06 | 1,195,000 | 4.9 | 2,865,000 | ||
| Inferred* | 249,000 | 1.27 | 10,000 | 8.8 | 70,000 | ||
| Resources amenable to underground extraction |
Measured | 1.65 | 41,000 | 2.07 | 2,800 | 4.3 | 6,000 |
| Indicated | 2,925,000 | 2.81 | 264,000 | 4.2 | 398,000 | ||
| Measured & Indicated |
2,967,000 | 2.80 | 266,700 | 4.2 | 404,000 | ||
| Inferred* | 621,000 | 2.07 | 41,400 | 3.9 | 79,000 | ||
| Total Resources | Measured | OP 0.6 and UG 1.65 |
7,582,000 | 2.43 | 592,800 | 5.1 | 1,242,000 |
| Indicated | 13,416,000 | 2.01 | 869,000 | 4.7 | 2,027,000 | ||
| Measured & Indicated |
20,998,000 | 2.17 | 1,461,800 | 4.8 | 3,269,000 | ||
| Inferred* | 870,000 | 1.84 | 51,400 | 5.3 | 149,000 |
*Note: The quantity and grade of reported Inferred resources in this estimation are conceptual in nature and are estimated on the basis of limited geological evidence and sampling. Geological evidence is sufficient to imply but not verify geological and grade or quality continuity. For these reasons, an Inferred Mineral Resources has a lower level of confidence than an Indicated Mineral Resources and it is reasonably expected that the majority of Inferred Mineral Resources could be upgraded to Indicated Mineral Resources with continued exploration. Mineral Resources that are not Mineral Reserves do not have demonstrated economic viability. Rounding of tonnes as required by reporting guidelines may result in apparent differences between tonnes, grade, and contained metal content.
25.4 MINING METHODS
Mining studies have been completed using the resource estimate as of May 16, 2017 for Ana Paula and includes the following aspects:
-
Pit optimization utilized the Lerch-Grossman algorithm to determine the ultimate pit limits. A metal price of $984/oz gold was used to define the ultimate pit for the Study.
-
Final pit was designed with three phases to help advance ore to the mill and defer was stripping. Bench and overall pit slope designs were based on recommendations by Knight Piésold.
|
|
253 |
| ANA PAULA PROJECT |
| FORM 43-101F1 TECHNICAL REPORT |
-
Mineral reserves have been determined from mineral resources by taking into account geologic, mining, processing, legal and environmental considerations and are therefore classified in accordance with the 2014 CIM Definition Standards for Mineral Resources and Mineral Reserves;
-
Proven Mineral Reserves amount to 6.53 Mt at an average grade of 2.62 g/t Au and 5.31 g/t Ag. Probable Mineral Reserves amount to 6.91 Mt at an average grade of 2.12 g/t Au and 5.13 g/t Ag. Total estimated Mineral Reserves amounts to 13.44 Mt at an average grade of 2.36 g/t Au and 5.22 g/t Ag. Inferred Mineral Resources have not been converted to reserves and instead are treated as waste for mine planning purposes.
-
The mine schedule moves 43.7 Mt of waste and 13.4 Mt of ore for a strip ratio of 3.25:1 over an 8 year mine life.
-
Waste rock facilities (WRF) are located in the same valley as the tailings facility at two different locations. They accommodate all the waste material from the pit.
-
Mining will be completed by contractor with size appropriate equipment in the form of 56 t haulage trucks matched to 6.4 m3 front end loaders. Support equipment such as dozers, graders and water trucks will assist in the mining operation.
-
Contract mining has been employed for the entire mine production.
-
Grade control will be provided by a separate fleet of reverse circulation drills working in advance of the active mine faces.
-
Dewatering activities will be of smaller scale with seasonal pit dewatering after storm events. Water discharge from the pit will be to the tailings facility or consumed for dust control purposes.
-
Estimates of both mine capital and operating costs are summarized in Section 21. Capital costs consider contractor mining from Year -2 onwards with supervision by Alio’s technical team.
The potential for underground mining exists beneath the PFS design pit. Alio is in the process of obtaining permission to develop an exploration drift to further delineate the material beneath the pit. This drift is not expected to start until Q3 2017.
This potential underground material has not been considered in the pre-feasibility study and are not included within the Mineral Reserves. Mineral Resources that are not included within Mineral Reserves do not have demonstrated economic viability
25.5 MINERAL PROCESSING AND METALLURGY
- Arsenopyrite and pyrite were identified as the primary sulphide minerals in the deposit. Both minerals were identified as carriers of submicroscopic/solid solution gold.
- Ana Paula material may be considered moderately hard to hard with SMC results yielding Axb values of 34.8 and 33.3. Bond Ball Work Index test results showed work indices ranging from 15.1 kWh/t to 19.4 kWh/t.
- The material is mildly abrasive.
- Whole ore flotation yields gold recoveries ranging from 93% to 96% with an average mass recovery of 20%.
- The flotation response was insensitive to the primary grind size between 75µm and 160µm. A primary grind of 80% passing 160µm was selected.
- Flotation
- Ana Paula responded well to gravity concentration. At a 160µm grind size recovery to gravity concentrate is expected to be approximately 20%, based on treatment of 36% of the ball mill circulating load.
|
|
254 |
| ANA PAULA PROJECT |
| FORM 43-101F1 TECHNICAL REPORT |
- Whole ore cyanidation resulted in recoveries ranging from 59% to 70% for GD, 62% to 68% for HGB, and 6% to 50% for LS.
- Preg-robbing carbon was identified in the LS composite, explaining the low initial recoveries. LS performance improved through the addition of activated carbon.
- Whole ore cyanidation of Ana Paula material was insensitive to primary grind size residence time, cyanide concentration, lead nitrate addition and preaeration. Gold recovery is limited by the refractory gold content of the material.
- Pressure oxidation of Ana Paula material yielded gold recoveries in excess of 95%.
- Atmospheric oxidation of Ana Paula material yielded overall gold recoveries of approximately 84-88% depending on regrind size and soda ash dosage.
- The atmospheric oxidation flowsheet was chosen based on a lower capital cost.
- Soda ash was chosen as the pH modifier during the atmospheric oxidation process as it yielded the best results and is locally available.
- Soda ash consumption is a function of the sulphur content of the concentrate and the extent of oxidation desired.
- Regrinding the concentrate to 25µm resulted in the best oxidation conditions and highest gold recovery.
- Gold recovery is maximized after 48 hours of oxidation. Further residence time does not yield additional recovery.
|
|
255 |
| ANA PAULA PROJECT |
| FORM 43-101F1 TECHNICAL REPORT |
26 RECOMMENDATIONS
The Ana Paula project should advance to a feasibility study (FS) in alignment with Alio’s desire to develop the resource.
Estimated costs for a FS-level study specific to the project total $16.59M and itemized in Table 26-1.
Table 26-1: Feasibility Study Estimated Costs
| Item | Cost in k$ | Description |
| Metallurgical Test Work | 1,280 | Metallurgical Core Sampling, Pilot Plant Test Work, Analysis, and Interpretation |
| Tailings Management and Waste Rock, Facilities and Water Supply | 570 | Geotechnical and Design Engineering for Tailing Management and Waste Rock Facilities. Hydrogeology and Geochemical |
| FS Engineering & Services | 700 | FS-Level Mine, Infrastructure and Process Designs |
| Environment and Social Studies | 900 | Geochemistry, Environmental and Social Impact Studies |
| Other Studies | 386 | Mining, Geology & Peer Review |
| Local Infrastructure Engineering | 350 | Access Roads, Power Studies |
| EPCM Engineering | 750 | Infrastructure & Plant Design and Engineering |
| Underground Exploration | 7,500 | Underground Exploration Adit |
| Surface Exploration | 875 | Delineation of High Grade Breccia |
| Hydrology Drilling | 640 | Well Testing |
| Site G&A | 1,140 | |
| Subtotal | 15,090 | |
| Contingency (10%) | 1,500 | |
| Total | 16,590 | Excludes Owner’s Costs and Permitting Fees |
Source:Alio (2017)
26.1 GEOLOGY
26.1.1 QA/QC Recommendation
- While the current QA/QC is of industry standard, the best program seen by the QP re-insert coarse and pulps rejects from earlier assays in the sample stream with a new tag number, in order to incorporate a blind coarse and pulp duplicate procedure to the QA/QC protocol. This additional protocol is deemed optional, and should be considered on larger drill programs and for more advance projects. Cost per samples is $35 USD for gold, silver and multi-elements. Therefore the estimated cost per 1000 samples, assuming only gold and silver is run is estimated below $1,500 USD.
26.1.2 Resource Model Recommendation:
-
The block size while adequate for the area covered by the pre-feasibility pit is considered to small for the area to the North of the pit. The use of a 8m x 8m x 6m block model matrix should be investigated with the goal to improve the estimate in the North while minimizing the impact to the model in the pit area.
-
It is recommended that the oxidation layer be studied and model separately during the construction of the feasibility model.
|
|
256 |
| ANA PAULA PROJECT |
| FORM 43-101F1 TECHNICAL REPORT |
-
For the feasibility study, AGP recommends re-visiting the grade transition profiles at the lithological boundaries and investigate if a revised high grade probabilistic model may be used as a surrogate to the HALO in order to simplifying the procedure. This may also result in a smoother grade distribution.
-
The geological interpretation and resulting geological model covering the south west portion of the deposits should be redone taking into account the surface mapping. There is potential mineralization occurring in this area and a preliminary resource model could be interpolated to assist the exploration effort.
-
During the resource model validation process, it was noted several areas of isolated pockets of Measured blocks exist in the model. While these areas have excellent data support, it is recommended for the feasibility model, that these areas be evaluated separately and manually cleaned up if necessary.
-
The underground resource requires significant additional drilling to confirm continuity and proper grade distribution at the precision level required for underground mine planning. Drilling this small target is difficult to accomplish due in part to topographical limitation and due to drill string accuracy. It is recommended to carry out an underground scoping study that would offer guidelines on stope size and level spacing which would offer guidelines as to the drill pattern required to improve the resource estimate for the material below the pit shell.
Costs for the above recommendations pertaining to the resource model are factored in the total cost of the feasibility study.
26.1.3 Resource Model Risk Assessment:
For a feasibility model, it is recommended that the resource model be evaluated for risks associated with the estimated quality (grade) and quantity (tonnage) of resources at a given cut-off. This risk is evaluated using advance geostatistical technique such as Hermite correction/change of support studies, confidence intervals via the use of conditional simulation and uniform conditioning. Theses studies will require the use of a Geostatistician and cost is estimated at $15,000 for approximately one week of work.
AGP also recommend drilling with an RC rig a test area covering the first few months of production on a tight pattern similar to what will be use for grade control. This drilling will allow the calibration of the resource model and de-risk the project during start-up. The recommended area should be selected with the mine planning engineers.
26.2 EXPLORATION
26.2.1 Underground Exploration
Previous deep drilling from surface at Ana Paula indicated significant high-grade gold mineralization potential below the proposed open pit. From Alio’s most recent 2016-17 drilling program, this hypothesis was further strengthened, and the Company was able to declare an underground resource of 266,700 gold ounces at 2.80 g/t gold in the Measured and Indicated Category and 41,400 gold ounces at 2.07 g/t gold, both at a 1.65 g/t gold cut-off grade (see Section 14 for further details). The high grade breccia mineralization extends at depth with multiple drill hole intercepts with grade sufficient to support underground mining.
It is recommended that Alio should carry out an underground scoping study and assuming the study result is positive, Alio should consider exploring the underground mineralization beneath the proposed pit.
Alio has received a proposal from a well-known mining contractor for developing an underground development which would be suitable for both exploration and production. The development would include:
- a 1,450 m decline with a 4 m by 4.5 m cross-section.
|
|
257 |
| ANA PAULA PROJECT |
| FORM 43-101F1 TECHNICAL REPORT |
-
Approximately 700 m of cross-cuts (7) with a 3.5 m by 3.5 m cross-section.
-
a 275 m vent raise with a 4m diameter
Permits for development of the decline are expected to be submitted for approval in 3Q/4Q 2017. Once approved, the development would take approximately 11 months. The approximate cost for the development is approximately $7.5M.
Once the development is complete, a Phase 1 drilling program of 10,000 m has been proposed at an all-in cost of $150/m. The Phase 1 drilling program would focus on the delineation of the high-grade breccia structure that extends through the pit bottom.
A Phase 2 program of the same approximate cost and meterage could be carried out subsequent to Phase 1, targeting a high-grade hornfel-skarn structure that was intercepted multiple times from surface drilling.
The appeal of the underground resource delineation and development is its potential to supplement open-pit mill feed with high grade underground ore and the potential for the deposit to continue to extend below depths that have been drilled to this point.
A cross-section showing the underground mineralization is shown in Figure 26-1.
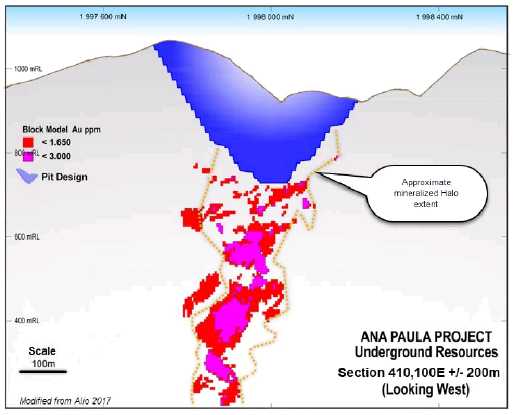
Figure 26-1: Cross-section showing the Ana Paula underground mineralization
The approximate fully committed cost for the decline
development during the feasibility stage is $7.5M. Subsequent work will involve
underground drilling, core logging, core cutting, geochemical assays, and
geological interpretation at estimated cost of $3.1M.
|
|
258 |
| ANA PAULA PROJECT |
| FORM 43-101F1 TECHNICAL REPORT |
26.2.2 Surface Exploration Drilling
A drilling program of 4,000 m has been proposed at an all-in cost of $205.50/m. The drilling program would focus on the north east section of the proposed pit where potential resources have been identified based on inferred and indicated resources. Figure 26-2 shows the location of the proposed drill holes for the surface exploration program.

Figure 26-2: Proposed Drill Holes
The approximate cost for the development is approximately $875,000.
26.3 MINING METHODS
Significant work has been completed to date on the open pit designs and costing for the Ana Paula pit. This work demonstrates the potential for economic development of the Project. There are still some areas that require further definition prior to operation and can be addressed in the feasibility study. These include:
| • | ARD characterization: |
| o | Information regarding potential for ARD is still to be confirmed. | |
| o | If this is an issue a proper mitigation strategy needs to be developed. | |
| o | This may include encapsulation in WRF or submersion in the TSF. |
|
|
259 |
| ANA PAULA PROJECT |
| FORM 43-101F1 TECHNICAL REPORT |
| • | Underground potential: |
| o | Beneath the reserve pit lies additional high grade mineralization. This material represents an opportunity to mine underground which could add additional grade to the mill feed. |
|
|
||
| o | A study examining the costs and practicality should be completed internally and then drilling to confirm the design concept. |
|
|
||
| o | Further investigation is warranted to examine a potential opportunity with underground mining beneath the current reserve pit. |
| • | WRF design and sequencing: |
o |
This needs to be examined in a bit more detail to assist in reducing hauls also minimizing future reclamation requirements. |
26.3.1 Grade Control Procedures
The pre-feasibility study went into detail with specific methods of grade control but this area represents a significant area of benefit to the overall mine operation in that it provides the following benefits:
-
Dilution is controlled.
-
The ore heterogeneity is understood and quantified to the extent possible.
-
Additional study is required to evaluate exact equipment for use in the grade control program and methodologies to be employed in mine operations. There are specific experts in the field and it would benefit the project to consider them as part of the feasibility study and basic engineering.
26.3.2 Road Design
Access due to topography is a concern that requires an extensive road network. Proper road design and construction is critical reducing material movement costs. A detailed examination of the roads, their timing and construction can positively assist the project economics.
The approximate cost for the development is approximately $40,000.
26.4 TAILINGS STORAGE FACILITY, WASTE ROCK FACILITIES, AND WATER ENGINEERING
The following engineering studies are recommended as part of the feasibility study:
-
TSF and WRF FS design engineering
-
Tailings pipeline and water recirculation systems engineering
-
Site wide water balance
-
Geotechnical characterization
-
TMF Hydrogeology model (to confirm hydrogeologic containment)
-
FS level water management plan and design
-
Geochemical characterization of leached tailings
The approximate cost for the feasibility stage is approximately
$570,000.
|
|
260 |
| ANA PAULA PROJECT |
| FORM 43-101F1 TECHNICAL REPORT |
26.5 METALLURGICAL TESTWORK RECOMMENDATIONS
The following testwork is recommended as part of the feasibility study:
| • | Additional grindability testing including the following: |
| o | JK Drop Weight tests on each major domain | |
| o | Variability SMC Tests | |
| o | Variability Bond Ball Work Index tests |
| • | Variability flotation testing for each major domain | |
| • | Atmospheric oxidation testing of composites based on production years | |
| • | Piloting scale testing of the flotation / atmospheric oxidation circuits | |
| • | Cyanide destruction testwork | |
| • | Thickening and rheology testwork |
The estimated cost for this testwork is expected to be approximately $580,000 not including drilling of the metallurgical sample.
26.6 ENVIRONMENTAL AND SOCIAL STUDIES
The following work is recommended as part of the feasibility study:
| • | Complete Social Economic Baseline Study. | |
| • | Complete Environmental and Social Impact Study. | |
| • | Develop a Community Stakeholder Engagement System. |
The estimated cost for this work is expected to be
approximately $900,000.
|
|
261 |
| ANA PAULA PROJECT |
| FORM 43-101F1 TECHNICAL REPORT |
27 REFERENCES
ALS Metallurgy Kamloops, 2017, Ana Paula Comminution Test Program – KM 5227. April 20, 2017.
AuTec Innovative Extractive Solutions Ltd., 2016, Blue Coast Research – Rotary Breakage Test Lite. Document #: P2016-126. Revision #: 0. August 30, 2016.
Bagan, T., 2013, Personal communications.
Blue Coast Research, 2017, Ana Paula Prefeasibility Metallurgical Testwork Report. Prepared for Alio Gold Inc. 25 May 2017.
C.I.M, 2010, Canadian Institute of Mining, Metallurgy and Petroleum, as the CIM Definition Standards on Mineral Resources and Mineral Reserves as amended by the CIM Standing Committee on Reserve Definitions, adopted by CIM Council on November 27, 2010. Available at http://web.cim.org/standards.
Colombo, F., 2012, June 12, 2012, Report 120480, Ana Paula Project: An internal report for Newstrike Capital Inc., by Vancouver Petrographics Ltd., 92 p.
Centeno-García, E.; Guerrero-Suastegui, M; and Talavera-Mendoza, O, 2008, The Guerrero Composite Terrane of western Mexico: Collision and subsequent rifting in a supra-subduction zone. Geological Society of America Special Papers 2008; 436; 279-308.
Corbett G., 2009, Anatomy of porphyry-related Au-Cu-Ag-Mo Mineralised systems: Some exploration implications: For: Australian Institute of Geoscientists North Queensland Exploration Conference June 2009. www.corbettgeology.com.
Corbett, G.J., and Leach, T.M., 1998, ‘Southwest Pacific rim gold-copper systems: Structure, alteration and mineralization’, Short course manual May 1997 edition: Also published with edits as Economic Geology, Special Publication 6, 1998, 238 p.
Díaz Nieves, L., et.al. 2012, Legal opinion on mineral rights status dated November 6, 2012. from Diaz Bouchot and Raya of Mexico City to Davidson and Company LLP of Vancouver. Newstrike internal communication.
FLSmidth, 2017, Gravity Circuit Modeling Report, Timmins Gold-Blue Coast Research, Ana Paula. Prepared for Taj Sigh, Revision 2. May 26, 2017.
Gibson, C., 2010, Ana Paula geology, sampling, and core logging manual: Private report prepared for Newstrike Capital Inc. by ProDeMin, 22 p. Gibson, C., 2011, Personal communications.
Gibson, C. 2012, Ana Paula Geology – Aurea Report 05-2012, An internal report for Minera Aurea SA de CV, 6 p. Gibson, C. 2012, Personal communications. Gibson, C. 2013, Personal communications. Gibson, C. 2014, Personal communications.
Goldcorp 2005a, Los Filos Project feasibility study. Press release dated May 17, 2005 available at http://sedar.com and from www.goldcorp.com.
Goldcorp 2005b, Goldcorp completes acquisition of Bermejal gold
deposit in Mexico. Press release dated March 31, 2005 and available at
http://sedar.com and from www.goldcorp.com.
|
|
262 |
| ANA PAULA PROJECT |
| FORM 43-101F1 TECHNICAL REPORT |
Goldcorp, 2012, Management’s discussion and analysis of financial condition and results of operations for the year ended December 31, 2012, Form 51-102F1. Available on www.Sedar.com and at: http://www.goldcorp.com with accompanying files Reserves.pdf and 2012 Resources.pdf.
Goldcorp, 2014, Goldcorp announces record quarterly and full-year gold production; Provides updated reserves and resources estimates. Press Release Dated February 13, 2014 Available on www.sedar.com and at www.goldcorp.com.
González-Partida, E., et. al., 2003, Paleocene Adakite Au–Fe Bearing Rocks, Mezcala, Mexico: Evidence From Geochemical Characteristics: Journal Of Geochemical Exploration, vol. 80 p. 25–40.
González-Partida, E., et. al., 2004, Fluidos Asociados Al Skarn Au(-Cu) De La Joya, Distrito De Mezcala, Guerrero, México: Implicaciones Regionales Para Depósitos Formados A Partir De Rocas Calcoalcalinas Vs. Adakíticas: Revista Mexicana De Ciencias Geológicas, V. 21, Núm. 3, p. 371-381.
Hacettepe Univerity: Department of Mining Engineering Online Dictionary on Mining, Mineral and Related Terms, www.maden.hacettepe.edu.tr/dmmrt/index.html.
Hertel, M., Rust, J, 2013, Media Luna Gold–Copper Project Guerrero State, Mexico NI 43-101 Technical Report. Prepared for Torex Gold Resources Inc. by AMEC E&C Services, Inc Project Number: 167627. Effective Date: 13 September 2013. 176P.
JDS Energy & Mining Inc. 2014, Ana Paula Project Preliminary Economic Assessment, Municipalities of Cuetzala del Progreso and Apaxtla del Castregon, Guerrero State, Mexico. Effective Date August 8, 2014. Report Date: October 29, 2014. Prepared for Timmins Gold Corp.
Johnson, B, 2014, Internal memo for Newstrike Capital dated July 27, 2014, and various personal communications.
Kappes, Cassiday & Associates, 2012, Ana Paula Project BxA700 Composite Report of Metallurgical Test Work, August 2012, doc. file: KCA0120137_ANA02_02. 108p.
Kearvell, G., 2009, Aurea Norte Property, The Guerrero Gold Belt, Guerrero State, México, (the El Coyote, Cosmos, Don Richard, Coyopancho, Cuetzala, Morenita, Don Jesus, Estafania, and Estafania Fracc. I Mining Concessions). 2004-2008 Exploration Programs Compilation Report: Internal report for Newstrike Capital Inc., 115p.
Kearvell, G., 2010, Personal communications during and subsequent to the Ana Paula Project visit conducted March 22-23rd, 2010.
Kearvell, G., 2011, Personal communications during and subsequent to the Ana Paula Project visit conducted January 10-11, 2011.
Kearvell, G., 2012, Personal communications during and subsequent to the Ana Paula Project visit conducted March 27-29, 2012, and October 10-12, 2012, 2012.
Kearvell, G., 2013, Personal communications. Kearvell, G., 2014, Personal communications.
Knight Piésold Consulting, 2017, Alio Gold Inc., Ana Paula
Project Pre-Feasibility Study, Tailings Storage Facility and Waste Rock
Facility. Prepared for Alio Gold Inc. May 17, 2017.
|
|
263 |
| ANA PAULA PROJECT |
| FORM 43-101F1 TECHNICAL REPORT |
Levresse, G; et al, 2004, Petrology, U/Pb Dating And (C-O) Stable Isotope Constraints On The Source And Evolution Of The Adakite-Related Mezcala Fe-Au Skarn District, Guerrero, Mexico. Mineralium Deposita (2004) 39: 301–312 DOI 10.1007/S00126 -003-0403-Y. Springer-Verlag.
Lunceford, R. A., 2009, Geological Report and Summary of Field Examinations, Aurea Norte Property, Municipalities of Apaxtla, Cocula and, Cuetzala Del Progreso Guerrero State Mexico, September 30, 2009: NI 43-101 Technical Report for Newstrike Capital Inc., 96 p.
Lunceford, R. A., 2010, Geological Report and Summary of Field Examinations, Ana Paula Project, Municipalities of Cuetzala Del Progreso, Apaxtla del Castregon Guerrero State, México June 26, 2010: NI 43-101 Technical Report for Newstrike Capital Inc., 101 p.
Mauler, A., Thompson, J. B., 2005, Petrographic Report Of 11 Samples; Mexico: Private Report For Goldcorp Inc., Petrascience Conultants, Inc., 44 P.
Medina Cázares, H., 2010, Geología y Mineralización del Proyecto Ana Paula, Gro.: Goldcorp Internal Report , 46 p.
Neff, D.H., et al, 2012, Morelos Gold Project 43-101 Technical Report Feasibility Study Guerrero, Mexico, Effective Date: 4 September 2012, Issue Date October 1, 2012. Prepared for Torex Gold Resources Inc. by M3 Engineering & Technology Corporation. 377P.
Newstrike Capital Inc, 2010, “Newstrike Capital to acquire Goldcorp’s ‘Ana Paula’ properties in Guerrero, Mexico” March 3, 2010. Available at http://sedar.com and from www.newstrikecapital.com.
Newstrike Capital Inc., 2011, Newstrike Drills 214 Meters of 3.0 G/T Gold at Ana Paula Project, Guerrero, Mexico: January 18, 2011 Available at http://sedar.com and from www.newstrikecapital.com.
Newstrike, 2012a, Management Discussion and Analysis (MD&A) - Six months ended January 31, 2012: Form 51-102F1, filed March 29, 2012, Newstrike Capital Inc., 28 p. Available at http://sedar.com and from www.newstrikecapital.com.
Newstrike, 2012b, Management Discussion and Analysis (MD&A) – Year ended July 31, 2012: Form 51-102F1, filed November 22, 2012, Newstrike Capital Inc., 41 p. Available at http://sedar.com and from www.newstrikecapital.com.
Newstrike, 2012c, Management Discussion and Analysis (MD&A) - Three months ended October 31, 2012: Form 51-102F1, filed December 19, 2012, Newstrike Capital Inc., 22 p. Available at http://sedar.com and from www.newstrikecapital.com.
Newstrike, 2013a, Newstrike Capital Inc. Announces Maiden Ni 43-101 Resource Estimate For The Ana Paula Project, Guerrero, Mexico. Press Release dated March 27, 2013 Available at http://sedar.com and from www.newstrikecapital.com.
NI-43-101, 2011, National Instrument 43-101 Standards of Disclosure for Mineral Projects, B.C. Reg. 86/2011, British Columbia Securities Commission. Deposited May 19, 2011 effective June 30, 2011, available from http://canlii.ca/t/l3nk and from http://www.bcsc.bc.ca.
Ortiz, J. M., 2005, Minas De San Luis, S.A. De C.V.,
Laboratorios de Servicios e Investigación Metalúrgica, Pruebas Metalurgicas Por
Cianuracion y Flotacion de Una Muestra del Proyecto Ana Paula: Internal Report
for Goldcorp, 29 p.
|
|
264 |
| ANA PAULA PROJECT |
| FORM 43-101F1 TECHNICAL REPORT |
Ross-Brown, D., Levy, M. 2012, Preliminary Geotechnical Assessment of Slope Angles for the Ultimate Pit of Ana Paula: A private report for Newstrike Capital Inc., 11 p.
SGS De Mexico, S.A. De C.V., 2006, Pruebas Metalúrgicas para Determinar Las Maximas Extracciones De Oro Y Plata Por Cianuracion Y Por Flotacion, De Un Composito Proveniente Del Proyecto Ana Paula : Reporte preparada para Desarrollos Mineros San Luis S.A. De C.V., 21 p.
SJS, 2012, Internal reports and communications for Newstrike Capital by SJS Geophysics Ltd, Vancouver, Canada. Teck Cominco, 2004, Teck Cominco and Wheaton River announce results of 2004 exploration program on Morelos Norte (El Limon) project, Mexico. Open pit inferred resource estimate at 3.2 million ounces gold. Press reléase dated November 08,2004 available on www.sedar.com.
Thompson, T., 2008, Petrography Of The AP-Series And Outcrop Specimens, Ana Paula, Mexico: Economic Geology Consulting Internal Report Prepared For Goldcorp, Inc. May 15, 2008. 68p.
Valencia-Gomez, V.A., et al., 2001, Caracterizacion de las Intrusiones Graniticas Relacionadas Con Yacimientos de Oro del Limite Oeste de la Plataforma Morelos-Guerrero: Una Guia para la Exploracion de Recursos Minerales en el Estado de Guerrero. Clave Proyecto 980506037. Sistema de Investigacíon Benito Juarez. SIBEJ, Informe Tecnico Final, 151p.
Valencia, V.A and Ruiz, J, 2008, Resultados Analiticos De La Visita De Las Minas Los Filos, Bermejal Y Nukay, Mezcala, Guerrero Y El Proyecto Ana Paula En Cuetzala Del Progreso, Guerrero. Departamento De Geosciencias University Of Arizona Internal Report For Minera Luismin S.A. De C.V. Por El Dr. Victor A. Valencia May 2008, 66p.
Vollmer, F.W., 2012. Orient 2.1.2 Orientation Data Analysis Software. www.frederickvollmer.com.
Welhener, H. E., Lunceford, R.A., Winckers, A.H., Ana Paula Project Technical Report And Initial Resource.
Werre Keeman, F.J., Estrada Rosarte, G., et al., 1999, Monografía Geológico-Minera del Estado de Guerrero: Consejo de Recursos Minerales Publicación M-19e.SECOFI, 1º Ed., 262 p.
Estimate Municipalities Of Cuetzala Del Progreso And Apaxtla Del Castregon Guerrero State, Mexico. NI 43-101 Technical Report for Newstrike Capital Inc., Effective Date February 26th, 2013 151p.
Werre Keeman, F.J., Estrada Rosarte, G., et al., 1999,
Monografía Geológico-Minera del Estado de Guerrero: Consejo de Recursos
Minerales Publicación M-19e.SECOFI, 1º Ed., 262p.
|
|
265 |
| ANA PAULA PROJECT |
| FORM 43-101F1 TECHNICAL REPORT |
APPENDIX A – PRE-FEASIBILITY CONTRIBUTORS AND PROFESSIONAL QUALIFICATIONS
|
|
266 |
CERTIFICATE OF QUALIFIED PERSON
I, Daniel H. Neff, P.E., do hereby certify that:
| 1. | I am currently employed as President by: |
M3 Engineering & Technology
Corporation
2051 W. Sunset Road, Ste. 101
Tucson, Arizona 85704
U.S.A.
| 2. | I am a graduate of the University of Arizona and received a Bachelor of Science degree in Civil Engineering in 1973 and a Master of Science degree in Civil Engineering in 1981. |
| 3. | I am a: |
Registered Professional Engineer in the State of Arizona (No. 11804 and 13848) |
|
| 4. | I have practiced civil and structural engineering and project management for 43 years. I have worked for engineering consulting companies for 13 years and for M3 Engineering & Technology Corporation for 31 years. |
| 5. | I have read the definition of “qualified person” set out in National instrument 43-101 (NI 43-101) and certify that by reason of my education, affiliation with a professional association (as defined in NI 43-101) and past relevant work experience, I fulfill the requirements to be a “qualified person” for the purposes of NI 43-101. |
| 6. | I am responsible for Sections 1.1, 1.2, 1.11, 1.14, 1.16, 1.17, 2, 3, 4, 18, 19, 21.1, 21.1.2, 21.1.3, 21.2.2, 21.2.3, 23, 24, 25.1, 25.2, and 27 of the technical report titled “Ana Paula Project, NI 43-101 Technical Report, Amended Preliminary Feasibility Study, Guerrero, Mexico”, (the “Technical Report”), dated effective May 16, 2017, prepared for Alio Gold Inc. |
| 7. | I have not had prior involvement with the property that is the subject of the Technical Report. |
| 8. | I have not visited the Ana Paula site. |
| 9. | As of the effective date of the Technical Report, to the best of my knowledge, information and belief, the parts of the Technical Report for which I am responsible contain all scientific and technical information required to be disclosed to make the report not misleading. |
| 10. | I am independent of the issuer applying all of the tests in Section 1.5 of National Instrument 43-101. |
| 11. | I have read National Instrument 43-101 and Form 43-101F1, and those portions of the Technical Report for which I am responsible have been prepared in compliance with that instrument and form. |
| 12. | I consent to the filing of the Technical Report with any stock exchange and other regulatory authority and any publication by them for regulatory purposes, including electronic publication in the public company files on their websites accessible by the public, of the Technical Report. |
| Signed and dated this 7th day of June, 2017. | |
| (Signed) Daniel H. Neff | |
| Signature of Qualified Person | |
| Daniel H. Neff, P.E. | |
| Print name of Qualified Person |
CERTIFICATE OF QUALIFIED PERSON
I, Art S. Ibrado, PhD, PE, do hereby certify that:
| 1. | I am employed as a project manager and metallurgist at M3 Engineering & Technology Corp., 2051 W Sunset Rd, Suite 101, Tucson, AZ 85704, USA. |
| 2. | I graduated with the following degrees: |
Bachelor of Science in Metallurgical
Engineering, University of the Philippines, 1980
Master of Science
(Metallurgy), University of California, Berkeley, 1986
Doctor of Philosophy
(Metallurgy), University of California, Berkeley, 1993
| 3. | I am a registered professional engineer in the State of Arizona (No. 58140) and a qualified professional (QP) member of the Mining and Metallurgical Society of America (MMSA). |
| 4. | I have worked as a metallurgist in the academic and research setting for five years, excluding graduate school research, and in the mining industry for 13 years before joining M3 Engineering in 2009. |
| 5. | I have read the definition of “Qualified Person” set out in National Instrument 43-101 (“NI 43-101”) and certify that, by reason of my education, professional engineer registration, affiliation with a professional association (as defined in NI 43-101) and past relevant experience, I fulfill the requirements to be a “Qualified Person” for the purposes of NI 43-101. |
| 6. | I am responsible for Sections 1.10 and 17 of the technical report titled “Ana Paula Project, NI 43-101 Technical Report, Amended Preliminary Feasibility Study, Guerrero, Mexico” (the “Technical Report”), dated effective May 16, 2017, prepared for Alio Gold Inc. I have not visited the Ana Paula property. |
| 7. | At the effective date of the Technical Report, to the best of my knowledge, information and belief, the parts of the Technical Report for which I am responsible contains all scientific and technical information that is required to be disclosed to make the Technical Report not misleading. |
| 8. | I am independent of Alio Gold Inc. as independence is described in Section 1.5 of NI 43-101 and do not own any of their stocks or shares. |
| 9. | I have had no prior involvement with the Ana Paula property. |
| 10. | I have read National Instrument 43-101 and Form 43-101F1, and the Technical Report has been prepared in compliance with that instrument and form. |
| 11. | I consent to the filing of the Technical Report with any stock exchange and other regulatory authority and any publication by them for regulatory purposes, including electronic publication in the public company files on their website accessible by the public, of the Technical Report. |
Signed and dated this 7th Day of June 2017.
| (Signed) (Sealed) | |
| Art S. Ibrado, PhD, PE |
CERTIFICATE OF QUALIFIED PERSON
Taj P. Singh
I, Taj Singh, P.Eng., do hereby certify that:
| 1. | I am employed by Alio Gold Inc., Suite 615 - 700 West Pender Street, Vancouver, BC, Canada V6C 1G8. |
| 2. | I graduated with a: |
| B.A.Sc., Metallurgy & Materials Science Engineering, University of Toronto, 2002 | |
| M.A.Sc., Materials Science Engineering, McMaster University, 2005 |
| 3. | I am a Professional Engineer in good standing with the Association of Professional Engineers of Ontario (Membership #100171142) in Ontario, Canada. |
| 4. | I have worked as an engineer in the mineral industry for a total of 15 years. My experience includes open-pit and underground mining, metallurgy, process engineering, environmental and permitting studies, cost estimation, project evaluation, due diligence reviews and management of technical studies. |
| 5. | I have read the definition of “Qualified Person” set out in National Instrument 43-101 (“NI 43-101”) and certify that by reason of my education, affiliation with a professional association (as defined in NI 43-101) and past relevant work experience, I fulfill the requirements to be a “Qualified Person” for the purposes of NI 43-101. |
| 6. | I am contributing author for the preparation of the technical report titled “Ana Paula Project, NI 43-101 Technical Report, Amended Preliminary Feasibility Study", (the “Technical Report”), dated effective May 16, 2017, prepared for Alio Gold; and am responsible for Sections 1.12, 1.13, 1.15, 20, 21.1.1, 21.2.1, 22, and 26.6. I have visited the project site multiple times in 2015 and 2016. My most recent visit was December 14, 2016. |
| 7. | I have prior involvement with the property that is the subject of the Technical Report through my on-going employment with Alio Gold. |
| 8. | As Vice-President of Engineering & Project Development of Alio Gold, I directed and carried out work on the Ana Paula project on a regular basis since Alio Gold acquired the property in May 2015. |
| 9. | As of the date of this certificate, to the best of my knowledge, information and belief, the Technical Report contains all scientific and technical information that is required to be disclosed to make the Technical Report not misleading. |
| 10. | I am not independent of the issuer applying all of the tests in Section 1.5 of National Instrument 43-101. I am able to sign off on the 43-101 technical report as a QP, as Alio Gold meets the requirements of an issuing producer as defined by NI 43-101. |
| 11. | I have read National Instrument 43-101 and Form 43-101F1, and the Technical Report has been prepared in compliance with that instrument and form. |
| 12. | I consent to the filing of the Technical Report with any stock exchange and other regulatory authority and any publication by them, including electronic publication in the public company files on their websites accessible by the public, of the Technical Report. |
Signed and dated this 7th day of June, 2017.
| “signed” | |
| Signature of Qualified Person | |
| Taj P. Singh, P.Eng. | |
| Print Name of Qualified Person |
CERTIFICATE OF QUALIFIED PERSON
I, Andrew Kelly, P.Eng., do hereby certify that:
| 1. | I am employed as Vice President, Technical Services and Senior Metallurgist with: |
Blue Coast Research Ltd. |
|
| 2. | I am a graduate of the University of New Brunswick and obtained a Bachelor of Science in Engineering (Chemical) degree in 2003. |
| 3. | I am a licensed Professional Engineer with the Association of Professional Engineers and Geoscientists of British Columbia (License No. 39900) and with the Association of Professional Engineers of Ontario (License No.100073664) |
| 4. | I have worked as metallurgist for for a total of 14 years. My experience includes both plant operations and laboratory settings and covers base and precious metals. |
| 5. | I have read the definition of “Qualified Person” set out in National Instrument 43-101 (“NI 43-101”) and certify that by reason of my education, affiliation with a professional association (as defined in NI 43-101) and past relevant work experience, I fulfill the requirements to be a “Qualified Person” for the purposes of NI 43-101. |
| 6. | I am a contributing author for the preparation of the technical report titled “Ana Paula Project, NI 43-101 Technical Report, Amended Preliminary Feasibility Study", (the “Technical Report”), dated effective May 16, 2017 and issued June 07, 2017, prepared for Alio Gold Inc.; and am responsible for Sections 1.5, 13, 25.5, and 26.5. |
| 7. | I have not visited the property. |
| 8. | I have not had prior involvement with the property that is the subject of the Technical Report. |
| 9. | As of the date of this certificate, to the best of my knowledge, information and belief, the Technical Report contains all scientific and technical information that is required to be disclosed to make the Technical Report not misleading. |
| 10. | I am independent of the issuer applying all of the tests in Section 1.5 of National Instrument 43-101. |
| 11. | I have read National Instrument 43-101 and Form 43-101F1, and the Technical Report has been prepared in compliance with that instrument and form. |
| 12. | I consent to the filing of the Technical Report with any stock exchange and other regulatory authority and any publication by them, including electronic publication in the public company files on their websites accessible by the public, of the Technical Report. |
Signed and dated this 7th day of June, 2017.
| “signed” | |
| Signature of Qualified Person | |
| Andrew Kelly | |
| Print Name of Qualified Person |
CERTIFICATE OF QUALIFIED PERSON
Joseph Rosaire Pierre Desautels
I, Joseph Rosaire Pierre Desautels, P.Geo. do hereby certify that:
| 1. | I am the Principal Resource Geologist of: |
AGP Mining Consultants Inc.
#246-132 Commerce Park Dr., Unit K
Barrie, ON L4N 0Z7
| 2. | I graduated with from Ottawa University (B.Sc. Hons., 1978). |
|
| 3. | I am a member in good standing of the Association of Professional Geoscientists of Ontario (Registration #1362). |
|
| 4. | I have practiced my profession in the mining industry continuously since graduation. |
|
| 5. | I have worked as a geologist for a total of 31years. My experience in the mining sector includes covering database, mine geology, grade control, and resource modelling. I have been involved in numerous projects around the world in both base metals and precious metals deposits. |
|
| 6. | I have read the definition of “Qualified Person” set out in National Instrument 43-101 (“NI 43-101”) and certify that by reason of my education, affiliation with a professional association (as defined in NI 43-101) and past relevant work experience, I fulfill the requirements to be a “Qualified Person” for the purposes of NI 43-101. |
|
| 7. | I am a contributing author for the preparation of the technical report titled “Ana Paula Project, NI 43-101 Technical Report, Amended Preliminary Feasibility Study", (the “Technical Report”), dated effective May 16, 2017 and issued June 07, 2017, prepared for Alio Gold Inc.; and am responsible for Sections 1.3, 1.4, 1.6, 5, 6, 7, 8, 9, 10, 11, 12, 14, 25.3, 26.1, and 26.2. I have visited the project site on December 13 and 14, 2016. |
|
| 8. | I have no prior involvement with the property that is the subject of the Technical Report. |
|
| 9. | As of the date of this certificate, to the best of my knowledge, information and belief, the Technical Report contains all scientific and technical information that is required to be disclosed to make the Technical Report not misleading. |
|
| 10. | I am independent of the issuer applying all of the tests in Section 1.5 of National Instrument 43-101. |
|
| 11. | I have read National Instrument 43-101 and Form 43-101F1, and the Technical Report has been prepared in compliance with that instrument and form. |
|
| 12. | I consent to the filing of the Technical Report with any stock exchange and other regulatory authority and any publication by them, including electronic publication in the public company files on their websites accessible by the public, of the Technical Report. |
Signed and dated this 7th day of June 2017.
| “signed” | |
| Signature of Qualified Person | |
| Pierre Desautels | |
| Print Name of Qualified Person |
CERTIFICATE OF QUALIFIED PERSON
Gordon Ross Zurowski
I, Gordon Zurowski, P.Eng, do hereby certify that:
| 1. | I am a Principal Mine Engineer of: |
AGP Mining Consultants Inc.
132
Commerce Park Dr., Unit K, Suite 246
Barrie, Ontario, Canada
L4N 0Z7
| 2. | I am a graduate of the University of Saskatchewan, B.Sc. in Geological Engineering, 1989. |
| 3. | I am member in good standing of the Association of Professional Engineers of Ontario, Registration #100077750. |
| 4. | I have practiced my profession in the mining industry continuously since graduation. |
| 5. | I have read the definition of “Qualified Person” set out in National Instrument 43-101 (“NI 43-101”) and certify that by reason of my education, affiliation with a professional association (as defined in NI 43-101) and past relevant work experience, I fulfill the requirements to be a “Qualified Person” for the purposes of NI 43-101. |
| 6. | My relevant experience includes the design and evaluation of open pit mines for over 25 years. |
| 7. | I am a contributing author for the preparation of the technical report titled “Ana Paula Project, NI 43-101 Amended Preliminary Feasibility Study", (the “Technical Report”), dated effective May 16, 2017 and issued June 07, 2017, prepared for Alio Gold Inc.; and am responsible for Sections 1.7, 1.8, 1.9, 15, 16.1, 16.2, 16.4 – 16.11, 25.4, and 26.3. I visited the project site on December 13th and 14th, 2016. |
| 8. | I have not had any prior involvement with the property that is the subject of the Technical Report. |
| 9. | As of the date of this certificate, to the best of my knowledge, information and belief, the Technical Report contains all scientific and technical information that is required to be disclosed to make the Technical Report not misleading. |
| 10. | I am independent of the issuer applying all of the tests in Section 1.5 of National Instrument 43-101. |
| 11. | I have read National Instrument 43-101 and Form 43-101F1, and the Technical Report has been prepared in compliance with that instrument and form. |
| 12. | I consent to the filing of the Technical Report with any stock exchange and other regulatory authority and any publication by them, including electronic publication in the public company files on their websites accessible by the public, of the Technical Report. |
Signed and dated this 7th day of June 2017 at Stouffville, Ontario, Canada.
“signed”
Gordon Zurowski, P.Eng
CERTIFICATE OF QUALIFIED PERSON
Gilberto Dominguez
I, Gilberto Dominguez, P.E., do hereby certify that:
| 1. | I am Senior Vice-President, Civil Engineering of: Knight Piésold and Co. |
Broadway 1999, suite 600 |
|
| 2. | I graduated in 1994 from Washington University in St. Louis with a Master of Science in Civil Engineering, in 1992 from the Pennsylvania State University also with a Master of Science in Civil Engineering, and from the Pontificia Universidad Católica del Perú, with a Bachelor of Science in Civil Engineering in 1989. |
| 3. | I am a Registered Professional Engineer in good standing in the state of Colorado (registration number 32075). I am also registered as a professional engineer in Peru as a Civil Engineer (registration number 63974). |
| 4. | I have worked as a Civil Engineer for a total of 27 years. My experience includes design of heap leach pads, waste and tailings management facilities, dams and reservoirs, geotechnical studies, construction management and quality assurance/control, environmental and permitting processes, and project management. |
| 5. | I have read the definition of “Qualified Person” set out in National Instrument 43-101 (“NI 43-101”) and certify that by reason of my education, affiliation with a professional association (as defined in NI 43-101) and past relevant work experience, I fulfill the requirements to be a “Qualified Person” for the purposes of NI 43-101. |
| 6. | I am a contributing author for the preparation of the technical report titled “Ana Paula Project, NI 43-101 Technical Report, Amended Preliminary Feasibility Study, Guerrero, Mexico", (the “Technical Report”), dated effective May 16, 2017, prepared for Alio Gold Inc.; and I am responsible for Sections 18.2 and 18.3, 21.1.3, and 26.4. |
| 7. | I have not visited the project site. |
| 8. | I have not have had prior involvement with the property that is the subject of the Technical Report. |
| 9. | As of the date of this certificate, to the best of my knowledge, information and belief, the Technical Report contains all scientific and technical information that is required to be disclosed to make the Technical Report not misleading. |
| 10. | I am independent of the issuer applying all of the tests in Section 1.5 of National Instrument 43-101. |
| 11. | I have read National Instrument 43-101 and Form 43-101F1, and the Technical Report has been prepared in compliance with that instrument and form. |
| 12. | I consent to the filing of the Technical Report with any stock exchange and other regulatory authority and any publication by them, including electronic publication in the public company files on their websites accessible by the public, of the Technical Report. |
Signed and dated this 7th day of June, 2017.
| “signed” | |
| Signature of Qualified Person | |
| Gilberto Dominguez | |
| Print Name of Qualified Person |
CERTIFICATE OF QUALIFIED PERSON
James A. Cremeens
I, James A. Cremeens, P.E., P.G., do hereby certify that:
| 1. | I am Chief Geotechnical Engineer – Senior Executive Manager of: Knight Piésold and Company |
| 2. | I graduated with a Bachelor’s of Science degree in Geology (University of Illinois - Urbana-Champaign - 1985) and Master of Science degree in Geology (Rock Mechanics specialization in combination with the Geotechnical Engineering department) from the University of Illinois - Urbana-Champaign (1990). |
| 3. | I am a Registered Professional Engineer in the State of Colorado (License No. 0040683). I am also a Registered Professional Engineer in the State of Nevada (License No. 022225) and the State of New York (License No. 085282). I am also a Registered Professional Geologist in the State of Wyoming (License No. PG-2957). |
| 4. | I have worked continuously in the field of geotechnical engineering with numerous domestic and international mining projects and mining operations since 1990. I have been involved in the evaluation of pit slope stability for large open pits at various levels: preliminary studies, preliminary economic assessments, pre-feasibility studies, feasibility studies, design level evaluations and technical due diligence reviews. |
| 5. | I have read the definition of “Qualified Person” set out in National Instrument 43-101 (“NI 43-101”) and certify that by reason of my education, affiliation with a professional association (as defined in NI 43-101) and past relevant work experience, I fulfill the requirements to be a “Qualified Person” for the purposes of NI 43-101. |
| 6. | I am a contributing author for the preparation of the technical report titled “Ana Paula Project, NI 43-101 Technical Report, Amended Preliminary Feasibility Study, Guerrero, Mexico", (the “Technical Report”), dated effective May 16, 2017 and issued June 07, 2017, prepared for Alio Gold Inc.; and am responsible for Sections 16.3, 16.12, 25.4 and 26.3. I have visited the project site on September 27 and 28, 2016. |
| 7. | I have not have had prior involvement with the property that is the subject of the Technical Report. |
| 8. | As of the date of this certificate, to the best of my knowledge, information and belief, the Technical Report contains all scientific and technical information that is required to be disclosed to make the Technical Report not misleading. |
| 9. | I am independent of the issuer applying all of the tests in Section 1.5 of National Instrument 43-101. |
| 10. | I have read National Instrument 43-101 and Form 43-101F1, and the Technical Report has been prepared in compliance with that instrument and form. |
| 11. | I consent to the filing of the Technical Report with any stock exchange and other regulatory authority and any publication by them, including electronic publication in the public company files on their websites accessible by the public, of the Technical Report. |
Signed and dated this 7th day of June, 2017.
| “signed” | |
| Signature of Qualified Person | |
| James A. Cremeens | |
| Print Name of Qualified Person |


Serious News for Serious Traders! Try StreetInsider.com Premium Free!
You May Also Be Interested In
- Form 8.5 (EPT/RI) - Abrdn European Logistics Income Plc
- REBELXL - A Revolutionary Reformer Pilates Franchise Announce the Grand Opening of Its First Studio in Wyckoff, New Jersey
- Falcon Oil & Gas Ltd - Full Year Results
Create E-mail Alert Related Categories
SEC FilingsSign up for StreetInsider Free!
Receive full access to all new and archived articles, unlimited portfolio tracking, e-mail alerts, custom newswires and RSS feeds - and more!
