



Form 497K PRUDENTIAL SECTOR FUNDS,
 Tweet
Tweet Share
Share E-mail
PGIM
INVESTMENTS | Bringing you the investment managers of Prudential Financial, Inc.
PGIM
Jennison Utility Fund
Formerly, Prudential
Jennison Utility Fund
| A: PRUAX | B: PRUTX | C: PCUFX | R: JDURX | Z: PRUZX | R6†: PRUQX |
SUMMARY PROSPECTUS
| January 26, 2018 (AS REISSUED JUNE 11, 2018)
Before you invest, you may want
to review the Fund's Prospectus, which contains more information about the Fund and its risks. You can find the Fund's Prospectus, Statement of Additional Information (SAI), Annual Report and other information
about the Fund online at www.pgiminvestments.com/prospectus. You can also get this information at no cost by calling 1-800-225-1852 or by sending an e-mail to: [email protected]. The Fund's Prospectus and SAI, both
dated January 26, 2018 (AS REISSUED JUNE 11, 2018), as supplemented and amended from time to time, and the Fund's most recent shareholder report, dated November 30, 2017, are all incorporated by reference into
(legally made a part of) this Summary Prospectus.
INVESTMENT OBJECTIVE
The investment objective of the Fund is total return through a combination of capital appreciation and current income.
FUND FEES AND EXPENSES
The tables below describe the sales charges, fees
and expenses that you may pay if you buy and hold shares of the Fund. You may qualify for sales charge discounts if you and an eligible group of related investors purchase, or agree to purchase in the future, $25,000
or more in shares of the Fund or other funds in the PGIM Funds family. More information about these discounts as well as other waivers or discounts is available from your financial professional and is explained in
Reducing or Waiving Class A's and Class C’s Sales Charges on page 25 of the Fund's Prospectus, Appendix A: Waivers and Discounts Available From Certain Financial Intermediaries on page 47 of the Fund's Prospectus and in Rights of Accumulation on page 64 of the Fund's Statement of Additional Information (SAI).
| Shareholder Fees (paid directly from your investment) | ||||||
| Class A | Class B | Class C | Class R | Class Z | Class R6† | |
| Maximum sales charge (load) imposed on purchases (as a percentage of offering price) | 5.50% | None | None | None | None | None |
| Maximum deferred sales charge (load) (as a percentage of the lower of original purchase price or net asset value at redemption) | 1.00% | 5.00% | 1.00% | None | None | None |
| Maximum sales charge (load) imposed on reinvested dividends and other distributions | None | None | None | None | None | None |
| Redemption fees | None | None | None | None | None | None |
| Exchange fee | None | None | None | None | None | None |
| Maximum account fee (accounts under $10,000) | $15 | $15 | $15 | None | None* | None |
*Direct Transfer Agent
Accounts holding under $10,000 of Class Z shares are subject to the $15 fee.
†Formerly known as Class Q.
| Annual Fund Operating Expenses (expenses that you pay each year as a percentage of the value of your investment) | ||||||
| Class A | Class B | Class C | Class R | Class Z | Class R6(1) | |
| Management fees | 0.42% | 0.42% | 0.42% | 0.42% | 0.42% | 0.42% |
| Distribution and service (12b-1) fees | 0.30% | 1.00% | 1.00% | 0.75% | None | None |
| Other expenses(2) | 0.10% | 0.38% | 0.14% | 0.17% | 0.12% | 1.63% |
| Total annual Fund operating expenses | 0.82% | 1.80% | 1.56% | 1.34% | 0.54% | 2.05% |
| Fee waiver and/or expense reimbursement | None | (0.02)% | None | (0.25)% | None | (1.53)% |
| Total annual Fund operating expenses after fee waiver and/or expense reimbursement(3,4) | 0.82% | 1.78% | 1.56% | 1.09% | 0.54% | 0.52% |
(1) Formerly known as Class Q.
(2) Other expenses are based on estimates.
(3) PGIM Investments LLC (PGIM Investments) has contractually agreed, through March 31, 2020, to limit transfer agency, shareholder servicing, sub-transfer agency, and blue sky
fees, as applicable, to the extent that such fees cause the Total Annual Fund Operating Expenses to exceed 1.78% of average daily net assets for Class B shares or 0.52% of average daily net assets for Class R6 shares.
This contractual expense limitation excludes interest, brokerage, taxes (such as income and foreign withholding taxes, stamp duty and deferred tax expenses), acquired fund fees and expenses, extraordinary expenses,
and certain other Fund expenses such as dividend and interest expense and broker charges on short sales. Fees and/or expenses

waived and/or reimbursed by PGIM Investments
may be recouped by PGIM Investments within the same fiscal year during which such waiver and/or reimbursement is made if such recoupment can be realized without exceeding the expense limit in effect at the time of the
recoupment for that fiscal year. This expense limitation may not be terminated prior to March 31, 2020 without the prior approval of the Fund's Board of Directors.
(4) The distributor has contractually agreed through March 31, 2019 to reduce its distribution and service (12b-1) fees for Class R shares to 0.50% of the average daily net assets
of the Class R shares. This waiver may not be terminated prior to March 31, 2019 without the prior approval of the Fund's Board of Directors.
Example. The following hypothetical example is intended to help you compare the cost of investing in the Fund with the cost of investing in other mutual funds. It assumes that you invest $10,000 in
the Fund for the time periods indicated and then, except as indicated, redeem all your shares at the end of those periods. It assumes a 5% return on your investment each year, that the Fund's operating expenses remain
the same (except that fee waivers or reimbursements, if any, are only reflected in the 1-Year figures) and that all dividends and distributions are reinvested. Your actual costs may be higher or lower.
| If Shares Are Redeemed | If Shares Are Not Redeemed | |||||||
| Share Class | 1 Year | 3 Years | 5 Years | 10 Years | 1 Year | 3 Years | 5 Years | 10 Years |
| Class A | $629 | $797 | $980 | $1,508 | $629 | $797 | $980 | $1,508 |
| Class B | $681 | $862 | $1,071 | $1,733 | $181 | $562 | $971 | $1,733 |
| Class C | $259 | $493 | $850 | $1,856 | $159 | $493 | $850 | $1,856 |
| Class R | $111 | $400 | $710 | $1,591 | $111 | $400 | $710 | $1,591 |
| Class Z | $55 | $173 | $302 | $677 | $55 | $173 | $302 | $677 |
| Class R6† | $53 | $336 | $810 | $2,124 | $53 | $336 | $810 | $2,124 |
†Formerly known as Class Q.
Portfolio Turnover. The Fund pays transaction costs, such as commissions, when it buys and sells securities (or “turns over” its portfolio). A higher portfolio turnover rate may indicate higher
transaction costs and may result in higher taxes when Fund shares are held in a taxable account. These costs, which are not reflected in annual fund operating expenses or in the example, affect the Fund's performance.
During the Fund's most recent fiscal year, the Fund's portfolio turnover rate was 24% of the average value of its portfolio.
INVESTMENTS, RISKS AND
PERFORMANCE
Principal Investment Strategies. The Fund seeks investments whose prices will increase as well as pay the Fund dividends and other income. The Fund’s investment subadviser normally invests at least 80% of the Fund's
investable assets in equity and equity-related and investment-grade debt securities of utility companies. The term “investable assets” refers to the Fund's net assets plus any borrowings for investment
purposes. The Fund's investable assets will be less than its total assets to the extent that it has borrowed money for non-investment purposes, such as to meet anticipated redemptions.
The Fund buys equity and
equity-related securities, including common stocks; nonconvertible preferred stocks; convertible securities—like bonds, corporate notes and preferred stocks—that can convert into the company's common
stock, the cash value of common stock, or some other equity security; American Depositary Receipts (ADRs); warrants and rights that can be exercised to obtain stocks; equity securities of real estate investment trusts
(REITs); investments in various types of business ventures, including partnerships and joint ventures; master limited partnerships (MLPs); and similar securities. The Fund invests in companies of any market
capitalization.
The Fund’s investment in debt
securities, including corporate and government bonds, is generally limited to those rated investment-grade by a major rating service (such as BBB or above by S&P Global Ratings (S&P) or Baa or above by Moody's
Investors Service, Inc. (Moody's)) or, if not rated, to those the subadviser believes are of comparable quality.
Utility companies include electric
utilities, gas utilities, water utilities, multi-utilities, independent power producers, diversified telecommunication services, wireless telecommunication services, and oil & gas storage & transportation.
Some of these securities are issued by foreign companies. The subadviser may invest more than 5% of the Fund's assets in any one issuer. The Fund participates in the initial public offering (IPO) market. The Fund may
invest up to 50% of its investable assets in foreign securities.
In deciding which stocks to buy,
the subadviser uses what is known as a value investment style. That is, the subadviser invests in stocks that it believes are undervalued, given the company's earnings, cash flow or asset values. The subadviser looks
for catalysts that will help unlock inherent value. A number of conditions can warrant the sale of an existing position, including (1) the stock has reached its price target; (2) subsequent events invalidate the
subadviser’s investment thesis; (3) the catalysts it expected to narrow the gap between the stock price and what it believes to be the true worth of the company have passed or no longer exist; or (4) the stock
price declines to below what the subadviser had thought to be the reasonable worst-case scenario.
Principal Risks. All investments have risks to some degree. An investment in the Fund is not guaranteed to achieve its investment objective; is not a deposit with a bank; is not insured, endorsed or
guaranteed by the Federal Deposit Insurance Corporation or any other government agency; and is subject to investment risks, including possible loss of your original investment.
Utility Sector Risk. The Fund is subject to risks of the utility industry, such as inflation and regulatory changes, due to its concentration in utility securities. When interest rates go up, the value of
securities issued by utility companies historically has gone down. Although the average dividend yield of utility industry stocks has been higher than those of other companies, the total return of utility securities
has historically underperformed those of industrial companies. In most countries and localities, the utility industry is regulated by governmental entities, which can increase costs and delays for new projects and
make it difficult to pass increased costs on to consumers. In certain areas, deregulation of utilities has resulted in increased competition and reduced profitability for certain companies, and increased the risk that
a particular company will become bankrupt or fail completely. Reduced profitability, as well as new uses for or additional need of funds (such as for expansion, operations or stock buybacks), could result in reduced
dividend payout rates for utility companies. In addition, utility companies face the risk of increases in the cost and reduced availability of fuel (such as oil, coal, natural gas or nuclear energy) and potentially
high interest costs for borrowing to finance new projects. As a sector fund, the Fund's holdings can vary significantly from broad market indexes and the performance of the Fund can deviate from the performance
indexes.
Equity and Equity-Related Securities
Risks. The value of a particular security could go down and you could lose money. In addition to an individual security losing value, the value of the equity markets or a sector in which the Fund
invests could go down. The Fund's holdings can vary significantly from broad market indexes and the performance of the Fund can deviate from the performance of these indexes. Different parts of a market can react
differently to adverse issuer, market, regulatory, political and economic developments.
Market Risk. Securities markets may be volatile and the market prices of the Fund’s securities may decline. Securities fluctuate in price based on changes in an issuer’s financial condition
and overall market and economic conditions. If the market prices of the securities owned by the Fund fall, the value of your investment in the Fund will decline.
Value Style Risk. Since the Fund follows a value investment style, there is the risk that the value style may be out of favor for a period of time, that the market will not recognize a security's intrinsic
value for a long time or that a stock judged to be undervalued may not be undervalued.
Foreign Securities Risk. The Fund’s investments in securities of foreign issuers or issuers with significant exposure to foreign markets involve additional risk. Foreign countries in which the Fund may
invest may have markets that are less liquid, less regulated and more volatile than US markets. The value of the Fund’s investments may decline because of factors affecting the particular issuer as well as
foreign markets and issuers generally, such as unfavorable government actions, and political or financial instability. Lack of information may also affect the value of these securities.
Geographic Concentration Risk. The Fund’s performance may be closely tied to the market, economic, political, regulatory or other conditions in the countries or regions in which the Fund invests. This can result
in more pronounced risks based upon conditions that impact one or more countries or regions more or less than other countries or regions.
Currency Risk. The Fund's net asset value could decline as a result of changes in exchange rates, which could adversely affect the Fund’s investments in currencies, or in securities that trade in,
and receive revenues related to currencies, or in derivatives that provide exposure to currencies. Certain foreign countries may impose restrictions on the ability of issuers of foreign securities to make payment of
principal and interest or dividends to investors located outside the country, due to blockage of foreign currency exchanges or otherwise.
Credit Risk. This is the risk that the issuer, the guarantor or the insurer of a fixed-income security, or the counterparty to a contract may be unable or unwilling to make timely principal and interest
payments or to otherwise honor its obligations. Additionally, the securities could lose value due to a loss of confidence in the ability of the issuer, guarantor, insurer or counterparty to pay back debt. The longer
the maturity and the lower the credit quality of a bond, the more sensitive it is to credit risk.
Non-diversification Risk. The Fund is non-diversified for purposes of the Investment Company Act of 1940 (the “1940 Act”). This means that the Fund may invest a greater percentage of its assets in the
securities of a single company or other issuer than a diversified fund. Investing in a non-diversified fund involves greater risk than investing in a diversified fund because a loss resulting from the decline in value
of any one security may represent a greater portion of the total assets of a non-diversified fund.
Management Risk. The value of your investment may decrease if judgments by the subadviser about the attractiveness, value or market trends affecting a particular security, industry or sector or about market
movements are incorrect.
Initial Public Offerings Risk. The volume of IPOs and the levels at which the newly issued stocks trade in the secondary market are affected by the performance of the stock market overall. If IPOs are brought to the
market, availability may be limited and if the Fund desires to acquire shares in such an offering, it may not be able to buy any shares at the offering price, or if it is able to buy shares, it may not be able to buy
as many shares at the offering price as it would like. The prices of securities involved in IPOs are often subject to greater and more unpredictable price changes than more established stocks. Such unpredictability
can have a dramatic impact on the Fund's performance (higher or lower) and any assumptions by investors based on the affected performance may be unwarranted. In addition, as Fund assets grow, the impact of IPO
investments on performance will decline, which could reduce total returns.
Market Capitalization Risk. The Fund may invest in companies of any market capitalization. Generally, the stock prices of small- and medium-sized companies are less stable than the prices of large company stocks and
may present greater risks. Large capitalization companies as a group could fall out of favor with the market, causing the Fund to underperform compared to investments that focus on smaller capitalized
companies.
Economic and Market Events Risk. Events in the US and global financial markets, including actions taken by the US Federal Reserve or foreign central banks to stimulate or stabilize economic growth, may at times result in
unusually high market volatility, which could negatively impact performance. Reduced liquidity in credit and fixed income markets could adversely affect issuers worldwide.
Risk of Increase in Expenses. Your actual cost of investing in the Fund may be higher than the expenses shown in the expense table for a variety of reasons. For example, expense ratios may be higher than those shown if
average net assets decrease. Net assets are more likely to decrease and Fund expense ratios are more likely to increase when markets are volatile. Active and frequent trading of Fund securities can increase
expenses.
Performance. The following bar chart shows the Fund's performance for Class Z shares for each full calendar year of operations or for the last 10 calendar years, whichever is shorter. The
following table shows the average annual returns of each of the Fund’s share classes and also compares the Fund’s performance with the average annual total returns of an index or other benchmark and a
group of similar mutual funds. The bar chart and table demonstrate the risk of investing in the Fund by showing how returns can change from year to year.
Past performance (before and after
taxes) does not mean that the Fund will achieve similar results in the future. Updated Fund performance information is available online at www.pgiminvestments.com.
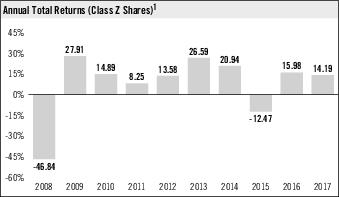
1 Prior to this year, the annual returns bar chart displayed returns for the Fund’s Class A shares. The Fund now shows annual returns for Class Z shares in light of the
relative growth of assets in this share class.
| Average Annual Total Returns % (including sales charges) (as of 12-31-17) | |||
| Return Before Taxes | One Year | Five Years | Ten Years |
| Class A shares | 7.53% | 10.55% | 4.57% |
| Class B shares | 8.05% | 10.90% | 4.43% |
| Class C shares | 11.98% | 11.03% | 4.43% |
| Class R shares | 13.57% | 11.57% | 4.95% |
| Class R6 shares*† | N/A | N/A | N/A |
| Class Z Shares % | |||
| Return Before Taxes | 14.19% | 12.16% | 5.48% |
| Return After Taxes on Distributions | 12.99% | 10.07% | 4.28% |
| Return After Taxes on Distribution and Sale of Fund Shares | 8.99% | 9.41% | 4.20% |
° After-tax
returns are calculated using the highest historical individual federal marginal tax rates and do not reflect the impact of state and local taxes. Actual after-tax returns depend on an investor's tax situation and may
differ from those shown. After-tax returns shown are not relevant to investors who hold their Fund shares through tax-deferred arrangements, such as 401(k) plans or individual retirement accounts. After-tax returns
are shown only for Class Z shares. After-tax returns for other classes will vary due to differing sales charges and expenses.
* Average annual returns are not
shown for Class R6 shares, because Class R6 shares are new. Performance for Class R6 shares will be included after Class R6 shares have been in existence for a full calendar year.
†Formerly known as Class Q.
| Index % (reflects no deduction for fees, expenses or taxes) | |||
| S&P 500 Utility Total Return Index | 12.11% | 12.62% | 6.31% |
| S&P 500 Index | 21.82% | 15.78% | 8.49% |
| Lipper Average % (reflects no deduction for sales charges or taxes) | |||
| Lipper Utility Funds Average | 12.99% | 10.16% | 4.98% |
MANAGEMENT OF THE FUND
| Investment Manager | Subadviser | Portfolio Managers | Title | Service Date |
| PGIM Investments LLC | Jennison Associates LLC | Ubong “Bobby” Edemeka | Managing Director | March 2005 |
| Shaun Hong, CFA | Managing Director | September 2000 | ||
| Teresa Ho Kim, CFA | Managing Director | January 2013 |
BUYING AND SELLING FUND
SHARES
| Class A** | Class C** | Class R** | Class Z** | Class R6† | |
| Minimum initial investment* | $2,500 | $2,500 | None | Institutions: $5 million Group Retirement Plans: None | Institutions: $5 million Group Retirement Plans: None |
| Minimum subsequent investment* | $100 | $100 | None | None | None |
* Class B shares are closed
to new purchases except for exchanges from Class B shares of another fund. Please see “How to Buy, Sell and Exchange Fund Shares—Closure of Class B Shares” in the Prospectus for more information.
** Certain share classes were generally closed to investments by new group retirement plans effective on or about June 1, 2018. Please see “How to Buy, Sell and Exchange Fund Shares—Closure of Certain Share Classes to New Group Retirement Plans” in the Prospectus for more information.
** Certain share classes were generally closed to investments by new group retirement plans effective on or about June 1, 2018. Please see “How to Buy, Sell and Exchange Fund Shares—Closure of Certain Share Classes to New Group Retirement Plans” in the Prospectus for more information.
†Formerly known as Class Q.
For Class A and Class C shares, the
minimum initial investment for retirement accounts and custodial accounts for minors is $1,000 and the minimum subsequent investment is $100. For Class A and Class C shares, the minimum initial and subsequent
investment for Automatic Investment Plan purchases is $50. Class R6 shares and Class R shares are generally not available for purchase by individuals. Class Z shares may be purchased by certain individuals, subject to
minimum investment and/or other requirements. Please see “How to Buy, Sell and Exchange Fund Shares—How to Buy Shares—Qualifying for Class R Shares,” “—Qualifying for Class Z
Shares,” and “—Qualifying for Class R6 Shares” in the Prospectus for purchase eligibility requirements.
Your financial intermediary may
impose different investment minimums. You can purchase or redeem shares on any business day that the Fund is open through the Fund's transfer agent or through servicing agents, including brokers, dealers and other
financial intermediaries appointed by the distributor to receive purchase and redemption orders. Current shareholders may also purchase or redeem shares through the Fund's website or by calling (800) 225-1852.
TAX INFORMATION
Dividends, Capital Gains and Taxes. The Fund's dividends and distributions are taxable and will be taxed as ordinary income or capital gains, unless you are investing through a tax-deferred arrangement, such as a 401(k) plan
or an individual retirement account. Such tax-deferred arrangements may be taxed later upon withdrawal of monies from those arrangements.
PAYMENTS TO FINANCIAL
INTERMEDIaries
If you purchase Fund shares through a financial
intermediary such as a broker-dealer, bank, retirement recordkeeper or other financial services firm, the Fund or its affiliates may pay the financial intermediary for the sale of Fund shares and/or for services to
shareholders. This may create a conflict of interest by influencing the financial intermediary or its representatives to recommend the Fund over another investment. Ask your financial intermediary or representative or
visit your financial intermediary’s website for more information.
Notes
Notes

| ||
| By Mail: | Prudential Mutual Fund Services LLC, PO Box 9658, Providence, RI 02940 | |
| By Telephone: | 800-225-1852 or 973-367-3529 (outside the US) | |
| On the Internet: | www.pgiminvestments.com |
MF105A
Serious News for Serious Traders! Try StreetInsider.com Premium Free!
You May Also Be Interested In
- LVMH: Share transactions disclosure
- Clutch Launches Clutch Guarantee, a Risk-Free Way to Hire a Service Provider
- University of Florida Selects Myno Carbon for Innovative Sargassum-to-Biochar Water Quality Research
Create E-mail Alert Related Categories
SEC FilingsSign up for StreetInsider Free!
Receive full access to all new and archived articles, unlimited portfolio tracking, e-mail alerts, custom newswires and RSS feeds - and more!
