

Form 425 CC Neuberger Principal Filed by: CC Neuberger Principal Holdings I
 Tweet
Tweet Share
Share
UNITED STATES
SECURITIES AND EXCHANGE COMMISSION
Washington, D.C. 20549
FORM 8-K
CURRENT REPORT
PURSUANT TO SECTION 13 OR 15(d)
OF THE SECURITIES EXCHANGE ACT OF 1934
Date of Report (Date of earliest event reported): November 30, 2020
CC NEUBERGER
PRINCIPAL HOLDINGS I
(Exact name of registrant as specified in its charter)
| Cayman Islands (State or other jurisdiction of incorporation) |
001-39272 (Commission File Number) |
98-1526024 (IRS Employer Identification No.) |
200 Park Avenue, 58th Floor
New York, New York 10166
(Address of principal executive offices, including Zip Code)
(212) 355-5515
(Registrant’s Telephone Number, Including Area Code)
N/A
(Former name or former address, if changed since last report.)
Check the appropriate box below if the Form 8-K filing is intended to simultaneously satisfy the filing obligation of the registrant under any of the following provisions (see General Instruction A.2. below):
x Written communications pursuant to Rule 425 under the Securities Act (17 CFR 230.425)
¨ Soliciting material pursuant to Rule 14a-12 under the Exchange Act (17 CFR 240.14a-12)
¨ Pre-commencement communications pursuant to Rule 14d-2(b) under the Exchange Act (17 CFR 240.14d-2(b))
¨ Pre-commencement communications pursuant to Rule 13e-4(c) under the Exchange Act (17 CFR 240.13e-4(c))
Securities registered pursuant to Section 12(b) of the Act
|
Title of each class |
Trading Symbol(s) |
Name of each exchange on which registered |
| Units, each consisting of one Class A ordinary share, $0.0001 par value, and one-third of one redeemable warrant | PCPL.U | New York Stock Exchange |
| Class A ordinary shares included as part of the units | PCPL | New York Stock Exchange |
| Warrants included as part of the units, each whole warrant exercisable for one Class A ordinary share at an exercise price of $11.50 | PCPL WS | New York Stock Exchange |
Indicate by check mark whether the registrant is an emerging growth company as defined in Rule 405 of the Securities Act of 1933 or Rule 12b-2 of the Securities Exchange Act of 1934.
Emerging growth company x
If an emerging growth company, indicate by check mark if the registrant has elected not to use the extended transition period for complying with any new or revised financial accounting standards provided pursuant to Section 13(a) of the Exchange Act ¨
| Item 7.01 | Regulation FD Disclosure. |
Attached as Exhibit 99.1 to this Current Report on Form 8-K, and incorporated into this Item 7.01 by reference, is an Analyst Day presentation being used in connection with the proposed business combination (the “Business Combination”) between CC Neuberger Principal Holdings I (“CCNB1”) and E2open Holdings, LLC (“E2open”).
The foregoing (including Exhibit 99.1) is being furnished pursuant to Item 7.01 and will not be deemed to be filed for purposes of Section 18 of the Securities Exchange Act, of 1934, as amended (the “Exchange Act”) or otherwise be subject to the liabilities of that section, nor will it be deemed to be incorporated by reference in any filing under the Securities Act of 1933, as amended (the “Securities Act”), or the Exchange Act.
Additional Information
In connection with the Business Combination, including the domestication of CCNB1 as a Delaware corporation, CCNB1 filed with the Securities and Exchange Commission (the “SEC”), on November 6, 2020, a registration statement on Form S-4 containing a preliminary proxy statement and a preliminary prospectus of CCNB1, and after the registration statement is declared effective, CCNB1 will mail a definitive proxy statement/prospectus relating to the Business Combination to its shareholders. This Current Report on Form 8-K does not contain all the information that should be considered concerning the Business Combination and is not intended to form the basis of any investment decision or any other decision in respect of the Business Combination. CCNB1’s shareholders and other interested persons are advised to read the preliminary proxy statement/prospectus and, when available, any amendments thereto, the definitive proxy statement/prospectus and other documents filed in connection with the Business Combination, as these materials will contain important information about CCNB1, E2open and the Business Combination. When available, the definitive proxy statement/prospectus and other relevant materials for the Business Combination will be mailed to shareholders of CCNB1 as of a record date to be established for voting on the Business Combination. Shareholders are able to obtain copies of the preliminary proxy statement/prospectus and, once available, the definitive proxy statement/prospectus and other documents filed with the SEC, without charge, at the SEC’s website at www.sec.gov, or by directing a request to: CC Neuberger Principal Holdings I, 200 Park Avenue, 58th Floor, New York, NY 10166.
Participants in the Solicitation
CCNB1 and its directors and executive officers may be deemed participants in the solicitation of proxies from CCNB1’s shareholders with respect to the Business Combination. A list of the names of those directors and executive officers and a description of their interests in CCNB1 is contained in CCNB1’s final prospectus related to its initial public offering, dated April 23, 2020, which was filed with the SEC and is available free of charge at the SEC’s website at www.sec.gov, or by directing a request to CC Neuberger Principal Holdings I, 200 Park Avenue, 58th Floor, New York, NY 10166. Additional information regarding the interests of such participants will be contained in the definitive proxy statement/prospectus for the Business Combination when available.
E2open and its directors and executive officers may also be deemed to be participants in the solicitation of proxies from the shareholders of CCNB1 in connection with the Business Combination. A list of the names of such directors and executive officers and information regarding their interests in the Business Combination will be included in the definitive proxy statement/prospectus for the Business Combination when available.
No Offer or Solicitation
This communication is not a proxy statement or solicitation of a proxy, consent or authorization with respect to any securities or in respect of the potential transaction and shall not constitute an offer to sell or a solicitation of an offer to buy the securities of CCNB1 or E2open, nor shall there be any sale of any such securities in any state or jurisdiction in which such offer, solicitation, or sale would be unlawful prior to registration or qualification under the securities laws of such state or jurisdiction. No offer of securities shall be made except by means of a prospectus meeting the requirements of the Securities Act.
Forward-Looking Statements
Certain statements in this Current Report on Form 8-K may be considered forward-looking statements. Forward-looking statements generally relate to future events or CCNB1’s or E2open’s future financial or operating performance. For example, projections of future growth, financial performance, and other metrics are forward-looking statements. In some cases, you can identify forward-looking statements by terminology such as “may,” “should,” “expect,” “intend,” “will,” “estimate,” “anticipate,” “believe,” “predict,” “potential” or “continue,” or the negatives of these terms or variations of them or similar terminology. Such forward-looking statements are subject to risks, uncertainties, and other factors which could cause actual results to differ materially from those expressed or implied by such forward looking statements.
These forward-looking statements are based upon estimates and assumptions that, while considered reasonable by CCNB1 and its management, and E2open and its management, as the case may be, are inherently uncertain. Factors that may cause actual results to differ materially from current expectations include, but are not limited to: (1) the occurrence of any event, change or other circumstances that could give rise to the termination of negotiations and any subsequent definitive agreements with respect to the Business Combination; (2) the outcome of any legal proceedings that may be instituted against CCNB1, the combined company or others following the announcement of the Business Combination and any definitive agreements with respect thereto; (3) the inability to complete the Business Combination due to the failure to obtain approval of the shareholders of CCNB1, to obtain financing to complete the Business Combination or to satisfy other conditions to closing; (4) changes to the proposed structure of the Business Combination that may be required or appropriate as a result of applicable laws or regulations or as a condition to obtaining regulatory approval of the Business Combination; (5) the ability to meet stock exchange listing standards following the consummation of the Business Combination; (6) the risk that the Business Combination disrupts current plans and operations of E2open as a result of the announcement and consummation of the Business Combination; (7) the ability to recognize the anticipated benefits of the Business Combination, which may be affected by, among other things, competition, the ability of the combined company to grow and manage growth profitably, maintain relationships with customers and suppliers and retain its management and key employees; (8) costs related to the Business Combination; (9) changes in applicable laws or regulations; (10) the possibility that E2open or the combined company may be adversely affected by other economic, business, and/or competitive factors; (11) E2open’s estimates of expenses and profitability; and (12) other risks and uncertainties set forth in the section entitled “Risk Factors” and “Cautionary Note Regarding Forward-Looking Statements” in CCNB1’s final prospectus relating to its initial public offering, dated April 23, 2020.
Nothing in this Current Report on Form 8-K should be regarded as a representation by any person that the forward-looking statements set forth herein will be achieved or that any of the contemplated results of such forward-looking statements will be achieved. You should not place undue reliance on forward-looking statements, which speak only as of the date they are made. Neither CCNB1 nor E2open undertakes any duty to update these forward-looking statements.
| Item 9.01 | Financial Statements and Exhibits. |
(d) Exhibits The following exhibit is provided as part of this Form 8-K:
|
Exhibit No.
|
Description
|
| 99.1 | Analyst Day Presentation, dated November 2020. |
SIGNATURE
Pursuant to the requirements of the Securities Exchange Act of 1934, the Registrant has duly caused this report to be signed on its behalf by the undersigned thereunto duly authorized.
| Date: November 30, 2020 | CC NEUBERGER PRINCIPAL HOLDINGS I | |
| By: | /s/ Matthew Skurbe | |
| Name: | Matthew Skurbe | |
| Title: | Chief Financial Officer | |
Exhibit 99.1
 |
Exhibit 99.1 Investor Presentation November 2020 Networked, Harmonized, Optimized, Live. CC Neuberger Principal Holdings I |
 |
Disclaimer This investor presentation (this “Presentation”) is for informational purposes only to assist interested parties in making th eir own evaluation with respect to the proposed business combination (the “Business Combination”) between CC Neuberger Principal Holdings 1 (“CCN”) and E2open, LLC (the “Company”). The information contained herein does not purport to be all-inclusive and none of CCN, the Company or their respective directors, officers, stockholders or affiliates makes any representation or warranty, express or implied, as to the accuracy, completeness or reliability of the information contained in this Presentation or any other written or oral communication communicated to the recipient in the course of the recipient's evaluation of the Company or CCN. This Presentation does not constitute (i) a solicitation of a proxy, consent or authorization with respect to any securities or in respect of the proposed Business Combination or (ii) an offer to sell, a solicitation of an offer to buy, or a recommendation to purchase any security of CCN, the Company, or any of their respective affiliates. You should not construe the contents of this Presentation as legal, tax, accounting or investment advice or a recommendation. You should consult your own counsel and tax and financial advisors as to legal and related matters concerning the matters described here in, and, by accepting this Presentation, you confirm that you are not relying upon the information contained herein to make any decision. The distribution of this Presentation may also be restricted by law and persons into whose possession this Presentation comes should inform themselves about and observe any such restrictions. The recipient acknowledges that it is (a) aware that the United States securities laws prohibit any person who has material, non-public information concerning a company from purchasing or selling securities of such company or from communicating such information to any other person under circumstances in which it is reasonably foreseeable that such person is likely to purchase or sell such securiti es, and (b) familiar with the Securities Exchange Act of 1934, as amended, and the rules and regulations promulgated thereunder (collectively, the "Exchange Act"), and that the recipient will neither use, nor cause any third party to use, this Presentation or any information contained herein in contravention of the Exchange Act, including, without limitation, Rule 10b-5 thereunder. This Presentation and information contained herein constitutes confidential information and is provided to you on the condition th at you agree that you will hold it in strict confidence and not reproduce, disclose, forward or distribute it in whole or in part without the prior written consent of CCN and the Company and is intended for the recipient hereof only. No securities commission or securities regulatory authority in the United States or any other jurisdiction has in any way passed upon them merits of the Business Combination or the accuracy or adequacy of this Presentation. Forward-Looking Statements Certain statements in this Presentation may be considered forward-looking statements. Forward-looking statements generally relate to future events or CCN’s or the Company’s future financial or operating performance. For example, projections of future Revenue, Pro Forma Adjusted EBITDA and other metrics are forward-looking statements. In some cases, you can identify forward-looking statements by terminology such as “may”, “should”, “expect”, “intend”, “will”, “estimate”, “anticipate”, “believe”, “predict”, “potential” or “continue”, or the negatives of these terms or variations of t hem or similar terminology. Such forward-looking statements are subject to risks, uncertainties, and other factors which could cause actual results to differ materially from those expressed or implied by such forward looking statements. These forward-looking statements are based upon estimates and assumptions that, while considered reasonable by CCN and its management, and the Company and its management, as the case may be, are inherently uncertain. Factors that may cause actual results to differ materially from current expectations include, but are not limited to: (1) the occurrence of any event, change or other circumstances that could give rise to the termination of negotiations and any subsequent definitive agreements with respect to the Business Combination; (2) the outcome of any legal proceedings that may be instituted against CCN, the combined company or others following the announcement of the Business Combination and any definitive agreements with respect thereto; (3) the inability to complete the Business Combination due to the failure to obtain approval of the shareholders of CCN, to obtain financing to complete the Business Combination or to satisfy other conditions to closing; (4) changes to the proposed structure of the Business Combination that may be required or appropriate as a result of applicable laws or regulations or as a condition to obtaining regulatory approval of the Business Combination; (5) the ability to meet stock exchange listing standards following the consummation of the Business Combination; (6) the risk that the Business Combination disrupts current plans and operations of the Company as a result of the announcement and consummation of the Business Combination; (7) the ability to recognize the antici pated benefits of the Business Combination, which may be affected by, among other things, competition, the ability of the combined company to grow and manage growth profitably, maintain relationships with customers and suppliers and retain its management and key employees; (8) costs related to the Business Combination; (9) changes in applicable laws or regulations; (10) the possibility that the Company or the combined company may be adversely affected by ot her economic, business, and/or competitive factors; (11) the Company’s estimates of expenses and profitability; and (12) other risks and uncertainties set forth in the section entitled “Risk Factors” and “Cautionary Note Regarding Forwar d-Looking Statements” in CCN’s final prospectus relating to its initial public offering dated April 23, 2020. Nothing in this Presentation should be regarded as a representation by any person that the forward-looking statements set forth herein will be achieved or that any of the contemplated results of such forward-looking statements will be achieved. You should not place undue reliance on forward-looking statements, which speak only as of the date they are made. Neither CCN nor the Company undertakes any duty to update these forward-looking statements. Non-GAAP Financial Measures This Presentation includes certain financial measures not presented in accordance with generally accepted accounting principl es (“GAAP”) including, but not limited to, Pro Forma Adjusted EBITDA and certain ratios and other metrics derived therefrom. These non-GAAP financial measures are not measures of financial performance in accordance with GAAP and may exclude i tems that are significant in understanding and assessing the Company’s financial results. Therefore, these measures should not be considered in isolation or as an alternative to net income, cash flows from operations or other measures of profitability, liquidity or performance under GAAP. You should be aware that the Company’s presentation of these measures may not be comparable to similarly-titled measures used by other companies. The Company believes these non-GAAP measures of financial results provide useful information to management and investors regarding certain financial and business trends relating to the Company’s financial condition and results of operations. The Company believes that the use of these non-GAAP financial measures provides an additional tool for investors to use in evaluating ongoing operating results and trends in and in comparing the Company’s financial measures with other similar companies, many of which present similar non-GAAP financial measures to investors. These non-GAAP financial measures are subject to inherent limitations as they reflect the exercise of judgments by management about which expense and income are excluded or included in determining these non-GAAP financial measures. Please refer to footnotes where presented on each page of this Presentation or to the appendix found at the end of this Presentation for a reconciliation of these measures to what the Company believes are the most directly comparable measure evaluated in accordance with GAAP. This Presentation also includes certain projections of non-GAAP financial measures. Due to the high variability and difficulty in making accurate forecasts and projections of some of the information excluded from these projected measures, together with some of the excluded information not being ascertainable or accessible, the Company is unable to quantify certa in amounts that would be required to be included in the most directly comparable GAAP financial measures without unreasonable effort. Consequently, no disclosure of estimated comparable GAAP measures is included and no reconciliat ion of the forward-looking non-GAAP financial measures is included. 2 |
 |
Disclaimer (Cont’d) Use of Projections This Presentation contains financial forecasts with respect to the Company’s projected financial results, including Revenue and Pr o Forma Adjusted EBITDA, for the Company's fiscal years 2021 through 2022. The Company's independent auditors have not audited, reviewed, compiled or performed any procedures with respect to the projections for the purpose of their inclusion in this Presentation, and accordingly, they did not express an opinion or provide any other form of assurance with respect thereto for the purpose of this Presentation. These projections should not be relied upon as being necessarily indicative of future results. The assumptions and estimates underlying the prospective financial information are inherently uncertain and are subject to a wide variety of significant business, economic and competitive risks and uncertainties that could cause actual results to differ materially from those contained in the prospective financial information. Accordingly, there can be no assurance that the prospective results are indicative of the future performance of the Company or that actual results will not differ materially from those presented in the prospective financial information. Inclusion of the prospective financial information in this Presentation should not be regarded as a representation by any person that the results contained in the prospective financial information will be achieved. Actual results may differ as a result of the completion of the Company's quarter-end closing procedures, review adjustments and other developments that may arise between now and the time such financial information for the period is finalized. As a result, these estimates are preliminary, may change and constitute forward-looking information and, as a result, are subject to risks and uncertainties. Neither the Company’s nor CCN’s independent registered accounting firm has audited, reviewed or compiled, examined or performed any procedures with respect to the preliminary results, nor have the y expressed any opinion or any other form of assurance on the preliminary financial information. Industry and Market Data In this Presentation, CCN and the Company rely on and refer to certain information and statistics obtained from third-party sources which they believe to be reliable. Neither CCN nor the Company has independently verified the accuracy or completeness of any such third-party information. You are cautioned not to give undue weight to such industry and market data. This Presentation may include trademarks, service marks, trade names and copyrights of other companies, which are the property of their respective owners. Solely for convenience, some of the trademarks, service marks, trade names and copyrights referred to in this Presentation may be listed without the ™, ℠, ©, or ® symbols, but CCN and the Company will assert, to the fullest extent under applicable law, the right of the applicable owners, if any, to these trademarks, service marks, trade names and copyrights. Additional Information In connection with the proposed Business Combination, including the domestication of CCN as a Delaware corporation, CCN intends to file with the SEC a registration statement on Form S-4 containing a preliminary proxy statement and a preliminary prospectus of CCN, and after the registration statement is declared effective, CCN will mail a definitive proxy statement/prospectus relating to the proposed Business Combination to its shareholders. This Investor Presentation does not contain all the information that should be considered concerning the proposed Business Combination and is not intend ed to form the basis of any investment decision or any other decision in respect of the Business Combination. CCN’s shareholders and other interested persons are advised to read, when available, the preliminary proxy statement/prospect us and the amendments thereto and the definitive proxy statement/prospectus and other documents filed in connection with the proposed Business Combination, as these materials will contain important information about CCN, the Company and the Business Combination. When available, the definitive proxy statement/prospectus and other relevant materials for the proposed Business Combination will be mailed to shareholders of CCN as of a record date to be esta blished for voting on the proposed Business Combination. Shareholders will also be able to obtain copies of the preliminary proxy statement/prospectus, the definitive proxy statement/prospectus and other documents filed with the SEC, without charge, once available, at the SEC’s website at www.sec.gov, or by directing a request to: CC Neuberger Principal Holdings 1, 200 Park Avenue, New York, NY 10166. Participants in the Solicitation CCN and its directors and executive officers may be deemed participants in the solicitation of proxies from CCN’s shareholder s with respect to the proposed Business Combination. A list of the names of those directors and executive officers and a description of their interests in CCN is contained in CCN’s final prospectus related to its initial public offering dated April 23, 2020, which was filed with the SEC and is available free of charge at the SEC’s web site at www.sec.gov, or by directing a request to CC Neuberger Principal Holdings 1, 200 Park Avenue, New York, NY 10166. Additional information regarding the interests of such participants will be contained in the proxy statement/prospectus for the proposed Business Combination when available. The Company and its directors and executive officers may also be deemed to be participants in the solicitation of proxies fro m the shareholders of CCN in connection with the proposed Business Combination. A list of the names of such directors and executive officers and information regarding their interests in the proposed Business Combination will be inclu ded in the proxy statement for the proposed Business Combination when available. Safe Harbor Statement Please remember that during the course of this call, the CC Neuberger Principal Holdings I and E2open teams may make forward-looking statements within the meaning of the Federal Securities Laws. These statements are based on their current expectations and beliefs and involve risks and uncertainties that could cause actual results to differ materially from those described in these forward-looking statements. Please refer to the CC Neuberger Principal Holdings I filings with the Securities and Exchange Commission, the accompanying presentation, and the company's press release issued today for a detailed discussion of the risks that could cause actual results to differ materially from those expressed or implied in any forward-looking statements made today. Please note that during this call and in the accompanying presentation, management will refer to certain non-GAAP financial measures, such as Adjusted Gross Profit, Adjusted EBITDA, Pro Forma Adjusted EBITDA, among others. While the company believes these non-GAAP financial measures provide useful information for investors, the presentation of this information is not intended to be considered in isolation or as a substitute for the financial information presented in accordance with GAAP. Please refer to today's presentation available on CC Neuberger Principal Holdings’ website and filed wi th the SEC on its website for a reconciliation of the non-GAAP financial measures to the most comparable measures prepared in accordance with GAAP. In addition, this presentation also includes certain projections of non-GAAP financial measures. Due to the high variability and difficulty in making accurate forecasts and projections of some of the information excluded from these projected measures, together with some of the excluded information not being ascertained or accessible, CC Neuberger Principal Holdings I is unable to quantify certain amounts that would be required to be included in the most directly comparable GAAP measure without unreasonable effort. Consequently, this presentation does not include disclosure of estimated comparable GAAP measures and no reconciliation of the forward-looking statement, forward-looking non-GAAP financial measures is included. 3 |
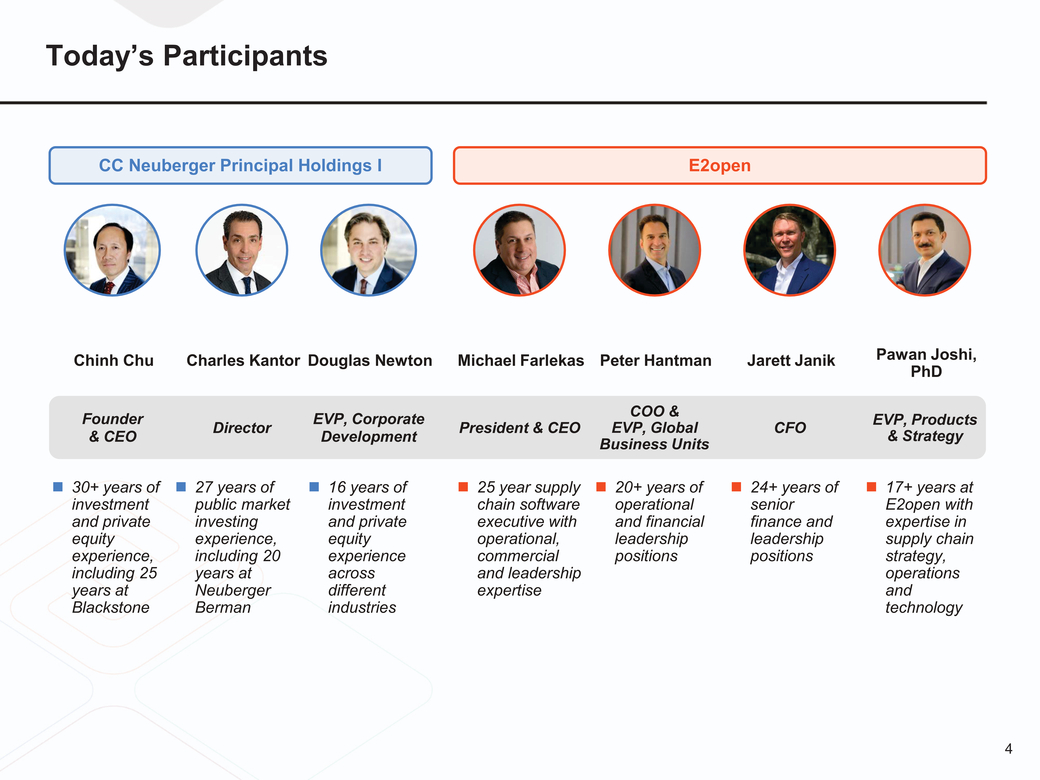 |
Today’s Participants CC Neuberger Principal Holdings IE2open Chinh Chu Founder & CEO 30+ years of investment and private equity experience, including 25 years at Blackstone Charles Kantor Director 27 years of public market investing experience, including 20 years at Neuberger Berman Douglas Newton EVP, Corporate Development 16 years of investment and private equity experience across different industries Michael Farlekas President & CEO 25 year supply chain software executive with operational, commercial and leadership expertise Peter Hantman COO & EVP, Global Business Units 20+ years of operational and financial leadership positions Jarett Janik CFO 24+ years of senior finance and leadership positions Pawan Joshi, PhD EVP, Products & Strategy 17+ years at E2open with expertise in supply chain strategy, operations and technology 4 |
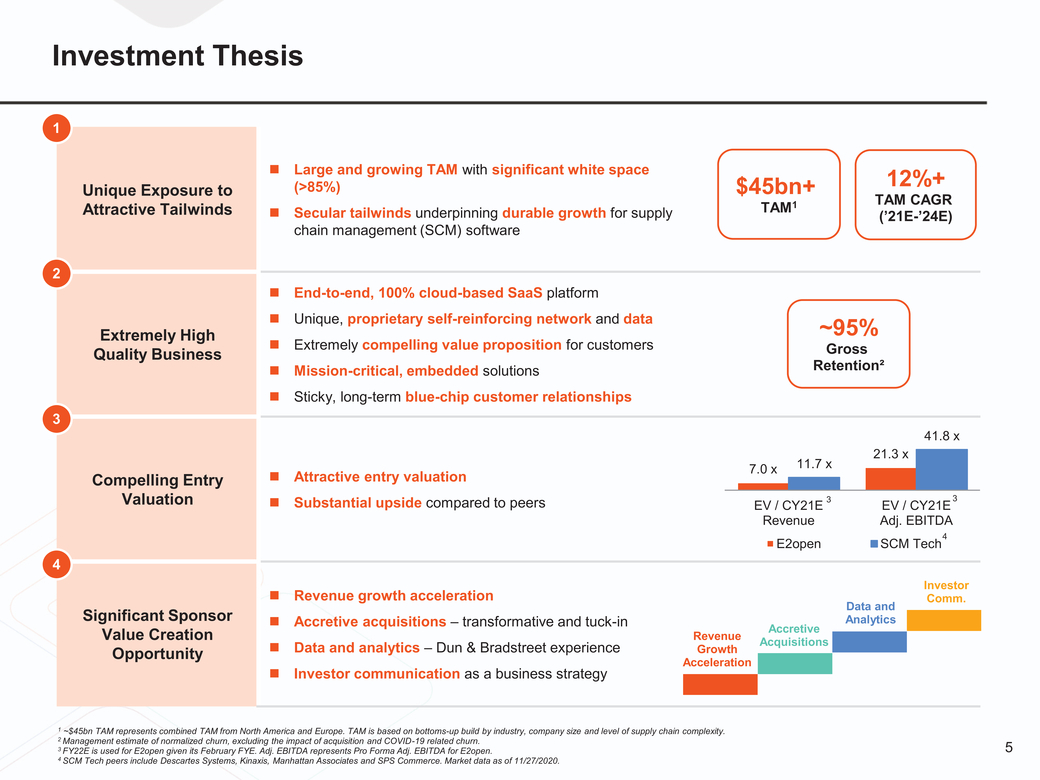 |
Investment Thesis 1 Unique Exposure to Attractive Tailwinds Large and growing TAM with significant white space (>85%) Secular tailwinds underpinning durable growth for supply chain management (SCM) software $45bn+ TAM1 12%+ TAM CAGR (’21E-’24E) 2 Extremely High Quality Business 3 End-to-end, 100% cloud-based SaaS platform Unique, proprietary self-reinforcing network and data Extremely compelling value proposition for customers Mission-critical, embedded solutions Sticky, long-term blue-chip customer relationships ~95% Gross Retention² 21.3 x x Compelling Entry Attractive entry valuation 7.0 x x Valuation Substantial upside compared to peers EV / CY21E 3 Revenue 3 EV / CY21E Adj. EBITDA 4 4 Significant Sponsor Value Creation Opportunity Revenue growth acceleration Accretive acquisitions – transformative and tuck-in Data and analytics – Dun & Bradstreet experience Investor communication as a business strategy Revenue Growth Acceleration E2openSCM Tech Investor Comm. Data and Analytics Accretive Acquisitions ~$45bn TAM represents combined TAM from North America and Europe. TAM is based on bottoms-up build by industry, company size and level of supply chain complexity. 5 FY22E is used for E2open given its February FYE. Adj. EBITDA represents Pro Forma Adj. EBITDA for E2open. SCM Tech peers include Descartes Systems, Kinaxis, Manhattan Associates and SPS Commerce. Market data as of 11/27/2020. |
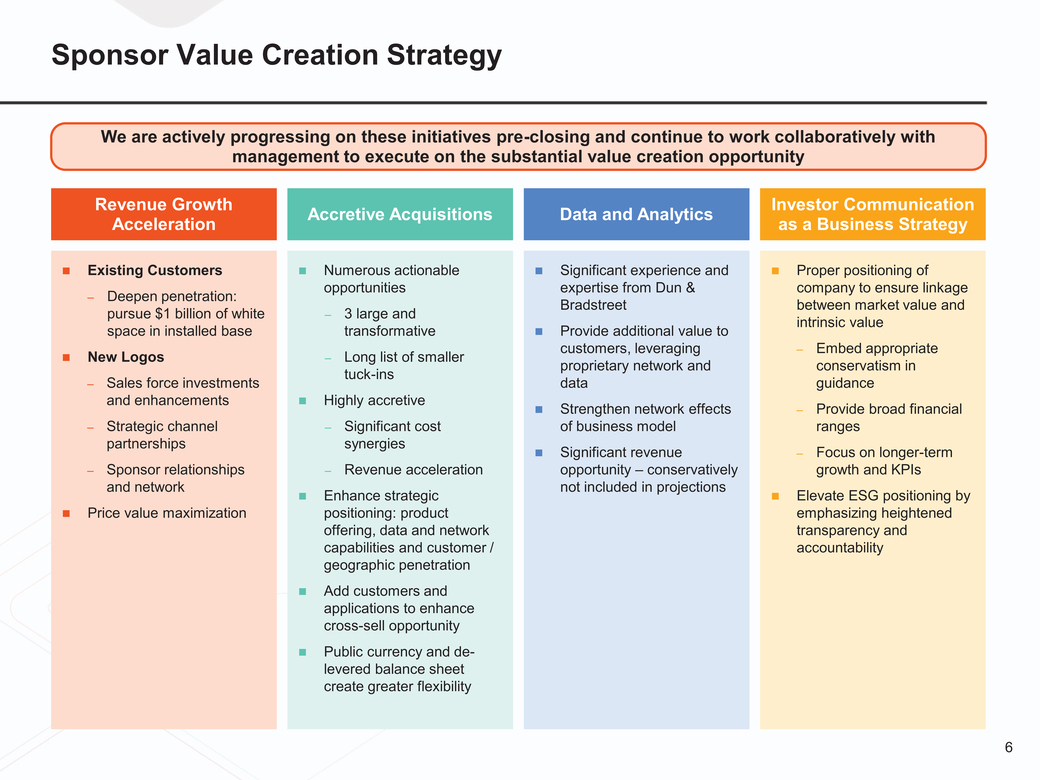 |
Sponsor Value Creation Strategy We are actively progressing on these initiatives pre-closing and continue to work collaboratively with management to execute on the substantial value creation opportunity Revenue Growth Acceleration Accretive AcquisitionsData and Analytics Investor Communication as a Business Strategy Existing Customers Deepen penetration: pursue $1 billion of white space in installed base New Logos Sales force investments and enhancements Strategic channel partnerships Sponsor relationships and network Price value maximization Numerous actionable opportunities 3 large and transformative Long list of smaller tuck-ins Highly accretive Significant cost synergies Revenue acceleration Enhance strategic positioning: product offering, data and network capabilities and customer / geographic penetration Add customers and applications to enhance cross-sell opportunity Public currency and de-levered balance sheet create greater flexibility Significant experience and expertise from Dun & Bradstreet Provide additional value to customers, leveraging proprietary network and data Strengthen network effects of business model Significant revenue opportunity – conservatively not included in projections Proper positioning of company to ensure linkage between market value and intrinsic value Embed appropriate conservatism in guidance Provide broad financial ranges Focus on longer-term growth and KPIs Elevate ESG positioning by emphasizing heightened transparency and accountability 6 |
 |
Select Board of Directors Nominees Stephen Daffron Director Nominee President of Dun & Bradstreet (NYSE:DNB) Co-founder of Motive Partners Former President and CEO of Interactive Data Corporation Held various command and staff positions in the US Army BS from the US Military Academy and an MBA, MA, MPHIL and PhD from Yale University Eva Huston Director Nominee Chief Strategy Officer of Duck Creek Technologies (NASDAQ:DCT) Former CFO, Treasurer, Chief Knowledge Officer, and Head of Investor Relations at Verisk Analytics Previously, Managing Director in TMT investment banking at JP Morgan BS in Foreign Service from Georgetown University 7 |
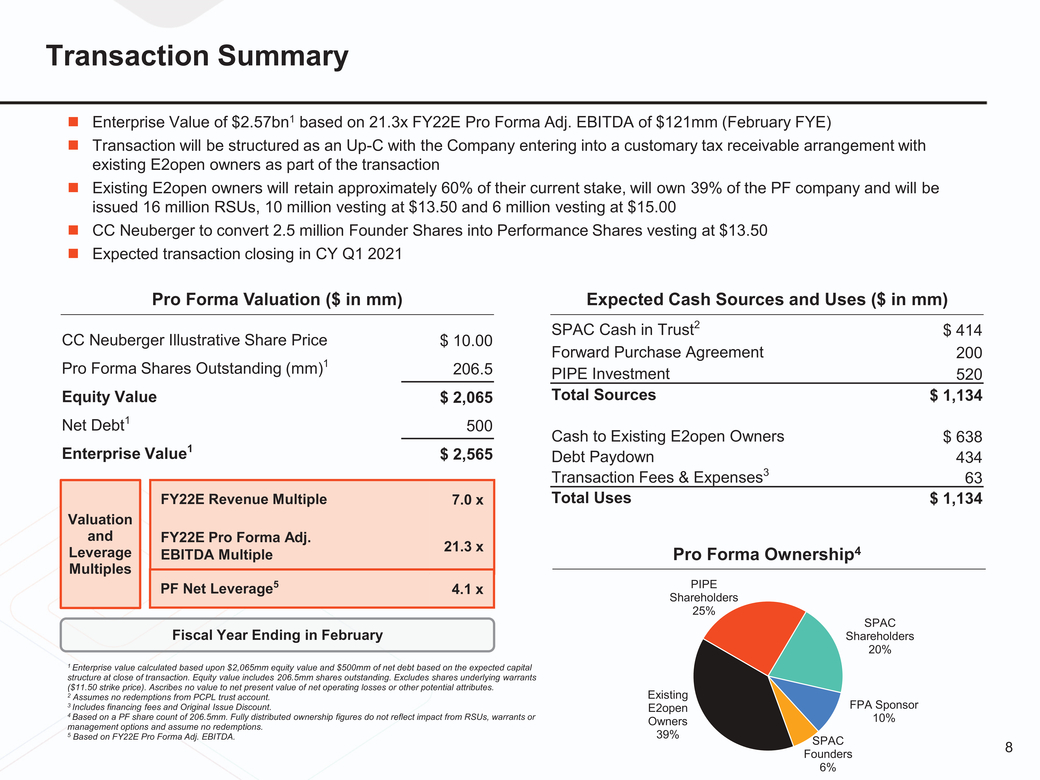 |
Transaction Summary Enterprise Value of $2.57bn1 based on 21.3x FY22E Pro Forma Adj. EBITDA of $121mm (February FYE) Transaction will be structured as an Up-C with the Company entering into a customary tax receivable arrangement with existing E2open owners as part of the transaction Existing E2open owners will retain approximately 60% of their current stake, will own 39% of the PF company and will be issued 16 million RSUs, 10 million vesting at $13.50 and 6 million vesting at $15.00 CC Neuberger to convert 2.5 million Founder Shares into Performance Shares vesting at $13.50 Expected transaction closing in CY Q1 2021 2 $ 414 Forward Purchase Agreement 200 PIPE Investment 520 Total Sources $ 1,134 Cash to Existing E2open Owners $ 638 Debt Paydown 434 Transaction Fees & Expenses3 63 Total Uses $ 1,134 CC Neuberger Illustrative Share Price $ 10.00 Pro Forma Shares Outstanding (mm)1 206.5 Equity Value $ 2,065 Net Debt1 500 Enterprise Value1 $ 2,565 Valuation and Leverage Multiples FY22E Revenue Multiple 7.0 x FY22E Pro Forma Adj. EBITDA Multiple 21.3 x Pro Forma Ownership4 PIPE Shareholders 25% SPAC Fiscal Year Ending in February Enterprise value calculated based upon $2,065mm equity value and $500mm of net debt based on the expected capital structure at close of transaction. Equity value includes 206.5mm shares outstanding. Excludes shares underlying warrants ($11.50 strike price). Ascribes no value to net present value of net operating losses or other potential attributes. Assumes no redemptions from PCPL trust account. Includes financing fees and Original Issue Discount. Based on a PF share count of 206.5mm. Fully distributed ownership figures do not reflect impact from RSUs, warrants or management options and assume no redemptions. Based on FY22E Pro Forma Adj. EBITDA. Existing E2open Owners 39% SPAC Shareholders 20% FPA Sponsor 10% 8 Founders 6% |
 |
I II III IV Company Highlights Financial Overview Valuation Overview Appendix 9 |
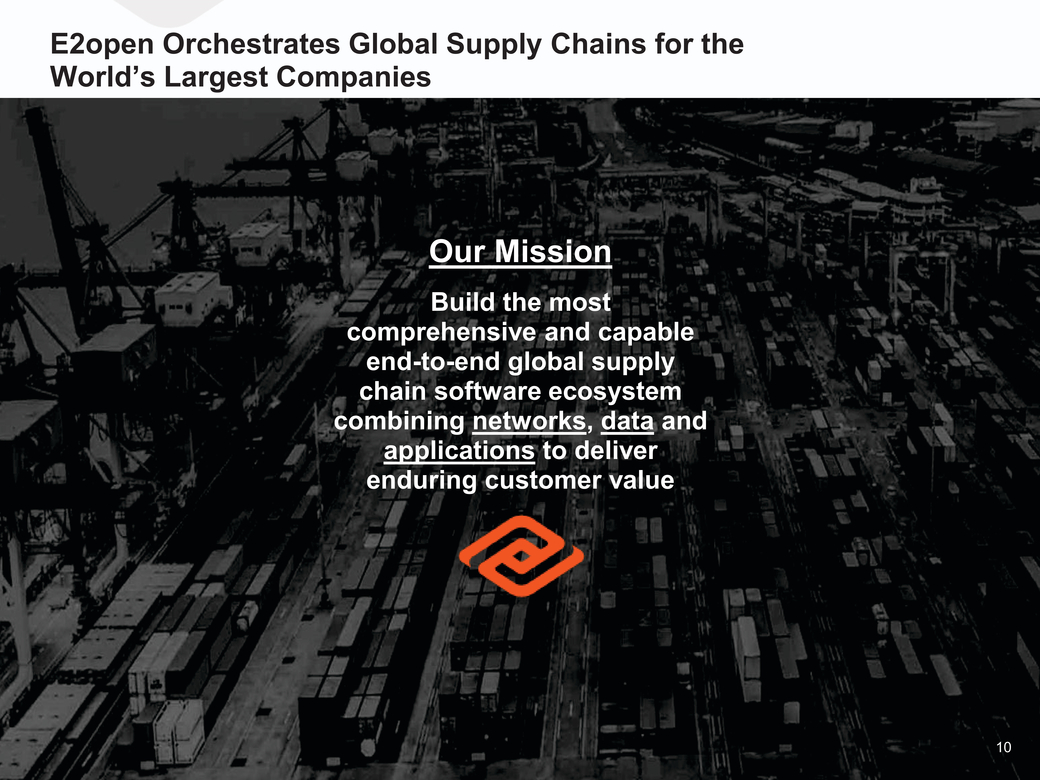 |
E2open Orchestrates Global Supply Chains for the World’s Largest Companies Our Mission Build the most comprehensive and capable end-to-end global supply chain software ecosystem combining networks, data and applications to deliver enduring customer value 10 |
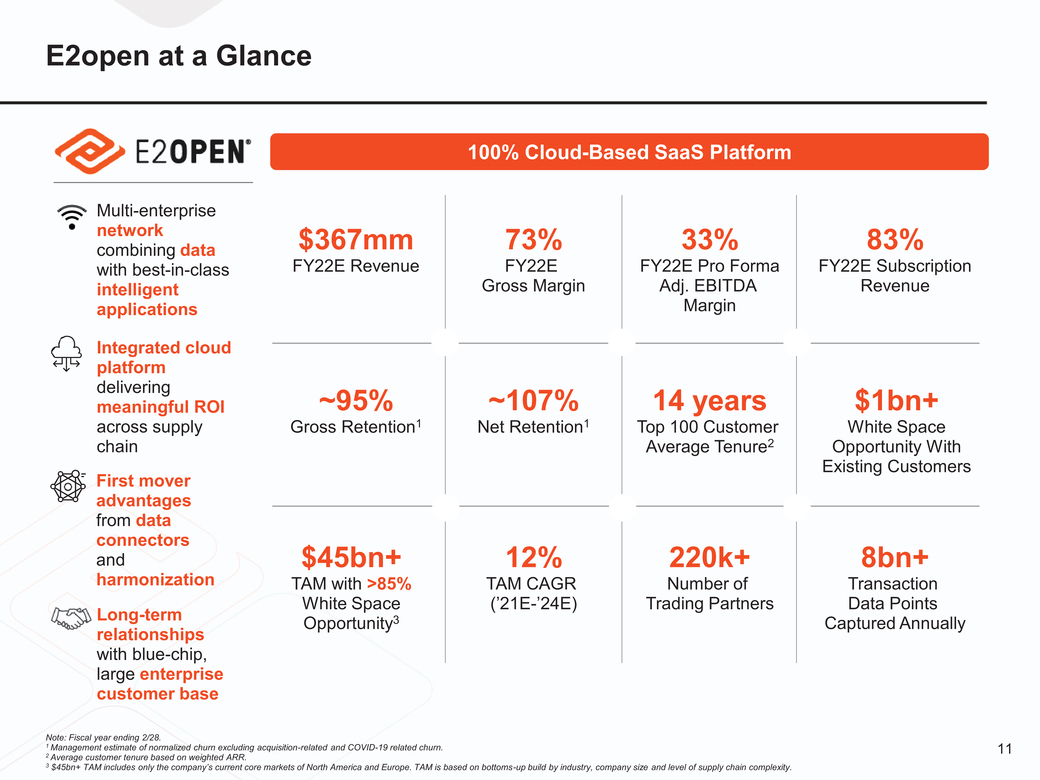 |
E2open at a Glance 100% Cloud-Based SaaS Platform Multi-enterprise network combining data with best-in-class intelligent applications $367mm FY22E Revenue 73% FY22E Gross Margin 33% FY22E Pro Forma Adj. EBITDA Margin 83% FY22E Subscription Revenue Integrated cloud platform delivering meaningful ROI across supply chain First mover advantages from data connectors and harmonization Long-term relationships with blue-chip, large enterprise customer base ~95% Gross Retention1 $45bn+ TAM with >85% White Space Opportunity3 ~107% Net Retention1 12% TAM CAGR (’21E-’24E) 14 years Top 100 Customer Average Tenure2 220k+ Number of Trading Partners $1bn+ White Space Opportunity With Existing Customers 8bn+ Transaction Data Points Captured Annually Note: Fiscal year ending 2/28. Management estimate of normalized churn excluding acquisition-related and COVID-19 related churn. 11 Average customer tenure based on weighted ARR. $45bn+ TAM includes only the company’s current core markets of North America and Europe. TAM is based on bottoms-up build by industry, company size and level of supply chain complexity. |
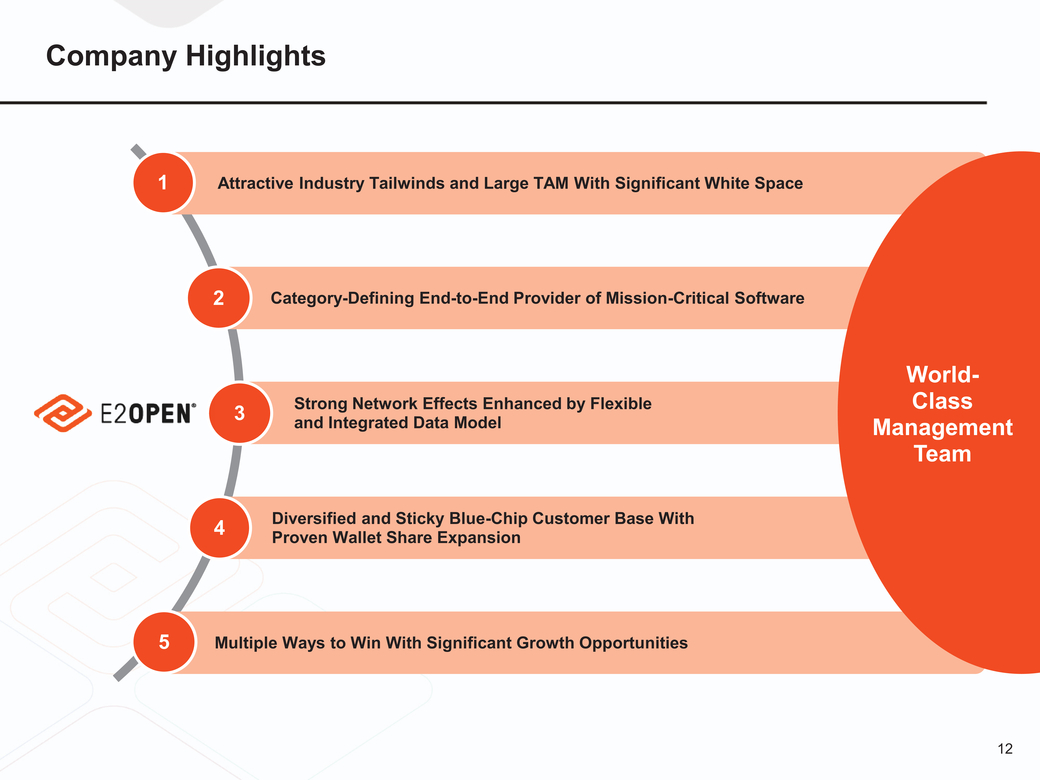 |
Company Highlights 1Attractive Industry Tailwinds and Large TAM With Significant White Space 2Category-Defining End-to-End Provider of Mission-Critical Software 3 World-Class Management Team 4 5Multiple Ways to Win With Significant Growth Opportunities 12 |
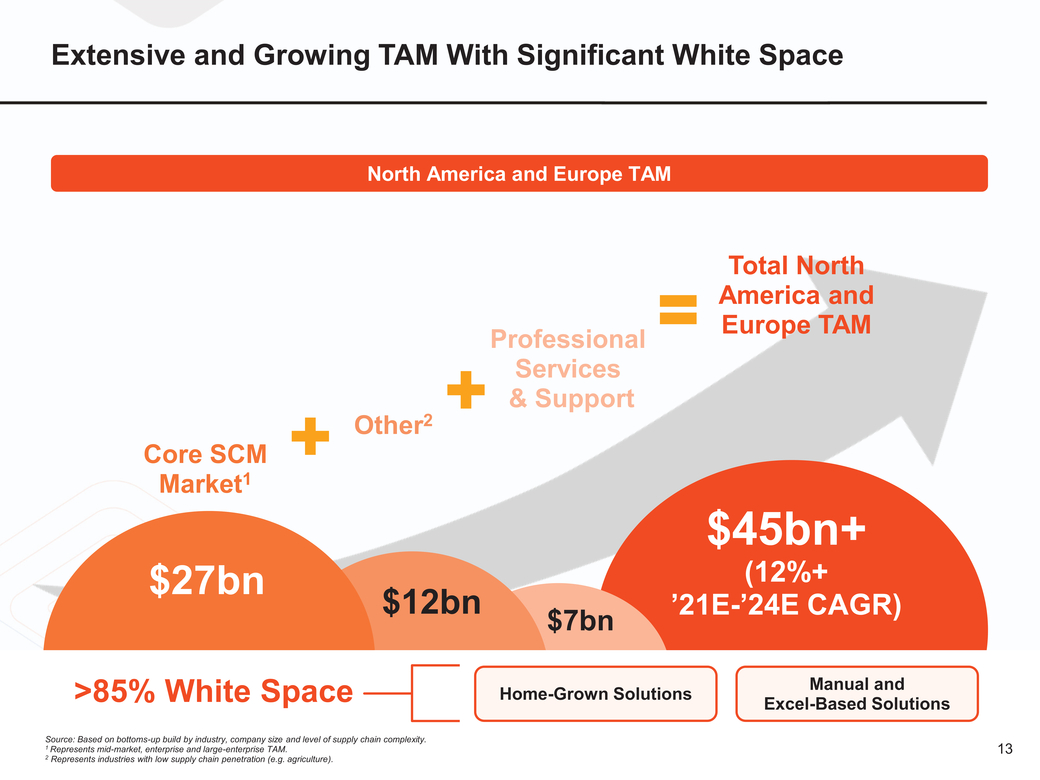 |
Extensive and Growing TAM With Significant White Space North America and Europe TAM Core SCM Market1 $27bn Other2 $12bn Professional Services & Support $7bn Total North America and Europe TAM $45bn+ (12%+ ’21E-’24E CAGR) >85% White Space Source: Based on bottoms-up build by industry, company size and level of supply chain complexity. Represents mid-market, enterprise and large-enterprise TAM. Represents industries with low supply chain penetration (e.g. agriculture). Home-Grown Solutions Manual and Excel-Based Solutions 13 |
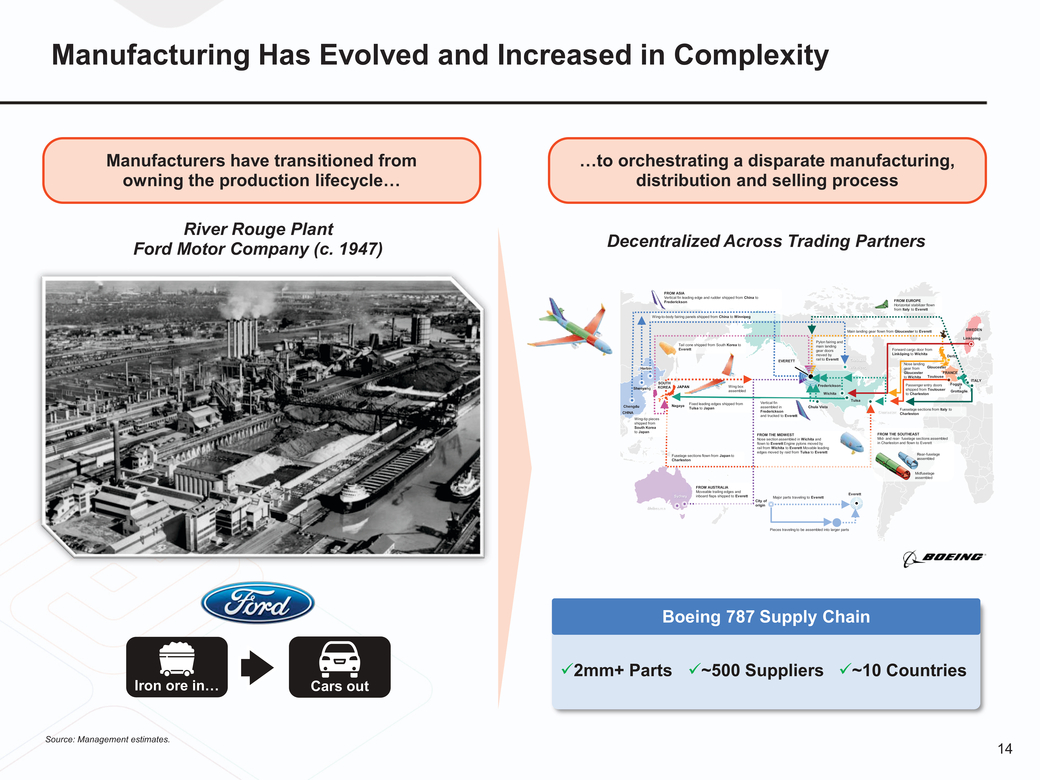 |
Manufacturing Has Evolved and Increased in Complexity Manufacturers have transitioned from owning the production lifecycle… …to orchestrating a disparate manufacturing, distribution and selling process River Rouge Plant Ford Motor Company (c. 1947) Decentralized Across Trading Partners FROM ASIA Vertical fin leading edge and rudder shipped from China to Frederickson FROM EUROPE Horizontal stabilizer flown from Italy to Everett Wing-to-body fairing panels shipped from China to Winnipeg Tail cone shipped from South Korea to Everett EVERETT Pylon fairing and main landing gear doors moved by rail to Everett Main landing gear flown from Gloucester to Everett Forward cargo door from Linköping to Wichita CANADA Derby SWEDEN Linköping Harbin Winnipeg Nose landing gear from Gloucester Gloucester FRANCE Shenyang SOUTH KOREA JAPAN Wing box assembled Frederickson Wichita to Wichita Toulouse Passenger entry doors shipped from Toulouser to Charleston Foggla Grottaglie ITALY Chengdu CHINA Wing-tip pieces shipped from South Korea to Japan Nagaya Fixed leading edges shipped from Tulsa to Japan Vertical fin assembled in Frederickson and trucked to Everett FROM THE MIDWEST Chula Vista Tulsa Fueselage sections from Italy to Charleston Charleston FROM THE SOUTHEAST Fuselage sections flown from Japan to Charleston Nose section assembled in Wichita and flown to Everett Engine pylons moved by rail from Wichita to Everett Movable leading edges moved by raid from Tulsa to Everett Mid-and rear-fuselage sections assembled in Charleston and flown to Everett Rear-fuselage assembled Midfuselage assembled Melbourne Sydney FROM AUSTRALIA Moveable trailing edges and inboard flaps shipped to Everett City of origin Major parts traveling to Everett Everett Pieces traveling to be assembled into larger parts Boeing 787 Supply Chain Iron ore in… Cars out x2mm+ Partsx~500 Suppliers x~10 Countries Source: Management estimates. 14 |
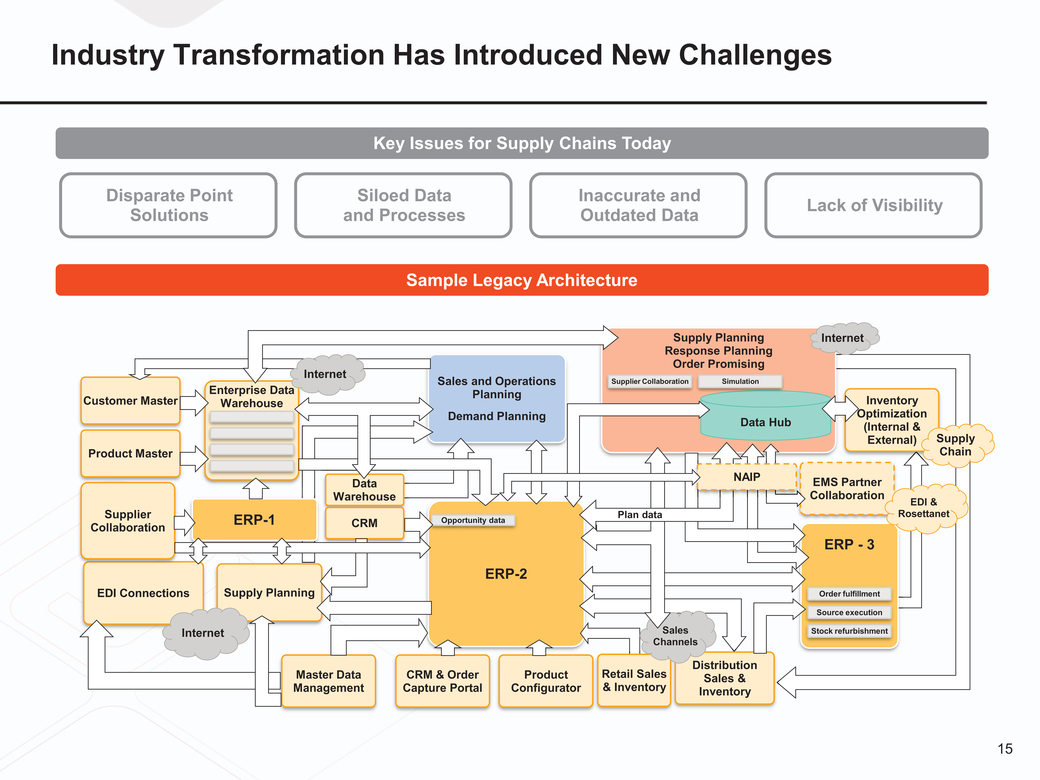 |
Industry Transformation Has Introduced New Challenges Key Issues for Supply Chains Today Disparate Point Solutions Siloed Data and Processes Inaccurate and Outdated DataLack of Visibility Sample Legacy Architecture Customer Master Enterprise Data Warehouse Internet Sales and Operations Planning Supply Planning Response Planning Order Promising Supplier CollaborationSimulation Internet Inventory Product Master Data Demand Planning Data Hub NAIP Optimization (Internal & External)Supply Chain EMS Partner Supplier Collaboration ERP-1 Warehouse CRM Opportunity data Plan data Collaboration ERP - 3 EDI & Rosettanet EDI Connections Supply Planning ERP-2 Order fulfillment Internet Sales Channels Source execution Stock refurbishment Master Data Management CRM & Order Capture Portal Product Configurator Retail Sales & Inventory Distribution Sales & Inventory 15 |
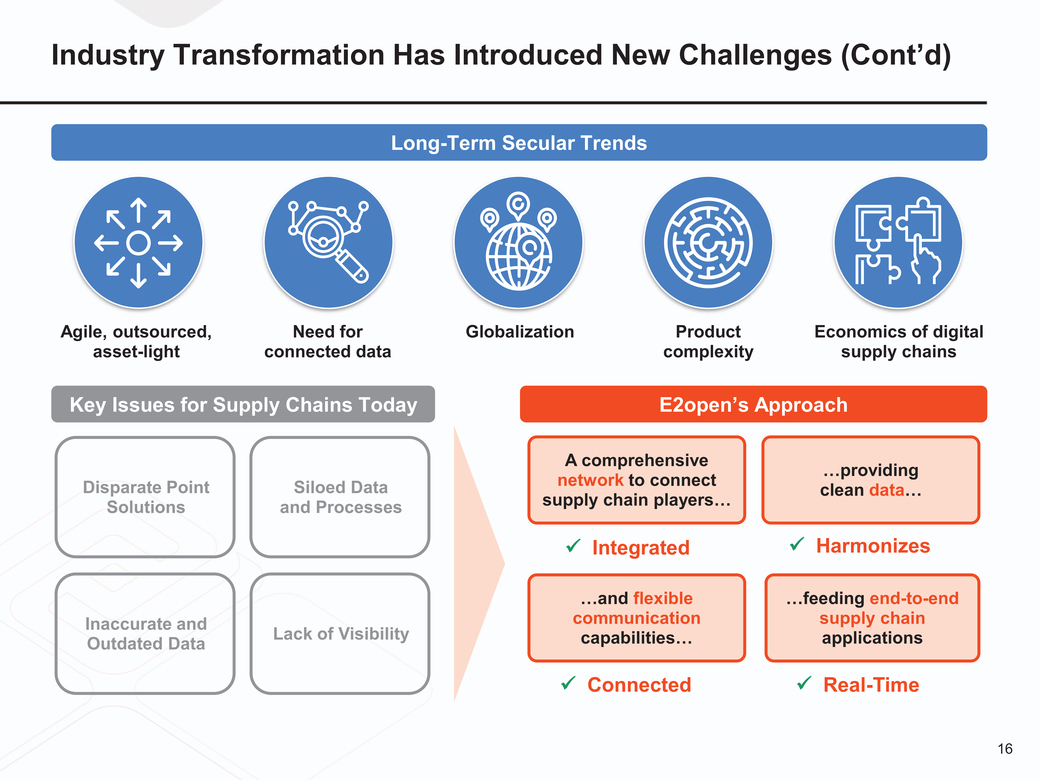 |
Industry Transformation Has Introduced New Challenges (Cont’d) Long-Term Secular Trends Agile, outsourced, asset-light Need for connected data Globalization Product complexity Economics of digital supply chains Key Issues for Supply Chains Today E2open’s Approach Disparate Point Solutions Siloed Data and Processes A comprehensive network to connect supply chain players… Integrated …providing clean data… Harmonizes Inaccurate and Outdated Data Lack of Visibility …and flexible communication capabilities… …feeding end-to-end supply chain applications Connected Real-Time 16 |
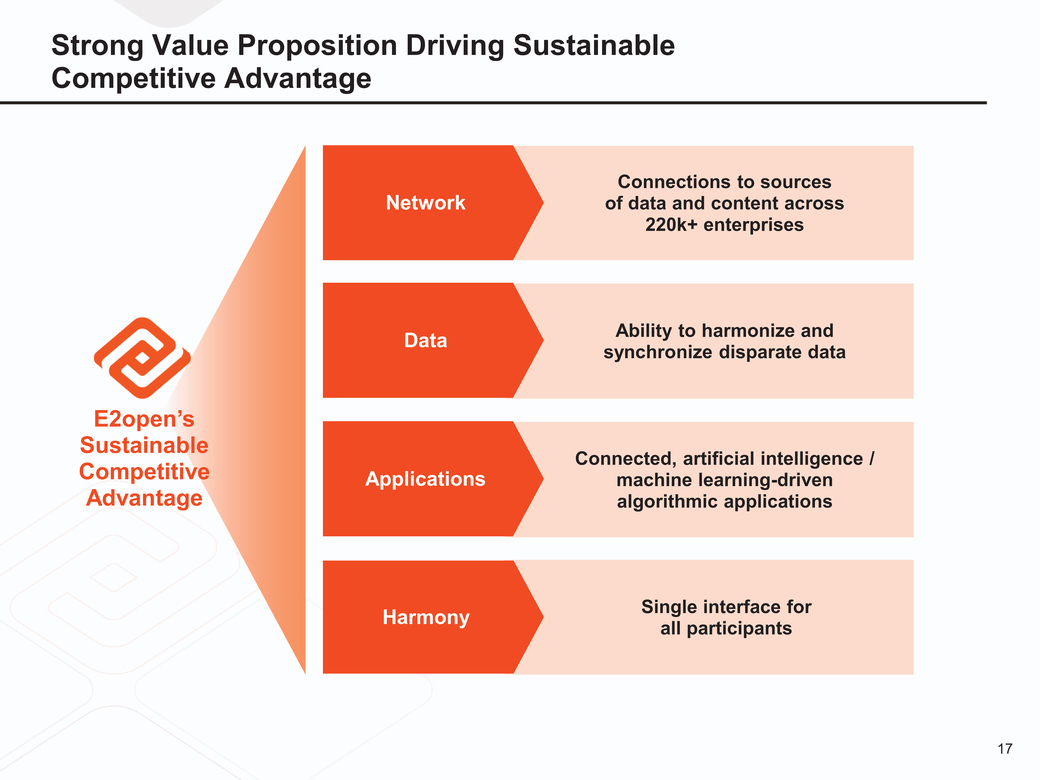 |
Strong Value Proposition Driving Sustainable Competitive Advantage Network Connections to sources of data and content across 220k+ enterprises Data Ability to harmonize and synchronize disparate data E2open’s Sustainable Competitive Advantage Applications Connected, artificial intelligence / machine learning-driven algorithmic applications Harmony Single interface for all participants 17 |
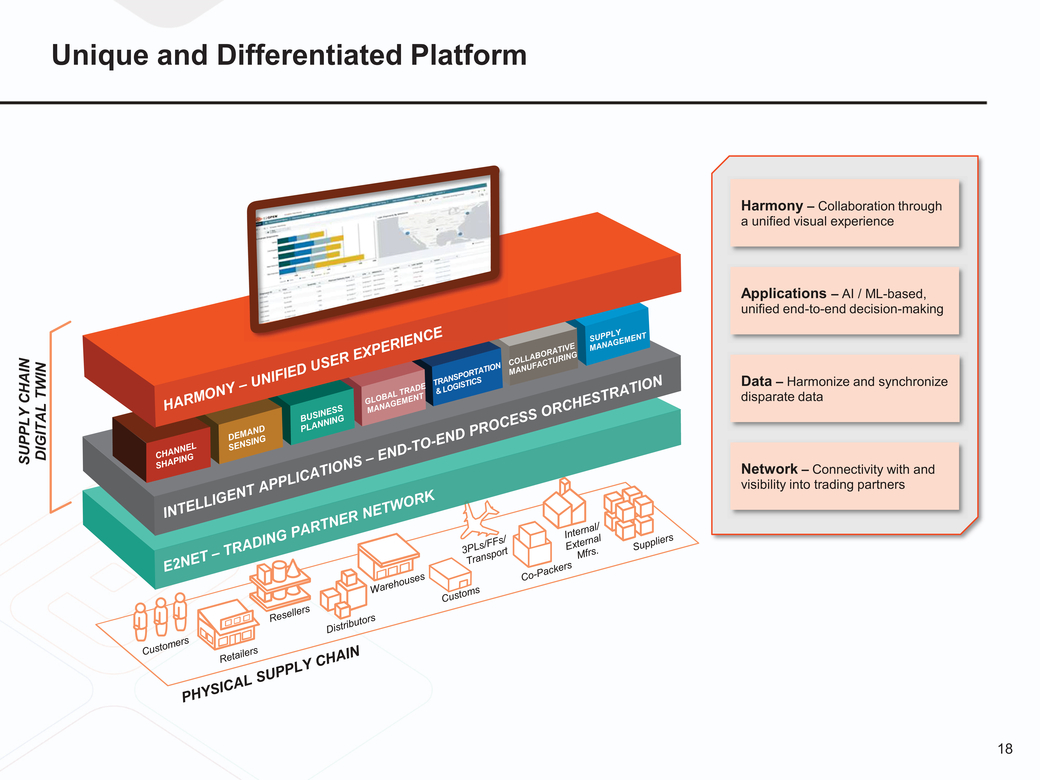 |
SUPPLY CHAIN DIGITAL TWIN Harmony – Collaboration through a unified visual experience Applications – AI / ML-based, unified end-to-end decision-making Data – Harmonize and synchronize disparate data Network – Connectivity with and visibility into trading partners 18 |
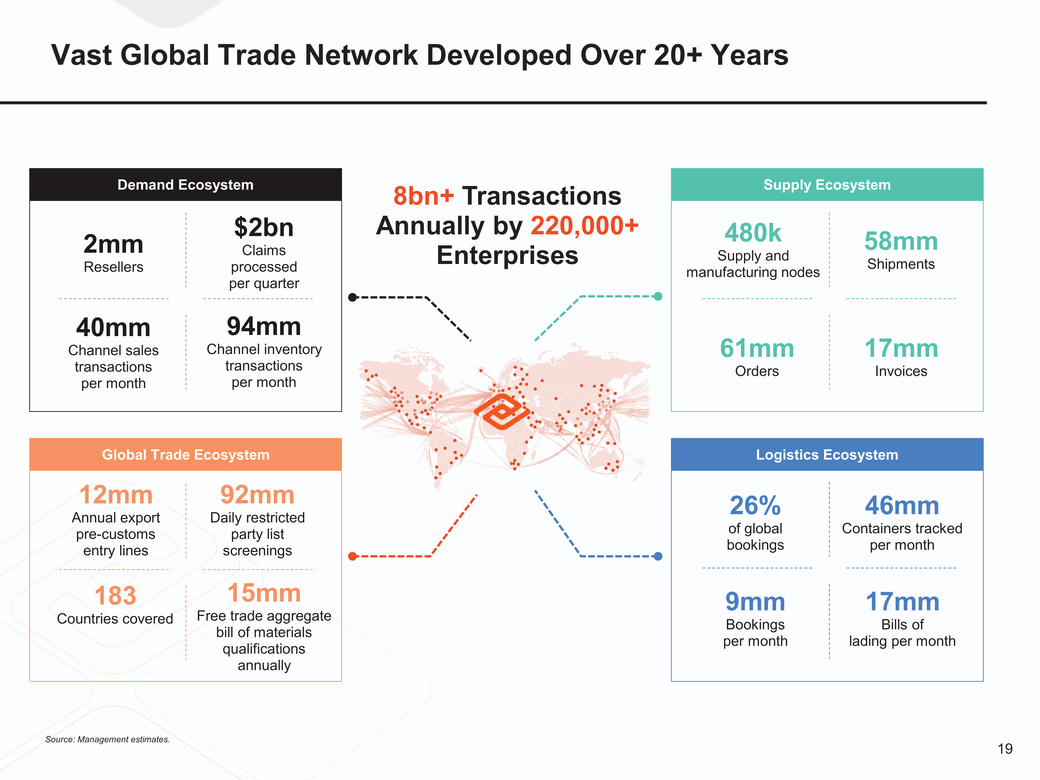 |
Vast Global Trade Network Developed Over 20+ Years Demand Ecosystem $2bn 8bn+ Transactions Annually by 220,000+ Supply Ecosystem 480k 2mm Resellers 40mm Channel sales transactions per month Claims processed per quarter 94mm Channel inventory transactions per month Enterprises Supply and manufacturing nodes 61mm Orders 58mm Shipments 17mm Invoices Global Trade Ecosystem Logistics Ecosystem 12mm Annual export pre-customs entry lines 183 Countries covered 92mm Daily restricted party list screenings 15mm Free trade aggregate bill of materials qualifications annually 26% of global bookings 9mm Bookings per month 46mm Containers tracked per month 17mm Bills of lading per month Source: Management estimates. 19 |
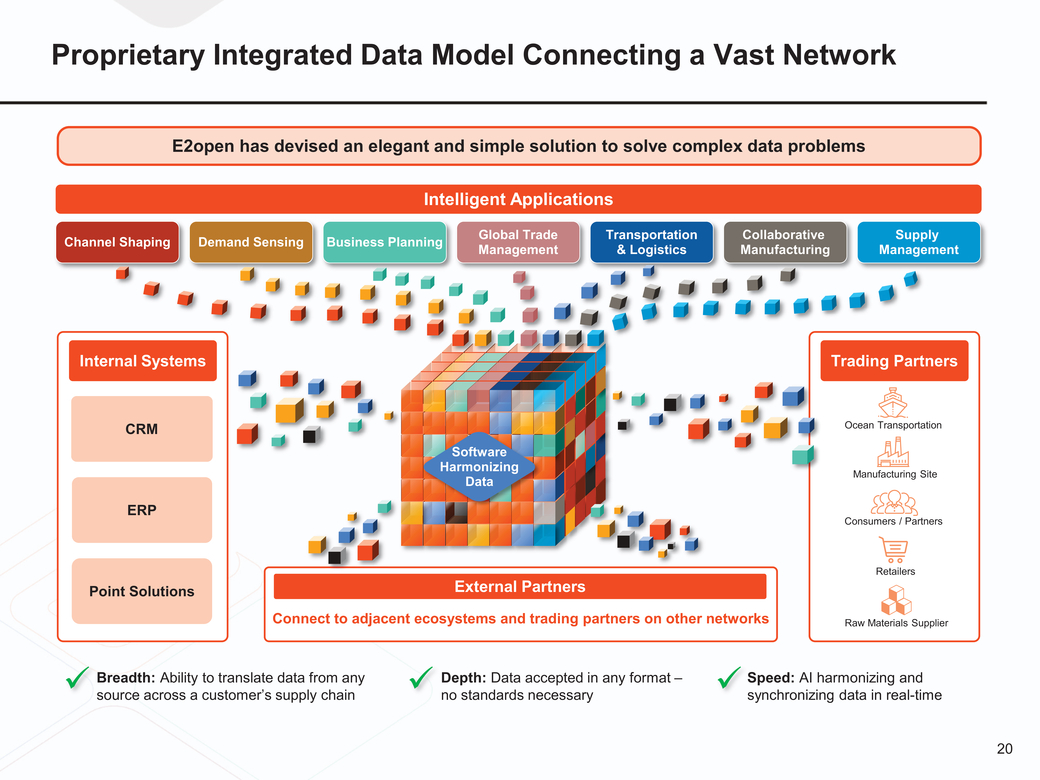 |
Proprietary Integrated Data Model Connecting a Vast Network E2open has devised an elegant and simple solution to solve complex data problems Intelligent Applications Channel Shaping Demand SensingBusiness Planning Global Trade Management Transportation & Logistics Collaborative Manufacturing Supply Management Internal SystemsTrading Partners CRM Software Harmonizing Data Ocean Transportation Manufacturing Site ERP Consumers / Partners Point Solutions External Partners Connect to adjacent ecosystems and trading partners on other networks Retailers Raw Materials Supplier x x x 20 |
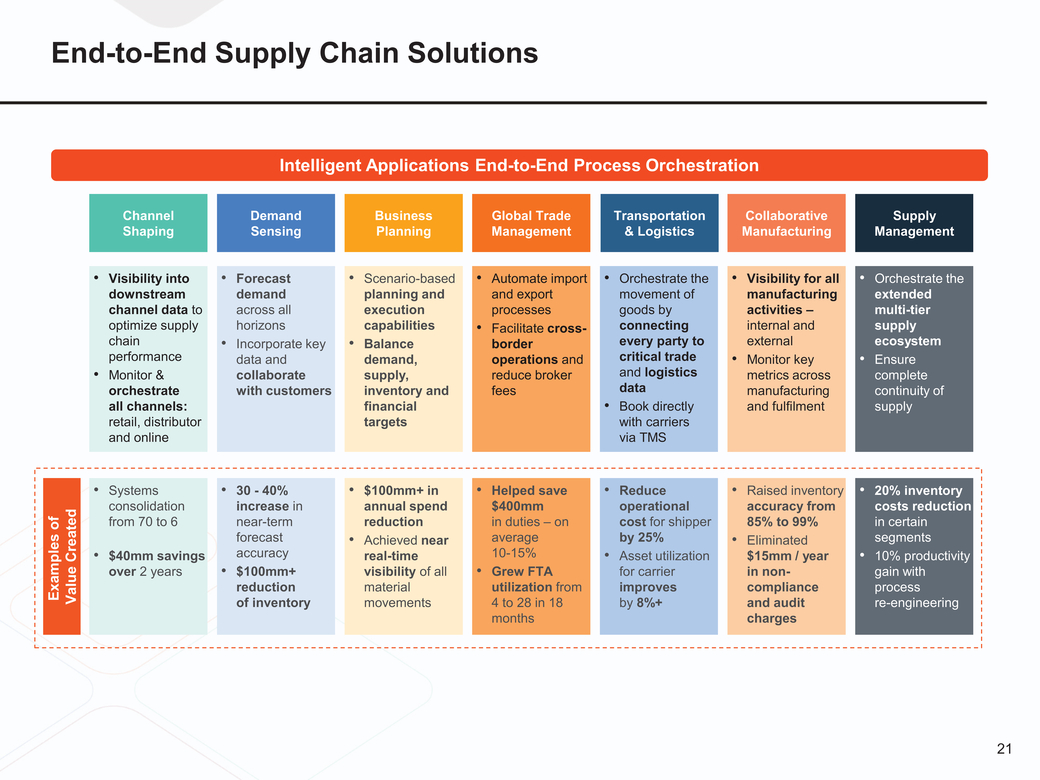 |
End-to-End Supply Chain Solutions Intelligent Applications End-to-End Process Orchestration Examples of Value Created |
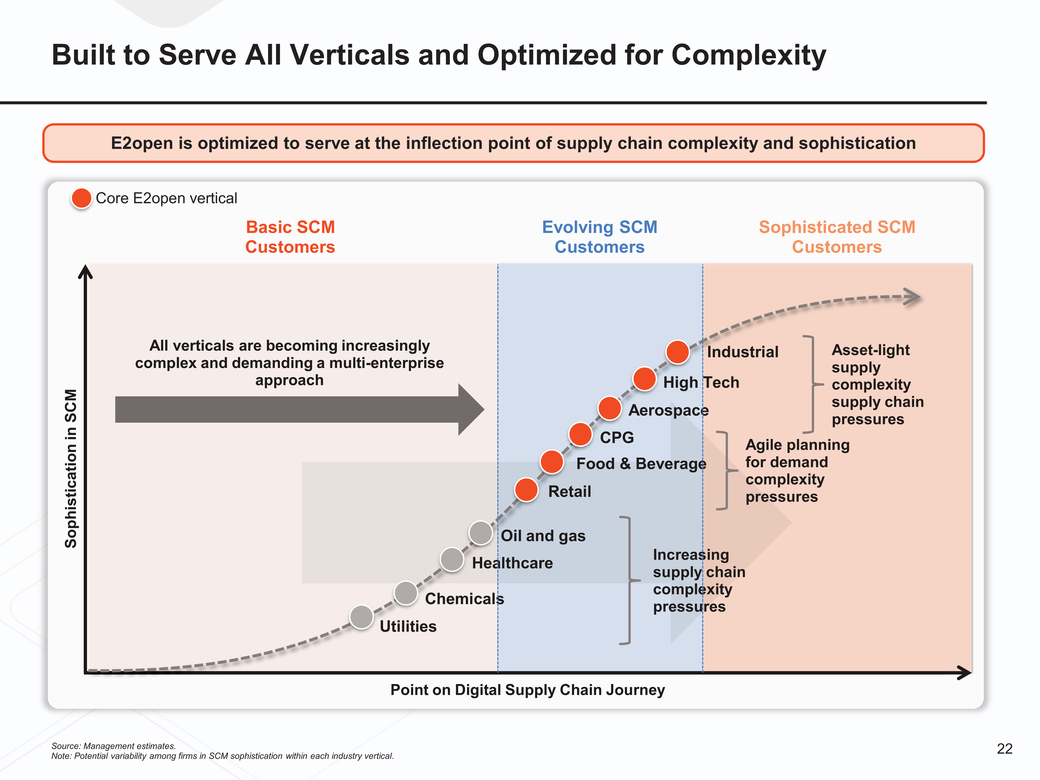 |
Built to Serve All Verticals and Optimized for Complexity E2open is optimized to serve at the inflection point of supply chain complexity and sophistication Core E2open vertical Basic SCM Customers Evolving SCM Customers Sophisticated SCM Customers Sophistication in SCM Industrial High Tech Aerospace Asset-light supply complexity supply chain pressures CPG Food & Beverage Retail Agile planning for demand complexity pressures Oil and gas Healthcare Chemicals Utilities Increasing supply chain complexity pressures Point on Digital Supply Chain Journey 22 Note: Potential variability among firms in SCM sophistication within each industry vertical. |
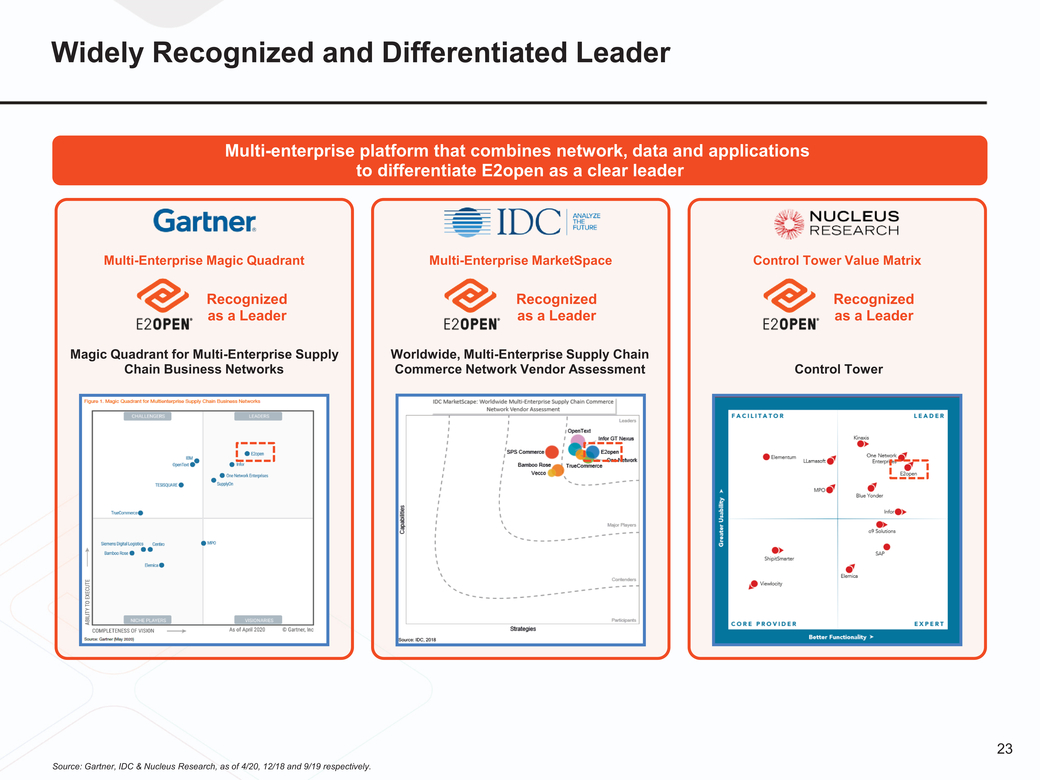 |
Widely Recognized and Differentiated Leader Multi-enterprise platform that combines network, data and applications to differentiate E2open as a clear leader Multi-Enterprise Magic Quadrant Multi-Enterprise MarketSpace Control Tower Value Matrix Recognized as a Leader Recognized as a Leader Recognized as a Leader Magic Quadrant for Multi-Enterprise Supply Chain Business Networks Worldwide, Multi-Enterprise Supply Chain Commerce Network Vendor AssessmentControl Tower 23 Source: Gartner, IDC & Nucleus Research, as of 4/20, 12/18 and 9/19 respectively. |
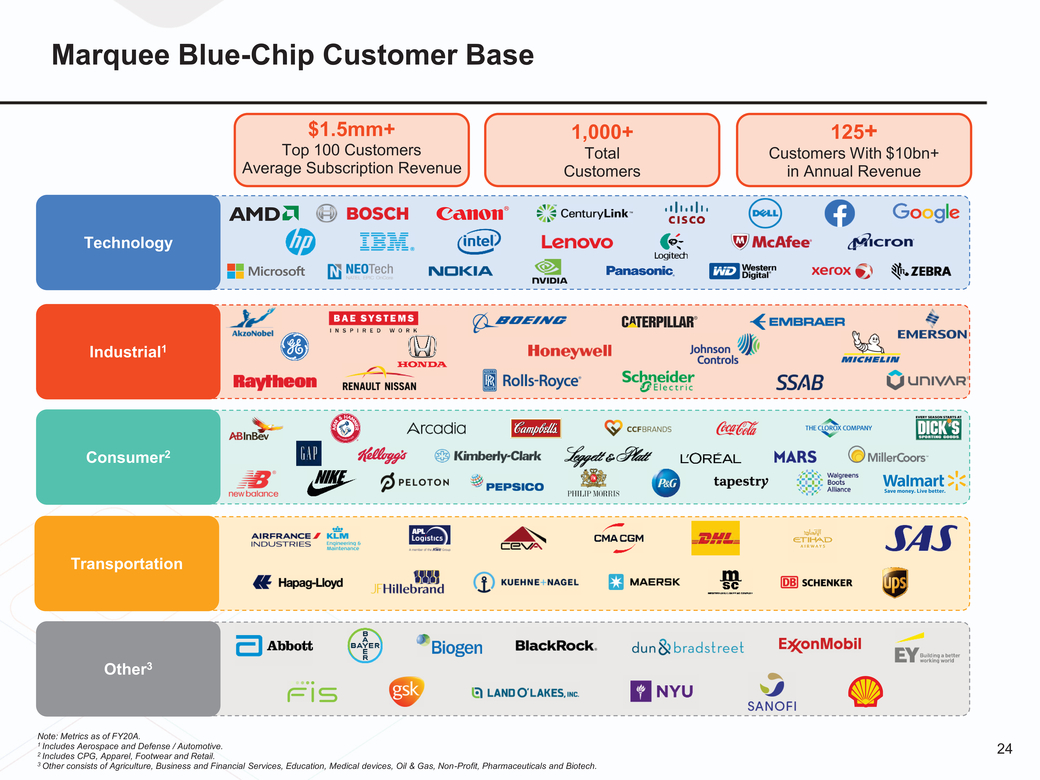 |
Marquee Blue-Chip Customer Base $1.5mm+ Top 100 Customers Average Subscription Revenue 1,000+ Total Customers 125+ Customers With $10bn+ in Annual Revenue Technology Industrial1 Consumer2 Transportation Other3 Note: Metrics as of FY20A. 24 Includes CPG, Apparel, Footwear and Retail. Other consists of Agriculture, Business and Financial Services, Education, Medical devices, Oil & Gas, Non-Profit, Pharmaceuticals and Biotech. |
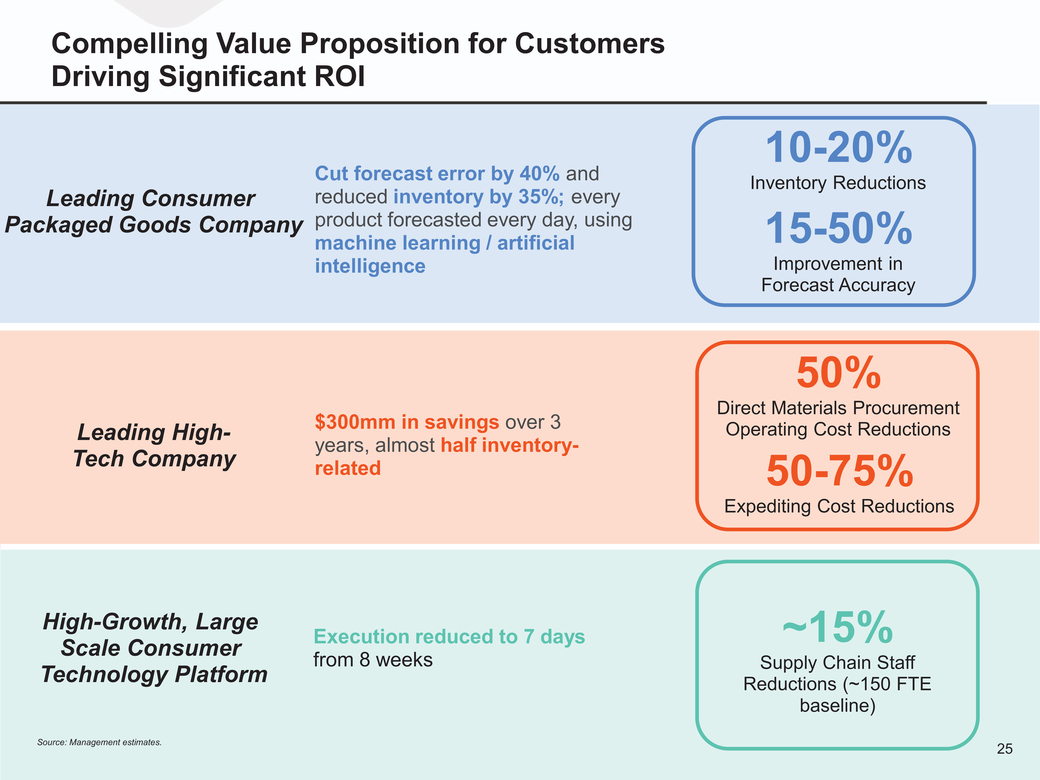 |
Compelling Value Proposition for Customers Driving Significant ROI Cut forecast error by 40% and 10-20% Inventory Reductions Leading Consumer Packaged Goods Company Leading High-Tech Company reduced inventory by 35%; every product forecasted every day, using machine learning / artificial intelligence $300mm in savings over 3 years, almost half inventory-related 15-50% Improvement in Forecast Accuracy 50% Direct Materials Procurement Operating Cost Reductions 50-75% Expediting Cost Reductions High-Growth, Large Scale Consumer Technology Platform Source: Management estimates. Execution reduced to 7 days from 8 weeks ~15% Supply Chain Staff Reductions (~150 FTE baseline) 25 |
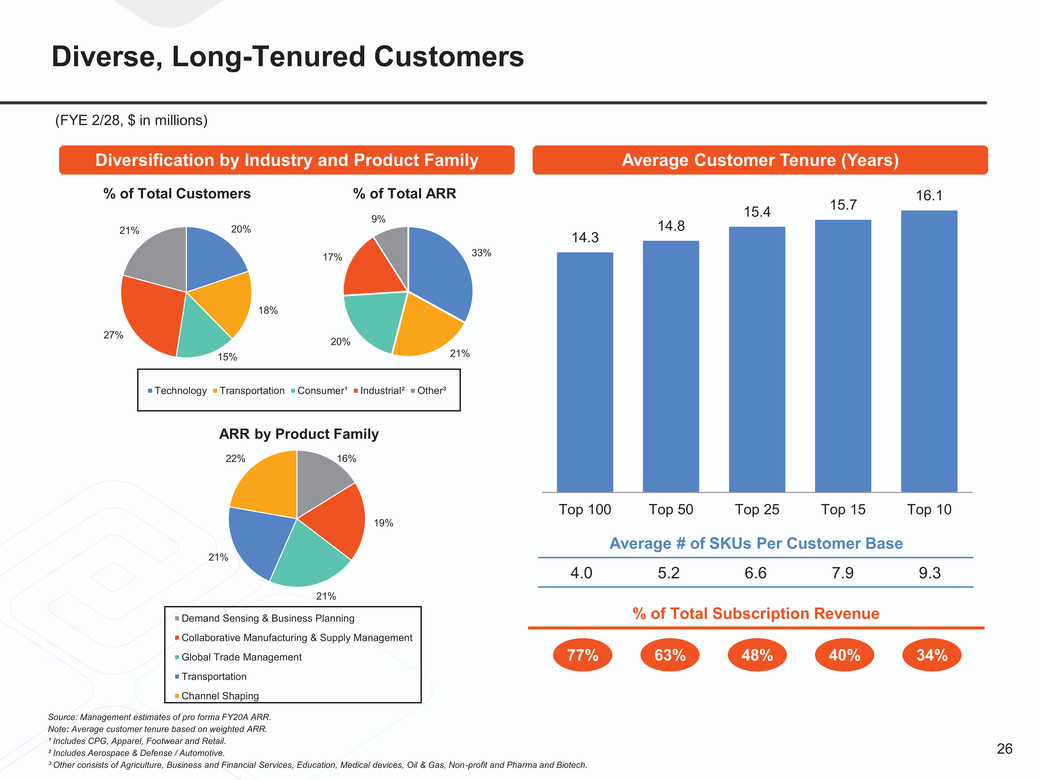 |
Diverse, Long-Tenured Customers (FYE 2/28, $ in millions) Diversification by Industry and Product FamilyAverage Customer Tenure (Years) % of Total Customers % of Total ARR 9% 15.4 15.716.1 21% 20% 17% 33% 14.8 14.3 27% 15% 18% 20% 21% Technology Transportation Consumer¹ Industrial² Other³ ARR by Product Family 22% 16% 19% Top 100Top 50Top 25Top 15Top 10 Average # of SKUs Per Customer Base 4.0 5.2 6.6 7.9 9.3 21% Demand Sensing & Business Planning Collaborative Manufacturing & Supply Management Global Trade Management Transportation Channel Shaping 77% % of Total Subscription Revenue 63%48%40% 34% Source: Management estimates of pro forma FY20A ARR. Note: Average customer tenure based on weighted ARR. ¹ Includes CPG, Apparel, Footwear and Retail. ² Includes Aerospace & Defense / Automotive. 26 ³ Other consists of Agriculture, Business and Financial Services, Education, Medical devices, Oil & Gas, Non-profit and Pharma and Biotech. |
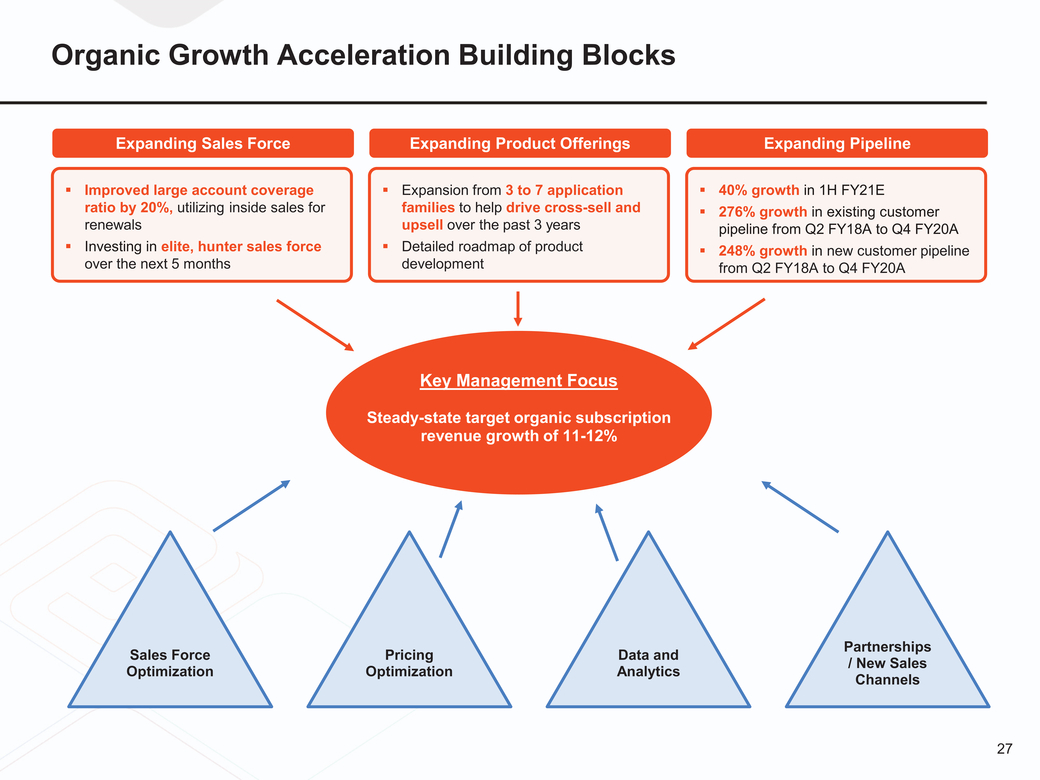 |
Organic Growth Acceleration Building Blocks Expanding Sales Force Expanding Product Offerings Expanding Pipeline Improved large account coverage ratio by 20%, utilizing inside sales for renewals Investing in elite, hunter sales force over the next 5 months Expansion from 3 to 7 application families to help drive cross-sell and upsell over the past 3 years Detailed roadmap of product development 40% growth in 1H FY21E 276% growth in existing customer pipeline from Q2 FY18A to Q4 FY20A 248% growth in new customer pipeline from Q2 FY18A to Q4 FY20A Key Management Focus Steady-state target organic subscription revenue growth of 11-12% Sales Force Optimization Pricing Optimization Data and Analytics Partnerships / New Sales Channels 27 |
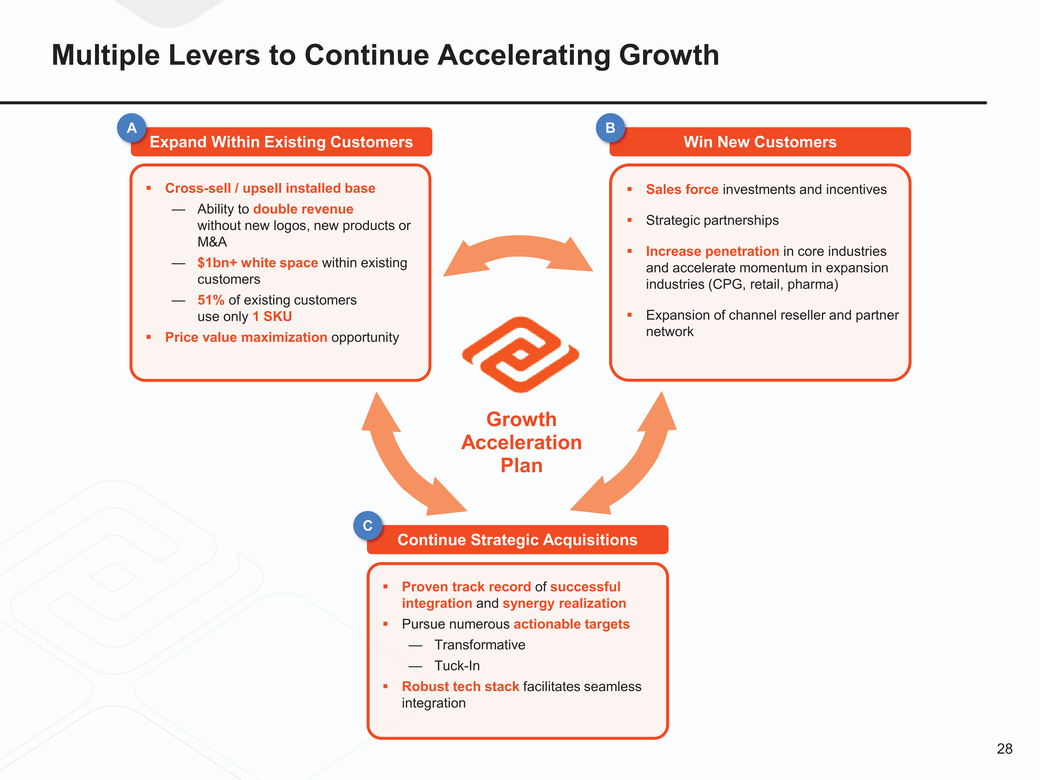 |
Multiple Levers to Continue Accelerating Growth A Expand Within Existing Customers B Win New Customers Cross-sell / upsell installed base Ability to double revenue without new logos, new products or M&A $1bn+ white space within existing customers 51% of existing customers use only 1 SKU Price value maximization opportunity Sales force investments and incentives Strategic partnerships Increase penetration in core industries and accelerate momentum in expansion industries (CPG, retail, pharma) Expansion of channel reseller and partner network Growth Acceleration Plan C Continue Strategic Acquisitions Proven track record of successful integration and synergy realization Pursue numerous actionable targets Transformative Tuck-In Robust tech stack facilitates seamless integration 28 |
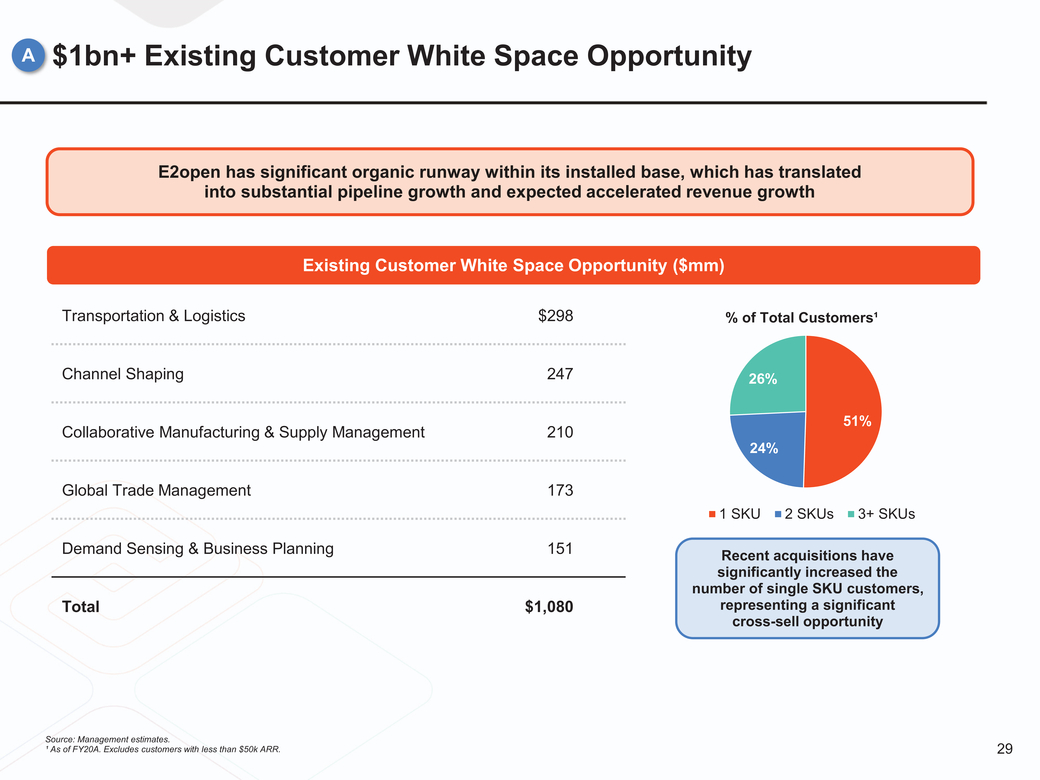 |
A$1bn+ Existing Customer White Space Opportunity E2open has significant organic runway within its installed base, which has translated into substantial pipeline growth and expected accelerated revenue growth Existing Customer White Space Opportunity ($mm) Transportation & Logistics$298 Channel Shaping 247 % of Total Customers¹ 26% Collaborative Manufacturing & Supply Management 210 24% 51% Global Trade Management 173 Demand Sensing & Business Planning 151 Total$1,080 1 SKU2 SKUs3+ SKUs Recent acquisitions have significantly increased the number of single SKU customers, representing a significant cross-sell opportunity Source: Management estimates. ¹ As of FY20A. Excludes customers with less than $50k ARR. 29 |
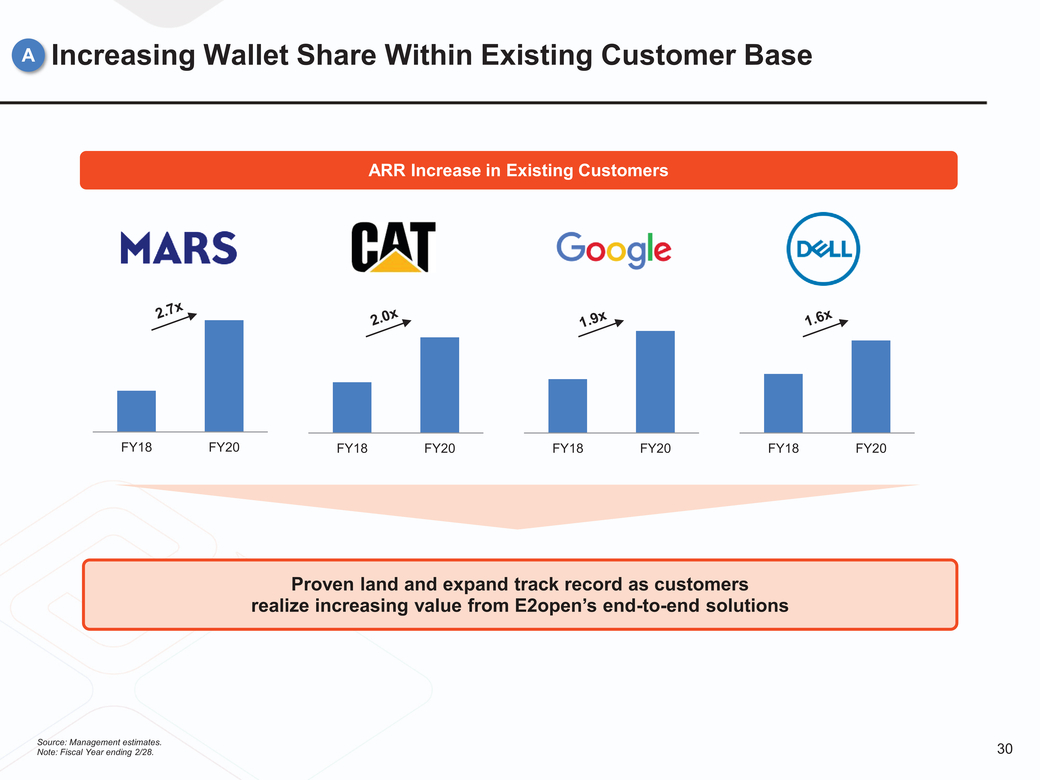 |
Increasing Wallet Share Within Existing Customer Base ARR Increase in Existing Customers FY18FY20 FY18FY20 FY18FY20 FY18FY20 Proven land and expand track record as customers realize increasing value from E2open’s end-to-end solutions 30 |
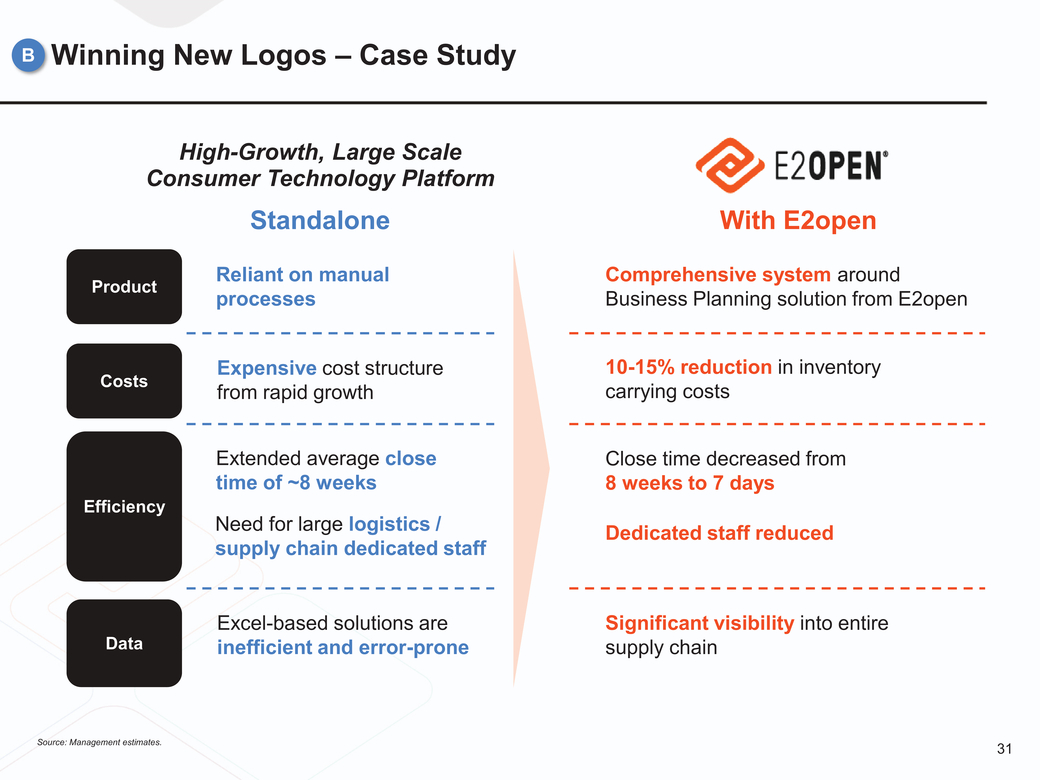 |
Winning New Logos – Case Study High-Growth, Large Scale Consumer Technology Platform StandaloneWith E2open Product Reliant on manual processes Comprehensive system around Business Planning solution from E2open Costs Efficiency Expensive cost structure from rapid growth Extended average close time of ~8 weeks Need for large logistics / supply chain dedicated staff 10-15% reduction in inventory carrying costs Close time decreased from 8 weeks to 7 days Dedicated staff reduced Data Excel-based solutions are inefficient and error-prone Significant visibility into entire supply chain Source: Management estimates. 31 |
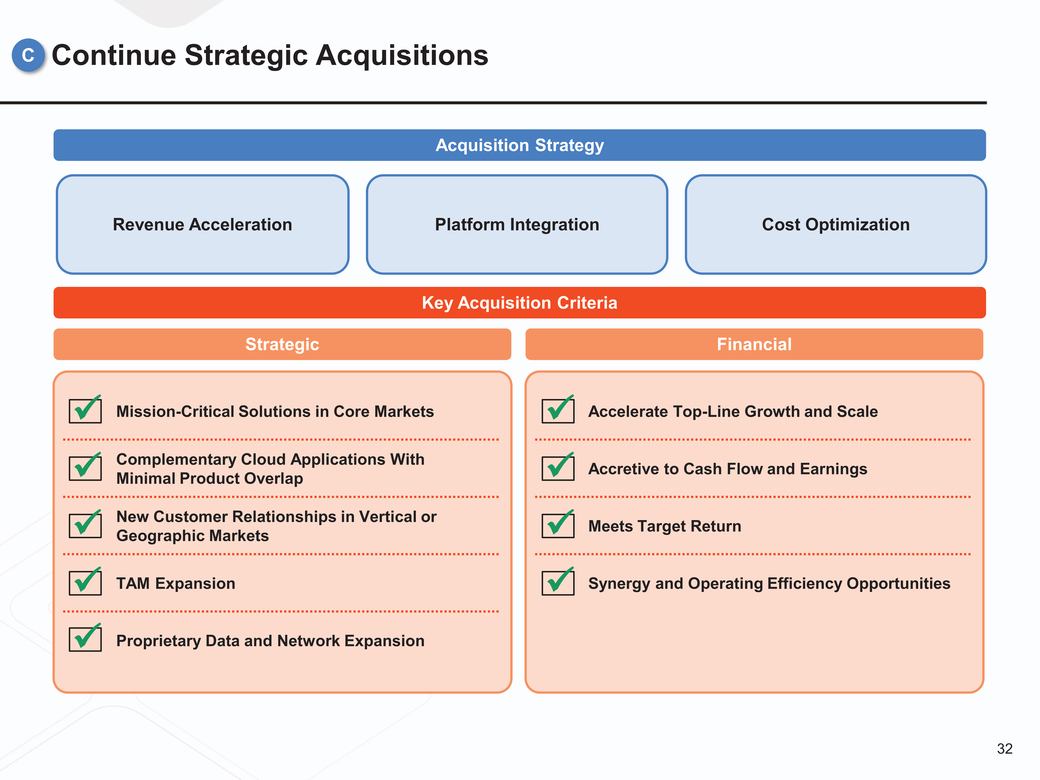 |
Continue Strategic Acquisitions Acquisition Strategy Revenue AccelerationPlatform Integration Cost Optimization Key Acquisition Criteria Strategic Financial x Minimal Product Overlap x Geographic Markets TAM Expansion Proprietary Data and Network Expansion Accelerate Top-Line Growth and Scale Accretive to Cash Flow and Earnings Meets Target Return Synergy and Operating Efficiency Opportunities 32 |
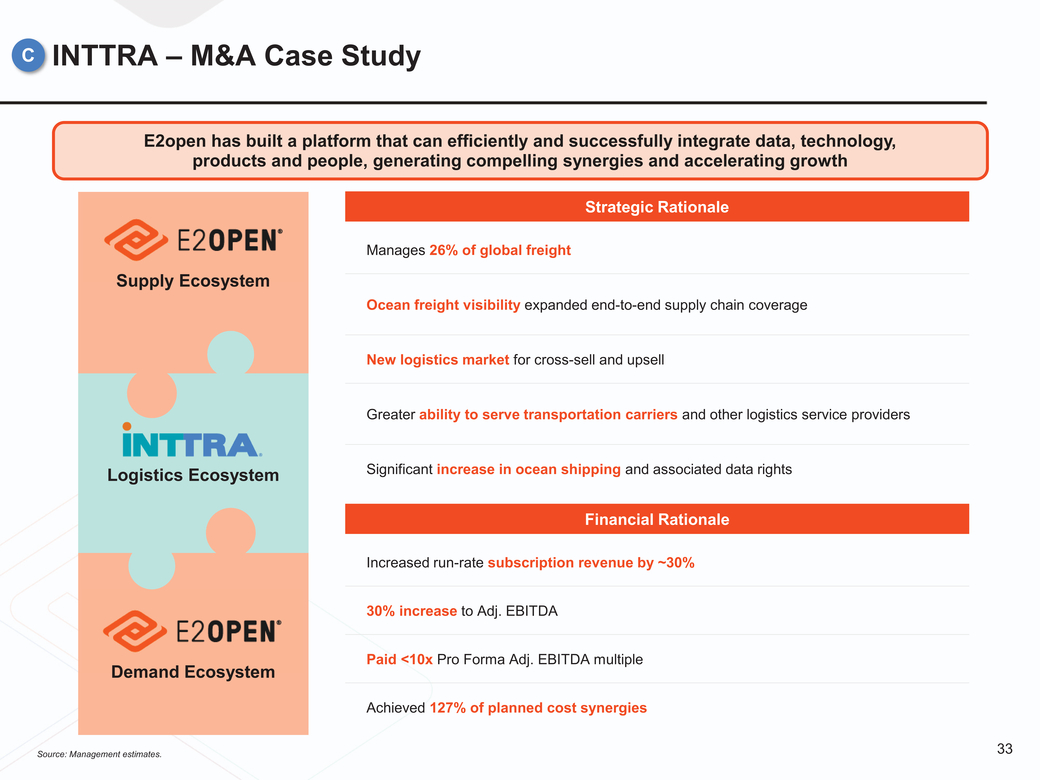 |
CINTTRA – M&A Case Study E2open has built a platform that can efficiently and successfully integrate data, technology, products and people, generating compelling synergies and accelerating growth Strategic Rationale Supply Ecosystem Logistics Ecosystem Manages 26% of global freight Ocean freight visibility expanded end-to-end supply chain coverage New logistics market for cross-sell and upsell Greater ability to serve transportation carriers and other logistics service providers Significant increase in ocean shipping and associated data rights Financial Rationale Increased run-rate subscription revenue by ~30% 30% increase to Adj. EBITDA Demand Ecosystem Paid <10x Pro Forma Adj. EBITDA multiple Achieved 127% of planned cost synergies Source: Management estimates. 33 |
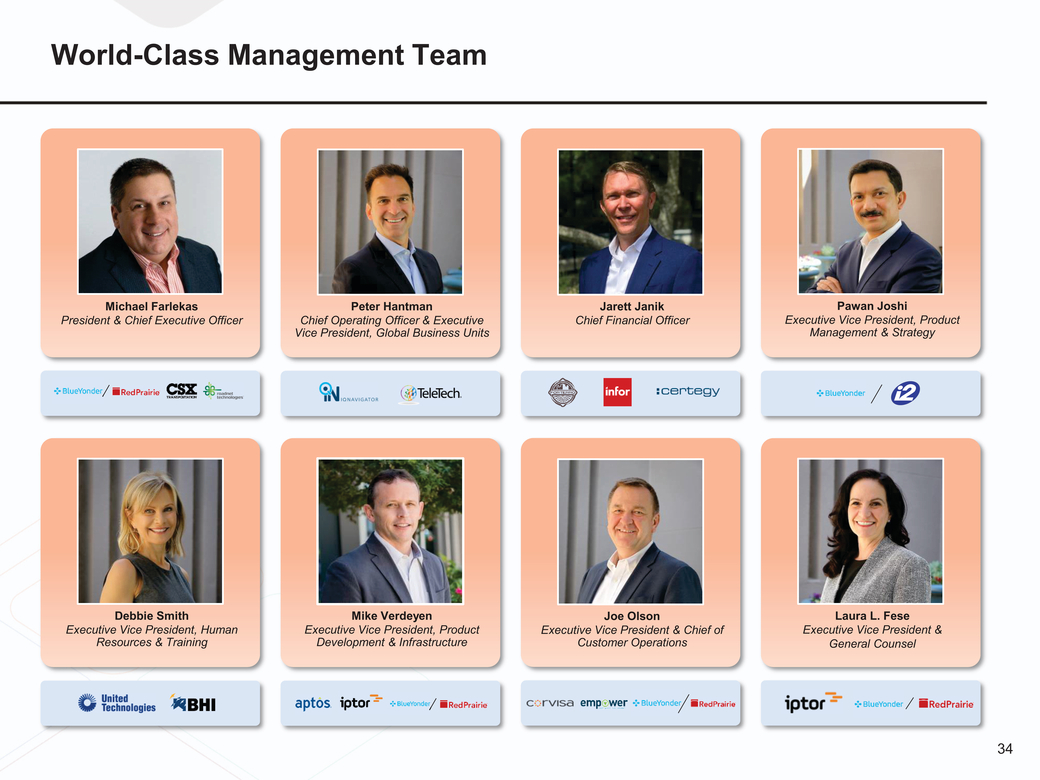 |
World-Class Management Team Michael Farlekas President & Chief Executive Officer Peter Hantman Chief Operating Officer & Executive Vice President, Global Business Units Jarett Janik Chief Financial Officer Pawan Joshi Executive Vice President, Product Management & Strategy Debbie Smith Executive Vice President, Human Resources & Training Mike Verdeyen Executive Vice President, Product Development & Infrastructure Joe Olson Executive Vice President & Chief of Customer Operations Laura L. Fese Executive Vice President & General Counsel 34 |
 |
Company Highlights 1Attractive Industry Tailwinds and Large TAM With Significant White Space 2Category-Defining End-to-End Provider of Mission-Critical Software 3 World-Class Management Team 4 5Multiple Ways to Win With Significant Growth Opportunities 35 |
 |
I II III IV Company Highlights Financial Overview Valuation Overview Appendix 36 |
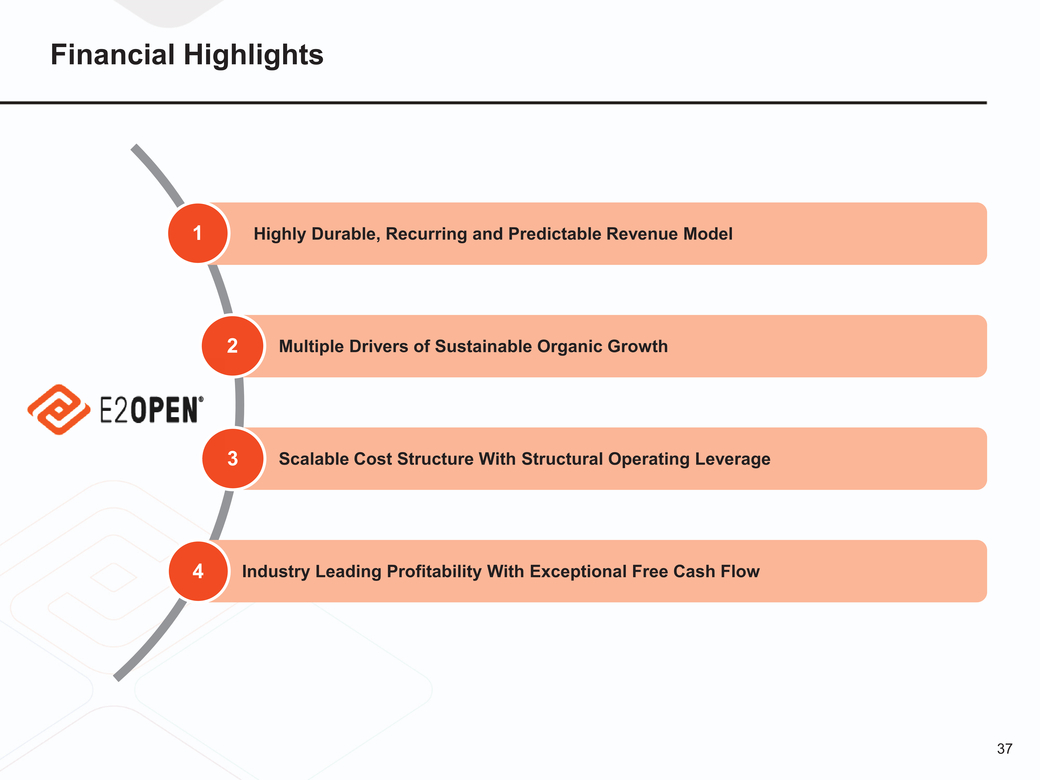 |
Financial Highlights 1Highly Durable, Recurring and Predictable Revenue Model Multiple Drivers of Sustainable Organic Growth Scalable Cost Structure With Structural Operating Leverage Industry Leading Profitability With Exceptional Free Cash Flow 37 |
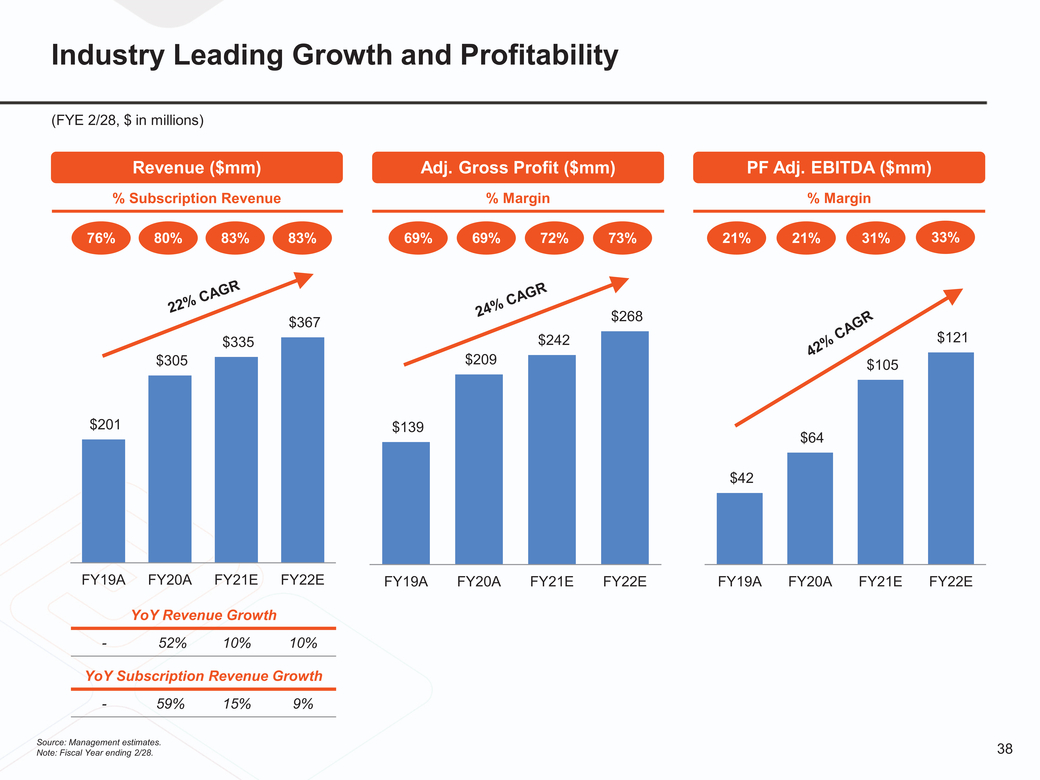 |
Industry Leading Growth and Profitability (FYE 2/28, $ in millions) Revenue ($mm)Adj. Gross Profit ($mm)PF Adj. EBITDA ($mm) % Subscription Revenue % Margin % Margin 76% 80%83%83% 69% 69%72%73% 21% 21%31%33% $305 $335 $367 $209 $242 $268 $105 $121 $201 $139 $64 $42 FY19AFY20AFY21EFY22E FY19AFY20AFY21EFY22E FY19AFY20AFY21EFY22E 38 |
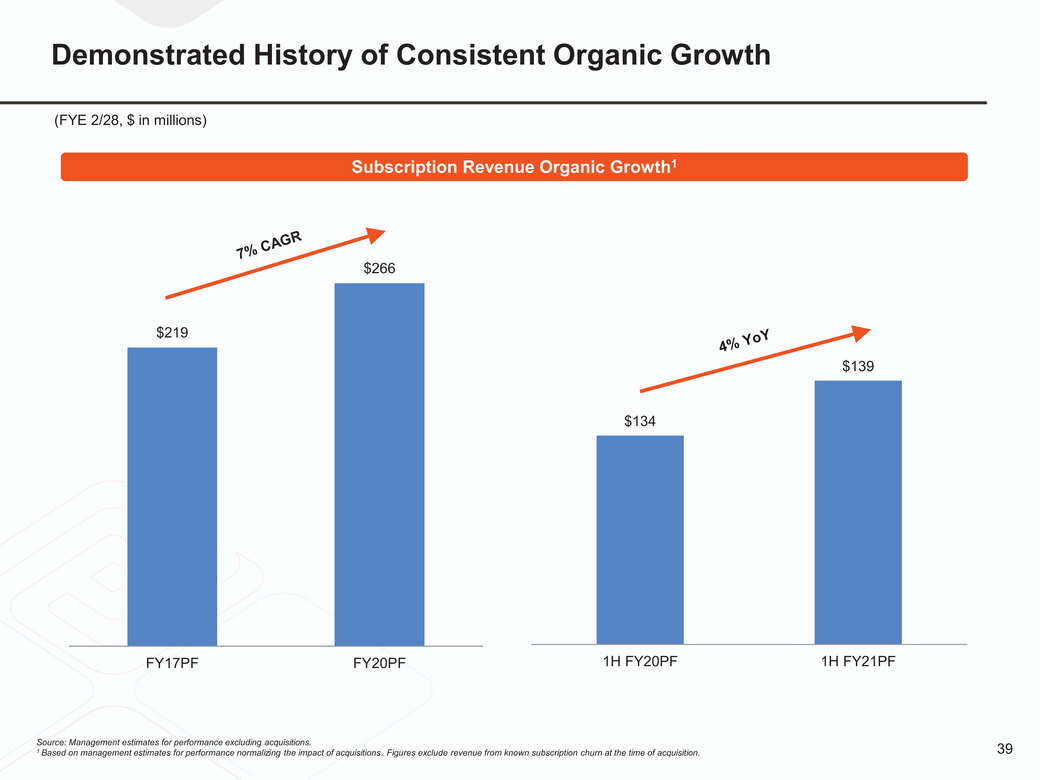 |
Demonstrated History of Consistent Organic Growth (FYE 2/28, $ in millions) Subscription Revenue Organic Growth1 $266 $219 $139 $134 FY17PFFY20PF 1H FY20PF1H FY21PF 39 1 Based on management estimates for performance normalizing the impact of acquisitions. Figures exclude revenue from known subscription churn at the time of acquisition. |
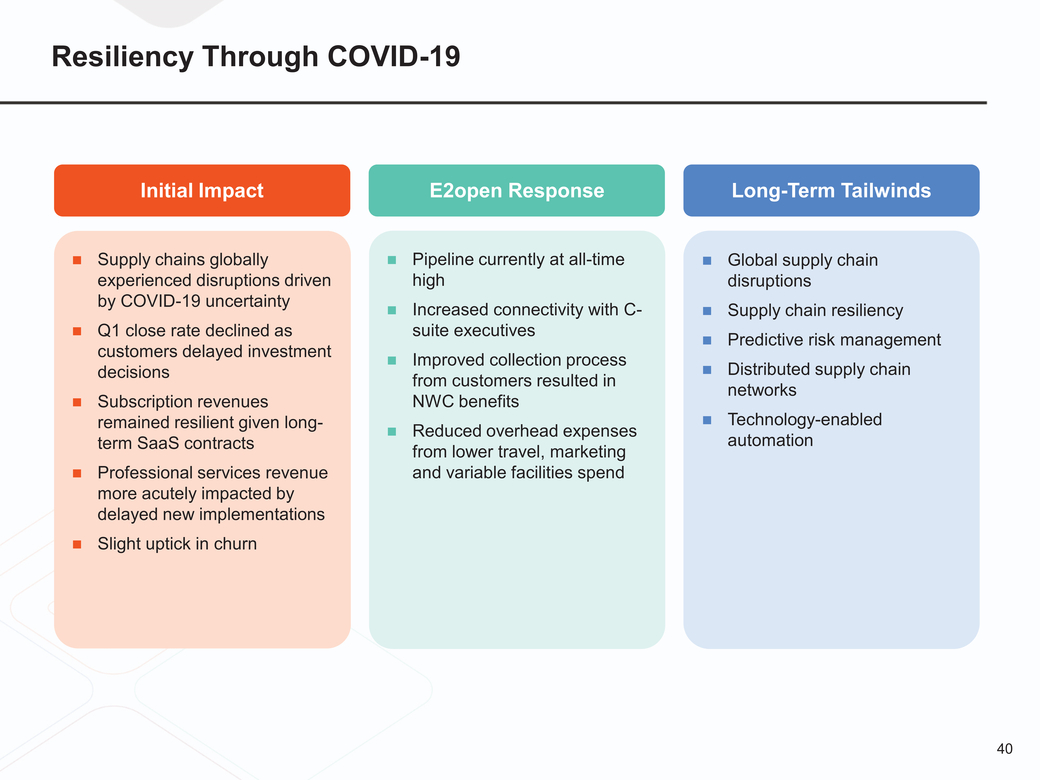 |
Resiliency Through COVID-19 Initial ImpactE2open ResponseLong-Term Tailwinds Supply chains globally experienced disruptions driven by COVID-19 uncertainty Q1 close rate declined as customers delayed investment decisions Subscription revenues remained resilient given long-term SaaS contracts Professional services revenue more acutely impacted by delayed new implementations Slight uptick in churn Pipeline currently at all-time high Increased connectivity with C-suite executives Improved collection process from customers resulted in NWC benefits Reduced overhead expenses from lower travel, marketing and variable facilities spend Global supply chain disruptions Supply chain resiliency Predictive risk management Distributed supply chain networks Technology-enabled automation 40 |
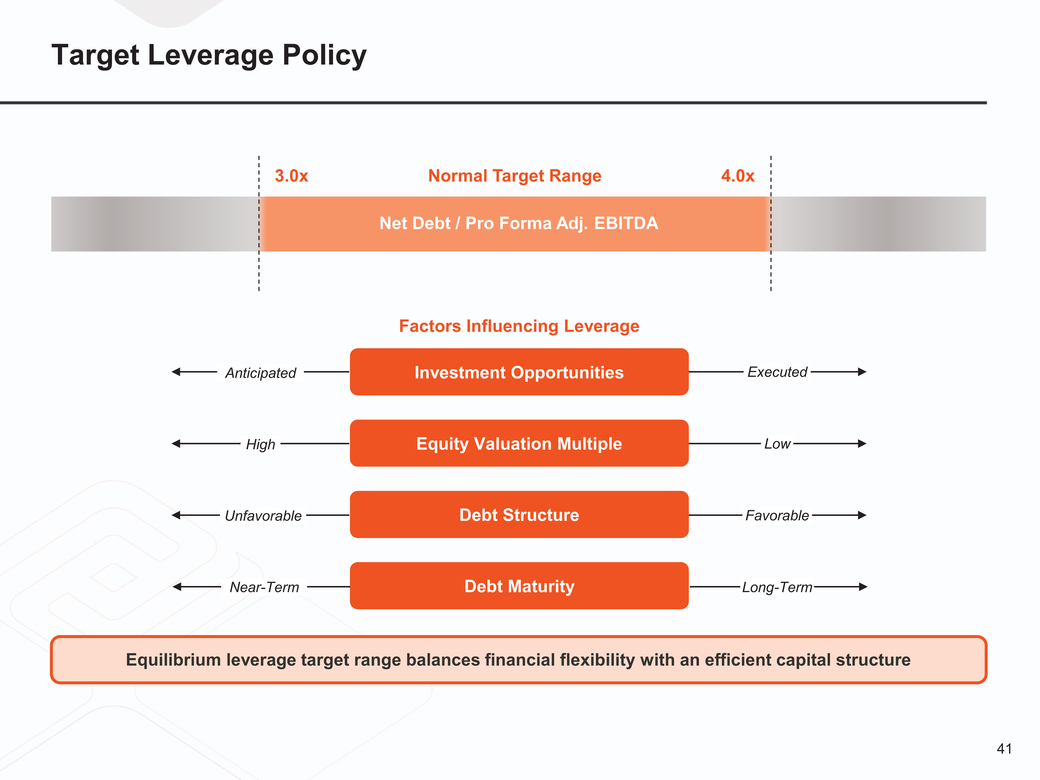 |
Target Leverage Policy 3.0xNormal Target Range4.0x Net Debt / Pro Forma Adj. EBITDA Factors Influencing Leverage Anticipated Investment Opportunities Executed High Equity Valuation Multiple Low Unfavorable Debt Structure Favorable Near-Term Debt MaturityLong-Term Equilibrium leverage target range balances financial flexibility with an efficient capital structure 41 |
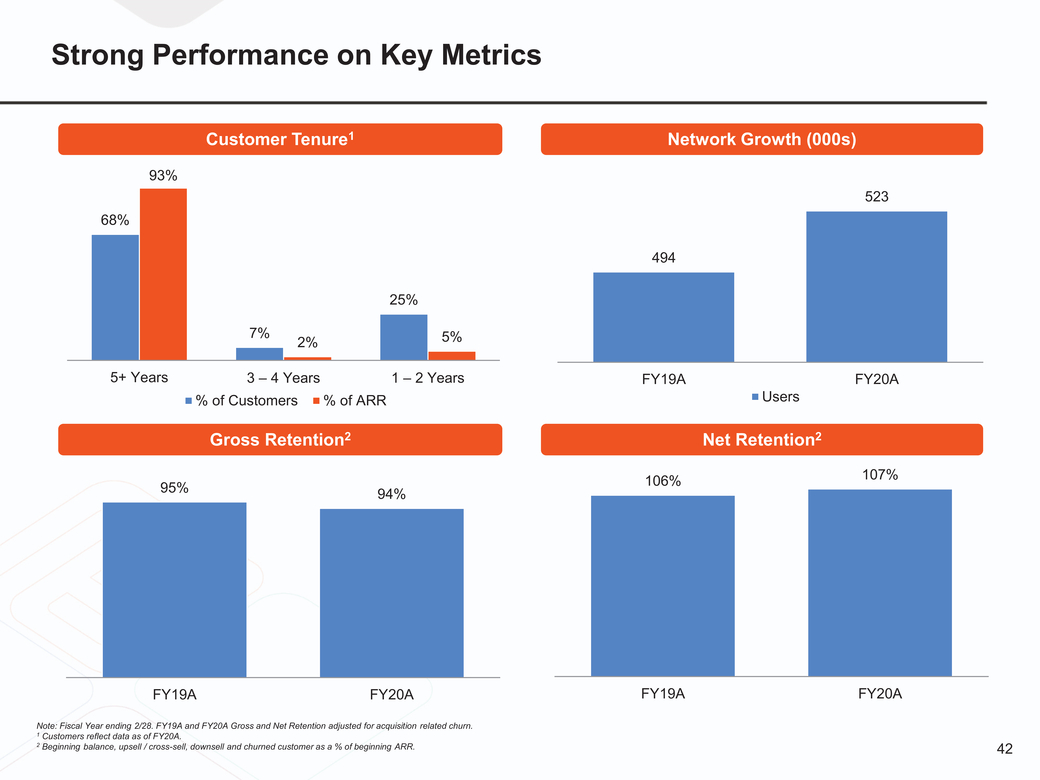 |
Strong Performance on Key Metrics Customer Tenure1Network Growth (000s) 68% 93% 523 494 25% 7%2%5% 5+ Years3 – 4 Years1 – 2 Years % of Customers% of ARR FY19AFY20A Users 95% Gross Retention2Net Retention2 106%107% FY19AFY20A FY19AFY20A Note: Fiscal Year ending 2/28. FY19A and FY20A Gross and Net Retention adjusted for acquisition related churn. Customers reflect data as of FY20A. Beginning balance, upsell / cross-sell, downsell and churned customer as a % of beginning ARR. 42 |
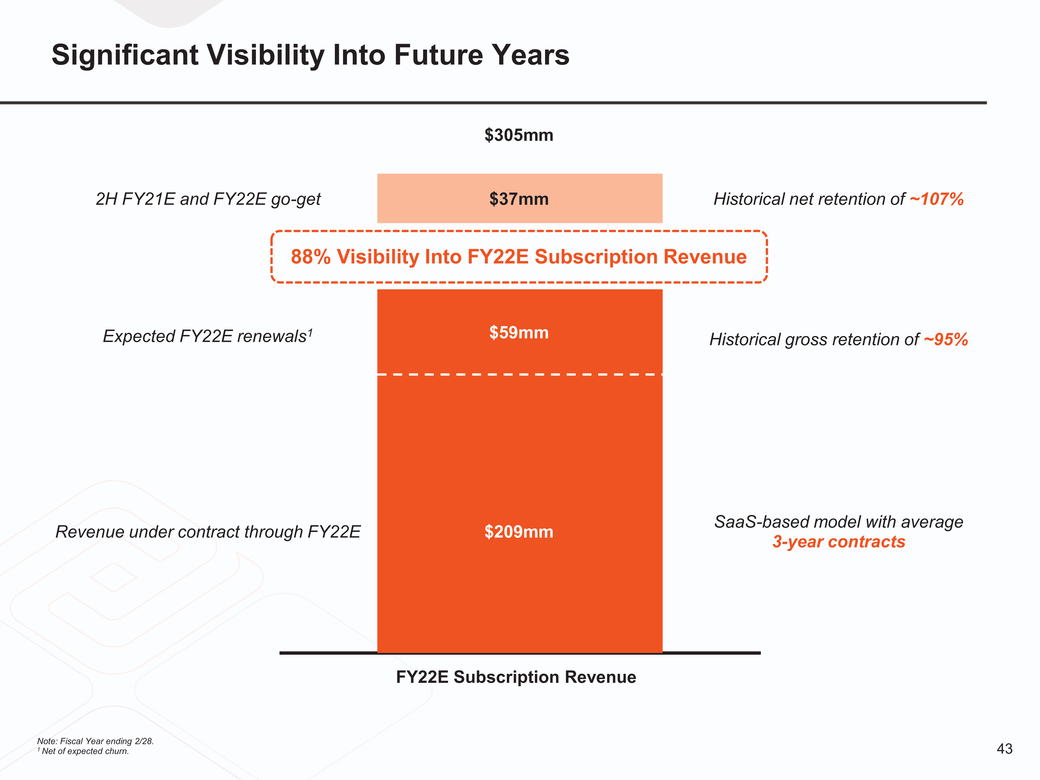 |
Significant Visibility Into Future Years $305mm 2H FY21E and FY22E go-get $37mm Historical net retention of ~107% 88% Visibility Into FY22E Subscription Revenue Expected FY22E renewals1 $59mmHistorical gross retention of ~95% Revenue under contract through FY22E $209mm SaaS-based model with average 3-year contracts FY22E Subscription Revenue Note: Fiscal Year ending 2/28. 1 Net of expected churn. 43 |
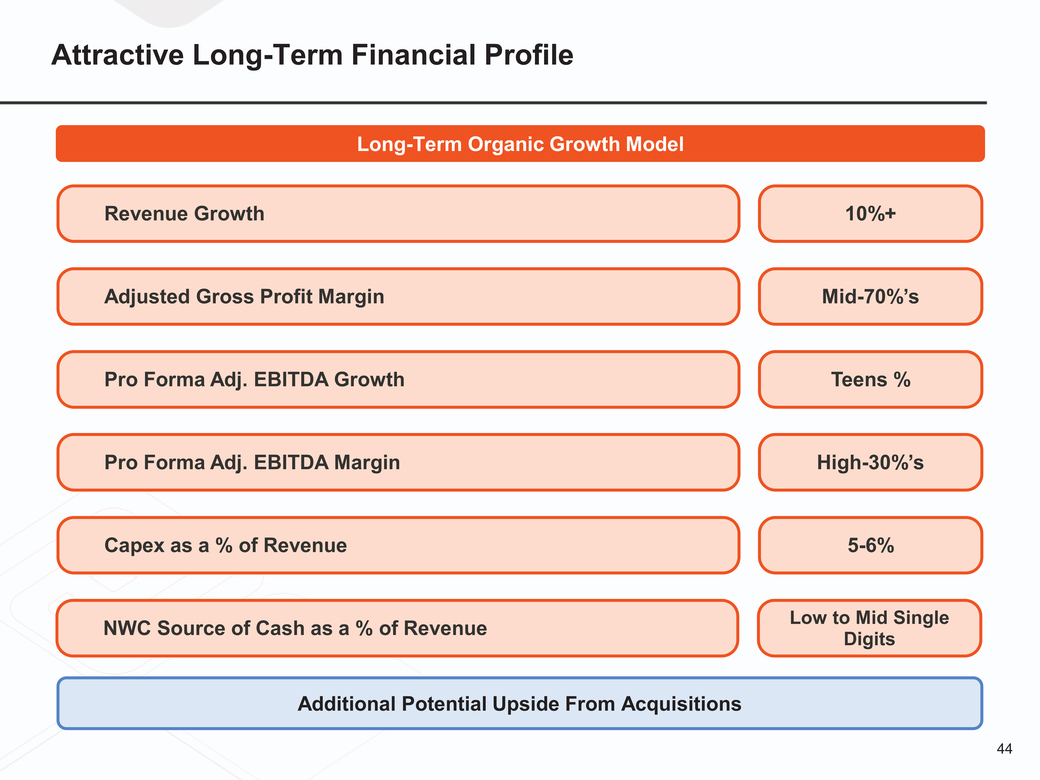 |
Attractive Long-Term Financial Profile Long-Term Organic Growth Model Revenue Growth 10%+ Adjusted Gross Profit MarginMid-70%’s Pro Forma Adj. EBITDA Growth Teens % Pro Forma Adj. EBITDA Margin High-30%’s Capex as a % of Revenue 5-6% NWC Source of Cash as a % of RevenueLow to Mid Single Digits Additional Potential Upside From Acquisitions 44 |
 |
I II III IV Company Highlights Financial Overview Valuation Overview Appendix 45 |
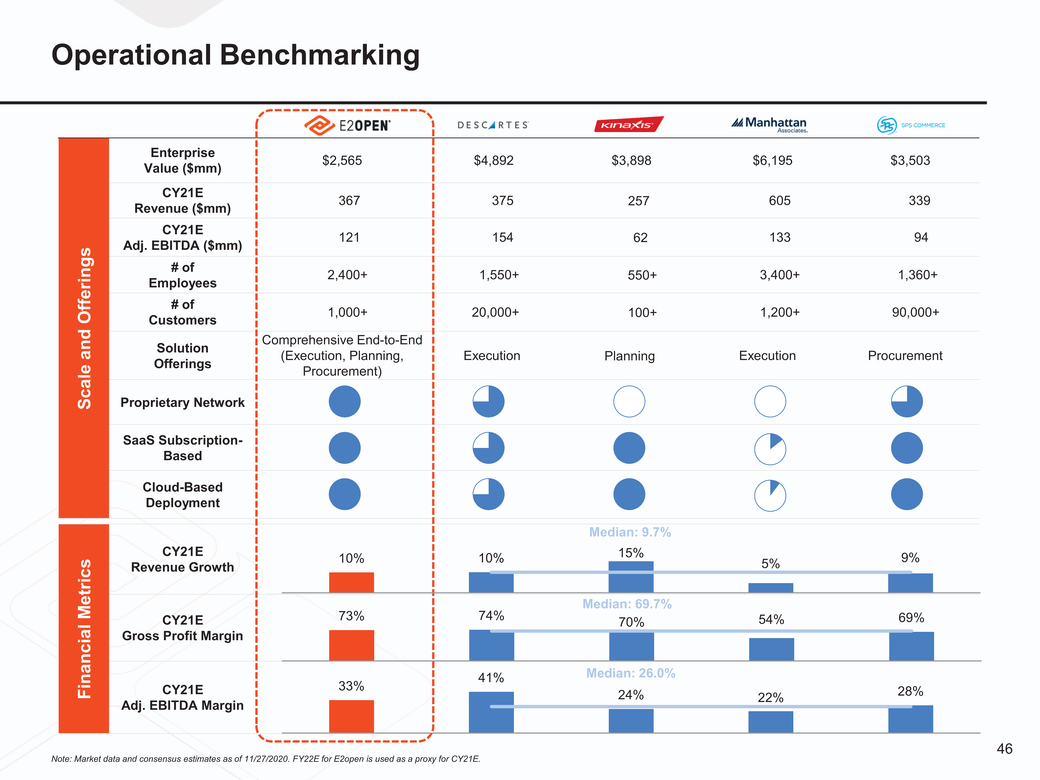 |
Operational Benchmarking Enterprise Value ($mm)$2,565$4,892$3,898$6,195$3,503 CY21E Scale and Offerings Employees2,400+1,550+550+3,400+1,360+ # of Customers1,000+20,000+100+1,200+90,000+ Solution Offerings Comprehensive End-to-End (Execution, Planning, Procurement) ExecutionPlanningExecutionProcurement Proprietary Network SaaS Subscription-Based Cloud-Based Deployment Financial Metrics Revenue Growth CY21E Gross Profit Margin Median: 9.7% 10%10%15%5%9% Median: 69.7% 73%74%70%54%69% CY21E Adj. EBITDA Margin 33% 41% Median: 26.0% 24%22%28% 46 Note: Market data and consensus estimates as of 11/27/2020. FY22E for E2open is used as a proxy for CY21E. |
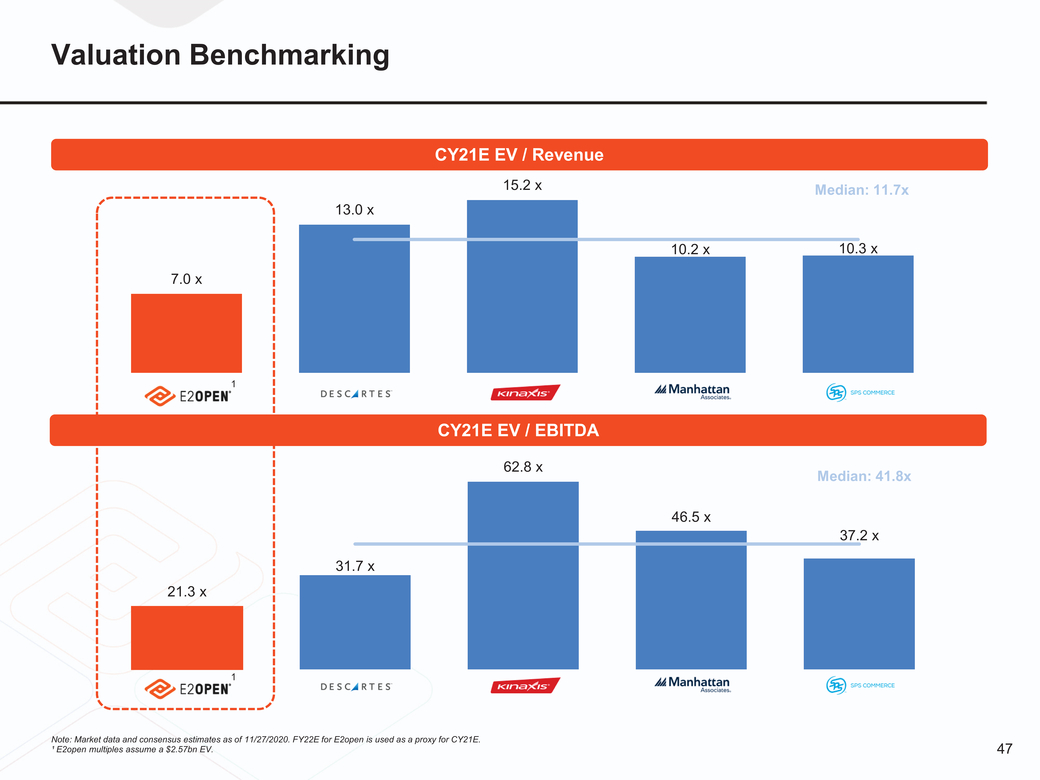 |
Valuation Benchmarking 13.0 x CY21E EV / Revenue 15.2 x Median: 11.7x 10.2 x10.3 x 7.0 x 1 CY21E EV / EBITDA 62.8 x Median: 41.8x 46.5 x 37.2 x 21.3 x 31.7 x 1 Note: Market data and consensus estimates as of 11/27/2020. FY22E for E2open is used as a proxy for CY21E. ¹ E2open multiples assume a $2.57bn EV. 47 |
 |
[LOGO] |
 |
I II III IV Company Highlights Financial Overview Valuation Overview Appendix 49 |
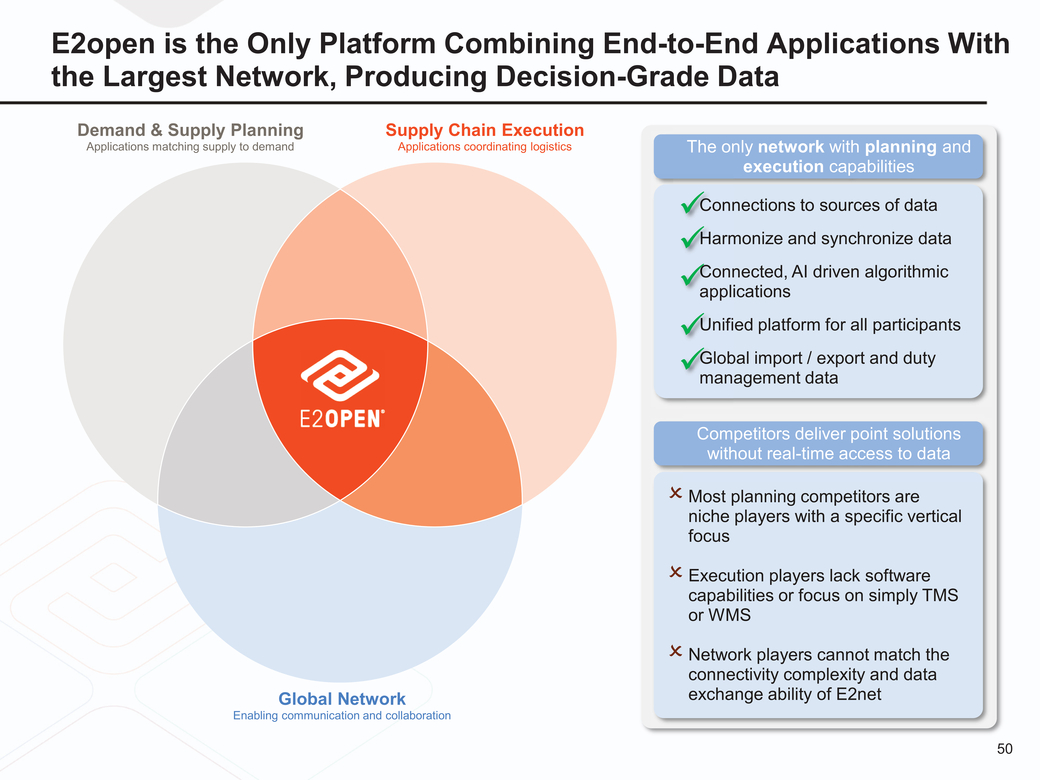 |
E2open is the Only Platform Combining End-to-End Applications With the Largest Network, Producing Decision-Grade Data Demand & Supply Planning Applications matching supply to demand Supply Chain Execution Applications coordinating logistics The only network with planning and execution capabilities xConnections to sources of data xHarmonize and synchronize data x x Global Network Enabling communication and collaboration Competitors deliver point solutions without real-time access to data Most planning competitors are niche players with a specific vertical focus Execution players lack software capabilities or focus on simply TMS or WMS Network players cannot match the connectivity complexity and data exchange ability of E2net 50 |
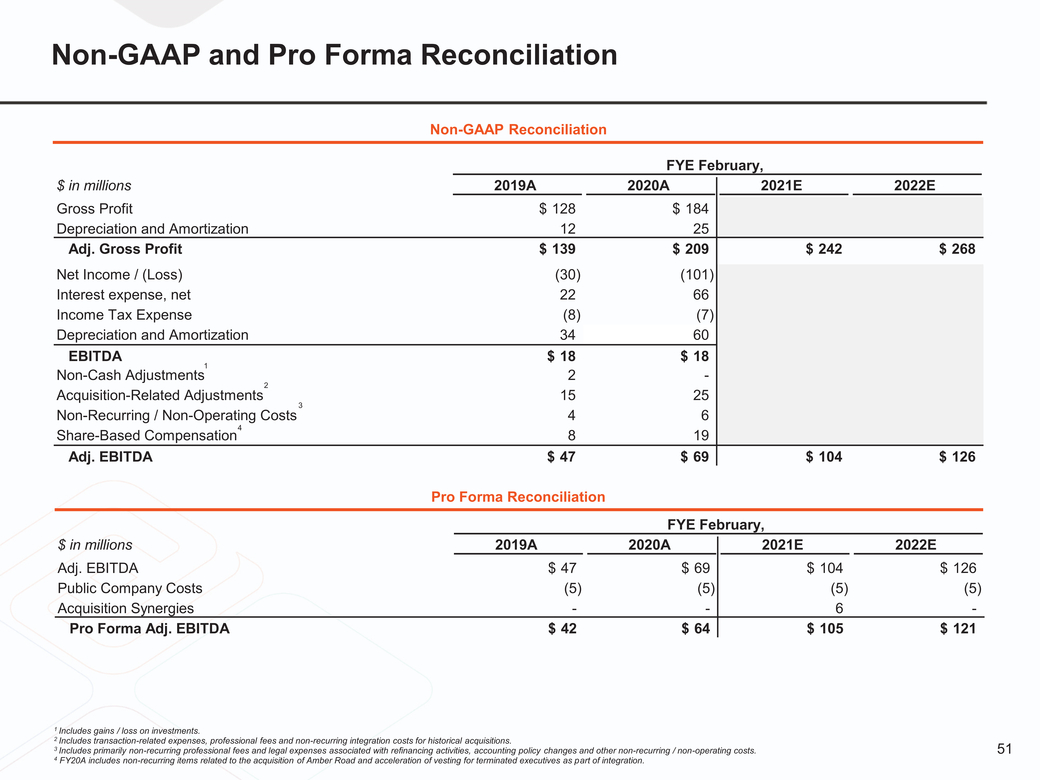 |
Non-GAAP and Pro Forma Reconciliation Non-GAAP Reconciliation FYE February, Pro Forma Reconciliation FYE February, Includes gains / loss on investments. Includes transaction-related expenses, professional fees and non-recurring integration costs for historical acquisitions. Includes primarily non-recurring professional fees and legal expenses associated with refinancing activities, accounting policy changes and other non-recurring / non-operating costs. 51 FY20A includes non-recurring items related to the acquisition of Amber Road and acceleration of vesting for terminated executives as part of integration. |
Serious News for Serious Traders! Try StreetInsider.com Premium Free!
You May Also Be Interested In
- Roper Technologies announces first quarter financial results
- Krystal Biotech to Report First Quarter 2024 Financial Results on May 6, 2024
- Informative Research’s Ryan Kaufman Named HousingWire’s 2024 Rising Star
Create E-mail Alert Related Categories
SEC FilingsSign up for StreetInsider Free!
Receive full access to all new and archived articles, unlimited portfolio tracking, e-mail alerts, custom newswires and RSS feeds - and more!
