



Form 40FR12B/A Kirkland Lake Gold Ltd.
 Tweet
Tweet Share
Share E-mail
UNITED STATES
SECURITIES AND EXCHANGE COMMISSION
Washington, D.C. 20549
_______________________
FORM 40-F/A
(Amendment No. 4)
[X] Registration statement pursuant to Section 12 of the Securities Exchange Act of 1934
or
[ ] Annual report pursuant to Section 13(a) or 15(d) of the Securities Exchange Act of 1934
| For the fiscal year ended _______________________ | Commission File Number 001-38179 |
_______________________
Kirkland Lake Gold Ltd.
(Exact name of Registrant as specified in its charter)
| Ontario | 1000 | Not Applicable |
| (Province or other jurisdiction of | (Primary Standard Industrial Classification | (I.R.S. Employer |
| incorporation or organization) | Code Number) | Identification Number) |
200 Bay Street, Suite 3120
Toronto, Ontario M5J 2J1
Canada
(416) 840-7884
(Address and
telephone number of Registrant’s principal executive offices)
_______________________
Registered Agent Solutions, Inc.
99 Washington Avenue
Suite 1008
Albany, NY 12260
(888)
705-7274
(Name, address (including zip code) and telephone number
(including
area code) of agent for service in the United States)
_______________________
Securities registered or to be registered pursuant to Section 12(b) of the Act:
| Title of each class | Name of each exchange on which registered |
| Common Shares, no par value | New York Stock Exchange |
Securities registered pursuant to Section 12(g) of the Act: None.
Securities for which there is a reporting obligation pursuant to Section 15(d) of the Act: None
For annual reports, indicate by check mark the information filed with this Form:
| [ ] Annual information form | [ ]Audited annual financial statements |
Indicate the number of outstanding shares of each of the registrant’s classes of capital or common stock as of the close of the period covered by the annual report: N/A
Indicate by check mark whether the registrant: (1) has filed all reports required to be filed by Section 13 or 15(d) of the Exchange Act during the preceding 12 months (or for such shorter period that the registrant was required to file such reports); and (2) has been subject to such filing requirements for the past 90 days. [ ] Yes [ ] No
Indicate by check mark by filing the information contained in this Form is also thereby furnishing the information to the Commission pursuant to Rule 12g3-2(b) under the Securities Exchange Act of 1934 (the “Exchange Act”). If “Yes” is marked, indicate the file number assigned to the Registrant in connection with such Rule. [ ] Yes [X] No
Indicate by check mark whether the registrant is an emerging growth company as defined in Rule 12b-2 of the Exchange Act.
Emerging growth company [X]
If an emerging growth company that prepares its financial statements in accordance with U.S. GAAP, indicate by check mark if the registrant has elected not to use the extended transition period for complying with any new or revised financial accounting standards† provided pursuant to Section 13(a) of the Exchange Act. [ ]
The term “new or revised financial accounting standard” refers to any update issued by the Financial Accounting Standards Board to its Accounting Standards Codification after April 5, 2012.
EXPLANATORY NOTE
Kirkland Lake Gold Ltd. (the “Company”, the “Registrant”) is a Canadian issuer eligible to file its registration statement pursuant to Section 12 of the Securities Exchange Act of 1934, as amended (the “Exchange Act”), on Form 40-F pursuant to the multi-jurisdictional disclosure system of the Exchange Act. The Company is a “foreign private issuer” as defined in Rule 3b-4 under the Exchange Act. Equity securities of the Company are accordingly exempt from Sections 14(a), 14(b), 14(c), 14(f) and 16 of the Exchange Act pursuant to Rule 3a12-3.
The Company filed a Registration Statement on Form 40-F on August 4, 2017 (the “Original Form 40-F”), an Amendment No. 1 to the Original Form 40-F on August 4, 2017 (the “Amendment No. 1), an Amendment No. 2 to the Original Form 40-F on August 4, 2017 (the “Amendment No. 2) and an Amendment No. 3 to the Original Form 40-F on August 4, 2017. The Company is filing this Amendment No. 4 for the sole purpose of filing exhibits that were too large to be filed with the Original Form 40-F, the Amendment No. 1, the Amendment No. 2 and the Amendment No. 3.
4
SIGNATURES
Pursuant to the requirements of the Exchange Act, the Registrant certifies that it meets all of the requirements for filing on Form 40-F and has duly caused this Registration Statement to be signed on its behalf by the undersigned, thereunto duly authorized.
| KIRKLAND LAKE GOLD LTD. | |
| By: | /s/ Jennifer Wagner |
| Name: Jennifer Wagner | |
| Title: Corporate Secretary | |
Date: August 4, 2017
5
EXHIBIT INDEX
The following documents are being filed with the Commission as Exhibits to this Registration Statement:
| Exhibit | Description |
| 99.1* | Annual Audited Consolidated Financial Statements for Kirkland Lake Gold Ltd. as at December 31, 2016, December 31, 2015, April 30, 2015 and April 30, 2014 and the Year Ended December 31, 2016, the Eight-Month Period Ended December 31, 2015 and Year Ended April 30, 2015* |
| 99.2* | Management's Discussion and Analysis for the year ended December 31, 2016* |
| 99.3* | Annual Information Form dated March 30, 2017* |
| 99.4* | Certification of Refiled Annual Financial Statements by the CEO dated August 1 2017* |
| 99.5* | Certification of Refiled Annual Financial Statements by the CFO dated August 1 2017* |
| 99.6* | Indenture dated July 19, 2012* |
| 99.7* | Supplemental Indenture dated November 7, 2012* |
| 99.8* | Arrangement Agreement dated November 16, 2015* |
| 99.9* | News Release dated January 11, 2016* |
| 99.10* | News Release dated January 18, 2016* |
| 99.11* | News Release dated January 26, 2016* |
| 99.12* | Articles of Arrangement dated January 26, 2016* |
| 99.13* | News Release dated February 2, 2016* |
| 99.14* | News Release dated February 12, 2016* |
| 99.15* | Material Change Report dated February 17, 2016* |
| 99.16* | News Release dated February 26, 2016* |
| 99.17* | News Release dated February 29, 2016* |
| 99.18* | News Release dated March 4, 2016* |
| 99.19* | Consolidated Financial Statements for the years ended December 31, 2015 and 2014* |
| 99.20* | Management’s Discussion and Analysis for the years ended December 31, 2015 and 2014* |
| 99.21* | Confirmation of Notice of Record and Meeting Dates dated March 16, 2016* |
| 99.22* | News Release dated March 21, 2016* |
| 99.23** | Technical Report for the Maud Creek Gold Project, Northern Territory Australia dated March 21, 2016** |
| 99.24** | Technical Report for the Stawell Gold Mine, Victoria, Australia dated March 16, 2016** |
| 99.25** | Report on the Mineral Resources & Minerals Reserves of the Northern Territory Operations, Northern Territory, Australia dated March 21, 2016** |
| 99.26*** | Report on the Mineral Resources & Mineral Reserves of the Fosterville Gold Mine, Victoria, Australia dated March 21, 2016*** |
| 99.27* | Annual Information Form for the year ended December 31, 2015* |
| 99.28* | Certification of Annual Filings in connection with filing of Annual Information Form by CEO March 21, 2016* |
| 99.29* | Certification of Annual Filings in connection with filing of Annual Information Form by CFO March 21, 2016* |
6
| Exhibit | Description |
| 99.30* | Material Change Report dated March 21, 2016* |
| 99.31* | Revised Confirmation of Notice of Record and Meeting Dates dated March 28, 2016* |
| 99.32* | News Release dated March 30, 2016* |
| 99.33* | News Release dated April 4, 2016* |
| 99.34* | News Release dated April 6, 2016* |
| 99.35* | News Release dated April 12, 2016* |
| 99.36* | Notice of Annual General Meeting of Shareholders dated April 7, 2016* |
| 99.37* | Management Information Circular dated April 7, 2016* |
| 99.38* | Form of Proxy dated April 22, 2016* |
| 99.39* | News Release dated April 26, 2016* |
| 99.40* | News Release dated April 29, 2016* |
| 99.41* | Condensed Interim Consolidated Financial Statements for the three months ended March 31, 2016 and 2015* |
| 99.42* | Management’s Discussion and Analysis for the three months ended March 31, 2016 and 2015* |
| 99.43* | Certification of Interim Filings by CEO April 29, 2016* |
| 99.44* | Certification of Interim Filings by CFO April 29, 2016* |
| 99.45* | News Release dated May 9, 2016* |
| 99.46* | News Release dated May16, 2016* |
| 99.47*** | Technical Report and Preliminary Economic Assessment of the Maud Creek Gold Project, Northern Territory, Australia dated May 16, 2016*** |
| 99.48* | News Release dated May 18, 2016* |
| 99.49*** | Amended Technical Report and Preliminary Economic Assessment of the Maud Creek Gold Project, Northern Territory, Australia dated May 18, 2016*** |
| 99.50* | Material Change Report dated May 18, 2016* |
| 99.51* | News Release dated May 26, 2016* |
| 99.52* | Report of voting results dated May 26, 2016* |
| 99.53* | News release dated June 27, 2016* |
| 99.54* | News release dated July 12, 2016* |
| 99.55* | News release dated July 29, 2016* |
| 99.56* | Management’s Discussion and Analysis for the three and six months ended June 30, 2016* |
| 99.57* | Condensed Interim Consolidated Financial Statements for the three and six months ended June 30, 2016 and 2015* |
| 99.58* | Certification of Interim Filings by CEO dated July 29, 2016,* |
| 99.59* | Certification of Interim Filings by CFO dated July 29, 2016* |
| 99.60* | News release dated August 3, 2016* |
| 99.61* | News release dated August 22, 2016* |
| 99.62* | News release dated September 14, 2016* |
7
| Exhibit | Description |
| 99.63* | News release dated September 20, 2016* |
| 99.64* | News release dated September 29, 2016* |
| 99.65* | Form of Voting and Support Agreement dated September 29, 2016 re Kirkland Lake Gold Inc.* |
| 99.66* | Form of Voting and Support Agreement dated September 29, 2016 re Kirkland Lake Gold Inc.* |
| 99.67* | Form of Voting and Support Agreement dated September 29, 2016 re Newmarket Gold Inc.* |
| 99.68* | Arrangement Agreement dated September 29, 2016* |
| 99.69* | Material Change Report dated October 4, 2016* |
| 99.70* | Confirmation of Notice of Record and Meeting Dates dated October 12, 2016* |
| 99.71* | News release dated October 13, 2016* |
| 99.72* | Revised Confirmation of Notice of Record and Meeting Dates dated October 13, 2016* |
| 99.73* | Certificate of Officer dated October 31, 2016* |
| 99.74* | Notice of Special Meeting of Shareholder of Newmarket Gold Inc. dated October 28, 2016* |
| 99.75* | Joint Management Information Circular Concerning an Arrangement Involving Kirkland Lake Gold Inc. and Newmarket Gold Inc. dated October 28, 2016* |
| 99.76* | Annual Information Form of Kirkland Lake Gold Inc. dated March 10, 2016* |
| 99.77* | Audited Financial statements of Kirkland Lake Gold Inc. for the stub year ended December 31, 2015 and the year ended April 30, 2015* |
| 99.78* | Management’s Discussion and Analysis of Kirkland Lake Gold Inc. for the eight month (stub) year ended December 31, 2015* |
| 99.79* | Unaudited Condensed Consolidated Interim Financial Statements of Kirkland Lake Gold Inc. as at and for the three and six month period ended June 30, 2016 and July 31, 2015* |
| 99.80* | Management’s Discussion and Analysis of Kirkland Lake Gold Inc. for the three and six months ended June 30, 2016* |
| 99.81* | Management Information Circular of Kirkland Lake Gold Inc. dated May 16, 2016* |
| 99.82* | Management Information Circular of Kirkland Lake Gold Inc. dated December 15, 2015* |
| 99.83* | Management information circular of Kirkland Lake Gold Inc. dated September 23, 2015* |
| 99.84* | Material Change Report of Kirkland Lake Gold Inc. dated October 3, 2016* |
| 99.85* | Material Change Report of Kirkland Lake Gold Inc. dated January 27, 2016* |
| 99.86* | News Release dated August 2, 2017* |
| 99.87* | Joint Management Information Circular of Newmarket Gold Inc. and Crocodile Gold Corp. dated June 2, 2015* |
| 99.88* | News Release dated October 31, 2016* |
| 99.89* | Form of proxy dated October 31, 2016* |
| 99.90* | News Release dated November 3, 2016* |
| 99.91* | Management’s Discussion and Analysis for the three and nine months ended September 30, 2016* |
| 99.92* | Condensed Interim Consolidated Financial Statements for the three and nine months ended September 30, 2016 and 2015* |
| 99.93* | Certification of Interim Filings by CEO dated November 3, 2016* |
8
| Exhibit | Description |
| 99.94* | Certification of Interim Filings by CFO dated November 3, 2016* |
| 99.95* | News Release dated November 8, 2016* |
| 99.96* | News Release dated November 9, 2016* |
| 99.97* | News Release dated November 11, 2016* |
| 99.98* | News Release dated November 25, 2016* |
| 99.99* | Report of voting results dated November 25, 2016* |
| 99.100* | Letter of Transmittal for Registered Holders of Common Shares of Newmarket Gold Inc. dated November 29, 2016* |
| 99.101* | News Release dated November 30, 2016* |
| 99.102* | Articles of Amendment dated November 30, 2016* |
| 99.103* | Notice of Change in Corporate Structure Pursuant to Section 4.9 of National Instrument 51-102 dated December 2, 2016* |
| 99.104* | News Release dated November 30, 2016* |
| 99.105* | Second Supplemental Indenture dated as of November 30, 2016* |
| 99.106* | Material Change Report dated December 2, 2016* |
| 99.107* | News Release dated December 6, 2016* |
| 99.108* | News Release dated December 12, 2016* |
| 99.109* | News Release dated December 23, 2016* |
| 99.110* | News Release dated January 3, 2017* |
| 99.111* | Report of Exempt Distribution dated January 3, 2017* |
| 99.112* | News Release dated January 9, 2017* |
| 99.113* | News Release dated January 17, 2017* |
| 99.114* | News Release dated January 19, 2017* |
| 99.115* | News Release dated January 30, 2017* |
| 99.116* | News Release dated February 27, 2017* |
| 99.117* | News Release dated March 6, 2017* |
| 99.118* | Confirmation of Notice of Record and Meeting Dates dated March 10, 2017* |
| 99.119* | News Release dated March 28, 2017* |
| 99.120* | News Release dated March 29, 2017* |
| 99.121* | Third Supplemental Indenture dated March 13, 2017* |
| 99.122**** | Report on the Mineral Resources & Mineral Reserves of the Northern Territory Operations, Northern Territory, Australia dated March 30, 2017**** |
| 99.123**** | Macassa Property, Ontario, Canada Updated NI 43-101 Technical Report dated March 30, 2017**** |
| 99.124**** | Holt-Holloway Property, Ontario, Canada Updated NI 43-101 Technical Report dated March 30, 2017**** |
| 99.125 | Report on the Mineral Resources & Mineral Reserves of the Stawell Gold Mine, Victoria, Australia dated March 30, 2017 |
| 99.126 | Hislop Property, Ontario, Canada Updated NI 43-101 Technical Report dated March 30, 2017 |
9
| Exhibit | Description |
| 99.127 | Report on the Mineral Resources & Minerals Reserves of the Fosterville Gold Mine, Victoria, Australia dated March 30, 2017 |
| 99.128 | Taylor Property, Ontario, Canada Updated NI 43-101 Technical Report dated March 30, 2017 |
| 99.129* | News Release dated March 30, 2017* |
| 99.130* | Voting Instruction Form dated April 11, 2017* |
| 99.131* | Notice of Annual General Meeting of Shareholders dated April 7, 2017* |
| 99.132* | Management Information Circular dated April 7, 2017* |
| 99.133* | Form of Proxy dated April 11, 2017* |
| 99.134* | Kirkland Lake Gold Ltd. Long Term Incentive Plan dated April 7, 2017* |
| 99.135* | Kirkland Lake Gold Ltd. Deferred Share Unit Plan dated April 7, 2017* |
| 99.136* | Code of Conduct dated April 11, 2017* |
| 99.137* | News Release dated April 12, 2017* |
| 99.138* | Form of Proxy dated April 12, 2017* |
| 99.139* | News Release dated April 24, 2017* |
| 99.140* | News Release dated May 3, 2017* |
| 99.141* | News Release dated May 4, 2017* |
| 99.142* | Condensed Consolidated Interim Financial Statements for the three months ended March 31, 2017 and 2016* |
| 99.143* | Management’s Discussion and Analysis for the three months ended March 31, 2017 and 2016* |
| 99.144* | Certification of Interim Filings by CEO dated May 4, 2017* |
| 99.145* | Certification of Interim Filings by CFO dated May 4, 2017* |
| 99.146* | Report of voting results dated May 4, 2017* |
| 99.147* | News Release dated May 5, 2017* |
| 99.148* | News Release dated May 15, 2017* |
| 99.149* | News Release dated May 23, 2017* |
| 99.150* | Annual Report 2016* |
| 99.151* | News Release dated June 19, 2017* |
| 99.152* | News Release dated June 21, 2017* |
| 99.153* | News Release dated June 27, 2017* |
| 99.154* | News Release dated June 28, 2017* |
| 99.155* | News Release dated July 9, 2017* |
| 99.156* | News Release dated July 27, 2017* |
| 99.157* | Condensed Consolidated Interim Financial Statements for the three and six months ended June 30, 2017 and 2016* |
| 99.158* | Management’s Discussion and Analysis for the three and six months ended June 30, 2017 and 2016* |
| 99.159* | Certification of Interim Filings by CEO dated August 1, 2017* |
| 99.160* | Certification of Interim Filings by CFO dated August 1, 2017* |
10
| Exhibit | Description |
| 99.161* | Consent of Jason Keily* |
| 99.162* | Consent of Peter Fairfield* |
| 99.163* | Consent of SRK Consulting (Australia) Pty Ltd.* |
| 99.164* | Consent of David Schonfeldt* |
| 99.165* | Consent of Danny Kentwell* |
| 99.166* | Consent of Justine Tracey* |
| 99.167* | Consent of Mark Edwards* |
| 99.168* | Consent of Wayne Chapman* |
| 99.169* | Consent of Murray Smith* |
| 99.170* | Consent of Troy Fuller* |
| 99.171* | Consent of Ion Hann* |
| 99.172* | Consent of Mining Plus PTY Ltd.* |
| 99.173* | Consent of Simon Walsh* |
| 99.174* | Consent of Pierre Rocque* |
| 99.175* | Consent of Douglas Carter* |
| 99.176* | Consent of John Winterbottom* |
| 99.177* | Consent of Ian Holland* |
| 99.178* | Consent of Glenn R. Clark* |
| 99.179* | Consent of Glenn R. Clark & Associates* |
| 99.180* | Consent of Stewart Carmichael* |
| 99.181* | Consent of Christopher Stewart* |
| 99.182* | Consent of Keyvan Salehi* |
| 99.183* | Consent of Dean Basile* |
| 99.184* | Consent of Phil Bremner* |
| 99.185* | Consent MiningOne Pty* |
| 99.186* | Consent of Simon Hitchman* |
| 99.187* | Consent of Stuart Hutchin* |
| 99.188* | Consent of GMP Securities L.P.* |
| 99.189* | Consent of CIBC World Markets Inc.* |
| 99.190* | Consent of RBC Dominion Securities Inc.* |
| 99.191* | Consent of Maxit Capital LP* |
| 99.192* | Consent of PricewaterhouseCoopers LLP* |
| 99.193* | Consent of KPMG LLP* |
* previously filed with the Original Form 40-F
** previously filed with Amendment No. 1
*** previously filed with Amendment No. 2
**** previously filed with Amendment No. 3
11
REPORT ON THE
MINERAL RESOURCES & MINERAL RESERVES
OF THE
STAWELL GOLD MINE
In the State of Victoria, Australia
Prepared for
KIRKLAND LAKE GOLD LTD
Effective Date December 31, 2016
Dated March 30, 2017
Authors: John Winterbottom MAIG
Ian Holland FAusIMM

| Technical Report | Kirkland Lake Gold |
| December 2016 | Stawell Gold Mines |
Important Notice
This Technical Report has been prepared as a National Instrument 43-101 Technical Report, as prescribed in Canadian Securities Administrators’ National Instrument 43-101, Standards of Disclosure for Mineral Projects (NI 43-101) for Kirkland Lake Gold Ltd. (Kirkland Lake Gold). The data, information, estimates, conclusions and recommendations contained herein, as prepared and presented by the Authors, are consistent with: the information available at the time of preparation; the data supplied by outside sources, which has been verified by the authors as applicable; and the assumptions, conditions and qualifications set forth in this Technical Report.
Cautionary Note with Respect to Forward-Looking Information
Certain information and statements contained in this Technical Report are “forward looking” in nature. All information and statements in this report, other than statements of historical fact, that address events, results, outcomes or developments that Kirkland Lake Gold Ltd. and/or the Qualified Persons who authored this report expect to occur are “forward-looking statements”. Forward looking statements are statements that are not historical facts and are generally, but not always, identified by the use of forward-looking terminology such as “plans”, “expects”, “is expected”, “budget”, “scheduled”, “estimates”, “forecasts”, “intends”, “anticipates”, “projects”, “potential”, “believes” or variations of such words and phrases or statements that certain actions, events or results “may”, “could”, “would”, “should”, “might” or “will be taken”, “occur” or “be achieved” or the negative connotation of such terms.
Forward-looking statements involve known and unknown risks, uncertainties and other factors which may cause actual results, performance or achievements to be materially different from any of its future results, performance or achievements expressed or implied by forward-looking statements. These risks, uncertainties and other factors include, but are not limited to, assumptions and parameters underlying the life of mine update not being realized, a decrease in the future gold price, discrepancies between actual and estimated production, changes in costs (including labour, supplies, fuel and equipment), changes to tax rates; environmental compliance and changes in environmental legislation and regulation, exchange rate fluctuations, general economic conditions and other risks involved in the gold exploration and development industry, as well as those risk factors discussed in the technical report. Such forward-looking statements are also based on a number of assumptions which may prove to be incorrect, including, but not limited to, assumptions about the following: the availability of financing for exploration and development activities; operating and capital costs; the Company’s ability to attract and retain skilled staff; sensitivity to metal prices and other sensitivities; the supply and demand for, and the level and volatility of the price of, gold; the supply and availability of consumables and services; the exchange rates of the Canadian dollar to the U.S. dollar; energy and fuel costs; the accuracy of reserve and resource estimates and the assumptions on which the reserve and resource estimates are based; market competition; ongoing relations with employees and impacted communities and general business and economic conditions. Accordingly, readers should not place undue reliance on forward-looking statements. The forward-looking statements contained herein are made as of the date hereof, or such other date or dates specified in such statements.
i
| Technical Report | Kirkland Lake Gold |
| December 2016 | Stawell Gold Mines |
All forward-looking statements in this Technical Report are necessarily based on opinions and estimates made as of the date such statements are made and are subject to important risk factors and uncertainties, many of which cannot be controlled or predicted. Kirkland Lake Gold Ltd. and the Qualified Persons who authored this report undertake no obligation to update publicly or otherwise revise any forward-looking statements contained herein whether as a result of new information or future events or otherwise, except as may be required by law.
Non-IFRS Financial Performance Measures
Kirkland Lake Gold has included a non-IFRS measure “total site costs”, “total site costs per ounce” and various unit costs in this Technical Report. The Company believes that these measures, in addition to conventional measures prepared in accordance with IFRS, provide investors an improved ability to evaluate the underlying performance of the Company. The non-IFRS measures are intended to provide additional information and should not be considered in isolation or as a substitute for measures of performance prepared in accordance with IFRS. These measures do not have any standardized meaning prescribed under IFRS, and therefore may not be comparable to other issuers.
ii
| Technical Report | Kirkland Lake Gold |
| December 2016 | Stawell Gold Mines |
TABLE OF CONTENTS
iii
| Technical Report | Kirkland Lake Gold |
| December 2016 | Stawell Gold Mines |
iv
| Technical Report | Kirkland Lake Gold |
| December 2016 | Stawell Gold Mines |
v
| Technical Report | Kirkland Lake Gold |
| December 2016 | Stawell Gold Mines |
vi
| Technical Report | Kirkland Lake Gold |
| December 2016 | Stawell Gold Mines |
i
| Technical Report | Kirkland Lake Gold |
| December 2016 | Stawell Gold Mines |
ii
| Technical Report | Kirkland Lake Gold |
| December 2016 | Stawell Gold Mines |
iii
| Technical Report | Kirkland Lake Gold |
| December 2016 | Stawell Gold Mines |
1 EXECUTIVE SUMMARY
This technical report has been prepared for Kirkland Lake Gold Ltd. (Kirkland Lake Gold), the beneficial owner of the Stawell Gold Mine. Kirkland Lake Gold is listed on the Toronto Stock Exchange under the ticker symbol “KL”. On November 30, 2016, Newmarket Gold Inc. (“Newmarket”) combined with Kirkland Lake Gold Inc. and the combined company was renamed Kirkland Lake Gold Ltd, which has 100% ownership of the Stawell Gold Mine. As used in this Technical Report, unless the context otherwise requires, reference to “Kirkland Lake Gold” or the “Company” means Kirkland Lake Gold Ltd. and the subsidiaries. Reference to “Newmarket Gold” means the Company when it was previously named Newmarket Gold and its subsidiaries, prior to the completion of the arrangement with Kirkland Lake Gold Inc.
It has been prepared in accordance with the requirements of the National Instrument 43-101 – Standards of Disclosure for Mineral Projects and updates material changes to the Mineral Resource and Mineral Reserve position as of December 31, 2016.
The Mineral Resources and Mineral Reserve estimate for Stawell Gold Mines is a summation of a number of individual estimates for various ore bodies and geographically constrained areas. All of these estimates are contained within the Mining Lease MIN5260.
The Stawell Gold Deposit was discovered in the mid 1850’s during the Victorian gold rush, which saw the discovery and exploitation of significant deposits at Bendigo and Ballarat. Mining activity eventually ceased in the 1920’s and after a prolonged period of sporadic exploration, mining operation recommenced in 1981. Mining operations and various levels of exploration and resource development activities have been continuous since 1981 and as such the project has significant past production and development history, which is discussed in this technical report and also utilized during the compilation of the Mineral Resource and Mineral Reserve estimates.
Since the publication of the previous 2015 Technical Report, Kirkland Lake placed the underground mine and processing facility on care and maintenance. Prior to this date (December 13, 2016) Newmarket Gold drilled and re-estimated the Mineral Resource for some of the deposits within the Stawell underground mine. No underground Mineral Reserves have been reported within those Mineral Resources as they no longer warrant the financial considerations required to fulfill the requirements of a Mineral Reserve.
In June 2014 the Big Hill Surface Resource and Reserve were reported in the Technical Report on the Big Hill Enhanced Development Project at Stawell Gold Mines.
This technical report has been prepared by a number of the Stawell Gold Mines personnel. The report utilizes information available within Kirkland Lake Gold’s technical reports, published geological papers and internal Mineral Resource and Mineral Reserve documents completed by members of the Stawell Gold Mines’ mine geological and mine engineering teams.
John Winterbottom and Ian Holland are qualified persons as defined by NI 43-101 and accept overall responsibility for the preparation of all sections of this technical report, including the preparation of the Mineral Resources as reported in Section 14.
1
| Technical Report | Kirkland Lake Gold |
| December 2016 | Stawell Gold Mines |
| 1.1 | PROJECT DESCRIPTION AND OWNERSHIP |
Stawell Gold Mines is located in the Australian State of Victoria, located 250km northwest of the city of Melbourne and 2km from the Township of Stawell, FIGURE 1-1.
Stawell Gold Mines principal approval is its Mining Lease MIN5260, (see Figure 4-2) issued by the Victorian State Government under the Sustainable Development Act. This MIN5260 lease (centroid coordinates of 142.80° E and 37.06° S, GDA94) encompasses both the Magdala and Wonga Mines and is located both under and around the Township of Stawell with an area of approximately 1,000.58ha.
Stawell is an historic goldfield that produced 2.7Moz of gold between 1853 and 1926 from both alluvial and hard rock sources. In 1981, Stawell Gold Mines was re-opened by the Western Mining Corporation (WMC)/Central Norseman Gold joint venture with commencement of the Magdala decline. By 1984, the operation had expanded with the construction of a processing facility and subsequent commencement of an open cut operation at the Wonga Mine (two kilometers south of Magdala). The Wonga Open Cut operated from 1984 to 1987 and produced 778,847t, recovering 69,159oz of gold. The Davis Open Cut operated from 1987 to 1989 and produced 154,525t for 8,992 recovered ounces of gold.
In December 1992, the operation was acquired in a 50/50 joint venture by Mining Project Investors Pty Ltd. (MPI) and Pittston Mineral Ventures (Pittston). The joint venture continued until 2004, during which time there was a record of continued exploration success with the discovery of additional mineralized deposits that were subsequently mined.
In February 2004, MPI acquired Pittston’s 50% share of the project. In November 2004, a de-merger of the MPI gold business came into effect, and Leviathan Resources Ltd. (Leviathan) was floated in December 2004. In January 2007 Perseverance Corporation Limited (Perseverance) acquired Leviathan. Perseverance was acquired by Northgate Minerals Corp. (Northgate) on February 18, 2008. Northgate was acquired by AuRico Gold Inc. (AuRico) in October 2011.
Crocodile Gold Corp (Crocodile Gold) completed their acquisition of Stawell Gold Mines from AuRico on May 4, 2012. In 2012, Crocodile Gold transitioned the underground mine to a smaller scale operation whereby the lower levels of the mine were closed off (flooded and not ventilated) and mining focused on the upper levels and lower grade stock. On July 14, 2015 a merger between Newmarket Gold Inc. and Crocodile Gold was completed to form Newmarket Gold. On November 30, 2016, Newmarket Gold Inc. (“Newmarket”) combined with Kirkland Lake Gold Inc. and the combined company was renamed Kirkland Lake Gold Ltd, which has 100% ownership of Stawell Gold Mines. As used in this Technical Report, unless the context otherwise requires, reference to “Kirkland Lake Gold” or the “Company” means Kirkland Lake Gold Ltd. and the subsidiaries. Reference to “Newmarket Gold” means the Company when it was previously named Newmarket Gold and its subsidiaries, prior to the completion of the arrangement with Kirkland Lake Gold Inc. Kirkland Lake Gold Ltd placed the Stawell Gold Mine site inclusive of the underground operations and processing plant into care and maintenance from the December 13, 2016.
2
| Technical Report | Kirkland Lake Gold |
| December 2016 | Stawell Gold Mines |

| 1.2 | GEOLOGY & MINERALIZATION |
The Stawell Goldfield is located in the western Stawell Zone of the Lachlan Fold Belt. Interpretations from the Victorian Geological Survey present a thin skinned tectonics model where the Moyston Fault is an east dipping basal detachment, which has juxtaposed higher metamorphic grade rocks of the Stawell Zone against lower grade Cambrian rocks of the Delamarian Glenelg Zone. The west dipping Stawell Fault, Coongee Break and other parallel west dipping faults represent back thrusts from the Moyston Fault. The Stawell-Wildwood corridor therefore represents a significant structural high in an up-thrown block of deeper stratigraphy between the Coongee Break and Pleasant Creek Fault.
Intruded into this sequence are the Stawell Granite and a number of felsic and mafic intrusions. The stratigraphy at Stawell is divided into three principal units: Magdala Basalt, Albion Formation and Leviathan Formation. The dominant feature at Stawell is the 1.2km wide, doubly plunging, northwest-striking Magdala Basalt dome. The Magdala Basalt is made up of a series of basalt noses, interpreted to be flow sheets, which now dip to the southwest and plunge to the northwest. Areas of sedimentation are present between the basalt noses and are locally termed ‘waterloos’.
3
| Technical Report | Kirkland Lake Gold |
| December 2016 | Stawell Gold Mines |
There are three mineralization styles at Stawell, these being Magdala (separated into west and east flanks), Golden Gift and Wonga. The Magdala and Golden Gift ore types are hosted within the Magdala Volcanogenic. Within the Magdala Deposit there are three main ore types; Central Lode, Basalt Contact Lodes, and Magdala Stockwork Lodes. The east flank mineralization introduces a new ore type: the Hampshire Lode.
Gold occurs as free gold, frequently associated with pyrite, pyrrhotite and arsenopyrite.
| 1.3 | EXPLORATION, DEVELOPMENT AND OPERATIONS |
The Stawell Gold Mine site, inclusive of the underground operations and processing plant transitioned into care and maintenance as of the December 13, 2016. An underground exploration program exploring the potential for economic mineralization on the Eastern Flank is to continue during 2017 (Section 9).
There is no current mine plan and no reportable underground Mineral Reserves.
| 1.4 | MINERAL RESOURCES AND MINERAL RESERVES |
| 1.4.1 | TOTAL STAWELL GOLD MINES INVENTORY |
The total Mineral Resource estimate for the Stawell Gold Mines operations is listed in Table 1-1.
This Stawell Gold Mines Mineral Resource is categorized as Underground (Table 1-1), and Big Hill Surface (Table 1-2). These are all located on the same Mining Lease and share the Processing Facility.
TABLE 1-1 STAWELL GOLD MINES MINERAL RESOURCE AS AT DECEMBER 31, 2016
| Stawell Gold Mines Resource | |||
| Classification | Tonnes (kt) | Gold Grade g/t | Ounces Gold (koz) |
| Measured | 81 | 3.67 | 10 |
| Indicated | 3,624 | 2.03 | 236 |
| Total (Measured and Indicated only) | 3,705 | 2.07 | 246 |
| Inferred | 1,127 | 2.89 | 105 |
Notes:
| 1. |
All Mineral Resources have been estimated in accordance with CIM Standards (2014). | |
| 2. |
Mineral Resources are inclusive of Mineral Reserves. | |
| 3. |
Mineral Resources were estimated using the following parameters: |
| (a) |
Gold price of US$1,200/oz (A$1,500/oz); | |
| (b) |
Cut-off Grade of 0.35 g/t Au for Big Hill Surface Mineral Resources; | |
| (c) |
Cut-off Grade applied was variable for underground Mineral Resources. Grades used were as follows: | |
| – 2.0 g/t Au for Mariners and Big Hill outside of
current pit optimisation, – 2.3 g/t Au for all remaining underground Mineral Resources. |
| 4. |
Underground and surface Mineral Resource estimates were prepared under the supervision of Mr John Winterbottom, MAIG. | |
| 5. |
The QP believes that the stated Mineral Resources is a realistic inventory of mineralization, which, under the assumed technical, political, legal, environmental and economic development conditions, is economically extractable. If these conditions change then the Mineral Resources, either in whole or part, may not be economically extractable. |
4
| Technical Report | Kirkland Lake Gold |
| December 2016 | Stawell Gold Mines |
| 6. |
The quantity and grade of the reported Inferred Mineral Resources are uncertain in nature and there has been insufficient exploration to define the Inferred Mineral Resources as Indicated or Measured Mineral Resources and it is uncertain if further exploration will result in upgrading them to an Indicated or Measured Mineral Resource category. | |
| 7. |
Mineral Resources are rounded to 1,000t, 0.01 g/t Au and 1,000oz. Minor discrepancies in summations may occur due to rounding. | |
| 8. |
Mineral Resources that are not Mineral Reserves do not have demonstrated economic viability. |
The total Mineral Reserve estimate for the Stawell Gold Mines Operations is listed below and is categorized as Big Hill Surface only. There are no reportable underground Mineral Reserves.
TABLE 1-2 TOTAL MINERAL RESERVE CLASSIFICATION AS AT DECEMBER 31, 2016
| Classification | Tonnes (kt) | Gold Grade g/t Au | Ounces Gold (koz) |
| Proven | 0 | 0 | 0 |
| Probable | 2,700 | 1.51 | 132 |
| Total Reserve | 2,700 | 1.51 | 132 |
Notes:
| 1. |
All Mineral Reserves have been estimated in accordance with CIM Standards (2014). | |
| 2. |
Mineral Resources are inclusive of Mineral Reserves. | |
| 3. |
Mineral Reserves were estimated using the following economic parameters: – Gold price of US$1,200/oz (A$1,500/oz), | |
| 4. |
Big Hill Surface Mineral Reserve estimates were prepared under the supervision of Ian Holland, FAusIMM. | |
| 5. |
Mineral Reserves are rounded to 1,000t, 0.01 g/t Au and 1,000oz. Minor discrepancies in summations may occur due to rounding. |
| 1.5 | INTERPRETATION |
The data on which this updated Mineral Resource and Mineral Reserve statement is based has been collected utilizing quality systems, procedures and processes. The data collection and data storage utilized at Stawell Gold Mines and the assay quality is supported by QA/QC documentation and verifiable data. Data management systems are in place to ensure long term security of all geological information collected on site.
The gold grade estimates are based on high quality assay datasets of diamond drill core that has been spatially located, sampled and assayed using sound industry standard practices.
There is available an extensive coverage of diamond drilling reaching a drill spacing of 15m x 15m in areas that are subject to grade control drilling. Additionally, face mapping information and “sludge sample” holes logged for geology are available to construct geological models for all Mineral Resource areas. The key control on Mineral Resource estimation is an accurate definition of the constraining geological models. Estimation of grade within the domains, whilst still very important, is of secondary importance to the first order geological domaining. The geological personnel have a sound understanding of the mineralized system and have good practices in place to ensure quality models are produced.
In addition to the quality control and data verification procedures, the Qualified Person preparing the Mineral Resource estimates have further validated the data upon extraction from the database prior to resource interpolation. This verification used MineSight software as the primary tool to identify data problems. This allowed the omission of holes if they were of questionable quality, for example due to low quality sample techniques or incomplete assaying. When coupled with the more mechanical check processes ensuring high quality is entering the database in the first place, these checks were effective in allowing the Qualified Persons to be confident that the data was geologically coherent and of appropriate quality.
5
| Technical Report | Kirkland Lake Gold |
| December 2016 | Stawell Gold Mines |
| 1.6 | CONCLUSION AND RECOMMENDATIONS |
Underground production from the Western Flank mineralization continued up to December 13, 2016, when the Mine was placed on care and maintenance due to decreasing grade and high operating costs. Ongoing exploration programs are continuing at Stawell Gold Mines while it is on care and maintenance in 2017. There is no mine plan for 2017 beyond Big Hill surface permitting. Big Hill surface mining and underground eastern flank exploration provide opportunity beyond 2016.
The Stawell Mineral Resource decreased in total inventory (MI&I) over the past 12 months. A small increase in measured and indicated ounces in the Magdala Western Flank mineralization does not reflect the extent of conversion during the year. This is a result of a short time frame between delivery of the resource and mine scheduling, thus material that was converted during the reporting period is already in production in the same reporting period.
A notable decrease to the Inferred Resource in the reporting year (-16% oz) is the result of resource definition drilling and Mineral Resource conversion. During 2016 there was little addition to Inferred Resources through exploration drilling on the Eastern Flank (Aurora B), Moray 343, 486L mid-north Magdala. This was a combination of poor results (Moray 343), sparse intersection points relative to geological architecture (486L mid-north Magdala and Aurora B) and poor drill angle (Aurora B).
There is no reportable underground Mineral Reserves as the operation is on care and maintenance. Big Hill Surface Mineral Reserves remains the same.
A summary of the key recommendations is as follows:
| • |
Maintain the mine geological program as currently implemented to supplement currently available geological information in the preparation of detailed mine design. It is the opinion of the Authors that there remains sufficient prospectivity within the Stawell Gold Mines tenement to support the proposed programs and budgeted expenditure and it is recommended that ongoing evaluation of this potential be continued and re-evaluated as exploration results are received; |
|
| |
| • |
A detailed exploration program is presented in Section 9 of this report, including a proposed program for 2017; |
|
| |
| • |
Further investigation of the Eastern Flank mineralization should be undertaken, including a detailed structural study of the diamond drill core to understand the down-plunge position of the Aurora B Zone and the potential of the mineralized shoots to be converted to Resources. This understanding will aid in the targeting and design of further diamond drilling campaigns with the intent to extend the Inferred Resource and infill and convert to Indicated Resources; |
6
| Technical Report | Kirkland Lake Gold |
| December 2016 | Stawell Gold Mines |
| • |
Perform qualitative Kriging neighborhood analysis (QKNA) analysis of the Aurora B Resource Model with external consultation to ensure best practices in estimation of the Mineral Resource; |
| • |
Undertake resource estimation risk evaluation on the Eastern Flank mineralization to determine the likely variance in grade and thickness as an aid in classification of Mineral Resource for the next reporting year; |
| • |
Continuation of diligent QA/QC programs. The outsourcing of sample preparation in 2017 due to the closure of the site laboratory will need to be closely monitored for quality; |
| • |
Continuation of collection of density measurements and geometallurgical testwork in areas of newly defined mineralization and geology; |
| • |
Aurora B geotechnical studies should be conducted to aid in future mining assessments of the area; and |
| • |
Continuation of the collection of multielement data and analysis of mineralogical trends to aid in defining additional gold mineralization. |
7
| Technical Report | Kirkland Lake Gold |
| December 2016 | Stawell Gold Mines |
2 INTRODUCTION AND TERMS OF REFERENCE
| 2.1 | INTRODUCTION |
The purpose of this technical report is to support public disclosure of Mineral Resource and Mineral Reserve estimates at the Stawell Gold Mines as at December 31, 2016. This technical report is prepared in accordance with NI 43-101.
This technical report has been prepared for Kirkland Lake Gold Ltd. (Kirkland Lake Gold), the beneficial owner of the Stawell Gold Mine. Kirkland Lake Gold Ltd. is listed on the Toronto Stock Exchange under the ticker symbol “KL”. On November 30, 2016 Kirkland Lake Gold Inc. and Newmarket Gold Inc., merged to form Kirkland Lake Gold Ltd.
The Stawell Gold Deposit was discovered in the mid 1850’s during the Victorian gold rush, which saw the discovery and exploitation of significant deposits at Bendigo and Ballarat. Mining activity eventually ceased in the 1920’s and after a prolonged period of sporadic exploration, mining operations recommenced in 1981. Mining operations and various levels of exploration and Mineral Resource development activities have been continuous since 1981 and as such, the project has significant past production and development history which is discussed in this technical report and also utilized during the compilation of the Mineral Resource and Mineral Reserve estimates.
The Authors have prepared this technical report for Kirkland Lake Gold in respect of the underground Mineral Resource and Reserve of the Stawell Gold Mines, which is located adjacent to the Township of Stawell, Western Victoria, Australia. The underground operation had been in operation since 1981 and had produced in excess of 2.31Moz of gold during this period.
The Stawell Gold Mine site, inclusive of the underground operations and processing plant transitioned into care and maintenance as of the December 13, 2016. An underground program exploring the potential for economic mineralization on the Eastern Flank will continue during 2017 along with the permitting activities for the Big Hill project.
| 2.2 | TERMS OF REFERENCE |
This technical report has been prepared in accordance with the requirements of the NI 43-101 and updates changes to the Mineral Resource and Mineral Reserve position of the Stawell Gold Mines as of December 31, 2016.
The Mineral Resources estimate for the Stawell Gold Mines is a summation of a number of individual estimates for various deposits or various geographically constrained areas. All of these estimates are contained within the Mining Lease MIN5260. Details of the locations and geographical constraints of the various deposit components as of December 31, 2016 are given in Section 8. The Mineral Reserves estimate for the Stawell Gold Mines is a summation of a number of individual estimates for various methods of extraction of Mineral Resource areas contained within Mining Lease MIN5260.
8
| Technical Report | Kirkland Lake Gold |
| December 2016 | Stawell Gold Mines |
| 2.3 | AUTHORS ’ QUALIFICATIONS & RESPONSIBILITIES |
This technical report conforms to the CIM Standards on Mineral Resources and Mineral Reserves referred to in NI 43-101. The qualified persons (together, the Authors) who supervised the preparation of this technical report are:
| • |
Ian Holland, FAusIMM, General Manager, Victorian Operations, Kirkland Lake Gold. Ian Holland has more than 20 years in underground and surface mining including more than nine years in gold mining operations. Mr Holland has worked for Kirkland Lake Gold and its predecessors for nine years; and |
|
| |
| • |
John Winterbottom, MAIG, Geology Manager. Mr Winterbottom has over 20 years of relevant experience and has worked at Stawell Gold Mines for the last six months. |
Responsibilities for the preparation of certain sections of this technical report have been assigned to individual authors as shown in Table 2-1 below. Technical Reporting Responsibilities of this technical report and such individual authors are not responsible for sections of this technical report other than those indicated in this table.
Both Authors visit the site regularly as part of their roles.
TABLE 2-1 TECHNICAL REPORTING RESPONSIBILITIES
| Technical Report Section | Qualified Person | Employer |
| 1, 2, 3, 4, 5, 6, 7, 8, 9, 10, 11, 12, 13,
14, 17, 19, 20, 23, 24, 25, 26, 27 & 28 |
John Winterbottom (Geology
Manager), MAIG |
Kirkland Lake
Gold |
| 1, 2, 3, 15, 16, 18, 21, 22, 25, 26, 27 & 28 | Ian Holland (General Manager, Victorian Operations), FAusIMM | Kirkland Lake Gold |
| 2.4 | DEFINITIONS |
In this technical report, reference to the “Stawell Gold Mines” refers to the current underground mine area including and below the surface Big Hill Project.
All units, unless expressed otherwise, are in the metric system. All gold assay grades are expressed as grams per metric tonne (g/t) unless otherwise specified, with tonnages stated in metric tonnes. Gold metal is reported in troy ounces.
Unless otherwise stated, monetary values are in Australian Dollars (A$).
The following abbreviations and definitions are used throughout this technical report:
TABLE 2-2 DEFINITIONS AND ABBREVIATIONS
| Abbreviation | Unit or Term |
| AAS | ATOMIC ABSORPTION SPECTROSCOPY |
| AUSIMM | AUSTRALASIAN INSTITUTE OF MINING & METALLURGY |
| AHD | AUSTRALIAN HEIGHT DATUM |
9
| Technical Report | Kirkland Lake Gold |
| December 2016 | Stawell Gold Mines |
| Abbreviation | Unit or Term |
| AIG | AUSTRALIAN INSTITUTE OF GEOSCIENTISTS |
| AMG | AUSTRALIAN MAP GRID |
| AU | GOLD |
| A$ | AUSTRALIAN DOLLARS |
| AZI | AZIMUTH |
| BCM | BULK CUBIC METER |
| BIF | BANDED IRON FORMATION |
| BLEG | BULK LEACH EXTRACTABLE GOLD - ANALYSIS FOR SOIL SAMPLING |
| CIM | CANADIAN INSTITUTE OF MINING, METALLURGY & PETROLEUM |
| CIM STANDARDS | CIM DEFINITION STANDARDS FOR MINERAL RESOURCES AND MINERAL RESERVES |
| CRF | CEMENTED ROCK FILL |
| DD, DDH | DIAMOND DRILLING, DIAMOND DRILLHOLE |
| DELWP | DEPARTMENT OF ENVIRONMENT, LAND, WATER AND PLANNING |
| EPA | ENVIRONMENTAL PROTECTION AGENCY |
| FAS | FEDERAL ALBION SOUTH |
| FX | FOREIGN EXCHANGE |
| G OR GM | GRAM(S) |
| G/T | GRAMS PER TONNE |
| GDA94 | GEOCENTRIC DATUM OF AUSTRALIA (USUALLY REFERRED TO AS GDA94, OR JUST GDA) IS A COORDINATE SYSTEM FOR AUSTRALIA |
| GEOCD | GEOLOGICAL ROCK CODE |
| GWM-WATER | GRAMPIANS-WIMMERA-MALLEE WATER |
| HA | HECTARE (10,000 M2) |
| HISTORICAL RESOURCE |
NON-COMPLIANT MINERAL RESOURCE AS REPORTED IN PUBLICALLY AVAILABLE DOCUMENTATION. IN NO TERMS IS THIS TYPE OF MINERAL RESOURCE TO BE INCLUDED OR QUANTIFIED BUT IS NOTED IN THIS TECHNICAL REPORT TO REFLECT PREVIOUS WORK THAT HAS BEEN COMPLETED ON DEPOSITS OUTSIDE THE CURRENT LISTING IN THIS MINERAL RESOURCE STATEMENT |
| IRR | INTERNAL RATE OF RETURN |
| JORC CODE | AUSTRALASIAN CODE FOR REPORTING OF EXPLORATION RESULTS, MINERAL RESOURCES AND ORE RESERVES PREPARED BY THE JOINT ORE RESERVES COMMITTEE OF THE AUSTRALASIAN INSTITUTE OF MINING AND METALLURGY, AUSTRALIAN INSTITUTE OF GEOSCIENTISTS AND MINERALS COUNCIL OF AUSTRALIA, AS AMENDED |
| JV | JOINT VENTURE |
| LLD | LOWER LIMIT OF DETECTION |
| KG | KILOGRAM(S) |
| KM | KILOMETER(S) |
| MA | MILLION YEARS |
| M | METER (S) |
| MGA | MAP GRID OF AUSTRALIA |
| ML | MILLILITERS |
10
| Technical Report | Kirkland Lake Gold |
| December 2016 | Stawell Gold Mines |
| Abbreviation | Unit or Term |
| MT | MILLION TONNES |
| MTPA | MILLION TONNES PER ANNUM |
| MMP | MINE MANAGEMENT PLAN |
| MRL | MINE GRID REDUCED LEVEL (METERS) |
| NATA | NATIONAL ASSOCIATION OF TESTING AUTHORITIES |
| NMI | NEWMARKET GOLD INC. |
| NPV | NET PRESENT VALUE |
| OZ | TROY OUNCE (31.1035 G) |
| OZ/AN | OUNCE (GOLD) PER ANNUM |
| % | PER CENT BY WEIGHT |
| PPB | PARTS PER BILLION |
| PPM | PARTS PER MILLION |
| QA/QC | “QUALITY ASSURANCE – QUALITY CONTROL” |
| QKNA | QUALITATIVE KRIGING NEIGHBORHOOD ANALYSIS |
| QUALIFIED PERSON | “QUALIFIED PERSON” HAS THE MEANING ASCRIBED TO SUCH TERM IN NI43-101 |
| PEA | PRELIMINARY ECONOMIC ASSESSMENT |
| RAB | ROTARY AIR BLAST DRILLHOLE |
| RC | REVERSE CIRCULATION DRILLHOLE |
| RL | REDUCED LEVEL |
| ROM | RUN OF MINE ORE PAD |
| T OR T | METRIC TONNE (2,204 LBS) |
| TSF | TAILINGS STORAGE FACILITY |
| UG | UNDERGROUND |
| USF1 | UPPER SOUTH FAULT 1 |
| $C | CANADIAN DOLLAR |
| US$ | UNITED STATES DOLLAR |
| VOLC | VOLCANOGENIC |
| °C | DEGREES CELSIUS |
| 2.5 | MINERAL RESOURCE AND RESERVE DEFINITIONS |
The following web site provides full definitions for Mineral Resources and Reserves, prepared by the CIM Standing Committee on Reserve Definitions, and adopted by CIM Council on May 10, 2014.
http://web.cim.org/standards/MenuPage.cfm?sections=177&menu=178
11
| Technical Report | Kirkland Lake Gold |
| December 2016 | Stawell Gold Mines |
3 RELIANCE ON TECHNICAL EXPERTS
This technical report has been prepared by the Authors for Kirkland Lake Gold and is based, in part, as specifically set forth below on the review, analysis, interpretation and conclusions derived from information which has been provided or made available to the Authors by Kirkland Lake Gold, augmented by direct field examination and discussion with former employees, current employees of Kirkland Lake Gold and consultants who have previously worked for past operators or are currently working for Kirkland Lake Gold. The Authors have reviewed such information and determined it to be adequate for the purposes of this Technical Report. The Authors do not disclaim any responsibility for this information.
It is the view of the Authors that the data collection, storage, and analysis methods utilized in estimating and compiling Mineral Resource estimates at Stawell Gold Mines are of sufficient quality to ensure the information is reliable and suitable for the compilation of this technical report. The Authors are not aware of any critical data that has been omitted so as to be detrimental to the objectives of this technical report. There was sufficient data provided to enable credible interpretations to be made in respect of the data. The principal Authors, believe that no information that might influence the conclusion of this technical report has been withheld from the study.
Kirkland Lake Gold used the assistance of internal employees to assist with the generation of this technical report. Below is a summary of those roles and the areas they were responsible for within this technical report.
TABLE 3-1 SITE EXPERTS WHO CONTRIBUTED TO THE TECHNICAL REPORT
| Area of Contribution | Site Expert | Sections |
| Metallurgy and Recovery | Peter Wemyss Metallurgy Manager | 17 |
| Mine Geology and Resource | Justine Tracey Senior Resource Geologist | 8, 11 & 14 |
| Environmental Studies | David Coe Environmental Manager | 3 & 20 |
| Mining and Operations | Ross Carpenter Operations Manager | 15,16, 18,21 & 22 |
The Author of Section 20 is also reliant on external consultants for expert advice and opinions. Where external advice has been used the appropriate parties have been referenced.
| 3.1 | HISTORICAL INFORMATION |
Information relating to historical exploration, production and Mineral Resources and Reserves, mining and metallurgy has in part been sourced from summary documentation prepared by past operators and Kirkland Lake Gold, from previously filed NI 43-101 Technical Reports and corporate filings and press releases available on the System for Electronic Document Analysis and Retrieval (SEDAR) website: www.SEDAR.com and from other public sources. Where required the source of this information has been noted in this technical report.
12
| Technical Report | Kirkland Lake Gold |
| December 2016 | Stawell Gold Mines |
Interpretations and conclusions contained herein reflect the detail and accuracy of historical exploration data available for review. Given the nature of mineral exploration, and with more detailed modern exploration work and new exploration and mining technology, more precise methods of analysis and advances in understanding of local and regional geology and mineral deposit models over time, the interpretations and conclusions contained herein are likely to change and may be found to be in error or be obsolete. As part of Kirkland Lake Gold ongoing process to improve Mineral Resource estimates, all mining information is reconciled against the models to ensure accuracy; this assists in improving the accuracy of the models. A qualified person has not done sufficient work to classifying historical estimates as current Mineral Resource or Mineral Reserves and Kirkland Lake Gold is not treating any historical estimates as current Mineral Resources or Mineral Reserves.
13
| Technical Report | Kirkland Lake Gold |
| December 2016 | Stawell Gold Mines |
4 PROPERTY DESCRIPTION & LOCATION
| 4.1 | LOCATION |
Stawell Gold Mines is located in the Australian State of Victoria, 250km northwest of the city of Melbourne and 2km from the Township of Stawell (see FIGURE 4 -1). Stawell is a rural township of approximately 6,500 people and is within the Northern Grampians Shire.
| 4.2 | PROPERTY DESCRIPTION |
Stawell Gold Mines principal approval is its Mining Lease MIN5260, (see FIGURE 4-2) issued by the Victorian State Government under the Sustainable Development Act. This MIN5260 lease (centroid coordinates of 142.80° E and 37.06° S, GDA94) encompasses both the Magdala and Wonga Mines and is located both under and around the Township of Stawell with an area of 1,000.58ha. The mining lease is comprised of private and crown land including designated crown land reserves. Designated crown land reserves require particular consideration in accordance with the Sustainable Development Act and the National Parks (Box Ironbark and Other Parks) Act 2002.

14
| Technical Report | Kirkland Lake Gold |
| December 2016 | Stawell Gold Mines |
Stawell Gold Mines refers to the underground workings on Mining Lease MIN5260. Big Hill locally refers to the area approximately 1km north of the current underground mine and milling operations at Stawell Gold Mines. Stawell Gold Mines refers to the underground workings as highlighted in yellow and the Big Hill Surface Project as highlighted in pink (see FIGURE 4-2 below).

The surface project site is mainly Crown Land under the control of DELWP, with four exceptions, namely:
| • |
CA 11B is a Public Purpose Reserve – Committee of Management is Northern Grampians Shire Council; |
|
| |
| • |
CA 10A & 11A comprise a Reservoir Reserve – Committee of Management is GWM-Water; |
|
| |
| • |
CA 10F is freehold land owned by GWM-Water; and |
|
| |
| • |
Private land lot 11 is owned by Stawell Gold Mines. |
Within the Crown Land, apart from the mine ventilation shaft, above-ground mine development and some memorials and a picnic facility, four small areas of land are developed for specific uses, namely:
| • |
CA 10B a former Forest Commission Reserve, containing a DELWP Fire Tower; |
| • |
CA 10C, a former Municipal Purposes Reserve leased to Shire of Stawell is now leased to Vencorp and houses the organization’s radio communication facility; |
| • |
CA 10D a former Police & Emergency Services Reserve, is leased to the Victorian Police. It houses the State Mobile Radio Network (Telstra); and |
|
| |
| • |
CA 10G is leased by Optus Communications and contains a mobile telephone tower and three buildings. It houses the mobile telephone facilities for Optus, Telstra and Vodafone. |
15
| Technical Report | Kirkland Lake Gold |
| December 2016 | Stawell Gold Mines |
| 4.1 | EXPLORATION MINERAL TENURE |
Stawell Gold Mines comprises a package of tenements covering the Northern MMC covering an area of approximately 720km2 (see FIGURE 4-3). No tenements are under Farm-in or Joint Venture agreements. There are no Native Titles or claims on any of the tenements.

Under the Sustainable Development Act, ongoing relinquishment of tenements is required at regular intervals, these being 25% of the original tenement size at the end of year two and 35% of the original tenement size at the end of year four. Amendments to the Sustainable Development Act which came into effect on the February 1, 2012 require an additional 20% of the original tenement size at the end of year seven and 10% of the original tenement size at the end of year 10 (leaving 10% of the original tenement area). Exploration licenses that are more than 10 years old may be renewed for up to an additional two years. Further renewal may be given for a period not exceeding two years but only in exceptional circumstances and where it can be demonstrated that there is likelihood of identifying a Mineral Resource in the term. Following this term, no further renewals are allowed. Tenements that are greater than 10 years old will have the seven year and 10 year relinquishments applied (for a total of 30%) at their next renewal. An outline of current Stawell Gold Mines tenements can be found in Table 4-1 below, note that EL3008 is now the only tenement older than 10 years.
16
| Technical Report | Kirkland Lake Gold |
| December 2016 | Stawell Gold Mines |
TABLE 4-1 REGIONAL TENEMENT INFORMATION
| Name | Number | Area
(km2) |
Annual
Expenditure Commitment |
Grant Date | Expiry /
Renewal Date |
Comments |
| Wildwood | EL3008 | 352 | $120,600 | 16/12/1988 | 20/06/2017 | Stawell Gold Mines Managed |
| Glenorchy | ELA6156 | 24 | $18,600 | 29/12/2016 | 29/12/2021 | Stawell Gold Mines Managed |
| Barrabool | EL5443 | 319 | $16,600 | 26/11/2013 | 25/11/2018 | Stawell Gold Mines Managed |
| North Magdala | EL5474 | 8 | $16,600 | 24/01/2013 | 23/01/2017 | Stawell Gold Mines Managed |
| Stawell Gold Mines | MIN6024 | 14 | TBA | Approval pending | ||
| Stawell Gold Mines | MIN5260 | 10 | $899,730 | 31/05/1985 | 30/05/2020 | Stawell Gold Mines Managed |
EL3008 is considered a “strategic” exploration tenement under amendments to the Sustainable Development Act and any renewal of the tenement will not be subject to additional relinquishment requirements for a combined total of five years from the next renewal date after the introduction of the Amendments (June 2013). Beyond the five year term, further renewals for a period up to five years may be given only in exceptional circumstances and where it can be demonstrated that there is likelihood of identifying a Mineral Resource in that term. Following this term, no further renewals are allowed.
EL6156 was granted a five year extension with $18,600 minimum Expenditure Commitment set for 2017.
| 4.2 | LEGISLATION AND PERMIT |
Stawell Gold Mines principal approval, MIN5260, issued by the Victorian State Government under the Mineral Resources (Sustainable Development) Act 1990 (Vic) (the Sustainable Development Act) is the applicable “right to mine” title over the land described in Section 4.1. Kirkland Lake Gold is the 100% owner of the title. MIN5260 is current to 2020, when it will require to be renewed. This approval was first issued on the May 31, 1985 as ML1219 and has been amended on at least six occasions as a result of approved Work Plan variations. Attached to this title are mining license conditions upon which a Work Plan and all associated Work Plan variations are filed with the regulatory authority, the license is regularly reviewed and updated by the State according to current legislations and guidelines. Stawell Gold Mines mining license was last updated in 2011.
The license covers the areas of:
| • | Work plan requirements; |
| • | Land use; |
| • | Insurances; |
| • | Public safety; |
| • | Community engagement; |
| • | Reporting; |
17
| Technical Report | Kirkland Lake Gold |
| December 2016 | Stawell Gold Mines |
| • | Environmental impact management; |
| • | Rehabilitation and bonds; |
| • | Exploration; and |
| • | Hazardous material management. |
Mining License 5520 was granted to Stawell Gold Mines in March 2010 to cover the northern extension of the Magdala Lodes outside MIN5260. No mining activity was undertaken on this license and exploration drilling found the prospect to be uneconomic. The license was relinquished in March 2013 and the area is now covered as Exploration License EL5474.
Apart from the primary mining legislation the Sustainable Development Act, operations on MIN5260 are subject to the additional following legislation and regulations for which all appropriate permits, (MIN5260) and approvals have been obtained.
Acts:
- Extractive Industry Development Act 1995 (Vic);
- Environment Protection Act 1970;
- Mines Act 1958;
- Planning and Environment Act 1987;
- Environmental Protection and Biodiversity Conservation Act 1999;
- National Environment Protection Council (Vic) Acts 1995;
- Flora and Fauna Guarantee Act 1988;
- Catchment and Land Protection Act 1994;
- Archaeological and Aboriginal Relics Preservation Act 1972;
- Heritage Act 1995;
- Forest Act 1958;
- Dangerous Goods Act 1985;
- Mines Safety and Inspection Act 1994;
- Drugs, Poisons and Controlled Substances Act 1981;
- Health Act 1958;
- Water Act 1989;
- Crown Land (Reserves) Act 1978;
- Radiation Act 2005;
- Sustainability Victoria Act 2005;
- Country Fire Authority Act 1958;
- Conservation, Forests and Lands Act 1987; and
- Wildlife Act 1975.
Regulations:
- Dangerous Good (Explosives) Regulations 2011;
- Dangerous Good (Storage and Handling) Regulations 2000;
- Dangerous Goods (HCDG) Regulations 2005;
18
| Technical Report | Kirkland Lake Gold |
| December 2016 | Stawell Gold Mines |
- Occupational Health and Safety Regulations 2007;
- Forest Fire Regulations 1992;
- Biodiversity Conservation Regulation 2000;
- Drugs, Poisons and Controlled Substances (Commonwealth Standard) Regulations 2001;
- Mineral Resources (Infringements) Regulations 1991;
- Environmental Protection (Vehicle Emissions) Regulations 2003; and
- Regular reviews of legislation and regulation requirements have been completed and Stawell Gold Mines maintains all required statutory approvals to continue with mining operations.
| 4.3 | ROYALTY AND ENCUMBERANCES |
There are two royalties associated with MIN5260. The first royalty of $2.00 per ounce is payable to Mineral Ventures of Australia (MVA). The royalty agreement was signed in February 2004 and is in place until the earlier of 15 years of production or 2.5Moz of gold produced. Furthermore, this royalty agreement extends to Victorian tenements held by Leviathan Resources Ltd (now a wholly-owned subsidiary of Newmarket Gold), which included MIN5260.
The second royalty of 1% of Net Smelter Returns is payable to Alamos Gold Inc. The royalty agreement was signed in January 2015 and is in place from January 1, 2016 and in perpetuity thereafter. This royalty extends to the following tenements: EL 5474, EL 3008 and EL 4279.
| 4.4 | ENVIRONMENTAL LIABILITIES |
Stawell Gold Mines is operating under a Work Plan submitted as required under Section 3 of the general license conditions of MIN5260. A key component of this Work Plan is an Environmental Management Plan (EMP) the most recent of which was approved by the Department of Primary Industries Victoria in February 2013 in conjunction with the 2013 Processing of Mt Micke Stockpile Work Plan Variation. A requirement of the general license conditions of a mining license is to maintain the EMP and update it accordingly as work plan variations are presented.
Rehabilitation for the project is ongoing: Stawell Gold Mines entered into a cooperative research project with both Curtin and Melbourne Universities in 2000 to conduct rehabilitation trials to prepare the rehabilitation program for eventual closure of the operations. These trials were extensive and have been undertaken over many years with works ongoing with O’Kane Consultancy regarding tailings storage facility capping design. Other than the existing rehabilitation bond of A$4,803,000 lodged with the Department of State Development and Business Innovation, the project is not subject to any other environmental liabilities.
| 4.5 | STAWELL GOLD MINES LOCAL SURVEY GRID REFERENCE |
All survey data on MIN5260 is collected and stored using modified AMG co-ordinates, based on Australian Map Grid AGD 66 (Zone 54). The convention is to drop the first digit of the Northing, so 5,896,000N becomes 896,000N. The Easting value is unchanged.
19
| Technical Report | Kirkland Lake Gold |
| December 2016 | Stawell Gold Mines |
The mine RL is calculated as -300m RL AHD and displayed as a negative number below surface. The RL origin is at 303.60 AHD station located adjacent to the mine on Big Hill, Stawell.
The principal local grid in use within the Mine Lease is the Stawell Gold Mines grid (also referred to as the “45 degree grid”) as shown in FIGURE 4-4. This grid is orientated 45° west of AMG north and has its origin at 5890137.479N and 659498.820E. It is convention to divide the Northing by 20 and refer to this as the section Northing line, (i.e. Northing 6200 becomes the 310 section line). Additional local grids are used as required for presentation of geological information as required.

20
| Technical Report | Kirkland Lake Gold |
| December 2016 | Stawell Gold Mines |
5 ACCESSIBILITY, CLIMATE, LOCAL RESOURCES, INFRASTRUCTURE & PHYSIOGRAPHY
| 5.1 | ACCESSIBILITY |
Stawell Gold Mines is easily accessible from Melbourne via the Western Highway. Access closer to the mine site is provided through a network of sealed bitumen government roads. Roads within the mine site are unsealed and regularly maintained. The main Melbourne to Adelaide rail line passes through the Township of Stawell, which is also serviced by a local sealed airfield.
| 5.2 | CLIMATE |
The Township of Stawell is located within the southern part of the Wimmera where the climate is described as semi-arid, allowing for exploration and mining activities all year round. Stawell’s weather for the past 20 years has recorded an annual daily average temperature of 19.7°C, a daily high mean maximum of 28.1°C in February and low daily maximum mean of 12°C occurring in July. Mean annual rainfall is 562.1mm with 80.4 days per year on average recorded as having rain.
| 5.3 | LOCAL RESOURCE |
Stawell Gold Mines has been in operation for over 30 years, developing a highly experienced workforce. Many contractors, also having a long association with the mine, are available in the Township of Stawell and surrounding regions. Due to Stawell Gold Mines’ close location to the Township of Stawell many facilities are available. Within the Township area is a police station, hospital, schools and shops. Main electricity and water are also accessible.
| 5.4 | INFRASTRUCTURE |
Stawell Gold Mine’s facilities are extensive and representative of a modern gold mining operation. Surface facilities include the gold processing plant, offices, core shed, laboratory and workshops. Larger infrastructure onsite includes a tailings dam, covering 96ha and receiving 100% of gold tailings from the processing plant. Three freshwater dams occur throughout the mine lease. The mine purchases electric power from Origin Energy Australia.
Water supply is from harvested rainfall runoff, mine dewatering, recycling of process water from the tailings facility, and by way of a 1ML/day raw water right entitlement and urban customer access to potable supply from Lake Bellfield, located in the Grampians Mountains. The capacity of the site water storages is approximately 690ML. Potable water was preferentially used in the processing operations as it improves gold recovery particularly for the sulphide portion of the ore body.
21
| Technical Report | Kirkland Lake Gold |
| December 2016 | Stawell Gold Mines |
| 5.5 | PHYSIOGRAPHY |
The area surrounding Stawell is flat to gently undulating farmland with the Grampians Mountain Range and National Park 20km to the southwest. Close to the center of Stawell is Big Hill, the Township’s highest point 303.6m above mean sea level. Stawell Gold Mines is situated on the southern slope of Big Hill. Parts of the area adjacent to the mine are covered by iron bark forest.
| 5.6 | MINING PERSONNEL |
The Stawell Gold Mines is located adjacent to the Stawell Township and as a result, the mining industry within the region is well understood and supported by the surrounding centers. Mining and exploration activities have a direct impact on the manufacturing, service and hospitality sectors of the local economies.
During 2016, prior to mine being placed on care and maintenance, Stawell Gold Mines retained a workforce of 155 people, including 135 employees and 20 contractors. Current care and maintenance workforce is 22 employees and 16 contractors.
A number of contracting personnel are engaged for security services, labor hire services, drilling activities and other typical contracted activities.
| 5.7 | PROCESSING FACILITIES |
The Stawell gold plant was commissioned in 1984, undergoing a number of upgrades over the years. Current mill capacity is 110tph on underground hard rock and up to 150tph on softer oxide ore types. The treatment facility employs gravity, flotation and fine grind and CIL processes. Infrastructure on site includes a crushing system using a primary jaw crusher and then secondary cone crushers within a closed circuit, before ore is milled in a 1.3MW single-stage, rubber lined, ball mill. The ball mill grinds the ore to 80% passing 120um. The milling circuit incorporates two gravity concentrators (one Knelson, one Falcon concentrator), extracting coarse gold from the slurry prior to flotation/regrind treatment. The 3-stage flotation circuit is present to separate sulphide minerals from the gangue material for fine grinding in a stirred mill.
The leach circuit consists of 12 leach/adsorption tanks, with loaded carbon recovered from the CIL circuit eluted in one of two pressure Zadra elution columns to remove gold as an auriferous caustic-cyanide solution from which the gold is recovered by electro winning. The stripped carbon is reactivated in a horizontal kiln and returned to the CIL circuit for reuse. Tailings from the processing plant are pumped to Tailings Storage Facility No 2 located approximately 1.8km SE of the processing plant.
The Stawell processing plant is currently on care and maintenance.
22
| Technical Report | Kirkland Lake Gold |
| December 2016 | Stawell Gold Mines |
6 HISTORY
Stawell is a historic goldfield that produced 2.7Moz of gold between 1853 and 1926 from both alluvial and hard rock sources. There was little mining activity in the Stawell area from 1926 to 1976 when Western Mining Company Resources Ltd. was granted an exploration license over the Stawell Goldfield.
In 1981, Stawell Gold Mines was reopened by a WMC/Central Norseman Gold joint venture with commencement of the Magdala decline. By 1984, the operation had expanded with the construction of a processing facility and subsequent commencement of an open cut operation at the Wonga Mine (2km south of Magdala). A number of historical tailing dumps were retreated during this period. Towards the end of mining of the Wonga open cut (1987), the Davis open cut operation was commenced. The Davis open cut exploited the oxide material on the up-dip projection of the Magdala Deposit. The Wonga open cut operated from 1984 to 1987 and produced 778,847t, recovering 69,159oz of gold. The Davis open cut operated from 1987 to 1989 and produced 154,525t for 8,992 recovered ounces of gold.
In December 1992, the operation was acquired in a 50/50 joint venture by MPI and Pittston. At this stage, the Magdala decline was at 410m RL, while the Wonga decline was at 180-200m RL. With the acquisition, there was a clear direction to increase expenditure on resource definition drilling and near mine exploration. The joint venture continued until 2004 during which time there was a record of continued exploration success with discovery of additional mineralized deposits that were subsequently mined.
In February 2004, MPI acquired Pittston’s 50% share of the project. Exploration continued in the Golden Gift area during 2004 with the commencement of the Golden Gift south surface exploration program. In November 2004, a de-merger of the MPI gold business came into effect, and Leviathan Resources Ltd. was floated in December 2004. The resource drilling into the Golden Gift Deposit initially identified seven areas of mineralization offset from each other due to late faulting. Conversion of these areas of mineralization into ore blocks wasn’t universal but was successful in the majority of cases. The further drilling of the fault blocks also identified other mineralized surfaces previously unknown due to the faulted nature of the Golden Gift. From the increased geological understanding of the Golden Gift Deposit, it was clear in the mine planning process that two declines were required, the GG5 and GG3 declines, to access the ore zones for continuity of supply.
In January 2007, Perseverance acquired Leviathan Resources Ltd. Perseverance was acquired by Northgate on February 18, 2008. Northgate was acquired by AuRico in October, 2011. Crocodile Gold completed their acquisition of Stawell Gold Mines from AuRico on May 4, 2012. A merger in July 2015 between Newmarket Gold Inc. and Crocodile Gold created Newmarket Gold Inc. In November, 2016, Kirkland Lake Inc. and Newmarket Gold Inc. merged to form Kirkland Lake Gold Ltd (KL Gold), who currently have 100% ownership of Stawell Gold Mines.
Production of both the Magdala and Golden Gift ore bodies had remained continuous with workings having reached to depths of -1200mRL and -1600mRL respectively. Lower mine closure was exercised by mid-2013 following the interception of the Wildcat Porphyry and subsequent exploration drilling was conducted only to determine deposit offsets beyond economic viability for the continuation of deep mine operations.
Since mid-2013 the mining and exploration methodology at the Stawell Gold Mines was adjusted as a consequence of the retreat from the mining of lower levels. The ‘lower levels’ primarily covers the Golden
23
| Technical Report | Kirkland Lake Gold |
| December 2016 | Stawell Gold Mines |
Gift ore bodies, which are located below the South Fault; from -900mRl to the lowest development level at -1646mRL. The closure of the lower levels of the mine and an adjusted cost model resulted in lower operating costs and thus allowed for consideration of lower grade material for mining. As a consequence, all undepleted material in the upper levels (above the South Fault) were reassessed for mining potential and unrecognized mineralized extensions. This allowed for a continued operating profile of around 38koz pa from both lower grade underground sources and processing low-grade surface stockpiles.
In 1999 a proposal was submitted to the Victorian State Government to establish an open pit mining operation over the area known as Big Hill. This proposal was subsequently rejected due a number of ministerial concerns and an additional application addressing these concerns was presented in 2014. Ministerial assessment raised additional concerns that Stawell Gold Mines are currently addressing.
On the December 13, 2016 the Stawell Gold Mine site inclusive of the processing plant transitioned into care and maintenance. An underground exploration program exploring the potential for economic mineralization on the Eastern Flank continues in 2017.
| 6.1 | HISTORICAL AND MODERN PRODUCTION |
Stawell is a historic goldfield having produced approximately 2.7Moz of gold between 1853 and 1926 from both alluvial and hard rock sources. Since the commencement of mining in the modern period, 1984, until December 2015, over 2.2Moz have been produced from the Stawell Mine. A summary of annual gold production from underground is shown in FIGURE 6-1. Ore treated and head grades from underground are shown in FIGURE 6-2.

24
| Technical Report | Kirkland Lake Gold |
| December 2016 | Stawell Gold Mines |

25
| Technical Report | Kirkland Lake Gold |
| December 2016 | Stawell Gold Mines |
7 GEOLOGICAL SETTING AND MINERALIZATION
For additional details on the geological setting of the Stawell Project beyond those required by the scope of this technical report, the reader is referred to Fredericksen, D., Miller, G., Dincer, T. (2008).
| 7.1 | REGIONAL GEOLOGY |
The Stawell Goldfield is located in the western Stawell Zone of the Lachlan Fold Belt (FIGURE 7-1). The Stawell Zone is a belt of predominantly deformed meta-sedimentary rocks representing the lower parts of the Cambro-Ordovician Lachlan Fold Belt stratigraphy bound to the west by the Moyston Fault and to the east by the Coongee Break (Vandenberg et al. 2000).
Interpretations from the Victorian Geological Survey present a thin skinned tectonics model where the Moyston Fault is an east dipping basal detachment which has juxtaposed higher metamorphic grade rocks of the Stawell Zone against lower grade Cambrian rocks of the Delamarian Glenelg Zone. The west dipping Stawell Fault, Coongee Break and other parallel west dipping faults represent back thrusts from the Moyston Fault. These back thrusts have progressively emplaced deeper stratigraphy against shallower stratigraphy with a generally west over east sense. An apparent anomaly in this sequence is the presence of deeper magnetic stratigraphy in the Stawell-Wildwood corridor. Vandenberg et al. 2002 interprets that the Pleasant Creek Fault, to the west of the Stawell Fault, actually dips east and has an east over west sense - similar to the Moyston Fault. The Stawell-Wildwood corridor therefore represents a significant structural high in an up-thrown block of deeper stratigraphy between the Coongee Break and Pleasant Creek Fault.
26
| Technical Report | Kirkland Lake Gold |
| December 2016 | Stawell Gold Mines |

| 7.2 | LOCAL GEOLOGY AND PROPERTY |
There are three separate ore bodies defined at Stawell; the Magdala (west flank and east flank), Golden Gift and Wonga. All have differing characteristics but the same local geology is relevant to the genesis of them all.
| 7.2.1 | STRATIGRAPHY AT STAWELL GOLD MINES |
The stratigraphy at Stawell is divided into three principal units: Magdala Basalt; Albion Formation; Leviathan Formation, see FIGURE 7-4 (Squire and Wilson, 2005). Intruded into this sequence are the Stawell Granite and a number of felsic and mafic intrusions. Squire and Wilson (2005) interpreted that the rock unit previously termed the Magdala Volcanogenics (Watchorn and Wilson, 1989) is an alteration facies that locally occurs adjacent to the Magdala Basalt.
27
| Technical Report | Kirkland Lake Gold |
| December 2016 | Stawell Gold Mines |
7.2.1.1 Magdala Basalt
The Cambrian aged Magdala Basalt is composed of subaqueous low-K tholeiitic lavas that exhibit an aphyric to sparsely plagioclase-phyric texture (Watchorn and Wilson, 1989; Squire and Wilson, 2005). The basalt body comprises flows ranging from 0.5m to 50m thick, pillows basalts with pillows ranging in size from 0.1 to 2m in size (Watchorn and Wilson, 1989) and monomictic basalt breccias of varying proportions (Pritchard, 2001; Squire and Wilson, 2005).
The basalts are interpreted to form part of the Victorian Cambrian greenstone sequences, which are the oldest known rocks in the Palaeozoic Lachlan Orogen and have inferred ages of 516-514Ma (Squire and Wilson, 2005). The basalts near Stawell occur as dome-like units in the footwall and hangingwall of major faults (Miller and Wilson, 2002). The Magdala Basalt, which closely resemble typical back-arc basin basalts (Kaufman, 2003; Crawford, 1988) has been interpreted to represent the medial to distal facies on the flank of a large basalt edifice upward of 500m thick (Squire and Wilson, 2005) and has similar magmatic affinities to the known basalt bodies north of Stawell, Wildwood and Kewell Basalts (Kaufman, 2003; Jupp, 2003).
7.2.1.2 Leviathan Formation
Overlying the Magdala Basalt is a 200-300m thick sequence of non-fossiliferous turbidites (Squire and Wilson, 2005). The turbidite sequence has been subdivided into two different lithologies: Albion Formation and the Leviathan Formation. The differences between the two lithologies was first recognized but not explored by Gane (1998). He recognized the sediments on the western side of the Magdala Basalt graded from predominantly mud-rich to more sand-rich away from the basalt.
The Albion Formation is believed to have been deposited precontemporaneously with the Magdala Basalt, and is found on the east flank, interbedded with the Magdala Basalt and on the west flank (Squire and Wilson, 2005), it is the lowest clastic sequence found proximal to the Magdala Basalt. The unit varies in thickness with the top of the unit defined by a 20-100m sequence of black mudstone. Within the Albion Formation there are a number of facies which along with black mudstone include calcareous sandstone, siliceous siltstone and sulphidic black mudstone. Squire and Wilson (2005) suggested that the sediments were deposited predominantly due to suspension settling in a sediment-starved sedimentary basin. There were short-lived periods of oxygen-rich conditions shortly after volcanism, recognized by the presence of siliceous siltstone but the dominance of black mudstone within the Albion Formation indicates the basin of deposition was predominantly anoxic (Squire and Wilson, 2005). The provenance for the Albion Formation sediments has been identified from detrital compositions to be a low-grade metamorphic terrain (Cas, 1983).
The Leviathan Formation overlies the Albion Formation and is dominated by fine-to medium-grained quartz-rich sandstones (Squire and Wilson, 2005). The contact between the two formations is gradational and conformable. Although the Leviathan Formation was deposited in a higher-energy environment than the underlying Albion Formation, the detrital compositions indicate little change in the provenance between the two formations (Squire and Wilson, 2005).
28
| Technical Report | Kirkland Lake Gold |
| December 2016 | Stawell Gold Mines |
The Leviathan and Albion Formations are not segregated by the mine or exploration geologists at Stawell Gold Mines and are referred to by the local name of ‘Mine Schist’.
7.2.1.3 Magdala Facies
The Magdala Facies, termed Magdala Volcanogenics at Stawell Gold Mines, distinguished by its dark green colour, is a result of intense chloritic ± stilpnomelane alteration of mudstone and or shales located at the base of the Albion Formation and immediately above the Magdala Basalt. The Magdala Facies are the primary and most important host rock for the sulphide replacement style of gold mineralization at Stawell. Major mineralization sulphides include arsenopyrite, pyrite and pyrrhotite, the latter two commonly occurring along cleavage planes and concentrated within shear zones (Robinson, 2005). Magdala Facies is also occurs on the East Flank, but differs in that BIF can clearly be identified as protolith and could provide the iron source for chloritic ± stilpnomelane alteration. Sulphide replacement of magnetite bands is identified as bands of pyrrhotite.
7.2.1.4 Felsic Intrusions
Quartz ± feldspar-phyric felsic intrusions crosscut the turbidite sequence. The quartz ± feldspar-phyric felsic intrusions vary in thickness from 50cm to 12m wide and showed chilled margins. They are predominantly composed of quartz and plagioclase with phenocrysts up to 3mm in size. The feldspar phenocrysts have euhedral shapes and display multiple twinning while the quartz phenocrysts had a cloud-like appearance and were rimmed with fibrous quartz (Gedge, 1997). The groundmass is composed of ~80% quartz in anhedral grains and display undulose extinction (Gedge, 1997).
The felsic intrusions tend to follow northwest-trending shear zones (Wilson et al., 1992) and the emplacement of the quartz ± feldspar-phyric felsic intrusions post-dates the main Magdala mineralization event. The intrusions have been dated at 413±3Ma (Arne et al., 1998).
7.2.1.5 Stawell Granite
The Stawell Granite was emplaced during the early Devonian, 401±4Ma (Arne et al., 1998), and is located about 2km south of the Magdala Deposit (Xu et al., 1994) and adjacent to the Wonga Deposit. The pluton is approximately 20km wide and 13km long and intrudes the sandstone and shale units of the turbidite sequence. The pluton is an asymmetrically zoned, medium grained intrusion, which contains diorites, granodiorites and magnetite-rich felsic granites (Wilson et al., 1992). There is a 0.5km to 1.0km contact aureole surrounding the Stawell Granite (Xu et al., 1994).
7.2.1.6 Lamprophyric Intrusions
Lamprophyres intrude all the above lithologies and are hosted in D4 shears (Gedge, 1997). The lamprophyre intrusions can range in thickness from 1.0cm to 3m (Wilson et al., 1992). The dykes vary in color from dark grey to chocolate brown and display conchoidal fracture patterns (Gedge, 1997). The compositions of the intrusions vary from monchiquite (olivine bearing) to fourchite (augite and no olivine) (Wilson et al., 1992). The lamprophyre dykes typical mineralogy is composed of Na-rich plagioclase (albite), clynopyroxenes, biotite, sulphides, ilmenite and Ti-rich magnetite (Gedge, 1997).
29
| Technical Report | Kirkland Lake Gold |
| December 2016 | Stawell Gold Mines |
| 7.2.2 | STRUCTURAL HISTORY AT STAWELL |
At least seven deformation events have been recognized at Stawell (Wilson et al., 1992). These deformation events can be broadly split into two categories; early, ductile deformation (D1 to D4), and late brittle deformation (D4 and later). A description of both categories of deformation and related structures are given below.
7.2.2.1 Early, Ductile Deformation
The ductile deformation events all occurred under a northeast-southwest shortening direction (see FIGURE 7-2) (Miller and Wilson, 2002). The earliest ductile event recognized, D1, is thought to be thrust-related with early shearing along detachment surfaces that produced a fabric, S1, parallel to bedding (Wilson et al., 1992). This event has been suggested to occur at about 510-504Ma (Squire and Wilson, 2005). The second ductile deformation event, D2, produced the most dominant ductile fabrics at Stawell and occurred at about 496-494Ma (Squire, 2004). D2 refolded F1 closures and fabric into tight F2 folds causing S1 to appear predominantly parallel to S2 (Miller and Wilson, 2002). The mesoscopic F2 folds trend to the northwest and are generally asymmetric with hinges varying in size from centimeters to tens of meters (Wilson et al., 1992). Peak metamorphism at Stawell is considered pre- to syn- D2 and reached mid-greenschist grades (Miller and Wilson, 2002, Wilson et al., 1992).
Overprinting both of the earlier fabrics at Stawell is an asymmetric differentiated crenulation cleavage, S3. D3 is a result of developing west-over east-shearing and folding (Watchorn and Wilson, 1989). This event is date at approximately 494-492Ma (Squire and Wilson, 2005). The crenulation foliation is generally sub-horizontal and is associated with cleavage-parallel veins. There is evidence of a fourth ductile fabric at Stawell, which is associated with D4 and is interpreted as a ductile-brittle event (Miller and Wilson, 2002).
7.2.2.2 Late, Brittle Deformation
Superimposed on the ductile fabrics (D1-D4) are a number of brittle structures (see FIGURE 7-2 and FIGURE 7-3). The geometry and style of the brittle deformation is strongly dependent on the pre-existing geometry of the basalt (Miller and Wilson, 2002). The initiation of the brittle deformation occurred during late D4 when the shortening direction changed from a northeast-southwest to an east-west orientation (Watchorn and Wilson, 1989; Miller and Wilson, 2002). The early D4 shear zones have a northwest trend and dip to the southwest between 20° to 60° with a reverse sense of movement (Watchorn and Wilson, 1989).
There was a change in the regional stress field within the Lachlan Orogen during the Late Silurian, which is expressed at Stawell as a change from east-west shortening to sinistral wrenching along pre-existing faults (Miller and Wilson, 2004a). Reactivation of the D4 shears by sinistral wrenching is termed D5 (Mapani and Wilson, 1994). The sinistral wrenching was followed by another change in the regional stress field with the shortening direction changing to northwest-southeast. A set of major faults oblique to the earlier structural trends associated with this change in shortening direction are termed ‘early South Fault’ structures (Miller and Wilson, 2004a). The last major deformation event was associated with a final change to a northeast-southwest shortening. Faults associated with this event dip northwest and have a dip-slip sense of movement (Miller and Wilson, 2004a).
30
| Technical Report | Kirkland Lake Gold |
| December 2016 | Stawell Gold Mines |

FIGURE 7-2 above shows stereonets represent hangingwall transport direction calculated at pole to fault with the circle center of each arrow representing a single fault pole (Miller & Wilson 2004a). These transport directions are the inferred maximum resolved shear stress along a fault for an applied stress tensor. A change in the hangingwall transport direction for similarly oriented faults represents a change in stress tensor.
31
| Technical Report | Kirkland Lake Gold |
| December 2016 | Stawell Gold Mines |

FIGURE 7-3 above shows stereonets representing hangingwall transport direction calculated at pole to fault (Miller & Wilson 2004a). Map symbol are the same as those in FIGURE 7-5. From Miller et al. 2006.
32
| Technical Report | Kirkland Lake Gold |
| December 2016 | Stawell Gold Mines |
| 7.2.3 | STAWELL MINE GEOLOGICAL ARCHITECTURE |
The dominant feature at Stawell is the 1.2km wide doubly plunging, northwest striking, Magdala Basalt dome. The Magdala Basalt is made up of a series of basalt noses, interpreted to be flow sheets (Squire and Wilson, 2005), which dip to the southwest and plunge to the northwest. Areas of sedimentation are present between the basalt noses and are locally termed ‘waterloos’. The Magdala Basalt has been drilled and identified to a depth of 1.7km and interpreted from existing drill information and from geophysical modelling to extend along strike at least 5km.
Surrounding the Magdala Basalt dome is the turbidite sequences of the Albion and Leviathan Formations (Mine Schist), which young to the west. The contact between the Mine Schist and Magdala Basalt on the western side is marked by the alteration package of the Magdala Volcanogenics. The Magdala Volcanogenics is weakly developed on the eastern surface of the Magdala Basalt.
This Magdala geology has been faulted and offset by later brittle deformation, the most notable of these offsets is the South Fault which has a northeast over southwest sense of transport (see FIGURE 7-4, FIGURE 7-6 and FIGURE 7-7).
Above the South Fault is the Magdala ore body, which contains limited offsets due to late faulting. The Basalt surface in the Magdala ore body dips to the west and strikes towards 340°. Beneath the South Fault is the Golden Gift ore body, which is heavily offset by late faulting creating isolated ore blocks. Unlike the Magdala ore body the basalt in the Golden Gift dips to the east and strikes towards 315°. The late faulting, as well as creating isolated ore blocks, also complicates the ore geometry within each block.
To the south of the Magdala Basalt is the Stawell Granite, which structurally is situated below the South Fault (see FIGURE 7-6).
Located close to an embayment in the Stawell Granite are a series of brittle structures. One of the structures (the Hangingwall structure) strikes towards 350° and dips between 25° and 50° towards the east, and the other structural set, (the Link structures), generally trend toward 240° and dip between 40° and 70° to the southeast (Xu et al., 1994). Crosscutting these late brittle structures are a series of late felsic intrusive. This fault system hosts the Wonga ore body.
33
| Technical Report | Kirkland Lake Gold |
| December 2016 | Stawell Gold Mines |

34
| Technical Report | Kirkland Lake Gold |
| December 2016 | Stawell Gold Mines |

35
| Technical Report | Kirkland Lake Gold |
| December 2016 | Stawell Gold Mines |
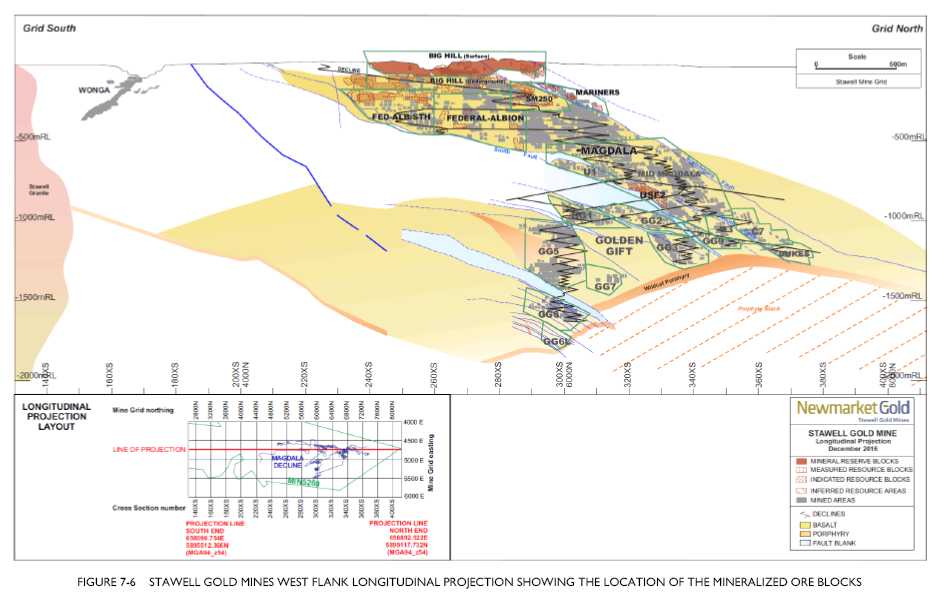
NOTE: The geological and spatial relationship between the Magdala, Golden Gift and Wonga deposits can clearly be seen
36
| Technical Report | Kirkland Lake Gold |
| December 2016 | Stawell Gold Mines |

37
| Technical Report | Kirkland Lake Gold |
| December 2016 | Stawell Gold Mines |
| 7.3 | MINERALIZATI3ON |
| 7.3.1 | INTRODUCTION |
Victorian mineralization episodes have been dated to occur during the Devonian and Silurian periods with no gold mineralization occurring prior to 440Ma (Miller and Wilson, 2002). A description of the mineralization episodes in western Victoria is described below.
The largest and most significant mineralization event in the western Lachlan Orogen occurred at ca. 440Ma (Foster et al., 1998). It occurred contemporaneously in the Stawell and in the Bendigo-Ballarat Zones with the mineralization occurring during late D4 deformation in the Stawell Zone and occurring during late D1 deformation in the Bendigo-Ballarat Zone. The mineralization is hosted in D4 brittle structures associated with east-over-west movement at Stawell while in the Bendigo-Ballarat Zone the mineralization occurs in saddle reefs in the hinges of D1 folds and in reverse faults created via D1 fold lock-up (Miller and Wilson, 2002; Schaubs and Wilson, 2002). This mineralization event produced the largest endowments of gold within the western Lachlan Orogen (Miller and Wilson, 2002).
The next episode of gold mineralization occurred at about 426-420Ma (Foster et al., 1998) and is associated with fault reactivation throughout western Victoria (Miller and Wilson, 2002). This episode of gold mineralization produced significantly smaller endowments than the 440 Ma event (Miller and Wilson, 2002). The late Silurian mineralization is associated with the D5 sinistral wrenching at Stawell and has been recognized at the Percydale fields in the Stawell Zone and at Tarnagulla in the Bendigo-Ballarat Zone (Miller and Wilson, 2002).
The final episode of mineralization recognized in western Victoria is the Wonga mineralization at Stawell (Miller and Wilson, 2004a). The mineralization at Wonga overprints the quartz- and felsic-rich intrusions and is overprinted by the Stawell Granite contact areole. Watchorn and Wilson (1989) suggested that this mineralization is temporally and spatially related to the granites emplacement. Miller and Wilson (2004b) advocate the mineralization event at Wonga formed at ca. 400Ma (Foster et al., 1998). The Wonga mineralization occurred during a late-stage magmatic event within a long-lived orogenic system at shallow crustal levels (Miller and Wilson, 2004b). This mineralization occurred in a series of brittle structures dependent on pre-existing weakness which are related to a fluid over-pressure event after the lockup of major structures (Miller et al., 2004).
| 7.3.2 | MINERALIZATION STYLES AT STAWELL |
There are three mineralization styles at Stawell, being Magdala (separated into west and east flanks), Golden Gift and Wonga. The Magdala and Golden Gift ore types are hosted within the Magdala Volcanogenic. Within the Magdala Deposit there are three main ore types; Central Lode, Basalt Contact Lodes, and Magdala Stockwork Lodes. The East Flank mineralization introduces a new ore type: The Hampshire Lode.
Central Lode mineralization (see FIGURE 7-8) was a significant production source from Magdala early in the mine’s history. It is a quartz-rich shear lode ranging from 0.5m to 10m in width and generally dips 55° to 65° to the west with a total strike length of 4km and a down-dip extend of one kilometer. The overall structure is mineralized economic shoots that vary from 20m to 30m in strike up to 200m to 350m in strike. Free gold in the quartz is associated with pyrite, arsenopyrite and recrystallized pyrrhotite. Average mined grade for Central Lode is 4.0 g/t Au – 7.0 g/t Au.
38
| Technical Report | Kirkland Lake Gold |
| December 2016 | Stawell Gold Mines |

Basalt Contact Lodes (see FIGURE 7-9) are located parallel to the Magdala Basalt and in ‘waterloo’ or reentrant positions. They are typically 2m wide and are represented by arrays of quartz sulphide tension veins immediately adjacent to the Volcanogenic Basalt contacts. Sulphides include pyrrhotite, arsenopyrite and pyrite and occur as alteration selvages on tension vein margins. The main alteration mineral is stilpnomelane, resulting in its dark color. The mineralization is isolated to the Magdala Volcanogenic package with none present in the adjacent Magdala Basalt. Ore shoot lengths range between 50m and 450m. The average mined grade for Basalt Contact Lodes is 4.0 g/t Au – 9.0 g/t Au.
39
| Technical Report | Kirkland Lake Gold |
| December 2016 | Stawell Gold Mines |

The Magdala Stockwork Lodes are situated above major basalt noses and can be described as a hybrid between Central and Basalt Contact Lodes. They consist of large quartz tension vein arrays with arsenopyrite and pyrrhotite dominant sulphide mineralization. The strike extent is limited to 40m to 50m and limited vertically to between 30m and 50m. Average mined grade for Magdala Stockwork Lodes is 4.0 g/t Au – 7.0 g/t Au.
Unlike the Magdala Deposit there is only one identifiable ore type in the Golden Gift and this is termed the Golden Gift Stockworks. Though there is only one discernible ore type in the Golden Gift, the Golden Gift Stockworks contain a spectrum of all Magdala styles. Typical widths range from 8-12m up to 30m and the strike extents of shoots range between 150m and 400m. Areas of highest gold grades and largest widths are situated above major basalt noses which are present in most ore bodies. Quartz content is generally below 25%. Mineralization includes abundant recrystallized pyrrhotite and coarse grained arsenopyrite, pyrite and visible gold. Average mined grade is 4.0 g/t Au – 10.0 g/t Au.
In comparison to current mining areas at Magdala, the Aurora B Zone sits on the East Flank of the Magdala Basalt. Like the West Flank, mineralized gold lodes occur within altered sediment off the contact of the Magdala Basalt ‘dome’. However, the host rock appears to differ and as a result so does the style of gold mineralization. The Fest Flank sediment hosted ‘Volcanogenics’ protolith appears to consist of siliceous siltstones, mudstones and calcareous sandstones and gold mineralization has a close association with sulphides (Aspy, Py, Po). Unlike the West Flank sediments, the Eastern Flank includes a magnetite-rich banded unit. This East Flank protolith was most likely siliceous and ferruginous chemical sediment. The magnetite banding is likely the result of interfingering of Fe-rich sediments (granular Fe-oxide particles and minor pyrite) with siliceous sediments. The term ‘BIF’ has been used in the logging codes to represent this due to visual similarities to banded iron formations.
40
| Technical Report | Kirkland Lake Gold |
| December 2016 | Stawell Gold Mines |
The Aurora B gold mineralization was observed to differ from the sulphide-replacement-style mineralization observed on the Western Flank. The Eastern Flank of the Magdala Basalt is distinguished by a significant reduction of chlorite (which is predominantly limited to vein selvages), and a near absence of muscovite. The Aurora B mineralization is hosted within a strongly altered silica-sulphide altered siliclastic sedimentary unit that contain centimeter to meter scale sub-planar layers dominated by magnetite-chlorite-carbonate alteration. The West Flank mineralization, however, is hosted in quartz lodes and within Fe enriched mudstone (The “Stanwell Facies” or Volcanogenics – Mine term).
The Wonga Deposit is hosted within the locally termed Wonga Schist that is part of the Leviathan Formation along two main fault systems. The Wonga Schist has undergone contact metamorphism during the emplacement of the Stawell Granite and undergone three ductile deformation events similar to other areas of the Stawell region. The two fault systems controlling the mineralization are the Hangingwall structure which, strikes towards 350° and dips between 25° and 50° towards the east, and the Link structures, which generally trend toward 240° and dip between 40° and 70° to the southeast. The mineralization is represented by arsenopyrite disseminations in quartz veins within these structures. The main minerals present are anhedral fine grained pyrrhotite and arsenopyrite. The higher grade ore zones often show andalusite and sericite alteration with rutile and ilmenite associations. Production grades from 4.0 g/t Au – 6.0 g/t Au were common for the Wonga Deposit.
| 7.3.3 | MINERALIZATION TYPES BY AREA |
7.3.3.1 Aurora B
In comparison to the mined areas of the Stawell underground mine, Aurora B sits on the East Flank of the Magdala Basalt. Like the West Flank, mineralized gold lodes occur within altered sediment off the contact of the Magdala Basalt ‘dome’. However, the host rock appears to differ and as a result so does the style of gold mineralization. The West Flank sediment hosted ‘Volcanogenics’ protolith appears to consist of siliceous siltstones, mudstones and calcareous sandstones and gold mineralization has a close association with sulphides (Aspy, Py, Po). In addition to the West Flank sediments the Eastern Flank includes a magnetite-rich banded unit. This East Flank protolith was most likely siliceous and ferruginous chemical sediment. The magnetite banding is likely the result of interfingering of Fe-rich sediments (granular Fe-oxide particles and minor pyrite) with siliceous sediments. The term ‘BIF’ has been used in the logging codes to represent this due to visual similarities to banded iron formations.
The Aurora B gold mineralization was observed to differ from the sulphide-replacement-style mineralization observed on the western flank. The eastern flank of the Magdala basalt is distinguished by a significant reduction of chlorite (which is predominantly limited to vein selvages), and a near absence of muscovite. The Aurora B mineralization is hosted within a strongly altered silica-sulphide altered siliclastic sedimentary unit that contain centimeter to meter scale sub-planar layers dominated by magnetite-chlorite-carbonate alteration. The West Flank mineralization however, is hosted in quartz lodes and within Fe enriched mudstone (The “Stawell Facies” or Volcanogenics – Mine term).
41
| Technical Report | Kirkland Lake Gold |
| December 2016 | Stawell Gold Mines |
Mineralized intervals are highly represented within the ‘BIF’ due to the availability of sulphur and iron within the ubiquitous pyrrhotite and magnetite. Visible gold mineralization within the eastern flank was observed to occur within chlorite and sulphur-poor quartz veins, and within the host matrix adjacent to auriferous veins. The gold mineralization was observed to post-date the main quartz-stilpnomelane-magnetite-pyrrhotite alteration assemblage. There was an unclear relationship between gold and arsenopyrite, with no association observed between the two in thin section. Of the sulphides present within the Aurora B, pyrite was the only sulphide identified which hosted gold.
Structural analysis of the east flank of the Magdala basalt identified three ductile deformation events within the host sequence during approximately E-W shortening (D1-D3). The dominant structures are the F3 hinges, which define the basalt noses. Gold mineralization is closely associated with these decameter scale folds, due to folding and cracking of the brittle host sequence, creating zones of dilation, later infilled with mineralized veins. The mineralized lodes, previously interpreted as a sub-vertical structure following the east flank of the Magdala Basalt, have now been defined as broadly concordant to the basalt dome. These lodes therefore consist of two categories: ‘vertical’ lodes which occur along the basalt flanks, and ‘flat’ lodes which occur within the hinges of F3 folds. Gold mineralization is the most volumetrically significant within the flat lodes, as this zone was subject to the most dilation, due to competency contrasts between the silica-rich chemical sediments and the less competent pelitic units.
Mining on the East Flank first occurred in 2016 with the placement of a drill platform which extended at the 342 Level through the basalt pile from west to east and intersected the east contact of the Moray Basalt. Economic mineralization was mined from what has been termed the Bengal Lode (currently not drill tested or modelled) as the drill platform was established. The Bengal Lode is the up-dip mineralization of the identified ‘waterloo’ mineralization of the first Aurora B Resource Model.
The current working hypothesis developed by the Stawell geology team is that BIFM is a metasomatically-modified rock-type that reflects the impact of the sea floor or diagenetic alteration process. Sea floor metasomatism resulted in iron being stripped from the underlying Magdala Basalt and redistributed into the immediately overlying psammo-pelitic sedimentary pile (sedimentary rocks overlying the Magdala Basalt may have been partially sourced from the mafic volcanic pile further promoting an iron rich chemistry) (Beeson, et al., 2016). The pillowed sequence of the Magdala Basalt is west to the Aurora B mineralization, and presents as a series of tight antiformal folds. Around the basalt lies the BIF mineralization zone within which is the mineralized zone which presents as thickened flat structures on the basalt noses (up to 12m thick) and vertical structures on the basalt flank, FIGURE 7-10.
42
| Technical Report | Kirkland Lake Gold |
| December 2016 | Stawell Gold Mines |

The current interpretation of the Hampshire Lode combines the BIF Hampshire mineralization and the porphyry contact mineralization; however, this is yet to be confirmed with further drilling. The Hampshire Lode averages about 5m thick. Grade varies; averaging 3-4 g/t Au with several intercepts greater than 25 g/t Au. Stronger grades appear to be within shallow, north plunging shoots such as those seen on the West Flank.
7.3.3.2 Upper South Fault 2
Geologically, the Upper South Fault 2 (USF2) shares the same characteristics as the other Magdala ore bodies, comprising of three distinct mineralization types. The mineralization types, which occur in the Magdala System include the quartz rich shear of Central Lode, the chlorite and sulphide rich Basalt Contact Lodes and the Stockwork Lodes, FIGURE 7-11.
The Central Lode shear zone generally has a well-defined hangingwall to shear along the Mine Schist/ Volcanogenic contact. The footwall structure is generally marked by a shear surface also, but at times gradational into stockwork Volcanogenics. The distribution of grade with the Central Lode is not uniform. But in this model it has some relationship with the internal basalt contacts. Up to two basalt dykes have intruded the Central Lode, one along or very near the Mine Schist contact, the other in the middle of the Central Lode. Gold grades in the USF2 Central Lode are of a low but consistent tenor, between 2-3 g/t Au with minor high-grade hits and outliers.
The Dukes Basalt Lode mineralization comprises dark green chloritic Volcanogenics, host to quartz sulphide tension veining. The hangingwall to the Basalt Contact Lode structure is generally defined by a quartz pyrrhotite shear structure, while the footwall is defined by the contact with the Basalt. The Basalt contact is often bounded by a 30cm to 50cm wide quartz sulphide vein containing coarse arsenopyrite and recrystallized pyrrhotite correlating with gold content.
43
| Technical Report | Kirkland Lake Gold |
| December 2016 | Stawell Gold Mines |
The Stockworks is made up of the Footwall Volcanogenics between the Central Lode and the Dukes Lode and is made up of quartz-sulphide tension vein arrays and contains 10+% massive pyrite and pyrrhotite with trace arsenopyrite. This zone is constrained to the southern end of the model and has been mined over the 2015 period. This zone reduces in grade to the north and is below the 2.3 g/t Au current economic cutoff down-plunge of the north of the 772 level.

7.3.3.3 Below Scotchmans 250
The Below Scotchmans 250 (SM250) Resource Model includes the northern region of the upper levels in the underground mine environment. The Below Scotchmans 250 area is in the Magdala Basalt flank in a structurally complex area where there is horizontal offset of the basalt and the formation of flat lodes over the basalt noses. The Central Lode is bound to the top by the Scotchmans Fault, and a narrow hangingwall lode is defined, FIGURE 7-12.
The Central Lode shear zone generally has a well-defined hanging wall to shear along the Mine Schist/ Volcanogenic contact but may also occur within Volcanogenic package. The footwall structure is generally marked by shear surface also, but at times gradational into stockworked Volcanogenics. The distribution of grade with the Central Lode is not uniform.
44
| Technical Report | Kirkland Lake Gold |
| December 2016 | Stawell Gold Mines |
The Hangingwall Lode is geologically similar to the Central Lode, with a high component of quartz, however, it is exclusively located in the hangingwall of the Central Lode, bound by Mine Schist or pelite and is typically much narrower and higher grade, and hence is generally almost all depleted. The Hangingwall Domain has now replaced what was previously interpreted as discontinuous splays, and it shown to continue from below Flat 1 up-dip to splay above Flat 3. As with the Central Lode, when it intersects the Flats it is variably offset from 5m to 10m.
The Magdala Lode mineralization comprises dark green chloritic volcanogenics, host to quartz sulphide tension veining. The footwall is defined by the contact with Magdala Basalt, and the hangingwall defined by the reduction of chlorite and sulphide. The basalt contact Magdala Lode wraps around a number of basalt noses and ‘waterloos’ and has variable grade.
The Flat Lodes 1 and 2 were previously mined by a handheld mining process and are effectively almost depleted. The lodes are typified by massive quartz reef with internal pyrite, arsenopyrite and pyrrhotite. The flats and are almost flat lying (25° to 35°), interpreted to be a flat fault formed above the basalt noses, that do not extend into the basalt.
Flat 3 is the highest flat defined by the 2015 and 2016 drilling and appears to tear and offset the Central Lode. Higher gold grade is concentrated at the intersection of the Flat and the Central Lode. Mining of this intersection has contributed to the 2016 production profile.
A small Flat 4 was modelled in the new model update, located up-dip of Flat 3. Flat 4 appears to be almost exclusively mined by handheld mining and is localized to the 145mRL.

45
| Technical Report | Kirkland Lake Gold |
| December 2016 | Stawell Gold Mines |
7.3.3.4 Federal Albion
The Federal Albion (Federal Albion and Federal Albion South (FAS)) shares the same geological characteristics as the other Magdala ore bodies above the South Fault: a west-dipping to sub-vertical ore lode adjacent to a basalt footwall contact; a Mine Schist hangingwall; the westerly dipping, quartz-rich Central Lode shear structure; and a weakly mineralized Volcanogenic package between Central Lode and the Footwall Ore Zone. A cross section showing the relationship between the various geological components is shown in FIGURE 7-13.

46
| Technical Report | Kirkland Lake Gold |
| December 2016 | Stawell Gold Mines |

Central Lode is typified by wide (1m to 10m) laminated to buck quartz seam and associated FW stocks in the Magdala “Volcanogenic” and its hangingwall is commonly defined by the Mine Schist. The Central Lode is often partially stoped out by later stage felsic porphyry dykes running sub parallel to the Central Lode shear, most dominantly on the hangingwall. Gold grades in the FAS Central Lode is of a low but consistent tenor between 2-3 g/t Au with minor high-grade hits and outliers.
The Extended Lode, on the western side of the Extended Basalt, is typified as a 1m to 2m wide, basalt contact mineralization, hosted within strongly chlorite altered volcanogenic or iron-rich sediments. Sulphide mineralization consists of coarse arsenopyrite up to 20mm with recrystallized pyrrhotite and minor pyrite. Quartz tension veins up to 0.75m wide are a common feature in the Basalt Contact Zone. Another feature, common in the immediate contact zone with the basalt is abundant silicification of the host rock in bands up to 1.0m wide. In places Central Lode has sheared out part or all of the Extended Lode and forms the hangingwall.
FIGURE 7-14 shows a typical cross section through the Federal Albion South Area with current interpreted geology. This geological framework is the same for the Federal Albion Area, which is the same as Magdala mineralization to the north.
Remodeling of previous drill intercepts coupled with drilling from 2016 into the upper Federal Albion South Area, identified a hangingwall structure west of the Central Lode, It was first modelled from 5120North extending to the south and splaying off from the Central Lode at approximately-200mLR. Adequate drill data is present within the domain and average grade is 2.3 g/t Au.
47
| Technical Report | Kirkland Lake Gold |
| December 2016 | Stawell Gold Mines |
7.3.3.5 Moray North
To date, Moray drilling indicates a similar contrast in geology to both the Upper Magdala ore bodies on the west and the Aurora B on the east at the Stawell Mine. Moray lode is interpreted to be the mineralization on the contact of the Moray basalt anticline. Three zones of mineralization have been modelled which have been termed the “basalt contact”, the “weak volcanogenic” and the “waterloo” zones, FIGURE 7-15.
To date, no mining has occurred on the Moray Lode and much like the Eastern Flank mineralization, it has been poorly explored. Two areas have been drilled to sufficiently define zones of continuous mineralization, the 275mRL (Moray Central) and the 475mRL (Moray North). Additionally, an exploration program in 2016, (detailed in Chapter 9), drilled out a zone of the Moray basalt contact Lode above 342 exploration drill drive, however, this program returned no significant gold intercepts.
Moray mineralization thus far, has been defined on the flank of the basalt contact (vertical) and is typically narrow from, 1.5m to 2.5m wide. Mineralization on the basalt nose (flats) has been poorly defined and appears to be of a lower gold tenor. Moray Lode is currently understood to be within the continuum of the Magdala mineralization and the Eastern Flank mineralization and exhibits properties of both lode styles.

The North Moray Model Area is located to the east of the North Mag-600 (2015) Resource Model. Additionally, the R1 target area (drill target area in 2016 Section X) is located directly above this resource, above the crest of the Moray and Magdala Basalts. Some of the drill intercepts of the R1 target area have not been domained for this resource model so there is an element of unconstrained mineralization estimated in the low-grade Volcanogenic (LG Volc) Domain.
48
| Technical Report | Kirkland Lake Gold |
| December 2016 | Stawell Gold Mines |
7.3.3.6 Mariners
The underground Mariners Area represents the down-dip extension/fault off-set of the surface Mariners target which was modelled as part of the Big Hill and Upper Levels Model in April 2014.
Geologically, the Mariners Area is a fault zone formed by the diverging Scotchmans Fault and Scotchmans Fault Splay which form a 'wedge'. This fault zone is known as the Scotchmans Fault Zone (SFZ) and contains highly deformed slices of basalt and pelites with high carbon alteration. The bounding faults have a high graphite content, which has enabled both faults to capture remobilized gold. Within the SFZ are secondary faults dipping moderately to the west, terminated by the bounding faults, these are considered to be the main structural hosts for the gold mineralization.
Mineralization is hosted within secondary shears and is associated with quartz breccia and fine-medium grained sulphides. The Curiosity, Opportunity, New, Mariners and Spirit Lodes are bound between the Scotchmans Fault at depth and the Scotchmans Splay (see Figure 8-5). Once considered an offset, upper component of the Central Lode System, the Mariners is now considered its own mineralized system within the Scotchmans Fault Zone. The schist within the zone have a much higher carbon content and are more intensely deformed than Albion Formation typically seen in the footwall of the Central Lode.
FIGURE 7-16 shows a typical cross section through the Mariners Area with current interpreted geology.

7.3.3.7 Big Hill and Upper Levels
Immediately below the Big Hill Surface Mineral Resource is the Upper Levels underground Mineral Resource and both are the up-dip extension of the Magdala System. It contains Basalt Contact mineralization, Central Lode mineralization and Stockwork mineralization, all typically seen in the Magdala System and previously mined from underground.
49
| Technical Report | Kirkland Lake Gold |
| December 2016 | Stawell Gold Mines |
Big Hill can be broken into four different geological mineralization domains, Mariners, Allens, Iron Duke and the Magdala Flank. All except Mariners and Allens are separated by faults. The Allens and Iron Duke are stockwork zones, which in their entirety are covered by the Big Hill Surface Mineral Resource. Mariners and the Magdala Flanks mineralization comprise the Upper Levels Underground Mineral Resource.
Mariners Lode has a consistent width and orientation, averaging around 14m and dipping to the northwest (mine grid). It constitutes of a shear package, with massive quartz veining. Offset extensions of the Mariners shear have also been modelled down-dip (see Figure 7-17). The original Upper Levels Model (1998) identified one offset extension; however, two further offset domains were identified in the 2012 model update. Underground drilling of Mariners Lode in early 2012, developed an increased understanding of the structural framework, identifying increased faulting complexity and offset lodes, which now connect the underground Mariners and Upper Levels Mineral Resource Models with the Big Hill Surface Model.

The main Mariners Lode is offset by Fault 3, which strikes at 145° (mine grid) and dipping approximately 35º to 40º northeast. It has an apparent reverse displacement of between 5m and 25m, decreasing northwards. This section of the Lode (Mariners L1) is then truncated and offset at depth by the Cross Course Fault. In this model update, the Cross Course Fault has been remodelled as two fault surfaces, which bounds another lower lode offset (Mariners L2). A third, less horizontally extensive offset (Mariner L3) was identified and was modelled to be bounded by the Cross Course Fault lower surface and the Scotchmans Fault. The Mariners L3 has a greater offset of 15m to 25m and plunges further to the north than the above two offset lodes, which is likely due to a greater influence from the Scotchman’s faulting. In reality these offset sections are likely to be more complexly faulted than modelled.
50
| Technical Report | Kirkland Lake Gold |
| December 2016 | Stawell Gold Mines |

The Allens Stockwork Zone is located below the Mariners Lode, see Figure 7-19. Exposures in the Allens open pit show lithological layering (S0 and later S2/3 foliation), as well as massive veining to be very steeply dipping to vertical. Diamond core shows the same. Two massive veins exposed in the Allens adit strike approximately N-S (mine grid) and dip vertically. Some stockwork style veining is seen near the top of the zone (immediately beneath the Mariners structure), but much of the geology consists of well bedded, foliated Volcanogenic sediments, which are unpredictably mineralized. Much of the gold occurs in these sediments. Because of the highly oxidized state of these rocks the form of sulphide mineralization is largely obliterated.
The relationship between the Mariners and Allens Zones is problematic. Little overlap exists beneath the main flatter section of Mariners and the Allens Zone, which dies out rapidly northwards beneath Mariners. No clear evidence is seen of the timing relationships between these structures, the Allens mineralization appears to hang as a pendant of dilational veining beneath a change in orientation of the Mariners shear structure.

51
| Technical Report | Kirkland Lake Gold |
| December 2016 | Stawell Gold Mines |
The Iron Duke Zone is a wedge of geology occurring between the Scotsman’s Fault and the Lower Cross Course Fault, Figure 7-19. It is the up-dip extension of the volcanogenic package/shear zone which has been offset from the main Magdala shear system by reverse movement on the Lower Cross Course Fault. It is truncated above by the Scotchmans Fault Zone, which again displaces the deposit westward. Interpretation of the geology in this zone is hampered by the strongly oxidized nature of the rocks. It has been interpreted as a series of constrained stockwork style mineralized zones (same as Allens), where the envelopes have been used to constrain tonnage. In reality the margins will have gradational boundaries.
For wireframing purposes the Iron Dukes Domain has been considered in the same context as Allens and was treated as broad envelope around the stockwork zones constraining bulk tonnage. The previous model wireframed the structures at a higher gold grade, which effectively reported a higher grade for lower tonnes. A lower domain gold threshold was used for this model update (0.35 g/t Au); in line with the model economic cut-off (0.44 g/t Au) to ensure all mineable tonnes were economically represented for mining analysis.

“Magdala Flanks” is the term used to describe the package of volcanogenic rocks lying to the west of and continuing up-dip from the nose of, the Basalt antiform. The western margin of this zone is the contact between the Volcanogenics and the Mine Schist, which often plays host to the Hangingwall Shear. The eastern margin is generally the contact with the basalts, but above the basalt noses, the eastern margin is a transitional boundary to siliceous eastern schists, usually marked by a clear grade boundary. The Hangingwall Shear was most recently air-leg mined from the –180 and –145 levels (and from sub-levels up to –109), between 269 and 278 N sections in the early 2000’s. Significant old stoping on this shear was encountered up-dip of those recent air-leg workings. The geological interpretation of the Magdala Flanks mineralization is shown in Figure 7-20.
52
| Technical Report | Kirkland Lake Gold |
| December 2016 | Stawell Gold Mines |
8 DEPOSIT TYPES
Sulfide gold mineralization at Stawell is typical of orogenic gold deposits.
Stawell is hosted by quartz-rich turbiditic sedimentary rocks (Albion Formation) that overlap a thick pile of tholeiitic basaltic lavas (Magdala Basalt). It is suggested that the host-rock (Stawell Facies) was originally a turbiditic sedimentary rock that was hydrothermally altered in response to seawater interaction with the hot basaltic pile. Subsequent regional greenschist metamorphism and ductile deformation culminated in the formation of the Magdala mineralized system and produced a complex pattern of hydrothermal alteration.
For details on the deposit types and mineralization of the Stawell deposits the reader is referred to the Technical Report on Stawell Gold Mine (Fredericksen, Miller and Dincer 2008).
53
| Technical Report | Kirkland Lake Gold |
| December 2016 | Stawell Gold Mines |
9 EXPLORATION
Exploration during 2016 has focused on extensions of the Magdala Deposit. Significant exploration progress and successes have been made over the life of the Stawell Project. In the period from January 1, 2016 to December 31, 2016 exploration has taken place on the West and East Flank of Magdala, Figure 9-1 and Figure 9-2.
Exploration on the Magdala West Flank (Figure 9-1) has concentrated on areas close to current infrastructure and includes the Mariners 109 and R1 468L Mid-North Magdala extensions.
Exploration on the East Flank (Figure 9-2) resulted in definition of the Aurora B Inferred Mineral Resource and drill testing of the Moray 343 Zone.
54
| Technical Report | Kirkland Lake Gold |
| December 2016 | Stawell Gold Mines |

55
| Technical Report | Kirkland Lake Gold |
| December 2016 | Stawell Gold Mines |

56
| Technical Report | Kirkland Lake Gold |
| December 2016 | Stawell Gold Mines |

57
| Technical Report | Kirkland Lake Gold |
| December 2016 | Stawell Gold Mines |
| 9.1 | CURRENT EXPLORATION |
Exploration progress and successes have been made over the life of the Stawell Project, including the discovery of the current Mineral Resources. In the period from January 2016 to December 2016 exploration success of note is the conversion of mineralization in the Aurora B Area to Mineral Resources (see Figure 9-2).
Near mine exploration during the period concentrated on adding to Mineral Resource in the underground environment and testing extensions to the mineralization for potential conversion in the near to mid-term. This included the Aurora B, 468L Mid-North Magdala, Moray 343L and Mariners 109 Programs, Figure 9-1 and Figure 9-2.
No surface exploration occurred in 2016.
Exploration work in 2017 is budgeted at A$1.7M and will be primarily directed toward Aurora B and East Flank resource extension and targets with the objective of adding these to Mineral Resource, and to further test the extent of the East Flank mineralization.
58
| Technical Report | Kirkland Lake Gold |
| December 2016 | Stawell Gold Mines |
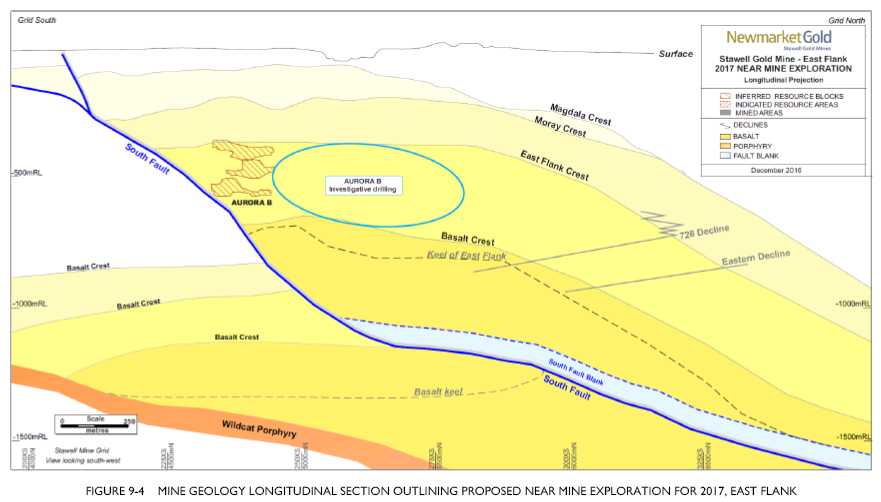
59
| Technical Report | Kirkland Lake Gold |
| December 2016 | Stawell Gold Mines |
| 9.2 | MAGDALA WEST FLANK |
Over the last 35+ years of operation at Stawell Gold Mines, mineralization proximal to the western flank of the Magdala Basalt has been the dominant source of ore feed. Since modern operations began in 1984, approximately 2.3Moz of gold has been extracted. In the past 12 months, exploration on the West Flank has focused on the larger areas remaining between depleted mining areas.
| 9.2.1 | 486L MID NORTH MAGDALA TARGET |
The R1 468L target is located above the Magdala Basalt Nose and below the Scotchmans Fault. Gold mineralization is hosted in the Central Lode and parallel Hangingwall Lodes, which in this position changes orientation to flatten within the sediment over the top of the Magdala Basalt Nose. Flat lying splay faults off the Scotchmans Fault cause minor displacement of the Central Lode with top to the southeast movement. Dilation of the Central Lode tends to occur over the top of the Basalt Nose and also where the splay faults intersect the Central Lode; these dilation zones have been found to be associated with higher grades in other areas of the Magdala Deposit.
During 2016, a six drill hole program totaling 1,174m was drilled to investigate a north down-plunging extension of the Central and Hangingwall Lodes on a 150m x 50m spacing. Results indicated that continuous mineralization is hosted closer to the Basalt contact down-plunge to the north with more discontinuous mineralized offsets away from the contact.
| 9.2.2 | MARINERS 109 |
The Mariners 109 target is located above the Scotchmans Splay between the weathered transition zone and the 250 Level. The program was testing historic low-grade intercepts in an otherwise untested highly prospective area of the mine, the down-plunge extension of the Big Hill North pit. Unfortunately, the gold results for this area were disappointing and no further exploration work is planned in this area of the underground.
| 9.3 | MAGDALA EAST FLANK |
The East Flank of Magdala includes the whole ~3km strike length of the eastern flank of the Magdala Basalt. There is no record of gold production from the East Flank and little exploration has taken place with priority given to the already accessible West Flank (located 0.5 -1km to the west). During 2016, 242m of development was advanced towards the East Flank to create a drill platform to expedite exploration (see Figure 9-3). The East Flank has been divided into two areas with the South Fault as the boundary: Aurora B in the hangingwall and Aurora A in the footwall. No exploration was conducted over Aurora A during 2016.
| 9.3.1 | AURORA B |
Aurora B sits on the East Flank of the Magdala Basalt. Mineralized gold lodes occur within altered sediment off the contact of the Magdala Basalt ‘dome’. The protolith consists of siliceous siltstones, often with magnetite rich bands and associated sulphides (Aspy, Py, Po), mudstones and calcareous sandstones. This East Flank protolith was most likely siliceous and ferruginous chemical sediment. The magnetite banding is likely the result of interfingering of Fe-rich sediments (granular Fe-oxide particles and minor pyrite) with siliceous sediments. The term ‘BIF’ has been used in the logging codes to represent this due to visual similarities to banded iron formations. The area has been extensively folded over multiple generations of structural deformation resulting in a series of ‘noses’ and ‘waterloos’ striking north-west. The BIF unit is believed to host the gold mineralization in the Aurora B Area.
60
| Technical Report | Kirkland Lake Gold |
| December 2016 | Stawell Gold Mines |
Twenty Six diamond holes over a series of drilling phases were drilled for 10,148m into the Aurora B Deposit in the first half of 2016. The programs aimed at drilling at a sufficient density and confidence sufficient for an Inferred Resource of the area.
The drilling programs highlighted the need for an exploration drive to be developed above the Flats Areas to better estimate BIF thicknesses through improved intersection angles. As a result, a 242m exploration development drive was completed in the second half of 2016 to gain better access to the flat mineralization above the basalt.
The exploration drive intersected significant sub-vertical mineralization 3m to 3.5m wide grading approximately 7.5 g/t Au corresponding to the Bengal sub-vertical lodes west of the Bengal Flats. Ore strike drives were developed along the basalt and BIF contact in excess of 80m with mineralization still open to the north and south. Ore was stockpiled on the surface before being milled with good recoveries (93%) and high levels of free gold (above 50%) reported.
| 9.3.2 | MORAY 343 |
The Moray 343 target area is located within a large ‘waterloo’ within the middle upper portion of the
Basalt dome, between the west and east flank of the Magdala and Moray Basalt. Basalt contact mineralization has been defined on the west flank of the Moray Basalt Nose in other areas of the Moray Basalt (275mRL and 468mRL – Moray N). As access to the Moray ‘waterloo’ became accessible in 2016 with the development of the 343 Level exploration drill drive (for drilling the Aurora B target), the Moray 343 target area was developed for drill testing. There were no previous intersections of the Moray Lode in the area, so the drill program was for scoping purposes to determine if the basalt contact was mineralized.
A 250m strike length was targeted from the Aurora B 343 exploration drill drive with a program of nine holes for 1,605.1m at 60m spacing. Unfortunately, the gold results for this area were disappointing and no further exploration work is planned in this area of the Moray contact mineralization. The Moray Basalt contact is another basalt flank that can be explored along with the Eastern Flank. Mine Geology have drilled the Moray North target (475mRL) and converted it to a resource in 2016 (8koz Indicated and 4koz Inferred). Mineralization controls on this flank need to be understood (in line with learnings from the Aurora B Project) to enable future effective targeting on the Moray Flank.
| 9.4 | REGIONAL EXPLORATION |
Regional exploration focused on the northern extension of the Moornambool Metamorphic Complex (MMC) looking for repeats of the Magdala System. At Stawell, the Palaeozoic basement outcrops, but 10km further north it is obscured by the much younger Cenozoic age Murray Basin Sediments (clays and flowing sands), which become deeper further north. Identification of basalt bodies in the corridor is initially by aeromagnetic data and regional gravity data where they show up as coincident gravity and magnetic anomalies. Ground geophysics is then conducted to better refine drill targets before drilling is used to test the basement geology. Relying solely on geophysics has created difficulties, as areas of potential mineralization along the extensive geophysical anomalies have not been tested. To address this, a large Ionic Leach (ALS Laboratory trademark) soil sampling program was conducted in 2012-2013 providing the geochemical information to complement the existing geophysical dataset in order to further define robust drill targets.
61
| Technical Report | Kirkland Lake Gold |
| December 2016 | Stawell Gold Mines |
No regional exploration has occurred during the reporting period as the exploration focus has been on extending the mine life at SGM through near mine exploration. SGM has been exploring the north for over 20 years, a summary of the main prospects and work completed is included in Table 9-1 below.
Locations for all regional exploration prospects are shown in Figure 9-5.
62
| Technical Report | Kirkland Lake Gold |
| December 2016 | Stawell Gold Mines |
TABLE 9-1 SUMMARY OF PAST EXPLORATION ON REGIONAL PROSPECTS WITHIN SGM HELD TENEMENTS
| Prospect | Status | Mineralization Model | Size | Cover Depth |
Geophysics | Geochemistry | Drilling | |
| Wildwood | Confirmed Cambrian basalt | Magdala type Basalt | 1,300m x | 10-20m | CSAMT/AMT | 35 BLEG Soil Samples | AC | 212 holes(11,271m) |
| and mineralization | contact hosted | 400m | Murray Basin | TEM | 1,331 Ionic Leach soil samples | RC | 269 holes (20,002m) | |
| seds | IP | DD | 99 holes (23,412m) | |||||
| Detailed Gravity | ||||||||
| MIMDAS IP & MT | ||||||||
| Stawell Fault | Confirmed structure and | Shear hosted quartz | 7,500m x | 2-15m | AC | 9 holes(550m) | ||
| North | mineralization | vein | 750m | Murray Basin | RC | 14 holes(1,145m) | ||
| seds | DD | 5 holes(1,051.5m) | ||||||
| Glenorchy | Confirmed sheared | Shear hosted quartz | 9,000m x | 35-70m | AMT (single line) | AC | 270 holes(19,276m) | |
| interbedded schist/basalt and | vein | 2,000m | Murray Basin | Detailed Gravity | RC | 25 holes(2,728m) | ||
| mineralization | seds | DD | 4 holes(1,088m) | |||||
| Browns | Confirmed interbedded | Shear hosted quartz | 7,000m x | Nil | Detailed Gravity | 16 Auger samples | AC | 365 holes(26,675m) |
| schist/basalt and | vein | 700m | 963 Ionic Leach soil samples | RC | 13 holes(889m) | |||
| mineralization | DD | 16 holes(5,794m) | ||||||
| Germania | Old workings (quartz vein), | Magdala type Basalt | 1,400m x | 0-7m Murray | Detailed Gravity | 1,007 Ionic Leach Soil samples | AC | 25 holes(1,252m) |
| coincident magnetic and gravy | contact hosted, quartz | 900m | Basin seds | Passive MT | DD | 5 holes(555.4m) | ||
| anomaly | shear hosted | |||||||
| Commercial | Confirmed Cambrian basalt, | Not determined at | 2,000m x | Nil | Detailed Gravity | DD | 4 holes(851m) | |
| Road | no mineralization as yet | present | 400m | Passive MT | ||||
| Ashens | Confirmed sheared | Shear hosted quartz | 10,000m | 60m Murray | TEM | 266 BLEG soil samples | AC | 185 holes (17,991m) |
| interbedded schist/basalt and | vein, Wonga type | x 3,000m | Basin seds | Detailed Gravity | DD | 2 holes (894m) | ||
| mineralization | ||||||||
| Lubeck | Confirmed interbedded | Shear hosted quartz | 3,000m x | 50m Murray | Detailed Gravity | AC | 41 holes (3,643m) | |
| schist/basalt, no mineralization | vein | 600m | Basin seds | MIMDAS MT | ||||
| as yet | ||||||||
| Wal Wal | Confirmed Cambrian basalt | Magdala type Basalt | 4,000m x | 35m-45m | Detailed Gravity | 493 Ionic Leach soil samples | AC | 289 holes (17,477.5m) |
| and mineralization | contact hosted, quartz | 1,000m | Murray Basin | MIMDAS MT | DD | 3 holes (970.8m) | ||
| shear hosted | seds | |||||||
| Holts & Bismark | Confirmed Cambrian basalt, | Magdala type Basalt | 2,000m x | 50m Murray | 27 BLEG soil samples | AC | 21 holes (1,537m) | |
| no mineralization as yet | contact hosted, quartz | 700m | Basin seds | |||||
63
| Technical Report | Kirkland Lake Gold |
| December 2016 | Stawell Gold Mines |
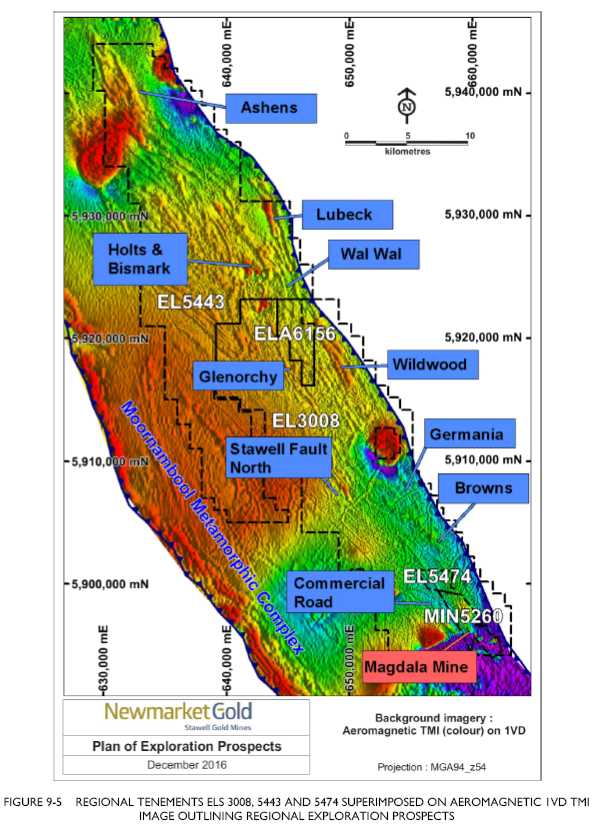
64
| Technical Report | Kirkland Lake Gold |
| December 2016 | Stawell Gold Mines |
| 9.5 | ONGOING EXPLORATION PROGRAMS |
Ongoing exploration for 2017 on the East Flank will continue to investigate underground extensions that can be added to Aurora B Mineral Resources. More regional surface exploration will continue to be conducted based on results from the Ionic Leach soil sampling program conducted in 2012-2013, drill targeting the highest prioritized gold anomalies.
Regional surface diamond drilling will focus on Germania (EL5003) testing a ‘Magdala’ style basalt target below 400m depth and follow-up exploration work of soil defined Ionic Leach and gold anomalies at Wal Wal (EL5443).
These targets and proposed exploration expenditure are summarized in Figure 9-4, Figure 9-6 and Table 9-2; all areas have had various levels of exploration over recent years.
TABLE 9-2 FORECAST EXPLORATION DRILLING BUDGET ($A) FOR 2017
| Prospect | Diamond Drilling ($) |
| Aurora B | $700,000 |
| Germania Prospect | $400,000 |
| Wal Wal Prospect | $327,000 |
| Totals | $1,427,000 |
65
| Technical Report | Kirkland Lake Gold |
| December 2016 | Stawell Gold Mines |
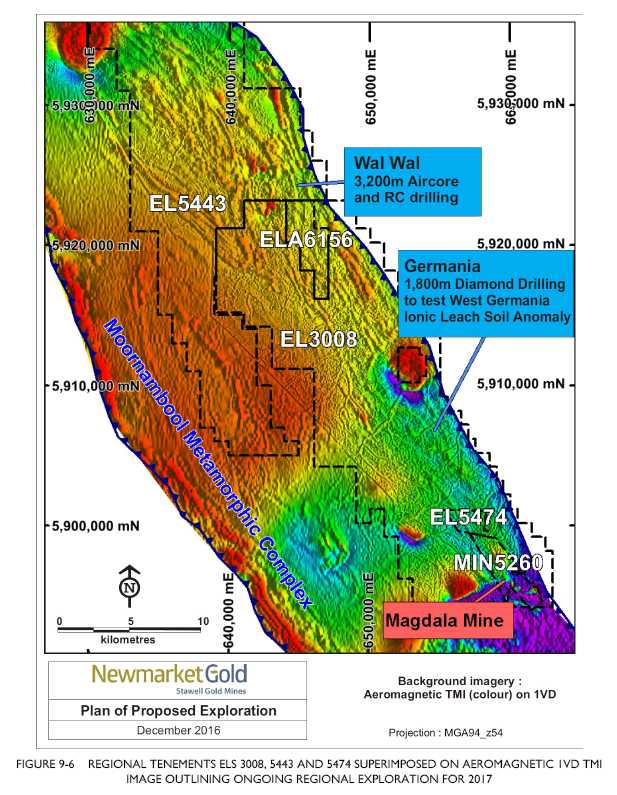
66
| Technical Report | Kirkland Lake Gold |
| December 2016 | Stawell Gold Mines |
Beyond 2017, exploration will continue to concentrate on near mine prospects with the objective of increasing Mineral Resource definition, dependent upon successful results returned in 2017. Regional exploration will continue to investigate potential mineralization below the Murray Basin sediments to the north of Stawell, expanding the Ionic Leach soil sampling area and drill testing gold soil anomalies identified in the 2012-2013 Ionic Leach soil programs.
Preliminary proposed exploration expenditure is summarized in Table 9-3.
TABLE 9-3 PROPOSED EXPLORATION EXPENDITURE (A$) FOR THE PERIOD 2018-2019

| 9.5.1 | AURORA B |
The sub-vertical lodes and ‘waterloo’ structures within the Aurora B area remain open along strike to both the south and the north and at depth. Exploration in 2017 will concentrate on these extensions with a total of 18,000m of drilling planned. A program of 37 diamond holes will target a 1,200m strike length x 500m equivalent dip extent to the north and south of the 343 Level development drive. This will include seven holes for 3,400m from surface targeting a further 350m northerly strike extension to the current Aurora B Inferred Mineral Resource. Successful results could allow for continued conversion to Mineral Resources.
| 9.5.2 | BRUMMIGAN’S STRUCTURE |
The Brummigans structure was modelled in the 2008 Wonga Pit Mineral Resource Model as a repeat of the Wonga Main Hangingwall Lode to the immediate east of the Wonga open pit. The modelling was conceptual in nature and no resource estimation was complete. During a structural review of the Wonga Mine and surrounds in the first quarter of 2014, the Brummigans structure was highlighted as a potential target. Diamond drill data from the 2012 on the southeastern area program was re-evaluated and found to support the presence of a continual mineralized structure in the approximate Brummigan’s
67
| Technical Report | Kirkland Lake Gold |
| December 2016 | Stawell Gold Mines |
| 9.5.3 | GERMANIA |
Proposed exploration will build on work completed in 2013, targeting the West Germania Ionic Leach gold in soil anomalies, which appear to be associated with the old West Germania Mine. A surface drill program of 1,800 diamond drill meters is proposed to test for the presence of basalt and associated basalt contact lodes to a vertical depth of at least 300m. There is also the potential for mineralized quartz shear lodes, which was the source of ore from the West Germania Mine. Diamond drilling has been chosen as the proposed drilling method due to the vital structural information it returns.
| 9.5.4 | WAL WAL |
Proposed exploration will build on work completed in 2012, drill testing the Ionic Leach soil anomalies to the west of the Wal Wal basalt. Soil anomalies are interpreted to be sourced by either Magdala-type basalt contact mineralization or Stawell Fault type quartz shear mineralization, which is supported by the existing geophysical data. A surface program of 3,200 Air Core and Reverse Circulation drill meters has been designed to test three of the five soil anomalies.
68
| Technical Report | Kirkland Lake Gold |
| December 2016 | Stawell Gold Mines |
10 DRILLING
| 10.1 | STAWELL GOLD MINES MINERAL RESOURCE DRILL DEFINITION PROCESS |
The Mineral Resource definition process at Stawell Gold Mines is an ongoing activity. Current Mineral Resources extend from surface to -1025mRL (effectively 1025m below surface). Geological information is collected by a variety of methods with the objective of improving the confidence of the Mineral Resource estimates prior to and during the mining process, including grade control drilling for development and stope definition.
Given the continuous and ongoing nature of the Mineral Resource process, the data utilized varies as the mining operations develop towards the Mineral Resource area. A summary of the main drilling methodologies employed and data types utilized is as follows with specific details on the sampling and assaying methodologies given below:
| • | Surface RC Drilling; |
| - |
Used for definition of near surface resources where diamond drilling is not required for detailed structural definition, | |
| - |
Used as a method for pre collaring deeper diamond drillholes, | |
| - |
Drilling completed using 5¼” Face Sampling Hammers, | |
| - |
Samples collected from cyclone discharge, | |
| - |
Hole depths vary but are generally less than 200m, | |
| - |
Drilling is conducted dry or with sufficient air to ensure collected samples are dry, | |
| - |
Sample tipped into three tier splitter from crate to ensure equal quantities available to all vanes, | |
| - |
Splitter cleaned by shaking/banging/brush/air compressor as necessary between samples, | |
| - |
Cyclone cleaned at regular intervals by banging/checked by hand/arm, | |
| - |
Around 99.5% of drilling was conducted dry. Big Hill surface Mineral Resource has been very effectively de-watered by the underground mining operation. In a handful of holes, samples were damp after a rod change. Where a sample could not be effectively riffle split it was spear sampled using a PVC spear, | |
| - |
Sample volumes were not routinely recorded pre-1999. An initial program in which samples were weighed showed little variation in recovered volume by depth or geology and it was decided that routine weighing was unnecessary, | |
| - |
In some project areas casing advancing technologies have been utilized to ensure drilling through fill produces reliable samples, and | |
| - |
Undertaken by contract drilling personnel under the supervision of Stawell Gold Mines’ Geology Team. |
69
| Technical Report | Kirkland Lake Gold |
| December 2016 | Stawell Gold Mines |
| • | Surface Diamond Drilling; |
| - |
Primarily used in initial exploration programs, near surface resource definition and to provide structural and geological information in near surface RC drilling programs, | |
| - |
Drilling by wireline methods, | |
| - |
Hole sizes PQ3, HQ3, NQ3, HQ2, NQ2, BQ2, | |
| - |
Hole depths vary from <100m to >2,000m, | |
| - |
Directional drilling utilized for specific tasks, | |
| - |
Core orientation devices often utilized to aid in structural interpretation, and | |
| - |
Undertaken by contract drilling personnel under the supervision of Stawell Gold Mines’ Geology Team. |
| • | Underground Diamond drilling; |
| - |
Used at all stages of the geological process, exploration, resource definition and grade control, | |
| - |
Drilling by conventional and wireline methods, | |
| - |
Hole sizes HQ3, HQ2, NQ2, BQ2, LTK60, LTK48 (not used post 1997), | |
| - |
Hole depths vary from <50m to 1200m, | |
| - |
Directional drilling utilized for specific tasks, and | |
| - |
Undertaken by contract drilling personnel under the supervision of Stawell Gold Mines’ Geology Team. |
| • | Open hole percussion sampling “sludge sampling”; |
| - |
Used after development of ore drives for final stope definition, | |
| - |
Hole sizes 89mm open hole, | |
| - |
Hole depths vary from 5m to 25m, | |
| - |
Samples of cutting of variable length are collected primarily for geological logging of the chips to identify major faults and geological contacts, and | |
| - |
Undertaken by Stawell Gold Mines production blasthole rigs. |
70
| Technical Report | Kirkland Lake Gold |
| December 2016 | Stawell Gold Mines |
TABLE 10-1 STAWELL GOLD MINES GEOLOGICAL PROCESSES AND APPROXIMATE DRILL SPACINGS
| Activity Area |
Target Type |
Criteria |
Resource
Classification |
Geological Data available |
Exploration |
Conceptual Targets |
• Conceptual geological model | • Geophysics | |
| • Geophysical anomaly | • Mapping | |||
| • Geochemical anomaly | • Wide spaced Exploration Drilling | |||
| • Conceptual geological models | ||||
Confirmed Targets |
• Geological model confirmed by drilling | • Wide Spaced Exploration drilling | ||
| • Mineralization confirmed by drilling | • Assay information | |||
| • Drill logs | ||||
Scoped targets |
• Geological continuity established | Pre resource, | • Broad spaced Grid Drilling | |
| • Ore grade intersections established | Resource | • Detailed cross sectional interpretations | ||
| • Preliminary geological model | • Assay information | |||
| • Drill spacing 160 m X 120 m | • Drill logs | |||
| • Geological models | ||||
Resource Definition |
• Geological continuity confirmed | Inferred Resource |
• Regular Grid Drilling | |
| • Ore grade intersections continuous | • Detailed cross sectional and 3D interpretations | |||
| • Geological interpretation modeled | • Assay information | |||
| • Geostatistical model established | • Drill logs | |||
| • Drill spacing 80m X 60m | • Geological models | |||
| • Geostatistical model | ||||
| • QA/QC analysis | ||||
| • Geological continuity confirmed | Indicated Resource |
• Regular Grid Drilling | ||
| • Ore grade intersections confirmed | • Detailed 3D modeling and interpretations | |||
| • Geological interpretation modeled | • Assay information | |||
| • Geostatistical model | • Drill logs | |||
| • Economic analysis | • Geological models | |||
| • Drill spacing 40m X 40m to 30m X 30m | • Geostatistical model | |||
| • QA/QC analysis |
71
| Technical Report | Kirkland Lake Gold |
| December 2016 | Stawell Gold Mines |
| Activity Area |
Target Type |
Criteria |
Resource Classification |
Geological Data available |
Grade Control |
• Confident Geological continuity | Indicated Resource |
• Close Grid Drilling | |
| • Ore grade intersections confirmed | • Detailed 3D modeling and interpretations | |||
| • Geological interpretation modeled | • Assay information | |||
| • Geostatistical model | • Drill logs | |||
| • Economic analysis | • Geological models | |||
| • Drill spacing 20m X 20m | • Geostatistical model | |||
| • QA/QC analysis | ||||
| • Confident Geological continuity | Measured Resource |
• Close Grid Drilling | ||
| • Ore grade intersections confirmed | • Detailed 3D modeling and interpretations | |||
| • Geological interpretation modeled | • Assay information | |||
| • Geostatistical model | • Drill logs | |||
| • Economic analysis | • Geological models | |||
| • Level Development above and below | • Geostatistical model | |||
| • Drill spacing 20m X 20m to 15m X 15m | • QA/QC analysis | |||
| • Open-hole sludge drilling | • Development face mapping sheets and ore runs | |||
| • Open-hole sludge drill geological data where required |
72
| Technical Report | Kirkland Lake Gold |
| December 2016 | Stawell Gold Mines |
| 10.2 | DRILLING PROCESS |
A flow sheet of the diamond drill process from design to implementation is shown in Figure 10-1.
The diamond drill contract personnel provide a daily record of drilling activities for all drill rigs. Data from the daily record sheet is entered daily to a site database for tracking of drilling production and to enable tracking of drilling progress interrogation at a later date.
Geological personnel track the drillhole path and maintain in control of the daily activities of all drill rigs including which drillers were responsible for various sections of the hole should there be issues with core presentation or down-hole depths that require clarification. A regime of regular rig audits and inspections are also used to assist with maintaining the high level of core presentation and sample quality. These drill records are kept indefinitely, enabling a review of drillhole information many years after completion of drilling.
73
| Technical Report | Kirkland Lake Gold |
| December 2016 | Stawell Gold Mines |
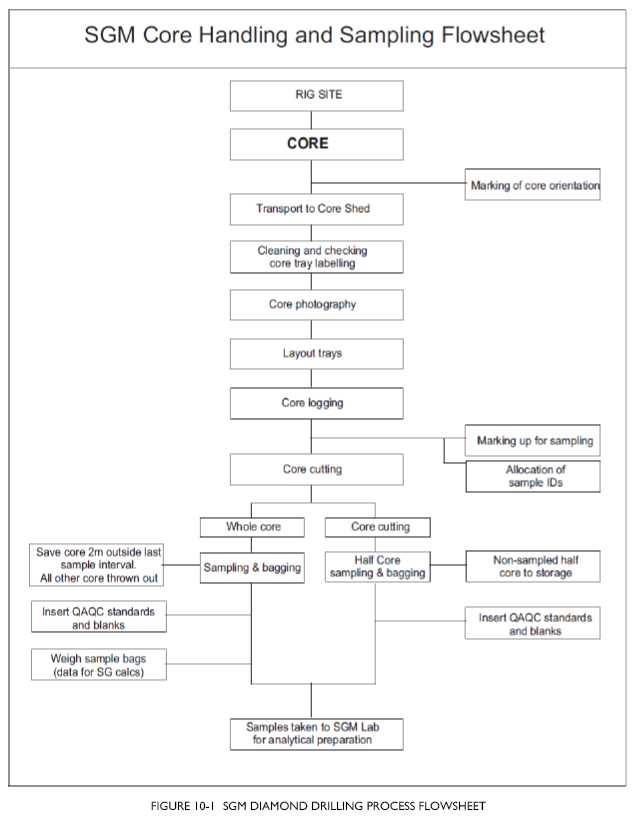
74
| Technical Report | Kirkland Lake Gold |
| December 2016 | Stawell Gold Mines |
| 10.3 | DRILL SPACING |
Drill spacing varies for exploration, resource definition and grade control programs within the ranges as indicated below. The appropriate Mineral Resource classifications indicated in this Table are a guide only and each Mineral Resource area is classified based on a number of criteria as discussed in Section 14 of this report. Each of the Mineral Resource areas will have drilling at various hole spacing depending upon the stage of resource development and mining activities.
Initially the exploration drilling is carried out on broad spaced targets, and if the continuity of the structure is apparent, as in the case of known basalt bodies, the targets will generally be tested on centers 160m along strike and 120m down-dip (160m x 120m).
When exploration is successful in locating appropriately mineralized environments this spacing is reduced to approximately 80m along strike x 60m up and down-dip. If updated geological interpretations completed at this drill spacing are able to demonstrate geological continuity and define sufficient gold grades to complete and define a Mineral Resource, it is possible to classify the defined Mineral Resources as Inferred Mineral Resources.
Ongoing drilling will be completed once appropriate drill platforms can be established to enable the drill spacing to be reduced to 30m x 40m centers. At this spacing, if the geological and grade continuity is well constrained, a Mineral Resource could be classified as Indicated Mineral Resource. Generally, at this stage final mine design and scheduling is possible and capital development infrastructure can be designed and commenced to access the area for mining including the design of appropriate platforms to complete ongoing resource definition and grade control diamond drilling.
Grade control diamond drilling targets a drill spacing of at least 15m to 20m, along strike, by 15m to 20m, up and down-dip, on the mineralized structures. This drilling is a component of the mine production process and is required to identify any small scale changes in geometry which will affect mining shapes. Where the geometries are complicated by faulting or other geological features then the spacing can locally be closed to 10m x 10m. Following this work, detailed stope and development design is completed and ore development is designed and implemented under survey control. As a general rule, only after completion of development or sufficiently close-spaced diamond drilling will a Mineral Resource be classified as a Measured Mineral Resource.
As development is implemented every face or development round (3.8m to 4.0m spacing) is visited by Stawell Gold Mines geological personnel to map the location of the major contacts and structures exposed by the development, and where practical and channel sample obtained. This information is critical in ensuring development is in the correct location and also to provide the detailed geological information required for final stope extraction and stope tonnes and grade determination. Sludge sampling programs are completed only where there is a requirement to gain additional geological information beyond that already available. Drilling is completed in fans of holes drilled up from the development locations (a typical fan is shown in Figure 10-2). These fans are only completed as required but may be as close as 10m along strike and on rare occasions 5m along strike when structural complexity is high or ore geometries vary.
75
| Technical Report | Kirkland Lake Gold |
| December 2016 | Stawell Gold Mines |

The drive outline is shown as well as the geological mapping collected from each face location. The up-hole drill fans are colored by logged geology: green = potentially mineralized Volcanogenics, yellow = Basalt.
| 10.4 | DRILLHOLE ORIENTATION |
| 10.4.1 | UNDERGROUND |
Where possible, drilling is oriented perpendicular to the structures being tested. The nature of the mineralization at Stawell and the availability of suitable drilling platforms in the underground environment will always result in compromises in the ability to obtain near perpendicular tests of the mineralization. An example of the orientations of the drillholes through the FAS and USF2 Mineral Resource area is shown in Figure 10-3 and Figure 10-4. Similar drillhole orientations relative to the strike and dip of the structure exist in many of the Mineral Resource areas.
76
| Technical Report | Kirkland Lake Gold |
| December 2016 | Stawell Gold Mines |
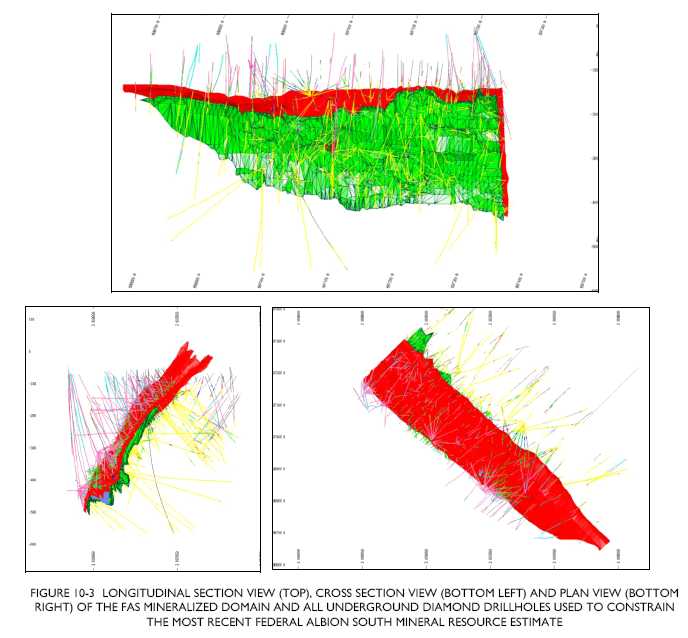
(Note: extended Basalt Lode = green; Central Lode = Red; Stockworks = purple).
77
| Technical Report | Kirkland Lake Gold |
| December 2016 | Stawell Gold Mines |

(Note: DUKES Basalt Lode = green; Central Lode = Red; Stockworks = light green).
| 10.4.2 | SURFACE |
The nature of the mineralization around Big Hill, near surface and the availability of suitable surface drilling platforms due to community constraints will always result in compromises in the ability to obtain near perpendicular tests of the mineralization. Overall the Big Hill Mineral Resource area has been drilled at regular 20m along strike intervals with the drill holes oriented perpendicular to the strike and dip of the main mineralization system with an up and down-dip spacing of 25m, see Figure 10-5 and Figure 10-6.
78
| Technical Report | Kirkland Lake Gold |
| December 2016 | Stawell Gold Mines |

(Note: Potential Pit = grey, Surface topography including previously mined Davis Pit = red, Davis lode = light green, Iron Duke lode = dark green, Allens lode = light blue and Mariners lode = dark blue
79
| Technical Report | Kirkland Lake Gold |
| December 2016 | Stawell Gold Mines |

Noting the most recent RC infill drilling in red (2012) and 2013 in blue. Used in both the Mineral Resource estimate and void modelling.
| 10.5 | COLLAR SURVEY CONTROL |
All survey control for the underground drilling programs was established by Stawell Gold Mines survey personnel. Survey control points are maintained in the underground decline by Stawell Gold Mines survey personnel and these locations provide the control for all mark out and pick-up surveying that is conducted in the underground environment. On conclusion of drilling and drillhole grouting, diamond drilling personnel inserted a wooden wedge labeled with the drillhole ID into the collar of the hole. This provides a permanent identification of the drillhole collar to ensure matching of surveying information to the correct drillhole collars.
80
| Technical Report | Kirkland Lake Gold |
| December 2016 | Stawell Gold Mines |
The collar survey information was entered in the Stawell Gold Mines database by data managers. An example of the information supplied by Stawell Gold Mines surveyors and the checklist utilized to ensure appropriate information was collated.
The coordinate system in use at Stawell is a modified version of AMG which is discussed in Section 4.5. All survey data pertaining to the mining operation is stored in this coordinate system.
| 10.6 | DOWN - HOLE SURVEY CONTROL |
Down-hole survey control was managed by utilizing down-hole cameras to survey the drillhole path. Electronic single shot instruments (REFLEX® and RANGER® tools) have progressively been used in preference to the Eastman® mechanical cameras since 2002 at Stawell Gold Mines as shown in Figure 10-7, and the vast majority of the down-hole surveys of diamond drillholes that are used in the estimation of the Mineral Resource estimate detailed in this technical report have been made with electronic single shot cameras. Magnetic intensity is recorded and used to assess validity of record. Dip +/- 1.5° and azimuth +/- 3° is highlighted and assessed.
Since mid-2014 multishot surveys have been taken at the end of the drill hole with the same REFLEX® electronic camera; with a survey interval of 3m, Figure 10-7. Single shot surveys are collected during drilling to manage the holes progress and deviations. The multishot surveys are collected on hole completion, providing survey data at a denser scale for hole orientation interpretation and validation.
Some of the deeper surface diamond drillholes have been surveyed using a North Seeking Gyro instrument.
Down-hole survey instruments routinely measure azimuth relative to magnetic north and declination (dip) relative to the horizontal. A correction is applied to convert Magnetic North to Grid North. The detail of how this correction is currently applied is shown in Figure 10-8.
Contract drilling personnel are responsible for providing survey information at pre-determined spacing’s down the drillhole. The first survey is taken at 15m down-hole and is effectively used as the collar survey. This depth is used as it reduces the influence of magnetics effects associated with the drill rig and support equipment. Subsequent surveys are taken at 30m spacing or at closer intervals where deemed necessary by the supervising geologist. The contract personnel records survey details on the daily drilling record sheet and also on a separate survey record sheet) from which the information is entered to the acQuire database system. The electronic instruments provide a direct reading of the magnetic field intensity at the survey locations. This reading can be used to determine if survey readings have been influenced by magnetic material down-hole. The single shot survey data is critical to understand the hole progress during drilling and to manage hole deviations.
81
| Technical Report | Kirkland Lake Gold |
| December 2016 | Stawell Gold Mines |

(SE = Eastman Single Shot in purple, SD = Electronic survey instrument in blue, sm = multishot survey in orange) by time. Post 2001, the standard survey instrument used has been an electronic single shot down-hole survey tool.

82
| Technical Report | Kirkland Lake Gold |
| December 2016 | Stawell Gold Mines |
| 10.7 | DOWN - HOLE SURVEY QUALITY CONTROL |
Several quality control and quality assurance processes are in place to ensure that appropriate survey (down-hole and collar) information is stored to the database. Along with the database manager’s checklist, the project geologist reviews the single shot and multishot data and makes a final decision on the expected trajectory of the hole azimuth. This is illustrated in Figure 10-9.
For longer drillhole traces, the survey information is plotted to provide a graphical review of the information method utilized where adjustments to the survey information can be made using the overall trend of the drillhole trace. (see Figure 10-9).
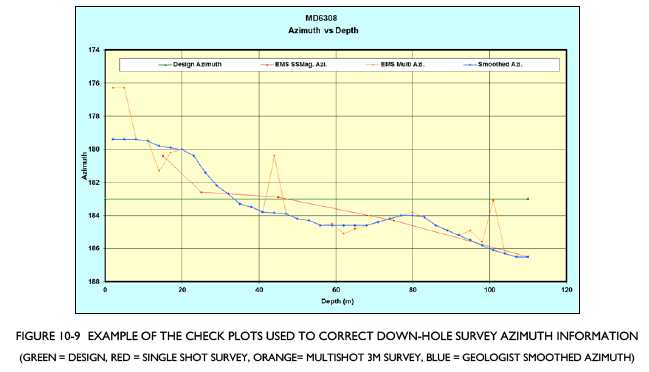
Where clear discrepancies have been identified with the validity of the survey information and adjusted surveys entered, the original surveys are given a lower priority in the database system. A record of survey methods and or adjustments are maintained in the main acQuire database as part of the audit trail.
Stawell Gold Mines personnel utilize a survey camera test bed with known azimuth and dip to routinely check the accuracy of the down-hole survey cameras. This test bed is located on the surface, well away from any potential magnetic sources and is utilized by contract drilling personnel to routinely check camera performance and determine if equipment requires servicing or re-calibration.
83
| Technical Report | Kirkland Lake Gold |
| December 2016 | Stawell Gold Mines |
| 10.8 | DIAMOND DRILL CORE PROCESSING |
A detailed flow sheet of core processing activities is shown in Figure 10-1. Prior to drillhole number MD2678 and SD607, the core photography was taken on film and stored as prints. Figure 10-10 is an example of the diamond core photography used for all diamond drill core.

| 10.9 | LOGGING |
All diamond drill core is logged by the site geological teams using a standardized logging methodology. The data is captured electronically at the point of collection using either a barcode logging “Datcol” software system or acQuire logging system. The “Datcol” system was developed on site in the mid 1990’s and has remained the standard process since that time where the key tables for lithology, alteration, structure, and geotechnical information are populated during the logging process. During 2009, the acQuire logging system was developed to replace the “Datcol” system. The acQuire logging system utilizes the same standard key tables for the lithology, alteration, structure, and geotechnical information, which are populated during the logging process.
| 10.10 | CORE RECOVERY |
During the logging process, any lost core is estimated and logged as lost core with a specific start and end interval.
A review of database for recently drilled holes indicates exceptionally good core recovery throughout the deposit, particularly adjacent to the major mineralized zones. Where core is lost, it is usually associated with significant faulting. Lost core is identified in the logging as “LOST” and as such there are very few if any assay intervals utilized in the Mineral Resource estimate where core recovery is less than 100%.
84
| Technical Report | Kirkland Lake Gold |
| December 2016 | Stawell Gold Mines |
11 SAMPLE PREPARATION, ANALYSIS AND SECURITY
| 11.1 | REVERSE CIRCULATION DRILLING SAMPLING |
All Stawell Gold Mines reverse circulation (RC) sampling was carried out using the following protocol:
| • |
Generally, the entire hole was sampled from the collar unless it was recognized as recent fill or material associated with the construction of the drill pads; |
| • |
Samples were collected at 1.0m sampling interval, bit pulled back and flushed between intervals; |
| • |
Samples discharged into tightly fitting plastic sample bag from cyclone; |
| • |
Sample transferred to a rectangular plastic tub, the same size as the splitter; |
| • |
Sample tipped into three tier splitter from plastic tub to ensure equal quantities available to all vanes; |
| • |
1/12 sub split (nominally 3kg) collected in calico sample bag, tied and placed in lots of five into plastic bags; |
| • |
Residue sample collected in original sample bag and transported to bag farm for storage; |
| • |
Splitter cleaned by shaking/banging/brush/air compressor as necessary between samples; |
| • |
Cyclone cleaned at regular intervals (completion of each hole minimum) by banging/checked by hand/arm; |
|
| |
| • |
Every 20th sample re-split to give a second 3kg sample, field splits dispatched along with first splits; and |
|
| |
| • |
Samples dispatched to laboratory for analysis by fire assay. |
| 11.2 | DIAMOND DRILLING SAMPLING |
During the logging process, the geologist will mark up the intervals of core required for sampling. Not all diamond core is sampled. Thorough sampling process has identified the key lithological and structural units that will host mineralization and the selection of units for sampling follows the protocols shown below:
| • | All Magdala Facies, also known as ‘Magdala Volcanogenics’, are sampled for assay; |
| • | A minimum of 2.0m into the hangingwall and/or footwall is sampled; |
| • | Fault zones and zones of sulphide are sampled at the geologist’s discretion; and |
| • | Magdala Basalt and Albion Formation units are sampled at the discretion of the logging geologist. |
Not all diamond core is cut in half prior to sampling. Sampling of diamond drill core follows one of two methods as detailed below:
| 1. |
Exploration and Resource Definition – HQ or NQ drill programs; |
| • |
Core is logged and geological derived intervals are marked up for sampling, | |
| • |
Sample intervals are matched to geological boundaries (structural or lithological) and fall within the range of 0.10m to 2.0m. The average sample interval is approximately 1.0m, and |
85
| Technical Report | Kirkland Lake Gold |
| December 2016 | Stawell Gold Mines |
|
• |
For Resource definition drilling programs, 1 in 5 holes is cut with a diamond saw prior to sampling and one half of the core is sent for assay. The remaining half core is retained as a record within the core library. All other drillholes are sampled as whole core, which is sent for sample preparation and assay as per the flow sheet shown in Figure 10-1. All drillholes deemed to be for the purpose of exploration are ½ core sampled and the entire remaining core retained in storage on site at Stawell Gold Mines. |
| 2. |
Grade control diamond drill programs – NQ or LTK60; |
| • |
Core is logged and geological derived intervals are marked up for sampling, | |
| • |
Sample intervals are matched to geological boundaries (structural or lithological) and fall within the range of 0.10m to 2.0m. The average sample interval is approximately 1.0m, and | |
| • |
For grade control drilling programs drillholes are sampled as whole core with the entire sample sent for sample preparation and assay as per the flow sheet shown in Figure 10-1. |
Detailed operating procedures for sampling of diamond drill core are used at Stawell Gold Mines to ensure uniformity of process and prevent errors.
| 11.2.1 | DIAMOND DRILL CORE SAMPLES |
Exploration physicals for January 2016 to December 2016 totaled 13,747m of drilling comprising of drillholes into the Aurora B and Moray 343, Mariners 109 and 468L Mid-North Magdala targets. Details of these exploration programs is covered in Section 9. The 2016 drill statistics is shown in Table 11-1.
Resource definition physicals for January 2016 to December 2016 totaled 2,801 comprising 17 drillholes into the SM250, USF2 and Federal Albion South. Resource definition drilling of all these areas resulted in convertible Mineral Resource.
Grade control physicals for January 2016 to December 2016 totaled 2,824.8m comprising 13 drillholes into the SM250, USF2, Moray N and FAS. This drilling resulted in convertible Mineral Resource for all areas and presentation of material directly into the 2016 mining plan for the USF2 and FAS.
TABLE 11-1 DRILL STATISTICS FOR STAWELL GOLD MINES UNDERGROUND DURING JANUARY 2016-DECEMBER 2016
| 2016 | ||
| Exploration Drilling | HOLES | 48 |
| Meters | 13,747 | |
| Targets | AURORA B, MORAY, MARINERS 109, R1 | |
| Resource
Definition Drilling |
HOLES | 17 |
| Meters | 2,801 | |
| Targets | SM250 ,USF2, FAS | |
| Grade Control Drilling | HOLES | 19 |
| Meters | 2,824.8 | |
| Targets | SM250, USF2, FAS, MORAY N |
86
| Technical Report | Kirkland Lake Gold |
| December 2016 | Stawell Gold Mines |
The sample interval statistics from January 2016 to December 2016 are shown in Table 11-2. The same sample methodologies are utilized for 2017 and it is anticipated similar sample lengths will be achieved. The average sample intervals demonstrated by the 2016 data are consistent, and are indicative of the complete data set utilized to estimate Mineral Resources at Stawell.
TABLE 11-2 DIAMOND DRILL CORE SAMPLE INTERVAL STATISTICS FOR SAMPLES TAKEN DURING 2016
| 2016 | |
| Total Samples (m) | 7,061.57 |
| Minimum Sample Length (m) | 0.20 |
| Maximum Sample Length (m) | 1.50 |
| Average Sample Length (m) | 0.93 |
| 11.2.2 | RELIABILITY OF SAMPLES |
It is the opinion of the Authors that the drilling and sampling methods employed by Stawell Gold Mines are of a high standard and provide representative tests of the mineralization suitable for the estimation of Mineral Resources. Standard drill spacings adopted by Stawell Gold Mines are appropriate for the various stages of Mineral Resource classification and whilst other factors also contribute to decisions regarding classification of the Mineral Resources, the drill spacings discussed in this section enable appropriate geological interpretation and Mineral Resource classification decisions to be made.
| 11.3 | ASSAY LABORATORIES |
During the life of the Stawell Gold Mines, a number of laboratories have been utilized for routine assaying of diamond drill core and RC samples. The details of the laboratories and the periods for which assaying has been conducted are as follows:
| 11.3.1 | STAWELL GOLD MINE LABORATORY |
The Stawell Gold Mine Laboratory is an onsite laboratory which is operated by the mine staff and is not classified as an independent laboratory. It was used intermittently prior to 1995 for assaying of diamond drill core and RC samples.
Some aspects of the facility include:
| • |
Non accredited company assay laboratory; |
|
| |
| • |
Assay method was 10g Aqua Regia with pre-digest roasting and AAS finish. Samples are roasted before digest to burn off the sulphides, to ensure all gold is released; |
| • |
Assaying of diamond drill core and RC samples was discontinued in 1995 and the laboratory sample preparation and assay methods updated to industry standard practice; |
|
| |
| • |
Now utilize a 25g Aqua Regia method with pre-digest roasting and AAS finish; |
87
| Technical Report | Kirkland Lake Gold |
| December 2016 | Stawell Gold Mines |
|
• |
Utilized for metallurgical assaying, underground face sample and other geological grade control sampling and |
| • | Undertake routine sample preparation of diamond drill core samples post 2004. |
| 11.3.2 | WMC BALLARAT ASSAY LABORATORY |
WMC Ballarat Assay Laboratory utilised prior to 1995 for assaying of diamond drill core and RC samples and was not an independent laboratory at the time of being used:
| • | Non accredited company assay laboratory; |
| • | Assay method was 10g Aqua Regia with pre-digest roasting and AAS finish; and |
| • | Assaying of diamond drill core and RC samples was discontinued in 1995 and the laboratory sample preparation and assay methods updated to industry standard practice. |
| 11.3.3 | AMDEL LABORATORY |
AMDEL Laboratories is an independent laboratory based in Adelaide, South Australia. The relationship between AMDEL and the Stawell Gold Mines was on a client/supplier arrangement with a contract in place:
| • | ISO 9001 accredited; |
| • | Utilized intermittently from 1995 through to present day; |
| • | Primary supplier of assay services from 2004 to mid-2007; |
| • | Ongoing utilization for check assays; and |
| • | Stawell Gold Mines reduced reliance on AMDEL Laboratories in mid-2007 as a result of very slow turnaround of assays results. |
| 11.3.4 | AMINYA LABORATORY |
AMINYA Laboratories was an independent laboratory based in Ballarat. The relationship between AMINYA and the Stawell Gold Mines was on a client/supplier arrangement with a contract in place:
| • | Not accredited; |
| • | Primary supplier of assay services for diamond drill core and RC samples period from 1995 to 2004; and |
| • | Discontinued in 2004. |
| 11.3.5 | INTERTEK GENALYSIS |
Intertek Genalysis (formerly Genalysis Laboratory Services) is an independent laboratory based in Perth. The relationship between Intertek and the Stawell Gold Mines was on a client/supplier arrangement with a contract in place:
88
| Technical Report | Kirkland Lake Gold |
| December 2016 | Stawell Gold Mines |
| • | Genalysis is a NATA accredited laboratory to ISO 17025; and |
| • | Provider of assay services during the period from 2004 to 2006. |
| 11.3.6 | ALS LABORATORY GROUP |
ALS Laboratory Group is an independent laboratory based in Orange NSW. The relationship between ALS and the Stawell Gold Mines is on a client/supplier arrangement with a contract in place:
| • | ALS Laboratory Group is accredited to ISO 9001 and ISO 17025; and |
| • | Primary provider of assay services to Stawell Gold Mines from August 2007 to present day. |
| 11.4 | SAMPLE PREPARATION |
The sample preparation protocol for diamond drill core is shown in the flow sheet given in Figure 11-1. This sample preparation flow sheet was developed in 1995 and has been in operation for all Stawell Gold Mines diamond core and RC samples since that time.
During the period from 1995 to 2004, all sample preparation was conducted by the assay laboratory facilities. In 2004, it was decided by site personnel to complete this task on site at the Stawell Gold Mines laboratory facility.
| 11.4.1 | STAWELL GOLD MINE LABORATORY |
The sample preparation at the Stawell Gold Mine laboratory follows the same process utilizing modern sample preparation equipment:
| • |
Daily primary crusher and pulverizer size fraction calibrations are reported in the weekly Stawell Gold Mines site laboratory report to ensure that the size fractions are meeting the set standards. The size fraction calibration for the crusher is that 75% of material must past through a 2mm screen (LABSOP-060 Boyd Crusher Size Fraction Analysis). For the pulverizer, the size fraction calibration is that 90% of material must pass through a 75µm screen (LABSOP-061 LM5 Pulverizer Size Fraction Analysis); |
|
| |
| • |
A quartz flush is inserted, at a 1:5 ratio, at the crushing stage for all diamond drill core and RC chip drill samples. If visible gold is identified at the logging stage, then a quartz flush is inserted after every sample within that mineralized zone; |
|
| |
| • |
Splitting using a vibrating feed cone splitter; |
|
| |
| • |
Pulverizing to 95% passing 75um using Labtechnics LM5 pulverizing mills; and |
|
| |
| • |
A quartz flush is inserted after every sample at the pulverizing stage for all diamond and RC drill core. |
By retaining responsibility for this work through the existing site based facility, Stawell Gold Mines has flexibility in sending the pulps only to a variety of assaying laboratories and also retain the coarse rejects on site for ongoing metallurgical test work programs.
89
| Technical Report | Kirkland Lake Gold |
| December 2016 | Stawell Gold Mines |
Stawell Gold Mines internal laboratory process was independently reviewed by ALS Global Laboratory’s February 2016. No serious concerns compromising the quality of data were identified. Outcomes of the audit will be actioned during 2016 to maintain a high quality of sample preparation.

90
| Technical Report | Kirkland Lake Gold |
| December 2016 | Stawell Gold Mines |
| 11.4.2 | ALS GOLD MINE LABORATORY |
During 2016 the SGM Assay lab was unable to prepare assay samples in a timely manner due to competing priorities (metallurgical testwork, sludge assay samples, etc.) so drill core samples were sent to ALS Orange for compete sample preparation and assay. This process started periodically from May 2016, then with the success of a timely turn around and high quality result the sample preparation was exclusive to ALS from August 2016. The breakdown of samples and holes by laboratory for 2016 is listed in Table 11-3.
TABLE 11-3 DRILL CORE SAMPLE PREPARATION FOR 2016 BY LABORATORY
| Drill Core Sample Prep 2016 | ||
| Laboratory | Holes | Samples |
| Stawell Site | 48 | 3,790 |
| ALS Orange | 41 | 4,792 |
With the Stawell operations being placed on care and maintenance including the SGM Assay Laboratory, in December 2016, all samples will continue to be sent to ALS Orange for sample preparation and assay in 2017.
Sample preparation process at ALS is as follows:
| • |
Sample received at laboratory; |
|
| |
| • |
Samples sorted into numerical order per sample dispatch advice; |
|
| |
| • |
Crushed duplicate sample IDs inserted on every 10th sample and assigned B suffix. NB – where the 10th sample falls on a pulp material, crushed duplicate is moved to the 11th sample; |
|
| |
| • |
Samples dried in oven at <95 degrees Celsius until dry. Samples received as pulp material in foil seal bags does not enter drying oven to prevent potential damage; |
|
| |
| • |
Samples crushed using Boyd crusher (2mm nominal jaw gap) and split 50:50 using RSD splitter. 50% of sample bagged to be returned to Stawell. Crushed duplicate samples generated at this stage. Barren quartz flush material run through crusher after every 5th sample; |
| - |
Samples with a received weight of 1.50kg or less are not be split, as the subsequent split would be too small for the LM5 pulverizer, and | |
|
| ||
| - |
Flush protocol removed at the end of January 2017 and only maintained after the sample where visible gold is indicated. |
|
• |
50% of sample pulverized using LM5 pulverizer to >90% passing 75um. 1:20 samples tested for grind fine- ness. A barren high silica sand flush is run after each sample; |
| - | Flush protocol removed at the end of January 2017. |
| • |
Approximately 300g of material taken from the pulverizer as the working “master” pulp sample. Remaining material bagged into the original calico bag to be returned to Stawell; and |
| • |
“Master” pulp samples boxed into groupings of 12 samples per box and submitted for assay. |
91
| Technical Report | Kirkland Lake Gold |
| December 2016 | Stawell Gold Mines |
| 11.5 | SAMPLE SECURITY |
All drill core and RC samples are delivered directly to the mine site based core farm facility. This is on a shift by shift basis for underground drill core and on a daily basis for all others. Access to the mine site is restricted to authorized personnel only or as a visitor under full supervision by Stawell Gold Mines personnel. During 2016 the site was gated and locked in the evening and manned by security personnel at all other times.
Security of drill core and samples is managed by maintaining records throughout the complete process from drilling, core processing, logging, sampling, sample preparation and assaying through to return of results.
Key record keeping procedures utilized in managing sample and data security are described below:
| • |
Daily drilling records are entered into the database which provides records of drill core produced; |
|
| |
| • |
Core is photographed within 24 hours of being delivered to the core processing facility; |
|
| |
| • |
The Stawell Gold Mines sample processing facility is located on the mine lease within a security fenced area. All core stored here is only able to be accessed by Stawell Gold Mines personnel; |
|
| |
| • |
At the conclusion of logging, a sample requisition sheet generates listing sample numbers, assay standard insertion and assay requirements. This is loaded directly to the acQuire database, enabling tracking of samples after this process; |
|
| |
| • |
Stawell Gold Mines personnel are trained in appropriate procedures for logging and sampling of the diamond drill core and generating an analytical request sheet outlining sample identification and assay requirements; and |
|
| |
| • |
The production of carefully labeled sample pulps for dispatch by registered posts. |
The pulps are dispatched from the Stawell Gold Mines prep laboratory to the assay laboratories using registered post or courier services. Consignments travelling by registered post or courier services are required to be signed off by each leg of the postage route on arrival and can be tracked online. The assay laboratories are also required to send a statement informing Stawell Gold Mines that the pulps have arrived and that the samples, as detailed on the analytical request sheet, can be accounted for. It is the opinion of the Authors that the sample security is adequate.
| 11.6 | ASSAY METHODS |
A summary of the laboratory methods utilized by the various laboratories is given in Figure 11-1. All assaying for gold that is utilized in the Mineral Resource estimates have been completed by fire assay method (30g – 50g charge weights) with an AAS finish.
For samples reporting below LLD, a value of 0.5 x LLD is utilized as standard in Mineral Resource estimation.
92
| Technical Report | Kirkland Lake Gold |
| December 2016 | Stawell Gold Mines |
| 11.7 | DATABASE STORAGE AND INTEGRITY |
All Stawell Gold Mines drilling data is stored within the “acQuire” Database Management System (the acQuire database) which operates in an SQL server framework, and data security is established by having various levels of user access rights. Stawell Gold Mines maintain a security access system where loading and manipulation of data is only conducted by one of two data managers. All geological personnel have access to the acQuire database for read-only purposes.
Analysis results are received from laboratory in fixed digital format. The load routine imports assay data matching against sample identification created during the logging procedure.
In March 2010, the acQuire database was updated to the CorpAssay ADM (acQuire Data Model) and QA/QC functionality “Assay Pending” has been implemented on analysis results reported since then. Assay results are first loaded to the database with an initial priority indicating that they have not passed through QA/QC. When subsequently reviewed for QA/QC, the priority is changed as the result is accepted or rejected. Only data with a priority of 1 is visible in the MineSight drillhole views ensuring QA/QC of drill data in the model has been approved.
Data validation occurs during upload of data to the acQuire database using the acQuire DBMS. Checks include:
- All alphanumeric codes (e.g. lithology) are valid and not duplicated;
- All numeric fields are within acceptable limits and not duplicated;
- Sample from-to depths cannot be greater than the maximum hole depth;
- Checks are performed for overlapping samples; and
- Analysis results are received from laboratory in fixed digital format. The load routine imports assay data matching against sample identification created during logging procedure.
Alpha analysis codes are stored as logged and/or reported e.g. NS (Not Sampled), IS (Insufficient Sample), <0.01. The database MetaAssayExport table records equivalent values which are substituted by client software (e.g. MineSight). The convention for defined values is a numeric value half detection limit for results at LLD, and for all other codes, -1 is substituted.
After data compilation is complete, it is critically reviewed by geologists with on-going scrutiny using logs, section/plan plotting and 3D modelling.
| 11.8 | QUALITY ASSURANCE/QUALITY CONTROL |
The general flow sheet for the sample preparation and assaying including the QA/QC samples submitted to ensure this compliance is shown in Figure 10-1;
| • | Exploration diamond drill core is routinely half core sampled; |
| • | Mine diamond drill core is mostly full core sampled, with approximately one in every five holes being half core sampled. Samples are crushed and pulverized; |
93
| Technical Report | Kirkland Lake Gold |
| December 2016 | Stawell Gold Mines |
| • |
Routine assaying of diamond drill core samples has been undertaken utilizing fire assay methodologies (30 gram charges) with an AAS finish; |
|
| |
| • |
Screen fire assay is also completed on samples in which visible Au was observed during the logging process; |
|
| |
| • |
Assays are reported to an LLD of 0.01ppm. For sample reporting below LLD, a value of 0.5 x LLD is used in resource estimation; |
|
| |
| • |
Sample QA/QC procedure incorporates routine check assays including repeats (re-assay or repeat assay), duplicate (second sample taken after pulverization), splits (half coarse sample split, at ratio of approximately 1:10 samples), and standards; |
|
| |
| • |
The Stawell Gold Mines QA/QC process was independently reviewed by The Quantitative Group consultants in July 2011 and February 2012. Quantitative Group found the system in place to be a robust and appropriate process for ensuring quality assay returns (Stewart July 2011 and Stewart Feb 2012). The Authors agree with the conclusions reached by Quantitative Group; and |
|
| |
| • |
In 2016 the Stawell Mine internal laboratory participated in the October 2016 Geostats Survey of International Laboratories. Results from the survey showed that the laboratory performed within range of expectation. |
| 11.8.1 | QA/QC CHECKS AND ACTIONS |
A range of checks and resulting actions are in place to monitor the QA/QC of the Stawell Gold Mines data set as set out in the QA/QC flow sheet shown in Figure 11-1. When monitoring these checks, the following guidelines are followed.
11.8.1.1 Standards
A range of standards (Table 11-4) are regularly inserted at the sampling stage (1:20 ratio) to monitor assay analysis accuracy. Figure 11-2 shows the assay standard performance for the all assays in 2016.
94
| Technical Report | Kirkland Lake Gold |
| December 2016 | Stawell Gold Mines |
TABLE 11-4 RANGE OF STANDARDS USED AT STAWELL GOLD MINES (g/t Au)
|
Standard ID |
Start/End Date Used |
Gating Values | Comment | ||
| Lower
Limit 2σ (ppm) |
Recommended Value (ppm) |
Upper
Limit 2σ (ppm) | |||
| SGM LowA | June 2001 - May 2010 | 3.18 | 3.34 | 3.5 | Discontinued |
| SGM LowB | June 2001 - May 2005 | 3.24 | 3.54 | 3.64 | Discontinued - no sample left |
| SGM HighA | June 2001 - Oct 2008 | 3.885 | 4.2 | 4.515 | Discontinued - performance issues |
| SGM HighB | June 2001 - Feb 2009 | 4.18 | 4.54 | 4.9 | Discontinued - no sample left |
| SGM High | Feb 2006 - May 2010 | 8.77 | 9.36 | 9.95 | Discontinued |
| SGM1 | Nov 2008 / current | 3.49 | 3.63 | 3.77 | |
| SGM2 | Nov 2008 / current | 6.77 | 7.15 | 7.53 | |
| SGM3 | Aug 2009 / May 2011 | 2.06 | 2.21 | 2.36 | Discontinued |
| OR2Pd | Apr 2011 / Jan 2012 | 0.058 | 0.89 | 0.943 | Discontinued - no sample left, replaced with matrix matched standards |
| OR54Pa | Apr 2011 / Jan 2012 | 2.68 | 2.9 | 3.12 | Discontinued - no sample left, replaced with matrix matched standards |
| OR15h | Apr 2011 / Mar 2014 | 0.97 | 1.02 | 1.068 | Discontinued - no sample left, replaced with matrix matched standards |
| OR10c | Apr 2011 / current | 6.27 | 6.6 | 6.92 | |
| OR62d | Apr 2011 / current | 9.84 | 10.36 | 11.16 | |
| OR12a | Apr 2011 / current | 11.31 | 11.79 | 12.27 | |
| OR17c | Jan 2012 / Sep 2016 | 2.87 | 3.04 | 3.21 | Discontinued - no sample left |
| OR15g | Jan 2012 / May 2012 | 0.481 | 0.527 | 0.573 | Discontinued - no sample left, replaced with matrix matched standards |
| OR15f | May 2012 / Mar 2014 | 0.301 | 0.334 | 0.366 | Discontinued - no sample left, replaced with matrix matched standards |
| OR200 | Mar 2014 / current | 0.316 | 0.34 | 0.365 | |
| OR204 | Mar 2014 / current | 0.966 | 1.043 | 1.12 | |
| OR904 | Aug 2014/current | 0.0407 | 0.045 | 0.0493 | ppb standard |
| OR214 | Sep 2016/current | 2.866 | 3.03 | 3.194 | |
95
| Technical Report | Kirkland Lake Gold |
| December 2016 | Stawell Gold Mines |

If the standard assay is outside ±3 standard deviations from the known value then ~50% of that batch is automatically repeated, similarly if two standards report outside ±2 standard deviations then ~50% of that batch will be repeated. Entry is made into the onsite QA/QC diary to indicate which sample identifications have been repeated.
In 2016 it was recognized that the re-assay analysis occurring on the ALS lab samples was excessive without any fundamental underlying QA/QC issues occurring. The acceptance tolerance was relaxed, to conform to the ALS instrument precision range of our assays. The instrument precision limit for ALS fire assay is 6% above 50 times the detection limit, so this was set to the maximum acceptance criteria. The population of each standard however is expected to perform to expectation and this is managed through quarterly QA/QC reporting and standard analysis. The performance over time for each standard used is individually graphed and reviewed Figure 11-3. This is to understand if non-compliant standards were well-spread across all standard material in use and if it is likely a result of the tightness of the confidence intervals. The spread of the results for each standard are reviewed to identify any potential respectively.
96
| Technical Report | Kirkland Lake Gold |
| December 2016 | Stawell Gold Mines |

11.8.1.2 Blanks
Regular insertion of basalt blanks are inserted at the sampling
stage (1:20 ratio), to monitor sample contamination or sample
homogeneity. If the blanks are not compliant, checks are
initiated to determine the cause of the
non-compliance and what
remedial action is required.
Until mid-2016 the basalt blank material used is non mineralized basalt
chip material purchased by site for batch plant process, where it was replaced
with non-mineralized garden quartz material. Basalt blank was replaced by quartz
material as the quartz is more abrasive and has greater capacity at cleaning any
potential contamination between sample pulverization of the higher grade
samples.
97
| Technical Report | Kirkland Lake Gold |
| December 2016 | Stawell Gold Mines |

Figure 11-4 shows the analysis of the basalt blank assay results for 2016. This figure shows three elevated blanks, with one reporting 0.34 in an area of low-grade and another reporting 0.22 after a sample of 4.11ppm Au were received for the period. The first elevated blank was re-assayed with the re-assays showing greater variability than the original batch, and, as a result the original results were accepted. The second blank was accepted as the adjacent standards were compliant with a high grade sample sitting prior to the blank and adjacent compliant standards. All blanks except three were compliant for the period January 1, 2016 to December 31, 2016 out of a total of 214 blanks inserted during that period.
11.8.1.3 Laboratory Splits
Laboratory (lab) splits are taken during the sample preparation crush stage to monitor sample preparation and homogeneity. If splits are outside of 10% of the initial assay, investigations into the quality of the sample preparation for the batch are conducted.
Figure 11-5 shows the monitored precision for the sample crush stage within the sample preparation process given for assay preparation of all assays within the January 1, 2016 to the January 31, 2016. The graph presented in Figure 11-5 is a December indication of the homogeneity of the sample after the crush stage and shows whether error is introduced during the splitting of this crushed material prior to pulverization. This analysis shows more than 90% of the sample split assays have an average relative difference of less than 20% to the original assay value indicating an appropriate level of precision through this stage in the sample preparation.
Figure 11-6 is a Log/Log graphical representation of the same data, which is also used to analyze the lab split outliers. This graph indicates that the split variation more frequently occurs in the lower grade range (yellow highlight) which is of lesser interest. The higher grade splits are all relatively constant and within acceptable tolerance.
98
| Technical Report | Kirkland Lake Gold |
| December 2016 | Stawell Gold Mines |

99
| Technical Report | Kirkland Lake Gold |
| December 2016 | Stawell Gold Mines |
| 11.8.2 | LABORATORY DUPLICATE ASSAYS |
Lab splits and duplicates are taken to monitor sample precision. Three sets of duplicate data are collected for Stawell Gold Mines samples:
| • |
The first duplicate data set is collected at the split stage of the sample preparation, before pulverization; every tenth sample is split with the split portion becoming the B sample (1:10 ratio). This duplicate is referred to as the lab-split at Stawell Gold Mines and monitors the precision of the crush and split stages of the sample preparation; |
|
| |
| • |
The second duplicate data set is collected at the fire assay stage; randomly, within a 1:20 ratio, a second scoop of the pulp is taken and processed in the same batch to the original sample. This duplicate is referred to as the duplicate at Stawell Gold Mines and monitors the precision of the pulverization sample preparation stage; and |
|
| |
| • |
The third duplicate data set is collected at the fire assay stage; randomly a second scoop of the pulp is taken and processed in a different batch to the original sample. This duplicate is referred to as the repeat at Stawell Gold Mines and monitors the precision of the pulverization sample preparation stage as well as across batch repeatability. This type of duplicate can also be requested if there is a non-compliant standard within the batch. |
Where duplicates and repeats are outside of 10% of the original sample, additional duplicate repeats are requested to determine if it is a laboratory issue or associated with coarse gold within the sample.
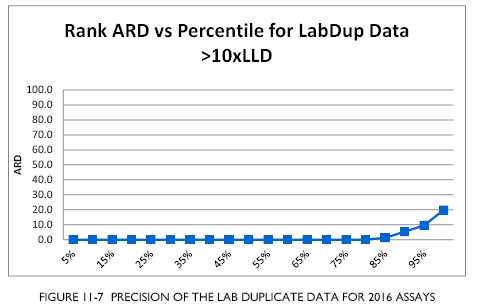
Figure 11-7 shows the monitored lab duplicate results from the period January 1, 2016 to the January 31, 2016. The graph presented in Figure 11-8 is an indication of the homogeneity of the sample after the pulverization stage. This analysis shows more than 95% of the duplicate assays have a relative difference of less than 10% to the original assay value indicating an appropriate level of precision through this stage in the sample preparation.
100
| Technical Report | Kirkland Lake Gold |
| December 2016 | Stawell Gold Mines |

Figure 10-8 is a Log/Log graphical representation of the same data, which is also used to analyze the lab duplicate outliers. This graph indicates that the duplicate variation more frequently occurs in the lower grade range (yellow highlight) which is of lesser interest. The higher grade duplicates are all relatively constant and within acceptable tolerance.
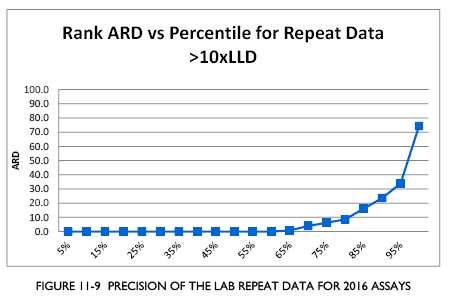
The Lab Repeat data performed well for the 2016 period assays,
achieving the required goal of returning with greater than 80%
of the duplicate assays obtaining a half absolute relative difference (HARD)
within 20% to the original batch. Refer to Figure 11-9.
101
| Technical Report | Kirkland Lake Gold |
| December 2016 | Stawell Gold Mines |

Figure 11-10 is a Log/Log graphical representation of assay repeats which is used to analyze the lab assay repeatability. Repeated assays are compared to initial assays and as duplicate assays are a measure of laboratory precision any large discrepancy is followed up and discussed with the internal and external laboratory managers.
Monitoring of these checks is done within two days of the sample batch return and actioned generally no later than seven days after the return date. Any actions taken during the monitoring process are recorded in the Stawell Gold Mines QA/QC diary, which was set up in September 2007.
| 11.8.3 | STAWELL GOLD MINES STANDARD REFERENCE MATERIAL |
Nine standard reference materials are currently being used by Stawell Gold Mines, and as per standard procedure are inserted at frequencies of 1:20-1:25 samples to monitor accuracy. All of the current standards, except for OR62d, OR904 and OR17c are matrix matched. Standard OR17c was introduced into the system in 2016 to replace OR214 which had run out of samples. This standard is not matrix match as there is no current capacity to obtain SGM matrix matched standards. All standards are commercially made by Ore Research and Exploration Pty Ltd (ORE) of Melbourne and certification certificates are available in Stawell Gold Mines records. The details of the standards and when they were introduced to the system are shown in Table 11.8.4.
102
| Technical Report | Kirkland Lake Gold |
| December 2016 | Stawell Gold Mines |
| 11.8.4 | QA/QC FOR THIS TECHNICAL REPORT |
For this technical report, an analysis of the QA/QC data returned for the current mineral resource estimates have been compiled in Table 11-5.
This analysis encompasses all QA/QC data returned to Stawell Gold Mines for the current model updates and serves to demonstrate that a responsible and ongoing approach to managing assay data quality is maintained at Stawell Gold Mines and that assaying information is of a good quality for Mineral Resource estimation.
As a result of QA/QC monitoring processes carried out during the current reporting period, 998 samples were re-assayed from an initial 2,720 assays, for holes reported during this period. The proportion of re-assay is variable for each model update and given time period. Full details of QA/QC results can be found in individual reports by area (see below Table 11-5).
TABLE 11-5 QA/QC ASSAY RESULTS
| AURORA B |
USF2 | SM 250 | FED ALB STH |
MORAY | FED ALB | MARINERS | BIG HILL | |
| Au | Au | Au | Au | Au | Au | Au | Au | |
| Population # | 98 | 186 | 9 | 28 | 232 | 47 | 192 | 69 |
| # Outside 2σ | 7 | 12 | 0 | 3 | 28 | 9 | 26 | 4 |
| % Outside 2σ | 7% | 6% | 0% | 11% | 12% | 19% | 14% | 6% |
| # Outside 3σ | 1 | 3 | 0 | 1 | 8 | 6 | 5 | 1 |
| % Outside 3σ | 1% | 2% | 0% | 4% | 3% | 13% | 3% | 1% |
| % positive | 48% | 37% | 78% | 68% | 49% | 45% | 66% | 46% |
| % negative | 43% | 56% | 11% | 32% | 44% | 51% | 32% | 52% |
| % at zero | 9% | 11 | 11% | 0% | 16 | 2 | 3 | 1 |
| TOTAL BIAS | 0.8% | -0.4% | 2.1% | 2.4% | -2.1% | -0.8% | 1.4% | -0.1% |
TABLE 11-6 REPEATED ASSAY FOR ALL CONTRIBUTING MINERAL RESOURCE AREA
| AURORA B |
USF2 | SM 250 | FED ALB STH |
MORAY | FED ALB | MARINERS | BIG HILL |
TOTAL | ||
| Initial assays | 526 | 206 | 64 | 144 | 43 | 297 | 503 | 1072 | 2855 | |
| Repeated assays | 240 | 47 | 8 | 20 | 21 | 163 | 397 | 38 | 934 | |
| Repeated
assays_Accepted |
190 | 45 | 8 | 20 | 21 | 142 | 339 | 38 | 803 | |
| % Repeated Assays | 45.6% | 22.8% | 12.5% | 13.9% | 48.8% | 54.9% | 78.9% | 3.5% | 32.7% | |
| % Accepted Repeated Assays |
36.1% | 21.8% | 12.5% | 13.9% | 100.0% | 87.1% | 85.4% | 3.5% | 86.0% |
103
| Technical Report | Kirkland Lake Gold |
| December 2016 | Stawell Gold Mines |
| 11.8.5 | OPINIONS ON SAMPLING |
It is the opinion of the Authors that the drilling and sampling methodologies employed by Stawell Gold Mines are of a high standard and provided representative tests of the mineralization for the estimation of Mineral Resources. Standard drill spacing’s adopted by Stawell Gold Mines are appropriate for the stages of Mineral Resource development and whilst other factors contribute to decisions regarding classification of the Mineral Resources the drill spacing’s discussed in this section enable appropriate geological interpretation and Mineral Resource classification decisions to be made.
| 11.8.6 | RECOMMENDATIONS |
The results from the QA/QC analysis of drill samples has indicated a good level of confidence in assay grades for use in the resource model. The following recommendations for improvements in the current procedures:
| • |
Standards continue to be inserted on site and independently of the assaying laboratories. The process of matrix matched standards needs to be continued wherever possible; |
| • |
Continued monthly reporting and meetings with the external independent laboratory(s); and |
| • |
The procedure for monitoring the acceptance gates of standards needs to continue to be reviewed regularly with increased sample support to validate the standard reference material precision of grade. |
104
| Technical Report | Kirkland Lake Gold |
| December 2016 | Stawell Gold Mines |
| 12 |
DATA VERIFICATION |
|
Kirkland Lake Gold utilize specialized industry computer software to manage its drillhole and assay database and employ dedicated personnel to manage the database and apply appropriate QA/QC procedures to maintain the integrity of the data. Data is assessed for errors with respect to standards and blanks prior to loading into the acQuire™ database software. Data is then spatially assessed in a commercially available mining software package (Surpac™) for any other questionable results. | |
|
To confirm compliance, the earlier 2012 Stawell Technical Report involved completing various database checks, which did not identify any reportable errors that would have raised any concerns about the integrity of the data. During the preparation of this technical report, which has included search and lookup of assay results, generation of plans and sections and estimation of Mineral Resources, the Authors did not encounter any difficulties with the database; hence the Authors believe the data/database has been verified to a sufficient level to permit its use and confidence in its reliability. | |
|
In addition to the quality control and data verification procedures discussed in detail above, the Qualified Persons preparing the Mineral Resource estimates have further validated the data upon extraction from the database prior to Mineral Resource interpolation. This verification used MineSight™ as the primary tool to identify data problems. This allowed the omission of holes, if they were of questionable quality, for example due to low quality sample techniques or incomplete assaying. When coupled with the more mechanical check processes ensuring high quality is entering the database in the first place, these checks were effective in allowing the Qualified Persons to be confident that the data was geologically coherent and of appropriate quality for the purposes used in this technical report. |
105
| Technical Report | Kirkland Lake Gold |
| December 2016 | Stawell Gold Mines |
13 MINERAL PROCESSING AND METALLURGICAL TESTING
| 13.1 | MINERAL PROCESSING AND METALLURGICAL TESTWORK |
An ongoing program of metallurgical test work was conducted at Stawell Gold Mines. The program utilizes diamond drill core to determine the expected plant recovery for all ore blocks at a stope scale within the immediate and long term mine plan. In addition to this, in areas where previous mining and treatment have occurred, previous actual plant performance is also taken into account.
Samples of the ore and estimated dilution are tested to determine the expected preg rob index and expected gold recovery through the Stawell Gold Mines processing circuit. Samples for metallurgical test work are selected from each ore lode; desirable samples are tested for each stope block. In this way expected rates of recovery can be determined for individual stope blocks, levels and ore lodes. As the metallurgical test work program is an ongoing process, the samples being tested to determine recovery rates can be said to be representative of the current and future production areas.
The results of the test work program (combined with previous performance where applicable) provide an expected plant recovery on a campaign basis. Stawell Gold Mines metallurgists were able to plot the actual versus predicted plant recoveries using the test work results so as to show the relationship between actual plant recovery and expected plant recoveries for all float ore treated project to date. This validated the robustness of the metallurgical test work programs utilized by SGM and as such the robustness of the forecast metallurgical assumptions used in developing project schedules and financial forecasts. The preg rob index is a relative scale that indicates preg rob severity per ore source. Determining the preg rob index for each ore source allows for tailoring of processing to suit.
Test work results by area are summarized in Table 13-2 METALLURGICAL LEACH TEST WORK RESULTS FOR EAST MAGDALA ORE SAMPLES, G/T AU below. An example of metallurgical and test work results by area (Table 13-1) are given below.
106
| Technical Report | Kirkland Lake Gold |
| December 2016 | Stawell Gold Mines |

107
| Technical Report | Kirkland Lake Gold |
| December 2016 | Stawell Gold Mines |
14 MINERAL RESOURCE ESTIMATES
| 14.1 | INTRODUCTION |
The geographical locations of the various Mineral Resource and Mineral Reserve areas for Stawell Gold Mines are shown in Figure 14-1 and Figure 14-2.
Over the period from January 1, 2016 to December 31, 2016, 19,423.9m of underground exploration, resource definition and stope definition diamond drilling was completed. This drilling has assisted in defining additional Mineral Resources.
Post 1998, the majority of the Mineral Resources and Mineral Reserves have been estimated using 3D geological block models. A number of block models have been created for separate geographical areas. The key Mineral Resource and Mineral Reserve areas and the date of the most recent updates are recorded and outlined in Table 14-1.
This Mineral Resource estimate is a compilation of a number of separate models and estimates. Table 14-1 summarizes the Resource Models that have been completed during the reporting period. Table 14-2 summarizes the Resource Models that were completed prior to the reporting period and contribute to the current reported Mineral Resource.
TABLE 14-1 SUMMARY OF MINERAL RESOURCE MODELS UPDATED IN 2016
| Model | Release Date | Report Date |
| Aurora B | Jun-16 | Aurora B Resource Model Report June 2016 |
| Upper South Fault 2 | Jul-16 | Upper South Fault 2 Resource Model Report July 2016 |
| Below SM 250 | Oct-16 | Below SM 250 Resource Model Report October 2016 |
| Fed Alb South | Nov-16 | Federal Albion South Resource Model Report November 2016 |
| Moray | Dec-16 | Moray North Resource Model Report December 2016 |
| TABLE 14-2 SUMMARY OF RESOURCE MODELS COMPLETED PRIOR TO 2016 THAT CONTRIBUTE TO THE CURRENT MINERAL RESOURCE |
| Model | Release Date | Report Date |
| Federal Albion | Apr-12 | Mid Magdala Resource Model Report June 2012 |
| Mariners | Dec-13 | Mariners Resource Model Report December 2013 |
| Big Hill | Mar-14 | Big Hill Resource Model Report April 2014 |
The Big Hill Resource Model (March 2014) has been reported as Big Hill Surface (within pit shell and evaluated at a cut-off grade of 0.44 g/t Au). The underground potential of this model includes all Mineral Resource outside of the resource pit shell, and has been reviewed at a 2.0 g/t Au cut-off. The underground component of this model is referred to as Upper Levels.
108
| Technical Report | Kirkland Lake Gold |
| December 2016 | Stawell Gold Mines |

109
| Technical Report | Kirkland Lake Gold |
| December 2016 | Stawell Gold Mines |

110
| Technical Report | Kirkland Lake Gold |
| December 2016 | Stawell Gold Mines |
| 14.2 | STOPE RECONCILIATION |
The resource calculation methodologies used at Stawell Gold Mines are supported by a significant period of mining and reconciliation information (see Figure 14-1 and Figure 14-2). Figure 14-3 illustrates final design versus actual mill reconciled stope performance since 2003.

111
| Technical Report | Kirkland Lake Gold |
| December 2016 | Stawell Gold Mines |
| 14.3 | MINERAL RESOURCE ESTIMATION METHODOLOGIES |
| 14.3.1 | INTRODUCTION |
Post 1997, 3D block modelling methodologies have progressively become the standard method for estimating Mineral Resources. All reported Mineral Resources have been estimated using computer 3D methodologies.
This work is carried out in the MineSight software suite which is an industry standard geology and mine planning software package. Detailed Mineral Resource documents for each individual Mineral Resource area are referenced in Section 27. The description below describes the general process that is common to each model.
| 14.3.2 | DATA TYPES |
The estimation of contained gold has been based on assays sourced from surface and underground drilling as detailed in Section 10. The data available as at December 2016 consisted of diamond core samples derived from earlier exploration and mining definition campaigns as well as reverse circulation drill chip samples. Sludge drilling and channel sample results were included in the database but excluded from compositing and subsequent estimation. Also excluded were quality suspect drillholes which are listed in each resource report.
All data was provided in local grid co-ordinates.
| 14.3.3 | GEOLOGICAL INTERPRETATION |
14.3.3.1 Aurora B Zone
The Aurora B Zone is the first Mineral Resource area estimated on the East Flank of the Magdala Basalt. The Aurora B Area is located in the hangingwall of the South Fault, between 232N and 245N, and from -350mRL to -600mRL. The area is terminated to the south and at depth by the South Fault, but depth extent increases further north due to the moderate northeast dip of the South Fault. The area remains open to the north and could continue for the estimated 3km strike length of the Magdala Basalt. The area is complicated by at least two Flat Faults with a top to the southeast movement; however, this only has a slight affect as the apparent eastwards dislocation is about 5-15m. The rocks within the Aurora B Area show good competency.
The mineralized zones of Aurora B have been divided into two separate domains: The Bengal and Siamese Lodes (Domain 110) and the BIF (low-grade, Domain 310). The recent Q2/Q3 2016 drilling lead to a reinterpretation of the Wonga Style Lode, resulting in this domain being removed.
The term Hampshire Lode is also no longer used but instead has been renamed along each nose of the East Flank Basalt. Currently, these are the Bengal and Siamese Lodes. The sub-domaining for the original Hampshire Lode has been maintained as both ‘flats’ (sub-domain 111) and ‘verticals’ (sub-domain 112). The ‘flat’ is the dilation zone over the top of basalt noses and the ‘vertical’ is a narrow vertical zone connecting the flats.
112
| Technical Report | Kirkland Lake Gold |
| December 2016 | Stawell Gold Mines |
The lodes are observed to be a highly siliceous host rock up to three to four meters wide. Assay values are varied in the domain, with isolated higher grades associated within the ‘flats’ and often due to fine grained visible gold. The two lodes do not sit on the immediate contact of the east basalt flank but in the sedimentary protolith. This protolith is predominately BIF which has been variably altered with silica, chlorite ± stilpnomelane. This differs to the west flank where the alteration is so intense, protolith cannot be clearly identified. Where the BIF is sulphidized and crosscut by later stage tension veins tends to correlate with gold mineralization. The sulphides (pyrrhotite, arsenopyrite, and pyrite) are the same as those associated with gold mineralization in the basalt contact lodes of the West Flank. Visible gold is often seen within the quartz veins, and chlorite veins or within the strongly chloritized groundmass. There has been no mining of this ore type to date.
14.3.3.2 Upper South Fault 2 Zone (USF2)
Geologically, the USF2 Zone shares the same characteristics as the other Magdala ore bodies, comprising of three distinct mineralization types. The mineralization types, which occur in the Magdala System include the quartz rich shear of Central Lode, the chlorite and sulphide rich Basalt Contact Lodes and the Stockwork Lodes.
The Upper South Fault 2 Resource Model (USF2) covers the area from the 314N to the 331N on the 45-degree mine grid and is bounded by the Upper South Fault above and the Lower South Fault below. The geology has structural complexity due to offsetting flat faults which differentiates it from the Magdala geology. The northern area of the model is bound to the north by historic USF2 mining on two lodes and from the southern area by the convergence of the Upper and Lower South Faults. The USF2 is interpreted to be a fault offset block of the Magdala ore body with the geology dipping very steeply to the west with internal faults offsetting ore blocks laterally up west. The model contains the Dukes Lode Basalt contact, the Stockworks Lode and Central Lode. This model represents the southern up-dip end of the broader fault block.
USF2 is a fault offset block of the Magdala mineralization system, below and north of the USF1 Fault block and is on the opposite side of the Lower South Fault from the Golden Gift mineralization system. The northern extent of the USF2 was mined from approximately 2002-2004. Face sketches and sludge drilling from the 752 and 772 levels were also used to assist in the building the model shapes. Historic geology shapes from the 2002-2004 USF2 mining were used to assist in building the geology shapes. The Central Lode is situated between the Mine Schist hangingwall and the low-grade internal Volcanogenic package. The Central Lode also often contains internal basalts running sub vertically through it. This area is called Central Lode due to the proximity to the Mine Schist without necessarily being a true Central Lode as seen in the Magdala Mineral System. Dukes Lode sits against the Dukes Basalt contact, in a footwall position to the internal Volcanogenics. Both ore lodes are bound underneath by the Lower South Fault and above by the Upper South Fault. The Stockworks Lode is primarily in the southern end of the model area where the distance between the Central and Basalt Contact Lodes is wider.
The Central Lode is defined by a hangingwall proximal to the Mine Schist contact, and a footwall contact defined by a reduction in grade, RQD and quartz content.
The Central Lode Domain is comprised of the 101 and 102 subdomains, separated based on a curve in the orientation of the ore but with the same characteristics. The vertical extent of the Central Lode is constrained by the Upper and Lower South Faults, but also internally by the My and Your Faults, which offset laterally the Central Lode. The 100 Domain was used for statistical analysis and used in variography studies.
113
| Technical Report | Kirkland Lake Gold |
| December 2016 | Stawell Gold Mines |
The Dukes Lode is defined by a footwall basalt contact, a sulphide/chlorite/quartz rich zone adjacent. The hangingwall is defined by a reduction in sulphides, chlorite, gold grade and often a reduction in shear intensity. The Dukes Basalt contact has been faulted out in the southern extent of the geology model and has not been intercepted by any drilling.
The Stockworks Lode is a single domain and is defined by a broad zone of variable grade between the Central Lode and Dukes Lode in the southern extent of the modelled area. The Stockworks Zone contains the highest gold grades in the southern end of the domain and reduces in grade to the north. The contact between the Central Lode and the Stockworks can be difficult to precisely define. The Stockworks Domain is now outside the area of interest and is essentially depleted.
The Weak Volcanic domain is a zone of weakly mineralized, less chloritic material from between the Central and Dukes Lodes and excluding the Stockwork Lode. The Weak Volcanic is typically of low-grade and less chloritic than the mineralized Central and Dukes Lodes.
14.3.3.3 Below Scotchmans 250
The geological interpretation of the Below Scotchmans 250 has progressed over the two model updates over the area with the increased geological understanding of the relationship between the Flats and Vertical structures. The current interpretation has eventuated in having six mineralized domains, basalt waste zones and a halo of low-grade Volcanogenic, (which was estimated).
The Central Lode is defined by a hangingwall proximal to the Mine Schist contact, and a footwall contact defined by a reduction in grade, RQD and quartz content.
A Hangingwall Lode displays similar geological characteristics as the Central Lode and sits most proximal to the Mine Schist contact. This Lode has been mostly depleted by historical mining.
The Magdala Basalt Contact Lode is defined by a footwall basalt contact, a sulphide/chlorite/quartz rich zone adjacent. The hangingwall is defined by a reduction in sulphides, chlorite, and grade and often a reduction in shear intensity. The Magdala Basalt Contact Lode and the basalt are defined and estimated in the 2012 Federal Albion Resource model.
An Upper Basalt has been modelled higher than the Magdala Basalt of which there is a small zone of Basalt Contact Lode identified, which has been modelled as Magdala Contact Lode, but in reality is the Contact Lode of the next basalt nose up (Federal Basalt). This lode was intersected in the 254mRL drive in 2015 and stoped in 2016.
The low-grade Volcanic domain is a zone of weakly mineralized, less chloritic material surrounding the mineralized domains extending out from the basalt to the Mine Schist.
14.3.3.4 Federal Albion and Federal Albion South Zones
The mineralized zones of the Federal Albion all exhibit visually distinctive mineralization styles.
114
| Technical Report | Kirkland Lake Gold |
| December 2016 | Stawell Gold Mines |
The Central Lode presents as a strongly sheared volcanogenic unit with high quartz content that frequently contain arsenopyrite-filled stylolites. Silica alteration is prevalent, as is moderate to strong sulphide mineralization (predominantly sheared pyrrhotite and cubic pyrite).
The Hangingwall Lode is characteristically similar to the Central Lode where it is dominated by high quartz content with moderate to strong sulphide. The lode is generally defined by a precise footwall contact with chloritic altered metasediments where it is not in close proximity to the Central Lode. The hangingwall is almost entirely always on the Mine Schist contact.
The Extended Lode is a Basalt Contact mineralization typified by coarse arsenopyrite up to 20mm in size along with recrystallized pyrrhotite and minor pyrite. Large quartz tension veining up to 750mm wide is often associated with coarse arsenopyrite and other sulphides that form along stylolites and is a common feature of the Basalt Contact mineralization. In the immediate contact zone with the basalt it was common to see silicification of the host rock and bands up to 4m wide of mineralized siliceous sediment. Assay values are weaker in these zones by comparison due to the lack of chlorite.
A hangingwall weak volcanogenic unit is found on the contact zone of the Mine Schist and the Central Lode, which is less chloritic, has higher graphitic alteration than the host rock, and shows a moderate S2 or S3 fabric, more typical of Mine Schist. This domain consists of recrystallized pyrrhotite and sedimentary pyrrhotite found around weak to moderate chlorite altered host rock. Quartz shear zones consisting of puggy graphite and weak chlorite alteration are also present. The hangingwall weak volcanogenic unit was often geologically logged as pelite to distinguish it from the mineralized zone and the Mine Schist proper. A footwall weak volcanogenic unit separates the Central Lode mineralization from the Extended Lode.
A felsic porphyry runs oblique to the Central Lode from 5220N to the South Fault and in places stopes out areas of the Central Lode. This porphyry is post mineralization and does not host any gold.
The geological framework has been updated to include the Penthouse Fault and the Upper South Fault, which are later, offsetting the mineralization below to the west (1m to 10m). The Penthouse Fault was intersected in the 310 development. The Penthouse mineralization is a small splay which is bound by the Upper South Fault and the Penthouse Fault. The location of the South fault was redefined to move further north based on the structural data of the Golden Gift offset diamond holes.
14.3.3.5 Moray North
To date, Moray drilling indicates a similar contrast in geology to both the Upper Magdala ore bodies on the west and the Aurora B on the east at the Stawell Mine. Moray Lode is interpreted to be the mineralization on the contact of the Moray Basalt Anticline. Three zones of mineralization have been modelled which have been termed the “basalt contact”, the “weak volcanogenic” and the “waterloo” zones.
The mineralized zones of Moray have been divided into three separate zones: Moray ore (Domain 600), Moray Waterloo (Domain 610) and Weak Volc (Domain 660), which is the area between the Magdala and
Moray anticlines that are not domained as ‘ore’.
Basalt Contact mineralization (Domain 600) is located in the immediate contact zone with the Moray Basalt. Commonly this is observed to be a highly siliceous host rock up to two to four meters wide. Assay values are varied in the domain; however, higher grades appear towards the synclinal keel of the Moray Basalt. Grade has been defined on the crest of the basalt up-plunge from the high grade shoot, although typically no economic mineralization is identified above the basalt nose.
115
| Technical Report | Kirkland Lake Gold |
| December 2016 | Stawell Gold Mines |
The Moray ‘basalt contact’ style of mineralization is characterized by a high siliceous zone with trace amounts of bleached chlorite alteration. Characteristic sulphide mineralization of the Moray contact is pyrite, trace arsenopyrite and disseminated recrystallized pyrrhotite. The contact is generally sheared with a weak volcanogenic zone with little to trace sulphides.
Commonly the mineralization is magnetic due to bands of magnetite, and in the 2016 drill holes, this has been logged as banded iron formation (BIF). Without a program of re-logging the historical holes where drill core exists, it is unclear the extent and distribution of the BIF through the Moray Lode, although it is suspected that it has been historically overlooked. For this reason, the correlation between BIF and mineralization cannot be ascertained. The identification of BIF in the Moray Lode was driven by the understanding of the eastern flank mineralization on the Aurora B and Bengal Lodes. Current geological thinking is that there is less pervasive chlorite overprinting of the original BIF protolith on the east and in part the Moray, and hence the BIF is preserved unlike the western ‘Volcanogenic’ unit.
The Moray Zone is fully healed/fused to the basalt contact and narrow 2-4m wide ‘waterloo’. The weak Volcanogenic Zone is comprised of varied rock types and alteration: Carbonaceous pelite, to chloritic volcanogenics. However, it is domained together due to sub-economic gold grades.
A zone of weak Volcanogenic separates the two distinct ore zones (Domain 610) and (Domain 600). Again moderate chloritic alteration and with a higher graphite alteration, the host rock shows a moderate S1 or S2 fabric, more typical of Mine Schist. The weak Volcanogenic is often geologically logged as pelite to distinguish it from the mineralized zone.
14.3.3.6 Mariners Area
The mineralized zones of the Mariners Area can be divided into five mineralized lodes, Curiosity Lode, Opportunity Lode, New Lode, Mariners Lode and Spirit Lode. All lodes strike at around 335° and dip around 50° towards the southwest. Each lode is separated by a low-grade zone from 2m to 14m thick.
All shear zone lodes differ from the typical Central Lode structure due to having diffuse boundaries on both the hangingwall and footwall of the structures. The Mariners Lode also differs in that it is mostly brecciated quartz rather than a laminated quartz vein. The lode structures are generally identified as a quartz-sulphide rich shear zone with varying widths of 2m to 10m. They have been modelled using elevated quartz-sulphide percentage as a guide, but have also been driven by grade boundaries.
The Spirit Lode is located to the west of the Mariners Lode. In comparison to the other four lodes, the Spirit Lode tends to have the lowest gold grades and the thinnest widths. It disappears along strike in the middle of Mariners and even though evidence of the hangingwall shear can be seen in drill core, there is little to no mineralization within the lode itself. The weaker grade is likely a result of the position of the lode on the Hangingwall Extreme of the Mariners area.
116
| Technical Report | Kirkland Lake Gold |
| December 2016 | Stawell Gold Mines |
The Mariners Lode is located between the New and Spirit Lodes. As this domain had the most drill intercepts it was the easiest in which to identify the mineralizing structure, which was also confirmed in old face and backs mapping in the area, which identified these secondary faults and mineralization associated with them. Once Mariners Lode had been established, the other shears and associated quartz breccia, fine grained sulphides and mineralization on either side of the Mariners Lode could be identified.
The New Lode is located between the Mariners and Opportunity Lodes. This is one of the stronger mineralized lodes, second to the Opportunity Lode.
The Opportunity Lode is located east of the New Lode and is the largest and most strongly mineralized of the five lodes. It is the widest of the modelled lodes and is likely to comprise more than one mineralized shear.
The Curiosity Lode is located east of the Opportunity Lode. The Curiosity Lode is a new addition to the previous model and was identified as mineralization not domained in the footwall of the Opportunity Lode. Recent drilling, particularly in holes MD6253, MD6254 and MD6255, has now provided enough evidence for the delineation of the Curiosity Lode. Drilling, however, is sparse and not all holes have been sampled in this position resulting in low confidence in the Curiosity Lode (classified as inferred).
14.3.3.7 Big Hill and Upper Levels
The package of Magdala Volcanogenics, as a whole, plays host to the bulk of mineralization. Where continuous mineralized structures can be defined with a reasonable degree of confidence, these structures have been constrained within wire-frame solids. Where it has not been possible to confidently define the geological control to mineralization this material has been left unconstrained. The Magdala Flanks, Mariners, Iron Duke and Allens are geologically modelled in the surface component of the model (Big Hill). The Mariners and Magdala Flanks units are geologically modelled in the underground component of the resource model (Upper Levels).
Mariners is the least problematic geological unit to define. It has a consistent width and orientation, averaging around 14m thick and dipping to the northwest (mine grid). It constitutes a shear package, with massive quartz veining. Less consistent is the Mariners Spur which is modelled on the upper surface (sections 289/290N). This is only defined by eight (three are twinned) drillholes and the geology in this area will be more complex than modelled.
Offset extensions of the Mariners Shear have also been modelled down-dip. The original model identified one offset extension; however, two further offset domains were identified in the Upper Levels 2012 Model update. Underground drilling of Mariners Lower in early 2012 drove an increased understanding of the structural framework, identifying increased faulting complexity and offset lodes which now connect the underground Mariners Resource with the Upper Levels Resource Model.
The main Mariners Lode is offset by Fault 3, which strikes at 145° (Mine Grid) and dipping at around 35º to 40º to the northeast. It has an apparent reverse displacement of between 5m and 25m, decreasing northwards. This section of the Mariners Lode (Mariners L1) is then truncated and offset at depth by the Cross Course Fault. In this model update, the Cross Course Fault has been remodelled as two fault surfaces which bounds another lower lode offset (Mariners L2). A third, less horizontally extensive offset (Mariners L3) was identified and was modelled to be bounded by the Cross Course Fault lower surface and the Scotchmans Fault. The Mariners L3 has a greater offset 15m to 25m and plunges further to the north than the above two offset lodes, which is likely due to a greater influence from the Scotchmans faulting. In reality these offset sections are likely to be more complexly faulted than modelled. Beneath the Cross Course Fault, the general definition of geology is hampered by a lack of diamond drill core. The principal reason for modelling a fault in this location is to explain the lack of semi-planar continuity of the otherwise predictable Mariners structure. Without a fault, it would be necessary to invoke a 30° to 40° change in the orientation of the shear. Note that the geological confidence of the interpretation around these faults is lower than the more planar section of Mariners, because of the greater degree of structural complexity and uncertainty in the location of the faults.
117
| Technical Report | Kirkland Lake Gold |
| December 2016 | Stawell Gold Mines |
Interpretation of the Allens Zone is somewhat problematic and the interpretation of the geology in this zone is of lower confidence than other sections of the ore body. Exposures in the Allens open pit show lithological layering (S0 and later S2/3 foliation), as well as massive veining to be very steeply dipping to vertical. Diamond core shows the same. Two massive veins exposed in the Allens Adit strike approximately N-S mine grid and dip vertically. Some Stockwork style veining is seen near the top of the zone (immediately beneath the Mariners structure), but much of the geology consists of well bedded, foliated volcanogenic sediments which are unpredictably mineralized. Much of the gold occurs in these sediments. Because of the highly oxidized state of these rocks the form of sulphide mineralization is largely obliterated.
There is a poor correlation between quartz percentage and gold mineralization. Accordingly, the wireframed structures which have been interpreted in the Allens Zone should not be regarded as having hard boundaries for ore/waste selection. Rather they have been used to constrain a tonnage that should reflect the tonnage of ore grade material adequately. They have dimensions that reflect the attitude of mappable geology, which in turn will probably exert the main influence on gold mineralization. However, the locations of the wire-frames are controlled as much by distribution of gold grades as by definable geological contacts/zones.
It is suspected that a degree of remobilization of gold within the weathering profile may exist, although no distinct enrichment horizons could be identified. The geology is of such variety that it is very difficult to separate any secondary effects from primary variation.
The relationship between the Mariners and Allens Zones is also still problematic. Little overlap exists beneath the main flatter section of Mariners and the Allens Zone, which dies out rapidly northwards beneath Mariners. No clear evidence is seen of the timing relationships between these structures, the Allens mineralization appears to hang as a pendant of dilational veining beneath a change in orientation of the Mariners shear structure.
The Iron Duke Zone is a wedge of geology occurring between the Scotchmans Fault and the Lower Cross Course Fault. It is the up-dip extension of the volcanogenic package/shear zone which has been offset from the main Magdala shear system by reverse movement on the Lower Cross Course Fault. It is truncated above by the Scotchmans Fault Zone, which again displaces the orebody westward. Interpretation of the geology in this zone is hampered by the strongly oxidized nature of the rocks. It has been interpreted as a series of constrained stockwork style ore zones (same as Allens), where the envelopes have been used to constrain a tonnage. In reality the margins will have gradational boundaries.
118
| Technical Report | Kirkland Lake Gold |
| December 2016 | Stawell Gold Mines |
For wireframing purposes the Iron Dukes Domain has been considered in the same context as Allens and was treated as broad envelope around the stockwork zones constraining bulk tonnage. The previous model wireframed the structures at a higher grade which effectively reported a higher grade for lower tonnes. A lower domain threshold has been utilized for the current model at (0.35 g/t Au); in line with the model economic cut-off (0.44 g/t Au) to ensure all mineable tonnes was economically represented for mining analysis.
“Magdala Flanks” is the term used to describe the package of volcanogenic rocks lying to the west of and continuing up-dip from the nose of the Basalt antiform. The western margin of this zone is the contact between the Volcanogenics and the Mine Schist, which often plays host to the Hangingwall Shear. The eastern margin is generally the contact with the basalts, but above the basalt noses the eastern margin is a transitional boundary to siliceous eastern schists, usually marked by a clear grade boundary.
14.3.4 GEOLOGICAL
MODELLING
Geological modelling is carried out on individual Mineral Resource areas by the geological team at Stawell Gold Mines. The data available for this varies depending upon the stage of the development and understanding of the deposit area. The general process is as follows:
| • |
Wireframe models of major geological units are interpreted and created using MineSight software; |
|
| |
| • |
Less advanced deposit areas are first interpreted on paper while more advanced deposits are often interpreted directly within the software; |
|
| |
| • |
All available geological information is utilized in the interpretation process including; |
| - | Diamond drill core logs, core photographs, face mapping and photographs, and sludge drilling geology logging, | |
| - | The drillhole logging information available to the mine geologists including, |
| • | Lithology, | |
| • | Alteration, | |
| • | Quartz veining percentage and veining style, | |
| • | Sulphide percentages, type and style, | |
| • | Location and orientation of lithological contacts, shears and fault structures, | |
| • | Core texture – indicating faulting, shearing etc., and | |
| • | Core photographs. |
|
- |
Geological modelling is an ongoing process and models are progressively updated to reflect the most up to date information. Model updates are generally made upon completion of infill drilling programs and completion of development levels, where this information results in a significant change in the amount and quality of data involved and/or changes in geological understanding. |
The gross geological architecture of the mineralization systems is well understood and described in detail in Sections 7 and 8 of this technical report. Mineralization is hosted by relatively distinctive and predictable geological units that are modelled by the area geologists. The key units that are modelled in each area are:
119
| Technical Report | Kirkland Lake Gold |
| December 2016 | Stawell Gold Mines |
| • |
Magdala Basalt – unmineralized. Geometry of the Magdala Basalt is required to estimate the quantity of dilution that will be incorporated into the mine designs; |
|
| |
| • |
Mine Schist – unmineralized. Also important for estimating the quantity of dilution that will be incorporated into the mine designs; |
|
| |
| • |
Weakly Mineralized Volcanogenic – important to estimate dilution in the mine designs; |
|
| |
| • |
Mineralized domains. For individual model areas these may be either in the Central Lode position, Basalt Contact positions and contain zones of Stockwork Lode mineralization and Flat Lodes; |
|
| |
| • |
Key fault structures are modelled as they can have a significant impact on the shape of the mineralized domains; |
| - |
Structures have a significant impact on the outcomes of the geological modelling and improving the understanding of the location of these is a key component to producing reliable estimations of the in situ Mineral Resources, and | |
|
| ||
| - |
Structures have a significant impact on the in situ Mineral Resources. |
| • | Wireframes are, where possible, snapped to drillhole intervals. |
The key control on Mineral Resource estimation is accurate definition of the constraining geological models. Estimation of grade within the domains, whilst still very important, is of secondary importance to the first order geological demining.
| 14.3.5 | WEATHERING MODEL |
A model of weathering state was constructed using the following criteria:
| • |
Base of total oxidation was defined as the point down-hole at which weathering is not completely pervasive of the rock mass and where remnant fresh rock first appears; and |
|
| |
| • |
Base of transition zone was defined as the point down-hole at which oxidized material becomes an insignificant volume component (<1% by volume). |
In diamond core, these boundaries were identified from logging and core photographs. In RC chips identification was principally made from color and mineralogy changes. Many of the holes were re-logged specifically for identification of these boundaries.
Both surfaces are highly variable in reality due to uneven fracture density and fluid flows, and holes may pass in and out of totally weathered, partially weathered and fresh material. The surfaces are therefore necessarily smoothed.
Only two Resource Models have ore domains that extend up past the Fresh Weathering Domain. This is the Federal Albion South (Nov 2016) and the Big Hill (March, 2014) Models.
120
| Technical Report | Kirkland Lake Gold |
| December 2016 | Stawell Gold Mines |
| 14.3.6 | MINERAL RESOURCE INTERPRETATION BY AREA |
The process of block modelling at Stawell Gold Mines is relatively standard across all model areas and is drawn from the details for the individual model areas.
Stawell Gold Mines has retained the services of several key consulting groups over time to ensure Mineral Resource estimation processes have been maintained to a high standard. Quantitative Geosciences (QG) have provided ongoing coaching, training, mentoring, and Mineral Resource estimation services on an as required basis since the late 1990’s. This has ensured consistency of process over this time as key site personnel have changed and these consulting services have provided ongoing support to the resource estimation function.
Resource wireframes were used to code the drill intercepts contained within them by coding the raw drillholes for ‘GEOCD’. This flagging allows the selection of data within domains by codes for the purposes of sample analysis and compositing.
All resource interpretation wireframes have been used as hard boundaries.
14.3.6.1 Aurora B
The high priority exploration target, Aurora B, at Stawell was defined and explored through three phased drill programs through the course of H2 2015 and Q1 2016. These drill programs identified a mineralized surface with approximate dimensions of 150m in strike and 150m in dip sitting off the basalt contact. The first Mineral Resource estimation was undertaken after the completion of these programs resulting in a total Inferred Resource of 270,168t @ 3.5g/t Au for 30,385oz of gold.
The Aurora B Model has two ore domains, AB Min (high-grade zone) and AB BIF (low-grade zone). The AB Min Domain has been sub domained into AB Min Flat for the flatly orientated lodes and AB Min Vert for the vertically orientated lodes. The AB Min Flat Lode is approximately 10m wide and occurs over the top of a basalt nose, it dips slightly to the east and has a variable plunge ranging 10° to the south to 10° to the north. The AB Vert Lode is 3-5m wide and dips vertically at 90°, sits proximal to the basalt flanks. The BIF envelops the high grade mineralized zone and thickness varies from 10m to 30m. All lodes strike parallel to the basalt at 315°. An area roughly 230m x 150m has been scoped on a 50m x 50m spacing for conversion to Inferred Resource.
The Hampshire Lode is mostly hosted within sulphidized BIF. Sulphides associated with gold mineralization include arsenopyrite, pyrrhotite (replacing magnetite bands) and pyrite (associated with carbonate alteration and brecciation). Free gold has been observed in quartz veins, chlorite veins and within the chloritized groundmass.
The Waterloo Lode is similar to the Waterloo Lodes on the West Flank; in the Aurora B Area it sits within sediments between the Moray Basalt Nose and the East Basalt Nose. It differs to the West Flank ‘waterloos’ in that BIF can clearly be identified and mineralization is similar to the Hampshire Lode, where the BIF is sulphidized and tends to be associated with gold mineralization. An area 300m x 60m has been modelled, but has insufficient drillhole information for a Mineral Resource estimation. With further drilling, there is the possibility to add this domain to Mineral Resources.
121
| Technical Report | Kirkland Lake Gold |
| December 2016 | Stawell Gold Mines |
The Wonga Style Lode sits 30m to 60m further east of the Hampshire Lode, but dips at a shallower angle of about 60° to the east. An area 190m x 300m has been modelled, but there is insufficient drill hole information for a Mineral Resource estimation. Like the Wonga Deposit, gold mineralization is associated with needle-form arsenopyrite hosted within pre-existing weaknesses in the sediment. In the Aurora B Area this pre-existing weakness appears to be a fault in which a feldspar-porphyry dyke has intruded prior to the mineralization event. These similarities and relative timing leads this to be interpreted as being associated with the later Wonga Gold event rather than the earlier, main Magdala Gold event (~440Ma) with which the Hampshire and Waterloo Lodes are associated. With further drilling, there is the possibility to add this domain to Mineral Resources.
14.3.6.2 Upper South Fault 2
The Upper South Fault 2 (USF2) is earmarked to be a higher grade ore source feeding into the Mine plan from late 2016. Access development into the southern end of the fault block was initiated in early 2015 and has reached the third ore level as of mid-2016. Short ore drives on each level have been developed and are limited by the plunge of the ore between the Upper and Lower South Faults and the laterally offsetting My and Your Faults within the greater fault block. Six diamond drillholes from the 748 level were drilled in February 2016 to infill areas of the previous model, upgrading inferred areas into Indicated through reducing drillhole spacing in strategic areas and improving the structural understanding of the multiply faulted resource. 2016 drilling from the 748 level has closed the drill spacing 20m by 20m, Stage one drilling was constrained by the drilling angle from the 762 drill location and the vertically restricted limits on the ore body. The 2016 drilling was restricted by the limited vertical extent of the ore bodies, lateral separation and drilling angle to the north. The original USF2 Resource Model (2002) focused on the northern area of the USF2 resource and has been used to provide structural guidance for this model. No further drilling for this model is planned at this stage.
The six diamond drill holes completed to June 2016 have upgraded 11,000t of Inferred Resource into the Indicated category with an additional 9,400t of material being dropped out of Inferred category as a result of the new drilling and updated geological interpretation. An overall increase of 1,900oz of gold has been brought into the Indicated category from Inferred with an overall drop of 1,000oz of gold taken out of the model at a 2.3 g/t Au cutoff. The model was compiled from previous data collected throughout the 30 years of modern mining, including diamond drilling, sludge drilling, underground drive mapping and previous cross-sectional interpretation. The geological model consists of three main ore locations, the Central Lode, Dukes Lode Basalt Contact and the Stockworks Lode. The Stockworks Lode was concentrated in the southern end of the model and has been fully exploited by mining.
14.3.6.3 Below SM250
The Below Scotchmans 250 Mineral Resource Model (SM250) includes the northern region of the upper levels in the underground mine environment. Recent drilling in the area has focused on an unmodelled area between the -212 and -250RL above early mine workings. The Below Scotchmans 250 area is in the (Magdala) basalt flank in a structurally complex area where there is horizontal offset of the basalt and the formation of flat lodes over the basalt noses. The Central Lode is bound to the top by the Scotchmans Fault, and a narrow hangingwall lode is defined.
122
| Technical Report | Kirkland Lake Gold |
| December 2016 | Stawell Gold Mines |
The current Below Scotchmans 250 Resource Model (Oct, 2016) has been extended up-dip and now overlaps with the Big Hill Resource Model area (March 2014). Mineralized domains are not shared, however, these are now continuity of the fault surfaces, Scotchmans Fault, Cross Course Fault and Fault 4 between the models, Figure 14-5. The current Below Scotchmans 250 Mineral Resource Model also overlaps the eastern extent of the Federal Albion Model (April, 2012), however, the interpretation of the domains are locally variable as the Federal Albion Model domains are not locally precise in all areas.

The Below Scotchmans 250 (SM 250) Mineral Resource Model covers an area from the 281N to 301N below the Scotchmans Fault down to -300mRL all within fresh rock. The Below Scotchmans 250 Model is the northern extent of the Magdala ore body, with geology dipping to the west. The model area contains the Central and Hangingwall and the Magdala and Federal Basalt Contact as well as the three flat structures (1, 3 and 4).
The addition of nine drill holes in 2016 into the Below Scotchmans 250 Resource area, along with stope and drive development, channel and sludge sampling developed the understanding that the Hangingwall structure is a more dominant continuous structure on the pelite- schist contact and the previously interpreted ‘splay’ structures are actually mineralization attributable to the Hangingwall Lode.
Two diamond holes in the drill program were abandoned as they got stuck up-hole. Hole MD6414 was stuck in puggy material, which has clasts of angular lamprophyre present and is possibly a breccia pipe as this is the second diamond hole in this location to get stuck while drilling. The hole was abandoned less than 10m from target intercept and a gap of 30m remains in the Central Lode/Hangingwall Lode where they are interpreted to splay apart. This remains as a gap in the resource and geological understanding.
123
| Technical Report | Kirkland Lake Gold |
| December 2016 | Stawell Gold Mines |
The October 2016 drilling and resource model update allowed for definition of inferred and indicated mineral resources across multiple lodes, although there was a reduction in metal (-5Koz), which is mainly attributable to depletion. The model was compiled from previous data collected throughout the 30 years of modern mining, including diamond drilling, sludge drilling, underground drive mapping and previous cross-sectional interpretation.
14.3.6.4 Federal Albion South
The Federal Albion South (FAS) was the major mining front for the 2016 mine plan and as such grade control and resource extension drilling has been undertaken over the Mineral Resource to continue defining the extent and tenor of mineralization up-dip. The initial FAS Mineral Resource was produced in February 2014 with a large area of the north end of the model overlapping with the April 2012 Federal Albion Model, with preliminary variography. A subsequent model update in November 2014 incorporated grade control drilling and undertook QA/QC statistical comparisons of the dataset to validate the dataset. This model produced an initial Mineral Reserve over the area and development access on four levels commenced (310; already accessed, 293, 273 and the 253) in early 2015. Another phase of drilling from the 310 exploration cuddy in 2015 defined the Penthouse offset to the South Fault and infilled the drill spacing to the south to approximately 30m spacing up to the -275mRL. The height of the drilling definition is constrained by the maximum angle of drilling from the 310 drill drive. In 2016 drilling was undertaken from the 343 exploration drive drilling east to west and defining further up-dip than previously possible (from -253mRL to -190mRL) when couple from down-hole drilling from the 190mRL Level and was able to define up-dip the previous resource and define a parallel Hangingwall Lode above the Magdala Basalt Flank from the 5120N (45 degree grid) extending to the south.
During 2016, an additional 14 diamond holes were drilled into the FAS project area. This drilling was a combination of grade control and resource definition drilling with Inferred and unclassified areas converted to Indicated status. Historical drill data was present in the 2016 drill areas giving capacity for QA/QC analysis between the data sets and a large area for definition and conversion. Resource conversion approximately matched the depletion for 2016.
14.3.6.5 Moray North
Early drill programs (MD 400 era) targeted the Moray flank. Minimal mineral resource was reported, due to the variable grades and low gold price. With an increased gold price and push to delineate upper levels resources, the Moray Lode was investigated further in 2009 with two drill programs. These programs defined the Central (275RL) and Northern (468RL) areas. Given the narrow, localized nature of the mineralization the project was not considered favorable for further exploration and drill definition. Additionally, the converted resource was not economically mineable in 2009 and the material was not reported in the Company Resource Statement.
In 2016 the Moray Area was revisited as part of the access condition to the 468 Level Mid North Magdala target. As the access condition to the North Moray Lode was now partially available the costings were revisited and the mining on the 433, 456 and 478 Levels proved to be economic and included into the Life of Mine (LOM). Four diamond holes were drilled to convert Inferred Resources to Indicated Resources and build more resource to justify development of the 525 Level.
124
| Technical Report | Kirkland Lake Gold |
| December 2016 | Stawell Gold Mines |
The 2009 drill program also intersected unexpected areas of mineralization in a parallel position to the main volcanogenic envelope, which has been termed the ‘waterloo’ in the Northern Flank Block. The geometry and grade distribution within these targets is not clear due to limited drilling. The ‘waterloo’ and mineralization within the volcanogenic envelope are also observed as potential ounces.
In summary, the latest drill program into Moray Area has shown that the mineralization intersected in the last program is consistent with the previous interpretation. The added drilling information brought about a change in the position of the modelled basalt nose within the Moray Anticline (Northern 468 RL end).
14.3.6.6 Federal Albion
The Mid Magdala Mineral Resource Model (Federal Albion) covers the area from 255N to 295N, and is bounded by the surface or Scotchmans Fault at the top and the South Fault at depth. The geology of the area is generally well recognized as mining activity within the area has been occurring for over 100 years.
At the time of modelling there were thousands of surface and underground diamond drillholes intersecting the ore body at varying intercept spacings. The model consists of six ‘ore lodes’ – four basalt noses (or
‘waterloos’), the Central Lode, and a separated ‘Stockwork’ Lode. Weakly mineralized Volcanogenic material is also modelled.
Given the long mining history of the Magdala ore body, a full ‘depletion’ model does not exist, however, many of the mined voids are modelled. As such, reporting from the model was limited to areas that were known to still be intact and totally unmined and as such additional mineral resources could be identified pending accurate void modelling exercises.
During the 2011/2012 period, an additional 23 drillholes were drilled into the Federal Albion Area. These drillholes were the basis of the April 2012 Model update. This was a combination of grade control and mineral resource definition drilling with Inferred Mineral Resource blocks taken straight to grade control status. There has been no further drilling or model update to the area since 2012.
14.3.6.7 Mariners
The underground Mariners Area represents the down-dip extension/fault off-set of the surface Mariners target which was modelled as part of the Big Hill and Upper Levels Model in April 2014. The Mariners underground area is not a Magdala contact or quartz lode style mineralized system but part of the Scotchmans Fault Zone (SFZ) where mineralization is hosted within shear zones and the whole zone is typified by high carbon content. The prospect has been drilled over several surface and underground campaigns dating back to 1986. The first Mineral Resource estimate and Mineral Reserve was conducted in December 2009 and followed by updates in July 2012 and October 2013. The Mariners Lode has had four mineral resource model updates, the last completed in December 2013. A further six diamond holes were drilled into the Mariners Lode but there was no Mineral Resource model update for this drilling as drill results were disappointing.
At the time of the latest model update in December 2013, there were 72 diamond drillholes coded as part of the geological modelling process. The most noticeable to this model update is the addition of the Curiosity Lode. The Curiosity Lode is similar to the other four lodes defined previously (Spirit, Mariners, New and Opportunity), like these, it strikes roughly 335° and dips at 50° to the west. The Curiosity Lode sits further in the footwall to the Opportunity Lode and has been delineated from the October 2013 Footwall Low-Grade Domain. There has been no further drilling or model update to the area since 2013.
125
| Technical Report | Kirkland Lake Gold |
| December 2016 | Stawell Gold Mines |
14.3.6.8 Big Hill and Upper Levels
The original Big Hill Mineral Resource estimate was completed in 1998, with the next estimate completed in 2012, incorporating new drilling from 2008 and 2012 RC programs, an updated geological interpretation and mineral resource estimation as well as a void model review. The most recent estimate (March, 2014) is a small update to that presented in November 2012, and continues to utilize the same resource parameters for reporting. The underground resource is reported above a 2.0 g/t Au cut-off (see Table 14-4). The March 2014 model update was a small update to the 2012 model, with inclusion of data from the 2013 geotechnical drill information.
Upper Levels is the up-dip extension of the Magdala System, which has been historically mined from underground. It contains basalt contact mineralization, Central Lode mineralization and Stockwork Lode mineralization, all typically seen in the Magdala System. Above the South Fault is the Mariners mineralization, which extends up-dip into the Big Hill Surface Mineral Resource.
| 14.3.7 | BLOCK MODEL DIMENSIONS |
The primary consideration of the 3D model was to provide an adequate level of resolution to cope with all volume related complexity. The 3D wireframes were used to create block model volume constraints for each mineralized zone within the respective models, as indicated in Table 14-3. All block models are rotated to align with the strike of the area being modelled. The details of the rotations applied are shown in Table 14-3.
Block model dimensions are varied based upon the density of the available drilling data and also on the overall geometry of the mineralized structures. The chosen block size represents approximately half the best data spacing in the northing direction and a choice in the vertical and easting dimension controlled by the need to appropriately represent the volume of the wireframes. Additionally, the block model dimensions were constrained to reflect the selective mining unit and the support required for an underground mining operation.
All five Mineral Resource models built in 2016 were constructed as sub block models, earlier models were constructed as partials models. Sub block models are of equal quality to partials models. The reason for the change to sub block model construction is to ensure ease of model translation between software packages, and better reporting functionality for sub-block models. No dip rotation has been applied to the models (also allows for greater software compatibility) and as such, the model RL height has been reduced.
TABLE 14-3 STAWEL MINE BLOCK MODEL DIMENSIONS AND MODEL SET UP
| Method | Block Size E x N x RL (meters) |
Model
Rotation |
Comp Lengt |
Lode | Geocode | Grade Cap Au g/t | |
| AURORA B |
OK |
5x20x10 |
325NW |
1 m |
Hampshire Hampshire Flat Hampshire Verticle WongaStyle BIF LG |
110 111 112 30 310 |
- - - - - |
| USF2 |
OK |
2.5 x 10 x 5 |
320NW |
1 m |
Central Dukes Stockworks |
100 300 600 |
- - - |
126
| Technical Report | Kirkland Lake Gold |
| December 2016 | Stawell Gold Mines |
| Method | Block Size E x N x RL (meters) |
Model
Rotation |
Comp Lengt |
Lode | Geocode | Grade Cap Au g/t | |
| Central Volc | 720 | - | |||||
| BELOW SM 250 |
OK |
2.5 x 10 x 5 |
325NW |
1 m |
Central Hangingwall Magdala Flat 1 Flat 3 Flat 4 LG Volc |
100 400 500 650 660 670 700 |
15 20 20 16 19 18 4 |
| FEDERAL ALBION SOUTH |
OK |
2.5 x 10 x 5 |
320NW |
1 m |
Central Hangingwall Extended Stockworks LG Volc |
100 169 300 630 5 |
- - 22 35 6 |
| MORAY |
OK |
2.5 x 10 x 5 |
320NW/0 |
1 m |
Moray Ore Moray West Volc package |
600 610 660 |
- - - |
| FEDERAL ALBION |
OK |
5 x 10 x 5 |
325NW/-25 |
1 m |
Extended Central Dukes Moonlight Magdala Stockworks Hangingwall Volc Footwall Volc |
300 100 200 400 500 630 710 720 |
25 30 - 20 25 25 12 20 |
| MARINERS
|
OK
|
3 x 10 x 10
|
3240NW/-35
|
1 m
|
Spirit Lode Mariners Lode New Lode Opportunity Lode Curiosity Lode Low-Grade Hangingwall Low-Grade Spirit Low-Grade Mariners Low-Grade New Low-Grade Opportunity Low-Grade Footwall |
110 120 130 140 150 300 310 320 330 340 350 |
21 21 21 25 - - 2 2 2 7 7 |
| BIG HILL
|
OK
|
5x10x5
|
315/0
|
2 m
|
601 Brown 602 Orange 603 Blue 604 Green 605 Purple 606 Grey 607 Teal Links 608 Cyan 610 Yellow 611 Pink Stocks 505 LG Volc Davis 107 Iron Duke 108 Allens 109 Mariners 111 Mariners Splay 501 LG Volc Allens 502 LG Volc Iron Duke 503 LG Volc Mariners 504 LG Volc 3 |
601 602 603 604 605 606 607 608 610 611 505 107 108 109 111 501 502 503 504 |
- 20 - - - - - - 13 4 4 12 - 18 15 - - 4 - |
| 14.3.8 | BLOCK MODEL CODING |
Block models are coded with the key structural/mineralization domains. This process is completed using the MineSight software. The details of the coding also vary by Mineral Resource area and are determined based on the number and geometry of the mineralization domains. Given the block sizes utilized by Stawell Gold Mines relative to the individual structures, multiple domain codes and percentages are stored in each block.
127
| Technical Report | Kirkland Lake Gold |
| December 2016 | Stawell Gold Mines |
| 14.3.9 | DRILLHOLE CODING |
A diamond drillhole set is coded with the key structural/mineralization domains. Importantly, this coding is checked manually by the area geologists to ensure that they match the wireframes created. Where required, some manual adjustment is made and if suspect drillhole locations are noted these drillholes may be excluded from the estimate. These details are included in the documentation for each Mineral Resource area.
| 14.3.10 | COMPOSITING AND STATISTIC |
Compositing of the raw drilling sample data is necessary to establish a single support for the data (length) and to avoid bias when calculating statistics and undertaking any estimation of the data into 3D volumes. A number of items are considered when selecting an appropriate composite length; they include the original support of the raw sample data, the assumed selectivity (and therefore the block size) of the model and the imposed spatial dimensions of the mineralized domains.
The drillhole files are composited down-hole to fixed length composite intervals. The composites are matched to honor the geological domains as coded in the drillhole files.
Composite intervals appear in Geostatistical Parameters .
The choice of composite intervals is made on a model by model basis that will best reflect the block size, data available, geometry of domains and selective mining unit.
The effect of a small number of outlier composite grades or spatially isolated composites may have an undue effect on the estimated block grades within individual domains. The identification of outliers was undertaken using statistical tables, statistical summary charts and an investigation of the composite data in 3D visualization for both mineralized and waste domains.
A number of high cuts were identified as necessary within both mineralized and waste domains. A statistical summary of the mineralized/waste domains, Table 14-4 and their corresponding high cuts Geostatistical Parameters are outlined below.
The data populations within the majority of mineralized domains are positively skewed with moderate variability. The variability is reduced somewhat by high cutting of gold grades in those domains with relatively high coefficients of variation. Alternatively, an outlier restriction function has been applied which allows for a localization of the high grade with a range restriction for its influence, See Table 14-7 STAWELL GOLD MINES Variogram Parameter Table.
Within waste domains, the high cut was applied with the aim of reducing the influence of singular ‘outlier’ high grades whilst allowing any genuine anomalous areas to be represented within the estimation.
128
| Technical Report | Kirkland Lake Gold |
| December 2016 | Stawell Gold Mines |
TABLE 14-4 STATISTICAL SUMMARY BY AREA
| Model | Domain | Number of
Composites |
Minimum Gold Grade g/t Au |
Maximum Gold Grade g/t Au |
Mean Gold Grade g/t Au |
Co-efficient of Variation |
| AURORA B |
110 111 112 30 310 |
363 215 151 169 1,075 |
0.01 0.01 0.01 0.01 0.01 |
50.30 50.30 17.30 7.25 4.00 |
2.63 3.07 1.99 1.57 0.19 |
2.037 2.099 1.546 1.271 1.728 |
| USF2 |
100 300 630 720 |
336 98 182 983 |
0.01 0.01 0.01 0.01 |
28.70 50.00 30.50 64.00 |
2.81 5.13 3.50 0.85 |
1.509 1.552 1.582 5.085 |
| BELOW SM250 |
100 400 500 650 660 670 700 |
326 410 701 170 199 175 22,292 |
0.03 0.01 0.01 0.01 0.01 0.61 0.01 |
45.78 33.40 169.62 23.00 48.80 28.50 166.95 |
2.95 3.47 3.24 3.59 3.71 3.70 0.91 |
1.328 1.175 2.526 0.910 1.414 1.330 3.323 |
| FEDERAL ALBION STATE |
100 169 300 630 5 |
3,193 339 2,156 1,018 38,764 |
0.01 0.01 0.01 0.01 0.01 |
141.63 25.20 110.52 89.69 57.67 |
3.17 2.29 2.56 3.50 0.34 |
1.768 1.575 1.652 1.688 3.482 |
| MORAY |
600 610 660 |
158 40 1,917 |
0.005 0.1 0.005 |
30.83 8.64 44.81 |
2.65 1.41 0.48 |
1.669 1.440 3.250 |
| FEDERAL ALBION |
300 100 200 400 500 710 720 |
1,417 5,578 9 911 1,488 2,504 10,312 |
0.01 0.01 0.01 0.01 0.01 0.01 0.01 |
97.78 141.63 4.60 25.96 169.62 29.90 80.11 |
2.49 2.80 1.01 1.29 2.59 0.65 0.82 |
1.976 1.950 1.903 2.173 2.517 3.771 6.044 |
| MARINERS
|
110 120 130 140 150 300 310 320 330 340 350 |
287 482 822 1,473 276 396 495 957 623 776 834 |
0.01 0.01 0.01 0.01 0.01 0.01 0.01 0.01 0.01 0.01 0.01 |
41.44 44.70 48.71 107.22 12.60 2.12 12.35 5.21 3.61 28.06 30.60 |
1.76 2.31 2.44 2.74 1.69 0.11 0.19 0.24 0.27 0.98 0.52 |
2.333 1.793 1.606 1.795 1.068 2.280 3.206 1.742 1.311 2.380 2.998 |
| BIG HILL
|
601 602 603 604 605 606 607 608 610 611 505 107 108 109 111 501 502 503 504 |
1,493 501 237 59 36 140 74 28 318 30 6,681 405 541 526 74 342 331 585 18 |
0.01 0.01 0.01 0.01 0.01 0.01 0.01 0.01 0.01 0.01 0.01 0.01 0.01 0.01 0.01 0.01 0.01 0.01 0.01 |
72.60 31.94 14.83 9.12 9.85 6.23 6.71 5.15 71.20 64.98 13.99 24.55 12.68 129.60 28.48 2.17 2.51 11.52 1.31 |
2.13 2.27 1.60 1.66 1.32 0.89 1.16 1.07 2.82 3.39 0.18 1.23 1.16 2.91 2.42 0.12 0.17 0.26 0.24 |
1.507 1.244 1.348 0.990 1.265 1.131 1.087 1.023 2.072 3.445 2.599 1.519 1.248 2.114 1.944 1.620 1.547 2.473 1.452 |
129
| Technical Report | Kirkland Lake Gold |
| December 2016 | Stawell Gold Mines |
TABLE 14-5 STATISTICAL SUMMARY FOR HIGH CUT COMPOSITES, g/t Au
| Model | Domain | Number of Composites |
Minimum Gold Grade g/t Au |
Maximum Gold Grade g/t Au |
Mean Gold
Grade g/t Au |
Co-efficient of Variation |
| BELOW SM 250 | 100 400 500 650 660 670 700 |
326 410 701 170 199 175 22,292 |
0.03 0.005 0.005 0.005 0.005 0.01 0.005 |
15 20 21 16 19 18 4 |
2.82 3.42 2.88 3.56 3.51 3.60 0.63 |
1.065 1.102 1.425 0.861 1.175 1.259 1.714 |
| FEDERAL ALBION SOUTH |
169 300 630 5 |
339 2,156 1018 38764 |
0.01 0.01 0.01 0.01 |
25 22 35 6 |
2.29 2.5 3.37 0.31 |
1.575 1.374 1.402 0.242 |
| FEDERAL ALBION |
300 100 400 500 |
1,417 5,578 911 1,488 |
0.01 0.01 0.01 0.01 |
25 30 20 25 |
2.37 2.68 1.27 2.40 |
1.570 1.490 2.100 1.690 |
| MARINERS | 110 120 130 140 310 320 330 340 350 |
287 482 822 1,473 495 957 623 776 834 |
0.01 0.01 0.01 0.01 0.01 0.01 0.01 0.01 0.01 |
21 21 21 25 2 2 2 7 7 |
1.64 2.19 2.36 2.64 0.17 0.23 0.27 0.85 0.47 |
1.937 1.499 1.423 1.458 1.529 1.515 1.227 1.752 2.162 |
| BIG HILL | 601 602 610 611 505 107 109 111 503 |
1,493 501 318 30 6,681 405 526 74 585 |
0.01 0.01 0.01 0.01 0.01 0.01 0.01 0.01 0.01 |
18 20 13 4 4 12 18 15 4 |
2.05 2.24 2.38 1.36 0.17 1.20 2.69 2.15 0.25 |
1.100 1.165 1.046 0.898 2.206 1.285 1.018 1.609 1.883 |
| 14.3.11 | GEOSTATISTICAL PARAMETERS |
For all of the Mineral Resource areas that have been modelled in 3D, gold grades (Au g/t) have been estimated by Ordinary Kriging. Over time, this methodology, when coupled with detailed and robust geological models, provided reliable estimates of in situ gold grade.
The key geostatistical parameters are modelled for each project separately (see Table 14-7 STAWELL GOLD MINES Variogram Parameter Table).
Variography studies have been conducted using MineSight MSDA analysis software. Individual variogram studies are conducted for each domain and modelled separately).
Key variogram parameters, nugget and sill and variogram ranges are modelled on untransformed data. Whilst the estimated values for the nugget and ranges vary for each modelled area, they are generally relatively consistent.
130
| Technical Report | Kirkland Lake Gold |
| December 2016 | Stawell Gold Mines |
The variograms studies have been performed to optimize the Kriging neighborhood as per the methodologies presented in Vann et al (2003). This enables quantitative evaluation of the results of the Kriging to be performed and, as well as enabling the search neighborhoods to be optimized, provides numerical outputs from the Kriging runs (slope of regression of the estimate). The slope of regression is used in part to aid in classification of the Mineral Resource.
Search rotations were applied directly from the variography search orientation. Search distance was given the same ratio as variography range but made much larger than the variography range to ensure that it does not limit the Kriging, and only influences the search directions (Figure 14-6 and Figure 14-7).

The variography is orientated down this plunge (red ellipse) in an anisotropic orientation. Search is given the same orientation with a larger ratio (green ellipsoid).
131
| Technical Report | Kirkland Lake Gold |
| December 2016 | Stawell Gold Mines |

The variography is orientated in the plan of the Domain (red ellipse) in a flat isotropic orientation. Search is given the same orientation with a larger ratio (green ellipsoid)
132
| Technical Report | Kirkland Lake Gold |
| December 2016 | Stawell Gold Mines |

133
| Technical Report | Kirkland Lake Gold |
| December 2016 | Stawell Gold Mines |

134
| Technical Report | Kirkland Lake Gold |
| December 2016 | Stawell Gold Mines |

135
| Technical Report | Kirkland Lake Gold |
| December 2016 | Stawell Gold Mines |
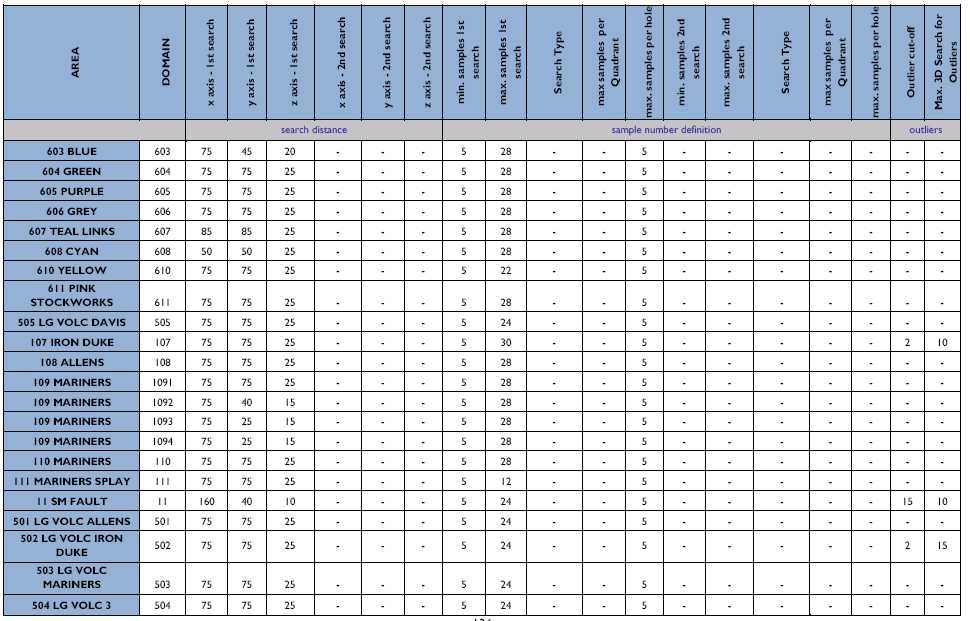
136
| Technical Report | Kirkland Lake Gold |
| December 2016 | Stawell Gold Mines |
TABLE 14-7 STAWELL GOLD MINES VARIOGRAM PARAMETER TABLE

137
| Technical Report | Kirkland Lake Gold |
| December 2016 | Stawell Gold Mines |

138
| Technical Report | Kirkland Lake Gold |
| December 2016 | Stawell Gold Mines |

139
| Technical Report | Kirkland Lake Gold |
| December 2016 | Stawell Gold Mines |
| 14.3.12 | BULK DENSITY |
As per the Stawell Gold Mines core processing flow chart all whole core sample intervals that are sent for assay are bagged and weighed prior to leaving site. The weights of the core are stored in the drillhole database and an apparent dry bulk density for each interval is calculated based upon a theoretical volume for the specific core diameter for each sample interval.
Whilst there are potential limitations in this process given that the volume for each core is based upon the theoretical drill core diameter and the measured length of each interval, it can be demonstrated by reconciliation of stope volumes as surveyed by cavity monitoring systems and tonnage measured by trucked ore that the estimated density applied to specific areas is a reliable estimator of in situ density. A 35-year history of processing and reconciliation supports the density values that are currently being used in the estimates at Stawell Gold Mines.
This apparent density measurement includes some residual moisture, which by measurement has been estimated at approximately 2% or less and is generally not accounted for in the estimates.
Table 14-8 shows the bulk density values that have been applied by Mineral Resource area. Specific details of the data and analysis and assumptions used to derive these values are given in each of the area specific reports.
TABLE 14-8 COMPILATION OF DENSITY g/cm3, APPLIED BY RESOURCE MODEL AREA
| ASSIGNED Density (G/CM3) | |||||
| MODEL | LODE | GEOCODE | FRESH | TRANS | OXIDE |
| AURORA B | Hampshire Flat | 111 | 2.85 | - | - |
| Hampshire Verticle | 112 | 2.85 | - | - | |
| WongaStyle | 30 | 2.89 | - | - | |
| BIF LG | 310 | 2.77 | - | - | |
| USF2 | Central | 100 | 2.75 | - | - |
| Dukes | 300 | 2.90 | - | - | |
| Stockworks | 630 | 2.75 | - | - | |
| LG Volc | 700 | 2.75 | - | - | |
| BELOW SM 250 | Central | 100 | 2.75 | - | - |
| Hangingwall | 400 | 2.70 | - | - | |
| Magdala | 500 | 2.85 | - | - | |
| Flat 1 | 650 | 2.75 | - | - | |
| Flat 3 | 660 | 2.75 | - | - | |
| Flat 4 | 670 | 2.75 | - | - | |
| LG Volc | 700 | 2.75 | - | - | |
| FEDERAL | Central | 100 | 2.70 | 2.30 | 2.10 |
| Hangingwall | 169 | 2.70 | 2.30 | 2.10 | |
| ALBION SOUTH | Extended | 300 | 2.80 | 2.30 | 2.10 |
| Stockworks | 630 | 2.75 | 2.30 | 2.10 | |
| LG Volc | 5 | 2.75 | 2.30 | 2.00 | |
| MORAY | Moray Ore | 600 | 2.85 | - | - |
| Moray West | 610 | 2.85 | - | - | |
| Volc package | 660 | 2.85 | - | - | |
| FEDERAL ALBION | Extended | 300 | 2.80 | - | - |
| Central | 100 | 2.75 | - | - | |
| Dukes | 200 | 2.75 | - | - | |
140
| Technical Report | Kirkland Lake Gold |
| December 2016 | Stawell Gold Mines |
| ASSIGNED Density (G/CM3) | |||||
| MODEL | LODE | GEOCODE | FRESH | TRANS | OXIDE |
| Moonlight | 400 | 2.85 | - | - | |
| Magdala | 500 | 2.85 | - | - | |
| Hangingwall Volc | 710 | 2.75 | - | - | |
| Footwall Volc | 720 | 2.75 | - | - | |
| MARINERS | Spirit Lode | 110 | 2.90 | - | - |
| Mariners Lode | 120 | 2.80 | - | - | |
| New Lode | 130 | 2.80 | - | - | |
| Opportunity Lode | 140 | 2.90 | - | - | |
| Curiosity Lode | 150 | 2.75 | - | - | |
| Low-Grade Hangingwall | 300 | 2.80 | - | - | |
| Low-Grade Spirit | 310 | 2.80 | - | - | |
| Low-Grade Mariners | 320 | 2.80 | - | - | |
| Low-Grade New | 330 | 2.80 | - | - | |
| Low-Grade Opportunity | 340 | 2.80 | - | - | |
| Low-Grade Footwall | 350 | 2.80 | - | - | |
| Breccia | 420 | 2.70 | - | - | |
| BIG HILL | 601 Brown | 601 | 2.70 | 2.30 | 2.10 |
| 602 Orange | 602 | 2.70 | 2.30 | 2.10 | |
| 603 Blue | 603 | 2.70 | 2.30 | 2.10 | |
| 604 Green | 604 | 2.70 | 2.30 | 2.10 | |
| 605 Purple | 605 | 2.70 | 2.30 | 2.10 | |
| 606 Grey | 606 | 2.70 | 2.30 | 2.10 | |
| 607 Teal Links | 607 | 2.70 | 2.30 | 2.10 | |
| 608 Cyan | 608 | 2.70 | 2.30 | 2.10 | |
| 610 Yellow | 610 | 2.70 | 2.30 | 2.10 | |
| 611 Pink Stocks | 611 | 2.70 | 2.30 | 2.10 | |
| 505 LG Volc Davis | 505 | 2.85 | 2.30 | 2.00 | |
| 107 Iron Duke | 107 | 2.85 | 2.30 | 2.15 | |
| 108 Allens | 108 | 2.85 | 2.30 | 2.15 | |
| 109 Mariners | 109 | 2.85 | 2.50 | 2.30 | |
| 111 Mariners Splay | 111 | 2.85 | 2.50 | 2.30 | |
| 501 LG Volc Allens | 501 | 2.85 | 2.30 | 2.10 | |
| 502 LG Volc Iron Duke | 502 | 2.85 | 2.30 | 2.10 | |
| 503 LG Volc Mariners | 503 | 2.85 | 2.30 | 2.10 | |
| 504 LG Volc 3 | 504 | 2.85 | 2.30 | 2.10 | |
| ALL | Basalt | 400 | 2.80 | 2.30 | 2.10 |
| Mine Schist | 1 | 2.80 | 2.30 | 2.10 | |
| Porphyry | 3 | 2.70 | 2.65 | 2.45 | |
| 14.3.13 | MODEL VALIDATION |
Model validation has been completed using several different methods. The first is a visual assessment of the output Kriging statistics and by visualization of the actual samples chosen in the search. Estimation parameters were then adjusted to ensure the right balance of estimation is achieved for each individual domain to match the geology.
The coding end estimation of each domain was reviewed by:
| • | Visualization of blocks in 3D; |
141
| Technical Report | Kirkland Lake Gold |
| December 2016 | Stawell Gold Mines |
|
• |
Visualization of grade estimates, particularly with respect to local reproduction of grades and smoothing; and |
| • | Statistical reproduction- comparison of output block grade with input composite statistics. |
| Statistical comparisons of input data and block model outcomes for the mineralized domains are shown in Table 14-9. |
| TABLE 14-9 MINERALIZED DOMAINS MODEL VALIDATION |
| STAWELL GOLD MINE | MODEL VALIDATION | ||||
| Mean Grade (Au g/t) | |||||
| DOMAIN | Resource
Category |
Undeclust
1.0m comp all holes |
Declust. 1.0m comp. |
Model Average Grade g/t Au |
Model Variance to 1m Comp Au% |
| AURORA B | |||||
| Hampshire Flat | 111 | 2.83 | 2.81 | 3.30 | 17.6% |
| Hampshire Vertical | 112 | 1.75 | 1.78 | 2.88 | 61.9% |
| Wongastyle | 30 | 1.47 | 1.40 | 1.35 | -3.5% |
| BIF LG | 310 | 0.19 | 0.20 | 0.19 | -2.2% |
| USF2 | |||||
| Central | 100 | 2.67 | 2.66 | 2.74 | 3.0% |
| Dukes | 300 | 4.77 | 5.25 | 5.17 | -1.7% |
| Stockworks | 630 | 3.17 | 3.16 | 3.16 | -0.2% |
| LG Volc | 720 | 0.75 | 0.88 | 0.96 | 8.4% |
| SM 250 | |||||
| Central | 100 | 2.95 | 2.96 | 2.59 | -12.5% |
| Hanging Wall | 400 | 3.47 | 3.50 | 2.79 | -20.2% |
| Magdala | 500 | 3.24 | 3.28 | 2.96 | -9.8% |
| Flat 1 | 650 | 3.59 | 3.59 | 3.75 | 4.5% |
| Flat 3 | 660 | 3.71 | 3.69 | 3.14 | -14.8% |
| Flat 4 | 670 | 3.70 | 3.69 | 3.87 | 4.9% |
| LG Volc | 700 | 0.91 | 0.98 | 0.42 | -57.4% |
| FEDERAL ALBION SOUTH | |||||
| Central | 100 All | 3.17 | 3.16 | 2.64 | -16.6% |
| Central | 101 | 2.45 | 2.43 | 2.08 | -14.5% |
| Central | 102 | 3.32 | 3.18 | 2.81 | -11.6% |
| Central | 103 | 2.41 | 2.41 | 2.54 | 5.4% |
| Hanging Wall | 169 | 2.29 | 2.28 | 1.89 | -17.0% |
| Extended | 300 All | 2.50 | 2.55 | 2.68 | 5.2% |
| Extended | 301 | 2.52 | 2.56 | 2.40 | -6.2% |
| Extended | 302 | 2.50 | 2.55 | 2.88 | 12.9% |
| FED ALB STK | 630 | 3.37 | 3.42 | 3.38 | -1.1% |
| LG Volc | 5 | 0.31 | 0.26 | 0.17 | -35.3% |
| MORAY | |||||
| Moray Lode | 600 | 2.65 | 2.65 | 2.62 | -1.2% |
| West Moray | 610 | 1.41 | 1.41 | 0.34 | -76.1% |
| Weak Volc | 660 | 0.48 | 0.66 | 0.55 | -16.9% |
| FEDERAL ALBION | |||||
| Central | 100 | 2.80 | 2.69 | 2.35 | -12.7% |
| Dukes | 200 | 1.01 | 1.06 | 0.91 | -14.3% |
| Extended | 300 | 2.49 | 2.38 | 2.68 | 12.6% |
| Moonlight | 400 | 1.29 | 1.27 | 1.46 | 15.3% |
142
| Technical Report | Kirkland Lake Gold |
| December 2016 | Stawell Gold Mines |
| STAWELL GOLD MINE | MODEL VALIDATION | ||||
| Mean Grade (Au g/t) | |||||
| DOMAIN | Resource
Category |
Undeclust
1.0m comp all holes |
Declust. 1.0m comp. |
Model Average Grade g/t Au |
Model Variance to 1m Comp Au% |
| Magdala | 500 | 2.59 | 2.40 | 2.18 | -9.1% |
| HW Volc | 710 | 0.65 | 0.60 | 0.65 | 8.0% |
| Volc | 720 | 0.82 | 0.76 | 0.76 | 0.5% |
| MARINERS | |||||
| Spirit | 110 | 1.77 | 1.65 | 2.51 | 41.7% |
| Mariners | 120 | 2.25 | 2.17 | 3.05 | 35.9% |
| New | 130 | 2.44 | 2.37 | 2.39 | -2.2% |
| Opportunity | 140 | 2.74 | 2.64 | 2.33 | -14.8% |
| Curiosity | 150 | 1.67 | 1.67 | 1.89 | 13.3% |
| LG HW | 300 | 0.11 | 0.11 | 0.12 | 7.1% |
| LG Spirit | 310 | 0.19 | 0.17 | 0.19 | -0.1% |
| LG Mariners | 320 | 0.24 | 0.23 | 0.24 | 1.1% |
| LG New | 330 | 0.27 | 0.27 | 0.24 | -9.9% |
| LG Opportunity | 340 | 0.96 | 0.83 | 0.40 | -58.5% |
| LG FW | 350 | 0.52 | 0.47 | 0.48 | -7.6% |
| BIG HILL | |||||
| 601 Brown | 601 | 2.13 | 2.04 | 1.92 | -5.8% |
| 602 Orange | 602 | 2.27 | 2.24 | 2.10 | -6.6% |
| 603 Blue | 603 | 1.60 | 1.61 | 1.56 | -3.3% |
| 604 Green | 604 | 1.66 | 1.69 | 1.77 | 4.2% |
| 605 Purple | 605 | 1.32 | 1.28 | 1.15 | -11.3% |
| 606 Grey | 606 | 0.89 | 0.90 | 0.90 | 0.4% |
| 607 Teal Links | 607 | 1.16 | 1.20 | 1.09 | -9.5% |
| 608 Cyan | 608 | 1.07 | 1.08 | 1.09 | 1.2% |
| 610 Yellow | 610 | 2.82 | 2.36 | 2.48 | 5.0% |
| 611 Pink Stockworks | 611 | 3.39 | 1.40 | 1.43 | 1.9% |
| 505 LG Volc Davis | 505 | 0.18 | 0.17 | 0.16 | -3.2% |
| 107 Iron Duke | 107 | 1.23 | 1.20 | 1.14 | -5.1% |
| 108 Allens | 108 | 1.16 | 1.18 | 1.19 | 0.8% |
| 109 Mariners | 109 | 2.91 | 2.72 | 2.63 | -3.6% |
| 110 Mariners | 110 | 2.00 | 2.01 | 2.10 | 4.5% |
| 111 Mariners Splay | 111 | 2.42 | 2.29 | 1.58 | -44.7% |
| 11 SM Fault | 11 | 0.33 | 0.33 | 0.28 | -18.0% |
| 501 LG Volc Allens | 501 | 0.12 | 0.12 | 0.15 | 16.4% |
| 502 LG Volc Iron Duke | 502 | 0.17 | 0.17 | 0.15 | -16.6% |
| 503 LG Volc Mariners | 503 | 0.26 | 0.25 | 0.24 | -6.3% |
| 504 LG VOLC 3 | 504 | 0.24 | 0.17 | 0.19 | 11.9% |
The mineralized domain comparisons display some variation between input and outcome average grades when the total domain is reported. The variations in grade occur in areas that generally are poorly informed and in portions of domains that represent the margins of the modelling area.
143
| Technical Report | Kirkland Lake Gold |
| December 2016 | Stawell Gold Mines |
| 14.3.14 | MINERAL RESOURCE CLASSIFICATION |
The classification of Indicated and Inferred Mineral Resource material is based on geological confidence, slope of regression analysis and model validation results. The practice adopted at Stawell Gold Mines uses general guidelines for classification that utilize the following information:
| • |
Drilling density; |
| • |
Drillhole spacing and sample locations; |
| • |
Stage of development; ore development and final data gathering in place; |
| • |
Demonstrated geological continuity of structures and mineralized domains; |
| • |
Slope of regression of the estimate analysis (calculated value during the Kriging Process); and |
| • |
Consideration has been given to the estimation technique and the risks associated with extrapolation of sample data. |
| 14.3.15 | LOGGING |
The drilling data provided for the Stawell Underground mineral resource estimate is collected over a period of 100-years and thus the drilling data base contains data of various levels of descriptive explanations of the geology. Underground drill-hole data has been collected over the last 30-years, all with descriptive explanations of observed geology. The geological logging code has essentially remained the same over the past 20-years which enable consistency in geological interpretation.
The logging information was considered for each model area and is of sufficient detail and quality to be used in the estimation at the current level of confidence.
| 14.3.16 | DATA SPACING AND DISTRIBUTION |
The Stawell underground Mineral Resource model areas were subject to varying drillhole density and sample locations in relation to the lode geometry. In most domains the drilling was of regular spacing and sufficient density closer to existing infrastructure but subject to decreasing densities and irregular spacing further away. Where the data spacing is sparser, the estimation in these areas was considered to be higher risk and is classified with less confidence. For classification purposes each mineralized domain was considered individually and where sufficient data density was present a classification solid was extruded.
Data spacing requirements are different for each model and drill spacing requirements for each model is considered individually. The data correlation as modelled by the variography gives the minimum drill spacing for confidence of correlation between holes. In areas of varying domain geometry, such as in proximity to faults, tighter drill spacing is required.
144
| Technical Report | Kirkland Lake Gold |
| December 2016 | Stawell Gold Mines |
| 14.3.17 | ORIENTATION OF DATA IN RELATION TO GEOLOGICAL STRUCTURE |
The orientation of the Magdala mineralization is interpreted to dip to the west between 50º and 85º. The drilling is considered to be appropriately targeted for this geological orientation. Where drillholes are considered too oblique to the interpreted lode they have been excluded from the modelling and estimation and are noted in the respective model reports.
| 14.3.18 | GEOLOGICAL INTERPRETATION |
The geological interpretation of the Stawell Underground Mineral Resource areas were undertaken by Company geologists. The interpretations were peer reviewed by the Company’s Senior Resource Geologist who believes that they form a reasonable interpretation within the limits of the available data. The Authors agree with Kirkland Lank Gold’s Senior Resource Geologist’s conclusions.
| 14.3.19 | DEPOSIT DIMENSIONS |
The mineralized portion of the Stawell underground deposit extends down to -1800m RL. However, the remnant retreat of the Stawell Gold Mines, which commenced at the end of 2012 saw the closure of the lower decline and decommissioning of the lower ventilation system. The classification of Mineral Resource was adjusted to reflect this change in extractive availability and all Mineral Resource previously reported below the -900mRL was depleted. All Mineral Reserves below the -900mRL were mined.
The dimensions of the mineralization are adequately defined by the available drilling with acceptable extensions beyond data.
| 14.3.20 | MOISTURE |
Moisture determinations performed on RC chips immediately upon delivery to surface showed in-situ moisture contents to vary between 2% and 20%. After air-drying for two days (average exposure of sample to air before sampling) moisture contents varied from 0.5% to 2.5% . In-situ moisture is directly related to clay percentage (and therefore parent lithology) and is not directly linked to depth.
Estimates have been made on the basis of dry tonnes.
| 14.3.21 | EXTERNAL FACTORS AFFECTING EXTRACTION |
Mining and extraction of the Magdala Mineral Resources and Reserves has been continuous since 1981. The Authors are not aware of any known environmental, permitting, legal, title, socio-economic, political or other issues that will prevent extraction of the remaining existing Mineral Resources other than permitting requirements for the Big Hill Surface Project, as further described in section.
Stawell Gold Mines has been able to carry out its mining activities as defined by current Work Plans and approvals without intervention since 1981.
145
| Technical Report | Kirkland Lake Gold |
| December 2016 | Stawell Gold Mines |
| 14.3.22 | BULK DENSITY |
The bulk density factors used in this estimate are derived from previous data, and more recent data from diamond core intervals.
| 14.3.23 | CLASSIFICATION |
All material within the mineral resource interpretation has been classified to represent the opinion of the Authors with regard to the risk in the Mineral Resource estimated. Within the mineralized domains that have been defined it is assumed that some of the material will form dilution to the mining of higher grade material. The classification of the Stawell Underground Mineral Resource into Measured, Indicated and Inferred Mineral Resources as set out below reflects the Authors’ view of this deposit as it is currently defined.
| 14.3.24 | SELECTIVITY ASSUMPTIONS |
The Mineral Resource estimate contains implicit assumptions of mining selectivity represented by the block size defined for each model (Y x X x Z).
| 14.3.25 | RESOURCE AUDITS OR REVIEWS |
No Mineral Resource audits or reviews have been undertaken on the current Western Flank Underground Mineral Resource in 2016.
A high-level independent review of the Eastern Flank Aurora B resource modelling parameters was undertaken by Mike Stewart from QG Group in March 2106. Consideration of material included into the Inferred category of classification was reviewed and determined appropriate to the geological understanding of the Aurora B Eastern Flank mineralization.
| 14.3.26 | DISCUSSION OF RELATIVE ACCURACY/CONFIDENCE |
At this stage no quantitative testing of the accuracy of the estimate or establishment of confidence limits has been undertaken.
| 14.3.27 | MINERAL RESOURCE STATEMENT |
The total Mineral Resource inventory for Stawell Gold Mines as at December 31, 2016 is listed in Table 1.1.
The Mineral Resource Statements account for depleted Mineral Resources up to December 31, 2016 as a result of mining activities.
The depletion was carried out using underground development, stoping solids, historical voids as well as an existing pit surface (Davis). The as mined solids were taken up to December 31, 2016.
The Stawell Gold Mines classified Mineral Resource statements for Stawell Underground is tabulated below in Notes:
146
| Technical Report | Kirkland Lake Gold |
| December 2016 | Stawell Gold Mines |
. Cut-off grades applied to the resource was variable depending upon width, mining method and ground conditions. Cut-off grades used for Mariners and Upper Levels Mineral Resource outside of current pit optimization is 2.0 g/t Au. A cut-off grade of 2.3 g/t Au was applied to all remaining underground resources.
The Stawell Gold Mines classified Mineral Resource statements for Stawell surface is tabulated below in Notes:
1. All Mineral Resources have been estimated in accordance with CIM Standards (2014).
. Surface Mineral Resource is constrained by current Big Hill pit optimization with a cut-off grade of 0.35 g/t Au
Stawell Gold Mines Mineral Resources between January 1, 2014 and December 31, 2016 are reported as inclusive of Mineral Reserves.
There are no known situations where the Mineral Resource estimate outlined above could be materially affected by environmental, permitting, legal, title, taxation, socio-economic, marketing or political or other relevant factors. There is, however, some risk with any gold Mineral Resource estimates where the gold price may affect the overall economic viability of a Mineral Resource.
TABLE 14-10 STAWELL GOLD MINES RESOURCE AS AT DECEMBER 31, 2016
| Stawell Gold Mines Resource | |||
| Classification | Tonnes (kt) | Gold Grade g/t | Ounces Gold (koz) |
| Measured | 81 | 3.67 | 10 |
| Indicated | 3624 | 2.03 | 236 |
| Total (Measured and Indicated only) | 3,705 | 2.07 | 246 |
| Inferred | 1,127 | 2.89 | 105 |
Notes:
| 1. |
All Mineral Resources have been estimated in accordance with CIM Standards (2014). | |
| 2. |
Mineral Resources are inclusive of Mineral Reserves. | |
| 3. |
Mineral Resources were estimated using the following parameters: |
| (a) |
Gold price of US$1,200/oz (A$1,500/oz); | |
| (b) |
Cut-off Grade of 0.35 g/t Au for Big Hill surface Mineral Resources; and | |
| (c) |
Cut-off Grade applied was variable for underground Mineral Resources. Grades used were as follows: | |
| – 2.0g/t Au for Mariners and Big Hill outside of current
pit optimisation, – 2.3g/t Au for all remaining underground Mineral Resources. |
| 4. |
Underground and surface Mineral Resource estimates were prepared under the supervision of Mr John Winterbottom, MAIG. | |
| 5. |
The QP believes that the stated Mineral Resources is a realistic inventory of mineralization which, under the assumed technical, political, legal, environmental and economic development conditions, is economically extractable. If these conditions change then the Mineral Resources, either in whole or part, may not be economically extractable. | |
| 6. |
The quantity and grade of the reported Inferred Mineral Resources are uncertain in nature and there has been insufficient exploration to define the Inferred Mineral Resources as Indicated or Measured Mineral Resources and it is uncertain if further exploration will result in upgrading them to an Indicated or Measured Mineral Resource category. | |
| 7. |
Mineral Resources are rounded to 1,000t, 0.01 g/t Au and 1,000oz. Minor discrepancies in summations may occur due to rounding. | |
| 8. |
Mineral Resources that are not Mineral Reserves do not have demonstrated economic viability. |
147
| Technical Report | Kirkland Lake Gold |
| December 2016 | Stawell Gold Mines |
The Mineral Resource estimate for the Stawell Underground Mine is listed in Notes:
TABLE 14-11 STAWELL GOLD MINES UNDERGROUND RESOURCES AS AT DECEMBER 31, 2016
| Stawell Underground Resources | |||
| Classification | Tonnes (kt) | Gold Grade g/t | Ounces Gold (koz) |
| Measured | 81 | 3.67 | 10 |
| Indicated | 654 | 3.6 | 76 |
| Total (Measured and Indicated only) | 735 | 3.64 | 86 |
| Inferred | 944 | 3.21 | 97 |
Notes:
| 1. |
All Mineral Resources have been estimated in accordance with CIM Standards (2014). | |
| 2. |
Mineral Resources are inclusive of Mineral Reserves. | |
| 3. |
Mineral Resources were estimated using the following parameters: |
| (a) |
Gold price of US$1,200/oz (A$1,500/oz); and | |
| (b) |
Cut-off Grade applied was variable for underground Mineral Resources. Grades used were as follows; | |
| – 2.0 g/t Au for Mariners and Big Hill outside of
current pit optimisation, and – 2.3 g/t Au for all remaining underground Mineral Resources. |
| 4. |
Underground and surface Mineral Resource estimates were prepared under the supervision of Mr John Winterbottom, MAIG. | |
| 5. |
The QP believes that the stated Mineral Resources is a realistic inventory of mineralization which, under the assumed technical, political, legal, environmental and economic development conditions, is economically extractable. If these conditions change then the Mineral Resources, either in whole or part, may not be economically extractable. | |
| 6. |
The quantity and grade of the reported Inferred Mineral Resources are uncertain in nature and there has been insufficient exploration to define the Inferred Mineral Resources as Indicated or Measured Mineral Resources and it is uncertain if further exploration will result in upgrading them to an Indicated or Measured Mineral Resource category. | |
| 7. |
Mineral Resources are rounded to 1,000t, 0.01 g/t Au and 1,000oz. Minor discrepancies in summations may occur due to rounding. | |
| 8. |
Mineral Resources that are not Mineral Reserves do not have demonstrated economic viability. |
The Mineral Resource estimate for the Big Hill Surface Project at Stawell Gold Mines is listed in Notes:
| 9. |
All Mineral Resources have been estimated in accordance with CIM Standards (2014). |
TABLE 14-12 BIG HILL SURFACE RESOURCES ESTIMATION AS AT DECEMBER 31, 2016
| Big Hill Surface Resources | |||
| Classification | Tonnes (kt) | Gold Grade g/t | Ounces Gold (koz) |
| Measured | 0 | 0 | 0 |
| Indicated | 2,971 | 1.68 | 160 |
| Total (Measured and Indicated only) | 2,971 | 1.68 | 160 |
| Inferred | 183 | 1.24 | 7 |
Notes:
148
| Technical Report | Kirkland Lake Gold |
| December 2016 | Stawell Gold Mines |
| 10. |
All Mineral Resources have been estimated in accordance with CIM Standards (2014). | |
| 11. |
Mineral Resources are inclusive of Mineral Reserves. | |
| 12. |
Mineral Resources were estimated using Cut-off Grade of 0.35 g/t Au and a gold price of US$1,200/oz (A$1,500/oz) | |
| 13. |
Surface Mineral Resource estimates prepared under the supervision of Mr John Winterbottom, MAIG. | |
| 14. |
The QP believes that the stated Mineral Resources is a realistic inventory of mineralization which, under the assumed technical, political, legal, environmental and economic development conditions, is economically extractable. If these conditions change then the Mineral Resources, either in whole or part, may not be economically extractable. | |
| 15. |
The quantity and grade of the reported Inferred Mineral Resources are uncertain in nature and there has been insufficient exploration to define the Inferred Mineral Resources as Indicated or Measured Mineral Resources and it is uncertain if further exploration will result in upgrading them to an Indicated or Measured Mineral Resource category. | |
| 16. |
Mineral Resources are rounded to 1,000t, 0.01 g/t Au and 1,000oz. Minor discrepancies in summations may occur due to rounding. | |
| 17. |
Mineral Resources that are not Mineral Reserves do not have demonstrated economic viability. |
149
| Technical Report | Kirkland Lake Gold |
| December 2016 | Stawell Gold Mines |
15 MINERAL RESERVES
| 15.1 | MINERAL RESERVES UNDERGROUND |
The underground operation and processing plant are currently on care and maintenance. As such, no underground Mineral Reserves have been reported given the capital cost requirements of recommencing the operation is now required to be factored into Mineral Reserve costings.
| 15.2 | MINERAL RESERVES BIG HILL SURFACE |
The Mineral Reserves estimate for the Stawell Big Hill Surface Project is listed in Table 15-1.
TABLE 15-1 BIG HILL SURFACE MINERAL RESERVES CLASSIFICATION – EFFECTIVE DECEMBER 31, 2016
| Classification | Tonnes (kt) | Gold Grade g/t | Ounces Gold (koz) |
| Proven | - | - | - |
| Probable | 2,700 | 1.51 | 132 |
| Total Mining Reserves | 2,700 | 1.51 | 132 |
Notes:
| 1. |
All Mineral Reserves have been estimated in accordance with CIM Standards (2014). |
| 2. |
Mineral Reserves were estimated using the following economic parameters: |
| (a) |
Gold price of US$1,200/oz (A$1,500/oz); | |
| (b) |
Cut-off Grade applied was 0.4 g/t Au. |
| 3. |
Big Hill Surface Mineral Reserve estimates were prepared under the supervision of Ian Holland, FAusIMM. |
| 4. |
Mineral Reserves are rounded to 1,000t, 0.01 g/t Au and 1,000oz. Minor discrepancies in summations may occur due to rounding. |
| 15.2.1 | MINERAL RESERVE ESTIMATE |
The following sections outline the process undertaken to produce Mineral Reserve estimates from the available Mineral Resources for the Big Hill Surface. This section contains descriptions of Mineral Reserve design parameters, recovery and unplanned dilution factors, cut-off grades and depletion for mined material. Big Hill Surface Reserves are subject to project permitting conditions. There is some risk that permitting conditions will not be realized and Mineral Reserve Estimates will need to be modified.
| 15.2.2 | MINE RESERVE DESIGN |
Big Hill Surface Mineral Reserve estimates are based upon a Lerchs-Grossman algorithm optimization technique utilizing Gemcom’s Whittle 4X software. This produced a series of nested pit shells utilizing a range of parameters from slope angles, Mining Cost Adjustment Factors (MCAF’s) all utilizing a diluted block model. Mineral Reserve numbers are from a final pit design based on a suitable “Whittle” shell.
150
| Technical Report | Kirkland Lake Gold |
| December 2016 | Stawell Gold Mines |
| 15.2.3 | BIG HILL SURFACE DESIGN AND RESERVE PARAMETERS |
Big Hill Surface Mineral Reserves were created utilizing a diluted block model, minimum ore block size (1.5m minimum mining width) and maximum mining block size of 10m. Pit benches are designed at 5m with 2.5m mining flitch.
Final Pit Design parameters are as follows:
- Ramp width 12m single, 25m double;
- Ramp grade 1:9 with 1:10 localized maximum;
- Batter Height 20m;
- Berm width 10m weathered zones 8.5m minimum;
- Batter Slope 60°; and
- Overall Slope Angle 42.9°.
In order to estimate the expected dilution and ore recovery for Big Hill Surface Mineral Reserves, Datamine Mineable Shape Optimizer software (MSO) was used to create a diluted model that mimics what an engineer or geologist might do when generating dig outlines on adjacent sections. This generates optimal mining ore blocks that take into account footwall and hangingwall dilution skins to ensure mining areas remain above cutoff grade, Gold Cut-Off Grades .
The following parameters are used to define a potentially mineable ore block:
- Diluted Cut-Off grade (0.4 g/t Au);
- Near and far wall dilution skin (0.5m and 0.5m);
- Minimum ore block size (1.5m minimum mining width); and
- Maximum mining block size (10m).
The subsequent MSO wireframes were used as a guide for a new block model in which the diluted grades generated using the MSO were added to the new block model prior to the Whittle evaluation and final design. The subsequent dilution, grades and recovery are displayed below.
TABLE 15-2 MINEABLE SHAPE OPTIMISER – BIG HILL DILUTION
| Undiluted | Diluted | |
| Tonnes (>0.4 g/t Au) | 8,106,899 | 9,958,474 |
| Avg. Grade g/t Au | 1.70 | 1.48 |
| Avg. Dilution g/t Au | - | 0.15 |
| Avg. Mining Recovery | - | 0.07 |
| 15.2.4 | GOLD CUT-OFF GRADES |
Table 15-3 shows the calculated lower cut-off grade used in the estimation of the Mineral Reserves. Cost assumptions are based on the 2017 budget.
Surface cut-off grade is used for determination of ore and waste based predominately on process, administration, royalty and differential mining cost to allow for haulage to the ROM.
151
| Technical Report | Kirkland Lake Gold |
| December 2016 | Stawell Gold Mines |
TABLE 15-3 GOLD CUT-OFF GRADE, BIG HILL
| Description | g/t Au |
| Big Hill Surface | 0.44 |
| 15.2.5 | DEPLETION AND RESULTS |
The evaluation models have been depleted for material mined up to January 1, 2017.
| 15.3 | MINERAL RESERVE ESTIMATE SURFACE STOCKPILES |
There is no Mineral Reserve estimate for Stawell surface low-grade Stockpiles. The surface low-grade Stockpiles were processed by the Stawell processing facility in 2016 and are now depleted.
152
| Technical Report | Kirkland Lake Gold |
| December 2016 | Stawell Gold Mines |
16 MINING METHODS
Kirkland Lake Gold’s Australian operations currently have the Stawell Gold Mine and processing facility on care and maintenance. No further underground mining is intended at the operation until an underground Mineral Reserve is reported. Currently an exploration program is underway with intent to define mineralization on the Eastern Flank, (Section 9).
Surface mining operations are planned around a conventional excavator and truck operation with light blasting activity only required in the very lower portion of the excavation. Additional controls are planned for air quality and amenity considerations around hours of operation, benching configuration, dust suppression and equipment specifications.
For additional details on the Big Hill Feasibility study, beyond those required by the scope of this technical report, the reader is referred to Basile, D. (2014).
| 16.1 | MINE DESIGN SURFACE MINING |
| 16.1.1 | MINING METHOD DESCRIPTION |
Surface mining activities are planned as an adaptation of conventional open cut mining where benching techniques of predominately rip and dig or free dig mining has been proposed. In order to provide best practice mitigation measures for air quality and amenity, the majority of operational activity will occur as low as practicable in the pit to enable upper benches to provide an element of shielding, see Figure 16-1 below. In order to further preserve amenity operating hours are daylight hours only Monday to Friday. This is in order to appease community relations, as the proposed pit sits adjacent to the township of Stawell.

It is expected that much of the Big Hill Surface Mineral Reserve will be excavated without blasting as the majority of surface drill holes rank in the “Easy Digging” to “Easy Ripping” categories of the Pettifer and Fookes Excavatability Assessment. Some areas at depth reach the “Extremely Hard Ripping” category but these are the minority and light blasting is planned to be applied to these areas.
153
| Technical Report | Kirkland Lake Gold |
| December 2016 | Stawell Gold Mines |
Surface mining plans commence with the excavation of the North Pit and a two stage cutback approach to mining of the South Pit with waste material from the South Pit being used to reconstruct the North Pit. Surface mining fleets at peak operation are to consist of five 90t trucks, a 120t excavator and a 190t excavator.
| 16.1.2 | SURFACE MINING SCHEDULE |
Mining schedules for the extraction of the North and South Pits at Big Hill are based around levels of extraction to ensure that suitable environmental conditions can be met at any point in time. Extensive air quality and noise modelling of project parameters have provided a schedule quantity that can be operated within suitable parameters. This schedule is presented below in Figure 16-2.

| 16.1.3 | SURFACE MINING EQUIPMENT |
Mining equipment requirements for extraction of the North and South Pits at Big Hill are based on first principle productivities using excavator specifications and benchmarks from existing operations, Table 16-1.
TABLE 16-1 PRODUCTIVITY ESTIMATES
| Excavator Productivity | Unit | Value | Value |
| Excavator Type | EX1200 | EX1900-6-BH | |
| Truck Type | Cat_777F | Cat_777F | |
| Digger Configuration | Backhoe | Backhoe | |
| Material Detail | |||
| Dry Density | t/BCM | 2.1 | 2.1 |
| Moisture Content | % | 2% | 2% |
| Swell Factor | % | 15% | 15% |
154
| Technical Report | Kirkland Lake Gold |
| December 2016 | Stawell Gold Mines |
| Excavator Productivity | Unit | Value | Value |
| Wet Density Loose | t/m^3 | 1.86 | 1.86 |
| Wet Bank Density | t/m^3 | 2.14 | 2.14 |
| Shovel Details | |||
| Bucket Heaped Cap. | m^3 | 6.7 | 9.6 |
| Fill Factor | % | 85% | 85% |
| Bucket Cap. Volume | BCM | 5.0 | 7.1 |
| Bucket Cap. Weight | t | 14.7 | 19.2 |
| Bucket Cap. Weight | BCM | 6.9 | 9.0 |
| Bucket Cap. Adopted | BCM | 5.0 | 7.1 |
| Truck Details | |||
| Tray Capacity | m^3 | 60.2 | 60.2 |
| Truck Fill Factor | % | 95% | 95% |
| Volume Limit | BCM | 49.7 | 49.7 |
| Rated Payload | t | 90.7 | 90.7 |
| Assumed Overload | % | 0 | 0 |
| Adjusted Payload | t | 90.7 | 90.7 |
| Weight Limit | BCM | 42 | 42 |
| Adopted Capacity | BCM | 42 | 42 |
| Min. Bucket Fill | % | 25% | 25% |
| Calculated Passes Per load | 9 | 6 | |
| Calculated Passes Per load | (rounded) | 9 | 6 |
| Actual Truck Load | BCM | 42 | 42 |
| Actual Truck Load | t | 90.7 | 90.7 |
| Dump Time | min | 1.2 | 1.2 |
| Excavator Productivity | |||
| Cycle Time | sec | 25 | 25 |
| Efficiency Factor | % | 100% | 100% |
| 1st Pass | sec | 9 | 9 |
| Truck Exchange | sec | 38 | 38 |
| Loading Time | min | 4.12 | 2.87 |
| Max. Productivity | BCM/OH | 617 | 886 |
| Effective Utilisation of operating hours | % | 73% | 76% |
| Productivity | BCM/OH | 450 | 670 |
| Productivity | t/OH | 945 | 1,407 |
The productivity estimates for each excavator is matched against the mining schedule to determine the required number of excavators. Figure 16-3 below illustrates the total excavator capacity for an EX1900 and EX1200 versus the mining schedule.
155
| Technical Report | Kirkland Lake Gold |
| December 2016 | Stawell Gold Mines |

Haulage of ore and waste were modelled in TALPAC software to determine travel time and fuel consumption. Travel time and fuel consumptions were calculated for all haulage routes from each bench to the ROM or waste dump.
In addition, travel times were used to determine the productivity of each truck and thus truck requirements were matched to the mining schedule. Figure 16-4 below illustrates the haul truck requirements.

Ancillary equipment requirements for the project are based upon best environmental management practices and include additional bulldozers to reduce drill and blast requirements as well as additional water cart capacity.
156
| Technical Report | Kirkland Lake Gold |
| December 2016 | Stawell Gold Mines |
17 RECOVERY METHODS
| 17.1 | MINERAL PROCESSING |
The gold processing facilities utilized at SGM comprise a standard Carbon-In-Leach (CIL) gold recovery circuit following crushing and grinding and sulphide flotation. The treatment plant consists of five unit processes Figure 17-1. These are:
- size reduction (crushing and milling);
- gravity gold recovery;
- flotation/ultra-fine grinding;
- leach-adsorption; and
- gold recovery.
Geographically the plant can be split up into five main areas. These are:
- the primary crushing circuit;
- the milling circuit;
- the flotation/ultra-fine grinding circuit;
- the leach-adsorption circuit; and
- the elution/electrowinning circuit.
A current processing flow sheet is shown in Figure 17-1. A history of tonnage and grade throughput for the processing facilities is shown in Section 6 of this report.
Coarse gold (up to 30% of the gold in mill feed) was recovered from the milling circuit in self-cleaning centrifugal gravity concentrators. Approximately 75% of the ore requires further liberation of the gold from sulphides and this is achieved in a two stage flotation circuit where gold bearing sulphides (pyrite, arsenopyrite and some pyrrhotite) are concentrated. The sulphide was ground to approximately 0.01mm in an ultra-fine grinding mill to liberate enclosed gold (up to 20% of the gold in mill feed). The ground sulphides and flotation tail are recombined and sent to the CIL circuit.
Stawell ore exhibits various degrees of preg-robbing of gold. Preg-robbing occurs when naturally occurring carbon species (graphite) in the ore rob gold from the pregnant liquor in the leach circuit, thus reducing the gold recovery. To combat this, kerosene was added to foul the naturally occurring carbon before it enters the leach circuit and a simple preg-rob index developed at SGM indicates the rate of addition needed for the kerosene to be most effective.
157
| Technical Report | Kirkland Lake Gold |
| December 2016 | Stawell Gold Mines |

158
| Technical Report | Kirkland Lake Gold |
| December 2016 | Stawell Gold Mines |
Infrastructure and systems to meet all current and projected energy, process water and consumable requirements are in place and operating with no expected impairments over the course of the expected mining.
Total gold recovered in the reporting period is given in Table 17-1.
TABLE 17-1 STAWELL GOLD MINES TOTAL GOLD RECOVERED JANUARY 2016 TO DECEMBER 2016
| YEAR | PERIOD | Average. | Recovered. |
| REC % | OUNCES | ||
| 2016 | JAN - DEC | 80.90 | 32,300 |
The Stawell Gold Mine site inclusive of the processing plant transitioned into care and maintenance as of the December 13, 2016.
159
| Technical Report | Kirkland Lake Gold |
| December 2016 | Stawell Gold Mines |
18 PROJECT INFRASTRUCTURE
The Stawell Gold Mines has been operating for over 30 years and therefore has all major infrastructures in place.
Milling infrastructure is related to the Stawell Gold Mines processing facility, which is outlined above in Sections 5 and 17.
| 18.1 | SURFACE INFRASTRUCTURE |
Stawell Gold Mines facilities are extensive and representative of a modern gold mining operation (see Figure). The main site location comprises:
- Office and administration complex;
- Store and storage facilities;
- Heavy underground equipment workshop and light vehicle workshop;
- Surface run of mine stockpiles;
- Gold processing plant and associated facilities;
- On site assay and metallurgical test work laboratory;
- Four freshwater storage dams to store rainfall run-off and mine dewatering which is used in the plant or around the mine site;
- Power for the plant is fed from a main transformer located adjacent to the administration complex;
- A batch plant for preparing shotcrete for underground support; and
- Core farm and core processing facility,
Surface facilities include the gold processing plant, offices, core shed, laboratory and workshops. Larger infrastructure onsite includes tailings dams covering 96ha and receiving all tailings from the processing plant. Four freshwater dams occur throughout the mine lease.
Main haul road facilities are yet to be constructed for surface mining activities.
| 18.2 | TAILINGS AND STORAGE FACILITIES |
Since operations began in 1984, three tailings dams have been constructed and operated, two of which have since been decommissioned:
- Reserve Tailings Dam has been decommissioned and rehabilitated to a clay target shooting complex;
- Tailings Storage Facility 1 (TSF1) has been decommissioned and partially rehabilitated; and
- Tailings Storage Facility 2 (TSF2) remains in operational.
160
| Technical Report | Kirkland Lake Gold |
| December 2016 | Stawell Gold Mines |
All dams were constructed as earthen embankments with upstream sub-aerial deposition and are subject to annual integrity and operational review by an independent industry expert. TSF2 currently has an approved Work Plan Variation enabling the completion of a wall lift to 253RL (the current wall level is 251.3RL) .
| 18.3 | WASTE DUMPS |
No active surface waste dumps are in use, with all waste material from underground operations being used for filling requirements. Previous surface waste dumps are being processed as low-grade oxide stocks.
Surface mining requires the construction of a temporary waste rock storage facility. This would be located partly over the existing Davis waste dump area and extend over private land towards Landsborough Road. This dump will be in operation from commencement of mining in the North Pit until reconstruction of the South Pit is complete after approximately 5-6 years.
161
| Technical Report | Kirkland Lake Gold |
| December 2016 | Stawell Gold Mines |

162
| Technical Report | Kirkland Lake Gold |
| December 2016 | Stawell Gold Mines |
| 18.4 | UNDERGROUND MINE INFRASTRUCTURE |
Underground infrastructure within the Magdala Mine is extensive and includes a 5.5m x 5.5m access decline extending from surface to around 1600mRL as at the end of December 2015. The gradient of the decline is 1:8 down to 468mRL then changes to 1:7 to 1600mRL. A number of historic surface shafts and the main decline supply fresh air to the mine. The exhaust system comprises two parallel 500kW Korfmann AL22-2500 Primary fans exhausting through the Darlington Shaft, which is the only exhaust.
Mine dewatering systems had been de-commissioned with the lower portion of the mine allowed to flood. Estimations are at around 50 years for the ground water levels to return to pre-mining levels. During 2016 mine pumping system was commissioned to the 806RL for ground / process water reticulation and water management.
An underground workshop and underground crib room is available at the 800mRL level within the mine.
In addition to the fixed plant, Stawell Gold Mines owns, operates and maintains all mobile mining equipment including jumbo development drills, production drills, loaders, trucks, and ancillary equipment required to undertake mining operations.
| 18.5 | POWER |
Stawell Gold Mines purchases power under contract from Origin Energy Australia.
Supply from the National Electricity Grid to Stawell Gold Mines is via high voltage installations in two locations:
| • |
Moonlight Substation (10 Mega Watts feed) which supplies the Magdala Underground operation; and |
|
| |
| • |
Reefs Road (7 Mega Watts feed) that supplies the gold processing plant, administration, workshop facilities and parts of the upper levels of the Magdala mine. |
Power to underground from the Moonlight substation is supplied through a 990m steel cased borehole, a 400m borehole and that from the Reefs Road substation via the Magdala decline.
The total facilities for electrical power input distribution to site is 5,833,600 kwh/month.
The main underground demands are outlined below:
| 1. |
Primary ventilation fan sizes are; |
| • | 482L 1000kw. |
| 2. |
Compressor sizes are; |
| • | 1300 cfm x 4(250kw x 2 units), | |
| • | 1000 cfm x 2(132kw x 1 unit underground), and | |
| • | 650 cfm x 3(110kw x 3 units). |
163
| Technical Report | Kirkland Lake Gold |
| December 2016 | Stawell Gold Mines |
The total volume of ventilation supplied to the mine is 180m3/sec.
The current power availability is sufficient to meet the needs of the current life of mine operating plan.
| 18.6 | WATER |
Water supply is from harvested rainfall runoff, mine dewatering, recycling of process water from the tailings facility, and by way of a 1ML/day raw water right entitlement and urban customer access to potable supply from GWMWater, Figure 18-2. This water is sourced from the nearby Grampians Mountains. The capacity of the site water storages is approximately 690ML.
The GWMWater water is supplied as raw or potable and is preferentially used, when required in the processing operations as it improves gold recovery.
| 18.7 | EXISTING PUBLIC INFRASTRUCTURE |
For the mining operations to commence there is a number of items of public and private infrastructure to be replicated elsewhere and then removed or decommissioned from the project area.
These items include:
- Fire watch tower;
- Town water supply system;
- Optic fiber route across the North Pit;
- Power reticulation for communications and fire watch facility;
- Pioneer Memorial Rotunda and access roads; and
- Arboretum gates and various other monuments from 1930’s through to 1975.
Feasibility level studies have been conducted on the replication, removal and re-establishment of the above items with costing included in the Capital assessment of the project:
-
Fire-watch tower - Replacement facilities will be constructed adjacent to the existing facility with necessary access off Scenic Road. Detailed design is to be progressed;
-
Town water supply system - As a risk mitigation strategy the current Stawell gravity feed treated water supply system will be decommissioned, with a pressure pumping system to be installed on the regional water authority managed crown land. This system will involve the installation of 600m of mains delivery system; construction of 10ML treated water storage capacity and pumping capability for the service of both high and low elevation town water feed. Detailed design and site investigation is to be progressed;
-
Optic fiber – As short length of an optic fiber data and communications cable is routed across the North Pit mining area. This is to be re-routed around the pit operation area to the existing communications tower;
164
| Technical Report | Kirkland Lake Gold |
| December 2016 | Stawell Gold Mines |
-
Power reticulation - Power reticulation will need to be re-routed to the communications and firewatch facilities;
-
Memorial Rotunda and access road - A memorial rotunda currently serviced by three roads is situated close to the crest of Big Hill, this will be deconstructed and stored for the duration of mining of the North Pit. This facility with one access road and car parking area is to be re-established following reconstruction of the Big Hill land form; and
-
Other Monuments - Provision has been made for the deconstruction and reconstruction of a number of monuments spanning a range of structures, ages and construction methodology. These structures range from stone fascia entrance gates, memorial, stone construction memorial seating and a medium solid stone monument.

165
| Technical Report | Kirkland Lake Gold |
| December 2016 | Stawell Gold Mines |
19 MARKET STUDIES AND CONTRACTS
| 19.1 | MARKETS |
Gold doré produced by Kirkland Lake Gold is currently shipped to the Perth Mint for smelting. On notification of produced amounts of gold doré, the Company notifies Auramet Trading LLC (Auramet) of the upcoming gold shipment and deals for future delivery of gold to the mint. During this process a given number of ounces will be included in the sale amount for delivery directly after smelting has occurred. Generally, a period of one week is required for this process to occur.
Auramet is a New Jersey based company, which specializes in the sale of both base metals such as copper, nickel and zinc and precious metals such as gold, silver, platinum and palladium.
During the smelting process the mint can extract other minerals. The main other economic mineral that is recovered is silver, which is sold to Perth Mint.
| 19.2 | GOLD PRICE |
To determine the Australian denominated gold price to use in the Mineral Resource and Mineral Reserve calculations, reference was made to publicly available price forecasts by industry analysts for both the gold price in US dollar terms and the AU$/US$ foreign exchange rate.
This exercise was completed in December 2016, and yielded the following average gold forecast prices and corresponding average forecast US$:A$ FX rates.
For Mineral Reserve purposes, a US$1,200/oz gold price was used and an FX rate of $0.75 for an approximate Australian dollar gold price of A$1,500 per ounce.
For Mineral Resource purposes, a US$1,200/oz gold price was used and an FX rate of $0.75 for an approximate Australian dollar gold price of A$1,500 per ounce.
The Qualified Persons are not aware of any agreements that are not within market parameters.
166
| Technical Report | Kirkland Lake Gold |
| December 2016 | Stawell Gold Mines |
20 ENVIRONMENTAL STUDIES, PERMITTING AND SOCIAL OR COMMUNITY IMPACT
Stawell Gold Mines is committed to maintaining effective management systems with respect to environmental matters on site. At Stawell Gold Mines, site management monitors and regularly reviews the potential for environmental and social impacts of the operations, such as water quality, air quality, blast vibration, noise, flora and fauna, and community attitudes. Site environmental performance results are shared with regulatory authorities and local communities quarterly through the Environmental Review Committee (ERC) meeting and annual Sustainability Report. Stawell Gold Mines promotes responsible environmental behavior among all employees and contractors. Operations are managed in accordance with the Stawell Gold Mines Environmental Management Plan (EMP) which assesses Stawell Gold Mines’ environmental risks and provides the controls, procedures, and guidelines required to mitigate and manage any risks.
| 20.1 | ENVIRONMENTAL RESEARCH |
As a practice, Stawell Gold Mines personnel conducts research in all environmental fields of Stawell Gold Mines to better understand any potential impacts and ensure best practices for closure and remediation. Environmental research is done by Stawell Gold Mines staff, consultants or though university partnerships. The main areas of research are in tailings storage facility management both during operations and post closure, noise of operations, rehabilitation of vegetation and air emissions from operations.
Stawell Gold Mines has three tailings storage facilities (TSF) with one operational (TSF2) and two rehabilitated
(TSF1 and the reserve tailings dam) to a planned end use. In 2009, Stawell Gold Mines engaged O’Kane
Consultants, a world leader capping design consultant, to design a store and release cover system for the long term stability of the tailing storage facilities. This design has been installed on the two rehabilitated TSF’s. Ongoing research by O’Kane Consultants in monitoring capping design methodology occurs and is reported on annually.
Stawell Gold Mines has had a long partnership with the University of Melbourne and Curtin University to undertake research and trials on remediation and rehabilitation. The University of Melbourne has led studies in both restoration ecology of TSF’s and waste rock stockpiles and bioremediation of groundwater. The results of the restoration ecology trials have found that the local native vegetation can survive and flourish in the proposed capping design and there are no impacts on the vegetation or subsequent food chain from the vegetation roots entering tailings. The results of the bioremediation work have isolated a naturally forming local bacteria that degrades thiocyanate (SCN) and have been undertaking laboratory trials and field trials in 2016. The work undertaken by Curtin University has investigated the acid generating potential of the waste rock and tailings and determined that Stawell Gold Mines tailings were non-acid forming due to a high degree of buffering minerals available.
Stawell Gold Mines has detected SCN in some monitoring bores immediate to TSF2. The groundwater in several areas is also elevated due to hydraulic pressure from TSF2. Stawell Gold Mines has undertaken multiple studies of the area and the impacts from the seepage (Coffey (2008), LanePiper (2008), Rockwater (2010), NQ Groundwater and Environment (2011), NQ Groundwater and Environment (2012), Cardno LanePiper (2014)). An environmental audit of groundwater downstream of TSF2 (Cardno LanePiper, 2014) was completed for the tailings storage facilities at the direction of the Environment Protection Authority Victoria (EPAV) in 2014. The conclusions to the audit environmental risk assessment based on the source-path-receptor (Conceptual Site Model) and rehabilitation proposed for TSF2 indicated that the risk to the beneficial use of stock watering to be “moderate”, given the unlikely use based on background groundwater salinity. The risk to primary contact recreation and buildings and structures to be “low” and “no risk” to the maintenance of aquatic ecosystems and industrial water use. The closest water receptor to the TSF is Concongella Creek and the audit (Cardno LanePiper, 2014) stated that under present operating conditions seepage would take between 150 to 240 years to reach the distance required (1.3km) .
167
| Technical Report | Kirkland Lake Gold |
| December 2016 | Stawell Gold Mines |
A remediation feasibility study was undertaken in 2015 by URS Australia in compliance with a notice from EPAV. The study concluded that hydraulic containment (pump and treat) would be the best option for remediation of SCN detected in groundwater immediate to TSF2. A clean-up plan was developed in 2016 by AECOM Australia. The plan modelled the options for hydraulic containment and determined the most effective configuration to remediate the contamination from both the fractured bedrock aquifer (FBA) and surface weathered bedrock aquifer (SWBA). The clean-up plan was endorsed by an Anthony Lane of Cardno Australia as an accredited EPA auditor. The clean-up plan was also accepted by EPA Victoria. In November 2016 the final extraction and monitoring bores were installed for the containment system. The pumping system will be operational in early 2017.
In a review conducted by NQ Groundwater and Environment in 2012 during the installation of five new seepage interception bores it has been indicated that due to very high clay content and high weathering rates it was demonstrated that seepage mitigation from TSF2 is very slow ranging from 0.0016m/day to 0.067m/day. Increasing distance, dilution and absorption of cyanide to geological materials down gradient will slow migration. During mining operations, to manage elevated water levels and seepage from TSF2, rock filled cutoff seepage trenches have been installed in several locations around the dam. Extraction bores have been installed in areas of seepage and groundwater rise to mitigate any impacts in accordance with the regulatory approved site groundwater management plan.
It is expected that with capping and closure of TSF 2, the tailings will progressively dewater resulting in groundwater levels slowly re-establishing to near pre-TSF levels. This is supported by the modelling works undertaken by O’Kane Consultants (O’Kane 2010). Therefore, the need for active groundwater level management is anticipated to decline once the operation of TSF2 and closure is complete.
Research on the noise of operations has been undertaken with modelling of the site operations including milling and haulage against the mining license requirements due to the proximity of the mine site against the town. Results of the investigations have found opportunities to further reduce noise from site with vehicle alterations and barriers around selective fixed plant. During 2016 works were undertaken to install an earthen bund around the ROM at 2.5m above the highest noise source, replace all reversing beepers with low frequency “squawkers”, replace fans and exhausts on surface loaders and utilize noise abatement curtains on crushing facilities. These control measures have been evaluated by an increased monitoring program and the installation of continuous fixed point noise loggers.
Ambient air quality monitoring stations (AAQMS) were installed within the community in 2013 to take continuous results for PM10 and PM2.5 as well as one week per month for metals and respirable crystalline silica (RCS). Previous monitoring was undertaken for dust deposition only. This more detailed investigation was undertaken initially for the permitting of the Big Hill Enhanced Development program and has now been incorporated into the site monitoring program. All results (apart from some offsite bushfire influenced events) have been below statutory criteria.
168
| Technical Report | Kirkland Lake Gold |
| December 2016 | Stawell Gold Mines |
There are currently no new permit requirements for the underground operations that would require any change in operation or effect the current environmental management. The TSF is currently permitted for another lift (1.7m) that will hold the waste of the known Mineral Resources/Reserves. The TSF is being actively managed for detected seepage and is being regulated to manage any associated risks.
| 20.2 | MONITORING |
Monitoring is undertaken on site for a range of environmental parameters as required by state and federal government regulations, the mining license and work plans. A report on monitoring data is presented to the ERC on a quarterly basis and an annual report is provided to the State regulators as a condition of the mining license. Table 20-1 lists the reportable environmental monitoring requirements for Stawell Gold Mines as outlined in the site EMP. Additional internal monitoring is undertaken to ensure all risks are being controlled.
TABLE 20-1 ENVIRONMENTAL MONITORING REQUIREMENTS FOR STAWELL GOLD MINES
| Component | Action | Frequency |
| Air Quality | Directional dust deposition monitors at 14 locations surrounding site (including 3 background sites). | Monthly |
| Real time PM10 and PM2.5 within community at 2 locations. | Continuous | |
| Real time PM10 and PM2.5 between TSF2 and closest receptor. | Continuous | |
| RCS and metals in particulate matter from the 3 air quality stations. | 1 week for month | |
| Emissions of hydrogen cyanide from TSF2 | Continuous | |
| Emissions from exhaust vents and kiln for odor and gases. | Biannual | |
| Blasting | Surface vibration at 5 locations within community above working areas. | Continuous |
| Airblast at 4 locations within community above working areas. | Continuous | |
| Noise | Noise monitoring at 4 closest sensitive receptors. | Quarterly |
| Flora | Flora surveys of rehabilitation sites. | Annual |
| Weed surveys of site. | Quarterly | |
| Fauna | Record of fauna onsite. | Daily |
| Pest animal survey of site. | Annual | |
| Heritage | Survey of new areas | As required |
| Air Emissions (including greenhouse gases). |
Reporting through statutory reporting for the National Greenhouse and Energy reporting Scheme and National Pollutant Inventory. | Annual |
| Water | Surface water monitoring of surrounding farm dams, water supplies and streams of mining lease. | Monthly, Quarterly, Annually and Trieennially |
| Groundwater monitoring of monitoring bores downstream of mining lease. | Monthly, Quarterly, Annually and Trieennially | |
| Tailings Storage Facility | Monitoring of SWL, drainage flows, piezometers, freeboard and deformation surveys. | Monthly and Annually |
169
| Technical Report | Kirkland Lake Gold |
| December 2016 | Stawell Gold Mines |
Directional dust deposition monitoring stations are located at 14 locations around the site including three background sites. Three AAQMS are operated with two located within the immediate community and one adjacent to TSF2 to monitor ambient dust emissions in accordance with the EPA protocols for environmental management. All monitoring is undertaken in accordance with the Australian standards. Monitoring of the afterburner inlet and outlet of the mill kiln and the ventilation stacks is undertaken on a biannual basis by an independent emissions consultant and analysis performed by a NATA certified laboratory for gaseous emissions and odor.
Noise control is an integral part of site design and a number of mitigation measures are in place to reduce the impact of noise on local residents. As described in the site mining license, the noise limits applicable for the Stawell Gold Mines operations were derived from procedures outlined in the EPA State Environment Protection Policy (Control of Noise from Commerce, Industry & Trade) No. N-1. Monitoring is undertaken annually by an independent consultant. All blast events are monitored for ground vibration using monitors located at sensitive sites. A portable vibration monitor can be utilized if the need arises. All results of the air blast and ground vibration monitoring are recorded and maintained by Stawell Gold Mines. Flora and fauna surveys are conducted yearly by consultants in rehabilitation areas and surrounding the TSF. The rehabilitation areas are surveyed to ensure progress is meeting the planned end land use and the flora surrounding the TSF is monitored to ensure there are no impacts on vegetation.
Monitoring of surface waters and groundwater on site and off site is undertaken to ensure compliance with the State Environmental Planning Policies (SEPP, Waters of Victoria), the SEPP (Groundwater), Work Plan conditions and the mining license conditions. Stawell Gold Mines monitors 110 groundwater monitoring bores installed around the site with them being most densely installed around the TSF’s. Also monitored are all surface water catchments including surrounding farm dams and creeks.
In December 2016 Stawell Gold Mines went into care and maintenance. A care and maintenance monitoring program will be implemented during 2017.
| 20.3 | PERMITTING |
Stawell Gold Mines underground operations are fully permitted with no outstanding permitting requirements for current Mineral Resources.
In October 2014 the Big Hill Project EES was provided a recommendation from the Minister for Planning to the Minister for Energy and Resources that further considerations were required, predominately in the areas of air quality and public health. The Big Hill Project was modified to meet the concerns raised by the Minister for Planning and SGM has requested the Department of Economic Development, Job, Transport and Resources Victoria to review the changes and to provide the permitting pathway for the project to progress to a work plan.
| 20.4 | COMMUNITY ENGAGEMENT |
Stawell Gold Mines is closely associated with the Township of Stawell (immediately adjacent to the east of the mine) and is bordered by farming land to the north and south, and state forest to the west. Stawell Gold Mines has been operating in Stawell since 1981 and is an integral part of the town. The mine is a large contributor to the regional economy and therefore has many stakeholders connected directly or indirectly to the operation. The expectation by the local community is that Kirkland Lake Gold Ltd. will continue to operate in accordance with its license conditions and modern community standards and the local community expects and appreciates being informed of changes to the operations.
170
| Technical Report | Kirkland Lake Gold |
| December 2016 | Stawell Gold Mines |
Stawell Gold Mines has taken a proactive approach to community relations and has endeavored to keep the community up to date with all changes occurring at the mine site and within their community. Community attitudes and expectations have been identified through a range of techniques including:
- One on one discussions;
- Community surveys;
- Information sessions;
- Community meetings;
- Environmental Review Committee; and
- Annual Open Day.
| 20.5 | REHABILITATION AND CLOSURE |
Stawell Gold Mines is regulated through the Mineral Resources (Sustainable Development) Act 1990 (MRSDA). It is a requirement of the MRSDA to have a rehabilitation plan and a rehabilitation bond held by the State government. Stawell Gold Mines is required to regularly review their closure plan and rehabilitation bond with the state regulators; this was undertaken in August 2016. Closure costs are derived using a combination of consultants, contractors and the regulator rehabilitation bond calculator. The current bond held by the state for rehabilitation is $5.833M ($1M for demolition and removal of surface infrastructure has been deferred from the bond by the state after an asset valuation for second hand and scrap of the existing infrastructure was shown to be greater than the demolition cost). The bond amount covers the decommissioning and rehabilitation of the surface and underground facilities including:
- Demolition and removal of all surface infrastructure (plant, buildings, roads, services);
- Capping and rehabilitation of tailings storage facilities to native bush (carting and spreading growth material and topsoil, structural works, surface contouring, drainage, seed and seedlings);
- Rehabilitation of open pits (stabilization of pit walls, bunds/fencing, re-vegetation and signage);
- Rehabilitation of underground workings (sealing of any underground accesses and ventilation shafts);
- Rehabilitation of stockpiles/waste dumps (shaping, spreading, contouring and re-vegetation);
- Decommissioning and Post closure costs (To cover the on-going assessment, monitoring and management of the site); and
- Contingency (Imposed by the regulator for unforeseen costs).
The Stawell Gold Mines is a reasonably small compact site and there are very few opportunities to conduct progressive rehabilitation whilst it is in operation. Two closed TSF’s have been filled in and rehabilitated over the life of the mine along with other small areas around site.
The Reserve Tailings Dam has been rehabilitated into the home of the Stawell Clay Target Complex. In 2000 Stawell Gold Mines established a Tailings Experimental Research Facility (TERF) on TSF1 as a field trial to investigate different closure mechanisms for the tailings dams. The University of Melbourne, Curtin University and O’Kane Consultants have undertaken extensive research on this TERF to determine the performance of the cover design system on a number of aspects including:
171
| Technical Report | Kirkland Lake Gold |
| December 2016 | Stawell Gold Mines |
- Acid Mine Drainage;
- Ecotoxicology;
- Soil stabilization;
- Arsenic uptake;
- Net percolation and water balance; and
- Phyto-stabilization using trees.
The results of these trials have been used to finalize rehabilitation and create an end land use available to community activities.
172
| Technical Report | Kirkland Lake Gold |
| December 2016 | Stawell Gold Mines |
21 CAPITAL AND OPERATING COSTS
| 21.1 | UNDERGROUND COSTS |
The Stawell Gold Mine site inclusive of the underground operation announced and transitioned into care and maintenance as of the December 13, 2016.
Underground costs detailed in this section have been derived from the 2017 Stawell Gold Mines budget and include current costs for care and maintenance of the underground mine and processing plant.
| 21.1.1 | CAPITAL COSTS |
For the purpose of financial reporting all costs incurred under care and maintenance will be treated as operating in nature. These costs are presented below.
| 21.1.2 | OPERATING COSTS |
Operating costs for Stawell Gold Mines in 2017 are presented below in Table 21-1. These costs are based upon the budgeted quantity of works planned to be undertaken through the course of 2017.
Underground care and maintenance costs are inclusive of all pumping, ventilation, supervision and associated power.
TABLE 21-1 SGM 2017 OPERATING COST SUMMARY A$
| 2017 Operating Costs | $,000’s Cost |
| Stawell Gold Mines Care and Maintenance | 9,846 |
| Total | 9,846 |
Care and maintenance costs for Stawell Gold Mines beyond the 2017 budget period are expected to be similar to the current values presented above.
| 21.2 | SURFACE COSTS |
Surface mining costs are based on a Project Feasibility Study for the Big Hill Enhanced Development Project prepared by Dean Basile, MAusIMM (CP) and Stuart Hutchin, MAIG, MAusIMM dated June 2014 (the Big Hill Technical Report).
Operating and capital cost estimates were developed by Mining One in conjunction with Newmarket Gold for the Big Hill project. The operating costs used in the feasibility study were based on a contractor tendered mining rates. A shadow bid cost estimate using first principles was carried out to verify the tender rates used are reasonable for a project of this nature and size. Capital cost estimates include initial and sustaining expenditures and have been estimated and obtained from a variety of sources. They are detailed in the following sections.
173
| Technical Report | Kirkland Lake Gold |
| December 2016 | Stawell Gold Mines |
| 21.2.1 | CAPITAL COSTS |
Overall project capital requirements are assumed to be similar for both Contractor and Owner mining cost models. Owner mining cost models assume that equipment is either fully leased or on a dry/maintained hire agreement.
Capital costs estimates are based on both onsite set up requirements for the surface mining activities, environmental monitoring programs and removal and re-establishment of infrastructure items as per Section 18.7, Table 21-2 and Figure 21-1.
TABLE 21-2 CAPITAL COST ESTIMATE BIG HILL A$ (AS PER JUNE 2014)
| Capital Cost Estimate Big Hill | $,000’s Cost |
| Permitting | |
| Project Site Set Up | 2,704 |
| Environmental | 7,229 |
| Public Infrastructure | 898 |
| GWM Infrastructure | 2,798 |
| Communications | 773 |
| Mining Set Up | 1,639 |
| Mining Equipment | 1,380 |
| Operation Fixed Capital | 187 |
| Total | 17,608 |

Capital cost estimates were reviewed during 2016 and are in line with modified project considerations.
174
| Technical Report | Kirkland Lake Gold |
| December 2016 | Stawell Gold Mines |
| 21.2.2 | OPERATING COSTS |
Operating costs for the Big Hill Project were reviewed during 2016 with modified project schedules and material movements.
Operating cost estimates for the Big Hill Project are based upon owner mining costs models with equipment leased for the duration of the project. The operating costs are detailed in Table 21-3.
TABLE 21-3 OPERATING COST ESTIMATE BIG HILL A$
| Operating Costs Estimate Big Hill | $,000’s Cost |
| Surface Mining | 1.24 |
| Geology | 0.11 |
| Surface Trucking | 0.39 |
| Fixed & Labor | 2.02 |
| Lease & Hire | 1.24 |
| Total | 4.99 |
Operating cost estimates for the Big Hill Project showing proportion of cost drivers below in Figure 21-2.

Mining cost estimates are driven by productivity analysis on the mining schedule to determine cycle times and associated equipment and related labor requirements.
175
| Technical Report | Kirkland Lake Gold |
| December 2016 | Stawell Gold Mines |
21.2.2.1 Load and Haul Operations Costs
Load and haulage cost estimates are based upon surface mining schedules as per Section 16.3.2. First principle productivities are calculated using excavator specifications and benchmarks from existing operations.
Table 21-4 outlines the productivity estimates for the load and haulage fleet proposed for the operation.
TABLE 21-4 OPERATING PRODUCTIVITY ESTIMATE BIG HILL
| Excavator Productivity | Unit | Value | Value |
| Excavator Type | EX1200 | EX1900-6-BH | |
| Truck Type | Cat_777F | Cat_777F | |
| Digger Configuration | Backhoe | Backhoe | |
| Material Detail | |||
| Dry Density | t/BCM | 2.1 | 2.1 |
| Moisture Content | % | 2% | 2% |
| Swell Factor | % | 15% | 15% |
| Wet Density Loose | t/m^3 | 1.86 | 1.86 |
| Wet Bank Density | t/m^3 | 2.14 | 2.14 |
| Shovel Details | |||
| Bucket Heaped Cap. | m^3 | 6.7 | 9.6 |
| Fill Factor | % | 85% | 85% |
| Bucket Cap. Volume | BCM | 5.0 | 7.1 |
| Bucket Cap. Weight | t | 14.7 | 19.2 |
| Bucket Cap. Weight | BCM | 6.9 | 9.0 |
| Bucket Cap. Adopted | BCM | 5.0 | 7.1 |
| Truck Details | |||
| Tray Capacity | m^3 | 60.2 | 60.2 |
| Truck Fill Factor | % | 95% | 95% |
| Volume Limit | BCM | 49.7 | 49.7 |
| Rated Payload | t | 90.7 | 90.7 |
| Assumed Overload | % | 0 | 0 |
| Adjusted Payload | t | 90.7 | 90.7 |
| Weight Limit | BCM | 42 | 42 |
| Adopted Capacity | BCM | 42 | 42 |
| Min. Bucket Fill | % | 25% | 25% |
| Calculated Passes Per load | 9 | 6 | |
| Calculated Passes Per load | (rounded) | 9 | 6 |
| Actual Truck Load | BCM | 42 | 42 |
| Actual Truck Load | t | 90.7 | 90.7 |
| Dump Time | min | 1.2 | 1.2 |
| Excavator Productivity | |||
| Cycle Time | sec | 25 | 25 |
| Efficiency Factor | % | 100% | 100% |
| 1st Pass | sec | 9 | 9 |
| Truck Exchange | sec | 38 | 38 |
| Loading Time | min | 4.12 | 2.87 |
| Max. Productivity | BCM/OH | 617 | 886 |
| Effective Utilisation of operating hours | % | 73% | 76% |
| Productivity | BCM/OH | 450 | 670 |
| Productivity | t/OH | 945 | 1,407 |
176
| Technical Report | Kirkland Lake Gold |
| December 2016 | Stawell Gold Mines |
The productivity estimates for each excavator is matched against the mining schedule to determine the required number of excavators. Figure 21-3 below illustrates the total excavator capacity for an EX1900 and EX1200 versus the mining schedule.

Overall excavator operating costs excluding operating labor for the project period equate to A$5,313,000 for a unit rate averaged across the project of A$0.24/t mined and an additional A$0.58/t of rehandle material for reconstruction purposes.
Haulage of ore and waste were modelled in TALPAC software to determine travel time and fuel consumption. Travel time and fuel consumptions were calculated for all haulage routes from each bench to the ROM or waste dump.
In addition, travel times were used to determine the productivity of each truck and thus truck requirements were matched to the mining schedule. Figure 21-4 below illustrates the haul truck requirements.
177
| Technical Report | Kirkland Lake Gold |
| December 2016 | Stawell Gold Mines |

Overall haulage truck operating costs excluding operating labor for the project period equate to A$11,881,000 for a unit rate averaged across the project of A$0.39/t mined and an additional A$1.64/t of rehandle material for reconstruction purposes.
21.2.2.2 Ancillary Equipment Operator Costs
Ancillary equipment was selected in order to adequately support mining operations. The type and quantity selected over and above what would be required at based on experience with operations of a similar size and nature. Additional ancillary equipment costs are incurred for the project mainly in the increased use of additional bulldozers for excavation, stockpile and re-establishment purposes. Additional water cart and dust suppression equipment and labor allowances have also been added to the ancillary equipment schedule.
Ancillary equipment requirements equate to A$9,955,000 over the life of the project or a unit rate of A$0.79/t mined and an additional A$0.47/t of rehandle material for reconstruction purposes.
21.2.2.3 Drill and Blast Operator Costs
Mining will predominantly be via rip and dig with minimal drill and blast activity scheduled. Due to the relatively small quantity of material expected to be drilled and fired, drill and blast operations will be carried out via a contractor as the quantity does not justify the capital cost.
178
| Technical Report | Kirkland Lake Gold |
| December 2016 | Stawell Gold Mines |
Drill and blast contractor costs equate to A$2,038,000 over the life of the project or A$2.74/BCM for drill and blast zones.
21.2.2.4 Equipment Leasing and Hire
For the project major items of mobile equipment would be leased with additional equipment hired on an as needs basis. Lease rate calculations have been based on the duration of the project at 10% interest terms.
Leasing, insurance and hire costs for the duration of the project equate to A$19,147,000 or a unit rate of A$1.24/t mined and an additional A$1.46/t of rehandle material for reconstruction purposes.
179
| Technical Report | Kirkland Lake Gold |
| December 2016 | Stawell Gold Mines |
22 ECONOMIC ANALYSIS
| 22.1 | UNDERGROUND ECONOMIC ANALYSIS |
Section 22 for underground mining has been excluded on the basis that the property is currently in care and maintenance and there are no plans for material expansion of current production, other than in connection with the Big Hill Project.
| 22.1 | BIG HILL ECONOMIC ANALYSIS |
Economic Analysis for the Big Hill Project is based upon Feasibility Cost Estimates compiled during 2014 with adjustment as necessary for Project modifications conducted to-date. Cashflow streams consist of Revenue, Capital Costs, Operating Costs and Taxes.
| 22.1.1 | PRODUCTION AND REVENUE |
Production and revenue estimates for the Big Hill Project are presented below in Operating Costs .
TABLE 22-1 BIG HILL PRODUCTION AND REVENUE SUMMARY
| Description | Unit | Big Hill Project |
| Ore Production | Mt | 2.73 |
| Processing Recovery | % | 90 |
| Gold | koz | 119 |
| Revenue @ A$1,500/oz gold price | $M | 172.9 |
| 22.1.2 | OPERATING COSTS |
Operating costs are comprised of Mining, Waste Rehandle, Processing, Royalties and Administration with further detail provided in Section 16.3.2 and Section 21.2.2. Overall operating costs for the Project are presented below in Table 22-2.
TABLE 22-2 BIG HILL OPERATING COST SUMMARY
| Description | Unit | Big Hill Project |
| Mining | A$M | 48.34 |
| Waste Rehandle | A$M | 17.23 |
| Processing and General Admin | A$M | 40.25 |
| Royalties | A$M | 0.24 |
| Total Operating Costs | A$M | 106.06 |
| Operating Cost per Ounce | A$/oz | 891 |
The operating cost profile for the Big Hill surface operations is presented below on a quarterly basis in Figure 22-1.
180
| Technical Report | Kirkland Lake Gold |
| December 2016 | Stawell Gold Mines |

| 22.1.3 | CASHFLOWS |
The overall project cashflow has been divided into four cash streams. All working Capital, stocks, and tax deductions are included in these four cash streams.
The four cash streams are summarized below:
| • |
Revenue – Based on production with no delay from mining to processing to sales; |
| • |
Capital Costs – Capital costs grouped into nine major capital items as per Section 21.2.1; |
| • |
Operating Costs – Comprised of mining, waste rehandle, processing, administration and royalty costs; and |
| • |
Taxes – Tax assessments use a broad method and are based on tax losses carried forward and a 30% company tax is assumed. |
The four cash streams are combined to give an overall project cash flow as presented below in Table 22-3.
TABLE 22-3 BIG HILL CASHFLOW MODEL OUTPUTS SUMMARY A$
| Description | Unit | Big Hill Project |
| Pre-tax | ||
| Undiscounted CashFlow | $ 000 | 46,915 |
| Discounted CashFlow @ 8% | $ 000 | 37,262 |
| IRR | % | 121.4% |
| Payback Period | quarter | 6.38 |
| Post-tax | ||
| Undiscounted CashFlow | $ 000 | 20,584 |
| Discounted CashFlow @ 8% | $ 000 | 20,007 |
| IRR | % | 74.5% |
| Payback Period | quarter | 7.35 |
181
| Technical Report | Kirkland Lake Gold |
| December 2016 | Stawell Gold Mines |
The quarterly cashflow, cash streams and operating costs of the Big Hill Project are depicted in Figure 22 and Figure 22-3 respectively.

182
| Technical Report | Kirkland Lake Gold |
| December 2016 | Stawell Gold Mines |
23 ADJACENT PROPERTIES
There are no adjacent properties of significance to the Stawell Gold Mines.
183
| Technical Report | Kirkland Lake Gold |
| December 2016 | Stawell Gold Mines |
24 OTHER RELEVANT DATA AND INFORMATION
The Stawell Gold Mines has no underground mining as the underground operation and processing plant is currently on care and maintenance. As such, no underground Mineral Reserves have been reported given the capital cost requirements of recommencing the operation is now required to be factored into Mineral Reserve costings.
In June 2014, Crocodile Gold Corp. released the results of a Feasibility Study for the Big Hill Enhanced Development Project located adjacent to the Stawell Gold Mine. The Feasibility Study had been completed in accordance with the CIM Definition Standards on Mineral Resources and Mineral Reserves referred to in the National Instrument 43-101.
Table 24-2 CAPITAL COST SUMMARY summarizes the findings of the Feasibility Study as of June 2014 on the Big Hill Deposit.
TABLE 24-1 BIG HILL FINANCIAL ANALYSIS RESULTS BASED ON
A
USD$1,225/oz PRICE AND A US$:A$ EXCHANGE RATE OF 0.87
| Financial Analysis | Pre-Tax | Post Tax |
| Gold Price* | A$1,415 | A$1,415 |
| Undiscounted Cash Flow (A$)(M) | 49.2 | 30.3 |
| NPV @ 8% Discount (A$)(M) | 38.5 | 22.6 |
| IRR | 125.3% | 79.1% |
| Payback Period (Years) | 1.5 | 1.9 |
TABLE 24-2 CAPITAL COST SUMMARY
| Capital Costs | |
| Pre-production Capital (A$)(M) | A$11.99 |
| Total Project Capital (A$(M) | A$19.60 |
TABLE 24-3 OPERATING COST SUMMARY
| Operating Costs | |
| Mining Cost (A$/t ore) | A$4.83 |
| Waste Rehandle (A$/m3 waste) | A$4.98 |
| Processing Costs (A$/t ore) | A$14.75 |
| Royalty (AUD$/oz) | A$2.00 |
TABLE 24-4 UNIT COSTS SUMMARY
| Unit Costs | |
| Operating Cash Cost (A$/oz) | A$886 |
| All-in Sustaining Cash Cost (A$/oz) | A$1,035 |
TABLE 24-5 OPERATING PLAN SUMMARY
| Operating Plan | |
| Mining Duration (Years) | 3.5 – 4 |
| Mining (Days/Yr) | 260 |
| Landform Re-establishment (Years) | 1-1.5 |
184
| Technical Report | Kirkland Lake Gold |
| December 2016 | Stawell Gold Mines |
TABLE 24-6 BIG HILL PROCESSING SUMMARY
| Processing | |
| Metallurgical Recovery | 90 % |
| Recovered Grade (g/t Au) | 1.5 |
| Recovered Gold (oz) | 131,000 |
The Feasibility Study confirmed the technical and economic viability of the Project and highlights the measures taken to achieve levels of compliance beyond that of conventional open pit mining in consideration of proximity to the Stawell community. Self-imposed modified practices have been adopted to mitigate environmental and social impacts, even if not economically optimal.
The Project is currently the subject of an Environmental Effects Statement and Ministerial Assessment.
Substantial work has been done to confirm operational costs, technical support and social impacts. Based on a forecast gold price of A$1,415/oz, the Feasibility Study base case, pre-tax NPV (8%) is A$39M with an IRR of 125%. The most positive characteristic of the Project is its high operating margin; economic sensitivity analyses demonstrate the Project NPV to be resilient to downward movement in gold price and potential upward movement in costs. Table 24-7 and Table 24-8 highlight the Project’s ability to withstand potential market pressures and capacity to capitalize on opportunities.
TABLE 24-7 GOLD PRICE SENSITIVITY ANALYSIS
| Gold Price Sensitivity (Pre-tax) | |||||
| A$/oz | 1,300 | 1,350 | 1,400 | 1,450 | 1,500 |
| NPV (A$M) | 26.3 | 31.6 | 36.9 | 42.2 | 47.6 |
| IRR (%) | 97.7% | 110.2% | 121.9% | 133.1% | 143.7% |
| Pre-Tax Payback Period Undiscounted (Years) | 1.7 | 1.6 | 1.6 | 1.5 | 1.5 |
TABLE 24-8 COST SENSITIVITY ANALYSIS
| Change in NPV Pre-tax (%) | -20 | -10 | 0 | 10 | 20 |
| Capital costs (A)($M) | 42.7 | 40.6 | 38.5 | 36.4 | 34.3 |
| Operating costs (A)($M) | 56.7 | 47.6 | 38.5 | 29.4 | 20.3 |
The Big Hill Project is part of an Australian tax-consolidation group, which has non-capital operating losses, which can be applied to reduce taxable income in future years. It is expected that a portion of these losses will be available during the Big Hill time frame which would effectively increase the after-tax value of the project.
The total pre-production capital cost is estimated at A$11.99M and include costs associated with site establishment, relocation of existing infrastructure and environmental impact mitigation. The total capital cost for the Big Hill Enhanced Development Project is estimated at A$19.6M, which includes rehabilitation and end land use amenity consideration. Mine fleet requirements will be pursued through either leasing or dry hire arrangement.
185
| Technical Report | Kirkland Lake Gold |
| December 2016 | Stawell Gold Mines |
TABLE 24-9 CAPITAL COST SUMMARY AND PRE-PRODUCTION CAPITAL COSTS
| Capital Cost Summary | Unit Cost (A$M) |
| Permitting | 1.85 |
| Project Site Set up | 2.56 |
| Public Infrastructure | 0.90 |
| Town Water Infrastructures | 2.67 |
| Communication and Fire Watch | 2.05 |
| Mining Set Up | 1.62 |
| Mining Equipment and Operation Fixed Capital | 0.34 |
| Pre-production Capital Costs | 11.99 |
| Environmental | 7.61 |
| Total Project Capital Costs | 19.60 |
Environmental Bonds will reflect incremental payment at key stages of the project and will also reflect bond reduction on completion of progressive rehabilitative works.
A comprehensive first principle mining cost model was developed to provide a shadow bid estimate and compared to the result of a formal tender process. This undertaking forms the basis of mine operating costs used in the Feasibility Study. Processing costs are based on actual costs as realized at Stawell Gold Mines for the treatment of Big Hill Enhanced Development Project ore types.
At the end of mining operations, re-handling and rehabilitation of the pits and waste dumps will be undertaken. Approximately 3.5Mm 3 of material will be re-handled back into the pit voids as part of the rehabilitation. This will complete the progressive rehabilitation program of events.
TABLE 24-10 OPERATING COSTS SUMMARY
| Operating Cost Summary | Unit Cost |
| Mining cost (A$/t rock) | 4.83 |
| Waste re-handle cost (A$/m3) | 4.98 |
| Processing & Administration cost (A$/t ore) | 14.75 |
Additional operating cost allowances have been incorporated to reflect the adoption of leading practice mine operations and were estimated in the order of more than A$10.6M over the life of the project (Table 24-10). These initiatives are in addition to those environmental management initiatives included within capital costs, and are included within operating unit rates presented.
186
| Technical Report | Kirkland Lake Gold |
| December 2016 | Stawell Gold Mines |
25 INTERPRETATION AND CONCLUSIONS
The Stawell Gold Mine site inclusive of the underground operations and processing plant transitioned into care and maintenance as of the December 13, 2016. An underground exploration program exploring the potential for economic mineralization on the Eastern Flank continues during 2017.
The Stawell Project has a significant production history and the site personnel have significant knowledge of the orebody and the mining process, which adds additional support to the methodologies used to estimate the Mineral Resources and Mineral Reserves.
Stawell Gold Mines has in place rigorous processes for the estimation of Mineral Resources and Mineral Reserves. These processes are managed on site and appropriate resources (personnel and drilling) are allocated to this function.
The conclusion of the Authors is that the Mineral Resources and Mineral Reserves as stated in this document are valid and supported by appropriate data collection, sampling, processing, interpretation and estimation methodologies and conform to NI 43-101 guidelines.
Exploration activities continue at the Stawell Gold Mine and it is the opinion of the Authors that additional exploration is warranted as per the descriptions included in Section 9 of this technical report.
There are no known risks or uncertainties, other than previously noted, (outside a significant reduction in gold price assumptions) which could reasonably be expected to affect the reliability or confidence in the exploration information, Mineral Resource or Mineral Reserve estimates or projected economic outcomes discussed in this technical report. The risk of the gold price assumptions has been mitigated by the use of an industry standard approach to estimating the price to be used in all estimations. Further work is required to maintain the understanding of the Mineral Resources and Mineral Reserves of the deposit, which will be completed as required to ensure the successful development of the project.
There is some uncertainty regarding the permitting process for the Big Hill Surface Deposit, however, the Company team understand the obligations to obtaining these approvals and will work within the requirements of the mining department to gain approvals. There is some risk that this could delay the commencement of the operations but it is not of the opinion of the author that this approval will not be granted.
The Authors have made the following interpretations and conclusions:
| • |
Underground Mineral Reserves reduced to zero through depletion over the course of 2016 and decision to move to care and maintenance in December 2016. Remaining underground material is currently not considered economically viable. |
|
| |
| • |
Big Hill Mineral Reserve remains the same (132Koz), and has been reviewed in early 2017 by Mr Dean Basile, Principal Mining Engineer, Mining One Consultants to ensure that the economic parameters and project viability remain valid and appropriate when considering the project under current circumstances. |
|
| |
| • |
A minor reduction in surface Mineral Reserves (-6Koz) is driven by the removal of low-grade surface oxide stockpiles through depletion in 2016. |
187
| Technical Report | Kirkland Lake Gold |
| December 2016 | Stawell Gold Mines |
| • |
The Stawell Measured and Indicated Mineral Resource increased in inventory over the past 12 months. Mineral Resource depletion was replaced in 2016 through extensional and operational drilling and conversion of Inferred Mineral Resource. The small increase in Indicated ounces in the Magdala Western Flank mineralization does not reflect the extent of conversion during the year. This is a result of a short time frame between delivery of the Mineral Resource and mine scheduling, thus material that was converted during the reporting period is already in production during the same reporting period. |
|
| |
| • |
A reduction to the Inferred Mineral Resource (-18Koz) is due to resource conversion drilling in 2016. Although there was continued exploration drilling during 2016 there was little addition to Inferred Mineral Resource through exploration drilling on the Eastern Flank (Aurora B), Moray 343 and 486L mid north Magdala. This was a combination of poor assay results (Moray 343), sparse intersection points relative to geological architecture (486L Mid North Magdala and Aurora B) and poor drill angle (Aurora B). |
|
| |
| • |
Surface Inferred Mineral Resources were increased by 5Koz due to a typographical error in the 2015 Big Hill Surface Inferred figures. |
188
| Technical Report | Kirkland Lake Gold |
| December 2016 | Stawell Gold Mines |
26 RECOMMENDATIONS
The key recommendations of the Principal Author are in respect of ongoing geological testing and mining evaluation of the Mineral Resources and exploration areas at Stawell Gold Mines:
|
• |
A detailed exploration program is presented in Section 9 of this report, including a proposed program for 2017. These targets and proposed exploration expenditure are summarized in Table 26-1; all areas have had various levels of exploration over recent years. |
TABLE 26-1 FORECAST EXPLORATION DRILLING BUDGET ($A) FOR 2017
| Prospect | Diamond Drilling ($) |
| Aurora B | $700,000 |
| Germania Prospect | $400,000 |
| Wal Wal Prospect | $327,000 |
| Totals | $1,427,000 |
| • |
Maintain the mine geological program as currently implemented to supplement currently available geological information in the preparation of detailed mine design. It is the opinion of the Authors that there remains sufficient prospectivity within the Stawell Gold Mines tenement to support the proposed programs and budgeted expenditure and it is recommended that ongoing evaluation of this potential be continued and re-evaluated as exploration results are received; |
|
| |
| • |
Further investigation of the Eastern Flank mineralization should be undertaken, including a detailed structural study of the diamond drill core to understand the down-plunge position of Aurora B and the potential of the mineralized shoots. This understanding will aid in the targeting and design of further diamond drilling campaigns with the intent to extend the Inferred Resource and infill and convert to Indicated Resources; |
|
| |
| • |
Continuation of diligent QA/QC programs. The outsourcing of sample preparation in 2017 due to the closure of the site lab will need to be closely monitored for quality; |
|
| |
| • |
Continuation of collection of density measurements and geometallurgical testwork in areas of newly defined mineralization and geology; |
|
| |
| • |
Geotechnical studies on the Eastern Flank mineralization; and |
|
| |
| • |
Continuation of collection of multi-element data and analysis of mineralogical trends. |
In order to improve the quality of the estimated resources the following actions are also recommended:
| • | Continue definition drilling on the Eastern Flank to define the Aurora B and Hampshire mineralization; |
| • | Maintain high QA/QC practices with managing the drill core acceptance into the database prior to utilization in estimation; |
| • | Manage the offsite sample preparation to ensure samples continue to present as high quality; |
189
| Technical Report | Kirkland Lake Gold |
| December 2016 | Stawell Gold Mines |
| • |
Perform QKNA analysis of the Aurora B Resource Model with external consultation to ensure best practices in estimation of the Mineral Resource; and |
|
| |
| • |
Undertake resource estimation risk evaluation on the Eastern Flank mineralization to determine the likely variance in grade and thickness as an aid in classification of Mineral Resource for the next reporting year. |
190
| Technical Report | Kirkland Lake Gold |
| December 2016 | Stawell Gold Mines |
27 REFERENCES
Arne, D.C., Bierlein, F.P., McNaughton, N., Wilson, C.J.L., Morland, V.J. (1998). Timing of gold mineralization in western and central Victoria, Australia: New constraints from SHRIMP II analysis of zircon grains from felsic intrusive rocks. Ore Geology Review, 13, 251-273.
Basile, D., Hutchins, S. (2014). NI 43-101Technical Report – Big Hill Enhanced Development Project at Stawell Gold Mine, Mineral Resources and Reserves for Crocodile Gold Corp. Prepared by Mining One Consultants.
Beeson, J., Heard, S., Vincent, S., Pittway, N., Cochrane, G. (2016). Review of Structural Data from the Aurora B Diamond Drill Core, Stawell Gold Mine, Western Victoria. SGM Internal Report.
Blythman, R. (2016). Upper South Fault 2 Geology and Resource Model Report. SGM Internal Report.
Cas, R.A.F. (1983). A review of the palaeogeographic and tectonic development of the Palaeozoic Lachlan Fold Belt of southeastern Australia. Geological Society of Australia, Special Publication, 10.
Crawford, A.J. (1988). The Cambrian system in Victoria. Geology of Victoria. J. G. Douglas, and Ferguson, J.A. Melbourne, Geology Society of Australia, Victoria Division Special Publications: 37-62.
Coventry, D., Llorca, J., Keeling, S., Haydon, M., Weymess, P., Brenchley, P., Ross, J., Ankerson, A (2012). Technical Report on Stawell Gold Mines, Victoria, Australia.
Coffey Environments (2008), Stawell Gold Mines – Stage 4(a) – Hydrogeological Assessment, Tailings Storage Facility No 2 Factual Report (Draft). 621.0/10/1
Doronila, A. (2006). Phytostabilisation of arsenic – rich sulphidic gold mine tailings in Victorian goldfields, Australia. Ph.D. Thesis submitted to the School of Botany, University of Melbourne. Melbourne, Australia.
Dowsley, K. (2001). Characterization of a partially oxidized sulphidic tailings dam. Honors Thesis (unpublished). School of Earth Sciences. University of Melbourne.
Foster D.A., Gray, D.R., Kwak, T.A.P., Bucher, M. (1998). Chronology and tectonic framework of turbidite hosted gold deposits in western Lachlan Fold Belt, Victoria: 40Ar-39Ar results: Ore Geology Review, 13, 229-250
Fredericksen, D., Miller, G., Dincer, T. (2008). Technical Report on Stawell Gold Mines, Victoria, Australia.
Gane, M.J. (1998) Gold mineralization within the basalt contact ore zones, Magdala Mine, Stawell, Victoria. Masters Thesis (unpublished). The University of Melbourne, 208p
Gedge, L. (1997). The relationships between structure, gold mineralization and intrusive events at Stawell, Victoria. Unpublished thesis, Melbourne, Australia, The University of Melbourne, 95p
Heard, S. (2013). Mariners Underground Geology and Resource Model Report. SGM Internal Report.
Jupp, B. (2003). Hydrothermal alteration and lithogeochemistry of the Kewell and Wallup prospects and their comparison with the Magdala gold, Stawell, Victoria. Unpublished thesis, Melbourne, Australia, The University of Melbourne, 193p
Kaufman, A. (2003). The volcano-sedimentary and structural evolution of the Wildwood prospect, Western Lachlan Orogen. Unpublished thesis, Melbourne, Australia, The University of Melbourne, 85p
LanePiper. (2008). 207119 Report 01.2 Environmental Audit Report Stawell Gold Mine Leviathan Rd, Stawell Vic, January 2008
Lllorca, J.P., Schunke, N., (2012). Crocodile Gold Corp. NI 43-101 Report Stawell Gold Mines, Victoria, Australia.
191
| Technical Report | Kirkland Lake Gold |
| December 2016 | Stawell Gold Mines |
Mapani, S.E., Wilson, C.J.L. (1994). Structural evolution and gold mineralization in the Scotchmans Fault Zone, Magdala Gold Mine, Stawell, Western Victoria, Australia. Economic Geology, 89, 566-583
Miller, J.McL., Wilson, C.J.L, Dugdale, L.J. (2006). Stawell gold deposit: a key to unravelling Cambrian to Early Devonian structural evolution of the western Victorian goldfields, Australian Journal of Earth Sciences, 53, 677-695
Miller, J.McL., Wilson, C.J.L. (2004a). Structural Analysis of faults related to a heterogeneous stress history: reconstruction of a dismembered gold deposit, Stawell, western Lachlan Fold Belt, Australia. Journal of Structural Geology, 26, 1231-1256
Miller, J.McL., Wilson, C.J.L. (2004b). Stress controls on intrusion-related gold lodes: Wonga Gold Mine, Stawell, Western Lachlan Fold Belt, southeastern Australia. Economic Geology, 99, 941-963
Miller, J. McL., Wilson, C.J.L. (2002). The Magdala Lode System, Stawell, Southeastern Australia: Structural style and relationship to gold mineralization across the western Lachlan Fold Belt. Economic Geology, 97, 325-349
NQ, Groundwater & Environment (2011). Modelling of physical groundwater control options and cost estimates for ozone remediation at Stawell Gold Mines, July 2011.
NQ, Groundwater & Environment (2012). Review of Conceptual Groundwater Model with reference to the detection of SCN in Bore PS585.
Oldmeadow, D. (2008). Geochemical evolution of experimental tailings rehabilitations systems at Stawell Gold Mine, Victoria, Australia: implications for the use of thin composite cover in storage of sulphidic gold mine tailings. Thesis, Curtin University of Technology.
Pritchard, E.G. (2001). The Magdala Basalt in the east exploration decline, Magdala Gold Mine, Stawell Victoria: Petrography, alteration paragenesis and structural style. School of Earth Sciences, The University of Melbourne, 68p
Rockwater. (2010). Summary report on hydrogeological assessment and modelling of possible seepage from tailings storage facility No2. 621.0/101, March 2010.
Robinson, J.A., Wilson, C.J.L, Rawling T.J. (2006). Numerical modelling of an evolving gold -lode system: structural and lithological controls on ore-shoot formation in the Magdala Gold Mine, western Victoria, Australian Journal of Earth Sciences, 54, 799 – 823.
Robinson, J.A. (2005). Nature of the Mineralized (ore-shoot) environment within the Magdala Gold Deposit, western Lachlan Fold Belt, Australia, Unpublished thesis, Melbourne, Australia, The University of Melbourne, 373p
Schaubs, P.M., Wilson, C.J.L. (2002). The relative roles of folding and faulting in controlling gold mineralization along the Deborah anticline, Bendigo, Victoria, Australia. Economic Geology, 97, 351-370
Squire, R.J., (2004). Stawell Au Deposit – ARC Linkage Project: June 2004 progress report, Unpublished
Squire, R.J., Wilson, C.J.L. (2005). Tectonic responses to super-continent formation: correlation of Cambrian geological events along proto-Pacific margin of East Gondwana. Journal of the Geological Society, London, 162, 749-761 Mineral Resources and Reserves.
Tracey, J (2012). Mid Magdala Geology and Resource Model Report. SGM Internal Report.
Tracey, J (2013). Big Hill Davis Geology and Resource Model Report. SGM Internal Report.
Tracey, J (2015). Below Scotchmans 250 Geology and Resource Model Report. SGM Internal Report.
Tracey, J (2016). Moray Geology and Resource Model Report. SGM Internal Report.
192
| Technical Report | Kirkland Lake Gold |
| December 2016 | Stawell Gold Mines |
Tracey, J (2015). Federal Albion South Geology and Resource Model Report. SGM Internal Report.
Tracey, J., Blythman, R. (2014). Magdala S6000 Geology and Resource Model Report. SGM Internal Report.
Tracey, J., Chapman, W. (2014). Technical Report on Stawell Gold Mines, Victoria, Australia.
Tracey, J., Chapman, W. (2015). Technical Report on Stawell Gold Mines, Victoria, Australia.
Vandenberg, A.H.M., Willman, C.E., Maher, S., Simons, B.A., Cayley, R.A., Taylor, D.H., Morland, V.J., More, D.H., and Radojkovic A. (2000). The Tasman Fold Belt System in Victoria, Geological Survey of Victoria Special Publication
Vann, J, Jackson, S, and Bertoli, O. (2003). Quantitative Kriging Neighborhood Analysis for the Mining Geologist — A Description of the Method with worked case examples, in Proceedings of the, 5th International Mining Geology Conference (Australasian Institute on Mining and Metallurgy, Melbourne)
Watchorn, R.B., Wilson, C.J.L (1989). Structural setting of the gold mineralization at Stawell, Victoria, Australia. Economic Geology Monographs, 6, 292-309
Wilson, C.J.L., Will, T.M., Cayley, R.A., Chen, S. (1992). Geologic framework and tectonic evolution in Western Victoria, Australia. Tectonophysics, 214, 93-127
Xu, G., Powell, R., Wilson, C.J.L., Will, T.M. (1994). Contact metamorphism around the Stawell granite, Victoria, Australia. Journal of Metamorphic Geology, 12, 609-624
| Websites used |
| http://www.kitco.com/ |
| http://www.abs.gov.au |
| http://www.crirsco.com/docs/cim_definition_standards_20142.pdf |
193
| Technical Report | Kirkland Lake Gold |
| December 2016 | Stawell Gold Mines |
28 SIGNATURE PAGE
CERTIFICATE OF QUALIFIED PERSON
I, John Winterbottom, BSc, PGCert and MAIG, as an author of this report entitled “REPORT ON THE MINERAL RESOURCES & MINERAL RESERVES OF THE STAWELL GOLD MINE” dated effective December 31, 2016 prepared for Kirkland Lake Gold Ltd. (the “Issuer”) do hereby certify that:
| 1. |
I am Geology Manager, at Stawell Gold Mines Pty Ltd, located at Leviathan Road, Stawell, Victoria, Australia 3380. |
| 2. |
This certificate applies to the technical report entitled “REPORT ON THE MINERAL RESOURCES & MINERAL RESERVES OF THE STAWELL GOLD MINE”, dated effective December 31, 2016 (the “Technical Report”). |
| 3. |
I graduated with a Bachelor of Science degree in Geology from the University of Wollongong, Wollongong, in 1996, and a Post graduate Certificate in Geostatistics from Edith Cowan University Western Australia, in 2004. I have worked as a geologist since graduation from university in 1996. During that time, I have been employed as mine geologist, resource geologist, Technical Services Manager and Geology Manager, at several mining companies. I am a member in full standing of the Australian Institute of Geoscientists with Registration No. 6112. |
| 4. |
I am familiar with National Instrument 43-101 – Standards of Disclosure for Mineral Projects (“NI 43- |
|
101”) and by reason of education, experience and professional registration I fulfill the requirements of a “qualified person” as defined in NI 43-101. | |
| 5. |
I currently work at the Stawell Gold Mines. |
| 6. |
I am responsible for Sections 1, 2, 3, 4, 5, 6, 7, 8, 9, 10, 11, 12, 13, 14, 17, 19, 20, 23, 24, 25, 26, 27 & 28 of the Technical Report. |
| 7. |
I am not independent of the Issuer as described in section 1.5 of NI 43-101, as I am an employee of the Issuer. |
| 8. |
I have prior involvement with the property that is the subject of the Technical Report and have worked at Stawell Gold Mines since September 2016 in the role Geology Manager. |
| 9. |
I have read NI 43-101 and the parts of the Technical Report for which I am responsible have been prepared in compliance with NI 43-101. |
At the effective date of the Technical Report, to the best of my knowledge, information and belief, the parts of the Technical Report for which I am responsible contain all scientific and technical information that is required to be disclosed to make the Technical Report not misleading.
194
| Technical Report | Kirkland Lake Gold |
| December 2016 | Stawell Gold Mines |
Dated this 30th day of March, 2017.

195
| Technical Report | Kirkland Lake Gold |
| December 2016 | Stawell Gold Mines |
CERTIFICATE OF QUALIFIED PERSON
I, Ian Holland, BSc, MMinGeoSc, FAusIMM, as an author of this report entitled “REPORT ON THE MINERAL RESOURCES & MINERAL RESERVES OF THE STAWELL GOLD MINE” dated effective December 31, 2017 prepared for Kirkland Lake Gold Ltd. (the “Issuer”) do hereby certify that:
| 1. |
I am General Manager - Victorian Operations, at Kirkland Lake Gold, located at Fosterville Gold Mine, McCormicks Road, Fosterville, VIC, 3557. |
|
| |
| 2. |
This certificate applies to the technical report entitled “REPORT ON THE MINERAL RESOURCES & MINERAL RESERVES OF THE STAWELL GOLD MINE”, dated effective December 31, 2016 (the “Technical Report”). |
|
| |
| 3. |
I graduated with a Bachelor of Science degree in Geology from James Cook University, Townsville, Australia in 1997, and a Master of Minerals Geoscience from James Cook University, Townsville, Australia, in 2007. I have worked in the industry since graduation from university in 1997. During that time, I have been employed as a mine geologist and senior manager at several mining companies. I am a Fellow in full standing of the Australasian Institute of Mining & Metallurgy (FAusIMM) with Registration No. 210118. |
|
| |
| 4. |
I am familiar with National Instrument 43-101 – Standards of Disclosure for Mineral Projects (“NI 43- 101”) and by reason of education, experience and professional registration I fulfill the requirements of a “qualified person” as defined in NI 43-101. |
|
|
|
| 5. |
I last visited the Stawell Gold Mine, subject of the Technical Report, on 10th February, 2017. |
|
| |
| 6. |
I am responsible for Sections 1-3, 15, 16, 18, 21-22 and 25-28 of the Technical Report. |
|
| |
| 7. |
I am not independent of the Issuer as described in section 1.5 of NI 43-101, as I am an employee of the Issuer. |
|
| |
| 8. |
I have prior involvement with the property that is the subject of the Technical Report. I have worked for Kirkland Lake Gold (and predecessor companies) for the previous nine years and have regularly visited over this period. My current role as General Manager – Victorian Operations includes oversight of all activities at the Stawell site. |
|
| |
| 9. |
I have read NI 43-101 and the parts of the Technical Report for which I am responsible have been prepared in compliance with NI 43-101. |
|
| |
| 10. |
At the effective date of the Technical Report, to the best of my knowledge, information and belief, the parts of the Technical Report for which I am responsible contain all scientific and technical information that is required to be disclosed to make the Technical Report not misleading. |
196
| Technical Report | Kirkland Lake Gold |
| December 2016 | Stawell Gold Mines |
Dated this 30th day of March, 2017.

197

| Hislop Property |
| NI 43-101 Technical report |
Important Notice
This Technical Report has been prepared as a National Instrument 43-101 Technical Report, as prescribed in Canadian Securities Administrators’ National Instrument 43-101, Standards of Disclosure for Mineral Projects (NI 43-101) for Kirkland Lake Gold Ltd. (Kirkland Lake Gold). The data, information, estimates, conclusions and recommendations contained herein, as prepared and presented by the Authors, are consistent with: the information available at the time of preparation; the data supplied by outside sources, which has been verified by the authors as applicable; and the assumptions, conditions and qualifications set forth in this Technical Report.
Cautionary Note with Respect to Forward-Looking Information
Certain information and statements contained in this Technical Report are “forward looking” in nature.
All information and statements in this report, other than statements of historical fact, that address events, results, outcomes or developments that Kirkland Lake Gold Ltd. and/or the Qualified Persons who authored this report expect to occur are “forward-looking statements”. Forward looking statements are statements that are not historical facts and are generally, but not always, identified by the use of forward-looking terminology such as “plans”, “expects”, “is expected”, “budget”, “scheduled”, “estimates”, “forecasts”, “intends”, “anticipates”, “projects”, “potential”, “believes” or variations of such words and phrases or statements that certain actions, events or results “may”, “could”, “would”, “should”, “might” or “will be taken”, “occur” or “be achieved” or the negative connotation of such terms.
Forward-looking statements involve known and unknown risks, uncertainties and other factors which may cause actual results, performance or achievements to be materially different from any of its future results, performance or achievements expressed or implied by forward-looking statements. These risks, uncertainties and other factors include, but are not limited to, assumptions and parameters underlying the life of mine update not being realized, a decrease in the future gold price, discrepancies between actual and estimated production, changes in costs (including labour, supplies, fuel and equipment), changes to tax rates; environmental compliance and changes in environmental legislation and regulation, exchange rate fluctuations, general economic conditions and other risks involved in the gold exploration and development industry, as well as those risk factors discussed in the technical report. Such forward-looking statements are also based on a number of assumptions which may prove to be incorrect, including, but not limited to, assumptions about the following: the availability of financing for exploration and development activities; operating and capital costs; the Company’s ability to attract and retain skilled staff; sensitivity to metal prices and other sensitivities; the supply and demand for, and the level and volatility of the price of, gold; the supply and availability of consumables and services; the exchange rates of the Canadian dollar to the U.S. dollar; energy and fuel costs; the accuracy of reserve and resource estimates and the assumptions on which the reserve and resource estimates are based; market competition; ongoing relations with employees and impacted communities and general business and economic conditions. Accordingly, readers should not place undue reliance on forward-looking statements. The forward-looking statements contained herein are made as of the date hereof, or such other date or dates specified in such statements.
All forward-looking statements in this Technical Report are necessarily based on opinions and estimates made as of the date such statements are made and are subject to important risk factors and uncertainties, many of which cannot be controlled or predicted. Kirkland Lake Gold Ltd. and the Qualified Persons who authored this report undertake no obligation to update publicly or otherwise revise any forward-looking statements contained herein whether as a result of new information or future events or otherwise, except as may be required by law.
Page | ii
Hislop Property
NI 43-101 Technical report
Non-IFRS Financial Performance Measures
Kirkland Lake Gold has included a non-IFRS measure “total site costs”, “total site costs per ounce” and various unit costs in this Technical Report. The Company believes that these measures, in addition to conventional measures prepared in accordance with IFRS, provide investors an improved ability to evaluate the underlying performance of the Company. The non-IFRS measures are intended to provide additional information and should not be considered in isolation or as a substitute for measures of performance prepared in accordance with IFRS. These measures do not have any standardized meaning prescribed under IFRS, and therefore may not be comparable to other issuers.
Page | iii
Hislop Property
NI 43-101 Technical
report
| C O N T E N T S |
Page | iv
Hislop Property
NI 43-101 Technical report
| T A B L E S |
| F I G U R E S |
Page | v
Hislop Property
NI 43-101 Technical report
| A P P E N D I C E S |
| Appendix A: Hislop Property Claim list. | 78 |
Page | vi
SUMMARY
This National Instrument 43-101 technical report (technical report) was triggered by the disclosure from Kirkland Lake Gold Ltd (KLG) of its Annual Information Form (AIF) for the year 2016 (section 4.2 (1) (f) of the Instrument).
This technical report has been prepared for KLG, the beneficial owner of the Hislop Mine. KLG is listed on the Toronto Stock Exchange under the ticker symbol “KL”. This technical report provides the Mineral Resource and Mineral Reserve estimates for the Hislop Mine that have resulted from ongoing exploration and resource definition drilling and as a result of ongoing mine design and evaluation during the period January 1, 2016 to December 31, 2016.
The updated mineral resources and mineral reserves (as of December 31, 2016) are presented in
Summary Table 1 and Summary Table 2 respectively. Mineral resources are exclusive of mineral reserves.
| Indicated | Measured + Indicated | Inferred | |||||||
| Cont. | Cont. | Cont. | |||||||
| Tonnes | Grade | Gold | Tonnes | Grade | Gold | Tonnes | Grade | Gold | |
| (kt) | (g/t) | (koz) | (kt) | (g/t) | (koz) | (kt) | (g/t) | (koz) | |
| 2016 | 1,150 | 3.59 | 132 | 1,150 | 3.59 | 132 | 797 | 3.76 | 95 |
Notes
CIM definitions
(2014) were followed in the calculation of Mineral Resource
Mineral Resource
estimates were prepared under the supervision of D. Cater, P. Geo.
Mineral
Resources were estimated at a block cut-off grade of 2.2 g/t
Mineral
Resources are estimated using a long term gold price of US$1,200/oz or C$1,500 /
oz
A minimum mining width of 3m was applied
A bulk density of 2.84
t/m3 was used
Totals may not add exactly due to rounding
Summary Table 1: Mineral resources at the Hislop Mine Complex (as of Dec 31, 2016).
| Page | 1 |
Hislop Property
NI 43-101 Technical report
| HISLOP MINE | ||||
| ZONE | CATEGORY | TONNES | GRADE | OUNCES |
| THOR ZONE | PROVEN | 0 | 0.00 | 0 |
| THOR ZONE | PROBABLE | 175,545 | 5.80 | 32,744 |
| TOTALS | PROVEN | 0 | 0.00 | 0 |
| TOTALS | PROBABLE | 175,545 | 5.80 | 32,744 |
| TOTALS | 2 P'S | 175,545 | 5.80 | 32,744 |
Notes
CIM definitions
(2014) were followed in the calculation of Mineral Reserves
Mineral Reserves
estimates were prepared under the supervision of P. Rocque, P. Eng.
Cut-off
grades were calculated for each stopes
Mineral Reserves were estimated using
a long term gold price of US$1,200/oz (CDN$1,500)
Totals may not add exactly
due to rounding
Summary Table 2: Mineral reserves at Hislop Mine Complex (as of Dec 31, 2016).
The open-pit mine ceased operation in 2015 and was placed on care and maintenance.
A mine design was proposed for development of the underground deposit, below the current pit. No other significant changes, besides mineral reserves depletion of the open-pits, occurred since the last technical report.
Page | 2
Hislop Property
NI 43-101 Technical report
| 1.0 |
INTRODUCTION |
|
This National Instrument 43-101 technical report (technical report) was triggered by the disclosure from KLG of its Annual Information Form (AIF) for the year 2016 (section 4.2 (1) (f) of the Instrument). It was prepared by employees of KLG and is addressed to KLG. | |
|
This update from the 2009 technical report covers the changes in mineral resources and mineral reserves, mine design and life of mine plan pertaining to the Hislop deposit located in the Taylor Township, Ontario, Canada. | |
|
Information was obtained through the field and technical work related to the Hislop deposit over the past several years. Most of that information was derived by KLG employees. | |
|
The two qualified persons (QP) visited the Hislop property in 2016 and numerous times since 2010 and participated in the direction of the field and technical work. | |
|
The units of measures used in this report conform to the metric system. Unless stated otherwise, the Canadian Dollar (CDN$) is the currency used in this technical report. A list of abbreviations is displayed in Table 1-1. |
Page | 3
Hislop Property
NI 43-101 Technical report
| Abbreviation | Meaning |
| a | annum |
| CDN$ | Canadian dollar |
| cm | centimetre |
| d | day |
| DDH | diamond drill hole |
| EM | electromagnetic |
| g | gram |
| gpt, g/t | gram per tonne |
| ha | hectare (2.471 acres) |
| HLEM | horizontal loop electromagnetic |
| IP | induced polarization |
| k | kilo |
| kg | kilogram |
| km | kilometre |
| L, l | litre |
| m | metre |
| M | mega |
| $M | million dolars |
| m³ | cubic metre |
| MASL | metres above sea level |
| min | minute |
| ODH | overburden drill hole |
| oz | Troy ounce (31.1035 grams) |
| koz | thousand ounces |
| ppm, ppb | part per million, part per billion |
| s | second |
| ton | short ton (0.907185 tonne) |
| tonne, t | metric tonne |
| tpa, t/a | tonne per year |
| tpd, t/d | tonne per day |
| US$ | United States of America Dollar |
| VLEM | vertical loop electromagnetic |
| VLF-EM | very low frequency electromagnetic |
Table 1-1: List of Abbreviations.
Page | 4
Hislop Property
NI 43-101 Technical report
| 2.0 |
RELIANCE ON OTHER EXPERTS |
|
The QP relied on the following people for non technical information: |
|
• |
Alasdair Federico, Executive Vice President of Social Corporate Responsibility for section 4.3 and portions of Section 19. | |
| • | Ryan Cox, Environmental Manager, for Section 3.3 and portions of Section 19. |
Page | 5
Hislop Property
NI 43-101 Technical report
| 3.0 |
PROPERTY DESCRIPTION AND LOCATION |
|
The following sections are copied (and updated) from the previous technical report (SWRPA, 2009) |
| 3.1 |
Location |
|
The Hislop Mine property is part of KLG’s Larder Lake Mining District land holdings (Figure 3-1). The property consists of 26 patented mining claims and is located in Hislop and Guibord Townships (Figure 3-2). All of the mineral claims that are patented have been surveyed. The mining claim cover more than 6 km2. The property is centered at approximately 551000E and 5371000N in NAD83, Zone 17. |

Figure 3-1: Hislop property location map.
Page | 6
Hislop Property
NI 43-101 Technical report

|
Figure 3-2: Hislop property claim map. | |
| 3.2 |
Mineral Tenure and Encumbrances. |
|
The claim group is centered at 5379000N and 529000E in NAD83, zone 17 (using UTM coordinate system). | |
|
The 3,269 ha property is comprised of 78 claims that include patented, leased, mineral claims and surface and mineral rights claims. | |
|
The Advance Royalty agreement with Franco-Nevada was bought back for US$1.457 millions around September 25th, 2015. | |
|
The QP is not aware of any other royalty covering the Hislop Mine. |
Page | 7
Hislop Property
NI 43-101 Technical report
| 3.3 |
Permit Status |
|
All permits and certificates are in good standing with the appropriate regulatory offices. Updates or modifications are performed in compliance with current legislation. | |
| 3.4 |
Environmental Liability and Other Potential Risks |
|
In the Qualified Person’s (QP) opinion, there are no significant factors or risks that may affect access, title or the right or ability of KLG to perform work on the Hislop property. |
Page | 8
Hislop Property
NI 43-101 Technical report
| 4.0 |
ACCESSIBILITY, CLIMATE, LOCAL RESOURCES, INFRASTRUCTURE AND PHYSIOGRAPHY |
|
The following sections are copied (and updated) from the previous technical report (SWRPA, 2008). |
| 4.1 | Climate, Topography and Physiography |
|
The climate in the area is typical continental, with extreme seasonal variations. From May through September, mean temperatures range from 9ºC to 17ºC, with occasional daily highs in excess of 30ºC. In this area, winter conditions can be experienced from October through April. From December through March, mean temperatures range from -7ºC to -16ºC, but there can be short periods of -20ºC to -30ºC. There can be at least 50 cm snow on the ground on average during winter. Annual precipitation amounts to approximately 874 mm, with 66% of this occurring as rain. | |
|
| |
|
All of the property is covered by flat lying to gently rolling terrain with average topographic relief of approximately 6 m around the Hislop East and West Pits. Overburden depths range from 3 m to 40 m, with average overburden depth on the property ranging from 5 m to 10 m. Elevations range from approximately 250 m to 300 m above sea level. The area is reasonably well drained by creeks and small rivers, and there are numerous small swamps and marsh areas. The area is located within the Boreal Shield zone: tree cover is normally thick and predominantly coniferous (with black spruce and jack pine being the most common species), with lesser stands of poplar and birch. The current cover is believed to be a mix of second and third growth forest as a result of logging operations and forest fires. | |
|
| |
| 4.2 |
Means of Access to the Property |
|
| |
|
The Hislop property is located in the District of Cochrane, 12.7 km east of Matheson on Ontario Provincial Highway 101 and 4.5km south on Tamarack Road (Figure 4-1). To reach the property from Toronto, there are daily scheduled flights to Timmins, which is approximately 80 km by road west of the property. From Montreal, there are daily scheduled flights to Rouyn-Noranda, which is 142 km by road east of the property. Access to various parts of the property package can be achieved by various bush roads and logging roads that join Ontario Provincial Highway 101. In the summer months, these roads are normally passable. The Trans-Canada Highway (Highway 11) goes through the town of Matheson. The Hislop property has been cleared of all infrastructure following the closure of the mine by St. Andrew Goldfields LTD. (SAS) in 2015. The mine area is gated on both access roads into the mine, one on Tamarack Road and the second coming off of Highway 572. |
Page | 9
Hislop Property
NI 43-101 Technical report

|
Figure 4-1: Access to the Hislop property. | |
| 4.3 |
Infrastructure and Local Resources |
|
The infrastructure is well developed and can support mining activities in the area. Power, fuel sources and water are readily available for the Hislop property. Water is plentiful in the area and can be sourced from rivers and small lakes. The existing site power configuration consists of a 27 kV feed, delivered to site via a single wood pole transmission line originating at Tamarack Road. The power is distributed within the site parameters by means of two pole lines, each terminated with pole mounted transformers, metering stations and distribution panels, providing the site with 120V/240V/600V – 200A services. The area is well serviced with an array of major roads and two airports (in Timmins and Rouyn-Noranda). |
Page | 10
Hislop Property
NI 43-101 Technical report
The Black River-Matheson Township (116,167 ha) has an approximate population of 2,800 residing mainly in the towns of Matheson, Shillington, Holtyre and Ramore. Further to the west are the towns and cities of Porcupine, South Porcupine, Schumacher and Timmins (approximately 45,000 residents). To the north are the towns of Iroquois Falls and Cochrane. To the south is the Town of Kirkland Lake (approximately 10,000 residents).
KLG owns an office building in Matheson that is being used as its Regional Exploration Department base. Additionally, SAS acquired two former motels in Matheson that are operated as temporary housing for relocated employees. KLG uses many local residents as support staff and local contractors to maintain the facilities.
KLG has recently signed an agreement with First Nations who have treaty and aboriginal rights which they assert within the operations area of the mine.
The agreement provides a framework for strengthened collaboration in the development and operations of the mine and outlines tangible benefits for the First Nations, including skills training and employment, opportunities for business development and contracting, and a framework for issues resolution, regulatory permitting and KLG future financial contributions.
Page | 11
Hislop Property
NI 43-101 Technical report
| 5.0 |
HISTORY |
|
The information for Section 5 is copied and summarized in the following sub-sections from the previous technical report (RPA, 2009). |
| 5.1 |
Prior Ownership and Historical Exploration |
| The Hislop property has a long history of exploration and development as well as production in 1990-1991, 1993-1994, 1999-2000, and 2005-2006 as summarized below. | |
|
| |
|
During the period from 1934 through to 1936, McIntyre Mines optioned six claims owned by Torovic Gold Mines and six claims owned by Vindur Porcupine Gold Mines, which form much of the current Hislop Mine property, and carried out a program of extensive surface trenching as well as a surface diamond drill program totalling 3,962.4 m in 45 holes. Results of the program proved inconclusive and the option was dropped in 1936. | |
|
| |
|
In 1935, Mining Corporation drilled three holes totalling 819.3 m along a northeast to southwest section in the S1/2, Lot 2, Con III, on ground west of the Ross Mine. Results of this work revealed gold values over narrow widths in altered volcanic rocks, but no further work was undertaken. | |
|
| |
|
Torovic Gold Mines and Vindur Porcupine Gold Mines amalgamated in 1938 to form Kelrowe Gold Mines, Limited. During the period 1939 through 1940, Kelrowe sunk a shaft to a depth of 98 m, established levels at the 24 m, 55 m and 91 m elevations, undertook lateral development on the 24 m and 55 m levels, and completed 1,498 m of underground diamond drilling from stations on all three levels. All operations were suspended in 1940 and the mine was allowed to flood. | |
|
| |
|
In 1939, Hollinger Mines Limited (Hollinger) drilled 10 surface holes for a total of 2,644 m in the S1/2 Lot 2, Con. III and the N1/2 Lot 2, Con. II that indicated the presence of interesting gold values in a broad zone of altered volcanic rocks. Subsequently in 1940, Hollinger completed a drive to the west-northwest at the 137 m level from the Ross Mine workings that extended 160 m on to the N1/2 Lot 2, Con. II and completed a 33.5 m crosscut towards the south. A total of 1,953 m of underground diamond drilling was completed from the crosscut and stations along the drive. | |
|
| |
|
In 1945, Kelwren Gold Mines, Limited was formed when Kelrowe Gold Mines, Limited and Wren Gold Mines amalgamated. During the period 1945 to 1947, additional claims were obtained and a 32 hole surface diamond drill program totalling 5,028 m was completed. The shaft was deepened to 145 m and a new level established at the 137 m elevation. Development work began on the 91 m level, and more extensively on the 137 m level, where 4,588 m was drilled in 140 holes. In 1948 Kelwren Gold Mines, Limited reorganized to form Kelore Gold Mines, Limited. During 1948, an underground diamond drill program of 122 holes totalling 3,847.5 m was completed. Operations were suspended in January 1949 and the workings allowed to flood. During the period 1949 to 1950, Kelore completed 3,466 m of surface diamond drilling in 14 holes. |
Page | 12
Hislop Property
NI 43-101 Technical report
During the years 1945 to 1949, Hiskerr Gold Mines Ltd. completed two diamond drill programs on two claims to the northwest of the Kelwren Shaft (23129 and 23130) that now form part of the Hislop Mine property.
In 1953, Kelore Gold Mines, Limited was renamed New Kelore Mines, Limited (New Kelore).
During 1955, Hiskerr Gold Mines Ltd. completed additional diamond drilling amounting to approximately 1,220 m on the Hiskerr claims.
Hollinger optioned the Hislop property from New Kelore in 1973, and during the period 1973 through 1980, completed an extensive surface and underground exploration program. In 1973, 2,322.3 m in 11 surface diamond drill holes (HK series drill holes) were drilled and the mine workings were dewatered. In 1974, Hollinger completed an underground sampling and mapping program, and completed an underground diamond drill program comprising 8,914.8 m in 239 holes (K series holes). Geological reserves were estimated following this work. The option was dropped in 1980. In 1985, Geddes Resources Ltd. (Geddes) optioned the property from New Kelore and Goldpost Resources Inc. (Goldpost) subsequently acquired 100% of the Geddes interest in the property.
In 1986, Goldpost acquired two additional claims which increased the property holdings to a total of 19 patented mining claims and one 160 acre VETERAN Lot. During the period 1986 to 1989, Goldpost completed an extensive surface exploration program consisting of line cutting, ground magnetic surveys, ground very low frequency (VLF) surveys, geological mapping, and trenching, and surface diamond drilling comprising 29,612 m in 303 holes (GK series holes). An underground development program consisting of a 422 m East Decline and a 997 m Main Decline was completed. Connections from the Main Decline to the existing workings were made at the 55 m, 91 m, and 137 m levels and an underground diamond drill program consisting of two drill holes (156.7 m in total) in the East Decline and 42 drill holes (3,614.6 m, HE series holes) in the Main Decline was completed. All levels and declines were channel sampled and geologically mapped.
In 1990, a joint venture was established between Goldpost and SAS to mine parts of the Shaft Zone and the North Zone. During 1990 and 1991, 5,401 m of underground drilling in 288 holes was completed and mining took place.
Page | 13
Hislop Property
NI 43-101 Technical report
|
In 1993, the Hislop property was acquired by SAS from Goldpost. In the period 1993 to 1994, the workings were pumped out, underground drilling totalling 10,373.9 m in 270 holes was completed, development continued and mine production was milled at the Stock Mill. In 1994, production was curtailed and underground workings allowed to flood. Entrances to the declines were sealed with steel barriers in 1995 and equipment was removed from site. | |
|
In 1996, the two Hiskerr claims were acquired by SAS. A grid with line spacing at 30 m (100 ft) was established over the entire Hislop Mine property and Realsection induced polarization (IP) surveying totalling 201 line km was completed. During 1996 to 1997, a surface diamond drill program amounting to 8,575.2 m in 14 drill holes (including two wedged holes and deepening of a hole drilled during an earlier drill program) tested several of the IP anomalies | |
| 5.2 |
Historical Production |
|
During the 1990-1991 production program, mining methods included longhole (60%), silling (20%), and shrinkage (20%), with ore coming from the Shaft Zone and the North Zone, just north of the old shaft. Haulage of ore out of the mine was by diesel- powered trucks up the ramp. Development for exploration and haulage was in the hanging wall because of poor footwall ground conditions. The ore was stored on surface, then transported by highway truck to the Stock Mill of SAS for processing. Average mill recovery was 92.2%. Mining ceased in August 1991 and the workings were allowed to flood. Cutting high assays to 17.1 g/t Au gave an estimated grade for the reserves mined that was 10% lower than the mill head grade. Cutting to 31.1 g/t Au gave a closer correlation between the reserves mined and the mill head grade. | |
|
For the 1993-94 campaign, the workings were pumped out and the 2nd Level and 3rd Level were developed south from the decline through the Marsh Zones and the South Zone. The 5-East Zone was discovered near the West Marsh Zone. Ore was hauled up the ramp and trucked to the Stock Mill for processing. Mining was predominantly by longhole stoping. The main ore sources were the Shaft Zone (42,600 tonnes) and the North Zone (35,400 tonnes). Production also came from the Marsh Zones, 5-East Zone, Decline Zone, and South Zone. As noted elsewhere, metallurgical recovery from the Marsh Zones and the South Zone were lower than expected. This caused the overall Hislop Mine recoveries to decrease from 92% in the first half of 1994 to 83% in the latter half of 1994. | |
|
Production during the 1990-1991 and 1993-1994 campaigns is summarized in Table 5-1. |
Page | 14
Hislop Property
NI 43-101 Technical report
| Year | Tonnes Mined (t) |
Grade (g/t) | Cont. Gold | Tonnes Milled (t) |
Ounces Produced |
| 1990 | 23,516 | 7.89 | 6,584 | 18,756 | 4,199 |
| 1991 | 45,986 | 7.1 | 11,572 | 51,271 | 11,750 |
| 1992 | - | - | - | - | - |
| 1993 | 22,808 | 3.05 | 2,480 | 17,047 | 1,634 |
| 1994 | 103,688 | 4.83 | 18,040 | 114,717 | 17,620 |
| Total | 195,998 | 5.55 | 38,676 | 201,791 | 35,203 |
|
Table 5-1: Underground Production History 1990-1994. | |
|
There was open pit production from the West Zone in the period July 1999 to October 2000. Total production from this time period (based on mill records) was 185,900 tonnes grading 3.4 g/t Au. An additional 612,000 tonnes of waste were mined for a waste:ore ratio of 3.3:1. The mine was operated at a nominal production rate of 1,800 tpd and a cut-off grade of 2.0 g/t Au was utilized. The ultimate pit is approximately 300 m long northwest-southeast, and 100 m wide. Locally, it extends to approximately 60 m below the surface. | |
|
During 2005 and 2006, the northeast side of the pit was extended 135 m by 45 m in area to a depth of 27 m. Production records indicate that from August 2006 to March 31, 2007, a total of 52,268 tonnes grading 2.07 g/t Au (from muck samples) were mined. | |
|
SAS commenced mining activities in 2009 and continued through to 2014. All infrastructure was removed and final milling ended in mid-2015. | |
| 5.3 |
Historical Mineral Resources |
|
KLG is not treating the historical estimates as current mineral resources or mineral reserves. A qualified person has not done sufficient work to classify the historical estimates as current mineral resources or mineral reserves. | |
|
Table 5-2 lists the historical mineral resources for the Hislop Mine. These mineral resources were estimated in 1995 by SAS personnel. At the completion of mining in 1994, Scott Wilson RPA (then RPA) reviewed and restated the mineral resources in accordance with the classification at the time. At that time, mineral resources were also reported in the West Zone. However, because of the open pit production, the West Zone has now been removed from the historical mineral resource statement. |
Page | 15
Hislop Property
NI 43-101 Technical report
| Indicated | Inferred | ||||||
| Area | Zone | Tonnes (kt) | Grade (g/t) |
Cont. Gold | Tonnes (kt) | Grade (g/t) |
Cont. Gold |
| Shaft | Shaft | 14.5 | 7.3 | 3,400 | 20 | 5.4 | 3,500 |
| Shaft | North | 25.4 | 6.7 | 5,400 | 0 | 0 | 0 |
| Shaft | Total | 39.9 | 6.9 | 8,900 | 20 | 5.4 | 3,500 |
| South | 5-east | 18.1 | 6.2 | 3,600 | 0 | 0 | 0 |
| South | Marsh | 28.1 | 5.3 | 4,800 | 0 | 0 | 0 |
| South | South | 82.6 | 5.9 | 15,700 | 0 | 0 | 0 |
| South | Total | 128.8 | 5.8 | 24,200 | 0 | 0 | 0 |
| Total | 168.7 | 6.1 | 33,100 | 20 | 5.4 | 3,500 | |
Notes:
1. All assays greater than
31.103 g/t Au (1.0 oz/ton Au) are cut to 31.103 g/t Au (1.0 oz/ton Au).
2.
Some of the Indicated Resources in the Shaft and South Areas could be
categorized as Measured.
3. Numbers in this table have been rounded
Table 5-2: Historical Mineral Resources as of December 31, 1994.
These mineral resource estimates were prepared prior to the introduction of NI 43-101 and are not considered to be compliant with NI 43-101. The estimates are considered to be a historical resource initially reported in “Report on the Stock, Taylor, and Hislop East Properties of St Andrew Goldfields” by RPA and dated April 7, 1995. The estimates are considered to be relevant because they give an indication of the size and grade of the remaining tonnages. The classification used in the 1995 report may not be consistent with NI 43-101.
Mineral resources were also calculated during the mining tenure between 2009 and 2015. The following Table 5-3 outlines the mineral resources completed between 2014 and 2016.
| Indicated | Measured + Indicated | Inferred | |||||||
| Cont. | Cont. | Cont. | |||||||
| Tonnes | Grade | Gold | Tonnes | Grade | Gold | Tonnes | Grade | Gold | |
| (kt) | (g/t) | (koz) | (kt) | (g/t) | (koz) | (kt) | (g/t) | (koz) | |
| 2016 | 1,150 | 3.59 | 132 | 1,150 | 3.59 | 132 | 797 | 3.76 | 95 |
| 2015 | 983 | 4.01 | 127 | 983 | 4.01 | 127 | 690 | 4.16 | 92 |
| 2014 | 983 | 4.01 | 127 | 983 | 4.01 | 127 | 690 | 4.16 | 92 |
Table 5-3: Hislop mineral resource estimates 2014-2016.
Page | 16
Hislop Property
NI 43-101 Technical report
| 6.0 |
GEOLOGICAL SETTINGS AND MINERALIZATION |
|
The following sections are copied (and updated) from the previous technical report (SWRPA, 2009). |
| 6.1 |
Regional Geology |
|
The Hislop Mine Complex lies within the Southern Abitibi Greenstone Belt (SAGB) of the Superior Province in northeastern Ontario (Figure 6-1). In very general terms, the Abitibi Subprovince consists of Late Archean metavolcanic rocks, related synvolcanic intrusions, and clastic metasedimentary rocks intruded by Archean alkaline intrusions and Paleoproterozoic diabase dikes. The traditional Abitibi greenstone belt stratigraphic model envisages lithostratigraphic units deposited in autochthonous successions, with their current complex map pattern distribution developed through the interplay of multiphase folding and faulting (Heather, 1998). | |
|
At a regional scale, the distribution of supracrustal units in the SAGB is dominated by east-west striking volcanic and sedimentary assemblages. The structural grain is also dominated by east-west trending Archean deformation zones and folds. The regional deformation zones commonly occur at assemblage boundaries and are spatially closely associated with long linear belts representing the sedimentary assemblages. The dominant regional fault in this area is the Porcupine-Destor Fault Zone (PDF). The current locations of these regional deformation zones are interpreted to be proximal to the locus of early synvolcanic extensional faults. Belt scale folding and faulting was protracted and occurred in a number of distinct intervals associated at least in the early stages with compressive stresses related to the onset of continental collision between the Abitibi and older subprovinces to the north (Ayer et al., 2005). Throughout the history of the Abitibi Subprovince, there was repeated plutonism defined by three broad suites: |
| • |
synvolcanic plutons; | |
| • |
syntectonic intrusions that range in age from 2695 Ma to 2680 Ma and include tonalite, granodiorite, syenite, and granite; and, | |
| • |
post tectonic granites that range in age from approximately 2665 Ma to 2640 Ma (Ayer et al., 1999). |
The southern part of the Abitibi greenstone belt, in the general vicinity of the Hislop Mine Complex, consists of three major volcanic lithotectonic assemblages and two unconformably overlying primarily metasedimentary assemblages (Ayer et al., 2002). From oldest to youngest, these assemblages are the Stoughton-Roquemaure (2723 Ma–2720 Ma), the Kidd-Munro (2719 Ma–2711 Ma), the Blake River (2704 Ma–2696 Ma), the Porcupine (2690 Ma-2685 Ma), and the Timiskaming (2676 Ma-2670 Ma). The three oldest assemblages are all volcanic with plume, island arc, and rifted island arc affinities, have conformable contacts, and were developed by volcanic construction in variable extension to compression tectonic environments. On a belt scale, these form a broad synclinorium cored by the Blake River assemblage.
Page | 17
Hislop Property
NI 43-101 Technical report

Figure 6-1: Regional Geology Map around the Porcupine-Destor Fault Zone.
Page | 18
Hislop Property
NI 43-101 Technical report
| 6.2 |
Local and Property Geology |
|
The Hislop Mine Complex (Figure 6-2) is underlain by a sequence of mainly tholeiitic basalts to the North and basaltic to peridotitic komatiite volcanic flows to the South intruded by a number of sheets or dikes of feldspar porphyritic syenite. The syenite related to gold mineralization is a silicified feldspar syenite, which has a NW-SE strike occurring within a major regional fault. Narrow dikes of lamprophyre intrude all other rock types, but mainly in the ultramafic volcanic flows and are generally aligned parallel to the main geological contacts and structures. The rocks have undergone low grade metamorphism and are located in a broad deformation zone, which is part of the PDF. Because of this metamorphism and deformation, many of the geological contacts show evidence of shearing and displacement due to the competency contrast between the major rock types. In addition many of the rocks have undergone varying intensities of hydrothermal alteration, mainly carbonatization and silicification, in part related to the gold mineralization, making the correlation of the rock types difficult across the property. | |
|
Two open pits have been mined on the Hislop Mine Complex being identified as the East Pit (Shaft Zone and South Area) and West Pit (West Zone). The East and West Pits have an approximate strike length of 700m and 300m respectively. Although both pits have similar strike directions, there holds the possibility that there is a minor cross- cutting fault between the two pits as there is lateral sinistral movement causing a minor offset. Minor faults (Figure 6-3) are visible in the pit walls with strike directions parallel, subparallel and perpendicular to the strike of the mineralized trend |
Page | 19
Hislop Property
NI 43-101 Technical report

Figure 6-2: Hislop property geology.
Page | 20
Hislop Property
NI 43-101 Technical report

Gold mineralization at the Hislop Mine Complex follows a felsic intrusion related model, with the main control being the silicified feldspar syenite. The syenite is generally subvertical with varying thicknesses across both pits. The Ultramafic-Syenite contact has been the main focus of targets for gold mineralization in recent drilling due to the higher expected grade. The ultramafic rock often alters to a green carbonate rock with different degrees of fuchsite and/or sericite alteration and finely disseminated pyrite mineralization. At depth, sericite alteration has been more commonly associated with the gold mineralization. The gold however, has been present within both the ultramafic and syenite lithologies, yielding higher grades within the ultramafic rock. Within the mafic volcanic rock, gold mineralization can be associated with minor syenitic dike swarms closer to the main syenite distinct by hematite alteration, but is also present around quartz-carbonate veinlets and fracture systems where pyrite mineralization and hematization or silicification occur.
Page | 21
Hislop Property
NI 43-101 Technical report
Deeper drilling beneath the East Pit along strike to the east has resulted in the feldspar syenite being non-existent or pinching out. Therefore, a contact between the mafic and ultramafic rock occur.
Hislop North exploration has discovered a different geological interpretation. Drilling in the area targeted breccia style structures present within mafic rock units. The targets were developed through potential mineralized extensions from Primero Mining’s Grey Fox Property trending south onto the Hislop Property. The breccia style structures are also similar to those of the Ross Mine, which was a 1 million oz gold producing mine. These structures are interpreted to be within a brittle deformation zone as one of the types of Archean lode deposits (Figure 6-4).
Page | 22
Hislop Property
NI 43-101 Technical report

Page | 23
Hislop Property
NI 43-101 Technical report
Lithology in the Hislop North area consists of mainly of alternating mafic rock units, intrusive and volcanic. Mafic pillowed flows, variolitic, spherulitic and amygdaloidal flows have been logged by the geologists historically. These rocks have undergone low grade metamorphism to the lower greenschist facies. Carbonatization (calcite, ankerite, and dolomite) are common throughout most rock units as well as chloritization. Closer towards mineralized veins, silicification (bleaching) or albite alteration becomes dominant with fracture controlled sericitization. Graphite has been present within the fractures around quartz veins known to carry gold.
Sulphide alteration is common within and adjacent to quartz veins, which have been sampled and producing high grade results. Dominantly pyrite is identified as the main replacement. There is no strong correlation with other sulphides being more common with gold hosting veins, although geologists for Primero Mining have identified molybdenite as a common sulphide with gold hosting veins. Pyrrhotite and chalcopyrite have been identified as well, but mainly clustered or coarse grained within pillow selvages and in carbonate veinlets.
Regional fault structures have a strong role in controlling the extension of these gold hosting veins. Three large faults present in the area is the Gibson-Kelore Fault, which strikes northeast to southwest to the west of the property, the Arrow Fault, which is an east-west striking fault approximately 75m south of the northern border and the Ross Fault, a NW-SE striking fault with gold deposits directly adjacent to it. The Arrow fault has been interpreted to be a sinistral fault.
Page | 24
Hislop Property
NI 43-101 Technical report
| 7.0 |
DEPOSIT TYPE |
| 7.1 |
Deposit Type |
|
The Hislop deposit is felsic intrusive related and located in a broad deformation zone within the PDF. Numerous gold deposits occur in the vicinity of the PDF and related structures, such as the Pipestone Fault. These include the major mines of the Timmins camp (Dome, Hollinger, McIntyre, and Pamour). A number of gold deposits have been discovered in more recent years, including the Holt-McDermott Mine, Holloway Mine, Owl Creek Mine, Bell Creek Mine, Hoyle Pond Mine, Aquarius Mine, Maude Lake Deposit, Glimmer (Black Fox) Mine, Stroud Deposit, Fenn-Gib Deposit, Ludgate Deposit, Jonpol Mine, and a number of other prospects. | |
|
Some of the PDF gold deposits extend from surface to over 1,000 m below surface, and some are blind deposits, in that they do not reach bedrock surface. The top of the Holloway deposit, for example, is over 300 m below surface. | |
|
The following description of potential gold deposit types on the KL Timmins area claims is from Reid (2003). Deposit types and exploration models can generally be characterized as one of three main types, although they tend to merge with each other at times. The deposit types may have more to do with the different host rocks than a genetic difference. Proximity to the main break(s), associated splays, presence of hydrothermal alteration, Timiskaming sediments or high level porphyries are common to all. The three main types are as follows: |
| • |
Green Carbonate Hosted: Nighthawk Lake, Aquarius, Stock, West Porphyry, and Glimmer all fall into this classification. Gold is generally present as free gold in quartz veins or with disseminated sulphides associated with small intrusive rocks or albitic alteration in completely carbonate altered ultramafic flows. Carbonate alteration is up to 200 m wide and can be traced for thousands of metres discontinuously on strike. The gold is often in crosscutting or conformable features. Timiskaming conglomerates are often proximal or part of the package. | |
| • |
Felsic Intrusive Related: Ronnoco, Pominex, parts of the Taylor Shaft and Hislop are examples of this type. The intrusive rocks vary from feldspar (plus or minus quartz) porphyry in the west to more syenitic in the east. Mineralization is characterized by both thin crosscutting to stockwork quartz veins to disseminated sulphides to more contact skarns or hornfels, depending on host rock. Carbonate alteration is still quite common in the host rocks with silica, sericite, and hematite more within the intrusive. |
Page | 25
Hislop Property
NI 43-101 Technical report
| • |
Mafic Volcanic Hosted: Holloway, Holt, and Hoyle Pond are examples. Ubiquitous carbonate alteration with iron carbonate, albite, silicification and sericite more proximal to ore. Quartz veins and/or albitized variolitic mafic flows are often central to the zone and often found near the mafic/ultramafic contact. |
| 7.2 |
Mineralization |
|
Several mineralized zones occur on the Hislop property along a strike length of approximately 1,200 m following the fault contact between mafic flows to the north and ultramafic rocks to the south. Gold is associated with the margins of feldspar porphyritic syenite dikes that have intruded the mafic and ultramafic rocks. The dikes are generally conformable to the contact between the mafic and ultramafic rocks striking west to northwest and dipping steeply to the north. | |
|
It had been observed that gold is distributed at or near major lithologic contacts and the locus of gold mineralization in particular is limited to the north by the Mafic Volcanic – Syenite (+other) altered rocks contact. This contact was modeled in detail, using sections spaced 25m apart oriented at 032° (i.e. looking Azimuth 302°) which was the orientation of the historic local grid and design orientation of most surface drill holes in this area. (Miree, 2013) | |
|
The mineralized zones have been called from west to east; the West Zone, Shaft Zone, and the South Area. | |
|
Two settings and styles of gold mineralization are present at the Hislop Mine. Gold occurs on the south side of the syenite dike complex in the carbonate and carbonate breccia rock, which separates the syenite dikes from the less altered ultramafic volcanic rocks to the south side. Gold also occurs on the north contact of the syenite dike complex in quartz veinlets, stockworks and fractures in hematite altered and syenitized mafic metavolcanic rocks. | |
|
The rocks and the associated mineralization strike northwest-southeast and dip steeply north to vertically. Later cross faults trend both east-west and northeast to southwest, and are steeply to vertically dipping. Gold mineralization occurs along the length of the syenite dike complex, but the gold-bearing zones tend to be wider and higher in grade where associated with these cross faults. The minor off-setting along these faults causes the mineralized zones to have an irregular appearance in detail. | |
|
Previous reports have described several zones of gold mineralization occurring in three main mineralized areas along a strike length of 1,100 m, centred on the original shaft. These include the Shaft Area, the South Area, and the West Area. KLG has explored and reinterpreted the near surface area of the Shaft Area. |
Page | 26
Hislop Property
NI 43-101 Technical report
Diamond drill information was used to create a robust three dimensional picture for each of the lithological units and each of the mineralized zones in the Shaft Area. The mineralized units were named 3000, 3001, 3002, and 3003. The zones were followed over a strike length of 1.4 km. Figure 7-1 is a schematic cross-section showing the geology and extent of mineralized zones 3001 and 3002. Figure 7-1 is a schematic cross-section showing the geology and extent of mineralized zones 3001 and 3002.

Zone 3001 is hosted within the altered mafic metavolcanic unit. The mineralization is found within lenses of carbonate fracture veinlets/stringers with carbonaceous and hematitic alteration as halos. Pyrite mineralization is very finely disseminated.
Zone 3002 is hosted within the altered (hematized) mafic metavolcanic unit along the north side of the syenite contact. Pyrite mineralization is very finely disseminated within the mafic metavolcanic unit with little carbonate fracturing and stringers. The unit is fairly continuous along its 1.4 km strike length.
Page | 27
Hislop Property
NI 43-101 Technical report
|
Zone 3003 is hosted within the altered ultramafic metavolcanic along the ultramafic and syenite contact. Gold mineralization is associated with the disseminated sulphides | |
|
(typically pyrite). The altered host rock includes the “Green Quartz Carbonate” unit, which hosts the higher grade material mined underground. The unit is typically defined as moderately to strongly carbonate and fuchsite altered. The degree of alteration varies along the 1.2 km strike length. | |
| 7.2.1 |
West Zone |
|
The West Zone sits directly on a major fault that strikes at approximately azimuth 122º (east-southeast) and dips steeply north or vertically. The fault is represented by a thick zone of talc-chlorite schist at least 70 m to 300 m thick. Fabric in the talc schist is closely spaced on a millimetre scale and most of the original fabric dips have been destroyed. The fabric is dominantly oriented with an azimuth of 122° and is nearly vertical. Rare zones in the talc chlorite showing spinifex texture and whole rock high chrome contents (>2,000ppm) which support the assumption that these rocks were komatiitic in composition. The talc schist forms the south wall of the current pit and extends approximately halfway across the pit in the west end, and almost entirely across the pit at the east end. | |
|
To the south of the talc-chlorite schist, there is a zone of mafic volcanic rocks. Mafic volcanic rocks to the south of the talc-schist have a weak magnetic signature, with open fold axes apparent from magnetic surveys. Fold axes are roughly parallel to the fault zone. Amplitudes of folds are approximately 800 m. Fabric is poorly developed. These southern mafic rocks are only mapped in core. | |
|
To the north of the talc chlorite schist is another group of mafic volcanic rocks. These rocks have a high magnetic signature and tight folding. The amplitudes of folds in this package of mafic rocks are on the order of 200 m. The fold axes in these rocks appear to be oriented at an azimuth of approximately 160º. These mafic rocks show what appear to be variolitic textures in some areas. There are medium-grained gabbroic flows/intrusive rocks in this sequence. | |
|
Sandwiched between the northern mafic flows and the talc schist is a coarse-grained feldspar porphyritic intrusive rock. The rock is composed of 40% to 70% pink to grey 5 mm to 20 mm feldspar phenocrysts, sitting in a variably altered, aphanitic groundmass. This rock has been designated syenite, coarse quartz-feldspar porphyry, and even granite by earlier workers. Since the relatively unaltered phenocrysts of this intrusive appear to be potassium feldspar, it is reasonable to call this rock a coarse-grained syenite. The syenite extends the length of the pit, is steeply north dipping, and reaches horizontal widths of 15 m to 50 m. The syenite appears to intrude the northern mafic sequence. |
Page | 28
Hislop Property
NI 43-101 Technical report
| Minor lamprophyre dikes intrude all rock masses and can be seen to cut mineralized material at the north contact zone. | |
| 7.2.2 | Shaft Zone |
|
The mineralization located in the vicinity of the New Kelore Shaft and the Goldpost Decline is called the Shaft Zone. The Shaft Zone is in turn composed of four separate zones: the South and 5-East zones on the south contact of the syenite, and the North and Decline zones on the north contact of the syenite. The near-surface portions of this mineralization have been drilled and re-interpreted by SAS and are the focus of the resource estimates. | |
|
| |
|
The Shaft Zone is located between surface and 150 m depth and varies in width from 2.5 m to 17 m. The average width is 5.5 m. The zone strikes at 120º and dips 85º to the north. Metallurgical recovery from Shaft Zone ore exceeded 90% from production of 102,545 tonnes averaging 6.10 g/t Au. Gold occurs in the edges of carbonate breccias that separates the south contact of the syenite from the ultramafic rocks to the south. The gold either occurs as free gold or with wispy disseminated pyrite. | |
|
| |
|
The 5-East Zone is similar to the Shaft Zone but is located 150 m to 230 m to the east of the shaft. Production from the 5-East Zone was 15,450 tonnes of ore averaging 4.70 g/t Au. | |
|
|
|
|
The North and Decline zones are located on the north side of the syenite, and both zones exhibit purple to cream albite-pyrite-hematite alteration in the mafic rocks. The North Zone extends from near surface to at least 130 m below surface, is approximately 80 m in strike length, and reaches widths of up to 10 m. The North zone extends from five metres north of the shaft to 80 m east of the shaft. The North Zone production between 1990 and 1994 was 51,200 tonnes at 5.48 g/t Au. | |
|
| |
|
The Decline Zone is a small zone located approximately 30 m northeast of the shaft from 100 m to 130 m from surface. Production from the North Zone was 9,100 tonnes at 3.50 g/t. Au. | |
|
|
|
| 7.2.3 |
South Zone |
|
| |
|
The South Zone is composed of the Marsh Zones (east, west, and central) and the South Area (not to be confused with the South Zone of the Shaft Area). The Marsh Zones have a strike length of 100 m and extend from surface to 130 m depth. The average width is approximately three metres. The zone is open at depth. The Marsh Zones are 200 m south-southeast of the shaft at the south side of the syenite contact. The Marsh Zones are separated from each other by dextral faults. During the 1993 and 1994 period, production from the Marsh Zones was 21,818 tonnes of ore grading 5.69 g/t Au. |
Page | 29
Hislop Property
NI 43-101 Technical report
Similarly, the South Zone is 400 m south-southeast of the shaft along the maficultramafic contact and occurs along the south side of the syenite. The average width of the South Area is approximately 4.5 m. In 1993 to 1994, the South Area saw development at the 60 m and 90 m levels from the shaft to the South Area on the two levels. Some 14,000 tonnes of development muck was sent to the mill at an average grade of 4.22 g/t Au. Metallurgical recovery was 80%. The near-surface portions of this mineralization have been drilled and reinterpreted by SAS and are the focus of the resource estimates.
Page | 30
Hislop Property
NI 43-101 Technical report
| 8.0 |
EXPLORATION |
|
There are several exploration targets identified by KLG personnel within the Hislop Property. KLG continued to drill and test prospective areas from 2011 to 2016 identifying two main areas of focus: |
| • | Extensions to the Hislop Pits; along strike and down dip. | |
| • | Mineral extensions from adjacent properties. |
Drilling adjacent to the Hislop Pits had the goal of extending resources and reserves during production. Additionally, there are two historically drilled ‘mini pits’ directly south of the West and East Pit. They are currently named the Yo and Ho camps. The geology has similar characteristics to the Hislop Mine Complex.
There were several mineralized trends adjacent to the Hislop Property, which gives interest into drill targeting. To the north is a property owned by Primero Mining Corp. (Primero) where they have identified the 147 Zone, Grey Fox Zone and Contact Zone. Each zone was reported by Primero to have NI 43-101 standard resources.
To the west, two areas of interest were tested. In the northwestern claim block, Romios Gold identified a system of gold bearing veins. This system was named the Alphabet Veins. Lower to the property was the V2 Trend, which is considered to be an extension of the mineralize zone identified by Stroud Resources.
To the south lies the Ross Mine, historically producing over 1.0 M oz of gold over its lifetime. Production at the Ross Mine was open pit and underground development. The underground development extended to the property boundary. Although considered to be an area of high potential, drill testing only commenced in 2016.
The last mineral resource estimate was published in 1994. Between 1999 and 2005, SAS mined 226,600 tonnes grading 3.14 g/t Au from the open pit. Between 1996 and 2009, a total of 235 holes where drilled from surface with a total length of 32,679 m.
The 2006–2007 exploration program of surface diamond drilling and sampling of older core drilled within the hematized mafic volcanics identified the potential of an open pit mine. The 2009 exploration program was designed to increase the information density by infill drilling to reduce the drill spacing in the pit area to 15 m by 15 m to a depth of 100 m. As part of the above programs, approximately 7,000 samples were taken from previously drilled core to provide continuous assay information across the mineralized zones.
Page | 31
Hislop Property
NI 43-101 Technical report
Exploration on the Hislop Property continued in 2011 up to 2013 with various targets. The drilling program can be separated into the 2 target areas, Hislop North (holes named preceding with H) and Hislop Pits (Holes named preceding with HP).
The 2013 drilling program had the majority of drilling focusing on extending mineralization beneath the East and West Pits. Drilling was completed during two phases with Phase 2 following up on the results of Phase 1. The mandate was to extend mineralization beneath the pits at a depth of 100 m.
Target spacing for the 2013 pit drilling was intended to be 50 m from hole to hole. Multiple holes may have been drilled from the same set up at varying dips. The dips were between 45-70 degrees. All holes were drilled at an intended azimuth perpendicular to the strike of the trend. North of the syenite, the drilling azimuth was 212 degrees and south of the syenite, the drilling azimuth was 32 degrees. Preference was given to drill from the North of the syenite as potential for intercepting quartz-carbonate fracture systems were higher and there was less duplication of historic data. Due to restrictions with the infrastructure on Hislop and mine activity, it was necessary to drill from the South of the pits.
Page | 32
Hislop Property
NI 43-101 Technical report
| 9.0 |
DRILLING |
|
KLG contracts out all of the diamond drilling on surface and underground. The diamond drilling provides whole core recovery in mainly NQ diameter for the geologist to log and model. | |
|
The core is boxed by the contractor at the drill site and transported to a designated pick up area. Employees of KLG would pick up the core on site and transport it to the Exploration Office in Matheson, ON. | |
|
Surface drilling occurred on this Hislop property from 2011 to 2016. From 2011 to 2014, KL employed Forage Orbit Garant to complete its exploration program. In 2015 to 2016, Asinii Drilling was the contractor. |
Page | 33
Hislop Property
NI 43-101 Technical report
| 10.0 |
SAMPLE PREPARATION, ANALYSES AND SECURITY |
| 10.1 |
Sampling Method |
|
Historically, blast holes samples were taken when mining benches in the Hislop Mine Complex. The blast hole samples were utilized to aid in the reconciliation of grade of gold when processed at the mill. Additionally, a geologist may channel sample benches and walls in the pit to identify the gold distribution. Also, intervals of interest for diamond drilling around the pits and on exploration targets were also sampled. Of the sampling methods, only diamond drilling was considered when creating resource shapes. | |
|
A standardized protocol for sampling of surface exploration diamond drill core is employed by KLG. From the 2010 drill campaign, this protocol was documented (KLG, 2010), and geologists and technicians were trained on using the protocol. Revisions were made to the technical procedure over time, but the practices remained the same. | |
|
With all drill core, intervals of interest are sampled at a maximum interval of 1.5 m unless a variation in mineralization, lithology or alteration dictates that a smaller interval should be used. A minimum sample interval of 0.3 m is also applied to sampling procedures. If a gap of 7.0 m or less is between sampled intervals of interest, the sampling continues through that gap for continuous results. Visual recognition of variation of auriferous (sulphide) mineralization concentration, strength of alteration mineralization and lithological host are keys used by the geology personnel in determination of an appropriate sample length to be employed. More specifically, samples are begun or ended at the interface of different lithology, alteration assemblages, or concentrations in auriferous mineralization. Sampling extends into barren rock at a minimum of one sample at the beginning and end of any sampled interval. Each sample is assigned a unique sample number, preferable six digits long, as recorded on pre-printed sample tag books. Sample data are entered in the DHLogger program as the samples are being laid out and this information is confirmed by the logging geologist prior to placing the core in the queue for cutting. During sampling, one portion of each tag is placed in each numbered sample bag, while another portion remains in the core box at the end of each sample, and another portion remains in the tag book which contains all records for that sample. Quality Controls in the form of barren samples and standards are inserted into the sample sequence at an industry accepted frequency of 1 barren sample and 1 standard in every group of 20 samples. | |
|
The surface exploration drill core samples are tagged by the geologist and transported to the cutting room on site. A technician employed by KLG then cuts the core using a diamond saw blade. The weight of the sample varies from two to ten kg depending of the length of the core sample and its protolith (massive sulphides, chloritic waste rocks). |
Page | 34
Hislop Property
NI 43-101 Technical report
|
Chip sampling of wall and benches in the pits also abide by the above described protocol in that sample lengths can range from a minimum of 0.3 m to a maximum of 1.5 m and are delineated by lithological and alteration assemblage, as well as by concentration of auriferous minerals. Chip sample orientations are chosen so that an optimal cross- section of observed material on the face is represented, when logistically possible. Once gold values for obtained samples are received, they are incorporated into drawings and may be used as additional data for evaluations of grade control shapes compiled to maximize gold recovery. Chip samples are analyzed at the Holt Mine assay lab and have a typical turnaround time of 3 days. | |
|
Rock is crushed onsite to a size of 50 mm before being hauled to the Holt Mill for processing. KLG practices dictates that one sample from each truck be taken as a representative sample of approximately 50 tonnes. These samples serve to gauge the mill feed and to confirm the chip sample results. | |
|
Upper and lower limits for Standards are “3 standard deviations” above and below reported average Au concentration. Major discrepancies from expected values were typically human errors during sampling; however, significant samples associated with failed standards were re-analyzed by batch and Au values confirmed. | |
|
Samples containing potentially significant Au values (greater than 0.1 g/t) in batches that contained failed blanks were re-analyzed. | |
|
Drill core samples were sent to ALS Minerals in Timmins, ON for 2011, AGAT Laboratories in Mississauga, ON for 2012-2014, Laboratoire Expert Inc. in Rouyn- Noranda, QC for 2015 and Swastika Laboratory in Swastika, ON for 2016. | |
|
Blast hole samples were sent to the Holt Assay Lab. | |
|
In the QP’s opinion, the sample preparation, security and analytical procedures are adequate. | |
| 10.2 |
QC/QA Comparative Assay Laboratory Program |
|
KLG engages in industry standard practices to re-test mineralized rejects at a second commercial lab for a check on the quality of the primary assay results. Approximately 5% of the mineralized exploration samples that go directly to a commercial lab are sent to another commercial lab for verification. As a standard procedure, all exploration samples that assay above 1.0 g/t Au are subjected to multiple re-assaying as a check on the particular intersection. |
Page | 35
Hislop Property
NI 43-101 Technical report
|
The program to send the samples out for check analysis is under the direction of D. Schonfeldt employed by KLG. | |
|
| |
|
Two comparative lab-lab checks were completed in 2013. The first one completed in January analyzed the results from the 2012 campaign and the second in August analyzed the results from the 2013 campaign. Both campaigns represent the largest drilling programs completed on Hislop within the last decade. | |
|
| |
| 10.2.1 |
January, 2013 Lab Check – AGAT vs SGS |
|
| |
|
The January, 2013 lab check compared the original results from AGAT Laboratories with a representative sample batch sent to SGS Mineral Services in Cochrane, Ontario from drilling in 2012. A total of 282 samples were analyzed with the addition of 14 analytical standards and 14 sample blanks. This represented approximately 4% of all samples taken in 2012. A standard 30 g fire assay with an ICP finish was used for analysis from both AGAT and SGS. If the gold value was greater than 10ppm or 100,000ppb, the lab performed an Au-Gravimetric finish reported in g/t. | |
|
| |
|
A number of holes were chosen in a non-bias way to represent the gold values at Hislop. Six holes were selected for the process based on a mixture of low to high gold values. The holes included in the re-analysis were: H12-008, H12-010, H12-012, H12-016, H12- 017 and H12-018. The protected rejects for the selected intervals of these holes were used and sent to SGS Mineral Services. Sample sequences containing a standard either had the same standard or one of similar Au value inserted into the sequence. Blanks were kept as the original rejects from previous analysis. | |
|
| |
|
Overall, when the original assays from AGAT Laboratories are compared with the reanalyzed assays from SGS mineral Services there is not a significant difference. Values are relatively close, +/-10%, with the exception of the higher-grade samples having a greater variation. | |
|
| |
|
All standards and blanks fell within the acceptable limits with the exception of two OR- 66a and one OR-15d standard sample. These particular samples failed below the lower limit. SGS Mineral Services will be reviewing the data for these failed samples and will possibly run another analysis. Overall, acceptable levels of accuracy from AGAT Laboratories were able to be confirmed by performing this lab check with another lab. | |
|
| |
| 10.2.2 |
August, 2013 Lab Check – AGAT vs Accurassay |
|
| |
|
The August, 2013 lab check compared the original results from AGAT Laboratories with a representative sample batch sent to Accurassay Laboratories in Rouyn-Noranda, Quebec. A total of 304 samples were analyzed with the addition of 17 analytical standards and 16 blanks for further quality control, which is approximately 4.7% of all samples from drill holes beneath the pits and 3.7% of the total samples taken in 2013 on the Hislop Property. A standard 30 g fire assay, ICP finish was used for analysis from both AGAT and Accurassay. If the gold value was greater than 10g/t, the lab performed an Au-Gravimetric finish reported in g/t. |
Page | 36
Hislop Property
NI 43-101 Technical report
A number of holes were chosen in a non-bias way to represent the gold values at Hislop. Nine holes from the Hislop Pit drilling were selected for the process based on a mixture of low to high gold values. The holes included in the re-analysis were HP13-002A, HP13-007, HP13-008, HP13-009, HP13-010, HP13-017, HP13-021, HP13-025 and HP13-033. The protected rejects for the selected intervals of these holes were sent to Accurassay for re-analysis. Sample sequences containing a standard had a new standard with the same ID code or one of similar Au value inserted into the sequence. The original rejects of the blanks were used from previous analysis.
Overall, bulk of the results from Accurassay was under 50% of difference from the AGAT Laboratories results. Greater deviation occurred with lower grade samples as lower grades would be more impacted by a minor difference. It also cannot be said that one lab resulted in a consistently higher or lower grade return. Results are summarized in Figure 10-1.
All standards and blanks fell within the acceptable limits. One Oreas-67a standard had insufficient material to be tested, however. Overall, acceptable levels of accuracy from AGAT Laboratories were able to be confirmed by performing this lab check with Accurassay Laboratories.
Page | 37
Hislop Property
NI 43-101 Technical report

| 10.3 |
QC/QA Holt Assay Lab |
|
The Holt Assay Laboratory follows industry standard protocols for sample preparation and assaying. The lab inserts QC/QA standard samples, barren samples and a duplicate with each batch to test that proper procedure is being followed for quality control. | |
| 10.4 |
Assay Laboratory Site Audits |
|
Analytical labs used by the Exploration group are routinely inspected and a more detailed lab audit was conducted by Analytical Solutions Ltd in March 2017. Quality control samples consisting of reference standards and blanks are inserted into each batch and pulps are submitted for lab / lab check assay. |
Page | 38
Hislop Property
NI 43-101 Technical report
| 11.0 |
DATA VERIFICATION |
|
Data was checked prior to the release of the 2013 Updated Technical Report by Scott Wilson RPA. The data was not subjected to any independent sampling. Scott Wilson RPA checked the assay entry on a number of diamond drill logs against the original assay certificates and found no transcription errors. Since the Hislop property produced gold in the past, no independent samples were taken by Scott Wilson RPA to confirm the presence of gold in the target area. | |
|
Moving forward, the new data was compiled and verified by geologists employed by KLG. All collar data was surveyed by hand held GPS. Drill holes around the Hislop Pits were re-measured using a Trimble and control points prior to completing an internal resource estimate in late 2013. | |
|
It is in the QP’s opinion that the data has been property verified in the past and QC measures were taken during the continued drilling program. |
Page | 39
Hislop Property
NI 43-101 Technical report
| 12.0 |
MINERAL PROCESSING AND METALLURGICAL TESTIING |
|
No new metallurgical test work has been undertaken since the last technical report update. |
Page | 40
Hislop Property
NI 43-101 Technical report
| 13.0 |
MINERAL RESSOURCE ESTIMATES |
|
The Mineral Resources for the Hislop Mine effective as of December 31, 2016, are summarized in Table 13-1, with individual zones segregated in Table 13-2. All mineral resources are reported exclusive of Mineral Reserves. |
| Indicated | Measured + Indicated | Inferred | |||||||
| Cont. | Cont. | Cont. | |||||||
| Tonnes | Grade | Gold | Tonnes | Grade | Gold | Tonnes | Grade | Gold | |
| (kt) | (g/t) | (koz) | (kt) | (g/t) | (koz) | (kt) | (g/t) | (koz) | |
| 2016 | 1,150 | 3.59 | 132 | 1,150 | 3.59 | 132 | 797 | 3.76 | 95 |
Notes
CIM definitions
(2014) were followed in the calculation of Mineral Resource
Mineral
Resources are reported Exclusive of Mineral Reserves.
Mineral Resource
estimates were prepared under the supervision of D. Cater, P. Geo.
Mineral
Resources were estimated at a block cut-off grade of 2.6g/t
Mineral
Resources are estimated using a long term gold price of US$1,200/oz
(CDN$1,500/oz)
A minimum mining width of 3m was applied
A bulk density
of 2.84 t/m3 was used
Totals may not add exactly due to rounding
Table 13-1: Mineral Resources for the Hislop Mine Complex as of 31 December 2016.

Notes
CIM definitions
(2014) were followed in the calculation of Mineral Resource
Mineral
Resources are reported Exclusive of Mineral Reserves.
Mineral Resource
estimates were prepared under the supervision of D. Cater, P. Geo.
Mineral
Resources were estimated at a block cut-off grade of 2.6g/t
Mineral
Resources are estimated using a long term gold price of US$1,200/oz
(CDN$1,500/oz)
A minimum mining width of 3m was applied
A bulk density
of 2.84 t/m3 was used
Totals may not add exactly due to rounding
Table 13-2: Mineral Resources for the Hislop Mine Complex by Zone (as of Dec 31, 2016).
Page | 41
Hislop Property
NI 43-101 Technical report
| 13.1 |
Database |
|
The current Hislop database, summarized in Table 13-3, is composed of surface and underground diamond drill holes. The drill hole information has been compiled from a variety of sources and has been standardized to: |
| • | UTM NAD 27 Zone 17 metric co-ordinates; | |
| • | All assays reported as g/t Au; and, | |
| • | Common lithological legend. |
Until 2007, the surface and underground drill collar locations where surveyed by theodolite and distomat to the local imperial mine grid systems. Some of the older holes are located by cut grid co-ordinates, which have since been converted to imperial mine grid coordinates. Starting in 2007, the drill co-ordinates were converted to the UTM NAD 27 systems. Many of the older holes where mathematically converted and the available collars where resurveyed using Topcon GR3 GPS Survey Instrument. Recent drill hole locations and completed drill hole collar locations have been done using the Topcon GR3 GPS Survey Instrument.
Drilling since 2006 has had the downhole surveys done by FLEXIT, a downhole survey instrument that measures deviation and records it digitally. Downhole deviation in historic holes here determined by Tropari instruments and/or by acid tests which give a dip measurement only.
Drilling after 2011 has had the downhole surveys done by REFLEX EZshot tests spaced 50 m apart. Geomagnetics may have affected the accuracy of the azimuth result and that was considered for decision of when to ignore potentially incorrect data. The dips from the EZshot tests were interpreted to be correct. This data has been sorted and considered by the geologist on the project as well as a consulting geologist.
The drill logs provide sufficient description and recognition of the lithology, alteration, geological structures, and mineralization to correlate mineralization between holes and sections. Several underground holes in densely drilled areas were not able to be included within the mineralized zones without compromising the mineral shape. In these few cases, the hole was given the mineral interval for compositing. The assay data from these holes were included in the grade interpolation.
Page | 42
Hislop Property
NI 43-101 Technical report
The Mineral Resource estimate is based entirely on diamond drilling data. The diamond drill spacing is approximately 15 m by 15 m.
In 2013, the drill hole collars were converted from UTM NAD 27 to UTM NAD 83 at the end of the drilling program. Moving forward into 2014, the drill program commenced collecting data in UTM NAD 83.
Drilling in 2009 to 2014 was completed by Orbit Garant Drilling. In 2015 and 2016, drilling was contracted out to Asinii Drilling.
Page | 43
Hislop Property
NI 43-101 Technical report

|
Table 13-3: Summary of the Hislop Drill Hole Database. | |
| 13.2 |
Geological Interpretation and 3D Solid Modelling |
|
Datamine Studio 3 software was utilized to complete updated models of geological and mineralized zone models. |
Page | 44
Hislop Property
NI 43-101 Technical report
|
Geologic interpretation completed during the 2013 Resource Estimate program used defined sections oriented looking Azimuth 302o and spaced 25 m apart as located from the approximate position of a historical local grid relative to the NAD27 coordinate system. This was done so that drill holes fall along defined sections approximately equal to historic sections and are static (exact section can be readily reproduced). ‘Section definition’ files were created and have been saved on KLG’s Exploration server in the previously noted folder for on-going use of these defined sections. | |
|
KLG personnel completed an initial 3D geological model of main rock types and mineralized zones in 2009, which was updated by the work of a third party consultant (Belzile Solutions Inc.) in October 2013, and further updated during the 2013 resource estimation program. Each of these interpretations and the resource estimates made thereon utilizes consistent mineralized ‘Domain’ ideology and nomenclature. Due to various files not being available at the time of the 2013 resource estimation program, the 2013 interpretation of the mineralized Domains was made largely independent of previous efforts, while remaining consistent in nomenclature and broader terms. Consequently, this has provided an excellent verification of the Domain ideology while incorporating tighter economic criteria on the mineralized zones. | |
|
The current mineralized zone interpretation could be further improved with additional review, analysis and re-consideration of each detail of the interpretation and particularly by including additional information on structural trends (which became apparent during the course of this update). | |
| 13.2.1 |
Distribution of Main Rock Types |
|
It had been observed that gold is distributed at or near major lithologic contacts and the locus of gold mineralization in particular is limited to the north by the Mafic Volcanic – Syenite (+other) altered rocks contact, this contact was modelled in detail, using sections spaced 25m apart oriented at 032o (i.e. looking Azimuth 302o) which was the orientation of the historic local grid and designed orientation of most surface drill holes in this area. | |
| 13.2.2 |
Structural Trends |
|
From high-level overview of main rock type distributions, it is apparent that geological structures have a significant control on the distribution of main rock types including in particular the main syenite intrusion and subsidiary dykes, which in turn control gold distribution. Preliminary interpretations of impacting structural trends were prepared and presented in the (Microsoft Powerpoint©-based) document “Geological Structures and Evidence for their Impact on Ore Zone Geometry”, dated Sept. 12, 2013. Main points supporting the interpretation that geological structures play a significant role in gold distribution as summarized by this preliminary note as follows: |
Page | 45
Hislop Property
NI 43-101 Technical report
| • |
Patterns in blast hole gold grade show abrupt truncations followed by trend towards the northeast, | |
| • |
The open pits change shape or terminate (end of economic mineralization) coincident with northeast trending features. |
Significant improvement of lithologic and mineralized zone interpretations could be achieved through the incorporation of observed, mapped, projected, and interpreted structures in the 3D model. Thus, the following are recommended to help better understand the significance of geologic structures with respect to gold distribution at Hislop:
| • |
Mapping of pit wall exposures in the West Pit, and if possible in the East Pit (so long as remains safely accessible) be completed at the earliest possible time. | |
| • |
Blast hole grade data be fully compiled and map-able patterns be prepared as 3D shapes in Datamine Studio 3. |
|
Cross-cutting features such as diabase dikes, lamprophyre dikes, and faults be fully queried in the drill hole database and results compiled into 3D shapes of those features in Datamine Studio 3. Cross-cutting features such as lamprophyre dikes have been observed to be hosted within earlier geological structures or zones of weakness, and even though their emplacement may be much later than the mineralizing event(s), those intrusions mark earlier trends which may have influenced ore distribution. In the case of diabase dikes, this needs to be done also to ‘extract’ any diabase of significant volume from the mineral resource estimate. | |
| 13.2.3 |
Distribution of Gold Mineralization and Mineralized ‘Domains’ |
|
As described in previous work and validated by the current effort, gold mineralization in the Hislop pit area is distributed within mineralized ‘Domains’, characterized by their relative position relative to main rock types. The 2001 Domain was not modelled in this interpretation as it is defined as a low grade envelope surrounding the higher grade ‘300_’ series Domains, and this low grade envelope is ineffective in defining mineralized zones. | |
|
Preliminary interpretation of mineralized zones found that sections spaced 25m apart did not adequately represent drill holes drilled at much tighter spacing and also resulted in wireframing problems while completing the cross-section based interpretation. Thus, the mineralized zone Domains were interpreted at sections spaced 15m apart, again oriented at 032o Azimuth and approximately at the historic local grid sections. Datamine section definition files were created for both the 25 m spaced sections and for the 15m sections used, as well as for level plans spaced at 10m depth intervals and for longitudinal sections in order to maintain consistency during this interpretation and in future. |
Page | 46
Hislop Property
NI 43-101 Technical report
Other base parameters used in the mineralized interpretation are as follows:
| • | Minimum Horizontal width = 2m | |
| • | Minimum gold grade, open pit-able resources = 1.3 g/t Au | |
| • | Minimum gold grade, potential underground resources = 2.1 g/t Au |
|
In order to maintain reasonably consistent mineralized zone trends, the interpretation included a minority of intercepts which do not meet the above criteria. It was deemed that in all likelihood, structural continuity of the zone is present, although grade continuity may be lacking in those limited areas and otherwise the zone interpretation would be inaccurately disjointed. If mineral resources are deemed by KLG sufficient to justify continued exploration, these areas should be tested with additional drilling | |
| 13.3 |
Density Data |
|
A density of 2.84 g/cm3 was utilized for all Domains. This value was determined by KLG from project data including density measurements as more fully described in the August 6, 2009 Scott Wilson RPA technical report. | |
| 13.4 |
Assay Composites |
|
All sample lengths were composited to 1.5m length. This compares well with the maximum sample length as well as zone dimensions. Histograms of sample lengths present in each of the Domains were used to validate the composite length selection. The Scott Wilson RPA August 6, 2009 resource estimate utilized 1.5m composites, while the Belzile 2012 estimate used 3 m composite length. | |
| 13.5 |
Assay Statistics |
|
The drill hole file was capped and trace gold values inserted where otherwise absent prior to compositing. This is a conservative approach and was recommended in the August 6, 2009 Scott Wilson RPA technical report. | |
|
Absent Gold Values | |
|
Intervals for which there was no gold value present in the drill hole file (interval was not analyzed) were assigned trace gold value of 0.0025 g/t Au. This value corresponds with the ‘less than detection’ limit of typically completed gold analyses employed during drill programs for the project. |
Page | 47
Hislop Property
NI 43-101 Technical report
|
Grade Capping | |
|
Log-probability plots of gold grade were generated for each of the Domains; analysis of these distributions found that 30gpt Au is an appropriated capping level for all the Domains. This is reasonably consistent with the previous 2009 and 2012 resource estimate for the Hislop pit area. The 2009 estimate used capping of 5gpt Au for Domain 10-1 (equivalent to Belzile’s 2001 Domain and not estimated in this program as largely pertains to open pit resources previously mined), 25gpt for Domain 3-01, 15gpt for Domain 3-02, 35gpt for Domain 3-03, and 15gpt for Domain 3-04. The 2012 estimate used 35gpt as the top cut in the 3001 and 3003 Domains, and 15gpt in the 2001, 3002 and 3004 Domains. In other words, the characteristics of gold values in the recently completed drilling did not markedly impact the overall characteristics of that in each Domain found historically. | |
| 13.6 |
Semi-Variograms and Search Ellipsoid |
|
Detailed variography was not performed in this update. The August 6, 2009 Scott Wilson RPA technical report provides a detailed description of the variography completed in that program, which found roughly flattened, spherical search volume shape appropriate. Belzile 2012 resource estimate update provided variography analysis for the 3003 Domain and again found a flattened spherical shape suited zone characteristics with the major axis of the first pass search volume at 10m, second pass at 30m and third pass at 40m. | |
|
Variography was visually reviewed in this program and a search ellipsoid shaped 40 x 40 x 10 m in dimensions (summarized in Table 13-4) was deemed appropriate for this estimate in order to ensure population of grade in blocks for deeper portions of the mineralized zones and particularly areas tested by recent, relatively wide-spaced drilling which was an expressed objective of this effort. Subsequent comparative iterations may wish to adjust these dimensions to examine the impact of different ellipsoid shapes or estimate well drilled portions of the zones separate from widely spaced drilled portions. | |
|
Static search ellipses where rotation angles are defined and carefully optimized prior to grade interpolation were tried in preliminary iterations for each Domain. It was found that static search ellipsoids did not adequately respect the changing orientations of the Domains and therefore Dynamic Anisotropy was selected for use in the grade interpolation. As Dynamic Anisotropy was used, static rotation angles about each of the X, Y, and Z axes are not required to be defined and carefully optimized prior to the grade interpolation. |
Page | 48
Hislop Property
NI 43-101 Technical report

|
Table 13-4: Search ellipsoid parameters for the 4 Hislop Mine Complex domains. | |
| 13.7 |
Grade Interpolation |
|
Block dimensions of X=3m, Y=1.5m, and Z= 3m were used. These relatively small block dimensions were used to respect the sometimes relatively narrow zone shape without creating an inordinate number of subcells in the block model, and to respect the degree of selectivity in anticipated mining. Blocks were rotated to fit the data in 2D in the XY plane, subcelling was used in all directions and subcelling was optimized. Also, it is noted in ‘well drilled’ portions of the Domains, drill spacing is between 7 and 15m and the block dimensions are roughly consistent with being 1/3 to 1 / 4 average drill spacing as is generally recommended. Drill spacing at deeper portions of the zones though are much wider though. The 2009 resource estimate used blocks 3x3x3m while the 2012 estimate used blocks 6x3x6m. | |
|
Inverse distance squared (“ID2”) and dynamic anisotropy were used to interpolate grade in the block model. | |
|
Grades were interpolated using the search parameters in Table 10. Octant searches were tested but the use of a minimum number of octants greater than 1 resulted in significant portions of the block model lacking interpolated grade (as didn’t meet this minimum criteria), particularly near the recently completed drill holes. Consequently, a minimum number of octants of 1 was used, but with a maximum of 4 samples, forcing additional drillholes to be used in densely drilled octants. A minimum of two drillholes were required to interpolate grades into the first and second search passes. Single drillholes were allowed to populate the third search pass, but these areas were assigned to, at most, an inferred resource. | |
| 13.8 |
Model Checks |
|
The block models were checked visually by displaying the blocks coloured by grade with the input drillholes coloured by the same legend. Each section was examined in detail to compare estimated grade to drillhole grade. A similar exercise was undertaken level by level from surface to the bottom of each domain. | |
|
It is recommended, should the mineral resources be considered for more detailed engineering or economic feasibility analysis, that comparative iterations of grade models be performed, for example, using Ordinary Kriging, examining the impact of different capping levels, increasing block size, or reducing search ellipse dimensions. |
Page | 49
Hislop Property
NI 43-101 Technical report
| 13.9 |
Resource Estimate and Classification |
|
The models were classified as measured, indicated or inferred based on a few qualifying factors. The resource classification is essentially based on the density of drill hole information and the continuity of gold grades. | |
|
In general, cells estimated using the first search pass were used to populate the indicated category, although some leeway was allowed to fill areas estimated using the second search pass for the indicated category. In addition to search passes, cells were also filtered to the resource cut-off grade (2.2g/t) and large areas of low grade were removed from the indicated category. Classification was performed by defining a perimeter around cells that fit the above criteria for indicated resources. Using this method, isolated patches of indicated are avoided and a contiguous indicated volume is created. | |
|
Surface and underground excavations were removed by applying a “MINED” criteria to the block model then filtering only unmined cells. The resource estimates created in 2013 were progressively depleted as open pit mining continued. The final resource reported herein uses a high quality surface DEM model to deplete the open pit excavations. Mineral Reserves were depleted in a similar fashion. Stopes and ore development defined as Mineral Reserves were assigned a “RESERVE” criteria and all reserve cells were filtered from the final resource model. No areas were upgraded to the measured category. Production ceased in Q1 of 2015. In 2016 several holes were drilled to test the orientation of the relatively small 3004 domain. This drilling did not encounter sufficient mineralization to justify inclusion of the resource in future resource estimates, so the domain was removed. A few additional holes were drilled just below the West Pit, to test for possible extensions of mineralization in that area. No significant changes were found between the previously estimated grades and mineralization in the newer drillholes so a comprehensive update to the existing resource was not deemed necessary. | |
|
In the QP’s opinion, there are no known environmental, permitting, legal, title, taxation, socio-economic, marketing, political or other relevant factors that could materially affect the mineral resources estimate. |
Page | 50
Hislop Property
NI 43-101 Technical report
| 14.0 |
MINERAL RESERVES ESTIMATE |
|
The Mineral Reserves effective as of December 31, 2016 are summarized in Table 14-1. |
| HISLOP MINE | |||||
| ZONE | CATEGORY | TONNES | GRADE | OUNCES | |
| THOR ZONE | PROVEN | 0 | 0.00 | 0 | |
| THOR ZONE | PROBABLE | 175,545 | 5.80 | 32,744 | |
| TOTALS | PROVEN | 0 | 0.00 | 0 | |
| TOTALS | PROBABLE | 175,545 | 5.80 | 32,744 | |
| TOTALS | 2 P'S | 175,545 | 5.80 | 32,744 |
Notes
CIM definitions (2014)
were followed in the calculation of Mineral Reserves
Cut-off grades were
calculated for each stopes
Mineral Reserves were estimated using a long term
gold price of US$1,200/oz (CDN$1,500/oz)
Mineral Reserves estimates were
prepared under the supervision of P. Rocque, P. Eng.
Totals may not add exactly due to rounding
Table 14-1: Mineral reserves at the Hislop Mine.
The mine is currently on care and maintenance. The main changes from the December 2014 disclosure of mineral reserves are attributed to the mining operation (i.e. depletion).
In the QP’s opinion, there are no known environmental, permitting, legal, title, taxation, socio-economic, marketing, political or other relevant factors that could affect materially the mineral reserves estimate once the operation re-start.
Page | 51
Hislop Property
NI 43-101 Technical report
| 15.0 |
MINING METHODS |
|
Hislop was mined by open-pit method, using conventional excavators, loaders and trucks. The ore was sent to the Holt mill for further processing. | |
|
The operation was ceased at the Hislop pit at the end of 2015. | |
|
The current reserves are based on technical work that was completed internally in 2014 (Salehi, 2014). | |
|
The Hislop Project consists of five zones, 3000, 3001, 3002, 3003, and 3004 (Figure 15-1). Only the portions of the mineral resources identified as indicated have been used in the life of mine (LOM) plan for this scoping study. The long strike length of this deposit (>1.5km) is not conducive to a single ramp and portal system to service the entire ore body. The shallow depth of the deposit and lack of sufficient ounces of gold per vertical meter could not support all the lateral development required from a single access. As a result, the ore body was divided into 3 distinct mining zones; THOR, ODIN, and LOKI. These zones were evaluated independently. |

Page | 52
Hislop Property
NI 43-101 Technical report
Figure 15-1: Hislop Indicated Resources (longitudinal view looking north).
A Sub-Level Cave mining method was selected as the most economical for this project, as it allows for quick access to the ore and does not require backfill. A cut-off grade of 3 g/t was used to develop the life of mine plan for this project. Preliminary mineable shapes were developed from the indicated resources using a cut-off grade of 3 g/t. Figure 15-2 shows the conversion of indicated resources to mineable shapes for all zones

Figure 15-3 displays the plan view of the access ramp from the bottom of the west pit into the Thor mineralization zone. The ramp is designed at 5m x 5m. Access development and sill development on ore are designed at 4m x 4m. The sill development on ore has been designed to reflect the average width of the ore which ranges from 3 m to 5 m in width.
A fresh air raise, which will also serve as secondary egress into the mine, has been included in the LOM plan. This raise system has been divided into two segments to relieve ventilation pressures on the temporary ventilation system at the portal while acting as secondary egress.
Page | 53
Hislop Property
NI 43-101 Technical report

Stopes and reserves shapes included in the LOM plan for the Thor Zone are shown in Figure 15-4.
Page | 54
Hislop Property
NI 43-101 Technical report

| 15.1 |
Mining Shapes and Associated Tonnage, Grade and Metal Contents |
|
Mine design calculations were performed in using Datamine Studio 3 software. Plan views and cross-sections were plotted and mining shapes were drawn directly on the sections. The shapes were populated with the grade block model, yielding 296 kt grading 5.05 g/t for a total of 48,153 oz in-situ. The value of contained ounces was updated at the end of December to reflect 2016 year-end cost structure and is included in the current mineral reserves statement. The mill recovery rate for the Hislop ore, based on previous performance, is approximately 92%. | |
| 15.2 |
Geotechnical |
|
More detailed geotechnical information is required to characterize the response of the Hislop rock mass to mining-induced stresses and validate the stability assessments. The proposed mine design and stope dimensions are based on conservative assumptions on rock mass classification from the region: based on an RMR classification of 70. |
Page | 55
Hislop Property
NI 43-101 Technical report
| 15.3 |
Mine Access and Development |
|
Due to its relatively shallow depth, the underground deposit will be accessed via a decline from surface. A summary of all development is presented in Table 15-1. | |
|
Capital Development-Decline | |
|
A 5 m (wide) by 5 (high) ramp is proposed to access the Thor Zone. Driven at a -15% grade, the planned length is 1,364 meters. This number includes 10% of miscellaneous development for remucks, safety bays, and other mine cut outs. | |
|
Capital Development-Lateral | |
|
The capital development in this category consists of lateral development to facilitate the excavation and completion of the Fresh Air Raise/Escapeway system. | |
|
Capital Development-Escapeway/Ventilation raise (and access) | |
|
Two 3.6 m circular raises, approximately 88 m and 150 m long, have been proposed. These raises will act as the secondary egress from the mine while also providing fresh air into the mine for the duration of the project. The first leg of the raise is dipping approximately 80 degrees and the second leg at approximately 70 degrees. The access to the fresh air raise/escapeway and associated development metres are included the total capital lateral development metres. | |
|
Operating Development | |
|
The operating development consists of all the lateral access development into mineralization and all development on mineralization, named Access and Sill development respectively |
| Capital or Operating | Type | Description | Total |
| Capital |
Development |
RAMP Escapeway Escapeway X-Cut |
1,364 238 53 |
| Operating |
Production |
ACCESS Sill on Ore |
871 1,251 |
| Grand Total | 3,777 | ||
Page | 56
Hislop Property
NI 43-101 Technical report
|
Table 15-1: Capital and Operating Development Summary. | |
| 15.4 |
Equipment |
|
The list of proposed major mobile equipment is shown in | |
|
Table 15-2. |
| Equipment Type | Engine Rating (hp) | Comments |
| LHD - 7 yd3 | 250 | Primary |
| LHD - 7 yd3 | 250 | Primary |
| Scissor Lifts | 82 | Primary |
| EJC 430 Truck (20t) | 325 | Primary |
| EJC 430 Truck (20t) | 325 | Primary |
| 2 Boom Jumbo | 82 | Primary |
| MineCat | 75 | Primary |
| Mancarrier | 50 | Primary |
| Boom Truck | 82 | Primary |
|
Table 15-2: List of equipment. | |
| 15.5 |
Dewatering and Fresh Water |
|
Existing hydrological studies at the Hislop project should suffice for this project as the ore body does not fall outside the Hislop Pit footprints. It is anticipated that water inflows will be pumped out of the mine using a conventional dewatering system (i.e. sump pumps) to a settling pond located on surface. | |
|
No issues or concerns are anticipated in amending the existing closure plan to take and discharge water. As part of the infrastructure planning and capital cost estimate, it has been assumed that a mine water recycling pond will be constructed on site. A well will also be drilled and installed to ensure supply of potable water for the duration of the project. |
Page | 57
Hislop Property
NI 43-101 Technical report
| 15.6 |
Mine Ventilation |
|
Mine air requirements are specified in the provincial legislation. The total airflow was estimated by multiplying the diesel power in break-horse power (hp) by 1.75 cubic metres per second (m3/s). Diesel power for the major mobile equipment is calculated at 57 m3/s (Table 15-3). |
| Equipment Type | Engine Rating
(hp) |
Air
Requirement (m3/s) |
Utilization
(%) |
Air Flow
Requirement (m3/s) |
20% Allowance for Leakage |
| LHD - 7yd | 250 | 12 | 100% | 12 | 14 |
| LHD - 7yd | 250 | 12 | 50% | 6 | 7 |
| Scissor Lifts | 82 | 4 | 100% | 4 | 5 |
| EJC 430 Truck (20T) | 325 | 15 | 100% | 15 | 18 |
| EJC 430 Truck (20T) | 325 | 15 | 25% | 4 | 5 |
| 2 Boom Jumbo | 82 | 4 | 25% | 1 | 1 |
| MineCat | 75 | 4 | 25% | 1 | 1 |
| Mancarrier | 50 | 2 | 25% | 0.5 | 1 |
| Boom Truck | 82 | 4 | 100% | 4 | 5 |
| Total | 72 | 48 | 57 |
|
Table 15-3: Mine airflow requirement. | |
|
The initial ventilation program for this project will consist of five 250 hp fans to reach the bottom of the ramp via 137cm oval shaped steel or fibre glass conduit. This system will act as the temporary fresh air source for the ramp and mine until an fresh air raise/escapeway can be excavated and commissioned. | |
|
The ventilation raise dimensions are based on the air velocity in the raise, assuming that 100% of the airflow has to travel through the raise. | |
| 15.7 |
Material Handling |
Page | 58
Hislop Property
NI 43-101 Technical report
Material will be trucked out of the mine via the decline. A temporary mill feed storage area will be constructed on surface. The ore from the mine will be crushed using a contract rented portable crusher, loaded and hauled to the Holt Mill, as conducted with the Hislop pit ore in the past. Waste will be permanently stockpiled on surface. Upon confirmation that waste rock from Hislop is not potentially acid generating, it is likely that some of the waste will be used as construction aggregate.
Page | 59
Hislop Property
NI 43-101 Technical report
| 16.0 |
RECOVERY METHODS |
|
The mill recovery rate has been assumed at 92% based on historical performance in the mill and, at this point, the QP does not anticipate additional test work to assess the metallurgical performance of this ore type in the mill. | |
|
Description of the current milling process is summarized from the previous NI 43-101 technical report. | |
| 16.1 |
Process Plant Flow Sheet |
|
The Holt Mill was constructed in 1988 and was originally designed for a throughput of 1,360 tpd. Expansions in 1988 and 2001 increased the throughput to 2,500 tpd and 3,000 tpd, respectively. | |
|
Surface ore storage is a total of 4,900 t in three silos, the Holt headframe bin (900 t) and two other separate storage bins (1,000 t and 3,000 t). Ore can be delivered to the mill from the Holt Mine by conveyor or from a separate surface dump that enters a 100 tonne hopper, and then can be fed to either of the two storage bins. | |
|
The grinding circuit consists of a 5 m diameter by 6.1 m long Allis Chalmers ball mill, converted to a SAG mill, a 4 m diameter by 5.5 m long Allis Chalmers ball mill and a 3.6 m diameter by 4.9 m long tertiary ball mill, all operating in series and in closed circuit. The details of the grinding circuit are shown below in Table 16-1. The grinding circuit is controlled by an expert system and fuzzy logic. | |
|
The primary cyclone cluster consists of six 381 mm (15”) Krebs D15B cyclones. A secondary cyclone cluster consists of twelve 254 mm (10”) Krebs gMAX cyclones with an Outokumpu PSI-200 online analyzer. The secondary cyclone cluster feeds a 27 m (90 ft) Eimco thickener. The thickener underflow feeds six carbon-in-leach (CIL) tanks. The tank system is conventional gravity flow for slurry with counter-current carbon advancement. | |
|
Precious metal stripping is performed in batch operations, advancing 2.7 t of loaded carbon through a 1.2 m by 2.4 m (4 ft x 8ft) Simplicity screen. Carbon is transferred to an adsorption column where a Zadra process is utilized as the gold elution method. Barren solution is circulated through two shell and tube heat exchangers and a 360 kW electric inline heater. | |
|
The resulting pregnant solution is pumped from the solution tank to an electro-winning cell. The gold precipitate is further refined using a 125 kW Inductotherm furnace and the doré bars are poured in a seven mould cascade arrangement. After stripping, the carbon is regenerated in a rotary kiln, quenched, screened and returned to the process. Carbon fines are collected in a tank, filtered in a Perrin press, and packaged for sale. |
Page | 60
Hislop Property
NI 43-101 Technical report
The process flow sheet is shown in Figure 16-1.
Reagents and operating supplies for the mill, such as process chemicals and grinding steel, are stored in the reagent storage building attached to the concentrator at the south end of the building.
Laboratory
The assay laboratory is located at the Holt site in an area near but separate from the mill and previously used as an assay lab. The building was renovated and a sample preparation area, fire assay facilities and an AA facility were established to provide analytical services for the site.
| Data | Primary | Secondary | Tertiary |
| SAG mill | Ball mill #1 | Ball mill #2 | |
| Diameter (m) | 5.0 | 4.0 | 3.6 |
| Length (m) | 6.1 | 5.5 | 4.9 |
| Motor (hp) | 3,400 | 1,650 | 1,250 |
| Ball charge (%) | 8-12 | 45 | 40 |
| Grinding media | 5" balls | 2" balls | 1" slugs |
| Media consumption (kg/t) | 0.75 | 0.30 | 0.45 |
| Speed (rpm) | 13.9 | 16.2 | 17.3 |
| Critical speed (%) | 72.5 | 76.5 | 71.0 |
| Circulating load (%) | 10-15 | 350 | 225 |
| Power draw (kWh) | 2,250 | 1250-1450 | 750-900 |
| Lifters | Polymet | Rubber | Rubber |
| Liners | Polymet | Rubber | Rubber |
| Discharge grates (mm) | 18-30 mm | Overflow mill | |
| by 40 mm | |||
Table 16-1: Details of the grinding circuit.
Page | 61
Hislop Property
NI 43-101 Technical report

In the QP’s opinion, there are no processing factors or deleterious elements that could have a significant effect on potential economic extraction at Hislop.
Page | 62
Hislop Property
NI 43-101 Technical report
| 17.0 | PROJECT INFRASTRUCTURE |
|
The surface infrastructure from the previous open-pit operation will need to be re- established prior to start-up of the underground mine. | |
|
A budget of $3.0M is estimated to cover the costs associated with all surface projects required to develop and set up the Hislop Underground deposit: |
| • | Surface Facilities | |
| • | Portal | |
| • | Permitting | |
| • | U/G Projects |
Page | 63
Hislop Property
NI 43-101 Technical report
| 18.0 |
MARKET STUDIES AND CONTRACTS |
| 18.1 |
Market for the Product |
|
The QP has reviewed KLG contract with the refiner and he is satisfied that the contract reflects industry norms and reasonable market terms for selling Hislop gold production. | |
| 18.2 |
Material Contracts |
|
When a decision is made to re-start the operation, KLG will negotiate with one or more contractors for the development, mining and haulage to the Holt Mill. |
Page | 64
Hislop Property
NI 43-101 Technical report
| 19.0 |
ENVIRONMENTAL STUDIES, PERMITTING, AND SOCIAL OR COMMUNITY IMPACT |
|
There have not been additional studies since the operation at the mine ceased in 2015. | |
|
Material from the Hislop Mine was processed at the Holt Mill. The Holt Mine Tailings Management Facilities (TMF) are summarized below. | |
|
The TMF area contains four individual basins: two tailing ponds, one sludge precipitate pond and one polishing pond. Within the tailings facilities, there are 18 individual dam structures, a total of 465.4 ha of watershed area and 212 ha of tailings area. The remaining storage capacity is approximately 4.56 Mt at the close of 2016. In 2016, KLG submitted an amended permit to the MOE for the implementation of Sub-Aerial stacking in the Southwest Basin of the TMF. The amendment will provide an estimated additional 2.17 Mt of storage capacity. The tailings facilities are inspected annually by an external third party and comply with current provincial and federal regulations. A plan view of the TMF is displayed in Figure 19-1. | |
|
KLG has retained Golder Associates (Sudbury) to assess location(s) for additional tailings storage basin within the TMF that will provide sufficient storage capacity for the LOM plan. |
Page | 65
Hislop Property
NI 43-101 Technical report

As part of the Closure Plan process First Nations and community outreach consultation informs the public of developing projects.
KLG has recently signed an agreement with First Nations who have treaty and aboriginal rights which they assert within the operations area of the mine.
The agreement provides a framework for strengthened collaboration in the development and operations of the mine and outlines tangible benefits for the First Nations, including skills training and employment, opportunities for business development and contracting, and a framework for issues resolution, regulatory permitting and KLG’s future financial contributions.
Page | 66
Hislop Property
NI 43-101 Technical report
| 20.0 | CAPITAL AND OPERATING COSTS |
|
The Hislop Mine is not in operation. | |
|
When a decision to re-start the operation is made, a budget of $3.0M is estimated to cover the costs associated with all surface projects required to develop and set up the Hislop Underground deposit. These costs are based on historical pricing from recent projects of similar nature in the Timmins mining district. | |
|
A yearly maintenance cost of approximately $100,000 is budgeted until the operation re-start. |
Page | 67
Hislop Property
NI 43-101 Technical report
| 21.0 |
ECONOMIC ANALYSIS |
|
KLG is a producing issuer and, following instructions contained in Form 43-101F1 Technical Report, may exclude information required under Item 22 (Economic Analysis) for technical reports on properties currently in production unless the technical report includes a material expansion of current production. |
Page | 68
Hislop Property
NI 43-101 Technical report
| 22.0 |
ADJACENT PROPERTIES |
|
There are no adjacent properties to the Hislop Mine that are material to the scope of this technical report. |
Page | 69
Hislop Property
NI 43-101 Technical report
| 23.0 |
OTHER RELEVANT DATA AND INFORMATION |
|
There is no other relevant data or information on the Hislop Mine known to the QPs that if undisclosed would make this NI 43-101 technical report misleading or more understandable. |
Page | 70
Hislop Property
NI 43-101 Technical report
| 24.0 | INTERPRETATION AND CONCLUSIONS |
|
The Property is being maintained in a state that would require a minimum of time to re- start the operation. | |
|
The property is extremely well positioned geologically and is essentially surrounded by mineral deposits and a former mine. The Grey Fox deposit lies 1 km to the northwest, the former Ross Mine is located 1 km to the southeast. In 2016 the company conducted a VTEM Magnetics / Electro-magnetics survey over the property, which defined a number of geophysical anomalies at depth. The company is correlating the geology to the anomalies at this time. |
Page | 71
Hislop Property
NI 43-101 Technical report
| 25.0 |
RECOMMENDATIONS |
|
A number of recommendations arising from the Technical Report are: |
| • |
On-going exploration data compilation and target work-ups which integrate all geoscientific data sets. | |
| • |
Diamond drill follow-up is recommended to test for the mineralized extensions of the V2 zone to the east. | |
| • |
Work programs will be recommended once the results of the recent heliborne VTEM geophysical survey have been compiled and compared against the local geological and structural setting for the property. |
In 2017, the Company’s exploration efforts will continue to focus on identifying additional mineral resources near existing operations. KLG will also initiate “grass roots” exploration on high priority targets, based on a compilation and assessment of targets currently in KLG’s extensive database.
The Hislop underground proposed mine design should be re-assessed validated.
Page | 72
Hislop Property
NI 43-101 Technical report
| 26.0 | REFERENCES |
|
Ayer, J.A., Amelin, Y., Kamo, S.L., Ketchum, J.W.F., Kwok, K. and Trowell, N. 2002: Evolution of the southern Abitibi greenstone belt based on U-Pb chronology: autochthonous volcanic construction followed by plutonism, regional deformation and sedimentation; Precambrian Research, v. 115, pp. 63-95. | |
|
Ayer, J.A., Thurston, P.C., Bateman, R., Dube, B., Gibson, H.L., Hamilton, M.A., Hathway, B., Hocker, S.M., Houle, M.G., Hudak, G., Ispolatov, V.O., Lafrance, B., Lesher, C.M., MacDonald, P.J., Peloquin, A.S., Piercy, S.J., Reed, L.E. and Thompson, P.H., 2005: Overview of results from the Greenstone Architecture Project: Discover Abitibi Initiative: OGS, Open File 6154, 146 p. | |
|
Ayer, J.A., Trowell, N.F., Amelin, Y. and Corfu, F. 1999: Geological Compilation of the Abitibi Greenstone Belt in Ontario: Toward a revised Stratigraphy Based on Compilation and New Geochronology Results; in Summary of Field Work and Other Activities 1998: OGS MP169, pp. 14-24. | |
|
Belzile E. 2012, Hislop Pit Resource Estimation, Internal report prepared for St Andrew Goldfields Ltd dated December 19, 2012 14 pages. | |
|
Corfu, F., Jackson, S.L., and Sutcliffe, R.H., 1991: U-Pb ages and tectonic significance of late alkalic nonmarine sedimentation: Timiskaming Group, southern Abitibi belt. Canadian Journal of Earth Sciences, vol. 28, pp. 489-503. | |
|
Environment Canada, http://www.climate.weatheroffice.gc.ca | |
|
Goldfarb, R.J., Groves, D.I., Gardoll, S. 2001: Orogenic gold and geologic time: a global synthesis: Ore Geology Reviews, vol 18, pp. 1-75. | |
|
Heather, K.B. 1998: New insights on the stratigraphy and structural geology of the southwestern Abitibi greenstone belt: Implications for the tectonic evolution and setting of mineral deposits in the Superior Province: in The first age of giant ore formation: stratigraphy, tectonics and mineralization in the Late Archean and Early Proterozoic; Papers presented at the PDAC, pp. 63-101. | |
|
Miree, H., Hislop 2013 Resource Estimate parameters, 2013. | |
|
Poulsen, K.H., Robert, F., and Dube, B., 2000: Geological classification of Canadian gold deposits; geological Survey of Canada, Bulletin 540, 106 p. | |
|
Robert, F. Syenite Associated disseminated Gold Deposits in the Abitibi Greenstone Belt, Canada 2001. |
Page | 73
Hislop Property
NI 43-101 Technical report
Salehi, K., Hislop Project-technical study, internal report to SAS, January 26th, 2014.
Valliant, W., and Bergen, R. (SWRPA) Technical Report on the Hislop Project, Ontario, Canada, 2009.
Weather data for Timmins – web reference:
http://www.weather.com/outlook/travel/businesstraveler/wxclimatology/monthly/CAXX0 501.
Page | 74
Hislop Property
NI 43-101 Technical report
| 27.0 |
SIGNATURE PAGE AND DATE |
|
The undersigned prepared this technical report titled “Hislop Property, Ontario, Canada, Updated NI 43-101 Technical Report”. The effective date of this Technical Report is December 31, 2016 and the disclosure date is March 30, 2017. | |
|
Signed, |
| “signed and sealed” | ||
| Pierre Rocque, P. Eng. | March 30, 2017 | Kirkland Lake Gold Ltd. |
| 200 Bay Street, Suite 3120 | ||
| Toronto, Ontario, M5J 2J1 | ||
| Canada | ||
| “signed and sealed” | ||
| Doug Cater, P. Geo | March 30, 2017 | Kirkland Lake Gold Ltd. |
| 200 Bay Street, Suite 3120 | ||
| Toronto, Ontario, M5J 2J1 | ||
| Canada |
Page | 75
Hislop Property
NI 43-101 Technical report
CERTIFICATE OF QUALIFIED PERSON
I, Pierre Rocque, P. Eng., as an author of this report entitled “Hislop Property, Ontario, Canada, Updated NI 43-101 Technical Report” dated effective December 31, 2016 prepared for Kirkland Lake Gold Ltd. (the “Issuer”) do hereby certify that:
| 1. |
I am Vice President of Technical Services, at Kirkland Lake Gold Ltd., located at Royal Bank Plaza South Tower, 200 Bay Street, Suite 3120, Toronto, ON, Canada M5J 2J1. | |
|
| ||
| 2. |
This certificate applies to the technical report entitled “Hislop Property, Ontario, Canada, Updated NI 43-101 Technical Report”, dated effective December 31, 2016 (The “Technical Report”) | |
|
| ||
| 3. |
I graduated with a Bachelor’s degree in Mining Engineering (B. Ing.) in 1986 from École polytechnique de Montréal and a Master’s degree in Mining Engineering (M.Sc.Eng.) in 1992 from Queen’s University at Kingston. I have worked as a mining engineer since graduation from university in 1986. I have been directly involved in mine design of underground gold mines and, since 1997 I have overseen the mining engineering department at three narrow veins underground gold mines, providing relief to the Mine Manager and General Manager on site. Since 2008, I have provided corporate direction for the engineering function at junior gold exploration and producing companies, except from 2014 to 2016 where I was Global Director- Mining for an international EPCM firm. I am a member of Professional Engineers of Ontario and Ordre des ingénieurs du Québec. | |
|
| ||
| 4. |
I am familiar with National Instrument 43-101 – Standards of Disclosure for Mineral Projects (“NI 43-101”) and by reason of education, experience and professional registration I fulfill the requirements of a “qualified person” as defined in NI 43-101. | |
|
| ||
| 5. |
I last visited the Hislop Property, subject of the Technical Report, on March 2017. | |
|
| ||
| 6. |
I am responsible for the preparation of the Summary and Sections 1 to 5, 12, 14 to 27 of the Technical Report. | |
|
| ||
| 7. |
I am not independent of the Issuer as described in section 1.5 of NI 43-101, as I am an employee of the Issuer. Independence is not required under Section 5.3 (3) of NI 43–101. | |
|
| ||
| 8. |
I have prior involvement with the property that is the subject of the Technical Report as I was working for the previous owner of the Property between 2010 and 2014. | |
|
| ||
| 9. |
I have read NI 43–101 and the parts of the Technical Report for which I am responsible have been prepared in compliance with NI 43-101. | |
|
| ||
| 10. |
At the effective date of the Technical Report, to the best of my knowledge, information and belief, the parts of the Technical Report for which I am responsible contain all scientific and technical information that is required to be disclosed to make the Technical Report not misleading. |
Dated this 30th day of March, 2017.
“Signed and Sealed”
Pierre Rocque, P. Eng.
Vice President Technical Services
Page | 76
Hislop Property
NI 43-101 Technical report
CERTIFICATE OF QUALIFIED PERSON
I, Douglas Cater, P. Geo, as an author of this report entitled “Hislop Property, Ontario Canada, Updated NI 43-101” dated effective December 31, 2016 prepared for Kirkland Lake Gold Ltd. (the “Issuer”) do hereby certify that:
| 1. |
I am Vice President Exploration Canada, at Kirkland Lake Gold Ltd. located at Royal Bank Plaza, South Tower 200 Bay Street, Suite 3120 Toronto, Ontario, M5J 2J1 Canada. | |
| 2. |
This certificate applies to the technical report entitled “Hislop Property Updated NI-43-101”, dated effective December 31, 2016 (the “Technical Report”). | |
| 3. |
I graduated with a Bachelor of Science degree in Earth Science from University of Waterloo, Waterloo, ON, in 1981. I have worked as a geologist since graduation from university in 1981. During that time, I have been employed as exploration geologist, mine geologist, resource geologist and consulting geologist, at several mining companies. I am a member in full standing of the Association of Professional Geoscientists of Ontario with Registration No. 0161. I have practiced my profession for over thirty years. I have been an Exploration Manager / Chief Geologist at several gold mines and advanced stage exploration projects since 1991 and have been responsible for all geological functions including calculating and reporting Mineral Resources. I have been Vice President Exploration responsible for surface exploration activities on the company’s extensive land package since 2012. | |
|
4. |
I am familiar with National Instrument 43-101 – Standards of Disclosure for Mineral Projects (“NI 43-101”) and by reason of education, experience and professional registration I fulfill the requirements of a “qualified person” as defined in NI 43-101. | |
| 5. |
I last visited the Hislop Property, subject of the Technical Report, in October, 2016. | |
| 6. |
I am responsible for the Summary and Sections 6 to 11, 13 and 22 to 25 of the Technical Report. | |
| 7. |
I am not independent of the Issuer as described in section 1.5 of NI 43-101, as I am an employee of the Issuer . | |
| 8. |
I have prior involvement with the property that is the subject of the Technical Report. I have been frequently involved with the property having reviewed both the exploration programs and the Mineral Resource estimates at the site since 2012. | |
| 9. |
I have read NI 43-101 and the parts of the Technical Report for which I am responsible have been prepared in compliance with NI 43-101. | |
| 10. |
At the effective date of the Technical Report, to the best of my knowledge, information and belief, the parts of the Technical Report for which I am responsible contain all scientific and technical information that is required to be disclosed to make the Technical Report not misleading. |
Dated this 30 day of March, 2017.
| “Signed and Sealed” | |
| Douglas Cater, P. Geo | |
| Vice President Exploration |
Page | 77
Hislop Property
NI 43-101 Technical report
Appendix A: Hislop Property Claim list.
| Claim | Township | Claim Type | Size (ha) | Surface/Mining Rights |
| CP 468 | Hislop TWP | Patented Claim | 64.20 | Surface and Mineral Rights |
| L 23129 MRO | Hislop TWP | Patented Claim | 16.80 | Mining Rights |
| L 23129 SRO | Hislop TWP | Patented Claim | 16.80 | Surface Rights |
| L 23130 MRO | Hislop TWP | Patented Claim | 14.00 | Mining Rights |
| L 23130 SRO | Hislop TWP | Patented Claim | 14.00 | Surface Rights |
| L 24685 | Hislop TWP | Patented Claim | 16.70 | Surface and Mineral Rights |
| L 24686 | Hislop TWP | Patented Claim | 14.10 | Surface and Mineral Rights |
| L 24712 | Hislop TWP | Patented Claim | 18.30 | Surface and Mineral Rights |
| L 24713 | Hislop TWP | Patented Claim | 14.90 | Surface and Mineral Rights |
| L 26039 | Hislop TWP | Patented Claim | 20.70 | Surface and Mineral Rights |
| L 26040 | Hislop TWP | Patented Claim | 17.70 | Surface and Mineral Rights |
| L 26540 | Hislop TWP | Patented Claim | 25.10 | Surface and Mineral Rights |
| L 26541 | Hislop TWP | Patented Claim | 15.70 | Surface and Mineral Rights |
| L 26542 | Hislop TWP | Patented Claim | 18.20 | Surface and Mineral Rights |
| L 26819 | Guibord TWP | Patented Claim | 18.80 | Surface and Mineral Rights |
| L 26820 | Guibord TWP | Patented Claim | 18.50 | Surface and Mineral Rights |
| L 26821 | Guibord TWP | Patented Claim | 19.20 | Surface and Mineral Rights |
| L 26822 | Guibord TWP | Patented Claim | 18.80 | Surface and Mineral Rights |
| L 26958 | Hislop TWP | Patented Claim | 22.60 | Surface and Mineral Rights |
| L 26959 | Hislop TWP | Patented Claim | 20.90 | Surface and Mineral Rights |
| L 26960 | Hislop TWP | Patented Claim | 18.60 | Surface and Mineral Rights |
| L 26961 | Hislop TWP | Patented Claim | 14.00 | Surface and Mineral Rights |
| L 26962 | Hislop TWP | Patented Claim | 17.00 | Surface and Mineral Rights |
| L 26963 | Hislop TWP | Patented Claim | 17.60 | Surface and Mineral Rights |
| NP 2632 | Hislop TWP | Patented Claim | 66.50 | Surface and Mineral Rights |
| NP 2633 | Hislop TWP | Patented Claim | 62.60 | Surface and Mineral Rights |
Page | 78
REPORT ON THE
MINERAL RESOURCES & MINERAL RESERVES
OF THE
FOSTERVILLE GOLD MINE
In the State of Victoria, Australia
Prepared for
KIRKLAND LAKE GOLD LTD
Effective Date December 31, 2016
Dated March 30, 2017
Authors: Troy Fuller, MAIG Ion Hann, FAusIMM
i
| Technical Report | Kirkland Lake Gold |
| December 2016 | Fosterville Gold Mine |
IMPORTANT NOTICE
This Technical Report has been prepared as a National Instrument 43-101 Technical Report, as prescribed in
Canadian Securities Administrators’ National Instrument 43-101, Standards of Disclosure for Mineral Projects (NI 43-101) for Kirkland Lake Gold Ltd. (Kirkland Lake Gold). The data, information, estimates, conclusions and recommendations contained herein, as prepared and presented by the Authors, are consistent with: the information available at the time of preparation; the data supplied by outside sources, which has been verified by the authors as applicable; and the assumptions, conditions and qualifications set forth in this Technical Report.
CAUTIONARY NOTE WITH RESPECT TO FORWARD LOOKING INFORMATION
Certain information and statements contained in this Technical Report are “forward looking” in nature. All information and statements in this report, other than statements of historical fact, that address events, results, outcomes or developments that Kirkland Lake Gold Ltd. and/or the Qualified Persons who authored this report expect to occur are “forward-looking statements”. Forward looking statements are statements that are not historical facts and are generally, but not always, identified by the use of forward-looking terminology such as “plans”, “expects”, “is expected”, “budget”, “scheduled”, “estimates”, “forecasts”, “intends”, “anticipates”, “projects”, “potential”, “believes” or variations of such words and phrases or statements that certain actions, events or results “may”, “could”, “would”, “should”, “might” or “will be taken”, “occur” or “be achieved” or the negative connotation of such terms.
Forward-looking statements involve known and unknown risks, uncertainties and other factors which may cause actual results, performance or achievements to be materially different from any of its future results, performance or achievements expressed or implied by forward-looking statements. These risks, uncertainties and other factors include, but are not limited to, assumptions and parameters underlying the life of mine update not being realized, a decrease in the future gold price, discrepancies between actual and estimated production, changes in costs (including labour, supplies, fuel and equipment), changes to tax rates; environmental compliance and changes in environmental legislation and regulation, exchange rate fluctuations, general economic conditions and other risks involved in the gold exploration and development industry, as well as those risk factors discussed in the technical report. Such forward-looking statements are also based on a number of assumptions which may prove to be incorrect, including, but not limited to, assumptions about the following: the availability of financing for exploration and development activities; operating and capital costs; the Company’s ability to attract and retain skilled staff; sensitivity to metal prices and other sensitivities; the supply and demand for, and the level and volatility of the price of, gold; the supply and availability of consumables and services; the exchange rates of the Canadian dollar to the US dollar; energy and fuel costs; the accuracy of reserve and resource estimates and the assumptions on which the reserve and resource estimates are based; market competition; ongoing relations with employees and impacted communities and general business and economic conditions. Accordingly, readers should not place undue reliance on forward-looking statements. The forward-looking statements contained herein are made as of the date hereof, or such other date or dates specified in such statements.
All forward-looking statements in this Technical Report are necessarily based on opinions and estimates made as of the date such statements are made and are subject to important risk factors and uncertainties, many of which cannot be controlled or predicted. Kirkland Lake Gold Ltd. and the Qualified Persons who authored this report undertake no obligation to update publicly or otherwise revise any forward-looking statements contained herein whether as a result of new information or future events or otherwise, except as may be required by law.
ii
| Technical Report | Kirkland Lake Gold |
| December 2016 | Fosterville Gold Mine |
NON-IFRS FINANCIAL PERFORMANCE MEASURES
Kirkland Lake Gold has included a non-IFRS measure “total site costs”, “total site costs per ounce” and various unit costs in this Technical Report. The Company believes that these measures, in addition to conventional measures prepared in accordance with IFRS, provide investors an improved ability to evaluate the underlying performance of the Company. The non-IFRS measures are intended to provide additional information and should not be considered in isolation or as a substitute for measures of performance prepared in accordance with IFRS. These measures do not have any standardized meaning prescribed under IFRS, and therefore may not be comparable to other issuers.
iii
| Technical Report | Kirkland Lake Gold |
| December 2016 | Fosterville Gold Mine |
iv
| Technical Report | Kirkland Lake Gold |
| December 2016 | Fosterville Gold Mine |
v
| Technical Report | Kirkland Lake Gold |
| December 2016 | Fosterville Gold Mine |
vi
| Technical Report | Kirkland Lake Gold |
| December 2016 | Fosterville Gold Mine |
| FIGURES | PAGE NO. |
vii
| Technical Report | Kirkland Lake Gold |
| December 2016 | Fosterville Gold Mine |
viii
| Technical Report | Kirkland Lake Gold |
| December 2016 | Fosterville Gold Mine |
| TABLES | PAGE NO. |
ix
| Technical Report | Kirkland Lake Gold |
| December 2016 | Fosterville Gold Mine |
1 EXECUTIVE SUMMARY
This technical report has been prepared for Kirkland Lake Gold Ltd. (Kirkland Lake Gold), the beneficial owner of the Fosterville Gold Mine. Kirkland Lake Gold is listed on the Toronto Stock Exchange under the ticker symbol “KL”. On November 30, 2016, Newmarket Gold Inc. (“Newmarket”) combined with Kirkland Lake Gold Inc. and the combined company was renamed Kirkland Lake Gold Ltd. As used in this Technical Report, unless the context otherwise requires, reference to “Kirkland Lake Gold” or the “Company” means Kirkland Lake Gold Ltd. and the subsidiaries. Reference to “Newmarket Gold” means the Company when it was previously named Newmarket Gold and its subsidiaries, prior to the completion of the arrangement with Kirkland Lake Gold Inc.
This document provides the Mineral Resource and Mineral Reserve estimates for the Fosterville Gold Mine that have resulted from ongoing exploration and resource definition and as a result of ongoing mine design and evaluation during the period January 1, 2016 to December 31, 2016.
| 1.1 | LOCATION |
The Fosterville Gold Mine (Fosterville or FGM) is located approximately 20km northeast of the city of Bendigo and 130km north of the city of Melbourne in the State of Victoria, Australia.
The FGM and all associated infrastructure including the tailings dam and waste dumps are located on Mining Lease 5404, which is 100% owned by Kirkland Lake Gold Ltd.
Kirkland Lake Gold also holds titles through FGM of two surrounding Exploration Licenses totaling 504.9km 2. These exploration licenses encompass the entire known strike extent of the Fosterville Goldfield.
| 1.2 | HISTORY AND OWNERSHIP |
Gold was first discovered in the Fosterville area in 1894 with mining activity continuing until 1903 for a total of 28koz of production. Mining in this era was confined to the near-surface oxide material. Aside from a minor tailings retreatment in the 1930’s, activity resumed in 1988 with a further tailings retreatment program conducted by Bendigo Gold Associates, which ceased in 1989. Mining recommenced in 1991 when Brunswick Mining NL and then Perseverance Corporation Ltd. (from 1992) commenced heap-leaching operations from shallow oxide open pits. Between 1988 and the cessation of oxide mining in 2001, a total of 240koz of gold were poured (Roberts et al, 2003).
A feasibility study into a sulfide mining operation was completed by Perseverance in 2003 with construction and open pit mining commencing in early 2004. Commercial production commenced in April 2005 and up to the end of December 2006 had produced 136,882oz gold. In October 2007, Perseverance announced that it had entered into an agreement with Northgate Minerals Corporation to acquire the company with full control passing to Northgate in February 2008.
The 500,000th ounce of sulfide gold production was achieved in April 2011.
In August 2011, Northgate entered into a merger agreement with AuRico Gold Inc. who assumed control of Northgate in October 2011. In March 2012 AuRico and Crocodile Gold Corp jointly announced that Crocodile Gold would acquire the Fosterville and Stawell Mines. Crocodile Gold’s ownership of Fosterville was achieved on May 4, 2012. In July 2015, Newmarket Gold Inc. merged with Crocodile Gold to form Newmarket Gold Inc.
1
| Technical Report | Kirkland Lake Gold |
| December 2016 | Fosterville Gold Mine |
In January 2016 a significant milestone in Fosterville Gold Mine’s history was reached when the 1,000,000th ounce of sulfide gold was poured.
At the end of November 2016, Kirkland Lake Gold Inc. merged with Newmarket Gold Inc. to form a new mid-tier gold company Kirkland Lake Gold Ltd.
| 1.3 | GEOLOGY AND MINERALIZATION |
The Fosterville Goldfield is located within the Bendigo Structural Zone in the Lachlan Fold Belt. The deposit is hosted by an interbedded turbidite sequence of sandstones, siltstones and shales. This sequence has been metamorphosed to sub-greenschist facies and folded into a set of upright, open to closed folds. The folding resulted in the formation of a series of bedding parallel laminated quartz (LQ) veins.
Mineralization at Fosterville is controlled by late brittle faulting. These late brittle faults are generally steeply west dipping, reverse faults with a series of moderately west dipping, reverse splay faults formed in the footwall of the main fault. There are also moderately east dipping faults, which have become more significant footwall to the anticlinal offsets along the west dipping faults. Primary gold mineralization occurs as disseminated arsenopyrite and pyrite forming as a selvage to veins in a quartz–carbonate veinlet stockwork. The mineralization is structurally controlled with high-grade zones localized by the geometric relationship between bedding and faulting. Mineralized shoots are typically 4m to 15m thick, 50m to 150m up and down-dip and 300m to 2,000m+ down-plunge.
Antimony mineralization, in the form of stibnite, occurs with quartz and varies from replacement and infill of earlier quartz-carbonate stockwork veins, to massive stibnite-only veins up to 0.5m in width. The stibnite-quartz event occurs in favourable structural locations, such as the Phoenix, Eagle and Lower Phoenix structures. There are also occurrences of primary visible gold (≤3mm in size) that has a spatial association with stibnite in fault related quartz veins. The occurrence of visible gold is becoming increasingly significant at Fosterville and is being observed more frequently with depth and down-plunge within the Lower Phoenix Mineralized Zones. During 2016 visible gold mineralization occurrences were also frequently observed at depth in the Harrier Mineralized Zones.
Fosterville Gold Mine engaged Quantitative Group (QG) in November 2014, in response to the noted increased frequency of visible gold occurrences at depth, to provide FGM with some external advice and thinking regarding the implications to resource estimation and mine geology practices. Throughout 2015 and 2016 QG continued to assist FGM through review of current practices and providing technical theory and background to sampling, assaying and resource modeling in visible gold environments.
| 1.4 | CURRENT STATUS |
Since the commencement of commercial gold production in April 2005, the sulfide plant at Fosterville Gold Mine has produced 1,152,373oz of gold up to the end of December 2016. This production was initially sourced solely from open cut mining with underground mining starting to contribute from late 2006. The Harrier open cut was initially completed in December 2007 and since that time the underground mine has been the primary source of ore. Ore sourced from a series of pit expansions on the previously mined Harrier, John’s and O’Dwyer's South Pits between Q1 2011 and Q4 2012 has provided supplementary feed to underground ore sources. Since the beginning of 2013 underground operations have been the sole provider of mill feed at Fosterville. Current mining activities are focused on the Central, Phoenix and Harrier underground areas and current gold production outlook for 2017 is between 140,000oz and 145,000oz.
2
| Technical Report | Kirkland Lake Gold |
| December 2016 | Fosterville Gold Mine |
Kirkland Lake Gold is planning to undertake 128,019m of exploration and resource definition drilling and continue the development of dedicated underground drill platforms (2,055m). Total estimated cost for exploration and resource development activities for 2017 is AUD$40.4M.
| 1.5 | MINERAL RESOURCES AND MINERAL RESERVES |
The Mineral Resources and Mineral Reserves reported are contained within the mine lease MIN5404 (Section 4). Within the mine lease, the Mineral Resource Areas of Central, Southern, Harrier and Robbin’s Hill are historically defined resource areas, which were established at different times in the evolution of the project. The Central Area contains multiple Mineral Resource models, primarily for reasons of data handling. Details on Mineral Resource block model extents can be seen in Figure 14-1.
Mineral Resources are reported inclusive of Mineral Reserves.
All Mineral Reserves are contained within the Central and Harrier Mineral Resource Areas. Mineral Reserves contained within the Central Mineral Resource Area have been subdivided into Central and Phoenix Mineral Reserves Table 15-1.
CIL Residue Mineral Resource and Mineral Reserves are distinguished from in situ Mineral Resources and Mineral Reserves in Table 1.1and Table 1-2 on the basis of differing recovery assumptions.
3
| Technical Report | Kirkland Lake Gold |
| December 2016 | Fosterville Gold Mine |
TABLE 1-1 SUMMARIZED MINERAL RESOURCES (INCLUSIVE OF MINERAL RESERVE) FOR FGM AS AT DECEMBER 31, 2016
| Summarized Mineral Resources (Inclusive of Mineral Reserve) for Fosterville as of December 31, 2016 | |||
| Classification |
Tonnes (kt) |
Gold Grade (g/t Au) |
Insitu Gold (kOz) |
| Oxide and Sulfide Materials | |||
| Measured | 2,141 | 3.98 | 274 |
| Indicated | 12,562 | 5.85 | 2,361 |
| Total (Measured and Indicated) | 14,703 | 5.58 | 2,636 |
| Inferred | 5,404 | 4.56 | 792 |
| CIL Residues | |||
| Measured | 616 | 7.73 | 153 |
Notes:
| 1. |
CIM definitions (2014) were followed in the estimation of Mineral Resources. |
| 2. |
For the Mineral Resource estimate, the Qualified Person is Troy Fuller. |
| 3. |
The Mineral Resources reported are inclusive of the Mineral Reserves. |
| 4. |
See notes provided for Table 14-1 for more detail on oxide and sulfide resources. |
| 5. |
CIL residues are stated as contained ounces – 25% recovery is expected. Recoveries are based on operating performances. |
| 6. |
Mineral Resources are rounded to 1,000t, 0.01 g/t Au and 1koz. Minor discrepancies in summation may occur due to rounding. |
| 7. |
Mineral Resources that are not Mineral Reserves do not have demonstrated economic viability. |
| 8. |
The Mineral Resource estimate used a gold price of US$1,200 per ounce (AUD$1,500 per ounce). |
| 9. |
Cut-off grades applied are 0.7 g/t Au for oxide, 1.0 g/t Au for near-surface sulfide (above 5050mRL) and 3.0 g/t Au for underground sulfide mineralization (below 5050mRL). |
| 10. |
A minimum mining width of 2.5m was applied. |
| 11. |
Density of mineralized material applied 2.40t/m3 for oxide, 2.56t/m3 for transitional material, 2.64t/m3 for fresh material between 5000 and 5050mRL, 2.72t/m3 for fresh material between 4500 and 5000mRL and 2.78t/m3 for fresh material below 4500mRL. |
4
| Technical Report | Kirkland Lake Gold |
| December 2016 | Fosterville Gold Mine |
TABLE 1-2 SUMMARIZED MINERAL RESERVES FOR FGM AS AT DECEMBER 31, 2016
| Summarized Mineral Reserves for Fosterville as of December 31, 2016 | |||
| Classification | Tonnes (kt) |
Gold Grade (g/t Au) |
Insitu Gold
(kOz) |
| Proven | 280 | 8.43 | 76 |
| Probable | 1,276 | 10.08 | 414 |
| Total (Proven and Probable) | 1,557 | 9.78 | 490 |
| CIL Residues | |||
| Proven | 616 | 7.73 | 153 |
Notes:
| 1. |
CIM definitions (2014) were followed in the estimation of Mineral Reserves. |
| 2. |
For the Mineral Reserves estimate, the Qualified Person is Ion Hann. |
| 3. |
The Mineral Reserve estimate used a gold price of US$1,200 per ounce (AUD$1,500 per ounce). |
| 4. |
The cut-off grades applied ranged from 1.6 g/t to 3.1 g/t Au for underground sulfide ore depending upon width, mining method and ground conditions. |
| 5. |
Dilution ranging between 10% to 60% and mining recovery ranging between 40% to 95% were applied to stopes within the Mineral Reserves estimate. |
| 6. |
Mineral Reserves are rounded to 1,000t, 0.01 g/t Au and 1koz. Minor discrepancies in summation may occur due to rounding. |
| 7. |
CIL residue is stated as contained ounces – 25% recovery is expected. Recoveries are based on operating performances. |
| 1.6 | CONCLUSIONS AND RECOMMENDATIONS |
The Authors have made the following interpretations and conclusions:
| • | The understanding of the fundamental geological controls on mineralization at Fosterville is high. Primary mineralization is structurally controlled with high-grade zones localized by the geometric relationship between bedding and west dipping faulting. This predictive model has led to considerable exploration success in following the down-plunge extensions of high-grade mineralization; |
| o |
The Lower Phoenix Fault is the primary west dipping structure in the active mine development area and is defined by reverse faulting on a shale package where anticline thrust displacement of ~80m occurs. The fault dips between 35 and ~55 degrees to the west and mineralization can be traced along a dip extent of ~190m and strike extent of ~1.75km. The dominant mineralization style on this structure is disseminated sulfide, however, occurrences of visible gold at depth are becoming increasingly more common, concentrated where footwall structures intersect. The Lower Phoenix System currently remains open to the north and south so maximum plunge extent has not yet been defined, | |
| o |
Throughout 2016, development mapping and continued drilling confirmed that there were multiple mineralized structures of various size and continuity footwall to the main west dipping Lower Phoenix Fault, which present significant resource growth potential. Progressive geological understanding of the Phoenix and Lower Phoenix footwall environs has highlighted the significance of these favorable settings for mineralization, including, | |
| o |
East dipping mineralized structures, namely the Eagle Fault and East Dipping Faults, which commonly contain quartz–stibnite vein assemblages and substantial concentrations of visible gold, typically enveloped by halos of disseminated sulfide. The Eagle Fault is discordant to bedding and variably dips between 10 and 60 degrees to the east and transforms further to the south to strike in an ENE direction, dipping ~45 degrees to the SSE. Mineralization on the Eagle Zone extends over a 790m strike extent and is untested and open at depth below the 3960mRL and south of 6350mN. Drilling is planned to target beyond this extent during the remainder of 2017. East Dipping Faults are typically bedding parallel to sub parallel with dips of ~70 degrees east to sub vertical. The defined extent of East Dipping structures containing significant mineralization is now approximately 1.5km, |
5
| Technical Report | Kirkland Lake Gold |
| December 2016 | Fosterville Gold Mine |
| o |
Low-angled Lower Phoenix Footwall west dipping structures typically consist of large quartz veins up to several meters wide with laminated textures, indicating a series of multiple mineralizing events, including a later stage quartz-stibnite phase of mineralization with visible gold. The faults are interpreted to have minimal offset but rather have been hydraulically fractured. Where these structures form linkages between the Lower Phoenix and East Dipping Faults, extremely high gold grades are observed. During 2016 drilling extending footwall to the Lower Phoenix discovered west dipping Lower Phoenix Footwall mineralization, which occupies a reverse fault structure that exhibits ~20m of thrust offset, returning some of the highest grade intercepts returned on the Fosterville Lease. The defined size of this high-grade mineralized structure is now 200m in strike length and 160m in vertical extent. The mineralized zone appears to adjoin the high- grade Eagle structure at its lower edge and is untested down-plunge. Continued drilling from the hangingwall drill platforms during 2017 will continue to advance the understanding of the size and scale of this attractive resource growth target. |
| • |
Continued drill definition of these structures over 2016, in combination with ore development and production exposure and reconciliation performance has reaffirmed the significance of these easterly dipping footwall structures to the Lower Phoenix Fault. The defined continuity, proximity to existing Mineral Resources and high-grade tenor of these structures enhances the December 2016 Mineral Resource and Reserve position. Furthermore, mineralization on these structures is open down-plunge, providing encouraging future Mineral Resource and Mineral Reserve growth potential for the Fosterville operation; |
|
| |
| • |
Continued drilling into the Harrier system over 2016 has identified high-grade mineralization containing significant amounts of visible gold at depth, primarily associated with the Harrier Base structure. The Harrier Base structure exhibits reverse thrust movement of approximately 60m. Visible gold is hosted within a laminated quartz-carbonate vein assemblage, which may contain minor amounts of stibnite. In the strongest mineralized zones a broad halo of sulfide mineralization surrounds quartz structures bearing visible gold. The high-grade visible gold mineralization was first recognized at approximately the 4480mRL, a comparable elevation to where visible gold occurrences in the Lower Phoenix became more prominent. The Harrier Base mineralization is open to the south; |
|
| |
| • |
There is an observed change in the nature of some of the Fosterville mineralization at depth with a number of high-grade, quartz-carbonate +/- stibnite vein hosted, visible gold drill intercepts recorded for the Eagle, Lower Phoenix, Lower Phoenix Footwall, East Dipping and Harrier Zones. Disseminated sulfide mineralization continues to persist at all depths and is uniform in character. It is currently inferred that the quartz-carbonate +/-stibnite-visible gold assemblages have been emplaced at a later date to the disseminated sulfide providing an upgrade to the mineralization; |
|
| |
| • |
Progressive geological interpretation has led to continued development of robust geological and resource models underpinning the Mineral Resource and Mineral Reserve estimates. The relationship between mineralization and the controlling structural/stratigraphic architecture means that quality geological interpretation is critical to producing quality resource/reserve estimates; and |
6
| Technical Report | Kirkland Lake Gold |
| December 2016 | Fosterville Gold Mine |
| • |
The modifying factors used to convert the Mineral Resources to Mineral Reserves have been refined with the operating experience gained since underground production commenced in September 2006. In particular, the robustness of the mining recovery and dilution estimates has improved with experience relative to the pre-mining assessments. |
The following recommendations are made:
| • |
Further mine lease growth exploration activities should be pursued. Given the strong understanding of geological controls on mineralization, this could have the potential to yield additional resources and reserves. Particular areas that are recommended to focus upon are the up and down-plunge extensions of the Lower Phoenix structure (northwards up-plunge from 8200mN and southwards down-plunge from 6200mN). Exploration of the Lower Phoenix southwards of 6200mN is technically challenging from surface due to target depths and as such Kirkland Lake Gold has commenced the development of dedicated underground drill platform to facilitate further exploration of the Lower Phoenix system down-plunge. The current 2017 exploration budget includes development extensions of the Harrier Exploration Drive Decline, P4190 Drill Drive and Central Decline Drill Drive to establish drilling platforms to target Lower Phoenix extensions at a cost of AUD$12.44M. Diamond drilling from these platforms is estimated to cost AUD$4.08M to explore these gold targets; |
|
| |
| • |
A Harrier Drill Drive Incline development is also planned to commence from the Phoenix Decline in 2017 at a cost of AUD$2.88M. This development is projected to join with the Harrier Drill Drive Decline in 2018 providing a link between the Harrier and Phoenix mining areas. The long term benefits of this development link are significant, not only as providing a hangingwall drill platform to explore the Lower Phoenix extensions over a 1.5km strike extent, but also in unconstraining production as it will provide an alternative ore haulage route; |
|
| |
| • |
Exploration of the Lower Phoenix, up-plunge, northwards of 8200mN should be progressively pursued from surface drill positions to provide satisfactory drill intercept angles. A total of four drill sections are planned from surface to explore the Lower Phoenix and Lower Phoenix Footwall targets at a cost of AUD$3.19M; |
|
| |
| • |
With an increasing grade profile identified at depth and the establishment of high-grade Mineral Reserves at lower levels in Harrier, it is strongly recommended that the down-plunge extensions of the Harrier system are further explored. The 2017 budget plan has a scheduled development extension of the H4625 Drill Drive at a cost of AUD$797K, which will facilitate a 100m step out section of drilling beyond the current extent of Mineral Resources and Mineral Reserves at a cost of $558K; |
|
| |
| • |
Given the unexplored potential of the Fosterville Goldfield, it is recommended that growth drill programs are implemented in pursuit of defining potential Mineral Resources independent from current mining centers. Growth drill programs planned to be undertaken within the mining lease during 2017 include the Harrier Up-Dip program, which will explore for gold mineralization between the existing Harrier Mineral Resource and the Daley’s Hill Pit and the Robbin’s Hill Program, which will continue to build an understanding of the underground Mineral Reserve potential beneath the Robbin’s Hill pits. A total cost of AUD$3.50M is budgeted in 2017 to execute these programs; |
|
| |
| • |
To advance the pipeline of regional growth targets on surrounding exploration licenses, Fosterville is planning to drill an adjacent line of mineralization at Sugarloaf located approximately 1km to the west of the Fosterville Line with a scoping drill hole from an underground platform at a cost of AUD$234K. A regional soil sampling program at a cost of AUD$32K is also planned. In addition, given the recent technological advancements and successful application of seismic exploration in the mining industry, Fosterville has budgeted for preliminary seismic works to assess the suitability of this method to optimize drill targeting. The project is proposed to be undertaken during 2017 at a cost of AUD$400K, and if successful, could lead to further application on a more regional scale; |
7
| Technical Report | Kirkland Lake Gold |
| December 2016 | Fosterville Gold Mine |
| • |
The infill/resource definition programs should be continued with an aim to maintain a minimum two years of reserves drilled out to 25m centers (or closer where necessary). Both the south plunging, westerly dipping Phoenix and Lower Phoenix Mineralized Zones and the easterly dipping Eagle and East Dipping Mineralized Zones require definition drilling, which is to be conducted from both hangingwall (western side) and footwall (eastern side) drill platforms. Infill/definition drilling should also target the down-plunge extensions of the Harrier Mineralized Zones with the aim of increasing Mineral Resource confidence. A total of AUD$13.4M is budgeted to undertake infill/definition drilling in 2017. As the decline and mining front continues to move south and to depth, further hangingwall drives will be required. This work and the associated drilling have not been cost estimated in detail; and |
|
| |
| • |
The observed increased frequency of visible gold intercepts at depth requires continued research to better understand the potential implications on future geological, mining and metallurgical processes. Kirkland Lake Gold continued to seek external advice over 2016 in relation to sampling, assaying and resource estimation of visible gold mineralization. Based on recommendations from external reviews, project plans have been developed and implemented. |
With this additional drilling data and further ongoing operational experience, it is recommended that mining recovery and dilution factors are reviewed and refined on an ongoing basis.
8
| Technical Report | Kirkland Lake Gold |
| December 2016 | Fosterville Gold Mine |
2 INTRODUCTION
| 2.1 | TERMS OF REFERENCE |
This technical report on Fosterville Gold Mine is to support public disclosure of Mineral Resource and Mineral Reserve estimates effective at Fosterville as at December 31, 2016. This report has been prepared in accordance with disclosure and reporting requirements set forth in the National Instrument 43-101 (NI 43-
101) ‘Standards of Disclosure for Mineral Projects’ and Form 43-101F1, dated May 2011.
This report has been prepared for Kirkland Lake Gold, the beneficial owner of Fosterville. Kirkland Lake Gold (KL) is listed on the Toronto Stock Exchange. Kirkland Lake Gold is a Canadian-listed gold mining and exploration company with operating mines in Canada and Australia.
The report provides an update of the Mineral Resource and Mineral Reserve (MRMR) position as of December 31, 2016. The MRMR estimate for Fosterville is a summation of a number of individual estimates for various mineralized zones or various geographically constrained areas. All of these estimates are contained within the Mining Lease MIN5404 (Fosterville Mine Lease). Details of the locations and geographical constraints of the various mineralized zones as of December 2016 are given in Section 14.
The report includes an overview of Fosterville Gold Mine, which has been compiled from Company technical reports, published geological papers and internal Mineral Resource and Mineral Reserve documents completed by members of the FGM mine geological and engineering teams. The overview includes a description of the geology, project history, exploration activities and results, methodology, quality assurance, interpretations, metallurgy, land issues and environmental information. It also provides recommendations on additional exploration drilling which has the potential to upgrade resource classifications and to augment the resource base.
Mr Troy Fuller of Fosterville is a Qualified Person as defined by NI 43-101 and accepts overall responsibility for the preparation of sections 1-14, 17, 18.1, 19 – 27 and 28.2 of this report.
Mr Ion Hann of Fosterville is a Qualified Person as defined by NI 43-101 and accepts overall responsibility for the preparation of sections 15-16, 18.2 and 28.1 of this report.
| 2.2 | FIELD INVOLVEMENT OF QUALIFIED PERSONS |
Ion Hann is the Mining Manager for FGM. He has over 25 years of experience in the mining industry. In this time, 10 years of relevant experience in gold mining operations has been gained at Fosterville.
Troy Fuller is the Geology Manager for FGM. He has over 20 years mining experience and has 18 years of gold operations experience in the Northern Territory, Western Australia and Victoria. Troy Fuller has managed all aspects of the geological operations for Fosterville since May 2010.
All of the Qualified Persons are based at Fosterville and through routine personal inspection have a comprehensive understanding of the property conditions, geology and mineralization, work completed and works planned /recommended.
9
| Technical Report | Kirkland Lake Gold |
| December 2016 | Fosterville Gold Mine |
| 2.3 | DEFINITIONS |
TABLE 2-1 DEFINITION OF TERMS
| Term | Description |
| AAS | Atomic Absorption Spectroscopy |
| AC | Air core |
| acQuire | acQuire - Geoscientific Information Management System |
| Ag | Silver |
| AHD | Australian Height Datum (mean sea level) |
| AIG | Australian Institute of Geoscientists |
| Aminya | Aminya Laboratory Services |
| Ammtec | ALS Ammtec Ltd. |
| ALS | Australian Laboratory Services |
| AMDEL | Amdel Analytical Laboratories |
| As | Arsenic |
| Au | Gold |
| AUD | Australian Dollar |
| AuRico | AuRico Gold Corporation |
| AusIMM | Australian Institute of Mining and Metallurgy |
| Bendigo Gold Associates |
Bendigo Gold Associates Ltd., owner of the FGM prior to Brunswick |
| BETS-SHTS | Bendigo to Shepparton power line |
| BHP | Broken Hill Proprietary, now BHP Billiton |
| Biomin | Biomin South Africa Pty Limited |
| BIOX® | Proprietary bacterial oxidation technology licensed from Goldfields Ltd. |
| Brunswick | Brunswick Mining N.L., owner of the FGM prior to Perseverance |
| C$ | Canadian Dollar (CAD) |
| Ca | Calcium |
| CCD | Counter Current Decantation |
| Cd | Cadmium |
| Ce | Cerium |
| CIL | Carbon in Leach |
| CIL Residue | Carbon in Leach Residue. The term is equivalent to CIL Tailings. |
| CIM | Canadian Institute of Mining, Metallurgy and Petroleum |
| cm | Centimeter |
| COG | Cut-off Grade |
| CP | Chartered Professional |
| Crocodile Gold | Crocodile Gold Corporation |
| Cu | Copper |
| DTM | Digital Terrain Model |
| E | Easting |
| EL | Exploration License |
| EMS | Electronic Multi-shot Survey |
| EPA | Environment Protection Authority |
| ETW | Estimated True Width |
| Fe | Iron |
| FGM | Fosterville Gold Mine |
| FVTS | Fosterville Terminal Station |
| FW | Footwall |
| FY | Future Year |
| g/cm3 | Gram per cubic centimeter (unit of density) |
| GAL | Gekko Assay Laboratory |
| GDA94 | Geocentric Datum of Australia, 1994 |
| GC | Grade Control |
| GSV | Geoscience Victoria |
| g/t | Grams per (metric) tonne |
| HCl | Hydrogen Chloride |
| HDPE | High Density Polyethylene |
10
| Technical Report | Kirkland Lake Gold |
| December 2016 | Fosterville Gold Mine |
| Term | Description |
| HF | Hydrogen Fluoride |
| HG | High-grade |
| Historic Resource |
A qualified person has not done sufficient work to classify historical estimates as current Mineral Resources or Mineral Reserves described within the report. Kirkland Lake Gold is not treating any historical estimates as current Mineral Resources or Mineral Reserves. |
| HNO3 | Nitric Acid |
| HQ | 63.5 mm diameter diamond drill core |
| HRM | Harrier Resource Model |
| HW | Hangingwall |
| ICP-AES | Inductively Coupled Plasma – Atomic Emission Spectrometry |
| IP | Induced Polarization – geophysical imaging technique |
| ISO | International Organization for Standardization |
| K | Potassium |
| km | Kilometer |
| km2 | Square kilometer (area) |
| koz | Kiloounce |
| kt | Kilotonne |
| K/Th | Potassium/Thorium ratio - relating to a 2008 airborne radiometric survey |
| kV | Kilovolt |
| kVA | Kilovolt-ampere |
| kW | Kilowatt |
| LG | Low-grade |
| LOM | Life of Mine |
| LQ | Laminated Quartz |
| M | Mega (SI prefix; Factor 106) |
| m | Meter |
| µ | Micro (SI prefix; factor 10-6) |
| Ma | Million years |
| MCC | Motor Control Centre |
| Mg | Magnesium |
| MGA | Map Grid of Australia |
| MIN | Mining Lease |
| ML | Megalitre |
| mm | Millimeter |
| Mn | Manganese |
| Mo | Molybdenum |
| MRMR | Mineral Resources and Mineral Reserves |
| Mt | Mega-tonne (metric) |
| Mtpa | Mega-tonne (metric) per annum |
| MVA | Megavolt-ampere |
| N | Northing |
| NATA | National Association of Testing Authorities |
| Nb | Niobium |
| NCC | Non-carbonate carbon |
| New Holland | New Holland Mining Ltd., now Nu Energy Capital Limited |
| Newmarket | Newmarket Gold Inc. |
| NI43-101 | National Instrument 43-101 |
| NNE | North North-East |
| NNW | North North-West |
| NRM | Northern Resource Model |
| Northgate | Northgate Minerals Corporation |
| NQ | 47.6 mm diameter diamond drill core |
| NQ2 | 50.6 mm diameter diamond drill core |
| NW | Northwest |
| ODW | O’Dwyer's |
| ONAF | Oil Natural Air Forced – Transformer cooling without pumps and fans for air |
| ONAN | Oil Natural Air Natural - Transformer cooling without pumps and fans |
| O/O | Oblique /Oblique (structural setting) |
11
| Technical Report | Kirkland Lake Gold |
| December 2016 | Fosterville Gold Mine |
| Term | Description |
| O/P |
Oblique /Parallel (structural setting) |
| OSLS |
On Site Laboratory Services |
| oz |
Troy Ounce (31.1034768 grams) |
| P |
Phosphorous |
| PAF |
Potentially Acid Forming |
| Pb |
Lead |
| P/O |
Parallel /Oblique (structural setting) |
| P/P |
Parallel /Parallel (structural setting) |
| ppb |
Parts per billion |
| PRM |
Phoenix Resource Model |
| PQ |
85.0 mm diameter diamond drill core |
| PSV |
Perseverance Corporation Ltd., a wholly owned subsidiary of Newmarket Gold |
| QAQC |
Quality Assurance – Quality Control |
| QG |
Quantitative Group (Geostatistical Consultants) |
| QP |
Qualified Person |
| R2 |
R squared – coefficient of determination |
| RAB |
Rotary Air Blast |
| RC |
Reverse Circulation |
| RH |
Robbin’s Hill |
| Riffle splitter |
A device comprising tiers of ‘riffles’ for equi-probable splitting of dry particulate matter (e.g. drill chips), each tier yields a 50:50 split. |
| RL |
Reduced Level (elevation) |
| ROM |
Run of Mine |
| RQD |
Rock Quality Designation |
| S |
Sulfur |
| SAG |
Semi-Autogenous Grinding |
| Sb |
Antimony – present at Fosterville in the mineral stibnite |
| SD |
(Statistical) Standard Deviation |
| SMU |
Selective Mining Unit |
| SP Ausnet |
SP Ausnet – Electricity Distributor |
| Spear sampling |
Using a tube (‘spear’) to collect a sample for assay from a sample bag of RC or RAB drill chips (this method is not equi-probable as it is susceptible to density segregation in the sample bag) |
| SQL |
Structured Query Language |
| t |
(Metric) tonne (2204.6 lb or 1.1023 short tonnes) |
| Tailings |
Ground rock and process effluents generated during processing of ore |
| TGC |
Total Graphitic Carbon |
| t/m3 |
Tonne per cubic meter (unit of density) |
| TOEC |
Total Organic and Elemental Carbon |
| tpa |
Tonnes Per Annum |
| TSF |
Tailings Storage Facility |
| UG |
Underground |
| WPV |
Work Plan Variation |
12
| Technical Report | Kirkland Lake Gold |
| December 2016 | Fosterville Gold Mine |
3 RELIANCE ON OTHER EXPERTS
The Qualified Persons have prepared this report from a range of sources including their personal work, contributions, from other FGM personnel and reports from a range of external consultants. Where input has been received from these sources, the Qualified Persons have reviewed and verified the contained assumptions and conclusions. The Qualified Persons do not disclaim responsibility for this information.
Other experts which have assisted with the preparation of this report include;
Ashley Jackson (Senior Resource Geologist - Fosterville Gold Mine) BSc (Geology) MSc (Mineral Economics), MAusIMM has made contributions to Sections 10 - 12, 14.1 and 14.2 of this report.
Braden Verity (Project Exploration Geologist – Fosterville Gold Mine) BEnvSc, GAIG has made contributions to sections 4-12 and 14.3 to 14.5 of this report.
Steve Gannon (Processing Manager – Fosterville Gold Mine) BEng has made contributions to Sections 13 and 17 and 18.1 of this report.
Jon Hurst (Mine Technical Superintendent – Fosterville Gold Mine) has made contributions to Section 15, 16 and 18.2 of this report.
Felicia Binks (Environmental Superintendent – Fosterville Gold Mine) BAppSc, GradDipEnvMan, MAusIMM has made contributions to Section 20 of this report.
Ian Holland (General Manager – Fosterville Gold Mine), BSc (Geology), MMinGeoSc, MAusIMM has made contributions to Sections 16, 21 and 22 of this report.
Craig Reid (Commercial Manager - Fosterville Gold Mine), BBus, CPA has made contributions to Sections 19 and 21 of this report.
13
| Technical Report | Kirkland Lake Gold |
| December 2016 | Fosterville Gold Mine |
4 PROPERTY, DESCRIPTION AND LOCATION
The FGM is located about 20km northeast of Bendigo and 130km north of Melbourne in the State of Victoria, Australia (Figure 4-1).

The FGM and all associated infrastructure including the tailings dam and waste dumps are located on Mining Lease 5404 (MIN5404)
Figure 4-2), which is 100% owned by Kirkland Lake Gold Ltd. MIN5404 was initially granted as ML1868 on August 24, 1990. The license later merged with adjoining lease MIN4877, resulting in MIN5404.
In December 2012 another Mining Lease (MIN5565) was granted to FGM, and this license was also merged into MIN5404. The present MIN5404 has a total area of 1,715.7Ha, and is active until August 24, 2020.
MIN5404 is located at centroid coordinates 276,599.72mE and 5,935,134.9mN using Map Grid of Australia Zone 55 (GDA94) coordinate projection.
Note that all Eastings, Northings, elevations (RL) and azimuths in the text reference to the local FGM grid. The FGM grid is a plane affine grid and can be referenced to MGA using the two reference points contained in Table 4-1 and -5000mRL (AHD). Fosterville Mine grid north is 13°20’ west from true north and 21° west from magnetic north.
14
| Technical Report | Kirkland Lake Gold |
| December 2016 | Fosterville Gold Mine |
TABLE 4-1 GRID CONVERSION REFERENCE POINTS
| Point 1: MIN5404 Mine Lease peg SE of Daley's Hill | ||
| Coordinate System | N | E |
| GDA94 Zone 55 | 5930837.663 | 278011.932 |
| Fosterville Mine Grid | 4786.030 | 2177.630 |
| Point 2: MIN5404 Mine Lease peg at NE corner | ||
| Coordinate System | N | E |
| GDA94 Zone 55 | 5939047.136 | 278407.302 |
| Fosterville Mine Grid | 12713.150 | 4343.140 |
The boundaries of land covered by the Mining License are accurately surveyed and marked on the ground with posts, trenches and information plates in accordance with the Mineral Resources Development Regulations 2002.
Kirkland Lake Gold also holds titles through FGM of two surrounding Exploration Licenses totaling 504.9km 2. These exploration licenses encompass the entire known strike extent of the Fosterville Goldfield. In the State of Victoria, exploration licenses are renewable annually subject to adequate exploration expenditure and statutory license size reductions. However, EL3539 is recognized by the State of Victoria as a strategic license and is able to be renewed on an annual basis without size reductions until February 26, 2017 (Figure 4-2). To retain the two EL tenements, Kirkland Lake Gold is required to conduct exploration programs and commit to minimum annual expenditures that are prescribed by Earth Resources Regulation Victoria. Presently, the annual expenditures are set at AUD$36;188,700 for EL3539 and AUD$36;34,000 for EL4937. Renewal applications have been submitted for EL3539 and EL4937 to the Department of Economic Development, Jobs, Transport and Resources.
An application to extend MIN5404 to the southwest of the current mine lease boundary (Figure 4-2) was underway at the effective date. This application is referred to as MIN(A)6267 or Min Application in this document.
15
| Technical Report | Kirkland Lake Gold |
| December 2016 | Fosterville Gold Mine |

16
| Technical Report | Kirkland Lake Gold |
| December 2016 | Fosterville Gold Mine |
Within MIN5404, there is a 2.5% gold royalty payable to New Holland Mining Ltd, now Nu Energy Capital Limited for the area outlined by an historical mining lease MIN4877 in the northeastern portion of MIN5404. Furthermore, the royalty agreement extends north and south of MIN5404 where previously existing tenements EL3211, EL3271 and EL3276 (New Holland Mining) overlap with EL3539 (FGM). See Figure 4-2.
When Crocodile Gold acquired the Fosterville and Stawell Gold Mines from AuRico in 2012, a net free cash flow sharing arrangement was established where Crocodile Gold was entitled to cumulative net free cash flow from those mines of up to C$60M. AuRico was then entitled to 100% of the next C$30M in net free cash flow, after which Crocodile Gold and AuRico would share the next C$30M of net free cash flow on a 50/50 basis until C$120M of cumulative net free cash flow was achieved, following which AuRico would be entitled to 20% on an ongoing basis.
On December 22, 2014 it was announced that Crocodile Gold had reached a mutually beneficial agreement with AuRico that terminated their net free cash flow sharing arrangement in exchange for a one-time payment of C$20M in cash and a net smelter return royalty of 2% from Fosterville Gold Mine (effective upon final approval from the Foreign Investment Review Board of Australia) and a 1% royalty from the Stawell Gold Mines (commencing January 1, 2016), releasing Crocodile Gold from its obligation to pay AuRico any further net free cash flow generated from its Victorian operations. This agreement is interpreted to mean that Kirkland Lake Gold is obligated to pay AuRico a net smelter royalty of 2% from Fosterville Gold Mine. However, Alamos Gold Inc. (Alamos) merged with AuRico in July 2015, which has resulted in Kirkland Lake Gold now being obliged to pay the new company, AuRico Metals, the net smelter royalty of 2% from Fosterville Gold Mine.
There are no state government royalties on gold production in the State of Victoria.
A rehabilitation bond is reviewed regularly with the Department of Economic Development, Jobs, Transport and Resources Victoria. In December 2015 the rehabilitation bond was reviewed and increased to AUD$7.84M. Rehabilitation is undertaken progressively at FGM as per the mining license conditions and the bond may be reduced on establishment that the land has been rehabilitated in accordance with the MRSD Act. That is, the land is safe and stable, non-polluting and the revegetation cover is self-sustaining. FGM is located near areas of moderate environmental significance (Mt Sugarloaf Nature Conservation Reserve), established productive farmland and is adjacent to the locally significant Campaspe River.
FGM is operating under a Work Plan approved in April 2004 under Schedule 14 of the Mineral Resources (Sustainable Development)(Minerals Industries) Regulations 2013. The approval, concerning MIN5404 (formerly ML1868), MIN4456 and MIN4887, was given by the Minister of Environment and Water at that time to Perseverance Exploration Pty Ltd. Work Plan Variations are submitted when significant changes from the current Work Plan are proposed.
MIN5404 & MIN4456 were granted prior to enactment of the Commonwealth Native Title Act of 1993 and as such are not subject to any Native Title compensation claim now for following renewal.
EL3539 is also not subject to any Native Title compensation claim. EL4937 is subject to a regional an Indigenous Land Use Agreement.
17
| Technical Report | Kirkland Lake Gold |
| December 2016 | Fosterville Gold Mine |
5 ACCESSIBILITY, CLIMATE, LOCAL RESOURCES, INFRASTRUCTURE AND PHYSIOGRAPHY
The Fosterville area is flat to very gently undulating with a range of low, rolling hills located 2km to the west and the Campaspe River situated about 2km to the east. On MIN5404, natural surface elevations range from 150m to 185m above sea level (5150mRL to 5185mRL mine grid). Vegetation in the area ranges from native forest to established grazing pasture.
The FGM has ready access via two separate sealed roads and a variety of all-weather un-sealed roads linking to regional highways. The regional center of Bendigo is approximately 20km to the south west has a population of around 147,000 (ABS, 2017), which provides a source of skilled labor.
The climate based on 30-year temperature and humidity data (1961–1990) show FGM is located in an area that is described as having a warm to mild summers, and cold winters (BOM, 2017). Köppen classification for the same 30-year period, based on predominant native vegetation type places FGM within a temperate climate with no dry season (BOM, 2017). Median annual rainfall data over a 100-year period (1900–1999) show the major seasonal rainfall is winter dominated (wet winter and low summer rainfall; BOM, 2017). The operation is not significantly affected by climate, which allows the operation to continue all year.
Power is supplied to the site via a terminal station that was constructed by PSV in 2005. This station is connected to the 220kV transmission line that runs from Bendigo to Shepparton and traverses the southern end of MIN5404 approximately 2km south of the processing plant. There is a connection agreement in place with SP Ausnet who manages the transmission and distribution network.
A pipeline was commissioned in April 2005 that has the capacity to supply approximately 2,000ML annually, which comfortably exceeds the current plant usage of approximately 1,000ML per annum. The current arrangement for the provision of water to site is secured through a ten-year contract between FGM and Coliban Water (catchment management authority). This allows for the supply of treated waste water from the Bendigo sewerage treatment facility. This agreement follows on from a previous ten-year agreement that expired in 2016. One further ten-year contract renewal is available on expiry upon written request.
All other site infrastructure is in place and approved in the Work Plan established in April 2004.
Details of tailings storage areas are covered in sections 18.1.4 and 20.2.
The location and of the processing plant site is illustrated in Figure 18-1 and Figure 18-2. The layout of the comminution circuit allows for installation of a pebble crushing circuit, should it be required and a secondary ball mill to increase grinding circuit capacity. Space was left in the area layouts for additional tank farms and equipment to accommodate a nominal increase in plant capacity. Space exists to the east of the plant site to duplicate existing facilities to double plant throughput, if required.
Mining waste material that cannot be placed underground is brought to the surface and held within the confines of the Ellesmere Pit (Figure 18-1; Section 18.2.4) . Details on the storage of historically mined waste overburden is covered in Section 20.2 and tabulated in Table 20-1.
18
| Technical Report | Kirkland Lake Gold |
| December 2016 | Fosterville Gold Mine |
6 HISTORY
Gold was first discovered in the Fosterville area in 1894 with mining activity continuing until 1903 for a total of 28koz of production. Mining in this era was confined to near-surface oxide material.
Aside from a minor tailings retreatment in the 1930’s, the field lay dormant until 1988 when Bendigo Gold Associates recommenced gold production at Fosterville from the reprocessing of tailings. By 1989 this program had come to an end and exploration for oxide resources commenced. The leases were then acquired by Brunswick who continued exploration and in 1991 started heap leaching ore derived from shallow oxide open pits. After six months of production, Brunswick went into receivership as a result of the failure of another operation. Perseverance (PSV) bought the operation from the receivers and continued the oxide heap leach operations. PSV continued to produce between 25koz to 35koz per annum until the cessation of the oxide mining in 2001. Between 1988 and 2001, a total of 240koz of gold were poured (Roberts et al., 2003).
In 2001, PSV underwent a significant recapitalization and the focus of the company changed to developing the sulfide resource. A feasibility study investigating a combined open pit and underground mining operation feeding 0.8Mtpa of sulfide ore to a BIOX® processing plant was completed in 2003. Work on the plant and open pit mining commenced in early 2004. Commercial sulfide hosted gold production commenced in April 2005 and up to the end of December 2006 had produced 136,882oz of gold. Underground development commenced in March 2006 with first production recorded in September 2006 and significant open pit production ceasing at the end of 2007, but with minor production from open pits in 2011 and 2012. The 500,000th ounce milestone of ‘sulfide’ gold production was achieved in April 2011 and by the end of December 2016 'sulfide' gold production totaled 1,152,373oz.
A breakdown of open cut and underground mined tonnes and grade over the previous ten-year period is given in Table 6-1.
19
| Technical Report | Kirkland Lake Gold |
| December 2016 | Fosterville Gold Mine |
TABLE 6-1 MINED PRODUCTION DATA FOR FOSTERVILLE FOR THE PERIOD 2007-2016
| Mining Area | 2007 | 2008 | 2009 | 2010 | 2011 | 2012 | 2013 | 2014 | 2015 | 2016 | |
| Open Cut |
Tonnes (kt) |
423 | - | - | - | 45 | 75 | - | - | - | - |
| Grade (g/t Au) |
2.3 | - | - | - | 2.8 | 2.6 | - | - | - | - | |
| Under- ground |
Tonnes (kt) |
376 | 512 | 780 | 729 | 734 | 729 | 827 | 786 | 704 | 692 |
| Grade (g/t Au) |
4.2 | 4.5 | 4.8 | 5.0 | 5.0 | 4.5 | 4.6 | 4.6 | 6.1 | 7.9 | |
| Total | Tonnes (kt) |
799 | 512 | 780 | 729 | 779 | 804 | 827 | 786 | 704 | 692 |
| Grade (g/t Au) |
3.2 | 4.5 | 4.8 | 5.0 | 4.9 | 4.3 | 4.6 | 4.6 | 6.1 | 7.9 | |
On October 29, 2007, Perseverance announced that it had entered into an agreement with Northgate Minerals Corporation (Northgate) to acquire the company via a Scheme of Arrangement. This agreement was ratified by Perseverance’s shareholders and option holders on January 18, 2008 with full control passing to Northgate in February 2008.
In August 2011 Northgate entered into a merger agreement with AuRico, who assumed control of the Northgate assets in October 2011. In March 2012 AuRico and Crocodile Gold jointly announced that Crocodile Gold would acquire FGM and Stawell Mines. Crocodile Gold’s ownership of FGM was achieved on May 4, 2012. In May 2015 Crocodile Gold and Newmarket Gold entered into a definitive arrangement agreement and completed a merger on July 10, 2015 to form Newmarket Gold. At the end of November 2016, Kirkland Lake Gold Inc. merged with Newmarket Gold Inc. to form a new mid-tier gold company Kirkland Lake Gold Ltd.
A detailed summary of exploration and development works on the property from previous operators can be found in Section 9 and Section 10 of this report. Two historical mineral resource estimates contained within
EL3539, Hallanan’s and Goornong South Prospects, were reported by Perseverance in their 1999 Annual
Report as shown in Table 6-2 and Table 6-3.
Kirkland Lake Gold is not treating these Historical Resources as current Mineral Resources as a QP has not done sufficient work to classify the Historic Resources, or comment on the reliability of the estimates.
20
| Technical Report | Kirkland Lake Gold |
| December 2016 | Fosterville Gold Mine |
TABLE 6-2 HISTORIC RESOURCE OF THE GOORNONG SOUTH PROSPECT PERSERVERANCE (1999)
| Historical Mineral Resource (PSV 1999) - Goornong South Prospect | |||||||||
| Classification | Measured | Indicated | Inferred | ||||||
| Tonnes (kt) |
Grade (g/t Au) |
Insitu Gold (Oz) |
Tonnes (kt) |
Grade (g/t Au) |
Insitu Gold (Oz) |
Tonnes (kt) |
Grade (g/t Au) |
Insitu Gold (Oz) | |
| Oxide | 216 | 1.3 | 9,300 | 535 | 1.3 | 23,100 | 32 | 1.6 | 1,700 |
| Sulphide (High-Grade) | 7 | 1.7 | 400 | 46 | 1.6 | 2,400 | 373 | 1.5 | 18,200 |
| Sulphide (Low-Grade) | 3 | 0.7 | 100 | 11 | 0.7 | 300 | 140 | 0.8 | 3,700 |
| Total Sulphide | 10 | 1.4 | 500 | 57 | 1.4 | 2,700 | 513 | 1.3 | 21,800 |
| Total Oxide & Sulphide | 226 | 1.3 | 9,800 | 592 | 1.4 | 25,800 | 545 | 1.3 | 23,500 |
Notes:
| 1. |
Historical Resource as reported in Perseverance Annual Report 1999. |
| 2. |
Kirkland Lake Gold is not treating the historical estimate as a current Mineral Resource as a QP has not done sufficient work to classify the historical estimate or comment the reliability of the estimate. |
| 3. |
Reporting lower cut-off gold grades used are ≥0.5 g/t Au for oxide, 0.5-1.0 g/t Au for sulfide low-grade and >1.0 g/t Au for sulfide high-grade. |
| 4. |
Bulk Density values set to 1.8t/m³ for clay, 2.4t/m³ for oxide and 2.8t/m³ for sulfide materials. |
| 5. |
Resource block grades estimated by Ordinary Kriging of 50m spaced drill sections. |
| 6. |
Mineral Resources have been rounded to 1,000t, 0.1 g/t Au and 100oz. Minor discrepancies in summation may occur due to rounding. |
| 7. |
Mineral Resources that are not Mineral Reserves do not have demonstrated economic viability. |
21
| Technical Report | Kirkland Lake Gold |
| December 2016 | Fosterville Gold Mine |
TABLE 6-3 HISTORIC RESOURCE OF THE HALLANAN’S PROSPECT PERSERVERANCE (1999)
| Historical Mineral Resource (PSV 1999) - Hallanan's Prospect | |||||||||
| Classification | Measured | Indicated | Inferred | ||||||
| Tonnes (kt) |
Grade (g/t Au) |
Insitu Gold (Oz) |
Tonnes (kt) |
Grade (g/t Au) |
Insitu Gold (Oz) |
Tonnes (kt) |
Grade (g/t Au) |
Insitu Gold (Oz) | |
| Oxide | 281 | 1.4 | 12,900 | 169 | 1.4 | 7,600 | 41 | 1.2 | 1,600 |
| Sulphide (High-Grade) | 89 | 1.5 | 4,400 | 240 | 1.5 | 11,500 | 521 | 1.7 | 28,600 |
| Sulphide (Low-Grade) | 35 | 0.8 | 900 | 66 | 0.8 | 1,600 | 124 | 0.8 | 3,000 |
| Total Sulphide | 124 | 1.3 | 5,200 | 306 | 1.3 | 13,100 | 645 | 1.5 | 31,700 |
| - | - | - | |||||||
| Total Oxide & Sulphide | 405 | 1.4 | 18,100 | 475 | 1.4 | 20,700 | 686 | 1.5 | 33,300 |
Notes:
| 1. |
Historic Resource as reported in Perseverance Annual Report 1999. |
| 2. |
Kirkland Lake Gold is not treating the historical estimate as a current Mineral Resource as a QP has not done sufficient work to classify the historical estimate or comment the reliability of the estimate. |
| 3. |
Reporting Lower cut-off gold grades used are ≥0.5 g/t Au for oxide, 0.5-1.0 g/t Au for sulfide low-grade and >1.0 g/t Au for sulfide high-grade. |
| 4. |
Bulk Density values of 1.8t/m³ for clay, 2.4t/m³ for oxide and 2.8t/m³ for sulfide materials. |
| 5. |
Resource block grades estimated by Ordinary Kriging of 25m & 50m spaced drill sections. |
| 6. |
Mineral Resources have been rounded to 1,000t, 0.1 g/t Au and 100oz. Minor discrepancies in summation may occur due to rounding. |
| 7. |
Mineral Resources that are not Mineral Reserves do not have demonstrated economic viability. |
22
| Technical Report | Kirkland Lake Gold |
| December 2016 | Fosterville Gold Mine |
7 GEOLOGICAL SETTING AND MINERALIZATION
| 7.1 | REGIONAL GEOLOGY |
The western sub-province of the Paleozoic Lachlan Orogen in Victoria has been divided into three major fault-bounded structural zones: the Stawell, Bendigo, and Melbourne Zones (Figure 7-1a; Caley et al., 2011). These structural zones are dominated by chevron-folded Cambro-Ordovician to Devonian turbidite sequences, and were progressively intruded by Early Silurian granite plutons in the west, through to Late Devonian granite plutons in the East (Bierlein & McKnight, 2005; Phillips et al., 2012).
The Fosterville Goldfield is located within the Bendigo Zone, which is bounded by the Avoca Fault to the west and the Heathcote Fault Zone to the east (Figure 7-1b), both of which are steep west-dipping reverse faults. The Bendigo Zone contains thick Ordovician age turbidite sequences that were subjected to low-grade metamorphism during the Late Ordovician Benambran Orogeny (~455-440 Ma) and the Late Devonian Tabberabberan Orogeny (~380 Ma). East-vergent folding and thrusting indicates a predominantly east-west compression that resulted in the formation of north-south upright folds. Continued deformation caused steepening of fold limbs and progressive development of a series of west-dipping reverse faults. These faults are interpreted to have listric geometries at depth and were likely conduits that provided a regional control on mineralizing processes, in conjunction with intra-zonal west dipping faults, such as the Redesdale Fault, mapped to the south of Fosterville (Cayley et al., 2008). In addition, smaller reverse faults propagated across fold limbs, linking bedded faults and are well mineralized in the style characteristic to the classic Central Victorian Slate Belt Gold Deposits of Bendigo and Castlemaine (Roberts et al., 2003).
Gold mineralization is associated with to two main events across the western Lachlan Orogen at ~445Ma and ~380-370Ma, with a possibly another minor event at ~410-400Ma (Phillips et al., 2012). The ~445Ma event is thought to have involved crustal thickening and the circulation of metamorphic fluids through the crust (Vandenberg et al., 2000) and formed gold deposits at Bendigo, Castlemaine, Maldon and Daylesford. The ~380-370Ma event is restricted largely to the Melbourne and eastern Bendigo Zones and is responsible for the emplacement of gold at the Fosterville Goldfield (Bierlein and Maher, 2001). The minor period of mineralization at ~410-400 Ma is restricted to the Stawell and western Bendigo Zones and is associated with crustal anatexis and Early Devonian plutonism (Phillips et al., 2012). The two major gold mineralizing events have been linked to the Benambran and Tabberabberan Orogenies (VandenBerg et al., 2000). All three gold mineralizing events are characterized by carbonate and sericite alteration, but only the latter two events (~410-400Ma & ~380-370Ma) have elevated Mo, Cu, Sb and W. During the third mineralizing event a range of mineralization styles resulted and include quartz-carbonate vein hosted free gold through to sulfide hosted refractory gold in association with arsenopyrite, pyrite and stibnite (Roberts et al., 2003).
Deep weathering and erosion in the late Tertiary resulted in the development of a regional laterite profile with weathering locally to 50m depths.
23
| Technical Report | Kirkland Lake Gold |
| December 2016 | Fosterville Gold Mine |

(a) Distribution of major geologic units and major faults of
the Bendigo and Stawell Zones and location of seismic lines.
(b)
Geological interpretation from seismic surveys. Adapted from Leader &
Wilson, 2010.
| 7.2 | LOCAL AND PROPERTY GEOLOGY |
The Fosterville Goldfield is hosted by Lower Ordovician Lancefieldian (486~488 Ma) turbidites within the Ordovician Castlemaine Group rocks (Figure 7-2 and Figure 7-3). The turbiditic sequence comprises interbedded sandstones, siltstones and shales, which are interpreted as having formed in a meandering submarine channel setting. The sequence is dominated by shale topped sands ranging from 0.2m to 1.5m in thickness, with lesser amounts of massive sandstone, shale and black shale (Roberts et al., 2003). Detailed drill core logging has confirmed almost 1km of stratigraphic succession exists at Fosterville and correlation of sedimentary units has been possible over a 10km distance within the Fosterville Mine Lease (Boucher et al, 2008a).
24
| Technical Report | Kirkland Lake Gold |
| December 2016 | Fosterville Gold Mine |
The sequence is metamorphosed to sub-greenschist facies. Illite crystallinity studies support this observation with results falling in the range of anchizone to lower epizone (Melling, 2008). Fluid inclusion work indicates that the Fosterville Goldfield formed at ~270°C and at 2.6 -5.7km crustal levels (Mernagh, 2001).
The stratigraphic sequence was folded into a set of upright chevron, occasional open style folds, with fold wavelengths up to 350m and parasitic fold wavelengths up to 50m. During folding, vertical axial planar (in finer sediments) and radial cleavages (sandstones) developed and are best observed in fold hinges. Bedded LQ veins were also formed during early folding and were preferentially formed in shales, at or close to the contact with sandstone units.
The north-south trending Redesdale Fault (Figure 7-2), lying approximately 2km to the east of the FGM, is an important intrazonal fault and occurs in the hangingwall of the Heathcote Fault Zone (Figure 7-1a).
Subordinate faults (third order and higher), such as the Fosterville, O'Dwyer's and Sugarloaf Faults (Figure 7-2) all have associated gold mineralization and are located in the hangingwall of the Redesdale Fault.
Within the Fosterville area the north-north-west trending Fosterville Fault is strike extensive and dips steeply west.
A fold culmination (dome) exists in the Fosterville Mine Lease in the Falcon pit area (Figure 7-3), about which a fold plunge reversal occurs. South of the culmination, folds plunge approximately 20° southwards, and a large west-dipping fold limb, containing parasitic folds and faulting has been well drilled over a 4km length to as far south as Daley's Hill. Extensive drilling focused on south plunging gold mineralization associated with late brittle west dipping reverse faulting that offsets syncline and anticline fold closures (Figure 7-5).
In the northern portion of the Mine Lease, in the Robbin's Hill - O'Dwyer's area, a number of west dipping faults occur and parallel the Fosterville Fault. Late Silurian to early Devonian porphyry dykes (Arne et al., 1998) also occur in this area, are up to 10m in width, intrude the stratigraphic sequence, predominantly along anticlinal axial planes (King, 2005 & Reed, 2007a) and postdate all significant faulting. The porphyry dykes are sericite altered and have associated gold mineralization that was sufficient to support several oxide and minor sulfide (O' Dwyer's South) open pits.
Lamprophyre dykes, typically less than 1m in width, intrude along the general Fosterville Fault trend and are unmineralized. These dykes were emplaced in the Middle Jurassic (157-153 Ma) (Bierlein et al, 2001) and are of similar age to those that occur at Bendigo.
Erosion of the area followed by Cainozoic Murray Basin sediment valley backfill and weathering has resulted in local clay conglomerate alluvial channels and complete oxidation to about 40m below surface. Immediately below the base of complete oxidation is a 10m to 15m thick zone of partial oxidation of sulfide minerals. Feldspar destruction and partial carbonate dissolution extends from the base of oxidation to about 150m depths. Approximately 2km to the east of Fosterville Miocene aged Newer Basalt Group rocks mask the Ordovician rocks and Murray Basin sediments.
25
| Technical Report | Kirkland Lake Gold |
| December 2016 | Fosterville Gold Mine |

26
| Technical Report | Kirkland Lake Gold |
| December 2016 | Fosterville Gold Mine |

27
| Technical Report | Kirkland Lake Gold |
| December 2016 | Fosterville Gold Mine |
Schematic Geological Cross Section
The geological knowledge of the Fosterville Fault Zone architecture has progressively grown over the last decade as diamond drilling explored new areas and underground mining reached deeper levels. The present understanding of the faulting is shown on schematic cross sections (Figure 7-4 and Figure 7-5). Pictured is the moderate-steep west dipping Fosterville Fault, which has several en echelon arrays of footwall reverse faults that link across from a western anticline to a syncline in the east.
Most of the lower faults (Hawk through to Kestrel) are thought to exist as bedding parallel LQ veins at depth to the west of their respective footwall anticlines. However, eastwards between footwall and hangingwall anticlines the faults have concordant (parallel)/discordant (oblique) bedding relationships and to the east of hangingwall anticlines, the faults shallow in dip and have discordant contacts with adjacent bedding. When certain stratigraphic units are encountered across the east dipping limb, reactionary east dipping structures form, creating zones of greater structural complexity. Further eastwards the single stranded west dipping faults become an unmineralized zone of distributed faults for 50-100m, before merging into a single fault, approximately 50m west of footwall synclines. East of the footwall syncline the faults' dip steepens, matching the dip of the footwall bedding. Between footwall and hangingwall synclines, faults have discordant/concordant bedding relationships and to the east of the hangingwall syncline the faults exist as bedding parallel LQ veins, commonly with pug on one margin.
Structurally higher level faults such as the Harrier and Osprey Faults appear as footwall faults emanating/ splaying from the footwall of the Fosterville Fault.
The schematic cross section portrays a number of fault segments where gold mineralization occurs and includes examples of areas of fault-bedding discordant relationships, changes in fault dip and localization of mineralization between hangingwall and footwall synclines and to a lesser extent between hangingwall and footwall anticlines. In particular, the Phoenix Fault System is an important structure at Fosterville for gold mineralization. It has 120 to 150m of reverse offset and as underground mining has progressed to deeper levels, faulting has become more complex. Nearer to surface the Phoenix Fault was a relatively narrow west-dipping reverse fault. However, down-plunge the faulting changes to also include mineralized hangingwall splay faulting and west dipping footwall faults emanating from bedding parallel LQ veins.
Other faults at structurally higher positions have comparable fault offset and are well mineralized. These include the Harrier and Osprey Faults (exposed at Harrier Pit) that are footwall splays of the Fosterville Fault. The faults have over 200m of combined reverse movement, and are mined at the southern end of the mine lease.
Where wall rocks are faulted and brecciated, fractures are healed by quartz-carbonate veining and commonly have arsenopyrite and pyrite disseminated in the wall rock up to 50cm from the veins. The wall rock proximal to faults is also sericitized, sometimes with alteration visually subtle, and has similar spatial extents to the gross disseminated sulfide distribution. Bedded faults exist as bedding parallel LQ veins and are thought to have formed during ductile deformation. As such they pre-date mineralizing events and are generally poorly mineralized.
28
| Technical Report | Kirkland Lake Gold |
| December 2016 | Fosterville Gold Mine |

29
| Technical Report | Kirkland Lake Gold |
| December 2016 | Fosterville Gold Mine |

30
| Technical Report | Kirkland Lake Gold |
| December 2016 | Fosterville Gold Mine |
| 7.3 | MINERALIZATION |
Gold is mined in two forms at FGM: Sulfide gold and visible gold.
Sulfide Gold
Mineralization at FGM occurs mainly as gold atoms trapped within the crystal lattice of disseminated arsenopyrite and pyrite (sulfides). These sulfide minerals precipitate in the wall rock as selvage alteration proximal to veins that penetrate the host rock. Associated alteration mineralogy within veins is predominantly euhedral to amorphous quartz-carbonate, with minor amorphous albite-chlorite-epidote.
Arsenopyrite crystals occur as 0.05 -6mm long acicular needles in random orientations. The disseminated pyrite associated with gold mineralization occurs as crystalline pyritohedrons 0.1mm to 2mm in size. Electron microprobe analyses and metallurgical test work indicates that the arsenopyrite contains 100 g/t Au to 1,000 g/t Au and the auriferous pyrite 10 g/t Au to 100 g/t Au (Roberts et al., 2003). Approximately 80% of sulfide-hosted gold occurs in arsenopyrite, with the remaining 20% hosted by pyrite.
The quartz–carbonate veining forms in several styles that range from isolated veins through to stockwork veining. The quartz–carbonate veining is barren of sulfide gold. Broad zones of sulfide selvedge altered zones are located where stockwork veining occurs. This can allow a pervasive body of sulfide mineralization in the wall rock around that stockwork veining to form, with widths up to several meters.
Visible Gold
Visible gold has been observed in all areas of the underground workings at FGM and has been observed in some open cut pits within the MIN5404 lease.
Visible gold is observed within quartz-carbonate veins, with a noticeable increase in recent years as underground mining and diamond drilling has advanced deeper. Visible gold particles are predominantly specks (up to 3mm), however, they can be up to 5mm in size, and are observed in drill core, underground development face/wall mapping, and stope sampling. The width of quartz-carbonate veining that contain visible gold is variable, with widths ranging from a few millimeters to several meters (true thickness). The veins usually have incomplete infill with druse quartz within those voids. Visible gold can be found as specks in narrow linear trends as well as isolated specks without a clear trend (Figure 7-7). Alteration mineralogy associated with veins that host visible gold includes quartz - carbonate (ankerite), with minor occurrences of fibrous boulangerite (Pb5Sb4S11) as inclusions in euhedral quartz or as fibrous growths within void spaces. Selvedge sulfide alteration can be present, proximal to veins hosting visible gold.
The visible gold has a spatial association with stibnite (Sb2S3). However, the stibnite mineralization can occur without visible gold (Henderson, 2014). The rationale for the one-way correlation is likely due to the stibnite mineralization occurring in different events, but utilizing the same structurally favorable locations. Stibnite mineralization has also been observed in all areas of the underground workings at FGM and has been observed in some open cut pits within MIN5404. Figure 7-6 illustrates antinomy mineralization within an east dipping quartz-carbonate vein.
31
| Technical Report | Kirkland Lake Gold |
| December 2016 | Fosterville Gold Mine |

Framboidal pyrite aggregates (≤50mm in size) and laminations of pyrite (≤20mm widths) are common in the stratigraphic sequence, especially in black shale units. The framboidal pyrite is diagenetic and drill core assaying of this material regularly returns grades <5ppb Au.
Other sulfides present at FGM in small quantities include galena, sphalerite and chalcopyrite, boulangerite (Pb5Sb4S11) and rarer still are tennantite (CuFe12As4S13), tetrahedrite (CuFe12Sb4S13), and bournonite (PbCuSbS3), which have been reported in processing plant sulfide concentrates (McArthur, 2012; & Townsend, 2009)
Silver grades are low at Fosterville; usually about one tenth of the gold grade with only ~1% silver commonly in poured gold doré in the early years of sulfide gold operations. However, the silver content in poured doré has gradually increased to the present ~4% silver levels and may be related to the gradual increase in contribution of visible gold that is mined.
32
| Technical Report | Kirkland Lake Gold |
| December 2016 | Fosterville Gold Mine |
| 7.4 | CONTROLS ON GOLD MINERALIZATION |
At Fosterville sulfide gold mineralization is structurally controlled and localized by the discordant relationship between bedding and faulting (Figure 7-4). Gold mineralization is more continuous and of higher grades in fault zones where east-dipping beds occur adjacent to west-dipping footwall beds across faulting, such as along the Phoenix Fault (Boucher et al., 2008a), i.e: discordant-concordant structural setting (locally termed oblique/parallel or parallel/oblique). Mineralized shoots are typically 4m to 15m thick, 50m to 150m up/down-dip and 300m to 1,500m+ down-plunge (Figure 7-8). Sulfide gold grades are relatively smoothly distributed with both extremely high values and extremely low values being uncommon.
There are four geometric bedding-fault relationships present at Fosterville; primarily created through the interaction of west dipping faulting that links across fold closures, from an anticline in the west to a syncline in the east. The four bedding relationships across a fault are locally referred to as parallel/parallel, parallel/oblique, oblique/oblique and oblique/parallel structural settings. These are briefly described below:
| • |
Parallel/Oblique (P/O) setting is where hangingwall bedding is parallel to the fault, but the footwall bedding is at an oblique angle (discordant) to the fault. Parallel/oblique settings occur at Fosterville where a west dipping fault offsets a footwall anticline axial plane. This structural setting is generally well mineralized; |
|
| |
| • |
Oblique/Oblique (O/O) setting is where bedding in both the hangingwall and footwall is oblique to faulting. Oblique/oblique settings occur where a west dipping structure passes through east dipping bedding between the hangingwall anticline and footwall syncline axial planes. This structural setting is variably mineralized; |
|
| |
| • |
Oblique/Parallel (O/P) setting is where bedding hangingwall to faulting is oblique to faulting and the footwall bedding is parallel. Oblique/parallel settings occur at Fosterville where a west dipping fault offsets a syncline axial plane. This setting is also generally well mineralized; and |
|
| |
| • |
Parallel/Parallel (P/P) setting is where the bedding in the hangingwall and footwall is parallel (concordant) with faulting. This setting was once thought to be non-prospective for sulfide gold mineralization, however, recent developments have shown that economic mineralization can form in parallel/parallel setting where the stress between slipping beds can form stacked vein arrays that form perpendicular to the bedding orientation, termed ladder veins. Visible gold and stibnite can also form within veins constrained by bedding units giving another mechanism for parallel/parallel mineralization. |
The controls on visible gold mineralization are less well tested compared with sulphide-hosted gold, however, general observations suggest that visible gold is focused along reactivated faults where sulfide hosted gold mineralization is located. Visible gold is generally found in higher concentrations on faulting proximal to anticline hinges. The newly discovered Eagle Zone has a fault with an orientation that is east-west striking, and steeply south plunging, which is significantly different to all other mineralized faults at FGM. It would appear that this orientation has a strong control on visible gold mineralization, however, this is yet to be tested in other areas within FGM.
33
| Technical Report | Kirkland Lake Gold |
| December 2016 | Fosterville Gold Mine |

34
| Technical Report | Kirkland Lake Gold |
| December 2016 | Fosterville Gold Mine |
| 7.5 | FOSTERVILLE FAULT ZONE |
The Fosterville Fault Area represents a linear trend of gold mineralization within MIN5404 extending from Daley's Hill in the south to Rehe's pit in the north (Figure 7-3).
Early deformation of the sedimentary packages developed laminated quartz veins proximal to shale packages that were susceptible to accommodation flexural slip. Due to the brittle and ductile contrast between quartz and shale packages, compressive forces have focused fault movement along these zones. Faulting has added re-mobilized carbon sourced from carbonaceous sedimentary units and from deep seated structurally induced fluid flow. As deformation intensified these preserved shale laminations became nucleation points for brittle fault failure across East dipping bedding. The accommodation of strain between the syncline and anticline provided a fault mesh where there is a complex interplay between east and west dipping faults. From 9000mN to 7500mN, this interplay was largely not recognized due to the short eastern limb length. Over this northing range most of the compressive force was accommodated by large fault offsets of the Fosterville and Phoenix Faults. As exploration continued south, the syncline and anticline appeared to diverge subtly from one another, increasing the eastern limb length. Force accommodation between the zones had longer distances to cut across, resulting in faulting that has reduced measurable offset.
The result of the reduced offset appears to have an effect on how the east dipping rocks accommodated faulting at depth, with ladder vein systems opening in bedding parallel zones along shale boundaries. Fluids utilizing these pathways were not constrained to one pathway as seen in the Phoenix and Falcon Zones, but used a diverse network including hinges, sedimentary units, east and west dipping faults. There also appears to be an element of fluid pressurization injecting up-plunge, seeking lower pressure environments.
This fluid pressurization appears to be strongly coincident with the increase in veining that contains quartz, stibnite and visible gold at depth. Veining can be several meters thick and suggest an element of hydraulic fracturing as fluid pressure overcomes the overlying lithostastic pressure and injects into zones, which act as a trap. This occurs in the Eagle / Lower Phoenix interaction zone around the Fosterville anticline.
Midway along the mineralized trend at approximately 8800mN (Falcon Pit area), a fold culmination (dome) occurs. The culmination causes plunge reversals to both folds and mineralization, and to the north of the culmination, the footwall syncline and mineralization shoots plunge gently to the north. Similarly, south of the culmination, the footwall syncline and mineralization shoots plunge gently to the south.
The Fosterville Fault Zone consists of nine primary and eight secondary Mineralization Zones (Table 7-1).
35
| Technical Report | Kirkland Lake Gold |
| December 2016 | Fosterville Gold Mine |
TABLE 7-1 FOSTERVILLE FAULT ZONE PRIMARY AND SECONDARY MINERALIZATION ZONES
| Fosterville Fault Zone Mineralization Zones | |
| Primary | Secondary |
| Phoenix Falcon Harrier Lower Phoenix Lower Phoenix Footwall Eagle East Dippers Allwood Kestrel |
Splays Ellesmere Vulture Osprey Robin Raven Shamrock Griffon |
| 7.5.1 | CENTRAL, NORTHERN AND LOWER PHOENIX DOMAINS |
Based on observed variations in geology, orientation, variography, geochemistry, statistics and spatial location within the Fosterville Mine Area, mineralization in the Central, Northern and Lower Phoenix Areas has been divided into 23 distinct domains, two redundant and one common domain shared with the Harrier Area, detailed in Section 7.5.2.
Domains are created due to the identification of a unique set of parameters that are coincident with economic mineralization traced through a number of drilled sections. Unique parameters may include the presence of a defining structure (Fosterville Fault, Phoenix Fault, Benu Fault, etc.), consistent orientation along strike and dip, mineralization style (disseminated sulfide, massive stibnite or visible gold), spatial location or geological setting (hinge, oblique/oblique, parallel/parallel, parallel/oblique, oblique/parallel, etc.). Surrounding all the mineralized domains is a waste domain that was used to generate the waste gold grades in the immediate vicinity of the mineralization.
Broader zones of mineralization have been defined in the Central Area and each of these zones may consist of multiple domains. Below are descriptions of the mineralized zones within the Central Area.
TABLE 7-2 MODEL DOMAINS, CODES AND ASSIGNED MINERALIZED ZONES

36
| Technical Report | Kirkland Lake Gold |
| December 2016 | Fosterville Gold Mine |

Phoenix
The Phoenix Mineralized Zone is situated within offset zones of Phoenix Syncline Hinge created by faulting within the Phoenix Shale package. Faulting that occurs at the top of ~8m, moderately sericitised shale package is defined as the Phoenix Fault, with the Phoenix Base Fault occurring towards the base before transition into undifferentiated sandstones.
37
| Technical Report | Kirkland Lake Gold |
| December 2016 | Fosterville Gold Mine |

Movement and fluid generation for the Phoenix Fault appears to nucleate from the Fosterville Anticline as west dipping faulting branches through east dipping beds. This fault movement creates an offset of the syncline hinge resulting in wall rock brecciation and permeation of mineralized fluids into the surrounding country rocks. Brecciation and economic mineralization appear to cease as the system encounters the hangingwall offset of the syncline hinge sending the fluid into parallel bedding and limiting sulfide dissemination.
The mineralization in the Phoenix Domain plunges 15° to 20° to the south. Mineralization on the Phoenix Fault is consistent in width and geometry dipping 45° to 65° to the west with an internal high-grade shoot geometry that plunges roughly 70° to the south with a strike length of 30m to 40m and a width up to 20m.
The high-grade shoot geometry, believed to be related to subtle strike changes to the Phoenix Fault, appears also to be periodic in occurrence with a shoot occurring around every 200m between 7300mN and 8200mN. Syncline offset on the Phoenix Fault ceases around 7085.5mN with movement and mineralization transferring to Phoenix Base Fault from the 8212.5mN section becoming more evident from 7537.5mN (Figure 7-9).
Mineralization associated with the Phoenix Base and Phoenix Footwall Faults occurs south of 7337.5mN and remains open down-plunge. The Phoenix Base area differs slightly to the Phoenix as fluid flow and fault movement appear to be related to compressive compensation of the Phoenix Syncline Hinge along the Kestrel Shale package. Current faulting mechanisms suggest that as the Phoenix Syncline Hinge is squeezed by East-West regional compression, a pervasive low angle structure (~35o) links from the Eastern limb of the Kestrel Shale package across to the Phoenix Base laminated quartz vein with ~30m of movement at its maximum. Sulfide mineralization appears to be sourced from migration up the Phoenix Syncline Hinge.
South of 6360mN an apparent change in orientation has been noted on the Phoenix Base fault, striking in a more south southeast direction, with the dip steepening to ~60°. This change appears to correlate with the development of a parasitic syncline-anticline pair on the western limb of the Phoenix FW Syncline.
Lower Phoenix
The Lower Phoenix Mineralized Zone encompasses mineralization that is directly related to the west dipping faulting associated with the Benu sedimentary strata package below 4500mRL. Source mineralization is interpreted to migrate up the system from deep intersections with other mineralized structures including potential hinges and other proximal oblique structures. Fluids utilize fault and fracture pathways to migrate up-plunge and dip towards the Fosterville Anticline before linking across to a zone of distributed faults, which eventually re-forms up-dip into the Phoenix Zone.
38
| Technical Report | Kirkland Lake Gold |
| December 2016 | Fosterville Gold Mine |

The Lower Phoenix is defined by west dipping faulting on the Benu Shale sequence and associated west dipping where anticline thrust displacement of ~80m occurs. Components of mineralization can also be traced up-dip into east dipping stratigraphy and downdip into parallel-bedded zones giving a maximum dip extent of 190m. The system currently remains open to the north and south and maximum plunge extent has not yet been characterized.
The system orientation is predominately controlled by west dipping bedding orientation giving the zone a similar structural orientation to that of both Phoenix and Falcon Zones with a strike of ~355°, a general plunge of ~20°S and a dip of 55°W in parallel/oblique settings, but shallowing to 35°W dip in oblique/oblique settings.
To the south of the Lower Phoenix, mineralization is strongly influenced by the intersection with the Eagle System where faulting appears to cross-cut west dipping bedding strata providing an environment where parallel/parallel economic mineralization occurs to the north and up-plunge of this intersection.
Extension drilling programs are planned to test up and down-plunge components of the ore zone, which presently remain unconstrained by drill data.
Lower Phoenix Footwall
The Lower Phoenix Footwall Mineralized Zone encompasses mineralization that is associated with west dipping structures footwall to the Lower Phoenix System below 4500mRL. Mineralization is interpreted to utilize similar networks to those utilized by the Lower Phoenix System. Clearly discernable sedimentary horizons such as the Pelican Shale package are evolving as the next step in fluid migration pathways however, non-bedding conformable systems are evident that require further research.
39
| Technical Report | Kirkland Lake Gold |
| December 2016 | Fosterville Gold Mine |

Mineralization domained within the Lower Phoenix FW (Figure 7-11) is interpreted to be due to low angled structures that largely have minimal offset but have been hydraulically fractured by gold bearing fluids, though down below the Eagle System the structures appear to accommodate more significant movement, such as on the Swan Fault, which has at least ~20m of thrust offset. The hydraulically fractured zones can create large quartz carbonate veins that can be several meters wide in true thickness. The presence of a number of laminations within the quartz veins indicates a series of events with differing geochemistry including later stage quartz-stibnite mineralization and visible gold.
The vein systems are interpreted to migrate across east dipping stratigraphy, appearing to terminate on prominent stratigraphic units such as the Kestrel East, Pegasus East and Allwood East LQ veins. The termination is due to mineralizing fluids moving out of an oblique/oblique setting as the structure cuts across beds into a parallel/parallel setting as fluids escape into the east dipping bedding parallel laminations.
East Dippers
The East Dippers System has developed at depth as the Fosterville Anticline has diverged away from the Phoenix Syncline System creating new networks for fluids to migrate up the Fosterville System. Systems utilize similar mechanics to that established within the west dipping fault network where rheological contrasts between bedding units (primarily slip associated with graphitic laminated quartz veins around carbonaceous shales) provide an accommodation zone for stress and mineralization (Figure 7-12).

The difference between the west and east dipping packages are in the way that sedimentary packages accommodate forces acting on the zone. The East Dipping Zones accommodate stress by attenuation whereas the more ductile shale package deforms plastically and the more sand rich units show brittle deformation in the form of ladder veins. These veins sets that radiate out from the shale boundaries perpendicular to the bedding orientation provide a mechanism for sulfides to leach into the host rocks.
40
| Technical Report | Kirkland Lake Gold |
| December 2016 | Fosterville Gold Mine |
The environments where East Dipper System occurs have shale packages that correlate to a west dipping counterpart such as Kestrel, Allwood, Benu and Pegasus Zones. The East Dipping Fault naming convention utilizes the identified shale characteristics matched to the west dipping counterpart and given the E suffix to denote the east dipping status of the structure.
Eagle
The Eagle System occurs below 4400mRL where forces look to accommodate strain between the Fosterville Anticline and Phoenix Syncline via east dipping structures that are discordant to bedding. Although similar to the East Dippers System spatially, Eagle differs as east dipping faults link from one east dipping shale package to another, where the bedding angle is high (>70o). This movement from across bedding creates a fault angle oblique to bedding that allows for mineralization to permeate into the host rocks (Figure 7-13).

Movement on the system via direct underground measurement and sedimentary horizon displacement appears to have a sinistral strike slip orientation. Predominant slip orientations on west dipping structures indicate a steep dip slip movement with a plunge to the south. How the sinistral movement fits into the overall Fosterville System’s architecture is under evaluation.
41
| Technical Report | Kirkland Lake Gold |
| December 2016 | Fosterville Gold Mine |

Mineralization gold grades on the Eagle System increase up-dip where east dipping faulting is proximal to the Fosterville Anticline and west dipping faulting. The convergence of east and west dipping structures in proximity to the Fosterville Anticline appears to provide a barrier for fluid migration resulting in flow textures of quartz and stibnite (Figure 7-14). Isolated areas of visible gold can be seen within the zone as fine specks that form in alignment with stylolitic fractures that can extend for up to ~10cm. Typically the arsenopyrite / pyrite mineralization within the zone is weaker with grades in the 1-2 g/t Au range with sulfide disseminations localized around the zone.
Moving down-dip away from the hinge, the quartz stibnite vein pinches out with disseminated arsenopyrite and pyrite increasing in intensity and grade. Dissemination is still localized to the main Eagle Fault (with 1-2m of the structure), however, interaction with bedded faults creates zones where fracture interplay between the two systems increases the fluid flux and therefore increases the economic width of the zone.
Down-plunge and dip continuation of the Eagle System is currently being evaluated, however, intercepts that show potential extensions to the system, have already been intersected.
Splays
Throughout the Central Area, there are a number of significant mineralized structures and settings that fail to have size, confidence or spatial continuity to develop into extensive mineralized zones. These systems are captured within the Splays HG and Splays LG domain and present either proximal mining opportunity or future potential growth prospects. Most systems within the Splay domains are defined by shallow west dipping faulting (~30-40°), of anastomosing nature and highly variable grade distribution (Figure 7-15).
42
| Technical Report | Kirkland Lake Gold |
| December 2016 | Fosterville Gold Mine |

Splay faults are interpreted to be short-lived structures that split as the structure moves from a Lower Phoenix Zone setting across to the Phoenix Zone setting. Larger splay faults are prevalent between the anticline offset of the Fosterville Fault, where the large thrust movement has nucleated a number of smaller structures. The largest of the splays in the zone is the Kite Fault. The Kite Area of mineralization is interpreted to be due to an oblique/oblique setting created between bedding relationships with the Kite Fault. The Kite Fault is an example of a mid-splay system that nucleates from the Fosterville Fault linking across to the Phoenix Footwall Syncline setting. The main system extends from 7662.5mN through to 7062.5mN with an overall dip of ~30° to the west and a plunge of 25° to the south.
Allwood Domain
The Allwood Area is interpreted to be created by 30m of fault movement along the Allwood Shale package that offsets an anticline creating a parallel/oblique setting for mineralization. The system is analogous to the Phoenix Lower Zone setting and extends 562m to the south from the 7675mN section. Orientation of the Allwood Zone is similar to other geometries constrained by a west dipping hangingwall (Fosterville HG, Fosterville LG, and Benu) with a 65° dip to the west and a 10° plunge to the south. (Figure 7-16).

Kestrel
During 2016 the Kestrel Area was re-interpreted to incorporate the observations from the geological mapping of the first ore sill developed into the Phoenix Syncline Hinge Zone (Figure 7-17). The initial section of development was consistent with previous interpretations which described a broad zone of low to moderate grade (1-4 g/t Au) mineralization through the Hinge Zone, with fluid pathways appearing to utilize weaknesses in cleavage and flexural slip planes between contrasting beds. The higher grade mineralization 43 was associated with an east dipping structure which nucleated within the Hinge Zone, with increasing amounts of offset noted across the structure as it developed into an oblique-parallel setting.
| Technical Report | Kirkland Lake Gold |
| December 2016 | Fosterville Gold Mine |
Based on the observed interaction the mineralized domains in the Kestrel System were reinterpreted to group the higher grade intercepts together to link up to east dipping bedding parallel LQ Faults. The intersection of the structures with the syncline hinge is interpreted to be responsible for the dilational zones, which allows for the localized enrichment above the background low-grade within the Hinge Zone.
Drill programs testing the new interpretation are continuing into 2017.

Falcon
The Falcon Mineralized Zone is situated on the Fosterville Fault where it displaces the Fosterville Anticline along a distinguishable black shale horizon. The thrust movement on the fault creates an offset of ~500m with several splay faults that nucleate from the main Fosterville Thrust. These splays cross east dipping bedding creating smaller ore bodies such as the Ellesmere and Vulture Mineralized Zones. (Figure 7-18).

The Falcon Mineralized Zone consists of Fosterville HG and Fosterville LG domains. Fosterville HG is reasoned to be a population of discernibly higher grade assays that exist due to a shoot geometry that is geologically controlled within the larger Fosterville LG Domain. A plunge reversal occurs between 8800mN and 8900mN and all of the mineralization between 8900mN and 11000mN plunges gently to the north. The vast majority of the mineralization in the Falcon Domain occurs on the Fosterville Fault and dips about 70° to the west. Most of this domain is relatively shallow (less than 150m below surface) and has been drilled by either RC drilling grade control drilling on 6.25m spaced sections or by RC and diamond exploration drilling on 20m spaced sections.
44
| Technical Report | Kirkland Lake Gold |
| December 2016 | Fosterville Gold Mine |
Ellesmere
The Ellesmere Mineralized Zone is characterized by Fosterville Zone type mineralization and resides primarily between the Fosterville HG and Fosterville LG domains, south of the culmination. Overall the plunge of the mineralization within the Ellesmere ore body appears to be 20° to 40° to the south with internal narrow (~20m) high-grade shoots plunging 70°S and occurring at roughly 100m intervals. The high-grade shoots are believed to be the results of smaller footwall splay fault interaction with the Fosterville Fault. Mining of the Ellesmere ore body was completed in 2010 (Figure 7-19).

Raven
The Raven Mineralized Zone exists as a zone of high-grade splay mineralization north of the Phoenix Mineralized Zone analogous with Phoenix Zone mineralization. The ore body is situated where fault movement associated with the Phoenix Fault links across to the Phoenix Base Footwall Syncline Hinge moving into an oblique/oblique setting. Mineralization forms on a number of splay structures that typically have a shallower dip (~40°) and strikes more NNW than the typical N-S bearing of the Phoenix Zone (Figure 7-20).
45
| Technical Report | Kirkland Lake Gold |
| December 2016 | Fosterville Gold Mine |

Vulture
The Vulture Mineralized Zone occurs between 6262.5mN and 7337.5mN in a zone characterized primarily by Harrier faulting where economic mineralization occurs proximal to the intersection between the interpreted Harrier Base Fault and the Fosterville Fault. The main Vulture Mineralized Zone on the Harrier Base Fault dips ~45°W, steepening as the fault diverges from the Fosterville Fault. Mining of parts the Vulture Zone was completed in early 2012. However, subsequent knowledge gained from mining the Harrier Zone is being applied to the remainder of the Vulture Zone to optimize further extraction potential (Figure 7-21).

Robin, Griffon & Shamrock Zones
The Robin Mineralized Zone, shown in pink in Figure 7-22 is interpreted to be a zone where mineralization switches back from the Phoenix Fault across to the Fosterville Fault around the hangingwall section of the Phoenix Syncline Hinge. The fault network is a combination of east and west dipping structure that has a zonation plunge on the intersection with the Fosterville Fault of ~30o. The interaction zone occurs from 8600mN to 8100mN where separation distance between the Fosterville and Phoenix Faults widens to the south reducing the intensity of faulting reducing mineralization intensity.
The Griffon Mineralized Zone, shown in green (Figure 7-22), is a zone of mineralization on the Phoenix Keel Zone where faulting from the Fosterville Fault directly links across to the footwall section of the Phoenix Syncline Hinge. The zone exists between 8800mN and 8600mN with mining completed in 2009.
The Shamrock Mineralized Zone, shown in teal (Figure 7-22), is a Zone of mineralization footwall to the Fosterville Fault where the Phoenix Fault is directly adjacent to the system. The zone existed between 8600mN and 8350mN with mining completed in 2009.
46
| Technical Report | Kirkland Lake Gold |
| December 2016 | Fosterville Gold Mine |

| 7.5.2 | HARRIER AREA GEOLOGY |
Within the Harrier UG Model area, there appears to be two main zones of mineralization, one zone associated with the Harrier Fault System and the other with the Osprey Fault System. Both systems trace their roots back to movement along the Fosterville Fault; however, they appear to differ at their nucleation points with the Osprey System sitting higher in the system with relation to the Harrier System (Figure 7-23).
Both systems generate most of their fault related mineralization within oblique/oblique environments as movement propagates away from the Fosterville Fault. The systems are related by the way of linking structures that strike ~5° to the north as opposed to the Osprey and Harrier Systems that strike ~350° to the north. The relationship between structures takes on a large en echelon type geometry with mineralization intensity increasing at the intersections between main systems and linking structures.
47
| Technical Report | Kirkland Lake Gold |
| December 2016 | Fosterville Gold Mine |

Since 2011 drilling to a 25m x 25m drill spacing has allowed domains to be built on 25m spaced sections. Areas of particular geological difficulty were drilled to 12.5m spacing and domains also constrained using underground face mapping, sampling and sludge hole sampling data. Drill program progress was improved with the addition of the Harrier 4625mRL Diamond Drill Drive, which provided resource definition as far south as 4750mN.
Harrier Domains
Based on observed variations in geology, variography, geochemistry, statistics and spatial location within the Fosterville Mine Area, mineralization in the Harrier Area has been divided into nine unique domains and one common splay domain shared with the Central Area. The domains and domain codes corresponded to:
| – | 6. | Splay LG (Low-grade) – common to Harrier and Central Areas; | |
| – | 20. | Harrier; | |
| – | 21. | Harrier Base; | |
| – | 22. | Harrier Link; | |
| – | 24. | Harrier HW ; | |
| – | 25. | Harrier Splay; | |
| – | 30. | Osprey; | |
| – | 31. | Osprey Base; | |
| – | 32. | Osprey Link; and | |
| – | 35. | Osprey Splays. |
The domains can be generically categorized into two groups, Harrier (5 Domains) Figure 7-24, Osprey (4 Domains) Figure 7-25, including various Splays. Harrier and Osprey Domain differentiations are driven primarily on grade population differences between structures that reside within close proximity to each other. The host geology of the mineralization within the Harrier UG Area is consistent with details listed within the Central Area.
48
| Technical Report | Kirkland Lake Gold |
| December 2016 | Fosterville Gold Mine |

The Harrier System is interpreted to have developed as reverse thrust faulting progressed up the Fosterville Fault reaching the anticline, refracting and developing a complex system of splay faults that link across to the eastern syncline hinge. Fault propagation continues across east dipping interbedded sandstone and shale beds before movement conformed into the large Harrier Shale package. Movement into the Eastern Syncline and Harrier Shale package develops several minor hinge offsets along early LQ veins that create localized zones of oblique/parallel mineralization.
The Harrier Shale package proximal to the ore body has been is estimated to be ~30m in thickness with several LQ veins throughout the succession. Major LQs were correlated along strike and structurally wireframed to create the Harrier Base and Harrier Upper Faults. The total displacement over the Harrier suite of faults is about 120m.
The Harrier Mineralized Zone extends through to surface having been mined as the Harrier Open Pit with its northernmost extent around 7300mN. The system has an overall plunge of 25° with the main underground shoot of mineralization not beginning until around the 4760mRL. The Harrier Zone consists of five distinct domains including the Harrier, Harrier Base, Harrier Link, Harrier Splay and Splay LG Domains.
Mineralization within the Harrier Zone consists of primary sulfides including arsenopyrite and pyrite with the area having only localized amounts of stibnite. The sulfides are disseminated into the host sandstone and shale packages around strongly faulted and fractured areas. Grade tenor proxies utilized in the Central Zone such as the percentage of arsenopyrite can be misleading due to mica rich sand horizons being mistaken for mineralization, silicification of host rocks giving a false indication of quartz fluid flow and fine sulfide crystal growth that can be overlooked as dust or sedimentary fine grains.
49
| Technical Report | Kirkland Lake Gold |
| December 2016 | Fosterville Gold Mine |

The Osprey System is modeled ~50m hangingwall to the Harrier System and appears to be the last splay fault that bifurcates from the Fosterville Fault before the Fosterville Anticline. The movement seen on the Osprey System appears to maintain its offset to the Harrier System up-dip, however, it does not appear to connect through to the eastern syncline hinge as the Harrier System does. There is growing support to suggest that mineralization in the Osprey System is directly influenced by the western limb of the Harrier Shale package as areas of intersection appear to act as a barrier to the flow of mineralization further up-dip of the Osprey System.
The Osprey System shares similar geometries to that seen in the Harrier System with economic mineralization largely running in parallel between 5420mN and 5100mN. North of 5420mN, the Osprey System mineralization links across to the Harrier System utilizing the linking structures. South of 5100, the Osprey System appears to trend more north-south with similar trends to the second order linking structures. Structures that trend more north-south appear to take on a lower grade tenor than those that strike towards ~355°, although the controls on why this occurs are poorly understood.
The Osprey System consists of four distinct geometries including the Osprey, Osprey Base, Osprey Link and Osprey Splays. The main shoot of Osprey mineralization is encompassed within the Osprey Domain that is modeled south of 5725mN and remains open at depth. The Osprey System has similar geological properties to the Harrier System (Strike ~355°, Dip ~40°, and Plunge ~ 20°), however, it gains some complexity to the south of 5450mN where multiple converging geometries are modeled.
| 7.5.3 | DALEY’S HILL |
Within the Southern Model Area, the controlling features include the Fosterville Fault and the Footwall Harrier suite of faults, which have variable reverse offsets and a total reverse displacement of about 200m.
Reverse movement on the Fosterville Fault lessens from north (100m+) to south (~10m at Daley’s Hill) and becomes less important southwards with respect to mineralization. At Daley's Hill the Fosterville Fault is un-mineralized and passes to the west of the oxide pit.
The east-west folding in the area varies from gently southerly plunging in the north to moderate southerly plunging at Daley’s Hill in the south. Fold plunge is important as the mineralized west dipping fault geometry is controlled by the eastern limbs of syncline fold plunges where the faults become un-mineralized “bedded” LQ features.
At Daley’s Hill, the Daley’s Hill Fault has an associated 10m of reverse fault movement and localizes the bulk of gold mineralization. Lesser well mineralized east-west structures occur in the eastern parts of the pit and several other poorly defined hangingwall mineralized fault structures are present in the western portions of the pit.
50
| Technical Report | Kirkland Lake Gold |
| December 2016 | Fosterville Gold Mine |
Daley’s Hill is unusual in that late stage, free, primary gold, in association with stibnite-quartz, is noted in several diamond holes. The mineralized structure ("Wagon Wheel") is restricted to an 80m strike extent, but is untested at depth.
The geology of the Southern Model area was reviewed by independent consultant Stephen King in 2004 (King, 2004) and the northern parts again in 2006 (King, 2006). Rod Boucher (geological consultant, Linex Pty Ltd Geological Consultation) has also contributed much to the stratigraphic-structural understanding of the area. A geological interpretation was also reported by Reed (2007).
7.5.3.1 Domains
Domaining of the Daley's Hill area was based on geological structure, orientation, material types and variography. The structures and material types include:
- Daley’s Hill N-S Faults;
- Daley’s Hill E-W Faults; and
- Materials (Oxide, Transitional and Fresh).
Mineralization domains were created by initially using a nominal 0.2 g/t Au to 0.5 g/t Au outer limit for sectional strings in weathered areas and 0.5 g/t Au to 1.0 g/t Au in un-weathered mineralization. These values reflect natural breaks to the mineralization.
The strings were then linked or extruded to form a three dimensional wireframe domain. The strings were generally extruded a maximum of half the drill spacing. This varied from as little as 5m, in well drilled pit locations, to 50m, where mineralization extended over several 100m spaced drill sections.
The Daley’s Hill Area (Figure 7-26, Figure 7-27 and Figure 7-28) has three separate northerly trending subvertical to westerly dipping mineralized domains:
- DH Main Fit;
- DH Wagon Wheel; and
- DH West Area.
The domains have variable strike lengths (between 50m and 650m), dips (-50°W to -90°) and exhibit ~20° southerly plunges.
A domain (DH Syncline) has also been generated that encompasses mineralization associated with the Daley’s Hill Syncline. The syncline axial plane trends grid NNE with a 45° plunge towards the south and is located in the far northern position of the existing Daley’s Hill Pit.
East-west mineralized structures occurring in the eastern parts of the pit are footwall to the main Daley’s Hill N-S structure. The Daley’s Hill E-W Domain (DH Campaspe) comprises four separate structures, which trend 060° and dip 80°N.
Three ‘material’ domains were constructed, similar to that described previously for the Central Area Model. The domains are:
- Oxide (sulfide minerals completely oxidized, Fe-carbonates largely oxidized);
51
| Technical Report | Kirkland Lake Gold |
| December 2016 | Fosterville Gold Mine |
- Transition (sulfide minerals may be partially oxidized, includes zones of mixed fresh and oxide); and
- Fresh (sulfide minerals completely un-oxidized).
The Transitional Domain lower boundary is only an approximation because there is insufficient logging of the base of transition to allow a reasonable interpretation of this surface over the entire Southern Model. The base of transition was taken to be 5110mRL after comparison with drill data and results from open pit mining in the area.
Separate material domains were constructed for transitional and fresh materials and coded into the Southern Model for inventory and metallurgical recovery study purposes. However, during block model interpolations, drill assays coded as transitional and fresh material types are treated as if they are the same material type.

Shown are model boundary (light blue), mineralized solids (red, blue and green) and Daley’s Hill oxide open pit (brown wireframe).
52
| Technical Report | Kirkland Lake Gold |
| December 2016 | Fosterville Gold Mine |

Shown are the DH Main Flt (blue), DH Wagon Wheel (red), DH West Area (purple), DH Syncline (orange), DH Campaspe (green) and oxide open pit (brown wireframe)
53
| Technical Report | Kirkland Lake Gold |
| December 2016 | Fosterville Gold Mine |

Shown are DH Main Flt (blue), DH Wagon Wheel (red), DH West Area (purple), DH Syncline (orange) and DH Campaspe (green) Mineralization and oxide open pit (brown) wireframes
54
| Technical Report | Kirkland Lake Gold |
| December 2016 | Fosterville Gold Mine |
| 7.6 | ROBBIN’S HILL AREA |
The Robbin’s Hill Area lies northeast of the Central Area and contains the O’Dwyer’s, Robbin’s Hill, Farley’s, Sharkey’s, Woolshed and Read’s oxide pits as shown in Figure 7-3 and Figure 7-32. The area can be defined as the zone east of 2,700mE, between 10,500mN and 14,00mN. The fault architecture of the Robbin’s Hill Area is much more complex than that observed in the Fosterville Fault Zone.
Rhyolitic dyke associated gold mineralization also occurs in the area, with mineralization mainly within 2m of the dyke contacts. The rhyolitic porphyry dyke bodies have a general north-south trend, are typically subvertically orientated and are observed to often intrude anticlinal axial planes.
Higher grade gold zones are controlled by the intersection of fault controlled mineralization with the dykes.
| 7.6.1 | GEOLOGICAL OVERVIEW |
The region between Robbin’s Hill in the south (12,100mN) and Sharkey’s in the north (14,000mN) contains three significant fold closures – the Robbin’s Hill Anticline and Syncline and the Trench Syncline, with associated parasitic folds in the eastern limb of the syncline. The folds are all roughly north-trending and asymmetrical, however, the plunge of the folds are variable with complexities arising from the intersection of both steep and shallow bedding-parallel and bedding-discordant faults.
The Robbin’s Hill Anticline and Syncline appear to plunge gently north, whilst the Trench Syncline dips gently south. The Robbin’s Hill Anticline and Syncline also lose amplitude and wavelength southwards, from amplitude of around 100m in the north to become a small parasitic fold pair in the south of Robbin’s Hill Pit.
The axial plane of the anticline is intruded by a mineralized felsic porphyry dyke (RH Porphyry), which also pinches out towards the south.
On 12,100mN, the Robbin’s Hill Anticline and Syncline form asymmetric folding on east-dipping bedding (Figure 7-29). The mineralized felsic dyke intrudes the core of the anticline, consistent with more northern sections. A number of low-angle oblique-oblique west-dipping faults crosscut the geology, and are associated with localized mineralization. The Trench Syncline has a large wavelength, with a major plane of slip (Farley’s Fault) developing in a black shale unit on the eastern limb of the syncline. Moving north towards 12,300mN, faulting on this plane increases in complexity, becoming broader and further displacing the geology (west-over-east).
55
| Technical Report | Kirkland Lake Gold |
| December 2016 | Fosterville Gold Mine |

On 12,400mN (Figure 7-30), the amplitude and wavelength of the Robbin’s Hill Anticline and Syncline has increased (width ~50m), forming tight folds with axial planes, which increasingly dip towards the west with depth. The axial-trace of the anticline is intruded by the same mineralized felsic dyke intercepted further south. The Trench Syncline has decreased in amplitude, with significant displacement on the faulted zone (Farley’s Fault) in the eastern limb. Mineralization in the Trench Syncline is confined to the faulted zone in the hangingwall of the major younging change fault. Minor parasitic folding has developed on the eastern limb of the Trench Syncline.
56
| Technical Report | Kirkland Lake Gold |
| December 2016 | Fosterville Gold Mine |

Further down-dip Farley’s Fault becomes an oblique-parallel younging-change fault, truncating the steep eastern limb of the Robbin’s Hill Anticline. Lithology exerts a strong control on mineralization associated with Farley’s Fault in this section, with the development of mineralized stockwork veining in sandstone in the hangingwall of the fault. A second steep west-dipping fault (Farley’s Footwall Fault) occurs in the footwall of the Farley’s Fault, however, deformation associated with the fault is minor.
Low-angle oblique/oblique faults with associated localized mineralization also crosscut the Robbin’s Hill Anticline and dyke in this section. The dips of the faults become steeper as they approach the surface, with bedding-parallel sections highly brecciated, indicating a protracted history of movement.
57
| Technical Report | Kirkland Lake Gold |
| December 2016 | Fosterville Gold Mine |

On 12,600mN, (Figure 7-31) the Robbin’s Hill Syncline and Anticline are better defined as a result of their south-plunging geometry. Both folds are asymmetric, with an axial plane that increasingly dips towards the west with depth. There is a much greater degree of faulting and shearing in the eastern limb of the RH Syncline.
58
| Technical Report | Kirkland Lake Gold |
| December 2016 | Fosterville Gold Mine |
The amplitude and wavelength of the parasitic folding in the eastern limb of the Trench Syncline is now more open, with faulting and displacement in the Farley’s Fault Zone becoming accordingly more distributed. This represents a zone of increased deformation with shearing and quartz-carbonate stockwork veining developed between the faults and focused on the two parasitic fold hinges. Within this zone, deformation has occurred mainly as puggy faulting with little actual displacement on any one fault. Quartz-carbonate stockwork is well developed in the hangingwall and footwall to the puggy faults, where the bulk of the sulfide mineralization is hosted.
Off-set along the NNW-trending Farley’s Fault appears to be reduced in this section (~100m), allowing the delineation of the Trench Syncline in the footwall of the fault down-dip (~4850RL). The hinge of the Trench Syncline has a major impact on the dip of the Farley’s Fault, transitioning from steep (oblique-parallel) where it utilises the black shale unit as a plane of slip, to shallow, becoming bedding-discordant. This accounts for the broad zone of deformation and mineralization in the hangingwall of the fault, characterized by stockwork veining and numerous faults of various orientations.
Highly mineralized east-dipping structures are present in the footwall of the Farley’s Fault, above the syncline hinge. The faults are brecciated with evidence of significant movement but it is unclear if these faults relate to the steep west-dipping faults or post-date this movement. Highly mineralized east-dipping structures are also present in the Sharkey’s Area, NE of the Robbin’s Hill Pit.
Displacement on the Farley’s Footwall Fault has markedly increased, off-setting the hinges of the parasitic folds in the eastern limb of the Trench Syncline. As a result of the interaction with these hinges, the zone of deformation surrounding the fault is much broader.
South of Robbin’s Hill Pit to O’Dwyer’s South Pit (between 10,500mN and 12,100mN), the same west-dipping fault structure (Farley’s Fault) is mineralized and has a curvilinear grid north trend. East of, and paralleling this fault, is an anticline structure, which has a mineralized porphyry dyke (ODW Porphyry) occupying the sub-vertical axial plane. The ODW Porphyry occurs in the eastern portion of the ODW South pit and in the middle of the ODW Central Pit. Several west-dipping mineralized faults occur on both sides of the ODW Porphyry and outcrop in ODW Central and Eastern Pits.
Northeast trending unconsolidated Murray Basin clays, sands and gravels mask the Ordovician basement and the northwest and southeast parts of the Robbin’s Hill Model area.
59
| Technical Report | Kirkland Lake Gold |
| December 2016 | Fosterville Gold Mine |

| 7.6.2 | ROBBIN’S HILL DOMAINS |
Basic high level statistics and variographic analysis was completed on the interpreted mineralization wireframes in the Robbin’s Hill Area. Oxide and sulfide mineralization was grouped into single domains for the Porphyry and the Faults Domains because there is very little difference in the statistics of the oxide and sulfide mineralization for the domains. Subtle changes in the strike of the domains are captured in separate domains. General descriptions are listed in Table 7-3.
60
| Technical Report | Kirkland Lake Gold |
| December 2016 | Fosterville Gold Mine |
TABLE 7-3 ROBBIN’S HILL DOMAINS
| Domain | Description |
| D40 | Steep west dipping, NNW trend |
| D41 | Steep west dipping, north trend |
| D42 | Sub-vertical, north trend (RH Dyke) |
| D43 | West dipping, NNE trend |
| D44 | West dipping, NWN – N trend (i.e.: Farley’s Fault) |
| D45 | Steep east dipping, north trend |
| D46 | West dipping, NNE trend |
| D47 | Steep west dipping, NW trend |
| D48 | Steep to shallow east dipping |
| D49 | East dipping, NE trend |
| D50 | Steep west dipping, north trend |
| D51 | Shallow east dipping, north trend |
| D52 | West dipping, north trend |
| D53 | Steep east dipping, NNW trend |
| D54 | Sub-vertical, north trend |
| D55 | Sub-vertical, NNE trend |
Oxidation Domains
Four ‘material’ domains were constructed, similar to that described for the Southern Models in order to assess density differences on gold grades in these zones.
The four domains are:
| • | Alluvium (near surface transported material, generally barren of gold, largely clay, free digging); |
| • | Oxide (sulfide minerals completely oxidized, Fe-carbonates largely oxidized); |
| • | Transition (sulfide minerals may be partially oxidized, includes zones of mixed fresh and oxide); and |
| • | Fresh (sulfide minerals completely un-oxidized). |
| 7.7 | CONTROLS ON OXIDE MINERALIZATION |
Minor re-mobilization of gold into the immediately surrounding country rocks has resulted in an approximate 50% increase in the width of mineralization and consequent reduction in gold grade. There is no evidence of a wide spread high-grade supergene zone immediately below the water table.
Other elements have been more significantly affected by weathering processes. Dissolution of sulfur by oxidizing groundwater above the water table has effectively removed all sulfur from the oxide zone. Arsenic has been strongly remobilized over a zone five to ten times the width of mineralization. The greater width of anomalous arsenic values in the oxide zones makes arsenic soil geochemistry a very useful tool for finding exposed gold mineralization.
61
| Technical Report | Kirkland Lake Gold |
| December 2016 | Fosterville Gold Mine |
Geochemical studies (Arne and House, 2009) found evidence of Fe or Mn oxide minerals scavenging Au, As or Sb in the weathered zone and that raw concentrations of Au, As and Sb may be used for defining secondary dispersion (with allowance made for the rock type for Sb).
62
| Technical Report | Kirkland Lake Gold |
| December 2016 | Fosterville Gold Mine |
8 DEPOSIT TYPES
Sulfide gold mineralization at Fosterville is relatively homogenous with only one deposit type present. There are minor variations in the host rock type and structural setting. Fosterville-type deposits form a sub-group of orogenic gold deposits that are typified by gold occurring in fine grained arsenopyrite and/or pyrite disseminated in country rocks as a selvage to faults or veins. Fosterville-type deposits and classic vein-hosted deposits are effectively end members with many orogenic gold deposits displaying features of both.
Sulfide gold mineralization at Fosterville is controlled by late brittle faulting. These late brittle faults are stacked, generally steeply west dipping with reverse movement varying from a few meters to over 150m. In the upper parts the fault system a series of moderately west dipping reverse splay faults occurs in the footwall of the Fosterville Fault. Sulfide gold mineralization occurs as disseminated arsenopyrite and pyrite forming as a selvage to veins in quartz – carbonate veinlet stockwork. The mineralization is structurally controlled with high-grade zones localized by the geometric relationship between bedding and faulting. Mineralized shoots are typically 4m to 15m thick, 50m to 150m up/downdip and 300m to 1,500m+ down-plunge. These sulfide bodies are the primary targets for exploration activities, especially where there is potential for grades in excess of 3 g/t Au (i.e. above underground resource cut-off gold grades).
Within the oxide zone, there has typically been minor re-mobilization of gold into the immediately surrounding country rocks which has resulted in an approximately 50% increase in the width of mineralization and consequent reduction in gold grade. There is no evidence of a wide spread high-grade supergene zone immediately below the water table. There is no current focus on exploring for additional oxide resources.
Until recently, the occurrence of primary visible gold had no clear control, with limited observations made mostly in oxide pits at the time they were mined. However, currently FGM has made many observations to date of visible gold mineralization in drill core and underground face/wall mapping. Based on those observations, FGM is of the view that visible gold mineralization is spatially associated with stibnite and quartz-carbonate veining. This stibnite-quartz-carbonate mineralization occurs as a late stage overprint/ replacement/reactivation of existing structures.
The broader concept that was used to explain observations of sulfide gold mineralization at FGM was primarily as an orogenic gold system. However, with the increase in visible gold and stibnite mineralization, there is a view that FGM may be part of a much larger scale intrusion-related gold system (e.g.: Bierlein & McKnight, 2005) that may help to explain the overprinting relationship between the sulfide hosted gold and visible gold.
63
| Technical Report | Kirkland Lake Gold |
| December 2016 | Fosterville Gold Mine |
9 EXPLORATION
| 9.1 | PRE - 1992 EXPLORATION |
Exploration prior to 1983 was undertaken by numerous companies including, Noranda Australia, Pennzoil, Newmont, Lone Star Exploration and Apollo International which obtained significant results, but concluded that target potential did not meet with their high tonnage exploration criteria.
1984 – 1987 – Bendigo Gold Associates Pty Ltd - EL1392
Relevant and available literature of the area was collected and researched and an extensive pilot study was undertaken in the Fosterville area, investigating the relationships between gold, arsenic, mercury in soils and mineralization believed to be typical for the area. Positive correlations were found between mineralization and all three elements in the soil C Horizon. Arsenic, due to better contrast characteristics was selected for future exploration (Van Riel, 1985). A general survey of the EL was also conducted, locating and inspecting historic workings.
A 730m long traverse of auger hole drilling soil program at 10m intervals was completed east of Mt Sugarloaf and west of the Fosterville Fault zone with C Horizons assayed for As. A 230ppm anomaly was returned which indicated potential mineralized lines parallel to the Fosterville Fault zone A reconnaissance stream sediment survey was also initiated with main streams on the EL bulk sampled. All anomalous results from the stream sediment survey were explained by nearby old workings (Van Riel, 1985).
The old mining areas of Yankee Creek, The Sugarloaf Range and the New Windsor Rush area were mapped and investigated in detail. Both the Sugarloaf and New Windsor Rush workings were chip and channel sampled. In particular, the New Windsor Rush area showed encouraging gold values over a strike length of 250m.
A semi regional geochemical sampling program was conducted over the Sugarloaf Range area. Four anomolous zones were identified from nine sample lines at 500m spacing and 25m sample intervals, the most significant aligning with a line of historic workings. Two auger lines over the 250m anomaly at New Windsor Rush did not reflect the anomaly and no further follow-up work was conducted. A total of 99 bedrock samples were taken at the Axedale Mine workings area on a 800 x 200m grid but gold values tended to be low and erratically dispersed (Swensson, 1986).
During 1985 a pilot ground magnetic survey was conducted over selected areas of the Fosterville Goldfield. A geometrix G-816 magnetometer was used with readings taken at 10m intervals along lines. In some instances, magnetic anomalies could be related to underlying reefs (Van Riel, 1985a).
1989 – 1990 – BHP Goldmines Ltd - EL1881
In early December 1989 BHPG entered into a joint venture with Homestake Limited to explore for possible extensions to the Fosterville and O’Dwyers Faults north of the Fosterville goldfield into the north eastern parts of EL1881.
Soil sampling was undertaken from 22 lines using a broad star pattern defined by 400 x 200m centers with five sub samples, each 1kg collected near each center. One is taken from the center sample site and four others are taken 50m grid east, west, north and south of the center generating a representative composite sample (C Benn, 1989). From this sampling, a NNW trending Au anomaly between 500 and 800m in with and strike extent of 5km.
64
| Technical Report | Kirkland Lake Gold |
| December 2016 | Fosterville Gold Mine |
By September 1989, a stream sediment sampling program for gold and base metals was completed. A total of 190 samples from 89 sites were taken. From each site, two samples were collected: a nominal 4kg to 5kg sample of <4mm active gravel/gravel trap sediment which was analyzed for gold using bulk cyanide leach method and an active silt sample sieved to -80 microns analyzed for Cu, Pb, Zn and As. The Au bulk cyanide leach results identified a number of moderate to strongly anomalous drainages (J. Cameron, 1988).
In 1990 exploration activities within the project area comprised RAB drilling and rock chip sampling to evaluate the gold potential of the northern projection of the Fosterville and O’Dwyer’s Fault systems. Low gold and arsenic geochemistry across the inferred position of both structures suggested that the faults were not significantly mineralized along this section of the fault system (G. Rabone et al, 1990).
The tenement was relinquished in September 1990 after the potential of the area was downgraded.
Other
The Russell’s Reef area, south of the current Fosterville Mine Lease, has been subjected to several lines of soil sampling, and several programs of shallow RC drilling (50 holes averaging 31m depth) undertaken over a protracted period from 1976 to 1989.
Modern exploration in the Myrtle Creek area has occurred since 1974 by companies such as Noranda Australia (rock chip sampling, geological mapping, soil geochemistry (Au, Cu)), Ghana Gold (structural interpretation of aerial photography) and BHP (stream sediments and follow up soil surveys).
In the early 1990’s Brunswick completed a 100m by 20m soil geochemistry grid across the Fosterville project area and as far west as the Sugarloaf Range. The soil geochemistry was very effective at defining gold mineralization except where alluvial cover exceeded about two meters. Two preliminary IP/resistivity lines were also completed with mixed results.
| 9.2 | 1992 - 2001 EXPLORATION |
A 25m by 25m gradient-array IP/resistivity survey was conducted in the Robbin’s Hill area by Perseverance in 1997. This survey did not conclusively define gold mineralization; however, it was successful in mapping carbonaceous shales and alluvial channels.
In the 12 month period leading up to 25 February 1998 PSV conducted hand auger bedrock geochemistry samples from Acott’s Prospect, Lyal Glen and Sedgwick South where mildly anomalous zones of mineralization were defined. Hand auger soil sampling was also run along road reserves in the Goornong North Area and in combination with RAB drilling resulted in the identification of two new prospects, May Reef and Ramussen’s. An Au-As soil geochemical survey was undertaken in the Myrtle Creek area where encouraging results were obtained where gold mineralization appears to be associated with a small granite intrusion. Reconnaissance work and rock chip sampling was also undertaken during this period on the Fosterville East and Wild Duck Prospects (Van Riel, 1998).
Throughout 1998 and 1999 PSV continued to actively undertake extensive hand auger soil sampling and rock chip sampling at multiple prospects including West of Axedale-Goornong Road, Cochrone’s Prospect, Rasmussen’s, Sharkey’s North, Lyal Glen South, Sugarloaf East and Sugarloaf North. Most of these survey’s returned indifferent results. A further soil geochemistry and rockchip sampling at Myrtle Creek delineated sandstone hosted and granite related mineralization. An orientation soil geochemical study was undertaken to establish the parameters for exploring Goornong South type deposits buried below deep soil and gravel cover (Van Riel, 1999).
65
| Technical Report | Kirkland Lake Gold |
| December 2016 | Fosterville Gold Mine |
A geobotanical survey was conducted within the Fosterville Mining Lease by Australian Geochemical Survey Ltd. It was found that an association of Au with As, Sb and also with Zn exists in this environment (i.e. tree bark was sampled). The survey results appear to point at three virtually untested anomalies: one west of Hunt’s and two at Daley’s Hill North (Van Riel, 1999).
After 1999 PSV regional exploration activities were limited with the company focusing on resource drilling at two of its advanced projects, Goornong South and Mills. Resources were determined for both, and EES-feasibility studies instigated.
| 9.3 | 2001 - 2015 EXPLORATION |
After the EES studies for both the Goornong South and Hallanan projects were completed, the company had suspended its plans and proposals to mine the deposits.
As a result, the main activity for this year has been a revaluation of the exploration potential of the area and a re-assessment of the exploration parameters.
The company’s main priority was the development of the sulphide resource at Fosterville.
Two IP/resistivity surveys were completed by Perseverance in 2001 and 2005. The 2001 survey consisted of four lines of 50m node spacing over the Central Area. This survey was designed to define gold mineralization at depths of between 50m to 250m. The data was inverted to make a model in real space. Anomalies were defined along the Fosterville Fault Zone, but the 50m node spacing meant that the survey resolution was unable to distinguish the carbonaceous shale in the hangingwall of the Fosterville Fault from mineralization in the footwall of the Fosterville Fault. In 2005 another four IP/resistivity lines were completed across the northern end of the Fosterville Goldfield, covering the Sugarloaf geochemical anomaly, the Fosterville Fault Zone and the Robbin’s Hill Area. This survey defined weak anomalies over the Sugarloaf geochemical anomaly and the strike projection of the Fosterville Fault Zone north of MIN5404.
During the period June 2005 to June 2006, 1:10,000 scale color aerial photography was flown over the area surrounding the Fosterville Mining License by PSV. In addition, a Landsat image of the entire exploration license was obtained to assist in regional interpretation (Norris, 2006).
During the period June 2006 to June 2007 PSV conducted a detailed mapping, soil-and rockchip- sampling program at the Myrtle Creek prospect. Petrography of twenty samples concluded that (altered and mineralized) granite is much more extensive than originally mapped.
It is concluded that the mineralization at Myrtle Creek is related to igneous (granitic) activity. This class of deposits is most unusual for Victoria, although examples are known elsewhere in the Lachlan Fold belt. A literature study was carried out which assisted in developing a suitable exploration model. A first-ever drilling program was designed for Myrtle Creek (Van Riel, 2007).
66
| Technical Report | Kirkland Lake Gold |
| December 2016 | Fosterville Gold Mine |
Northgate explored the Myrtle Creek area between 2008 and 2009, undertaking additional surface sampling in the northern area of historical workings, but the results were disappointing with the overall tenor of gold-in-soil much lower than observed elsewhere on the prospect.
UTS Geophysics, based in Perth WA, was commissioned in the latter half of 2008 to fly a detailed airborne magnetic, radiometric and digital terrain survey over Northgate’s Fosterville Group of tenements and
EL3484 Greenstones. A total of 23,172 line km were flown between October 2nd and November 26th, 2008 of which approximately 22,000 line km were completed over the Fosterville Group. A table of all geophysical data grids produced during the interpretive work is presented in Table 9-1. Magnetics Reduced to Pole and Total Count Radiometric results are illustrated in Figure 9-2 and Figure 9-3 respectively.
Of most use as aids to structural interpretation and target definition are the RTP 1VD magnetics, K/Th radiometrics and DTM images. In comparison to the airborne survey data from the Heathcote Greenstone Belt (EL3484), the magnetic and radiometric response is subdued. However, the north-northwest trending regional structural/lithological grain is clearly visible throughout the group lease area, particularly in the south, and numerous offsets of the regional grain can be interpreted. The Harcourt Granodiorite and associated contact metamorphic halo is prominent in the southern portion of EL4572 and EL3539, as expected. The position of the Whitelaw Fault is confirmed by the sharp contrast in the total count radiometrics data and the subtle elevation change across the fault seen in the DTM image.
The Fosterville Fault geophysical signature is affected by surface disturbance and infrastructure. The extension of the fault to the north beyond the mine lease boundary below Tertiary/Quaternary sediments and to the south of the mine lease is not well defined. Further interpretative work in combination with prospect-scale geochemical and geophysical surveys will be required to better define the position of the Fosterville Fault.
TABLE 9-1 2008 UTS GEOPHYSICAL SURVEYS OVER THE FOSTERVILLE GOLD MINE AND SURROUNDING AREAS
| Dataset | Grid name |
| Magnetics | Total Magnetic Intensity |
| Reduced to Pole | |
| First Vertical Derivative | |
| RTP First Vertical Derivative | |
| Radiometrics | Total Count |
| Potassium Percentage | |
| Thorium Percentage | |
| Uranium Percentage | |
| Potassium vs Thorium | |
| Ternary Image | |
| Digital Terrain Data | Digital Terrain Map |
| Digital Terrain Contours | |
| Magnetic ZS Filters | RTP Block |
| RTP Edge Zone | |
| RTP Tilt | |
| RTP Plateau |
The existence of the Redesdale Fault was first proposed in late 2009 by the Geological Survey of Victoria and is supported by the 2006 State seismic transect (which passes north of EL3539), geological mapping near Redesdale and interpretation of State and Northgate gravity data. The interpretation importantly defined a number of gravity highs within the Redesdale Fault corridor, corresponding with known areas of gold mineralization including the Fosterville and O’Dwyer's Fault Systems. This identified relationship is the basis for proposing future RAB drilling between the Goornong South and May Reef Prospects where similar, but less well-defined gravity anomalies are present.
67
| Technical Report | Kirkland Lake Gold |
| December 2016 | Fosterville Gold Mine |
A compilation and interpretation of available drilling and geochemical data in conjunction with interpretation of FGM’s airborne geophysical data (acquired in 2008) and consideration of Geoscience Victoria’s (GSV) Redesdale Fault Model indicated potential for Fosterville-style gold mineralization within the Sugarloaf prospect area.
Exploration data in the Sugarloaf area includes surface geochemistry, RC drilling, airborne magnetics and radiometrics and ground IP. However, it should be noted that historical (1989-1991) drilling of 36 RC holes (totaling 1,164m) in the area averages only 32m in depth and diamond drilling is absent.
IP/resistivity surveys were conducted by Northgate in 2010 that highlighted areas for targeting, as shown in Figure 9-1.
In 2010 Northgate reviewed the Goornong South area for its potential to host gold mineralization amenable to underground mine extraction. The initial exploration saw completion of two lines of IP/resistivity survey (Figure 9-1) to the south of the prospect in order to identify chargeability anomalies along strike from the sulfide mineralization at Goornong South. Chargeability anomalies were encountered on both lines and a five diamond drill hole program (totaling 1,532m) was completed.
Ground IP/resistivity data, collected in 2010, maps resistive chargeability anomalies beneath the Sugarloaf Range and between the range and the Fosterville Fault. In addition to this an airborne radiometric K/Th ratio anomaly in the southern part of the prospect may represent a potassium alteration halo proximal to faulting. The K/Th ratio anomaly also has a coincidental and similar trend to the Sugarloaf Fault IP chargeability anomaly. The chargeability anomaly could be caused by the presence of subsurface black shale stratigraphy and/or sulfides.
Haines Surveys completed a ground-based grid and traverse gravity survey centered on the Fosterville Mine Lease and covering part of EL3539 and EL4572 in April/May 2010. A total of 34 survey lines and 723 stations were completed during the survey period (Figure 9-4). Grid station spacing was nominally 200m in the central corridor of interest defined by the GSV Redesdale Fault model, increasing to 400m towards the edge of the grid. A number of roadside traverse lines were then completed in the southern portion of the Fosterville license group, designed to infill existing state data and potentially track the course of the Redesdale Fault towards the Harcourt Batholith.
The strong gradient beneath the Campaspe River appears to confirm the GSV Redesdale Fault model although additional complexity is apparent particularly in the vicinity of the Fosterville Mine Lease. Gravity highs (not visible in the state data) also appear to correspond with mineralized zones on the Fosterville and O’Dwyer’s Faults and the Goornong South and Mills prospect areas. The theorized offset between Daley’s Hill and Mills is apparent.
68
| Technical Report | Kirkland Lake Gold |
| December 2016 | Fosterville Gold Mine |

69
| Technical Report | Kirkland Lake Gold |
| December 2016 | Fosterville Gold Mine |

70
| Technical Report | Kirkland Lake Gold |
| December 2016 | Fosterville Gold Mine |

71
| Technical Report | Kirkland Lake Gold |
| December 2016 | Fosterville Gold Mine |

72
| Technical Report | Kirkland Lake Gold |
| December 2016 | Fosterville Gold Mine |
10 DRILLING
| 10.1 | PRE - 1992 DRILLING |
Modern exploration commenced at Fosterville during the 1970’s. Apollo International Minerals NL drilled three HQ diamond holes in what is now the Hunts area. Noranda Inc. drilled three HQ diamond holes in the Daley’s Hill area. None of these holes have been included in the drilling database due to uncertainty in their collar locations.
From 1987 to 1991 Bendigo Gold Associates and later Brunswick drilled 488 RC holes and six HQ diamond holes targeting oxide mineralization on the Fosterville Fault and the Robbin’s Hill area. This program resulted in the development of a heap leach operation, which commenced in 1991.
| 10.2 | 1992 - 2001 DRILLING |
On acquiring the Fosterville Mine Lease in 1992, Perseverance (through a drilling contractor) started RC drilling for further oxide resources and reserves using a combination of cross over and face sampling hammers. These holes used the CN, CEL, CEN, DH and HAR prefixes.
In late 1994, while continuing to explore for oxide mineralization, Perseverance began to drill for sulfide mineralization on the Fosterville Fault potentially amenable to open cut mining. The 1997 Feasibility Study drilling was almost entirely RC with minor diamond drilling for metallurgical and geotechnical purposes and extended from 6000mN to 10700mN. Most of the drilling was completed by 1997 with minor infill drilling continuing to 1999. Holes from this program have the SP (sulfide project), CN, CEL (D), CEN (D), GT or HAR (D) prefixes, the ‘D’ denoting holes with a diamond tail (Table 10-1 and Table 10-2).
Section spacing was either 25m or 20m except in two small zones in the Falcon and Ellesmere Areas where 12.5m sections were drilled. This drilling program was generally restricted to within 100m of surface, extending to a vertical depth of 150m below surface in the Central North Area, reflecting the perceived limits of open cut mining. The data from this drilling program formed the basis of the 1997 Sulfide Project Feasibility Study, which was later updated in 2000 (Perseverance, 1997; 2000).
Two deep diamond holes, SPD7 and SPD8 were also drilled. SPD7 was drilled beneath the Central Ellesmere pit and intersected 53.8m at 1.97 g/t Au (drill hole abandoned in mineralization) from 382m, while SPD8 was drilled to 450m below Central North intersecting only 2.0m at 0.58 g/t Au on a splay fault some 60m to the east of the Fosterville Fault.
All the RC drill holes used face sample hammers. After 1996, if the sample was unable to be kept dry the hole was finished with an NQ2 diamond tail.
Open hole down-hole surveys were completed on all drill holes at 30m intervals except for a small number of holes which collapsed before a survey instrument could be lowered down the hole. The vast majority of holes were drilled from the west towards the east, generally intersecting mineralization at 50° to 80°. Most sections include at least one hole drilled towards the west as a check on the geological interpretation.
The Fosterville Mine Surveyor used a Total Station Instrument to run a complete digital survey of the topography for any areas where drilling and later resource evaluation was planned to take place. Spot heights were measured at suitable intervals where easting, northing and RL are noted. Closer spaced measurements were taken around noticeable highs and lows in the topography. These spot heights were then triangulated using Minsurv software to construct a Digital Terrain Model (DTM). This DTM was used in all resource/reserve estimates at Fosterville. The spot heights were measured to an accuracy of ± 1.0cm at spacing of approximately two meters.
73
| Technical Report | Kirkland Lake Gold |
| December 2016 | Fosterville Gold Mine |
| 10.3 | 2001 - 2015 DRILLING |
The current drilling program which commenced in July 2001 is focused largely on the Fosterville Fault Zone and is ongoing.
The drilling programs at Fosterville have essentially been continuous from 2001 to 2015. Most of the surface drilling was conducted by Silver City Drilling Pty Ltd until November 2009 and thereafter by Macquarie Drilling (drilling contractor). Deepcore Pty Ltd has continued to provide all underground diamond drilling services as well as completing diamond holes from surface.
The majority of drilling carried out in this period has been diamond drilling with a limited amount of RC being undertaken, as well as a few AC holes. RC has been utilized to some extent for pre-collars (with diamond tails) this was predominantly undertaken for SPD holes up until 2008. The diamond tails commenced at least 20m before the Fosterville Fault so that all mineralization was intersected by the diamond tail. The RC pre-collars were generally 150m to 200m deep and the diamond drilling was double tube wireline drilling. In addition, navi or wedge drilling was undertaken from parent holes where holes depths are great, and since 2008 many of SPD prefixed holes were drilled using diamond drilling exclusively, HQ collars with NQ2 tails.
Collar locations are surveyed using the same technique as prior to 2001 (see Section 1992-2001 Drilling 10.2 above).
The direction of the RC pre-collars was controlled to some degree by the use of a stabilizer rod, the relative size of the bit compared to the rods and by the weight on the hammer. Drill holes shallower than 70° tended to lift. Drill holes steeper than 75° tended to drop. With experience, deviation in the pre-collar was restricted to less than 1° in 10m. Navigational drilling was occasionally used to keep holes on target where the RC pre-collar deviated significantly. Down-hole surveys were carried out using a single shot Eastman camera (up until 2007) and then using ReflexTM or PathfinderTM cameras (from 2007 onwards) at 25m intervals in the pre-collars (every 50m inside the rods as the hole was drilled and the intervening 25m intervals open hole after the pre-collar was completed) and at 30m intervals in the diamond tails. As a check on the validity of the single shot surveys six holes were surveyed at 6m intervals using an EMS (electronic multi-shot) tool. Since 2010 holes greater than 130m have been surveyed at every 6m utilizing the EMS tool on hole completion.
The drill hole traces are currently calculated using the ‘semi tangent’ de-surveying algorithm on 10m intervals in MineSightTM software. This method is suitable for deeper RC holes, which have more than two down-hole surveys. The ‘fit-spine’ algorithm was previously used because it dealt well with RC holes that have only one or two surveys near the top of the hole and also because this algorithm was used historically at Fosterville.
The NQ2 diamond core has generally been drilled using either six meter core barrels for surface drill rigs or three meter core barrels for underground drill rigs. A core orientation mark is attempted for each three meter run predominantly utilizing an electronic core orientation tool, such as the reflex orientation tool (spear and mechanical devices has also been utilized in the past). An Ace Core Tool is employed to take structural measurements, where the Ace Core Tool cannot be utilized, structural measurements are taken from an inferred reference plane (regional cleavage) or are un-oriented.
74
| Technical Report | Kirkland Lake Gold |
| December 2016 | Fosterville Gold Mine |
Sieved chips from the RC pre-collars were logged in two meter intervals for lithology, weathering, alteration, percentage quartz, color and recovery. The logging information in the past has been recorded into the database via offline logging using hand held IPAQ computers and uploaded to the database. Since 2008 geological information has been entered into laptops running acQuireTM Offline logging software, which supports increased validation options prior to uploading into the SQL Fosterville geology database.
The diamond core is transported to the core shed where the core is washed, oriented, geologically logged, recovery and RQD measured, marked up for sampling, digitally photographed, sampled and dispatched. Geotechnical logging occurs on an as needs basis, but is completed for each resource definition drill hole. The remaining core is stored on site either in the core farm behind the core shed or at a storage facility at the backfilled portion of the Falcon pit. The geological logging involves direct digital recording of observations on sediment grain size, lithology, planar and linear structural observations (as alpha, beta and gamma measurements), mineralization, alteration and quartz veining and identification of sample locations. Logging is recorded in the database by utilising online acQuire logging software with data validation, the usual automated error checking and a list of samples printed as a cutting sheet. True dip and dip direction values for each collected structural measurement is calculated using a stored procedure in acQuireTM software. Since 2008 logged data has been verified through viewing of the data using MineSight 3D software.
The strategy for underground diamond drilling is to infill the exploration drilling intercepts (100m sections) to a notional 25m x 25m grid spacing (or tighter if required) prior to the mining of underground development. Underground diamond drill core samples used in the Phoenix and Harrier resource estimations are predominately NQ2 in diameter.
The change in drilling methods to largely oriented diamond core, intensive re-mapping of old oxide pits and a change in logging methods to collect detailed grain size data allowing sequence stratigraphic analysis allowed much more detailed and robust geological models. These geological models allowed a better understanding of the controls on gold mineralization, which in turn resulted in the better targeting and more efficient use of drilling.
The post-2001 exploration resulted in the discovery and definition of the Phoenix, Wirrawilla and Farley’s deep zones. In addition, the Falcon, Ellesmere and Harrier Zones were extended. Modest additions to resources were made at the Daley’s Hill, Sharkey’s and Hunts Deposits.
The 2008 surface diamond drilling program tested the characteristics and extent of resources of the Wirrawilla (renamed as Harrier UG) and Phoenix resource areas. Thirty-six holes totaling 16,253m were completed with 86% completed in Harrier UG Area and 14% in the Phoenix Area.
The program resulted in the discovery of extensions to three north striking, west dipping areas of gold mineralization within the Harrier UG Area: The Osprey; Raptor; and, Harrier Base Fault Zones. The zones are situated 1.5km south of the current Phoenix Mineralized Zone and are interpreted to be at a higher stratigraphic level, but down-plunge of the Harrier open-pit Mineralized Zone, which was mined in 2007.
75
| Technical Report | Kirkland Lake Gold |
| December 2016 | Fosterville Gold Mine |
The 2009 exploration program consisted of an additional 12,179m of drilling that served as the basis for an underground resource estimate in the Harrier Area using a 3.0 g/t Au lower cut-off.
Additional exploration drilling in 2009 consisted of 6,633m of drilling on Phoenix Extension, 1,051m on other targets in the Fosterville Mine Lease as well as 1,695m in ten holes on the Myrtle Creek Prospect (EL3539) located south of the FGM.
The 2010 exploration program consisted of 49,980m of drilling; the majority of which was directed towards the Harrier (47%) and Phoenix (30%) Zones, to both extend zones and reduce drill spacing to upgrade the confidence in the resources prior to reserve studies. The balance of the exploration was directed to other targets on the Mine Lease and a small amount of drilling was undertaken on the exploration tenements surrounding the Mine Lease.
The 2011 exploration program consisted of 17,032m of drilling directed towards thirteen different target areas on the Mining Lease, some of which are push backs on existing open pits and others are underground mining target areas.
Between 2012 and 2015 exploration has predominantly focused on diamond drilling in close proximity to current mining, with programs based on extending known extents of gold mineralization. This period saw approximately 132,816m of exploration drilling occur in the Robbin’s Hill, Falcon North, Harrier, Phoenix, Lower Phoenix, Lower Phoenix Footwall, Fosterville Splays, Eagle, and Kestrel areas.
The nominal progression of drilling is from initial surface exploration, through 100m by 50m and then 50m by 50m. Near surface mineralization is then further in-filled to 25m by 25m to allow pit design. Open pit grade control drilling consists of RC holes drilled 5m apart on either 10m or 12.5m sections to a maximum depth of 30m. However, for the O’Dwyer’s South cutback, Harrier pit cutback and the deepening of John’s pit, two 2.5m riffle split samples of 5m deep blast holes were used for grade control purposes. The open pit drilling, sampling and logging methods are the same as exploration RC drilling. Underground mineralization is in-filled to 25m by 25m or tighter if required by underground diamond holes.
Strike drives are face sampled each round (~3m) and sludge hole sampled on 6m Northings in a ring pattern with holes selected by geologists after review of current geological information. The selection criteria for sludge sampling are based on either the need for providing diamond drill data support or the need for additional sampling in data poor zones. No face sampling or sludge hole sampling is used in resource grade estimation, however, the information is considered for domain boundary placements.
Based on drilling results, geological interpretations are made in three dimensional surfaces to form a geological model. The geological model is utilized to interpret the mineralized zones, with geological solids subsequently generated from these interpretations. Further detailed discussion on this process is contained in Section 14 under each of the modeled areas.
| 10.4 | 2016 DRILLING |
During 2016 the Phoenix decline was re-directed to the hangingwall of the Fosterville FW Anticline. A new drill drive (P4190 DD) from a hangingwall location was completed and ready for preliminary drilling from August and more extensive programs continued from October 2016. The drilling targeted primarily the D11 Swan (Lower Phoenix Footwall) and the D13 Benu (Lower Phoenix). The D01 Audax (Eagle) was also drilled during this time from Central Decline stockpiles with secondary targeting into the D11 Swan also occurring. The drill fleet was split into these two main areas during 2016 and the fleet was extended to handle the multiple east and west dipping mineralized targets requiring drilling.
76
| Technical Report | Kirkland Lake Gold |
| December 2016 | Fosterville Gold Mine |
During 2016 some 405 holes were collared from underground locations for 96,697 meters. Holes drilled into the Eagle Zone comprised 29.8%, Harrier, 29.7%, Lower Phoenix, 9.1%, Phoenix, 7.1%, Lower Phoenix Footwall, 6.7%, East Dippers, 5.3%, Osprey, 4.8%, Splays, 0.6% and UG exploration drilling comprised 6.7% . In addition there were 27 growth exploration holes collared from surface, including four targeting the southern extension of the Lower Phoenix, 14 in the Northern Phoenix and nine in the Robbin’s Hill area
During 2016, growth exploration diamond drilling totaled 22,205m in 35 drill holes. This drilling predominantly focused on near-mine targets to replace reserves by extending known ore shoots. These holes targeted areas within MIN5404 including the Eagle, north and south extensions of the Lower Phoenix, Lower Phoenix Footwall, and Fosterville Splays Areas (Figure 10-4 and Figure 10-5). The Robbin’s Hill Area was also investigated (Figure 10-6) with several diamond drill holes with positive assay results being received.
Key growth drill intercepts over the 2016 period are illustrated in Figure 10-7 and Figure 10-8.
Resource definition drilling was focused on targeting extensions of both the Phoenix and Harrier systems (Figure 10-1, Figure 10-2 and Figure 10-3). Significant high-grade results were returned from this drilling with several intercepts containing visible gold in the Eagle, Lower Phoenix Footwall and Harrier Base structures. Drill results returned from the Eagle, Lower Phoenix Footwall and Harrier Base structures that form part of the December 2016 Mineral Resource estimate are illustrated in Figure 10-9, Figure 10-10 and Figure 10-11.
77
| Technical Report | Kirkland Lake Gold |
| December 2016 | Fosterville Gold Mine |

78
| Technical Report | Kirkland Lake Gold |
| December 2016 | Fosterville Gold Mine |

79
| Technical Report | Kirkland Lake Gold |
| December 2016 | Fosterville Gold Mine |

80
| Technical Report | Kirkland Lake Gold |
| December 2016 | Fosterville Gold Mine |

81
| Technical Report | Kirkland Lake Gold |
| December 2016 | Fosterville Gold Mine |

82
| Technical Report | Kirkland Lake Gold |
| December 2016 | Fosterville Gold Mine |

83
| Technical Report | Kirkland Lake Gold |
| December 2016 | Fosterville Gold Mine |

84
| Technical Report | Kirkland Lake Gold |
| December 2016 | Fosterville Gold Mine |

85
| Technical Report | Kirkland Lake Gold |
| December 2016 | Fosterville Gold Mine |

86
| Technical Report | Kirkland Lake Gold |
| December 2016 | Fosterville Gold Mine |

87
| Technical Report | Kirkland Lake Gold |
| December 2016 | Fosterville Gold Mine |

88
| Technical Report | Kirkland Lake Gold |
| December 2016 | Fosterville Gold Mine |
TABLE 10-1 DRILL HOLE PREFIXES FOR ALL DRILLING ON THE FOSTERVILLE FAULT CORRIDOR SOUTH OF 10,000mN
| Hole Series | No. of Holes | Comments | |
| BGL001 | BGL106 | 35 | 1990-2016 RC hydrological |
| CEL001 | CEL124 | 96 | 1997 RC & AC open pit sulfide |
| CELD020 | CELD106 | 26 | 1997-2003 Diamond tails from RC wet drilling |
| CELD051 | CELD058 | 8 | 1996 Diamond metallurgical |
| CEM100 | CEM105 | 6 | 1994 RC metallurgical |
| CEN001 | CEN124 | 80 | 1997 RC for open pit sulfides |
| CEND019 | CEND103 | 22 | 1997-8 Diamond tails of RC |
| CEND110 | CEND112 | 2 | 1997 Diamond Exploration |
| CEND038 | CEND113 | 12 | 1996-7 Diamond metallurgical |
| CN100 | CN248 | 149 | 1994 RC exploration |
| CNM001 | - | 1 | 1995 RC metallurgical |
| DALD001 | DALD020 | 21 | 2003-6 Daley's Hill diamond |
| DDH3* | DDH5* | 3 | 1976 Daley's Hill diamond |
| DH001 | DH238 | 193 | 1995-9 Daley's Hill RC |
| DHRB010 | DHRB013 | 4 | 1997 Daley’s Hill RC |
| ELRC0001 | ELRC0949 | 912 | 2005-7 Ellesmere pit RC (7500mN–8425mN) |
| FARC0001 | FARC0825 | 825 | 2005 Falcon pit RC (8615mN–8800mN) |
| FDD14A | FDD33 | 7 | 1990 Diamond (Brunswick) |
| FO002 | FO379 | 235 | 1986-90 RC (Bendigo Gold Associates) |
| FO400 | FO487 | 56 | 1992-1994 RC (Perseverance) |
| FOS056 | FOS214 | 3 | 1998-2000 RC & AC exploration |
| GT001 | GT048 | 47 | 2004-2016 Diamond geotechnical |
| H4805RAWPILOT | - | 1 | 2014 Pilot hole for Harrier 4805 RAW |
| HAR003 | HAR065 | 61 | 1997-9 Harrington’s Hill RC |
| HARC001 | HARC248 | 233 | 2006-11 RC (6350mN-7315mN) |
| HARD1 | - | 1 | 1996 Diamond PQ metallurgical |
| MB12 | - | 1 | 2009-12 RC hydrological monitoring |
| SH003 | SH016 | 14 | 2012 – 2015 Underground Services |
| SD001 | SD039 | 43 | 2007-8 Diamond (7775mN-8675mN) |
| SP001 | SP372 | 299 | 1994-6 RC drilled down to 5100mRL |
| SPD001 | SPD009C | 9 | 1995 Diamond exploration |
| SPD010 | SPD621A | 708 | 2001-16 RC and diamond exploration |
| ST009 | ST179 | 50 | 2003 RC & AC Sterilization |
| SVH001 | SVH009 | 9 | 2010 Underground Services |
| UD001 | UD995 | 934 | 2006–11 Underground diamond |
| UDE001 | UDE119 | 132 | 2010-16 Underground diamond exploration |
| UDH0001 | UDH2003 | 1652 | 2011–16 Underground diamond |
| Total Holes | 6,890 | ||
TABLE 10-2 DRILL HOLE PREFIXES FOR ALL DRILLING IN THE ROBBIN'S HILL - O'DWYER'S AREA
| Hole Series | No. of Holes | Comments | |
| FAC001 | FAC003 | 3 | 1993-2001 Farley's AC |
| FAR001 | FAR011 | 10 | 1997 Farley's RC (face) |
| FARM001 | - | 1 | 1994 Farley's metallurgy RC (x-over) |
89
| Technical Report | Kirkland Lake Gold |
| December 2016 | Fosterville Gold Mine |
| FDD019 | FDD040 | 12 | 1989-90 Robbin's Hill diamond HQ |
| FO303 | FO309 | 6 | 1998 O'Dwyer's RC (face) |
| 1993-96 Sharkey's RC (x-over) & | |||
| GH100 | GH354 | 254 | |
| diamond HQ (1) & NQ (1) & RAB (2) | |||
| GHM001 | GHM002 | 2 | 1994 Sharkey's metallurgy RC (x-over) |
| MBOS01 | MBOS07 | 7 | 2011 O'Dwyer's South RC hydrological monitoring |
| ODW001-134, 150-158 & 167 | 128 | 1999, (2005 ODW167) O'Dwyer's RC (face) | |
| ODW135-149 & 159-166 | 23 | 1999 O'Dwyer's AC | |
| ODW168 | ODW206 | 39 | 2007 O'Dwyer's South RC (face) |
| ODW207 | ODW228 | 22 | 2011 O'Dwyer's RC (17, face) & NQ2 (5) |
| ODWD001 | ODWD003 | 3 | 1997 O’Dwyer's diamond NQ |
| PBOS01 | PBOS05 | 5 | 2012 O'Dwyer's South RC hydrological production |
| RD001 | RD151 | 147 | 1994-98 Read's RC (83, face) and AC (64) |
| RDD146 | - | 1 | 1998 Read's diamond NQ |
| RH001 | RH878 | 756 | 1987-96 Robbin's Hill and O'Dwyer's RC |
| RHD001 | RHD207 | 204 | 1994, 2004-07 Robbin's Hill RC
& diamond NQ2 (47) & HQ (15) |
| RHD208 | RHD248 | 44 | 2009-16 Robbin's Hill &
Farley's-Sharkey's diamond NQ2 (25) & NQ3 (3) & RC (6, face) |
| RHM001 | RHM004 | 4 | 1993 Robbin's Hill metallurgy RC (x-over) |
| ROB001 | ROB012 | 11 | 1996 Robbin's Hill RAB |
| ROB013 | ROB066 | 51 | 1998-99 Robbin's Hill RC (face) & AC (3) |
| SHA001 | SHA033 | 25 | 1997 Sharkey's RC (face) |
| ST001 | ST008 | 8 | 1993 Sterilization RC (x-over) |
| Total No. of Holes | 1,766 |
90
| Technical Report | Kirkland Lake Gold |
| December 2016 | Fosterville Gold Mine |
No drill holes are excluded from the database. However, drill holes that are of questionable quality (due to suspect collar coordinates, down-hole surveys or sampling/analytical QAQC) are omitted from any resource calculation process. Such holes typically are in areas of historic mining and have no influence on the current Mineral Resource estimates.
| 10.5 | QAQC OF DRILL HOLE SURVEYS |
Allwood (2003) details the results of down-hole surveys repeated using both an Eastman camera and an Electronic Multi-Shot (EMS) tool. The EMS down-hole surveys agreed with the single shot surveys to within 0.1° in dip and 2° in azimuth resulting in a total average variation of 0.4m per 100m down-hole. The repeated Eastman surveys have an average variation of 0.6° in azimuth and 1.6° in dip, reflecting the precision of the Eastman camera survey tool. Comparing the drill hole traces plotted using the Eastman data with the EMS data shows that the variation in drill hole location due to survey method is considerably less than the variation in hole trace caused by the use of different drill hole de-surveying algorithms. However, in 2007 the use of EMS tools as a standard in preference to Eastman cameras was adopted across the various rigs operating at Fosterville, and in 2010 it became common practice to have survey data at six meter increments or less down each hole. The increased density of down-hole survey data has permitted ability to readily identify and remove suspect azimuth measurements.
Accuracy of down-hole surveys are most effected by proximal ferrous mine infrastructure and/or proximal in-hole casing. Other factor affecting the accuracy of the position of DH survey data is the accuracy of the collar position. Drill holes can be affected when passing close to existing development due to steelwork (mesh, plates and cable bolts) associated with underground development; the effect is shown through elevated magnetic readings, which allow the removal affected surveys. Over time the survey instruments accuracy degrades through usage. Routine testing of all down-hole survey cameras on a test bench of known dips and azimuths checks tool accuracy degradation.
| 10.6 | PLANNED 2017 EXPLORATION |
The proposed exploration activities in 2017 are focused on near-mine targets and extending mineralized trends within MIN5404. However, in subsequent years exploration is planned for target areas away from the Fosterville Mine Lease within the north-south extensive EL3539. The intent of the exploration is to replace and increase the mineralized resource at Fosterville by extending presently known ore shoots, and also to locate anomalous gold mineralization for further exploration investigation, then subsequent resource evaluation. Near mine exploration activities planned for 2017 include:
Northern Lower Phoenix (8400mN, 8500mN, 8600mN, & 8800mN)
Collectively these programs target the northern extension of the Lower Phoenix System. Initial interpretations between the 7700mN and 8300mN drill sections indicate that gold mineralization may be strike extensive, and these programs will test the continuation of that strike extent. The combined proposed programs have an estimated cost of AUD$3.19M.
91
| Technical Report | Kirkland Lake Gold |
| December 2016 | Fosterville Gold Mine |
Southern Lower Phoenix (6200mN, 6300mN & 6400mN)
This program targets the southern extension of the Lower Phoenix System. The system is not constrained to the south, so the program will test the southern continuation of the currently known gold mineralization. The proposed drill program is estimated to cost AUD$1.5M.
Lower Phoenix Footwall (5550mN, 5650mN, 5750mN, & 5850mN)
This program is designed to follow up a drill program on the 5450mN section that commenced in mid-2016 and was still progressing at the effective date of this report. The combined proposed drill programs are estimated to cost AUD$2.12M.
Robbin’s Hill (12500mN to 13100mN)
This program is proposed to follow up drilling in the Robbin’s Hill Area conducted in 2016. Drilling will test for mineralized structures at depth and is estimated to cost AUD$2.65M.
Other Planned Programs for 2017
There are several other exploration programs planned for 2017, including, but not limited to:
- 2D seismic transects to identify potential exploration targets (AUD$400k);
- EL4937 soil sampling aimed at identifying gold mineralization or evidence of buried sulfide mineralization (AUD$32k);
- Harrier South and Harrier up-dip drilling, which is designed to target extensions of known mineralization (AUD$1.4M); and
- Diamond drilling targeting the Sugarloaf Fault, which is to be collared from underground workings (AUD$234k).
| 10.7 | EXPLORATION POTENTIAL |
| 10.7.1 | GOORNONG SOUTH |
The Goornong South Prospect is located approximately 4km north of the Fosterville Mine Lease, where Fosterville style gold mineralization occurs beneath transported cover on privately owned land. The gold prospect was discovered by Perseverance during regional exploration in the mid 1990's. PSV identified a 1.3km long anomalous zone of gold mineralization and systematically drilled the anomaly between 1995 and 1999 for its open pit potential. The drilling was comprised of 71 RC holes (totaling 4,482m) and one diamond hole (69m) with a further eight aircore holes (293m) drilled for ground water monitoring purposes.
Perseverance subsequently reported a Historic Resource in their 1999 Annual Report as shown in Table 6-2. Kirkland Lake Gold is not treating the Historical Resource as a current Mineral Resource as a QP has not done sufficient work to classify the Historic Resource, or comment on the reliability of the estimate.
In 2010 Northgate reviewed the Goornong South area for its potential to host gold mineralization amenable to underground mine extraction. The initial exploration saw completion of two lines of IP/resistivity survey (Figure 9-1) to the south of the prospect in order to identify chargeability anomalies along strike from the sulfide mineralization at Goornong South. Chargeability anomalies were encountered on both lines and a five diamond drill hole program (totaling 1,532m) was completed.
92
| Technical Report | Kirkland Lake Gold |
| December 2016 | Fosterville Gold Mine |
A 2010 diamond drilling program was undertaken from the roadside and spans about a 750m north-south trend. The program was unfortunately cut short owing to fiscal constraints at that time and the IP chargeability anomalies were not drill tested. However, of the five holes drilled, three returned assay intercepts averaging greater than 2.5 g/t Au and the strike length of the prospect had been extended southwards a further 300m.
Structural measurements of the available drill core indicate that the folding of the Ordovician turbidites plunges southwards at <20° and it is interpreted that gold mineralization will also have this plunge, analogous to structural controls of mineralization at Fosterville.
Kirkland Lake Gold recommends a review of the Goornong South prospect as a potential underground Fosterville-style gold occurrence.
| 10.7.2 | HALLANAN'S |
The Hallanan's Prospect area, located 1km south of the Fosterville Mine Lease, was explored for oxide gold by Perseverance between 1994 and 1998. During this period Perseverance completed 104 RC drill holes (totaling 6,245m with an average drill hole length of 60m), two diamond holes (109m) and 11 monitoring bore holes (354m). Gold mineralization was identified in drill intercepts over a 750m north-south trend and at the end of drilling a Historic Resource was estimated and reported by Perseverance in their 1999 Annual Report as shown below. However, Kirkland Lake Gold is not treating the Historic Resource as a current Mineral Resource as a QP has not done sufficient work to classify the Historic Resource, or comment the reliability of the estimate.
No exploration activity has been undertaken on the Hallanan's Prospect since 1999 and during the intervening period to 2012 much has been learnt about structural controls of Fosterville-style gold mineralization at the nearby Mine Lease. Diamond drill core is virtually absent from the Hallanan's Prospect, and this coupled with an absence of any deep drilling, with RC drilling only averaging 60m in depth, the prospect is viewed by Kirkland Lake Gold as being under explored for underground gold targets. The area is to be reviewed for drill testing in the future.
| 10.7.3 | HARRIER UG FAR SOUTH |
The Harrier mineralized system is located to the south of MIN5404. Gold grades are less consistent in the Harrier System and it has largely been dominated by sub-average to average sulfide mineralization. Recent resource definition drilling in 2016 intersected visible gold in several drill holes. The Harrier System is not constrained up-dip and to the south beyond 4750mN, with both areas forming part of the 2017 proposed exploration target areas.
| 10.7.4 | MAY REEF |
The May Reef Prospect is located in the northeastern portion of EL3539, some 15km north of the Fosterville Mine Lease. Several minor historic shafts (early 1900's) occur in the area including the May Reef shaft, which is the namesake of the prospect. Shallow RAB drilling with follow up RC (eight) drilling in the area through
93
| Technical Report | Kirkland Lake Gold |
| December 2016 | Fosterville Gold Mine |
the unconsolidated gravel and clays to Ordovician turbidite bedrock identified gold and arsenic anomalism 100m west of the historical workings. The RC drilling in 1998 returned only one significant intersection (MR4: 10m @ 1.01 g/t Au from 42m incl. 2m @ 3.71 g/t Au). However, the context of the drill intercept is unclear and a review of the prospect is recommended.
| 10.7.5 | MYRTLE CREEK |
The Myrtle Creek prospect is located in the southern part of EL3539 on private land, 24km south of the Fosterville Mine Lease. The prospect is 4km northeast of, the 370Ma, Harcourt Batholith where rocks on the prospect comprise 440Ma Lower Ordovician Lancefieldian sediments, dominated by sandstone and quartzite, of the Castlemaine Supergroup. The sediments are tightly folded on an axis trending NNW, similar to that of other Bendigonian sediments east of the Whitelaw Fault. The sandstone-dominated sequence has been intruded by a granitic stock that measures 250m by 200m at surface, and by several quartz porphyry dykes up to 1.5m wide, both of which may be related to the Upper Devonian Harcourt Granodiorite.
Gold was first discovered in the Myrtle Creek area in 1858 and sporadic mining for alluvial and quartz reef gold occurred up until the 1930's. Production from the goldfield is not well recorded, but James (2005) reported quartz reefs grading 1-2oz Au per ton. Modern exploration in the general Myrtle Creek area has occurred since 1974 by companies such as Noranda Australia (rock chip sampling, geological mapping, soil geochemistry (Au, Cu)), Ghana Gold (structural interpretation of aerial photography) and BHP (stream sediments and follow up soil surveys). Perseverance explored the area from the mid 1990's to 2006, completing regional stream sediment, rock chip and soil sampling, geological mapping and petrographic work on rock samples. Northgate explored the area between 2008 and 2009, undertaking additional surface sampling in the northern area of historical workings, but the results were disappointing with the overall tenor of gold-in-soil much lower than observed elsewhere on the prospect.
In 2009 Northgate drilled 10 diamond holes (totaling 1,695m) at Myrtle Creek to test a number of proposed mineralization settings including intrusion-related, fold-fault related, dyke-related and disseminated styles. Much of the drilling was centered about a 600m long by x 200m wide NW trending Au-Mo soil geochemical anomaly centered on the granite stock (Quartz Hill). The drilling, reported by Dean (2010), gained financial support of a drilling grant from the Rediscover Victoria Strategic Drilling Initiative.
Two of the holes returned significant intersections of gold mineralization are reported and interpreted to be from the NE trending New Amelia Mine Shear; Down-hole widths of 10.9m @ 2.0 g/t Au from 0.9m (incl. 6.0m @ 3.1 g/t Au from 4.0m) in hole MCD004 and 8.0m @ 1.9 g/t Au from 84.0m (incl. 2.0m @ 5.2 g/t Au from 88.0m) in hole MCD006.
Anomalous gold (7.61 g/t Au peak) and molybdenum (2,882 ppm) were encountered throughout much of the prospect, particularly in proximity to the granite. Visible gold was observed twice within sheeted quartz veins and there appears to be a strong intrusion-related Au-Mo-As correlation. A significant nugget-effect may be present given the presence of coarse gold and frequent highly anomalous As/Mo results without corresponding elevated gold.
The drilling at Myrtle Creek indicates that gold occurs in structurally controlled shears and is not disseminated widely through the wall rock. This fact caused Northgate to suspend exploration on the prospect. However, the drill intercepts on the New Amelia Shear remain untested along strike and down-dip and this prospect is to be further reviewed by Kirkland Lake Gold in the future.
94
| Technical Report | Kirkland Lake Gold |
| December 2016 | Fosterville Gold Mine |
| 10.7.6 | NORTHERN AREA |
The EL3539 Northern Area refers to the region north of the Goornong Township to the northern extents of the Exploration License. Previous exploration within the Northern Block was initially limited to
BHP/Homestake exploration for northern extensions of the Fosterville and O’Dwyer's Faults. However, in the 1990's PSV carried out an extensive program of roadside geochemical sampling from which sporadic gold anomalies were defined and followed up by infill RAB and shallow RC drilling (an example of this being May Reef – best intersection of 2.0m @ 3.7 g/t Au).
The existing geochemical dataset, although widespread, does not presently cover the eastern portion of EL3539 where the area is now considered prospective for gold owing to its position in relation to the Redesdale Fault corridor.
The existence of the Redesdale Fault was first proposed in late 2009 by the Geological Survey of Victoria and is supported by the 2006 State seismic transect (which passes north of EL3539), geological mapping near Redesdale and interpretation of State and Northgate gravity data. The interpretation importantly defined a number of gravity highs within the Redesdale Fault corridor, corresponding with known areas of gold mineralization including the Fosterville and O’Dwyer's Fault Systems. This identified relationship is the basis for proposing future RAB drilling between the Goornong South and May Reef Prospects where similar, but less well-defined gravity anomalies are present.
| 10.7.7 | REDESDALE FAULT CORRIDOR |
The current understanding of the underlying structural architecture in the Fosterville region provides opportunities for renewed greenfields exploration activity in relation to regional gold prospectivity. For instance, there are a number of faults interpreted and mapped in the region that appear to have similar trends as the Fosterville Fault and abut the west side (hangingwall) of the Redesdale Fault. Examples within Kirkland Lake Gold tenements include the Sugarloaf, O'Dwyer's and Drummartin Faults as well as other faults interpreted north of MIN5404 from Goornong South through the Northern Area to the May Reef gold occurrence.
Exploration will use the existing geophysical (airborne magnetics and radiometrics, gravity, ground IP), drilling and surface geochemical datasets to support renewed gold focused exploration activity in the Fosterville region.
| 10.7.8 | RUSSELL'S REEF |
The Russell's Reef Prospect is located within EL3539, approximately 2.4km south of the Fosterville Mine Lease. See Figure 9-1. The prospect is based on shallow historical shafts and pits spread over about a 250m north-south extent. Recorded historical production in the area totals 417oz from the 1897-1900 period of mining.
The area has been subjected to several lines of soil sampling, and several programs of shallow RC drilling (50 holes averaging 31m depth) undertaken over a protracted period from 1976 to 1989. Perseverance subsequently drilled nine diamond holes in 2006 to test for Fosterville style sulfide hosted gold mineralization. Three of the nine diamond holes returned drill intercepts averaging above 3.0 g/t Au.
95
| Technical Report | Kirkland Lake Gold |
| December 2016 | Fosterville Gold Mine |
These included:
|
• |
RRD006: | ||
|
- |
4.0m @ 6.1 g/t Au from 48.0m (incl. 2.0m @ 9.4 g/t Au from 49.0m) | ||
|
• |
RRD005: | ||
|
- |
10.4m @ 2.2 g/t Au from 57.8m, | ||
|
(incl. 4.3m @ 2.9 g/t Au from 57.8 and 2.3m @ 3.1 g/t Au from 65.9m) | |||
|
• |
RRD007: | ||
|
- |
10.7m @ 3.1 g/t Au from 141.5m, | ||
|
(incl. 0.9m @ 7.5 g/t Au from 147.1m and1.4m @ 12.3 g/t Au from 150.8m) | |||
Owing to Perseverance's drilling being heavily focused on exploration targets within the Fosterville Mine Lease, no follow up diamond drilling was undertaken at Russell's Reef.
| 10.7.9 | SUGARLOAF RANGE |
The Sugarloaf Prospect area encompasses the entire length of the Sugarloaf Range, a ridge of steeply dipping sandstone and quartzite located immediately west and southwest of the Fosterville Mine Lease. The prospect area is mostly within the Sugarloaf Nature Conservation Reserve.
A compilation and interpretation of available drilling and geochemical data in conjunction with interpretation of FGM’s airborne geophysical data (acquired in 2008) and consideration of Geoscience Victoria’s (GSV)
Redesdale Fault Model indicates potential for Fosterville-style gold mineralization within the prospect area.
Exploration data in the area includes surface geochemistry, RC drilling, airborne magnetics and radiometrics and ground IP. However, it should be noted that historical (1989-1991) drilling of 36 RC holes (totaling 1,164m) in the area averages only 32m in depth and diamond drilling is absent.
Ground IP/resistivity data, collected in 2010, maps resistive chargeability anomalies beneath the Sugarloaf Range and between the range and the Fosterville Fault. In addition to this an airborne radiometric K/Th ratio anomaly in the southern part of the prospect may represent a potassium alteration halo proximal to faulting. The K/Th ratio anomaly also has a coincidental and similar trend to the Sugarloaf Fault IP chargeability anomaly. The chargeability anomaly could be caused by the presence of subsurface black shale stratigraphy and/or sulfides.
Kirkland Lake Gold will review the prospect with the intent of undertaking ground exploration at the prospect in the future.
96
| Technical Report | Kirkland Lake Gold |
| December 2016 | Fosterville Gold Mine |
11 SAMPLE PREPARATION, ANALYSES & SECURITY
| 11.1 | SAMPLING METHOD AND APPROACH |
For the period 1987-1991 (Bendigo Gold Associates, then Brunswick), drilling used a cross over type hammer and significant down-hole contamination is suspected for some holes below the water table where the rig was unable to produce dry samples. This drilling method is likely to have produced a relatively poor sample quality. During this time RC drill samples were collected at one meter intervals using ‘spear’ sampling. Although this sampling method is likely to have produced a relatively poor sample quality, the drilling was confined to oxide pits that have subsequently been mined and so is not relevant to the Resources and Reserves included in this report.
From the acquisition of the project by Perseverance in 1992 through to the present, all RC drilling through mineralization has been collected at one meter intervals and sampled as two meter composite samples. Prior to 1995, samples were collected using ‘spear’ sampling. Since 1995 all RC holes have been sampled using a riffle splitter split to either 12.5% or 6.25% depending on the drill hole diameter. After 1996, if the sample was unable to be kept dry the hole was finished with an NQ2 diamond tail. In the central area, spear samples comprise 16% of all mineralized samples and 28% of all mineralized RC samples. All RC holes were completely sampled.
As part of the 1997 Feasibility Study several of the FO prefixed holes (see Table 10-1) with long, high-grade intersections were twinned with RC holes drilled with a much bigger compressor and a face sample hammer resulting in dry samples. These twin holes demonstrated that there was significant down-hole contamination in the FO holes (Perseverance, 1997). As a result, the FO holes were only used for estimating oxide resources and reserves where it is assumed that dry samples were recovered and down-hole contamination was not an issue.
In the diamond drill core, all visible sulfide mineralization, quartz vein stockworks and LQ veins plus at least three meters of apparent waste either side is sampled. Samples are cut to geological boundaries and within a length range of 0.05m to 1.3m, with a preferred length of one meter. Infill diamond holes (spaced at 25m or less) are full core sampled; the entire core sample is broken with a hammer in the tray and moved directly into the sample bag. All other core is halved using a diamond saw and the upper half of the core dispatched for analysis and the lower half returned to the core tray in its original orientation. The PQ core was sampled by cutting a sliver equivalent in volume to half NQ2 core from the top of the core. Recovery of diamond drill core is acceptable where it is determined that over 90% recovery for a run has been achieved. If recovery is proven to be less due to core loss or because of poor ground, the samples may not be used for Mineral Resource estimation.
In underground sampling, an attempt is made to sample every round (3 to 4m nominal advance) in the ore- drives where safe to do so. Sample intervals are chosen based on structure, mineralization and lithology, and are a minimum of 0.1m and a maximum of 1.5m in length. Mapping data that was collected at the same time as the samples is used to validate the sample results.
Figure 11-1 includes some 576 duplicate face sample pairs were collated including face sample duplicates taken on the Phoenix 4380mRL and the Phoenix 4280mRL. With outliers removed, the duplicates show a moderate correlation with an R2 of 0.6402. This study covered the underground face sampling method used throughout the mine since ore driving commenced in late 2006 to ore driving completed to the end of 2016. Face sampling data is used to refine resource domain boundaries. Sample grades from face sampling are not used in the resource estimation process.
97
| Technical Report | Kirkland Lake Gold |
| December 2016 | Fosterville Gold Mine |

Sludge holes are bored with 54mm diameter drill bits and sampled at two meter composite intervals giving a weight of between 2kg to 5 kg per sample. Cuttings are collected by a custom designed apparatus to maximize the catchment area to improve sample quantity/quality. Samples are inspected for quartz percentage, non-carbonate carbon content, sulfides present and lithology. Due to the poor quality of the samples, sludge samples are not used directly in resource estimations but may be used to define domain margins.
All remaining diamond drill core is stored on site within the fenced and gated core handling facility or within the mine compound on the backfilled Falcon Pit storage area. Assay sample pulps are also returned from the laboratory and stored at the core handling facility.
The RC samples from previous grade control programs were kept at an onsite depot for approximately three months after the receipt of final assay results. This allowed time for any re-sampling that might be necessary. The plastic sample bags photo-degrade rendering re-sampling impossible after six to 12 months and presenting an environmental hazard from windblown plastic, therefore the sample bags are disposed of as part of routine site rehabilitation works. Exploration RC pre-collar samples were collected in hessian sample bags since 2005 and similarly retained for a three-month period at the drill sites. Hessian was chosen as it poses less of an environmental hazard and allows for mechanical rehabilitation of drill sites.
98
| Technical Report | Kirkland Lake Gold |
| December 2016 | Fosterville Gold Mine |
| 11.2 | ELEMENTS ANALYZED |
TABLE 11-1 ANALYSED ELEMENTS BY METHOD AND TIME PERIOD
| Element/ Analysis |
Reason for Analysis | Sample selection/Method/Timing |
| Au | Primary Commodity | All samples 25g Fire Assay,
except: fresh (non-oxide) rock until December 2004 (40g FA) oxide samples until December 2004 (25g Aqua Regia digestion, AAS) production drill core sent to GAL in 2012-2016 (30g FA) some Robbin's Hill Exploration RC and drill core sent to ALS in 2007 (40g FA), pulps sent to Bureau Veritas in 2016 (40g FA). |
| As | Toxic to BIOX® | Analysed since August 1995.
All Exploration drill samples 1995 - 2016. Metallurgical diamond drill samples in 1997. Blasthole sampling sulfide open pits 2004 - 2007. Underground face sampling 2008 - 2009. Stope sampling 2008 - 2009. ICP-AES Select stope samples only 2016. All by ICP AES, except: Aminya 2001 - 2006 (AR50) ALS Bendigo 1994 - 2002 (AAS) |
| S | Primary feed for BIOX® | All Au values over 0.5 g/t
August 1995 to May 2001. All Exploration drill samples by ICP AES 2001 to 2016. Sulfide open pit grade control and blast holes by ICP 2005 – 2006. All production drilling and underground sampling by LECO or equivalent (IR detection), 2006 - 2009. Production drill core samples on significant Au intercepts from 2009 - 2016. All open pit sulfide grade control RC and blast holes, 2006 - 2007. Selected blast holes 2011. All underground face samples 2006 - 2009. Selected sludge holes 2007 - 2008. Selected stope samples 2007 - 2009. Selected open pit sulfide grab samples 2011. All open pit sulfide RC samples 2012. |
| Sb | Toxic to BIOX®, indicator for high-grade Au | For all Au values over 0.5 g/t
August 1995 to May 2001. From 2001, all Exploration core routinely. Production samples only where stibnite observed. ICP AES except: AAS on RC drilling by ALS Bendigo 1999. 50g Aqua Regia digest with AAS finish. 2002 - 2006. XRF by Amdel 2006 - 2007 >0.6% ICP-AES derived Sb grade then OSLS modified triple acid digest with AAS finish 2013 - 2016 Production core submitted to GAL 2015/2016 with stibnite observed, Aqua Regia/AAS (<10%) and Acid Digest/Titration (>10%) |
| NCC/TOEC | Organic carbon is preg-robbing and competes with activated carbon in CIL recovery. Historically an effective indicator for preg-robbing potential. |
IR detection, LECO or
equivalent carbon/sulfur analyser. All Au values over 0.5g/t August 1995 to May 2001. Since 2001 only where high carbon content is observed. Sulfide open pit grade control and blast holes only selected samples 2006 - 2007. |
99
| Technical Report | Kirkland Lake Gold |
| December 2016 | Fosterville Gold Mine |
| Element/ Analysis |
Reason for Analysis | Sample selection/Method/Timing |
| Selected sludge samples 2006 -
2016. Selected stope samples 2007 - 2010. 2012 - 2016. Selected face samples 2007 - 2010. 2012 - 2016. | ||
| Preg- Robbing Activity |
Method developed by Fosterville
Metallurgy and provided to OSLS to perform at scale, where NCC is not an adequate proxy. Some ore is low NCC but high preg-robbing. Some ore is low preg-robbing despite high NCC. |
Selected face samples 2014. Selected stope samples 2014 – 2016. |
| 11.3 | DESCRIPTION OF ANALYTICAL TECHNIQUES |
All of the gold analyses used in the sulfide resource model in the 2000 Sulfide Feasibility Study were fire assays of a 40g charge carried out by ALS at Bendigo, a commercial laboratory (non-accredited). The other elements were analyzed by a variety of techniques at a variety of laboratories. A full program of repeats, standards and inter-laboratory check sampling was conducted on the gold analyses.
For the 2001 – 2004 NQ2 SPD diamond drilling campaign, gold analyses were determined by fire assay of a 40g charge by AMDEL in Adelaide, a commercial laboratory (ISO 9001 accredited). A 30 element suite including As, S and Sb was analyzed by ICP-AES from a separate 5g charge following HNO3/HF digestion. From November 2002 to August 2003 TGC (total graphitic carbon) was analyzed on a selective basis. A full program of repeats, standards and inter-laboratory check sampling was conducted on the gold analyses.
Since 2005, independent On Site Laboratory Services (OSLS), a commercial laboratory based in Bendigo, has been the primary provider of analytical services to the operation. The OSLS Bendigo laboratory gained ISO 9001 accreditation in October 2008 with registration ISO9001:2008 (CERT-C33510).
OSLS use a combined crusher and mill to pulverize the entire sample to a nominal 90% passing 75µm. A 25g sub-sample is analyzed for gold by fire assay with an AAS finish. A 0.5g sub-sample of the pulp is digested in a HNO3/HCl digest and then analyzed for Ag, As, Bi, Ca, Cu, Fe, K, Sb and S by ICP-AES. A full program of repeats, standards and inter-laboratory check sampling was conducted on the gold analyses.
An audit of the OSLS facility was completed for Perseverance by an external consultant during 2007 (Stewart, 2007). This audit found that OSL’s procedures were adequate and presented no major risk to the resource estimate. There were areas for improvement identified with the following corrective actions taken during the second half of 2007:
- Temperature variation within the drying oven is now being measured and recorded;
- Sizing analysis for all pulps is now being conducted and recorded;
- Calibration of scales is now being recorded and documented;
- Further improvements also included AAS electronic data capture in 2011; and
- Fosterville staff has formal monthly laboratory meetings to discuss performance.
Work undertaken by employees of Fosterville is limited to core logging and the mark-up, cutting and bagging of samples. All other sample preparation and analysis was conducted off-site at the commercial laboratories.
100
| Technical Report | Kirkland Lake Gold |
| December 2016 | Fosterville Gold Mine |
Since April 2015, Gekko Analytical Laboratories (GAL) have been contracted to provide analytical services for diamond core and underground face samples. Analytical techniques include fire assay for gold, titration and atomic absorption spectrometry for Antimony, combustion analysis and Infrared detection for both sulfur and Non-organic Carbon. Gekko Analytical Laboratories gained National Association of Testing Authorities, Australia accreditation (NATA) in October 2015 with accreditation number, 19561.
All samples are dried at approximately 105 degrees C. GAL uses a Jaw crusher to crush the sample material to 8mm. The sample is then placed within a Boyd crusher and rotary splitter combination to enable further crushing to 3mm and optional splitting of the sample if it weighs in excess 3kg. Pulverization takes place with up to 3kg of sample to achieve 90% passing 75um. Sizing is reported with Au assays at 1:20 frequency. Approximately 120g of pulverized sample is scooped into a wire and cardboard pulp packet. Two pulp packets are created as a lab duplicate at a frequency of 1:10. A 25g scoop of sample is taken from the pulp packet and smelted with 180g flux. A 10g scoop from the pulp is re-fired for comparison if the initial grade was determined at >50g/t. Antimony is analyzed by using an aqua regia digestion with an AAS finish. If the result is over 1% Sb, the sample is then analyzed by an acid digestion and titration. Total sulfur is analyzed using combustion analysis followed by Infrared detection. Non-Carbonate carbon is analyzed by weak acid digest and combustion analysis followed by Infrared detection (LECO).
A laboratory audit in June 2015 was conducted by FGM personnel at the GAL Ballarat facility. Its primary focus was to assess the preparation and handling of FGM’s sample material through the GAL laboratory and to observe the data and material handling process. No major risks were observed.
Due to commercial reasons, GAL laboratories and Fosterville Gold Mine ceased conducting business together in April 2016. Some left over analytical work continued until shortly after this time. On Site Laboratory Services have since serviced Fosterville Gold Mines’ production and diamond drill sample requirements.
| 11.4 | QAQC |
Fosterville uses independent assay laboratories, which provide assay data in digital form. Since July 2007 OSLS has been the main assay laboratory used to assay drill and grab samples. GAL received a percentage of diamond core samples and all production face samples from April 2015 through June 2016.
Quality Assurance and Quality Control (QAQC) are completed on sampled after being imported into the database. Assays not passing the QAQC tolerances on blanks, standards, duplicates and repeats are retained in the database but are not available for viewing or Resource work within Mine Sight. Where it is determined the sample itself is compromised, rather than the analysis, then the sample is demoted and its assays also are not reported Mine Sight or other applications.
Any values falling beyond defined quality parameters are investigated according to laboratory and company procedures. Sufficient proof or suspicion of error requires re-assays on the affected portion of a job, where the original assays are rejected, and the results from the subsequent batch (provided these pass QAQC processes) are used instead.
The QAQC review process has been improved and developed over the years. The system comprises four main strands with the reliance on standards (certified reference materials), duplicates, repeats and blanks samples. Each strand is summarized below.
101
| Technical Report | Kirkland Lake Gold |
| December 2016 | Fosterville Gold Mine |
| 11.4.1 | STANDARDS |
Drilling programs up to the end of 2007 included the use of four gold mineralized standards provided by Gannet Holdings Pty Ltd (ST148, ST109/0285, ST73/7192 and ST43/7194) and one standard prepared from approximately 500kg of Fosterville sulfide mineralization from previous RC drilling (AA). Over time the use of gold mineralized standards from Gannet Holdings Pty Ltd has diminished, with alternative suppliers being favored.
Since 2008, a further 22 gold standards have been adopted for use at Fosterville, with 18 of these still available for use. Of these available standards, only a small selection is “active” (in use) at any one time, to ensure each provides a sufficiently large dataset month to month with which to effectively assess laboratory performance with respect to bias, variation, and any change in trend of these factors. Each standard remains in use for several consecutive months to gauge trends over the longer term, before gradually being replaced with a different standard with a similar mean. Active standards are rotated occasionally to prevent predictability of expected means and to demonstrate that standards are being accurately analyzed.
FGM purchase “fit for purpose” standards from Geostats Pty Ltd as certified reference materials. Unlike laboratory standards these standards are submitted for analysis in particular order with a lab consignment so as to better test the laboratory’s accuracy at different grade ranges. FGM standards are inserted at a rate of about one in forty, and have a wide range of gold grades extending from less than 0.3 g/t Au to about seven times the average ore grade expected at Fosterville. (Details are not given due to data integrity reasons).
OSLS have included lab standards with assay results since August 2012. All GAL jobs have been reported with lab standards.
Table 11-2 documents the lab standards reported by OSLS in 2016, along with the nominal ranges used to validate them.
TABLE 11-2 OSLS LABORATORY STANDARDS, g/t Au
| STANDARD ID |
Expected Mean |
Mean – 3SD |
Mean + 3SD |
| ST345 | 0.055 | 0.040 | 0.070 |
| ST588 | 1.61 | 1.49 | 1.73 |
| ST37/6373 | 1.69 | 1.48 | 1.90 |
| ST643 | 4.92 | 4.50 | 5.34 |
| ST507 | 4.94 | 4.55 | 5.33 |
| ST484 | 7.49 | 6.74 | 8.24 |
Table 11-3 GAL Laboratory Standards, g/t Au documents the lab standard reported by GAL in 2016, along with the nominal ranges used to validate them.
102
| Technical Report | Kirkland Lake Gold |
| December 2016 | Fosterville Gold Mine |
TABLE 11-3 GAL LABORATORY STANDARDS, g/t Au
| STANDARD ID |
Expected Mean |
Mean – 3SD |
Mean + 3SD |
| ST528 | 0.51 | 0.42 | 0.60 |
| ST484 | 7.52 | 6.62 | 8.42 |
| ST725 | 12.38 | 11.00 | 13.76 |
| ST448 | 13.29 | 11.52 | 15.06 |
As recommended by QG (Quantitative Group Pty Ltd), reported populations associated with a given laboratory/method are intermittently reviewed against certified ranges. Where populations are sufficiently large (usually greater than 400 assays) the mean and standard deviation of the reported population is calculated, and these are used to assess the standards performance, in place of the certified values, for that laboratory/method.
| 11.4.2 | LAB DUPLICATE SAMPLES |
Laboratory pulp duplicates are provided as part of internal lab QC as an indication of preparation/pulverization homogeneity, but may also indicate random analytical errors. Laboratory duplicates are selected at random at a rate of approximately one in ten and constitute a second ~200g subsample taken from the pulveriser. From this stage of lab preparation, the duplicate is treated as an additional sample and undergoes the same process at the same time as the original aliquot being used to represent the submitted sample.
Fosterville sulfide samples have historically shown to be highly repeatable.
A review of OSLS laboratory duplicate data collected from 2012 to 2015 found a very strong correlation with an R2 of 0.98. GAL lab duplicate data collected during 2015 had an R2 correlation coefficient of 0.94.
In 2016, the combined dataset of OSLS and GAL 25g Fire Assay duplicates on primary sulfide samples totaled 915 (Figure 11-2). This figure excludes results less than 10x lower limit of detection. Bias was insignificant (-0.83%) with an R2 of 0.997. 85.79% were within 10% AMPRD and 96.5% were within 20%.
103
| Technical Report | Kirkland Lake Gold |
| December 2016 | Fosterville Gold Mine |

In 2016, the OSLS 25g Fire Assay repeats on primary samples dispatched as ‘VG’ samples totaled 121, and included values up to 2,497 g/t Au (Figure 11-3). Bias was insignificant (-0.96%) with an R2 of 0.966. 72.73% were within 10% AMPRD and 84.30% within 20%. GAL did not analyse any ‘VG’ samples in 2016.
104
| Technical Report | Kirkland Lake Gold |
| December 2016 | Fosterville Gold Mine |

| 11.4.3 | LAB REPEAT (REPLICATE) SAMPLES |
Laboratory repeats are additional fires from the original pulp run in a subsequent fire. At OSLS, the lab repeats are specifically performed on a different day and by a different fire assay technician than those of the originals. At GAL, the fire was run on a different day, but there is no explicit requirement for a different technician to perform each fire. Repeats are required to be selected, run and reported by the laboratory before finalized results can be released to the FGM. Repeats may additionally be requested on specific samples at the client’s request and reported as an amendment, in support of the original values.
In 2016, lab repeats, not flagged as Visible Gold or potential, show insignificant bias (0.27%) and a strong correlation with an R2 of 0.963, from 2,501 pairs. This represents both the GAL and OSLS datasets combined and excludes results less than 10x lower limit of detection. 93.56% of these are within 10% AMPRD, and 99.65% within 20%. This dataset includes a small handful of notable outliers above 40 g/t Au, with differences such as 44.1 g/t Au vs 105.9 g/t Au (82.4% AMPRD) and 126.4 vs 73.3 g/t Au (53.2% AMPRD). It is likely that these samples were not identified at the logging stage for their potential to host coarse gold (Figure 11-4).
105
| Technical Report | Kirkland Lake Gold |
| December 2016 | Fosterville Gold Mine |

Laboratory Repeats from 2016, which were flagged for Visible Gold or potential show insignificant bias (0.21%) and correlate strongly, with an R2 of 0.981 from 425 pairs (threshold 10x detection). 95 of these pairs (or 22.34%) have an assay at 200 g/t Au or more. 61.64% of the 425 pairs were within 10% AMPRD, with 82.35% within 20% (Figure 11-5).
106
| Technical Report | Kirkland Lake Gold |
| December 2016 | Fosterville Gold Mine |

| 11.4.4 | BLANKS |
Field blanks were historically not used because there is a sharp visual grade contrast between mineralization and waste, which provides a natural blank. However, in 2009 the use of field blanks was adopted to assess quality control of the sample preparation; i.e. to test for contamination from one job to the next and also from sample to sample within the job. These were produced by half core sampling 1.2m intervals of barren material. Intervals showing less than 0.03ppm were then split into 0.3m lengths, with each constituting a ‘field blank’. From October 2012, this process was refined and original 1.2m samples were analysed at ppb levels, for more precise determination of values below 0.03ppm/30ppb. A minimum of two field blank samples is inserted into each diamond drill hole sample batch. At least one field blank sample is inserted at the beginning of the job, with others inserted between mineralized samples.
In the period June 2014 – February 2016 interstitial blanks were routinely inserted within zones containing potential or observed visible gold as an attempt to control and quantify contamination between samples. From February 2016 this process was improved by instead inserting quartz wash samples between samples of potential or observed coarse gold, with blanks occasionally following these to verify the effectiveness of the quartz wash.
Since August 2012 laboratory blank samples have been imported and assessed as part of the FGM QAQC process for drill core. OSLS reports blanks in Au Fire Assay only, where barren flux is fired in a new pot. Elevated grades will usually either indicate drift in calibration, or contamination during fire assay. All elemental analytical methods requested by GAL have been reported with laboratory blanks.
107
| Technical Report | Kirkland Lake Gold |
| December 2016 | Fosterville Gold Mine |
| 11.4.5 | FIELD DUPLICATES |
Half core samples (cut in half longitudinally by diamond tipped saw blade) are duplicated at a rate of about one in every 80 samples per drill hole. The second half of core, usually discarded after a time or retained indefinitely for reference, is submitted blindly to the laboratory and processed like any primary sample within the same job. These test the sample representivity of the Fosterville half core sampling process and quantify the nugget effect.
Field duplicate data collected over the 2013 – 2015 period showed an R2 value of 0.96 with no apparent bias.
Field duplicates from 2016 (Figure 11-6) on sulfide samples represent 436 pairs, with insignificant bias (-0.97) and an R2 of 0.922. Excluding two extreme outliers, which are believed to contain unobserved coarse gold, the R2 becomes 0.980. Au grades peak at 28.8 g/t, supporting the hypothesis that 30 g/t is close to the upper limit for arsenopyrite-hosted gold mineralization at Fosterville, and that grades beyond this include, or consist of, different phases and styles of mineralization.

| 11.5 | ANALYTICAL TECHNIQUE VERIFICATION |
During 2016 various analytical testing was conducted to ascertain the accuracy of using the FA25g analysis technique employed at FGM with respect to the suitability of it in high-grade visible gold resources and, also to check the accuracy of the main service provider of analytical services to the mine.
108
| Technical Report | Kirkland Lake Gold |
| December 2016 | Fosterville Gold Mine |
| 11.5.1 | COMPARISON OF ANALYTICAL TECHNIQUES |
During May to July 2016 a series of stope samples were collected from three stoping panels on the P4240mRL. Each stope sample was collected as a truck dump grab from the ROM. The sample were approximately 3-5kg mass in a calico bag as per standard mine geology practice. In addition to each sample being tested using the FA25g technique (see section 12.3) the pulp created for each sample was further tested for gold by fire assay with a 50g charge (FA50) and by Screen Fire Assay (SFA) techniques. The bulk of the same sample (sample mass minus pulp mass) was sub set to ~3kg (maximum) and 2kg of mass were then analysed by Leach well with the tail residue being analysed by FA25. The analysis type was selected in order of increasing sample analysing mass (sample support) to detect any analytical bias introduced by FA25.
Quantitative Group Pty Ltd consultants (2016) reviewed the stope sample data and commented regarding the limitations regarding stope sampling ROM material in that the bias represented between FA25 and Leachwell (for example) may be exacerbated. Notwithstanding this, the results do suggest that although the averages of each data set are very similar, there is a change in the nature of the correlation of the data, particularly between the FA25 and the LW data sets. There seems to be a positive conditional grade bias of the FA25 data over the other three methods with assays exceeding 20 g/t Au (Figure 11-7).
Further work will be undertaken to ascertain the worth of investigating this analytical bias and to seek the best industry practice as a standard for FGM.
109
| Technical Report | Kirkland Lake Gold |
| December 2016 | Fosterville Gold Mine |

| 11.5.2 | VISIBLE GOLD DUPLICATE SAMPLE COMPARISON |
During 2016, some 81 remaining half core intervals were selected from diamond core tested quartz lode zones, many of them containing visible gold. A FA25 sample was analysed from each half of the core, similar to the normal QAQC field duplicate protocol as mentioned in section 11.4. This project was to augment the small population of field duplicates already taken in quartz lode zones so as to determine the homogeneity of the FA25 analyses from each half of the selected intervals.
110
| Technical Report | Kirkland Lake Gold |
| December 2016 | Fosterville Gold Mine |

Figure 11-8 shows a raw correlation of the VG field duplicate data set (excluding a handful of extreme outliers) where even without a regression model added, a change in the correlation of the data can be discerned over the 30-40 g/t Au grade level between the two field duplicate samples. Visible gold prepping procedures were identical for all of the samples as was the analysis method. At this point FGM geology believes that there is a connection between the FA25 assay bias (Figure 11-7) and the lack of sample correlation as discerned in Figure 11-8. From this data analysis there are geological and analytical implications that require further work to identify whether sample preparation and or analytical methodology are still fit for purpose for predicting grade in high-grade areas of the FGM Mineral Resource.
| 11.5.3 | UMPIRE LABORATORY CHECKS |
Confidence in analytical accuracy is further assessed by re-submitting pulps from one laboratory to another and comparing differences in results. Such a program is usually done at least every few years.
A program of inter-laboratory checks was undertaken in 2002 comparing the AMDEL results to two other commercial laboratories – Aminya Laboratories Pty Ltd (Aminya) and Genalysis Laboratory Services (Genalysis). The two batches (147 samples) sent to Aminya returned an average of 9% higher with an R2 correlation coefficient of 0.993. The Genalysis results were 2% lower with an R2 correlation coefficient of 0.996. The inter-laboratory check samples range in grade from below detection (<0.01 g/t Au) to 45 g/t Au. This inter-laboratory check data is presented in Allwood (2003).
111
| Technical Report | Kirkland Lake Gold |
| December 2016 | Fosterville Gold Mine |
During 2013, the OSLS 25g Au Fire Assay method was compared against GAL’s 50g Au Fire Assay method. All 245 samples showed an overall bias of only 2%, with an R2 correlation coefficient of 0.988.
In 2016, 82 samples were selected from various domains and their pulps submitted for umpire testwork at Bureau Veritas Minerals (Adelaide) (BV). A summary of the ore sources is shown in Table 11-4.
TABLE 11-4 UMPIRE SAMPLING BY ZONE.
| Zone | Sulfide | Visible Gold | Total |
| Eagle | 20 | 23 | 43 |
| Harrier | 15 | 5 | 20 |
| Phoenix | 13 | 7 | 20 |
| Total | 48 | 35 | 83 |

A correlation of FA samples from Bureau Veritas (BV) and Onsite Laboratory Services (OSLS) laboratories comprises the OSLS 25g Fire Assay method and the BV 40g Fire Assay method (Figure 11-9). Following transportation, the pulps (sourced from OSLS) were re-homogenised at BV by mat roll so as to avoid smearing and contamination in the pulveriser. Small population size should be taken into consideration when reviewing the following statistics, however the ‘Sulfide’ subset (n = 48) shows insignificant bias (0.957%) and an R2 of 0.997. Apart from a few high-grade results showing significant variation, there is a very good correlation with the results, even considering the differences in charge weight and slight acid digest differences.
112
| Technical Report | Kirkland Lake Gold |
| December 2016 | Fosterville Gold Mine |
| 11.6 | SAMPLE AND DATA SECURITY |
| 11.6.1 | SAMPLE SECURITY |
The methods of sample storage and transport have remained largely unchanged throughout the life of the project.
Samples are bagged and numbered either on site at the drill rig or at the FGM core handling facility.
Samples sent to laboratories outside Bendigo were in plastic bags in lots of about five and transported using the laboratory’s pick up vehicles. On arrival at the laboratory, the list of samples sent is matched to the actual samples received and confirmation is sent by either fax or email using a sample consignment system.
Analytical laboratories have operated in Bendigo during the periods 1992 – 2000 and 2005 to present. During these periods individual samples from the drill rig or core shed have been placed in a designated area within the mine security gate and collected daily by laboratory staff. Again, on arrival at the laboratory, the list of samples sent is matched to the actual samples received and confirmation is sent by either fax or email.
Work undertaken by employees at Fosterville is limited to core logging and the mark-up, cutting and bagging of samples. All other sample preparation and analysis is conducted off-site at commercial laboratories.
| 11.6.2 | DATA SECURITY |
Data security is ensured through the use of an ‘acQuire/SQL Server’ database of all company exploration drilling information. This database includes all assays, geological and geotechnical information. As well as data interrogation, the database allows automated error checking as new data is entered. The database is backed up in full daily, and incrementally four times a day.
Access to the database is controlled by user login permissions and the acQuire software.
| 11.7 | ADEQUACY OF PROCEDURES |
It is the opinion of the Authors that the sample preparation, security and analytical procedures are adequate and have been appropriately applied over the life of the project to ensure that the data is representative and of high quality.
113
| Technical Report | Kirkland Lake Gold |
| December 2016 | Fosterville Gold Mine |
12 DATA VERIFICATION
| 12.1 | DATABASE VALIDATION |
The drilling carried out by previous owners at Fosterville routinely included quality assurance and quality control checks. The nature of these checks evolved through time and these are described below. In addition, sampling QAQC consultants SMP Consultants reviewed the sampling, analytical and data storage procedures used in drilling programs to May 2002 (Crase, 2002). Data system reviews of the exploration database were also undertaken by IO Digital Systems in 2004 and 2006 (Kelemen, 2004; McConville, 2006).
The database includes numerous automated data validation methods. The database structure and the use of primary key fields prevent certain types of invalid data (e.g. overlapping sample intervals) from being stored in the database. Also, numerous checks are performed on the data when it is imported (e.g. assay QAQC performance gates, variation in down-hole surveys from previous survey).
Prior to 2000, the geological data was entered directly into the database by hand from the original hardcopy geological log with a manual validation system. From 2001 until 2008, all geological data was uploaded directly from IPAQ hand held logging devices into the database with similar automatic checks as used for the assays. Immediately after the IPAQ was uploaded a hard copy of the geological log was printed to provide an extra back up of the data. Since 2008 geological information has been entered into laptops running acQuireTM offline logging software. This software supports an increased range of logging validation that prompts the user while logging and also prior to uploading of the logged data into the Fosterville Geological SQL database.
The down-hole drilling survey data, between 2001 and 2010, was the only data hand entered into the Fosterville geology database. Allwood (2003) reports a program conducted in 2002 where approximately 10% of the SPD holes were randomly selected for checking the database against the original survey shots. This check found several errors so it was decided to check the entire down-hole survey database against the original surveys shots. All errors found were corrected. Diamond drill hole (underground holes are prefixed by UD, UDE and UDH) traces are visually checked in MineSight software against the design trace, as soon as the down-hole surveys are entered into the database.
| 12.2 | DATA VERIFICATION |
In addition to the quality control and data verification procedures discussed in detail above, the Qualified Persons preparing the Mineral Resource estimates have further validated the data upon extraction from the database prior to resource interpolation. This verification used MineSight drill views as the primary tool to identify data problems. This allowed the omission of holes if they were of questionable quality, for example due to low quality sample techniques or incomplete assaying. When coupled with the more mechanical check processes ensuring high quality data is entering the database in the first place, these checks were effective in allowing the Qualified Persons to be confident that the data was geologically coherent and of appropriate quality and adequate for use in resource estimations and reserve studies.
114
| Technical Report | Kirkland Lake Gold |
| December 2016 | Fosterville Gold Mine |
13 MINERAL PROCESSING AND METALLURGICAL TESTING
Details of previous metallurgical test work conducted on a range of Fosterville ores can be referenced in the Fosterville Technical Report December 2015. Metallurgical test work is ongoing with particular focus on recoverability of gravity recoverable gold.
Several newly discovered geological structures at depth, such as Eagle, East Dipping and LPFW Faults, have gold in the form of coarse visible gold that frequently occurs with sulfide mineralization. In 2015, a series of plant trials and mineralogy surveys indicated that the visible gold is being recovered in the flotation concentrates (primarily Flash flotation concentrate) and is recoverable from this concentrate by gravity methods. A gravity gold circuit was commissioned in April 2016. The gravity circuit consists of a Knelson concentrator and Gemeni tables treating the recirculating load of the concentrate regrind mill.
In the opinion of the authors, all deleterious elements are effectively managed and it is considered that their presence does not have a significant impact on economic extraction. No identified processing factors have a significant impact on economic extraction.
115
| Technical Report | Kirkland Lake Gold |
| December 2016 | Fosterville Gold Mine |
14 MINERAL RESOURCE ESTIMATES
The Mineral Resources reported are broken down into areas contained within the mine lease MIN5404 (Section 4). Mineral Resource Areas of Central, Southern, Harrier and Robbin’s Hill (Table 14-1) are defined resource areas, which were established at different times in the projects history. The Central Area contains multiple Mineral Resource models primarily for reasons of data handling. Details on Mineral Resource block model extents can be seen in Figure 14-1.
CIL Residue Mineral Resources are distinguished from in-situ Mineral Resources in Table 14-1 on the basis of differing recovery assumptions.
The current Mineral Resource estimate for the FGM is presented below in Table 14-1.
116
| Technical Report | Kirkland Lake Gold |
| December 2016 | Fosterville Gold Mine |
TABLE 14-1 MINERAL RESOURCES (INCLUSIVE OF MINERAL RESERVE) FOR FGM AS AT DECEMBER 31, 2016
| Mineral Resources (Inclusive of Mineral Reserves) - Fosterville as at December 31, 2016 | ||||||||||
| Classification | Measured | Indicated | Inferred | |||||||
| Tonnes (kt) |
Grade (g/t Au) |
Insitu Gold (kOz) |
Tonnes (kt) |
Grade (g/t Au) |
Insitu Gold (kOz) |
Tonnes (kt) |
Grade (g/t Au) |
Insitu Gold (kOz) | ||
| Fosterville Fault Zone Sulfide Resources | ||||||||||
| Central Area |
Upper | 1,463 | 2.47 | 116 | 808 | 2.69 | 70 | 24 | 1.45 | 1 |
| Lower | 379 | 11.62 | 141 | 5,296 | 7.95 | 1,354 | 2,441 | 5.96 | 468 | |
| Southern Area |
Upper | 21 | 3.32 | 2 | 463 | 2.44 | 36 | 537 | 2.29 | 40 |
| Lower | 0 | 0.00 | 0 | 0 | 0.00 | 0 | 320 | 5.59 | 57 | |
| Harrier Area |
Upper | 0 | 0.00 | 0 | 0 | 0.00 | 0 | 0 | 0.00 | 0 |
| Lower | 8 | 6.50 | 2 | 2,861 | 7.46 | 686 | 593 | 4.70 | 90 | |
| Robbin's Hill Area Sulfide Resources | ||||||||||
| Combined | Upper Lower |
0 | 0.00 | 0 | 1,532 | 2.19 | 108 | 718 | 2.24 | 52 |
| 0 | 0.00 | 0 | 224 | 3.73 | 27 | 476 | 4.54 | 69 | ||
| Sulfide Upper | 1,484 | 2.48 | 118 | 2,803 | 2.38 | 214 | 1,279 | 2.25 | 92 | |
| Sulfide Lower | 387 | 11.51 | 143 | 8,380 | 7.67 | 2,066 | 3,830 | 5.56 | 684 | |
| Total Sulfide | 1,871 | 4.34 | 261 | 11,183 | 6.34 | 2,281 | 5,109 | 4.73 | 776 | |
| Total Oxide | 270 | 1.47 | 13 | 1,379 | 1.83 | 81 | 295 | 1.63 | 15 | |
| Total Oxide & Sulfide | 2,141 | 3.98 | 274 | 12,562 | 5.85 | 2,361 | 5,404 | 4.56 | 792 | |
| Residues | ||||||||||
| CIL | 616 | 7.73 | 153 | 0 | 0.00 | 0 | 0 | 0.00 | 0 | |
| Total | 616 | 7.73 | 153 | 0 | 0.00 | 0 | 0 | 0.00 | 0 | |
Notes:
| 1. |
CIM definitions (2014) were followed in the estimation of Mineral Resource. |
| 2. |
For the Mineral Resource estimate, the Qualified Person is Troy Fuller. |
| 3. |
The Mineral Resources reported are inclusive of the Mineral Reserves. |
| 4. |
CIL residues are stated as contained ounces – 25% recovery is expected. Recoveries are based on operating performances. |
| 5. |
Mineral Resources are rounded to 1,000t, 0.01 g/t Au and 1koz. Minor discrepancies in summation may occur due to rounding. |
| 6. |
Mineral Resources that are not Mineral Reserves do not have demonstrated economic viability. |
| 7. |
The Mineral Resource estimate used a gold price of US$1,200 per ounce (AUD$1,500 per ounce). |
| 8. |
Cut-off grades applied are 0.7 g/t Au for oxide, 1.0 g/t Au for near-surface sulfide (above 5050mRL) and 3.0 g/t Au for underground sulfide mineralization (below 5050mRL). |
| 9. |
A minimum mining width of 2.5m was applied. |
| 10. |
Density of mineralized material applied 2.40t/m3 for oxide, 2.56t/m3 for transitional material, 2.64t/m3 for fresh material between 5000mRL and 5050mRL, 2.72t/m3 for fresh material between 4500mRL and 5000mRL and 2.78t/m3 for fresh material below 4500mRL. |
117
| Technical Report | Kirkland Lake Gold |
| December 2016 | Fosterville Gold Mine |
The reported Mineral Resources are as at December 31, 2016 and reported by Kirkland Lake Gold in accordance with NI43-101.
In all cases, the Qualified Person has complied with CIM standards as prescribed by NI 43-101.
The Authors are not aware of any known environmental, permitting, legal, title, taxation, socio-economic, marketing and political or other relevant factors that would materially affect the Mineral Resource estimate.
The location and extents of the block models for each of these areas are displayed in Figure 14-1. Current underground mining activities are confined to the Central (Northern, Phoenix and Central Models) and Harrier (Harrier Model) Areas. Open pit mining activities were last undertaken in 2012 in the Robbin’s Hill Area (Robbin’s Hill Model).
118
| Technical Report | Kirkland Lake Gold |
| December 2016 | Fosterville Gold Mine |

119
| Technical Report | Kirkland Lake Gold |
| December 2016 | Fosterville Gold Mine |
| 14.1 | CENTRAL AREA |
| 14.1.1 | AREA GEOLOGY |
The Central Area is divided into eight current and six remnant mineralized zones.
| Current | Remnant |
| Phoenix | Falcon |
| Lower Phoenix | Ellesmere |
| Lower Phoenix Footwall | Shamrock |
| Eagle | Robin |
| East Dippers | Griffon |
| Allwood | Vulture |
| Kestrel | |
| Splays |
|
Throughout 2016 the majority of drilling, mining, mapping, interpretation and subsequent Mineral Resource Modeling were undertaken within the extents of the Lower Central and Harrier Areas, below the 5050mRL. The Mineral Resources in the Lower Central and Harrier Areas are detailed in Table 14-2 . |
120
| Technical Report | Kirkland Lake Gold |
| December 2016 | Fosterville Gold Mine |
TABLE 14-2 CENTRAL AND HARRIER AREA LOWER SULFIDE MINERAL RESOURCES (INCLUSIVE OF MINERAL RESERVES) BELOW 5050MRL - FOSTERVILLE AS AT DECEMBER 31, 2016
| Central and Harrier Area Lower Sulphide Mineral
Resources (Inclusive of Mineral Reserves) below 5050mRL as at December 31, 2016 |
|||||||||
| Classification | Measured | Indicated | Inferred | ||||||
| Tonnes (kt) |
Grade (g/t Au) |
Insitu Gold (koz) |
Tonnes (kt) |
Grade (g/t Au) |
Insitu Gold (koz) |
Tonnes (kt) |
Grade (g/t Au) |
Insitu Gold (koz) | |
| Allwood | 5 | 5.21 | 1 | 164 | 5.69 | 30 | 274 | 6.72 | 59 |
| Eagle | 67 | 19.34 | 42 | 433 | 15.07 | 210 | 61 | 10.39 | 20 |
| East Dippers | 61 | 12.57 | 24 | 741 | 6.79 | 162 | 84 | 5.61 | 15 |
| Ellesmere | - | 0.00 | - | 331 | 5.73 | 61 | 22 | 3.39 | 2 |
| Harrier | 8 | 6.50 | 2 | 2,085 | 7.92 | 531 | 274 | 5.11 | 45 |
| Kestrel | 12 | 5.28 | 2 | 522 | 4.98 | 84 | 52 | 4.09 | 7 |
| Lower Phoenix | 51 | 14.25 | 23 | 396 | 7.80 | 99 | 777 | 6.84 | 171 |
| Lower Phoenix Footwall |
26 |
8.58 |
7 |
365 |
22.18 |
260 |
320 |
7.38 |
76 |
| Osprey | - | 0.00 | - | 824 | 6.07 | 161 | 320 | 4.07 | 42 |
| Phoenix | 125 | 7.62 | 31 | 684 | 6.28 | 138 | 38 | 4.67 | 6 |
| Raven | - | 0.00 | - | 119 | 8.12 | 31 | - | 0.00 | - |
| Robin | - | 0.00 | - | 68 | 8.39 | 18 | - | 0.00 | - |
| Splays | - | 0.00 | - | 908 | 5.84 | 171 | 176 | 3.67 | 21 |
| Vulture | - | 0.00 | - | 517 | 5.04 | 84 | 635 | 4.56 | 93 |
| Stockpile* | 31 | 10.81 | 11 | - | - | - | - | - | - |
| Total Sulphide | 387 | 11.51 | 143 | 8156 | 7.78 | 2039 | 3034 | 5.71 | 557 |
Notes:
| 1. |
CIM definitions (2014) were followed in the estimation of Mineral Resource. |
| 2. |
For the Mineral Resource estimate, the Qualified Person is Troy Fuller. |
| 3. |
The Mineral Resources reported are inclusive of the Mineral Reserves. |
| 4. |
CIL residues are stated as contained ounces – 25% recovery is expected. Recoveries are based on operating performances. |
| 5. |
Mineral Resources are rounded to 1,000t, 0.01 g/t Au and 1koz. Minor discrepancies in summation may occur due to rounding. |
| 6. |
Mineral Resources that are not Mineral Reserves do not have demonstrated economic viability. |
| 7. |
The Mineral Resource estimate used a gold price of US$1,200 per ounce (AUD$1,500 per ounce). |
| 8. |
Cut-off grades applied are 0.7 g/t Au for oxide, 1.0 g/t Au for near-surface sulfide (above 5050mRL) and 3.0 g/t Au for underground sulfide mineralization (below 5050mRL). |
| 9. |
A minimum mining width of 2.5m was applied. |
| 10. |
Density of mineralized material applied 2.40t/m3 for oxide, 2.56t/m3 for transitional material, 2.64t/m3 for fresh material between 5000 and 5050mRL, 2.72t/m3 for fresh material between 4500 and 5000mRL and 2.78t/m3 for fresh material below 4500mRL. |
| 11. |
*Stockpile Inventory includes Lower Central Area Mineral Resources contained within the Run of Mine Stockpile and Coarse Ore Stockpile as at December 31, 2016. |
| 14.1.2 | GEOLOGICAL MODELS |
In order to constrain the mineral resource models, a number of three-dimensional geological models were generated for each zone using MineSight software. The models produced were of three types:
- structural wireframe models;
- mineralization wireframe models; and
121
| Technical Report | Kirkland Lake Gold |
| December 2016 | Fosterville Gold Mine |
- waste wireframe models.
Structural models contain three-dimensional wireframe surfaces of major faults and minor structures as interpreted from surveyed data points obtained from open pit and underground mapping and diamond drill core logs. The mineralization model defines the interpreted gold-bearing mineralized envelopes and is constrained either by structural, lithological or grade boundaries. The waste model is defined by a 10m to 15m envelope surrounding the mineralization model.
Mineralization domain wireframes are constructed by the creation of solid polygons on sections that are clipped to the corresponding minimum drill spacing. This has resulted in interpretations completed on 6.25m sections in areas of open pit grade control drilling and on 25m in areas of underground grade control drilling and, 50m and 100m sections where there is only surface and underground exploration drilling.
Mineralization used within the domain boundary is selected based on a current cut-off of four gram-meters (generally two meters at 2.0 g/t Au). Mineralization below the cut-off may exist within the mineralized domain if there is adjacent supporting higher gold grade data directly adjacent or if the intercept lays central to other peripheral economic intercepts on the same interpreted structure. Sub-economic mineralization may also be included around the periphery of the domain to produce more representative estimates towards the margins of the mineralized envelope.
Data points that satisfy particular economic or geological criteria for inclusion are directly clipped into the domain solid so that the assay interval is either entirely within or entirely excluded from the interpreted mineralized envelope. Separate mineralization envelopes are created to distinguish between geologically or economically distinct zones such as high-grade/low-grade envelopes or changes in structural orientations.
Information derived from RC and diamond drill data (assays, structure, lithology, etc.) are used in the initial construction of the mineralized domains. Mineralized zones that become viable for mining are further constrained by the addition of geological mapping, surveyed structures, open pit blast hole samples, underground sludge hole and face samples (Figure 14-2).
122
| Technical Report | Kirkland Lake Gold |
| December 2016 | Fosterville Gold Mine |

| 14.1.3 | DRILLING DATA |
Drill hole assay data used to produce the model was subjected to a number of data preparation processes:
| 1. |
Files containing all drill hole logging and assay data were imported from the AcQuire production and exploration database into MineSight using an automated script. |
| 2. |
A MineSight procedure coded the drill holes with the appropriate properties from the geological models and a drill hole composite file was constructed for values inside the mineralization wireframes. |
| 3. |
The files were viewed in MineSight in order to identify holes that contained obvious erroneous data missed during the validation process. Data that was considered erroneous was either corrected or deleted from the data set. Note: step 1 and 2 were also completed prior to the geological models being finalized to ensure the interpretations were completed on a validated drill hole file. |
123
| Technical Report | Kirkland Lake Gold |
| December 2016 | Fosterville Gold Mine |
In combination, the Dec 2016 drill hole files used for the Central Area Models (1612_SPRM, 1612_NPRM, 1506_CRM and 1201_NRM) contained a total of 6,582 drill holes between them to estimate mineralization, of which 3,195 (48.5%) are RC holes and 3,387 (51.5%) diamond core holes. There are a number of holes that appear both in the Central Model and the Northern Model. This is to allow for smoothness of interpolation from one model boundary to another (Table 14-3).
TABLE 14-3 CENTRAL AREA RESOURCE MODEL DRILLING DATA EXTENTS
| Central Area Resource Models Drilling Data Extents | |||||||||
| Model | North Min (m) |
North Max (m) |
RL Min (m) |
RL Max (m) |
Total Holes |
Diamond Holes |
RC/AC Holes |
% Diamond Holes |
(% RC/AC) Holes |
| 1506_CRM | 6,000 | 8,250 | 4,600 | 5,200 | 2,914 | 1,070 | 1,844 | 36.7 | 63.3 |
| 1612_SPRM | 5,800 | 7,650 | 3,700 | 5,200 | 1,524 | 1,524 | 0 | 100.0 | 0.0 |
| 1612_NPRM | 7,300 | 8,700 | 4,000 | 5,200 | 2,481 | 2,481 | 0 | 100.0 | 0.0 |
| 1201_NRM | 8,250 | 10,250 | 4,800 | 5,200 | 1,745 | 394 | 1,351 | 22.6 | 77.4 |
| Total | 8,664 | 5,469 | 3,195 | 63.1 | 36.9 | ||||
* These totals include over lapping holes used in the margins of more than one model project.
14.1.3.1 Compositing
The raw sample results were composited to 2m intervals in the 1612_SPRM, 1612NPRM, 1506_CRM and the 1201_NRM (Northern) Model using the MineSight compositing procedure. A 2m composite length was selected as it encompasses a high proportion of RC drill assay data, of which a high proportion is of 2m length or greater. Further work is required to ascertain the increasing proportion of recent ~1m underground diamond assay data collated as the mine exceeds depths unobtainable to surface RC drilling.
The compositing process creates up to 2m sample length composites of the primary assay intervals in a down-hole direction honoring the coded geological domains. The MineSight software down-hole compositing routine provides an option to accumulate short intervals (up to 50% of the composite length) into the preceding interval. Assay intervals above the minimum 50% primary sample length are treated as a unique composite interval. For example, an assay interval over 1.0m in length is left in the composite file as is, and an assay interval less than 1.0m is added into the preceding composite interval (Figure 14-3). This option has been used to prevent a number of smaller intervals from forming on the down-hole margins of estimation domains, and as such all intervals can be used in the estimation process.
124
| Technical Report | Kirkland Lake Gold |
| December 2016 | Fosterville Gold Mine |

A listing of descriptive statistics for the estimated domains is provided for the Northern Model (1201_NRM) in Table 14-4.
125
| Technical Report | Kirkland Lake Gold |
| December 2016 | Fosterville Gold Mine |
TABLE 14-4 DESCRIPTIVE STATISTICS FOR THE NORTHERN MODEL
| Model | 1201_NRM | Descriptive Statistics | ||||||
| Date: | Dec-2011 | |||||||
| Variable | Data Type(s) |
Number of Samples |
Minimum (g/t Au) |
Maximum (g/t Au) |
Mean (g/t Au) |
Std Dev g/t |
Variance g/t 2 |
Coeff of Var |
| Code 1 Fosterville HG | ||||||||
| Au 2.0m Composites TC 40 | DD | 1,701 | 0.01 | 49.60 | 4.61 | 5.45 | 29.70 | 1.18 |
| Code 2 Fosterville LG | ||||||||
| Au 2.0m Composites | DD | 9,949 | 0.00 | 104.60 | 5.66 | 6.63 | 43.96 | 1.17 |
| Code 3 Phoenix HG | ||||||||
| Au 2.0m Composites | DD | 4,021 | 0.00 | 60.44 | 5.50 | 6.95 | 48.30 | 1.26 |
| Code 6 Splay LG | ||||||||
| Au 2.0m Composites | DD | 740 | 0.00 | 36.89 | 2.25 | 3.41 | 11.63 | 1.52 |
| Code 7 Griffon | ||||||||
| Au 2.0m Composites | DD | 101 | 0.20 | 57.21 | 9.74 | 10.62 | 112.78 | 1.09 |
A listing of composite statistics is provided in Table 14-5 for the Northern Model (1201_NRM).
TABLE 14-5 COMPOSITE STATISTICS BY COMPOSITE LENGTH IN THE NORTHERN MODEL
| Composite Length | Number | % of Composites | Mean Length (m) |
Mean Grade (g/t Au) |
| < 1.0m | 110 | 1% | 0.24 | 3.37 |
| ≥ 1.0 and < 2.0 | 459 | 5% | 1.44 | 5.49 |
| ≥ 2.0m | 7,879 | 93% | 2.01 | 5.39 |
| Total | 8,448 | 100% | 1.96 | 5.37 |
A listing of descriptive statistics for the estimated domains is provided in Table 14-6, Table 14-7 and Table 14-8 for the 1612_SPRM Southern Phoenix Model, 1612_NPRM Northern Phoenix and the 1506_CRM Central Models respectively. These statistics are provided as a context for the size and the average grade in each of the domains. The 1201_NRM model name encompasses the build date of the model and infers that the model includes the latest drilling and interpolation data in that respective area. Therefore, the Northern area has not had interpretational and/or drilling additions since January 2012. Similarly, the Central Model has not had any changes since June 2015. However, the Phoenix Model includes areas within the active mining and drilling zones and was completed in December 2016.
126
| Technical Report | Kirkland Lake Gold |
| December 2016 | Fosterville Gold Mine |
TABLE 14-6 DESCRIPTIVE STATISTICS OF GOLD FOR THE SOUTHERN PHOENIX MODEL
| Model: | 1612_SPRM | Descriptive Statistics | ||||||
| Date: | Dec-2016 | |||||||
| Variable | Data Type(s) |
Number
of Samples |
Minimum (g/t Au) |
Maximum (g/t Au) |
Mean (g/t Au) |
Std Dev (g/t Au) |
Variance
(g/t2 Au) |
Coeff. of
Var. |
| Code 1 Audax | ||||||||
| Au Raw | DD | 641 | 0.01 | 8486.00 | 70.75 | 413.34 | 170,849.96 | 5.84 |
| Au 2.0m Composites (top-cut) | DD | 200 | 0.01 | 160.00 | 31.47 | 47.81 | 2,285.80 | 1.52 |
| Code 3 Phoenix HG | ||||||||
| Au Raw | DD | 862 | 0.01 | 75.00 | 7.99 | 8.05 | 64.80 | 1.01 |
| Au 2.0m Composites | DD | 370 | 0.02 | 47.98 | 7.68 | 5.87 | 34.46 | 0.76 |
| Code 5 Splay HG | ||||||||
| Au Raw | DD | 695 | 0.01 | 97.80 | 6.70 | 7.77 | 60.37 | 1.16 |
| Au 2.0m Composites | DD | 267 | 0.03 | 44.70 | 6.47 | 5.57 | 31.02 | 0.86 |
| Code 6 Splay LG | ||||||||
| Au Raw | DD | 1,369 | 0.01 | 514.80 | 4.67 | 17.32 | 299.98 | 3.71 |
| Au 2.0m Composites (top-cut) | DD | 692 | 0.01 | 75.00 | 3.73 | 4.70 | 22.09 | 1.26 |
| Code 8 Allwood | ||||||||
| Au Raw | DD | 235 | 0.02 | 29.30 | 5.91 | 4.78 | 22.85 | 0.81 |
| Au 2.0m Composites | DD | 101 | 0.04 | 21.76 | 5.95 | 3.85 | 14.82 | 0.65 |
| Code 9 Vertical | ||||||||
| Au Raw | DD | 734 | 0.01 | 7368.00 | 60.53 | 419.63 | 176,089.34 | 6.93 |
| Au 2.0m Composites (top-cut) | DD | 255 | 0.09 | 160.00 | 21.49 | 39.87 | 1,589.62 | 1.86 |
| Code 10 Benu W1 | ||||||||
| Au Raw | DD | 271 | 0.01 | 860.00 | 33.61 | 102.54 | 10,514.45 | 3.05 |
| Au 2.0m Composites (top-cut) | DD | 87 | 0.02 | 100.00 | 21.90 | 26.49 | 701.72 | 1.21 |
| Code 11 Swan | ||||||||
| Au Raw | DD | 327 | 0.01 | 21490.00 | 206.37 | 87.34 | 7,628.28 | 0.42 |
| Au 2.0m Composites (top-cut) | DD | 97 | 0.91 | 120.00 | 41.58 | 44.89 | 2,015.11 | 1.08 |
| Code 12 Phoenix Base | ||||||||
| Au Raw | DD | 753 | 0.01 | 694.70 | 11.77 | 63.78 | 4,067.89 | 5.42 |
| Au 2.0m Composites (top-cut) | DD | 298 | 0.01 | 75.00 | 8.91 | 8.39 | 70.39 | 0.94 |
| Code 13 Benu | ||||||||
| Au Raw | DD | 1,951 | 0.01 | 707.00 | 15.79 | 79.05 | 6,248.90 | 5.01 |
| Au 2.0m Composites (top-cut) | DD | 767 | 0.03 | 75.00 | 9.80 | 11.07 | 122.54 | 1.13 |
| Code 14 Benu FW | ||||||||
| Au Raw | DD | 630 | 0.03 | 186.80 | 8.75 | 10.90 | 118.81 | 1.25 |
| Au 2.0m Composites | DD | 241 | 0.27 | 55.20 | 8.42 | 6.55 | 42.90 | 0.78 |
| Code 15 Kestrel | ||||||||
| Au Raw | DD | 606 | 0.02 | 25.20 | 4.48 | 3.23 | 10.43 | 0.72 |
| Au 2.0m Composites | DD | 248 | 0.54 | 19.21 | 4.37 | 2.25 | 5.06 | 0.51 |
127
| Technical Report | Kirkland Lake Gold |
| December 2016 | Fosterville Gold Mine |
| Model: | 1612_SPRM | Descriptive Statistics | ||||||
| Date: | Dec-2016 | |||||||
| Variable | Data Type(s) |
Number of Samples |
Minimum (g/t Au) |
Maximum (g/t Au) |
Mean (g/t Au) |
Std Dev (g/t Au) |
Variance (g/t2 Au) |
Coeff. of Var. |
| Code 16 Bedding East | ||||||||
| Au Raw | DD | 1825 | 0.01 | 104.00 | 5.27 | 5.66 | 32.04 | 1.07 |
| Au 2.0m Composites (top-cut) | DD | 808 | 0.05 | 75.00 | 5.15 | 4.65 | 21.62 | 0.90 |
| Code 17 Shallow East Dippers | ||||||||
| Au Raw | DD | 215 | 0.09 | 29.08 | 4.83 | 4.08 | 16.65 | 0.84 |
| Au 2.0m Composites | DD | 88 | 0.55 | 13.47 | 4.64 | 2.60 | 6.76 | 0.56 |
| Code 18 East Dipper | ||||||||
| Au Raw | DD | 1374 | 0.01 | 454.00 | 7.59 | 14.59 | 212.87 | 1.92 |
| Au 2.0m Composites | DD | 596 | 0.04 | 52.58 | 7.09 | 5.97 | 35.64 | 0.84 |
| Code 20 Eagle | ||||||||
| Au Raw | DD | 320 | 0.02 | 175.00 | 8.81 | 13.63 | 185.78 | 1.55 |
| Au 2.0m Composites (top-cut) | DD | 120 | 0.80 | 75.00 | 7.95 | 7.02 | 49.28 | 0.88 |
| Code 21 Allwood East | ||||||||
| Au Raw | DD | 649 | 0.01 | 17050.00 | 57.4 | 704.63 | 496,503.44 | 12.28 |
| Au 2.0m Composites (top-cut) | DD | 210 | 0.20 | 160.00 | 18.96 | 30.09 | 905.41 | 1.59 |
| Code 22 Audax FW | ||||||||
| Au Raw | DD | 640 | 0.01 | 775.70 | 8.70 | 37.76 | 1,425.82 | 4.34 |
| Au 2.0m Composites (top-cut) | DD | 218 | 0.26 | 75.00 | 6.69 | 10.48 | 109.83 | 1.57 |
| Code 23 Phoenix Base FW | ||||||||
| Au Raw | DD | 381 | 0.02 | 47.70 | 6.90 | 6.57 | 43.16 | 0.95 |
| Au 2.0m Composites | DD | 197 | 0.02 | 31.65 | 6.58 | 5.17 | 26.73 | 0.79 |
128
| Technical Report | Kirkland Lake Gold |
| December 2016 | Fosterville Gold Mine |
TABLE 14-7 DESCRIPTIVE STATISTICS OF GOLD FOR THE NORTHERN PHOENIX MODEL
| Model: | 1612_NPRM | Descriptive Statistics | ||||||
| Date: | Dec-2016 | |||||||
| Variable | Data Type(s) |
Number of Samples |
Minimum (g/t Au) |
Maximum (g/t Au) |
Mean (g/t Au) |
Std Dev (g/t Au) |
Variance
(g/t2 Au) |
Coeff. of
Var. |
| Code 3 Phoenix HG | ||||||||
| Au Raw | DD | 154 | 0.05 | 75.00 | 8.95 | 0.64 | 0.41 | 0.07 |
| Au 2.0m Composites | DD | 70 | 0.53 | 47.98 | 8.32 | 7.92 | 62.73 | 0.95 |
| Code 5 Splay HG | ||||||||
| Au Raw | DD | 68 | 0.26 | 15.00 | 5.30 | 3.36 | 11.29 | 0.63 |
| Au 2.0m Composites | DD | 28 | 1.43 | 10.29 | 5.14 | 2.08 | 4.33 | 0.40 |
| Code 6 Splay LG | ||||||||
| Au Raw | DD | 62 | 0.19 | 24.30 | 4.76 | 4.63 | 21.44 | 0.97 |
| Au 2.0m Composites | DD | 29 | 0.89 | 20.53 | 4.67 | 4.19 | 17.56 | 0.90 |
| Code 8 Allwood | ||||||||
| Au Raw | DD | 88 | 0.32 | 33.30 | 7.89 | 6.81 | 46.38 | 0.86 |
| Au 2.0m Composites | DD | 40 | 1.60 | 21.76 | 7.85 | 4.63 | 21.44 | 0.59 |
| Code 9 Vertical | ||||||||
| Au Raw | DD | 4 | 1.36 | 5.70 | 3.98 | 1.89 | 3.57 | 0.47 |
| Au 2.0m Composites | DD | 1 | 4.11 | 4.11 | 4.11 | 0.00 | 0.00 | 0.00 |
| Code 12 Phoenix Base | ||||||||
| Au Raw | DD | 22 | 0.02 | 17.20 | 5.70 | 5.08 | 25.81 | 0.89 |
| Au 2.0m Composites | DD | 12 | 0.02 | 15.63 | 5.93 | 4.77 | 22.75 | 0.80 |
| Code 13 Benu | ||||||||
| Au Raw | DD | 277 | 0.02 | 44.20 | 7.38 | 6.22 | 38.69 | 0.84 |
| Au 2.0m Composites | DD | 110 | 0.69 | 29.37 | 7.44 | 5.14 | 26.42 | 0.69 |
| Code 14 Benu FW | ||||||||
| Au Raw | DD | 22 | 1.05 | 11.20 | 5.25 | 2.72 | 7.40 | 0.52 |
| Au 2.0m Composites | DD | 9 | 2.59 | 8.41 | 5.02 | 2.04 | 4.16 | 0.41 |
| Code 15 Kestrel | ||||||||
| Au Raw | DD | 91 | 0.02 | 23.60 | 4.65 | 4.60 | 21.16 | 0.99 |
| Au 2.0m Composites | DD | 40 | 0.79 | 19.21 | 4.59 | 3.39 | 11.49 | 0.74 |
| Code 16 Bedding East | ||||||||
| Au Raw | DD | 101 | 0.06 | 15.40 | 4.71 | 3.10 | 9.61 | 0.66 |
| Au 2.0m Composites | DD | 46 | 1.04 | 12.20 | 4.71 | 2.52 | 6.35 | 0.54 |
| Code 18 East Dipper | ||||||||
| Au Raw | DD | 82 | 0.13 | 26.10 | 6.07 | 4.38 | 19.18 | 0.72 |
| Au 2.0m Composites | DD | 44 | 0.62 | 15.31 | 6.29 | 3.38 | 11.42 | 0.54 |
| Code 23 Phoenix Base FW | ||||||||
| Au Raw | DD | 42 | 0.24 | 22.20 | 4.77 | 5.30 | 28.09 | 1.11 |
| Au 2.0m Composites | DD | 21 | 0.59 | 20.80 | 4.94 | 4.72 | 22.28 | 0.96 |
129
| Technical Report | Kirkland Lake Gold |
| December 2016 | Fosterville Gold Mine |
TABLE 14-8 DESCRIPTIVE STATISTICS OF GOLD FOR THE CENTRAL MODEL
| Model: | 1506_CRM | Descriptive Statistics | ||||||
| Date: | Jun-2015 | |||||||
| Variable | Data Type(s) |
Number of Samples |
Minimum (g/t Au) |
Maximum (g/t Au) |
Mean (g/t Au) |
Std Dev (g/t
Au) |
Variance
(g/t2 Au) |
Coeff. of
Var. |
| Code 1 Fosterville HG | ||||||||
| Au Raw | DD | 571 | 0.02 | 72.00 | 7.93 | 6.45 | 41.60 | 0.81 |
| Au 2.0m Composites | DD | 287 | 0.02 | 28.98 | 7.49 | 4.68 | 21.90 | 0.62 |
| Code 2 Fosterville LG | ||||||||
| Au Raw | DD | 6,993 | 0.00 | 41.00 | 2.81 | 3.71 | 13.73 | 1.32 |
| Au 2.0m Composites | DD | 6,556 | 0.00 | 41.00 | 2.82 | 3.67 | 13.45 | 1.30 |
| Code 3 Phoenix HG | ||||||||
| Au Raw | DD | 2,694 | 0.01 | 104.80 | 8.37 | 8.67 | 75.20 | 1.04 |
| Au 2.0m Composites | DD | 1,175 | 0.01 | 49.54 | 7.96 | 6.39 | 40.81 | 0.80 |
| Code 4 Phoenix LG | ||||||||
| Au Raw | DD | 124 | 0.01 | 27.3 | 4.08 | 4.79 | 22.94 | 1.17 |
| Au 2.0m Composites | DD | 75 | 0.01 | 17.5 | 4.33 | 4.23 | 17.89 | 0.98 |
| Code 5 Splay HG | ||||||||
| Au Raw | DD | 873 | 0.01 | 57.60 | 6.41 | 7.01 | 49.10 | 1.09 |
| Au 2.0m Composites | DD | 394 | 0.01 | 38.18 | 6.11 | 5.55 | 30.80 | 0.91 |
| Code 6 Splay LG | ||||||||
| Au Raw | DD | 2,291 | 0.00 | 28.80 | 2.24 | 2.85 | 8.14 | 1.27 |
| Au 2.0m Composites | DD | 1,875 | 0.00 | 24.60 | 2.04 | 2.53 | 6.40 | 1.24 |
| Code 7 Kite | ||||||||
| Au Raw | DD | 298 | 0.42 | 28.60 | 8.02 | 5.96 | 35.52 | 0.74 |
| Au 2.0m Composites | DD | 145 | 1.21 | 23.85 | 7.73 | 4.39 | 19.27 | 0.57 |
| Code 10 Vulture | ||||||||
| Au Raw | DD | 595 | 0.14 | 24.20 | 5.03 | 2.86 | 7.84 | 0.56 |
| Au 2.0m Composites | DD | 313 | 0.45 | 19.9 | 4.97 | 2.35 | 5.52 | 0.47 |
| Code 11 Harrier OP | ||||||||
| Au Raw | DD | 1,635 | 0.00 | 15.33 | 2.44 | 2.69 | 7.24 | 1.10 |
| Au 2.0m Composites | DD | 1,574 | 0.00 | 15.33 | 2.41 | 2.66 | 7.08 | 1.10 |
| Code 12 Phoenix Base | ||||||||
| Au Raw | DD | 184 | 0.01 | 52.40 | 10.51 | 8.80 | 77.44 | 0.84 |
| Au 2.0m Composites | DD | 84 | 0.01 | 32.40 | 10.08 | 7.08 | 50.13 | 0.70 |
| Code 18 East Dipper | ||||||||
| Au Raw | DD | 245 | 0.06 | 59.40 | 7.52 | 6.50 | 42.25 | 0.86 |
| Au 2.0m Composites | DD | 114 | 0.32 | 24.61 | 7.25 | 4.06 | 16.48 | 0.56 |
130
| Technical Report | Kirkland Lake Gold |
| December 2016 | Fosterville Gold Mine |
A listing of composite statistics is provided in Table 14-9 for the (1612_SPRM, 1612_NPRM and 1506_CRM) Phoenix and Central Models.
TABLE 14-9 COMPOSITE STATISTICS BY COMPOSITE LENGTH FOR THE CENTRAL MODEL (1506_CRM), SOUTHERN PHOENIX (1612_SPRM) AND NORTHERN PHOENIX MODEL (1612_NPRM)
| Model | Composite Length | Number | % of Comps | Mean length (m) |
Mean Grade (g/t Au) |
| 1612_SPRM | < 1.0m | 770 | 11.7 | 0.64 | 6.43 |
| ≥ 1.0 and <2.0m | 1,655 | 25.2 | 1.37 | 10.66 | |
| ≥ 2.0m | 4,133 | 63.0 | 2.09 | 15.61 | |
| Total | 6,558 | 100 | 1.74 | 14.23 | |
| 1612_NPRM | < 1.0m | 148 | 2.8 | 0.68 | 4.80 |
| ≥ 1.0 and <2.0m | 894 | 17.2 | 1.38 | 7.01 | |
| ≥ 2.0m | 4,165 | 80.0 | 2.05 | 7.01 | |
| Total | 5,207 | 100 | 1.89 | 5.56 | |
| 1506_CRM | < 1.0m | 86 | 2.1 | 0.68 | 4.92 |
| ≥ 1.0 and <2.0m | 572 | 14.0 | 1.34 | 7.14 | |
| ≥ 2.0m | 3,431 | 83.9 | 2.03 | 0.56 | |
| Total | 4,089 | 100 | 1.91 | 1.57 |
Variography
Modeling of the spatial continuity (variography) of gold for the Harrier and Lower Phoenix Models were carried out using Snowden’s Supervisor software. The variography for the Central and Northern Models was calculated using MineSight software. Sulfur is estimated in each domain as a variable using the domain geology shape, with a general sulfur variogram employed in the Northern and Central Models. In the Lower Phoenix Models the gold variography of the corresponding domains is employed, based on the strong correlation between Au and S. Non-Carbonate Carbon (NCC) is estimated using two broad domain shapes, encompassing east and west geometries, using a general variogram structure. Gold grade continuity is the highest along structures contained within parallel/oblique sedimentary host rock bedding contrasts. Within the parallel/oblique bedding zones it is common to see variogram structure ranges of up to 80m. In oblique/oblique host sedimentary settings the spatial grade continuity is less consistent, giving rise to variogram structures with ranges of less than 40m. Therefore, high level mining decisions (reserve block and capital development) are made where drill spacing is at least 50m x 50m and a decision to mine a given level is only made on an indicated resource with a drill spacing of 25m x 25m (sulfide hosted gold resources only). A similar rationale currently exists for confidence around the development and extraction of the visible gold quartz hosted style mineralization.
Variogram parameters used for gold in the Northern Block Model (1201_NRM) estimation are listed in Table 14-10. Variogram parameters used for Sulfur and NCC in the block model estimation in the 1201_NRM are listed in Table 14-11.
131
| Technical Report | Kirkland Lake Gold |
| December 2016 | Fosterville Gold Mine |

132
| Technical Report | Kirkland Lake Gold |
| December 2016 | Fosterville Gold Mine |

| • |
Variogram parameters used for gold in the Southern Phoenix Block Model (1612_SPRM) estimation are listed in Table 14-12. |
| • |
Variogram parameters used for sulfur and NCC in the Southern Phoenix Block Model (1612_SPRM) estimation are listed in Table 14-13. |
| • |
Variogram parameters used for gold in the Northern Phoenix Block Model (1612_NPRM) estimation are listed in Table 14-14. |
| • |
Variogram parameters used for sulfur and NCC in the Phoenix Block Model (1612_NPRM) estimation are listed in Table 14-15. |
| • |
Variogram parameters used for gold in the Central Block Model (1506_CRM) estimation are listed in |
133
| Technical Report | Kirkland Lake Gold |
| December 2016 | Fosterville Gold Mine |
| Table 14-16. | |
| • |
Variogram parameters used for sulfur and NCC in the Central Block Model (1506_CRM) estimation are listed in Table 14-17. |
134
| Technical Report | Kirkland Lake Gold |
| December 2016 | Fosterville Gold Mine |

135
| Technical Report | Kirkland Lake Gold |
| December 2016 | Fosterville Gold Mine |

136
| Technical Report | Kirkland Lake Gold |
| December 2016 | Fosterville Gold Mine |

137
| Technical Report | Kirkland Lake Gold |
| December 2016 | Fosterville Gold Mine |

138
| Technical Report | Kirkland Lake Gold |
| December 2016 | Fosterville Gold Mine |

139
| Technical Report | Kirkland Lake Gold |
| December 2016 | Fosterville Gold Mine |

140
| Technical Report | Kirkland Lake Gold |
| December 2016 | Fosterville Gold Mine |
| 14.1.4 | RESOURCE MODELING |
Block Models
For reasons of data handling, the Central Area was divided into four separate block models – Northern, Central, Southern Phoenix and Northern Phoenix, with the following extents and block dimensions contained within (Table 14-18) (Figure 14-6).
TABLE 14-18 CENTRAL AREA BLOCK MODEL DIMENSIONS
| Parameter | Northern | Central | Northern
Phoenix |
Southern
Phoenix |
| Northing Min (m) | 8,250 | 6,000 | 7,450 | 6,000 |
| Northing Max (m) | 10,250 | 8,250 | 8,500 | 7,450 |
| Easting Min (m) | 1,400 | 1,400 | 1,400 | 1,300 |
| Easting Max (m) | 2,100 | 2,100 | 1,850 | 1,850 |
| RL Max (m) | 5,200 | 5,200 | 4,600 | 4,600 |
| RL Min (m) | 4,800 | 4,600 | 4,150 | 3,700 |
| X direction m (East) | 2 | 2 | 2 | 2 |
| Y direction m (North) | 10 | 10 | 10 | 10 |
| Z direction m (Vertical) | 5 | 5 | 5 | 5 |
All models use Ordinary Kriging to interpolate grades.
Top Cuts
Historically, gold grades generated by disseminated sulfides were top cut to 75 g/t Au in order to limit the influence of a low number of high-grade intercepts. This changed in late 2014 when the Central Area saw an increase in the number of high-grade assays associated with visible gold intersections into the Phoenix, Lower Phoenix and Eagle Areas. A review of applicable top cuts was carried out in 2016 and due to the frequency of high-grade composites increasing in the model, (Table 14-19) a change in top-cut grades was made in a number of domains. An independent review of top-cutting methodology from QG consultants consolidated the CV top cut optimization approach, with additional review and reconciliation work continuing into 2017.
141
| Technical Report | Kirkland Lake Gold |
| December 2016 | Fosterville Gold Mine |
TABLE 14-19 COMPARISON BETWEEN NUMBER OF COMPOSITES PRESENT ABOVE THE CUT-OFF VALUE FROM 2014 TO 2016 FOR THE SAME RESOURCE AREA
Model Year |
2m Composite Grade Cut-off (g/t Au) | |||||
| 25 g/t | 50 g/t | 75 g/t | 100 g/t | 150 g/t | 200 g/t | |
| Number of Composites above Grade Cut-off | ||||||
| 2014 | 72 | 20 | 14 | 10 | 8 | 5 |
| 2015 | 208 | 75 | 60 | 46 | 34 | 23 |
| 2016 | 282 | 143 | 112 | 84 | 68 | 48 |
On review of the Central Area dataset in 2014, QG recommended utilizing the Coefficient of Variation (CV) statistic as an outlier identification tool. The methodology involved sorting the grades from highest to lowest, then tabulating and plotting the mean Au and mean CV versus the number of composites removed. This method was employed in conjunction with the examination of histograms and log probability plots of the grade data sets to determine top cuts. These methods were consolidated in late 2016 following the introduction of the geostatistical package, Supervisor, with the mean and variance plots and log probability plots generated providing comparable results to the manually generated CV plots. Using the methodology, combined with a review of model vs mill reconciliation performance, a number of component domains in the Phoenix Resource Model had their top cuts adjusted (Table 14-20 and Table 14-21).
For the majority of the mineralized domains containing high-grade assays associated with visible gold the top cut has been set to 160 g/t Au, associated with an inflection in both the mean and variance (Figure 14-4) and log probability plots (Figure 14-5). The D11 Swan domain is the exception, with a more conservative 120 g/t Au top cut applied given the extremely high-grades but low data support.
As data populations increase through additional drilling and mining in the visible gold environments of the Lower Phoenix Area top cuts will be revised on an ongoing basis.
In addition to the gold top cut, an interpolation range limit was imposed on samples in most of the domains within the Phoenix 1512_PRM Resource Model. The range limits imposed, vary between 10 and 60m for assay grades varying between 12-30 g/t Au. This limit was imposed to decrease the importance of locally estimated blocks with very high composite sample grades (>70 g/t Au) where sample support was low.
142
| Technical Report | Kirkland Lake Gold |
| December 2016 | Fosterville Gold Mine |

143
| Technical Report | Kirkland Lake Gold |
| December 2016 | Fosterville Gold Mine |

144
| Technical Report | Kirkland Lake Gold |
| December 2016 | Fosterville Gold Mine |
TABLE 14-20 TOP-CUTS APPLIED TO GOLD WITHIN THE SOUTHERN PHOENIX RESOURCE MODEL 2016
| Domain Name | Domain
Number |
Top-Cut Applied\
(g/t Au) |
| Audax | 1 | 160 |
| Phoenix HG | 3 | 75 |
| Splay HG | 5 | 75 |
| Splay LG | 6 | 75 |
| Allwood | 8 | 75 |
| Vertical | 9 | 160 |
| Benu W1 | 10 | 100 |
| Swan | 11 | 120 |
| Phoenix Base | 12 | 75 |
| Benu | 13 | 160 |
| Benu FW | 14 | 75 |
| Kestrel | 15 | 75 |
| Bedded East | 16 | 75 |
| Shallow East Dippers | 17 | 75 |
| East Dipper | 18 | 75 |
| Eagle | 20 | 75 |
| Allwood East | 21 | 160 |
| Audax FW | 22 | 75 |
| Phoenix Base FW | 23 | 75 |
| Phoenix HG | 3 | 75 |
145
| Technical Report | Kirkland Lake Gold |
| December 2016 | Fosterville Gold Mine |
TABLE 14-21 TOP-CUTS APPLIED TO GOLD WITHIN THE NORTHERN PHOENIX RESOURCE MODEL 2016
| Domain Name | Domain
Number |
Top-Cut Applied
(g/t Au) |
| Phoenix HG | 3 | 75 |
| Splay HG | 5 | 75 |
| Splay LG | 6 | 75 |
| Allwood | 8 | 75 |
| Vertical | 9 | 75 |
| Benu W1 | 7 | 75 |
| Phoenix Base | 8 | 75 |
| Benu | 9 | 160 |
| Benu FW | 14 | 75 |
| Kestrel | 15 | 75 |
| Bedded East | 16 | 75 |
| Shallow East Dippers | 17 | 75 |
| East Dippers | 18 | 75 |
| Sphinx | 19 | 75 |
| Phoenix Base FW | 23 | 75 |
Search Criteria
Gold, Sulfur and NCC grades are interpolated into blocks meeting the following criteria:
- Greater than 1% of the block volume is inside one of the domain envelopes;
- Blocks within one of the domain solids; and
- Blocks whose ellipsoid includes at least one composite, depending on the particular mineralized envelope.
The search ellipsoid geometries were based on optimized variogram models, also taking into account the geology and drill spacing of the relevant zone so that a block could ‘see’ at least the nearest sections along strike and holes up or downdip.
Only composites meeting the following criteria are used to interpolate any one block, where:
- Composites (to a maximum of 35) within the search ellipsoid dimensions and search area limits;
- Where more than 35 composites lie within the search ellipsoid, the closest 35 samples in anisotropic ellipsoid space are used;
- There was no directional de-clustering employed in the 1612_NPRM Model, 1612_SPRM Model or the 1506_CRM Model. A maximum of 10 composites per quadrant were estimated in a four sector quadrant search in the 1201_NRM Model (Table 14-25);
- Codes of both the composite and the block were matched by correlating the coded composite item with the coded block model item; and
- A maximum of ten composites can be taken from any single drill hole.
146
| Technical Report | Kirkland Lake Gold |
| December 2016 | Fosterville Gold Mine |

147
| Technical Report | Kirkland Lake Gold |
| December 2016 | Fosterville Gold Mine |
In order to optimize the search ellipsoids used for interpolation, variogram fans were calculated and analyzed. The variogram model with the best structure and longest range that was concordant with known geological trends or interactions was utilized to dictate the search ellipsoid. A Kriged ‘de-bug’ search ellipsoid was also created in MineSight on selected domains for the variogram to be used allowing visual inspection of the composites and Kriging weights calculated for the block at the center of the ellipsoid.
Search ellipsoids in Figure 14-7 show the maximum range extents that composites were employed to estimate a block. Range extents for the 1612_SPRM Model can be seen in Table 14-22, with the extents for the 1612_NPRM Model in Table 14-23. Search routines used to interpolate blocks in the model are a combination of a broad extensive searches based on a low sample support estimate combined with an overprint of a tighter estimation with a maximum search distance no greater than the range calculated in the variogram model.
148
| Technical Report | Kirkland Lake Gold |
| December 2016 | Fosterville Gold Mine |
The majority of the domains in the 1612_NPRM model have a moderate southerly plunge, following the observed mineralized shoot geometry resulting from the intersection of the main fault structures with secondary splay faults as well as the southerly plunging fold hinges. An example of the search direction in the 1612 SPRM following the observed structural interactions can be seen in Figure 14-7, which shows the search ellipsoid for DOMAIN=13 Benu plunging on a similar orientation to the intersecting DOMAIN=1 Audax.
Additional ‘outlier’ sub domains were employed within selected domains in the 1612_SPRM Model, 1612_NPRM Model and the 1506_CRM. This was to restrict the influence of lower grade composite gold values smearing into high-grade areas of the resource shown in Table 14-24.
Figure 14-8 depicts the DOMAIN=13 Benu Resource with its first and second search ellipsoids for gold interpolation. Rotations are in MineSight coordinates.
149
| Technical Report | Kirkland Lake Gold |
| December 2016 | Fosterville Gold Mine |

150
| Technical Report | Kirkland Lake Gold |
| December 2016 | Fosterville Gold Mine |

151
| Technical Report | Kirkland Lake Gold |
| December 2016 | Fosterville Gold Mine |

152
| Technical Report | Kirkland Lake Gold |
| December 2016 | Fosterville Gold Mine |

153
| Technical Report | Kirkland Lake Gold |
| December 2016 | Fosterville Gold Mine |

The resultant block models are tightly constrained by wireframe models derived from detailed geological interpretation and modeling of the mineralized zones. This provides the vital basic geological control over the computer-generated grade estimations. A section through the block model is included in Figure 14-8.
154
| Technical Report | Kirkland Lake Gold |
| December 2016 | Fosterville Gold Mine |

The above figure shows DOMAIN=13 Benu, DOMAIN=9 Vertical, DOMAIN=21 Allwood East, DOMAIN=20 Eagle, DOMAIN=22 Audax FW, DOMAIN=5 Splay HG and DOMAIN=6 Splay LG mineralization envelopes.
Bulk Density
During the course of 2013, a review was conducted of the bulk density values used at Fosterville including analysis of all diamond core data and grab sample analysis from known production locations. Bulk density measurements conducted on production samples via a water displacement method (Lipton, 1997) shows the average densities of mineralized material at 2.79t/m 3, stibnite material at 3.20t/m 3 and waste material at 2.76t/m 3 (Table 14-26). Further support can be seen in Figure 14-9, where a total of 1,078 samples of mineralized and un-mineralized samples were charted against their respective reduced level. From the graphs produced, it can be observed that data below 4500mRL are greater than the previously used model bulk density value of 2.72t/m 3. When looking at only mineralized samples above a 1.0 g/t Au cut-off in Figure 14-10, there is a clear step change below 4500mRL with an average density of 2.80t/m 3. It is important to note that data points around 4200mRL shown in Figure 14-10 show a drop in density, however, this is due to insufficient number of samples taken at around this level. A decision was made to increase model density below 4500mRL from 2.72t/m 3 to 2.78t/m 3 given the supporting evidence.
155
| Technical Report | Kirkland Lake Gold |
| December 2016 | Fosterville Gold Mine |
TABLE 14-26 BULK DENSITY SAMPLES FROM UNDERGROUND PRODUCTION LOCATIONS
| Source | Reduced Level (m) |
Description | Calculated Density
(t/m3) |
| O4640 | 4640 | Mineralized | 2.77 |
| O4640 | 4640 | Mineralized | 2.68 |
| C4480 | 4480 | Mineralized | 2.75 |
| C4480 | 4480 | Mineralized | 2.94 |
| C4480 | 4480 | Stibnite | 3.52 |
| C4460 | 4460 | Mineralized | 2.84 |
| C4460 | 4460 | Mineralized | 2.75 |
| C4460 | 4460 | Stibnite | 3.00 |
| C4460 | 4460 | Stibnite | 3.07 |
| C4460 | 4460 | Waste | 2.67 |
| C4460 | 4460 | Waste | 2.77 |
| C4480 | 4480 | Waste | 2.82 |
| C4480 | 4480 | Waste | 2.79 |
| O4640 | 4640 | Waste | 2.70 |
| O4640 | 4640 | Waste | 2.79 |
156
| Technical Report | Kirkland Lake Gold |
| December 2016 | Fosterville Gold Mine |

Bulk density within the oxide zone from surface to base of complete oxidation is determined from RC drilling, and test work assigns it a value of 2.40t/m 3. Fresh rock is then divided into four zones determined by test work carried out on the diamond drill core. The three categories are based on reduced level with transitional material between fresh and oxide above 5050mRL assigned 2.56t/m 3, fresh material between 5050mRL and 5000mRL assigned 2.64t/m 3, fresh material between 5000mRL and 4500mRL assigned 2.72t/m 3 and fresh material below 4500mRL assigned 2.78t/m 3 (Figure 14-11).
157
| Technical Report | Kirkland Lake Gold |
| December 2016 | Fosterville Gold Mine |

| 14.1.5 | MINERAL RESOURCE CLASSIFICATION |
The Mineral Resource estimates were generally classified according to the following parameters:
- Areas that have proximal underground development (as a draw point to a stoping block) were classified as Measured Mineral Resources with the Resources having adjacent mapping, face sampling and sludge sampling through the area. This does not extend to the material in stoping blocks below the lowest developed level in the area.
158
| Technical Report | Kirkland Lake Gold |
| December 2016 | Fosterville Gold Mine |
- Areas drilled from a spacing of 50 x 50m to a spacing of 25m x 25m were classified as Indicated Mineral Resources.
- Areas drilled to spacing wider than 50m x 50m were classified as Inferred Mineral Resources.
These parameters may vary subject to the level of geological confidence in specific areas. Visible gold Indicated Mineral Resources generally required a spacing of no less than 25m x 25m.
Figure 14-12 depicts Mineral Resource classifications encompassing the Central and Phoenix Areas as at December 31, 2016.
159
| Technical Report | Kirkland Lake Gold |
| December 2016 | Fosterville Gold Mine |

160
| Technical Report | Kirkland Lake Gold |
| December 2016 | Fosterville Gold Mine |
| 14.1.6 | RESULTS |
Results for the Mineral Resources contained in the Central Area (Central, Phoenix and Northern Model) are provided in Table 14-1.
| 14.2 | HARRIER AREA |
The Harrier UG Area resides within the bounds of the Southern Model Area and replaced the Wirrawilla region in 2009, while not encompassing the Daley’s Hill Open Pit region. Project definitions and model boundaries were altered to coincide with the transition of the Harrier UG project from Exploration to Mine Geology (Figure 14-1).
In late 2009 a detailed review of the information gathered was undertaken to determine mining risk. Analogues derived from systems developed to understand Central Area geology were applied to the Harrier UG dataset. While fundamental Fosterville geological principles such as the larger faulting systems, stratigraphy and plunge were found to be sound; the inter-relationship between structure and grade required further investigation. Further discussion of the Harrier geological domains is covered in Section 7.5.2.
| 14.2.1 | DRILLING DATA |
Compositing
Similar to the Phoenix Models (1612_S/NPRM), coded Harrier drill data was composited to 2m lengths with a 1m add-back threshold to avoid an increase in small intervals close to the margins of the coded mineralized domains. If the final composite was less than 1m, it was added to the previous composite making a composite with a length between 2m and 3m, refer to Figure 14-3. Final composites between 1m and 3m in length were left as is.
The Harrier Model (1612_HRM) has used a total of 627 drill holes with 27 RC (5%) and 600 diamond holes (95%).
Table 14-27 includes descriptive model statistics for the Harrier Model (1612_HRM) and Table 14-28 includes composite length statistics for the composite file.
161
| Technical Report | Kirkland Lake Gold |
| December 2016 | Fosterville Gold Mine |
TABLE14-27 DESCRIPTIVESTATISTICSFORTHEHARRIERMODEL(1612_HRM)
| Model: | 1612_HRM | Descriptive Statistics | ||||||
| Date: | Dec-2016 | |||||||
| Variable | Data Type(s) |
Number of Samples |
Minimum (g/t Au) |
Maximum (g/t Au) |
Mean (g/t Au) |
StdDev g/t |
Variance
g/t2 |
Coeff of Var |
| Code 6 Splay LG | ||||||||
| Au Raw | DD | 509 | 0.01 | 27.10 | 3.19 | 3.81 | 14.52 | 1.19 |
| Au 2.0m Composites | DD | 314 | 0.03 | 24.60 | 3.10 | 3.47 | 12.04 | 1.12 |
| Code 20 Harrier | ||||||||
| Au Raw | DD | 985 | 0.01 | 45.30 | 6.96 | 5.92 | 35.05 | 0.85 |
| Au 2.0m Composites | DD | 490 | 0.08 | 28.96 | 7.02 | 4.85 | 23.52 | 0.69 |
| Code 21 Harrier Base | ||||||||
| Au Raw | DD | 230 | 0.10 | 879.00 | 14.22 | 9.66 | 93.32 | 0.68 |
| Au 2.0m Composites | DD | 108 | 0.11 | 100.00 | 10.86 | 3.22 | 10.37 | 0.30 |
| Code 22 Harrier Link | ||||||||
| Au Raw | DD | 123 | 0.09 | 34.68 | 5.24 | 5.16 | 26.63 | 0.98 |
| Au 2.0m Composites | DD | 61 | 0.38 | 20.91 | 5.13 | 3.76 | 14.14 | 0.73 |
| Code 23 Harrier E Dipper | ||||||||
| Au Raw | DD | 36 | 0.33 | 26.90 | 7.68 | 6.42 | 41.22 | 0.84 |
| Au 2.0m Composites | DD | 15 | 0.79 | 11.88 | 7.19 | 2.83 | 8.01 | 0.39 |
| Code 24 Harrier HW | ||||||||
| Au Raw | DD | 458 | 0.03 | 31.60 | 6.89 | 5.38 | 28.94 | 0.78 |
| Au 2.0m Composites | DD | 232 | 0.46 | 20.11 | 7.01 | 4.27 | 18.23 | 0.61 |
| Code 25 Harrier Splay | ||||||||
| Au Raw | DD | 533 | 0.01 | 877.40 | 8.92 | 4.46 | 19.89 | 0.50 |
| Au 2.0m Composites | DD | 253 | 0.30 | 100.00 | 6.84 | 0.88 | 0.77 | 0.13 |
| Code 30 Osprey | ||||||||
| Au Raw | DD | 921 | 0.01 | 30.50 | 6.61 | 5.25 | 27.56 | 0.79 |
| Au 2.0m Composites | DD | 492 | 0.02 | 27.32 | 6.50 | 4.37 | 19.10 | 0.67 |
| Code 31 Osprey Base | ||||||||
| Au Raw | DD | 68 | 0.02 | 45.70 | 8.00 | 8.06 | 64.96 | 1.01 |
| Au 2.0m Composites | DD | 34 | 0.60 | 27.62 | 7.57 | 5.38 | 28.94 | 0.71 |
| Code 32 Osprey Link | ||||||||
| Au Raw | DD | 263 | 0.07 | 28.00 | 5.78 | 4.09 | 16.73 | 0.71 |
| Au 2.0m Composites | DD | 146 | 0.13 | 20.22 | 5.58 | 3.20 | 10.24 | 0.57 |
| Code 35 Osprey Splays | ||||||||
| Au Raw | DD | 257 | 0.03 | 24.00 | 5.64 | 4.19 | 17.56 | 0.74 |
| Au 2.0m Composites | DD | 150 | 0.20 | 15.75 | 5.48 | 3.25 | 10.56 | 0.59 |
162
| Technical Report | Kirkland Lake Gold |
| December 2016 | Fosterville Gold Mine |
TABLE 14-28 COMPOSITE STATISTICS BY COMPOSITE LENGTH FOR THE (1612_HRM) HARRIER MODEL
| Composite Length | Number | % of comps | mean length (m) |
mean grade (g/t Au) |
| < 1.0m | 444 | 19.3% | 0.63 | 4.97 |
| ≥ 1.0m and < 2.0m | 760 | 33.1% | 1.33 | 5.91 |
| ≥ 2.0m | 1092 | 47.6% | 2.11 | 6.80 |
| Total | 2296 | 100% | 1.57 | 6.41 |
No gold top cuts were imposed in the 1612_HRM Model. However, similar to the Phoenix and Central Models, search limiting was used to constrain 12 g/t Au to 20 g/t Au data to interpolation distances less than the primary search distance for a given domain.
Variography
The Harrier Model shares many common elements with the Phoenix Model. During 2016, very little Mineral Resource tonnage was added due to further constraining mineral wireframes to maximize grade. Significant ounces were added below the 4400mRL due to additional drilling in the Harrier Base and Harrier Splay where existing Mineral Resource was increased in width and significantly increased in grade.
The variography for each domain was analyzed and optimized using Snowden’s Supervisor program, with directions cross-referenced against geological interpretations. The variogram and search parameters for the Harrier (1612_HRM) Model domains are summarized in Table 14-29 and Table 14-30, both with respect for gold but also for sulfur and NCC (non-carbonate carbon).
163
| Technical Report | Kirkland Lake Gold |
| December 2016 | Fosterville Gold Mine |

164
| Technical Report | Kirkland Lake Gold |
| December 2016 | Fosterville Gold Mine |

165
| Technical Report | Kirkland Lake Gold |
| December 2016 | Fosterville Gold Mine |
| 14.2.2 | RESOURCE MODELING |
Block Models
The Harrier Block Model was created to allow modeling of mineralization between 4700mN and 6250mN (Table 14-31). The XYZ block dimensions of 2m (east) by 10m (north) by 5m (RL) were used.
This block size was chosen after consideration of:
|
• |
Drilling with the intent to mine was conducted at a nominal density of 25m x 25m spacing, although some areas of the Harrier Mineral Resource are drilled to 12.5m spacing; |
| • | Variogram model ranges between 10m to 30m; |
| • | Typical mineralization width of 4m to 8m; and |
| • | Likely underground mining methods (Selective Mining Unit). |
TABLE 14-31 HARRIER BLOCK MODEL EXTENTS AND CELL SIZE
| Model Extents | Minimum | Maximum | Cell | Dimension (m) |
| Northing (m N) | 4,700 | 6,250 | X Direction (East) | 2 |
| Easting (m E) | 1,400 | 2,100 | Y Direction (North) | 10 |
| Reduced Level (m RL) | 4,200 | 5,200 | Z Direction (Vertical) | 5 |
The Harrier Block Model used Ordinary Kriging to interpolate grades without a composite top cut.
Search Criteria
Search Criteria methods and justification within the Harrier Block Model are the same as those used for the Central Area.
Similarly, to the 1612_PRM (Phoenix Model) the Harrier Underground Model employed:
| • |
No direction de-clustering; |
| • |
A maximum of two to six composites per drill hole, dependent on intercept width and drill hole spacing. The restriction was enforced to minimize single-hole block estimation; and |
| • |
A lower composite outlier ‘soft boundary’, used to limit the effect of grade variability influencing higher grade and more densely supported area. |
Search ellipsoids, shown in Figure 14-13, depict the maximum range extents that composites can be used to estimate a block. Search parameters for the Harrier Block Model are provided in Table 14-32. Search ellipsoids for the 1612_HRM model were derived from variography for each domain. Variography was scrutinised against geological mapping, mining performance and interpretations made from diamond drilling. Low-grade outliers were modelled separately within some domains to constrain low-grades smearing into higher grade areas.
Figure 14-14 shows a cross section of the 1612_HRM Block Model with respect block size and Resource Domains.
166
| Technical Report | Kirkland Lake Gold |
| December 2016 | Fosterville Gold Mine |

167
| Technical Report | Kirkland Lake Gold |
| December 2016 | Fosterville Gold Mine |

Shown above are DOMAIN=21 Harrier Base, DOMAIN=25 Harrier Splay and DOMAIN=24 Harrier HW Mineralization Domains.
168
| Technical Report | Kirkland Lake Gold |
| December 2016 | Fosterville Gold Mine |
Bulk Density
Bulk density data obtained from exploration diamond core testing within the model area showed no material difference from density data obtained in the Central Area Models. Consequently, bulk density values were assigned to the Harrier Block Model according to material type using values from data collected in the Central Area (Figure 14-11). As mining continues below the 4500mRL, further density data will be collected to compliment density measurement taken from similar levels within the Phoenix Area.
| 14.2.3 | MINERAL RESOURCE CLASSIFICATION |
The Mineral Resource classification for the Harrier Block Model is the same technique applied as within the Central Area. Figure 14-15 illustrates the Harrier Model Resource classification.

| 14.2.4 | RESULTS |
Results for the Mineral Resources contained in the Harrier Area are provided in Table 14-1.
169
| Technical Report | Kirkland Lake Gold |
| December 2016 | Fosterville Gold Mine |
| 14.3 | FOSTERVILLE - HUNTS AREA |
The Fosterville-Hunts Model is located to the north of the Central Area and is defined as the zone between 10,000mN and 11,500mN (Figure 14-1) and conveniently extends over Fosterville and Hunt’s oxide pits.
| 14.3.1 | AREA DISCUSSION AND RESULTS |
The controlling structural features from west to east include: the moderately west dipping Hunt’s Fault, several footwall splays and the Fosterville Fault (Figure 14-16). The geology of the area was assessed by Fosterville staff, later reviewed by Stephen King (King, 2007) and Mineral Resource Modeling undertaken by Kerrin Allwood (2008).
The gold mineralization in the Fosterville-Hunt's area was historically mined for oxide gold and in the 1990's mining for oxide heap leach material created the Fosterville and Hunt's oxide pits.
However, since 2010 flotation in-pit tailings has and is being placed into the Fosterville and Hunt's pits. This tailings placement has resulted in no Mineral Resources being reported from the Fosterville-Hunts area for 2016.
It is the opinion of the Authors that the placement of tailings within the Fosterville and Hunts pits currently impedes reasonable prospect for eventual economic extraction of the mineral occurrence, which lies directly below these pits.
170
| Technical Report | Kirkland Lake Gold |
| December 2016 | Fosterville Gold Mine |

Shown are the relationships between the Hunt’s Fault, bedding and the set of splays that strike obliquely to the fault.
| 14.4 | DALEY’S HILL AREA |
The Southern Model spans from the Harrier Pit area to Daley’s Hill Pit, close to the southern margin of the Fosterville Mine Lease (MIN5404) as shown in Figure 14-1.
The Southern Model was in existence before the initial Harrier Mine Model became operational. Where there is overlap between the Harrier Model and Southern Model, the Harrier Model is used in preference for Mineral Resource reporting with the only exception being the Daley’s Hill Pit area (south of 5300mN and above 4800mRL), where Southern Model has been used. Only the Daley’s Hill area is discussed in detail in the following sections.
171
| Technical Report | Kirkland Lake Gold |
| December 2016 | Fosterville Gold Mine |
| 14.4.1 | GEOLOGICAL MODELS |
Geological modeling undertaken is essentially identical to that used for the Fosterville-Hunt’s and Robbin's Hill Models. Several iterations of Mineral Resource modeling of the Southern Model were undertaken and reported in Hitchman (2006). A review of the 2006 resource work was undertaken by Scott Jackson from QG Consultants (Jackson, 2007).
| 14.4.2 | DRILLING DATA |
The drilling quality is variable in the southern area and includes:
- RAB – Rotary air blast;
- Reverse circulation – Cross over hammer and face sampling hammer variants; and
- Diamond core – HQ and NQ2, often with RC pre-collars.
During drill hole data extraction for resource interpolations, the omission of RAB holes and one diamond hole was required owing to low quality sample techniques and incomplete assaying respectively. MineSight drill views were the primary tool used to identify data problems.
Included as part of the drill data review process assay data were:
- Imported from the acQuire Exploration databases into MineSight using customizable parameter screens; and
- Coded for mineralization using 3D gold wireframe solids.
Within the oxide open pit areas, the historical 5m blast holes are vertical and generally had one sample collected over a 5m length. These holes were used to aid interpretation, but were not used during subsequent Kriging owing to sample quality and that the 5m sample lengths were in excess of the desired 2m composite lengths.
Compositing and Coding
Compositing and coding of drill holes was undertaken similar to the Central Area.
Variography
In the Daley’s Hill area where drill spacing is nominally on 10m to 20m is available, variography work demonstrates relative nugget effect values of 50% and most of the variance in the first ~30m. The variogram models closely follow the expected geological controls with 20° southerly plunging shoots in 70° west dipping faults.
| 14.4.3 | MINERAL RESOURCE MODELING |
Block Models
The Southern Block Model (Southern Model) was originally created to allow modeling of gold mineralization south of 7,400mN to the southern end of the Fosterville Mine Lease. However, as mining advanced southwards, the use of the Southern Model has diminished, such that it is only being used for reporting Mineral Resources in the Daley’s Hill Area.
172
| Technical Report | Kirkland Lake Gold |
| December 2016 | Fosterville Gold Mine |
The Southern Model XYZ block dimensions of 4m (east) by 10m (north) by 5m (RL) were used. This block size was chosen after consideration of the maximum drilling density (25m by 15m), mineralization geometry (typical mineralization width of 3m to 8m) and probable open pit mining methods.
Search Criteria
Gold grades were interpolated into blocks meeting the following block criteria:
- Greater than 1% of the block volume is inside one of the domain envelopes;
- Blocks whose search ellipsoid includes at least five composites; and
- Blocks whose material code is set to Fresh (1), Transitional (2) or Oxide (3).
Similarly, only composites meeting the following criteria are used to interpolate any one block:
- All composites (to a maximum of 30 composites) within the search ellipsoid dimensions and search area limits outlined in the table below;
- Where more than 30 composites lie within the search ellipsoid the 30 closest composites in ellipsoid space are used;
- Maximum of six composites are used from any split quadrant of the search ellipsoid (a split-quadrant is 1/8th of the search ellipsoid dividend in the major, intermediate and minor ellipsoid axes); and
- The CODE1 and MATL values of both the composite and the block must match (i.e. only fresh composites from are used to interpolate a fresh block and vice versa for oxide).
The search ellipsoid orientations follow the Kriging axes. The search ellipsoid dimensions allow the block being interpolated to ‘see’ two sections along strike and two holes up or downdip.
Bulk Density
The bulk density profile (Figure 14-11) established for the Central Area was taken as being appropriate for the Southern Model given the similar rock types, levels of oxidation and identical mineralization and gangue mineralogy. Deep drilling in the Central Area and Harrier Area has supported the inclusion of a bulk density value of 2.78t/m 3 for material below 4500mRL. However, as the mineralization at Daley's Hill is shallower than 4500mRL, reporting of Resources for this area from the Southern Model is unchanged.
| 14.4.4 | MINERAL RESOURCE CLASSIFICATION |
Three solids were created enclosing regions of geological confidence (Measured=1, Indicated=2 and Inferred=3) and these three regions were used to code the Mineral Resource category item in the block model. The solids generally enclose areas of approximately equally spaced drilling, but also allow areas where there is reduced confidence in the geological interpretation to be reported to a lower confidence category.
In areas of the Southern Model at depth below and to the north of the Daley’s Hill Pit, the diamond drilling is on nominal 100m north spaced drill sections with 50m down dip holes spacing, and for this drill density the mineralization is broadly classified as Inferred Mineral Resource. Beneath the open pits where the drill spacing is reduced to 10m to 20m north by 10m to 15m east, mineralization is classified as Measured Mineral Resource with a halo of Indicated Mineral Resource.
The Daley’s Hill east-west structures are not well understood and as such this mineralization is classified as Inferred Mineral Resource.
173
| Technical Report | Kirkland Lake Gold |
| December 2016 | Fosterville Gold Mine |
| 14.4.5 | RESULTS |
Results for the Mineral Resources contained in the Southern Model are provided in Table 14-1.
Small oxide gold resources exist in the Daley’s Hill Area and are confined along strike from the previously mined open pit in the top 40m from surface.
The bulk of the sulfide Mineral Resources reported from the Daley’s Hill Area within the Southern Model are based on 100m by 50m spaced diamond drilling supplemented by closer spaced, but lower quality face and cross over RC drilling. Infill drilling will be required to increase resource confidence from an Inferred Mineral Resource category.
| 14.5 | ROBBIN ’ S HILL AREA |
The Robbin’s Hill Area lies northeast of the Central Area and contains the O’Dwyer’s, Robbin’s Hill, Farley’s, Sharkey’s, Woolshed and Read’s oxide pits as shown in Figure 14-1. The area can be defined as the zone east of 2,700mE, between 10,500mN and 14,000mN. The fault architecture of the Robbin’s Hill Area is much more complex than that observed in the Fosterville Fault Zone.
The controlling structural features in the area include a variety of north-trending west-dipping faults and failed anticline axes intruded by dykes.
The geology of the area was assessed by the Fosterville staff during diamond drilling activities between 2004 and 2007, reported by Reed (2007a) and reviewed twice by Stephen King (2005 and 2007). The area was also the subject of a study conducted by Chris Davis (Davis, 2006). Robbin's Hill Model resource modeling conducted by Kerrin Allwood and Simon Hitchman is reported in Allwood (2006) and Hitchman (2007). A further review of modeling in the Farley’s-Sharkey’s area is also reported in Allwood (2007). Following on from an open pit optimization study in March 2011 (Dincer, 2011) 5,257m of combined RC and diamond drilling was undertaken in the Robbin’s Hill Project area to test beneath and along strike from existing open pits. This drilling was for both open pit and underground targets occurred in the Robbin's Hill Area until August 2012, during which resource modeling was undertaken.
A short-lived sulfide open pit mining operation was completed at the O'Dwyer's South Pit in 2012 and is now the site for flotation tailing storage.
| 14.5.1 | GEOLOGICAL MODELS |
Geological modeling undertaken was essentially identical to that described for the Southern Models described above.
| 14.5.2 | DRILLING DATA |
The quality of the drilling is variable in the Robbin’s Hill Area. Drilling was conducted from 1989 to 2011, and up until 2001 drilling was focused on oxide heap leach targets and as such cheaper less precise drilling methods were used and dominate the dataset. After 2004, diamond holes were used to aid structural interpretation and often, RC pre-collars were diamond tailed.
174
| Technical Report | Kirkland Lake Gold |
| December 2016 | Fosterville Gold Mine |
The model uses more than 1,110 holes of which about 95% are RC holes and 5% are NQ2 and HQ diamond core holes. Pre-2016 drill data was treated as per previous model procedures; with data omitted where there was uncertainty of coordinates, dubious down-hole surveys and grade or geological mismatch. MineSight drill views were the primary tool used to identify data grade and geological mismatches. 2016 drill data was assessed and validated to the same standard as used in the Central and Harrier Models.
Subsequent to the drill data review, process assay data were:
- Imported from the acQuire exploration databases into MineSight using customizable parameter screens; and
- Coded for mineralization using 3D gold wireframe solids.
Compositing and Coding
Similar to the Central Area, coded Robbin’s Hill Model area drill data was composited to 2m lengths starting from the point at which the drill hole enters the mineralization envelope. If the final composite was less than 1m it was added to the previous composite making a composite with length between 2m and 3m. Final composites between 1m and 2m in length were left as is. The 2m composite lengths were chosen to reflect the anticipated minimum mining width, to allow across strike variability to be maintained within the data, and because the vast majority of RC drilling samples are 2m in width. Table 14-33 below shows the Robbin’s Hill Model composite statistics.
TABLE 14-33 COMPOSITE STATISTICS BY COMPOSITE LENGTH FOR THE ROBBIN'S HILL MODEL
| Composite Length (m) |
Number of Composites |
% of Composites |
Mean Length (m) |
Mean Grade (g/t Au) |
| <1m | 13 | 0.32 | 0.72 | 3.65 |
| ≥1and <2 | 328 | 7.98 | 1.15 | 3.21 |
| ≥2 | 3,771 | 91.71 | 2.01 | 2.12 |
| Total | 4,112 | 100 | 1.93 | 2.17 |
Variography
In all domains, the nugget effect (46% to 59%) is typical of gold deposits at Fosterville. Typically, low nugget effects elsewhere at Fosterville reflect the fine grained, disseminated nature of the sulfide minerals hosting the elements analyzed and are confirmed by the very low variability exhibited in assay QAQC data. The higher nugget effects modeled for these domains may reflect some mixing of populations, possibly owing to re-mobilization of gold by weathering resulting in erratically distributed extreme gold grades.
The longer range structures in the RH-ODW Areas possibly reflect high-grade zones occurring where faults intersect the quartz porphyry dykes. The variogram models closely follow the expected geological controls with flat to shallowly south plunging shoots in steeply west dipping faults and sub vertical porphyry contact zones.
175
| Technical Report | Kirkland Lake Gold |
| December 2016 | Fosterville Gold Mine |
| 14.5.3 | MINERAL RESOURCE MODELING |
Block Models
The most recent Robbin’s Hill Block Model was created in 2016 and has sufficient extents to contain all drilled mineralization beneath the open pits in the area, replicating model extent parameters setup in 2005. Previously, several smaller block models were used to inventory mineralization for the oxide pits in the area. These models had differing block dimensions and orientations from one another and so combining them into a single unified model was not possible.
The Robbin’s Hill Model has XYZ block dimensions of 2m (EW) by 10m (NS) by 5m (RL). The 2m width was chosen as it is approximates the minimum mining width for both open pit and underground mining. The 10m N–S block dimension is half the section spacing in the most densely drilled areas. The 5m vertical block dimension is the likely open pit mining bench height and allows sufficient resolution for future pit optimization.
TABLE 14-34 ROBBIN’S HILL BLOCK MODEL EXTENTS
| Parameter | Robbin’s Hill |
| Northing Min (m) | 10,000 |
| Northing Max (m) | 14,000 |
| Easting Min (m) | 2,900 |
| Easting Max (m) | 4,100 |
| RL Min (m) | 4,600 |
| RL Max (m) | 5,200 |
| X direction m (east) | 2 |
| Y direction m (north) | 10 |
| Z direction m (vertical) | 5 |
Historic Mineral Resource Modeling includes a previous Robbin’s Hill Resource Model (2012) and various grade control models that overlapped with the resource model and were used as a sub-set for detailed mining extraction. No active mining has been conducted within the Robbin’s Hill resource model data extents since 2012.
To facilitate renewed open pit mining in 2012 at O'Dwyer's South a Grade Control (GC) resource model was created with XYZ block dimensions of 2m (EW), 5m (NS) and 5m(RL), with the dimensions chosen to cosmetically better represent likely open pit SMU (Selective Mining Unit) volumes. The block size is identical to those that were previously in use at Harrier and John's open pits.
The Mineral Resource in the Robbin's Hill Area is shown in Figure 14-17.
176
| Technical Report | Kirkland Lake Gold |
| December 2016 | Fosterville Gold Mine |

Search Criteria
Gold and sulfur grades are only interpolated into blocks meeting the following criteria:
- Greater than 1% of the block volume is inside one of the domain envelopes; and
- Blocks whose search ellipsoid includes at least one composite.
Similar to the Central Area models, only composites meeting the following criteria are used to interpolate any one block:
- All composites to a maximum of 35 composites within the search ellipsoid dimensions and search area limits;
- Where more than 35 composites lie within the search ellipsoid the 35 closest composites in ellipsoid space are used; and
- The mineralization code of both the composite and the block must match (i.e. only composites from within the same mineralization envelope are used to interpolate a block).
The search ellipsoid orientations follow interpreted variogram structures. The search ellipsoid within domains follows the dimensions of the ranges set in the variograms allow the block being interpolated to ‘see’ two sections along strike and two holes up or downdip.
177
| Technical Report | Kirkland Lake Gold |
| December 2016 | Fosterville Gold Mine |
To check the suitability of the search ellipsoids used, search ellipsoids were checked in MineSight to allow visual inspection of the composites to be used and the suitability of the interpolation direction within the domain.
Bulk Density
The bulk density profile established for the Central Area was taken as being appropriate for the Robbin’s Hill Model area given the similar rock types, levels of oxidation and identical mineralization and gangue mineralogy.
| 14.5.4 | MINERAL RESOURCE CLASSIFICATION |
No Mineral Resources in the Robbin’s Hill Area have been categorized as Measured Mineral Resources owing to drill hole data spacing and uncertainties in the quality of the largely historical data used to construct this model.
Two solids were created enclosing regions of geological confidence (Indicated or Inferred Mineral Resources) and these regions were in turn used to identify Inferred and Indicated Resource for reporting purposes. The solids generally enclose areas of approximately equally spaced drilling, but also allow areas where there is reduced confidence in the geological interpretation to be reported to a lower confidence category. The Indicated Mineral Resource solid is always surrounded by a halo of Inferred Resource. There is some modelled mineralization falling outside both the Indicated and Inferred solids. These areas were not reported as Mineral Resource and were flagged as non-resource zones (Figure 14-17).
| 14.5.5 | RESULTS |
The drilling conducted during 2016 has yielded significant mineralization of moderate grade in the vicinity East of Robbin’s Hill pit on Farley’s Fault on sections 12,600–12500mN. With a combination of existing drilling, drill results have increased the Inferred Mineral Resource in this area. (Figure 14 18).
Oxide gold resources exist in the Robbin’s Hill Model area, notably east of Sharkey’s Pit where exploration drilling in 2007 discovered shallow oxide mineralization. Elsewhere remnant low-grade oxide gold mineralization is found below and along strike from previously mined open pits.
Resources in the Farley’s-Sharkey’s area are based on modern face sampling RC methods and substantial diamond drilling and as such the geological information is better than elsewhere in the modelled area.
178
| Technical Report | Kirkland Lake Gold |
| December 2016 | Fosterville Gold Mine |

179
15 MINERAL RESERVE ESTIMATES
The current Mineral Reserve estimate, from the available Mineral Resource estimates, is presented below in Table 15-1. Mineral Reserves are subdivided on the basis of accessing decline i.e. Central, Phoenix and Harrier. A further breakdown of the Phoenix Mineral Reserves is presented in Table 15-2, where reserves on the Eagle structure are separated.
CIL Residue Mineral Reserves are distinguished from in situ Mineral Reserves in Table 15-1 and Table 15-2 on the basis of differing recovery assumptions.
TABLE 15-1 MINERAL RESERVES FOR FGM AS AT DECEMBER 31, 2016
| Classification | Proven | Probable | Total | ||||||
| Tonnes (kt) |
Grade (g/t Au) |
In situ Gold (kOz) |
Tonnes (kt) |
Grade (g/t Au) |
In situ Gold (kOz) |
Tonnes (kt) |
Grade (g/t Au) |
In situ Gold (kOz) | |
| Underground | |||||||||
| Central | 33 | 5.16 | 5 | 91 | 4.73 | 14 | 123 | 4.84 | 19 |
| Phoenix | 248 | 8.86 | 71 | 865 | 11.48 | 319 | 1,113 | 10.90 | 390 |
| Harrier | 0 | 0.00 | 0 | 321 | 7.83 | 81 | 321 | 7.83 | 81 |
| Surface | |||||||||
| 0 | 0.00 | 0 | 0 | 0.00 | 0 | 0 | 0.00 | 0 | |
| Total | 280 | 8.43 | 76 | 1,276 | 10.08 | 414 | 1,557 | 9.78 | 490 |
| Residues | |||||||||
| CIL Residues | 616 | 7.73 | 153 | 0 | 0.00 | 0 | 616 | 7.73 | 153 |
| Total | 616 | 7.73 | 153 | 0 | 0.00 | 0 | 616 | 7.73 | 153 |
Notes:
| 1. |
CIM definitions (2014) were followed in the estimation of Mineral Reserves. |
| 2. |
For the Mineral Reserves estimate, the Qualified Person is Ion Hann. The Mineral Reserve estimate used a gold price of US$1,200 per ounce (AUD$1,500 per ounce). Cut-off grades applied ranged from 1.6 g/t Au to 3.1 g/t Au for underground sulfide ore depending upon width, mining method and ground conditions. |
| 3. |
Dilution and mining recovery factors as per Table 15-3 and Table 15-4 were applied to stopes within the Mineral Reserves estimate. |
| 4. |
Mineral Reserves are rounded to 1,000t, 0.01 g/t Au and 1koz. Minor discrepancies in summation may occur due to rounding. |
| 5. |
CIL residues are stated as contained ounces – 25% recovery is expected. Recoveries are based on laboratory and processing plant test work and operating experience. |
180
| Technical Report | Kirkland Lake Gold |
| December 2016 | Fosterville Gold Mine |
TABLE 15-2 MINERAL RESERVES (WITH EAGLE SUBDIVISION) FOR FGM AS AT DECEMBER 31, 2016
| Classification | Proven | Probable | Total | ||||||
| Tonnes (kt) |
Grade (g/t Au) |
In situ Gold (kOz) |
Tonnes (kt) |
Grade (g/t Au) |
In situ Gold (kOz) |
Tonnes (kt) |
Grade (g/t Au) |
In Situ Gold (kOz) | |
| Underground | |||||||||
| Central | 33 | 5.16 | 5 | 91 | 4.73 | 14 | 123 | 4.84 | 19 |
| Phoenix | 183 | 7.82 | 46 | 528 | 12.16 | 206 | 711 | 11.04 | 252 |
| Eagle | 65 | 11.79 | 25 | 337 | 10.41 | 113 | 402 | 10.63 | 137 |
| Harrier | 0 | 0.00 | 0 | 321 | 7.83 | 81 | 321 | 7.83 | 81 |
| Surface | |||||||||
| 0 | 0.00 | 0 | 0 | 0.00 | 0 | 0 | 0.00 | 0 | |
| Total | 280 | 8.43 | 76 | 1,276 | 10.08 | 414 | 1,557 | 9.78 | 490 |
| Residues | |||||||||
| CIL Residues | 616 | 7.73 | 153 | 0 | 0.00 | 0 | 616 | 7.73 | 153 |
| Total | 616 | 7.73 | 153 | 0 | 0.00 | 0 | 616 | 7.73 | 153 |
Notes:
| 1. |
CIM definitions (2014) were followed in the estimation of Mineral Reserves. |
| 2. |
For the Mineral Reserves estimate, the Qualified Person is Ion Hann. The Mineral Reserve estimate used a gold price of US$1,200 per ounce (AUD$1,500 per ounce). Cut-off grades applied ranged from 1.6 g/t Au to 3.1 g/t Au for underground sulfide ore depending upon width, mining method and ground conditions. |
| 3. |
Dilution and mining recovery factors as per Table 15-3 and Table 15-4 were applied to stopes within the Mineral Reserves estimate. |
| 4. |
Mineral Reserves are rounded to 1,000t, 0.01 g/t Au and 1koz. Minor discrepancies in summation may occur due to rounding. |
| 5. |
CIL residues are stated as contained ounces – 25% recovery is expected. Recoveries are based on laboratory and processing plant test work and operating experience. |
| 15.1 | MINERAL RESERVE ESTIMATE |
The initial stage of the Mineral Reserve estimation process was the revision of the Mining Method Selection chart. The mining methods that were considered for the Mineral Reserve estimation process were sill driving, up-hole open stoping, up-hole stoping with fill, underhand open stoping with chain and rib pillars and transverse open stoping. These methods were selected based upon previous experience at the Fosterville mine or because they were considered suitable for the ore zone geometry and geotechnical conditions present and expected.
| 15.1.1 | OPEN STOPE DESIGN |
Stope reserve shapes were created to cover all active and planned mining areas. These stope shapes did not necessarily reflect the final stope strike and/or crown pillar dimensions. Stoping widths vary from 3m out to 10m. Mining method selection criteria and applied design parameters are described in the Mining Methods Selection process (see Figure 15-2).
181
| Technical Report | Kirkland Lake Gold |
| December 2016 | Fosterville Gold Mine |
The open stope reserve wireframe design parameters applied were:
- Strike length dictated by grade distribution in block model;
- Minimum true width of 2.5m;
- Maximum height of 20m vertical from backs to floor; and
- Internal waste incorporated within the stope block design.

182
| Technical Report | Kirkland Lake Gold |
| December 2016 | Fosterville Gold Mine |

183
| Technical Report | Kirkland Lake Gold |
| December 2016 | Fosterville Gold Mine |
Mining recovery from open stopes at Fosterville is principally influenced by the following factors:
- Accuracy of the geological interpretation;
- Accuracy of the production hole drilling;
- Stope dimensions;
- Sill drive dimensions and position relative to bench stope;
- Presence or absence of adjacent filled voids and pillars; and
- Geotechnical integrity of stope and sill drive walls.
The above factors manifest themselves as ore loss in the following ways:
- The need for planned pillars due to accessing of ore blocks (i.e. top down mining sequence);
- Frozen rings due to ground movement or out of sequence firing;
- Bridged stopes;
- Failure of the stope to break back to a main structural plane of weakness; and
- Unplanned ore pillars left to improve ground support.
Unplanned dilution in open stopes at Fosterville is a function of the following factors:
- Regional geotechnical conditions;
- Location of sill drives relative to the open stope;
- Width of sill drives relative to the open stope width;
- Production drilling accuracy;
- Quantity, quality and type of ground support in sill drive walls;
- Speed of ore extraction from active stopes; and
- Length of time sill drives have been open before stoping commences.
Inclusive within the production mining cycle are systematic cavity monitoring surveys, data from which is feedback into the understanding and scaling of dilution factors by area.
In order to correctly apply recovery and dilution factors to all stopes in the Mineral Reserve, factors such as ore body dip, rock RQD and development and stope sequence were considered.
Table 15-3 and Table 15-4 show the recovery and dilution factors that were applied to the reserve blocks:
184
| Technical Report | Kirkland Lake Gold |
| December 2016 | Fosterville Gold Mine |
TABLE 15-3 RECOVERY AND DILUTION FACTORS FOR THE RESERVE BLOCKS AS DISPLAYED IN FIGURE 15-3
| Description | Recovery Factor - Tonnes |
Dilution Factor - Tonnes |
Comments |
| Stoping - Phoenix | 73% | 28% | Top down, crown and rib pillars, and/or CRF, underhand open stoping with chain and rib pillars |
| Stoping - Central | 76% | 24% | Top down, crown and rib pillars, and/or CRF, underhand open stoping with chain and rib pillars |
| Stoping – Harrier/Osprey | 77% | 23% | Top down, crown and rib pillars, and/or CRF, underhand open stoping with chain and rib pillars |
| Strike Development | 100% | 15% |
Notes:
| 1. |
Dilution and Recovery factors are assigned based on sequence, angle of the hangingwall, strike length of panel and surrounding voids whether open, failed or filled, both laterally and vertically (and the likelihood of adjacent panels failed). |
| 2. |
Primary stopes are in-situ with solid unfired material on all extremities excluding development. |
| 3. |
Secondary panels are those adjacent to a single panel either laterally or vertically that may or may not be filled. |
| 4. |
Tertiary panels are those adjacent to two or more panels either laterally or vertically that may or may not be filled. |
| 5. |
Table 15-4 provides guidelines for individual panel recovery and dilution for specific mining scenarios. |
185
| Technical Report | Kirkland Lake Gold |
| December 2016 | Fosterville Gold Mine |

186
| Technical Report | Kirkland Lake Gold |
| December 2016 | Fosterville Gold Mine |

187
| Technical Report | Kirkland Lake Gold |
| December 2016 | Fosterville Gold Mine |
Gold Cut-Off Grades
Table 15-5 shows the calculated cut-off grades used in the estimation of the Mineral Reserve. Cost assumptions are based on the 2017 budget (inclusive of royalties) and 2016 full year performance.
TABLE 15-5 MINERAL RESERVE GOLD CUT-OFF GRADES
| Description | g/t Au |
| Open Stope – full | 3.1 |
| Open Stope - marginal | 1.6 |
| Development - marginal | 3.5 |
For certain other situations, a lower cut-off grade is applied. For development, which is justified for other reasons (i.e. access to a higher grade block or infrastructure considerations), the marginal cut-off grade is applied to reflect that the material only has to cover the non-mining costs to break even. This is only applied if the development material had to be trucked to surface anyway and that it is not displacing higher-grade ore from the mill. Likewise, for incremental stoping production where the development has already been mined (i.e. for access to a higher-grade block), the marginal cut-off grade is applied to reflect that the development cost has already been incurred.
Stope and development shapes are limited in their extremity by the application of appropriate COGs (Table 15-5) and a full conceptual design is subsequently created around the resultant shapes. This design includes, but is not necessarily limited to; decline design, associated level infrastructure and vertical development.
Physicals generated from the design are applied against budget costs and assumptions to provide an economic model by level and area (Table 15-6). This model is capable of representing various cost structures and is utilized as the final hurdle point for determination of inclusion/exclusion of material into the mine plan and reserve statement.
188
| Technical Report | Kirkland Lake Gold |
| December 2016 | Fosterville Gold Mine |

189
| Technical Report | Kirkland Lake Gold |
| December 2016 | Fosterville Gold Mine |
| 15.1.2 | DEPLETION AND RESULTS |
The Mineral Reserves reported above are the result of work based on data to December 31, 2016 and reported by Kirkland Lake Gold in accordance with NI43-101. The evaluation models have been depleted for material mined up to December 31, 2016. The process involved the generation of surveyed solid models for the mined development and stope areas and then running a depletion process in order that the depleted areas can be excluded from the Mineral Reserve.
Results for the Mineral Reserves contained in the Fosterville operating areas are provided in Table 15-1.
Infrastructure required for the exploitation of the stated reserves are either in place or have been planned to be developed within the LOM plan generated through the reserving process. All works fall within the granted mining lease boundaries and are covered within the existing approved work plan. It is unlikely that either infrastructure or permitting could materially affect the stated reserve position.
There are no known political, legal, environmental or other risks that could materially affect the potential development of the Mineral Reserves.
190
| Technical Report | Kirkland Lake Gold |
| December 2016 | Fosterville Gold Mine |
16 MINING METHODS
Since the completion of the Harrier Open Cut Mine in early December 2007, the sole source of ore had been the underground operations until Q2 2011 when ore feed became available from a series of open pit cut backs on the Harrier Pit, John’s Pit and O'Dwyer's South Pit. Since the completion of O'Dwyer's South cut back in Q4 2012, the sole source of ore has been from the underground operations. The current Life of Mine (LOM) plan contains ore sourced from underground operations only (Figure 16-1).

The underground mine commenced declining in March 2006 with production first recorded in September 2006. Development and stoping have been conducted in the Phoenix, Falcon, Ellesmere, Kink, Vulture, Raven, Robin and Harrier ore bodies since that time. As at January 1, 2017 works are planned to continue in the Phoenix, Central, Harrier and Robin (Robin material is included with Central material in the reserve table (Table 15-1) ore bodies. All areas are planned to be extracted using open stoping techniques with the application of Cemented Rock Fill (CRF) where applicable and practical. Selection of the specific mining method within the open stoping regime is based upon previous experience at the Fosterville Mine and expectations of ore zone geometry and geotechnical conditions (Figure 15-2). A standard level interval of 20 vertical meters can be applied across all mining areas. However, this can be varied as is required to maximize the extraction of the economic material. The Phoenix to 4240rl, Harrier below 4500rl, Central and Robin ore bodies are accessed from a footwall decline position while the Phoenix below 4240mRL and Harrier ore body above 4500mRL are accessed from the hangingwall.
191
| Technical Report | Kirkland Lake Gold |
| December 2016 | Fosterville Gold Mine |
Underground mining is conducted using a conventional fleet including jumbos, production drills, loaders, trucks and ancillary equipment. Current mining is undertaken as owner miner.
The production forecast contained in Table 16-1 forms part of the latest Life-of-Mine (LOM) Model. This LOM Model was for the period 2017 (FY-17) to 2023 (FY-23).
TABLE 16-1 PRODUCTION FORECAST FOR THE YEARS 2017-2023 (CURRENT LOM PLAN)
| Fosterville Gold Mine | LOM Model | |||||||
| LOM | FY - 17 | FY - 18 | FY - 19 | FY - 20 | FY - 21 | FY - 22 | FY - 23 | |
| Total ore mined (t) | 3,838,402 | 688,402 | 600,000 | 650,000 | 700,000 | 700,000 | 500,000 | |
| Ore Milled (t) | 3,838,402 | 688,402 | 600,000 | 650,000 | 700,000 | 700,000 | 500,000 | |
| Ore Milled Head Grade (g/t) | 8.28 | 7.34 | 9.32 | 8.69 | 8.43 | 8.43 | 7.39 | |
| Recovery (%) | 89.9 | 89.7 | 90.0 | 90.0 | 90.0 | 90.0 | 90.0 | |
| Gold Produced (Oz) | 919,392 | 145,725 | 161,808 | 163,443 | 170,749 | 170,749 | 106,917 | |
| Tails Retreatment (Oz) | 41,594 | 594 | 600 | 600 | 600 | 600 | 600 | 38,000 |
| Total Gold Produced (Oz) | 960,986 | 146,319 | 162,408 | 164,043 | 171,349 | 171,349 | 107,517 | 38,000 |
192
| Technical Report | Kirkland Lake Gold |
| December 2016 | Fosterville Gold Mine |
17 RECOVERY METHODS
Since the commissioning of the processing plant in 2004, all processing models for the mill have been based on actual plant performances. The processing budget takes into consideration the mining schedule (ore source location, tonnes to be mined and gold grade), and predicted sulfur grades to be processed. Recovery data for Fosterville is detailed in Table 17-1.
TABLE 17-1 ACTUAL PLANT PERFORMANCES (2008-2016)
| Plant Parameter | 2008 | 2009 | 2010 | 2011 | 2012 | 2013 | 2014 | 2015 | 2016 | |
| Tonnes Milled | t | 540,725 | 781,878 | 817,535 | 785,503 | 786,572 | 792,166 | 814,835 | 703,788 | 693,066 |
| Sulfur Feed grade | % | 1.64 | 1.71 | 1.6 | 1.59 | 1.44 | 1.35 | 1.36 | 1.34 | 1.71 |
| Feed Grade | g/t Au | 5.42 | 4.79 | 4.57 | 4.87 | 4.36 | 4.53 | 4.62 | 6.11 | 7.55 |
| Flotation recovery | % | 92.4 | 96.2 | 96.2 | 96.7 | 95.0 | 95.9 | 95.7 | 96.6 | 97.0 |
| Gravity gold recovery | % | 12.9 | ||||||||
| BIOX® recovery | % | 97.8 | 99.0 | 98.7 | 98.4 | 97.8 | 98.0 | 98.6 | 98.5 | 98.4 |
| Sulfide Oxidation | % | 97.5 | 96.3 | 98.6 | 97.7 | 97.7 | 98.2 | 98.1 | 98.3 | 97.7 |
| CIL recovery | % | 78.7 | 86.2 | 79.8 | 81.3 | 80.5 | 86.2 | 87.1 | 90.9 | 89.9 |
| Heated leach recovery | % | 0.0 | 0.3 | 7.1 | 6.0 | 7.6 | 4.5 | 4.6 | 2.0 | 3.7 |
| Overall Leach recovery | % | 78.7 | 86.6 | 86.9 | 87.3 | 88.1 | 90.7 | 91.6 | 92.9 | 93.6 |
| Overall Plant recovery | % | 71.2 | 85.0 | 82.5 | 83.0 | 82.0 | 85.2 | 86.5 | 88.5 | 90.1 |
| Mining Au produced | oz | 66,984 | 102,336 | 99,032 | 102,048 | 90,358 | 98,354 | 104,518 | 122,362 | 151,585 |
| Retreat: Leach tails: tonnes | t | 0 | 9,634 | 13,222 | 4,495 | 2,623 | 854 | 4,951 | 4,519 | 2,141 |
| Retreat: Leach tails: grade | g/t Au | 0 | 10.25 | 10.37 | 8.27 | 6.98 | 7.05 | 10.48 | 10.75 | 7.90 |
| Retreat: Leach tails: recovery | % | 0 | 32.5 | 30.3 | 12.2 | 12.1 | 35.2 | 49.0 | 46.3 | 30.8 |
| Retreat: Leach tails: Au produced | oz | 0 | 1024 | 1,410 | 154 | 80 | 69 | 824 | 734 | 169 |
| Total gold produced | oz | 66,984 | 103,360 | 100,442 | 102,201 | 90,439 | 98,423 | 105,342 | 123,096 | 151,755 |
The process plant incorporates the following unit operations:
- Single stage crushing with a primary jaw crusher;
- Open stockpile with reclaim tunnel;
- Semi-autogenous grinding (SAG) mill;
- Flotation circuit to produce a gold bearing sulfide mineral concentrate and a barren residue;
- A gravity circuit recovering coarser gold from the flotation concentrate. Gravity circuit concentrate is direct smelted;
- A Bio-oxidation circuit consisting of BIOX® reactors to oxidize the flotation concentrate, releasing gold from the sulfide mineral matrix;
- A three-stage CCD circuit to separate the gold bearing oxidized solid residue from the solubilized acid oxidation products;
193
| Technical Report | Kirkland Lake Gold |
| December 2016 | Fosterville Gold Mine |
- A liquor neutralization circuit to neutralize acid and precipitate arsenic as stable basic ferric arsenate and sulphate as calcium sulphate (gypsum) using both ground limestone and lime slurries;
- A limestone grinding facility comprising a single wet ball mill operated in closed circuit with hydrocyclones to produce ground limestone slurry for neutralization of sulfuric and arsenic acids produced from oxidation of gold bearing sulfide minerals;
- Carbon-in-leach (CIL) circuit, with a pH adjustment tank at the head of the circuit, to leach gold from oxidized material and load the cyanide soluble gold onto activated carbon;
- Heated Leach (HL) circuit to combat preg-robbing capabilities of the non-carbonaceous carbon always present in the Mill feed. Specialized in-house technology unique to Fosterville; and
- Pressure Zadra elution circuit to remove gold from carbon, followed by recovery by electrowinning and smelting to doré.
A schematic flow sheet detailing unit operations is presented in Figure 17-1.
The plant was laid out on either side of a central rack in order to facilitate the distribution of reagents, services, and piping arrays. Individual plant areas are separately bunded to isolate and contain spillage. Storm water and abnormal spillage events report to an existing drainage channel, which discharges to a separate containment dam.
The layout of the comminution circuit allows for installation of a pebble crushing circuit should it be required, and a secondary ball mill to increase grinding circuit capacity. Space was left in the area layouts for additional tank farms and equipment to accommodate a nominal increase in plant capacity. Space exists to the east of the plant site to duplicate existing facilities to double plant throughput if required.
Plant commissioning began in November 2004 with first gold production in Q1 of 2005.
194
| Technical Report | Kirkland Lake Gold |
| December 2016 | Fosterville Gold Mine |

Crushing and Milling
The crushing circuit has the capacity to operate 24 hours per day, 7 days/week, at the design availability of 80%.
Run of Mine (ROM) ore is reclaimed from stockpiles on the ROM pad and fed to a bin by front-end loader, blending the ore in the process. Ore is then fed to a 760mm x 1,372mm single toggle jaw crusher by a vibrating grizzly feeder and minus 100mm crushed ore is conveyed to a coarse ore open stockpile with reclaim tunnel providing feed to a semi-autogenous grinding (SAG) mill.
Dust suppression measures are installed at the ROM bin. The crusher discharge and conveyor transfer points both being fitted with dust collectors.
Crushed ore is fed at a controlled rate onto a conveyor feeding 3,500kW SAG mill (~6.1m in diameter x 6.1m) . The ore is ground to a P80 of 75µm in closed circuit with hydrocyclones to liberate sulfide minerals containing gold from the barren gangue minerals. The milling circuit operates 24 hours per day with a throughput of up to 120 dry tph.
Flotation
Hydrocyclone overflow from the SAG mill gravitates to the flotation circuit where the gold containing sulfide minerals are concentrated into a flotation concentrate containing about 8% to 10% of the feed mass with a barren flotation residue, which is rejected from the process.
195
| Technical Report | Kirkland Lake Gold |
| December 2016 | Fosterville Gold Mine |
The design basis for the flotation circuit is to maximize gold recovery to a concentrate grading approximately 20% S. The flotation circuit consists of a rougher-scavenger cleaner circuit. Rougher concentrate passes directly to final concentrate, while scavenger concentrate passes to the cleaning circuit for upgrading. Cleaner tailing is recycled to the head of the rougher circuit.
Flotation reagents such as the following are added to the hydrocyclone overflow launder and flash flotation feed:
- Activator - copper sulphate;
- Collector - potassium amyl xanthate (PAX); and
- Frother.
Reagent selectivity is a key aspect of the flotation circuit management, based not just on performance, but also toxicity aspects to the downstream Bacterial Oxidation Circuit.
Flotation residue gravitates to a tailings hopper and then is pumped to the flotation residue storage facility together with the products from neutralization of the BIOX® liquor.
Flotation concentrate is thickened in a high-rate thickener prior to feeding the BIOX® circuit.
Gravity Recoverable Gold
With recent changes in the ore body showing increased occurrences of visible gold, a gravity recoverable gold circuit was constructed in Q1 2016 and commissioned in April 2016.
The gravity recoverable gold circuit is installed in the flotation concentrate regrind circuit and continuously processes 100% of the recirculating load. A Knelson concentrator is used as the primary concentrating device, with Knelson concentrate passing to a surge tank. On a day shift basis only, gravity concentrate is removed from the day surge tank and processed over a secondary concentrating Gemini GT1000 table. GT1000 concentrate is then tertiary processed over a GT250 Gemini table. All table tails are passed directly back to the regrind mill recirculating load where they pass back through the Knelson concentrator.
Final tabling room concentrate is calcined in an oven with oven exhaust being wet scrubbed. Calcine concentrate is direct smelted to doré bars.
Oxidation - BIOX®
Due to the different design availabilities between the milling/flotation circuits and BIOX® circuit, and the need for steady operation of the BIOX® circuit, a surge tank with a live capacity of about 48 hours acts as a buffer between the circuits.
The BIOX® bacteria are sensitive to chloride levels in the water, and management of BIOX® feed dilution water quality to <1,000ppm Cl- is critical for the health of the BIOX® circuit. Likewise, cyanide and thiocyanate species are also toxic materials to the bacteria, hence the Flotation and Neutralization waters, plus CIL decant liquors are managed separately at the Fosterville operations to eliminate any processing risks.
Nutrient solution is dosed to the feed splitter box to maintain the correct levels of nitrogen (N), potassium (K) and phosphorous (P) levels in the BIOX® reactors.
196
| Technical Report | Kirkland Lake Gold |
| December 2016 | Fosterville Gold Mine |
The BIOX® culture is kept active in the reactors by controlling the slurry conditions within specific ranges. The oxidation reactions are exothermic and it is necessary to constantly cool the slurry. The reactors are equipped with cooling coil baffles through which cooling water is circulated to control the slurry temperature at about 43ºC in each reactor.
Oxygen requirements for sulfide oxidation are significant and medium pressure air is injected into each of the reactors.
The slurry pH in each of the reactors is controlled between 1.0 and 1.6 by addition of ground limestone. Hence the corrosive nature of the BIOX® slurry and the potential risk for elevated chloride levels resulted in selection of SAF 2205 stainless steel for equipment in the BIOX®, CCD, and neutralization circuits.
The oxidized product discharged from the final secondary BIOX® reactor gravitates to a product hopper from where it is pumped to the first of three CCD thickeners.
During bio-oxidation iron, sulfur and arsenic is solubilized and is washed from the solid oxidized gold containing residue in the series of three CCD thickeners. A three-stage CCD circuit with a wash ratio of 4.0 is used to ensure cyanicides, soluble arsenic and acid is reduced to levels acceptable in the oxidized concentrate prior to the CIL process. Process water is used as wash water in the CCD circuit and is added to the feed tank ahead of the third (last) CCD thickener. The underflow from the last CCD thickener (washed product) is pumped to an agitated pH adjustment tank ahead of the CIL circuit.
The acidic solution overflowing the first CCD thickener is pumped to the first of six agitated neutralization tanks in series and the solution flows from tank to tank via launders. By-pass launders allow tanks to be taken off line for cleaning and maintenance. In the neutralization circuit the majority of the sulfuric acid is neutralized and precipitated as calcium sulphate (gypsum) and the soluble arsenic and iron precipitated as stable basic ferric arsenate.
The neutralized effluent gravitates to a flotation residue hopper and is pumped with flotation residue to the residue storage facility.
Mozley Cyclones
Ahead of the BIOX® surge tank, the Mozley de-sliming cyclones were installed in April 2008. The Mozley cyclones are used when the feed blend to the flotation circuit is more than 0.3% NCC. The rougher and cleaner concentrate from the flotation concentrate is run through the Mozley cyclones.
The cyclone clusters come in two sets of 20 cyclones and have a typical spigot /vortex finder arrangement of 2.2/7.0mm. The cyclones are fed at a pressure of 250Kpa resulting in typical mass split of 60% to the underflow. Typical feed rate of 40 to 50m3/hr @ 16% solids with 30 to 40m3/hr at 5% to 8% solids reporting to the overflow tailings.
Leaching
Six adsorption tanks are identical in size at 190m3 with a total circuit residence time of about 48 hours at a 30% pulp density. Test-work indicates that the leaching of the oxidized residue plateaus at 36 to 48 hours. Underflow from the last CCD thickener is pumped to the pH adjustment tank and lime slurry is used to neutralize residual acid and raise the pH of the pulp to 11.
197
| Technical Report | Kirkland Lake Gold |
| December 2016 | Fosterville Gold Mine |
Carbon concentrations (20g/L–30g/L) are maintained in all tanks to ensure high gold adsorption efficiency and achieve a low soluble tail. The last CIL tank can be used as tails retreat feed tank.
Heated leach
CIL discharge is fed to heated leach circuit, which was commissioned in April 2009. The process utilizes heat from steam injection and caustic to facilitate gold release from native carbon.
The heated leach circuit consists of 6 x 75m3 tanks with a residence time of 8 to 12 hours. The first three tanks are heated. The last three tanks are cooled to avoid loss of gold in solution. The heated leach process is effective in destroying WAD cyanide to < 1ppm and has replaced the former detoxification circuit.
Elution and Gold Electro-winning
The following operations are carried out in the elution and gold room areas:
- Acid washing of carbon;
- Stripping of gold from loaded carbon using a pressure Zadra elution circuit;
- Electro-winning of gold from pregnant solution; and
- Smelting of electro-winning and gravity products.
The elution and gold room areas operate up to seven days per week, with the loaded carbon recovery on nightshift and the majority of the elution occurring during dayshift. The 3.5t pressure Zadra elution circuit consists of separate rubber lined acid wash and stainless steel elution columns.
Energy, water and major process reagents consumed by the processing plant are all readily available in Australia. FGM do not anticipate there to be any significant increases or decreases to the current consumption rates.
198
| Technical Report | Kirkland Lake Gold |
| December 2016 | Fosterville Gold Mine |
18 PROJECT INFRASTRUCTURE
All project infrastructures are in place servicing mining and processing operations (Figure 18-1).
| 18.1 | SURFACE INFRASTRUCTURE |
| 18.1.1 | PLANT |
The process plant site was selected close to the western boundary of the Fosterville Mine Lease, as it:
- Offers easy access from the existing public road system;
- Minimizes haulage distances from mining operations, particularly, the underground portal location; and
- Minimizes the potential for noise impact on nearby residential areas to the east and south by allowing waste dumps and noise abatement bunds to be constructed to the east of the plant site.
The process plant has a nominal capacity of 830,000tpa and incorporates the following unit process operations (Figure 18-2):
- Single stage crushing with a primary jaw crusher;
- Open stockpile with reclaim tunnel;
- Semi-autogenous grinding (SAG) mill;
- Flotation circuit to produce a gold bearing sulfide mineral concentrate and a discardable barren residue;
- A gravity gold recovery circuit consisting of a Knelson concentrator and two Gemini tables;
- A bank of de-sliming hydrocyclones for removing native carbon from flotation concentrate;
- Bio-oxidation circuit consisting of BIOX® reactors to oxidize the flotation concentrate, releasing gold from the sulfide mineral matrix;
- A three stage CCD circuit to separate the gold bearing oxidized solid residue from solubilized acid oxidation products;
- A liquor neutralization circuit to neutralize acid and precipitate arsenic as stable basic ferric arsenate and sulphate as calcium sulphate (gypsum) using both ground limestone and lime slurries;
- A limestone grinding facility comprising a single wet ball mill operated in closed circuit with hydrocyclones to produce ground limestone slurry for neutralization;
- Carbon-in-leach (CIL) circuit, with a pH adjustment tank at the head of the circuit, to leach gold from oxidized material and load the cyanide soluble gold onto activated carbon;
- A heated leach circuit consisting of 6 x 75m3 tanks to recover ‘preg-robbed’ gold from native carbon; and
- Pressure Zadra elution circuit to remove gold from carbon, followed by recovery by electrowinning and smelting to doré.
The plant is laid out on either side of a central rack in order to facilitate the distribution of reagents, services and inter-area piping. Individual plant areas are separately bunded to isolate and contain spillage. Storm water and abnormal spillage events report to an existing drainage channel, to the west of the plant area, which discharges to an existing containment dam to the north.
199
| Technical Report | Kirkland Lake Gold |
| December 2016 | Fosterville Gold Mine |

200
| Technical Report | Kirkland Lake Gold |
| December 2016 | Fosterville Gold Mine |

201
| Technical Report | Kirkland Lake Gold |
| December 2016 | Fosterville Gold Mine |
| 18.1.2 | BUILDINGS |
The site buildings comprise of administration, processing and mining office complexes, toilet/shower/change room facilities, store/warehouse, light vehicle and heavy vehicle workshops, a surface maintenance workshop and core shed facility.
The site is serviced by security infrastructure, phone and internet services.
| 18.1.3 | POWER |
Site power is supplied by the Fosterville Terminal Station (FVTS), which is a zone substation on the 220kV power line from Bendigo to Shepparton (BETS-SHTS). The terminal station is owned by Fosterville, operated by SP Ausnet and maintained by Powercor.
The terminal station has a single 15/20MVA ONAN/ONAF 220/11kV transformer.
An overhead 11kV power line runs from the FVTS to the processing plant. The power line is 2,800m long at consists of 19 poles.
At pole 9 there is an 11kV switch room, which supplies the U/G operation.
The processing plant has five 11kV/ 415V transformers and low voltage MCC’s to supply and control the processing plant.
There is also an 11kV 3,500kW SAG Mill motor and three 11kV 750KW motors for the BIOX® Blowers.
The processing plant also has a Power Factor Correction unit.
Power consumption in the processing plant is approximately 7,000kw at a power factor of 0.98.
There are also a couple of 22kV supplies into site, which supply remote areas for site water management as well as the main administration offices.
The site also has a 2.5km long 11kV cable from the U/G settling dams to the in pit Tails MCC, which has a 750KVA 11kv/415V transformer.
| 18.1.4 | TAILINGS |
There are two separate residue streams at Fosterville, a flotation/neutralization residue (Figure 18-3) and a cyanide bearing residue (Figure 18-4):
|
• |
The flotation / neutralization residue is a combination of flotation tails (95%) which is ground ore and neutralized liquor containing precipitated solids (5%) from the oxidation process. These tailings are either stored within an above ground paddock style Residue storage facility, or within an In-Pit facility. Fosterville operates Victoria’s first In-Pit facilities, whereby through extensive hydro-geological modeling, abandoned oxide ore pits where identified as preferred storage options. In-Pit facilities offer significantly lower capital and operating costs compared to above ground facilities, and also contribute to the overall rehabilitation of the mine site. Water from these facilities is reused back through the milling, flotation and bacterial oxidation processes. The starter embankment for TSF#4 was constructed in 2015 and has the capacity to hold two years’ worth of flotation/neutralization tailings. Fosterville currently has at least four years of permitted (regulator approved) storage capacity. Therefore, Fosterville has a permitted flotation/neutralization storage plan until 2020. Planning of future flotation / neutralization storage is underway to provide adequate storage for LOM; and |
202
| Technical Report | Kirkland Lake Gold |
| December 2016 | Fosterville Gold Mine |
| • |
Cyanide bearing leach residue: The leaching circuit uses cyanide to extract the gold and subsequently the liquor possesses traces of cyanide species. As a consequence, the leach residue is deliberately stored separately to that of the flotation residue in a HDPE or clay lined storage facility and only utilized back within the leaching circuits. Tailings is excavated annually from one of the CIL TSF’s and placed onto one of the CIL hardstands. Fosterville has at least two years of storage capacity available on existing CIL Hardstands. In 2017, Fosterville will seek regulatory approval for further CIL Hardstand upgrades. |

203
| Technical Report | Kirkland Lake Gold |
| December 2016 | Fosterville Gold Mine |

204
| Technical Report | Kirkland Lake Gold |
| December 2016 | Fosterville Gold Mine |
| 18.2 | UNDERGROUND INFRASTRUCTURE |
| 18.2.1 | POWER |
Power for the underground operations is drawn from Pole 9 11kV Switch Room that connects to the
Fosterville Terminal Station (FVTS) Transformer located adjacent to Daley’s Hill.
Three 11,000 volt feeds each enter the underground workings at:
- Harrier at the 4775 Sub Station, via the Harrier vent shaft;
- Phoenix at the 5031 Sub Station, via a service hole; and
- Ellesmere at the 4968 Sub Station, via a service hole.
From these locations low voltage (1000 volt) is reticulated to the working areas via cable and distribution boxes. Further 11,000 volt sub-stations are cascaded from the above named primary points as mine working load requires.
Existing underground power reticulation has been sized to meet the designed LOM requirements.
| 18.2.2 | WATER |
Dewatering of the Fosterville underground workings is conducted utilizing two pumping stations.
Each of these stations comprises of three by WT088 helical rotor pumps that are fed from purpose constructed feed dams.
The Phoenix/Central Area is serviced by a station situated at the 4830 level, this station pumps directly to the surface via a steel rising main line that is run through service holes and mine workings and discharges into the Falcon Pit caving area for final settlement of mine solids so that the water can then be utilized within the mine water reticulation system.
The Harrier Area is serviced by a station situated at the 4775 level, this station pumps directly to the surface via steel rising main that is run through service holes, mine workings and the Harrier vent shaft and discharges to the Harrier pit.
Mine water is managed through sumps that are, where possible, connected by drain holes, otherwise pumps are used to move water to collection points where it enters staged pumps that transport water from the working areas of the mine to the pump station feed dams. Pumps used for the staged transfer of water are of the helical rotor type, predominantly WT103 type.
Underground mine process water is recycled from the mine water and is reticulated to the underground working areas from a tank farm on the surface.
205
| Technical Report | Kirkland Lake Gold |
| December 2016 | Fosterville Gold Mine |
| 18.2.3 | VENTILATION |
Primary ventilation of the Fosterville underground workings is achieved utilizing three return air systems; fresh air is drawn into the mine workings via the Falcon and Ellesmere portals and a total of 310m3 / second is delivered to the underground workings.
| • | Central/Phoenix |
| o | Utilize a shared system that exhausts through the Harrier ventilation shaft. |
|
- |
1 x Howden 1500/2400 axial fan situated within the Harrier workings draws air through a series of rises and horizontal development that at present terminate at the Phoenix 4190 level. |
| • | Phoenix |
|
o |
1 x FlaktWoods TR-1400-GV-4P fan situated underground at the Phoenix 5071 level draws air through a series of rises and horizontal development to maintain flow through the underground magazines. Exhaust is via a rise to the Falcon pit. |
| • | Harrier |
|
o |
Up to 4 x FlaktWoods TR-1400-GV-4P fans are situated underground and draw air through a series of rises and horizontal development that at present terminate at the 4350 level. Exhaust to the surface is via the Harrier ventilation shaft. |
Secondary ventilation is provided to the mine working areas utilizing electric fans and flexible ducting. Fans are sized according to air-flow requirements and range in size from 22 to 180 kW.
| 18.2.4 | DUMPS |
Waste material that cannot be placed underground is brought to the surface and dumped within the confines of the Ellesmere pit. As the available volume for waste material within the Ellesmere pit moves towards exhaustion, waste material placement processes will be modified to exploit void available within the Falcon pit envelope.
206
| Technical Report | Kirkland Lake Gold |
| December 2016 | Fosterville Gold Mine |
19 MARKET STUDIES AND CONTRACTS
| 19.1 | MARKETS |
Fosterville produces gold doré bars at mine site, which during the year ended December 31, 2016 were transported to The Perth Mint in Western Australia or ABC Refinery in Marrickville, NSW, Australia and refined to produce gold bullion. The gold bullion is sold over the counter through either The Perth Mint, ABC Refinery directly, or third party international brokers.
Gold is the principal commodity at Fosterville and is freely traded, at prices that are widely known, so that prospects of any production are virtually assured. Prices are usually quoted in US dollars per ounce.
To determine the Australian denominated gold price to use in the Mineral Resource and Mineral Reserve calculations, reference was made to publicly available price forecasts by industry analysts for both the gold price in US dollar terms and the AUD/USD foreign exchange rate.
This exercise was completed in January 2017, and yielded the following average gold forecast prices and corresponding average forecast AUD/USD FX rates.
For Mineral Reserve purposes, a US$1,200 per ounce gold price was used and an FX rate of $0.80 for an approximate Australian dollar gold price of AUD$1,500 per ounce.
| 19.2 | CONTRACTS |
Fosterville is subject to a License fee following a License agreement entered into with Biomin South Africa Pty Limited (Biomin) (formally known as Minsaco) in 2003. Biomin has a License from the proprietor to implement a process known as the BIOX® process in Australia whereby micro-organisms are used in the oxidation of certain gold bearing sulphidic minerals in order to facilitate gold recovery. Fosterville agreed to pay a License fee to Biomin calculated as an amount determined by multiplying the number of ounces of gold produced from FGM treated through the BIOX® Plant by $1.33. The License fee was payable from the date of commencement of operations and shall terminate when 1,500koz of gold in the aggregate has been produced from FGM treated at the BIOX® plant. License costs are integrated into the operating expenditure cost structure.
When Crocodile Gold acquired the Fosterville and Stawell Gold Mines from AuRico in 2012, a net free cash flow sharing arrangement was established where Crocodile Gold was entitled to cumulative net free cash flow from those mines of up to C$60M. AuRico would then be entitled to 100% of the next C$30M in net free cash flow, after which Crocodile Gold and AuRico would share the next C$30M of net free cash flow on a 50/50 basis until C$120M of cumulative net free cash flow was achieved, following which AuRico would be entitled to 20% on an ongoing basis.
On December 22, 2014 it was announced that Crocodile Gold had reached a mutually beneficial agreement with AuRico that terminated their net free cash flow sharing arrangement in exchange for a one-time payment of $C20M in cash and a net smelter return royalty of 2% from Fosterville (effective upon final approval from the Foreign Investment Review Board of Australia) and a 1% royalty from the Stawell Gold Mines (commencing January 1, 2016), releasing Crocodile Gold from its obligation to pay AuRico any further net free cash flow generated from its Victorian operations. This agreement means that Kirkland Lake Gold is obligated to pay AuRico a net smelter royalty of 2%. However, Alamos Gold Inc. (Alamos) merged with AuRico Gold in July 2015, which has resulted in Kirkland Lake Gold now being obliged to pay the new company, AuRico Metals, the net smelter royalty of 2% from Fosterville Gold Mine.
207
| Technical Report | Kirkland Lake Gold |
| December 2016 | Fosterville Gold Mine |
Fosterville is an owner/operator business with mining, processing, technical and administration functions undertaken by personnel employed by Kirkland Lake Gold. Supplementary support to the operation is sourced through various service contracts. The most significant service contracts include:
| • | E.B. Mawson & Sons Pty. Ltd. – providing services and supply of concrete products; |
| • | Downer EDI Mining Pty. Ltd. – providing underground drilling services; |
| • | Hoare Bros. Pty. Ltd – providing surface haulage services; and |
| • | Deepcore Australia Pty. Ltd. – providing underground and surface diamond drilling services. |
The terms and rates of these contracts are within industry norms. The Authors are not aware of any other agreements that are not within normal market parameters.
208
| Technical Report | Kirkland Lake Gold |
| December 2016 | Fosterville Gold Mine |
20 ENVIRONMENTAL STUDIES, PERMITTING AND SOCIAL OR COMMUNITY IMPACT
| 20.1 | ENVIRONMENTAL STUDIES AND RELATED ISSUES |
Environmental studies conducted at FGM related to environmental issues are outlined below:
Managed Aquifer Injection
Fosterville Gold Mine produces an excess of mine water from the dewatering of underground operations. Regulatory approval has been gained to treat excess mine water using a Reverse Osmosis (RO) plant for reuse in the processing plant. RO technology is a common solution for water treatment, readily available and understood. A by-product of the process is the generation of a concentrated saline solution called brine. The brine produced would need to be stored in evaporation ponds designed to withstand seasonal rainfalls without discharge.
Managed Aquifer Injection (MAI) is an alternative mine water treatment and reuse strategy being investigated. MAI involves the intentional injection of water into a host aquifer for storage and/or potential reuse for environmental and agricultural benefits. Water is treated prior to injection so that the water chemistry meets the same specifications as the host aquifer. A pilot treatment plant using Ionic Filtration and Exchange has been established at Fosterville to investigate the effectiveness of the treatment process. Investigations into the water treatment process are continuing to ensure groundwater would not be adversely impacted.
An injection trial was carried out in January 2017 whereby water of an approved quality was physically injected into the aquifer and evidence of that water chemistry was monitored at a series of groundwater monitoring bores. The trial also improved the understanding of how the water moves through the aquifer. A Work Plan Variation for this project is presently being compiled and will be submitted during 2017.
Environmental Noise Assessments and Mitigation
AECOM consultants were commissioned in 2014 to conduct an acoustic assessment of Fosterville Gold Mine, which included measurement and modeling of the operations and advice for potential noise mitigation. This included noise imagery investigations on complicated noise sources within the processing plant using an acoustic camera. The acoustic camera captures a photographic image overlaid by coloured sound intensity contours emitted from objects.
Over 2015 and 2016 a number of noise mitigation projects were implemented. Key projects included:
| • |
Hardware installation and control modifications to reduce the amount of excess air being emitted from ‘Blow Off’ valves at the Processing Plant; |
|
| |
| • |
Incorporating noise isolation material into the lining of noise attenuation boxes that partially surround BIOX® agitators at the Processing Plant; |
|
| |
| • |
Modifications were made to the vibrating feeder and blower operation at the Tannin Mixing Plant; and |
|
| |
| • |
Operating some exploration drill rigs within a fully enclosed purpose built noise attenuation shed or noise attenuating hay bales. |
|
| |
| • |
Placing sound isolation material around the SAG Mill Gearbox and Lube Shed pump. |
209
| Technical Report | Kirkland Lake Gold |
| December 2016 | Fosterville Gold Mine |
Storm Water Management
During 2016 FGM commissioned Advisian Consultants to develop a water balance model to evaluate the ability of storm water dams to contain mine affected runoff from a 1:100-year rainfall event. A management plan is being developed to upgrade the water management system to meet these requirements.
CIL and Mine Water Evaporation Spray Monitoring Programs
Environmental monitoring is conducted at the Robbin’s Hill and Fosterville CIL evaporation facilities as per the CIL management plan. Monitoring is also conducted at the Falcon Pit mine water evaporation facility in accordance with the approved Work Plan Variation. Monitoring includes vegetation assessments, soil monitoring and spray drift catcher monitoring to determine if the operation of the sprays is having any impact on the environment.
Biosolids Trial
In collaboration with Coliban Water Fosterville Gold Mine is conducting a biosolid fertilizer trial. Biosolids is a solid product from sewage treatment processes and have been treated in a way to make them safe for further use. The biosolid fertilizer has been incorporated into a number of soil plots and planted with native species. Monitoring of the trial plots over time will determine the effectiveness of the biosolid fertilizer in improving soil structure and fertility and also enhancing vegetation establishment and growth.
Monitoring of the plots is being undertaken by Goldfields Revegetation Ltd. Monitoring indicates certain plant species have good growth rates in the plot containing a mix of waste rock and biosolids. Further trials using biosolids planted out with pasture species is planned for 2017.
Heap Leach Environmental Characterization
An environmental characterization of Robbin’s Hill heap leach waste rock was undertaken to assist determination of the appropriate closure strategy for the material. Sampling was carried out during 2015 from five cores drilled into the heap leach waste rock. The material was found to be non-reactive and could be used as a capping material on tailings storage facilities or re-shaping and rehabilitation. The potential reuse of heap leach as a capping material has potential environmental and cost benefits by reducing rehabilitation liability and providing a readily available source of construction material. Longer term kinetic column leach testing of the material is being undertaken to identify the best option.
AECOM Dust Dispersion Study
During 2016 AECOM consultants were commissioned to model the dust dispersion patterns from mining activities and provide recommendations on the appropriate siting of existing dust monitoring equipment. As per the recommendations of the report FGM will modify some of the dust monitoring locations and are investigating installing further ambient air monitoring equipment.
210
| Technical Report | Kirkland Lake Gold |
| December 2016 | Fosterville Gold Mine |
| 20.2 | WASTE AND TAILINGS DISPOSAL, SITE MONITORING AND WATER MANAGEMENT |
| 20.2.1 | REQUIREMENTS |
Requirements for residue storage sites are provided in the following documents:
- Section 4.5 of the 2004 Work Plan;
- Approved Work Plan Variation for Additional Portal Access Points (three in total), additional CIL storage facilities (including on the Fosterville Heap Leach Pad) and the construction of a reload facility (February 22, 2005);
- Work Plan Variation CIL Tails Storage and Decant Water Management (July 1, 2008);
- Work Plan Variation CIL Residue Hardstand Area (October 23, 2009);
- Work Plan Variation, “In-Pit Residue Disposal Facility” (November 2009);
- Work Plan Variation, CIL Residue Hardstand #2 Area (March 2012);
- Work Plan Variation, “In-Pit Residue Disposal Facility – TSF3 O’Dwyer’s
South Pit”
(November 2012); - Work Plan Variation, “Raising of existing embankment of TSF1” (December 2013); and
- Work Plan Variation, “Additional Residue Storage Facility - TSF4” (September 2014).
Flotation and Neutralization Tails
Flotation and neutralization tails have been stored in the following facilities:
- TSF1;
- Hunts and Fosterville In-Pit Facilities;
- O’Dwyer’s South In-Pit Facility; and
- TSF4
During 2016 FGM deposited flotation and neutralization tails into TSF1, Hunts in pit facility, O’Dwyer’s South In-pit facility and TSF4, which was commissioned in November 2015. The Fosterville In-Pit Facility has been filled and capped. Capping performance is being monitored by the amount of rainfall infiltration through the cap, and is measured by two lysimeters installed within the cover profile.
CIL Tailings
CIL tailings have been stored in lined tailing facilities within and adjacent to the old Fosterville Heap leach facility. A Work Plan Variation will be submitted in 2017 to enlarge the storage capacity of the CIL tailings facility.
Overburden Waste
The deposition/distribution of overburden waste throughout the Fosterville site is outlined in Table 20-1.
211
| Technical Report | Kirkland Lake Gold |
| December 2016 | Fosterville Gold Mine |
TABLE 20-1 OVERBURDEN USE AT FOSTERVILLE GOLD MINE
| Overburden Source | Use |
| Falcon Pit | Construction of
TSF1 (internal rock armouring of walls) Construction of the ROM pad Construction of haul roads Backfill into Vanessa’s North Pit and at the southern end of Fosterville Pit (the remainder is flotation tailings) Construction of McCormick’s Waste Dump (majority) |
| Ellesmere Pit | Sound bunds on
the eastern side of Ellesmere (possibly Harrier sound bund as well)
McCormick’s Waste Dump Falcon Backfill |
| Johns Pit | Backfilling
Harrington Hill South Open Pit1 Backfilling into Harrier Open Pit (western side) Use for repairing the CIL Storm Dam wall Abandonment bund walls for Johns Pit South end of Ellesmere |
| O'Dwyer's South Open Pit | To be used as
backfill into the northern end of the Pit To be placed into the existing O'Dwyer's South Waste Dump |
| Harrier | Backfilling into
Ellesmere Pit south to north Construction of internal ramps in Harrier Pit Sound walls to the east of Harrier Pit To be used for rock fill for CIL #3 |
| Hunts | TSF12
main embankment Building Hunts Pit Waste Dump |
| Fosterville | Hunts Waste Dump |
| Underground | Backfilled into
underground workings Used as base in the Ellesmere Saddle |
Notes:
| 1. |
Sediment from Fosterville Storm Dam was also transferred into Harrington Hill South Pit. |
| 2. |
TSF1 was also constructed using heap leach material from Robbin’s Hill. |
Potentially Acid Forming Materials
Known potentially acid forming (PAF) materials excavated from open pits have been stored in:
- McCormick’s Waste Dump;
- Johns Pit (taken from Johns Pit and Harrier Pit); and
- Flotation and Neutralization Tailings.
212
| Technical Report | Kirkland Lake Gold |
| December 2016 | Fosterville Gold Mine |
A Waste Rock management plan was developed in 2014, which indicated that waste rock was overall non-acid-forming and contained a significant inherent Acid Neutralizing Capacity that was available to offset any isolated acid formation. Kinetic column leach testing of the main waste rock lithologies is presently being undertaken to further understand the long term leaching characteristics of the main overburden lithologies. It is intended that further waste rock characterization will be undertaken during 2017.
| 20.2.2 | SITE MONITORING AND WATER MANAGEMENT |
Water Management
The Fosterville annual water monitoring plan is designed to monitor the impacts of mining activities on surface and groundwater quality and quantity in the regional and local aquifer systems. Water samples are collected on monthly, quarterly or an annual basis in accordance with the Work Plan (2004) and the annual water monitoring schedule which is reviewed each year.
Groundwater levels in the monitoring bores are also recorded each month.
Noise Monitoring
Noise monitoring is undertaken in accordance with the Work Plan (2004) and Work Plan variation (2015) and includes periodic day, evening and night measurements at nine representative locations surrounding the mine. Noise results are assessed against EPA criteria and any mine related exceedances are reported to the Regulators.
Air Quality
Dust deposition rates were monitored on a monthly basis at 10 sensitive receptors around the mine. The quantity of material deposited was analyzed for total insoluble material (g/m2), which comprises non-combustible material (ash) and combustible material. Ash content provides an indication of the mineral content of a sample. The mineral content may be attributable to mining, but may also be attributable to other sources such as agriculture, unsealed roads etc. The combustible material will not be attributable to mining as this is mostly organic matter.
Dust was also measured at a sensitive receptor by a high volume sampler. The high volume sampler measures the particulate loading in the air less than 10 and 2.5 microns (mg/m3).
Greenhouse gases and other emissions are evaluated and reported under the National Greenhouse and Energy Reporting and National Pollutant Inventory regulatory programs on an annual basis.
Rehabilitation Monitoring
As part of the Environmental Management Plan, Fosterville undertakes progressive rehabilitation of areas affected by the operations, taking into consideration the future end use of the land. Progressive rehabilitation includes stabilization earthworks, drainage enhancement and control works, establishing vegetation, weed and pest animal control and continual monitoring. Bi-annual monitoring of the revegetation works associated with the McCormick’s Waste Dump site and the O’Dwyer’s South Pit remnant patch is conducted by an independent consultant. The scope of the monitoring includes an assessment on plant growth and survival, threats to plant survival and the presence of pest plants and animals.
213
| Technical Report | Kirkland Lake Gold |
| December 2016 | Fosterville Gold Mine |
Vibration Monitoring
Blast monitoring was undertaken at a sensitive receptor outside the boundary of the Fosterville Mine Lease with a permanently installed blast monitor. All of the blasts that were monitored during 2016 were within the Mining License limits.
| 20.3 | PROJECT PERMITTING REQUIREMENTS |
Fosterville currently operates under a Mining Lease and Mining License dated 2003. A Work Plan was approved for the project in February 2, 2004. There have been a number of Work Plan Variations that have been prepared for the project which form addendums to the 2004 Work Plan. Recent Work Plan Variations approved include:
- Mine water evaporation sprays in North end of Falcon Pit (August 2014);
- Mine water treatment plant (September 2014);
- Additional Residue Storage Facility - TSF4 (September 2014); and
- Reviewed Noise Monitoring Limits (February 2015).
A mining lease application MIN006267, which is adjacent to the southwestern border of MIN5404, was submitted for approval in 2016 and is currently being assessed by the regulators.
A Work Plan Variation for underground aquifer injection (see Section 20.1) is presently being compiled and will be submitted during Q1 2017.
There are a number of requirements relating to rehabilitation and closure both in the License, the 2004 Work Plan and in subsequent Work Plan Variations. All rehabilitation and closure requirements have been incorporated into the site’s Closure Plan.
| 20.4 | SOCIAL OR COMMUNITY RELATED REQUIREMENTS AND PLANS |
Community engagement and consultation on all aspects of the operation continues as an integral part of the FGM business model. There are a range of forums and consultation undertaken including quarterly Environmental Review Committee Meetings, an annual Open Day, newsletters, information updates and an active Facebook Page. A range of project or activity-specific meetings are also held where future activities and plans are communicated. The feedback from these sessions is utilized in planning any future projects. Fosterville Gold Mine also has a Community Engagement Plan and prepares an annual Sustainability Report that is made available to all members of the community.
214
| Technical Report | Kirkland Lake Gold |
| December 2016 | Fosterville Gold Mine |
| 20.5 | MINE CLOSURE (REMEDIATION AND RECLAMATION) REQUIREMENTS AND COSTS |
A rehabilitation bond is reviewed regularly with the Department of Economic Development, Jobs, Transport and Resources Victoria. In December 2015 the rehabilitation bond was reviewed and increased to AUD$7.84M. Rehabilitation is undertaken progressively at FGM as per the mining license conditions and the bond may be reduced on establishment that the land has been rehabilitated in accordance with the MRSD Act. That is, the land is safe and stable, non-polluting and the revegetation cover is self-sustaining. All closure requirements are included in the FGM Closure Plan.
Key operational domains for reclamation works include:
- Northern Site Facilities;
- Southern Site Facilities;
- Sulfide Infrastructure;
- Sulfide Open Pits;
- Adits and Shafts;
- Main Overburden Heap;
- Tailings Storage Facility;
- CIL Dams;
- Heap Leach Pads; and
- Oxide Open Pits.
After an investigation into the potential realization estimates of the FGM assets, including the processing plant, ancillary equipment, non-fixed assets and the mining mobile fleet, the Company considers the current processing plant as a valuable asset that will be able to be successfully sold as an entire operation unit and removed down to the foundations on a cash positive basis. The demolition of the plant is therefore an integral cost within the Rehabilitation Bond Provision at this time.
In addition to disposal of the plant, key closure activities for FGM include:
- Decommissioning and rehabilitation of the heap leach facilities, associated dams and infrastructure;
- Decommissioning and rehabilitation of the tailings facilities (including TSF1 and the in-pit storages);
- Decommissioning and rehabilitation of the CIL tails facilities and associated dams;
- Rehabilitation of old open pits; and
- Re-vegetation of all remaining disturbed areas.
215
| Technical Report | Kirkland Lake Gold |
| December 2016 | Fosterville Gold Mine |
21 CAPITAL AND OPERATING COSTS
| 21.1 | CAPITAL AND OPERATING ESTIMATES |
The capital and operating costs for the FGM are presented below in Table 21-1.
The basis of the below estimates is on operating history and known increases in cost for the current and future years.
Operating Costs
- All 2017 costs as per budget.
- 2018/19/20/21 operating costs as per 2017 reflecting a similar production profile and operating development schedule. This assumes that ongoing cost control/productivity program keeps pace with inflation.
- Operating costs for the reduced volume in 2022 have been estimated at $70/t for mining (mostly stoping only), $3/t for geology, $45/t processing and $14/t for administration. Residual administration costs during tails-only operation have been estimated at $100/oz post mine closure.
- Tails retreat-only processing costs (post-mining) have been estimated at $900/oz (+100/oz for administration).
- Royalty is reflected as 2% of revenue throughout the model.
Capital Costs
- All 2017 costs as per budget.
- Mobile Plant and Equipment has been modeled as $14.0m annually for 2018-21 reflecting the 2017 budget.
- Processing Plant Capital modelled at 2017 budget levels for the period 2018-21.
- Infrastructure Capital in 2017 Budget is elevated due to TSF1 lift. 2016 expenditure ($1.6m) is taken as the baseline for 2018-2021 with the exception of an additional $3.2m in 2018 for TSF4 lift 2.
- Underground Development Capital in 2017 is elevated due to addition of the Harrier South decline. This elevated expenditure has been maintained for 2018-21 to reflect the intention to maintain three main declines/production fronts. This reflects the development required (decline, level accesses, ventilation raises) to access the subsequent year of production.
- Resource Definition Capital modelled at 2017 budget levels for the period 2018-2021 reflecting the replacement cost of reserves mined.
216
| Technical Report | Kirkland Lake Gold |
| December 2016 | Fosterville Gold Mine |
TABLE 21-1 CAPITAL AND OPERATING COST ESTIMATES FROM THE CURRENT LOM PLAN
| Fosterville Gold Mine | LOM | FY-17 | FY-18 | FY-19 | FY-20 | FY-21 | FY-22 | FY-23 |
| Current LOM Reserves + Resource Conversion | ||||||||
| Operating Costs | ||||||||
| Surface Mining | $0 | $0 | $0 | $0 | $0 | $0 | $0 | $0 |
| Underground Mining (includes geo & mine maint.) | $290,967,660 | $50,893,532 | $50,893,532 | $50,893,532 | $50,893,532 | $50,893,532 | $36,500,000 | $0 |
| Processing (includes refining, transp. & mill maint.) | $188,123,125 | $26,284,625 | $26,284,625 | $26,284,625 | $26,284,625 | $26,284,625 | $22,500,000 | $34,200,000 |
| Administration | $58,574,110 | $9,554,822 | $9,554,822 | $9,554,822 | $9,554,822 | $9,554,822 | $7,000,000 | $3,800,000 |
| Royalty | $30,745,737 | $4,676,383 | $5,197,063 | $5,249,379 | $5,483,179 | $5,483,179 | $3,440,553 | $1,216,000 |
| Total Operating | $568,410,633 | $91,409,363 | $91,930,042 | $91,982,358 | $92,216,158 | $92,216,158 | $69,440,553 | $39,216,000 |
| Capital | ||||||||
| Mobile Plant and Equipment | $63,281,774 | $7,281,774 | $14,000,000 | $14,000,000 | $14,000,000 | $14,000,000 | $0 | $0 |
| Mobile Plant and Equipment Under Finance | $6,787,000 | $6,787,000 | $0 | $0 | $0 | $0 | $0 | $0 |
| Processing Plant | $3,610,000 | $722,000 | $722,000 | $722,000 | $722,000 | $722,000 | $0 | $0 |
| Infrastructure | $12,992,000 | $3,392,000 | $1,600,000 | $4,800,000 | $1,600,000 | $1,600,000 | $0 | $0 |
| Land and Buildings | $20,000 | $20,000 | $0 | $0 | $0 | $0 | $0 | $0 |
| Underground Development | $168,108,200 | $33,621,640 | $33,621,640 | $33,621,640 | $33,621,640 | $33,621,640 | $0 | $0 |
| Ventilation Upgrade | $22,020,000 | $12,200,000 | $9,820,000 | $0 | $0 | $0 | $0 | $0 |
| Managed Aquifer Injection | $6,180,000 | $6,040,000 | $140,000 | $0 | $0 | $0 | $0 | $0 |
| Resource Definition | $60,504,645 | $12,100,929 | $12,100,929 | $12,100,929 | $12,100,929 | $12,100,929 | $0 | $0 |
| Total Capital | $343,503,619 | $82,165,343 | $72,004,569 | $65,244,569 | $62,044,569 | $62,044,569 | $0 | $0 |
217
| Technical Report | Kirkland Lake Gold |
| December 2016 | Fosterville Gold Mine |
22 ECONOMIC ANALYSIS
As per Item 22: Economic Analysis, Instruction 1, item 22 has been excluded on the basis that the property is currently in production and there are no plans for material expansion of current production.
218
| Technical Report | Kirkland Lake Gold |
| December 2016 | Fosterville Gold Mine |
23 ADJACENT PROPERTIES
As shown in Figure 4-2, the Fosterville Mine Lease (MIN5404) is completely enveloped by Exploration Licenses held by Kirkland Lake Gold (through Fosterville Gold Mine Pty Ltd). Within FGM held ELs sulfide-hosted gold mineralization has been identified in the Goornong area (5km to the north of MIN5404) and the Hallanan’s area (2km to the south), as discussed in van Riel (1999). However, the exploration of these prospects is only at an early stage and not relevant to discuss further in relation to this Technical Report.
No other sulfide hosted gold operations are in production in the Fosterville district. However, sulfide hosted gold mineralization does occur in the Lockington area (Boucher et al., 2008b; Arne et al., 2009), 50km north of Fosterville where eight mineralized trends have been mapped beneath thick cover using aircore drilling. This information is not able to be verified by a Qualified Person (QP) and is not indicative of the mineralization that is the subject of this technical report.
219
| Technical Report | Kirkland Lake Gold |
| December 2016 | Fosterville Gold Mine |
24 OTHER RELEVANT DATA AND INFORMATION
No other relevant information is required to make the technical report understandable and not misleading.
220
| Technical Report | Kirkland Lake Gold |
| December 2016 | Fosterville Gold Mine |
25 INTERPRETATION AND CONCLUSIONS
The Authors have made the following interpretations and conclusions:
|
• |
The understanding of the fundamental geological controls on mineralization at Fosterville is high. Primary mineralization is structurally controlled with high-grade zones localized by the geometric relationship between bedding and west dipping faulting. This predictive model has led to considerable exploration success in following the down-plunge extensions of high-grade mineralization. |
| o |
The Lower Phoenix Fault is the primary west dipping structure in the active mine development area and is defined by reverse faulting on a shale package where anticline thrust displacement of ~80m occurs. The fault dips between 35 and ~55 degrees to the west and mineralization can be traced along a dip extent of ~190m and strike extent of ~1.75km. The dominant mineralization style on this structure is disseminated sulfide, however, occurrences of visible gold at depth are becoming increasingly common, concentrated where footwall structures intersect. The Lower Phoenix System currently remains open to the north and south so maximum plunge extent has not yet been defined. | |
|
| ||
| o |
Throughout 2016, development mapping and continued drilling confirmed that there were multiple mineralized structures of various size and continuity footwall to the main west dipping Lower Phoenix Fault, which present significant resource growth potential. Progressive geological understanding of the Phoenix and Lower Phoenix footwall environs has highlighted the significance of these favorable settings for mineralization, including; | |
|
| ||
| o |
East Dipping mineralized structures, namely the Eagle Fault and East Dipping Faults, which commonly contain quartz–stibnite vein assemblages and substantial concentrations of visible gold, typically enveloped by halos of disseminated sulfide. The Eagle Fault is discordant to bedding and variably dips between 10 and 60 degrees to the east and transforms further to the south to strike in an ENE direction dipping ~45 degrees to the SSE. The Eagle Zone mineralization extends over a 790m strike extent and it is untested and open at depth below the 3960mRL and south of 6350mN. Drilling is planned to target beyond this extent during the remainder of 2017. East Dipping Faults are typically bedding parallel to sub parallel with dips of ~70 degrees east to sub vertical. The defined extent of East Dipping structures containing significant mineralization is now approximately 1.5km. | |
|
| ||
| o |
The low-angled Lower Phoenix Footwall west dipping structures typically consist of large quartz veins up to several meters wide with laminated textures, indicating a series of multiple mineralizing events, including a later stage quartz-stibnite phase of mineralization and visible gold. The faults are interpreted to have minimal offset but rather have been hydraulically fractured. Where these structures form linkages between the Lower Phoenix and East Dipping Faults, extremely high gold grades are observed. During 2016 drilling from the footwall to the Lower Phoenix discovered west dipping Lower Phoenix Footwall mineralization, which occupies a reverse fault structure that exhibits ~20m of thrust offset, returning some of the highest grade intercepts returned on the Fosterville Lease. The defined size of this high-grade mineralized structure is now 200m in strike length and 160m in vertical extent. The mineralized zone appears to adjoin the high-grade Eagle structure at its lower edge and is untested down-plunge. Continued drilling from the hangingwall drill platforms during 2017 will continue to advance the understanding of size and scale of this attractive resource growth target. |
221
| Technical Report | Kirkland Lake Gold |
| December 2016 | Fosterville Gold Mine |
| • |
Continued drill definition of these structures over 2016, in combination with ore development and production exposure and reconciliation performance has reaffirmed the significance of these easterly dipping footwall structures to the Lower Phoenix Fault. The defined continuity, proximity to existing Mineral Resources and high-grade tenor of these structures enhances the December 2016 Mineral Resource and Reserve position. Furthermore, mineralization on these structures is open down-plunge, providing encouraging future Mineral Resource and Mineral Reserve growth potential for the operation. |
|
| |
| • |
Continued drilling into the Harrier System in 2016 has identified high-grade mineralization containing significant amounts of visible gold at depth, primarily associated the Harrier Base structure. The Harrier base structure exhibits reverse thrust movement of approximately 60m. Visible gold is hosted within laminated quartz-carbonate vein assemblages, which may contain minor amounts of stibnite. In the strongest mineralized zones a broad halo of sulfide mineralization surrounds quartz bearing structures hosting visible gold. The high-grade visible gold mineralization was first recognized at approximately the 4480rl, a comparable elevation to where visible gold occurrences in the Lower Phoenix became more prominent. The Harrier Base mineralization is open to the south. |
|
| |
| • |
There is an observed change in the nature of some of Fosterville mineralization at depth with a number of high-grade, quartz-carbonate +/- stibnite vein hosted, visible gold drill intercepts recorded for the Eagle, Lower Phoenix, Lower Phoenix Footwall, East Dipping and Harrier Zones. Disseminated sulfide mineralization continues to persist at all depths and is uniform in character. It is currently inferred that the quartz-carbonate +/-stibnite-visible gold assemblages have been emplaced at a later date to the disseminated sulfide providing an upgrade to the mineralization. |
|
| |
| • |
Progressive geological interpretation has led to continued development of robust geological and resource models underpinning the Mineral Resource and Mineral Reserve estimates. The relationship between mineralization and the controlling structural/stratigraphic architecture means that quality geological interpretation is critical to producing quality resource/reserve estimates. |
|
| |
| • |
The modifying factors used to convert the Mineral Resources to Mineral Reserves have been refined with the operating experience gained since underground production commenced in September 2006. In particular, the robustness of the mining recovery and dilution estimates has improved with experience relative to the pre-mining assessments. |
|
| |
| • |
Fosterville Gold Mine has a demonstrated solid production history over a 10 year plus period since the beginning of commercial sulfide gold production in April 2005, and it is the Authors’ view that the risk of not achieving projected economic outcomes is low given the operational experience gained over this time period. A foreseeable risk and uncertainty facing the operation is the changing character of mineralization at depth with an increase in the occurrence of visible gold. Reconciliation results in the past have provided confidence in the sample collection procedures, the quality of assays and the resource estimation methodology, but these processes will need to be continually adapted in consideration of the changing mineralization character at depth. Kirkland Lake Gold needs to continue research to better understand the potential implications on future geological, mining and metallurgical processes and will continue to seek external advice during 2017 in relation to sampling, assaying and Mineral Resource estimation of visible gold mineralization. Based on recommendations from previous external reviews, projects plans have been developed and implemented. |
222
| Technical Report | Kirkland Lake Gold |
| December 2016 | Fosterville Gold Mine |
26 RECOMMENDATIONS
The following recommendations are made:
| • |
Further mine lease growth exploration activities should be pursued. Given the strong understanding of geological controls on mineralization, this could have the potential to yield additional resources and reserves. Particular areas that are recommended to focus upon are the up and down-plunge extensions of the Lower Phoenix structure (northwards up-plunge from 8200mN and southwards down-plunge from 6200mN). Exploration of the Lower Phoenix southwards of 6200mN is technically challenging from surface due to target depths and as such Kirkland Lake Gold has commenced the development of dedicated underground drill platform to facilitate further exploration of the Lower Phoenix system down-plunge. The current 2017 exploration budget includes development extensions of the Harrier Exploration Drive Decline, P4190 Drill Drive and Central Decline Drill Drive to establish drilling platforms to target Lower Phoenix extensions at a cost of AUD$12.44M. Diamond drilling from these platforms is estimated to cost AUD$4.08M to explore these gold targets; |
|
| |
| • |
A Harrier Drill Drive Incline development is also planned to commence from the Phoenix Decline in 2017 at a cost of AUD$2.88M. This development is projected to join with the Harrier Drill Drive Decline in 2018 providing a link between the Harrier and Phoenix mining areas. The long term benefits of this development link are significant, not only as providing a hangingwall drill platform to explore the Lower Phoenix extensions over a 1.5km strike extent, but also in unconstraining production as it will provide an alternative ore haulage route; |
|
| |
| • |
Exploration of the Lower Phoenix, up-plunge, northwards of 8200mN should be progressively pursued from surface drill positions to provide satisfactory drill intercept angles. A total of four drill sections are planned from surface to explore the Lower Phoenix and Lower Phoenix Footwall targets at a cost of AUD$3.19M; |
|
| |
| • |
With an increasing grade profile identified at depth and the establishment of high-grade Mineral Reserves at lower levels in Harrier, it is strongly recommended that the down-plunge extensions of the Harrier system are further explored. The 2017 budget plan has a scheduled development extension of the H4625 Drill Drive at a cost of AUD$797K, which will facilitate a 100m step out section of drilling beyond the current extent of Mineral Resources and Mineral Reserves at a cost of $558K; |
|
| |
| • |
Given the unexplored potential of the Fosterville Goldfield, it is recommended that growth drill programs are implemented in pursuit of defining potential Mineral Resources independent from current mining centers. Growth drill programs planned to be undertaken within the mining lease during 2017 include the Harrier Up-Dip program, which will explore for gold mineralization between the existing Harrier Mineral Resource and the Daley’s Hill Pit and the Robbin’s Hill Program, which will continue to build an understanding of the underground Mineral Reserve potential beneath the Robbin’s Hill pits. A total cost of AUD$3.50M is budgeted in 2017 to execute these programs; |
|
| |
| • |
To advance the pipeline of regional growth targets on surrounding exploration licenses, Fosterville is planning to drill an adjacent line of mineralization at Sugarloaf located approximately 1km to the west of the Fosterville Line with a scoping drill hole from an underground platform at a cost of AUD$234K. A regional soil sampling program at a cost of AUD$32K is also planned. In addition, given the recent technological advancements and successful application of seismic exploration in the mining industry, Fosterville has budgeted for preliminary seismic works to assess the suitability of this method to optimise drill targeting. The project is proposed to be undertaken during 2017 at a cost of AUD$400K, and if successful, could lead to further application on a more regional scale; |
| Technical Report | Kirkland Lake Gold |
| December 2016 | Fosterville Gold Mine |
| • |
Outside the 2017 scope of planned works other prospective regional exploration targets also exist in close proximity to the existing Mine Lease and form part of the overall future drill planning. These prospects include Goornong, Hallanan’s and the O’Donnell’s Line. Other prospects further away from the Mine Lease will be explored in future years. |
|
| |
| • |
The infill/resource definition programs should be continued with an aim to maintain a minimum two years of reserves drilled out to 25m centers (or closer where necessary). Both the south plunging, westerly dipping Phoenix and Lower Phoenix Mineralized Zones and the easterly dipping Eagle and East Dipping Mineralized Zones require definition drilling, which is to be conducted from both hangingwall (western side) and footwall (eastern side) drill platforms. Infill/definition drilling should also target the down-plunge extensions of the Harrier Mineralized Zones with the aim of increasing Mineral Resource confidence. A total of AUD$13.4M is budgeted to undertake infill/definition drilling in 2017. As the decline and mining front continues to move south and to depth, further hangingwall drives will be required. This work and the associated drilling have not been cost estimated in detail; and |
|
| |
| • |
The observed increased frequency of visible gold intercepts at depth requires continued research to better understand the potential implications on future geological, mining and metallurgical processes. Kirkland Lake Gold continued to seek external advice over 2016 in relation to sampling, assaying and resource estimation of visible gold mineralization. Based on recommendations from external reviews, project plans have been developed and implemented. |
|
| |
| • |
With this additional drilling data and further ongoing operational experience, it is recommended that mining recovery and dilution factors are reviewed and refined on an ongoing basis. |
224
| Technical Report | Kirkland Lake Gold |
| December 2016 | Fosterville Gold Mine |

225
| Technical Report | Kirkland Lake Gold |
| December 2016 | Fosterville Gold Mine |
TABLE 26-1 PROPOSED EXPLORATION DRILLING PROGRAMS FOR 2017
| Exploration programs for 2017 | Description | Expenditure (AUD) |
| Lower Phoenix FW 5550mN Drilling | Test for extension of down-plunge Lower Phoenix mineralization | $720,000 |
| Lower Phoenix FW 5650mN Drilling | Test for extension of down-plunge Lower Phoenix mineralization | $720,000 |
| Lower Phoenix FW 5750mN Drilling | Test for extension of down-plunge Lower Phoenix mineralization | $439,200 |
| Lower Phoenix FW 5850mN Drilling | Test for extension of down-plunge Lower Phoenix mineralization | $243,900 |
| Eagle South Extension Drilling | Test for extension of down-plunge Lower Phoenix mineralization and repeats | $450,000 |
| Lower Phoenix 6200mN Drilling | Test for extension of down-plunge Lower Phoenix mineralization | $423,900 |
| Lower Phoenix 6300mN Drilling | Test for extension of down-plunge Lower Phoenix mineralization | $540,000 |
| Lower Phoenix 6400mN Drilling | Test for extension of down-plunge Lower Phoenix mineralization | $540,000 |
| Harrier South 4650mN Drilling | 1 section of Harrier South Resource extension (100mx50m) drilling | $558,000 |
| Harrier Up-Dip (UG) Drilling | Mineralization on west dipping and potential E-W trending fault. | $846,000 |
| Sugarloaf (UG) Drilling | West drilled Investigative hole to test for Sugarloaf structures | $234,000 |
| Lower Phoenix North 8400mN Drilling | Scoping Drilling to test for Lower Phoenix North extensions | $750,000 |
| Lower Phoenix North 8500mN Drilling | Scoping Drilling to test for Lower Phoenix North extensions | $525,000 |
| Lower Phoenix North 8700mN Drilling | Scoping Drilling to test for Lower Phoenix North extensions | $675,000 |
| Lower Phoenix North 8800mN Drilling | Scoping Drilling to test for Lower Phoenix North extensions | $388,750 |
| Fosterville Splays North 8400mN Drilling | Single Investigative hole to test deep structures | $292,500 |
| Fosterville Splays North 8500mN Drilling | Single Investigative hole to test deep structures | $275,000 |
| Fosterville Splays North 8700mN Drilling | Single Investigative hole to test deep structures | $287,500 |
| Robbin's Hill 12500mN - 12800mN Drilling | Scoping (100mx50m) drilling to test for UG target | $1,225,000 |
| Robbin's Hill 12900mN - 13100mN Drilling | Scoping (100mx50m) drilling to test for UG target | $1,250,000 |
| O'Dwyer's North Drilling | 2 sections of Resource extension drilling N of O'Dwyer's North open pit | $175,000 |
| Sugarloaf alteration comparison | Comparing Sugarloaf drill core to Fosterville system for mineralogical zonations to support target generation | $5,000 |
| 2D Seismic of Northern Lease | Initial trial of the method to identify known and new structures | $400,000 |
| Harrier 4625 DD Development | Dev. to support Harrier 4650mN drilling | $797,040 |
| Harrier Drill Drive Decline | Dev. to support Lower Phoenix drilling | $8,147,520 |
| Harrier Drill Drive Incline | Dev. to support Lower Phoenix drilling | $2,883,150 |
| Phoenix 4190 DD Development | Dev. to support Lower Phoenix 6200mN to 6400mN drilling | $2,453,240 |
| Central Decline DD Development | Dev. to support Lower Phoenix 6200mN and 2018 growth drilling | $1,838,040 |
| EL4937 Soil Sampling | Partial leach / XRF soil sampling, potentially along strike from mineralization | $32,000 |
226
| Technical Report | Kirkland Lake Gold |
| December 2016 | Fosterville Gold Mine |
27 REFERENCES
Allwood, K., 2003. Fosterville Gold Project April 2003 Resource Estimate. Unpublished internal Perseverance report.
Allwood, K., 2006. June 30 2006 Fosterville ML Resource Model Descriptions Section 3 – O’Dwyer’s Area. Unpublished report by GeoModeling.
Allwood, K., 2007. Review of Resource Modeling Procedures for the Farley's Area, Unpublished report by GeoModeling.
Allwood, K., 2008. Hunt’s – Fosterville Resource Estimate (Northern Block Model), Fosterville Gold Project. Unpublished report by GeoModeling.
Arne D.C., Bierlein F.P., McNaughton N., Wilson C.J.L. & Morland V.J., 1998. Timing of gold mineralization in western and central Victoria, Australia: New constraints from SHRIMP II analysis of zircon grains from felsic intrusive rocks. Ore Geology Reviews 13, 251-273.
Arne D.C., & House E., 2009. Lithogeochemical haloes surrounding central Victorian gold deposits: Part 2 - Secondary dispersion. Gold Undercover Report 16. Department of Primary Industries.
Arne D.C., House E., Turner G.R., Scott K. & Dronseika, E., 2009. Exploration for deeply buried gold deposits in northern Victoria: soil, regolith and groundwater geochemistry of the Lockington and Lockington East deposits. Geoscience Victoria Gold Undercover Report 10. Department of Primary Industries.
Benn C., 1989, Gold Exploration by BHP Gold Mines Ltd. on EL 1881 Huntly, Victoria for the Six Month Period ending 1st March, 1989. Unpublished report by BHP Gold Mines Ltd.
Bierlein F.P., Arne D.C., Reynolds P. & McNaughton N.J., 2001. Timing Relationships Between Felsic Magmatism and Mineralization in The Central Victorian Gold Province, Southeastern Australia.
Australian Journal of Earth Science, 48, 883-899.
Bierlein F.P., Maher S., 2001. Orogenic disseminated gold in Phanerozoic fold belts; examples from Victoria, Australia and elsewhere. Ore Geology Reviews 18, 113-148.
Bierlein F.P. & McKnight S., 2005. Possible Intrusion-Related Gold Systems in The Western Lachlan Orogen, Southeast Australia, Society of Economic Geologist Inc. Economic Geology v. 100. Pp. 385-398.
Boucher R.K., Hitchman S.P. & Allwood, K.J., 2008a. Stratigraphic Controls on Structures and Mineralization in Central Victoria: Fosterville. Australian Institute of Geoscientists Newsletter No. 93, August 2008.
Boucher, R.K., Turner, G.R. & Rossiter, A.G., 2008b. Stratigraphic control on structures and mineralization in central Victoria 4: Lockington. Australian Institute of Geoscientist Newsletter 94, pp. 1-5.
Bureau of Meteorology, 2016. http://www.bom.gov.au/, March.
Cameron J. K., 1988, Gold Exploration by BHP Gold Mines Ltd. on EL 1881 Huntly, Victoria for the Six Month Period ending 1st September, 1988. Unpublished report by BHP Gold Mines Ltd.
Cayley, R.A., Skladzien, P.B., Williams B. and Willman C.E. 2008. Redesdale and part of Pyalong 1:50 000 map area geological report Geoscience Victoria. Geological Survey of Victoria Report 128.
227
| Technical Report | Kirkland Lake Gold |
| December 2016 | Fosterville Gold Mine |
Cayley, R. A., Korsch R. J., Moore D. H., Costelloe R. D., Nakamura A., Willman C. E., Rawling T. J., Morand V. J., Skladzien P. B., & O’Shea P. J. O. 2011. Crustal Architecture of central Victoria: results from the 2006 deep crustal reflection seismic survey. Australian Journal of Earth Sciences. 58, (2) 113-156
Crase, N., 2002. Brief notes on the review of Quality Assurance and Quality Control in sampling and assaying at Fosterville, May 2002. Unpublished memorandum by SMP Consultants.
Davis, C., 2006. Structures and Alteration of the Robbin’s Hill Pit Area. Unpublished University of Melbourne
Bachelor of Science Honours Thesis.
Dean G., 2010. EL3539 Myrtle Creek Prospect Drilling - Final Report to Rediscover Victoria Drilling Round 2, April 2010 by Northgate Australian Ventures.
Dincer, T., 2011. Robbin's Hill Area, Preliminary Pit Optimisation Study Results - Draft. Unpublished report to Fosterville Gold Mine by Mining Solutions Consultancy Pty Ltd, March 2011.
Hitchman, S.P., 2006. June 30 2006 Fosterville ML Resource Model Descriptions Section 2 - Southern Areas, July, 2006. Unpublished internal Perseverance Exploration report.
Hitchman, S.P., 2007. Farley’s Area Resource Work - May 2007. Unpublished internal Perseverance Exploration report.
Henderson K. 2014. A structural and geochemical analysis of stibnite-visible gold mineralisation at the Fosterville Gold Mine, central Victoria. Monash University Thesis (unpublished).
Jackson, S., 2007. Review of Fosterville and Golden Gift 3 & 9 Resource Estimates. Unpublished report by QG Consulting.
James, K., 2005. History of Myrtle Creek (Central Victoria). In limited print.
Kelemen, T., 2004. Perseverance – Data Systems Review, March 2004. Unpublished report by IO Digital Systems.
King, S., 2004. Geology of the Harrington’s Hill to Daley’s Hill Area with Special Reference to Daley’s Hill Pit
Geology. Unpublished report by Solid Geology.
King, S., 2005. Structural Compilation of Drilling and Geological Mapping in the Robbin’s Hill – Sharkey's Area, Fosterville Gold Project, Victoria. Unpublished report by Solid Geology.
King, S., 2006. Structural Interpretation of Cross-sections, Between 6700N and 5900N (Harrier Splay) Fosterville Gold Project, Victoria. Unpublished report by Solid Geology.
King, S., 2007. Structural Interpretation of The Fosterville and Hunt’s Pit Area
9900N – 11400N Fosterville Gold Project, Victoria. Unpublished report by Solid Geology.
Leader L. D. & Wilson C. J. L., 2010. The control of regional-scale fault geometries on strain and fluid flow related to gold mineralization: Insights from FLAC3D models constrained by seismic survey interpretations. GeoScience Victoria 3D Victoria Report 11. Department of Primary Industries.
Lipton I.T., 1997. A Review of Density Determination Methods for Iron Ore Deposit Evaluation. National Conference on iron making resources and reserves estimation, Perth 25-26 September, 1997, Perth. WA. In Australian Institute of Mining and Metallurgy spectrum series No.5, 51-56.
228
| Technical Report | Kirkland Lake Gold |
| December 2016 | Fosterville Gold Mine |
Melling W.D., 2008. Alteration at the Fosterville Gold Deposit, Victoria, Australia. Unpublished University of Melbourne Bachelor of Science Honours Thesis.
McArthur G.J., 2012. Fosterville Antimony Mineralogy, July 2012. Unpublished report for Fosterville Gold Mine by ALS AMMTEC Metallurgy.
McConville, F., 2006. Perseverance - Data Systems Review, September 2006. Unpublished report by IO Digital Systems.
Mernagh T.P., 2001. A fluid inclusion study of the Fosterville Mine: a turbidite hosted gold field in the Western Lachlan Fold Belt, Victoria, Australia. Chemical Geology 173, 91-106.
Norris N.D., 2006, EL3539 Goornong Annual Report for the period ending July 30th, 2006. Unpublished report by Perseverance Exploration Pty Ltd.
Perseverance, 1997. Sulfide Open Pit Feasibility Study. Unpublished internal report. Perseverance, 2000. Sulfide Open Pit Feasibility Study. Unpublished internal report. Perseverance, 2003. Fosterville Bankable Feasibility Study. Unpublished internal report.
Phillips D., Fu B., Wilson C.J.L., Kendrick M.A., Fairmaid A.M. & Miller J. MCL., 2012. Timing of gold mineralisation in the western Lachlan Orogen, SE Australia: A critical overview. Australian Journal of Earth Sciences. Volume 59, pp 495-525.
Rabone G, Watt J., 1990, Report on Exploration License 1881 Fosterville North, Victoria for the Six Month Period ending September 1, 1990. Unpublished report by BHP Gold Mines Ltd.
Reed A., 2007. Wirrawilla Report, November 2007. Unpublished internal Perseverance Exploration report.
Reed C., 2007a. Farley’s Deposit Geological Summary, April 2007. Unpublished internal report.
Roberts C, Jackson T, Allwood K, Shawcross M, Story J, Barbetti L, Tielen R, Boucher R and Norris N, 2003. Fosterville - Rise of the Phoenix, the emerging goldfield at Fosterville, in NewGenGold 2003 Conference Proceedings, (Louthean Media: Perth).
Stewart, M., 2007. Notes on QAQC processes and On-Site Laboratory visit. Unpublished report by QG Consulting.
Swensson C., 1986, Statutory Report for EL1392 for the Period ended July 1986 to November 1986. Unpublished report by Bendigo Gold Associates Pty Ltd.
Townend R., 2009. Preparation of two polished sections of two sulfide concentrates and optical/SEM examination, Jan 2009. Unpublished report for Fosterville Gold Mine by Roger Townend and Associates.
Van Riel B., 1985, Exploration License 1392, Fosterville - Progress Exploration Report for the Period ended April, 1985. Unpublished report by Bendigo Gold Associates Pty Ltd.
Van Riel B., 1985a, Exploration License 1392, Fosterville - Progress Exploration Report for the Period ended November, 1985. Unpublished report by Bendigo Gold Associates Pty Ltd.
Van Riel B., 1998, EL3539 Goornong Annual Report for the period ending 25th February, 1998. Unpublished report by Perseverance Exploration Pty Ltd.
229
| Technical Report | Kirkland Lake Gold |
| December 2016 | Fosterville Gold Mine |
Van Riel B., 1999, EL3539 Goornong Annual Report for the period ending 25th February, 1999. Unpublished report by Perseverance Exploration Pty Ltd.
Van Riel B., 2007, EL3539 Goornong Annual Report for the period ending July 30th, 2007. Unpublished report by Perseverance Exploration Pty Ltd.
Vandenberg A.H.M., Willman, C.E., Maher, S., Simons, B.A, Cayley, R.A., Taylor, D.H., Morland, V.J., Moore, D.H, & Radojkovic, A., 2000. The Tasman Fold Belt in Victoria, in Geological Survey of Victoria Special Publication.
230
| Technical Report | Kirkland Lake Gold |
| December 2016 | Fosterville Gold Mine |
28 DATE AND SIGNATURE
| 28.1 | CERTIFICATE OF QUALIFIED PERSON – ION HANN |
I, Ion Hann, FAusIMM, as an author of this report entitled “Report on the Mineral Resources & Mineral Reserves of the Fosterville Gold Mine Victoria, Australia” dated effective 31 December, 2016 prepared for Kirkland Lake Gold Ltd. (the “Issuer”) do hereby certify that:
| 1. |
I am Mining Manager, at Fosterville Gold Mine, located at McCormick’s Road, Fosterville, Victoria 3557, Australia. |
|
| |
| 2. |
This certificate applies to the technical report entitled “Report on the Mineral Resources & Mineral Reserves of the Fosterville Gold Mine Victoria, Australia”, dated effective 31 December, 2016 (the “Technical Report”). |
|
| |
| 3. |
I graduated with a Bachelor of Engineering degree in Mining from the Western Australian School of Mines, Kalgoorlie, in 1991. I have worked as an engineer since graduation from university in 1991. During that time, I have been employed in various operation and technical roles at several mining companies within Australia with exposure to gold, nickel and tantalum.. I am a member in full standing of the Australian Institute of Mining and Metallurgy with Registration No. 302934. |
|
| |
| 4. |
I am familiar with National Instrument 43-101 – Standards of Disclosure for Mineral Projects (“NI 43-101”) and by reason of education, experience and professional registration I fulfill the requirements of a “qualified person” as defined in NI 43-101. |
|
| |
| 5. |
I am currently employed on a full time basis at the Fosterville Gold Mine, subject of the Technical Report, and have been since March 2005. |
|
| |
| 6. |
I am responsible for Sections 15-16, 18.2 and 28.1 of the Technical Report. |
|
| |
| 7. |
I am not independent of the Issuer as described in section 1.5 of NI 43-101 as I am an employee of the Issuer. |
|
| |
| 8. |
I have prior involvement with the property that is the subject of the Technical Report as I was a contributing author of the technical report on the Fosterville Gold Mine entitled “Report on the Mineral Resources & Mineral Reserves of the Fosterville Gold Mine Victoria, Australia” dated effective December 31, 2016. Since then, I have been frequently involved with the property by way of my role as Mining Manager. |
|
| |
| 9. |
I have read NI 43-101 and the parts of the Technical Report for which I am responsible have been prepared in compliance with NI 43-101. |
|
| |
| 10. |
At the effective date of the Technical Report, to the best of my knowledge, information and belief, the parts of the Technical Report for which I am responsible contain all scientific and technical information that is required to be disclosed to make the Technical Report not misleading. |
Dated this 30 day of March, 2017.
231
| Technical Report | Kirkland Lake Gold |
| December 2016 | Fosterville Gold Mine |

Ion Hann, B.Eng (Mining), FAusIMM
MINING MANAGER
FOSTERVILLE GOLD MINE
232
| Technical Report | Kirkland Lake Gold |
| December 2016 | Fosterville Gold Mine |
| 28.2 | CERTIFICATE OF QUALIFIED PERSON – TROY FULLER |
I, Troy Fuller, MAIG, as an author of this report entitled “Report on the Mineral Resources & Mineral Reserves of the Fosterville Gold Mine Victoria, Australia” dated effective 31 December, 2016 prepared for Kirkland Lake Gold Ltd. (the “Issuer”) do hereby certify that:
| 1. |
I am Geology Manager, at Fosterville Gold Mine, located at McCormick’s Road, Fosterville, Victoria3557, Australia. |
|
| |
| 2. |
This certificate applies to the technical report entitled “Report on the Mineral Resources & Mineral Reserves of the Fosterville Gold Mine Victoria, Australia”, dated effective 31 December, 2016 (the “Technical Report”). |
|
| |
| 3. |
I graduated with a Bachelor of Science degree in Geology (Hons) from University of Ballarat, in 1995. I have worked as a geologist since graduation from university in 1995. During that time, I have been employed as a Mine Geologist, Resource Geologist, Senior Mine Geologist, Mine Geology Superintendent and Geology Manager, at several mining companies. I have worked for more than 20 years in the mining industry, including more than 18 years in gold mining operations. I am familiar with and have worked on a variety of styles of mineral deposits in Australia, with a particular emphasis on gold mineralization. I am a member in full standing of the Australian Institute of Geoscientists with Registration No. 4570. |
|
| |
| 4. |
I am familiar with National Instrument 43-101 – Standards of Disclosure for Mineral Projects (“NI 43-101”) and by reason of education, experience and professional registration I fulfill the requirements of a “qualified person” as defined in NI 43-101. |
|
| |
| 5. |
I am currently employed on a full time basis at the Fosterville Gold Mine, subject of the Technical Report, and have been since May, 2010. |
|
| |
| 6. |
I am responsible for Sections 1-14, 17, 18.1, 19–27 and 28.2 of the Technical Report. |
|
| |
| 7. |
I am not independent of the Issuer as described in section 1.5 of NI 43-101 as I am an employee of the Issuer. |
|
| |
| 8. |
I have prior involvement with the property that is the subject of the Technical Report as I was a contributing author of the technical report on the Fosterville Gold Mine entitled “Report on the Mineral Resources & Mineral Reserves of the Fosterville Gold Mine Victoria, Australia” dated effective December 31, 2016. Since then, I have been frequently involved with the property by way of my role as Geology Manager. |
|
| |
| 9. |
I have read NI 43-101 and the parts of the Technical Report for which I am responsible have been prepared in compliance with NI 43-101. |
|
| |
| 10. |
At the effective date of the Technical Report, to the best of my knowledge, information and belief, the parts of the Technical Report for which I am responsible contain all scientific and technical information that is required to be disclosed to make the Technical Report not misleading. |
Dated this 30 day of March, 2017.
233
| Technical Report | Kirkland Lake Gold |
| December 2016 | Fosterville Gold Mine |

Troy Fuller, BSc (Geology) Hons, MAIG
GEOLOGY MANAGER
FOSTERVILLE GOLD MINE
234

| Taylor Property |
| NI 43-101 Technical report |
Important Notice
This Technical Report has been prepared as a National Instrument 43-101 Technical Report, as prescribed in Canadian Securities Administrators’ National Instrument 43-101, Standards of Disclosure for Mineral Projects (NI 43-101) for Kirkland Lake Gold Ltd. (Kirkland Lake Gold). The data, information, estimates, conclusions and recommendations contained herein, as prepared and presented by the Authors, are consistent with: the information available at the time of preparation; the data supplied by outside sources, which has been verified by the authors as applicable; and the assumptions, conditions and qualifications set forth in this Technical Report.
Cautionary Note with Respect to Forward-Looking Information
Certain information and statements contained in this Technical Report are “forward looking” in nature. All information and statements in this report, other than statements of historical fact, that address events, results, outcomes or developments that Kirkland Lake Gold Ltd. and/or the Qualified Persons who authored this report expect to occur are “forward-looking statements”. Forward looking statements are statements that are not historical facts and are generally, but not always, identified by the use of forward-looking terminology such as “plans”, “expects”, “is expected”, “budget”, “scheduled”, “estimates”, “forecasts”, “intends”, “anticipates”, “projects”, “potential”, “believes” or variations of such words and phrases or statements that certain actions, events or results “may”, “could”, “would”, “should”, “might” or “will be taken”, “occur” or “be achieved” or the negative connotation of such terms.
Forward-looking statements involve known and unknown risks, uncertainties and other factors which may cause actual results, performance or achievements to be materially different from any of its future results, performance or achievements expressed or implied by forward-looking statements. These risks, uncertainties and other factors include, but are not limited to, assumptions and parameters underlying the life of mine update not being realized, a decrease in the future gold price, discrepancies between actual and estimated production, changes in costs (including labour, supplies, fuel and equipment), changes to tax rates; environmental compliance and changes in environmental legislation and regulation, exchange rate fluctuations, general economic conditions and other risks involved in the gold exploration and development industry, as well as those risk factors discussed in the technical report. Such forward-looking statements are also based on a number of assumptions which may prove to be incorrect, including, but not limited to, assumptions about the following: the availability of financing for exploration and development activities; operating and capital costs; the Company’s ability to attract and retain skilled staff; sensitivity to metal prices and other sensitivities; the supply and demand for, and the level and volatility of the price of, gold; the supply and availability of consumables and services; the exchange rates of the Canadian dollar to the U.S. dollar; energy and fuel costs; the accuracy of reserve and resource estimates and the assumptions on which the reserve and resource estimates are based; market competition; ongoing relations with employees and impacted communities and general business and economic conditions. Accordingly, readers should not place undue reliance on forward-looking statements. The forward-looking statements contained herein are made as of the date hereof, or such other date or dates specified in such statements.
All forward-looking statements in this Technical Report are necessarily based on opinions and estimates made as of the date such statements are made and are subject to important risk factors and uncertainties, many of which cannot be controlled or predicted. Kirkland Lake Gold Ltd. and the
Page | ii
Taylor Property
NI 43-101 Technical report
Qualified Persons who authored this report undertake no obligation to update publicly or otherwise revise any forward-looking statements contained herein whether as a result of new information or future events or otherwise, except as may be required by law.
Non-IFRS Financial Performance Measures
Kirkland Lake Gold has included a non-IFRS measure “total site costs”, “total site costs per ounce” and various unit costs in this Technical Report. The Company believes that these measures, in addition to conventional measures prepared in accordance with IFRS, provide investors an improved ability to evaluate the underlying performance of the Company. The non-IFRS measures are intended to provide additional information and should not be considered in isolation or as a substitute for measures of performance prepared in accordance with IFRS. These measures do not have any standardized meaning prescribed under IFRS, and therefore may not be comparable to other issuers.
Page | iii
| Taylor Property |
| NI 43-101 Technical report |
| C O N T E N T S |
Page | iv
Taylor Property
NI 43-101 Technical
report
Page | v
Taylor Property
NI 43-101 Technical report
| T A B L E S |
Page | vi
Taylor Property
NI 43-101 Technical
report
| F I G U R E S |
Page | vii
SUMMARY
This National Instrument 43-101 technical report (technical report) was triggered by the disclosure from Kirkland Lake Gold Ltd (KLG) of its Annual Information Form (AIF) for the year 2016 (section 4.2 (1) (f) of the Instrument).
This technical report has been prepared for KLG, the beneficial owner of the Taylor Mine. KLG is listed on the Toronto Stock Exchange under the ticker symbol “KL”. This technical report provides the Mineral Resource and Mineral Reserve estimates for the Taylor Mine that have resulted from ongoing exploration and resource definition drilling and as a result of ongoing mine design and evaluation during the period January 1, 2016 to December 31, 2016.
The Taylor property is located in the Taylor Township, approximately eight km northwest of the town of Matheson and four km, north of Highway 101, which lies within the Black River-Matheson Municipality and within Lots 5 – 8, Concessions II and III of Taylor Townships in the Larder Lake Mining Division, District of Cochrane, Ontario, Canada. The main access to the property is via Regional Road #11, north of Highway #101.
The infrastructure is well developed and can support mining activities in the area. Power, fuel and water are already available at the Taylor. The area is well serviced with an array of major roads and two airports (in Timmins and Rouyn-Noranda). Since the ore will be treated at the company’s
Holt mill, there are no requirements to store tailings at the Taylor site; waste rock storage areas were constructed during previous mining activities and are being used, as required.
The Taylor property area had been explored by Hollinger and by a joint venture between Labrador Mining and Exploration Company Ltd. (successor to Hollinger) and later by Esso Minerals Canada (Esso Minerals). The property was acquired by St Andrew Goldfields Ltd. (SAS) in 2000; SAS was acquired by KLG on January 26, 2016.
The Taylor Mine Complex is located along the Porcupine-Destor Fault Zone (PDF), a major structural feature associated with globally significant gold deposits lying within the Abitibi Greenstone Belt of northeastern Ontario and north-western Quebec. The Abitibi Greenstone Belt is typical of other Archean-aged greenstone belts in the Canadian Shield and elsewhere in the world in that, it contains predominantly volcanic and sedimentary sequences of rocks intruded by mafic to felsic intrusions and late cross-cutting diabase dikes. Being approximately 750 km in length by 250 km in width, it is one of the largest greenstone belt in the world. Volcanic, sedimentary and contemporaneous intrusive rocks in the Abitibi range in age from 2,745 to 2,680 Ma. Gold production from deposits located in proximity to the PDF has been prolific. Total output is estimated at over 62 million ounces of gold since the start of gold production in the Porcupine Camp.
Page | 1
Taylor Property
NI 43-101 Technical report
The Taylor Mine is located along the PDF in its central portion, approximately 60 km east of the main gold producers in the vicinity of Timmins. The PDF in the area of the Taylor Mine strikes roughly east-west, and dips to the south between 40° and 60°, with the majority of the property lying to the south of the projected trace of the PDF. The PDF is a complex structural zone and it is more accurately described as a zone of tens of metres width, along which are contained many individual zones of movement. In the Taylor property area, the footwall of the PDF is considered to be a thick series of relatively undeformed and unaltered metasedimentary rocks intersected to the footwall.
The Taylor Mineralization is in close proximity, within the hanging wall, to the PDF. Over a strike length of 2.3 kilometres there are three mineralization zones that have been identified, from east to west these are:
-
The Shaft Deposit, with gold mineralization associated with felsic intrusive rocks.
-
The West Porphyry Deposit (WPZ), a system of stacked lenses, with the gold mineralization associated with felsic intrusive and altered mafic-ultramafic rocks (Green Quartz Carbonate).
-
The Shoot Deposit, with gold mineralization hosted by argillaceous metasedimentary rocks within a package of green quartz carbonate.
Gold commonly occurs as relatively coarse-sized free gold in quartz, but also occurs as fine particles, which may be intimately associated with sulphides (particularly pyrite and locally, arsenopyrite) both in quartz-carbonate veins or in surrounding altered host rocks.
The deposits within the Taylor Mine Complex are present along and within the hanging wall of the PDF. The company interprets the area to contain faults parallel to the PDF on the north and south side. Reverse faulting may occur in this sense creating an opportunity for offset zones. Though sparse in drilling, KLG has identified lenses in the footwall of the PDF, named the 1003 Zone (West Porphyry Deposit), which will continue to be explored in 2017. The Taylor Fault located to the south also creates an opportunity for offset zones. KLG plans on diamond drilling to test further away from the PDF.
In 2016, KLG employed three underground rigs to define and explore nearby targets and expand the resource. One target was in the area of the Bulk Sample #1 at the 100 Level (approximately 100 m below surface). Drilling focused mainly above the mined area with the goal of expanding the resource of the 1010 lenses. Another target focused down dip of the WPZ drilling from the lowest level, the 450 Level (450 m below surface), to expand the resource at depth and test for the potential of en échelon lenses.
Page | 2
Taylor Property
NI 43-101 Technical report
On surface, KLG utilized one drill to test for mineralization along strike of the PDF to the east of the Shaft Deposit. Recent drill results from 2016 drilling have shown gold present in quartz veins approximately 800m away.
While the Taylor Mine consists of a few zones: the Shoot Deposit (located on the west side of the property), the WPZ, the East Porphyry Deposit and the Shaft Deposit (located on the east side of the property), development and operating activities are currently focused on the WPZ; it extends vertically about 600 m and is mostly open at depth. The deposit is accessed via a ramp and mined by overhand cut and fill method (for shallow dip ore zones) or longhole stoping (where the ore zones dip at an angle greater than 45°). Ore and waste are trucked to surface where the ore is loaded into surface trucks for haulage to the Holt mill and the waste is stockpiled on designated surface areas. Ventilation is forced underground via the shaft opening. Auxiliary fans are installed, as required, for adequate airflow distribution. Underground water is pumped to a collector pond on surface prior to be discharged in the environment.
Ore is delivered to the mill where it goes through the grinding circuit (5 m diameter by 6.1 m long SAG mill), a 4 m diameter by 5.5 m long ball mill and a 3.6 m diameter by 4.9 m long tertiary ball mill, all operating in series and in closed circuit.
After going through the primary cyclone cluster, the secondary cyclone cluster feeds a 27 m thickener underflow that feeds carbon-in-leach tanks. The tank system is conventional gravity flow for slurry with counter-current carbon advancement.
Precious metal stripping is performed in batch operations. Carbon is transferred to an adsorption column where a Zadra process is utilized as the gold elution method. Barren solution is circulated through two shell and tube heat exchangers and a electric inline heater.
The resulting pregnant solution is pumped from the solution tank to an electro-winning cell. The gold precipitate is further refined in a furnace and the doré bars are poured.
KLG has recently signed an agreement with First Nations who have treaty and aboriginal rights which they assert within the operations area of the mine.
Page | 3
Taylor Property
NI 43-101 Technical report
The updated Mineral Resources and Mineral Reserves, as of December 31, 2016, are presented in Summary Table 1 and Summary Table 2, respectively.

Notes
CIM
definitions (2014) were followed in the estimation of Mineral
Resource
Mineral
Resources are reported Exclusive of Mineral
reserves
Mineral
Resource estimates were prepared under the supervision of D. Cater, P.
Geo.
Mineral
Resources were estimated at a block cut-off grade of
2.6g/t
Mineral
Resources are estimated using a long term gold price of US$1,200/oz
(CDN$1,500/oz)
A
minimum mining width of 3m was
applied
A
bulk density of 2.84 t/m3 was
used
Totals
may not add exactly due to rounding
Summary Table 1: Mineral resources at Taylor Mine (as of Dec 31, 2016).
Page | 4
Taylor Property
NI 43-101 Technical report

Notes
CIM definitions
(2014) were followed in the estimation of Mineral Reserves
Cut-off grades
were calculated for each stope, unless noted otherwise
Mineral Reserves were
estimated using a long-term gold price of US$1,200/oz (CDN$1,500/oz)
Mineral
Reserves estimates were prepared under the supervision of P. Rocque, P. Eng.
Totals may not add exactly due to rounding
Summary Table 2: Mineral reserves at Taylor Mine (as of Dec 31, 2016).
The Bulk Sample #2 program at Taylor successfully extracted gold mineralization as interpreted from SAS’ (now KLG’s) August 2014 Indicated Resource Estimate. The Holt mill successfully processed the Taylor ore recovering 4, 948 troy ounces from the 17,549 tonnes processed. Mill recovery of 97.4% exceeded the estimated 94.5 % recovered rate used in the PFS 2012 (which was based on laboratory test work).
Page | 5
Taylor Property
NI 43-101 Technical report
Commercial production at Taylor was declared in November 2015. During 2016 (the first full year of operation), Taylor produced a total of 199,200 tonnes at an average head grade of 6.90 g/t Au, resulting in 42,639 ounces being produced.
In 2017, an exploration drift to the east on the 430m level has been proposed to assess both the Shaft Deposit, which commences immediately below surface (under 15 m of overburden) and the East Porphyry Zone mineralization at depth.
Opportunities at Taylor include:
| • |
Strike / Dip extension of mineralized zones that remain open and warrant drill testing. | |
| • |
New Discovery potential is available given the historical sparse drill coverage which to date has been concentrated along the PDF. Additional targets exist to both the south and within the sediments situated north of PDF. | |
| • |
The installation of a gravity recovery circuit may improve the overall recovery by 1% to 2% based on recent test work. | |
| • |
Geology re-int+erpretation based on information gained through additional drilling and underground sampling may lead to additional mineral resources (and possibly to additional mineral reserves). |
Some of the risks include:
| • |
Future exploration programs are unable to keep pace with mining that in turn results in mineral resources and mineral reserves being depleted; | |
| • |
Mineral resources may not be converted up to mineral reserves due to a lack of economic support; | |
| • |
Drop in gold price to a level whereby it becomes uneconomic to continue mining and developing the mine complex; | |
| • |
Increased costs for skilled labour, power, fuel, reagents, trucking, etc. could lead to an increase the cut-off grade and decrease the level of mineral resources and mineral reserves; | |
| • |
Mechanical breakdown of critical equipment or infrastructure that could decrease or halt the production throughput at the mine; and | |
| • |
Continuity of ore zones not well defined or understood. |
Page | 6
Taylor Property
NI 43-101 Technical report
Exploration potential at Taylor is regarded as excellent. Diamond drilling from both surface and underground is warranted to 1) assess mineralized strike and dip extensions, 2) to define the overall trend and width of the through-going diabase dykes, and 3) to target new discoveries on the property and associated with the PDF trend.
Underground development west (on the 390 and 450 levels) and associated diamond drill platforms are critical to the delineation of future mineral resources.
The re-processing of the 1997 Quantec IP survey data over the Shaft Deposit, has yielded encouraging results when sliced into a series of level plans. Drilling is required to follow-up on the geophysical signature of the Shaft and WPZ mineralized trend at depth.
A seismic reflection line was conducted 5 km west of Taylor, as part of the Discover Abitibi exploration initiative in 2005, which defined a buried mafic volcanic complex to the north of the PDF. Additional seismic lines are justified, to define the regional geological setting at depth, with scout level drilling proposed to confirm the seismic line interpretation.
Continued definition drilling at the current drill spacing (15 m by 15 m centres) is recommended to confirm the geometry of the mineralized zones.
Page | 7
Taylor Property
NI 43-101 Technical report
| 1.0 |
INTRODUCTION |
|
This National Instrument 43-101 technical report (technical report) was triggered by the disclosure from Kirkland Lake Gold Ltd (KLG) of its Annual Information Form (AIF) for the year 2016 (section 4.2 (1) (f) of the Instrument). | |
|
This technical report has been prepared for KLG, the beneficial owner of the Taylor Mine. KLG is listed on the Toronto Stock Exchange under the ticker symbol “KL”. This technical report provides the Mineral Resource and Mineral Reserve estimates for the Taylor Mine that have resulted from ongoing exploration and resource definition drilling and as a result of ongoing mine design and evaluation during the period January 1, 2016 to December 31, 2016 | |
|
Information was obtained through the field and technical work related to the Taylor deposit over the past several years. Most of that information was derived by KLG employees. | |
|
The two qualified persons (QP) visited the Taylor property numerous times since 2010 and participated in the direction of the field and technical work. | |
|
The units of measures used in this report conform to the metric system. Unless stated otherwise, the Canadian Dollar (CDN$) is the currency used in this technical report. A list of abbreviations is displayed in Table 1-1. |
Page | 8
Taylor Property
NI 43-101 Technical report
| Abbreviation | Meaning |
| a | annum |
| CDN$ | Canadian dollar |
| cm | centimetre |
| d | day |
| DDH | diamond drill hole |
| EM | electromagnetic |
| g | gram |
| gpt, g/t | gram per tonne |
| ha | hectare (2.471 acres) |
| HLEM | horizontal loop electromagnetic |
| IP | induced polarization |
| k | kilo |
| kg | kilogram |
| km | kilometre |
| L, l | litre |
| m | metre |
| M | mega |
| $M | million dolars |
| m³ | cubic metre |
| MASL | metres above sea level |
| min | minute |
| ODH | overburden drill hole |
| oz | Troy ounce (31.1035 grams) |
| koz | thousand ounces |
| ppm, ppb | part per million, part per billion |
| s | second |
| ton | short ton (0.907185 tonne) |
| tonne, t | metric tonne |
| tpa, t/a | tonne per year |
| tpd, t/d | tonne per day |
| US$ | United States of America Dollar |
| VLEM | vertical loop electromagnetic |
| VLF-EM | very low frequency electromagnetic |
Table 1-1: List of Abbreviations.
Page | 9
Taylor Property
NI 43-101 Technical report
| 2.0 |
RELIANCE ON OTHER EXPERTS |
|
For some aspects of this technical report, the QPs relied on the following persons: |
| • | Ryan Cox, Environmental Coordinator (portions of section 19). | |
|
• |
Alasdair Federico, Executive Vice President (section 4.3 and portions of section 19; community and First Nations) |
Page | 10
Taylor Property
NI 43-101 Technical report
| 3.0 |
PROPERTY DESCRIPTION AND LOCATION |
| 3.1 |
Location |
|
The Taylor property is located in the Taylor Township, approximately eight km northwest of the town of Matheson and four km, north of Highway 101, which lies within the Black River-Matheson Municipality and within Lots 5 – 8, Concessions II and III of Taylor Townships in the Larder Lake Mining Division, District of Cochrane, Ontario (Figure 3-1). The main access to the property is via Regional Road #11, north of Highway #101. Existing mine workings are located immediately north and south of Concession Road II. The Taylor property lies east of the Stock Mine property and west of the Black Fox mine, which are both owned and operated by Primero Mining Corp. |

|
Figure 3-1: Location of Taylor project | |
| 3.2 |
Mineral Tenure and Encumbrances. |
|
The claim group is centered at 5379000N and 529000E in NAD83, zone 17 (using UTM coordinate system). | |
|
The 3,080 ha property is comprised of 77 claims that include patented, leased, mineral claims and surface and mineral rights claims (Figure 3-2). |
Page | 11
Taylor Property
NI 43-101 Technical report
Various net profit payments or other royalty agreements were negotiated over the past 23 years (Table 3-1).

Figure 3-2: Taylor property claim map.
Page | 12
Taylor Property
NI 43-101 Technical report

Table 3-1: Claim ownership and associated royalties.
Page | 13
Taylor Property
NI 43-101 Technical report
| 3.3 |
Permit Status |
|
Valid permits pertaining to the Taylor are displayed in Table 3-2. |
| Agency | Item | Description | Site | Expiration | Status | |
| MOE | CA # 8693-7NVPHR | ISW water treatment | Taylor | N/A | Active | |
| MOE | CA # 4-0020-98-006 | ISW water treatment | Taylor | N/A | Inactive | |
| MOE | CA # 6230-A2NK3Z | Air emissions | Taylor | N/A | Active | |
| MOE | CA # 3041-3MGQSQ | Portal exhaust and propane heaters | Taylor | N/A | Inactive | |
| MOE | PTTW # 5388-ADYH8L | Mine Sump | Taylor | Feb. 28, 2026 | Active | |
| MOE | PTTW # 1433-9ZHJXD | Mine Sump | Taylor | Feb. 28, 2026 | Inactive | |
| MOE | PTTW # 5330-7AQLJS | Dewatering | Taylor | Jan. 10, 2018 | Inactive | |
| MOE | PTTW # 0548-6J8HLQ | Dewatering | Taylor | Nov. 22, 2007 | Inactive | |
| MNDMF | Closure Plan 2015 | Director Acceptance | Taylor | N/A | Active | |
| MNR | Permit # KLK-16-25 | Fire Permit | Taylor | Annual | Active | |
| MOE | ID # ON5099035 | HWIN Waste Registration | Taylor | N/A | Active |
|
Table 3-2: Permits for Taylor Property. | |
|
A Notice of Project status change was received in 2016 from MNDN, modifying the status from inactive to active. | |
| 3.4 |
Environmental Liability and Other Potential Risks |
|
In the Qualified Person’s (QP) opinion, there are no significant factors or risks that may affect access, title or the right or ability of KLG to continue mining operations on the Taylor property. |
Page | 14
Taylor Property
NI 43-101 Technical report
| 4.0 |
ACCESSIBILITY, CLIMATE, LOCAL RESOURCES, INFRASTRUCTURE AND PHYSIOGRAPHY |
| 4.1 |
Climate, Topography and Physiography |
|
The climate of the area is typical of northern Ontario with cold winters, warm summers and only moderate precipitation. Climatic conditions in Timmins have been described based on meteorological information from Environment Canada1 during the period from 1971 to 2000. The average daily temperature in the Timmins area is recorded as 1.3°C with a daily average low of -17.5°C in the month of January, and a daily average high of 17.4°C in the month of July. An extreme low of -45.6°C was recorded on February 1st, 1962 and the extreme high of 38.9°C occurred on July 31st, 1975. The yearly average precipitation for the Timmins area is 831.3 mm with approximately 67% as rain and 33% as snow. The record daily amount of rainfall, 87.6 mm, occurred on July 29th, 1990 and the record daily amount of snowfall, 48.2 cm, occurred on March 19th, 1983. | |
|
All of the Taylor property is covered by flat lying to gently rolling terrain with little topographic relief. Overburden depths range for 3 to 60 m, with average overburden depth on the property being approximately 30 m. Elevations range from approximately 250 m to 300 m above sea level. The area is reasonably well drained by creeks and small rivers, and there are numerous small swamps and marsh areas. Outcrop is limited due to an extensive blanket of overburden, mostly sand with lesser amounts of clay from the northerly trending Munro esker. The area is located within the Boreal Shield zone: tree cover is normally thick and predominantly coniferous (with black spruce and jack pine being the most common species), with lesser stands of poplar and birch. The current cover is believed to be a mix of second and third growth forest as a result of logging operations and forest fires. | |
| 4.2 |
Means of Access to the Property |
|
The Taylor property can be accessed by travelling two km west on an all-weather gravel road (the “Taylor road”) off Highway #11, which is located eight km west of the town of | |
|
Matheson along Highway #101. Highways #11 and #101 are part of the Trans-Canada Highway system and a main transportation route between northern and southern Ontario. Alternately, the property can be accessed by travelling north on the Val Gagné Road from Highway #101, east along the Taylor Township Concession II Road. | |
|
Once on the Taylor property, visitors must register with site security personnel at the security office. |
______________________________________
1
Environment Canada website: http://www.climate.weatheroffice.gc.ca
Page | 15
Taylor Property
NI 43-101 Technical report
Access to the property and current infrastructure are displayed in Figure 4-1.

|
Figure 4-1: Access map to the Taylor property. | |
| 4.3 |
Infrastructure and Local Resources |
|
The infrastructure is well developed and can support mining activities in the area. Power, fuel and water are already available at the Taylor mine site. | |
|
The area is well serviced with an array of major roads and two airports (in Timmins and Rouyn-Noranda). Since the ore will be treated at the company’s Holt mill, there are no requirements to store tailings at the Taylor site; waste rock storage areas were constructed during previous mining activities and are being used, as required. | |
|
The Black River-Matheson Township (116,167 ha) has an approximate population of 2,800 residing mainly in the towns of Matheson, Shillington, Holtyre and Ramore. Further to the west are the towns and cities of Porcupine, South Porcupine, Schumacher and Timmins (approximately 45,000 residents). To the north are the towns of Iroquois Falls and Cochrane. To the south is the town of Kirkland Lake (approximately 10,000 residents). |
Page | 16
Taylor Property
NI 43-101 Technical report
KLG owns an office building in Matheson that is being used as its Exploration Department base. Additionally, KLG acquired two former motels in Matheson that are operated as temporary housing for relocated employees or transient contractors. KLG uses many local residents as support staff and local contractors to maintain the facilities.
KLG has recently signed an agreement with First Nations who have treaty and aboriginal rights which they assert within the operations area of the mine.
The agreement provides a framework for strengthened collaboration in the development and operations of the mine and outlines tangible benefits for the First Nations, including skills training and employment, opportunities for business development and contracting, and a framework for issues resolution, regulatory permitting and KLG’s future financial contributions.
Page | 17
Taylor Property
NI 43-101 Technical report
| 5.0 |
HISTORY |
| 5.1 |
Prior Ownership |
|
The Taylor property area had been explored by Hollinger and by a joint venture between Labrador Mining and Exploration Company Ltd. (successor to Hollinger) and later by Esso Minerals Canada (Esso Minerals). The property was acquired by St Andrew Goldfields Ltd. (SAS) in 2000; it included two near surface gold deposits, the Shoot Zone and the Shaft Zone and the deeper West Porphyry Zone. SAS was acquired by KLG on January 26, 2016. | |
| 5.2 |
Exploration and Development Work |
| 5.2.1 |
Shaft Deposit |
|
The Taylor Mine Shaft Deposit was discovered by Hollinger in 1962. From 1962 to 1966, Hollinger drilled 68 surface diamond drill holes totalling 14,384 m and from 1980 to 1984 Hollinger drilled an additional 31 surface diamond drill holes totalling 3,662 m From February 1986 to July 1998, SAS drilled 42 diamond drill holes from surface totalling 13,649 m. From 1986 to 1988, an underground exploration program was undertaken on the Shaft Zone by SAS and Esso Minerals. A shaft was sunk to 172 m through 14 m of overburden. Drifting, crosscutting, some raising, and extensive underground diamond drilling were carried out on three levels. From March 1987 to October 1988, 254 holes totalling 12,108 m were drilled from underground. From April 1962 to July 1998, a total of 395 diamond drill holes aggregating 43,803 m have targeted the Shaft Deposit mineralization. | |
|
In 2014, SAS constructed new mineral resource and provided an updated resource estimate shapes for both the “green carbonate” zone and felsic zone situated in the vicinity of the Shaft Deposit. In addition, in late 2014 one drill hole was completed and a comprehensive chip – channel sampling program was completed in order to confirm the mineral tenor of the Shaft Deposit | |
| 5.2.2 |
West Porphyry Deposit |
|
The West Porphyry Deposit (WPZ), located about 450 m west of the Shaft Deposit and about 400 m below surface, was discovered by Hollinger in 1962. From April 1962 to August 1966, Hollinger drilled 14 holes totalling 4,606 m. From November 1972 to June 1980, Hollinger intermittently drilled a total of 10 holes totalling 4,118 m. From February 1986 to July 1998, SAS drilled 185 holes from surface totalling 84,015 m. Up until July 1998, some 209 holes totalling 92,740 m had been drilled in the West Porphyry Deposit area and vicinity. The West Porphyry Deposit hosts the Main West Porphyry Deposit and the Upper West Porphyry Deposit. |
Page | 18
Taylor Property
NI 43-101 Technical report
|
In 2004, SAS commenced planning for the Advanced Exploration Project to test the West Porphyry deposit. In 2005, 13 surface diamond drill holes were completed in the planned portal area for condemnation purposes and rock strength testing. These holes tested the thickness of the overburden and typically cored about 3 m of rock. Detailed plans and budgets were completed. By the end of 2006, the overburden in the portal area had been excavated and development of the decline was commenced.\ | |
|
The West Porphyry Deposit consists of a series of multiple en-echelon shear zones and intrusive bodies that have a moderate to shallow south-dipping, west-plunging orientation along an east striking fault surface. The WPZ collectively host the majority of mineral resources at Taylor. In 2016, the WPZ was being actively developed down to the 450m elevation, with stoping taking place on the 360 – 390m elevations. | |
|
The mineral reserve / mineral resources for the WPZ at Taylor are now regularly updated for year-end Mineral Resource reporting purposes. A mineral resource update for the WPZ was completed in January 2017 to incorporate the results of the 2016 in-fill drilling campaign | |
| 5.2.3 |
Shoot Deposit |
|
The Shoot Deposit was discovered by Hollinger in 1972. From the time of the discovery until 1981, Hollinger drilled 50 holes totalling 8,263 m. From 1986 to April 1997, SAS drilled 49 holes totalling 9,960 m. The early 1997 SAS drill holes were shallow and closely spaced to investigate the Shoot Zone open pit potential. Some 99 diamond drill holes totalling 18,223 m were drilled in the Shoot Deposit area from 1972 to 1997. | |
|
Mineralization in the Shoot Deposit is situated near surface, and in 2014, SAS Engineering assessed the underground and open pit potential associated with the Shoot Deposit. | |
|
Additional drilling was done in 2016 to test for the extension of mineralization across the Bourgeois claim. In 2015, a total of 5,900 metres of drilling was conducted which targeted mineralization on the Bourgeois claim. Being the most recent claim to be incorporated into the Taylor property package, little diamond drill exploration has been performed up to this point. Drilling was conducted to evaluate property lithologies and explore for potential mineralized extensions between Shoot Deposit and 1004 Zone. Drill hole TA16-001 (dipping at –56°) intersected 10.31 g/t Au over 3.2 metres. Strong quartz veining, and disseminated sulphides are noted within the altered mafic volcanic. |
Page | 19
Taylor Property
NI 43-101 Technical report
| 5.2.4 |
East Porphyry Deposit |
|
A surface drilling program totaling 25 holes / 13,400 metres was completed in 2016 to follow up historic drilling on the down dip and down plunge mineralized trend to the west of the Shaft Deposit. Additional mineralization believed to be an extension of the Shaft Deposit was discovered. Indicated mineral resources of 128,000 tonnes averaging 5.71 g/t and inferred mineral resources of 248,000 tonnes averaging 6.07 g/t were subsequently added to the Taylor 2015 year end resource update. |
| 5.3 |
Historical Mineral Resources and Mineral Reserves |
|
KLG is not treating the historical estimates as current mineral resources or mineral reserves. A qualified person has not done sufficient work to classify the historical estimates as current mineral resources or mineral reserves. | |
| 5.3.1 |
Shaft Deposit |
|
An internal “Feasibility Study” completed in 1988 estimated “ore reserves” of 51,071 tonnes averaging 4.0 g/t Au, but indicated that profitability required a gold price in excess of CDN$610/oz. | |
|
Upon completion of the 2014-15 drilling and channel sampling program, the inferred mineral resources for the Shaft Deposit were estimated to be 204,000 tonnes averaging 4.95 g/t. | |
| 5.3.2 |
West Porphyry Deposit |
|
In 1998, SAS re-interpreted the West Porphyry Deposit mineralization and completed a mineral resource estimate using the polygonal method. The West Porphyry Deposit Indicated mineral resources were reported at 1,222,000 tonnes averaging 8.7 g/t Au at a 3.4 g/t Au cut-off grade and with high gold values capped at 34.3 g/t Au. The West Porphyry Deposit Inferred mineral resources totalled 410,000 tonnes averaging 8.5 g/t Au at a 3.4 g/t Au cut-off grade and with high gold values cut to 34.3 g/t Au. These mineral resources were first updated in 2004 (SWRPA, 2006). | |
| 5.3.3 |
Shoot Deposit |
|
In 1998, SAS estimated that the Shoot Deposit contained Indicated mineral resources totalling 670,000 tonnes averaging 5.5 Au at a 3.4 g/t Au cut-off grade. The Shoot Deposit Inferred mineral resources totalled 106,000 tonnes averaging 5.2 g/t Au at a 3.4 g/t Au cut-off grade. Capping of high gold values to 34.3 g/t Au had no impact on the resource estimate. |
Page | 20
Taylor Property
NI 43-101 Technical report
| 5.4 |
Historical Production from the Property |
|
A 6,000-tonne bulk sample from development in the Shaft Zone at the Taylor Project was processed at the Stock mill in September 1991. Gold recovery ranged from 89% to 96% for material grading on average 2.2 g/t Au. | |
|
An Advanced Exploration program was conducted on an upper lens within the West Porphyry Deposit in the fall of 2012, the “Bulk Sample 1” program. This program consisted of bulk sampling and test mining within the 1009 Lens on the 100 Level. Significant differences between interpreted gold resources and intersected gold mineralization were found in the program, resulting in disappointing gold production. A total of 8,467 tonnes grading 2.65 g/t Au was processed at the Holt Mill from the 2012 Bulk Sample 1 campaign during Q1 2013. Gold recovery rate was 95.2%. | |
|
Considerable knowledge concerning geological controls to gold mineralization within the WPZ was gained from the 2012 program, however. Key information learned from the Bulk Sample 1 Program includes: |
| • |
The WPZ is an extremely structurally complex ore body. Complex geological structures make full understanding of geometry and influences on gold distribution difficult to interpret from drill core with certainty. Underground development must be completed to understand the geometry and structural continuity of zones, and grade continuity within the zones. | |
| • |
Orientations of gold zones can be markedly different from those interpreted due to interpretation of widely spaced drill holes, which may not be oriented to best assess what are found to be the mineralized or controlling structures. Drill density must be sufficient to have tested potential alternative orientations of gold-bearing units and controlling structures. | |
| • |
Subtle structural features have been observed in underground excavations which have significant impact on the distribution and continuity of units (such as shear zones) and quartz veins, which are the main gold-bearing structures in the 100 Level Bulk Sample 1 area. These must be taken into account in geometric interpretations of gold zones. |
Following an extensive underground diamond drill program in 2012 and 2013, SAS initiated a second bulk sample program with the aim of testing the higher grade and more prospective ‘1004 Lens’ of the West Porphyry Deposit, approximately 275 meters below the 100 Level. Ramp development began in early 2014 and continued until the bottom level of the test area was reached in November 2014. Subsequent ore silling and longhole stoping of the area resulted in the extraction and milling of 17,540 tonnes averaging 9.01 g/t.
Page | 21
| Taylor Property |
| NI 43-101 Technical report |
Given the positive result of the second bulk sample program, a decision was made in February 2015 to commence mining activities that would see Taylor achieve commercial production. Commercial production was declared November 6, 2015, following three consecutive months of sustained production. Subsequent production results are summarized in Table 5-1.

Table 5-1: Taylor Project, Advanced Exploration and Production History.
Page | 22
Taylor Property
NI 43-101 Technical report
| 6.0 |
GEOLOGICAL SETTINGS AND MINERALIZATION |
| 6.1 |
Regional Geology |
|
The Taylor Mine Complex is located along the Porcupine-Destor Fault Zone (PDF), a major structural feature associated with globally significant gold deposits lying within the Abitibi Greenstone Belt of northeastern Ontario and north-western Quebec. The Abitibi Greenstone Belt is typical of other Archean-aged greenstone belts in the Canadian Shield and elsewhere in the world in that, it contains predominantly volcanic and sedimentary sequences of rocks intruded by mafic to felsic intrusions and late cross- cutting diabase dikes. Being approximately 750 km in length by 250 km in width, it is one of the largest greenstone belt in the world. Volcanic, sedimentary and contemporaneous intrusive rocks in the Abitibi range in age from 2,745 to 2,680 Ma. | |
|
There are three main stratigraphic units of significance to the region, from oldest to youngest: |
| • |
the Deloro Group consists of basal komatiitic flows overlain by calc-alkaline basalts and andesite and felsic pyroclastic volcanic rocks. | |
| • |
the Tisdale Group consists of ultramafic to basaltic komatiitic to Mg-tholeiitic basalt, which are overlain by Fe-tholeiitic basalts, overlain by felsic calc-alkaline pyroclastic volcanic rocks. | |
| • |
the Porcupine Group consists of metasedimentary rocks representing the infilling of a large basin via a turbiditic sequence including inter-layered greywacke, argillite and conglomerate. |
All the volcanic rocks listed above were intruded by mafic and felsic intrusive bodies, including feldspar and quartz-feldspar porphyries. Late diabase dikes cross-cut all of the above stratigraphic units. There is a common association of gold deposits with porphyritic intrusions in the Porcupine camp and elsewhere.
Gold production from deposits located in proximity to the PDF has been prolific. Total output is estimated at over 62 million ounces of gold since the start of gold production in the Porcupine Camp.
Numerous publications describe the regional geology of the area and gold deposit models and may be referenced for a more detailed description, including Ferguson et al (1971) and Pike and Jensen (1976).
Page | 23
Taylor Property
NI 43-101 Technical report
| 6.2 | Local and Property Geology |
|
The Taylor Mine Complex is almost entirely covered by glacial overburden, ranging from 3 m to 60 m in thickness (generally 30 m to 40 m thick). Thus, interpretations of the property geology have been made principally from diamond drill hole information as well as the underground excavations in the shaft and ramp areas developed in the Shaft Deposit. | |
|
| |
|
The Taylor Mine Complex is located along the PDF in its central portion, approximately 60 km east of the main gold producers in the vicinity of Timmins. The PDF in the area of the Taylor Mine Complex strikes roughly east-west, and dips to the south between 40° and 60°, with the majority of the property lying to the south of the projected trace of the PDF. The PDF is a complex structural zone and it is more accurately described as a zone of tens of metres width, along which are contained many individual zones of movement. In the Taylor property area, the footwall of the PDF is considered to be a thick series of relatively undeformed and unaltered metasedimentary rocks intersected to the footwall. | |
|
| |
|
The rock lithology on the Taylor property can be generalized, from south to north (Figure 6-1) as follows: |
| • |
mafic volcanic rocks, which are relatively undeformed and unaltered (likely Gold Centre Formation, Tisdale Assemblage); | |
| • |
ultramafic and mafic volcanic rocks, which vary from weakly to strongly deformed and altered and contain felsic to intermediate porphyritic intrusions of varying shapes and sizes; | |
| • |
metasedimentary rocks: the thick footwall sequence of Porcupine turbidites (siltstone, greywacke, sandstone) is interpreted to represent the footwall of the PDF on the Taylor property and an unconformity between the overlying volcanic rocks. |
Page | 24
Taylor Property
NI 43-101 Technical report
This general sequence is simplified and in detail and particularly in the mid section, the property geology is much more complex. Within the mid-section of the property, ultramafic and mafic rocks are interlayered, and exhibit varying degrees of deformation and alteration, sometimes intense, and are complexly intruded by dominantly felsic porphyritic intrusions. This sequence hosts the gold mineralization on the property.

|
Figure 6-1: Taylor property geological map | |
| 6.3 |
Mineralization |
|
The Taylor Mineralization is in close proximity, within the hanging wall, to the PDF. Over a strike length of 2.3 kilometres there are three mineralization zones that have been identified (Figure 6-2). From east to west these are: |
| • | The Shaft Deposit, with gold mineralization associated with felsic intrusive rocks. |
Page | 25
Taylor Property
NI 43-101 Technical report
| • |
The West Porphyry Deposit (WPZ), a system of stacked lenses, with the gold mineralization associated with felsic intrusive and altered mafic-ultramafic rocks (Green Quartz Carbonate). | |
| • |
The Shoot Deposit, with gold mineralization hosted by argillaceous metasedimentary rocks within a package of green quartz carbonate. | |
|
Gold commonly occurs as relatively coarse-sized free gold in quartz, but also occurs as fine particles, which may be intimately associated with sulphides (particularly pyrite and locally, arsenopyrite) both in quartz-carbonate veins or in surrounding altered host rocks. More detailed descriptions of the mineralized zones are given in the following sections. |
|
Figure 6-2: Longitudinal section showing the Shaft, Shoot and WPZ deposits. | |
| 6.3.1 |
Shaft Deposit |
|
The Shaft Deposit was explored underground in 1986 and 1987 via a 172 m shaft and three levels and again in 2006 via a surface ramp, which gave access to these levels. A large amount of information was collected by diamond drilling and drifting. At the conclusion of the earlier work, two types of gold association with a close spatial relationship were recognized: silicified molybdenite-graphite basalt and pyrite-altered felsic-intermediate intrusive rocks. |
Page | 26
Taylor Property
NI 43-101 Technical report
|
The molybdenite-graphite-associated mineralization comprises two small lenses extending from surface to a depth of 30 to 40 m. One has a strike length of 60 m and is approximately 9 m thick; the other has a strike length of 18 m and is approximately 11 m thick. Both occur as a zone of quartz veinlets with black molybdenite and graphite fracture filling within a flat lying porphyry dike. | |
|
The pyrite-altered porphyry is located 45 m to 120 m below surface and has a strike length of approximately 150 m. Horizontal width varies from 3 m to 18 m and the zone dips 50 degrees to the southeast. The zone is hosted in a brecciated, albite porphyry characterized by 10% to 30% pyrite and, to a lesser extent, red fluorapatite (5%). | |
|
An additional orebody termed the ‘green carbonate zone’ lies in the structural hanging wall of the Shaft deposit and was not within the scope of the earlier work. This orebody is characterized by variably dipping NE-SW-trending, shallow- to steep-dipping quartz- carbonate veins, stockworks, and breccias that contain coarse, visible gold with a wide spectrum of gold grades. These veins are hosted in a highly deformed fuchsite-chlorite- dolomite-altered ultramafic rock, locally termed “green carbonate.” The vein systems are the likely result of regional tectonic activity that caused extension veins to develop and later focused them into discrete shear zones along the margins of more competent rocks, such as the felsic intrusive and mafic volcanic rocks. | |
| 6.3.2 |
West Porphyry Deposit (WPZ) |
|
The WPZ has been interpreted as a series of stacked and en échelon lenses, which contain a locus of deformation, alteration, quartz veining, and gold mineralization (Figure 6-3). For this update, a total of 86 lenses (subdomains) have been defined. The lenses strike approximately 060° to 070°, dip approximately 40° to 50° to the south and are locally irregular in shape (although follow similar shape patterns from lens to lens). In the lower lenses, there appears to be gold enrichment related to a minor flexure in the footwall of the alteration zone with the underlying ultramafic volcanics. This flexure is approximately parallel to another potential structure that marks the down-dip extent of the concentrated gold mineralization. | |
|
Gold mineralization is hosted by several rock types within the WPZ, but primarily within areas of increased proportions of quartz ±carbonate veins, pyrite, strongly carbonate and sericite altered volcanic rocks, and silica ±albite-rich porphyritic intrusions. A compilation of the drilling and visual checks through underground development has shown that the quartz veining can cross cut lithologies as veining tends to follow contacts and fractures. | |
|
Gold mineralization with the WPZ occurs in high grade intercepts as relatively coarse free gold in quartz, which tends to have irregular distribution, and as lower grade intercepts, which are interpreted be resultant from fine-grained gold, perhaps more evenly distributed and associated with disseminated pyrite. The shape of each gold-bearing lens was very broadly interpreted based on structure, alteration, sulphide mineralization and gold grade. Rock type was used to a lesser extent, as it was determined that the gold mineralization is more related to geologic structures that transect lithological boundaries. |
Page | 27
Taylor Property
NI 43-101 Technical report

Figure 6-3: Isometric view of the West Porphyry Deposit.
Page | 28
Taylor Property
NI 43-101 Technical report
| 6.3.3 |
Shoot Deposit |
|
The Shoot Deposit consists of a single, regularly shaped, moderately dipping tabular body which strikes approximately 060° to 070° and dips 40° to 50° to the south. The zone has a strike length of about 350 m and has been traced from surface to a vertical depth of 350 m. The zone is controlled by a metasedimentary unit which includes greywacke and argillite. This unit hosts gold bearing quartz carbonate veins. The unit is thickest near surface averaging about 13 m and thins down dip and to the west. |
Page | 29
Taylor Property
NI 43-101 Technical report
| 7.0 | DEPOSIT TYPE |
|
Numerous gold deposits occur in the vicinity of the PDF and related structures such as the Pipestone Fault. These include the major mines of the Timmins camp (Dome, Hollinger, McIntyre, and Pamour). A number of gold deposits have been discovered in more recent years, including the Holt-McDermott Mine, Holloway Mine, Owl Creek Mine, Bell Creek Mine, Hoyle Pond Mine, Aquarius Mine, Maude Lake Deposit, Glimmer (Black Fox) Mine, Stroud Deposit, Fenn-Gib Deposit, Ludgate Deposit, Jonpol Mine and a number of other prospects. | |
|
Some of the PDF gold deposits extend from surface to over 1,000 m below surface, and some are blind deposits, in that they do not reach bedrock surface. The top of the Holloway deposit (i.e. the Lightning Zone), for example, is over 240 m below surface. | |
|
The following description of potential gold deposit types on the Kirkland Lake North area claims is from Reid (2003). Deposit types and exploration models can generally be characterized as one of three main types, although they tend to merge with each other at times. The deposit types may have more to do with the different host rocks than a genetic difference. Proximity to the main break(s), associated splays, presence of hydrothermal alteration, Timiskaming sediments or high level porphyries are common to all. The three main types are as follows: |
| • |
Green Carbonate Hosted: Nighthawk Lake, Aquarius, Stock, West Porphyry, and Black Fox all fall into this classification. Gold is generally present as free gold in quartz veins or with disseminated sulphides associated with small intrusive rocks or albitic alteration in completely carbonate altered ultramafic flows. Carbonate alteration is up to 200 m wide and can be traced for thousands of metres discontinuously on strike. The gold is often in cross cutting or conformable features. Timiskaming conglomerates are often proximal or part of the package. | |
| • |
Felsic Intrusive Related: Ronnoco, Pominex, parts of the Taylor Shaft and Hislop are examples of this type. The intrusive rocks vary from feldspar (plus or minus quartz) porphyry in the west to more syenitic in the east. Mineralization is characterized by both cross cutting to stockwork quartz veins, disseminated sulphides and/or contact skarns or hornfels, depending on host rock. Carbonate alteration is still quite common in the host rocks with silica, sericite, and hematite more within the intrusive. | |
| • |
Mafic Volcanic Hosted: Holloway, Holt and Hoyle Pond are examples. Ubiquitous carbonate alteration with iron carbonate, albite, silicification and sericite more proximal to ore. Quartz veins and/or albitized variolitic mafic flows are often central to the zone and often found near the mafic/ultramafic contact. |
Page | 30
Taylor Property
NI 43-101 Technical report
The deposit types vary within the Taylor Mine Complex. The Shaft Deposit furthest east is identified as a Felsic intrusive related model, with a contemporaneous green carbonate association. Feldspar porphyritic intrusions are the host to high grade gold veins and high concentrations of disseminated sulphides (generally pyrite).
Within the West Porphyry Deposit, free gold is found within quartz dominant extension veins and veinlets, cross-cutting the foliation present within the chrome-mica and chloritic altered ultramafic rock. This unit can be up to 20 m thick as the true extent of the veins are not fully understood. Additionally, the main shear (interpreted to be the contact of the PDF between the mafic and sediment contact, is host to a quartz brecciated shear vein, which can be up to 2m thick. Altered mafic units consisting of high concentrations of disseminated sulphides are also host to gold mineralization.
Similar to the West Porphyry Deposit, gold mineralization in the Shoot Deposit is associated with the quartz carbonate veins within argillaceous sediments bounded by green carbonate.
Page | 31
Taylor Property
NI 43-101 Technical report
| 8.0 |
EXPLORATION |
|
The deposits within the Taylor Mine Complex are present along and within the hanging wall of the PDF. The company interprets the area to contain faults parallel to the PDF on the north and south side. Reverse faulting may occur in this sense creating an opportunity for offset zones (Figure 8-1). Though sparse in drilling, KLG has identified lenses in the footwall of the PDF, named the 1003 Zone (West Porphyry Deposit), which will continue to be explored in 2017. The Taylor Fault located to the south also creates an opportunity for offset zones. To test, KLG plans on diamond drilling to test further away from the PDF. |

Figure 8-1: Cross section looking east of the WPZ with interpretation of target areas.
A 2D reflection seismic line shot on the Shillington Road, 5km west Taylor Mine, has identified a buried volcanic belt approximately 1 km below surface (Figure 8-2). The south boundary of the D2 thrust is 1.5 km north of the WPZ and the Porcupine-Destor Fault. At the Hoyle Pond Mine, 36 km west of the Taylor Mine, mineralization was found within the sediments south of the volcanic belt. To test this target, KLG looks to extend previous drilling north with a fence of holes to pass through the D2 Thrust and over the buried volcanic belt.
Page | 32
Taylor Property
NI 43-101 Technical report

Figure 8-2: Seismic Reflection survey cross section looking west.
A number of geophysical and geochemical surveys have been carried out over the Taylor property over the past few decades to understand any identifying factors controlling gold mineralization. Geological mapping is hampered by the lack of exposures in the general area, and bedrock geology relies on interpretation of drill hole information and geophysical surveys. In 1998, Realsection IP geophysical surveys and enzyme leach and sodium pyrophosphate geochemical surveys were conducted on the property.
In 2011, spectral analysis of approximately 3,000 m of drill core was conducted by Photonic Knowledge in an attempt to better define alteration and mineralization patterns in the West Porphyry Deposit. The drill core was chosen to be representative of the typical alteration and mineralization assemblages in the WPZ; however, the complexity of the alteration hampered calibration of the spectral data with the alteration types. Consequently, this data was not used when compiling the current resource estimate.
Page | 33
Taylor Property
NI 43-101 Technical report
Kirkland Lake Gold continues to explore the Taylor property through surface and underground drilling.
In 2016, KLG employed three underground rigs to define and explore nearby targets and expand the resource. One target was in the area of the Bulk Sample #1 at the 100 Level (approximately 100 m below surface). Drilling focused mainly above the mined area with the goal of expanding the resource of the 1010 lenses. Another target focused down dip of the WPZ drilling from the lowest level, the 450 Level (450 m below surface), to expand the resource at depth and test for the potential of en échelon lenses.
On surface, KLG utilized one drill to test for mineralization along strike of the PDF to the east of the Shaft Deposit (Figure 8-3). Drilling is sparse in the area. Recent drill results from 2016 drilling have shown gold present in quartz veins approximately 800m away.
Areas within the mine complex are needing to be drilled to help expand the resource. Higher priority targets are down plunge and dip of the 1004-1 Lower Zone and beneath and east of the Shaft Deposit (Figure 8-4).
Page | 34
Taylor Property
NI 43-101 Technical report

Page | 35
Taylor Property
NI 43-101 Technical report
| 9.0 |
DRILLING |
|
Kirkland Lake Gold contracts out all of the diamond drilling on surface and underground. The diamond drilling provides whole core recovery in mainly NQ diameter for the geologist to log and model. AQ core is also recovered from an air drill underground in 2016. BQ and BQTK has been utilized in the past. | |
|
Numerous diamond drilling programs have been undertaken on the Taylor property throughout its exploration history (Table 9-1). Over 300 km of drill core has been recovered on the Taylor Property targeting the Shoot, Shaft and West Porphyry Deposits and surrounding area. |

Table 9-1: Drilling History on the Taylor Property by Year.
With the PDF generally striking east-west and dipping moderately to the south, drilling from surface to intersect mineralization and obtain closer to true mineralized widths is best from the south, drilling towards the north. Through underground development, cross cutting faults and veins with associated gold mineralization have been seen at an oblique angle to general mineralized trends, but as the main mineralized trends follow the PDF, KL has found it best to continue with the trend of drilling. Underground drilling also is utilized to help define and explore areas near to mine development. As drilling bays and locations are limited, at times angles to expected mineralization may be more oblique.
Page | 36
Taylor Property
NI 43-101 Technical report
While not ideal, this may also pose an opportunity to identify the cross-cutting gold bearing structures and veins.
All underground drillhole collars and lines are digitally surveyed before and after to accurately locate the holes. Surveys are completed down the holes near the collar and at 50m increments to track any changes. There are minimal variations to the movement of the drillhole trace, but factors such as rock quality and fabric may affect the direction.
Underground drillholes are planned with an expected target depth in mind. After the target is reached, the drillhole planner also adds an extra buffer zone to increase the confidence in intersecting the zone. When the end of hole depth is reached, the drilling contractor ends the hole and moves on to the next usually without confirmation from the Geology Department. On surface, drillholes are confirmed by the geologist before stopping to commence a new hole.
Page | 37
Taylor Property
NI 43-101 Technical report
| 10.0 |
SAMPLE PREPARATION, ANALYSES AND SECURITY |
| 10.1 |
Sampling Method and Analytical Techniques |
|
Drill core sampling conducted by KLG during its drill campaigns followed a sampling protocol, which followed industry standards. From the 2010 drill campaign ongoing, this protocol was documented (KLG, 2010), and geologists and technicians were trained on using the protocol. Revisions were made to the technical procedure over time, but the practices remained the same. These processes were both utilized for surface exploration drill core and underground definition/exploration core. | |
|
Briefly described, samples are to be laid out based on geologic contacts and are to be a minimum 0.3 m and maximum of 1.5 m in length. Samples are to be taken on the up hole and down hole side (i.e. “shoulders”) of intervals where gold mineralization is prospective. Gaps of seven metres, or less, between prospective intervals are to be sampled. Each sample is assigned a unique sample number, preferable six digits long, as recorded on pre-printed sample tag books. Sample data are entered in the DHLogger program as the samples are being laid out and this information is confirmed by the logging geologist prior to placing the core in the queue for cutting (whole cored for definition holes). During sampling, one portion of each tag is placed in each numbered sample bag, while another portion remains in the core box at the end of each sample, and another portion remains in the tag book which contains all records for that sample. | |
|
Drill core samples are sent out to a third-party assay lab. In 2015, and on-going, KLG contracted SGS (Cochrane, ON) to receive and assay all underground exploration and definition drill core. Muck and Chip samples are being sent to the company internal lab at the Holt Mine site. Surface exploration samples in 2016 were sent to Swastika Laboratories (Kirkland Lake, ON), Laboratoire Expert (Rouyn-Noranda, QC) in 2015 and AGAT Laboratories (Mississauga, ON) in 2014. | |
| 10.2 |
Taylor 2014 Bulk Sample Program |
|
The Taylor 2014 Bulk Sample 2 Advanced Exploration Program was completed by St. Andrew Goldfields Ltd. (SAS), predecessor to KLG. The program consisted of: |
| • | Underground Access and Level development; | |
| • | Test mining (silling and long hole stoping); | |
| • | Underground definition diamond drilling; | |
| • | Geological ground-truthing; |
Page | 38
Taylor Property
NI 43-101 Technical report
| o | Geological mapping, | |
| o | Chip channel sampling, | |
| o | Production (muck) sampling, |
| • | Bulk (Sample Tower) sampling; and, | |
| • | Milling. |
Key objectives of the 2014 Advanced Exploration Program were to gain further knowledge on the true nature of quartz veins, shears and other controlling structures, geometry of rock units, alteration, and gold content and distribution within the 1004-1 Lens. Much of this could only be achieved by excavating and examining the 1004-1 Zone at a location considered to be representative. This area was chosen to be the area on 360 m to 390 m Sublevels, in the mid-portion of the 1004 Zone. Bulk (Sample Tower) sampling and milling were also considered required in order to confirm gold content, and that gold is recoverable on an economic basis in available processing systems.
In addition to the areas designed as part of the 2014 Bulk Sample 2 program on 360 m and 390 m Sublevels, the 1004 Lens was also intersected in the Remuck 10 area on the 335m Sublevel. Although not specifically part of the Bulk Sample 2 area, this area provided valuable insight in the 1004-1 Lens mineralization prior to the Bulk Sample 2 area being developed. Material mined from the Remuck 10 area was stockpiled on the surface ore pad. A portion of the stockpiled material was crushed to nominal -100 mm, and a portion of this was milled. None of the Remuck 10 material was processed through the Sample Tower.
Geological mapping was conducted throughout the ramp development, with sampling as deemed required in areas of geological interest intersected in the ramp. Examples of such areas of interest were a shear in Remuck 7, a portion of the 1006 Lens in Remuck 9, and an interval of extensional quartz veining below Remuck 9 and above Remuck 10. Although the geology of these areas was of interest, low gold values were found, and the structures lay outside of the 1004 Zone and the scope of the advanced exploration program and therefore are not described in detail in this report.
As development approached the Bulk Sample 2 area, systematic face, wall and back mapping (as well as systematic chip channel sampling) was completed at detailed scale (1:50, and 1:250) as ramps approached ore areas, on the 360 m and 390 m Sublevels, and during drifting in ore. Additional geological support for the Bulk Sample 2 program was brought in via hiring of additional geological staff and temporary transfer of existing KLG’ geological personnel to the Taylor Project. In addition to KLG’ geologists, a geological consultant, David Rhys, was commissioned to visit and review the Bulk Sample 2 underground exposure, drill core and data and provide additional insight on the geology, mineralization and structure of the 1004-1 Lens.
Page | 39
Taylor Property
NI 43-101 Technical report
Production geologist schedules were set up to allow for day shift and night shift geological coverage seven days a week for the duration of the Bulk Sample 2 program. This allowed drifting in ore to be completed under “Geology Control” and for each face (round) to be mapped and sampled prior to the next round being taken. Geological mapping, sampling, and control while drifting in ore were proven as fundamentally required in order to ensure ore was extracted as effectively as possible, in essence ‘to follow the ore’. One section of drift (390 Level Sill #2 East Rounds 1 to 4) was completed under Engineering Control due to requirements for remote scoop operation. In some areas, back mapping was completed subsequent to initial round excavation to allow for continuity and the overall geology to be better assessed. Time constraints and the requirement to maintain a tight development schedule in order to complete all components of the Bulk Sampling 2 program by its deadline impacted the time available for geologists in each heading and the ability of geologists to complete work to high standards (such as complete multiple lines of chip channel sampling on each face). All but one of the production faces while drifting in ore was examined by geology during the program. Several rounds were ‘cycled’ while drifting in ore during the program (two rounds drilled, blasted, mucked, and ground supported within a 24-hour period). No round was delayed from being blasted by geological activities or late or lack of direction from Geology. Geology, Engineering, Operations, and the mining contractor worked closely and effectively together to ensure effective and efficient completion of the underground work within the program schedule.
Silling was undertaken in the 1004 Zone on the 360 m Sublevel and 390 m Sublevel and back mapping completed in these areas (Figure 10-1 and Figure 10-2 respectively). On 360 m Sublevel, approximately 90 m of shear-zone dominated gold zone was developed. On 390 m Sublevel, approximately 86 m of shear-zone dominated, and 14 m of extensional vein dominated gold mineralization was developed, with the extensional style mineralization located in 390 m Sublevel, Sill #2 East Rounds 6, 7, and 8. In Remuck 10 later defined as the 335m Sublevel, 24 m of the 1004 Lens was excavated, although not considered part of Bulk Sample 2.
Face record sheets containing face and wall maps, photographs, chip channel sample data, and muck sample data were compiled throughout the program. An example of typical face maps of the 1004-1 Lens is presented as Figure 10-3. All face records remain stored in hard copy at the Taylor mine site, and in digital form on the Taylor server (resident at the Taylor mine site).
Page | 40
Taylor Property
NI 43-101 Technical report

Figure 10-1: Geological back mapping of 360 m sublevel.
Page | 41
Taylor Property
NI 43-101 Technical report

Figure 10-2: Geological back mapping of 390 m sublevel.
Page | 42
Taylor Property
NI 43-101 Technical report

Figure 10-3: Face photo and 1:50 map of 360 m Sublevel Sill #1 East Round.
Page | 43
Taylor Property
NI 43-101 Technical report
| 10.3 |
Sample Preparation, Analysis and Security |
|
Industry standard analytical techniques are utilized by third party labs in the performance of gold analyses. KLG routinely analyzes its samples via gold Fire Assay with atomic absorption (AA) or induction coupled plasma (ICP) finish. Gravimetric finish may be used where an initial result is greater than 3 g/t Au. From the start of drilling on the Taylor Project in 2010 to drill hole TA10-015, 30-gram assay aliquots were used by labs. Commencing with TA10-016, 50-gram assay aliquots have been used and are recommended to be continued to be used. “Screened Metallic” analysis was requested from 2010 to 2014, where visible gold has been identified in core, and if fire assay results are returning values greater than 5 g/t Au. After 2014, sufficient data was available to provide comparative statistics between gravimetric and screened metallic finishes. The results were considered close enough that screened metallics were no longer considered necessary. Check analyses are performed over selected intervals using fire assay and screened metallic (2010-2014) procedures. All drill core samples are analyzed by independent laboratories, which are either certified or are commonly used in the mining industry for such analyses. | |
|
Quality assurance and quality control (QA-QC) procedures are in place for all drill core sampling conducted by KLG and also by the analytical labs during the analytical process. A significant QA-QC measure undertaken by KLG includes the insertion of standard reference samples and blank sample materials within sampled drill core intervals, as can be referenced in the above cited KLG Technical Procedures. Standard reference materials are purchased in 60-gram foil packets from a qualified third party vendor (Oreas), which has been subject to auditing by other labs. Trends for standard and blank results are also assessed on a periodic basis with respect to any high or low bias which may be apparent at any particular lab. | |
|
KLG records and tracks its shipments of drill core samples to analytical labs using Chain of Custody documents. A Chain of Custody document is prepared for each sample shipment, which records the sample numbers shipped, number of samples, which KLG employee verifies the samples, and security seal information. In the past, KLG employed plastic tamper-proof security seals to ensure no tampering of any sample has taken place between preparation and packing of each sample by the sampling technician, and receipt at the analytical lab. Security seals are embossed with a unique number and the shipping bag number and corresponding security seal number is recorded on the Chain of Custody document. More recently, as the arrange transport is directly from the lab, security seals are no longer in place. The Chain of Custody document is checked by the lab upon receipt of each shipment, and if any discrepancy is noted between the information recorded on the Chain of Custody and the shipment, KLG is informed and the samples in that shipment are not processed until the issue is resolved. |
Page | 44
Taylor Property
NI 43-101 Technical report
|
Each third party analytical lab employs its own QA-QC procedures involving the use of standards and blank materials to clean out equipment between samples. These procedures can be referenced in each lab’s published QA-QC procedures. | |
|
Upper and lower limits for Standards are “3 standard deviations” above and below reported average Au concentration. Major discrepancies from expected values were typically human errors during sampling; however, significant samples associated with failed standards were re-analyzed by batch and Au values confirmed. | |
|
Samples containing potentially significant Au values (>0.1 g/t) in batches that contained failed blanks were re-analyzed. | |
|
In the QP’s opinion, the sample preparation, security and analytical procedures are adequate. | |
| 10.4 |
QC/QA Comparative Assay Laboratory Program |
|
KLG routinely engages in industry standard practices to re-test mineralized rejects at a second commercial lab for a check on the quality of the primary assay results. As a standard procedure, all samples are subjected to re-tests at a second commercial assay laboratory to validate results. | |
|
The program to send the samples out for check analysis is under the direction of A. Thompson, P.Geo. of KLG for underground and definition drill core, and R. Toews of KLG for surface exploration core. | |
|
In 2017, a comparative assay program was completed on the 2016 surface drill core from the drilling campaign. Included in that were some underground exploration core samples. A total of 229 samples that were sent to Swastika Laboratory were retested through Bureau Veritas in Timmins, ON. This represented approximately 5% of all samples from surface drilling and some exploration core from underground. Both the pulp and rejects were tested separately. The results are summarized in Table 10-1. | |
|
Reference standards from the 2016 Taylor exploration drilling programs as assayed at Swastika Laboratories are summarized in Table 10-2. A total of 175 reference samples were analyzed with assay determinations within the acceptable assay range |
Page | 45
Taylor Property
NI 43-101 Technical report

Table 10-1: Summary Statistics for the 2016 Surface Lab-Lab Check between Swastika and Bureau Veritas Results.
| RM | N | Outliers Excluded | Failures Excluded | Au g/t | Observed Au g/t | Percent of
Accepted | ||
| Accepted | Std. Dev. | Average | Std. Dev. | |||||
| OREAS 207 | 40 | 1 | - | 3.470 | 0.130 | 3.464 | 0.090 | 99.8% |
| OREAS 205 | 1 | - | - | 1.240 | 0.050 | 1.220 | - | 98.4% |
| OREAS 204 | 25 | - | - | 1.040 | 0.040 | 1.001 | 0.031 | 96.3% |
| OREAS 203 | 63 | - | - | 0.871 | 0.030 | 0.857 | 0.025 | 98.4% |
| OREAS 200 | 44 | - | - | 0.340 | 0.012 | 0.336 | 0.018 | 98.8% |
| OREAS 15d | 1 | - | - | 1.559 | 0.042 | 1.520 | - | 97.5% |
| OREAS 10c | 1 | - | - | 6.600 | 0.160 | 6.330 | - | 95.9% |
| Total | 175 | |
Weighted
Average |
98.5% | ||||
Table 10-2: Summary Statistics for Taylor sample reference material analyzed by Swastika Laboratories.
The reject data suggest a slight positive bias for the Swastika results. The data suggest the Swastika results have a very slight negative bias when considering the pulp check; however, both biases are so small that they are negligible. The results are shown in Figure 10-4 and Figure 10-5.
Page | 46
Taylor Property
NI 43-101 Technical report

Page | 47
Taylor Property
NI 43-101 Technical report
| 11.0 |
DATA VERIFICATION |
|
Historical and more recent drill records have been compiled in a digital database for the project and verified. Data verification was undertaken by Scott Wilson RPA during their resource estimation conducted in 2003 (Roscoe and Gow, 2006). During June and July 2010, (i.e. prior to the September 2010 resource estimation conducted by KLG personnel), issues with the digital database, such as inclusion of the azimuth component of downhole survey readings were addressed, to the maximum extent possible dependant on if original hardcopy records could be located. Other data verification was also completed at this time, including correction of minor differences during conversion of imperial data to metric data, as well as checking gold assays, assay duplicates, checks for duplicate or misidentified holes, and missing drill holes. | |
|
In 2015, KLG employed a Database Manager to conduct an in-depth verification of all digital drill hole data on the Taylor Project to hard paper copies. Any changes to historical data (pre-2015) were made prior to updating the mineral resources and mineral reserves in this report | |
|
In the QP’s opinion, the data are adequate for the purposes used in this technical report. |
Page | 48
Taylor Property
NI 43-101 Technical report
| 12.0 |
MINERAL PROCESSING AND METALLURGICAL TESTING |
| 12.1 | Metallurgical Test Work |
|
A grindability and metallurgical characterization of two composites from the Taylor Project was completed by SGS Minerals Services (SGS) in 2011. The samples were subjected to grindability testing and metallurgical test work (i.e. gravity separation and cyanidation). Five composites were also provided for gravity recoverable gold (GRG) and cyanide leaching test work. The composites were submitted for grindability and metallurgical testing. | |
|
| |
|
Metallurgical test work for the Shoot and Shaft Deposits will be completed in 2017. | |
|
| |
| 12.1.1 |
Grinding Summary |
|
| |
|
To predict milling rates, conclusions are drawn by comparing data from previous milling campaigns of Taylor ore, along with current milling and production data. | |
|
| |
|
A 10,000 tons bulk sample from Taylor Shaft Deposit was processed at the Holt Mill in 2007. The mill configuration was such that only the SAG mill and one ball mill was being used, thus reducing the overall throughput. That was due to the production demands at the time, not justifying running the mill in its optimum configuration. The throughput of Taylor ore was slightly better than that of Holloway ore (another mine operated by KLG), with a difference of 4 tonnes over a 24 hour period; Holloway ore has a Bond Work Index (BWI) value of 17.1 while Taylor ore has an average BWI of 15.9. It is anticipated that Taylor’s average milling rate will be equal to, or slightly higher than the average milling rate for Holloway ore of 125 tph. The projected milling rate for Taylor ore will be 125 tph with a final product size of 80% passing 325 mesh. | |
|
| |
| 12.1.2 |
Overall Recovery Summary |
|
| |
|
Using data collected at SGS, FLD Smith-Knelson was able to model a gravity circuit design that predicts an average primary circuit gravity recovery of 19.8% and a secondary gravity circuit recovery of 13.8%, yielding an overall gravity recovery of 33.5%. | |
|
| |
|
CIL leaching of the gravity tailings yielded a recovery of 88% to 97%. The combined recovery will be within the range of 93% to 99%, with the feed head grade being the largest contributing factor for the variation in the overall recovery. |
Page | 49
Taylor Property
NI 43-101 Technical report
|
An average recovery of 94.5% was achieved with previous whole ore leaching test work done by SGS in 2006 (without gravity concentration taken into account) and was proposed for the PFS. | |
| 12.1.3 |
Grindability Testing |
|
Bond Ball Mill Grindability Test | |
|
Five samples were submitted for Bond ball mill grindability testing at a closing screen size of 100 mesh (150 microns). The BWIs test results were consistent, ranging from 15.6 kWh/t to 16.4 kWh/t. The samples were categorized as moderately hard. | |
|
SMC Testing | |
|
The SMC test is an abbreviated version of the standard JK drop-weight test performed on rocks from a single size fraction (-22.4/+19 mm in this case). The SMC test was performed on all five samples. The “A x b” parameter ranged from 46.6 to 30.0, which corresponds, respectively, to the “moderately hard” to “hard” category. The density ranged from 2.77 g/cc3 to 2.89 g/cc3. | |
| 12.1.4 |
Metallurgical Testing |
|
The metallurgical test program examined the response of four Taylor Mine composite samples to gravity separation, gravity tailing cyanide leaching and extended gravity recoverable gold separation (e-GRG). | |
|
Gravity Separation | |
|
The response of the Taylor Mine composites to gravity separation for the recovery of free gold was examined on four kilogram charges of each sample. The tests were performed at a target grind size of a P80 of 45 microns, which produced tailings for the gravity tailing cyanidation testing. The gravity separation tests were performed using a Knelson MD-3 concentrator. The Knelson concentrate was recovered and further upgraded by treatment on a Mozley mineral separator to a low weight and high grade concentrate. The Mozley concentrate sample was assayed in its entirety. The Mozley and Knelson tailings were combined and forwarded to gravity tailing cyanidation testing. A summary of the test conditions and results are given in Table 12-1. |
Page | 50
Taylor Property
NI 43-101 Technical report
| Gravity Concentrate | Gravity Tails | Gravity Recovery | Head Grade | |||||||||
| Test Sample | K80 | Wt | Au | Ag | Au | Ag | Au | Ag | Calc. Au | Direct Au | Calc. Ag | Direct Ag |
| mm | % | g/t | g/t | g/t | g/t | % | % | g/t | g/t | g/t | g/t | |
| G1-RT-1 | 29 | 0.028 | 7,568 | 1,252 | 1.71 | < 0.5 | 55.3 | n/a | 3.82 | 3.02 | 0.85 | 2.6 |
| G1-RT-2 | 32 | 0.055 | 3,451 | 643 | 2.29 | < 0.5 | 45.2 | n/a | 4.18 | 4.87 | 0.85 | 0.7 |
| G1-RT-3 | 32 | 0.065 | 993 | 122 | 1.16 | < 0.5 | 35.7 | n/a | 1.80 | 1.66 | 0.58 | < 0.5 |
| G1-RT-4 | 25 | 0.031 | 5,026 | 517 | 1.54 | 1.4 | 50.5 | n/a | 3.11 | 2.36 | 1.56 | < 0.5 |
Table 12-1: Summary of gravity test results.
The direct head analyses of the four composites reported gold grades of 3.02 g/t, 4.87 g/t, 1.80 g/t and 3.11 g/t for samples RT-1 through RT-4 respectively. The tests on the composites resulted in relatively high gold recoveries ranging from approximately 36% to 55%. Gold gravity tailing analyses were in the range of 1.16 g/t to 2.29 g/t.
Gravity Tailing Cyanidation
Each gravity test tailings had two, one-kilogram charges split out for a cyanidation testing. Standard leach conditions were applied and performed, which included:
| • | 40% solids; | |
| • | a pH of 10.5 to 11.0; | |
| • | a solution concentration of 0.5 g/L NaCN; | |
| • | a carbon concentration of 10 g/L; and, | |
| • | the tests were carried out for 24 and 48 hours for each composite. |
Upon completion of the tests, the final pulp was poured through a screen to remove the carbon and onto a filter to separate the solids from the solution. All three test products were submitted for chemical analyses. For the tests completed, the gold recoveries ranged from 88% to 97%. The NaCN consumption ranged from 1.77 kg/t to 2.63 kg/t and the lime consumption ranged from 0.22 kg/t to 0.51 kg/t for all of the tests performed. The tailings assays for the tests were quite low, ranging from 0.050 g/t Au to 0.150 g/t Au. These results, combined with the gravity results, showed overall gold recoveries ranging from 93% to 99% for the four composite samples. A summary of the test results from gravity tailing cyanidation is shown in Table 12-2.
Page | 51
Taylor Property
NI 43-101 Technical report

Table 12-2: Summary of CIL test results.
Extended Gravity Recoverable Gold (EGRG) Test work
EGRG testing was conducted on composite samples RT-1 through RT-4. The procedure used was developed by Knelson Gravity Solutions of British Columbia and involves the recovery of gold from a sample ground to progressively finer sizes, with size analyses of the gravity concentrates and tailings at each stage. This test allows for the determination of the GRG value (theoretical maximum amount of gold recoverable) as a function of the size distribution.
For stage 1, a 20 kg sample of each composite was processed through the Knelson concentrator, producing a gravity concentrate and tailings. The first pass was performed on minus 20 mesh crushed material. The K80 range for the four samples was 497 to 559 microns. The concentrate was filtered and submitted for Au size fraction analysis. The tailings sample was filtered and sub-sampled (~200 g to 300 g) for Au size fraction analysis. The remainder of the tailings was split into two 10 kg charges, pulped to approximately 65% solids and ground in a 10 kg rod mill, targeting a K80 grind of 150 to 200 microns. The two charges were then combined for stage 2.
During stage 2, the gravity separation, sampling, and size fraction assaying procedure was repeated. The remaining stage 2 Knelson tailings was split into two 10 kg charges, pulped to approximately 65% solids and ground in a 10 kg rod mill, targeting a K80 grind of 50 to 70 microns. The two charges were then combined for stage 3.
Stage 3 was performed as per the prior stages, repeating the gravity separation, sampling and size fraction assaying procedure. All the concentrates were assayed to extinction.
For the RT-1 composite, a GRG number of 57.2 was obtained, indicating that gravity processes could recover approximately 55% to 60% of the gold. The distribution of gold in the gravity concentrate was similar to that seen in the conventional gravity test G1 conducted and reported at 55%. The calculated head grade from the EGRG test for the RT-1 composite was 5.91 g/t Au.
Page | 52
Taylor Property
NI 43-101 Technical report
|
For the RT-2 composite, a GRG number of 45.4 was obtained, indicating that gravity processes could recover approximately 45% to 50% of the gold. The distribution of gold to the gravity concentrate was similar to that seen in the conventional gravity test G2 conducted and reported at 45%. The calculated head grade from the EGRG test for the RT-2 composite was 4.90 g/t Au. | |
|
For the RT-3 composite, a GRG number of 52.9 was obtained, indicating that gravity processes could recover approximately 50% to 55% of the gold. The distribution of gold to the gravity concentrate was similar to that seen in the conventional gravity test G3 conducted and reported at 36%. The calculated head grade from the EGRG test for the RT-3 composite was 2.40 g/t Au. | |
|
For RT-4 composite, a GRG number of 62.1 was obtained, indicating that gravity processes could recover approximately 60% to 65% of the gold. The distribution of gold to the gravity concentrate was similar to that seen in the conventional gravity test G4 conducted and reported at 51%. The calculated head grade from the EGRG test for the RT-4 composite was 3.48 g/t Au. | |
| 12.1.5 |
Gravity Circuit Simulations |
|
Modeling results are presented in Table 12-3 and in Figure 12-1 to Figure 12-2. |
| Ore | Knelson | Tonnage to | Tonnage to | Primary Gravity | Secondary Gravity | Overall Gravity |
| Sample | Model | primary gravity | secondary gravity | Recovery | Recovery | Recovery |
| (tph) | (tph) | (%) | (%) | (%) | ||
| GRG-1 | QS48 | 200 | 200 | 24 | 14 | 38 |
| GRG-2 | QS48 | 200 | 200 | 15 | 13 | 28 |
| GRG-3 | QS48 | 200 | 200 | 15 | 12 | 27 |
| GRG-4 | QS48 | 200 | 200 | 25 | 16 | 41 |
Table 12-3: Gravity recovery modelling results.
Page | 53
Taylor Property
NI 43-101 Technical report

Page | 54
Taylor Property
NI 43-101 Technical report
| 13.0 |
MINERAL RESOURCE ESTIMATES |
|
The Mineral Resources for the Taylor Mine Complex effective as of December 31, 2016 are summarized in Table 13-1, with individual zones segregated in Table 13-2. All mineral resources are reported exclusive of Mineral Reserves. |

Notes
CIM definitions
(2014) were followed in the estimation of Mineral Resource
Mineral Resources
are reported Exclusive of Mineral reserves
Mineral Resource estimates were
prepared under the supervision of D. Cater, P. Geo.
Mineral Resources were
estimated at a block cut-off grade of 2.6g/t
Mineral Resources are estimated
using a long term gold price of US$1,200/oz (CDN$1,500/oz)
A minimum mining
width of 3m was applied
A bulk density of 2.84 t/m3 was used
Totals may not add exactly due to rounding
Table 13-1: Mineral Resources for the Taylor Mine Complex as of 31 December 2016.
Page | 55
Taylor Property
NI 43-101 Technical report

Notes
CIM definitions
(2014) were followed in the calculation of Mineral Resource
Mineral Resource
estimates were prepared under the supervision of D. Cater, P. Geo.
Mineral
Resources were estimated at a block cut-off grade of 2.6g/t
Mineral
Resources are estimated using a long term gold price of US$1,200/oz
(CDN$1,500/oz)
A minimum mining width of 3m was applied
A bulk density
of 2.84 t/m3 was used
Totals may not add exactly due to rounding
|
Table 13-2: Mineral Resources for the Taylor Mine Complex by Zone (as of Dec 31, 2016). | |
| 13.1 |
Database |
|
The Taylor database comprises of 1,565 drill holes from both surface and underground as of January 9th, 2017 and includes wedged holes (utilizing a parent hole and changing direction at depth), service holes (for use in development), re-logged holes and abandoned holes. Table 13-3 and Table 13-4 shows the number of drill holes utilized for interpretation in each lens in the WPZ. These have been compiled from a variety of sources into one secure database. The data has been standardized to: |
| • | UTM NAD 83 metric co-ordinates with standardized elevation grid; | |
| • | All Assays reported as g/t Au; and, | |
| • | Common Lithology Legend |
As of January 9, 2017, some assays were still outstanding from holes entered in the Fusion central database. The holes were still utilized to allow lithologies to be included in domain interpretation. These DDH were omitted from resource estimates. A number of older drillholes were deemed unreliable and excluded from resource estimates. This decision was based on poor correlation with recent underground drilling or in some cases with underground development. The list of holes and domains/subdomains to be excluded from is shown in Table 13-5.
Page | 56
Taylor Property
NI 43-101 Technical report

Table 13-3: Number of DDH for each of the 1004-1 subdomains.
Page | 57
Taylor Property
NI 43-101 Technical report

Table 13-4: Domains and Subdomains in the upper WPZ and number of DDH per subdomain.
Page | 58
Taylor Property
NI 43-101 Technical report

|
Table 13-5: DDH Exclusion list for the WPZ. | |
| 13.2 |
Geological Interpretation and 3D Solid Modelling |
|
In previous years, the WPZ has been interpreted using a set of stacked low grade envelopes, which encompassed high grade subdomains, where drill density permitted their creation. The additional definition drilling and a greater understanding through underground mining have allowed KLG to re-define and interpret the mineralization more precisely (Figure 13-1). In order to update the Mineral Resources for the Taylor Project, KLG personnel interpreted the geology and gold mineralization as high grade lenses and constructed three-dimensional (“3D”) solid body models to better constrain the gold mineralization during grade interpolation, typically a combination of flat to moderately south dipping shear veins and north dipping extensional veins, hosted by fuchsite-altered ultramafic units. In the areas where the shear system is best developed, the shear itself follows a sliver of argillaceous sediment and is associated with a quartz breccia that varies from 0.5 to 3.0 m in thickness. Extensional veins of variable grade and thickness and secondary shears are associated with this system. Mineralization is sometimes associated with steeply dipping structures that crosscut the south dipping shear veins and the shear veins themselves have been observed dipping steeply to the south. |
Page | 59
Taylor Property
NI 43-101 Technical report
For all the zones where a resource was developed, the shape of each gold-bearing lens was very broadly interpreted based on structure, alteration, sulfide mineralization and gold grade. Lithology was used to a lesser extent as it was determined that the gold mineralization is more related to geologic structures that transect lithological boundaries. This recent interpretation and 3D solid modelling of the gold mineralization is considered to be a more realistic representation of the mineralized zones, as the interpretation is based on alteration and mineralization based on a sound geologic model. Previous resource estimates (i.e. SWRPA, 2006) extrapolated the better gold grades from hole to hole with no consideration for the alteration and/or overall mineralized envelope. This assumed that the higher grade gold mineralization is continuous from hole to hole, which had yet to be confirmed with detailed underground exploration or in-fill drilling.

Figure 13-1: Isometric view of the Taylor Mine Complex (looking northwest).
Page | 60
Taylor Property
NI 43-101 Technical report
| 13.3 |
Density Data |
|
During the 2010-2011 drill programs, additional density measurements were taken and the results of metallurgical testing were used to confirm the density of Taylor ore at 2.84 t/m3. | |
| 13.4 |
Capping of High Gold Grades |
|
Assays for all zones were capped at 30 g/t, prior to compositing. Capping statistics show that this number is conservative and justifiably could be increased to 50 g/t or even up to 100 g/t; however, it was decided to keep the cap conservative until sufficient mill reconciliation data is available to justify a change based on more than statistics. Preliminary reconciliation data from the Bulk Sample program at Taylor showed that the block model performed reasonably well when capped at 30 g/t. | |
| 13.4.1 |
1004-1 (Lower WPZ) |
|
Figure 13-2 and Figure 13-3 show histograms and the log-probability plot for the 1004- 1 Zone, respectively. They show typical log-normal distributions. The log-probability plot shows that capping is conservative at 30 g/t and capping of 50 to100 g/t could be justified. This conclusion for a 50 g/t upper cap was corroborated by a letter report completed by an outside consultant in February, 2017. The 50 g/t upper cap was stated to be appropriate for the 1004 Zone and the Upper Zones in the WPZ (Desharnais and Leroux, 2017). |
Page | 61
Taylor Property
NI 43-101 Technical report

Figure 13-2: (a) Histogram of Au grades for the 1004-1 Zone. (b) Log Au histogram for the 1004-1 Zone
Page | 62
Taylor Property
NI 43-101 Technical report

Figure 13-3: Log probability plot for Au in the 1004-1 Zone.
Figure 13-4 is a QQ plot of subdomain vs. the entire 1004-1. Most of the smaller subdomains are skewed towards higher grade relative to the total domain because they were modelled around small high grade shear structures. Figure 13-5 is a log-probability plot of the 1004-1 Zone broken down by sub-domain (“ZONE”). It shows agreement between sub-domains, particularly in the 2 to 30 g/t range. Again, the smaller subdomains are skewed towards higher grade as the larger domains tend to incorporate more internal dilution.
Page | 63
Taylor Property
NI 43-101 Technical report

Figure 13-4: QQ plot of all subdomains vs. entire 1004-1 dataset.
Page | 64
Taylor Property
NI 43-101 Technical report

Figure 13-5: Log-probability plot by domain.
Analysis of the length weighted raw assays (Table 13-6) shows that 49% of the gold in the 1004-1 is contained in assays greater than 30 g/t. When subjected to the 30 g/t cap, the metal content of the same samples is reduced to 20%.
| Number of Samples |
4116 |
| Number >30g/t | 253 (6%) |
| Number > 50g/t | 105 (3%) |
| % Metal > 30g/t | 49% |
| % Metal > 50g/t | 34% |
Table 13-6: Basic capping statistics on raw assays for the 1004-1 Zone.
Page | 65
Taylor Property
NI 43-101 Technical report
| 13.4.2 |
1004-2, 1006, 1008, 1009, 1010, 1011 (Upper WPZ) |
|
Figure 13-6 is a histogram of Au frequency for the Upper WPZ. It shows a typical log- normal distribution for Au grades. Figure 13-7 is a log probability plot for the Upper WPZ. In this case, there is a slight change in the population at 26 g/t, but the points remain linear up to 50 to 70 g/t. Figure 13-8 is a QQ plot of subdomain vs. entire Upper WPZ population. Figure 13-9 shows the log-probability plots by subdomain. The entire zone is displayed in grey. | |
|
Figure 13-10 is a QQ plot comparing the populations of assays between the Upper and Lower WPZ. |
Page | 66
Taylor Property
NI 43-101 Technical report

Figure 13-6: (a) Histogram of Au values in the upper WPZ. (b) Log-Au histogram of gold values in the upper WPZ.
Page | 67
Taylor Property
NI 43-101 Technical report

Figure 13-7: Log-probability plot for all samples in the upper WPZ.
Page | 68
Taylor Property
NI 43-101 Technical report

Page | 69
Taylor Property
NI 43-101 Technical report

Figure 13-10: QQ plot comparing the upper and lower WPZ gold populations.
The effect of capping on the raw assays is summarized in Table 13-7. The capping statistics are very similar to those of the Lower WPZ (Table 13-6).
| Number of Samples |
1361 |
| Number >30g/t | 73 (5%) |
| Number > 50g/t | 44 (3%) |
| % Metal > 30g/t | 47% |
| % Metal > 50g/t | 35% |
Table 13-7: Basic capping statistics on raw assays for the Upper WPZ.
Page | 70
Taylor Property
NI 43-101 Technical report
| 13.4.3 |
Shaft Deposit |
|
The Shaft Deposit Au histogram is shown in Figure 13-11. The log-probability plot is shown in Figure 13-12. Again, these plots show a log-normal distribution. The log- probability plot shows a small kink at 30 g/t, but overall stays fairly consistent up to 50 g/t where there is a definite decrease in slope. Comparisons between the subdomains in the Shaft Deposit are made in Figure 13-13. The QQ plot shows reasonably good agreement between the individual subdomains and the overall population. Log- probability plots of the individual subdomains show reasonably consistent grade distributions, particularly in the 0.1 to 30 g/t range. | |
|
The effect of capping on the raw assays for the Shaft Deposit is summarized in Table 13-8. The capping statistics are substantially lower than those of the 1004-1 Zone (Table 13-6), with a similar sized sample dataset. |
Page | 71
Taylor Property
NI 43-101 Technical report

Figure 13-11: (a) Histogram of Au values for the Shaft Deposit. (b) Log-histogram of Au values for the Shaft Deposit.
Page | 72
Taylor Property
NI 43-101 Technical report

Figure 13-12: Log-probability plot for Au samples in the Shaft Deposit.
Page | 73
Taylor Property
NI 43-101 Technical report

Figure 13-13: (a) QQ plot comparing subdomains to the overall Shaft Deposit population. (b) Log probability plots for the subdomains in the Shaft Deposit.
Page | 74
Taylor Property
NI 43-101 Technical report
| Number of Samples |
4625 |
| Number >30 g/t | 59 (1.3%) |
| Number > 50 g/t | 30 (0.6%) |
| % Metal > 30 g/t | 31% |
| % Metal > 50 g/t | 22% |
|
Table 13-8: Basic capping statistics on raw assays for the Shaft Deposit. | |
| 13.5 |
Variography |
|
In order to define the amount of grade variability and the orientation of maximum grade continuity, a suite of semi-variograms were constructed from the composite values. | |
|
Anisotropic variograms were generated for the 1004-1 domain (Lower WPZ) and for the Shaft Deposit. An attempt was made to determine a good anisotropic variogram for the Upper WPZ, but no orientation produced good structures. This is assumed to be a consequence of the closely spaced shear systems, each with only a small number of DDH pierce points. Since the domain statistics suggest that the lower and upper WPZ have similar gold populations, it was considered to be reasonable to use the variogram model from the 1004-1 for the upper WPZ. The experimental and model variograms for the 1004-1 domain are shown in Figure 13-14. The search radius used for estimation was the determined by taking the range at 80% of the sill (30m x 18m x 8m). | |
|
The anisotropic variogram for the Shaft Deposit is shown in Figure 13-15. The nugget and perpendicular structure was set from a short-lag variogram (not shown). The search radius used for estimation was set to approximately 50% of the total range of the variogram (30m x 25m x 10m). | |
|
An omni-directional variogram was created for the Shoot Deposit and used as a guide for defining the size of the primary search pass during estimation. |
Page | 75
Taylor Property
NI 43-101 Technical report

Page | 76
Taylor Property
NI 43-101 Technical report
| 13.6 |
Compositing |
|
In accordance with KLG policy, DDH samples were composited to 1.0 m with capping applied prior to compositing. Composite statistics for the Lower WPZ, Upper WPZ and Shaft Deposit are included in Table 13-9, Table 13-10 and Table 13-11, respectively. Composite lengths were allowed to vary in order to incorporate residuals at the bottom of the mineralized zone. | |
|
Since no correlation between grade and density was identified, only sample length was used to weight the grades during compositing. Each composite was identified with a mineralized solid shape. Only assays occurring within the mineralized zones were composited. During the compositing process, missing or unsampled areas are assumed to have a ‘trace’ grade (0.0025 g/t applied). These unsampled intervals only account for approximately 1-2% of the intervals within the mineralized zones. Composites were calculated within the mineralized zones from the contact closest to the collar to the toe of the hole. Composites were allowed to vary up to 50% of the nominal composite interval in order to fill the volume. | |
|
No chip or test hole samples were used in the composites. A number of DDH were excluded from the composite file (see Table 13-5), typically because underground DDH had shown them to be erroneous. Recent DDH where samples were incomplete were also removed from the database. |
| Sample |
Recs. |
Missing Values |
Min. |
Max. |
Mean |
Variance |
Standard Deviation |
Standard Error |
Skewness |
| Raw Assays | 4168 | 50 | 0.003 | 3850.2 | 11.1 | 11453.6 | 107.0 | 1.7 | 33.9 |
| Uncapped Comps. | 3527 | 0 | 0.003 | 1541.2 | 7.7 | 1031.2 | 32.1 | 0.5 | 34.8 |
| Capped Comps. | 3527 | 0 | 0.003 | 30.0 | 5.4 | 50.2 | 7.1 | 0.1 | 1.8 |
Table 13-9: Summary statistics for raw assays, uncapped and capped composites, for the 1004-1 Zone (Lower WPZ).
Page | 77
Taylor Property
NI 43-101 Technical report
| Sample |
Recs. |
Missing Values |
Min. |
Max. |
Mean |
Variance |
Standard Deviation |
Standard Error |
Skewness |
| Raw Assays | 1361 | 9 | 0.003 | 235.00 | 7.90 | 460.09 | 21.45 | 0.58 | 6.29 |
| Uncapped Comps. | 1250 | 0 | 0.003 | 235.0 | 7.5 | 309.1 | 17.6 | 0.5 | 6.5 |
| Capped Comps. | 1250 | 0 | 0.003 | 30.0 | 5.3 | 51.1 | 7.1 | 0.2 | 2.1 |
Table 13-10: Summary statistics for raw assays, uncapped and capped composites, for the Upper WPZ.
| Sample |
Recs. |
Missing Values |
Min. |
Max. |
Mean |
Variance |
Standard Deviation |
Standard Error |
Skewness |
| Raw Assays | 4625 | 25 | 0.000 | 685.70 | 3.0 | 254.8 | 16.0 | 0.2 | 23.3 |
| Uncapped Comps. | 4425 | 0 | 0.000 | 330.4 | 2.4 | 77.6 | 8.8 | 0.1 | 18.1 |
| Capped Comps. | 4425 | 0 | 0.000 | 30.0 | 1.9 | 15.4 | 3.9 | 0.1 | 4.0 |
Table 13-11: Summary statistics for raw assays, uncapped and capped composites, for the Shaft Deposit.
| 13.7 |
Block Model |
| 13.7.1 |
Domaining |
|
High grade subdomains were created for the Lower and Upper WPZ, the Shaft Deposit, the East Shaft Deposit and East Porphyry Zone. The Lower and Upper WPZ were modelled as two separate block models, although the domain statistics show that they could be considered part of the same geologic domain. This was largely due to time constraints, so the two areas will likely be combined in the future. | |
|
There were 25 subdomains created for the Lower WPZ (1004-1 Zone) and 61 subdomains were created for the Upper WPZ (includes the 1004-2, 1006, 1008, 1009, 1010 and 1011 Zones). In the Shaft Deposit, 10 subdomains were created. |
Page | 78
Taylor Property
NI 43-101 Technical report
|
In addition to the high-grade subdomains mentioned above, mineralized envelopes were created for three less drilled areas of the Taylor Mine Complex. The East Porphyry Zone and East Shaft Deposit each contained three shapes. The 1003 Zone (below the Lower WPZ) contained 14 mineralized envelopes. | |
|
The Shoot Deposit is composed of a single domain. It was created using a 1g/t shell and falls almost entirely within a sliver of sheared argillite. Visually it is very similar to the eastern 1004-1 zone, but lacks significant mineralization outside the argillite, which in the 1004-1 is typically associated with secondary shears and extensional veins. | |
|
Each of the mineralized envelopes and subdomains was checked to ensure that no overlaps were present between shapes and the individual shapes were checked for internal overlaps and open edges. | |
|
Taylor’s Chief Mine Geologist and the Resource/Reserve Geologist (Canadian Operations) verified each shape prior to estimation. | |
| 13.7.2 |
Block Model, Search and Estimation Parameters |
|
The block and subcell dimensions used for each domain at the Taylor Mine Complex are summarized in Table 13-12 and rotation parameters for blocks are shown in Table 13-13. All other block models are unrotated. |
| Domain | X Cell | Y Cell | Z Cell | X Subcell | Y Subcell | Z Subcell |
| Shoot Deposit | 5 | 5 | 5 | 10 | 10 | 10 |
| Lower and Upper WPZ | 3 | 3 | 3 | 6 | 6 | 6 |
| 1003 | 9 | 9 | 9 | 9 | 9 | 9 |
| Shaft Deposit | 3 | 3 | 3 | 6 | 6 | 6 |
| East Shaft | 5 | 5 | 5 | 10 | 10 | 10 |
| EPZ | 7.5 | 7.5 | 2.5 | 14 | 14 | 5 |
Table 13-12: Cell and subcell dimensions for Taylor domains.
Page | 79
Taylor Property
NI 43-101 Technical report
| Domain | Rotation | ||
| Z | Y | X | |
| EPZ | -11 | 4 | -17 |
Table 13-13: Rotation parameters for rotated block models.
The search parameters used in each of the Taylor resource models are summarized in Table 13-14 and Table 13-15. For the high-grade domains in the 1004-1 and Upper WPZ, there were a number of subdomains with a small number of composites. To avoid issues with cells not filling with grade, the tertiary search used a low minimum number of samples. The tertiary search was not allowed to fill cells in the Measured or Indicated categories.
Most of the resource estimates at Taylor used the dynamic anisotropy functions in Datamine. This allows the search ellipsoid to change in orientation to follow folded or irregular mineralized zones. Using this technique, an azimuth and dip is created for each cell in the block model, generating search ellipsoid orientations that change for each cell. The azimuth and dip for each block is defined by modelling the orientations of the domain/subdomain wireframe in the neighbourhood of the cell in question. Dynamic anisotropy allows for superior estimates on the variable dips that are commonly encountered at Taylor, allowing domains to be defined based on geology and mineralization, regardless of orientation.
Table 13-16 shows the estimation methods used for each domain at Taylor. Gold grades were interpolated into the block model utilizing the inverse distance squared (ID2) method or ordinary kriging (OK). Only composites within the solid being modelled were used in the calculation.
| Domain | Z Rotation | X Rotation | Z Rotation |
| 1004-1 | Dynamic | ||
| Upper WPZ | Dynamic | ||
| Shaft Deposit | Dynamic | ||
| East Shaft | 180 | 25 | 0 |
| EPZ | 62 | -15 (Y) | 0 |
| 1003 | Dynamic | ||
| Shoot Deposit | 155 | 45 | 0 |
Table 13-14: Search ellipsoid orientations.
Page | 80
Taylor Property
NI 43-101 Technical report
| Domain | Primary Search | Secondary Search | Tertiary Search | Max | |||
| Dimensions (m) |
Min/Max |
Expansion Factor |
Min/Max |
Expansion Factor |
Min/Max |
Per Hole | |
| 1004-1 | 18x30x8 | 4/7 | 2 | 4/12 | 4 | 2/16 | 3 |
| Upper WPZ | 18x30x10 | 4/8 | 2 | 4/12 | 4 | 3/12 | 3 |
| Shaft Deposit | 30x25x10 | 4/10 | 2 | 4/16 | 3 | 3/12 | 3 |
| East Shaft | 20x20x10 | 4/8 | 2 | 4/12 | 3 | 4/12 | 3 |
| EPZ | 25x25x15 | 3/10 | 2 | 4/14 | 2 | 2/12 | 2 |
| Shoot Deposit | 35x55x5 | 6/12 | 2 | 6/20 | 3 | 3/16 | 4 |
| 1003 | 30x40x10 | 6/12 | 3 | 6/12 | 3 | 3/10 | 5 |
Table 13-15: Search parameters for each domain at the Taylor Mine Complex.
| Domain |
Estimation Method |
| 1003 | ID2 |
| 1004-1 | OK |
| Upper WPZ | OK |
| Shaft Deposit | OK |
| East Shaft | ID2 |
| EPZ | ID2 |
| Shoot Deposit | ID2 |
|
Table 13-16: Estimation methods for each of the models at the Taylor Mine Complex. | |
| 13.7.3 |
Kriging Efficiency |
|
Kriging efficiency (“KE”) was calculated for all zones estimated with ordinary kriging (e.g. | |
|
Figure 13-16 and Figure 13-17). Kriging efficiency serves as a tool to measure the effectiveness of a kriging estimate. The KE of a cell is a way of determining the confidence of the kriging estimate of that cell. It is a measure of the difference between variance within blocks (constant for the entire zone, and determined from the model variogram) and the kriging variance of the cell in question. Figure 13-16 shows the kriging efficiency of 1004-1 block model, although only blocks on the surface of the wireframe are visible. In general, values greater than zero are considered acceptable, and values greater than approximately 0.5 are considered to be reliably estimated cells. KE was calculated for all blocks in the 1004-1, Upper WPZ and Shaft Deposit. In the 1004-1 was calculated for all blocks in the 1004-1, Upper WPZ and Shaft Deposit. In the 1004-1 (Figure 13-16Figure 13-16), KE was excellent in the definition drilled areas. Poor KE was observed in the outlying areas in the west of the deposit. All of the cells with KE much smaller than 0 were classified as inferred or were excluded from the resource altogether. |
Page | 81
Taylor Property
NI 43-101 Technical report
Kriging efficiency was also good in the Upper WPZ and Shaft Deposit (Figure 13-17). Only a few areas had KE much smaller than 0. Again, those areas were not incorporated into the indicated resource.

Figure 13-16: Kriging efficiency for the lower WPZ 1004-1 Zone (looking north).
Page | 82
Taylor Property
NI 43-101 Technical report

|
Figure 13-17: Kriging efficiency for the Upper WPZ and Shaft Deposit (looking north). | |
| 13.7.4 |
Swath Plots |
|
Swath Plots were created for each of the models, comparing the DDH sample grades to as many estimation methods as possible. (Figure 13-18 to Figure 13-20). SWATH plots show the average grade by slice (in this case by easting) across the block model. In figures Figure 13-18 to Figure 13-20, the OK estimate (red) is compared to the sample grade (yellow), ID2 estimate (green) and nearest neighbour estimate (grey). The X swath plots have been included for the Lower and Upper WPZ and for the Shaft Deposit. In general, agreement between the models and samples is very good. In the Shaft Deposit there is a discrepancy between the model grade and sample grade on the west side of the zone. This is interpreted to be a result of the influence of a large number of low grade composites on the western edge of one subdomain (1102.04) overlapping a high-grade area of another subdomain (1102.01), with less influence from the high-grade composites. High variability in the sample grades is present in the swath plot in that area, which is explained by the difference in grades between the two subdomains. |
Page | 83
Taylor Property
NI 43-101 Technical report

Figure 13-18: SWATH plot in X for the Lower WPZ (1004-1 Zone).
Page | 84
Taylor Property
NI 43-101 Technical report

Figure 13-19: SWATH plot in X for the Upper WPZ.
Page | 85
Taylor Property
NI 43-101 Technical report

|
Figure 13-20: SWATH plot in X for the Shaft Deposit. | |
| 13.8 |
Classification |
|
The models were classified as measured, indicated or inferred based on a few qualifying factors. The resource classification is essentially based on the density of drill hole information and the continuity of gold grades. | |
|
In general, cells estimated using the first search pass were used to populate the measured and indicated categories, although some leeway was allowed to fill areas estimated using the second search pass for the indicated category. In addition to search pass, cells were also filtered to the resource cut-off grade (2.6 g/t) and large areas of low grade were removed from the measured and indicated categories. | |
|
Only one area of the Lower WPZ was included in the measured category. This is the area where mining is currently underway and drill density is sufficient to give a high confidence level in the estimate. | |
|
Due to nature of the Taylor mineralization, a number of small, narrow lenses were created as part of the geologic model. These were sometimes located in well drilled areas but did not have sufficient samples to populate the first or second search passes on the margins of the shapes. These areas were commonly incorporated into the initial indicated perimeter, but since the parameters for the third search permitted cells to fill from one drillhole, all cells estimated using the third search were reclassified as inferred. |
Page | 86
Taylor Property
NI 43-101 Technical report
In the QP’s opinion, there are no known environmental, permitting, legal, title, taxation, socio-economic, marketing, political or other relevant factors that could materially affect the mineral resources estimate.
Page | 87
Taylor Property
NI 43-101 Technical report
| 14.0 |
MINERAL RESERVES ESTIMATE |
|
The mineral reserves at Taylor stand at approximately 743,000 t grading 5.42 g/t (129,000 ounces in-situ) as of December 31, 2016. Details by zone are shown in Table 14-1. |
| ZONE | CATEGORY | TONNES | GRADE | OUNCES |
| 1004 East | PROVEN | 0 | 0.00 | 0 |
| 1004 East | PROBABLE | 359,000 | 5.28 | 61,000 |
| 1004 West | PROVEN | 0 | 0.00 | 0 |
| 1004 West | PROBABLE | 257,000 | 5.76 | 47,500 |
| 1006 Lens | PROVEN | 0 | 0.00 | 0 |
| 1006 Lens | PROBABLE | 38,700 | 6.45 | 8,030 |
| 1008 Lens | PROVEN | 0 | 0.00 | 0 |
| 1008 Lens | PROBABLE | 81,300 | 4.52 | 11,800 |
| 1009 Lens | PROVEN | 0 | 0.00 | 0 |
| 1009 Lens | PROBABLE | 3,830 | 5.10 | 630 |
| 1010 Lens | PROVEN | 0 | 0.00 | 0 |
| 1010 Lens | PROBABLE | 2,690 | 4.21 | 360 |
| 1011 Lens | PROVEN | 0 | 0.00 | 0 |
| 1011 Lens | PROBABLE | 0 | 0.00 | 0 |
| Shoot Zone | PROVEN | 0 | 0.00 | 0 |
| Shoot Zone | PROBABLE | 0 | 0.00 | 0 |
| TOTAL | PROVEN | 0 | 0.00 | 0 |
| TOTAL | PROBABLE | 743,000 | 5.42 | 129,000 |
| TOTALS | 2 P'S | 742,599 | 5.42 | 129,000 |
Table 14-1: Mineral reserves at Taylor.
The following assumptions were used in converting mineral resources to mineral reserves:
| • | Price of gold: US$1,200/oz; | |
| • | Currency exchange rate: $CDN1.25 = US$1.00; |
Page | 88
Taylor Property
NI 43-101 Technical report
| • |
Stope cut-off grade was calculated on an individual basis; | |
| • |
Dilution ranged from approximately 10% to 50% (applied by geologist on mining shapes); | |
| • |
Dilution grade varied from approximately 0.5 g/t to 1.0 g/t (applied by geologists); | |
| • |
Mining Extraction varied by approximately 90% to 95%, based on the mining method; | |
| • |
Milling Recovery varied from approximately 94% to 95% (based on the mill grade-recovery curve); | |
| • |
Stopes needed to show net positive cash flow to be included in the reserves; | |
| • |
Mineral reserves are not included in the mineral resources. |
In the QP’s opinion, there are no known environmental, permitting, legal, title, taxation, socio-economic, marketing, political or other relevant factors that could affect materially the mineral reserves estimate.
Page | 89
Taylor Property
NI 43-101 Technical report
| 15.0 |
MINING METHODS |
| 15.1 |
Design Criteria |
|
The Taylor Mine consists of a few zones: the Shoot Deposit (located on the west side of the property), the WPZ, the East Porphyry Deposit and the Shaft Deposit (located on the east side of the property), as shown in Figure 15-1. |

Figure 15-1: Longitudinal view (looking Northwest).
The WPZ extend vertically about 600 m and is mostly open at depth. The WPZ is accessed via a ramp and mined by overhand cut and fill method (for shallow dip ore zones) or longhole stoping (where the ore zones dip at an angle greater than 45°). Ore and waste are trucked to surface where the ore is loaded into surface trucks for haulage to the Holt mill and the waste is stockpiled on designated surface areas.
Ventilation is forced underground via the shaft opening. Auxiliary fans are installed, as required, for adequate airflow distribution.
Page | 90
Taylor Property
NI 43-101 Technical report
|
Results from geomechanical test work averaged the rock uniaxial compressive strength at 124 MPa. Backfill is introduced in stopes, either as loose waste or cemented rockfill where warranted (e.g. local stability, stope cycle). | |
|
Underground water is pumped to a collector pond on surface prior to be discharged in the environment. The current pumping rate is capped at 2,016 m3/day, which exceeds the anticipated water inflow at the mine; surface water inflow towards the portal will be collected and mixed with the underground water prior to be discharged. | |
|
Underground infrastructure is re-installed as the development work progresses (e.g. power, leaky feeder system, piping, etc.). | |
|
Existing ground support systems is tested and, if determined below current KLG ground support installation standards, be replaced or enhanced. | |
| 15.2 |
Mining Method |
|
Criteria used for selecting the appropriate mining method(s) were discussed in the previous Prefeasibility Study. Since the updated mining shapes are dipping shallower than previously modelled, Overhand Cut and Fill (OC&F) and Drift and Fill (D&F) were selected as the most suitable mining methods: |
| • |
Where the ore is dipping at less than 45° and the ore horizontal width is narrower than 10 m, OC&F is the method of choice; | |
| • |
Where the ore is dipping at less than 45° and the ore horizontal width exceeds 10 m, D&F will be the method of choice. |
Where the ore is dipping at more than 45°, longhole mining will be the method of choice, requiring minimum mining width of 3 m.
Waste rock generated by development activities is the source of backfill (whether cemented or not).
Upon examination of the mining shapes, the geologist applied a dilution factor varying from approximately 10% to 50% and a dilution grade ranging from approximately 0.5 g/t to 1.0 g/t. Mining extraction varied from approximately 90% to 95%, based on the mining method.
Page | 91
Taylor Property
NI 43-101 Technical report
| 15.3 |
Geomechanical |
|
One hole was drilled for the purpose of recovering core for geomechanical logging and test work (Queen’s, 2011). The hole was drilled from the hanging wall side and went through mineralized zones located in the upper area of the WPZ. | |
|
An external consultant logged the core and classified the rock mass using the RMR and Q systems (SRK, 2011). As a result from the analysis, the mineralized areas were assigned an RMR value of 65 (Q rating of 20) and the waste areas were assigned an RMR value of 62 (Q rating of 20). | |
|
The RMR rating was input in the “Critical Span Graph” (Pakalnis et al., 2004) in order to estimate the largest stable stope excavation for cut-and-fill stopes. The resulting range of stable stope spans varies from 9 m to 12 m. As more information is gathered through development and stoping, the assumptions leading to stope design will be reviewed accordingly. | |
|
The Q ratings were used for estimating the length of ground support for general applications in development headings and stopes. | |
| 15.4 |
Mine Access and Development |
|
The WPZ is accessed via the existing decline located near the shaft. The extension of the decline is located on the hanging wall side of the WPZ, addressing exploration and production requirements. Drill bays located along the decline are used for definition drilling, as required. | |
|
Accesses from the decline vary in length, depending on the location of the stopes. Generally, one access is required to mine approximately six cuts per stope. In some cases, the geometry of the stope and access will permit more, or less, cuts to be mined from that location. Longhole stopes are developed with a conventional overcut and undercut and mined via downholes blasting. In a few cases were an overcut is not warranted (e.g. short vertical extent of the ore from the undercut), “blind” upholes will be drilled and blasted in a retreat sequence. | |
|
Development requirements are detailed in Table 15-1 for the current Life-of-Mine (LOM) plan. |
Page | 92
Taylor Property
NI 43-101 Technical report

|
Table 15-1: Total development requirements (metres). | |
| 15.4.1 |
Capital Development |
|
Details of capital development are listed in Table 15-2. |

Table 15-2: Capital development breakdown (metres).
Page | 93
Taylor Property
NI 43-101 Technical report
Decline
A 5.0 m by 5.0 m ramp, driven at -15% grade, is being advanced for accessing the WPZ.
A vertical longitudinal view is shown in Figure 15-2. The view is cut on strike with the deposit (approximately in a south-west to north-east direction).

|
Figure 15-2: Longitudinal view showing the planned decline access to the WPZ. | |
|
Ventilation Raise and Escapeway | |
|
Two raise systems are proposed approximately (405 m in total) to increase the airflow into the mine. Lateral accesses to the ventilation raises amount to approximately 180 meters. | |
| 15.4.2 |
Operating Development |
|
Operating development consists of various accesses from capital headings or linking stopes. Lateral drifts are designed as 4 m by 4 m excavations; however, the final size will be set once the designed stopes are finalized. Details are provided in Table 15-3. |
Page | 94
Taylor Property
NI 43-101 Technical report

|
Table 15-3: Operating lateral development breakdown (metres). | |
| 15.5 |
Equipment |
|
The list of major mobile equipment is shown in Table 15-4. |

|
Table 15-4: WPZ list of major mobile equipment. | |
| 15.6 |
Production Rate and Life of Mine Plan |
|
An average mining rate of approximately 600 tpd was selected. An amendment to the closure plan was sent to the MNDM in support of an increased mining rate. Approval is anticipated early in the third quarter of 2017. The LOM plan is shown in Table 15-5. |
Page | 95
Taylor Property
NI 43-101 Technical report

Table 15-5: LOM plan.
Page | 96
Taylor Property
NI 43-101 Technical report
| 16.0 |
RECOVERY METHODS |
| 16.1 |
Summary of Laboratory Test Work |
|
The reader is referred to section 12. | |
| 16.2 |
Process Plant Flow Sheet |
|
Description of the current milling process is summarized from a previous NI 43-101 technical report (SWRPA, 2008); the process for treating Taylor ore does not vary from the process described below. | |
|
The Holt Mill was constructed in 1988 and was originally designed for a throughput of 1,360 tpd. Expansions in 1988 and 2001 increased the throughput to 2,500 tpd and 3,000 tpd, respectively. | |
|
Surface ore storage is a total of 4,900 t in three silos, the Holt headframe bin (900 t) and two other separate storage bins (1,000 t and 3,000 t). Ore can be delivered to the mill from the Holt Mine by conveyor or from a separate surface dump that enters a 100 tonne hopper, and then can be fed to either of the two storage bins. | |
|
The grinding circuit consists of a 5 m diameter by 6.1 m long Allis Chalmers ball mill, converted to a SAG mill, a 4 m diameter by 5.5 m long Allis Chalmers ball mill and a 3.6 m diameter by 4.9 m long tertiary ball mill, all operating in series and in closed circuit. The details of the grinding circuit are shown below in Table 16-1. The grinding circuit is controlled by an expert system and fuzzy logic. | |
|
The primary cyclone cluster consists of six 381 mm (15”) Krebs D15B cyclones. A secondary cyclone cluster consists of twelve 254 mm (10”) Krebs gMAX cyclones with an Outokumpu PSI-200 online analyzer. The secondary cyclone cluster feeds a 27 m (90 ft) Eimco thickener. The thickener underflow feeds six carbon-in-leach (CIL) tanks. The tank system is conventional gravity flow for slurry with counter-current carbon advancement | |
|
Precious metal stripping is performed in batch operations, advancing 2.7 t of loaded carbon through a 1.2 m by 2.4 m (4 ft x 8ft) Simplicity screen. Carbon is transferred to an adsorption column where a Zadra process is utilized as the gold elution method. Barren solution is circulated through two shell and tube heat exchangers and a 360 kW electric inline heater. | |
|
The resulting pregnant solution is pumped from the solution tank to an electro-winning cell. The gold precipitate is further refined using a 125 kW Inductotherm furnace and the |
Page | 97
Taylor Property
NI 43-101 Technical report
doré bars are poured in a seven mould cascade arrangement. After stripping, the carbon is regenerated in a rotary kiln, quenched, screened and returned to the process. Carbon fines are collected in a tank, filtered in a Perrin press, and packaged for sale.
The process flow sheet is shown in Figure 16-1.
Reagents and operating supplies for the mill, such as process chemicals and grinding steel, are stored in the reagent storage building attached to the concentrator at the south end of the building.
Laboratory
The assay laboratory is located at the Holt site in an area near but separate from the mill and previously used as an assay lab. The building was renovated and a sample preparation area, fire assay facilities and an AA facility were established to provide analytical services for the site.”
| Data | Primary | Secondary | Tertiary |
| SAG mill | Ball mill #1 | Ball mill #2 | |
| Diameter (m) | 5.0 | 4.0 | 3.6 |
| Length (m) | 6.1 | 5.5 | 4.9 |
| Motor (hp) | 3,400 | 1,650 | 1,250 |
| Ball charge (%) | 8-12 | 45 | 40 |
| Grinding media | 5" balls | 2" balls | 1" slugs |
| Media consumption (kg/t) | 0.75 | 0.30 | 0.45 |
| Speed (rpm) | 13.9 | 16.2 | 17.3 |
| Critical speed (%) | 72.5 | 76.5 | 71.0 |
| Circulating load (%) | 10-15 | 350 | 225 |
| Power draw (kWh) | 2,250 | 1250-1450 | 750-900 |
| Lifters | Polymet | Rubber | Rubber |
| Liners | Polymet | Rubber | Rubber |
| Discharge grates (mm) |
18-30 mm by 40 mm |
Overflow mill |
|
Table 16-1: Details of the grinding circuit.
Page | 98
Taylor Property
NI 43-101 Technical report

|
Figure 16-1: Process flow sheet. | |
| 16.3 |
Potential Gravity Recovery Circuit Design |
|
A gravity recovery circuit is being considered for the processing of Taylor ore. It would consist of adding two Knelson concentrators to the current process flow: one receiving the primary cyclone underflow and the second being fed from the secondary cyclone underflow. The primary Knelson tails would be directed to the ball mill #1 and the primary Knelson concentrate would be collected for 24 hours in the gravity concentrate tank/ACACIA reactor feed tank. The secondary Knelson tails would be directed to the ball mill #2 and the secondary Knelson concentrate would be collected for 24 hours in the gravity concentrate tank/ACACIA reactor feed tank. The reactor would be filled once daily with concentrate. The previous day’s concentrate, now reactor tails, would be returned to the grinding circuit after being washed free of residual cyanide. | |
|
In the QP’s opinion, there are no processing factors or deleterious elements that could have a significant effect on potential economic extraction at Taylor. |
Page | 99
Taylor Property
NI 43-101 Technical report
| 17.0 |
PROJECT INFRASTRUCTURE |
| 17.1 |
Surface Buildings |
|
A few buildings were erected on site during a previous exploration and development phase of the Taylor Shaft Deposit, namely: |
| • |
A security office; | |
| • |
A hoist house (223 m2) housing a 1.524m by 1.829 m double drum hoist; | |
| • |
A collar house (130 m2) and headframe, 30 m in height and constructed of steel; | |
| • |
an electrical substation (electrical power is currently distributed to site by this substation); | |
| • |
Engineering, Geology and Administration offices (additional office planned early in 2017); | |
| • |
Change room, wash room, shower and dry buildings; | |
| • |
Mine office, meeting room and wicket area; | |
| • |
Surface maintenance shop; | |
| • |
Core logging and sampling facilities; and a, | |
| • |
Cold storage building. |
|
Some maintenance and structural repairs were completed since the last technical report, mainly to upgrade the offices and changing facilities. | |
| 17.2 |
Road Upgrade and Ore Transportation |
|
Ore is transported along the existing 1.7 km long access road to the Taylor site, then along Regional Road #11, and finally along Highway #101 until it reaches the Holt mill. The Taylor site access road was widened and upgraded in order to accommodate the anticipated traffic and truck haulage flow. The associated costs are included in the Project capital expenditures. |
Page | 100
Taylor Property
NI 43-101 Technical report
| 17.3 |
Surface Stockpiles |
|
Temporary ore stockpile are located within 200 m of the portal. Permanent waste stockpiles extend from near the portal entrance to the South end of the property. There is sufficient area on the property to store all the waste from the current LOM plan. | |
| 17.4 |
Tailings Deposition and Storage |
|
The process plant for the Taylor ore is located at KLG’ Holt mill, an operating facility that is fully permitted and can accommodate the tailings generated by processing the Taylor ore. | |
| 17.5 |
Power |
|
The Taylor Project is currently serviced by a 1.5 MW sub-station. Additional capacity will be required to extend beyond the current LOM plan or to increase mining throughput. | |
| 17.6 |
Underground Mine Dewatering and Fresh Water Requirements |
|
Currently, the “steady-state” de-watering requirements are estimated at approximately 2,000 m3/day, which is the daily limit of KLG current permit. Underground water is pumped to settling ponds located on surface and then discharged in an appropriate receiver upon meeting water quality regulations and prescribed quantities in the permit. | |
|
Fresh water requirements are minimal since there is no process plant on site; this activity is covered by current permit to take water. | |
| 17.7 |
Underground Mine Ventilation |
|
Initial underground ventilation requirements and design were completed by an external consultant (Hatch, 2012). The design is updated on a “as required basis” to account for field conditions. | |
|
The “steady-state” ventilation system design for the Taylor Project is a push system that delivers approximately 85 m3/s to the underground mine (Figure 17-1). | |
|
Fresh air fans are mounted just outside the headframe, moving the air down the shaft to the 100 meter level (the shaft manway is also the second egress from the mine). The air is heated during the cold seasons with propane-fired mine air heaters. | |
|
Fan setup on the north side of the headframe consists of two units (1.2 m diameter; 112 kW) mounted horizontally in series and a 2.4 MW mine air heater. Fan setup on the east side of the headframe consists of a single fan (1.2 m; 112 kW) mounted horizontally and a 2.1 MW mine air heater. The average capacity of each surface fan is 42.5 m3/s, which meets regulation requirements. |
Page | 101
Taylor Property
NI 43-101 Technical report
The air travels underground through historical workings and then splits between the 100 level and a short access raise to the 45 level. The air flows along both the parallel 100 and 45 levels to the Main Ramp and then to a ventilation raise that services lower levels of the mine. A ventilation door has been installed to prevent air from short-circuiting back from the 100 level into the Main Ramp.
Auxiliary fans are installed underground, as required, to direct the fresh air to the work places.
Return air flows from the level and exit the mine through the decline.

Figure 17-1: Ventilation network schematic.
Page | 102
Taylor Property
NI 43-101 Technical report
| 17.8 |
Underground Material Handling |
|
Simulations were undertaken with an external consultant to assess the truck and LHD fleet size requirements (SANDVIK, 2011). | |
|
Ore and waste is moved from the stopes and headings using LHDs and trucks (refer to the equipment list in Table 15-4). | |
| 17.9 |
Communications |
|
A leaky feeder system and pager phones are installed underground, facilitating radio communications. A fibre optic line with terminations has been installed for future upgrades to the system. |
Page | 103
Taylor Property
NI 43-101 Technical report
| 18.0 |
MARKET STUDIES AND CONTRACTS |
| 18.1 |
Market for the Product |
|
The QP has reviewed KLG contract with the refiner and he is satisfied that the contract reflects industry norms and reasonable market terms for selling Taylor gold production. | |
| 18.2 |
Material Contracts |
|
Contract surface exploration drilling services are provided by Asinii Drilling based in Matheson, ON. Underground contract drilling at the Holt mine is being conducted by | |
|
Boreal Drilling based in Val d’Or (QC). Both contractors possess the necessary equipment, well trained personnel, replacement part inventory and have well documented drill experience on the property. These contracts can be discontinued by KLG at any time with advance written notification. | |
|
KLG anticipate extending the contract in force at another operation to haul the Taylor ore to the Holt mill facility. | |
|
Security services at the Taylor site are provided by Garda, an independent contractor. |
Page | 104
Taylor Property
NI 43-101 Technical report
| 19.0 |
ENVIRONMENTAL STUDIES, PERMITTING, AND SOCIAL OR COMMUNITY IMPACT |
|
The Taylor site utilizes an Environmental Management System (EMS). This system embodies a recurrent review process of site environmental policies, procedures, permits and approvals. The EMS system continually audits and supports the waste and hazardous waste management plan, the water and wastewater treatment plan and environmental monitoring programs throughout the site. | |
|
This process is kept current though EMS revisions, which are included as part of the continuous improvement review cycle. Thus, the EMS forms the basis for the monitoring, sampling, and reporting program requirements under each of the relevant governmental agencies. More importantly, it verifies that all the activities at the Taylor site are in compliance with governments and company standards. | |
|
The Taylor mine utilizes underground and surface water as part of the mining and milling process, in addition to domestic consumption. Water is collected, monitored, treated and released through an approved, regulated permitted industrial sewage works. All effluent discharge to the environment from the Taylor mine is controlled and monitored. | |
| 19.1 |
Summary of Environmental Studies |
| 19.1.1 |
Terrestrial Environment |
|
Surveys were undertaken in the past to provide further details on terrestrial vegetation and wildlife in areas that may be affected by mining activity, such as in the vicinity of the overburden and waste rock storage piles. Depending on the final stockpiles designs, additional studies may be warranted. | |
| 19.1.2 |
Hydrogeological Characterization |
|
A number of investigations were completed to support the characterization of the groundwater regime in the vicinity of the Taylor project. Monitoring of groundwater levels in exploration holes was conducted, in order to determine the characteristics of the overburden aquifer. Data obtained during these tests were used to estimate the amount of groundwater that would potentially report to the mine from the overburden aquifer. Additional testing is underway on selected wells to help approximate in-situ hydraulic conductivity values for each screened interval. A three-dimensional conceptual groundwater model was developed from the field data to predict the potential effects of mine development activities on the local groundwater and surface waters (e.g. drawdown effects). |
Page | 105
Taylor Property
NI 43-101 Technical report
| 19.1.3 |
Hydrological and Aquatic Habitat Assessments |
|
Previous hydrological assessments were in large part developed by pro-rating regional flow data to the local watershed areas. Current studies are focusing on developing more accurate estimates of stream flows, runoff volumes and site drainage patterns associated with the existing mine site and future developments. Efforts were spent on detailed watershed mapping initiatives, as well as the development of a stream flow monitoring station on Wabbler Creek. This information will be crucial in assessing potential adverse environmental effects to the downstream aquatic receiving environment and assisting in storm water management planning activities. | |
|
Past aquatic habitat assessments were based on data collection initiatives recommended in prior studies, within the context of the proposed project; additional sampling of stream sediments, water chemistry and benthic macro invertebrates were also undertaken. Future aquatic assessment programs will be expanded to include areas that could potentially be affected by future mining activity. Of particular importance is the comprehensive assessment of potential fisheries habitat areas in the areas of proposed mine development. | |
| 19.1.4 |
Waste Characterization Studies |
|
A detailed geochemical characterization of all mine waste materials was completed in support of the development of an integrated water and waste management plan for the site. | |
|
In developing the mine model, waste and host rock materials have undergone a comprehensive geological classification to ascertain the total volumes of materials that will be generated. Representative samples from each type of waste material were selected and tested for their acid generating and metal leaching potential as per the relevant guidance documents. An eight sample study of waste rock deposited on surface was completed and results indicated very good neutralizing potential. | |
| 19.2 |
Tailing Management Plan |
|
No process plant or tailings storage facilities are currently planned during the development and production activities at Taylor. Ore is processed at the Holt site process plant where there are four individual basins: two tailing ponds, one sludge precipitate pond and one polishing pond. Within the tailings facilities are 18 individual dam structures, a total of 465.4 ha of watershed area and 212 ha of tailings area. The remaining storage capacity is approximately 4.56 Mt at the close of 2016. In 2016 KLG submitted an amended permit to the MOE for the implementation of Sub-Aerial stacking in the Southwest Basin of the TMF. The amendment will provide an estimated additional |
Page | 106
Taylor Property
NI 43-101 Technical report
2.17 Mt of storage capacity. The tailings facilities are inspected annually by an external third party and comply with current provincial and federal regulations. A plan view of the TMF is displayed in Figure 19-1.
KLG has retained Golder Associates (Sudbury) to assess location(s) for additional tailings storage basin within the TMF that will provide sufficient storage capacity for the LOM plan.

|
Figure 19-1: Tailings management facilities. | |
| 19.3 |
Permits Status and Posted Bonds |
|
The reader is referred to section 3.3. | |
| 19.4 |
Social and Community |
|
As part of the Closure Plan process First Nations and community outreach consultation informs the public of developing projects. | |
|
KLG has recently signed an agreement with First Nations who have treaty and aboriginal rights which they assert within the operations area of the mine. |
Page | 107
Taylor Property
NI 43-101 Technical report
|
The agreement provides a framework for strengthened collaboration in the development and operations of the mine and outlines tangible benefits for the First Nations, including skills training and employment, opportunities for business development and contracting, and a framework for issues resolution, regulatory permitting and KLG’s future financial contributions | |
| 19.5 |
Closure Plan |
|
An operational closure plan was filed and approved by MNDM in 2015. | |
|
As part of the Taylor site development phase, a closure plan was submitted to the appropriate government agencies. The mine received government approval of this closure plan in 2005. | |
|
Amendments to the current closure plan include updated infrastructure details, mining plan, additional underground development and changes to surface features such as waste rock piles and overburden stockpiles. | |
|
KLG will submit an amendment to the closure plan in 2017 to include an increase of the daily production rate up to 1,500 tpd. |
Page | 108
Taylor Property
NI 43-101 Technical report
| 20.0 |
CAPITAL AND OPERATING COSTS |
| 20.1 |
Capital Costs |
|
Capital costs were estimated by KLG at $43M (including 10% contingencies), or US$293/oz (over the LOM). The capital expenditures schedule is shown in Table 20-1. |

Table 20-1: Capital expenditures schedule.
Page | 109
Taylor Property
NI 43-101 Technical report
| 20.1.1 |
Basis of Estimate |
|
Capital costs estimate for major items is based on budgetary quotations from suppliers in the industry. In order to account for unknown factors that should have been included in the estimate, a contingency of 10% was applied to the total. | |
| 20.1.2 |
Cost Estimate |
|
The underground operation is operated by KLG with its own workforce. Costs estimates were derived from first principles for the Company’s 2017 budget. | |
|
Budgetary quotations were received for external work or equipment. | |
|
A contingency of 10% was applied to the total capital estimate to cover the estimate accuracy (± 25%) and items that were omitted unknowingly. | |
| 20.2 |
Operating Costs |
|
Total operating costs are estimated at $97.0 M, broken down as follows: |
| • | Mining: $63.0 M (or $85/t) | |
| • | Milling: $17.8 M (or $24/t) | |
| • | G&A: $4.8 M (or $7/t) | |
| • | Trucking: $7.5 M (or $10/t) | |
| • | Royalties (1%): $3.8 M (or $5/t) |
Operating unit costs amounts to $131/t or US$625/oz (using an exchange rate of 1.25).
The operating costs schedule is shown in Table 20-2.
Page | 110
Taylor Property
NI 43-101 Technical report

|
Table 20-2: Operating costs schedule. | |
| 20.2.1 |
Basis for Estimate |
|
Quotations were obtained for units of work that will be contracted out. | |
|
Operating costs for units of work that will be carried out by KLG personnel were based on KLG’s budget for 2017. |
Page | 111
Taylor Property
NI 43-101 Technical report
| 21.0 |
ECONOMIC ANALYSIS |
|
KLG is a producing issuer and, following instructions contained in Form 43-101F1 Technical Report, may exclude information required under Item 22 (Economic Analysis) for technical reports on properties currently in production unless the technical report includes a material expansion of current production. |
Page | 112
Taylor Property
NI 43-101 Technical report
| 22.0 |
ADJACENT PROPERTIES |
|
There are no adjacent properties to the Taylor Mine that are material to the scope of this technical report. |
Page | 113
Taylor Property
NI 43-101 Technical report
| 23.0 |
OTHER RELEVANT DATA AND INFORMATION |
|
There is no other relevant data or information on the Taylor Mine known to the QPs that if undisclosed would make this NI 43-101 technical report misleading or more understandable. |
Page | 114
Taylor Property
NI 43-101 Technical report
| 24.0 |
INTERPRETATION AND CONCLUSIONS |
| 24.1 |
General |
|
The Bulk Sample #2 program at Taylor successfully extracted gold mineralization as interpreted from SAS’ (now KLG’s) August 2014 Indicated Resource Estimate. The Holt mill successfully processed the Taylor ore recovering 4, 948 troy ounces from the 17,549 tonnes processed. Mill recovery of 97.4% exceeded the estimated 94.5 % recovered rate used in the PFS 2012 (which was based on laboratory test work). | |
|
Commercial production at Taylor was declared in November 2015. During 2016 (the first full year of operation), Taylor produced a total of 199,200 tonnes at an average head grade of 6.90 g/t Au, resulting in 42,639 ounces being produced. | |
|
The geology of the WPZ which is comprised of multiple mineralized veins is complex and a high degree of geological control is required, which can be accomplished with tight spaced infill drilling on a 15 m by 15 m pattern, through the use of geological mapping and sampling of the development headings all of which is required in order to effectively mine the ore. | |
|
Diamond drilling during 2016 continued to extend defined mineralized zones to the east and west along strike and these zones remain open at depth. | |
|
Recent new discoveries announced by KLG in January 2017 (refer to press released disclosed publicly) have confirmed the presence of mineralization, situated to the north of the PDF associated with the 1003 Zone. Underground drilling is warranted, and provides value through resource delineation and also acts as a platform to explore at depth. | |
|
In 2017, an exploration drift to the east on the 430m level has been proposed to assess both the Shaft Deposit, which commences immediately below surface (under 15 m of overburden) and the East Porphyry Zone mineralization at depth. | |
| 24.2 |
Opportunities |
| • |
Strike / Dip extension of mineralized zones remain open and warrant drill testing. | |
|
• |
New Discovery potential is available given the historical sparse drill coverage which to date has been concentrated along the PDF. Additional targets exist to both the south and within the sediments situated north of PDF. |
Page | 115
Taylor Property
NI 43-101 Technical report
| • |
The installation of a gravity recovery circuit may improve the overall recovery by 1% to 2% based on recent test work; | |
| • |
Geology re-interpretation based on information gained through additional drilling and underground sampling may lead to additional mineral resources (and possibly to additional mineral reserves). |
| 24.3 |
Risks |
| • |
Future exploration programs are unable to keep pace with mining that in turn results in mineral resources and mineral reserves being depleted; | |
| • |
Mineral resources may not be converted up to mineral reserves due to a lack of economic support; | |
| • |
Drop in gold price to a level whereby it becomes uneconomic to continue mining and developing the mine complex; | |
| • |
Increased costs for skilled labour, power, fuel, reagents, trucking, etc. could lead to an increase the cut-off grade and decrease the level of mineral resources and mineral reserves; | |
| • |
Mechanical breakdown of critical equipment or infrastructure that could decrease or halt the production throughput at the mine; and, | |
| • |
Continuity of ore zones not well defined or understood. |
Page | 116
Taylor Property
NI 43-101 Technical report
| 25.0 |
RECOMMENDATIONS |
|
Exploration potential at Taylor is regarded as excellent. Diamond drilling from both surface and underground is warranted to 1) assess mineralized strike and dip extensions, 2) to define the overall trend and width of the through-going diabase dykes, and 3) to target new discoveries on the property and associated with the PDF trend. | |
|
Underground development west (on the 390 and 450 levels) and associated diamond drill platforms are critical to the delineation of future mineral resources. | |
|
The re-processing of the 1997 Quantec IP survey data over the Shaft Deposit, has yielded encouraging results when sliced into a series of level plans. Drilling is required to follow-up on the geophysical signature of the Shaft and WPZ mineralized trend at depth. | |
|
A seismic reflection line was conducted 5 km west of Taylor, as part of the Discover Abitibi exploration initiative in 2005, which defined a buried mafic volcanic complex to the north of the PDF. Additional seismic lines are justified, to define the regional geological setting at depth, with scout level drilling proposed to confirm the seismic line interpretation. | |
|
Continued definition drilling at the current drill spacing (15 m by 15 m centres) is recommended to confirm the geometry of the mineralized zones. |
Page | 117
Taylor Property
NI 43-101 Technical report
| 26.0 |
REFERENCESTO UPDATE |
|
Analytical Solutions Ltd. Preliminary Data Review - Analytical Laboratories Internal report prepared for KL Gold. March 13, 2017. | |
|
Ayer, J.A., Amelin, Y., Kamo, S.L., Ketchum, J.W.F., Kwok, K. and Trowell, N. 2002: Evolution of the southern Abitibi greenstone belt based on U-Pb chronology: autochthonous volcanic construction followed by plutonism, regional deformation and sedimentation; Precambrian Research, v. 115, pp. 63-95. | |
|
Dimov, January 23, 2015; Super-panning Results of Submitted Ore Samples, letter report prepared by Surface Science Western for St. Andrew Goldfields Ltd., SSW Ref. 55914, 29 p. | |
|
Environment Canada, http://www.climate.weatheroffice.gc.ca | |
|
Ferguson, S. A., et al., “Gold Deposits of Ontario, Part 1: Ontario Department of Mines MRC 13”, 1971, 315 p. | |
|
Hatch, “St Andrew Goldfields Ltd. – Taylor Project Ventilation Design”, January 3, 2012. | |
|
| |
|
KLG, “Technical Procedure for Core Sampling”, internal document, March 22, 2010. | |
|
| |
|
KLG, “Technical Procedure and Guidelines for Core Cutting and Handling”, internal document, July 13, 2010. | |
|
| |
|
Pakalnis, R., et al., “Update of Span Design Curve for Weak Rock Masses”, presented at AGM-CIM, Edmonton, 2004. | |
|
| |
|
Pykes, D.R. And Jensen, L.G., “Preliminary Stratigraphic Interpretation of the Timmins- Kirkland Lake Area, Ontario”, Program with Abstracts, Geological Association of Canada, Vol 1, 1976, 71p. | |
|
| |
|
Queen’s University at Kingston, “Rock Core Strength Testing – Taylor Property”, August 22, 2011. | |
|
| |
|
Reed, L.E., Snyder, D.B. and Salisbury, M.H. 2005. “Two-dimensional (2D) reflection seismic surveying in the Timmins-Kirkland Lake area, Northern Ontario; acquisition, processing, interpretation: Discover Abitibi Initiative”, Ontario geological Survey Open File Report 6169, 96 p. |
Page | 118
Taylor Property
NI 43-101 Technical report
Rhys, D., January 25, 2015; Taylor Deposit: West Porphyry 1004-1 Lens Geological Observations, report prepared by Panterra Geoservices Inc. for St. Andrew Goldfields Ltd., 53 p.
Rocque, P., Michaud, M., Kita, J., “Taylor Property Scoping Study”, SAS internal document, May 5, 2011.
Rocque, P., Todd, C., Harwood, B., Cole B., Lefevbre S., Spadetto, G., Rowe, K., “Taylor
Property Pre-Feasibility Study”, SAS internal document, February 2, 2012.
Rocque, P., Todd, C., “43-101 Technical Report Taylor Property Pre-Feasibility Study”, SAS internal document, March 29, 2012.
Roscoe, W. E., Gow, N. N. (SWRPA) 2006;“Technical report on the Taylor, Clavos, Hislop and Stock projects in the Timmins area, northeastern Ontario, Canada.”, prepared by SWRPA, October 2006
St Andrew Goldfields, 2015, Taylor Property, ON Canada, Bulk Sample 2 – 1004-1 Lens, West Porphyry Zone, Updated Technical Report (Internal report) dated February 5, 2015
SANDVIK, “Loading and Hauling Simulations”, personal communication, September 2011.
SGS 2017, Taylor Gold Deposit Mineral Resource Verification, (Internal Report prepared for KL Gold dated February 21, 2017.
SRK, “Geotechnical Field Program”, July 22, 2011.
SWRPA, “Technical Report on the Taylor, Clavos, Hislop and Stock Projects in the Timmins Area, Northeastern Ontario, Canada”, October 2, 2006.
SWRPA, “Technical Report on the Holloway-Holt Project, Ontario, Canada”, July 9,2008.
Terra Mineralogical Services, 2015 Mineralogical Examination of the Gold Mineralization from the Taylor Project, Timmins camp, Ontario. Internal report prepared for St Andrew Goldfields.
Page | 119
Taylor Property
NI 43-101 Technical report
| 27.0 |
SIGNATURE PAGE AND DATE |
|
The undersigned prepared this technical report titled “Taylor Property, Ontario, Canada, Updated NI 43-101 Technical Report”. The effective date of this Technical Report is December 31, 2016 and the disclosure date is March 30, 2017. | |
|
Signed, |
| “signed and sealed” | |||
| Pierre Rocque, P. Eng. |
March 30, 2017 |
Kirkland Lake Gold Ltd. 200 Bay Street, Suite 3120 Toronto, Ontario, M5J 2J1 Canada | |
|
|||
| “signed and sealed” | |||
| Doug Cater, P. Geo |
March 30, 2017 |
Kirkland Lake Gold Ltd. 200 Bay Street, Suite 3120 Toronto, Ontario, M5J 2J1 Canada |
Page | 120
Taylor Property
NI 43-101 Technical report
CERTIFICATE OF QUALIFIED PERSON
I, Pierre Rocque, P. Eng., as an author of this report entitled “Taylor Property, Ontario, Canada, Updated NI 43-101 Technical Report” dated effective December 31, 2016 prepared for Kirkland Lake Gold Ltd. (the “Issuer”) do hereby certify that:
| 1. |
I am Vice President of Technical Services, at Kirkland Lake Gold Ltd., located at Royal Bank Plaza South Tower, 200 Bay Street, Suite 3120, Toronto, ON, Canada M5J 2J1. | |
| 2. |
This certificate applies to the technical report entitled “Taylor Property, Ontario, Canada, Updated NI 43-101 Technical Report”, dated effective December 31, 2016 (The “Technical Report”) | |
| 3. |
I graduated with a Bachelor’s degree in Mining Engineering (B. Ing.) in 1986 from École polytechnique de Montréal and a Master’s degree in Mining Engineering (M.Sc.Eng.) in 1992 from Queen’s University at Kingston. I have worked as a mining engineer since graduation from university in 1986. I have been directly involved in mine design of underground gold mines and, since 1997 I have overseen the mining engineering department at three narrow veins underground gold mines, providing relief to the Mine Manager and General Manager on site. Since 2008, I have provided corporate direction for the engineering function at junior gold exploration and producing companies, except from 2014 to 2016 where I was Global Director- Mining for an international EPCM firm. I am a member of Professional Engineers of Ontario and Ordre des ingénieurs du Québec. | |
|
4. |
I am familiar with National Instrument 43-101 – Standards of Disclosure for Mineral Projects (“NI 43-101”) and by reason of education, experience and professional registration I fulfill the requirements of a “qualified person” as defined in NI 43-101. | |
| 5. |
I last visited the Taylor Property, subject of the Technical Report, on March 2017. | |
| 6. |
I am responsible for the preparation of the Summary and Sections 1 to 5, 12, 14 to 27 of the Technical Report. | |
| 7. |
I am not independent of the Issuer as described in section 1.5 of NI 43-101, as I am an employee of the Issuer. Independence is not required under Section 5.3 (3) of NI 43–101. | |
| 8. |
I have prior involvement with the property that is the subject of the Technical Report as I was working for a previous owner of the Property between 2010 and 2014. | |
| 9. |
I have read NI 43–101 and the parts of the Technical Report for which I am responsible have been prepared in compliance with NI 43-101. | |
| 10. |
At the effective date of the Technical Report, to the best of my knowledge, information and belief, the parts of the Technical Report for which I am responsible contain all scientific and technical information that is required to be disclosed to make the Technical Report not misleading. |
Dated this 30th day of March, 2017.
“Signed and
Sealed”
Pierre Rocque, P. Eng.
Vice President Technical Services
Page | 121
Taylor Property
NI 43-101 Technical report
CERTIFICATE OF QUALIFIED PERSON
I, Douglas Cater, P. Geo, as an author of this report entitled “Taylor Property, Ontario Canada, Updated NI 43-101” dated effective December 31, 2016 prepared for Kirkland Lake Gold Ltd. (the “Issuer”) do hereby certify that:
| 1. |
I am Vice President Exploration Canada, at Kirkland Lake Gold Ltd. located at Royal Bank Plaza, South Tower 200 Bay Street, Suite 3120 Toronto, Ontario, M5J 2J1 Canada. | |
| 2. |
This certificate applies to the technical report entitled “Taylor Property Updated NI-43-101”, dated effective December 31, 2016 (the “Technical Report”). | |
| 3. |
I graduated with a Bachelor of Science degree in Earth Science from University of Waterloo, Waterloo, ON, in 1981. I have worked as a geologist since graduation from university in 1981. During that time, I have been employed as exploration geologist, mine geologist, resource geologist and consulting geologist, at several mining companies. I am a member in full standing of the Association of Professional Geoscientists of Ontario with Registration No. 0161. I have practiced my profession for over thirty years. I have been an Exploration Manager / Chief Geologist at several gold mines and advanced stage exploration projects since 1991 and have been responsible for all geological functions including calculating and reporting Resources and Reserves. Since January 2016, I have been Vice President Exploration responsible for surface exploration activities on the company’s extensive land package. | |
| 4. |
I am familiar with National Instrument 43-101 – Standards of Disclosure for Mineral Projects (“NI 43-101”) and by reason of education, experience and professional registration I fulfill the requirements of a “qualified person” as defined in NI 43-101. | |
| 5. |
I last visited the Taylor Mine, subject of the Technical Report, in March 2017. | |
| 6. |
I am responsible for the Summary and Sections 6 to 11, 13 and 22 to 25 of the Technical Report. | |
| 7. |
I am not independent of the Issuer as described in section 1.5 of NI 43-101, as I am an employee of the Issuer . | |
| 8. |
I have prior involvement with the property that is the subject of the Technical Report. I have been frequently involved with the property having guided Exploration at the mine since June 2012 to the present. | |
| 9. |
I have read NI 43-101 and the parts of the Technical Report for which I am responsible have been prepared in compliance with NI 43-101. | |
| 10. |
At the effective date of the Technical Report, to the best of my knowledge, information and belief, the parts of the Technical Report for which I am responsible contain all scientific and technical information that is required to be disclosed to make the Technical Report not misleading. |
Dated this 30 day of March, 2017.
“Signed and Sealed”
Douglas Cater P. Geo.
Vice President Exploration
Page | 122
Serious News for Serious Traders! Try StreetInsider.com Premium Free!
You May Also Be Interested In
- Santander Expands U.S. Presence with Completion of Webster Acquisition
- Experian Brings Personalised Credit Scores to ChatGPT in a UK First
- New Company Crash.gg Launches Human-First Workforce Model to Challenge the AI Automation Trend
Create E-mail Alert Related Categories
SEC FilingsSign up for StreetInsider Free!
Receive full access to all new and archived articles, unlimited portfolio tracking, e-mail alerts, custom newswires and RSS feeds - and more!
