

Form 40-F SSR MINING INC. For: Dec 31
 Tweet
Tweet Share
Share
UNITED STATES
SECURITIES AND EXCHANGE COMMISSION
Washington, D.C. 20549
FORM 40-F
(Check One)
| ☐ | Registration statement pursuant to Section 12 of the Securities Exchange Act of 1934 |
or
| ☒ | Annual report pursuant to Section 13(a) or 15(d) of the Securities Exchange Act of 1934 |
For the fiscal year ended December 31, 2018
Commission File Number 001-35455
SSR MINING INC.
(Exact name of Registrant as specified in its charter)
| British Columbia | 1311 | Not applicable | ||
| (Province or other jurisdiction of incorporation or organization) |
(Primary Standard Industrial Classification Code Number (if applicable)) |
(I.R.S. Employer Identification Number (if applicable)) |
Suite 800 – 1055 Dunsmuir Street
PO Box 49088, Bentall Postal Station
Vancouver, British Columbia
Canada V7X 1G4
(604) 689-3846
(Address and telephone number of Registrant’s principal executive offices)
CT Corporation System, 111 8th Avenue, New York, NY 10011
(212) 894-8940
(Name, address (including zip code) and telephone number
(including area code) of agent for service in the United States)
Securities registered or to be registered pursuant to Section 12(b) of the Act.
| Title of each class |
Name of each exchange on which registered | |
| Common Shares without par value | The Nasdaq Stock Market LLC |
Securities registered or to be registered pursuant to Section 12(g) of the Act. None
Securities for which there is a reporting obligation pursuant to Section 15(d) of the Act. None
For annual reports, indicate by check mark the information filed with this Form:
| ☒ Annual Information Form | ☒ Audited Annual Financial Statements |
Indicate the number of outstanding shares of each of the issuer’s classes of capital or common stock as of the close of the period covered by the annual report: 120,741,162
Indicate by check mark whether the registrant: (1) has filed all reports required to be filed by Section 13 or 15(d) of the Exchange Act during the preceding 12 months (or for such shorter period that the registrant was required to file such reports); and (2) has been subject to such filing requirements for the past 90 days.
Yes ☒ No ☐
Indicate by check mark whether the registrant has submitted electronically every Interactive Data File required to be submitted pursuant to Rule 405 of Regulation S-T (§232.405 of this chapter) during the preceding 12 months (or for such shorter period that the Registrant was required to submit such files).
Yes ☒ No ☐
Indicate by check mark whether the registrant is an emerging growth company as defined in Rule 12b-2 of the Exchange Act.
Emerging growth company ☐
If an emerging growth company that prepares its financial statements in accordance with U.S. GAAP, indicate by check mark if the registrant has elected not to use the extended transition period for complying with any new or revised financial accounting standards provided pursuant to Section 13(a) of the Exchange Act. ☐
The Annual Report on Form 40-F shall be incorporated by reference into each of the following Registration Statements under the Securities Act of 1933, as amended: Form S-8 (File No. 333-219848, 333-185498, 333-196116 and 333-198092).
FORM 40-F
Principal Documents
The following documents, filed as Exhibits 99.1, 99.2 and 99.3 to this Annual Report on Form 40-F, are incorporated herein by reference:
| (a) | Annual Information Form for the fiscal year ended December 31, 2018; |
| (b) | Management’s Discussion and Analysis for the fiscal year ended December 31, 2018; and |
| (c) | Consolidated Financial Statements for the fiscal year ended December 31, 2018. |
Cautionary Note Regarding Differences in United States and Canadian Reporting Practices
SSR Mining Inc. (“SSR Mining” or the “Company”) is permitted, under a multijurisdictional disclosure system adopted by the United States and Canada, to prepare this Annual Report on Form 40-F in accordance with Canadian disclosure requirements, which are different from those of the United States. The Company prepares its financial statements, which are filed with this Annual Report on Form 40-F, in accordance with International Financial Reporting Standards as issued by the International Accounting Standards Board. They may not be comparable to financial statements of United States companies.
Cautionary Note Regarding Forward-Looking Statements
Certain statements in this Annual Report on Form 40-F constitute “forward-looking statements” within the meaning of the U.S. Private Securities Litigation Reform Act of 1995. See “Introductory Notes – Cautionary Notice Regarding Forward-Looking Statements” in SSR Mining’s Annual Information Form for the fiscal year ended December 31, 2018, filed as Exhibit 99.1 to this Annual Report on Form 40-F, and “Cautionary Notes Regarding Forward-Looking Statements and Mineral Reserve and Mineral Resource Estimates” in Section 13 of SSR Mining’s Management’s Discussion and Analysis for the fiscal year ended December 31, 2018, filed as Exhibit 99.2 to this Annual Report on Form 40-F.
2
ADDITIONAL DISCLOSURE
Certifications and Disclosure Regarding Controls and Procedures.
| (a) | Certifications. See Exhibits 99.5, 99.6, 99.7 and 99.8 to this Annual Report on Form 40-F. |
| (b) | Disclosure Controls and Procedures. As of the end of SSR Mining’s fiscal year ended December 31, 2018, an evaluation of the effectiveness of SSR Mining’s “disclosure controls and procedures” (as such term is defined in Rules 13a-15(e) and 15d-15(e) of the Securities Exchange Act of 1934, as amended (the “Exchange Act”)) was carried out by SSR Mining’s management, with the participation of its principal executive officer and principal financial officer. Based upon that evaluation, SSR Mining’s principal executive officer and principal financial officer have concluded that as of the end of that fiscal year, SSR Mining’s disclosure controls and procedures were effective to ensure that information required to be disclosed by SSR Mining in reports that it files or submits under the Exchange Act is (i) recorded, processed, summarized and reported within the time periods specified in Securities and Exchange Commission (the “Commission”) rules and forms and (ii) accumulated and communicated to SSR Mining’s management, including its principal executive officer and principal financial officer, as appropriate to allow timely decisions regarding required disclosure. |
It should be noted that while SSR Mining’s principal executive officer and principal financial officer believe that SSR Mining’s disclosure controls and procedures provide a reasonable level of assurance that they are effective, they do not expect that SSR Mining’s disclosure controls and procedures or internal control over financial reporting will prevent all errors and fraud. A control system, no matter how well conceived or operated, can provide only reasonable, not absolute, assurance that the objectives of the control system are met.
| (c) | Management’s Annual Report on Internal Control Over Financial Reporting. The required disclosure is included under the heading “Internal Control over Financial Reporting and Disclosure Controls and Procedures” in SSR Mining’s Management’s Discussion and Analysis for the fiscal year ended December 31, 2018, filed as Exhibit 99.2 to this Annual Report on Form 40-F. |
| (d) | Attestation Report of the Registered Public Accounting Firm. The required disclosure is included in the “Report of Independent Registered Public Accounting Firm” that accompanies SSR Mining’s Consolidated Financial Statements for the fiscal year ended December 31, 2018, filed as Exhibit 99.3 to this Annual Report on Form 40-F. |
3
| (e) | Changes in Internal Control Over Financial Reporting. During the fiscal year ended December 31, 2018, there were no changes in SSR Mining’s internal control over financial reporting that have materially affected, or are reasonably likely to materially affect, SSR Mining’s internal control over financial reporting. |
Notices Pursuant to Regulation BTR.
None.
Audit Committee Financial Expert.
SSR Mining’s board of directors has determined that each of Richard D. Paterson and Beverlee F. Park, members of SSR Mining’s audit committee, qualifies as an “audit committee financial expert” (as such term is defined under Item 8(a) of General Instruction B to Form 40-F) and is “independent” as that term is defined under listing standards of the Nasdaq Global Market (“Nasdaq”).
Code of Ethics.
SSR Mining has adopted a “code of ethics” (as that term is defined under Item 9(a) of General Instruction B to Form 40-F), entitled the “Code of Business Conduct and Ethics” (the “Code of Conduct”), that applies to its principal executive officer, principal financial officer and other senior financial officers performing similar functions. The Code of Conduct is available for viewing on SSR Mining’s website at www.ssrmining.com.
No amendments were made to and no waivers, including implicit waivers, were granted from any provision of the Code of Conduct during the fiscal year ended December 31, 2018.
SSR Mining intends to disclose and summarize any amendment to, or waiver from, any provision of the Code of Conduct that is required to be disclosed and summarized, on its website at www.ssrmining.com.
Principal Accountant Fees and Services.
The required disclosure is included under the heading “Audit Committee – External Auditor Service Fees” in SSR Mining’s Annual Information Form for the fiscal year ended December 31, 2018, filed as Exhibit 99.1 to this Annual Report on Form 40-F.
4
Pre-Approval Policies and Procedures.
The required disclosure is included under the heading “Audit Committee – Pre-Approval Policies and Procedures” in SSR Mining’s Annual Information Form for the fiscal year ended December 31, 2018, filed as Exhibit 99.1 to this Annual Report on Form 40-F.
Off-Balance Sheet Arrangements.
With the exception of the Company’s operating lease commitments disclosed below, SSR Mining does not have any off-balance sheet arrangements that have or are reasonably likely to have a current or future effect on its financial condition, changes in financial condition, revenues or expenses, results of operations, liquidity, capital expenditures or capital resources that is material to investors.
Tabular Disclosure of Contractual Obligations.
The following table summarizes our financial liabilities and moratorium commitments at December 31, 2018:
| Payments due by period (as at December 31, 2018) | ||||||||||||||||||||
| Contractual obligations | Less than one year |
1-3 years | 3-5 years | After 5 years | Total | |||||||||||||||
| $ | $ | $ | $ | $ | ||||||||||||||||
| Trade and other payables |
70,003 | — | — | — | 70,003 | |||||||||||||||
| Moratorium |
4,570 | 14,428 | 59 | — | 19,057 | |||||||||||||||
| Convertible notes(i) |
— | 265,000 | — | — | 265,000 | |||||||||||||||
| Interest on convertible notes(i) |
7,619 | 3,809 | — | — | 11,428 | |||||||||||||||
| Operating lease obligations |
512 | 1,493 | 933 | 2,322 | 5,260 | |||||||||||||||
|
|
|
|
|
|
|
|
|
|
|
|||||||||||
| Total contractual obligations |
82,704 | 284,730 | 992 | 2,322 | 370,748 | |||||||||||||||
| (i) | The convertible notes mature in 2033 but are redeemable in part or in full at the option of the holder on February 1 at each of 2020, 2023, and 2028, or upon fundamental corporate changes. They are also redeemable by us in part or in full on and after February 1, 2018. The convertible notes bear interest of 2.875% per annum and are convertible into common shares upon specified events at a fixed conversion price of $20.00 per common share. |
Identification of the Audit Committee.
SSR Mining has a separately-designated standing audit committee established in accordance with Section 3(a)(58)(A) of the Exchange Act. The members of the audit committee are Beverlee F. Park (Chair), Richard D. Paterson, Gustavo A. Herrero and Steven P. Reid.
5
Mine Safety Disclosure.
Section 1503(a) of the Dodd-Frank Wall Street Reform and Consumer Protection Act (the “Dodd-Frank Act”) requires that the Company disclose in this Annual Report on Form 40-F certain information about the Company’s U.S. mining operations, including the number of certain types of violations and orders issued under the Federal Mine Safety and Health Act of 1977 by the U.S. Labor Department’s Mine Safety and Health Administration. Information concerning such safety information related to the Company’s U.S. mining operations or other regulatory matters required by Section 1503(a) of the Financial Reform Act for the year ended December 31, 2018 is included as Exhibit 99.4 to this Annual Report on Form 40-F, which is incorporated herein by reference.
Nasdaq Global Market Disclosure.
SSR Mining is subject to a variety of corporate governance guidelines and requirements enacted by Canadian securities regulators, the Toronto Stock Exchange, Nasdaq and the Commission, and those mandated by the U.S. Sarbanes Oxley Act of 2002 and the Dodd-Frank Act.
SSR Mining’s common shares are listed on Nasdaq. Nasdaq Marketplace Rule 5615(a)(3) permits a foreign private issuer, such as SSR Mining, to follow its home country practice in lieu of most of the requirements of the 5600 Series of the Nasdaq Marketplace Rules. In order to claim such an exemption, SSR Mining must disclose the significant differences between its corporate governance practices and those required to be followed by U.S. domestic issuers under Nasdaq’s corporate governance requirements. Nasdaq Marketplace Rule 5635 requires shareholder approval of most equity compensation plans and material revisions to such plans. SSR Mining does not follow this Nasdaq Marketplace Rule. Instead, SSR Mining complies with the applicable Toronto Stock Exchange rules which only require that the creation of, or certain material amendments to, equity compensation plans require shareholder approval.
6
UNDERTAKING AND CONSENT TO SERVICE OF PROCESS
A. Undertaking.
The Registrant undertakes to make available, in person or by telephone, representatives to respond to inquiries made by the Commission staff, and to furnish promptly, when requested to do so by the Commission staff, information relating to: the securities registered pursuant to Form 40-F; the securities in relation to which the obligation to file an Annual Report on Form 40-F arises; or transactions in said securities.
B. Consent to Service of Process.
The Registrant has filed a Form F-X in connection with the class of securities in relation to which the obligation to file this report arises.
Any change to the name or address of the agent for service of process of the Registrant shall be communicated promptly to the Commission by an amendment to the Form F-X referencing the file number of the Registrant.
7
SIGNATURES
Pursuant to the requirements of the Exchange Act, the Registrant certifies that it meets all of the requirements for filing on Form 40-F and has duly caused this annual report to be signed on its behalf by the undersigned, thereunto duly authorized, on March 11, 2019.
| SSR Mining Inc. | ||
| By: | /s/ Paul Benson | |
| Name: | Paul Benson | |
| Title: | President & Chief Executive Officer | |
| By: | /s/ Gregory J. Martin | |
| Name: | Gregory J. Martin | |
| Title: | Senior Vice President & Chief Financial Officer | |
8
EXHIBIT INDEX
| Exhibit |
Description | |
| 99.1 | Annual Information Form for the fiscal year ended December 31, 2018 | |
| 99.2 | Management’s Discussion and Analysis for the fiscal year ended December 31, 2018 | |
| 99.3 | Consolidated Financial Statements for the fiscal year ended December 31, 2018 | |
| 99.4 | Mine Safety Information Pursuant to Section 1503(a) of the Dodd-Frank Wall Street Reform and Consumer Protection Act | |
| 99.5 | Certification of Chief Executive Officer pursuant to Rule 13a-14 or 15d-14 of the Securities Exchange Act of 1934 | |
| 99.6 | Certification of Chief Financial Officer pursuant to Rule 13a-14 or 15d-14 of the Securities Exchange Act of 1934 | |
| 99.7 | Certification of Chief Executive Officer pursuant to 18 U.S.C. Section 1350 | |
| 99.8 | Certification of Chief Financial Officer pursuant to 18 U.S.C. Section 1350 | |
| 99.9 | Consent of PricewaterhouseCoopers LLP, Chartered Professional Accountants | |
| 99.10 | Consent of Bruce Butcher | |
| 99.11 | Consent of F. Carl Edmunds | |
| 99.12 | Consent of Trevor J. Yeomans | |
| 99.13 | Consent of James N. Carver | |
| 99.14 | Consent of James Frost | |
| 99.15 | Consent of Karthik Rathnam | |
| 99.16 | Consent of Thomas Rice | |
9
| Exhibit |
Description | |
| 99.17 | Consent of Cameron Chapman | |
| 99.18 | Consent of Kevin Fitzpatrick | |
| 99.19 | Consent of Jeff Kulas | |
| 99.20 | Consent of Michael Selby | |
| 99.21 | Consent of Dominic Chartier | |
| 99.22 | Consent of Mark Liskowich | |
| 99.23 | Consent of Sebastien Bernier | |
| EX-101 | XBRL Files | |
10
ANNUAL INFORMATION FORM
FOR THE FINANCIAL YEAR ENDED DECEMBER 31, 2018
SSR MINING INC.
March 11, 2019
SSR MINING INC.
ANNUAL INFORMATION FORM
FOR THE FINANCIAL YEAR ENDED DECEMBER 31, 2018
TABLE OF CONTENTS
| Page | ||||
| INTRODUCTORY NOTES |
1 | |||
| Date of Information |
1 | |||
| Cautionary Notice Regarding Forward-Looking Statements |
1 | |||
| Currency and Exchange Rate Information |
2 | |||
| Scientific and Technical Information |
3 | |||
| Cautionary Notice Regarding Mineral Reserves and Mineral Resources Estimates |
3 | |||
| Notice Regarding Non-GAAP Measures |
5 | |||
| CORPORATE STRUCTURE |
5 | |||
| Name, Address and Incorporation |
5 | |||
| Intercorporate Relationships |
6 | |||
| GENERAL DEVELOPMENT OF THE BUSINESS |
6 | |||
| 2018 Developments |
6 | |||
| 2017 Developments |
7 | |||
| 2016 Developments |
9 | |||
| DESCRIPTION OF THE BUSINESS |
10 | |||
| General |
10 | |||
| Principal Products |
11 | |||
| Specialized Skills and Knowledge |
11 | |||
| Competitive Conditions |
11 | |||
| Operations |
12 | |||
| Corporate Social Responsibility |
13 | |||
| MINERAL PROPERTIES |
17 | |||
| Summary of Mineral Reserves and Mineral Resources Estimates |
17 | |||
| Marigold Mine |
20 | |||
| Seabee Gold Operation |
33 | |||
| Puna Operations |
47 | |||
| Projects |
47 | |||
| RISK FACTORS |
49 | |||
| Risks Related to Our Business and Our Industry |
49 | |||
| Risks Related to Our Common Shares |
65 | |||
| DIVIDENDS |
66 | |||
| DESCRIPTION OF CAPITAL STRUCTURE |
66 | |||
| Common Shares |
67 | |||
| Stock Options |
67 | |||
| Performance Share Units and Restricted Share Units |
69 | |||
| Deferred Share Units |
69 | |||
| Convertible Notes |
70 | |||
| MARKET FOR SECURITIES |
70 | |||
| Trading Price and Volume |
70 | |||
| PRIOR SALES |
71 | |||
| DIRECTORS AND EXECUTIVE OFFICERS |
72 | |||
| Directors |
72 | |||
| Executive Officers |
74 | |||
| Standing Committees of the Board |
75 | |||
| Code of Ethics |
76 | |||
| Cease Trade Orders or Bankruptcies |
76 | |||
| Penalties or Sanctions |
77 | |||
| Conflicts of Interest |
77 | |||
- ii -
| AUDIT COMMITTEE |
77 | |||
| Composition of the Audit Committee |
77 | |||
| Audit Committee Oversight |
77 | |||
| Reliance on Certain Exemptions |
78 | |||
| Pre-Approval Policies and Procedures |
78 | |||
| External Auditor Service Fees |
78 | |||
| INTEREST OF MANAGEMENT AND OTHERS IN MATERIAL TRANSACTIONS |
78 | |||
| TRANSFER AGENT AND REGISTRAR |
78 | |||
| MATERIAL CONTRACTS |
79 | |||
| INTERESTS OF EXPERTS |
79 | |||
| ADDITIONAL INFORMATION |
80 | |||
| SCHEDULE “A” AUDIT COMMITTEE CHARTER |
A-1 |
INTRODUCTORY NOTES
DATE OF INFORMATION
In this Annual Information Form, SSR Mining Inc., formerly Silver Standard Resources Inc., together with its subsidiaries, as the context requires, is referred to as “we,” “our,” “us,” the “Company” and “SSR Mining”. All information contained in this Annual Information Form is as at December 31, 2018, unless otherwise stated, being the date of our most recently completed financial year, and the use of the present tense and of the words “is,” “are,” “current,” “currently,” “presently,” “now” and similar expressions in this Annual Information Form is to be construed as referring to information given as of that date.
CAUTIONARY NOTICE REGARDING FORWARD-LOOKING STATEMENTS
This Annual Information Form contains forward-looking information within the meaning of Canadian securities laws and forward-looking statements within the meaning of the U.S. Private Securities Litigation Reform Act of 1995 (collectively, “forward-looking statements”) including, without limitation, forward-looking statements concerning our expected production and cost guidance for 2019, the anticipated operating and capital expenditures and reclamation costs at the Marigold mine, the Seabee Gold Operation and Puna Operations, our expected capital projects, including costs, results and timing of completion, and our planned exploration initiatives and expenditures for our projects in Argentina, Mexico, Peru, the United States and Canada. These statements relate to analyses and other information that are based on forecasts of future results, estimates of amounts not yet determinable and assumptions of management.
Generally, forward-looking statements can be identified by the use of words or phrases such as “expects,” “anticipates,” “plans,” “projects,” “estimates,” “assumes,” “intends,” “strategy,” “goals,” “objectives,” “potential,” “believes,” or variations thereof, or stating that certain actions, events or results “may,” “could,” “would,” “might” or “will” be taken, occur or be achieved, or the negative of any of these terms or similar expressions. These forward-looking statements are subject to a variety of known and unknown risks, uncertainties and other factors that could cause actual events or results to differ from those expressed or implied, including, without limitation, the following risks and uncertainties referred to under the heading “Risk Factors”: uncertainty of production, development plans and cost estimates for the Marigold mine, the Seabee Gold Operation, Puna Operations and our projects; our ability to replace Mineral Reserves; commodity price fluctuations; political or economic instability and unexpected regulatory changes; currency fluctuations; the possibility of future losses; general economic conditions; counterparty and market risks related to the sale of our concentrates and metals; uncertainty in the accuracy of Mineral Reserves and Mineral Resources estimates and in our ability to extract mineralization profitably; differences in U.S. and Canadian practices for reporting Mineral Reserves and Mineral Resources; lack of suitable infrastructure or damage to existing infrastructure; future development risks, including start-up delays and cost overruns; our ability to obtain adequate financing for further exploration and development programs and opportunities; uncertainty in acquiring additional commercially mineable mineral rights; delays in obtaining or failure to obtain governmental permits, or non-compliance with our permits; our ability to attract and retain qualified personnel and management; the impact of governmental regulations, including health, safety and environmental regulations, including increased costs and restrictions on operations due to compliance with such regulations; unpredictable risks and hazards related to the development and operation of a mine or mineral property that are beyond our control; reclamation and closure requirements for our mineral properties; potential labour unrest, including labour actions by our unionized employees at Puna Operations; indigenous peoples’ title claims and rights to consultation and accommodation may affect our existing operations as well as development projects and future acquisitions; certain transportation risks that could have a negative impact on our ability to operate; assessments by taxation authorities in multiple jurisdictions; recoverability of value added tax (“VAT”) and Puna credits balance and significant delays in the collection process in Argentina; claims and legal proceedings, including adverse rulings in litigation against us and/or our directors or officers; compliance with anti-corruption laws and internal controls, and increased regulatory compliance costs; complying with emerging climate change regulations and the impact of climate change; fully realizing our interest in deferred consideration received in connection with recent divestitures; fully realizing the value of our shareholdings in our marketable securities, due to changes in price, liquidity or disposal cost of such marketable securities; uncertainties related to title to our mineral properties and the ability to obtain surface
- 2 -
rights; the sufficiency of our insurance coverage; civil disobedience in the countries where our mineral properties are located; operational safety and security risks; actions required to be taken by us under human rights law; competition in the mining industry for mineral properties; our ability to complete and successfully integrate an announced acquisition; reputation loss resulting in decreased investor confidence, increased challenges in developing and maintaining community relations and an impediment to our overall ability to advance our projects; risks normally associated with the conduct of joint ventures; an event of default under our convertible notes may significantly reduce our liquidity and adversely affect our business; failure to meet covenants under our senior secured revolving credit facility; information systems security threats; conflicts of interest that could arise from certain of our directors’ and officers’ involvement with other natural resource companies; and other risks related to our common shares. This list is not exhaustive of the factors that may affect any of our forward-looking statements. Our forward-looking statements are based on what management considers to be reasonable assumptions, beliefs, expectations and opinions based on information currently available to it. We cannot assure you that actual events, performance or results will be consistent with these forward-looking statements, and management’s assumptions may prove to be incorrect.
Assumptions have been made regarding, among other things, our ability to carry on our exploration and development activities, our ability to meet our obligations under our property agreements, the timing and results of drilling programs, the discovery of Mineral Resources and Mineral Reserves on our mineral properties, the timely receipt of required approvals and permits, including those approvals and permits required for successful project permitting, construction and operation of our projects, the price of the minerals we produce, the costs of operating and exploration expenditures, our ability to operate in a safe, efficient and effective manner, our ability to obtain financing as and when required and on reasonable terms, our ability to continue operating the Marigold mine, the Seabee Gold Operation and Puna Operations, dilution and mining recovery assumptions, assumptions regarding stockpiles, the success of mining, processing, exploration and development activities, the accuracy of geological, mining and metallurgical estimates, no significant unanticipated operational or technical difficulties, maintaining good relations with the communities surrounding the Marigold mine, the Seabee Gold Operation and Puna Operations, no significant events or changes relating to regulatory, environmental, health and safety matters, certain tax matters and no significant and continuing adverse changes in general economic conditions or conditions in the financial markets (including commodity prices, foreign exchange rates and inflation rates). You are cautioned that the foregoing list is not exhaustive of all factors and assumptions which may have been used. Our forward-looking statements reflect current expectations regarding future events and operating performance and speak only as of the date hereof and we do not assume any obligation to update forward-looking statements if circumstances or management’s beliefs, expectations or opinions should change other than as required by applicable law. For the reasons set forth above, you should not place undue reliance on forward-looking statements.
CURRENCY AND EXCHANGE RATE INFORMATION
All currency references in this Annual Information Form are in United States dollars unless otherwise indicated. References to “Canadian dollars” or the use of the symbol “C$” refers to Canadian dollars. References to “Argentine pesos” and “ARS” are to the lawful currency of Argentina.
The following table sets forth, for each period indicated, the high and low exchange rates for Canadian dollars expressed in United States dollars, the average of such exchange rates during such period, and the exchange rate at the end of such period. These rates are based on the indicative rate of exchange reported by the Bank of Canada.
| Fiscal Year Ended December 31, | ||||||
| 2016 | 2017 | 2018 | ||||
| Rate at the end of period |
$0.7448 | $0.7971 | $0.7330 | |||
| Average rate during period |
$0.7555 | $0.7708 | $0.7721 | |||
| Highest rate during period |
$0.7972 | $0.8245 | $0.8138 | |||
| Lowest rate during period |
$0.6854 | $0.7276 | $0.7330 | |||
- 3 -
On March 8, 2019, the exchange rate reported by the Bank of Canada was C$1.00 per US$0.74505. As of the same date, one Argentine peso equaled US$0.02428.
SCIENTIFIC AND TECHNICAL INFORMATION
Unless otherwise indicated, scientific and technical information in this Annual Information Form relating to our mineral properties, other than the Marigold mine and the Seabee Gold Operation, has been reviewed and approved by Bruce Butcher, P.Eng., our Director, Mine Planning, and F. Carl Edmunds, P.Geo., our Vice President, Exploration, each of whom is a qualified person under National Instrument 43-101 – Standards of Disclosure for Mineral Projects (“NI 43-101”). Unless otherwise indicated, scientific and technical information in this Annual Information Form relating to our Marigold mine has been reviewed and approved by James N. Carver, SME Registered Member, our Chief Geologist at the Marigold mine, and James Frost, P.E., our Technical Services Superintendent at the Marigold mine, each of whom is a qualified person under NI 43-101. Unless otherwise indicated, scientific and technical information in this Annual Information Form relating to our Seabee Gold Operation has been reviewed and approved by Cameron Chapman, P.Eng., our General Manager at the Seabee Gold Operation, Kevin Fitzpatrick, P.Eng., our Engineering Supervisor at the Seabee Gold Operation, and Jeffrey Kulas, P. Geo., our Manager Geology, Mining Operations at the Seabee Gold Operation, each of whom is a qualified person under NI 43-101. See “Interests of Experts”.
A “qualified person” for the purposes of NI 43-101 means an individual who is an engineer or geoscientist, holding the required accreditation, with at least five years of experience in mineral exploration, mine development or operation or mineral project assessment, or any combination of these, has experience relevant to the subject matter of the mineral project, and is a member in good standing of a professional association.
CAUTIONARY NOTICE REGARDING MINERAL RESERVES AND MINERAL RESOURCES ESTIMATES
The disclosure included in this Annual Information Form uses Mineral Reserves and Mineral Resources classification terms that comply with reporting standards in Canada and the Mineral Reserves and Mineral Resources estimates are made in accordance with the Canadian Institute of Mining, Metallurgy and Petroleum (“CIM”) Definition Standards on Mineral Reserves and Mineral Resources (the “CIM Standards”) adopted by the CIM Council on May 10, 2014, and NI 43-101. NI 43-101 is a rule developed by the Canadian Securities Administrators (“CSA”) that establishes standards for all public disclosure an issuer makes of scientific and technical information concerning mineral projects. The following definitions are reproduced from the CIM Standards:
A Mineral Resource is a concentration or occurrence of solid material of economic interest in or on the Earth’s crust in such form, grade or quality and quantity that there are reasonable prospects for eventual economic extraction. The location, quantity, grade or quality, continuity and other geological characteristics of a Mineral Resource are known, estimated or interpreted from specific geological evidence and knowledge, including sampling. Mineral Resources are sub-divided, in order of increasing geological confidence, into Inferred, Indicated and Measured categories.
An Inferred Mineral Resource is that part of a Mineral Resource for which quantity and grade or quality are estimated on the basis of limited geological evidence and sampling. Geological evidence is sufficient to imply but not verify geological and grade or quality continuity. An Inferred Mineral Resource has a lower level of confidence than that applying to an Indicated Mineral Resource and must not be converted to a Mineral Reserve. It is reasonably expected that the majority of Inferred Mineral Resources could be upgraded to Indicated Mineral Resources with continued exploration.
An Indicated Mineral Resource is that part of a Mineral Resource for which quantity, grade or quality, densities, shape and physical characteristics are estimated with sufficient confidence to allow the application of Modifying Factors in sufficient detail to support mine planning and evaluation of the economic viability of the deposit. Geological evidence is derived from adequately detailed and reliable exploration, sampling and testing and is sufficient to assume geological and grade or quality continuity between points of observation.
- 4 -
An Indicated Mineral Resource has a lower level of confidence than that applying to a Measured Mineral Resource and may only be converted to a Probable Mineral Reserve. “Modifying Factors” are considerations used to convert Mineral Resources to Mineral Reserves. These include, but are not restricted to, mining, processing, metallurgical, infrastructure, economic, marketing, legal, environmental, social and governmental factors.
A Measured Mineral Resource is that part of a Mineral Resource for which quantity, grade or quality, densities, shape, and physical characteristics are estimated with confidence sufficient to allow the application of Modifying Factors to support detailed mine planning and final evaluation of the economic viability of the deposit. Geological evidence is derived from detailed and reliable exploration, sampling and testing and is sufficient to confirm geological and grade or quality continuity between points of observation. A Measured Mineral Resource has a higher level of confidence than that applying to either an Indicated Mineral Resource or an Inferred Mineral Resource. It may be converted to a Proven Mineral Reserve or to a Probable Mineral Reserve.
A Mineral Reserve is the economically mineable part of a Measured and/or Indicated Mineral Resource. It includes diluting materials and allowances for losses, which may occur when the material is mined or extracted and is defined by studies at Pre-Feasibility or Feasibility level as appropriate that include application of Modifying Factors. Such studies demonstrate that, at the time of reporting, extraction could reasonably be justified. The reference point at which Mineral Reserves are defined, usually the point where the ore is delivered to the processing plant, must be stated. It is important that, in all situations where the reference point is different, such as for a saleable product, a clarifying statement is included to ensure that the reader is fully informed as to what is being reported. Mineral Reserves are sub-divided in order of increasing confidence into Probable Mineral Reserves and Proven Mineral Reserves. The public disclosure of a Mineral Reserve must be demonstrated by a Pre-Feasibility Study or Feasibility Study.
A Probable Mineral Reserve is the economically mineable part of an Indicated, and in some circumstances, a Measured Mineral Resource. The confidence in the Modifying Factors applying to a Probable Mineral Reserve is lower than that applying to a Proven Mineral Reserve.
A Proven Mineral Reserve is the economically mineable part of a Measured Mineral Resource. A Proven Mineral Reserve implies a high degree of confidence in the Modifying Factors.
Unless otherwise indicated, all Mineral Reserves and Mineral Resources estimates included in this Annual Information Form have been prepared in accordance with NI 43-101. These standards differ significantly from the requirements of the U.S. Securities and Exchange Commission (“SEC”) set out in SEC Industry Guide 7. Consequently, Mineral Reserves and Mineral Resources information included in this Annual Information Form is not comparable to similar information that would generally be disclosed by domestic U.S. reporting companies subject to the reporting and disclosure requirements of the SEC.
In particular, SEC Industry Guide 7 applies different standards in order to classify mineralization as a reserve. As a result, the definitions of “Proven Mineral Reserves” and “Probable Mineral Reserves” used in NI 43-101 differ from the definitions in SEC Industry Guide 7. Under SEC standards, mineralization may not be classified as a “reserve” unless the determination has been made that the mineralization could be economically and legally produced or extracted at the time the reserve determination is made. Among other things, all necessary permits would be required to be in hand or issuance imminent in order to classify mineralized material as reserves under the SEC standards. Accordingly, Mineral Reserves estimates included in this Annual Information Form may not qualify as “reserves” under SEC standards.
In addition, this Annual Information Form uses the terms “Mineral Resources,” “Measured Mineral Resources,” “Indicated Mineral Resources” and “Inferred Mineral Resources” to comply with the reporting standards in Canada. SEC Industry Guide 7 does not recognize Mineral Resources and U.S. companies are generally not permitted to disclose resources in documents they file with the SEC. Furthermore, disclosure of “contained ounces” is permitted disclosure under Canadian regulations; however, the SEC only permits issuers to report mineralization that does not constitute “reserves” by SEC standards as in place tonnage and grade without reference to unit measures. Investors are specifically cautioned not to assume that all or any part of the mineral
- 5 -
deposits in these categories will ever be converted into SEC-defined mineral reserves. Further, “Inferred Mineral Resources” have a great amount of uncertainty as to their existence and as to whether they can be mined legally or economically. Therefore, investors are also cautioned not to assume that all or any part of an Inferred Mineral Resource exists. In accordance with Canadian rules, estimates of “Inferred Mineral Resources” cannot form the basis of feasibility or pre-feasibility studies. It cannot be assumed that all or any part of “Mineral Resources,” “Measured Mineral Resources,” “Indicated Mineral Resources” or “Inferred Mineral Resources” will ever be upgraded to a higher category. Investors are cautioned not to assume that any part of the “Mineral Resources,” “Measured Mineral Resources,” “Indicated Mineral Resources” or “Inferred Mineral Resources” reported in this Annual Information Form is economically or legally mineable. In addition, the definitions of “Proven Mineral Reserves” and “Probable Mineral Reserves” under reporting standards in Canada differ in certain respects from the standards of the SEC. For the above reasons, information included in this Annual Information Form that describes our Mineral Reserves and Mineral Resources estimates is not comparable to similar information made public by U.S. companies subject to the reporting and disclosure requirements of the SEC.
NOTICE REGARDING NON-GAAP MEASURES
This Annual Information Form includes certain terms or performance measures commonly used in the mining industry that are not defined under International Financial Reporting Standards as issued by the International Accounting Standards Board (“IASB”) and incorporated in the Handbook of the Canadian Institute of Chartered Accountants (“IFRS”), including cash costs and all-in sustaining costs per payable ounce of precious metals sold, realized metal prices, adjusted attributable income (loss) before tax, adjusted attributable net income (loss), adjusted basic attributable income (loss) per share, operating income and working capital. Non-GAAP financial measures do not have any standardized meaning prescribed under IFRS and, therefore, they may not be comparable to similar measures reported by other companies. We believe that, in addition to conventional measures prepared in accordance with IFRS, certain investors use this information to evaluate our performance. The data presented is intended to provide additional information and should not be considered in isolation or as a substitute for measures of performance prepared in accordance with IFRS. These non-GAAP measures should be read in conjunction with our financial statements. See “Non-GAAP Financial Measures” in our management’s discussion and analysis of the financial position and results of operations for the year ended December 31, 2018 for a more detailed discussion of how we calculate such measures and for a reconciliation of such measures to IFRS terms.
CORPORATE STRUCTURE
NAME, ADDRESS AND INCORPORATION
We were incorporated as a company in British Columbia, Canada, on December 11, 1946 under the name “Silver Standard Mines, Limited (NPL)” and changed our name to “Silver Standard Mines Limited” on July 18, 1979. We changed our name to “Consolidated Silver Standard Mines Limited” and consolidated our common shares on a 1-for-5 basis on August 9, 1984. We changed our name to “Silver Standard Resources Inc.” on April 9, 1990. On May 12, 2005, our shareholders adopted new articles as required by the new British Columbia Business Corporations Act (“BCBCA”), under which we are incorporated, and authorized an increase in our authorized capital from 100,000,000 common shares without par value to an unlimited number of common shares without par value. On May 4, 2017, our shareholders approved a name change to “SSR Mining Inc.”, and the name change became effective on August 1, 2017. All share data in this Annual Information Form refers to consolidated shares/data, unless otherwise indicated.
Our head office and registered and records office is located at Suite 800 – 1055 Dunsmuir Street, Vancouver, British Columbia, V7X 1G4.
- 6 -
INTERCORPORATE RELATIONSHIPS
The following is a diagram of the intercorporate relationships among us and certain of our subsidiaries that hold operating mining properties, including their respective jurisdiction of incorporation. Except as indicated in the diagram below, all of our material subsidiaries noted below are wholly-owned.
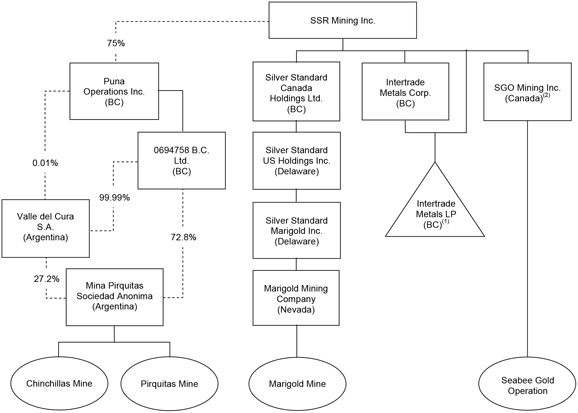
Notes:
| (1) | Intertrade Metals Corp. is the General Partner and SSR Mining is the Limited Partner. |
| (2) | Formerly known as Claude Resources Inc. |
GENERAL DEVELOPMENT OF THE BUSINESS
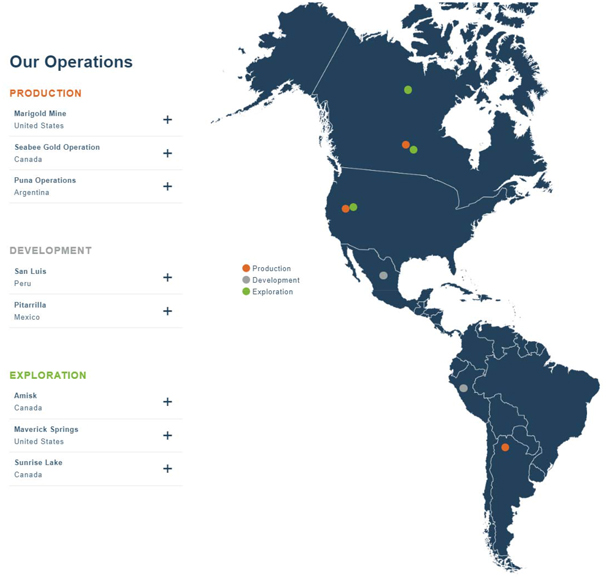
We are a Canadian-based resource company focused on the operation, acquisition, exploration and development of precious metal resource properties located in the Americas. We have three producing mines and a portfolio of precious metal dominant projects located throughout the Americas. Our focus is on safe, profitable gold and silver production from our Marigold mine in Nevada, U.S., our Seabee Gold Operation in Saskatchewan, Canada, and our 75%-owned Puna Operations in Jujuy, Argentina.
2018 DEVELOPMENTS
Change to Board of Directors
On January 1, 2018, we appointed Ms. Elizabeth A. Wademan and Mr. Simon A. Fish to our Board of Directors with the objective to strengthen the Board’s expertise in the areas of international capital markets and legal and corporate governance. See “Directors and Executive Officers – Directors” for additional information on each of Mr. Fish’s and Ms. Wademan’s prior experience.
- 7 -
Change to Chief Operating Officer
On May 3, 2018, we announced the appointment of Mr. Kevin O’Kane as Senior Vice President and Chief Operating Officer effective June 4, 2018, replacing Mr. Alan Pangbourne, who retired at the end of May 2018. See “Directors and Executive Officers – Directors” for additional information on Mr. O’Kane’s prior experience.
Updated Life of Mine Plan for the Marigold Mine
On June 18, 2018, we released an updated life of mine plan for the Marigold mine in Nevada, U.S., which outlined an anticipated mine-life of over ten-years based on Mineral Reserves as at December 31, 2017 and an after-tax net present value of $552 million. We filed a technical report titled “NI 43-101 Technical Report on the Marigold Mine, Humboldt County, Nevada USA” dated July 31, 2018 with an effective date of December 31, 2017 (the “Marigold Technical Report”) in support of the updated life of mine plan. See “Mineral Properties – Marigold Mine” for further details.
Sale of Pretium Shares
As of June 30, 2018, we sold our remaining position of 9.0 million common shares of Pretium Resources Inc. (“Pretium”) for pre-tax cash proceeds of approximately $63.4 million, and no longer hold any Pretium shares.
Declaration of Commercial Production at the Chinchillas Mine
On December 1, 2018, we declared commercial production at Puna Operations’ Chinchillas mine. Development of the mine, located approximately 45 kilometers from the Pirquitas plant, commenced in early 2018 and extends the life of the Pirquitas plant through mining of ore at Chinchillas, transporting the ore to Pirquitas and processing it through the existing Pirquitas plant.
Strategic Investment in SilverCrest Metals
On December 10, 2018, we completed a transaction with SilverCrest Metals Inc. (“SilverCrest”) to purchase, by way of private placement, a 9.7% ownership interest representing, 8,220,645 common shares of SilverCrest at a price of C$3.73 per common share for total consideration of C$30.7 million. SilverCrest owns the Las Chispas project, a high-grade development project, in Mexico.
2017 DEVELOPMENTS
Option of Candelaria Property
In January 2017, we agreed to option our Candelaria property in Nevada, U.S. to Silver One Resources Inc. (“Silver One”). To earn a 100% interest in the Candelaria property, Silver One has issued to us a total of $2.0 million worth of Silver One shares and is required to issue an additional annual installment of $1.0 million worth of shares of Silver One and assume the reclamation bond on the property immediately prior to its exercise of the option.
Change to Chairman of the Board
On March 27, 2017, we announced that, after serving over ten years on our Board of Directors, Mr. Peter W. Tomsett decided to retire from his position of Chairman at the close of our 2017 annual and special meeting of shareholders. The Board of Directors appointed Mr. A. E. Michael Anglin to assume the role of Chairman, effective as of May 4, 2017. Mr. Anglin has served as a member of our Board since 2008. See “Directors and Executive Officers – Directors” for additional information on Mr. Anglin’s experience.
- 8 -
Resolution of Export Duty Claim in Argentina
We entered into a fiscal stability agreement with the Federal Government of Argentina in 1998 for production from the Pirquitas mine. In December 2007, the National Customs Authority of Argentina (Dirección Nacional de Aduanas) (“Customs”) levied an export duty of approximately 10% from concentrate for projects with fiscal stability agreements pre-dating 2002 and Customs asserted that the Pirquitas mine was subject to this duty. We had previously challenged the legality of the export duty applied to silver concentrate.
On March 31, 2017, we entered into the tax moratorium system in Argentina to resolve this long-standing dispute. Under the conditions of the moratorium, which converts the export duty liability to Argentine pesos, we have agreed to pay approximately ARS 1 billion with 5% down payment initially and the balance in installments over 60 months. Outstanding ARS amounts are subject to interest at a minimum rate of 1.5% per month. Upon completion of these payments, all liabilities related to historical export duties and interest will be extinguished. We are no longer challenging the legality of the application of the export duty other than with respect to our right for reimbursement of the $6.6 million in export duties that we paid.
Sale of Berenguela Project
On May 2, 2017, we completed the sale of our Berenguela project in Peru to Valor Resources Limited (“VAL”), an Australian Securities Exchange listed company, for aggregate consideration of: cash payments of $12.0 million over five years; a 9.9% equity stake in VAL, with a free carry interest until VAL completes, in aggregate, a financing of $8.0 million; and a 1% net smelter returns (“NSR”) royalty on all metal production from the project.
Formation of Puna Operations Joint Venture
On May 31, 2017, we completed a joint venture with Golden Arrow Resources Corporation (“Golden Arrow”) for the development of the Chinchillas project in Jujuy, Argentina. The joint venture, named Puna Operations Inc., is comprised of the Pirquitas and Chinchillas properties of which we own 75% and are the operator. See “Mineral Properties – Puna Operations” for further details.
Amendment to Credit Facility
During the second quarter of 2017, we extended the maturity of our $75.0 million senior secured revolving credit facility (the “Credit Facility”) to June 8, 2020, and concurrently reduced applicable margins, increased covenant flexibility and added a $25.0 million accordion feature. Amounts that are borrowed under the Credit Facility will incur variable interest at London Interbank Offered Rate plus an applicable margin ranging from 2.25% to 3.75% determined based on our net leverage ratio. All debts, liabilities and obligations under the Credit Facility are guaranteed by certain of our material subsidiaries and secured by certain of our assets, certain of our material subsidiaries, and pledges of the securities of certain of our material subsidiaries. The Credit Facility may be used for reclamation bonding, working capital and other general corporate purposes.
Change of Name
Effective August 1, 2017, we changed our name to SSR Mining Inc. from Silver Standard Resources Inc. to better reflect our business focus as a precious metals producer.
Seabee Gold Operation PEA Supports Mine Expansion Plan
On September 7, 2017, we reported the results of a preliminary economic assessment (“PEA”) for the Seabee Gold Operation, which provided a mine expansion scenario. The PEA contemplated near-term production growth, extended production to 2024, expanded operating margins and improved processing plant performance while requiring low capital investment. We subsequently filed the technical report entitled “NI 43-101 Technical Report for the Seabee Gold Operation, Saskatchewan, Canada” dated October 20,
- 9 -
2017 (the “Seabee Gold Operation Technical Report”) in support of the PEA. See “Mineral Properties – Seabee Gold Operation” for further details.
2016 DEVELOPMENTS
Acquisition of Claude Resources and Change to Board of Directors
On May 31, 2016, we completed the acquisition of 100% of the issued and outstanding common shares of Claude Resources Inc. (“Claude Resources”), the owner and operator of the Seabee Gold Operation, for total consideration of approximately 37.4 million SSR Mining common shares and cash consideration of $0.2 million. The acquisition was carried out pursuant to the terms and conditions contained in an arrangement agreement dated March 7, 2016, as amended, between SSR Mining and Claude Resources. We filed a Business Acquisition Report on Form 51-102F4 in respect of this acquisition on June 24, 2016.
In connection with the acquisition, Mr. Brian R. Booth, the former Chairman of the Board of Directors of Claude Resources, was appointed to our Board of Directors on May 31, 2016. See “Directors and Executive Officers – Directors” for additional information on Mr. Booth’s prior experience.
Favorable Resolution of Tax Dispute with CRA
In 2016, the tax dispute with the Canada Revenue Agency (“CRA”) was settled in our favour. On August 24, 2016, the CRA issued a new notice of reassessment for each of our 2010 and 2011 taxation years reversing the Notice of Reassessment issued to us in January 2015 and, on September 2, 2016, refunded $18.2 million, being the deposit we paid to the CRA to appeal, plus accrued interest from the date of payment of the deposit. Following the receipt of the deposit, with accrued interest, the Department of Justice filed a notice of discontinuance of our appeal with the Tax Court of Canada.
Option to Explore Fisher Project
On October 6, 2016, we announced the signing of an option agreement with Eagle Plains Resources Ltd. (“Eagle Plains”) to acquire up to an 80% interest in the Fisher project, located in Saskatchewan, Canada, adjacent to our Seabee Gold Operation. The project consists of approximately 34,175 hectares and doubles our prospective land position at the Seabee Gold Operation. See “Mineral Properties – Projects – Fisher Project, Saskatchewan, Canada” for further details.
Sale of Parral Properties
On October 31, 2016, we completed the sale of our Parral properties in Mexico, including the Veta Colorada, La Palmilla and San Patricio properties, to Endeavour Silver Corp. (“Endeavour Silver”) for aggregate consideration of: 1,198,083 Endeavour Silver shares; the right to receive $0.2 million worth of Endeavour Silver shares for each 1 million silver ounces included in an estimate of Measured and Indicated Mineral Resources prepared by Endeavour Silver in respect of the San Patricio and La Palmilla properties; and a 1% NSR royalty on all mineral products from the San Patricio and La Palmilla properties.
Sale of Diablillos and M-18 Projects
On November 1, 2016, we completed the sale of our Diablillos and M-18 projects located in Argentina to Huayra Minerals Corporation (“Huayra”) for aggregate consideration of: cash payments of approximately $1.15 million over the first two years and $13.0 million over the following three to five years; a 19.9% equity stake in Huayra, with a free carry interest until the completion of a financing of $5.0 million or more; and a 1% NSR royalty on production from each of the projects. On April 24, 2017, Huayra completed its reverse take-over (“RTO”) of AbraPlata Resource Corp. (“AbraPlata”), a TSX Venture Exchange listed company. As a result of the RTO, our shares in Huayra were exchanged on a one-for-one basis for common shares in AbraPlata resulting in SSR Mining directly holding 19.9% of the total issued and outstanding common shares of AbraPlata. Effective as of the closing of the RTO, Mr. W. John DeCooman, our Senior Vice President, Business Development and Strategy, joined the Board of Directors of AbraPlata.
- 10 -
DESCRIPTION OF THE BUSINESS
GENERAL
SSR Mining has an experienced management team of mine-builders and operators with proven capabilities. We are engaged in the operation, acquisition, exploration and development of precious metal mineral properties located in the Americas. We are committed to delivering safe production through relentless emphasis on Operational Excellence. We are also focused on growing production and Mineral Reserves through the exploration and acquisition of assets for accretive growth, while maintaining financial strength.
In addition to the Marigold mine, the Seabee Gold Operation and the 75%-owned Puna Operations, we own two feasibility stage projects: the Pitarrilla project, a silver-lead-zinc project in Mexico; and the San Luis project, a high-grade gold-silver project in Peru. We also hold interests in several other properties in North and South America at various stages of exploration and development.
- 11 -
PRINCIPAL PRODUCTS
Our principal products are gold doré, bullion and metal concentrates. All of our gold doré and bullion is produced at the Marigold mine and the Seabee Gold Operation and sold primarily to bullion banks. Puna Operations produces silver, zinc and lead concentrates, which are sold to smelters or traders for further refining. During 2018, one concentrate customer accounted for 51% (2017 – 7%) of our total concentrate revenue.
Our revenue by product category for the financial years ended December 31, 2018 and December 31, 2017 was as follows:
|
Product Revenue
|
2018 | 2017 | ||
|
Gold
|
87% | 80% | ||
|
Silver
|
12% | 20% | ||
|
Zinc
|
1% | — | ||
|
Lead
|
— | — |
The market price of gold, as mined at our Marigold mine and Seabee Gold Operation, and silver, lead and zinc, as mined at our Puna Operations are key drivers to our profitability. The PM fix average gold price of $1,268 per ounce in 2018 was slightly higher than the 2017 average of $1,257 per ounce. The 2018 average silver fix of $15.71 per ounce was considerably lower than the 2017 average of $17.05 per ounce. The average price of lead and zinc for 2018 of $2,241 and $2,879 per tonne, respectively, were similar to the 2017 averages of $2,327 and $2,894 per tonne, respectively. The prices of lead and zinc had minimal impact on our 2018 financial results but will have a more significant impact in 2019 with the Chinchillas project reaching commercial production.
SPECIALIZED SKILLS AND KNOWLEDGE
Various aspects of our business require specialized skills and knowledge, including in areas of geology, engineering, drilling, metallurgy, permitting, logistics, planning and implementation of exploration programs as well as legal compliance, finance, accounting, environmental and community relations. We face competition for qualified personnel with these specialized skills and knowledge, which may increase our costs of operations or result in delays.
COMPETITIVE CONDITIONS
The precious and base metals mineral exploration and mining business is competitive. Competition is primarily for: (a) mineral properties that can be developed and produced economically; (b) technical experts that can find, develop and mine such mineral properties; (c) labour to operate the mineral properties; and (d) capital to finance exploration, development and operations.
We compete with other mining and exploration companies in the acquisition of mineral properties and in connection with the recruitment and retention of qualified employees. There is significant competition for mineral properties. Many larger competitors conduct business globally and thus have greater financial and technical resources available to them. If we are unsuccessful in acquiring additional mineral properties or qualified personnel, we may not be able to replace Mineral Reserves, maintain production or grow.
- 12 -
OPERATIONS
Employees and Contractors
As at December 31, 2018, we employed a total of 1,359 full-time employees and 271 contract employees. The table below sets out our employees at each of the following locations:
|
Location |
Number of Employees | |||
|
Full-time
|
Contract
| |||
|
Vancouver, Canada
|
42 | 2 | ||
|
Saskatchewan, Canada
|
314 | 4 | ||
|
U.S.
|
400 | 20 | ||
|
Argentina
|
583 | 239 | ||
|
Mexico
|
13 | 4 | ||
|
Peru
|
7 | 2 | ||
As at December 31, 2018, of the 583 full-time employees in Argentina, 351 were represented by a union.
Environmental Protection Requirements
We have certain reclamation obligations at our mineral properties, including the Marigold mine, the Seabee Gold Operation and Puna Operations. At the Marigold mine, we engage in concurrent reclamation practices and provide bonds for all permitted features, as part of the State of Nevada permitting process. Current bonding amounts are based on third party cost estimates to reclaim all permitted features at the Marigold mine, with the exception of a few features permitted as permanent, post-mining features. The Bureau of Land Management (“BLM”) and the State of Nevada both review and approve the bond estimate, and the BLM holds the financial instruments providing the bond backing. As at December 31, 2018, the Marigold mine had reclamation bond requirements totaling approximately $46.5 million.
At the Seabee Gold Operation, we also have an approved closure plan and financial assurance held by the Province of Saskatchewan. The closure plan addresses all final reclamation requirements as well as the longer term post-reclamation monitoring and maintenance phase. As required by our environmental permits, the closure plan is periodically updated. As at December 31, 2018, the Seabee Gold Operation had reclamation bond requirements totaling approximately $5.3 million.
At Puna Operations, the present value of the current closure and reclamation cost estimate for the Pirquitas property, to be spent over a number of years, using a discount rate of 9.9%, is approximately $24.0 million, excluding any salvage value, on a 100% basis. The undiscounted present value of our current closure and reclamation cost estimate for the Chinchillas property at the end of the life of mine is approximately $2.2 million, on a 100% basis.
We also have certain reclamation obligations at the Duthie property and the Silver Standard mine property, both located in British Columbia, Canada. In 2018, our reclamation work program at these properties was carried out at a cost of approximately $0.1 million.
Foreign Operations
Any changes in regulations or shifts in political attitudes in the foreign jurisdictions in which we operate, including Argentina, Mexico, Peru and the United States, are beyond our control and may adversely affect our business. Future development and operations may be affected in varying degrees by certain economic, political and other risks and uncertainties including, but not limited to: royalties and tax increases or claims by governmental bodies; restrictions on production; expropriation or nationalization; employee profit-sharing requirements; foreign exchange controls; restrictions on repatriation of profits; import and export regulations; cancellation or renegotiation of contracts; changing fiscal regimes and
- 13 -
uncertain regulatory environments; fluctuations in currency exchange rates; high rates of inflation; changes in royalty and tax regimes, including the elimination of tax exemptions; underdeveloped industrial and economic infrastructure; unenforceability of contractual rights and judgments; changes to environmental legislation; land claims of local people; and mine safety. We cannot accurately predict the effect of these factors. See “Risk Factors” for further details.
CORPORATE SOCIAL RESPONSIBILITY
For us, being a responsible corporate citizen means protecting the natural environment associated with our business activities, providing a safe workplace and work processes for our employees and contractors, and investing in the communities where we operate so that we can enhance the lives of those who work and live there beyond the life of such operations. We take a long-term view of our corporate responsibility, which is reflected in the policies that guide our business decisions, and in our corporate culture that fosters safe and ethical behavior across all levels of SSR Mining.
Safety Policy
Our safety policy (the “Safety Policy”) defines the organization’s safety values and is designed to guide us in advancing each of those values, to outline the values and standards for our health and safety systems; and to ensure that we develop and implement effective management systems to identify, minimize and manage health and safety risks. It is also used to promote and enhance employee commitment and accountability. The Safety Policy is available for viewing on our website at www.ssrmining.com.
Health and Safety
We reflect our commitment to the health and safety of our employees by creating and maintaining a safe working environment, equipment, work processes, effective safety and health management systems, and by complying with all applicable health and safety laws, rules and regulations. We acknowledge that there are inherent safety risks associated with our business and, through proactive risk management, continuously strive to minimize and control these risks.
Our safety vision is “Safe for Life”, and our ultimate goal is to deliver safe production every day. We seek to ensure our employees are safe both for their families and at work. Our safety framework puts emphasis on effective risk-centered management systems, positive and effective work cultures and proactive leadership to drive culture enhancement. We emphasize balancing the human and technical aspects of safety: blending leadership behaviors with traditional management activities to create a safe, productive culture. We ensure that our workers understand their individual contributions to safe production. In this way, our employees maintain safety awareness, recognizing hazards and analyzing risk in their daily activities. Each employee has established commitments related to their personal and work and off-the-job safety and health behaviors, and each employee is empowered to take the necessary actions to minimize risks. The technical aspects of safety are addressed by identifying critical tasks, assessing related risks, establishing systems, policies and procedures, providing appropriate training and verifying competencies. Performance measurement and accountability provides feedback and maintains focus on continuous improvement.
In 2018, we made a major commitment to improve leadership competencies among our line managers through the implementation of a customized leadership development system. In addition to defining critical competencies that impact safety and operations, a development program developed in 2018 will be executed in 2019 followed by additional site-specific leadership development activities designed to establish long-term improvement opportunities.
Safety and Sustainability Committee
Our Board of Directors has established a Safety and Sustainability Committee that, as part of its mandate, is responsible for reviewing our health, safety, security, environmental and community relations policies and practices and monitoring our performance in these areas. The Safety and Sustainability Committee meets and reports to the Board of Directors on a quarterly basis. Our Safety and Sustainability Committee charter is available for viewing on our website at www.ssrmining.com.
- 14 -
Environmental Policy
Under our environmental policy (the “Environmental Policy”), we are committed to undertaking a policy of sustainable resource development, which embodies the protection of human health and the natural environment, over the full life cycle of mining. The Environmental Policy is available for viewing on our website at www.ssrmining.com. Our Vice President, Environment and Community Relations oversees environmental management and reports directly to the Chief Operating Officer. The Chief Operating Officer reports directly to the Chief Executive Officer. Executive compensation and remuneration is based on the achievement of our corporate objectives, which include health, safety and environmental goals.
Environment and Sustainability
Our activities are subject to extensive laws and regulations governing the protection of the environment and natural resources. These laws address, among other things, emissions into the air, discharges into water, management of waste, management of hazardous substances, protection of natural resources, antiquities and endangered species and reclamation of lands disturbed by mining operations. We are required to obtain governmental permits and, in some instances, provide bonding requirements under federal, state, or provincial air, water quality, and mine reclamation rules and permits. Violations of environmental laws are subject to civil sanctions and, in some cases, criminal sanctions, including the suspension or revocation of permits. The failure to comply with environmental laws and regulations could result in temporary or permanent closure of our mining operations, project development delays, material financial impacts or other material impacts to our projects and activities, fines, penalties, lawsuits by the government or private parties, revocability of property or material capital expenditures. Additionally, environmental laws in the countries in which we operate require that we periodically perform environmental impact studies and updates at our mines. These studies could reveal environmental impacts that would require us to make significant capital outlays or cause material changes or delays in our intended activities. See “Risk Factors”.
We comply with regulatory requirements and diligently apply appropriate methodologies to protect the environment throughout our exploration, development, mining, processing and closure activities. Our environmental obligations include, but are not limited to, obtaining and maintaining all environmental permits and approvals required for the conduct of our operations, the proper handling, storage and disposal of regulated materials and the timely and accurate submission of required reports to the appropriate government agencies.
In 2006, the Marigold mine became the first operating gold mine in the world certified as fully compliant with the International Cyanide Management Code. We maintained such distinction in 2018, with the Marigold mine’s fourth successful recertification.
Since reclamation commenced at our Duthie property, it has progressed from an inactive mine to an award-winning example of our environmental stewardship. We received a citation from a joint committee of the Mining Association of British Columbia and the B.C. Ministry of Energy and Mines for outstanding reclamation achievement at this site.
Community Engagement
Our community relations program is based on open and continuous communication with the members of communities located in our areas of operation. We take a shared-value approach to local development activities to promote sustainable long-term economic and social benefits. In addition, we strive to ensure that local stakeholders have an opportunity for input and dialogue. Projects aimed at assisting and advancing our communities include training and employment, development of infrastructure and support for education and medical services, among others. At all times, we work to be a partner in the long-term sustainability of the communities in which we operate.
- 15 -
Community support and engagement is well-established at our Marigold mine, and several of our employees are key participants in local development efforts. Our employees work closely with the University of Nevada, Reno in creating a graduate program in mining, in addition to providing internships for students and ongoing support to the university. We also support local high schools through scholarships, contribution of equipment and supplies and employee volunteer efforts. In addition, our Marigold emergency response team actively supports the emergency preparedness and wellness in the local community and has participated in various activities including training drills and delivering flu vaccinations at health fairs.
Our Seabee Gold Operation is located in northern Saskatchewan, within the traditional territories of the Lac La Ronge Indian Band and the Peter Ballantyne Cree First Nation. Since our acquisition of the operation in May 2016, we have identified training, education and employment of northern communities as priorities for community engagement. This has resulted in over 35% of our employees at the Seabee Gold Operation being self-identified as indigenous and over 20% from Northern Saskatchewan communities.
At Puna Operations in Argentina, we support the educational system in the Province of Jujuy through collaboration with local schools. We have assisted with the renovation of six local educational facilities and with a number of information sessions and educational activities held for students throughout the region. We have also collaborated with the Argentina Ministry of Education to create a program allowing members of local communities, including our employees, to complete their secondary education. Furthermore, our medical services and health campaigns provide higher health standards and practices in the remote areas in close proximity to the Pirquitas property. The Pirquitas health center provides emergency services for the local communities and we have initiated a general practitioner outreach program for local towns, commenced a dental care program and held numerous illness prevention workshops. We also built two sports centers in 2016 for the surrounding communities.
In addition, we commenced commercial production at our Chinchillas mine on December 1, 2018. As part of the development of Chinchillas, we have enhanced community engagement targeting education, training and employment opportunities. Over 300 employees have been trained and are working at Chinchillas and nearly 100% of these employees are from the local communities.
At our Pitarrilla project in Mexico, as part of our agreement with the Ejido Casas Blancas, we have funded the construction of Lienzo Charro, a traditional rodeo site, and supported health and cultural activities. As part of our agreement with the Ejido San Francisco De Asís, we have funded infrastructure and cultural activities.
Over the past years at our San Luis project in Peru, we have engaged in and funded several projects aimed at developing the social and economic conditions in local communities. We are currently coordinating with the Social Management Office of the Ministry of Mining and Energy and a local university to advance a training program for local residents, including a mining internship program.
Transparency
In 2018, we embarked on the development of our inaugural sustainability report, which we expect to publish in 2019. This included identification of material topics to be included within the report and stakeholder engagement. The report will be developed using the Global Reporting Initiative framework. In addition, we disclose certain categories of payments we make to domestic and foreign governments at all levels under the Canadian Extractive Sector Transparency Measures Act (“ESTMA”).
Diversity
Our Corporate Governance and Nominating Committee (the “CGN Committee”) has responsibility for recommending to the Board the nominees for election or re-election as directors at the annual meeting of Shareholders. As part of this process, our CGN Committee assesses the skills, expertise, experience and backgrounds of our directors annually, in light of the needs of our board, including the extent to which the current composition of our board reflects a diverse mix of identified competencies. Our CGN Committee charter is available for viewing on our website at www.ssrmining.com.
- 16 -
Our board of directors recognizes that a board composed of men and women with a mix of differing skills, experience, perspectives, age and characteristics leads to a more robust understanding of opportunities, issues and risks, and to stronger decision-making. In 2018, our board of directors adopted a board diversity policy (the “Board Diversity Policy”), which promotes the benefits of, and need for, board diversity. Our Board Diversity Policy is available for viewing on our website at www.ssrmining.com. In addition, each of our code of business conduct and ethics (the “Code of Conduct”) and our Employee Assistance Program promotes and supports diversity and inclusion. Our Code of Conduct is available for viewing on our website at www.ssrmining.com.
We are committed to a merit-based system for board composition within a diverse and inclusive culture, which solicits multiple perspectives and views and is free of conscious or unconscious bias and discrimination. We are also committed to improving the gender representation of our board, and undertake to work diligently towards, among others: achieving a board composition by 2022 in which at least thirty percent (30%) of our directors are women; ensuring that our CGN Committee includes women directors; and, if we maintain an ongoing list of potential director nominees, such list will include women candidates.
Gender diversity was a particular focus for our CGN Committee in the most recent director search process in 2017, along with the need to recruit directors to strengthen our expertise in the areas of the international capital markets, legal and corporate governance. This search resulted in the appointment of each of Ms. Elizabeth A. Wademan and Mr. Simon A. Fish to the Board, effective January 1, 2018. As of such date, two of our nine directors (22%) were women (and two of our nine director nominees (22%) are women). We also recognize the need to promote gender diversity within our executive officer positions, and our five-member executive team includes Ms. Nadine J. Block as Senior Vice President, Human Resources (20% of our executive officers). See “Directors and Executive Officers – Directors” for further information.
Anti-Bribery and Anti-Corruption Policy
Our anti-corruption compliance policy (the “Anti-Corruption Compliance Policy”) outlines the requirements that must be fulfilled by all our employees, officers and directors, as well as by any third party working for or acting on our behalf. These requirements include prohibitions against bribing government officials, making facilitation payments and commercial bribery. The Anti-Corruption Compliance Policy also provides employees with clarity regarding: books and records transparency; giving gifts to government officials; making political or charitable contributions; and third party oversight and due diligence. The Anti-Corruption Compliance Policy is available for viewing on our website at www.ssrmining.com.
- 17 -
MINERAL PROPERTIES
SUMMARY OF MINERAL RESERVES AND MINERAL RESOURCES ESTIMATES
The following table summarizes as at December 31, 2018 our estimated Mineral Reserves and Mineral Resources. All of our projects noted below are wholly-owned except for Puna Operations.
| Location | Tonnes
millions |
Silver
g/t |
Gold
g/t |
Lead
% |
Zinc
% |
SSRM
% Interest |
SSRM Interest
Silver
million oz |
SSRM Interest
Gold
million oz | ||||||||||
| MINERAL RESERVES: | ||||||||||||||||||
| Proven Mineral Reserves | ||||||||||||||||||
| Seabee |
Canada |
0.33 | 9.00 | 100 | 0.09 | |||||||||||||
| Chinchillas |
Argentina |
0.94 | 196 | 0.67 | 0.33 | 75 | 4.5 | |||||||||||
| Total |
4.5 | 0.09 | ||||||||||||||||
| Probable Mineral Reserves | ||||||||||||||||||
| Marigold |
U.S. |
201.50 | 0.47 | 100 | 3.06 | |||||||||||||
| Marigold Leach Pad Inventory | U.S. |
100 | 0.24 | |||||||||||||||
| Seabee |
Canada |
1.73 | 9.24 | 100 | 0.51 | |||||||||||||
| Chinchillas |
Argentina |
7.91 | 161 | 1.35 | 0.47 | 75 | 30.7 | |||||||||||
| Chinchillas Stockpiles | Argentina |
0.60 | 157 | 0.96 | 0.68 | 75 | 2.3 | |||||||||||
| Pirquitas Stockpiles |
Argentina |
0.87 | 64 | 1.43 | 75 | 1.3 | ||||||||||||
| Total |
34.3 | 3.81 | ||||||||||||||||
| Proven and Probable Mineral Reserves | ||||||||||||||||||
| Marigold |
U.S. |
201.50 | 0.47 | 100 | 3.06 | |||||||||||||
| Marigold Leach Pad Inventory |
U.S. |
100 | 0.24 | |||||||||||||||
| Seabee |
Canada |
2.05 | 9.20 | 100 | 0.61 | |||||||||||||
| Chinchillas |
Argentina |
8.85 | 165 | 1.28 | 0.46 | 75 | 35.1 | |||||||||||
| Chinchillas Stockpiles | Argentina |
0.60 | 157 | 0.96 | 0.68 | 75 | 2.3 | |||||||||||
| Pirquitas Stockpiles |
Argentina |
0.87 | 64 | 1.43 | 75 | 1.3 | ||||||||||||
| Total Proven and Probable |
38.7 | 3.91 | ||||||||||||||||
| MINERAL RESOURCES: |
||||||||||||||||||
| Measured Mineral Resources (inclusive of Proven Mineral Reserves) |
||||||||||||||||||
| Seabee |
Canada |
0.45 | 11.76 | 100 | 0.17 | |||||||||||||
| Chinchillas |
Argentina |
2.11 | 130 | 0.52 | 0.39 | 75 | 6.6 | |||||||||||
| Pitarrilla |
Mexico |
12.35 | 90 | 0.70 | 1.22 | 100 | 35.7 | |||||||||||
| Total |
42.4 | 0.17 | ||||||||||||||||
- 18 -
| Location | Tonnes
millions |
Silver
g/t |
Gold
g/t |
Lead
% |
Zinc
% |
SSRM
% Interest |
SSRM Interest
Silver
million oz |
SSRM Interest
Gold
million oz | ||||||||||
| Indicated Mineral Resources (inclusive of Probable Mineral Reserves) | ||||||||||||||||||
| Marigold |
U.S. |
354.50 | 0.47 | 100 | 5.32 | |||||||||||||
| Marigold Leach Pad Inventory |
U.S. |
100 | 0.24 | |||||||||||||||
| Seabee |
Canada |
1.85 | 11.56 | 100 | 0.69 | |||||||||||||
| Chinchillas |
Argentina |
26.01 | 100 | 0.94 | 0.62 | 75 | 62.5 | |||||||||||
| Pirquitas UG |
Argentina |
2.63 | 292 | 4.46 | 75 | 18.6 | ||||||||||||
| Pirquitas Stockpiles |
Argentina |
0.87 | 64 | 1.43 | 75 | 1.3 | ||||||||||||
| Pitarrilla |
Mexico |
147.02 | 97 | 0.32 | 0.87 | 100 | 460.7 | |||||||||||
| Pitarrilla UG |
Mexico |
5.43 | 165 | 0.68 | 1.34 | 100 | 28.8 | |||||||||||
| San Luis |
Peru |
0.48 | 578 | 22.40 | 100 | 9.0 | 0.35 | |||||||||||
| Amisk |
Canada |
30.15 | 6 | 0.85 | 100 | 6.0 | 0.83 | |||||||||||
| Total |
586.9 | 7.42 | ||||||||||||||||
| Measured and Indicated Mineral Resources (inclusive of Mineral Reserves) |
||||||||||||||||||
| Marigold |
U.S. |
354.50 | 0.47 | 100 | 5.32 | |||||||||||||
| Marigold Leach Pad Inventory |
U.S. |
100 | 0.24 | |||||||||||||||
| Seabee |
Canada |
2.29 | 11.60 | 100 | 0.86 | |||||||||||||
| Chinchillas |
Argentina |
28.13 | 102 | 0.91 | 0.60 | 75 | 69.1 | |||||||||||
| Pirquitas UG |
Argentina |
2.63 | 292 | 4.46 | 75 | 18.6 | ||||||||||||
| Pirquitas Stockpiles |
Argentina |
0.87 | 64 | 1.43 | 75 | 1.3 | ||||||||||||
| Pitarrilla |
Mexico |
159.36 | 97 | 0.35 | 0.89 | 100 | 496.5 | |||||||||||
| Pitarrilla UG |
Mexico |
5.43 | 165 | 0.68 | 1.34 | 100 | 28.8 | |||||||||||
| San Luis |
Peru |
0.48 | 578 | 22.40 | 100 | 9.0 | 0.35 | |||||||||||
| Amisk |
Canada |
30.15 | 6 | 0.85 | 100 | 6.0 | 0.83 | |||||||||||
| Total Measured and Indicated |
629.3 | 7.59 | ||||||||||||||||
| Inferred Mineral Resources | ||||||||||||||||||
| Marigold |
U.S. |
33.60 | 0.37 | 100 | 0.40 | |||||||||||||
| Seabee |
Canada |
1.70 | 8.82 | 100 | 0.48 | |||||||||||||
| Chinchillas |
Argentina |
21.29 | 50 | 0.54 | 0.81 | 75 | 25.7 | |||||||||||
| Pirquitas UG |
Argentina |
1.08 | 207 | 7.45 | 75 | 5.4 | ||||||||||||
| Pitarrilla |
Mexico |
8.52 | 77 | 0.18 | 0.58 | 100 | 21.2 | |||||||||||
| Pitarrilla UG |
Mexico |
1.23 | 138 | 0.89 | 1.25 | 100 | 5.5 | |||||||||||
| San Luis |
Peru |
0.02 | 270 | 5.60 | 100 | 0.2 | 0.00 | |||||||||||
| Amisk |
Canada |
28.65 | 4 | 0.64 | 100 | 3.7 | 0.59 | |||||||||||
| Total |
61.6 | 1.48 | ||||||||||||||||
Notes to Mineral Reserves and Mineral Resources Table:
| ● | All estimates set forth in the Mineral Reserves and Mineral Resources table have been prepared in accordance with NI 43-101. The estimates of Mineral Reserves and Mineral Resources for each property other than the Marigold mine, the Seabee Gold Operation and the Amisk project have been reviewed and approved by Bruce Butcher, P.Eng., our Director, Mine Planning, and F. Carl Edmunds, P.Geo., our Vice President, Exploration, each of whom is a qualified person. |
- 19 -
| ● | Mineral Resources are reported inclusive of Mineral Reserves. Mineral Resources that are not Mineral Reserves do not have demonstrated economic viability. Due to the uncertainty that may be attached to Inferred Mineral Resources, it cannot be assumed that all or any part of an Inferred Mineral Resource will be upgraded to an Indicated or Measured Mineral Resource as a result of continued exploration. |
| ● | Mineral Reserves and Mineral Resources estimates of silver ounces for Puna Operations, comprised of Chinchillas and Pirquitas, are reported on a 75% attributable basis. |
| ● | Mineral Reserves and Mineral Resources figures have some rounding applied, and thus totals may not sum exactly. All ounces reported herein represent troy ounces, and “g/t” represents grams per tonne. |
| ● | Metal prices utilized for Mineral Reserves estimates are $1,250 per ounce of gold, $18.00 per ounce of silver, $0.90 per pound of lead and $1.00 per pound of zinc. Metal prices utilized for Mineral Resources estimates are $1,400 per ounce of gold, $20.00 per ounce of silver, $1.10 per pound of lead and $1.30 per pound of zinc, except as noted below for each of the Chinchillas project, the San Luis project and the Amisk project. |
| ● | All technical reports for the properties are available under our profile on the SEDAR website at www.sedar.com or on our website at www.ssrmining.com. |
| ● | “Measured Resources”, “Indicated Resources” and “Inferred Resources” are defined under the heading “Introductory Notes – Cautionary Notice Regarding Mineral Reserves and Mineral Resources Estimates”. Although Measured Resources, Indicated Resources and Inferred Resources are Mineral Resources confidence classification categories defined by CIM and are recognized and required to be disclosed by NI 43-101, the SEC does not recognize them. Disclosure of contained ounces is permitted under NI 43-101; however, the SEC permits mineralization that does not constitute “reserves” by SEC standards to be reported only as in place tonnage and grade. See “Introductory Notes – Cautionary Notice Regarding Mineral Reserves and Mineral Resources Estimates”. |
Marigold Mine
| ● | Except for updates to cost parameters, all other key assumptions, parameters and methods used to estimate Mineral Reserves and Mineral Resources and the data verification procedures followed are set out in the Marigold Technical Report. For additional information about the Marigold mine, readers are encouraged to review the Marigold Technical Report. |
| ● | Mineral Reserves estimate was prepared under the supervision of James Frost, P.E., a qualified person and our Technical Services Superintendent at the Marigold mine, and is reported at a cut-off grade of 0.065 g/t payable gold. |
| ● | Mineral Resources estimate was prepared under the supervision of James N. Carver, SME Registered Member, our Chief Geologist at the Marigold mine, and Karthik Rathnam, MAusIMM (CP), our Resource Manager, Corporate, each of whom is a qualified person. Mineral Resources estimate is reported based on an optimized pit shell at a cut-off grade of 0.065 g/t payable gold and includes an estimate of Mineral Resources for mineralized stockpiles using Inverse Distance cubed. |
Seabee Gold Operation
| ● | Except for updates to cost parameters, mill recovery and dilution to include recent operating results, and resource modeling techniques based on recommendations set forth in the Seabee Gold Operation Technical Report, all other key assumptions, parameters and methods used to estimate Mineral Reserves and Mineral Resources and the data verification procedures followed are set out in the Seabee Gold Operation Technical Report. For additional information about the Seabee Gold Operation, readers are encouraged to review the Seabee Gold Operation Technical Report. |
| ● | Mineral Reserves estimate was prepared under the supervision of Kevin Fitzpatrick, P.Eng., a qualified person and our Engineering Supervisor at the Seabee Gold Operation. Mineral Reserves estimate for the Santoy mine is reported at a cut-off grade of 3.31 g/t gold. |
| ● | Mineral Resources estimate was prepared under the supervision of Jeffrey Kulas, P.Geo., a qualified person and our Manager Geology, Mining Operations at the Seabee Gold Operation. Mineral Resources estimate for the Santoy mine is reported at a cut-off grade of 2.97 g/t gold. |
| ● | Block modeling techniques were used for Mineral Reserves and Mineral Resources evaluation for the Santoy mine and Porky West deposits. |
- 20 -
| ● | The PEA set forth in the Seabee Gold Operation Technical Report is preliminary in nature, and it includes Inferred Mineral Resources that are considered too speculative geologically to have the economic considerations applied to them that would enable them to be categorized as Mineral Reserves, and there is no certainty that the preliminary economic assessment will be realized. |
Puna Operations
| ● | Chinchillas Mineral Reserves estimate is reported at a cut-off grade of $37.80 per tonne NSR. For additional information on the key assumptions, parameters and methods used to estimate Chinchillas Mineral Reserves and the data verification procedures followed, readers are encouraged to review the technical report entitled “NI 43-101 Technical Report Pre-feasibility Study of the Chinchillas Silver-Lead-Zinc Project, Jujuy Province, Argentina” dated May 15, 2017 (the “Chinchillas Technical Report”). |
| ● | Chinchillas Mineral Resources estimate is reported at a base case cut-off grade, which reflects the transport to and processing of ore at the Pirquitas plant, of 60.00 g/t silver equivalent based on projected operating costs and using metal price assumptions of $22.50 per ounce of silver, $1.00 per pound of lead and $1.10 per pound of zinc. For additional information on the key assumptions, parameters and methods used to estimate Chinchillas Mineral Resources and the data verification procedures followed, readers are encouraged to review the Chinchillas Technical Report. |
| ● | Pirquitas underground Mineral Resources (Pirquitas UG) estimate is reported below the completed open pit shell; Mineral Resources estimate for the Mining Area (which includes San Miguel, Chocaya, Oploca and Potosí zones) is reported at a cut-off grade of $100.00 per tonne NSR for San Miguel, Oploca and Potosi, and $90.00 per tonne NSR for Cortaderas. |
| ● | Pirquitas Mineral Reserves and Pirquitas Mineral Resources estimates in surface stockpiles are reported at a cut-off grade of $20.00 per tonne NSR and were determined based on grade, rehandling costs and recovery estimates from metallurgical testing. |
San Luis Project
| ● | Mineral Resources estimate is reported at a cut-off grade of 6.0 g/t gold equivalent, using metal price assumptions of $600 per ounce of gold and $9.25 per ounce of silver |
Pitarrilla Project
| ● | Mineral Resources estimate for the open pit is reported at a cut-off grade of $16.38 per tonne NSR for direct leach material, and $16.40 per tonne NSR for flotation/leach material. |
| ● | Underground Mineral Resources (Pitarrilla UG) estimate is reported below the constrained open pit resource shell above a cut-off grade of $80.00 per tonne NSR, using grade shells that have been trimmed to exclude distal and lone blocks that would not support development costs. |
Amisk Project
| ● | Mineral Resources estimate was prepared by Sebastien Bernier, P.Geo., a qualified person. Mineral Resources estimate is reported at a cut-off grade of 0.40 grams of gold equivalent per tonne using metal price assumptions of $1,100 per ounce of gold and $16.00 per ounce of silver inside conceptual pit shells optimized using metallurgical and process recovery of 87%, overall ore mining and processing costs of $15.00 per tonne and overall pit slope of fifty-five degrees. |
MARIGOLD MINE
The following disclosure relating to the Marigold mine is based on information derived from the Marigold Technical Report prepared by James N. Carver, SME Registered Member, Karthik Rathnam, MAusIMM (CP), Thomas Rice, SME Registered Member, and Trevor J. Yeomans, ACSM, P.Eng., each of whom is a qualified person under NI 43-101. Each of Messrs. Carver, Rathnam and Yeomans is an employee of SSR Mining. The Marigold Technical Report is available for review under our profile on the SEDAR website at www.sedar.com or on our website at www.ssrmining.com. All scientific and technical information relating to the Marigold mine subsequent to the effective date of the Marigold Technical Report has been reviewed and approved by James N. Carver, SME Registered Member, our Chief Geologist at the Marigold mine, and James Frost, P.E., our Technical Services Superintendent at the Marigold mine, each of whom is a qualified person under NI 43-101.
- 21 -
Project Description, Location and Access
The Marigold mine is located in southeastern Humboldt County, in the northern foothills of the Battle Mountain Range, Nevada, U.S. The mine is situated approximately five kilometers south-southwest of the town of Valmy, Nevada. Other nearby municipalities include Winnemucca and Battle Mountain, Nevada, which are located approximately 58 kilometers to the northwest and 24 kilometers to the southeast of the Marigold mine, respectively. Access to the Marigold mine is via a five kilometer long public road consisting of hard packed clay and gravel, emanating from the Exit 216 off Interstate Highway 80.
For 2019, the authorized plan of operations (“PoO”) area of the Marigold mine encompasses approximately 10,600 hectares, with approximately 2,450 hectares within the PoO permitted for mining-related disturbance, based on a minor modification to the PoO pending approval of our Mackay Optimization Project Environmental Impact Statement (“EIS”) currently in process. Land and mineral ownership within the PoO for the mine are generally noted as having a “checkerboard” ownership pattern. In 2015, we acquired the Valmy property, a 2,844 hectare land package surrounding portions of the Marigold mine to the east, south and west. In 2018, we completed the acquisition of certain parcels of land, and the associated mineral and surface rights, proximal to the PoO boundary. We anticipate that operating synergies and exploration benefits will be realized from the incorporation of these lands into the Marigold land package.
We hold a 100% interest in the Marigold mine through our wholly-owned subsidiary, Marigold Mining Company. The surface and mineral rights we hold at the Marigold mine are comprised of certain real property, unpatented mining claims, and leasehold rights to unpatented mining claims, millsite claims and certain surface lands. Such mineral claims are federally-based and managed by the BLM.
In accordance with certain of the leases in respect of which we hold leasehold interests, we are required to make certain NSR royalty payments to the lessors and comply with certain other obligations, including completing certain work commitments or paying taxes levied on the underlying properties. Such NSR royalty payments are determined based on the specific areas of the Marigold mine that gold is extracted from and are payable when the related ounces extracted from such areas are produced and sold. The NSR royalty payments vary between 2.125% and 10% of the value of gold production net of offsite refining costs. We are required to pay an annual maintenance fee to keep our mining claims in good standing.
For a discussion of permitting and environmental liabilities at the Marigold mine, see “Infrastructure, Permitting and Compliance Activities” below.
- 22 -
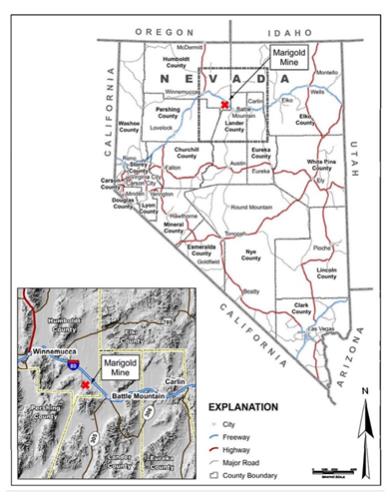
Location of the Marigold Mine
History
The following is a brief chronological description of mining that has occurred at the Marigold mine prior to our ownership:
| ● | 1938-1968: The first recorded gold production from the property was from the underground mine in 1938. Approximately 9,100 tonnes of ore averaging about 6.85 grams of gold per tonne was processed before World War II halted production. Several unsuccessful attempts to open and operate the mine were made before exploration activities began in 1968. |
| ● | 1968-1985: Several companies conducted exploration programs in the Marigold area, completing a total of 126 exploratory drillholes. From 1983 to 1984, the Marigold Development Company excavated a small open pit over the historic underground workings, producing 2,800 tonnes containing 271 ounces of gold. In 1985, Vek/Andrus Associates drilled three holes in the Section 8 area of the property, just northeast from the old underground mine. Following encouraging results from this drilling, Cordex Exploration Co. (“Cordex”), an exploration syndicate composed of, among others, Lacana Gold Inc. (“Lacana”) and Rayrock Mines Inc. (“Rayrock Mines”), leased the Vek/Andrus Associates claim block in September 1985 and began a drilling program in November 1985 that resulted in the discovery of the 8 South orebody. |
| ● | 1986-1992: Following further drilling in the 8 South area in the spring of 1986, a joint venture between SFP Minerals Corporation and the Cordex group consolidated some of the land holdings. |
- 23 -
| In March 1988, Rayrock Mines made a production decision on the 8 South deposit and, in August 1989, the first gold doré bar was poured at the Marigold mill. In March 1992, Rayrock Mines purchased a two-thirds ownership interest in the property, and Homestake Mining Company (“Homestake”), which had taken Lacana’s interest through previous corporate mergers, held the remaining one-third ownership interest. |
| ● | 1994-2001: In 1994, Marigold became a run of mine (“ROM”) heap leach operation. In March 1999, Glamis Gold Ltd. (“Glamis Gold”) purchased all of the assets of Rayrock Mines, thereby acquiring a two-thirds ownership interest in the Marigold mine, with Homestake continuing to hold the remaining one-third ownership interest. By January 2001, a total of one million ounces of gold had been recovered from the property. In July 2001, Glamis Gold released a revised technical report to present the Mineral Resources and Mineral Reserves for recently-discovered mineralization in the “checkerboard” square known as Section 31. |
| ● | 2006-2013: In 2006, Glamis Gold merged with Goldcorp Inc. (“Goldcorp”), resulting in a subsidiary of Goldcorp holding a two-thirds ownership interest in the Marigold mine, as operator, and Homestake, which had been acquired by Barrick Gold Corporation (“Barrick”) in 2001, continuing to hold the remaining one-third ownership interest. In 2007, discovery holes were drilled in the Red Dot deposit. By mid-2009, two million ounces of gold had been recovered from the property. |
On April 4, 2014, we completed the acquisition of the Marigold mine from subsidiaries of Goldcorp and Barrick for total cash consideration of $268 million after closing adjustments.
The following is a brief chronological description of mining that has occurred at the Valmy property prior to our ownership:
| ● | 1980-1998: Hecla Mining Company (“Hecla”) and Santa Fe Pacific Gold Corp. (“SFP Gold”) completed drilling programs at the Valmy property. |
| ● | 1998-2005: Newmont Mining Corporation (“Newmont”) acquired the Valmy property in 1998, and continued exploration activities. Mining operations commenced in 2002 at each of the Valmy, Mud and NW pits, with ore shipped to the North Peak leach pads. Mining activities ceased in 2005. From 2002 to 2005, Newmont mined approximately 196,000 ounces of gold at the Valmy property. |
On September 24, 2015, we completed the acquisition of the Valmy property in Nevada, U.S., which is contiguous with our Marigold mine, for $11.5 million in cash from Newmont.
Geological Setting, Mineralization and Deposit Types
Regional Geology
The Marigold mine is located in north-central Nevada within the Basin and Range physiographic province, bounded by the Sierra Nevada to the west and the Colorado Plateau to the east. The western part of the North American continent has undergone a complex history of extensional and compressional tectonics from the Proterozoic through to the Quaternary. Predominantly Paleozoic rifting and basin subsidence led to the formation of thick (hundreds of meters) passive margin sedimentary sequences, and repeated inter-plate collisions caused accretion of arc related volcanics and ocean floor rocks which were pushed together with the basin sediments to form fold and thrust belts. Later extension related to subduction and back arc basin rifting resulted in the development of basin and range topography. Crustal thinning caused by the extension allowed the rise of magma close to the surface which produced extensive and voluminous magmatism from the mid Eocene to late Miocene. Crustal extension with bi-modal volcanism occurred in the region from the late Miocene to the present day.
Local and Property Geology
The Marigold mine is located in the Battle Mountain mining district on the northern end of the Battle Mountain-Eureka trend, a conspicuous lineament of sedimentary rock-hosted gold deposits. The Battle
- 24 -
Mountain district hosts numerous mineral occurrences, including porphyry copper-gold, porphyry copper-molybdenum, skarn, placer gold, distal disseminated silver-gold, and Carlin-type gold systems.
Three packages of Paleozoic sedimentary and metasedimentary rocks are present at the Marigold mine. In ascending tectonostratigraphic order, these include:
| ● | Valmy Formation: The oldest rocks in the Marigold area belong to the Ordovician Valmy Formation. The Valmy Formation consists of quartzite, argillite, chert, and lesser metabasalt, all of which are complexly folded and faulted in the Marigold mine area. The top of the Valmy Formation is unconformable with overlying rocks. Silurian and Devonian rocks are not present either due to non-deposition or erosion. Unconformably overlying the Valmy Formation is the Pennsylvanian-Permian Antler overlap sequence. |
| ● | Antler Sequence: The Antler overlap sequence is composed of Pennsylvanian to Permian-aged rocks assigned to three formations: the basal Battle Formation; the Antler Peak Limestone; and the Edna Mountain Formation. These formations represent a transgressive sequence of shallow marine rocks that include conglomerate, sandstone, limestone and siltstone. There is evidence the Antler sequence was locally deposited into sub-basins developed by normal offset on growth faults of likely early Permian age. Antler sequence rocks are relatively undeformed, except for offset and rotation along Basin and Range normal faults. The Antler sequence is in thrust contact with the overlying and partially contemporaneous Havallah sequence. |
| ● | Havallah Sequence: The uppermost package of Paleozoic rocks exposed at Marigold is the Mississippian-Permian Havallah sequence. The Havallah sequence is an assemblage dominated by siltstone, metabasalt, chert, sandstone, conglomerate and carbonate rocks. These deeper water marine sediments were deposited in a fault-bounded deep-water trough and subsequently obducted over the Antler sequence along the Golconda thrust. |
A series of late Cretaceous porphyritic quartz monzonite dikes crosscut the Paleozoic rock package at the Marigold mine. The intrusions are typically several meters wide, and several can be traced along strike for tens to hundreds of meters. The dikes strike west-northwest to north and are typically steeply dipping.
There are no Mesozoic sedimentary rocks in the Marigold mine area; however, approximately two-thirds of the Marigold mine is covered by Tertiary to Quaternary intercalated gravel and volcanic material.
Mineralization
The gold deposits at the Marigold mine cumulatively define a north-trending alignment of gold mineralized rock more than 8 kilometers long. Gold mineralizing fluids were primarily controlled by fault structure and lithology, with tertiary influence by fold geometry. The deposition of gold was restricted to fault zones and quartzite-chert dominant horizons within the Valmy Formation and high permeability units within the Antler sequence. Gold mineralization was also influenced by fold geometry in the Valmy Formation.
In oxidized rocks, gold occurs natively in fractures associated with iron oxide. Rocks within the Marigold mine area are oxidized to a maximum depth of approximately 450 meters. The redox boundary is not consistent throughout the Marigold mine and is substantially influenced by lithology. Shale, argillite, and siltstone units are frequently unoxidized adjacent to pervasively oxidized quartzite horizons.
The table below provides the key stratigraphic and structural elements controlling the mineralization at each deposit:
- 25 -
| Deposit Name |
Main Control on
|
Host Rock |
Length
|
Width
|
Thickness (m)
|
Preferred
| ||||||
| Antler | Favorable host rock | Antler- quartzite and argillite | 722 | 177 | 40 | NS | ||||||
| Basalt | Favorable host rock | Valmy-quartzite, argillite meta-basalt | 1000 | 325 | 25 | NS | ||||||
| Target II | Favorable host rocks and structural intersections | Edna Mtn, Antler, Battle conglomerate, Valmy-quartzite | 700 | 100 | 30 | NS | ||||||
| Mackay and Red Dot | Favorable host rocks and steep structures | Valmy-quartzite | 3600 | 700 – 1500 |
Number of zones up to 30 | NS | ||||||
| 8 South (included in Mackay North) | Favorable host rocks and structures | Edna Mtn and Antler Peak Limestone | 300 | 100 | Up to 35 | NS | ||||||
| 5 North Phase 1 | Favorable host rocks | Edna Mtn | 260 | 90 | 10 | NS | ||||||
| 5 North Phase 2 | Steep structure and favorable host rocks | Antler Peak Limestone | 250 | 50 | 20 | NNW | ||||||
| Valmy | Favorable host rocks and structures | Valmy-quartzite | 3600 | 700 – 900 |
Up to 60 | NS | ||||||
Deposit Types
The deposits at the Marigold mine have been described as distal disseminated silver-gold deposits. Such deposits are disseminated equivalents of polymetallic vein deposits, characterized by a geochemical signature that includes silver, gold, lead, manganese, zinc, copper, antimony, arsenic, mercury and tellurium. Typically, they contain substantially more silver relative to gold than other types of disseminated gold deposits and may feature supergene enrichment of silver if significantly oxidized. In Nevada, distal disseminated silver-gold deposits are proximal to Jurassic, Cretaceous, and mid-Tertiary granitoid intrusions. A fundamental requirement of the distal disseminated silver-gold model necessitates a genetic link between silver-gold mineralization and causative intrusions; however, no such relationship has been conclusively demonstrated at the Marigold mine.
A Carlin-type gold deposit is a unique type of disseminated, sedimentary rock-hosted gold deposit. The genesis of Carlin-type gold deposits is currently not well understood. In Nevada, Carlin-type gold deposits occur along several main mineral trends, including the Carlin trend and Battle Mountain-Eureka trend, and are primarily hosted by silty carbonate rocks. Gold occurs in arsenian pyrite rims on pyrite grains and is associated with arsenic, sulphur, antimony, mercury and thallium. Even though the genesis of Carlin-type gold deposits remains enigmatic, there is consensus that all Carlin-type gold deposits in Nevada formed during the Eocene period.
Distal disseminated silver-gold deposits may share similarities with Carlin-type gold deposits, including ore body morphology, structural setting and alteration styles, but drastically differ with respect to alteration zonation, geochemical signature, hypogene mineralogy and endowment. Distal disseminated silver-gold deposits show a more definitive magmatic signature than Carlin-type gold deposits that includes zoning of alteration relative to felsic hypabyssal intrusions, base metal enrichment, significantly higher silver-to-gold ratios, and distinctive hypogene ore mineralogy (e.g., base metal sulfides, native gold and silver, electrum, silver sulfides and silver sulfosalts), and are typically much smaller in terms of gold endowment. Recent work suggests that the gold deposits at the Marigold mine are best classified as Carlin-type gold deposits, based on many similarities with the Carlin-type gold deposits model and a lack of evidence for causative hypabyssal intrusions.
- 26 -
Exploration
Subsequent to our acquisition of the Marigold mine in 2014, we initiated a review of the exploration activities conducted by previous owners. Based on this review, we initiated a gravity survey at a grid spacing of approximately 150 meters by 150 meters in areas not previously covered by a gravity survey. The main objective of this work was to delineate possible fluid conduits or feeder structures for the Marigold mineralization.
The data processing involved removal of spurious anomalies produced by dumps and leach pads. The survey successfully defined and confirmed the north-south structural zone as well as the north-east and north-west structures. Coupled with other historical geophysical programs conducted by previous owners of the Marigold mine, this information has provided a more complete structural understanding of the subsurface geology at the property to aid in our exploration program.
Exploration activities in 2016 included a pre-faulting reconstruction of the geology over our entire land package. This work yielded significant interpretative conclusions which identified several near-surface oxide targets. In the third quarter of 2016, we expanded our gravity survey coverage to include portions of the Valmy property and Marigold mine, including the additional lands to the east, south and west of the original Marigold mineral claims. This data, together with our understanding of the sub-surface geology, was used to select drill sites for our deep sulphide exploration program targeting a high grade style of mineralization.
In 2017, exploration and development activities included structural and compilation work at the North Red Dot target, which was tested and confirmed continuity of mineral controlling fault systems. Initial exploration of the Showdown target area yielded several encouraging intervals of shallow low grade gold mineralization between the East Basalt deposit and the Valmy deposits. The known zone of mineralization has been extended below and east of the current resource pit at East Basalt based on drill results. Positive drilling results were also received within the resource portions of the Red Dot deposit, which has confirmed the geologic interpretation.
Exploration activities in 2018 focused on the upgrading of Mineral Resources at Red Dot and growth within and along the various phases of the Mackay pit. Drilling also targeted Mineral Resource additions along the North and South Red Dot expansion areas.
Drilling
Prior to our acquisition of the Marigold mine, as at December 31, 2013, a total of 6,860 drillholes for approximately 1,357,413 meters of drilling had been completed, as set out in the table below. The first hole was drilled in 1968 and drilling continued sporadically until 1985, when Cordex began systematic exploration of the 8 South area. Prior to our acquisition of the Valmy property, Hecla, SFP Gold and Newmont completed a total of 852 drillholes for approximately 109,363 meters of drilling.
- 27 -
Since acquiring the Marigold mine in April 2014 and the Valmy property in September 2015, we have completed a total of 972 drillholes for 271,548 meters of drilling, as set out in the table below.
|
Drilling
|
Company |
No. RC
|
RC Meters(1) |
No. Holes
|
Diamond Meters(1) |
Total Holes |
Total Meters(1) |
|||||||||||||||||
| 1968- 1985
|
Various exploration and mining groups | 126 | (2) | 7,037 | (2) | -(2) | -(2) | 126 | 7,037 | |||||||||||||||
| 1985- 1999
|
Cordex and Rayrock Mines | 2,350 | 333,325 | 8 | 2,176 | 2,358 | 335,501 | |||||||||||||||||
| 1999- 2006
|
Glamis Gold | 2,498 | 484,619 | 8 | 2,030 | 2,506 | 486,649 | |||||||||||||||||
| 1968- 2012
|
Newmont and other mining groups (Valmy property) |
852 | 108,326 | 15 | 1,037 | 867 | 109,363 | |||||||||||||||||
| 2006- 2013
|
Goldcorp | 1,856 | 520,163 | 14 | 8,063 | 1,870 | 528,226 | |||||||||||||||||
| 2014
|
SSR Mining | 116 | 21,653 | 1(3) | 1,235 | (3) | 117 | 22,888 | ||||||||||||||||
| 2015
|
SSR Mining | 171 | (5) | 39,070 | 4 | 4,270 | (4) | 175 | (5) | 43,340 | (5) | |||||||||||||
| 2016
|
SSR Mining | 231 | 55,147 | 1 | 955 | 232 | 56,102 | |||||||||||||||||
| 2017
|
SSR Mining | 188 | 54,814 | 1 | 1,128 | 189 | 55,942 | |||||||||||||||||
| 2018
|
SSR Mining | 259 | 93,276 | — | — | 259 | 93,276 | |||||||||||||||||
|
Total
|
|
8,647
|
|
|
1,717,430
|
|
52
|
|
20,894
|
|
|
8,699
|
|
|
1,738,324
|
| ||||||||
Notes:
| (1) | Drill lengths converted from feet to meters. Figures have rounding applied. Exact totals prior to 2014 in feet can be found in the Marigold Technical Report. |
| (2) | No documentation of drilling method at the Marigold mine is available for these drillholes. However, before reverse circulation (“RC”) drilling became widely adopted in the mid-1980s, conventional single tube drilling was often relied upon as the exploration drilling technique. It is suspected that single tube drilling was used during this time period, with only occasional diamond drillholes utilized. These drillholes are located in areas that have been mined or are outside of the current Mineral Resource area of the Marigold mine. |
| (3) | Only one diamond core drillhole was completed at the end of 2014, for a total of 1,235 meters. Two diamond core drillholes were in progress, and the total diamond core drilled during 2014, including the completed diamond core drillhole, was approximately 2,829 meters. |
| (4) | Four HQ core drillholes, including the two HQ core drillholes in progress at the end of 2014, were completed in 2015, totaling 4,270 meters of HQ core. |
| (5) | Includes an additional 2,360 meters of drilling in 37 sonic drillholes in mineralized stockpiles. |
1980 to 2005 Drilling Programs
Drilling at the Marigold mine from 1985 to 1994 mainly targeted the high grade zone (greater than 1.71 grams of gold per tonne) in the 8 South deposit with a focus on gold recoverable in a mill and cyanide gold recovery circuit. In 1994, as these higher grade zones were depleted, the decision was made for the operation to migrate to a ROM heap leach operation. Consequently, the exploration strategy was adjusted to explore for and discover large tonnage ore deposits with average grades equal to or greater than 0.34 grams of gold per tonne.
Drilling activities commenced at the Valmy property in 1980 and were focused on shallow lower grade oxide mineralization amenable to ROM heap leach operations. Hecla and SFP Gold carried out drilling programs between 1980 and 1998, identifying the Valmy deposit. Exploration activities conducted by Newmont from 1998 to 2005 were mainly focused on infill drilling at the Valmy pit and also identified the Mud and NW pit deposits.
- 28 -
2006 to 2013 Drilling Programs
Goldcorp and Barrick supported ongoing near mine exploration work at the Marigold mine between 2006 and 2013. This included development drilling for mineral conversion and exploration drilling to discover additional Mineral Resources. This exploration work led to the discovery of mineralization in the Red Dot area, while the development work grew the Antler and Basalt deposits into one larger open pit with discovery and definition of additional Mineral Resources near and between these two deposits. Subsequent exploration drilling campaigns have expanded on the potential for an area which encompasses the 8 South, 8 North, 8 Deep and the Terry Zone North deposits, all of which comprise the Mackay North exploration area.
2014 to 2018 Drilling Programs
In June 2014, we initiated a program of infill and exploratory RC drilling, which targeted the discovery of near-surface gold mineralization proximal to the open pits and the upgrading of Inferred Mineral Resources to Indicated Mineral Resources. From June 2014 to 2017, our drilling production included: 706 RC drillholes for 170,684 meters; 37 sonic drillholes in rock stockpiles (included in RC totals); and seven HQ diamond core holes for 7,588 meters. We drilled on targets and resource areas, including East Basalt, Battle Cry, Showdown, Valmy SE, Mud & NW, Crossfire, HideOut, 8 South pit extension, Terry Zone North, 8 Deep, 5 North, Red Dot, North Red Dot, Mackay pit extensions and the Mackay Herco Keel structure.
In 2017, exploration activities included structural and compilation work at the North Red Dot target, which was tested and confirmed continuity of mineral controlling fault systems. Initial exploration of the Showdown target area yielded several encouraging intervals of shallow low grade gold mineralization between the East Basalt deposit and the Valmy deposits. Positive drilling results were also received within the resource portions of the Red Dot deposit and in the Mackay pit expansion phases 4 and 5, which encompasses the earlier phase 1 of mining on the Mackay pit. The drilling results confirmed the working geologic understanding of the Mackay and Red Dot deposit interpretation.
The focus of our 2018 exploration program was to conduct infill drilling to upgrade Mineral Resources at Red Dot and to explore higher grade structural zones within various phases of the Mackay pit, with work also targeting Mineral Resource addition. This is consistent with our longer-term objective of completing the necessary infill and geotechnical drilling to complete pit designs and an economic evaluation over the entire Red Dot area by mid-year 2019.
Sampling, Analysis and Data Verification
Exploration activities by each of Rayrock Mines, Glamis Gold and Goldcorp have contributed the majority of the assays in the Marigold database spanning the period from 1985 to 2013. Sampling and analytical procedures are known and documented covering this period, and it is assumed that analytical information prior to 1985 has no impact on the current Mineral Resources, as those volumes containing samples collected prior to 1985 have been mined out.
Most of the samples that inform the Marigold database were generated from RC drill cuttings. In general, the practice for the collection of RC samples has changed very little since 1985; however, there have been numerous sequential improvements in sample preparation, security and analysis to date. Marigold has generally followed and has continued to follow industry best practices.
There is an extensive sample storage facility at the Marigold mine that preserves the raw sample material which supports the Marigold database. Most of the laboratory pulp reject (since 1987), coarse reject (since 2006) and split diamond drill core are catalogued and securely stored in shipping containers on the property.
Sample Preparation and Analysis
Until the end of 1999, fire assay (“FA”) with a gravimetric finish was the preferred analytical method for gold in samples. Since then, all samples have been subjected to first-pass gold cyanide solution assay, which if results were greater than 0.17 grams of gold per tonne, samples were also subjected to FA determination with gravimetric finish at the onsite Marigold laboratory, or FA with atomic absorption (“AA”) spectroscopy finish and FA with gravimetric finish for over limits, at commercial laboratories.
- 29 -
All Newmont-provided samples that inform the resource database for the Valmy area were assayed at various commercial laboratories. The preferred assay method was FA with AA spectroscopy finish, followed by gold cyanide solution assay on select samples within the mineralized zone.
From and after April 2014, all exploration samples from Marigold and the Valmy property are analyzed at American Assay Laboratories (“AAL”), an ISO 17025 certified facility in Sparks, Nevada. AAL is independent from SSR Mining. All samples are subjected to first-pass FA determination with an AA finish and FA with gravimetric finish for over-limits. This is followed by a gold cyanide solution assay with an AA finish on samples that have FA values greater than or equal to 0.03 g/t gold.
Quality Assurance/Quality Control Procedures
As historical quality assurance/quality control (“QA/QC”) procedures at the Marigold mine did not meet current standard best practices, we collected a spatially and temporally representative selection from the well-preserved drillhole sample pulps (from the years 1987 to 2013) stored at the property and sent these to AAL for analysis. The aim of this re-assay program was to check the assay quality (i.e., accuracy and precision, from the laboratories that were used during these years). Drillhole sample pulp material was not available for the period 1968 to 1987. The 2014 pulp re-assay program returned values which did not demonstrate any systematic errors in the accuracy or precision of analytical assays from the period between 1987 and 2013. The results from the 2014 pulp re-assay program show the quality of the assay analysis only and give no indication of other potential sampling errors at any stage of the sample collection and preparation stage.
Similar to Marigold, because the historical QA/QC procedures for the Valmy property did not meet current industry standards, after our acquisition of the property, we drilled eight drillholes within a resource block of 200 meters by 150 meters. A total of eleven historical drillholes were within the same block. The infill drill comparison indicated that there was no systematic error in the historical sampling and assaying methodology when compared to current practices, and, therefore, the historical data could be used to develop the Mineral Resources for the Valmy property.
As part of our QA/QC protocol for our 2014 to 2018 drilling programs, we inserted a certified reference material or certified standards (“CRM”) every 20th sample, a blank sample every 50th sample and a field duplicate every 20th sample into the sampling stream. Sample data was monitored on a real-time basis (upon receipt of data from the analytical laboratory) to ensure that sample batches with control sample data were within acceptable limits and those batches outside the limits were re-submitted for analysis in a timely manner. Samples included eleven reference standard samples, unmineralized blank samples and field duplicate samples. The CRM was purchased from Rocklabs Ltd. (“Rocklabs”). Based on the results of the standard control samples, the assay data generated is unbiased and accurate, and suitable for use in our Mineral Resources estimate. Blank control samples indicated that sample cross-contamination was not an issue during the analytical work. The variability in the field duplicate control sample assays were within acceptable levels of precision.
Data Verification
For data collected after April 2014, the following verification steps were completed:
| ● | The location of planned drillholes was compared to the location of as-built drillholes in real time. Regular field checks were completed on drill and sampling systems; |
| ● | Downhole survey intervals that encountered major deviations were reviewed and validated; |
| ● | Precision and accuracy of laboratory assay results were verified using a QA/QC program that followed an industry standard protocol using the blind insertion of blanks and certified standards; |
- 30 -
| ● | The elevation of all surveyed drillhole collar co-ordinates was checked against the original/current/depleted topographic surface to identify any variations of more than one meter. No discrepancies were found; |
| ● | Profiles of all mined-out pits, backfilled pits and dumps were cross checked, updated annually, and incorporated into the current topography; and |
| ● | All data, including collars, downhole survey, assays and lithology, were imported directly into our geological database without any manual input. Data validation was conducted before the records were uploaded to the main database. |
Three technical issues were identified in the Marigold Mineral Resources database, each of which has since been resolved:
| ● | Drillholes were missing downhole surveys; |
| ● | Some samples were only assayed by cyanide soluble analysis and not by FA; and |
| ● | Assay results for a high percentage of lower grade samples were recorded as 0.0 oz/t gold. |
There have been changes in the lower detection limit for cyanide soluble gold assays over time as the ROM cut-off grade has been reduced. Prior to 2009, assay values below detection were entered into the database as 0.0 oz/t. This data artefact was under-representing the mineralized volume of the Mineral Resources estimate at the low-grade range of the analytical distribution and contributing to the positive reconciliation experienced at Marigold.
The issue of below-detection-limit analyses in the database was addressed through a systematic assay program implemented in 2015 and 2016 (the “Assay Program”). A total of 153,023 pulp samples from pre-2009 drill holes reporting a 0.0 oz/t gold cyanide soluble result and located within the reserve pits were recovered from storage and analyzed for gold at AAL. Certified standards and blanks were inserted into the pulp sample list at a rate of one standard in 20 samples and one blank in 50 samples. The samples were analyzed using a 30-gram FA with an AA finish, followed by a gold cyanide solution assay with an AA finish for those samples that returned FA results of 0.03 g/t or greater. The Assay Program identified additional mineralized areas, and the incorporation of this lower grade material, that had been previously estimated as 0.0 oz/t or deemed as waste, increased ore tonnage.
Based on the verification steps and adjustments outlined, the exploration data (including collar, survey, lithology and assay data) is suitable for use in the generation of our Mineral Resources and Mineral Reserves estimates, which can form the basis for mine planning studies.
Sample Security
The bulk of the sample values in the Marigold assay database are for samples analyzed at the secure on-site Marigold laboratory. Samples shipped off-site were either delivered to a commercial laboratory by a Marigold geologist or technician, or were collected by employees of the Marigold laboratory, and all samples were sent with a manifest listing the number of samples included in the shipment. Exploration personnel are unaware of any instances of tampering with samples either on site or in transit to a laboratory.
During our 2014 to 2018 drilling programs, all exploration samples were collected from the Marigold mine site by an employee of AAL. All sample dispatches included a manifest listing the sample identifiers and number of samples included in the shipment. AAL electronically acknowledged the receipt of the samples within 24 hours after physically reconciling the samples with the manifest. We are unaware of any instances of tampering with samples either on site or in transit to a laboratory.
- 31 -
Mining Operations
Marigold uses standard open pit mining methods at a current mining rate of 200,000 metric tonnes per day. The mine conducts conventional drilling and blasting activities with a free face trim row blast to ensure stable wall rock conditions. Electronic detonators are used to control the timing of the blasthole detonation.
Mining occurs on 15.2 meter (50 foot) benches for pre-stripping waste and 7.6 meter (25 foot) benches for ore. Loading operations are performed using three primary loading shovels. Waste and ore haulage are performed with a fleet of 300-tonne primary haulers. In 2018, we purchased four additional 300 tonne class haul trucks, which further expanded our fleet to 25-300 tonne haul trucks.
With the low grade nature of the Mineral Reserves and Mineral Resources at the Marigold mine, such large, efficient and cost effective machinery must be utilized for mining. All processing of ore, which is oxide in nature, is done on ROM heap leach pads, which is a cost effective method to recover the gold produced. Waste is hauled to storage locations near the mining pits to minimize haulage costs.
Processing, Recovery and Metallurgical Testing
The Marigold processing plant and facilities incorporate standard industry ROM heap leaching, carbon adsorption, carbon desorption and electro-winning circuits to produce a final precious metal (doré) product. All processing of ore, which is oxide in nature, is completed via ROM heap leach pad, and is a cost-effective method to recover gold. ROM ore is delivered to the leach pad by haulage truck and stacked in 6.1-meter (20 foot) to 12.2-meter (40 foot) lifts. At any given time, approximately 0.5 million square meters of pad area is being leached.
Barren leach solution (cyanide bearing solution, very low in gold grade) is applied selectively to different areas of the pad. The leach solution is pumped to the leach pad and the pregnant solution (gold bearing) from the leach pad is then collected in a pregnant solution pond before it is pumped to carbon column trains where gold is adsorbed from solution onto activated carbon. Carbon loaded with gold is taken from the carbon columns and transported to the on-site process facility where gold is stripped from the carbon by solution. The precious metal bearing solution is passed through electro-winning cells where metals are plated out of the solution. The plated material is retorted for mercury removal and drying prior to smelting for final precious metal recovery.
Cumulative gold produced from the leach pads is equivalent to 70.3% recovery, whereas total gold recovery including recoverable gold inventory in the leach pads is estimated at 73.6%.
Infrastructure, Permitting and Compliance Activities
Infrastructure
The Marigold mine has infrastructure existing onsite for delivering power and water to the various mine shops, heap leach pads, and process and ancillary facilities. Electrical power is supplied from NV Energy, Inc. via an existing 120-kilovolt (“kV”) transmission line and routed through a 25 kV grid.
Water is supplied from three existing groundwater wells located near the access road to the property. We own groundwater rights collectively allowing up to 3.137 million cubic meters of water consumption annually, the majority of which is used as makeup water for process operations. Approximately 5.3 cubic meters per minute of fresh water is required during peak periods in the summer months. The water is primarily consumed by retention in the leach pads, evaporation, processing operations and dust suppression.
The infrastructure facilities at the Marigold mine include ancillary buildings, offices and support buildings, access roads into the plant site, source of electrical power and power distribution, source of fresh water and water distribution, fuel supply, storage and distribution, waste management and communications. The property is located in a favorable area for natural resource development with significant existing resources to support the mining industry.
- 32 -
Environmental, Permitting and Social Responsibility
Given that significant portions of the Marigold mine exist on public lands administered by the BLM, the BLM is the primary permitting agency and our activities undergo environmental evaluation by the BLM. Past permitting actions were conducted under BLM authority as part of the regulations under the National Environmental Policy Act (“NEPA”), which require various degrees of environmental impact analyses dictated by the scope of the proposed action.
Marigold has prepared a proposed amendment to the existing PoO to permit the future mining of all pits to their planned maximum depths. The environmental baseline studies to support the EIS process were initiated in 2013. These baseline studies include, but are not limited to, socioeconomics, air quality impacts, cultural and archaeological resources, groundwater model, pit lake model, screen-level ecological risk assessment, waste rock/material characterization, water characterization, sage grouse habitat evaluation, evaluations for flora and fauna, and feasibility evaluation and pilot testing for rapid infiltration basins. We received a minor modification to the PoO for 2019 pending approval of the EIS currently in process.
Specific federal, state and local (Humboldt County, Nevada) regulatory and permitting requirements apply to Marigold activities. We currently hold active, valid permits for all current facets of the mining operation. At present, there are no known environmental issues that impact our ability to extract Mineral Resources at the Marigold mine.
We have an extensive monitoring program in place at the Marigold mine for both groundwater quantity and quality, as well as seasonal surface water quantity and quality. Results from this program as well as long-term trend data is reported to both state and federal agencies. Air, geochemical, vegetation, wildlife, and industrial health monitoring are also regularly conducted according to permit requirements. Agency representatives conduct routine compliance inspections on a quarterly basis.
We engage in concurrent reclamation practices and are bonded for all permitted features of the Marigold mine, as part of the State of Nevada permitting process. Current bonding requirements are based on the Nevada Standardized Reclamation Cost Estimator and Cost Data File established by the Nevada Division of Environmental Protection (“NDEP”) to reclaim all permitted features at the Marigold mine. Both the BLM and State of Nevada review and approve the bond estimate, and the BLM holds the financial instruments providing the bond backing.
The State of Nevada requires a tentative closure plan to be filed when a permit application is submitted or modified, and a final closure plan to be filed two years prior to the facility actually commencing closure. The Each of a tentative closure plan and reclamation permit for the Marigold mine has been filed and maintained with the NDEP, which, in conjunction with standard reclamation and re-vegetation of all disturbed areas, includes discussions on removal of infrastructure, environmental monitoring, and notably long-term process fluids/heap leach drain down solution management.
There are currently no outstanding negotiations or social requirements regarding operations at the Marigold mine. Community support and engagement is well-established and will continue, with regular updates provided by mine management to local stakeholders and regulators.
Capital and Operating Costs
The capital and operating cost estimates derived for the Marigold mine are based on a combination of the data set forth in the Marigold Technical Report and budgetary estimates, and reflect our current estimates as of December 31, 2018.
- 33 -
Capital costs are considered to be sustaining capital and are estimated to be $233.6 million for the life of the Marigold mine, which does not include capitalized stripping or capitalized exploration costs. The life of mine capital costs estimate is shown in the table below.
|
Capital Costs
|
Total ($ Millions)
| ||||
|
Mining Equipment
|
80.4 | ||||
|
Capitalized Equipment Maintenance
|
117.9 | ||||
|
Processing
|
26.6 | ||||
|
G&A/Permitting/Other
|
8.7 | ||||
|
Total Capital Costs
|
233.6 | ||||
The breakdown of estimated operating costs for the life of mine, which include deferred stripping, is shown in the table below. Estimated operating costs for mine operations includes both expensed and capitalized mining costs.
|
Operating Costs
|
$/tonne
| ||||
|
Mine Operations (per tonne mined)
|
1.49
| ||||
|
Processing (per tonne processed)
|
1.26
| ||||
|
G&A (per tonne processed)
|
0.70
| ||||
Costs in individual years may vary significantly as a result of, among other things, current or future non-recurring expenditures, changes to input costs and exchange rates, and changes to our current mining operations or mine plan.
Exploration, Development and Production
At the Marigold mine, gold production is expected to increase in 2019 with the full-year benefits from the four haul trucks added to the fleet in mid-2018 and production from the new leach pad beginning in the first quarter of 2019. Capital investments are expected to total $35 million in 2019, including $22 million in the mine for maintenance and purchase of mobile fleet as well as $10 million for accelerated leach pad construction and process infrastructure. To accommodate the higher ore tonnes mined and to provide additional operating flexibility regarding leach cycles, construction of a leach pad is expected to be accelerated to the second half of 2019 from 2020. Capitalized stripping is expected to total $20 million with the majority incurred through the first three quarters of the year. Exploration expenditures totaling $7.5 million, including 60,000 meters of drilling, focus on the Mackay, Valmy and Basalt areas with the goals of adding Mineral Reserves and defining additional Mineral Resources within these areas. Having completed the Red Dot exploration program in 2018, we intend to complete geotechnical drilling and engineering of the remaining Red Dot Mineral Resources with the objective of evaluating the potential for additional Red Dot Mineral Reserves by mid-2019.
SEABEE GOLD OPERATION
The following disclosure relating to the Seabee Gold Operation is based on information derived from the Seabee Gold Operation Technical Report prepared by each of Dominic Chartier, P.Geo., Senior Consultant (Geology), SRK Consulting (Canada) Inc., and Mark Liskowich, P.Geo., Principal Consultant (Environment), SRK Consulting (Canada) Inc., Michael Selby, P.Eng., and Jeffrey Kulas, P. Geo., our Manager Geology, Mining Operations at the Seabee Gold Operation, each of whom is a qualified person under NI 43-101. The Seabee Gold Operation Technical Report is available for review under our profile on the SEDAR website at www.sedar.com or on our website at www.ssrmining.com. This disclosure has been updated to include information about the Seabee Gold Operation subsequent to the effective date of the Seabee Gold Operation Technical Report. All scientific and technical information relating to the Seabee Gold Operation subsequent to the effective date of the Seabee Gold Operation Technical Report has been reviewed and approved by Cameron Chapman, P.Eng., our General Manager at the Seabee Gold Operation, Kevin Fitzpatrick, P.Eng., our Engineering Supervisor at the Seabee Gold Operation, and Jeffrey Kulas, P. Geo., our Manager Geology, Mining Operations at the Seabee Gold Operation, each of whom is a qualified person under NI 43-101.
- 34 -
Project Description, Location and Access
The Seabee Gold Operation is located in the La Ronge Mining District at the north end of Laonil Lake, approximately 125 kilometers northeast of the town of La Ronge, Saskatchewan and about 150 kilometers northwest of Flin Flon, Manitoba. The operation consists of two underground mines, the Seabee mine, which was closed in the second quarter of 2018, and the Santoy mine complex, a central milling facility and permanent camp facilities. The Santoy mine complex is connected to the milling and camp facilities, as well as the Seabee mine, by an all-weather road. Access to the Seabee Gold Operation is by fixed wing aircraft from La Ronge to a 1,275-meter airstrip located on the property. During the winter months, a 60-kilometer winter road is built between the operation and Brabant Lake on Highway 102, approximately 120 kilometers north of La Ronge, Saskatchewan, to transport heavy supplies and equipment by truck.
The current land position at the Seabee Gold Operation comprises an area of approximately 27,500 hectares. We hold a 100% interest in the Seabee Gold Operation through our wholly-owned subsidiary, SGO Mining Inc. (formerly Claude Resources). The surface and mineral rights we hold at the Seabee Gold Operation are comprised of six mineral leases and 42 mineral claims initially staked or acquired by Claude Resources. We also hold a valid surface lease with the Province of Saskatchewan, which provides Crown land surface rights necessary to carry out the mining, milling and associated operations at the Seabee Gold Operation. The Seabee Gold Operation is currently producing from mineral leases ML 5543 and ML 5551. We are required to pay certain annual rental and mining land taxes for the Seabee Gold Operation and comply with certain other obligations, including completing certain work commitments, to maintain our mining leases and mineral claims in good standing.
The Seabee Gold Operation is subject to certain production and NSR royalties payable to third parties. In 2007, Claude Resources entered into a royalty agreement pursuant to which a basic royalty at fixed amounts per ounce of gold production was granted, along with a net profit interest (“NPI”) of varying percentages, payable only if gold prices exceed a pre-determined threshold. In 2017, we exercised our call right under the royalty agreement to purchase the equity of the holder of the basic royalty, effectively terminating this royalty obligation. The NPI expired on December 31, 2017.
In 2014, Claude Resources entered into a royalty agreement to grant a 3% NSR royalty on gold sales from the Seabee Gold Operation, with such payments paid quarterly in cash or in physical gold at the average price of gold in each calendar month. In the first quarter of 2016, Claude Resources also granted a 1% NSR royalty on gold production from certain acquired mineral claims adjacent to the north portion of the Seabee Gold Operation. We have an option, which does not expire, to repurchase half or 0.5% of this 1% NSR for C$1.0 million.
The Seabee Gold Operation is also subject to certain payments to the Province of Saskatchewan, which are calculated as 10% of net operating profits and are payable once capital and exploration costs are recovered. No royalty payments have been made to the Province of Saskatchewan to date.
For a discussion of permitting and environmental liabilities at the Seabee Gold Operation, see “Infrastructure, Permitting and Compliance Activities” below.
- 35 -
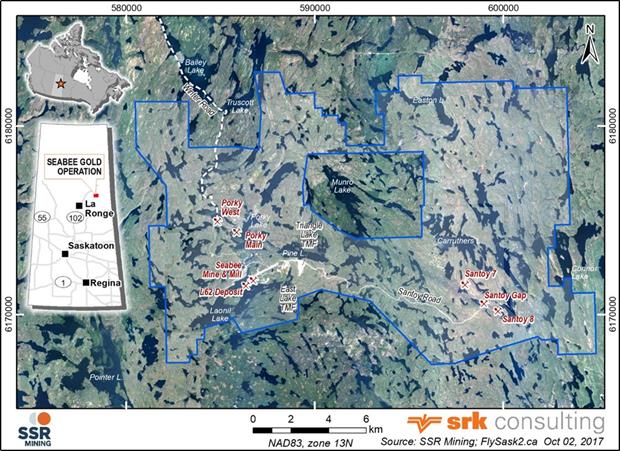
Location of the Seabee Gold Operation
History
The following is a brief chronological description of mining that has occurred at the Seabee Gold Operation prior to our ownership:
| ● | 1947-1983: The Laonil Lake region has been intermittently explored since the 1940s, with the first gold discovery made in 1947 by prospectors working on behalf of Cominco Inc. (“Cominco”). Between 1947 and 1950, Cominco conducted an extensive program of prospecting, trenching, geological mapping and diamond drilling. In 1958, Cominco applied for and was granted 10 quartz mining leases covering the Seabee property. From 1974 through 1983, Cominco conducted detailed drilling and exploration. |
| ● | 1983-1985: In 1983, Cominco sold the Seabee property to BEC International Corporation, which subsequently sold the property to Claude Resources. |
| ● | 1985-1988: In June 1985, Claude Resources optioned the Seabee property to Placer Development Limited (subsequently Placer Dome Inc., “Placer”). Placer conducted an extensive exploration program which involved geological mapping, trenching and stripping, geophysical, geochemical, environmental and metallurgical studies, as well as surface and underground drilling. Upon completion of the program, Placer allowed its option to expire and returned the property to Claude Resources in June 1988. |
| ● | 1988-1991: Claude Resources performed a geological review and analytical study to validate the work completed by Placer, and Cominco Engineering Services Limited (“Cominco Engineering”) subsequently completed bulk sampling and drilling as part of a feasibility study for the Seabee deposit. ACA Howe International Limited |
- 36 -
| (“ACA Howe”) completed a Mineral Reserve estimate in December 1988, and Cominco Engineering submitted a positive feasibility study in August 1989, which was further revised in May 1990. In the summer of 1990, Claude Resources placed the Seabee deposit into production and construction of the Seabee mine was initiated. Mill construction was completed in late 1991, and mining commenced in December 1991. |
| ● | 1992-2011: In 1998, prospecting and mapping was conducted by Claude Resources and several new discoveries were made, including the Porky West zone in 2002, the Santoy 7 deposit in 2004, the Santoy 8 and Santoy 8 East deposits in 2005, and the Santoy Gap deposit in 2010. Permit applications were submitted in 2005 to build an all-weather access road and conduct bulk sampling, and permission was subsequently granted to bulk sample the Santoy 7 and Porky West zones. Commercial production at the Santoy 7 deposit was achieved in 2007, and an economic study to evaluate the Mineral Resources at the Santoy 8 deposit was conducted in 2008. Portal construction and surface infrastructure development of the Santoy mine was initiated in late 2009, and environmental studies and permitting for commercial mining of the Santoy 8 and Santoy 8 East deposits was completed in 2010. Underground development continued in 2010, and the Santoy mine advanced towards commercial production in the second quarter of 2011. |
| ● | 2012-2015: The exploration programs conducted by Claude Resources in 2012 and 2013 focused on the Santoy Gap deposit and establishing its geological and structural relationship to the Santoy 8 deposit. In February 2013, a shaft extension project was completed at the Seabee mine to reduce trucking distance and ore handling. In 2014, the ventilation raise at the Santoy Gap deposit was completed and production was initiated. During 2015, an underground drill chamber was completed to begin drill testing the plunge continuity of the Santoy 8 deposit. The Seabee Gold Operation has produced over 1 million ounces of gold since production began in 1991. |
On May 31, 2016, we completed the acquisition of Claude Resources and the Seabee Gold Operation for total consideration of approximately 37.4 million SSR Mining common shares and cash consideration of $0.2 million.
Geological Setting, Mineralization and Deposit Types
Regional Geology
Northern Saskatchewan forms part of the Churchill Province of the Canadian Shield and has been subdivided into a series of litho-structural crustal units, of which the Seabee Gold Operation is located within the Glennie domain of the Proterozoic Trans-Hudson Orogen. The Trans-Hudson Orogen is divided into two distinctive zones: the Cree Lake Zone, composed of early Proterozoic continental shelf sedimentary rocks that overlie Archean rocks of the Hearne Province to the west; and the Reindeer Zone, comprised of mid-oceanic ridge basalts, oceanic island-arc basalts, inter-arc volcanogenic sedimentary rocks, and molasse-type sedimentary rocks. Plutonic rocks of various ages and compositions intrude the supracrustal sequences. The Reindeer zone is further subdivided into litho-tectonic domains based on similarities of lithology, metamorphic grade, and structure, of which the Glennie domain is one such component.
Local and Property Geology
The Seabee Gold Operation is located within the northern portion of the Pine Lake greenstone belt. The belt has a strike length in excess of 50 kilometers and comprises a variety of geochemically distinct tholeiitic mafic volcanic rocks formed in juvenile island arc settings, along with contemporaneous mafic intrusive rocks, volcaniclastics, sediments and felsic intrusions of varying age. Metamorphic grade across the Pine Lake greenstone belt ranges from upper greenschist to upper amphibolite, with the Seabee Gold Operation hosted in the latter. The belt has been complexly folded by at least four major phases of deformation that are observed across the Seabee Gold Operation site and elsewhere in the Glennie domain of the Proterozoic Trans-Hudson Orogen.
- 37 -
The Seabee Gold Operation can generally be subdivided into three main geologic domains:
| ● | The Seabee mine area is hosted within a coarsely-layered mafic intrusion dominated by gabbro in the mine sequence; |
| ● | The Santoy mine area is hosted within a sequence of mafic volcano-sedimentary rocks separated by generally north-south trending thrust faults; and |
| ● | The Porky deposit area is a mineralized trend hosted along a 12-kilometer long openly folded unconformity, separating arenaceous sedimentary rocks of the Rae Lake synform to the north from mafic volcanic rocks of the Seabee mine area to the south. |
Mineralization
Gold mineralization at the Seabee mine is hosted within an extensive network of sub-parallel shear structures, which crosscut the Laonil Lake intrusive complex. Vein mineralogy is dominantly quartz with pyrite, pyrrhotite and chalcopyrite, and accessory tourmaline and carbonate. Gold occurs primarily as free, finely-disseminated flakes and films replacing pyrite or at sulphide boundaries. Higher grade gold values are most often associated within sulphide rich zones or at vein junctions. Silicification is the most common alteration type observed at the Seabee mine.
Gold mineralization at the Santoy mine is hosted within calc-silicate altered shear structures with diopside-albite +/- titanite-bearing quartz veins, and occurs in gold-sulphide-chlorite-quartz veins in the shear zones, near or in the granodiorite and granite sills. Diopside-albite calc-silicate alteration facies are the main host to gold mineralization in the Santoy 8A and Santoy Gap 9A, 9B and 9C zones. The Santoy Gap deposit occurs along a major inflection of the Santoy Shear zone between the Santoy 7 and Santoy 8 deposits.
At the Porky deposit, the brittle-ductile lode gold system is hosted along a thick corridor of calc-silicate altered mafic volcanics and arenaceous sedimentary rocks that straddle a major unconformity along the southern margin of the Rae Lake synform. Both the Porky Main and Porky West deposits are characterized by the same calc-silicate alteration package, however, the unconformity and arenites host most of the auriferous quartz veins at the Porky West deposit.
The table below provides the key stratigraphic and structural elements controlling the mineralization at each of the Seabee Gold Operation deposits:
| Area | Deposit Name |
Main Control on Mineralization |
Host Rock | Strike- length (m) |
Vertical Extent (m) |
Thickness (m) |
Preferred Trend in Plan | |||||||
| Seabee | L62 |
Quartz-tourmaline veins in shear zones | Laonil Lake Intrusive Complex gabbro | 150 | 700 | 1 to 11 | E | |||||||
| 2 Vein |
Quartz-tourmaline veins in shear zones | Laonil Lake Intrusive Complex gabbro | 1,800 | 1,400 | 2 to 7 | ENE | ||||||||
| 5-1 Shear |
Quartz-tourmaline veins in shear zones | Laonil Lake Intrusive Complex gabbro | 800 | 1,100 | 1 to 11 | ENE |
- 38 -
| Area | Deposit Name |
Main Control on Mineralization |
Host Rock | Strike- length (m) |
Vertical Extent (m) |
Thickness (m) |
Preferred Trend in Plan | |||||||
| Santoy |
Zone 7 |
Quartz veins in diopside-albite (calc-silicate) altered shear zones | Mafic metavolcanic rocks and lesser dioritic to granodioritic sills | 330 | 120 | 2 to 10 | N | |||||||
| Zone 8 |
Quartz veins in diopside-albite (calc-silicate) altered shear zones | Mafic metavolcanic rocks and lesser dioritic to granodioritic sills | 600 | 500 | 2.5 to 7 | NW | ||||||||
| Zone 8 East |
Quartz veins and flooding in sheared and isoclinally folded granodiorite | Granodiorite stock in fold nose near hanging wall contact with mafic metavolcanic rocks | 200 | 250 | 1.5 to 15 | NNW | ||||||||
| Gap |
Quartz veins in diopside-albite (calc-silicate) altered shear zones | Mafic metavolcanic rocks and lesser dioritic to granodioritic sills | 650 | 650 | 2 to 30 | NW | ||||||||
| Gap HW |
Quartz veins in sheared and fractured granodiorite intrusive | Granodiorite intrusive | 400 | 800 | 1 to 20 | N | ||||||||
| Porky |
Porky Main |
Quartz veins in diopside-chlorite-actinolite (calc-silicate) altered shear zones. | Mafic metavolcanic rocks and to a lesser extent arenaceous sedimentary rocks. | 280 | 180 | 1 to 4 | SSE | |||||||
| Porky West |
Quartz veins in silicified calc-silicate altered shear zones | Arenaceous sedimentary rocks and to a lesser extent mafic metavolcanic rocks | 400 | 250 | 1.5 to 12 | E |
Deposit Types
Each of the Seabee mine, Santoy mine and Porky deposits host mesothermal, quartz-vein hosted lode gold deposits developed in major brittle-ductile to ductile shear systems. The gold mineralization throughout the Seabee Gold Operation exhibits complex geometrical patterns attributed to a combination of structural and/or lithological controls.
Exploration at the Seabee Gold Operation is guided by applying techniques consistent with the identification and discovery of other quartz-vein lode gold systems. Airborne magnetic data is used in surface exploration to identify structural corridors and asymmetrical features, folds and target areas that are known to host gold on the property. This geophysical data is used in conjunction with regional and detailed geological mapping to identify major zones of shearing and alteration, of which calc-silicate alteration has proven to be the most prospective variety on the property.
Geochemical soil sampling is also used as a regional exploration technique to identify gold and trace element vectors associated with Seabee-style gold mineralization, and has successfully identified gold mineralization at various locations across the property. Once targets have been delineated by the above exploration methods, diamond drilling at wide
- 39 -
spacing is used to test the structural systems to allow for our minimum threshold deposit size to be identified based on observed local grade.
Exploration
After our acquisition of the Seabee Gold Operation, we performed a review of all exploration activities conducted on the property by previous operators. In addition to the data review, we executed an exploration program that included detailed mapping of the Herb West and Santoy Lake areas, as well as the collection of accompanying soil samples to be submitted for gold assay. Limited anomalous occurrences were identified from grab and soil sample results, and no new showings or gold in soil trends were recognized. We plan to map additional regions to the north and east within the Herb Lake area as additional shear zones are targeted.
In 2016, we completed a high resolution airborne magnetic and radiometric survey over the most recently staked portion of the Seabee Gold Operation land package. The survey block covered an area of 22.9 kilometers by 15.0 kilometers and included 150 survey lines and 25 tie lines that totaled 1,815-line kilometers. Selected suspect anomalies were re-flown for confirmation, specifically those found on a single flight line. Survey overview maps (flight lines and digital terrain model), magnetic maps (total magnetic intensity, residual magnetic intensity and calculated vertical gradient of the residual magnetic intensity), and radiometric maps were produced, with the objective of identifying potential new targets for gold mineralization on the Seabee property. The magnetic data was collected to better observe the structural nature of the underlying bedrock and, where possible, determine major breaks in the regional stratigraphy along which shear zones can propagate, and the radiometric data was used to determine the relative amounts of uranium, thorium and potassium in the surficial rocks and soils to be used for the mapping of bedrock lithology, alteration and structure. The resultant data were found to be consistent with the structure of the bedrock and major lithological breaks previously interpreted by geological mapping, air photo interpretation and drilling. The data was also consistent with the two-dimensional structural architecture and intensity of previously flown surveys within juxtaposed survey blocks.
In 2017, greenfields exploration at the Seabee Gold Operation included the completion of a soils grid in the area of the Santoy mine. The results showed the down-ice dispersion of anomalous gold values associated with the Santoy shear zone, including the Carr target, which is the northern extension of the Santoy shear zone located four kilometers north from Santoy Gap.
In 2018, we completed field-based programs of mapping, continued overburden geochemical surveys of soils and tills, prospecting, and drill testing of first pass targets on the extension of the Santoy shear zone identified along the length of the Fisher project. See “Mineral Properties – Projects – Fisher Project, Saskatchewan, Canada” for further details.
Drilling
Prior to our acquisition of the Seabee Gold Operation, and as at December 31, 2015, a total of 2,037 surface boreholes totaling approximately 389,281 meters and 4,818 underground boreholes totaling approximately 861,514 meters had been completed on the property.
From and after December 31, 2015, a total of 169 surface boreholes for approximately 69,550 meters of surface drilling and 739 underground boreholes for approximately 178,701 meters of underground drilling were completed, as set out in the table below.
- 40 -
| Drilling Program |
Company | No. Surface |
Surface Meters Drilled(1) |
No. Underground Boreholes |
Underground Meters Drilled(1) |
Total Boreholes |
Total Meters(1) |
|||||||||||||||||||
| 1947- |
Various mining companies (Cominco, Claude Resources, Placer) | 278 | 35,419 | 77 | 6,491 | 355 | 41,910 | |||||||||||||||||||
| 1989- |
Claude Resources | 1,759 | 353,862 | 4,741 | 855,023 | 6,500 | 1,208,885 | |||||||||||||||||||
| 2016 | Claude Resources/ SSR Mining | 51 | 19,817 | 306 | 65,021 | 357 | 84,838 | |||||||||||||||||||
| 2017 | SSR Mining | 49 | 25,344 | 201 | 61,180 | 250 | 86,524 | |||||||||||||||||||
| 2018 | SSR Mining | 69 | 24,389 | 232 | 52,500 | 301 | 76,889 | |||||||||||||||||||
|
Total |
2,206 | 458,831 | 5,557 | 1,040,215 | 7,763 | 1,499,046 | ||||||||||||||||||||
Note:
| (1) | Figures have rounding applied. |
1947 to 1988 Drilling Programs
Between 1947 and 1950, Cominco identified four gold-bearing structures or zones on the Seabee property. In 1961, Cominco conducted its drilling program as part of an overall review of the known property data. In 1974, Cominco drilled to test additional vein structures, and commenced a further drilling program in 1982-1983, but did not complete the entire program before selling the property.
Upon its acquisition of the property, Claude Resources conducted drilling to corroborate Cominco’s prior work and property estimates. From June 1985 to June 1988, pursuant to an option agreement with Claude Resources, Placer carried out an extensive surface and underground drilling program.
1989 to 2015 Drilling Programs
Seabee Area
In 1994, Claude Resources conducted a drilling program to test gold-bearing structures identified the previous year during a prospecting program. In 1996, drilling defined the 10 zone, identified the previous year and found adjacent to the western boundary of the Seabee mine. Diamond drilling in 1997 explored the vein extensions of the 10 Vein and 2C Vein structures. The 1999 drill program focused on an area southwest of the Seabee mine trend.
As follow-up, the majority of boreholes in 2000 were collared to the west of mining lease ML 5520 in the Bird Lake area, to explore for mineralized structures parallel to the Seabee 2 Vein. Targets in the Porky Lake and Pine Lake areas were also tested. Six additional remote targets, namely the Scoop, Porky, Herb, Pine, East and West Bird Lakes were explored in 2001, with anomalous gold values encountered within variably sheared host rocks.
In 2002, drilling focused on a laterally extensive geochemical soil anomaly on the west shore of Porky Lake, and on a series of quartz-bearing shear structures north and east of the No. 5 ramp access. The drill program successfully discovered the Porky West zone and produced elevated gold values over narrow widths at the No. 5 ramp access.
Drilling in 2003 in the Porky area discovered the Porky West zone, an arenite-hosted high-grade gold lens. Subsequent drilling in 2004 focused on delineation drilling at the Porky Main and Porky West zones, and exploration drilling on the eastern limb of the Porky Lake anticline targeted the contact between the mafic metavolcanics rocks and feldspathic arenite. A small diamond drill program was completed in 2009, which extended the down plunge extent of the Porky West ore shoots.
- 41 -
Evaluation of the Neptune target, located approximately six kilometers north of the Seabee mine, was the focus of exploration in 2010. Exploration efforts in 2011 tested the 1.8-kilometer strike length of the soil anomaly to vertical depths of up to 250 meters, and in 2012, further drilling at the Neptune target confirmed the sporadic nature of the gold-bearing system.
Santoy Area
Prospecting and geological mapping in 1998 resulted in the discovery of numerous new veins in the Santoy area. The targets were drill tested in 2002 with encouraging results and became the focus of additional exploration programs leading to the discovery of the Santoy 7, Santoy 8 and Santoy 8 East deposits in 2004 and 2005. Drilling of the Santoy 8 and Santoy 8 East zones in 2005 was aimed at testing the north-northwest plunge and dip extensions of the mineralized shear structures outlined in previous drill programs. Infill drilling continued in 2007 to collect information for proposed mine plans with 25-meter infill data to a depth of 250 meters completed on the Santoy 8 and Santoy 8 East deposits.
Exploration drilling in 2010 targeted the Santoy Gap area to test the Santoy shear system between the Santoy 7 and Santoy 8 deposits, as well as to continue to investigate the down plunge continuity of the Santoy 8 and Santoy 8 East deposits. Results from the program outlined continuity at depth for both the Santoy 8 and Santoy 8 East deposit.
Drilling defined the Santoy Gap deposit in 2011. Multiple high-grade intervals were intercepted, expanding the strike length and width of the known mineralization. During 2012, exploration focused on defining the relationship between the Santoy Gap and Santoy 8 deposits to depths up to 750 meters. Infill and exploration drilling around the Santoy Gap lens and Santoy Shear zone continued to confirm and expand the Santoy Gap system and identified a sub-parallel lens approximately 150 meters east of the Santoy Gap deposit.
In 2013, surface drilling programs targeted the down plunge extension of the Santoy Gap and Santoy 8 deposits, resulting in two out of three step-out boreholes returning high grade gold intercepts. The Santoy Gap system was extended down plunge to 650 meters depth and the Santoy 8 deposit was extended 400 meters below the base of the previously-estimated Inferred Mineral Resources.
Underground drilling in 2014 focused on defining and expanding Mineral Reserves and Mineral Resources at the Santoy Gap deposit. Results identified high grade and promising widths of gold mineralization hosted within three vein systems, named the Santoy Gap 9A, 9B and 9C deposits. Additional underground drilling in 2015 focused on the expansion of Mineral Reserves and Mineral Resources at the Santoy Gap deposit, and a 6,000-meter drill program targeted the plunge continuity of the Santoy 8 deposit. Results from the Santoy Gap up-dip drilling demonstrated the potential for expansion of the deposit, and drilling results within, down-dip and down plunge also increased confidence in the continuity of the deposit at depth.
2016 to 2018 Drilling Programs
In 2016, an underground diamond drilling program to upgrade Inferred Mineral Resources and explore the extension of the Santoy 8A and Santoy Gap deposits was completed. From surface, drilling was conducted to upgrade the up-plunge extension of the Santoy Gap 9A, 9B and 9C deposits as well as to complete deeper infill drilling on the Santoy 8A Inferred Mineral Resources. At the Seabee mine, drilling was completed on the 15 Vein target. Results from drilling at each of the Carr and Herb West targets revealed shear-hosted quartz-veining structures with gold-bearing sulphide mineralization, which warranted follow-up drilling in 2017.
In 2017, we undertook a program of underground and surface drilling with the objective of increasing and converting Mineral Resources to Mineral Reserves at Santoy and demonstrating the exploration potential of several drill-ready targets for discovery of mineralization to utilize nearby infrastructure. Underground drilling further explored the Santoy 8A and Santoy Gap deposits. Drilling at Santoy 8 focused on upgrading existing Mineral Resources at the Santoy 8A vein and drilling at Santoy Gap aimed to increase or upgrade Inferred Mineral Resources. Surface exploration drilling focused on each of the Carr, Herb Lake, Porky Main, Porky West, Seabee, and Santoy areas.
- 42 -
In 2018, we undertook a program of underground and surface drilling with the objective to maximize Mineral Resource to Mineral Reserve conversion on the Santoy 8 and Santoy Gap zones. Discovery and exploration of the Santoy Gap hanging wall (“HW”) resulted in an initial Inferred Mineral Resource reported in this mineralized structure, sitting adjacent to the Santoy main ore zones.
Sampling, Analysis and Data Verification
Sample Preparation and Analysis
All underground samples are assayed at our on-site non-accredited Seabee Gold Operation laboratory. Samples are dried for 30 to 60 minutes, crushed to 10 mesh, and riffle split using a Jones splitter until only 200 grams of material remains. The samples are then pulverized in a ring and puck pulveriser until greater than 80% passes through a 200-mesh screen. Thirty grams of pulp material is then analyzed for gold by FA with gravimetric finish using a 0.01 g/t gold detection limit.
Most surface drilling samples are assayed at TSL Laboratories Inc. (“TSL”) in Saskatoon, Saskatchewan. TSL is independent from SSR Mining. Upon receipt of samples, TSL attaches a bar code label to the original sample bag, and the label is scanned to record the sample weight, date, time, equipment used and operator name, allowing for complete traceability of each sample during the laboratory process. Samples are crushed to 70% passing 10 mesh in two stages. The crushed reject is homogenized by passing it once through a Jones riffle splitter down to 250 grams and then recombining the two halves, from which 250 grams are split using the same riffle splitter. The split is then ring pulverized to 95% passing 200 mesh. Samples are analyzed for gold by 30-gram FA with gravimetric finish using a 0.03 g/t gold detection limit. Pulps and rejects are stored in containers on the TSL laboratory property. TSL employs comprehensive QA/QC protocol and control charts for standards assayed at the laboratory show routine performance within two standard deviations of the certified value. The relative precision for gold meets contract specifications and established limits.
Chip and muck samples are bagged, tagged with a unique identification number and transported to the Seabee Gold Operation laboratory for analysis following the same methodology as described above.
Quality Assurance/Quality Control Procedures and Data Verification
In 2006, the Seabee Gold Operation geology department introduced an analytical QA/QC program to verify the accuracy of the internal, non-accredited assay laboratory. Since our acquisition of Claude Resources, we have adopted and modified this program, which now involves the insertion of CRM, duplicate assays, and monthly umpire check assays at TSL.
CRM is inserted by a mine geologist at a frequency of one per 20 samples, regardless of the sample type. Three distinct CRM samples are typically cycled through the process: one low grade, one average grade and one high grade. The mine geologist records the identification numbers of the CRM samples introduced into the assay stream, and checks them as a pass or fail upon receipt of laboratory results. Assay batches with failed CRM results are re-analyzed. CRM results are recorded digitally in a spreadsheet provided by Rocklabs to track the pass and fail rates of each of the various reference materials used. The results are compiled in a monthly report and shared with the relevant departments involved in the process.
On a monthly basis, an average of 20 pulp samples are submitted for external analyses by TSL. CRM is included in each batch of external check samples, and a sieve analysis is performed on one of the pulps to determine percentages passing through -150 and -200 mesh. Results from the analyses at TSL are compared to the on-site laboratory results and included in a monthly report.
- 43 -
A blank sample of a coarse-grained quartz rich rock is inserted after every sample containing visible gold, and pulp duplicates are run every tenth sample by the laboratory. Blanks were used and recorded from 2010 to 2014.
We review the results from such control samples to accept the data from each individual batch or to reject the data and request a re-run. A batch is rejected if the result for the standard exceeds the tolerance of the 95% confidence level stated on the standard’s certificate. The failure trigger for pulp duplicates is less defined due to the lode-gold nature of the mineralization; however, batches are considered for re-run when duplicate assay values are greater than ±10 percent. With respect to coarse-grained blanks, sample batches are rejected if the result is greater than three times the detection limit of the laboratory.
Sample Security
Drill core is monitored by our staff from the time it is taken out of the ground until it is split, and the samples are delivered to the laboratory. Unauthorized personnel are not permitted access to the drill machines or the core logging and splitting facility. Samples that are split for assaying are double-bagged within the splitting facility and identified with a coded security tag. Upon receipt of samples at the laboratory, any sample tags that are broken or any sample bags that appear to have been tampered with are reported by the laboratory.
Mining Operations
In 2018, the Santoy mine supplied 93% of ore milled, predominantly from long hole stopes; the remaining ore was sourced from the Seabee mine, which was closed in the second quarter of 2018. Mineral Reserves and Mineral Resources estimates for the Santoy mine deposits represent an opportunity due to their proximity to permitted mine infrastructure, low development cost and near-term production potential.
We use a variety of mining methods to extract ore from the deposits at the Seabee Gold Operation. The selection of the method is dependent upon a variety of factors, including, among others, orebody geometry, dip, location, personnel and equipment availability.
Access underground at the Santoy mine is provided from surface at the Santoy portal via a main ramp. Sublevels are typically spaced 17 meters vertically. Stopes are mined and will continue to be mined via a longhole mining method. The length of the stopes varies based on deposit geometry and geotechnical guidance. The planned stopes range in width from 2.2 meters to 26 meters and can be up to 40 meters in length. The sill drifts on the levels are connected to a ramp to permit access for the rubber-tired mobile equipment fleet. Longhole drills are used to drill down from the top level to breakthrough into the bottom level of the stope. Once mined, where sequencing and access requirements dictate, stopes are backfilled with waste rock or cemented waste rock. The mining sequence will continue to proceed in several longitudinally retreating, bottom-up advancing mining fronts. Current practice for material handling involves ore being truck hauled to the surface and then hauled 14 kilometers to the mill located at the Seabee mine.
Processing, Recovery and Metallurgical Testing
Material is processed at the mill constructed immediately adjacent to the Seabee mine shaft. The initial capacity of the mill was 500 tonnes per day, which was later expanded to a nameplate capacity of 1,000 tonnes per day, with the addition of a third grinding mill in 2005. In 2017 and 2018, we began to implement the expansion scenario contemplated in the PEA to increase mining and milling rates. See “Exploration, Development and Production” below.
The mill flowsheet is a conventional crushing and grinding circuit employing gravity concentration and cyanide leaching and carbon-in-pulp for recovery and production of doré gold on site. An addition to the gravity recovery circuit was installed in 2018 and is expected to increase the gravity gold recovery and reduce the limitations of the main cyanide leach circuit.
- 44 -
Historic recovery at the Seabee mill was in the 94% to 96% range, with routine low levels of losses both in the tailings solids and solution. Current recovery estimates are 97.2% based on recent mill performance. These improvements are attributed to the better condition of the leach equipment as well as improved operating standards.
The Seabee Gold Operation was originally developed on bench scale metallurgical test work that characterized the Seabee deposit as a lode gold style of mineralization that was free milling and that would respond to a standard flowsheet employing gravity recovery and cyanidation. After the successful commissioning of the Seabee mill and the operation matured into exploration in the surrounding area, the mill became the reference flowsheet and recovery for other mineralization that was identified as a possible mill feed source.
The Seabee Gold Operation deposits, as well as other deposits in the surrounding area, are lode gold style deposits with the gold in quartz veins typically in shear zones with some variations of the host rock mineralization, with gabbros at Seabee and mafic metavolcanics at the Santoy and Porky deposits. As the satellite deposits advanced to potential development, bench scale testing was employed to confirm the free milling potential and the presence of any deleterious elements. This was followed with testing bulk samples in 2007 and 2008 in the Seabee mill when the economics of the deposits were being evaluated. No significant issues were identified in any of these criteria with respect to the Porky West and Santoy 7 ore bulk samples. Santoy 8 and Santoy Gap ore is currently being processed, with slightly higher recoveries than the Seabee deposit.
In 2014, the mill operation was the subject of an independent review, which evaluated its equipment and its achieved results. In 2016, the leach and absorption circuits were assessed by bench scale testing at an independent laboratory and a separate laboratory reviewed the carbon activity and regeneration results of the Seabee operating practices. It is expected that the limitations of both areas will be alleviated by the expansion of the recently completed gravity recovery circuit.
Infrastructure, Permitting and Compliance Activities
Infrastructure
The major infrastructure at the Seabee Gold Operation site includes roads and an airstrip, powerhouse and electrical distribution system, mill buildings and related services facilities, Seabee shaft and headframe, portals and ventilation raises, fuel storage, explosive storage, water supply and distribution, water management ponds and water treatment plant, tailings management facilities, administrative buildings, and camp accommodations.
The Seabee Gold Operation can be accessed by a winter road, which begins at Highway 102 near the community of Brabant Lake, Saskatchewan. The majority of annual supplies are transported to site via the winter road typically throughout the period of January through mid-April depending on ice quality. The two mines are connected via a 14-kilometer haul road. This access road is a one-way road that has specific travel convoy times throughout the day. There are also several miscellaneous roads throughout both the Seabee mine and Santoy mine sites that provide access to infrastructure.
Electrical power is provided by a transmission line by the provincial power authority, Saskatchewan Power Corporation. The Seabee Gold Operation is connected to a 138-kV hydroelectric power line from Island Falls, Saskatchewan. The supply of potable water is obtainable locally through a potable water system.
There are currently two tailings management facilities that are being used by the mill: the East Lake tailings management facility (the “East Lake TMF”); and the Triangle Lake tailings management facility (the “Triangle Lake TMF”). Tailings deposition alternates between the two tailings management facilities where winter deposition occurs in the Triangle Lake TMF and summer deposition is in the East Lake TMF. To ensure that water treatment volumes are attained, a new water treatment plant at East Lake TMF was constructed in 2017.
- 45 -
The remaining storage capacities of our tailings management facilities, based on the planned production rates in the Seabee Gold Operation Technical Report, will potentially reach maximum capacity in early 2021. We have therefore embarked on an expansion to tailings capacity at the Triangle Lake TMF in excess of that contemplated in the Seabee Gold Operation Technical Report. The detailed design for such expansion project was submitted to the Saskatchewan Ministry of Environment in August 2018 and received final regulatory approvals in January 2019. We expect the first phase of the Triangle Lake TMF expansion project to be completed in 2020.
Environmental, Permitting and Social Responsibility
The Seabee Gold Operation has been in production since 1991. During this period, three environmental assessments have been successfully completed for the Seabee Gold Operation. In all three environmental assessments, no significant potential environmental impacts were identified that could not be mitigated through the implementation of management plans. Subsequently, Ministerial Approvals to proceed to construction and operation were granted. The Triangle Lake TMF, as well as the Santoy mine projects, were previously screened by the applicable regulators in 2001 and 2009, respectively. The Seabee Gold Operation has never required a federal environmental assessment.
Generally, impacts of mining on the local environment result from mill tailings and associated tailings effluent. Surface and groundwater monitoring are undertaken as required under applicable laws. Appropriate infrastructure and operational plans are in place to reduce operational and closure risks associated with these liabilities to acceptable levels.
There are no known environmental concerns at the Seabee Gold Operation that cannot be successfully mitigated through the implementation of the various approved management plans that have been developed based on accepted scientific and engineering practices.
We have initiated a thorough stakeholder engagement plan designed to strengthen our relationship with neighbouring communities and the existing social license to continue operations of the site. This engagement plan focuses on and includes each of the Lac La Ronge Indian Band, Peter Ballantyne Cree Nation, and the La Ronge, Air Ronge, Stanley Mission, Brabant Lake and Southend communities. No significant public concern with the Seabee Gold Operation was expressed during stakeholder engagement meetings held in 2018. Continual effort has been made at the Seabee Gold Operation to engage the nearby communities to maximize northern employment opportunities as well as the local purchase of goods and services to support the mine.
In accordance with provincial regulations, an updated decommissioning and reclamation plan and cost estimate has been submitted for the Seabee Gold Operation every five years, since 1996. Most recently, we prepared and filed an update to the preliminary decommissioning and reclamation plan in January 2017. The closure plan addressed issues involving environmental protection and public safety and assessed water quality, rehabilitation and reclamation, and release of the property, following the successful implementation of the closure plan, back to the province.
Capital and Operating Costs
The capital and operating cost estimates derived for the Seabee Gold Operation are based on a combination of the data set forth in the Seabee Gold Operation Technical Report and budgetary estimates, and reflect our current estimates as of December 31, 2018. Such estimates assume the implementation of the development and expansion scenario contemplated in the PEA. See “Exploration, Development and Production” below.
- 46 -
Capital costs are considered to be sustaining capital and are estimated to be $132.2 million for the life of the Seabee Gold Operation. This total does not include capitalized exploration costs. The life of mine capital costs estimate is shown in the table below.
|
Capital Costs
|
Total ($ Millions) | |
|
Capital Development
|
44.4 | |
|
Mine Equipment
|
24.1 | |
|
Other Sustaining Capital
|
63.6 | |
|
Total Capital Costs
|
132.2 |
The breakdown of estimated operating costs for the life of mine is shown in the table below.
|
Operating Costs
|
$/tonne milled | |
|
Mining and Maintenance
|
72.98 | |
|
Processing
|
23.08 | |
|
G&A
|
48.58 |
Costs in individual years may vary significantly as a result of, among other things, current or future non-recurring expenditures, changes to input costs and exchange rates, and changes to our current mining operations or mine plan.
Exploration, Development and Production
On September 7, 2017, we reported the results of a PEA for the Seabee Gold Operation, which evaluated an expansion scenario to a sustained mining and milling rate of 1,050 tonnes per day for a seven-year period. We subsequently filed the Seabee Gold Operation Technical Report in support of the PEA, and began to implement the development and expansion scenario contemplated in the PEA. Based on the PEA, estimated gold production at the Seabee Gold Operation would average 100,000 ounces per year over the period from 2018 to 2023, with an estimated peak gold production of 120,000 ounces in 2020. The PEA is preliminary in nature and includes Inferred Mineral Resources that are considered too speculative geologically to have the economic considerations applied to them that would enable them to be categorized as Mineral Reserves. Mineral Resources that are not Mineral Reserves do not have demonstrated economic viability.
In 2019, we expect to continue executing our plan of increasing mining and milling rates at the Seabee Gold Operation as contemplated in the PEA and to deliver another record gold production year. The plan includes investment of $7 million in underground mining equipment to increase capacity and reliability. Due to continued exploration success, we are embarking on an expansion to tailings capacity in excess of that contemplated in the Seabee Gold Operation Technical Report. The investment for the first phase of such expansion project is expected to be $15 million in 2019, with the remaining sustaining capital investments related to the mill and surface infrastructure. Capitalized development expenditures of $12 million support higher mining rates and reflect the development strategy for the Santoy complex. Exploration expenditures at the Seabee Gold Operation total $6 million, including a 68,000-meter drill program, to continue underground exploration at depth, expansion of Santoy Gap HW and continued testing of surface targets.
- 47 -
PUNA OPERATIONS
Puna Operations is a joint venture comprised of the Pirquitas and Chinchillas properties located in Jujuy, Argentina, owned on a 75%/25% basis by SSR Mining and Golden Arrow, respectively, and operated by SSR Mining. The Pirquitas property achieved commercial production in 2009, with mining of the San Miguel open pit ceasing in January 2017. Chinchillas is a silver-lead-zinc deposit located approximately 45 kilometers by road from the Pirquitas property.
On September 30, 2015, we entered into an agreement with Golden Arrow (the “Business Combination Agreement”), pursuant to which Golden Arrow granted us an option to form a joint venture to combine the Chinchillas property and the Pirquitas property. On March 31, 2017, we exercised our option and made an option exercise payment of $13.0 million to Golden Arrow on closing of the transaction, which occurred on May 31, 2017. We subsequently filed the Chinchillas Technical Report, which evaluates the development and construction of an open-pit mine and supporting infrastructure to supply ore to the Pirquitas processing facilities over an eight-year active mining period. A copy of the Chinchillas Technical Report is available under our profile on the SEDAR website at www.sedar.com or on our website at www.ssrmining.com.
In 2018, activities required to support sustainable ore delivery from the Chinchillas mine to the Pirquitas plant were completed, including pre-stripping of the pit, completion of road bypasses, refurbishment and mobilization of the haul truck fleet, and construction of the crushed ore stockpile dome at the Pirquitas site. We declared commercial production at the Chinchillas mine on December 1, 2018, and ore feed to the Pirquitas plant has been sourced from the Chinchillas mine since that date. Certain infrastructure and remaining road upgrades within the scope of the Chinchillas project continued into the first quarter of 2019 with remaining capital expenditures totaling $9 million.
With commercial production of the Chinchillas open pit achieved, 2019 marks the first anticipated full year of ore production from the Chinchillas mine transported for processing at the Pirquitas plant.
Exploration activities in 2018 were limited to the collection of detailed drone magnetic data at the Chinchillas and Pirquitas mine areas. We also evaluated the potential for an underground mine at the Pirquitas deposit to provide supplemental ore to the Pirquitas mill. The study confirmed a technically feasible and economic project, however with a return below our investment thresholds at current metal prices. We have budgeted $1 million in 2019 for a 3,000-meter drill program to test for extensions to the mineralization that could have a positive impact on the project economics.
PROJECTS
Pitarrilla Project, Mexico
The Pitarrilla project is a wholly-owned silver project located within the Municipality of Santa María del Oro and Indé, on the eastern flank of the Sierra Madre Occidental mountain range in the central part of Durango State, Mexico. The project is held by our wholly-owned subsidiary, SSR Durango, S.A. de C.V.
On December 17, 2012, we filed a technical report entitled “NI 43-101 Technical Report on the Pitarrilla Project, Durango State, Mexico” (the “Pitarrilla Technical Report”) in support of the feasibility study. A copy of the Pitarrilla Technical Report is available under our profile on the SEDAR website at www.sedar.com or on our website at www.ssrmining.com.
In October 2013, the Mexican government approved certain amendments to Mexico’s mining taxation system to impose new taxes and royalties on mining activities. Given the significance of these changes, we deferred the open pit construction decision, placed project activities on hold and initiated a thorough review of the mine and plant options at the Pitarrilla project in the fourth quarter of 2013. In February 2014, we were advised that the federal environmental regulator in Mexico, Secretaría de Medio Ambiente y Recursos Naturales (SEMARNAT), did not approve the EIA for the Pitarrilla open pit mine.
- 48 -
In June 2017, we obtained from the Comisión Nacional del Agua (CONAGUA) the water permits required for mining operations for the use of up to a total of 2.5 million cubic meters of water per year.
In 2018, we advanced a study evaluating the potential for an underground mine at the Pitarrilla project. The study confirmed a technically feasible and economic project; however, with a return below our investment thresholds at current metal prices. We are conducting a review of the geological model evaluating structural controls that may define higher grade areas that were potentially underestimated in the model originally developed for open pit purposes.
We continue to keep the Pitarrilla project in good standing and fulfill our community and other project-related commitments.
San Luis Project, Peru
The San Luis project is a wholly-owned high-grade gold-silver project located in the Ancash Department of central Peru. The project is held by our wholly-owned subsidiary, Reliant Ventures S.A.C.
On June 4, 2010, we filed a NI 43-101 technical report entitled “Technical Report for the San Luis Project Feasibility Study, Ancash Department, Peru” (the “San Luis Technical Report”), which summarized our feasibility study on the Ayelén vein at the San Luis project. A copy of the San Luis Technical Report is available under our profile on the SEDAR website at www.sedar.com or on our website at www.ssrmining.com.
In September 2012, Peru’s Ministry of Mines and Energy approved the EIA for the mining operation of the Ayelén deposit, completing a significant milestone for the San Luis project. Based on the preliminary and early works we conducted in respect of the project in 2017, the EIA now has no expiry date.
The San Luis project includes several vein systems across an area of land whose surface rights are held by two local communities, Ecash and Cochabamba. The execution of the San Luis project requires land access and use negotiations to be completed with both of these communities. We continue to progress strategies for community engagement and for advancing the San Luis project.
Fisher Project, Saskatchewan, Canada
On October 6, 2016, we announced an option agreement with Eagle Plains to acquire up to an 80% interest in the Fisher project, which is contiguous to the Seabee Gold Operation. In 2018, the Fisher project was spun-out to Taiga Gold Corp. (“Taiga”). The project consists of approximately 34,175 hectares and doubles our prospective land position at the Seabee Gold Operation. The all-weather road connecting the Santoy mine to the Seabee mill and processing facility ends one kilometer from the Fisher property boundary, making for ease of access to the area.
To earn a 60% interest in the Fisher project, we are required to spend C$4.0 million in exploration expenditures and make C$75,000 annual cash payments to Taiga for each of the four years of the option period. We funded the C$0.4 million exploration program conducted by Eagle Plains in 2016, which is included in the C$4.0 million exploration expenditures, and made the annual cash payment of C$75,000 in 2017 and 2018. Upon earning the 60% interest in the Fisher project, we will have a 365-day option period in which to earn an additional 20% interest, for a total of 80%, by making a cash payment of C$3.0 million, at which time an 80%/20% joint venture with Taiga will be formed to advance the project. Taiga will retain a 2.5% NSR royalty, subject to reduction on certain claims by underlying NSR agreements, which may be reduced by 1% at any time upon payment of C$1.0 million by the joint venture until commencement of commercial production. We may terminate the option agreement at any time.
At the Fisher project, our objective is to discover a new zone with Inferred Mineral Resources potential. Work during 2018 comprised mapping, prospecting, soil and overburden sampling, in addition to drilling. Results from the prospecting and drilling identified new gold bearing quartz vein shear zone exposures. The widespread nature of the gold occurrences
- 49 -
at Fisher and their geologic similarities to the Seabee and Santoy mines reinforces our view of prospectivity of this extensive property package.
RISK FACTORS
An investment in our securities is speculative and involves a high degree of risk due to the nature of our business and the present stage of operation, exploration and development of our mineral properties. The following risk factors, as well as risks currently unknown to us, could materially adversely affect our future business, operations and financial condition and could cause them to differ materially from the estimates described in forward-looking statements relating to us, or our business, property or financial results, each of which could cause you to lose part or all of your investment in our securities. You should carefully consider the following risk factors along with the other matters set out in this Annual Information Form.
RISKS RELATED TO OUR BUSINESS AND OUR INDUSTRY
Our production, development plans and cost estimates may vary and/or not be achieved.
We have prepared estimates of future production, operating costs and capital costs for the Marigold mine, the Seabee Gold Operation and Puna Operations, and our technical studies and reports for our projects, including the Marigold Technical Report, the Seabee Gold Operation Technical Report and the Chinchillas Technical Report, contain estimates of future production, development plans, operating and capital costs and other economic and technical estimates relating to these projects. These estimates are based on a variety of factors and assumptions and there is no assurance that such production, plans, costs or other estimates will be achieved. Actual production, costs and financial returns may vary significantly from the estimates depending on a variety of factors many of which are not within our control. These factors include, but are not limited to: actual ore mined varying from estimates of grade, tonnage, dilution, and metallurgical and other characteristics; short-term operating factors such as the need for sequential development of ore bodies and the processing of new or different ore grades from those planned; mine failures, slope failures or equipment failures; industrial accidents; natural phenomena such as inclement weather conditions, inadequate ice thickness for an ice road at the Seabee Gold Operation, floods, droughts, wildfires, rock slides and earthquakes; encountering unusual or unexpected geological conditions; changes in power costs and potential power shortages; exchange rate and commodity price fluctuations; shortages of principal supplies needed for operations, including explosives, fuels, chemical reagents, water, equipment parts and lubricants; labour shortages or strikes; high rates of inflation; civil disobedience and protests; and restrictions (including changes to the taxation regime) or regulations imposed by governmental or regulatory authorities, including permitting and environmental regulations, or other changes in the regulatory environments. Failure to achieve estimates or material increases in costs could have a material adverse impact on our future cash flows, profitability, results of operations and financial condition.
In 2017, we reported the results of a PEA for the Seabee Gold Operation, which provided a mine expansion scenario. The PEA contemplates near-term production growth, extends production to 2024, expands operating margins and improves processing plant performance while requiring low capital investment. In 2018, we made the decision to implement the expansion scenario contemplated in the PEA. The PEA is preliminary in nature and includes Inferred Mineral Resources that are considered too speculative geologically to have the economic considerations applied to them that would enable them to be categorized as Mineral Reserves. Consequently, there is no certainty that the results set out in the PEA will be realized. The decision to implement the expansion scenario is not based on a feasibility study of Mineral Reserves demonstrating economic and technical viability, and therefore there is increased risk that the PEA results will not be realized. If we are unable to achieve the results in the PEA, it may have a material negative impact on us and our capital investment to implement the expansion scenario may be lost.
We may be unable to replace our Mineral Reserves.
We must continually replace our Mineral Reserves depleted by production to maintain production levels over the long term. Mineral Reserves can be replaced by expanding known ore bodies, locating new deposits or making acquisitions. Exploration is highly speculative in nature. Our exploration projects involve many risks and are frequently unsuccessful.
- 50 -
Once a site with mineralization is discovered, it may take several years from the initial phases of drilling until production is possible, during which time the economic feasibility of production may change. Substantial expenditures are required to establish Proven and Probable Mineral Reserves and to construct mining and processing facilities. As a result, there is no assurance that current or future exploration programs will be successful. There is a risk that depletion of our Mineral Reserves will not be offset by discoveries or acquisitions. Our mineral base may decline if Mineral Reserves are mined without adequate replacement and we may not be able to sustain production beyond the current mine lives, based on current production rates. If our Mineral Reserves are not replaced either by the development of additional Mineral Reserves and/or additions to Mineral Reserves, there may be an adverse impact on our future cash flows, earnings, results of operations and financial condition, and this may be compounded by requirements to expend funds for reclamation and decommissioning.
Changes in the market prices of gold, silver and other metals, which in the past have fluctuated widely, will affect our operations.
Our profitability and long-term viability and the economic feasibility of our mineral properties depend, in large part, on the market price of gold, silver, zinc and lead. The market prices for these metals are volatile and are affected by numerous factors beyond our control, including:
| ● | global or regional consumption patterns; |
| ● | the supply of, and demand for, these metals; |
| ● | speculative activities; |
| ● | the availability and costs of metal substitutes; |
| ● | expectations for inflation; and |
| ● | political and economic conditions, including interest rates and currency values. |
We cannot predict the effect of these factors on metal prices. A decrease in the market price of gold, silver and other metals would affect the profitability of the Marigold mine, the Seabee Gold Operation and Puna Operations and could affect our ability to finance the exploration and development of any of our other mineral properties. The market price of gold, silver and other metals may not remain at current levels. In particular, an increase in worldwide supply, and consequent downward pressure on prices, may result over the longer term from increased gold or silver production from mines developed or expanded as a result of current metal price levels.
Political or economic instability or unexpected regulatory change in the countries where our mineral properties are located could adversely affect our business.
We currently conduct operations in the United States, Canada and Argentina, and have exploration projects in Mexico, Peru, Canada and the United States, and as such we are exposed to various levels of economic, political and other risks and uncertainties. These risks and uncertainties vary from country to country and include, but are not limited to: royalties and tax increases or claims by governmental bodies; expropriation or nationalization; employee profit-sharing requirements; foreign exchange controls; restrictions on repatriation of profits; import and export regulations; cancellation or renegotiation of contracts; changing fiscal regimes and uncertain regulatory environments; fluctuations in currency exchange rates; high rates of inflation; changes in royalty and tax regimes, including the elimination of tax exemptions; underdeveloped industrial and economic infrastructure; unenforceability of contractual rights and judgments; loss of social license to operate resulting from a decline in societal support for the industry; loss of critical services such as power and water; and environmental permitting regulations. The occurrence of these various factors and uncertainties cannot be accurately predicted and could adversely affect our business.
Furthermore, the introduction of new tax laws, regulations or rules, or changes to, or differing interpretation of, or application of, existing tax laws, regulations or rules in any of the countries in which our operations or business is located, could result in an increase in our taxes, or other governmental charges, duties or impositions. No assurance can be given
- 51 -
that new tax laws, rules or regulations will not be enacted or that existing tax laws will not be changed, interpreted or applied in a manner that could result in our profits being subject to additional taxation or that could otherwise have a material adverse effect on us.
Additionally, the taking of property by nationalization or expropriation without adequate compensation is a risk in certain jurisdictions in which we have operations. Expropriation, or the threat of expropriation, is often the result of poor economic conditions within a country or has underlying political rationales. Although we do not presently anticipate that any of our properties will be the subject of expropriation, there can be no assurance that this will not occur. Such governmental actions may have an adverse impact on our operations and profitability.
We may be adversely affected by future fluctuations in foreign exchange rates.
We maintain our cash and cash equivalents primarily in U.S. dollars. Our revenues are in U.S. dollars, while certain of our costs will be incurred in other currencies. In particular, any appreciation in the currencies of Canada, Argentina, Mexico and Peru where we carry out exploration or development activities against the U.S. dollar will increase our costs of carrying on operations in such countries. In addition, any decrease in the Canadian dollar or Argentine peso against the U.S. dollar will result in a loss on our books to the extent we hold funds or net monetary assets denominated in those currencies. As a result, our financial performance and forecasts may be significantly impacted by changes in foreign exchange rates. The acquisition of the Seabee Gold Operation has materially increased our Canadian dollar exchange rate risk. In order to mitigate some of this risk, we have entered into certain currency hedging arrangements.
We have incurred losses in the past and may incur losses in the future.
Although we had income from mine operations of $76.8 million for the year ended December 31, 2018, we incurred a net loss of $0.03 million for the fiscal year and have incurred losses in the past. We may continue incurring losses or generating insufficient cash flows, such that the exploration and development of our other mineral properties will require commitment of substantial financial resources that may not be available. The amount and timing of expenditures will depend on a number of factors, including the progress of ongoing exploration and development, the results of analyses and recommendations, the rate of operating profits or losses, the execution of any strategic agreements with third parties and our acquisition of additional property interests, many of which are beyond our control. We cannot assure you that we will achieve consistent profitability.
General economic conditions may adversely affect our growth and profitability.
Market events and conditions, including the disruptions in the international credit markets and other financial systems, in China, Japan and Europe, along with political instability in the Middle East and Russia and currency prices expressed in U.S. dollars may result in commodity price volatility. These conditions have, at times, caused a loss of confidence in global credit markets, resulting in the collapse of, and/or government intervention in, major banks, financial institutions and insurers, and creating a climate of greater volatility, tighter regulations, less liquidity, widening credit spreads, less price transparency, increased credit losses and tighter credit conditions. Notwithstanding various actions by governments, concerns about the general condition of the capital markets, financial instruments, banks and investment banks, insurers and other financial institutions may cause the broader credit markets to be volatile and interest rates to remain low. These events are illustrative of the effect that events beyond our control may have on commodity prices, demand for metals, including gold, silver, zinc and lead, availability of credit, investor confidence, and general financial market liquidity, all of which may adversely affect our business.
We are exposed to counterparty and market risks related to the sale of our concentrates and metals.
We cannot assure you that in the future, where necessary, we will be successful in entering into arrangements to sell our doré or concentrates on acceptable terms, or at all. If we are not successful in entering into such arrangements, we may be forced to sell all of our products, or greater volumes of them than we may from time to time intend, in the spot market, or we may not have a market for our products and our future operating results may be materially adversely impacted as a
- 52 -
result. In addition, should any counterparty to any of our arrangements not honor such arrangement, or should any of such counterparties become insolvent, we may incur losses for products already shipped and be forced to sell greater volumes of our products than intended in the spot market or we may not have a market for our products, and our future operating results may be materially adversely impacted as a result. Moreover, we cannot assure you that we will be able to renew any agreements we may enter into to sell doré or concentrates when such agreements expire, or that our doré or concentrates will meet the qualitative requirements under future supply agreements or the requirements of buyers.
Our estimates of Mineral Reserves and Mineral Resources are based on interpretation and assumptions and may yield less mineral production under actual conditions than is currently estimated.
There are numerous uncertainties inherent in estimating quantities of Mineral Reserves and grades of mineralization, including many factors beyond our control. In making determinations about whether to advance any of our projects to development or to mine existing Mineral Reserves, we must rely upon estimated calculations as to the Mineral Reserves and grades of mineralization on our properties. Until ore is actually mined and processed, Mineral Reserves and grades of mineralization must be considered as estimates only. These estimates are imprecise and depend upon geological interpretation and statistical inferences drawn from drilling and sampling which may prove to be unreliable. We cannot assure you that Mineral Reserves, Mineral Resources or other mineralization estimates will be accurate, or mineralization can be mined or processed profitably.
Any material changes in Mineral Reserves estimates and grades of mineralization will affect the economic viability of placing a property into production and a property’s return on capital. Our estimates of Mineral Reserves and Mineral Resources have been determined and valued based on assumed future prices, cut-off grades and operating costs that may prove to be inaccurate. Extended declines in market prices for gold, silver and other precious metals may render portions of our mineralization uneconomic and result in reduced reported Mineral Reserves or Mineral Resources.
Any material reductions in estimates of mineralization, or of our ability to extract this mineralization, including estimates made in the Marigold Technical Report, the Seabee Gold Operation Technical Report, the Chinchillas Technical Report and the technical reports for our projects, could have a material adverse effect on our results of operations or financial condition. We cannot assure you that mineral recovery rates achieved in small scale tests will be duplicated in large scale tests under on-site conditions or in production scale.
We follow Canadian disclosure practices concerning our Mineral Reserves and Mineral Resources which allow for more disclosure than is permitted for domestic U.S. reporting companies.
Our Mineral Resources estimates are not directly comparable to those made by domestic U.S. reporting companies subject to the SEC reporting and disclosure requirements, as we report Mineral Resources in accordance with Canadian practices. These practices are different from the practices used to report Mineral Resources estimates in reports and other materials filed by domestic U.S. reporting companies with the SEC in that the Canadian practice is to report Measured, Indicated and Inferred Mineral Resources. In the United States, mineralization may not be classified as a reserve unless the determination has been made that the mineralization could be economically and legally produced or extracted at the time the reserve determination is made. U.S. investors are cautioned not to assume that all or any part of Measured or Indicated Mineral Resources will ever be converted into Mineral Reserves. Further, Inferred Mineral Resources have a great amount of uncertainty as to their existence and as to whether they can be mined legally or economically. Disclosure of “contained ounces” is permitted under Canadian regulations; however, the SEC only permits issuers to report mineralization that does not constitute “reserves” by SEC standards as in place tonnage and grade without reference to unit measures. Accordingly, information concerning descriptions of mineralization and Mineral Resources contained in this Annual Information Form may not be comparable to information made public by U.S. companies subject to the reporting and disclosure requirements
- 53 -
of the SEC. See “Introductory Notes – Cautionary Notice Regarding Mineral Reserves and Mineral Resources Estimates”.
Suitable infrastructure may not be available or damage to existing infrastructure may occur.
Mining, processing, development and exploration activities depend on adequate infrastructure. Reliable roads, ice roads, bridges, port and/or rail transportation, power sources, water supply and access to key consumables are important determinants for capital and operating costs. The lack of availability on acceptable terms or the delay in the availability of any one or more of these items could prevent or delay exploration, development or exploitation of our projects. If adequate infrastructure is not available in a timely manner, we cannot assure you that the exploitation or development of our projects will be commenced or completed on a timely basis, or at all, or that the resulting operations will achieve the anticipated production volume, or that the construction costs and operating costs associated with the exploitation and/or development of our projects will not be higher than anticipated. In addition, extreme weather phenomena, sabotage, vandalism, government, non-governmental organization and community or other interference in the maintenance or provision of such infrastructure could adversely affect our operations and profitability.
We may be exposed to future development risks.
Any adverse condition affecting mining or processing conditions at the Marigold mine, the Seabee Gold Operation or Puna Operations could have a material adverse effect on our financial performance and results of operations.
The future development of any other properties found to be economically feasible and approved by our board of directors will require the construction and operation of mines, processing plants and related infrastructure. As a result, we are and will continue to be subject to all of the risks associated with establishing new mining operations, including:
| ● | the availability and cost of skilled labour, and mining and processing equipment; |
| ● | the availability and cost of appropriate smelting and refining arrangements; |
| ● | securing long-term access agreements required to develop and operate a mine; |
| ● | the need to obtain and retain necessary environmental and other governmental approvals and permits and the timing of the receipt of those approvals and permits; |
| ● | potential opposition from non-governmental organizations, environmental groups or local community groups which may delay or prevent development activities; |
| ● | potential for labour unrest or other labour disturbances; |
| ● | potential increases in cost structures due to changes in the cost of fuel, power, materials and supplies and fluctuations in currency exchange rates; and |
| ● | the timing and cost, which can be considerable, of the construction and expansion of mining, processing and tailings management facilities. |
The costs, timing and complexities of operating the Marigold mine, the Seabee Gold Operation and Puna Operations and constructing and developing our other projects may be greater than we anticipate because the majority of our property interests are not located in developed areas and, as a result, our property interests may not be served by appropriate road access, water and power supply and other support infrastructure. Cost estimates may increase as more detailed engineering work is completed on a project.
Properties not yet in production or slated for expansion are subject to higher risks, as new mining operations often experience unexpected problems during the construction and start-up phase, and production delays and cost adjustments can often happen. Further, feasibility studies, pre-feasibility studies and preliminary economic assessments contain project-specific estimates of future production, which are based on a variety of factors and assumptions. There is no assurance that such estimates will be achieved and the failure to achieve production or cost estimates or material increases in costs
- 54 -
could have a material adverse effect on our future cash flows, profitability, results of operations and financial condition and our share price.
In addition, developments are prone to material cost overruns versus budget. The capital expenditures and time required to develop new mines, including building mining and processing facilities for new properties, are considerable, and changes in cost or construction schedules can significantly increase both the time and capital required to build the mine. The project development schedules are also dependent on obtaining the governmental approvals and permits necessary for the operation of a mine, which is often beyond our control. It is not unusual in the mining industry for new mining operations to experience unexpected problems during the start-up phase, resulting in delays and requiring more capital than anticipated. There is no assurance that there will be sufficient availability of funds to finance construction and development activities, particularly if unexpected problems arise.
Our production forecasts are based on full production being achieved at all of our mines and our ability to achieve and maintain full production rates at these mines is subject to a number of risks and uncertainties. Future development activities may not result in the expansion or replacement of current production with new production, or one or more of these new projects may be less profitable than currently anticipated or may not be profitable at all, any of which could have a material adverse effect on our results of operations and financial position.
We may not have sufficient funds to fully develop our mineral properties or to complete further exploration and development programs.
Our ability to continue our production, development and exploration activities, if any, will depend on our ability to generate sufficient operating cash flows from the Marigold mine, the Seabee Gold Operation and Puna Operations, and to obtain additional external financing where necessary. Any unexpected costs, problems or delays at the Marigold mine, the Seabee Gold Operation or Puna Operations could severely impact our ability to generate sufficient cash flows and require greater reliance on alternative sources of financing.
The sources of external financing that we may use for these purposes include the Credit Facility, other project or bank financing, or public or private offerings of equity and debt. In addition, we may enter into one or more strategic alliances or joint ventures, decide to sell certain property interests, or utilize one or a combination of all of these alternatives. The financing alternative chosen by us may not be available to us on acceptable terms, or at all. If additional financing is not available, we may have to postpone the development of, or sell, one or more of our mineral properties.
We cannot assure you that we will successfully acquire additional commercially mineable mineral rights.
Most exploration projects do not result in the discovery of commercially mineable ore deposits, and we cannot assure you that any anticipated level of recovery of Mineral Reserves will be realized or that any identified mineral deposit will ever qualify as a commercially mineable (or viable) orebody that can be legally and economically exploited. Estimates of Mineral Reserves, Mineral Resources, mineral deposits and production costs can also be affected by such factors as environmental permitting regulations and requirements, weather, environmental factors, unforeseen technical difficulties, unusual or unexpected geological formations and work interruptions.
Material changes in Mineral Reserves, grades, stripping ratios or recovery rates may affect the economic viability of any project. Our future growth and productivity will depend, in part, on our ability to identify and acquire additional commercially mineable mineral rights, and on the costs and results of continued exploration and potential development programs. Mineral exploration is highly speculative in nature and is frequently non-productive. Substantial expenditures are required to: establish Mineral Reserves through drilling and metallurgical and other testing techniques; determine metal content and metallurgical recovery processes to extract metal from the ore; and construct, renovate or expand mining and processing facilities.
- 55 -
In addition, if we discover ore, it would take several years from the initial phases of exploration until production is possible. During this time, the economic feasibility of production may change. As a result of these uncertainties, we cannot assure you that we will successfully acquire additional commercially mineable (or viable) mineral rights.
We require permits to conduct our operations, and delays in obtaining or failure to obtain such permits, or a failure to comply with the terms of any such permits that we have obtained, would adversely affect our business.
Our operations, including continued production at the Marigold mine, the Seabee Gold Operation and Puna Operations, and further exploration, development and commencement of production on our other mineral properties, including the Pitarrilla project and the San Luis project, require permits and other approvals from various governmental authorities. Obtaining or renewing governmental permits is a complex and time-consuming process. The duration and success of efforts to obtain and renew permits are contingent upon many variables not within our control.
We cannot assure you that all permits and licenses that we require for our operations, including any for construction of mining facilities or conduct of mining, will be obtainable or renewable on reasonable terms, or at all. Delays or a failure to obtain such required permits, or the expiry, revocation or failure by us to comply with the terms of any such permits that we have obtained, would adversely affect our business.
For example, we require certain permits to implement our life of mine plan at the Marigold mine and mine the full estimated Mineral Reserves. We have prepared a new EIS to permit a new optimization plan at the Marigold mine to enable pits to be mined deeper. If we do not receive regulatory approval for such EIS, gold production at the Marigold mine could be constrained.
We are dependent on our ability to recruit and retain qualified personnel.
We compete with other mining companies to attract and retain key executives and skilled and experienced employees. We are dependent on the services of our key executives and other skilled and experienced personnel to focus on advancing our corporate objectives as well as the identification of new opportunities for growth and funding. Due to the size of our organization, the loss of any of these persons or our inability to attract and retain suitable replacements for them or additional highly skilled employees and contractors required for the operation of our corporate office, the Marigold mine, the Seabee Gold Operation and Puna Operations and our other activities may have a material adverse effect on our business and financial condition.
We are subject to significant governmental regulations.
The operation of the Marigold mine, the Seabee Gold Operation and Puna Operations, as well as our exploration and development activities, are subject to extensive federal, state, provincial, territorial and local laws and regulations governing various matters, which may include:
| ● | environmental protection; |
| ● | the management and use of toxic substances and explosives; |
| ● | the management of natural resources; |
| ● | the exploration of mineral properties; |
| ● | exports; |
| ● | insurance restrictions; |
| ● | import restrictions; |
| ● | exchange controls; |
- 56 -
| ● | capital controls; |
| ● | price controls; |
| ● | taxation and mining royalties; |
| ● | labour standards and occupational health and safety, including mine safety; |
| ● | employee profit-sharing arrangements; |
| ● | anti-corruption and anti-bribery statutes; and |
| ● | historical, archaeological and cultural preservation. |
Failure to comply with applicable laws and regulations may result in civil or criminal fines or penalties or enforcement actions, including orders issued by regulatory or judicial authorities enjoining or curtailing operations or requiring corrective measures, installation of additional equipment or remedial actions, or the imposition of additional local or foreign parties as joint venture partners, any of which could result in significant expenditures. We may also be required to compensate private parties suffering loss or damage by reason of a breach of such laws, regulations or permitting requirements. Future laws and regulations, or more stringent enforcement of current laws and regulations by governmental authorities, cannot be accurately predicted and it is possible that these could cause us to incur additional expense, divert management time and attention from revenue generating activities or restrict or delay the exploration and development of our properties.
Our activities are subject to health, safety and environmental laws and regulations that may increase our costs and restrict our operations.
Our activities are subject to extensive laws and regulations governing the protection of the environment, natural resources and human health. These laws address, among other things, emissions into the air, discharges into water, management of waste, management of hazardous substances, protection of natural resources, antiquities and endangered species and reclamation of lands disturbed by mining operations, and employee safety and health. We are required to obtain governmental permits and, in some instances, provide bonding requirements under federal, state or provincial air, water quality, and mine reclamation rules and permits. Although we make provisions for reclamation costs, it cannot be assured that these provisions will be adequate to discharge our future obligations for these costs. Violations of environmental, health and safety laws may be subject to civil sanctions and, in some cases, criminal sanctions, including the suspension or revocation of permits. While responsible environmental, health and safety stewardship is one of our top priorities, we cannot assure you that we have been or will be at all times in complete compliance with such laws, regulations and permits, or that the costs of complying with current and future environmental laws and permits will not materially and adversely affect our business, results of operations or financial condition.
Under certain environmental laws, we could be held jointly and severally liable for removal or remediation of any hazardous substance contamination at our current, former and future properties, at nearby properties, or at other third party sites where our wastes may have migrated or been disposed. We could also be held liable for damages to natural resources resulting from hazardous substance contamination. Additionally, environmental laws in some of the countries in which we operate require that we periodically perform environmental impact studies at our mines. We cannot guarantee that these studies will not reveal environmental impacts that would require us to make significant capital outlays or cause material changes or delays in our intended activities, any of which could adversely affect our business.
The failure to comply with environmental laws and regulations or liabilities related to hazardous substance contamination could result in project development delays, material financial impacts or other material impacts to our projects and activities, fines, penalties, lawsuits by the government or private parties, or material capital expenditures. Environmental legislation in many countries is evolving and the trend has been towards stricter standards and enforcement, increased fines and penalties for non-compliance, more stringent environmental assessments of proposed projects, and increasing responsibility for companies and their officers, directors and employees. Future changes in these laws or regulations could
- 57 -
have a significant adverse impact on some portion of our business, causing us to re-evaluate those activities at that time.
Mining is inherently risky and subject to conditions and events beyond our control.
The development and operation of a mine or mine property is inherently risky and involves many risks that even a combination of experience, knowledge and careful evaluation may not be able to overcome, including:
| ● | unusual or unexpected geological formations; |
| ● | metallurgical and other processing problems; |
| ● | inaccurate mineral modeling; |
| ● | metal losses; |
| ● | environmental hazards; |
| ● | power outages; |
| ● | remote locations and inadequate infrastructure; |
| ● | community relations problems; |
| ● | labour disruptions; |
| ● | the availability and retention of skilled personnel; |
| ● | non-governmental organization or community activities; |
| ● | industrial accidents; |
| ● | periodic interruptions due to inclement or hazardous weather conditions; |
| ● | flooding, explosions, fire, rockbursts, cave-ins and landslides; |
| ● | mechanical equipment and facility performance problems; and |
| ● | the availability of materials and equipment. |
These risks could result in damage to, or destruction of, mineral properties, production facilities or other properties, environmental damage, delays in mining, increased production costs, asset write downs, monetary losses and possible legal liability or penalties, occupational illness or health issues, personal injury, and loss of life, and/or facility and workforce evacuation, such as the two fatalities on October 31, 2017 at the Marigold mine. We may not be able to obtain insurance to cover these risks at economically feasible premiums, or at all. We may suffer a material adverse effect on our business if we incur losses related to any significant events that are not covered by our insurance policies.
Land reclamation and mine closure requirements for our mineral properties may be burdensome.
Although variable depending on location and the governing authority, land reclamation and mine closure requirements are generally imposed on mining companies in order to minimize long-term effects of land disturbance. Such requirements may include requirements to control dispersion of potentially deleterious effluents, and reasonably re-establish pre-disturbance land forms and vegetation. Over the last several years, such requirements have been changing, with increasing obligations imposed in many jurisdictions.
The closure plan submitted by the controlling entity of Puna Operations for the Pirquitas property in 2016 continues to be under review by the regulatory authorities. The Chinchillas property conceptual closure plan was approved on December 2017 and an update of the EIA, including an updated closure plan, is required to be submitted in December 2019. Argentina currently has no specific mine closure legislation that requires such regulatory authority to grant approval in a timely manner or prescribes the conditions that may be attached to such approval if granted. The closure requirements for the Pirquitas and Chinchillas properties may change in the future and we may be subject to increased obligations for both the technical and social aspects associated with such mine closure and reclamation, which would impact our closure plan and the duration of our closure activities.
- 58 -
In order to carry out reclamation and mine closure obligations imposed on us in connection with our exploration, potential development and production activities, we must allocate financial resources that might otherwise be spent on further exploration and development programs, including providing the appropriate regulatory authorities with reclamation financial assurance. The amount and nature of the financial assurance are dependent upon a number of factors, including our financial condition and reclamation cost estimates. Changes to these amounts, as well as the nature of the collateral to be provided, could significantly increase our costs, making the maintenance and development of existing and new mines less economically feasible. To the extent that the value of the collateral provided to the regulatory authorities is or becomes insufficient to cover the amount of financial assurance we are required to post, we would be required to replace or supplement the existing security with more expensive forms of security, which might include cash deposits, which would reduce our cash available for operations and financing activities. There can be no guarantee that we will be able to maintain or add to our current level of financial assurance. We may not have sufficient capital resources to further supplement our existing security.
Certain of our mineral properties have been subject to historic mining operations and certain of the mineral properties that were historically mined by us are subject to remediation obligations. In addition, the actual costs of reclamation and mine closure are uncertain and planned expenditures may differ from the actual expenditures required. Therefore, the amount that we are required to spend could be materially higher than current estimates. Any additional amounts required to be spent on reclamation and mine closure may have an adverse effect on our financial position and results of operations and may cause us to alter our operations.
We could be subject to potential labour unrest or other labour disturbances, including labour action by our unionized employees at Puna Operations.
Production at the Marigold mine, the Seabee Gold Operation and Puna Operations is dependent upon the efforts of our employees and our relations with them. In addition, relations with our employees may be affected by changes in the scheme of labour relations that may be introduced by the relevant governmental authorities in those jurisdictions in which we carry on business. Changes in such legislation or in the relationship with our employees may have a material adverse effect on our business, financial condition and results of operations. We could be subject to labour unrest or other labour disturbances, which could, while ongoing, have a material adverse effect on our business.
Non-management employees at Puna Operations are unionized and subject to collective agreements, and the salary agreement with our union is currently in negotiations. We were subject to an illegal strike at Puna Operations in January 2019, may be subject to further strikes or work stoppages, and any such strike or work stoppage could have an adverse effect on our business. In addition, there can be no assurance that negotiations in accordance with our collective bargaining agreement will not prove difficult or that we will be able to renegotiate the salary agreement on satisfactory terms, or at all. The renewal of the salary agreement could result in higher on-going labour costs, which could have a negative impact on our future cash flows, earnings, results of operations and financial condition.
Indigenous peoples title claims and rights to consultation and accommodation may affect our existing operations as well as development projects and future acquisitions.
Some of our properties may be subject to the rights or the asserted rights of various community stakeholders, including indigenous peoples. The presence of community stakeholders may impact our ability to develop or operate our mining properties and projects or to conduct exploration activities. Accordingly, we are subject to the risk that one or more groups may oppose the continued operation, further development, or new development or exploration of our current or future mining properties and projects. Such opposition may be directed through legal or administrative proceedings, or through protests or other campaigns against our activities.
- 59 -
Governments in many jurisdictions must consult with, or require us to consult with, indigenous peoples with respect to grants of mineral rights and the issuance or amendment of project authorizations and permits, pursuant to various international and national laws, codes, resolutions, conventions and guidelines. Applicable conventions such as the International Labour Organization Convention 169, which has been ratified by Argentina and Mexico, is an example of such an international convention. Consultation and other rights of indigenous peoples may require accommodation including undertakings regarding employment, royalty payments and other matters. This may affect our ability to acquire within a reasonable time effective mineral titles, permits or licenses in these jurisdictions, including in some parts of Canada, the United States, Argentina, Mexico and Peru in which title or other rights are claimed by indigenous peoples, and may affect the timetable and costs of development and operation of our mineral properties in these jurisdictions. In addition, the risk of unforeseen title claims by indigenous peoples could affect existing operations and development projects. These legal requirements may also affect our ability to expand or transfer existing operations or to develop new projects.
We are subject to certain transportation risks that could have a negative impact on our ability to operate.
Our facilities at the Seabee Gold Operation depend on supplies of consumables (including diesel, tires, sodium cyanide and reagents) and capital items to operate efficiently, many of which are delivered to site across a seasonal ice road. If we experience prolonged disruption to the delivery of such consumables, our production efficiency and ability to effectively complete capital projects requiring such deliveries may be reduced. There can be no assurance that these transportation risks will not have an adverse effect on our Seabee Gold Operation and therefore on our profitability.
In addition, ore mined at the Chinchillas property is loaded onto road trucks and transported approximately 45 kilometers to the Pirquitas processing facilities. Transportation of such ore is subject to numerous risks including, but not limited to, roadblocks, terrorism, interruption by domesticated and non-domesticated herding animals, theft, weather conditions, environmental liabilities in the event of an accident or spill, inability to transport ore in oversized loads, personal injury and loss of life. We are also subject to the risk of a potential interruption of business from a third party beyond our control, which could have a material adverse effect on our operations and revenues.
We are subject to assessment by taxation authorities in multiple jurisdictions that arise in the ordinary course of business.
In the normal course of business, we are subject to assessment by taxation authorities in various jurisdictions. Income tax provisions and income tax filing positions require estimates and interpretations of income tax rules and regulations of the various jurisdictions in which we operate and judgments as to their interpretation and application to our specific situation. Our business and operations of the business and operations of our subsidiaries is complex, and we have, historically, undertaken a number of significant financings, acquisitions and other material transactions. The computation of income taxes payable as a result of these transactions involves many complex factors as well as our interpretation of, and compliance with, relevant tax legislation and regulations. While our management believes that the provision for income tax is appropriate and in accordance with IFRS and applicable legislation and regulations, tax filing positions are subject to review and adjustment by taxation authorities which may challenge our interpretation of the applicable tax legislation and regulations.
We are subject to credit risk through our VAT receivables and Puna credits balance collectible from the government of Argentina.
We are subject to credit risk through our VAT receivables and Puna credits balance that is collectible from the government of Argentina. The balance is expected to be recoverable in full; however, due to legislative rules and the complex collection process, a significant portion of the asset is classified as non-current until government approval of the recovery claim is approved.
- 60 -
We are subject to claims and legal proceedings that arise in the ordinary course of business.
We are subject to various claims and legal proceedings, including adverse rulings in current or future litigation against us and/or our directors or officers, covering a wide range of matters that arise in the ordinary course of business activities. Each of these matters is subject to various uncertainties and it is possible that some of these matters may be resolved unfavorably to us. We carry liability insurance coverage and establish reserves for matters that are probable and can be reasonably estimated. In addition, we may be involved in disputes with other parties in the future that may result in litigation, which may have a material adverse impact on our future cash flows, profitability, results of operations and financial condition.
We are subject to anti-corruption laws.
We are subject to anti-corruption laws under the Canadian Corruption of Foreign Public Officials Act and the U.S. Foreign Corrupt Practices Act, which generally prohibit companies from engaging in bribery or other prohibited payments to foreign officials for the purpose of obtaining or retaining business. In addition, we may also be subject to the extra-territorial provisions of the Bribery Act 2010 (United Kingdom) which, in certain circumstances, can apply to offences committed outside of the United Kingdom by foreign companies. Corruption, extortion, bribery, pay-offs, theft and other fraudulent practices may occur from time-to-time in Argentina, Peru, Mexico or any other jurisdiction in which we may conduct business, and we cannot assure you that our employees or other agents will not engage in such prohibited conduct for which we might be held responsible. If our employees or other agents are found to have engaged in such practices, we could suffer severe penalties and other consequences that may have a material adverse effect on our business, financial condition and results of operations. We have an Anti-Corruption Compliance Policy and internal controls and procedures intended to address compliance and business integrity issues, and we train our employees on anti-bribery compliance on a global basis. However, despite careful establishment and implementation, we cannot assure you that these or other anti-bribery, anti-fraud or anti-corruption policies and procedures are or will be sufficient to protect against fraudulent and/or corrupt activity. In particular, we, in spite of our best efforts, may not always be able to prevent or detect corrupt or unethical practices by employees or third parties, such as subcontractors or joint venture partners, which may result in reputational damage, civil and/or criminal liability (under the Canadian Corruption of Foreign Public Officials Act, the U.S. Foreign Corrupt Practices Act or any other relevant compliance, anti-bribery, anti-fraud or anti-corruption laws) being imposed on us.
We may fail to maintain adequate internal control over financial reporting pursuant to the requirements of applicable regulations.
We document and test our internal control procedures in order to maintain adequate internal control over our financial reporting and satisfy the requirements of applicable regulations, including Section 404 of the Sarbanes Oxley Act of 2002 (“SOX”) in the United States and Part 3 of National Instrument 52-109 – Certification of Disclosure in Issuers’ Annual and Interim Filings (“NI 52-109”) in Canada. SOX requires, among other things, an annual assessment by management of the effectiveness of our internal control over financial reporting and an attestation report by our independent auditors addressing the effectiveness of internal control over financial reporting. We may fail to maintain the adequacy of our internal control over financial reporting as such standards are modified, supplemented or amended from time to time, and we may not be able to conclude, on an ongoing basis, that we have effective internal control over financial reporting in accordance with applicable regulations. Our failure to satisfy the requirements of applicable regulations on an ongoing, timely basis could result in the loss of investor confidence in the reliability of our financial statements, which in turn could harm our business and negatively impact the trading price or the market value of our securities. In addition, any failure to implement required new or improved controls, or difficulties encountered in their implementation, could harm our operating results or cause us to fail to meet our reporting obligations. Future acquisitions of companies, if any, may provide us with challenges in implementing the required processes, procedures and controls in our acquired operations. No evaluation can provide complete assurance that our internal control over financial reporting will detect or uncover all failures of persons within our company to disclose material information otherwise required to be reported. The effectiveness of our processes, procedures and controls could also be limited by simple errors or faulty judgments. In addition, as we continue to expand, the challenges involved in implementing appropriate internal control over financial reporting will increase and will
- 61 -
require that we continue to monitor our internal control over financial reporting. Although we intend to expend substantial time and incur substantial costs, as necessary, to ensure ongoing compliance, we cannot be certain that we will be successful in complying with applicable regulations, including Section 404 of SOX and Part 3 of NI 52-109.
We are subject to evolving corporate governance and public disclosure regulations that have increased both our compliance costs and the risk of non-compliance, which could have an adverse effect on our stock price and our reputation.
We are subject to changing rules and regulations promulgated by a number of U.S. and Canadian governmental and self-regulated organizations, including the SEC, the CSA, the Nasdaq Global Market (“Nasdaq”), the Toronto Stock Exchange (“TSX”) and the IASB. These rules and regulations continue to evolve in scope and complexity and many new requirements have been created in response to laws that have been enacted, making compliance more difficult and uncertain. In addition, our efforts to comply with new regulations have resulted in, and are likely to continue to result in, increased general and administrative expenses and a diversion of management time and attention from revenue-generating activities to compliance activities.
For example, the Canadian ESTMA, which became effective June 1, 2015, imposes significant annual reporting obligations regarding certain categories of payments made by Canadian resource extraction issuers to domestic and foreign governments at all levels. Failure to report or false reporting may result in fines of up to C$0.25 million (which may be concurrent). If we find ourselves subject to an enforcement action or in violation of this legislation, this may result in significant penalties, fines and/or sanctions imposed on us resulting in a material adverse effect on our reputation.
Compliance with emerging climate change regulations could result in significant costs and climate change may present physical risks to a mining company’s operations.
Greenhouse gases (“GHGs”) are emitted directly by our operations, as well as by external utilities from which we purchase power. Currently, a number of international and national measures to address or limit GHG emissions, including the Kyoto Protocol, the Copenhagen Accord, Durban Platform and the Paris Agreement, are in various phases of discussion or implementation in the countries in which we operate. These, or future, measures could require us to reduce our direct GHG emissions or energy use or to incur significant costs for GHG emissions permits or taxes or have these costs or taxes passed on by electricity utilities which supply our operations. We could also incur significant costs associated with capital equipment, GHG monitoring and reporting and other obligations to comply with applicable requirements.
In addition, our operations could be exposed to a number of physical risks from climate change, such as changes in rainfall rates, rising sea levels, reduced water availability, higher temperatures, increased snow pack and extreme weather events. Events or conditions such as flooding or inadequate water supplies could disrupt mining and transport operations, mineral processing and rehabilitation efforts, could create resource shortages and could damage our property or equipment and increase health and safety risks on site. Such events or conditions could have other adverse effects on our workforce and on the communities around our mines, such as an increased risk of food insecurity, water scarcity and prevalence of disease.
If the effects of extreme weather events cause prolonged disruption to the delivery of essential commodities or capital items over the seasonable ice road at our Seabee Gold Operation or affect the prices of these commodities or capital items, our production efficiency may be reduced. Although we make efforts to mitigate these risks by ensuring that extreme weather conditions are included in emergency response plans at our Seabee Gold Operation as required, there can be no assurance that these efforts will be effective and that these risks will not have an adverse effect on our operations.
Our interest in deferred consideration received from divestitures may not be fully realizable.
As partial consideration for our disposition of the Berenguela project in Peru in 2017 and the Diablillos and M-18 projects in Argentina in 2016, we will receive deferred cash consideration. In addition, in connection with our disposition of the
- 62 -
Challacollo project in Chile to Mandalay Resources Corporation (“Mandalay”) in 2014, we received as partial consideration the contingent right to receive shares of Mandalay and cash consideration, in each case dependent on the commencement of commercial production at the Challacollo project. We also have a NSR royalty on production from each of the Berenguela project, the Diablillos and M-18 projects, the San Patricio, La Palmilla and San Agustín projects in Mexico, and the Juncal and La Flora projects in Chile. We are not able to provide any assurances that we will be able to realize the full value of these interests.
Market fluctuations could adversely affect the market price of our investments and the value we could realize on such investments.
Our investments in securities of other public companies, including our C$30.7 million investment in SilverCrest in 2018, are subject to volatility in the share prices of such companies. We cannot provide any assurance that an active trading market for any of the subject shares is sustainable. The trading prices of the subject shares could be subject to wide fluctuations in response to various factors beyond our control, including quarterly variations in the subject companies’ results of operations, exploration results, changes in earnings (if any), estimates by analysts, conditions in the industry of such companies and macroeconomic developments in North America and globally, currency fluctuations and market perceptions of the attractiveness of particular industries. The lack of a liquid market could adversely affect the value that we could ultimately realize on such investments.
Our mineral properties may be subject to uncertain title.
We cannot assure you that title to our mineral properties will not be challenged. We own, lease or have under option, unpatented and patented mining claims, mineral claims or concessions which constitute our property holdings. The ownership and validity, or title, of unpatented mining claims and concessions are often uncertain and may be contested. Also, we may not have, or may not be able to obtain or economically obtain, all necessary surface rights to develop a property. Title insurance is generally not available for mineral properties and our ability to ensure that we have obtained a secure claim to individual mining properties or mining concessions may be severely constrained. We have not conducted surveys of all of the claims in which we hold direct or indirect interests. A successful claim contesting our title to a property will cause us to lose our rights to explore and, if warranted, develop that property or undertake or continue production thereon. This could result in us not being compensated for our prior expenditures relating to the property.
In addition, certain of our properties are located in areas that were or are inhabited by indigenous people. If historical artifacts or archaeological sites are discovered on or near our properties, we may be prohibited or restricted from developing or mining our mineral properties or be required to relocate or preserve such findings.
Our insurance coverage does not cover all of our potential losses, liabilities and damages related to our business and certain risks are uninsured and uninsurable.
Our business is subject to a number of risks and hazards generally, including adverse environmental conditions, industrial accidents, labour disputes, unusual or unexpected geological conditions, ground or slope failures, cave-ins, mechanical failures, changes in the regulatory environment and natural phenomena such as inclement weather conditions, fires, floods, hurricanes and earthquakes. Such occurrences could result in damage to mineral properties or production facilities, personal injury or death, environmental damage to our properties or the properties of others, delays in mining, monetary losses and possible legal liability.
Although we maintain insurance to protect against certain risks in such amounts as we consider reasonable, our insurance will not cover all of the potential risks associated with a mining company’s operations. We may also be unable to maintain insurance to cover these risks at economically feasible premiums. Insurance coverage may not continue to be available or may not be adequate to cover any resulting liability. Moreover, insurance against risks such as loss of title to mineral property, environmental pollution, or other hazards as a result of exploration and production is not generally available
- 63 -
to us or to other companies in the mining industry on acceptable terms. We might also become subject to liability for pollution or other hazards which may not be insured against or which we may elect not to insure against because of premium costs or other reasons. Losses from these events may cause us to incur significant costs that could have a material adverse effect upon our financial performance and results of operations.
Civil disobedience in certain of the countries where our mineral properties are located could adversely affect our business.
Acts of civil disobedience are common in certain of the countries where our properties are located. In recent years, many mining companies have been the targets of actions to restrict their legally-entitled access to mining concessions or property. Such acts of civil disobedience often occur with no warning and can result in significant direct and indirect costs. We cannot assure you that there will be no disruptions to site access in the future, which could adversely affect our business.
Some of our operations are subject to significant safety and security risks.
We currently conduct mining operations in the United States, Canada and Argentina, and have additional exploration projects in Mexico and Peru. As a result, we are exposed to various levels of safety and security risks which could result in injury or death, damage to property, work stoppages, or blockades of our mining operations. Some of our properties, including the Pitarrilla project, are also located in areas where Mexican drug cartels operate. Risks and uncertainties vary from region to region and include, but are not limited to, terrorism, hostage taking, local drug gang activities, military repression, labour unrest and war or civil unrest. Local opposition to mine development projects could arise and such opposition may be violent. If we were to experience resistance or unrest in connection with our mines or projects, it could have a material adverse effect on our operations and profitability.
We may be required by human rights laws to take actions that delay our operations or the advancement of our projects.
Various international and national laws, codes, resolutions, conventions, guidelines and other materials relate to human rights (including rights with respect to health and safety and the environment surrounding our operations). Many of these materials impose obligations on government and companies to respect human rights. Some mandate that government consult with communities surrounding our projects regarding government actions that may affect local stakeholders, including actions to approve or grant mining rights or permits. The obligations of government and private parties under the various international and national materials pertaining to human rights continue to evolve and be defined. One or more groups of people may oppose our current and future operations or further development or new development of our projects or operations. Such opposition may be directed through legal or administrative proceedings or expressed in manifestations such as protests, roadblocks or other forms of public expression against our activities, and may have a negative impact on our reputation. Opposition by such groups to our operations may require modification of, or preclude the operation or development of, our projects or may require us to enter into agreements with such groups or local governments with respect to our projects, in some cases causing considerable delays to the advancement of our projects.
We face industry competition in the acquisition of mineral properties.
We compete with other exploration and production companies, many of which are better capitalized, have greater financial resources, operational experience and technical capabilities, or are further advanced in their development or are significantly larger and have access to greater Mineral Reserves than us, for the acquisition of mineral claims, leases and other mineral interests.
We may be unable to complete and successfully integrate an announced acquisition.
We expect to continue to evaluate acquisition opportunities and pursue those opportunities we believe are in our long-term best interests. The success of our acquisitions will depend upon our ability to effectively manage the integration and
- 64 -
operations of entities or properties we acquire and to realize other anticipated benefits. The process of managing acquired businesses may involve unforeseen difficulties and may require a disproportionate amount of management resources, which may divert management’s focus and resources from other strategic opportunities and from operational matters during this process. Any acquisitions would be accompanied by risks. For example: there may be a significant change in commodity prices after we have committed to complete the transaction and established the purchase price or exchange ratio; a material orebody may prove to be below expectations; we may have difficulty integrating and assimilating the operations and personnel of any acquired companies, realizing anticipated synergies and maximizing the financial and strategic position of the combined enterprise, and maintaining uniform standards, policies and controls across the organization; and the acquired business or assets may have unknown liabilities which may be significant. There can be no assurance that we will be able to successfully manage the integration and operations of businesses or properties we acquire or that the anticipated benefits of our acquisitions will be realized.
Reputation loss may result in decreased investor confidence, increased challenges in developing and maintaining community relations and an impediment to our overall ability to advance our projects, thereby having a material adverse impact on our financial performance, financial condition, cash flows and growth prospects.
Damage to our reputation can be the result of the actual or perceived occurrence of any number of events, and could include negative publicity (for example, with respect to our handling of environmental matters or our dealings with community groups), whether true or not. The increased use of social media and other web-based tools used to generate, publish and discuss user-generated content and to connect with other users has made it increasingly easier for individuals and groups to communicate and share opinions and views regarding us and our activities, whether true or not. We do not ultimately have direct control over how we are perceived by others and reputational damage could have a material adverse impact on our financial performance, financial condition, cash flows and growth prospects.
We hold a 75% interest in Puna Operations and such interest is subject to the risks normally associated with the conduct of joint ventures.
We hold a 75% interest in and are the operator of Puna Operations, with the remaining 25% interest held by Golden Arrow. In addition, in 2018, we entered into a credit agreement with Golden Arrow, pursuant to which we provided Golden Arrow with a two-year non-revolving term loan in an aggregate principal amount equal to $10.0 million. The existence or occurrence of certain circumstances and events, including the inability of Golden Arrow to meet its obligations to Puna Operations and litigation regarding joint venture matters, could have a material adverse impact on our profitability or the viability of our interest in Puna Operations, which could have a material adverse impact on our future cash flows, earnings, results of operations and financial condition.
An event of default under our outstanding convertible notes may significantly reduce our liquidity and adversely affect our business.
Under the indenture dated as of January 16, 2013 (the “Indenture”) governing our 2.875% convertible senior notes due 2033 (the “Notes”), we have made various covenants to the trustees on behalf of the holders of such notes, including to make payments of interest and principal when due and, upon undergoing a fundamental change, to offer to purchase all of the outstanding Notes, plus accrued and unpaid interest, if any. In addition, the holders of the Notes have the right to require us to repurchase, for cash, all or any portion of their Notes on specified dates, beginning February 1, 2020.
If there is an event of default under the Notes, the principal amount of such notes then outstanding, plus accrued and unpaid interest, if any, may be declared immediately due and payable. If such an event occurs, this would place additional strain on our cash resources, which could inhibit our ability to further our exploration and development activities.
- 65 -
The Credit Facility contains financial covenants which we could fail to meet.
The terms of our Credit Facility require us to satisfy various affirmative and negative covenants and to meet certain financial ratios and tests. These covenants limit, among other things, our ability to incur further indebtedness if doing so would cause us to fail to meet certain financial covenants, create certain liens on assets or engage in certain types of transactions. Although at present, these covenants do not restrict our ability to conduct our business as presently conducted, there are no assurances that in the future we will continue to satisfy these covenants or we will not be limited in our ability to respond to changes in our business or competitive activities or be restricted in our ability to engage in mergers, acquisitions or dispositions of assets. Furthermore, a breach of these covenants, including a failure to meet the financial tests or ratios, would likely result in an event of default under the Credit Facility unless we can obtain a waiver or consent in respect of any such breach. We cannot assure you that a waiver or consent would be granted. A breach of any of these covenants or the inability to comply with the required financial tests or ratios could result in a default under the Credit Facility. In the event of any default under the Credit Facility, the lenders could elect to declare all outstanding borrowings, together with accrued interest, fees and other amounts due thereunder, to be immediately due and payable, which may have a material adverse impact on our business, profitability or financial condition.
We may be subject to information systems security threats.
We have entered into agreements with third parties for hardware, software, telecommunications and other information technology (“IT”) services in connection with our operations. Our operations depend, in part, on how well we and our suppliers protect networks, equipment, IT systems and software against damage from a number of threats, including, but not limited to, cable cuts, damage to physical plants, natural disasters, terrorism, fire, power loss, hacking, computer viruses, vandalism and theft. Our operations also depend on the timely maintenance, upgrade and replacement of networks, equipment, IT systems and software, as well as pre-emptive expenses to mitigate the risks of failures. Any of these and other events could result in information system failures, delays and/or increase in capital and operating expenses. The failure of information systems or a component of information systems could, depending on the nature of any such failure, adversely impact our reputation and results of operations.
Although to date we have not experienced any material losses relating to cyber-attacks or other information security breaches, there can be no assurance that we will not incur such losses in the future. Our risk and exposure to these matters cannot be fully mitigated because of, among other things, the evolving nature of these threats. As cyber threats continue to evolve, we may be required to expend additional resources to continue to modify or enhance protective measures or to investigate and remediate any security vulnerabilities.
Certain of our directors and officers may have conflicts of interest as a result of their involvement with other natural resource companies.
Certain of our directors and an officer are directors of other natural resource or mining-related companies. These associations may give rise to conflicts of interest from time to time. As a result of these conflicts of interest, we may miss the opportunity to participate in certain transactions, which may have a material adverse effect on our financial position.
RISKS RELATED TO OUR COMMON SHARES
Our common shares are publicly traded and are subject to various factors that have historically made our common share price volatile.
The market price of our common shares has experienced, and may continue to experience, significant volatility, which may result in losses to investors. The market price of our common shares may increase or decrease in response to a number of events and factors, including: our operating performance and the performance of competitors and other similar companies; volatility in metal prices; the public’s reaction to our press releases on developments at the Marigold mine, the Seabee Gold Operation, Puna Operations and our other properties, material change reports, other public announcements and our
- 66 -
filings with the various securities regulatory authorities; changes in earnings estimates or recommendations by research analysts who track our common shares or the shares of other companies in the resource sector; changes in general economic and/or political conditions; the number of common shares to be publicly traded after an offering of our common shares; the arrival or departure of key personnel; acquisitions, strategic alliances or joint ventures involving us or our competitors; and the factors listed under the heading “Introductory Notes – Cautionary Notice Regarding Forward-Looking Statements”.
In addition, the global stock markets and prices for mining company shares have experienced volatility that often has been unrelated to the operating performance of such companies. These market and industry fluctuations may adversely affect the market price of our common shares, regardless of our operating performance. The variables which are not directly related to our success and are, therefore, not within our control, include other developments that affect the market for mining company shares, the breadth of the public market for our common shares and the attractiveness of alternative investments. The effect of these and other factors on the market price of our common shares on the exchanges on which they trade has historically made our common share price volatile and suggests that our common share price will continue to be volatile in the future.
Future sales or issuances of equity securities could decrease the value of our common shares, dilute investors’ voting power and reduce our earnings per share.
We may sell additional equity securities in subsequent offerings (including through the sale of securities convertible into equity securities) and may issue equity securities in acquisitions. We cannot predict the size of future issuances of equity securities or the size and terms of future issuances of debt instruments or other securities convertible into equity securities or the effect, if any, that future issuances and sales of our securities will have on the market price of our common shares.
Additional issuances of our securities may involve the issuance of a significant number of common shares at prices less than the current market price for the common shares. Issuances of substantial numbers of common shares, or the perception that such issuances could occur, may adversely affect prevailing market prices of our common shares. Any transaction involving the issuance of previously authorized but unissued common shares, or securities convertible into common shares, would result in dilution, possibly substantial, to security holders.
Sales of substantial amounts of our securities by us or our existing shareholders, or the availability of such securities for sale, could adversely affect the prevailing market prices for our securities and dilute investors’ earnings per share. Exercises of presently outstanding share options, share units or warrants may also result in dilution to security holders. A decline in the market prices of our securities could impair our ability to raise additional capital through the sale of securities should we desire to do so.
DIVIDENDS
We have not declared or paid any dividends on our common shares since 1955. We intend to retain earnings, if any, to finance the growth and development of our business and do not intend to pay cash dividends on our common shares in the foreseeable future. Any return on an investment in our common shares will come from the appreciation, if any, in the value of our common shares. The payment of future cash dividends, if any, will be reviewed periodically by our Board of Directors and will depend upon, among other things, conditions then existing including earnings, financial condition and capital requirements, restrictions in financing agreements, business opportunities and conditions and other factors.
DESCRIPTION OF CAPITAL STRUCTURE
Our authorized share capital consists of an unlimited number of common shares, without par value, of which 120,741,162 common shares were issued and outstanding as at December 31, 2018. In addition, we had 2,638,749 common shares reserved for issuance pursuant to outstanding stock options, which were exercisable at a weighted average price of C$10.35 per share, as at December 31, 2018. In 2013, we issued the Notes, which bear interest at 2.875% payable
- 67 -
semi-annually in arrears on February 1 and August 1 of each year and are convertible by holders into our common shares.
COMMON SHARES
All of our common shares rank equally as to voting rights, participation in a distribution of our assets on a liquidation, dissolution or winding-up and the entitlement to dividends. The holders of our common shares are entitled to receive notice of, and to attend and vote at, all meetings of shareholders (other than meetings at which only holders of another class or series of shares are entitled to vote). Each common share carries with it the right to one vote.
In the event of our liquidation, dissolution or winding-up or other distribution of our assets, the holders of our common shares will be entitled to receive, on a pro rata basis, all of the assets remaining after we have paid out our liabilities. Distributions in the form of dividends, if any, will be set by our Board of Directors. See “Dividends”.
Any alteration of the rights attached to our common shares must be approved by at least two-thirds of the common shares voted at a meeting of our shareholders.
In March 2012, we adopted a shareholder rights plan (the “Rights Plan”), which was reconfirmed by shareholders at our annual and special meeting of shareholders in 2015. In light of changes to take-over bid rules under Canadian securities laws, our shareholders approved an amended and restated Rights Plan (the “Amended and Restated Rights Plan”) at our annual and special meeting of shareholders in 2018. The Amended and Restated Rights Plan has successive three-year terms and will expire at the close of our annual meeting of shareholders in 2021, unless it is reconfirmed by shareholders at such meeting or otherwise terminated in accordance with its terms prior to that time. The Amended and Restated Rights Plan is similar to shareholder rights plans adopted by other Canadian public companies and was not adopted in response to, or in anticipation of, any known take-over bid. A copy of the Amended and Restated Rights Plan is available under our profile on the SEDAR website at www.sedar.com.
STOCK OPTIONS
Stock options to purchase our securities are granted to certain of our employees and consultants on terms and conditions acceptable to the regulatory authorities in Canada. At our annual and special meeting held on May 4, 2017, our shareholders approved a share compensation plan (the “Share Compensation Plan”) to replace our stock option plan, restricted share unit (“RSU”) plan and performance share unit (“PSU”) plan for the award of options, RSUs and PSUs to eligible persons for all grants effective January 1, 2018. The Share Compensation Plan reserves 6.5% of our issued and outstanding common shares from time to time (i.e., on a “rolling” basis) for issuance on exercise of stock options.
Under the Share Compensation Plan: (a) the maximum number of common shares reserved for issuance under the Share Compensation Plan, together with all of our other plans that provide for the issuance from treasury of common shares (collectively, the “Aggregate Plans”), is 6.5% of our issued and outstanding common shares; (b) stock options reserved for issuance to any one person under the Aggregate Plans in any one year may not exceed 5% of our issued and outstanding common shares; (c) stock options may be exercised for common shares issued from treasury once the vesting criteria have been satisfied and upon payment of the exercise price, or stock option holders may elect a “cashless” exercise of stock options, instead of paying the exercise price; (d) no stock option is transferable by the optionee other than by will or the laws of descent and distribution; (e) a stock option is exercisable during the lifetime of the optionee only by such optionee or by such optionee’s legal representative in specific circumstances; (f) the maximum term of each stock option is seven years, with the vesting period determined at the discretion of the Board of Directors; and (g) the minimum exercise price for a stock option is equal to the greater of the (i) five day volume weighted average trading price of our common shares on the TSX, calculated by dividing the total value by the total volume of common shares traded, on the trading day immediately before the grant date, and (ii) closing price of our common shares on the TSX on the trading day immediately before the grant date.
- 68 -
The number of stock options and the number of common shares subject to such stock options granted under the Aggregate Plans to officers and executives as a group and other employees and consultants as a group are set out below as at December 31, 2018.
|
Optionholders
|
Number of Options Outstanding
|
Exercise Price (C$)
|
Expiry Date
| ||||||
| Officers and Executives |
17,571 150,000 26,667 10,000 75,700 10,000 16,434 13,334 9,824 8,334 116,784 7,500 196,334 376,000 16,259 209,050 20,025 270,450 33,745 125,000
|
|
$15.41 $17.47 $23.57 $24.41 $12.99 $9.50 $7.37 $11.18 $7.26 $6.48 $5.83 $6.11 $8.38 $7.17 $7.27 $12.01 $14.12 $11.07 $12.41 $13.39
|
|
January 18, 2019 January 31, 2019 May 15, 2019 December 16, 2019 January 25, 2020 September 1, 2020 January 1, 2021 April 1, 2021 June 1, 2021 December 1, 2021 January 1, 2022 April 1, 2022 August 14, 2022 January 1, 2023 April 1, 2023 January 1, 2024 April 1, 2024 January 1, 2025 April 1, 2025 June 4, 2025
| ||||
|
Other Employees and Consultants |
37,062 5,000 6,500 37,454 7,256 7,500 3,700 18,477 13,834 53,872 2,272 139,684 10,000 1,836 126,084 64,816 103,217 89,920 105,850 95,404 |
|
$7.30 $15.15 $24.41 $5.62 $8.65 $7.37 $11.89 $12.86 $11.18 $10.86 $11.24 $5.83 $6.11 $4.00 $7.17 $7.27 $12.01 $14.12 $11.07 $12.41 |
|
February 24, 2019 March 17, 2019 December 16, 2019 March 26, 2020 December 10, 2020 January 1, 2021 January 1, 2021 March 25, 2021 April 1, 2021 May 12, 2021 June 3, 2021 January 1, 2022 April 1, 2022 May 6, 2022 January 1, 2023 April 1, 2023 January 1, 2024 April 1, 2024 January 1, 2025 April 1, 2025 | ||||
|
Total:
|
2,638,749
|
||||||||
- 69 -
PERFORMANCE SHARE UNITS AND RESTRICTED SHARE UNITS
Under the Share Compensation Plan: (a) the total number of common shares that may be issued pursuant to RSUs and PSUs is limited to 2% of our issued and outstanding common shares from time to time; (b) RSUs and PSUs are credited to an account set up for each participant; (c) except to the extent the award of RSUs or PSUs specifies that redemption will automatically occur on a date prior to the expiry date, participants can choose to redeem vested RSUs and PSUs at any time before the expiry date and we must redeem the RSUs and PSUs within fifteen business days of the participant’s elected redemption date; (d) if a participant does not elect a redemption date, the vested RSUs and PSUs will be redeemed on their expiry date; (e) a participant may require that we redeem the RSUs and PSUs with our common shares issued from treasury; and (f) if the participant does not make such election, we may redeem the RSUs and PSUs by: (i) paying a cash amount equal to the Market Price (as such term is defined in the Share Compensation Plan) of the vested RSUs and PSUs on the redemption date; (ii) issuing such number of common shares as is equal to the number of vested RSUs or PSUs; or (iii) purchasing such number of common shares as is equal to the number of vested RSUs or PSUs in the market and delivering them to the participant.
Under the Share Compensation Plan, our board of directors determines each of the:
| ● | expiry date of RSU and PSU awards, provided that such date may not be later than ten years from the grant date; |
| ● | vesting criteria applicable to RSUs. Generally, one-third of the awarded RSUs vest on each of the first, second and third anniversaries of the date of grant, subject to the participant continuing to be an eligible person; and |
| ● | Performance Period (as such term is defined in the Share Compensation Plan) for PSUs. Generally, the Performance Period is 36 months commencing on the 1st day of January and ending on the 31st day of December. The Target Milestones (as such term is defined in the Share Compensation Plan) for each Performance Period is determined by our board of directors based on measurable performance criteria and are expected to be determined in accordance with the criteria set forth in Schedule “A” of the Share Compensation Plan. Unless otherwise determined by our board of directors, the number of PSUs that vest is calculated by multiplying the aggregate number of PSUs granted by the percentage between 0 and 200 assigned to the performance achievement of the Target Milestones, subject to the participant continuing to be an eligible person. |
DEFERRED SHARE UNITS
Our board of directors adopted a deferred share unit plan effective July 1, 2008 (as amended from time to time, the “DSU Plan”) to more closely align the interests of our directors with the interests of the shareholders. Our directors are not eligible for option awards.
Under the DSU Plan: (a) directors are awarded annual deferred share unit (“DSU”) grants; (b) directors may elect to receive all or a portion of their annual retainer fees in DSUs; (c) the number of DSUs to be received is calculated by dividing the dollar value of the DSUs to be received by the market price of our common shares on the date the DSUs are credited to a director’s account; (d) directors are credited with additional DSUs for dividends paid on our common shares, if any, while they hold DSUs; (e) DSUs are credited to a director’s account pro rata on a quarterly basis; and (f) DSUs cannot be redeemed until the director ceases to be a member of the board of directors, at which point 50% of such director’s DSUs will be automatically redeemed (i) three months after the date such director ceases to be a member of our board of directors and (ii) the earlier of the date that is (1) fifteen months from the date such director ceases to be a member of our board of directors and (2) December 31 of the year following the date such director ceases to be a member of our board of directors. Upon redemption of DSUs, we will pay to a director a lump sum cash amount equal to the aggregate number of DSUs that have been credited to the account of that director multiplied by the market price of our common shares at the time of redemption.
- 70 -
CONVERTIBLE NOTES
2.875% Convertible Senior Notes due 2033
The Notes bear interest at 2.875% payable semi-annually in arrears on February 1 and August 1 of each year and are convertible by holders into our common shares, based on an initial conversion rate of 50 common shares per $1,000 principal amount of Notes, at any time up to and including the second business day immediately preceding March 1, 2033, subject to earlier redemption or purchase.
At any time on or after February 1, 2018 but before February 1, 2020, we may redeem all or part of the Notes for cash, but only if the last reported sale price of our common shares for 20 or more trading days in a period of 30 consecutive trading days ending on the trading day prior to the date we provide notice of redemption exceeds 130% of the conversion price in effect on each such trading day. The redemption price will be equal to the sum of: (a) 100% of the principal amount of the Notes to be redeemed; (b) accrued and unpaid interest, if any, to, but excluding, the redemption date; and (c) a “make-whole premium”, payable in cash, equal to the present value of the remaining scheduled payments of interest that would have been made on the Notes to be redeemed had they remained outstanding until February 1, 2020.
On or after February 1, 2020, we may redeem the Notes, in whole or in part, for cash equal to 100% of the Notes to be redeemed, plus accrued and unpaid interest, if any, to, but excluding, the redemption date.
Holders may require us to purchase all or a portion of their Notes on each of February 1, 2020, February 1, 2023, and February 1, 2028 for cash at a purchase price equal to 100% of the principal amount of the Notes to be purchased, plus accrued and unpaid interest, if any, to, but excluding, the purchase date.
In the event of a fundamental change (as defined in the Indenture), we are required to offer to purchase all of the outstanding Notes at a purchase price in cash equal to 100% of the principal amount of the Notes to be purchased, plus any accrued and unpaid interest, if any, to, but excluding, the purchase date.
The Notes are senior unsecured obligations and rank equally with all of our existing and future senior unsecured indebtedness. The Notes are effectively subordinated to all of our existing and future secured indebtedness and all existing and future liabilities of our subsidiaries, including trade payables. The Indenture does not restrict us from incurring further indebtedness including secured indebtedness.
The Indenture requires us to comply with certain reporting and other non-financial covenants.
MARKET FOR SECURITIES
TRADING PRICE AND VOLUME
Our common shares are listed on the Nasdaq and the TSX under the trading symbol “SSRM”. The following table sets out the market price range and total trading volumes of our common shares on the Nasdaq and the TSX for the periods indicated.
- 71 -
Nasdaq Global Market
| Year |
High | Low | Volume | |||||||||||
| ($) | ($) | (no. of shares) | ||||||||||||
| 2018 |
December | $ | 12.41 | $ | 10.06 | 20,717,300 | ||||||||
| November | $ | 11.30 | $ | 9.65 | 15,273,600 | |||||||||
| October | $ | 11.05 | $ | 8.62 | 19,628,200 | |||||||||
| September | $ | 9.28 | $ | 8.11 | 12,871,800 | |||||||||
| August | $ | 10.94 | $ | 8.34 | 16,210,900 | |||||||||
| July | $ | 10.80 | $ | 9.65 | 11,883,500 | |||||||||
| June | $ | 10.85 | $ | 9.47 | 13,760,700 | |||||||||
| May | $ | 11.44 | $ | 10.08 | 15,640,200 | |||||||||
| April | $ | 10.46 | $ | 9.40 | 14,649,700 | |||||||||
| March | $ | 9.79 | $ | 8.19 | 19,965,400 | |||||||||
| February | $ | 8.91 | $ | 7.64 | 24,190,900 | |||||||||
| January | $ | 9.54 | $ | 7.75 | 26,888,300 | |||||||||
|
Toronto Stock Exchange
|
||||||||||||||
| Year |
High | Low | Volume | |||||||||||
| (C$) | (C$) | (no. of shares) | ||||||||||||
| 2018 |
December | $ | 16.63 | $ | 13.99 | 5,659,400 | ||||||||
| November | $ | 14.96 | $ | 12.68 | 4,933,700 | |||||||||
| October | $ | 14.45 | $ | 11.05 | 5,529,600 | |||||||||
| September | $ | 11.97 | $ | 10.71 | 3,557,200 | |||||||||
| August | $ | 14.30 | $ | 10.91 | 3,479,100 | |||||||||
| July | $ | 14.16 | $ | 13.00 | 3,219,000 | |||||||||
| June | $ | 14.29 | $ | 12.61 | 3,334,600 | |||||||||
| May | $ | 14.62 | $ | 12.98 | 4,155,000 | |||||||||
| April | $ | 13.38 | $ | 12.07 | 5,007,700 | |||||||||
| March | $ | 12.62 | $ | 10.54 | 6,557,300 | |||||||||
| February | $ | 11.20 | $ | 9.70 | 6,560,700 | |||||||||
| January | $ | 11.89 | $ | 9.65 | 7,673,500 | |||||||||
PRIOR SALES
The following table summarizes the issuances of stock options, PSUs, RSUs and DSUs by us for the year ended December 31, 2018:
| Date of Issue | Number of Securities | Price per Security | Type of Security | |||
| January 1, 2018 |
376,300 | C$11.07 | Options | |||
| January 1, 2018 |
29,034 | C$11.00 | DSUs | |||
| January 1, 2018 |
174,900 | C$10.72 | PSUs | |||
| April 1, 2018 |
167,364 | C$12.41 | Options | |||
| April 1, 2018 |
25,923 | C$12.32 | DSUs | |||
| April 1, 2018 |
322,935 | C$11.47 | RSUs | |||
| June 4, 2018 |
125,000 | C$13.39 | Options | |||
| July 1, 2018 |
24,492 | C$13.04 | DSUs | |||
| October 1, 2018 |
27,869 | C$11.46 | DSUs |
- 72 -
DIRECTORS AND EXECUTIVE OFFICERS
The names, positions or offices held with us, province/state and country of residence, and principal occupation of our directors and executive officers as at March 11, 2019 are set out below. In addition, the principal occupations of each of our directors and executive officers within the past five years are disclosed in their brief biographies.
As at March 8, 2019, our directors and executive officers as a group beneficially owned, directly or indirectly, or exercised control or direction over 209,251 of our common shares, representing less than one percent of our issued and outstanding common shares before giving effect to the exercise of options to purchase common shares held by such directors and executive officers.
The term of our directors expires at the annual general meeting of shareholders where they can be nominated for re-election. The officers hold their office at the discretion of the Board of Directors, but typically on an annual basis, after the annual general meeting, the directors pass resolutions to appoint officers and committees.
DIRECTORS
A.E. Michael Anglin – California, U.S.A. (Director since August 7, 2008; Independent)
Mr. Anglin is the Chair of our Board and a member of our Corporate Governance and Nominating Committee. Mr. Anglin graduated with a Bachelor of Science (Honours) degree in Mining Engineering from the Royal School of Mines, Imperial College, London in 1977 and attained a Master of Science degree from the Imperial College in London in 1985. Mr. Anglin spent 22 years with BHP Billiton, most recently serving as Vice President Operations and Chief Operating Officer of the Base Metals Group based in Santiago, Chile, before retiring in 2008.
Paul Benson – British Columbia, Canada (Director since August 1, 2015; Not Independent)
Mr. Benson serves as our President and Chief Executive Officer and a member of our Board of Directors. He has been employed at SSR Mining since August 2015 and brings to the company more than 30 years of experience in various technical and business capacities. Most recently, Mr. Benson was CEO and Managing Director of Troy Resources Limited. Prior to that, for 20 years he held a number of executive and operating roles in Australia and overseas with BHP Billiton, Rio Tinto, and Renison Goldfields. Mr. Benson holds a Bachelor of Science in Geology and Exploration Geophysics and a Bachelor of Engineering in Mining, both from the University of Sydney. He also earned a Graduate Diploma in Applied Finance and Investment from the Securities Institute of Australia and a Masters of Science (Distinction) in Management from the London Business School.
Brian R. Booth – British Columbia, Canada (Director since May 31, 2016; Independent)
Mr. Booth is a member of our Compensation and Corporate Governance and Nominating Committees. He is also the President, CEO and a director of Element 29 Resources Inc. (“Element 29”), a private mining company and has served as a director on numerous public and private mining companies for over 10 years. Prior to joining Element 29, he was President, CEO and a director of Pembrook Copper Corp. and Lake Shore Gold Corp. and previous to that held various exploration management positions at Inco Limited over a 23 year career, including Manager of Exploration - North America and Europe, Manager of Global Nickel Exploration and Managing Director PT Ingold for Australasia. Mr. Booth holds a B.Sc. in Geological Sciences from McGill University (1983) and was awarded an honorary lifetime membership in the Indonesian Mining Association for service as Assistant Chairman of the Professional Division.
Simon A. Fish – Ontario, Canada (Director since January 1, 2018; Independent)
Mr. Fish was appointed to our Board in January 2018. He serves as a member of our Compensation and Safety and Sustainability Committees. Mr. Fish is the Executive Vice President and General Counsel of BMO Financial Group,
- 73 -
where he is responsible for the legal and regulatory affairs of the bank, including corporate governance, mergers and acquisitions, financial regulation and complex litigation. Prior to joining BMO, Mr. Fish was the Executive Vice President and General Counsel at Vale SA (formerly Inco Limited). Earlier, Mr. Fish held various positions at Royal Dutch Shell, most recently serving as the Vice President, General Counsel and Corporate Secretary at Shell Canada. Before joining Shell, Mr. Fish practiced corporate and securities law with Dechert LLP, an international law firm. Currently, he serves on the board of a number of think-tank, non-profit and charitable organizations. Mr. Fish holds business and law degrees from the University of Cape Town, the Washington College of Law and Harvard Business School.
Gustavo A. Herrero – Buenos Aires, Argentina (Director since January 8, 2013; Independent)
Mr. Herrero is the Chair of our Corporate Governance and Nominating Committee and a member of our Audit Committee. He is a resident of Buenos Aires, Argentina, and was the Executive Director of the Harvard Business School Latin America Research Center (“LARC”) from November 1, 1999 until December 31, 2013, at which time he retired from that position and currently serves on the Harvard Business School Latin American Advisory Board. Prior to joining the LARC in 1999, he was the CEO of IVA S.A., Argentina’s largest wool textile mill, and of Zucamor S.A./Papel Misionero S.A., Argentina’s leading paper and packaging manufacturer. Mr. Herrero also serves on the Advisory Committee of the university-wide David Rockefeller Center for Latin American Studies at Harvard. He also sits on the advisory boards of the Centro de Implementación de Políticas Públicas para la Equidad y el Crecimiento (CIPPEC) and the Fundación Red de Acción Política (RAP), both non-governmental organizations in Argentina. Mr. Herrero holds an MBA from Harvard Business School, where he was a Fulbright Scholar, and a degree of Licenciado en Administración de Empresas from the Universidad Argentina de la Empresa.
Beverlee F. Park – British Columbia, Canada (Director since May 20, 2014; Independent)
Ms. Park is the Chair of our Audit Committee and is one of our Audit Committee financial experts. She is also a member of our Compensation and Corporate Governance and Nominating Committees. Ms. Park graduated with a Bachelor of Commerce (Distinction) from McGill University. She is an FCPA/FCA and has a Masters of Business Administration from the Simon Fraser University Executive program. Ms. Park is a Corporate Director serving on three public company boards. Ms. Park has over 30 years of business experience, the majority of it in the forest industry where she held several executive roles with TimberWest Forest Corp., most recently serving as its Chief Operating Officer before retiring in 2013. Prior to becoming COO, Ms. Park also held the positions of Interim CEO, Executive Vice President and Chief Financial Officer as well as President, Couverdon Real Estate (TimberWest’s land development division).
Richard D. Paterson – California, U.S.A. (Director since August 7, 2008; Independent)
Mr. Paterson is a member of our Audit Committee and is one of our Audit Committee financial experts. He also serves on our Safety and Sustainability Committee. Mr. Paterson graduated from Concordia University, Montreal with a Bachelor of Commerce degree in 1964. Mr. Paterson has been a Managing Director of Genstar Capital, a private equity firm specializing in leveraged buyouts, since 1988. He retired from Genstar Capital at the end of 2016. Before founding Genstar Capital, Mr. Paterson served as Senior Vice President and Chief Financial Officer of Genstar Corporation, a NYSE-listed company, where he was responsible for finance, tax, information systems and public reporting.
Steven P. Reid – Alberta, Canada (Director since January 8, 2013; Independent)
Mr. Reid serves as the Chair of our Safety and Sustainability Committees and is a member of our Audit Committee. He has over 40 years of international business experience, including senior leadership roles in several countries. He held the position of Chief Operating Officer of Goldcorp from January 2007 until his retirement in September 2012. He also served Goldcorp as Executive Vice President, Canada and USA. Prior to joining Goldcorp, Mr. Reid spent 13 years at Placer Dome Inc. in numerous corporate, mine management and operating roles, including Country Manager for Canadian operations. Mr. Reid has also held leadership positions at Kingsgate Consolidated Limited and Newcrest Mining Limited, where he was responsible for running operations throughout Asia and Australia. Mr. Reid holds a Bachelor of Science
- 74 -
degree in Mineral Engineering from the South Australian Institute of Technology and a TRIUM Global Executive MBA. He is also a holder of the Institute of Corporate Directors Director designation (ICD.D).
Elizabeth A. Wademan – Ontario, Canada (Director since January 1, 2018; Independent)
Ms. Wademan was appointed to our Board in January 2018. She is the Chair of our Compensation Committee and a member of our Safety and Sustainability Committee. Ms. Wademan is a senior capital markets professional with over 23 years of financial services experience. Ms. Wademan spent 18 years in investment banking at BMO Capital Markets where she was one of the firm’s most senior capital markets professionals, responsible for leading capital markets advisory and complex transactions. She focused on the global metals and mining and technology sectors and was Head of Global Metals & Mining Equity Capital Markets prior to retiring in 2016. As a former Managing Director in Investment Banking, Ms. Wademan has extensive experience in capital markets and strategic advisory as well as a deep expertise in commodities and securities markets. She currently serves on the boards of Torex Gold Resources Inc., BSR REIT, and St. Joseph’s Health Centre Foundation. Ms. Wademan obtained her Bachelor of Commerce in Finance and International Business from McGill University. She is a CFA charterholder and is a holder of the Institute of Corporate Directors Director designation (ICD.D).
EXECUTIVE OFFICERS
Paul Benson – British Columbia, Canada
Mr. Benson serves as our President and Chief Executive Officer and a member of our Board of Directors. See “Directors and Executive Officers – Directors” for additional information on Mr. Benson’s experience.
Nadine J. Block – British Columbia, Canada
Ms. Block is our Senior Vice President, Human Resources. She has over 25 years of experience as a human resources professional. Before joining SSR Mining, Ms. Block provided HR consulting services to various mining organizations as well as other industries, including specialty food and manufacturing. Prior to her HR consulting practice, Ms. Block was Vice President, Human Resources for Quadra FNX Mining Ltd., Vice President, Human Resources for Pan American Silver Corp., and Senior Vice President, Human Resources for Finning International Inc. Ms. Block holds an MBA from McGill University and is a graduate of the University of British Columbia with a Bachelor of Arts in psychology.
W. John DeCooman – British Columbia, Canada
Mr. DeCooman is our Senior Vice President, Business Development and Strategy. His experience prior to joining SSR Mining in 2009 includes over 15 years of mining project finance and advisory responsibilities at Deutsche Bank, Alex Brown and Standard Bank, as well as corporate positions in finance, business development and exploration. Mr. DeCooman holds a Bachelor of Science degree from The Pennsylvania State University and a Master of Science degree from the Colorado School of Mines.
Gregory J. Martin – British Columbia, Canada
Mr. Martin has served as our Senior Vice President and Chief Financial Officer since January 2012. Before joining SSR Mining, Mr. Martin served as Vice President, Business Development and Treasurer for NovaGold Resources Inc. Prior to that, Mr. Martin held executive financial roles with Finning International Inc., Zincore Metals Inc. and Placer Dome Inc. Mr. Martin is a Chartered Professional Accountant, CGA, holds an MBA from the University of Western Ontario’s Ivey School of Business and is a graduate of the University of British Columbia with a B.A.Sc. in Civil Engineering.
Kevin O’Kane – British Columbia, Canada
Mr. O’Kane is our Senior Vice President and Chief Operating Officer. Before joining SSR Mining in 2018, he spent over 35 years at BHP Billiton in a diverse range of responsibilities and positions in management, operations, technical services
- 75 -
and support, business development and project management. Most recently, Mr. O’Kane was Asset President of Pampa Norte, BHP Minerals Americas Business, where he oversaw an exemplary safety record and drove operational improvements. Prior to this, he held a number of managerial and other positions at BHP’s Cerro Colorado and Escondida operations in Chile. Mr. O’Kane holds a Bachelor of Applied Science (Mining Engineering) from Queen’s University.
Except as described below, each of the individuals named above has been engaged for more than five years in his or her present principal occupation or organization in which he or she currently holds his or her principal occupation:
|
Name of Director or Officer
|
Five-Year Employment History
| |
| Paul Benson |
Prior to joining SSR Mining in August 2015, Mr. Benson was CEO and Managing Director of Troy Resources Limited.
| |
| Nadine J. Block |
Prior to joining SSR Mining in July 2014, Ms. Block provided HR consulting services to various mining organizations as well as other industries.
| |
| Brian R. Booth |
Prior to joining our Board of Directors, Mr. Booth served as Chairman of the Board of Directors of Claude Resources. He is currently the President, CEO and a director of Element 29.
| |
| Simon A. Fish |
Mr. Fish is currently the Executive Vice President and General Counsel at BMO Financial Group.
| |
| Kevin O’Kane |
Prior to joining SSR Mining in 2018, Mr. O’Kane spent over 35 years at BHP Billiton in a diverse range of responsibilities and positions. Most recently, Mr. O’Kane was Asset President of Pampa Norte, BHP Minerals Americas Business.
| |
| Elizabeth A. Wademan |
Prior to joining our Board of Directors, Ms. Wademan spent 18 years in investment banking at BMO Capital Markets. She was Head of Global Metals & Mining Equity Capital Markets prior to retiring in 2016. Prior to becoming Head of Global Metals & Mining Equity Capital Markets, Ms. Wademan served as Managing Director in Investment Banking. She also currently serves on the Board of Directors of Torex Gold Resources Inc. and BSR REIT.
| |
STANDING COMMITTEES OF THE BOARD
There are currently four standing committees of our Board of Directors: the Audit Committee, the Compensation Committee, the Corporate Governance and Nominating Committee, and the Safety and Sustainability Committee. The following table identifies the members of each of these committees:
|
Board Committee
|
Committee Members
|
Status
| ||
| Audit Committee |
Beverlee F. Park (Chair) Gustavo A. Herrero Richard D. Paterson Steven P. Reid
|
Independent Independent Independent Independent | ||
| Compensation Committee |
Elizabeth A. Wademan (Chair) Brian R. Booth Simon A. Fish Beverlee F. Park
|
Independent Independent Independent Independent | ||
| Corporate Governance and Nominating Committee |
Gustavo A. Herrero (Chair) A.E. Michael Anglin Brian R. Booth Beverlee F. Park
|
Independent Independent Independent Independent |
- 76 -
|
Board Committee
|
Committee Members
|
Status
| ||
| Safety and Sustainability Committee | Steven P. Reid (Chair) Simon A. Fish Richard D. Paterson Elizabeth A. Wademan |
Independent Independent Independent Independent |
CODE OF ETHICS
We have adopted a “code of ethics” (as that term is defined in the Annual Report on Form 40-F of the SEC), entitled the “Code of Business Conduct and Ethics”, that applies to our principal executive officer, principal financial officer and other senior financial officers performing similar functions. The Code of Conduct is available for viewing on our website at www.ssrmining.com.
All amendments to the Code of Conduct, and all waivers of the Code of Conduct with respect to our principal executive officer, principal financial officer or other senior financial officers performing similar functions, will be posted on our website.
CEASE TRADE ORDERS OR BANKRUPTCIES
Other than as disclosed below, no director or executive officer of SSR Mining is, as at the date of this Annual Information Form, or was within ten years before the date of this Annual Information Form, a director, chief executive officer or chief financial officer of any company (including SSR Mining), that:
| (a) | was subject to an order that was issued while the director or executive officer was acting in the capacity as director, chief executive officer or chief financial officer; or |
| (b) | was subject to an order that was issued after the director or executive officer ceased to be a director, chief executive officer or chief financial officer and which resulted from an event that occurred while that person was acting in the capacity as director, chief executive officer or chief financial officer. |
For the purposes of subsection (a) above, “order” means a cease trade order, an order similar to a cease trade order or an order that denied the relevant company access to any exemption under securities legislation, and in each case that was in effect for a period of more than 30 consecutive days.
Mr. Anglin was a director of EmberClear Corp. (“EmberClear”) until September 8, 2014. EmberClear was the subject of cease trade orders issued by each of the Alberta Securities Commission, British Columbia Securities Commission and Ontario Securities Commission on October 30, 2014, November 5, 2014 and November 17, 2014, respectively. The cease trade orders were issued due to EmberClear’s failure to file annual audited financial statements for the year ended June 30, 2014 and the related management’s discussion and analysis. The cease trade orders against EmberClear were revoked in January 2015. Mr. Anglin was also the non-executive Chairman of Laguna Gold Limited, a private Australian company, when its board of directors decided to put the company into receivership on December 19, 2018.
Other than as disclosed below, no director or executive officer of SSR Mining, or a shareholder holding a sufficient number of our securities to affect materially the control of SSR Mining:
| (a) | is, as at the date of this Annual Information Form, or has been within the ten years before the date of this Annual Information Form, a director, chief executive officer or chief financial officer of any company (including SSR Mining) that, while that person was acting in that capacity, or within a year of that person ceasing to act in that capacity, became bankrupt, made a proposal under any legislation relating to bankruptcy or insolvency or was subject to or instituted any proceedings, arrangement or compromise with creditors or had a receiver, receiver manager or trustee appointed to hold its assets; or |
- 77 -
| (b) | has, within the ten years before the date of this Annual Information Form, become bankrupt, made a proposal under any legislation relating to bankruptcy or insolvency, or was subject to or instituted any proceedings, arrangement or compromise with creditors, or had a receiver, receiver manager or trustee appointed to hold the assets of the director, executive officer or shareholder. |
PENALTIES OR SANCTIONS
No director or executive officer of SSR Mining, or a shareholder holding a sufficient number of our securities to affect materially the control of SSR Mining, has been subject to:
| (a) | any penalties or sanctions imposed by a court relating to securities legislation or by a securities regulatory authority or has entered into a settlement agreement with a securities regulatory authority; or |
| (b) | any other penalties or sanctions imposed by a court or regulatory body that would likely be considered important to a reasonable investor in making an investment decision regarding SSR Mining. |
CONFLICTS OF INTEREST
Certain of our directors and officers are directors or officers of other natural resource or mining-related companies. These associations may give rise to conflicts of interest from time to time. We are not aware of any existing or potential conflicts of interest between SSR Mining or any of its subsidiaries and any of our directors or officers. If a director or officer has any conflict of interest or potential conflict of interest, the interested director or officer is required to disclose such conflict pursuant to and is expected to govern themselves in accordance with the BCBCA and the Code of Conduct. In particular, an interested director or officer will not participate in deliberations where he or she has a conflict or potential conflict of interest and, in the case of an interested director, will not vote on any such matter.
AUDIT COMMITTEE
The Audit Committee has the responsibility of, among other things: overseeing financial reporting, internal controls, the audit process and the establishment of “whistleblower” and related policies; recommending the appointment of the independent auditor and reviewing the annual audit plan and auditor compensation; pre-approving audit, audit-related and tax services to be provided by the independent auditor; and reviewing and recommending approval to the Board of Directors of our annual and quarterly financial statements and management’s discussion and analysis and our Annual Information Form. The full text of the Audit Committee Charter is attached hereto as Schedule “A”.
COMPOSITION OF THE AUDIT COMMITTEE
All members of the Audit Committee are independent and considered to be financially literate within the meaning of National Instrument 52-110 — Audit Committees (“NI 52-110”). The members of the Audit Committee are: Beverlee F. Park (Chair), Gustavo A. Herrero, Richard D. Paterson and Steven P. Reid. Ms. Park and Mr. Paterson are our Audit Committee financial experts.
For more information regarding relevant education and experience for Ms. Park and Messrs. Herrero, Paterson and Reid, see “Directors and Executive Officers – Directors”.
AUDIT COMMITTEE OVERSIGHT
At no time since the commencement of our most recently-completed financial year was a recommendation of the Audit Committee to nominate or compensate an external auditor not adopted by our Board of Directors.
- 78 -
RELIANCE ON CERTAIN EXEMPTIONS
At no time since the commencement of our most recently completed financial year have we relied on the exemption in Section 2.4 of NI 52-110 (De Minimis Non-audit Services) or an exemption from NI 52-110, in whole or in part, granted under Part 8 of NI 52-110.
PRE-APPROVAL POLICIES AND PROCEDURES
The Audit Committee’s policy regarding the pre-approval of non-audit services to be provided to us by our independent auditors is that all such services shall be pre-approved by the Audit Committee. The Audit Committee Charter allows the Audit Committee to delegate the pre-approval authority to an independent member of the Audit Committee, provided that any pre-approval under delegated authority must be presented to the full Audit Committee at its first scheduled meeting following such pre-approval. This pre-approval authority has been delegated to the Chair of the Audit Committee. Non-audit services that are prohibited to be provided to us by our independent auditors may not be pre-approved. In addition, prior to the granting of any pre-approval, the Audit Committee must be satisfied that the performance of the services in question will not compromise the independence of the independent auditors. All non-audit services performed by our auditors for the fiscal year ended December 31, 2018 have been pre-approved by our Audit Committee or the Audit Committee Chair, pursuant to delegated authority. No non-audit services were approved pursuant to the de minimis exemption to the pre-approval requirement.
EXTERNAL AUDITOR SERVICE FEES
The aggregate fees billed by our external auditors, PricewaterhouseCoopers LLP, Chartered Professional Accountants, in each of the last two financial years are as follows:
| Financial Year Ending | Audit Fees(1) | Audit Related Fees(2) |
Tax Fees(3) | All Other Fees(4) | ||||
|
2018 |
C$991,121 |
— |
C$11,718 |
— | ||||
|
2017
|
C$1,025,264
|
—
|
C$42,400
|
—
|
Notes:
| (1) | The aggregate audit fees billed. |
| (2) | The aggregate fees billed for assurance and related services that are reasonably related to the performance of the audit or review of our financial statements which are not included under the heading “Audit Fees”. |
| (3) | The aggregate fees billed for professional services rendered for tax compliance, tax advice and tax planning, including review of certain tax forms and application of certain tax rules. |
| (4) | The aggregate fees billed for products and services other than as set out under the headings “Audit Fees”, “Audit Related Fees” and “Tax Fees”. |
| (5) | All audit and non-audit services performed by the external auditor during our two most recently-completed financial years were pre-approved by the Audit Committee or the Audit Committee Chair, as discussed under the heading “Pre-Approval Policies and Procedures” above. |
INTEREST OF MANAGEMENT AND OTHERS IN MATERIAL TRANSACTIONS
No director, executive officer or shareholder holding on record or beneficially, directly or indirectly, more than 10% of our issued shares, or any of their respective associates or affiliates has any material interest, direct or indirect, in any transaction in which we have participated prior to the date of this Annual Information Form, or in any proposed transaction, which has materially affected or will materially affect us.
TRANSFER AGENT AND REGISTRAR
The transfer agent and registrar for our common shares is Computershare Investor Services Inc. at its offices in Toronto, Ontario and Vancouver, British Columbia.
- 79 -
MATERIAL CONTRACTS
Except for contracts entered into in the ordinary course of business, the only material contracts that we have entered in the financial year ended December 31, 2018, or before the last financial year but still in effect, are as follows:
| 1. | the Indenture; |
| 2. | Indemnity agreements made effective as of March 1, 2014 between SSR Mining and each of A. E. Michael Anglin, Gustavo A. Herrero, Richard D. Paterson, Steven P. Reid, W. John DeCooman and Gregory J. Martin; |
| 3. | Indemnity agreement made effective as of May 20, 2014 between SSR Mining and Beverlee F. Park; |
| 4. | Indemnity agreement made effective as of August 6, 2014 between SSR Mining and Nadine J. Block; |
| 5. | Indemnity agreement made effective as of August 1, 2015 between SSR Mining and Paul Benson; |
| 6. | Indemnity agreement made effective as of May 31, 2016 between SSR Mining and Brian R. Booth; |
| 7. | Indemnity agreement made effective as of July 10, 2017 between SSR Mining and Thomas Hethmon; |
| 8. | Indemnity agreement made effective as of July 31, 2017 between SSR Mining and Matthew B. Langford; |
| 9. | Indemnity agreements made effective as of January 1, 2018 between SSR Mining and each of Simon A. Fish and Elizabeth A. Wademan. |
| 10. | Amended and Restated Shareholder Rights Plan Agreement made as of March 21, 2018 between SSR Mining and Computershare Investor Services Inc.; |
| 11. | Indemnity agreement made effective as of June 4, 2018 between SSR Mining and Kevin O’Kane; |
| 12. | Indemnity agreement made effective as of August 13, 2018 between SSR Mining and Tim Bekhuys; |
| 13. | Indemnity agreement made effective as of November 22, 2018 between SSR Mining and F. Carl Edmunds. |
Copies of the above material contracts are available under our profile on the SEDAR website at www.sedar.com.
INTERESTS OF EXPERTS
The following persons have been named as having prepared or certified a report, valuation, statement or opinion described or included in a filing, or referred to in a filing, made under NI 51-102 during, or relating to, our financial year ended December 31, 2018: Bruce Butcher, P.Eng., F. Carl Edmunds, P.Geo., Trevor J. Yeomans, ACSM, P.Eng., James N. Carver, SME Registered Member, James Frost, P.E., Karthik Rathnam, MAusIMM (CP), Thomas Rice, SME Registered Member, Cameron Chapman, P.Eng., Kevin Fitzpatrick, P.Eng., Jeffrey Kulas, P. Geo., Michael Selby, P.Eng., Dominic Chartier, P.Geo., Mark Liskowich, P.Geo. and Sebastien Bernier, P.Geo. None of the foregoing persons, or any director, officer, employee or partner thereof, as applicable, received or has received a direct or indirect interest in our property or the property of any of our associates or affiliates. The foregoing persons held an interest in either less than 1% or none of our securities or the securities of any associate or affiliate of ours when they prepared the reports, the Mineral Reserves estimates and the Mineral Resources estimates referred to herein and after the preparation of such reports and estimates, and they did not receive any direct or indirect interest in any of our securities or the securities of any associate or affiliate of ours in connection with the preparation of such reports or estimates. Neither the aforementioned persons, other than Bruce Butcher, F. Carl Edmunds, Trevor J. Yeomans, James N. Carver, James Frost, Karthik Rathnam, Cameron Chapman, Kevin Fitzpatrick and Jeffrey Kulas (each of whom is a SSR Mining employee), nor any director, officer, employee or
- 80 -
partner, as applicable, of the aforementioned companies or partnerships is currently expected to be elected, appointed or employed as a director, officer or employee of us or of any associate or affiliate of us.
PricewaterhouseCoopers LLP, Chartered Professional Accountants, provided an auditor’s report dated February 21, 2019 in respect of our financial statements for the year ended December 31, 2018. PricewaterhouseCoopers LLP, Chartered Professional Accountants, has advised us that they are independent with respect to SSR Mining in accordance with the Chartered Professional Accountants of British Columbia Code of Professional Conduct and within the meaning of PCAOB Rule 3520, Auditor Independence.
ADDITIONAL INFORMATION
Additional information, including that relating to directors’ and officers’ remuneration, principal holders of our securities and securities authorized for issuance under equity compensation plans, interests of insiders in material transactions and corporate governance practices, is contained in our management information circular for the annual and special meeting of shareholders to be held on May 9, 2019.
Additional financial information is provided in our audited consolidated financial statements and management’s discussion and analysis of the financial position and results of operations for the year ended December 31, 2018, which are available under our profile on the SEDAR website at www.sedar.com.
Additional information relating to us is available under our profile on the SEDAR website at www.sedar.com.
Dated March 11, 2019.
| BY ORDER OF THE BOARD OF DIRECTORS
“Paul Benson”
Paul Benson President and Chief Executive Officer |
SCHEDULE “A”
AUDIT COMMITTEE CHARTER
(revised November 2018)
| A. | PURPOSE |
The primary function of the Audit Committee (the “Committee”) of SSR Mining Inc. (the “Company”) is to assist the Board of Directors of the Company (the “Board”) in fulfilling its oversight responsibilities, relating to each of the:
| (a) | Company’s accounting and financial reporting process and systems of internal accounting and financial controls; |
| (b) | quality and integrity of the Company’s financial statements; |
| (c) | Company’s compliance with legal and regulatory requirements; and |
| (d) | independence and performance of the Company’s external auditor. |
| B. | COMPOSITION, PROCEDURES AND ORGANIZATION |
| 1. | The Board shall appoint the members and the Chair of the Committee each year. The Board may at any time remove or replace any member of the Committee and may fill any vacancy in the Committee. |
| 2. | The Committee shall consist of at least three members of the Board all of whom shall be independent in accordance with the securities laws, rules, regulations and guidelines of all applicable securities regulatory authorities, including without limitation the securities commissions in each of the provinces and territories of Canada and the U.S. Securities and Exchange Commission (the “SEC”), and the stock exchanges on which the Company’s securities are listed, including without limitation the Toronto Stock Exchange and the Nasdaq Global Market (collectively, “Securities Laws”), subject to any exemptions provided thereunder. |
| 3. | All Committee members shall be financially literate as defined by Securities Laws and at least one member of the Committee shall be a “financial expert” as defined by the SEC, unless otherwise determined by the Board. The Chair of the Board shall be an ex-officio member of the Committee. |
| 4. | If the Chair of the Committee is not present at any meeting of the Committee, one of the other members of the Committee present at the meeting shall be chosen by the Committee to preside at the meeting. |
| 5. | The Corporate Secretary of the Company shall be the secretary of the Committee, unless otherwise determined by the Committee. |
| 6. | The Committee shall meet at least four times annually on such dates and at such locations as may be determined by the Chair and may also meet at any other time or times on the call of the Chair, the external auditor or any two of the other Committee members. |
| 7. | The quorum for meetings shall be a majority of the members of the Committee, present in person or by telephone or other telecommunication device that permits all persons participating in the meeting to speak and to hear each other. The Committee may also act by unanimous written consent of its members. |
A-2
| 8. | The external auditor or any two Directors may request the Chair to call a meeting of the Committee and may attend at such meeting or inform the Committee of a specific matter of concern to the external auditor or such Directors, and may participate in such meeting. |
| 9. | Notice of the time and place of every meeting shall be given in writing or by e-mail or facsimile communication to each member of the Committee at least 24 hours prior to the time fixed for such meeting; provided, however, that a member may in any manner waive a notice of a meeting and attendance of a member at a meeting is a waiver of notice of the meeting, except where a member attends a meeting for the express purpose of objecting to the transaction of any business on the grounds that the meeting is not lawfully called. |
| 10. | The Chair shall develop the Committee’s agenda, in consultation with the other members of the Committee, the Board and management, as necessary. The agenda and information concerning the business to be conducted at each Committee meeting shall, to the extent practical, be communicated to the members of the Committee sufficiently in advance of each meeting to permit meaningful review. |
| 11. | At the invitation of the Chair, one or more officers or employees of the Company may, and if required by the Committee shall, attend a meeting of the Committee. The external auditor shall receive notice of and have the right to attend all meetings of the Committee. |
| 12. | The Committee shall fix its own procedure at meetings, keep records of its proceedings and report to the Board when the Committee may deem appropriate (but not later than the next meeting of the Board). |
| 13. | The external auditor shall have a direct line of communication to the Committee through the Chair and may bypass management if deemed necessary. The external auditor shall report to the Committee and is ultimately accountable to the Board and the Committee. |
| 14. | The Committee, through its Chair, may contact directly the external auditor, the internal auditor, if any, and any employee of the Company as it deems necessary. |
| 15. | In discharging its responsibilities, the Committee shall have full access to all books, records, facilities and personnel of the Company, to the Company’s legal counsel and to such other information respecting the Company as it considers necessary or advisable in order to perform its duties and responsibilities. |
| 16. | The Committee shall annually assess its performance and review this charter and the calendar of activities, attached as Appendix A, and submit any recommended changes thereto for approval by the Board. |
| C. | OUTSIDE CONSULTANTS AND ADVISORS |
The Committee, when it considers it necessary or advisable, may retain, at the Company’s expense, outside consultants or advisors to assist or advise the Committee independently on any matter within its mandate. The Committee shall have the sole authority to retain and terminate any such consultants or advisors, including sole authority to approve the fees and other retention terms for such persons.
| D. | ROLES AND RESPONSIBILITIES |
The following functions shall be the common recurring activities of the Committee in carrying out its responsibilities as outlined in the “Purpose” section of this charter. These functions should serve as a guide with the understanding that the Committee may carry out additional functions and adopt additional policies and procedures as may be appropriate in light of changing business, legislative, regulatory, legal or other conditions. The Committee shall also carry out any other
A-3
responsibilities and duties delegated to it by the Board from time to time related to the purposes of the Committee as outlined in the “Purpose” section of this charter.
The Committee shall carry out the duties set forth below for the Company, major subsidiary undertakings and the group as a whole, as appropriate. The Committee’s principal responsibility is one of oversight. The Company’s management is responsible for preparing the Company’s financial statements and ensuring their accuracy and completeness, and the Company’s external auditor is responsible for auditing and/or reviewing those financial statements. In carrying out these oversight responsibilities, the Committee is not required to provide any expert or special assurance as to the Company’s financial statements or any professional certification as to the external auditor’s work.
| 1. | Overall Duties and Responsibilities |
The overall duties and responsibilities of the Committee shall be to:
| (a) | assist the Board in the discharge of its responsibilities relating to the quality, acceptability and integrity of the Company’s accounting policies and principles, reporting practices and internal controls; |
| (b) | assist the Board in the discharge of its responsibilities relating to compliance with disclosure requirements under applicable Securities Laws, including approval of the Company’s annual and quarterly consolidated financial statements together with the Management’s Discussion and Analysis; |
| (c) | oversee the work of and to establish and maintain a direct line of communication with the Company’s external auditor and internal auditor (if any) and assess their performance; |
| (d) | ensure that the management of the Company has designed, implemented and is maintaining an effective system of internal controls; and |
| (e) | report regularly to the Board on the fulfillment of its duties and responsibilities. |
| 2. | Public Filings, Policies and Procedures |
The Committee is charged with the responsibility to:
| (a) | review and approve for recommendation to the Board: |
| (i) | the annual audited financial statements, with the report of the external auditor, Management’s Discussion and Analysis and the impact of unusual items and changes in accounting policies and estimates; |
| (ii) | the interim unaudited financial statements, Management’s Discussion and Analysis and the impact of unusual items and changes in accounting policies and estimates; |
| (iii) | financial information in earnings press releases; |
| (iv) | the annual information form; |
| (v) | prospectuses; and |
A-4
| (vi) | financial information in other public reports and public filings, including but not limited to the Extractive Sector Transparency Measures Act annual report, if applicable, requiring approval by the Board; |
| (b) | ensure adequate procedures are in place for the review of the Company’s disclosure of financial information extracted or derived from the Company’s financial statements and periodically assess the Company’s disclosure controls and procedures, and management’s evaluation thereof, to ensure that financial information is recorded, processed, summarized and reported within the time periods required by law; |
| (c) | review disclosures made to the Committee by the Chief Executive Officer and the Chief Financial Officer during their certification process for any statutory documents about any significant deficiencies in the design or operation of internal controls or material weakness therein and any fraud involving management or other employees who have a significant role in internal controls; and |
| (d) | review with management and the external auditor: |
| (i) | significant variances in actual financial results for the applicable period from budgeted or projected results; |
| (ii) | any actual or proposed changes in accounting or financial reporting practices; |
| (iii) | any significant or unusual events or transactions and the methods used to account for significant or unusual transactions where different approaches are possible; |
| (iv) | any actual or potential breaches of debt covenants; |
| (v) | the consistency of, and any changes to, accounting policies both on a year to year basis and across the Company; |
| (vi) | whether the Company has followed appropriate accounting standards and made appropriate estimates and judgments; |
| (vii) | the presentation and impact of significant risks and uncertainties; |
| (viii) | the accuracy, completeness and clarity of disclosure in the Company’s financial reports and the context in which statements are made; |
| (ix) | any tax assessments, changes in tax legislation or any other tax matters that could have a material effect upon the financial position or operating results of the Company and the manner in which such matters have been disclosed in the consolidated financial statements; |
| (x) | any litigation, claim or other contingency that could have a material effect upon the financial position or operating results of the Company and the manner in which such matters have been disclosed in the consolidated financial statements; |
| (xi) | all material information presented in the Management’s Discussion and Analysis; |
| (xii) | material communications between the external auditor and management, such as any management letter or schedule of unadjusted differences; |
| (xiii) | any fraud, illegal acts, deficiencies in internal controls or other similar issues; |
A-5
| (xiv) | general accounting trends and issues of auditing policy, standards and practices which affect or may affect the Company; and |
| (xv) | any correspondence with securities regulators or other regulatory or government agencies which raise material issues regarding the Company’s financial reporting or accounting policies. |
| 3. | Internal Controls, Risk Management and Compliance |
The duties and responsibilities of the Committee as they relate to the Company’s internal controls, risk management and compliance are to:
| (a) | evaluate whether management is setting the appropriate “control culture” by communicating the importance of internal controls and the management of risk and ensuring that all employees have an understanding of their roles and responsibilities; |
| (b) | review the adequacy, appropriateness and effectiveness of the Company’s policies and business practices which impact on the integrity, financial and otherwise, of the Company, including those relating to hedging, insurance, accounting, cybersecurity, information services and systems, financial controls, management reporting and risk management; |
| (c) | receive a report from management on tax issues and planning, including compliance with the Company’s source deduction obligations and other remittances under applicable tax or other legislation; |
| (d) | receive a report on the annual policy attestation process for, and review exceptions, if any, under the Company’s Code of Business Conduct and Ethics, Anti-Corruption Compliance Policy, Corporate Disclosure Policy, Whistleblower Policy and Insider Trading Policy; |
| (e) | review any issues between management and the external auditor that could affect the financial reporting or internal controls of the Company; |
| (f) | periodically review the Company’s accounting and auditing policies, practices and procedures and the extent to which recommendations made by the external auditor have been implemented; |
| (g) | review annually the adequacy and quality of the Company’s financial and accounting staffing, including the need for and scope of internal audit reviews (if any); |
| (h) | review annually with the external auditor any significant matters regarding the Company’s internal controls and procedures over financial reporting, including any significant deficiencies or material weaknesses in their design or operation, that have come to their attention during the conduct of their annual audit, and review whether internal control recommendations made by the external auditor have been implemented by management; |
| (i) | be responsible for the Company risk management processes including: (i) reviewing the Company’s risk register and Enterprise Risk Management Framework; (ii) receiving reports from management and other Board committees, including without limitation the Safety and Sustainability Committee, on the identification, assessment and management of risks; and (iii) reviewing major risk exposures and the guidelines and policies that management has put in place to govern the process of monitoring, controlling and reporting such exposures; |
| (j) | review and recommend for approval by the Board the appointment of the Chief Financial Officer and review the appointment of any other key financial executives involved in the financial reporting process; |
A-6
| (k) | establish procedures for: |
| (i) | the receipt, retention and treatment of complaints received by the Company regarding accounting, internal controls, or auditing matters; and |
| (ii) | the confidential, anonymous submission by employees of the Company of concerns regarding questionable accounting or auditing matters, |
and review any such complaints and concerns received and the investigation and resolution thereof, including without limitation the review of all complaints and concerns of any nature under the Whistleblower Policy; and
| (i) | review and approve related party transactions. |
| 4. | External Auditor |
The duties and responsibilities of the Committee as they relate to the external auditor shall be to:
| (a) | consider and make recommendations to the Board, to be put to shareholders for approval at the annual meeting of shareholders, in relation to the appointment, re-appointment or removal of the Company’s external auditor; |
| (b) | oversee the selection process for a new external auditor if required, and if an external auditor resigns the Committee shall investigate the issues leading to such resignation and decide whether any action is required; |
| (c) | oversee the relationship with the external auditor, including without limitation to: |
| (i) | recommend to the Board for approval the engagement of the external auditor for interim reviews and the remuneration for the audit and interim reviews and to assess whether fees for audit or non-audit services are appropriate to enable an adequate audit to be conducted; |
| (ii) | review the terms of engagement for the external auditor and review any engagement letter issued at the start of each audit and the scope of the audit; |
| (iii) | assess annually the independence and objectivity of the external auditor taking into account relevant professional and regulatory requirements and the relationship with the external auditor as a whole, including the provision of any non-audit services, which assessment shall include receipt of a report from the external auditor delineating all relationships between the external auditor and the Company; |
| (iv) | assess annually the qualifications, expertise and resources of the external auditor and the effectiveness of the audit process, which shall include a report from the external auditor on its own internal quality procedures; |
| (v) | satisfy itself that there are no relationships (such as family, employment, investment, financial or business) between the external auditor and the Company (other than in the ordinary course of business); |
| (vi) | review and approve the Company’s hiring policies regarding partners, employees and former partners and employees of the present and any former external auditor of the Company; and |
A-7
| (vii) | monitor the external auditor’s compliance with relevant ethical and professional guidance on the rotation of audit partners, the level of fees paid by the Company compared to the overall fee income of the firm, office and partner and other related requirements; and |
| (d) | review with the external auditor, upon completion of the audit and interim reviews: |
| (i) | contents of the report; |
| (ii) | scope and quality of the audit work performed; |
| (iii) | adequacy of the Company’s financial and auditing personnel; |
| (iv) | co-operation received from the Company’s personnel during the audit; |
| (v) | internal resources used; |
| (vi) | significant transactions outside of the normal business of the Company; |
| (vii) | significant proposed adjustments and recommendations for improving internal accounting controls, accounting principles and management systems; |
| (viii) | the quality, acceptability and integrity of the Company’s accounting policies and principles; |
| (ix) | the non-audit services provided by the external auditor; |
| (x) | the effect of regulatory and accounting initiatives as well as off-balance sheet structures on the Company’s financial statements; |
| (xi) | the management letter and management’s response to the external auditor’s findings and recommendations; |
and report to the Board in respect of the foregoing and on such other matters as they consider necessary;
| (e) | implement structures and procedures to ensure that the Committee meets with the external auditor on a regular basis in the absence of management in order to review any difficulties encountered in carrying out the audit and to resolve disagreements between the external auditor and management; and |
| (f) | pre-approve the retention of the external auditor for any non-audit services and the fee for such services. |
The Committee may satisfy the pre-approval requirement in subsection (f) if:
| (i) | the aggregate amount of all the non-audit services that were not pre-approved constitutes no more than five per cent of the total amount of revenues paid by the Company to its external auditor during the fiscal year in which the services are provided; |
| (ii) | the services were not recognized by the Company at the time of the engagement to be non-audit services; and |
A-8
| (iii) | the services are promptly brought to the attention of the Committee and are approved, prior to the completion of the audit, by the Committee or by one or more members of the Committee to whom authority to grant such approvals has been delegated by the Committee. |
The Committee may delegate to one or more independent members the authority to pre-approve non-audit services provided that the pre-approval of non-audit services by any member to whom authority has been delegated must be presented to the full Committee at its first scheduled meeting following such pre-approval.
For greater certainty, the external auditor shall report directly and be responsible to the Audit Committee.
| 5. | Internal Audit Function |
The duties and responsibilities of the Committee as they relate to the internal audit function shall be to:
| (a) | review and approve the annual internal audit plan; |
| (b) | review the significant findings prepared by the internal auditor and recommendations issued by any external party relating to internal audit issues, together with management’s response thereto; |
| (c) | review the adequacy of the resources of the internal audit function to ensure the objectivity and independence of the internal audit function; |
| (d) | consult with management on management’s appointment, replacement, reassignment or dismissal of any personnel engaged in the internal audit function; |
| (e) | ensure that the individual responsible for the internal audit function has access to the Chair of the Committee, the Chair of the Board, the Chief Executive Officer and the Chief Financial Officer, and periodically meet separately with such individual to review any problems or difficulties he or she may have encountered and specifically: |
| (i) | any difficulties that were encountered in the course of the internal audit work, including restrictions on the scope of activities or access to required information and any disagreements with management; |
| (ii) | any changes required in the planned scope of the internal audit; and |
| (iii) | the internal audit function’s responsibilities, budget and staffing; and |
| (f) | report to the Board on each of the foregoing matters. |
MANAGEMENT’S DISCUSSION AND ANALYSIS FOR THE YEAR ENDED DECEMBER 31, 2018
| SSR Mining Inc.
|
MD&A Year-End 2018 | 1
| |
CONTENTS
| 1 Fourth Quarter and Full Year 2018 Highlights |
3 | |||
| 2 Outlook |
4 | |||
| 3 Business Overview |
5 | |||
| 4 Results of Operations |
10 | |||
| 5 Review of Projects and Mineral Reserves and Mineral Resources |
17 | |||
| 6 Review of Annual Financial Results |
18 | |||
| 7 Quarterly Financial Review |
22 | |||
| 8 Financial Instruments and Related Risks |
27 | |||
| 9 Risks and Uncertainties |
31 | |||
| 10 Non-GAAP Financial Measures |
31 | |||
| 11 Critical Accounting Policies and Estimates |
36 | |||
| 12 Internal Control over Financial Reporting and Disclosure Controls and Procedures |
37 | |||
| 13 Cautionary Notes Regarding Forward-Looking Statements and Mineral Reserves and Mineral Resources Estimates |
38 | |||
| SSR Mining Inc.
|
MD&A Year-End 2018 | 2
| |
Management’s Discussion and Analysis of the Financial Position and Results of Operations for the Year Ended December 31, 2018
This Management’s Discussion and Analysis (“MD&A”) is intended to supplement the audited consolidated financial statements of SSR Mining Inc., formerly Silver Standard Resources Inc., (“SSR Mining”, “the Company”, “we”, “us” or “our”) for the year ended December 31, 2018, and the related notes thereto, which have been prepared in accordance with International Financial Reporting Standards, as issued by the International Accounting Standards Board (“IFRS”).
All figures are expressed in U.S. dollars except where otherwise indicated. This MD&A has been prepared as of February 21, 2019, and should be read in conjunction with the audited consolidated financial statements for the year ended December 31, 2018.
Additional information, including our most recent Annual Information Form and Annual Report on Form 40-F is available on SEDAR at www.sedar.com, and on the EDGAR section of the U.S. Securities and Exchange Commission (“SEC”) website at www.sec.gov.
This MD&A contains “forward-looking statements” that are subject to risk factors set out in a cautionary note contained in Section 13. We use certain non-GAAP financial measures in this MD&A which are described in Section 10. We use Mineral Reserves and Mineral Resources classifications in this MD&A, which differ significantly from the classifications required by the SEC as set out in the cautionary note contained in Section 13.
| 1. | FOURTH QUARTER AND FULL YEAR 2018 HIGHLIGHTS |
| ◾ | Achieved annual production and cost guidance: Achieved initial guidance for the seventh consecutive year by delivering gold equivalent production of over 345,000 ounces at cash costs of $736 per payable gold equivalent ounce sold. |
| ◾ | Continued our track record of Mineral Reserves growth: Successful exploration activities in 2018 increased gold Mineral Reserves at the Marigold mine to 3.3 million ounces and at the Seabee Gold Operation to 608,000 ounces. |
| ◾ | Delivered record annual gold production at Seabee: The operation achieved its fifth consecutive annual production record, producing 95,602 ounces of gold, exceeding the top end of our upwardly revised annual guidance. Annual cash costs were $505 per payable ounce of gold sold. |
| ◾ | Strong operating performance at Marigold: Delivered quarterly gold production of 54,306 ounces, resulting in annual production of 205,161 ounces of gold. Reported annual cash costs of $723 per payable ounce of gold sold, at the lower end of our improved guidance. |
| ◾ | Delivered updated Marigold life of mine plan: Released updated plan on June 18, 2018, outlining a ten-year mine life, 30% growth in production through 2021, and robust economics. |
| ◾ | Declared commercial production at Chinchillas: The mine achieved commercial production on December 1, 2018, marking a major milestone as we reached sustainable ore delivery from the Chinchillas mine to the Pirquitas plant. In December 2018, the Pirquitas mill operated at 3,605 tpd, processing exclusively Chinchillas ore. |
| ◾ | Investment in high-grade Las Chispas project: In the fourth quarter we purchased 9.7% of the issued and outstanding common shares of SilverCrest Metals Inc. for $23 million. SilverCrest’s Las Chispas project represents exposure to an exciting high-grade development project with exploration upside in a favourable mining jurisdiction and compelling near-term development catalysts. |
| ◾ | Balance sheet remains strong: Cash and marketable securities totaled $449 million at year-end 2018 after project development and investments for 2019 growth and beyond. |
| SSR Mining Inc.
|
MD&A Year-End 2018 | 3
| |
| 2. | OUTLOOK |
This section of the MD&A provides management’s production, cost, capital, exploration and development expenditure estimates for 2019. These are “forward-looking statements” and subject to the cautionary note regarding the risks associated with forward-looking statements contained in Section 13. Cash costs per payable ounce of gold and silver sold are non-GAAP financial measures. Please see the discussion under “Non-GAAP Financial Measures” in Section 10.
For the full year 2019, we expect:
| Puna Operations (75% | ||||||||||||||
| Operating Guidance | Marigold mine | Seabee Gold Operation | interest) (4) | |||||||||||
| Gold Production |
oz | 200,000 - 220,000 | 95,000 - 110,000 | — | ||||||||||
| Silver Production |
6.0 -7.0 | |||||||||||||
| (Attributable) |
Moz | — | — | (4.5 - 5.3) | ||||||||||
| Lead Production |
Mlb | 20.0 - 26.0 | ||||||||||||
| (Attributable) |
— | — | (15.0 -19.5) | |||||||||||
| Zinc Production |
Mlb | 15.0 - 20.0 | ||||||||||||
| (Attributable) |
— | — | (11.3 -15.0) | |||||||||||
| Cash Costs per Payable Ounce Sold (1) |
$/oz | 750 - 790 | 525 - 555 | 8.00 - 10.00 | ||||||||||
| Sustaining Capital Expenditures (2) |
$M | 35 | 25 | 12 | ||||||||||
| Capitalized Stripping / Capitalized Development |
$M | 20 | 12 | 20 | ||||||||||
| Exploration Expenditures (3) |
$M | 7.5 | 6 | 1 | ||||||||||
| (1) | We report the non-GAAP financial measure of cash costs per payable ounce of gold and silver sold to manage and evaluate operating performance at the Marigold mine, the Seabee Gold Operation and Puna Operations. See “Non-GAAP Financial Measures” in Section 10. |
| (2) | Sustaining capital expenditures for Puna Operations exclude initial capital expenditures related to the development of the Chinchillas project. |
| (3) | Includes capitalized and expensed exploration expenditures. |
| (4) | Shown on a 100% basis unless otherwise indicated by “attributable” which is shown on a 75% basis. |
Based on the mid-points of guidance, on a consolidated basis we expect to produce 395,000 gold equivalent ounces in 2019 at gold equivalent cash costs of $700 per ounce. On an attributable basis we expect to produce 375,000 gold equivalent ounces in 2019 at gold equivalent cash costs of $700 per ounce based on the mid-points of guidance.
At the Marigold mine, gold production is expected to increase in 2019 with the full-year benefits from the four haul trucks added to the fleet in mid-2018 and production from the new leach pad beginning in the first quarter of 2019. Due to the ongoing positive operating performance and optimization of pit designs, cash costs guidance of between $750 and $ 790 per payable gold ounce sold is an improvement to the forecast from the 2018 Technical Report. Capital investments are expected to total $35 million in 2019, including $22 million in the mine for maintenance and purchase of mobile fleet as well as $10 million for accelerated leach pad construction and process infrastructure. To accommodate the higher ore tonnes mined and to provide additional operating flexibility regarding leach cycles, construction of a leach pad is expected to be accelerated to the second half of 2019 from 2020. Capitalized stripping is expected to total $20 million with the majority incurred through the first three quarters of the year. Exploration expenditures totaling $7.5 million re-focuses to Mackay, Valmy and Basalt with the goals of adding Mineral Reserves and defining additional Mineral Resources within these areas. Having completed the Red Dot exploration program in 2018, we intend to complete geotechnical drilling and engineering of the remaining Red Dot Mineral Resources with the objective of evaluating the potential for additional Red Dot Mineral Reserves by mid-2019.
At the Seabee Gold Operation we expect to continue executing our plan of increasing mining and milling rates and to deliver another record gold production year in 2019. The plan includes investment of $7 million in underground mining equipment to increase capacity and reliability. With higher tonnes mined and demonstrated milling infrastructure capacity, cash costs are expected to remain low at between $525 and $555 per payable gold ounce sold. Due to continued exploration success at Seabee, we are embarking on an expansion to tailings capacity in excess of that contemplated in the 2017 Technical Report. The first phase is expected to be completed in 2019 at an investment of $15 million, with the remaining sustaining capital investments related to the mill and surface infrastructure. Capitalized development expenditures of $12 million support higher mining rates and reflect the development strategy for the Santoy complex. Exploration expenditures at Seabee total $6 million to continue underground exploration at depth, expansion of Santoy Gap hanging wall (“HW”) and continued testing of surface targets.
| SSR Mining Inc.
|
MD&A Year-End 2018 | 4
| |
At Puna Operations, with commercial production of the Chinchillas open pit achieved, 2019 marks the first anticipated full year of ore production from the Chinchillas mine transported for processing at the Pirquitas mill. Puna is expected to produce between 6.0 and 7.0 million ounces of silver at cash costs of between $8.00 and $10.00 per payable silver ounce sold. Reported cash costs may vary quarter to quarter due to the by-product credits arising from the production of lead and zinc as such credits vary based on the timing of sales of each concentrate. Capital investments at Puna of $12 million include $5 million for mine equipment maintenance, and $5 million for plant equipment maintenance. Capitalized stripping is elevated through 2019 as the mine completes the highwall pushback and commences stripping the next phase of the Chinchillas pit. As Chinchillas operations ramp-up through 2019, only waste material will be mined over certain periods of the year with ore stockpiled during the pre-production phase transported to and processed at the Pirquitas mill.
With Puna focused on optimization of the mine, transport and mill operations through 2019, limited exploration expenditures of $1 million are planned in the second half of the year.
As previously announced, the completion of certain Chinchillas project infrastructure carries over into 2019, with the remaining investment of approximately $9 million expected to be incurred in the first quarter. The project remains on budget.
In addition to exploration at our three operating mines, we expect to invest $3 million in exploration on the Fisher project adjacent to our Seabee Gold Operation. Community, development and holding costs related to non-operating properties total approximately $5 million.
Gold equivalent figures for our 2019 operating guidance are based on gold-to-silver ratio of 81:1. Cash costs and capital expenditures guidance is based on an oil price of $65 per barrel and exchange rate of 1.25 Canadian dollar to U.S. dollar.
| 3. | BUSINESS OVERVIEW |
| Strategy | |
We are a Canadian-based resource company focused on the operation, acquisition, exploration and development of precious metal resource properties located in the Americas. We have three producing mines and a portfolio of precious metal dominant projects located throughout the Americas. Our focus is on safe, profitable gold and silver production from our Marigold mine in Nevada, U.S., our Seabee Gold Operation in Saskatchewan, Canada, and our 75%-owned Puna Operations in Jujuy, Argentina.
Corporate summary
SSR Mining has an experienced management team of mine-builders and operators with proven capabilities. We have a strong balance sheet with $419.2 million in cash and cash equivalents as at December 31, 2018. We are committed to delivering safe production through relentless emphasis on Operational Excellence. We are also focused on growing production and Mineral Reserves through the exploration and acquisition of assets for accretive growth, while maintaining financial strength.
On January 1, 2018, we appointed Ms. Elizabeth A. Wademan and Mr. Simon A. Fish, to our Board of Directors with the objective to strengthen the Board’s expertise in the areas of international capital markets and legal and corporate governance.
On May 3, 2018, we announced the appointment of Kevin O’Kane as Chief Operating Officer effective June 4, 2018, replacing Alan Pangbourne who retired at the end of May 2018.
On June 18, 2018, we released an updated life of mine plan for the Marigold mine in Nevada, U.S., which outlined an anticipated mine-life of over ten-years based on Mineral Reserves and an after-tax net present value of $552 million. We filed a technical report titled “NI 43-101 Technical Report on the Marigold Mine, Humboldt County, Nevada USA” dated July 31, 2018 (the “Marigold Technical Report”) in support of the updated life of mine plan, which is available on SEDAR at www.sedar.com, the EDGAR section of the SEC website at www.sec.gov and on our website.
| SSR Mining Inc.
|
MD&A Year-End 2018 | 5
| |
As of June 30, 2018, we sold our remaining position of 9.0 million Pretium Resources Inc. (“Pretium”) common shares for pre-tax cash proceeds of approximately $63.4 million and no longer hold any Pretium shares.
On December 1, 2018, we declared commercial production at Puna Operations’ Chinchillas mine. Development of the mine, located approximately 45 kilometers from the Pirquitas plant, commenced in early 2018 and extends the life of the Pirquitas plant through mining of ore at Chinchillas, transporting the ore to Pirquitas and processing it through the existing Pirquitas plant.
On December 10, 2018, we completed a transaction with SilverCrest Metals Inc. (“SilverCrest”), which owns the Las Chispas project, a high-grade development project in Mexico, to purchase, by way of private placement, a 9.7% ownership interest representing, 8,220,645 common shares of SilverCrest at a price of C$3.73 per common share for total consideration of C$30.7 million.
In 2018, we achieved our initial guidance for the seventh consecutive year by delivering gold equivalent production of over 345,000 ounces at cash costs of $736 and AISC of $1,087 per payable gold equivalent ounce sold.
Successful exploration activities in 2018 increased gold Mineral Reserves at the Marigold mine by 110,000 ounces to 3.3 million ounces and at the Seabee Gold Operation by 39% to 608,000 ounces, as further discussed in Section 5.
Market overview
Metal prices
The market price of gold, as mined at our Marigold mine and Seabee Gold Operation and silver, lead and zinc, as mined at our Puna Operations are key drivers to our profitability. The gold price spent the first quarter trading between $1,360 per ounce and $ 1,310 per ounce before sliding to a low of $1,160 per ounce in mid-August. Subsequently, the price recovered to close out the year at $1,283 per ounce. The PM fix average of $1,268 per ounce in 2018 was slightly higher than the 2017 average of $1,257 per ounce. Silver’s price trading pattern mirrored that of gold with the first five months of 2018 trading within a $17.65 to $16.00 per ounce range. From June through August, the price fell from $17.30 per ounce to $13.90 per ounce before bouncing off the low and moving up to close the year at $15.50 per ounce. The 2018 average silver fix of $15.71 per ounce was considerably lower than the 2017 average of $17.05 per ounce. Both gold and silver prices have continued to climb in early 2019 to levels above $1,300 per ounce, and $15.50 per ounce, respectively.
The lead and zinc markets started 2018 with stronger prices than when the year ended. Lead opened the year at $2,500 per tonne and declined to $2,311 per tonne in mid-March. Following a brief rally, the price fell as low as $1,927 per tonne in mid-August and then traded sideways for the balance of the year, closing at $ 2,021 per tonne. The zinc price followed a similar pattern as lead; zinc opened at $ 3,316 per tonne and reached $3,595 per tonne in mid-February before trending lower to $ 3,150 per tonne in mid-June. Following a descent to $2,300 per tonne in mid-September, the price rallied marginally to close 2018 at $2,467 per tonne. Lead and zinc’s average price for 2018 of $2,241 and $ 2,879 per tonne, respectively, were similar to the 2017 averages of $ 2,327 and $2,894 per tonne respectively. The prices of lead and zinc had minimal impact on our 2018 financial results but will have a more significant impact in 2019 with the Chinchillas project reaching commercial production.
Currency and commodity markets
The Canadian dollar (“CAD”) opened 2018 at $1.25 per U.S. dollar and moved to its strongest point in February at $1.23. From there, the trend was generally weaker with the currency trading to $1.28 in late September until oil prices started to decline. With the Canadian economy and dollar strongly correlated to commodities, CAD fell to $1.37 at year’s end. A stabilized oil price early in January 2019 has helped push CAD to $1.32. The stronger to weaker price action in 2018 was the opposite of 2017. The CAD averaged $1.30 in both 2018 and 2017. Our exposure to the Canadian dollar is significant due to our Canadian Seabee Gold Operation and we have continued our risk management hedging program to protect a portion of our Canadian dollar operating costs through 2020.
The Argentine peso (“ARS”) depreciated from ARS 18.60 per U.S. dollar at the start of 2018 to ARS 41.47 in late September before closing at ARS 37.62 against the U.S. dollar. The average price ARS in 2018 was $ 28.08 compared to $16.55 in 2017. While a weaker currency is positive for Puna Operations operating costs, we expect the high inflation rates in Argentina to somewhat offset the benefits
| SSR Mining Inc.
|
MD&A Year-End 2018 | 6
| |
of the devaluation of the currency. Economic difficulties along with reforms introduced by the Macri federal government helped to push the ARS significantly weaker over the course of the year.
West Texas Intermediate (WTI) oil prices were steady throughout most of 2018 until the start of the fourth quarter. The WTI price opened 2018 at $60.20 per barrel and ascended to a year high of $76.90 per barrel in early October. In the span of less than three months, the price fell to $42.36 per barrel before recovering to $45.41 per barrel to finish the year. The average WTI oil price in 2018 was $64.90 per barrel compared to $50.85 per barrel in 2017. Diesel, a product of oil, consumed at both the Seabee Gold Operation and at the Marigold mine plays an important factor in each operations’ cost structure. To mitigate against adverse price movements, a portion of the diesel usage is hedged through to 2020.
Factors impacting commodity and currency markets
Numerous diverse factors, both positive and negative, impacted commodity prices in 2018. The most significant factor was the 5% appreciation year-over-year in the US dollar. The dollar strengthened as the U.S. Federal Reserve raised its U.S. dollar target interest rate four times from 1.50% to 2.50% and the Trump federal government added fiscal stimulus through tax cuts. A global move towards trade protectionism and tariffs such as U.S. imposed steel and aluminum tariffs had a negative impact on the global economy and dampened the gross domestic product of countries around the world. Political instability seen in Great Britain (Brexit), Latin America (Brazil and Venezuela) and the Middle East (Saudi Arabia, Iran and Iraq) continue to dominate the headlines and impact commodity prices.
Consolidated financial summary
(presented in thousands of U.D. dollar, except for per share value)
| Selected Financial Data (1) | Three Months | Year | ||||||||||||||
| Ended December 31 | Ended December 31 | |||||||||||||||
| 2018 | 2017 | 2018 | 2017 | |||||||||||||
| $ | $ | $ | $ | |||||||||||||
| Revenue |
103,712 | 107,881 | 420,675 | 448,773 | ||||||||||||
| Income from mine operations (1) |
16,536 | 21,190 | 76,845 | 113,263 | ||||||||||||
| Gross margin (%) |
16 | 20 | 18 | 25 | ||||||||||||
| Operating income (1) |
3,061 | 19,937 | 29,895 | 101,332 | ||||||||||||
| Net (loss) income |
(2,544 | ) | 16,850 | (31 | ) | 71,466 | ||||||||||
| Basic attributable (loss) income per share |
(0.03 | ) | 0.14 | 0.05 | 0.58 | |||||||||||
| Adjusted attributable income before tax (1) |
(345 | ) | 3,542 | 28,586 | 46,281 | |||||||||||
| Adjusted attributable net income (1) |
4,369 | 2,862 | 27,961 | 40,074 | ||||||||||||
| Adjusted basic attributable income per share (1) |
0.04 | 0.02 | 0.23 | 0.34 | ||||||||||||
| Cash (used in) generated by operating activities |
(3,744 | ) | 45,175 | 59,769 | 144,725 | |||||||||||
| Cash used in investing activities |
(63,028 | ) | (9,633 | ) | (115,930 | ) | (15,494 | ) | ||||||||
| Cash generated by financing activities |
11,903 | 1,942 | 20,516 | 4,601 | ||||||||||||
| Financial Position | December 31, 2018 | December 31, 2017 | ||||||||||||||
| Cash and cash equivalents |
419,212 | 459,864 | ||||||||||||||
| Marketable securities |
29,542 | 114,001 | ||||||||||||||
| Current assets |
733,119 | 799,597 | ||||||||||||||
| Current liabilities |
83,254 | 71,466 | ||||||||||||||
| Working capital (1) |
649,865 | 728,131 | ||||||||||||||
| Total assets |
1,521,138 | 1,537,454 | ||||||||||||||
| (1) | We report non-GAAP financial measures including income from mine operations, operating income, adjusted attributable income before tax, adjusted attributable net income, adjusted basic attributable income per share, to manage and evaluate our operating performance. See “Non-GAAP Financial Measures” in Section 10. |
| SSR Mining Inc.
|
MD&A Year-End 2018 | 7
| |
(i) Quarterly financial summary
Revenue in the fourth quarter of 2018 decreased by 4% relative to the comparative quarter in 2017, due principally to lower gold and silver prices. Gold production was similar to the comparative quarter but gold sales were approximately 3,000 ounces lower due to timing of shipments. Silver production was also similar to the comparative quarter as commercial production was reached at the Chinchillas mine on December 1, 2018 providing a strong finish to the quarter as the Pirquitas plant transitioned to solely Chinchillas ore. Silver sales increased marginally relative to the comparative quarter but the increase did not offset the factors discussed above. Sales of lead and zinc commenced in the quarter with the resumption of base metal production from Pirquitas and Chinchillas ores, but sales were well below production due to timeframes required to ramp up international concentrate sales.
Income from mine operations in the fourth quarter of 2018 generated a gross margin of 16%, lower than the 20% gross margin generated in the fourth quarter of 2017, mainly due to lower realized metal prices impacting margins at the Marigold mine and Puna Operations. Relative to the comparative prior year quarter, the Seabee Gold Operation generated higher income from mine operations as lower cost and depreciation more than offset lower realized prices.
In the fourth quarter of 2018, we incurred a net loss of $2.5 million, compared to net income of $ 16.9 million in the fourth quarter of 2017. In addition to the lower metal prices and finished goods inventory build of gold and concentrates discussed above, we recognized a share-based compensation and payroll expense of $8.3 million principally resulting from stronger relative and absolute share price performance over the quarter. We also recognized an expense of $2.8 million related to the premium paid over the prevailing market price for purchase of the shares of SilverCrest. The subsequent increase in value of SilverCrest shares of $ 4.3 million was recognized in other comprehensive income. During the quarter, a foreign exchange loss was recognized as the Argentine peso stabilized and strengthened relative to the end of the third quarter. Net income in the fourth quarter of 2017 benefited from a tax recovery of $5 million.
Cash used in operating activities was $3.7 million in the fourth quarter of 2018 compared to $45.2 million generated in the fourth quarter of 2017. Lower metal prices combined with lower gold sales at higher unit costs more than offset higher silver sales at lower unit costs at Puna Operations. Operating activities were impacted by a $22.3 million increase in non-cash working capital due to a combination of increased gold and concentrate finished goods inventories, inventory in circuit at Seabee Gold Operation, Chinchillas ore stockpiles at Puna Operations and a reduction in trade payables at year-end, particularly related to the Chinchillas project. We used $63.0 million in investing activities in the fourth quarter of 2018. We invested $23.1 million in the SilverCrest share purchase, $10.6 million in property, plant and equipment, and $18.9 million in the Chinchillas project and loaned $8 million to our joint venture partner. This compared to $9.6 million of cash used for investing activities in the fourth quarter of 2017 as the quarter benefited from $63.4 million of Pretium share sale proceeds. We received $8.8 million from our joint venture partner for its share of the development costs of the Chinchillas project.
(ii) Annual financial summary
The 6% decrease in revenue for the year of 2018 compared to the year of 2017 was due to an 8% decrease in equivalent payable gold ounces sold somewhat offset by a higher average realized gold price. The decrease was more than offset by lower silver ounces sold from Puna Operations, as lower grade ore stockpiles were processed through the development of the Chinchillas project.
Income from mine operations in 2018 generated a gross margin of 18%, lower than the 25% in 2017. Higher sales of gold at lower cost of sales at the Seabee Gold Operation was more than offset by lower sales of silver at Puna Operations and higher cost of sales at the Marigold mine. In the year ended December 31, 2017, the release of a supplies inventory provision at Puna Operations and the resolution of our export duty claim in Argentina resulted in a $10.5 million reduction to cost of sales, increasing the 2017 reported gross margin.
Our strong relative and absolute share price performance resulted in a $9.1 million higher share-based payment expense in 2018 relative to 2017 being recognized through general and administrative expense. We incurred a $2.8 million expense related to the premium paid over the prevailing market price on recording the investment in SilverCrest shares. The subsequent increase in value of SilverCrest shares of $4.3 million was recognized in other comprehensive income. We reported an elevated effective tax rate due to a $4.7 million tax expense related to the Argentine re-organization recorded in the second quarter of 2018. As a result, a small net loss was reported in 2018. Net income for 2017 benefitted by an impairment reversal of the Pirquitas plant of $24.4 million resulting from its life extension following the formation of Puna Operations.
| SSR Mining Inc.
|
MD&A Year-End 2018 | 8
| |
Cash generated from operating activities was $59.8 million in 2018, compared to $144.7 million in 2017. Higher sales and lower unit costs at the Seabee Gold Operation were more than offset by lower sales combined with higher unit costs both at Puna Operations and the Marigold mine. Non-cash working capital of $36 million was incurred as finished goods and ore inventories were built across all operations and particularly related to the development and ramp up at Chinchillas. We used $115.9 million in investing activities in the year ended December 31, 2018, compared to $15.5 million used in the comparative period of 2017. In 2018, we received $63.4 million from the sales of our remaining common shares of Pretium while investments in our business included $67.7 million in property, plant and equipment, $60.2 million in the Chinchillas project, $23.1 million in SilverCrest share purchase and loaned $8.0 million to our joint venture partner. We received $15.2 million from our joint venture partner for its share of the development and operating costs of the Chinchillas project.
| SSR Mining Inc.
|
MD&A Year-End 2018 | 9
| |
| 4. | RESULTS OF OPERATIONS |
Consolidated results of operations
The following table presents consolidated operating information for our Marigold mine, our Seabee Gold Operation and our 75% interest in Puna Operations, which comprises the Pirquitas and the Chinchillas properties. Additional operating information is provided in the sections relating to the individual mines.
| Three months ended | Total | |||||||||||||||||||||||||||
| December 31, | September | June 30, | March 31, | December | ||||||||||||||||||||||||
| Operating data | 2018 | 30, 2018 | 2018 | 2018 | 31, 2017 | 2018 | 2017 | |||||||||||||||||||||
| Consolidated production and sales: |
||||||||||||||||||||||||||||
| Gold produced (oz) |
74,779 | 86,290 | 73,018 | 66,676 | 76,995 | 300,763 | 286,238 | |||||||||||||||||||||
| Silver produced (‘000 oz) |
1,189 | 666 | 954 | 938 | 1,169 | 3,747 | 6,177 | |||||||||||||||||||||
| Silver produced (attributable) (‘000 oz) (1) |
892 | 500 | 716 | 704 | 877 | 2,812 | 5,330 | |||||||||||||||||||||
| Zinc produced (‘000 lb) (2) |
4,014 | 3,241 | 1,520 | — | — | 8,775 | — | |||||||||||||||||||||
| Lead produced (‘000 lb) (3) |
2,735 | 372 | — | — | — | 3,107 | — | |||||||||||||||||||||
| Gold sold (oz) |
72,261 | 88,787 | 67,156 | 62,090 | 75,389 | 290,294 | 286,279 | |||||||||||||||||||||
| Silver sold (‘000 oz) |
932 | 623 | 1,142 | 1,064 | 820 | 3,761 | 5,994 | |||||||||||||||||||||
| Silver sold (attributable) (‘000 oz) (1) |
699 | 467 | 857 | 798 | 615 | 2,821 | 5,088 | |||||||||||||||||||||
| Zinc sold (‘000 lb) (2) |
1,983 | 382 | — | — | — | 2,365 | — | |||||||||||||||||||||
| Lead sold (‘000 lb) (3) |
1,059 | — | — | — | — | 1,059 | — | |||||||||||||||||||||
| Cash costs ($/oz) - payable gold from Marigold mine (4) |
760 | 711 | 700 | 720 | 699 | 723 | 647 | |||||||||||||||||||||
| Cash costs ($/oz) - payable gold from Seabee Gold Operation (4) |
502 | 447 | 616 | 481 | 605 | 505 | 602 | |||||||||||||||||||||
| Cash costs ($/oz) - payable silver from Puna Operations (4) |
15.02 | 17.41 | 14.73 | 17.07 | 16.36 | 15.91 | 13.07 | |||||||||||||||||||||
| Gold equivalent production (oz) (5) |
88,718 | 94,808 | 85,082 | 78,482 | 92,594 | 347,090 | 393,325 | |||||||||||||||||||||
| Gold equivalent production (attributable) (oz) (1,5) |
85,236 | 92,685 | 82,072 | 75,537 | 88,698 | 336,208 | 358,862 | |||||||||||||||||||||
| Realized gold price ($/oz) (4) |
1,230 | 1,208 | 1,304 | 1,334 | 1,271 | 1,263 | 1,255 | |||||||||||||||||||||
| Realized silver price ($/oz) (4) |
14.42 | 15.45 | 16.49 | 16.79 | 16.96 | 15.92 | 17.10 | |||||||||||||||||||||
| Consolidated costs: |
||||||||||||||||||||||||||||
| Cash Costs per equivalent gold ounce sold ($/oz) (4,5) |
757 | 682 | 758 | 766 | 737 | 736 | 703 | |||||||||||||||||||||
| AISC per equivalent gold ounce sold ($/oz) (4,5) |
1,168 | 978 | 1,121 | 1,115 | 1,008 | 1,088 | 972 | |||||||||||||||||||||
| Financial data ($000s) | ||||||||||||||||||||||||||||
| Revenue |
103,712 | 115,033 | 104,028 | 97,902 | 107,881 | 420,675 | 448,773 | |||||||||||||||||||||
| Income from mine operations |
16,536 | 21,875 | 21,203 | 17,231 | 21,190 | 76,845 | 113,263 | |||||||||||||||||||||
| (1) | Figures are on a 75% basis for attributable production and sales at Puna Operations. |
| (2) | Data for zinc production and sales relate only to zinc in zinc concentrate. |
| (3) | Data for lead production and sales relate only to lead in lead concentrate. |
| (4) | We report the non-GAAP financial measures of realized metal price, cash costs, and all-in sustaining costs (“AISC”) per payable ounce of precious metals sold to manage and evaluate operating performance at our mines. For a better understanding and a reconciliation of these measures to cost of sales, as shown in our Consolidated Statements of Comprehensive (Loss) Income, please refer to “Non-GAAP Financial Measures” in Section 10. |
| (5) | Gold equivalent ounces have been established using the realized metal prices per payable ounce of precious metals sold in the period and applied to the recovered silver metal content produced by the mines. Zinc and lead production are not included in gold equivalent ounces produced. |
| SSR Mining Inc.
|
MD&A Year-End 2018 | 10
| |
Marigold Mine, U.S.
| Three months ended | ||||||||||||||||||||||||
| Total | ||||||||||||||||||||||||
| December 31, | September 30, | |||||||||||||||||||||||
| Operating data | 2018 | 2018 | June 30, 2018 | March 31, 2018 | 2018 | 2017 | ||||||||||||||||||
| Total material mined (kt) |
17,039 | 21,284 | 15,958 | 16,150 | 70,431 | 69,011 | ||||||||||||||||||
| Waste removed (kt) |
11,361 | 14,411 | 8,083 | 9,052 | 42,907 | 43,422 | ||||||||||||||||||
| Total ore stacked (kt) |
5,679 | 6,873 | 7,875 | 7,099 | 27,526 | 25,589 | ||||||||||||||||||
| Strip ratio |
2.0 | 2.1 | 1.0 | 1.3 | 1.6 | 1.7 | ||||||||||||||||||
| Mining cost ($/t mined) |
1.86 | 1.51 | 1.92 | 1.80 | 1.76 | 1.68 | ||||||||||||||||||
| Gold stacked grade (g/t) |
0.34 | 0.32 | 0.42 | 0.37 | 0.37 | 0.35 | ||||||||||||||||||
| Processing cost ($/t processed) |
1.27 | 1.12 | 0.86 | 0.93 | 1.03 | 0.92 | ||||||||||||||||||
| Gold recovery (%) |
72.9 | 72.3 | 74.4 | 73.6 | 73.5 | 73.0 | ||||||||||||||||||
| General and admin costs ($/t processed) |
0.51 | 0.50 | 0.41 | 0.42 | 0.45 | 0.46 | ||||||||||||||||||
| Gold produced (oz) |
54,306 | 58,459 | 49,436 | 42,960 | 205,161 | 202,240 | ||||||||||||||||||
| Gold sold (oz) |
50,550 | 59,612 | 46,644 | 42,078 | 198,884 | 200,192 | ||||||||||||||||||
| Realized gold price ($/oz) (1) |
1,227 | 1,207 | 1,304 | 1,331 | 1,261 | 1,254 | ||||||||||||||||||
| Cash costs ($/oz) (1) |
760 | 711 | 700 | 720 | 723 | 647 | ||||||||||||||||||
| AISC ($/oz) (1) |
995 | 965 | 981 | 954 | 974 | 896 | ||||||||||||||||||
| Financial data ($000s) | ||||||||||||||||||||||||
| Revenue |
61,861 | 71,848 | 60,752 | 55,880 | 250,341 | 250,825 | ||||||||||||||||||
| Income from mine operations |
9,977 | 13,254 | 14,670 | 12,312 | 50,213 | 66,666 | ||||||||||||||||||
| Capital expenditures (2) |
8,328 | 25,461 | 14,481 | 4,665 | 52,935 | 20,364 | ||||||||||||||||||
| Capitalized stripping |
1,208 | 2,529 | 850 | 2,902 | 7,489 | 22,863 | ||||||||||||||||||
| Exploration expenditures (3) |
2,096 | 2,956 | 3,243 | 1,914 | 10,209 | 4,900 | ||||||||||||||||||
| (1) | We report the non-GAAP financial measures of realized gold price, cash costs and AISC per payable ounce of gold sold to manage and evaluate operating performance at the Marigold mine. For a better understanding and a reconciliation of these measures to cost of sales, as shown in our Consolidated Statements of (Loss) Income, please refer to “Non-GAAP Financial Measures” in Section 10. |
| (2) | Includes expansion capital expenditure of $22 million for the twelve months ended December 31, 2018. |
| (3) | Includes capitalized and expensed exploration expenditures. |
Mine production
In 2018, the Marigold mine produced 205,161 ounces of gold, surpassing the upper end of our revised production guidance. This compares to 202,240 ounces of gold produced in 2017. For the full-year, gold sales were 198,884 ounces due to bullion inventory increasing in the fourth quarter relative to the previous quarter, which we expect to sell in the first quarter of 2019.
Material mined during the year totaled 70.4 million tonnes, a 2% increase as compared to 2017. The mine achieved record annual ore tonnes delivered to the leach pads with over 27.5 million tonnes stacked.
During the fourth quarter of 2018, 17.0 million tonnes of material were mined, down 20% from the third quarter due to scheduled maintenance on the electric rope shovel and longer haul cycles. Construction delays deferred the new leach pad commissioning to the first quarter of 2019 and solution application commenced in January 2019.
Approximately 5.7 million tonnes of ore were delivered to the heap leach pads at a gold grade of 0.34 g/t during the fourth quarter. This compares to 6.9 million tonnes of ore delivered to the heap leach pads at a gold grade of 0.32 g/t in the third quarter. Gold grade mined in the fourth quarter was 6% higher than the third quarter due to mining deeper in the current phase of the Mackay pit. The strip ratio declined to 2.0:1 in the quarter, a 5% reduction compared to the previous quarter.
In the fourth quarter of 2018, the Marigold mine produced 54,306 ounces of gold, representing a 7% reduction as compared to the previous quarter.
| SSR Mining Inc.
|
MD&A Year-End 2018 | 11
| |
Mine operating costs
Cash costs and AISC per payable ounce of gold sold are non-GAAP financial measures. Please see the discussion under “Non-GAAP Financial Measures” in Section 10.
Cash costs, which include all costs of inventory, refining costs and royalties, of $760 per payable ounce of gold sold in the fourth quarter of 2018 were 7% higher than the previous quarter primarily due to planned lower grades mined in the second half of the year. Total mining costs of $1.86 per tonne in the fourth quarter of 2018 were 23% higher than in the previous quarter due to fewer tonnes mined. Processing and general and administrative unit costs were higher in the fourth quarter of 2018 than in the third quarter of 2018 due to lower tonnes mined and processed. Processing and general and administrative costs in the current quarter were comparable on an absolute basis to the preceding quarter while mining costs declined. Cash costs per payable ounce of gold sold in 2018 were $723, higher than the $ 647 per payable ounce of gold sold in 2017, mainly due to higher leach pad opening inventory unit costs in 2018 relative to 2017.
AISC in the fourth quarter of 2018 was $995 per payable ounce of gold sold compared to $ 965 in the third quarter due to increased capital spending mostly related to mobile equipment and construction of a new leach pad. AISC of $974 per payable ounce of gold sold in 2018 increased from $896 in 2017, primarily due to higher capital investments and exploration partially offset by lower capitalized stripping.
Mine sales
A total of 50,550 ounces of gold were sold at an average realized price of $1,227 per ounce during the fourth quarter of 2018, a decrease of 15% from the 59,612 ounces of gold sold at an average realized price of $1,207 per ounce during the third quarter of 2018. In 2018, gold sales decreased marginally and totaled 198,884 ounces, compared to 200,192 ounces in 2017.
Exploration
Exploration at Marigold in 2018 successfully replaced mine depletion with growth in Mineral Reserves compared to the end of 2017. Mineral Reserves increased to 3.30 million gold ounces (201.5 million tonnes at an average gold grade of 0.47 g/t), while Measured and Indicated Mineral Resources (inclusive of Mineral Reserves) totaled 5.56 million gold ounces (354.5 million tonnes at an average gold grade of 0.47 g/t).
Drilling activities during the fourth quarter of 2018 targeted infill drilling and upgrade of Mineral Resources at Red Dot and growth at various phases of the Mackay Pit, with work also targeting resource addition. This is consistent with our longer-term objective of completing the necessary infill and geotechnical drilling to complete pit designs and an economic evaluation over the entire Red Dot area by mid-year 2019. During the quarter, we completed 21,260 meters of drilling in 60 reverse circulation (“RC”) holes at the Mackay pit and within the Red Dot area. RC drilling for the year totaled 93,276 meters in 259 RC holes.
Following our exploration news release of November 6, 2018, we have received results from an additional 33 RC drill holes that targeted Mineral Resource portions of the Red Dot deposit and its northern extensions. This contributed, in part, to success in achieving our objective of converting Mineral Resources to Mineral Reserves.
For 2019, we are planning 60,000 meters of drilling as our exploration focus returns to resource growth on the prospective Valmy, East Basalt, and North and South Red Dot areas.
| SSR Mining Inc.
|
MD&A Year-End 2018 | 12
| |
Seabee Gold Operation, Canada
| Three months ended | Total | |||||||||||||||||||||||
| Operating data | December 31, | September 30, | June 30, | March 31, | ||||||||||||||||||||
| 2018 | 2018 | 2018 | 2018 | 2018 | 2017 | |||||||||||||||||||
| Total ore milled (t) |
86,447 | 88,273 | 84,010 | 93,269 | 351,999 | 330,415 | ||||||||||||||||||
| Ore milled per day (t/day) |
940 | 959 | 923 | 1,036 | 964 | 905 | ||||||||||||||||||
| Gold mill feed grade (g/t) |
10.20 | 9.52 | 7.95 | 8.95 | 9.16 | 8.25 | ||||||||||||||||||
| Mining cost ($/t mined) |
57 | 48 | 60 | 59 | 56 | 68 | ||||||||||||||||||
| Processing cost ($/t processed) |
26 | 26 | 27 | 21 | 25 | 23 | ||||||||||||||||||
| Gold recovery (%) |
97.6 | 97.1 | 97.3 | 97.4 | 97.4 | 97.4 | ||||||||||||||||||
| General and admin cost ($/t processed) |
63 | 47 | 62 | 53 | 56 | 54 | ||||||||||||||||||
| Gold produced (oz) |
20,473 | 27,831 | 23,582 | 23,716 | 95,602 | 83,998 | ||||||||||||||||||
| Gold sold (oz) (1) |
21,711 | 29,175 | 20,512 | 20,012 | 91,410 | 86,087 | ||||||||||||||||||
| Realized gold price ($/oz) (2) |
1,236 | 1,210 | 1,306 | 1,340 | 1,267 | 1,259 | ||||||||||||||||||
| Cash costs ($/oz) (2) |
502 | 447 | 616 | 481 | 505 | 602 | ||||||||||||||||||
| AISC ($/oz) (2) |
743 | 596 | 854 | 896 | 755 | 843 | ||||||||||||||||||
| Financial data ($000s) | ||||||||||||||||||||||||
| Revenue |
26,890 | 35,270 | 26,706 | 26,789 | 115,655 | 108,334 | ||||||||||||||||||
| Income from mine operations |
7,347 | 11,061 | 5,703 | 6,672 | 30,783 | 15,644 | ||||||||||||||||||
| Capital expenditures |
625 | 968 | 1,035 | 4,426 | 7,054 | 7,190 | ||||||||||||||||||
| Capitalized development |
2,910 | 1,812 | 2,069 | 2,283 | 9,074 | 8,294 | ||||||||||||||||||
| Exploration expenditures (3) |
1,661 | 2,860 | 2,745 | 2,032 | 9,298 | 5,959 | ||||||||||||||||||
| (1) | Beginning with the first quarter of 2018, the holder of the 3% net smelter return royalty elected to receive its royalty in-kind and we will no longer report these ounces within gold sold. |
| (2) | We report the non-GAAP financial measures of realized gold price, cash costs and AISC per payable ounce of gold sold to manage and evaluate operating performance at the Seabee Gold Operation. For a better understanding and a reconciliation of these measures to cost of sales, as shown in our Consolidated Statements of Comprehensive (Loss) Income, please refer to “Non-GAAP Financial Measures” in Section 10. |
| (3) | Includes capitalized and expensed exploration expenditures. |
Mine production
The Seabee Gold Operation produced 95,602 ounces of gold in 2018, an annual production record resulting from an improved milling rate and higher gold grade.
In 2018, the operation milled 351,999 tonnes of ore, 7% higher than 2017 and another operating record, largely due to our ongoing Operational Excellence initiatives. During the year, average gold mill feed grade was 9.16 g/t, 11% higher compared to the average gold grade milled in 2017. The Santoy mine supplied 93% of ore milled, predominantly from long hole stopes; the remaining ore was sourced from the Seabee mine, which was closed in the second quarter of 2018.
In the fourth quarter of 2018, the operation produced 20,473 ounces of gold, a 26% decrease primarily due to gold ounces contained in-circuit at year-end 2018 due to timing of gold pours.
During the fourth quarter, 86,447 tonnes of ore were milled at an average gold grade of 10.20 g/t and recovery of 97.6%. This compares to 88,273 tonnes of ore milled at an average gold grade of 9.52 g/t and recovery of 97.1% in the third quarter of 2018.
| SSR Mining Inc.
|
MD&A Year-End 2018 | 13
| |
Mine operating costs
Cash costs and AISC per payable ounce of gold sold are non-GAAP financial measures. Please see the discussion under “Non-GAAP Financial Measures” in Section 10.
Cash costs per payable ounce of gold sold, which include all costs of inventory, and refining costs were $502 in the fourth quarter of 2018, higher than the $447 recorded in the third quarter of 2018. Higher cash costs were due to higher unit mining and general and administrative costs and lower production. Costs per tonne mined were $57 in the fourth quarter of 2018, 19% higher than in the previous quarter due to lower tonnes mined. Processing costs per tonne remained comparable to the prior quarter, while general and administrative unit costs increased by 34% in the fourth quarter of 2018 compared to the third quarter of 2018, due to adjustments to payroll accruals between the two quarters and lower tonnes milled. Cash costs per payable ounce of gold sold in 2018 were $505, lower than the $602 per payable ounce sold in 2017 due to lower unit mining costs and higher gold mill feed grade.
AISC per payable ounce of gold sold were $743 in the fourth quarter of 2018, compared to $596 in the third quarter, due to higher cash costs and higher per ounce underground capital development in conjunction with lower ounces sold. In 2018, AISC per payable ounce of gold sold decreased to $755 from $843 in 2017, mainly due to lower cash costs per payable ounce of gold sold.
Mine sales
A total of 21,711 ounces of gold were sold at an average realized price of $1,236 per ounce of gold during the fourth quarter of 2018. This compares to 29,175 ounces of gold sold in the third quarter of 2018 at an average realized price of $1,210 per ounce of gold. Gold sales totaled 91,410 ounces in 2018 compared to 86,087 ounces in 2017. Realized prices were marginally higher in 2018 than in 2017.
Exploration
At the Seabee Gold Operation, our 2018 objectives were to maximize Mineral Resource to Mineral Reserve conversion on the Santoy 8, and Santoy Gap zones. We were successful with those objectives, as 2018 Mineral Reserves increased 39% after depletion to 608,000 gold ounces (Proven Mineral Reserves were 94,500 ounces (0.33 million tonnes at an average gold grade of 9.00 g/t) and Probable Mineral Reserves were 513,500 ounces (1.73 million tonnes at an average gold grade of 9.24 g/t)). Measured and Indicated Mineral Resources (inclusive of Mineral Reserves) at 2018 year-end are 26% higher at 856,000 gold ounces (Measured Mineral Resources were 170,000 ounces (0.45 million tonnes at an average gold grade of 11.7 g/t) and Indicated Mineral Resources were 686,000 ounces (1.85 million tonnes at an average gold grade of 11.56 g/t)). Inferred Mineral Resources for 2018 are 482,000 gold ounces (1.70 million tonnes at an average gold grade of 8.82 g/t), reflecting our focus on conversion activities during the year.
During the fourth quarter of 2018, Seabee Gold Operation completed 15,453 meters of underground drilling for a total of 52,500 meters for the year to infill the Santoy 8A and Santoy Gap deposits. From surface, in the immediate vicinity of the Santoy mine, we completed 6,168 meters of drilling in the fourth quarter for a total of 24,389 meters of drilling for the year exploring at the Santoy Gap targets. Discovery and exploration of the Santoy Gap hanging wall (“HW”) resulted in an initial Inferred Mineral Resource being reported in this mineralized structure sitting adjacent to the Santoy main ore zones. Greenfields drilling during the fourth quarter of 2018 totaled 3,552 meters with activities on the adjacent Fisher property, currently under option from Taiga Gold Corp.
For 2019, we are planning to drill 68,000 meters in the area of the Santoy mine, with another 16,000 meters of drilling on greenfields targets on property owned or optioned by us.
| SSR Mining Inc.
|
MD&A Year-End 2018 | 14
| |
Puna Operations, Argentina (75% interest)
(amounts presented on a 100% basis)
| Three months ended | Total | |||||||||||||||||||||||
| December 31, | September 30, | |||||||||||||||||||||||
| Operating data | 2018 | 2018 | June 30, 2018 | March 31, 2018 | 2018 | 2017 | ||||||||||||||||||
| Total material mined (kt) (1) |
897 | — | — | — | 897 | — | ||||||||||||||||||
| Waste removed (kt) (1) |
696 | — | — | — | 696 | — | ||||||||||||||||||
| Strip ratio (1) |
3.5 | — | — | — | 3.5 | — | ||||||||||||||||||
| Mining cost ($/t mined) (1) |
2.61 | — | — | — | 2.61 | — | ||||||||||||||||||
| Ore milled (kt) |
342 | 308 | 396 | 374 | 1,420 | 1,798 | ||||||||||||||||||
| Silver mill feed grade (g/t) |
133 | 96 | 110 | 115 | 114 | 152 | ||||||||||||||||||
| Zinc mill feed grade (%) |
1.14 | 1.25 | 0.71 | — | 0.84 | — | ||||||||||||||||||
| Lead mill feed grade (%) (1) |
0.92 | — | — | — | 0.92 | — | ||||||||||||||||||
| Processing cost ($/t milled) |
22.18 | 20.87 | 17.26 | 15.34 | 18.72 | 13.00 | ||||||||||||||||||
| Silver recovery (%) |
81.5 | 69.9 | 68.1 | 67.7 | 72.1 | 70.3 | ||||||||||||||||||
| Zinc recovery (%) |
49.5 | 38.1 | 31.5 | — | 39.3 | — | ||||||||||||||||||
| Lead recovery (%) (1) |
83.1 | — | — | — | 83.1 | — | ||||||||||||||||||
| General and admin cost ($/t milled) |
8.16 | 7.98 | 7.07 | 6.33 | 7.34 | 5.19 | ||||||||||||||||||
| Silver produced (‘000 oz) |
1,189 | 666 | 954 | 938 | 3,747 | 6,177 | ||||||||||||||||||
| Silver sold (‘000 oz) |
932 | 623 | 1,142 | 1,064 | 3,761 | 5,994 | ||||||||||||||||||
| Zinc produced (‘000 lb) (2) |
4,014 | 3,241 | 1,520 | — | 8,775 | — | ||||||||||||||||||
| Zinc sold (‘000 lb) (2) |
1,983 | 382 | — | — | 2,365 | — | ||||||||||||||||||
| Lead produced (‘000 lb) (3) |
2,735 | 372 | — | — | 3,107 | — | ||||||||||||||||||
| Lead sold (‘000 lb) (3) |
1,059 | — | — | — | 1,059 | — | ||||||||||||||||||
| Realized silver price ($/oz) (4) |
14.42 | 15.45 | 16.49 | 16.79 | 15.92 | 17.10 | ||||||||||||||||||
| Cash costs ($/oz) (4,5) |
15.02 | 17.41 | 14.73 | 17.07 | 15.91 | 13.07 | ||||||||||||||||||
| AISC ($/oz) (4,5) |
20.45 | 22.39 | 17.66 | 18.37 | 19.33 | 14.30 | ||||||||||||||||||
| Financial Data ($000s) | ||||||||||||||||||||||||
| Revenue |
14,961 | 7,915 | 16,570 | 15,233 | 54,679 | 89,614 | ||||||||||||||||||
| (Loss) Income from mine operations |
(788 | ) | (2,440 | ) | 830 | (1,753 | ) | (4,151 | ) | 30,953 | ||||||||||||||
| Capital expenditures |
3,849 | 2,390 | 2,652 | 789 | 9,680 | 4,604 | ||||||||||||||||||
| Deferred stripping |
— | — | — | — | — | — | ||||||||||||||||||
| Exploration expenditures (6) |
21 | 6 | 429 | 6 | 462 | — | ||||||||||||||||||
| (1) | Data is for the period subsequent to December 1, 2018, the date upon which commercial production was declared at the Chinchillas mine. |
| (2) | Data for zinc production and sales relate only to zinc in zinc concentrate. |
| (3) | Data for lead production and sales relate only to lead in lead concentrate. |
| (4) | We report the non-GAAP financial measures of realized metal prices, cash costs and AISC per payable ounce of precious metal sold to manage and evaluate operating performance at Puna Operations. For a better understanding and a reconciliation of these measures to cost of sales, as shown in our Consolidated Statements of (Loss) Income, please refer to “Non-GAAP Financial Measures” in Section 10 of our MD&A. |
| (5) | Cash costs and AISC per payable ounce of silver sold include stockpile inventory costs previously incurred of $5.30 for the three months ended December 31, 2017 (September 31, 2017 - $5.20, June 30, 2017 - $3.30, March 31, 2017 - $2.00) and $3.90 for the year ended December 31, 2017. |
| (6) | Includes capitalized and expensed exploration expenditures. |
| SSR Mining Inc.
|
MD&A Year-End 2018 | 15
| |
Mine production
In 2018, Puna Operations, of which we hold 75% interest, produced a total of 3.7 million ounces of silver, 8.8 million pounds of zinc and 3.1 million pounds of lead. On an attributable basis, silver production in 2018 totaled 2.8 million ounces.
During the year, ore was milled at an average of 3,890 tonnes per day. Ore milled contained an average silver grade of 114 g/t. The average silver recovery was 72.1%, a 3% improvement as compared to 2017.
In the fourth quarter of 2018, silver production was 1.2 million ounces, an increase of 79% relative to the third quarter, due mainly to the increased tonnage of higher-grade Chinchillas ore milled. On an attributable basis, silver production for the quarter totaled 0.9 million ounces.
Subsequent to the declaration of commercial production at Chinchillas, material mined in December 2018 totaled 897,000 tonnes, including 201,000 tonnes of ore.
During the fourth quarter of 2018, ore was milled at an average of 3,720 tonnes per day. In December ore was sourced exclusively from Chinchillas and achieved a 3,605 tonnes per day milling rate. Processed ore in the fourth quarter contained an average silver grade of 133 g/t, a 38% increase as compared to the third quarter of 2018, due to processing of high grade Chinchillas ore in December. The average silver recovery in the fourth quarter was 81.5%, a 17% increase over the third quarter.
Mine operating costs
Cash costs and AISC per payable ounce of silver sold are non-GAAP financial measures. Please see the discussion under “Non-GAAP Financial Measures” in Section 10.
Cash costs, which include cost of inventory, treatment and refining costs, provincial royalties, export duties and by-product credits, were $15.02 per payable ounce of silver sold in the fourth quarter of 2018, a decrease from $17.41 per payable ounce of silver sold in the third quarter of 2018. Such decrease was primarily due to higher production resulting from higher silver grade of ore processed and recognition of by-product credits.
Cash costs per payable ounce of silver sold in 2018 increased to $15.91 from $13.07 in 2017. Until commercial production was declared at Chinchillas on December 1, 2018, Puna Operations processed sequentially lower grade stockpile ore since the closure of the Pirquitas open pit in January 2017.
AISC per payable ounce of silver sold in the fourth quarter of 2018 were at $20.45 compared to $22.39 in the third quarter due to lower cash costs and higher volumes sold. AISC of $19.33 per payable ounce of silver sold in 2018 were higher than $14.30 per payable ounce of silver sold in 2017 due to higher cash costs and higher capital investments per ounce sold.
Mine sales
Silver sales totaled 0.9 million ounces and attributable sales were 0.7 million in the fourth quarter of 2018, a 49% increase from the third quarter of 2018, due to higher production in the fourth quarter of 2018. Silver sales for the year totaled 3.8 million ounces and attributable share of silver sales in 2018 was 2.8 million ounces. This compares to 6.0 million ounces of silver sold in 2017.
Exploration
At Puna Operations, exploration activities were limited to the collection of detailed drone magnetic data at Chinchillas and the Pirquitas mine areas.
In 2018, we evaluated the potential for an underground mine at the Pirquitas deposit to provide supplemental ore to the Pirquitas mill. The study confirmed a technically feasible and economic project, however with a return below our investment thresholds at current metal prices. We have budgeted $1 million in 2019 for a 3,000-meter drill program to test for extensions to the mineralization that could have a positive impact on the project economics.
| SSR Mining Inc.
|
MD&A Year-End 2018 | 16
| |
Chinchillas Project, Argentina
During the fourth quarter, pre-stripping activities at the Chinchillas project were completed, ore haulage met required tonnages and commercial production was declared on December 1, 2018. Ore feed to the Pirquitas plant has been sourced from the Chinchillas mine since that date. Metallurgical recovery performance of the Chinchillas ore has met or exceeded design.
Construction of the in-pit tailings pumping and delivery system is complete, the slurry pumps have been pre-commissioned, and the tailings pipeline hydraulic test finished. The water reclaim pipeline has been hydrostatically tested and the pumps installed in the barges. The power line to the pumps is finished and in service. Pre-commissioning and commissioning of the tailings system is in process.
The Chinchillas truck shop structure is nearing completion with the installation of the main structural steel, cladding and internal offices. Electrical installation continues and the bridge crane is scheduled for installation in February. Two truck bays are being temporarily used in operations, while the finishing equipping of the facility is in progress.
Certain infrastructure and remaining road upgrades within the scope of the project will continue into the first quarter of 2019 with remaining capital expenditures totaling $9 million. The project remains on budget.
| 5. | REVIEW OF PROJECTS AND MINERAL RESERVES AND MINERAL RESOURCES |
Pitarrilla Project, Mexico
In 2018, we advanced a study evaluating the potential for an underground mine at the Pitarrilla project. The study confirmed a technically feasible and economic project; however, with a return below our investment thresholds at current metal prices. We are conducting a review of the geological model evaluating structural controls that may define higher grade areas that were potentially underestimated in the model originally developed for open pit purposes.
Mineral Reserves and Mineral Resources
At December 31, 2018, our total estimated Proven and Probable gold Mineral Reserves were 3.91 million ounces and total estimated silver Proven and Probable Mineral Reserves were 38.7 million ounces. Mineral Reserves estimates for the Marigold mine, the Seabee Gold Operation and Puna Operations have been determined based on prices of $1,250 per ounce of gold and $18.00 per ounce of silver. These prices are unchanged from those used to determine the Mineral Reserves estimate at December 31, 2017, reflecting market conditions and consensus long-term metal prices. All Mineral Resources and Mineral Reserves estimates are reported on a 100% basis, except for Puna Operations. Mineral Resources and Mineral Reserves estimates of silver ounces for Puna Operations are reported on a 75% attributable basis.
At Marigold, our 2018 exploration program led to an increase in Mineral Reserves. Probable Mineral Reserves increased to 3.3 million ounces of gold (201.5 million tonnes at an average gold grade of 0.47 g/t), after accounting for mining depletion and minor modeling reductions, while gold grade increased to 0.47 g/t. The increase in Probable Mineral Reserves is attributable to our successful infill and exploration drilling programs, which converted Mineral Resources at a portion of Red Dot and Mackay, collectively adding 460,000 gold ounces to Mineral Reserves. We added 350,000 ounces of gold Mineral Reserves at Red Dot, which we refer to as Red Dot Phase 1. Depletion of Mineral Reserves due to 2018 gold production totaled 320,000 ounces. Indicated Mineral Resources (inclusive of Mineral Reserves) totaled 5.56 million ounces of gold (354.5 million tonnes at an average gold grade of 0.47 g/t) after accounting for mining depletion and mine plan optimization, offset by our successful exploration program. Inferred Mineral Resources declined to 400,000 ounces of gold (33.6 million tonnes at an average gold grade of 0.37 g/t) due to conversion of Mineral Reserves and Mineral Resources in certain areas, particularly Red Dot. In addition, for further information regarding our Mineral Reserves and Mineral Resources estimate at Marigold, please see the Marigold Technical Report.
At the Seabee Gold Operation, Proven and Probable Mineral Reserves total 608,000 ounces of gold (Proven Mineral Reserves were 94,500 ounces (0.33 million tonnes at an average gold grade of 9.00 g/t) and Probable Mineral Reserves were 513,500 ounces (1.73 million tonnes at an average gold grade of 9.24 g/t)), a 39% increase compared to year-end 2017 as a result of conversion at Santoy 8. Proven and Probable Mineral Reserves increases are due to conversion of 191,000 gold ounces at Santoy 8 and 92,000 gold ounces at Santoy Gap. Measured and Indicated Mineral Resources (inclusive of Mineral Reserves) total 856,000 gold ounces (Measured
| SSR Mining Inc.
|
MD&A Year-End 2018 | 17
| |
Mineral Resources were 170,000 ounces (0.45 million tonnes at an average gold grade of 11.76 g/t) and Indicated Mineral Resources were 686,000 ounces (1.85 million tonnes at an average gold grade of 11.56 g/t)) at year-end 2018, reflecting an increase of 207,000 gold ounces at Santoy 8 and 17,000 gold ounces at Santoy Gap. As at December 31, 2018, Inferred Mineral Resources total 482,000 gold ounces (1.70 million tonnes at an average gold grade of 8.82 g/t), inclusive of our inaugural Inferred Mineral Resource estimate at Santoy Gap HW and reflecting a focus on Mineral Resources Conversion in 2018. In addition, for further information regarding our Mineral Reserves and Mineral Resources estimate at the Seabee Gold Operation, please see the technical report entitled “NI 43-101 Technical Report for the Seabee Gold Operation, Saskatchewan, Canada” dated October 20, 2017 (“Seabee Gold Operation Technical Report”).
At Puna Operations, Proven and Probable Mineral Reserves decreased to 38.7 million ounces of silver (Proven Mineral Reserves were 4.5 million ounces (0.94 million tonnes at an average silver grade of 196 g/t) and Probable Mineral Reserves were 34.3 million ounces (9.38 million tonnes at an average silver grade of 152 g/t)) due to depletion at the Chinchillas mine, processing Pirquitas stockpiles and modeling adjustments. Measured and Indicated Mineral Resources (inclusive of Mineral Reserves) total 89.0 million ounces of silver (Measured Mineral Resources were 6.6 million ounces (2.11 million tonnes at an average silver grade of 130 g/t) and Indicated Mineral Resources were 82.4 million ounces (29.51 million tonnes at an average silver grade of 116 g/t)) within the open pit, underground and stockpile inventory at both Chinchillas and Pirquitas. Inferred Mineral Resources are estimated to total 31.1 million ounces of silver (22.37 million tonnes at an average silver grade of 58 g/t) at December 31, 2018. In addition, for further information regarding our Mineral Reserves and Mineral Resources estimate at Puna Operations, please see the technical report entitled “NI 43-101 Technical Report Pre-feasibility Study of the Chinchillas Silver-Lead-Zinc Project, Jujuy Province, Argentina” dated May 15, 2017 (the “Chinchillas Technical Report”).
| 6. | REVIEW OF ANNUAL FINANCIAL RESULTS |
Income Statement Review
(expressed in thousands of United States dollars, except for per share amounts)
| Years ended December 31 | ||||||||||||
| 2018 | 2017 | 2016 (1) | ||||||||||
| $ | $ | $ | ||||||||||
| Revenue |
420,675 | 448,773 | 490,986 | |||||||||
| Cost of sales |
(343,830 | ) | (335,510 | ) | (336,980 | ) | ||||||
| Income from mine operations |
76,845 | 113,263 | 154,006 | |||||||||
| Impairment reversal |
— | 24,357 | — | |||||||||
| Operating income |
29,895 | 101,332 | 112,605 | |||||||||
| Net (loss) income |
(31 | ) | 71,466 | 64,957 | ||||||||
| Basic income per share attributable to equity holders of SSR Mining |
0.05 | 0.58 | 0.63 | |||||||||
| Diluted income per share attributable to equity holders of SSR Mining |
0.05 | 0.57 | 0.62 | |||||||||
| (1) | Data presented in this table with respect to the Seabee Gold Operation is for the period May 31, 2016, to December 31, 2016, the period for which we were entitled to all economic benefits of the Seabee Gold Operation, following our acquisition of Claude Resources. |
Revenue
Realized gold and silver prices are non-GAAP financial measure. Please see the discussion under “Non-GAAP Financial Measures” in Section 10.
Realized gold prices increased by $ 8 per ounce or less than 1% compared to 2017 while silver prices declined by $1.18 per ounce or 7% compared to 2017. Lower metal prices negatively impact revenue and reported income.
In 2018, we recognized revenues of $420.7 million compared to $448.8 million in 2017 as higher sales from our Seabee Gold Operation were more than offset by the anticipated decrease in sales from our Puna Operations.
| SSR Mining Inc.
|
MD&A Year-End 2018 | 18
| |
| ◾ | At the Marigold mine, we sold 198,780 payable ounces of gold at an average realized price of $1,261 per ounce, generating total revenue of $250.3 million in 2018 compared to sales of 200,094 payable ounces of gold at an average realized price of $1,254 per ounce, generating total revenue of $250.8 million in 2017. |
| ◾ | At the Seabee Gold Operation, we recognized revenues of $115.7 million in 2018, from the sale of 91,360 payable ounces of gold, at an average realized price of $1,267 per ounce, compared to revenues of $108.3 million from the sale of 86,050 payable ounces of gold at an average realized price of $1,259 per ounce, in 2017. |
| ◾ | At Puna Operations we recognized revenues of $54.7 million in 2018 from the sale of 3.6 million payable ounces of silver at an average realized price of $15.92 per ounce compared to revenue of $89.6 million recognized in 2017 from the sale of 5.8 million payable ounces of silver at an average realized price of $17.10 per ounce. At December 31, 2018, sales contracts containing 0.8 million ounces of silver were subject to final price settlement over the next four months. |
Cost of sales
Cost of sales for the year ended December 31, 2018, was $343.8 million, compared to $335.5 million in 2017. In 2017, cost of sales benefited from non-cash adjustments at the Puna Operations totaling $10.6 million.
| ◾ | At the Marigold mine, cost of sales for 2018 was $200.1 million, generating income from mine operations of $50.2 million compared to cost of sales in 2017 of $184.2 million, generating income from mine operations of $66.7 million. Cost of sales were higher at similar sales volumes due to higher inventory costs. |
| ◾ | At the Seabee Gold Operation, cost of sales in 2018, was $84.9 million, generating income from mine operations of $30.8 million compared to cost of sales in 2017 of $92.7 million, generating income from mine operations of $15.6 million. Cost of sales were lower despite the increase in sales volumes due to lower inventory costs from higher grades processed and lower depreciation. |
| ◾ | At Puna Operations, cost of sales for 2018 was $58.8 million, compared to $58.7 million in 2017, with a resulting loss from mine operations of $4.2 million in 2018, compared to income of $31.0 million in 2017. Low grade Pirquitas stockpiles were processed through 2018 prior to the Chinchillas project reaching commercial completion on December 1, 2018. Cost of sales in 2017 was positively impacted by $6.3 million of non-cash reversal of inventory provision and a positive non-cash impact of $4.3 million of export duties following the resolution of our export duty claim. |
Other operating costs
General and administrative expenses for the year ended December 31, 2018, of $32.9 million were higher than the $20.3 million recorded in 2017. Share-based compensation expense was $13.4 million in 2018 higher than the $4.2 million in 2017, due to stronger relative and absolute share price performance.
Expensed exploration and evaluation expenses were $14.0 million in 2018 compared to $16.0 million in 2017. Expenditures principally in the current period related to greenfield exploration work performed at the Seabee Gold Operation and SIB project.
Non-operating items
We recorded $33.6 million of interest expense and other financing costs in 2018, comparable to $34.9 million in 2017. In each period, the interest expense is mainly attributable to our 2.875% convertible senior notes issued in 2013 (the “Notes”). In 2018, we incurred interest expense of $ 6.2 million (2017 - $7.6 million) following the moratorium settlement in Argentina. On acquisition of the SilverCrest shares, we recognized an expense of $2.8 million related to the premium paid over the prevailing market price for the purchase of the shares of SilverCrest. Due to the subsequent increase in the SilverCrest share price, we recognized a gain of $4.3 million in Other Comprehensive Income at December 31, 2018.
| SSR Mining Inc.
|
MD&A Year-End 2018 | 19
| |
We recorded foreign exchange gains for year ended December 31, 2018 of $9.2 million compared to $5.1 million in 2017. Our main foreign exchange exposures are related to net monetary assets and liabilities denominated in ARS and CAD. The gain in the year resulted mainly from a weakening ARS, in which our moratorium liability is denominated, partially offset by VAT receivables balance. The CAD weakened against the USD during 2018.
Taxation
For the year ended December 31, 2018, we recorded an income tax expense of $8.1 million compared to $3.1 million in the year ended December 31, 2017. The total income tax expense in the year consists of current tax expense of $8.0 million and deferred tax expense of $0.1 million. Income tax expense is a result of profitable operations at the Marigold mine and Seabee Gold Operation, metal concentrate and gold sales activities in Canada, and current tax paid of $4.7 million related to the restructure of the Argentina operations. Offsets to the income tax expense items is primarily the general and administrative expenses in Canada.
The total income tax expense for the twelve months ended December 31, 2017 consisted of a current tax expense of $3.0 million and a deferred tax expense of $0.1 million. We recognized an income tax recovery in the year of $6.5 million due to the legislative changes in the United States, primarily due to a significant reduction in income tax rates applicable from January 1, 2018, impacting our Marigold Mine. The residual income tax expense is a result of profitable operations at the Marigold mine and Seabee Gold Operation and concentrates and gold sales activities in Canada. Offsets to the income tax expense items include the general and administrative expenses in Canada.
Net income
Net loss for the year ended December 31, 2018 was $0.03 million compared to a net income of $71.5 million for the year ended December 31, 2017. In the year ended December 31, 2017, we recognized non-cash adjustments to cost of sales due to the resolution of our export duty claim in Argentina of $4.3 million and $6.3 million due to reversal of supplies inventory previously written down at Puna Operations. We also recorded an impairment reversal of the Pirquitas plant of $24.4 million resulting from the Pirquitas life extension following the formation of the joint venture for the Chinchillas project.
Income attributable to the equity holders of SSR Mining was $ 6.4 million ($0.05 per share) in 2018 compared to $69.3 million ($0.58 per share) in 2017. Income attributable to equity holders of SSR Mining in 2018 was higher as the jointly owned Puna Operations recorded a loss while the remaining business reported a profit.
Other comprehensive income
During 2018, we recognized a loss of $37.7 million on marketable securities compared to a gain of $25.9 million in 2017, due to fair value movements in marketable securities designated as fair value through other comprehensive income.
Financial Position and Liquidity
(expressed in thousands of United States dollars)
| As at December 31 | ||||||||||||
| 2018 | 2017 | 2016 | ||||||||||
| Cash and cash equivalents |
419,212 | 459,864 | 327,127 | |||||||||
| Working capital (1) |
649,865 | 728,131 | 559,934 | |||||||||
| Total assets |
1,521,138 | 1,537,454 | 1,438,688 | |||||||||
| Non-current financial liabilities |
247,551 | 233,180 | 220,054 | |||||||||
| Cash generated by operating activities |
59,769 | 144,725 | 170.684 | |||||||||
| Cash (used in) investing activities |
(115,930 | ) | (15,494 | ) | (43,264 | ) | ||||||
| Cash generated by (used in) financing activities |
20,516 | 4,601 | (11,064 | ) | ||||||||
| (1) | We report the non-GAAP financial measure of working capital to manage and evaluate operating performance at our mines. For a better understanding of this measure, please refer to “Non-GAAP Financial Measures” in Section 10. |
| SSR Mining Inc.
|
MD&A Year-End 2018 | 20
| |
Liquidity
At December 31, 2018, we had $419.2 million of cash and cash equivalents, a decrease of $40.7 million from December 31, 2017. Our cash generated by operating activities was $ 59.8 million, while $67.7 million was invested in plant and equipment and $16.6 million was invested in capitalized stripping and underground development at our Marigold mine and Seabee Gold Operation, which will benefit future periods. We also invested $60.2 million in the development of the Chinchillas project and $23.1 million in the purchase of SilverCrest shares. We received $63.4 million from the sale of our remaining common shares of Pretium.
At December 31, 2018, our working capital position of $ 649.9 million, was a decrease of $78.3 million from $728.1 million at December 31, 2017, mainly due to the decline in the market value of common shares of Pretium which have now been sold. We manage our liquidity position with the objective of ensuring sufficient funds are available to meet planned operating requirements and providing support to fund strategic growth initiatives. Our cash balance at December 31, 2018, along with projected operating cash flows, are expected to be sufficient to fund planned activities over the next twelve months from the date of this MD&A. We continue to focus on capital allocation and our cost management strategy, while also implementing various optimization activities at our operations to improve the cash generating capacity of each mine.
Of our cash and cash equivalents balance, $417.1 million was held in Canada or the United States. At December 31, 2018, $1.6 million cash was held in Argentina. All cash is invested in short-term investments or high interest savings accounts under our investment policy with maturities of 90 days or less providing us with sufficient liquidity to meet our foreseeable corporate needs.
Capital Resources
Our objectives when managing capital are to:
| ◾ | safeguard our ability to continue as a going concern in order to operate and optimize our current projects and pursue strategic growth initiatives; and |
| ◾ | maintain a flexible capital structure which lowers our cost of capital. |
In assessing our capital structure, we include in our assessment the components of shareholders’ equity and our Notes. In order to facilitate the management of capital requirements, we prepare annual budgets and continuously monitor and review actual and forecasted cash flows. The annual budgets are monitored and approved by our Board of Directors.
To maintain or adjust the capital structure, we may, from time to time, issue new shares or debt, repay debt, buy back shares or dispose of non-core assets. We expect our current capital resources will be sufficient to carry out our exploration plans and support operations through the current operating period.
Our $75 million senior secured revolving credit facility along with the $25.0 million accordion extension in 2017, matures on June 8, 2020. As of December 31, 2018, the facility remained undrawn and we were in compliance with financial covenants to our credit facility. Our Notes do not contain any financial covenants.
Outstanding share data
The authorized capital consists of an unlimited number of common shares without par value. As at February 21, 2019, the following common shares and options were outstanding:
| Number of shares
|
Exercise price
|
Remaining life
|
||||||||||
| C$ |
(years) |
|||||||||||
| Capital stock |
|
121,115,824 |
|
|||||||||
| Stock options |
|
2,595,835 |
|
|
4.00 - 24.41 |
|
|
0.05 - 6.86 |
| |||
| Other share-based compensation awards |
|
815,805 |
|
|
0.11 - 9.86 |
| ||||||
| Fully diluted |
|
124,527,464 |
|
|||||||||
| SSR Mining Inc.
|
MD&A Year-End 2018 | 21
| |
| 7. | QUARTERLY FINANCIAL REVIEW |
The following table sets out selected financial results for each of the eight most recently completed quarters, expressed in thousands of USD, except per share and per ounce amounts:
| 2018
|
2017
|
|||||||||||||||||||||||||||||||
| 31-Dec | 30-Sep | 30-Jun | 31-Mar | 31-Dec | 30-Sep | 30-Jun | 31-Mar | |||||||||||||||||||||||||
|
$000s |
$000s | $000s | $000s | $000s | $000s | $000s | $000s | |||||||||||||||||||||||||
| Revenue | 103,712 | 115,033 | 104,028 | 97,902 | 107,881 | 106,005 | 116,982 | 117,905 | ||||||||||||||||||||||||
| Gold equivalent payable ounces sold | 82,439 | 96,337 | 80,937 | 74,922 | 85,883 | 86,930 | 97,039 | 94,576 | ||||||||||||||||||||||||
| Realized gold price ($/oz) (1) | 1,230 | 1,208 | 1,304 | 1,334 | 1,271 | 1,270 | 1,263 | 1,220 | ||||||||||||||||||||||||
| Realized silver price ($/oz) (1) | 14.42 | 15.45 | 16.49 | 16.79 | 16.96 | 16.77 | 17.31 | 17.35 | ||||||||||||||||||||||||
| Income from mine operations | 16,536 | 21,875 | 21,203 | 17,231 | 21,190 | 22,522 | 29,462 | 40,089 | ||||||||||||||||||||||||
| (Loss) income before tax | (7,559 | ) | 6,632 | 9,823 | (806 | ) | 13,936 | 2,175 | 40,008 | 18,467 | ||||||||||||||||||||||
| Net (loss) income | (2,544 | ) | 2,228 | 2,607 | (2,322 | ) | 16,850 | 1,821 | 37,747 | 15,047 | ||||||||||||||||||||||
| Attributable (loss) income to equity holders of SSR Mining | (3,486 | ) | 6,374 | 5,117 | (1,626 | ) | 15,883 | 1,067 | 37,319 | 15,047 | ||||||||||||||||||||||
| Basic attributable (loss) income per share | (0.03 | ) | 0.05 | 0.04 | (0.01 | ) | 0.14 | 0.01 | 0.31 | 0.13 | ||||||||||||||||||||||
| Diluted attributable (loss) income per share | (0.03 | ) | 0.05 | 0.04 | (0.01 | ) | 0.14 | 0.01 | 0.31 | 0.12 | ||||||||||||||||||||||
| Cash and cash equivalents | 419,212 | 474,511 | 493,642 | 472,901 | 459,864 | 424,025 | 353,530 | 340,585 | ||||||||||||||||||||||||
| Total assets | 1,521,138 | 1,503,717 | 1,504,987 | 1,490,123 | 1,537,454 | 1,499,220 | 1,514,567 | 1,484,224 | ||||||||||||||||||||||||
| Working capital (1) | 649,865 | 649,448 | 671,967 | 685,731 | 728,131 | 684,077 | 677,811 | 688,237 | ||||||||||||||||||||||||
| Non-current financial liabilities | 247,551 | 243,858 | 240,234 | 236,685 | 233,180 | 229,810 | 226,500 | 223,258 | ||||||||||||||||||||||||
| (1) | We report the non-GAAP financial measures of realized metal prices per payable ounce of precious metals sold and working capital to manage and evaluate operating performance at our mines. For a better understanding of these measures, please refer to “Non-GAAP Financial Measures” in Section 10. |
The volatility in revenue over the past eight quarters has resulted from variable precious metal prices and sales volumes at our operations. There are no significant seasonal fluctuations in the results for the presented periods. Realized gold prices have generally fluctuated between $1,208 and $1,334 per payable ounce of gold sold and realized silver prices have generally fluctuated between $14.42 and $17.35 per payable ounce of silver sold. Sales volumes have been impacted by generally increasing production at the Seabee Gold Operation, normal production variations at the Marigold mine due to its nature as a run-of-mine heap leach operation, and declining production at Puna Operations as the mine processed stockpiles while it transitioned to production from the Chinchillas deposit on December 1, 2018.
Income from mine operations broadly follows the trend in revenue. Although gross margins have reduced following the closure of Puna Operations’ Pirquitas pit in early 2017, margins have remained stable since the second half of 2017. Certain periods have been impacted by non-cash adjustments; notably, in the fourth quarter of 2017, there was a $6.3 million reversal of inventory provision as a result of the extended operational plant life at our Puna Operations due to the formation of Puna Operations, and the first quarter of 2017 was positively impacted by the resolution of the export duty claim in Argentina, which resulted in a non-cash reduction to cost of sales of $4.3 million.
Net income before and after income tax has fluctuated significantly over the past eight quarters, which has been heavily influenced by operating performance and impairment reversals and other adjustments. Net income for the fourth quarter of 2018 as negatively impacted by a $ 2.8 million expense related to the premium paid over the prevailing market price on the purchase of the SilverCrest shares. Net income for the second quarter of 2018 was negatively impacted by the recognition of a $5.8 million income tax expense related to the re-organization of our business units in Argentina and the second quarter of 2017 was positively impacted by an impairment reversal
| SSR Mining Inc.
|
MD&A Year-End 2018 | 22
| |
of the Pirquitas plant of $24.4 million resulting from its life extension following the formation of Puna Operations.
Three months ended December 31, 2018, compared to the three months ended December 31, 2017
(expressed in thousands of United States dollars, except for per share amounts)
| Three months ended December 31 | ||||||||
| 2018 | 2017 | |||||||
| $ | $ | |||||||
| Revenue |
103,712 | 107,881 | ||||||
| Cost of sales |
(87,176 | ) | (86,691 | ) | ||||
| Income from mining operations |
16,536 | 21,190 | ||||||
| General and administrative expenses |
(12,108 | ) | (2,082 | ) | ||||
| Exploration, evaluation and reclamation (expenses) recovery |
(1,367 | ) | 829 | |||||
| Operating income |
3,061 | 19,937 | ||||||
| Interest earned and other finance income |
3,202 | 2,165 | ||||||
| Interest expense and other finance expenses |
(8,205 | ) | (9,220 | ) | ||||
| Other expense |
(3,675 | ) | (185 | ) | ||||
| Foreign exchange (loss) gain |
(1,942 | ) | 1,239 | |||||
| (Loss) income before tax |
(7,559 | ) | 13,936 | |||||
| Income tax recovery |
5,015 | 2,914 | ||||||
| Net (loss) income |
(2,544 | ) | 16,850 | |||||
Net loss attributable to our shareholders for the three months ended December 31, 2018 was $3.5 million ($0.03 per share), compared to net income of $15.9 million ($0.14 per share) in the same period of 2017. The following is a summary and discussion of the significant components of income and expenses recorded during the current quarter compared to the same period in the prior year.
Revenue
Realized silver and gold price is a non-GAAP financial measure. Please see the discussion under “Non-GAAP Financial Measures” in Section 10.
Realized gold prices in the current quarter declined by $41 per ounce or 3% compared to the comparative 2017 quarter while silver prices declined by $2.54 per ounce or 15%. Lower metal prices negatively impact revenue and reported income in the current quarter relative to the comparative quarter.
In the three months ended December 31, 2018, we recognized total revenues of $ 103.7 million, compared to $107.9 million recognized in the comparative period of 2017. This reduction was primarily due to lower sales from both the Marigold mine and Seabee Gold Operation, which more than offset higher sales at Puna Operations.
| ◾ | At the Marigold mine, we recognized revenues of $61.9 million in the fourth quarter of 2018 from the sale of 50,524 payable ounces of gold, at an average realized gold price of $1,227 per payable ounce sold. In the fourth quarter of 2017, revenues were $65.2 million from the sale of 51,399 payable ounces of gold at an average realized gold price of $1,269 per payable ounce sold. Lower revenues in the fourth quarter of 2018 compared to the same period in 2017 were due to lower sales resulting from lower production and realized gold price. |
| ◾ | At the Seabee Gold Operation, we recognized revenues of $26.9 million in the fourth quarter of 2018 from the sale of 21,700 payable ounces of gold, at an average realized gold price of $1,236 per payable ounce sold. In the fourth quarter of 2017, |
| SSR Mining Inc.
|
MD&A Year-End 2018 | 23
| |
| revenues were $30.6 million from the sale of 23,963 payable ounces of gold, at an average realized price of $1,276 per ounce. Sales quantities in the fourth quarter of 2018 were 9% lower than in the comparative quarter due to lower production resulting from a temporary build-up of in-circuit inventory due to timing of gold pours. |
| ◾ | At Puna Operations, we recognized revenues of $15.0 million in the fourth quarter of 2018, higher than the $12.1 million in the same period in 2017. Sales volumes were higher as commercial production of Chinchillas ore processing commenced on December 1, 2018. We sold 0.9 million payable ounces of silver in the fourth quarter of 2018, higher than the 0.8 million payable ounces sold in the comparative period. Realized silver prices were lower in the fourth quarter of 2018, which averaged $14.42 per ounce, excluding the impact of period-end price adjustments, compared to $16.96 per ounce in the same period in 2017. Higher sales also assisted with a positive mark-to-market impact of $1.3 million in the fourth quarter of 2018, compared to a positive impact of $0.2 million in the fourth quarter of 2017. At December 31, 2018, sales contracts containing 0.8 million ounces of silver were subject to final price settlement over the next four months. |
Cost of sales
Cost of sales for the fourth quarter of 2018 was $87.2 million, compared to $86.7 million in the fourth quarter of 2017.
| ◾ | At the Marigold mine, cost of sales in the fourth quarter of 2018 was $51.9 million, generating income from mine operations of $10.0 million for a gross margin of 16%. This compares to cost of sales of $52.4 million in the fourth quarter of 2017, generating income from mine operations of $12.8 million, equal to a gross margin of 20%. The lower margin is due to lower gold prices, higher unit costs of inventory, higher depreciation and depletion per gold ounce sold. |
| ◾ | At the Seabee Gold Operation, cost of sales in the fourth quarter was $19.5 million, generating income from mine operations of $7.3 million, equal to a gross margin of 27%. In the comparative period of 2017, cost of sales was $27.6 million, generating income from mine operations of $2.9 million, equal to a gross margin of 10%. The higher margin is mainly due to lower unit cost of inventory and lower depreciation more than offsetting lower gold prices. |
| ◾ | At Puna Operations, cost of sales in the fourth quarter of 2018 was $15.7 million, resulting in loss from mine operation of $0.8 million, equal to a negative gross margin of 5.3%. This compares to cost of sales of $6.6 million in the fourth quarter of 2017, generating income from mine operations of $5.5 million, equal to a gross margin of 45%. The lower margin is mainly due to higher unit costs of inventory and a lower realized silver price in the current period, whereas the fourth quarter of 2017 was positively impacted by $6.3 million of non-cash reversal of inventory provision. |
Other operating costs
General and administrative expenses in the three months ended December 31, 2018, of $12.1 million were higher than the $2.1 million recorded in the three months ended December 31, 2017. Share-based compensation expense is $8.1 higher in the current quarter resulting from stronger relative and absolute share price performance.
Exploration, evaluation and reclamation costs of $1.4 million for the three months ended December 31, 2018, compared to a recovery of $0.8 million for the three months ended December 31, 2017. The majority of expenditures in the fourth quarter of 2018 related to greenfield exploration work performed at the Seabee Gold Operation.
Non-operating items
During the fourth quarter of 2018, we recorded interest expense and other financing costs of $8.2 million compared to the $9.2 million recorded in the fourth quarter of 2017. In each period, the interest expense is mainly attributable to our Notes. As part of the export duty moratorium settlement with the Argentine government, we also incurred interest expense of $1.5 million in the fourth quarter of 2018 and $2.3 million in the fourth quarter of 2017. The decrease was mainly due to devaluation of the ARS. On acquisition of SilverCrest shares, we recognized an expense of $2.8 million related to the premium paid over the prevailing market price for the purchase of the shares of SilverCrest. Due to the subsequent increase in the SilverCrest share price, we recognized a gain of $4.3 million in Other Comprehensive Income at December 31, 2018.
| SSR Mining Inc.
|
MD&A Year-End 2018 | 24
| |
We recorded a foreign exchange loss for the three months ended December 31, 2018, of $1.9 million compared to a gain of $1.2 million in the three months ended December 31, 2017. Our main foreign exchange exposures are related to the ARS and CAD. During the quarter the loss resulted as the ARS stabilized and then strengthened after a significant decline earlier in the year. Our moratorium liability denominated in ARS, is partially offset by VAT receivable balances.
Taxation
For the three months ended December 31, 2018, we recorded a net income tax recovery of $5.0 million compared to $2.9 million in the three months ended December 31, 2017. The total income tax recovery in the quarter consists of a current tax expense of $0.3 million and a deferred tax recovery of $5.3 million. Income tax expense is a result of profitable operations at the Marigold mine and Seabee Gold Operation, and metal concentrate and gold sales activities in Canada. Offsets to the income tax expense items include the general and administrative expenses in Canada, $1.2 million of BC Mining Exploration Tax Credit and a $5.1 million recovery of tax expense related to inflation adjustment to property, plant and equipment and foreign exchange in Argentina.
The income tax expense for the three months ended December 31, 2017 consists of a current tax recovery of $ 2.2 million and a deferred tax recovery of $0.7 million. We recognized an income tax recovery of $6.5 million due to the legislative changes in the United States, primarily due to a significant reduction in income tax rates applicable from Jan. 1, 2018 impacting Marigold Mine. Further, in the quarter the Province of Saskatchewan reversed an income tax rate reduction that had been previously enacted in the second quarter of 2017, resulting in an income tax expense of $2.1 million. The residual income tax expense is a result of the profitable operations at the Marigold mine and Seabee Gold Operation and concentrates, gold sales activities in Canada, offset by general and administrative expenses in Canada.
Other comprehensive income
During the fourth quarter of 2018, we recognized an unrealized gain of $2.1 million on marketable securities in other comprehensive income, compared to $15.5 million in the fourth quarter of 2017. The primarily gain in the current quarter was driven by valuation movements in our investment in SilverCrest. The prior period change was primarily driven by valuation movements in our investment in Pretium, which we no longer hold.
| SSR Mining Inc.
|
MD&A Year-End 2018 | 25
| |
Statements of cash flow
(expressed in thousands of United States dollars)
| Three months ended December 31
|
||||||||
| 2018 | 2017 | |||||||
| Cash flows from operating activities |
||||||||
| Net (loss) income for the period |
(2,544 | ) | 16,850 | |||||
| Adjustments for: |
||||||||
| Depreciation, depletion and amortization |
22,650 | 29,571 | ||||||
| Net finance expense |
4,915 | 6,564 | ||||||
| Income tax recovery |
(5,015 | ) | (2,914 | ) | ||||
| Non-cash foreign exchange loss (gain) |
1,802 | (5,369 | ) | |||||
| Net changes in non-cash working capital items |
(22,285 | ) | 4,037 | |||||
| Other operating activities |
181 | (1,322 | ) | |||||
| Cash (used in) generated by operating activities before interest and income taxes paid |
(296 | ) | 47,417 | |||||
| Interest paid |
(1,514 | ) | (2,340 | ) | ||||
| Moratorium paid |
(1,120 | ) | (1,947 | ) | ||||
| Income taxes (paid) recovered |
(814 | ) | 2,045 | |||||
| Cash (used in) generated by operating activities |
(3,744 | ) | 45,175 | |||||
| Cash flows from investing activities |
||||||||
| Purchase of plant and equipment |
(10,597 | ) | (4,026 | ) | ||||
| Capitalized stripping costs |
(1,208 | ) | (5,711 | ) | ||||
| Underground mine development costs |
(2,910 | ) | (2,300 | ) | ||||
| Capitalized exploration costs |
(2,571 | ) | (1,239 | ) | ||||
| Chinchillas project costs |
(18,862 | ) | (11,432 | ) | ||||
| Loan to joint venture partner |
(8,033 | ) | — | |||||
| Investment in marketable securities |
(23,057 | ) | — | |||||
| Proceeds from sale of marketable securities and other investments |
— | 14,244 | ||||||
| Interest received |
2,601 | 1,393 | ||||||
| Other |
1,609 | (562 | ) | |||||
| Cash used in investing activities |
(63,028 | ) | (9,633 | ) | ||||
| Cash flows from financing activities |
||||||||
| Proceeds from exercise of stock options |
3,103 | 788 | ||||||
| Funding from non-controlling interest |
8,800 | 1,154 | ||||||
| Cash generated by financing activities |
11,903 | 1,942 | ||||||
| Effect of foreign exchange rate changes on cash and cash equivalents |
(431 | ) | (1,645 | ) | ||||
| (Decrease) Increase in cash and cash equivalents |
(55,300 | ) | 35,839 | |||||
| Cash and cash equivalents, beginning of period |
474,511 | 424,025 | ||||||
| Cash and cash equivalents, end of period |
419,211 | 459,864 | ||||||
Cash used in operating activities was $3.7 million in the fourth quarter of 2018 compared to $45.2 million generated in the fourth quarter of 2017. Lower metal prices combined with lower gold sales at higher unit costs more than offset higher silver sales at lower unit costs at Puna Operations. Operating activities were impacted by a $22.3 million build in non-cash working capital due to a combination of increased gold and concentrate finished goods inventories, inventory in circuit at Seabee, Chinchillas ore stockpiles at Puna Operations and a reduction in trade payables at year end, particularly related to the Chinchillas project. We used $63.0 million in investing activities in the fourth quarter of 2018. We invested $23.1 million in the SilverCrest share purchase, $10.6 million in property, plant and equipment, $ 18.9 million in the Chinchillas project and loaned $8.0 million to our joint venture partner. This compares to $9.6 million in the fourth quarter of 2017 as the quarter benefited from $14.2 million of Pretium share sale proceeds. We received $8.8 million from our joint venture partner for its share of the development costs of the Chinchillas project.
| SSR Mining Inc.
|
MD&A Year-End 2018 | 26
| |
| 8. | FINANCIAL INSTRUMENTS AND RELATED RISKS |
We are exposed to a variety of financial risks as a result of our operations, including market risk (which includes price risk, currency risk and interest rate risk), credit risk and liquidity risk. Our overall risk management strategy seeks to reduce potential adverse effects on our financial performance. Risk management is carried out under policies approved by our Board of Directors.
We may, from time to time, use foreign exchange contracts, commodity price contracts, equity hedges and interest rate swaps to manage our exposure to fluctuations in foreign currency, metal and energy prices, marketable securities values and interest rates. We do not have a practice of trading derivatives. Our use of derivatives is limited to specific programs to manage fluctuations in foreign exchange, diesel prices and marketable securities risks, which are subject to the oversight of our Board of Directors.
The risks associated with our financial instruments, and the policies on how we mitigate those risks are set out below. This is not intended to be a comprehensive discussion of all risks.
Market Risk
This is the risk that the fair values of financial instruments will fluctuate owing to changes in market prices. The significant market risks to which we are exposed are price risk, currency risk and interest rate risk.
(i) Price Risk
This is the risk that the fair values or future cash flows of our financial instruments will fluctuate because of changes in market prices. Income from mine operations in the next year depends on the metal prices for gold and silver, lead and zinc and also prices of input commodities such as diesel. These prices are affected by numerous factors that are outside of our control, such as:
| ◾ | global or regional consumption patterns; |
| ◾ | the supply of, and demand for, these commodities; |
| ◾ | speculative activities; |
| ◾ | the availability and costs of substitutes; |
| ◾ | inflation; and |
| ◾ | political and economic conditions, including interest rates and currency values. |
The principal financial instruments that we hold which are impacted by commodity prices are our silver concentrate trade receivables. The majority of our sales agreements are subject to pricing terms that settle within one to three months after delivery of concentrate, and this adjustment period represents our trade receivable exposure to variations in commodity prices.
We have not hedged the price of any metal as part of our overall corporate strategy.
We hedge a portion of our diesel consumption with the objective of securing future costs. We executed swap and option contracts under a risk management policy approved by our Board of Directors. In addition, due to the ice road supply at the Seabee Gold Operation, we purchase annual consumable supplies in advance at prices which are generally fixed at time of purchase, not during period of use.
A 10% increase or decrease in the silver prices as at December 31, 2018, with all other variables held constant, would have resulted in a $0.9 (December 31, 2017 - $1.0) increase or decrease to our trade receivables and after-tax net income.
As we do not have trade receivables for gold sales, movements in gold prices will not impact the value of any financial instruments.
The costs relating to our production activities vary depending on market prices on mining consumables including diesel fuel and electricity.
During 2018, under our risk management policy we have used swaps and options to manage a portion of our cost of diesel.
| SSR Mining Inc.
|
MD&A Year-End 2018 | 27
| |
Marigold Mine
Our instruments are based on the ultra low sulphur Gulf Coast diesel index for diesel consumed at the Marigold mine. As at December 31, 2018, the spot price of diesel was $1.56/gallon and we have hedged the following future anticipated usage at the Marigold mine:
| 2019 | 2020 | |||||||
| Gallons hedged (in thousands) |
5,364 | 3,600 | ||||||
| Estimated usage |
52.6% | 35.3% | ||||||
| Floor price ($/gallon) |
1.70 | 1.75 | ||||||
| Cap price ($/gallon) |
2.34 | 2.36 | ||||||
For the year ended December 31, 2018, for the Marigold mine we had a mark-to-market loss of $1.5 million (2017 - $ 0.1 million) on outstanding diesel fuel hedges recognized in other comprehensive income. As and when it is determined to be favourable, we may execute additional diesel fuel hedges under our risk management policy.
Seabee Gold Operation
Our instruments are based on the US New York Harbour diesel index for diesel consumed at the Seabee Gold Operation. As at December 31, 2018, the spot price of diesel was $0.44/litre and we have hedged the following future anticipated usage at the Seabee mine:
| 2019 | 2020 | |||||||
| Litres hedged (in thousands) |
3,188 | — | ||||||
| Estimated usage |
75 | % | — | |||||
| Floor price ($/litre) |
0.46 | — | ||||||
| Cap price ($/litre) |
0.55 | — | ||||||
For the year ended December 31, 2018, for the Seabee Gold Operation we had a mark-to-market loss of $0.1 million (December 31, 2017 - $Nil) on outstanding diesel fuel hedges recognized in other comprehensive income. As and when it is determined to be favourable, we may execute additional diesel fuel hedges under our risk management policy.
We hold certain investments in marketable securities which are measured at fair value, being the closing price of each equity investment at the balance sheet date. We are exposed to changes in share prices which would result in gains and losses being recognized in OCI. A 10% change in prices would have a $2.6 million impact on total comprehensive income at December 31, 2018 (December 31, 2017 - $9.9 million). We did not hedge any securities in 2018 or 2017.
(ii) Currency Risk
Currency risk is the risk that the fair values or future cash flows of our financial instruments and other assets and liabilities will fluctuate because of changes in foreign currency rates. Our financial instruments are exposed to currency risk where those instruments are denominated in currencies that are not the same as the functional currency of the entity that holds them; exchange gains and losses in these situations impact earnings.
The following are the most significant areas of exposure to currency risk, shown in thousands of U.S. dollars:
Currency risk is the risk that the fair values or future cash flows of our financial instruments and other assets and liabilities will fluctuate because of changes in foreign currency rates. Our financial instruments are exposed to currency risk where those instruments are denominated in currencies that are not the same as the functional currency of the entity that holds them; exchange gains and losses in these situations impact earnings.
| SSR Mining Inc.
|
MD&A Year-End 2018 | 28
| |
The following are the most significant areas of exposure to currency risk, shown in thousands of U.S. dollars:
| December 31, 2018 | ||||||||
| Canadian dollar | Argentine peso | |||||||
| Cash |
7,982 | 1,604 | ||||||
| Value added tax receivable |
145 | 17,039 | ||||||
| Trade and other payables (excluding VAT and income taxes) |
(22,974 | ) | (9,908 | ) | ||||
| Provisions |
— | (19,056 | ) | |||||
| Total |
(14,847 | ) | (10,321 | ) | ||||
| December 31, 2017 | ||||||||
| Canadian dollar | Argentine peso | |||||||
| Cash |
5,342 | 17,223 | ||||||
| Value added tax receivable |
206 | 12,242 | ||||||
| Other financial assets |
200 | 884 | ||||||
| Trade and other payables (excluding VAT and income taxes) |
(17,017 | ) | (5,021 | ) | ||||
| Provisions |
— | (47,287 | ) | |||||
| Total |
(11,269 | ) | (21,959 | ) | ||||
We monitor and manage this risk with the objective of ensuring our company-wide exposure to negative fluctuations in currencies against the U.S. dollar is managed.
Over the course of 2018, ARS continued to devalue by approximately 102% compared to 17% in 2017. Following our entry into the moratorium in Argentina in 2017, our U.S. dollar export duty provision was converted into an Argentine peso liability (see Note 13 to our consolidated financial statements for the year ended December 31, 2018). Correspondingly, we now have a net Argentine peso liability position which has resulted in foreign exchange gains as a result of the devaluation of the Argentine peso.
The Canadian dollar was relatively stable through most of 2018, ending the year having depreciated by 8.7% (2017 - appreciated by 7%) and closing at $1.36 Canadian dollar per $1.00 U.S. dollar. This has negatively impacted the value of our marketable securities and our Canadian dollar cash, while having a marginally positive impact on our Canadian operating costs and liabilities in U.S. dollar terms.
The acquisition of the Seabee Gold Operation in 2016 materially increased our exposure to Canadian dollar operating and capital costs. Under our risk management policy, we have entered into options to manage this exposure. As at December 31, 2018, we had the following hedge positions outstanding:
| 2019 | 2020 | |||||||
| Notional amount (in thousands of Canadian dollars) |
54,140 | 30,000 | ||||||
| Estimated usage |
71.2 | % | 40.3 | % | ||||
| Floor level (Canadian dollars per $1 U.S. dollar) |
1.2500 | 1.2614 | ||||||
| Cap level (Canadian dollars per $1 U.S. dollar) |
1.3348 | 1.3710 | ||||||
For the year ended December 31, 2018, we had a mark-to-market gain of $1.6 million (2017 - gain of $0.4 million) on outstanding hedges recognized in other comprehensive income.
| SSR Mining Inc.
|
MD&A Year-End 2018 | 29
| |
A 10% increase or decrease in the U.S. dollar exchange rate, as at December 31, 2018 and December 31, 2017, on financial assets and liabilities denominated in the following currencies, with all other variables held constant, would have resulted in the following impact to our total comprehensive income for the years ended December 31, 2018 and December 31, 2017, respectively:
| 2018
$000s |
2017
$000s | |||||||
| Canadian dollar |
1,084 | 701 | ||||||
| Argentine peso |
715 | 1,460 | ||||||
(iii) Interest Rate Risk
Interest rate risk is the risk that the fair values or future cash flows of our financial instruments will fluctuate because of changes in market interest rates. Interest rate risk arises from the interest rate impact on our cash and cash equivalents and our moratorium liability because these are the only financial instruments we hold that are impacted by interest based on variable market interest rates. The Notes have a fixed interest rate and are not exposed to fluctuations in interest rates. A change in interest rates would impact the fair value of the Notes, but because we record the Notes at amortized cost, there would be no impact on our financial results. We monitor our exposure to interest rates closely and have not entered into any derivative contracts to manage our risk.
The resolution of the moratorium in Argentina in 2017 increased our exposure to this risk as the outstanding liability incurs interest based on variable rates with a floor of 1.5% per month.
As at December 31, 2018, the weighted average interest rate earned on our cash and cash equivalents was 2.4% (December 31, 2017 - 0.97%). With other variables unchanged, a 1% change in the annualized interest rate would impact after-tax net income by $3.4 million (2017 - $2.4 million).
| a) | Credit Risk |
Credit risk is the risk that a third party might fail to discharge its obligations under the terms of a financial contract. Our credit risk is limited to the following instruments:
(i) Credit risk related to financial institutions and cash deposits
Under our investment policy, investments are made only in highly-rated financial institutions and corporate and government securities. We diversify our holdings and consider the risk of loss associated with investments to be low.
(ii) Credit risk related to trade receivables
We are exposed to credit risk through our trade receivables on concentrate sales, which are principally with internationally-recognized counterparties. Payments of receivables are scheduled, routine and received within a contractually agreed time frame. We manage this risk by requiring provisional payments of at least 75% of the value of the concentrate shipped and through utilizing multiple counterparties.
(iii) Credit risk related to other financial assets
Our credit risk with respect to other financial assets includes deferred consideration following the sales of various mineral properties. We have security related to these payments in the event of default.
We also have credit risk through our significant VAT receivables and Puna credits balance that is collectible from the government of Argentina. The balance is expected to be recoverable in full, however due to legislative rules and the complex collection process, a significant portion of the asset is classified as non-current until government approval of the recovery claim is approved.
| SSR Mining Inc.
|
MD&A Year-End 2018 | 30
| |
Our maximum exposure to credit risk as at December 31, 2018 and December 31, 2017 was as follows:
| December 31, 2018 | December 31, 2017 | |||||||
| $000s | $000s | |||||||
| Cash and cash equivalents |
419,212 | 459,864 | ||||||
| Value added tax receivable |
18,802 | 13,755 | ||||||
| Trade and other receivables |
11,287 | 14,848 | ||||||
| Other financial assets |
37,097 | 22,399 | ||||||
| 486,398 | 510,866 | |||||||
At December 31, 2018, no amounts were held as collateral except those discussed above related to other financial assets.
| b) | Liquidity Risk |
Liquidity risk is the risk that we will not be able to meet our obligations under our financial instruments as they fall due. We manage our liquidity risk through a rigorous planning and budgeting process, which is reviewed and updated on a regular basis, to help determine the funding requirements to support our current operations, expansion and development plans, and by managing our capital structure as described in Note 24(d) of our consolidated financial statements for the year ended December 31, 2018. Our objective is to ensure that there are sufficient committed financial resources to meet our business requirements for a minimum of twelve months.
To supplement corporate liquidity we have a Credit Facility of which we utilized $8.0 million (December 31, 2017 - $7.7 million) to secure certain letters of credit.
In addition, we use surety bonds to support certain environmental bonding obligations. As at December 31, 2018, we had surety bonds totaling $54.1 million outstanding (December 31, 2017 - $61.2 million).
A detailed discussion of our liquidity position is included in Section 6 and the maturity profile of financial liabilities presenting contractual undiscounted cash flows as at December 31, 2018, is included in Note 24 (c) in our consolidated financial statements for the year ended December 31, 2018.
In our opinion, working capital at December 31, 2018 together with future cash flows from operations are sufficient to support our commitments through 2019.
| 9. | RISKS AND UNCERTAINTIES |
The mining industry involves many risks which are inherent to the nature of the business, global economic trends and economic, environmental and social conditions in the geographical areas of operation. As a result, we are subject to a number of risks and uncertainties, each of which could have an adverse effect on our operating results, business prospects or financial position. We continuously assess and evaluate these risks and minimize them by implementing high operating standards and processes to identify, assess, report and monitor risks across our organization.
For a comprehensive list of other risks and uncertainties affecting our business, please refer to the section entitled “Risk Factors” in our most recent Annual Information Form, which is available at www.sedar.com, and our most recent Annual Report on Form 40-F, which is available on the EDGAR section of the SEC website at www.sec.gov.
There has been no significant change in our risks and uncertainties.
| 10. | NON-GAAP FINANCIAL MEASURES |
The non-GAAP financial measures presented do not have any standardized meaning prescribed by IFRS and are therefore unlikely to be directly comparable to similar measures presented by other issuers. The data presented is intended to provide additional information and should not be considered in isolation or as a substitute for measures of performance prepared in accordance with IFRS. These non-GAAP measures should be read in conjunction with our consolidated financial statements.
| SSR Mining Inc.
|
MD&A Year-End 2018 | 31
| |
Non-GAAP financial measures - Cash costs and AISC per payable ounce of precious metals sold
We use the non-GAAP financial measures of cash costs and AISC per payable ounce of precious metals sold to manage and evaluate operating performance. We believe that, in addition to conventional measures prepared in accordance with GAAP, certain investors use this information to evaluate our performance and ability to generate cash flows. Cash costs per ounce metrics, net of by-product credits, are also used in our internal decision making processes. Accordingly, the data presented is intended to provide additional information and should not be considered in isolation or as a substitute for measures of performance prepared in accordance with GAAP.
In line with the guidance published by the World Gold Council, AISC reflect the full cost of operating our consolidated business as they include the cost of replacing ounces through exploration, cost of sustaining capital and general and administrative expenses. Expansionary capital is not included in this measure.
The following table provides a reconciliation of our condensed consolidated interim and annual statements of income to cash costs and AISC per payable ounce of precious metals sold for the three and twelve month periods indicated below:
| SSR Mining Inc.
|
MD&A Year-End 2018 | 32
| |
| Q4 | Q3 | Q2 | Q1 | Total | Total | |||||||||||||||||||
| 2018 | 2018 | 2018 | 2018 | 2018 | 2017 | |||||||||||||||||||
| $000s | $000s | $000s | $000s | $000s | $000s | |||||||||||||||||||
| Marigold mine |
||||||||||||||||||||||||
| Cost of sales (A) |
51,884 | 58,594 | 46,082 | 43,568 | 200,128 | 184,159 | ||||||||||||||||||
| Add: Treatment and refining costs |
78 | 58 | 122 | 114 | 372 | 347 | ||||||||||||||||||
| Less: By-product revenue |
(11 | ) | (13 | ) | (24 | ) | (16 | ) | (64 | ) | (50 | ) | ||||||||||||
| Less: Depreciation, depletion and amortization |
(13,571 | ) | (16,266 | ) | (13,539 | ) | (13,372 | ) | (56,748 | ) | (54,983 | ) | ||||||||||||
| Cash costs |
38,380 | 42,373 | 32,641 | 30,294 | 143,688 | 129,473 | ||||||||||||||||||
| Sustaining capital expenditure |
8,328 | 9,343 | 8,626 | 4,665 | 30,962 | 20,364 | ||||||||||||||||||
| Exploration and evaluation costs (sustaining) |
2,096 | 2,956 | 3,243 | 1,914 | 10,209 | 4,917 | ||||||||||||||||||
| Reclamation cost |
253 | 309 | 376 | 358 | 1,296 | 1,604 | ||||||||||||||||||
| Capitalized stripping costs |
1,208 | 2,529 | 850 | 2,902 | 7,489 | 22,863 | ||||||||||||||||||
| AISC |
50,265 | 57,510 | 45,736 | 40,133 | 193,644 | 179,221 | ||||||||||||||||||
| Seabee Gold Operation |
||||||||||||||||||||||||
| Cost of sales (B) |
19,544 | 24,208 | 21,003 | 20,117 | 84,872 | 92,690 | ||||||||||||||||||
| Add: Treatment and refining costs |
46 | 40 | 41 | 39 | 166 | 131 | ||||||||||||||||||
| Less: By-product revenue |
(10 | ) | (12 | ) | (8 | ) | (16 | ) | (46 | ) | (39 | ) | ||||||||||||
| Less: Inventory provision |
— | — | — | — | — | (632 | ) | |||||||||||||||||
| Less: Depreciation, depletion and amortization |
(8,678 | ) | (11,216 | ) | (8,411 | ) | (10,513 | ) | (38,818 | ) | (40,375 | ) | ||||||||||||
| Cash costs |
10,902 | 13,020 | 12,625 | 9,627 | 46,174 | 51,775 | ||||||||||||||||||
| Sustaining capital expenditure |
624 | 968 | 1,035 | 4,426 | 7,053 | 7,190 | ||||||||||||||||||
| Capitalized development |
2,910 | 1,812 | 2,069 | 2,283 | 9,074 | 8,295 | ||||||||||||||||||
| Exploration and evaluation costs (sustaining) |
1,646 | 1,557 | 1,749 | 1,551 | 6,503 | 5,071 | ||||||||||||||||||
| Reclamation cost |
34 | 33 | 34 | 34 | 135 | 200 | ||||||||||||||||||
| AISC |
16,116 | 17,390 | 17,512 | 17,921 | 68,939 | 72,531 | ||||||||||||||||||
| Puna Operations (1) |
||||||||||||||||||||||||
| Cost of sales (C) |
15,749 | 10,355 | 15,740 | 16,986 | 58,830 | 58,661 | ||||||||||||||||||
| Add: Treatment and refining costs |
807 | 820 | 1,228 | 1,522 | 4,377 | 13,092 | ||||||||||||||||||
| Add: Gain on moratorium settlement |
— | — | — | — | 4,303 | |||||||||||||||||||
| Less: By-product revenue |
(2,719 | ) | (360 | ) | — | — | (3,079 | ) | (56 | ) | ||||||||||||||
| Add: Inventory reversal |
— | — | — | — | — | 6,342 | ||||||||||||||||||
| Less: Restructuring costs |
— | — | — | — | — | (109 | ) | |||||||||||||||||
| Less: Depreciation, depletion and amortization |
(752 | ) | (478 | ) | (870 | ) | (1,053 | ) | (3,153 | ) | (7,058 | ) | ||||||||||||
| Cash costs |
13,085 | 10,337 | 16,098 | 17,455 | 56,975 | 75,175 | ||||||||||||||||||
| Sustaining capital expenditure |
3,849 | 2,390 | 2,652 | 789 | 9,680 | 4,604 | ||||||||||||||||||
| Reclamation cost |
888 | 567 | 553 | 540 | 2,548 | 2,489 | ||||||||||||||||||
| AISC |
17,822 | 13,294 | 19,303 | 18,784 | 69,203 | 82,268 | ||||||||||||||||||
| Cost of sales, per consolidated statement of (loss) income (A+B+C) |
87,177 | 93,157 | 82,825 | 80,671 | 343,830 | 335,510 | ||||||||||||||||||
| AISC (total for all mines) |
84,203 | 88,194 | 82,551 | 76,838 | 331,786 | 334,020 | ||||||||||||||||||
| General and administrative costs |
12,108 | 5,985 | 8,179 | 6,669 | 32,941 | 20,307 | ||||||||||||||||||
| Consolidated AISC |
96,311 | 94,179 | 90,730 | 83,507 | 364,727 | 354,327 | ||||||||||||||||||
| SSR Mining Inc.
|
MD&A Year-End 2018 | 33
| |
| Q4 | Q3 | Q2 | Q1 | Total | Total | |||||||||||||||||||
| 2018 | 2018 | 2018 | 2018 | 2018 | 2017 | |||||||||||||||||||
| $000s | $000s | $000s | $000s | $000s | $000s | |||||||||||||||||||
| Marigold mine | ||||||||||||||||||||||||
| Payable ounces of gold sold (oz) | 50,524 | 59,583 | 46,618 | 42,055 | 198,780 | 200,094 | ||||||||||||||||||
| Cash costs per gold ounce sold ($/oz) | 760 | 711 | 700 | 720 | 723 | 647 | ||||||||||||||||||
| AISC per gold ounce sold ($/oz) | 995 | 965 | 981 | 954 | 974 | 896 | ||||||||||||||||||
| Seabee Gold Operation | ||||||||||||||||||||||||
| Payable ounces of gold sold (oz) | 21,700 | 29,160 | 20,500 | 20,000 | 91,360 | 86,050 | ||||||||||||||||||
| Cash costs per gold ounce sold ($/oz) | 502 | 447 | 616 | 481 | 505 | 602 | ||||||||||||||||||
| AISC per gold ounce sold ($/oz) | 743 | 596 | 854 | 896 | 755 | 843 | ||||||||||||||||||
| Puna Operations (1) | ||||||||||||||||||||||||
| Payable ounces of silver sold (oz) | 871,303 | 593,739 | 1,092,778 | 1,022,275 | 3,580,095 | 5,753,459 | ||||||||||||||||||
| Cash costs per silver ounce sold ($/oz) | 15.02 | 17.41 | 14.73 | 17.07 | 15.91 | 13.07 | ||||||||||||||||||
| AISC per silver ounce sold ($/oz) | 20.45 | 22.39 | 17.66 | 18.37 | 19.33 | 14.30 | ||||||||||||||||||
| Realized gold price ($/oz) | 1,230 | 1,208 | 1,304 | 1,334 | 1,263 | 1,255 | ||||||||||||||||||
| Realized silver price ($/oz) | 14.42 | 15.45 | 16.49 | 16.79 | 15.92 | 17.10 | ||||||||||||||||||
| Precious metals equivalency | ||||||||||||||||||||||||
| Total cash costs (for all metals) | 62,367 | 65,730 | 61,364 | 57,376 | 246,837 | 256,423 | ||||||||||||||||||
| Equivalent payable gold ounces sold (2) | 82,439 | 96,337 | 80,937 | 74,922 | 335,267 | 364,538 | ||||||||||||||||||
| Cash costs per equivalent gold ounce sold ($/oz) | 757 | 682 | 758 | 766 | 736 | 703 | ||||||||||||||||||
| Consolidated AISC per equivalent gold ounce sold ($/oz) | 1,168 | 978 | 1,121 | 1,115 | 1,088 | 972 | ||||||||||||||||||
| (1) | The data presented for Puna Operations is reported on a 100% basis. |
| (2) | Gold equivalent ounces have been established using realized metal prices per payable ounce of precious metal sold in the period and applied to the recovered metal content of the gold and silver sold by the Marigold mine, the Seabee Gold Operation and Puna Operations. We have not included zinc and lead as they are considered a by-product. |
Non-GAAP financial measures - realized metal prices
Average realized price per ounce of silver sold in each reporting period excludes the period-end price adjustments and final settlements on concentrate shipments. These price adjustments do not apply to gold bullion sales.
Non-GAAP financial measure - working capital
Working capital is a non-GAAP measure calculated as current assets less current liabilities. Working capital does not have any standardized meaning prescribed by GAAP and is therefore unlikely to be comparable to similar measures presented by other companies.
Non-GAAP financial measure - gross margin from mine operations
Gross margin from mine operations is a non-GAAP measure calculated as the difference between revenue and cost of sales, divided by revenue, expressed as a percentage.
| SSR Mining Inc.
|
MD&A Year-End 2018 | 34
| |
Non-GAAP financial measures - adjusted attributable net income
We have included the non-GAAP financial performance measures of adjusted attributable income before tax, adjusted attributable income tax (expense), adjusted attributable net income and adjusted basic attributable income per share. Adjusted net income excludes gains/losses and other costs incurred for acquisitions and disposals of mineral properties and exploration and evaluation assets, impairment charges and reversals, unrealized and realized gains/losses on financial instruments, significant non-cash foreign exchange impacts as well as other significant non-cash, non-recurring items. We exclude these items from net income to provide a measure which allows investors to evaluate the operating results of our underlying core operations and our ability to generate liquidity through operating cash flow to fund working capital requirements, future capital expenditures and service outstanding debt. We believe that, in addition to conventional measures prepared in accordance with GAAP, certain investors may use this information to evaluate our performance. Accordingly, the data presented is intended to provide additional information and should not be considered in isolation or as a substitute for measures of performance prepared in accordance with GAAP.
The following table provides a reconciliation of adjusted net income to the consolidated financial statements:
| Year ended December 31, | ||||||||
| 2018 | 2017 | |||||||
| $000’s | $000’s | |||||||
| Income before tax per consolidated statements of (loss) income |
8,090 | 74,587 | ||||||
| Non-controlling interest |
6,410 | (2,150 | ) | |||||
| Income before tax attributable to our shareholders |
14,500 | 72,437 | ||||||
| Adjusted for: |
||||||||
| Non-cash finance income and expense |
15,252 | 15,666 | ||||||
| Write down of fixed assets |
2,749 | — | ||||||
| Expense related to the premium paid for shares of SilverCrest over the prevailing market price |
2,782 | — | ||||||
| Non-cash foreign exchange gain |
(11,862 | ) | (9,327 | ) | ||||
| Adjustment to CDRP provision |
(1,580 | ) | — | |||||
| Write-down (reversal) of VAT and inventory to NRV |
— | (5,710 | ) | |||||
| Impairment reversal |
— | (24,357 | ) | |||||
| Effect of resolution of export duty settlement |
— | (4,303 | ) | |||||
| Restructuring costs |
— | 109 | ||||||
| Other items |
6,745 | 1,766 | ||||||
| Adjusted attributable income before tax |
28,586 | 46,281 | ||||||
| Income tax (expense), per consolidated statement of (loss) income |
(8,121 | ) | (3,121 | ) | ||||
| Initial recognition of deferred tax in Argentina |
2,649 | — | ||||||
| Tax impact of SilverCrest acquisition |
(376 | ) | — | |||||
| Deferred tax on sale of mineral properties |
— | 811 | ||||||
| Change in prior period adjustments |
662 | 712 | ||||||
| Change in tax rate |
(127 | ) | (5,689 | ) | ||||
| Argentina restructuring |
4,712 | — | ||||||
| Other items |
(24 | ) | 1,080 | |||||
| Adjusted attributable income tax expense |
(625 | ) | (6,207 | ) | ||||
| Adjusted attributable net income |
27,961 | 40,074 | ||||||
| Weighted average shares outstanding (000’s) |
120,137 | 119,593 | ||||||
| Adjusted basic attributable income per share ($) |
0.23 | 0.34 | ||||||
| SSR Mining Inc.
|
MD&A Year-End 2018 | 35
| |
| Three months ended December 31, | ||||||||
| 2018 | 2017 | |||||||
| $000’s
|
$000’s
| |||||||
| (Loss) Income before tax per consolidated statements of (loss) income |
(7,559 | ) | 13,936 | |||||
| Non-controlling interest |
(942 | ) | (968 | ) | ||||
| Income before tax attributable to our shareholders |
(8,501 | ) | 12,968 | |||||
| Adjusted for: |
||||||||
| Non-cash finance income and expense |
3,745 | 4,303 | ||||||
| Expense related to the premium paid for shares of SilverCrest over the prevailing market price |
2,782 | — | ||||||
| Adjustment to CDRP provision |
(1,580 | ) | — | |||||
| Non-cash foreign exchange (gain) loss |
745 | (2,967 | ) | |||||
| Restructuring costs |
— | 695 | ||||||
| Reversal (write-down) of VAT and inventory to NRV |
— | (5,710 | ) | |||||
| Effect of revaluation of reclamation provision |
— | (3,437 | ) | |||||
| Other items |
2,464 | (2,310 | ) | |||||
| Adjusted attributable income before tax |
(345 | ) | 3,542 | |||||
| Income tax recovery |
5,015 | 2,914 | ||||||
| Tax impact of SilverCrest acquisition |
(376 | ) | — | |||||
| Deferred tax on sale of mineral properties |
— | (1,096 | ) | |||||
| Change in prior period estimates |
116 | 352 | ||||||
| Change in tax rate |
— | (3,647 | ) | |||||
| Argentina restructuring |
(16 | ) | — | |||||
| Other items |
(25 | ) | 797 | |||||
| Adjusted attributable income tax recovery (expense) |
4,714 | (680 | ) | |||||
| Adjusted attributable net income |
4,369 | 2,862 | ||||||
| Weighted average shares outstanding (000’s) |
120,351 | 119,832 | ||||||
| Adjusted basic attributable income per share ($) |
0.04 | 0.02 | ||||||
| 11. | CRITICAL ACCOUNTING POLICIES AND ESTIMATES |
| Basis | of preparation and accounting policies |
Our consolidated financial statements have been prepared in accordance with IFRS as issued by the IASB and interpretations issued by the International Financial Reporting Interpretations Committee (“IFRIC”). Note 2 of our consolidated financial statements for the year ended December 31, 2018, provides details of the significant accounting policies and accounting policy decisions for significant or potentially significant areas that have had an impact on our financial statements or may have an impact in future periods. The impact of future accounting changes is disclosed in note 2(w) to our consolidated financial statements.
Critical accounting estimates and judgments
The preparation of financial statements in conformity with IFRS requires the use of judgments and/or estimates that affect the amounts reported and disclosed in the consolidated financial statements and related notes. Critical accounting estimates represent estimates that are uncertain and for which changes in those estimates could materially impact our consolidated financial statements. Areas of judgment and key sources of estimation uncertainty that have the most significant effect are disclosed in Note 2(u) of our consolidated financial statements for the year ended December 31, 2018.
| SSR Mining Inc.
|
MD&A Year-End 2018 | 36
| |
| 12. | INTERNAL CONTROL OVER FINANCIAL REPORTING AND DISCLOSURE CONTROLS AND PROCEDURES |
Disclosure Controls and Procedures
Our management, with the participation of the President and Chief Executive Officer and Chief Financial Officer, has evaluated the effectiveness of our disclosure controls and procedures. Based upon the results of that evaluation, the President and Chief Executive Officer and Chief Financial Officer have concluded that, as of the end of the period covered by this MD&A, our disclosure controls and procedures were effective to provide reasonable assurance that the information required to be disclosed by us in the reports that we file is recorded, processed, summarized and reported, within the appropriate time periods and is accumulated and communicated to management, including the President and Chief Executive Officer and Chief Financial Officer, as appropriate to allow timely decisions regarding required disclosure.
Internal Control Over Financial Reporting
Our management, with the participation of the President and Chief Executive Officer and Chief Financial Officer, is responsible for establishing and maintaining adequate internal control over financial reporting. Under the supervision of the President and Chief Executive Officer and Chief Financial Officer, our internal control over financial reporting is a process designed to provide reasonable assurance regarding the reliability of financial reporting and the preparation of financial statements for external purposes in accordance with IFRS. Our internal control over financial reporting includes policies and procedures that:
| • | pertain to maintenance of records that accurately and fairly reflect, in reasonable detail, the transactions and dispositions of assets; |
| • | provide reasonable assurance that transactions are recorded as necessary to permit preparation of financial statements in accordance with IFRS and that our receipts and expenditures are made only in accordance with authorizations of management and our Board of Directors; and |
| • | provide reasonable assurance regarding prevention or timely detection of unauthorized acquisition, use, or disposition of our assets that could have a material effect on our consolidated financial statements. |
There has been no change in our internal control over financial reporting during the year ended December 31, 2018, other than the formation of the Puna Operations joint venture, which has not materially affected, or is reasonably not likely to materially affect, our internal control over financial reporting.
Management has assessed the effectiveness of our internal control over financial reporting as of December 31, 2018. In making this assessment, management used the criteria established in Internal Control - Integrated Framework (2013) issued by the Committee of Sponsoring Organizations of the Treadway Commission. Based on this evaluation, management concluded that our internal control over financial reporting was effective as of December 31, 2018.
The effectiveness of our internal control over financial reporting, as of December 31, 2018, has been audited by PricewaterhouseCoopers LLP, who also audited our consolidated financial statements as of and for the years ended December 31, 2018, and 2017, as stated in its report which accompanies our consolidated financial statements.
Limitations of Controls and Procedures
Our management, including the President and Chief Executive Officer and Chief Financial Officer, believes that any disclosure controls and procedures or internal control over financial reporting, no matter how well conceived and operated can provide only reasonable, not absolute, assurance that the objectives of the control system are met. Further, the design of a control system must reflect the fact that there are resource constraints, and the benefits of controls must be considered relative to their costs. Because of the inherent limitations in all control systems, they cannot provide absolute assurance that all control issues and instances of fraud, if any, within our organization have been prevented or detected. These inherent limitations include the realities that judgments in decision-making can be faulty, and that breakdowns can occur because of simple error or mistake. Additionally, controls can be circumvented by the individual acts of some persons, by collusion of two or more people, or by unauthorized override of the control. The design of any control system also is based in part upon certain assumptions about the likelihood of future events, and there can be no assurance that any design will succeed in achieving its stated goals under all potential future conditions. Accordingly, because of the inherent limitations in a cost effective control system, misstatements due to error or fraud may occur and not be detected.
| SSR Mining Inc.
|
MD&A Year-End 2018 | 37
| |
| 13. | CAUTIONARY NOTES REGARDING FORWARD-LOOKING STATEMENTS AND MINERAL RESERVE AND MINERAL RESOURCE ESTIMATES |
Cautionary Note Regarding Forward-Looking Statements
This MD&A contains forward-looking information within the meaning of Canadian securities laws and forward-looking statements within the meaning of the U.S. Private Securities Litigation Reform Act of 1995 (collectively, “forward-looking statements”). All statements, other than statements of historical fact, are forward-looking statements.
Generally, forward-looking statements can be identified by the use of words or phrases such as “expects,” “anticipates,” “plans,” “projects,” “estimates,” “assumes,” “intends,” “strategy,” “goals,” “objectives,” “potential,” “believes,” or variations thereof, or stating that certain actions, events or results “may,” “could,” “would,” “might” or “will” be taken, occur or be achieved, or the negative of any of these terms or similar expressions. The forward-looking statements in this MD&A relate to, among other things: future production of gold, silver and other metals; timing of production; future costs of inventory, cash costs and AISC per payable ounce of gold, silver and other metals sold; expected exploration and development expenditures; the prices of gold, silver and other metals; our ability to discover new areas of mineralization, to convert Inferred Mineral Resources to Indicated Mineral Resources, to expand Mineral Reserves and to convert Mineral Resources into Mineral Reserves; the timing and extent of capital investment at our operations; the timing and extent of capitalized stripping at our operations; our cash position remaining strong for 2019 growth and beyond; the expansion of the Seabee Gold Operation based on the results of the 2017 Technical Report, including the increase of mining and milling rates; the expansion of tailings at the Seabee Gold Operation, the timing and capacity thereof, and such capacity being in excess of that contemplated under the 2017 Technical Report, the anticipated effect of equipment purchases at the Marigold mine on future production; the construction of a leach pad at the Marigold mine, and the timing and effects thereof; only waste material being mined over certain periods of 2019 at Chinchillas with ore stockpiled during the pre-production phase being transported and processed at the Pirquitas mill; the completion of certain Chinchillas project infrastructure, the timing thereof and such remaining on budget; the prices of lead and zinc having a more significant impact in 2019 with the Chinchillas project reaching commercial production; anticipated community, development and holding costs; the investments made in the Marigold mine and the Seabee Gold Operation benefiting future periods; the expected high inflation rates in Argentina somewhat offsetting the benefits of the devaluation of the currency; the VAT receivable and Puna credits balance being expected to be recoverable in full; current capital resources being sufficient to carry out exploration plans and to support operations through the current operating period; movements in gold prices not impacting the value of any financial instruments; estimated production rates for gold, silver and other metals produced by us; the estimated cost of sustaining capital; ongoing or future development plans and capital replacement; estimates of expected or anticipated economic returns from our mining projects, including future sales of metals, concentrate or other products produced by us and the timing thereof; and our plans and expectations for our properties and operations.
These forward-looking statements are subject to a variety of known and unknown risks, uncertainties and other factors that could cause actual events or results to differ from those expressed or implied, including, without limitation, the following: uncertainty of production, development plans and cost estimates for the Marigold mine, the Seabee Gold Operation, Puna Operations and our projects; our ability to replace Mineral Reserves; our ability to obtain necessary permits for the Chinchillas project; commodity price fluctuations; political or economic instability and unexpected regulatory changes; currency and interest rate fluctuations; the possibility of future losses; general economic conditions; fully realizing the value of our shareholdings in SilverCrest and our other marketable securities, due to changes in price, liquidity or disposal cost of such marketable securities; counterparty and market risks related to the sale of our concentrate and metals; uncertainty in the accuracy of Mineral Reserves and Mineral Resources estimates and in our ability to extract mineralization profitably; differences in U.S. and Canadian practices for reporting Mineral Reserves and Mineral Resources; lack of suitable infrastructure or damage to existing infrastructure; future development risks, including start-up delays and cost overruns; our ability to obtain adequate financing for further exploration and development programs and opportunities; uncertainty in acquiring additional commercially mineable mineral rights; delays in obtaining or failure to obtain governmental permits, or non-compliance with our permits; our ability to attract and retain qualified personnel and management; potential labour unrest, including labour actions by our unionized employees at Puna Operations; the impact of governmental regulations, including health, safety and environmental regulations, including increased costs
| SSR Mining Inc.
|
MD&A Year-End 2018 | 38
| |
and restrictions on operations due to compliance with such regulations; reclamation and closure requirements for our mineral properties; failure to effectively manage our tailings facilities; social and economic changes following closure of a mine, may lead to adverse impacts and unrest; unpredictable risks and hazards related to the development and operation of a mine or mineral property that are beyond our control; indigenous peoples’ title claims and rights to consultation and accommodation may affect our existing operations as well as development projects and future acquisitions; assessments by taxation authorities in multiple jurisdictions; recoverability of VAT and significant delays in the collection process in Argentina; claims and legal proceedings, including adverse rulings in litigation against us and/or our directors or officers; compliance with anti-corruption laws and internal controls, and increased regulatory compliance costs; complying with emerging climate change regulations and the impact of climate change, including extreme weather conditions; fully realizing our interest in deferred consideration received in connection with recent divestitures; uncertainties related to title to our mineral properties and the ability to obtain surface rights; the sufficiency of our insurance coverage; civil disobedience in the countries where our mineral properties are located; operational safety and security risks; actions required to be taken by us under human rights law; competition in the mining industry for mineral properties; our ability to complete and successfully integrate an announced acquisition; an event of default under our Notes may significantly reduce our liquidity and adversely affect our business; failure to meet covenants under our senior secured revolving credit facility; conflicts of interest that could arise from certain of our directors’ and officers’ involvement with other natural resource companies; information systems security threats; and those other various risks and uncertainties identified under the heading “Risk Factors” in our most recent Annual Information Form filed with the Canadian securities regulatory authorities and included in our most recent Annual Report on Form 40-F filed with the SEC.
This list is not exhaustive of the factors that may affect any of our forward-looking statements. Our forward-looking statements are based on what our management considers to be reasonable assumptions, beliefs, expectations and opinions based on the information currently available to it. Assumptions have been made regarding, among other things, our ability to carry on our exploration and development activities, our ability to meet our obligations under our property agreements, the timing and results of drilling programs, the discovery of Mineral Resources and Mineral Reserves on our mineral properties, the timely receipt of required approvals and permits, including those approvals and permits required for successful project permitting, construction and operation of our projects, the price of the minerals we produce, the costs of operating and exploration expenditures, our ability to operate in a safe, efficient and effective manner, our ability to obtain financing as and when required and on reasonable terms, our ability to continue operating the Marigold mine, the Seabee Gold Operation and Puna Operations, dilution and mining recovery assumptions, assumptions regarding stockpiles, the success of mining, processing, exploration and development activities, the accuracy of geological, mining and metallurgical estimates, no significant unanticipated operational or technical difficulties, maintaining good relations with the communities surrounding the Marigold mine, the Seabee Gold Operation and Puna Operations, no significant events or changes relating to regulatory, environmental, health and safety matters, certain tax matters and no significant and continuing adverse changes in general economic conditions or conditions in the financial markets (including commodity prices, foreign exchange rates and inflation rates). You are cautioned that the foregoing list is not exhaustive of all factors and assumptions which may have been used. We cannot assure you that actual events, performance or results will be consistent with these forward-looking statements, and management’s assumptions may prove to be incorrect. Our forward-looking statements reflect current expectations regarding future events and operating performance and speak only as of the date hereof and we do not assume any obligation to update forward-looking statements if circumstances or management’s beliefs, expectations or opinions should change other than as required by applicable law. For the reasons set forth above, you should not place undue reliance on forward-looking statements.
Qualified Persons
The scientific and technical information contained in this MD&A relating to the Marigold mine has been reviewed and approved by James Frost, P.E. and James N. Carver, each of whom is a SME Registered Member and a qualified person under National Instrument 43-101 - Standards of Disclosure for Mineral Projects (“NI 43-101”). Mr. Frost is our Technical Services Superintendent and Mr. Carver is our Chief Geologist at the Marigold mine. The scientific and technical information contained in this MD&A relating to the Seabee Gold Operation has been reviewed and approved by Cameron Chapman, P.Eng., and Jeffrey Kulas, P. Geo., each of whom is a qualified person under NI 43-101. Mr. Chapman is our General Manager and Mr. Kulas is our Manager Geology, Mining Operations at the Seabee Gold Operation. The scientific and technical information contained in this MD&A relating to Puna Operations has been reviewed and approved by Bruce Butcher, P.Eng. and F. Carl Edmunds, P. Geo., each of whom is a qualified person under NI 43-101. Mr. Butcher is our Director, Mine Planning and Mr. Edmunds is our Vice President Exploration.
| SSR Mining Inc.
|
MD&A Year-End 2018 | 39
| |
Cautionary Note Regarding Mineral Reserves and Mineral Resources Estimates
This MD&A includes Mineral Reserves and Mineral Resources classification terms that comply with reporting standards in Canada and the Mineral Reserves and the Mineral Resources estimates are made in accordance with NI 43-101. NI 43-101 is a rule developed by the Canadian Securities Administrators that establishes standards for all public disclosure an issuer makes of scientific and technical information concerning mineral projects. These standards differ significantly from the requirements of the SEC set out in SEC Industry Guide 7. Consequently, Mineral Reserves and Mineral Resources information included in this MD&A is not comparable to similar information that would generally be disclosed by domestic U.S. reporting companies subject to the reporting and disclosure requirements of the SEC. Under SEC standards, mineralization may not be classified as a “reserve” unless the determination has been made that the mineralization could be economically produced or extracted at the time the reserve determination is made.
In addition, the SEC’s disclosure standards normally do not permit the inclusion of information concerning “Measured Mineral Resources,” “Indicated Mineral Resources” or “Inferred Mineral Resources” or other descriptions of the amount of mineralization in mineral deposits that do not constitute “reserves” by U.S. standards in documents filed with the SEC. U.S. investors should understand that “Inferred Mineral Resources” have a great amount of uncertainty as to their existence and great uncertainty as to their economic and legal feasibility. Moreover, the requirements of NI 43-101 for identification of “reserves” are also not the same as those of the SEC, and reserves reported by us in compliance with NI 43-101 may not qualify as “reserves” under SEC standards. Accordingly, information concerning mineral deposits set forth herein may not be comparable with information made public by companies that report in accordance with U.S. standards.
| SSR Mining Inc. | MD&A Year-End 2018 | 40 |
CONSOLIDATED FINANCIAL STATEMENTS FOR THE YEARS ENDED
DECEMBER 31, 2018 AND 2017
| SSR Mining Inc. | Financial Statements Year-End 2018 | 1
|
Contents
| Financial Statements |
||
| Management’s Report |
3 | |
| Report of Independent Registered Public Accounting Firm |
4 | |
| Consolidated Statements of Financial Position |
6 | |
| Consolidated Statements of (Loss) Income |
7 | |
| Consolidated Statements of Comprehensive (Loss) Income |
8 | |
| Consolidated Statements of Changes in Shareholders’ Equity |
9 | |
| Consolidated Statements of Cash Flows |
10 | |
| Notes to the Consolidated Financial Statements |
||
| Note 1 – Nature of operations |
11 | |
| Note 2 – Summary of significant accounting policies |
11 | |
| Note 3 – Acquisitions and change in interest on mineral properties |
29 | |
| Statements of Financial Position |
||
| Note 4 – Cash and cash equivalents |
30 | |
| Note 5 – Trade and other receivables |
30 | |
| Note 6 – Marketable securities |
31 | |
| Note 7 – Inventory |
31 | |
| Note 8 – Other assets |
32 | |
| Note 9 – Property, plant and equipment |
33 | |
| Note 10 – Current and deferred income tax |
35 | |
| Note 11 – Value added tax receivable |
38 | |
| Note 12 – Trade and other payables |
39 | |
| Note 13 – Provisions |
39 | |
| Note 14 – Debt and credit facility |
40 | |
| Statements of Shareholders’ Equity |
||
| Note 15 – Share capital and share-based payments |
41 | |
| Note 16 – Other reserves and non-controlling interest |
45 | |
| Statements of Income |
||
| Note 17 – Revenue |
46 | |
| Note 18 – Operating costs by nature |
46 | |
| Note 19 – Finance income and expenses |
47 | |
| Note 20 – Other (expenses) income |
48 | |
| Note 21 – (Loss) income per share |
48 | |
| Additional Disclosures |
||
| Note 22 – Operating segments |
49 | |
| Note 23 – Financial instruments and fair value measurements |
52 | |
| Note 24 – Financial risk management |
54 | |
| Note 25 – Related party transactions |
61 | |
| Note 26 – Supplemental cash flow information |
61 | |
| SSR Mining Inc. | Financial Statements Year-End 2018 | 2
|
Management’s Report
SSR Mining Inc.
Management’s Responsibility for the Financial Statements
The preparation and presentation of the accompanying consolidated financial statements and Management’s Discussion and Analysis (“MD&A”) are the responsibility of management and have been approved by the Board of Directors.
The consolidated financial statements have been prepared in accordance with International Financial Reporting Standards as issued by the International Accounting Standards Board. Financial statements, by nature, are not precise since they include certain amounts based upon estimates and judgments. When alternative methods exist, management has chosen those it deems to be the most appropriate in the circumstances.
Management, under the supervision of and the participation of the Chief Executive Officer and the Chief Financial Officer, has a process in place to evaluate disclosure controls and procedures and internal control over financial reporting as required by Canadian and U.S. securities regulations. We, as Chief Executive Officer and as Chief Financial Officer, will certify our annual filings with the Canadian Securities Administrators and the Securities and Exchange Commission as required in Canada by National Instrument 52-109 and in the United States as required by the Sarbanes-Oxley Act of 2002.
The Board of Directors is responsible for ensuring that management fulfills its responsibilities for financial reporting and is ultimately responsible for reviewing and approving the consolidated financial statements. The Board carries out this responsibility principally through its Audit Committee which is independent from management.
The Audit Committee is appointed by the Board of Directors and reviews the consolidated financial statements and MD&A; considers the report of the external auditors; assesses the adequacy of our internal controls, including management’s assessment described below; examines the fees and expenses for audit services; and recommends to the Board the independent auditors for appointment by the shareholders. The independent auditors have full and free access to the Audit Committee and meet with it to discuss their audit work, our internal control over financial reporting and financial reporting matters. The Audit Committee reports its findings to the Board for consideration when approving the consolidated financial statements for issuance to the shareholders and management’s assessment of the internal control over financial reporting.
Management’s Report on Internal Control over Financial Reporting
Management has assessed the effectiveness of our internal control over financial reporting as of December 31, 2018. In making this assessment, management used the criteria established in Internal Control - Integrated Framework (2013) issued by the Committee of Sponsoring Organizations of the Treadway Commission. Based on this evaluation, management concluded that our internal control over financial reporting was effective as of December 31, 2018.
PricewaterhouseCoopers LLP, our auditor, has audited the effectiveness of our internal control over financial reporting as of December 31, 2018, as stated in their report which appears herein.
| “Paul Benson” | “Gregory Martin” | |
| Paul Benson | Gregory Martin | |
| President and Chief Executive Officer | Senior Vice President and Chief Financial Officer | |
| February 21, 2019 | ||
| SSR Mining Inc. | Financial Statements Year-End 2018 | 3
|
Report of Independent Registered Public Accounting Firm
SSR Mining Inc.
To the Shareholders and Board of Directors of SSR Mining Inc.
Opinions on the Financial Statements and Internal Control over Financial Reporting
We have audited the accompanying consolidated statements of financial position of SSR Mining Inc. and its subsidiaries (together, the Company) as of December 31, 2018 and 2017, and the related consolidated statements of (loss) income, comprehensive (loss) income, changes in shareholders’ equity and cash flows for the years then ended, including the related notes (collectively referred to as the consolidated financial statements). We also have audited the Company’s internal control over financial reporting as of December 31, 2018, based on criteria established in Internal Control - Integrated Framework (2013) issued by the Committee of Sponsoring Organizations of the Treadway Commission (COSO).
In our opinion, the consolidated financial statements referred to above present fairly, in all material respects, the financial position of the Company as of December 31, 2018 and 2017, and their financial performance and their cash flows for the years then ended in conformity with International Financial Reporting Standards as issued by the International Accounting Standards Board (IFRS). Also in our opinion, the Company maintained, in all material respects, effective internal control over financial reporting as of December 31, 2018, based on criteria established in Internal Control – Integrated Framework (2013) issued by the COSO.
Basis for opinions
The Company’s management is responsible for these consolidated financial statements, for maintaining effective internal control over financial reporting, and for its assessment of the effectiveness of internal control over financial reporting, included in the accompanying Management’s Report on Internal Control over Financial Reporting. Our responsibility is to express opinions on the Company’s consolidated financial statements and on the Company’s internal control over financial reporting based on our audits. We are a public accounting firm registered with the Public Company Accounting Oversight Board (United States) (PCAOB) and are required to be independent with respect to the Company in accordance with the U.S. federal securities laws and the applicable rules and regulations of the Securities and Exchange Commission and the PCAOB.
We conducted our audits in accordance with the standards of the PCAOB. Those standards require that we plan and perform the audits to obtain reasonable assurance about whether the consolidated financial statements are free of material misstatement, whether due to error or fraud, and whether effective internal control over financial reporting was maintained in all material respects.
Our audits of the consolidated financial statements included performing procedures to assess the risks of material misstatement of the consolidated financial statements, whether due to error or fraud, and performing procedures that respond to those risks. Such procedures included examining, on a test basis, evidence regarding the amounts and disclosures in the consolidated financial statements. Our audits also included evaluating the accounting principles used and significant estimates made by management, as well as evaluating the overall presentation of the consolidated financial statements. Our audit of internal control over financial reporting included obtaining an understanding of internal control over financial reporting, assessing the risk that a material weakness exists, and testing and evaluating the design and operating effectiveness of internal control based on the assessed risk. Our audits also included performing such other procedures as we considered necessary in the circumstances. We believe that our audits provide a reasonable basis for our opinions.
Definition and limitations of internal control over financial reporting
A company’s internal control over financial reporting is a process designed to provide reasonable assurance regarding the reliability of financial reporting and the preparation of financial statements for external purposes in accordance with generally accepted accounting principles. A company’s internal control over financial reporting includes those policies and procedures that (i) pertain to the maintenance of records that, in reasonable detail, accurately and fairly reflect the transactions and dispositions of the assets of the company; (ii) provide reasonable assurance that transactions are recorded as necessary to permit preparation of financial statements in accordance with generally accepted accounting principles, and that receipts and
| SSR Mining Inc. | Financial Statements Year-End 2018 | 4
|
Report of Independent Registered Public Accounting Firm
SSR Mining Inc.
expenditures of the company are being made only in accordance with authorizations of management and directors of the company; and (iii) provide reasonable assurance regarding prevention or timely detection of unauthorized acquisition, use, or disposition of the company’s assets that could have a material effect on the financial statements.
Because of its inherent limitations, internal control over financial reporting may not prevent or detect misstatements. Also, projections of any evaluation of effectiveness to future periods are subject to the risk that controls may become inadequate because of changes in conditions, or that the degree of compliance with the policies or procedures may deteriorate.
(Signed) “PricewaterhouseCoopers LLP”
Chartered Professional Accountants
Vancouver, Canada
February 21, 2019
We have served as the company’s auditor since 1989.
| SSR Mining Inc. | Financial Statements Year-End 2018 | 5
|
Consolidated Statements of Financial Position
SSR Mining Inc.
(expressed in thousands of United States dollars)
| December 31 | December 31 | |||||||||
| 2018 | 2017 | |||||||||
| Note | $ | $ | ||||||||
| Current assets |
||||||||||
| Cash and cash equivalents |
4 | 419,212 | 459,864 | |||||||
| Trade and other receivables |
5 | 42,841 | 38,052 | |||||||
| Marketable securities |
6 | 29,542 | 114,001 | |||||||
| Inventory |
7 | 232,748 | 182,581 | |||||||
| Other |
8 | 8,776 | 5,099 | |||||||
|
|
|
|
|
|||||||
| 733,119 | 799,597 | |||||||||
| Non-current assets |
||||||||||
| Property, plant and equipment |
9 | 701,175 | 658,629 | |||||||
| Deferred income tax assets |
10 | 7,523 | — | |||||||
| Goodwill |
3 | 49,786 | 49,786 | |||||||
| Other |
8 | 29,535 | 29,442 | |||||||
|
|
|
|
|
|||||||
| Total assets |
1,521,138 | 1,537,454 | ||||||||
|
|
|
|
|
|||||||
| Current liabilities |
||||||||||
| Trade and other payables |
12 | 78,466 | 60,153 | |||||||
| Provisions |
13 | 4,788 | 11,313 | |||||||
|
|
|
|
|
|||||||
| 83,254 | 71,466 | |||||||||
| Non-current liabilities |
||||||||||
| Deferred income tax liabilities |
10 | 107,909 | 114,576 | |||||||
| Provisions |
13 | 76,448 | 94,304 | |||||||
| Debt |
14 | 247,551 | 233,180 | |||||||
|
|
|
|
|
|||||||
| Total liabilities |
515,162 | 513,526 | ||||||||
|
|
|
|
|
|||||||
| Shareholders’ equity |
||||||||||
| Share capital |
15 | 1,055,417 | 1,047,233 | |||||||
| Other reserves |
16 | (16,303 | ) | 24,998 | ||||||
| Equity component of convertible notes |
14 | 68,347 | 68,347 | |||||||
| Deficit |
(133,314 | ) | (139,693 | ) | ||||||
|
|
|
|
|
|||||||
| Total shareholders’ equity attributable to SSR Mining shareholders |
974,147 | 1,000,885 | ||||||||
|
|
|
|
|
|||||||
| Non-controlling interest |
16 | 31,829 | 23,043 | |||||||
|
|
|
|
|
|||||||
| Total equity |
1,005,976 | 1,023,928 | ||||||||
|
|
|
|
|
|||||||
| Total liabilities and equity |
1,521,138 | 1,537,454 | ||||||||
|
|
|
|
|
|||||||
Commitments (notes 9 and 24(c))
The accompanying notes are an integral part of the consolidated financial statements
Approved by the Board of Directors and authorized for issue on February 21, 2019
| “Richard D. Paterson” |
“Paul Benson” | |||
| Richard D. Paterson, Director |
Paul Benson, Director |
| SSR Mining Inc. | Financial Statements Year-End 2018 | 6
|
Consolidated Statements of (Loss) Income
SSR Mining Inc.
(expressed in thousands of United States dollars, except for per share amounts)
| 2018 | 2017 | |||||||||
| Note | $ | $ | ||||||||
| Revenue |
17 | 420,675 | 448,773 | |||||||
| Cost of sales |
18 | (343,830 | ) | (335,510 | ) | |||||
|
|
|
|
|
|||||||
| Income from mine operations |
76,845 | 113,263 | ||||||||
| General and administrative expenses |
18 | (32,941 | ) | (20,307 | ) | |||||
| Exploration, evaluation and reclamation expenses |
(14,009 | ) | (15,981 | ) | ||||||
| Impairment reversal |
9 | — | 24,357 | |||||||
|
|
|
|
|
|||||||
| Operating income |
29,895 | 101,332 | ||||||||
| Interest earned and other finance income |
19 | 11,761 | 6,130 | |||||||
| Interest expense and other finance costs |
19 | (33,630 | ) | (34,870 | ) | |||||
| Other expenses |
20 | (9,149 | ) | (3,067 | ) | |||||
| Foreign exchange gain |
9,213 | 5,062 | ||||||||
|
|
|
|
|
|||||||
| Income before tax |
8,090 | 74,587 | ||||||||
| Income tax expense |
10 | (8,121 | ) | (3,121 | ) | |||||
|
|
|
|
|
|||||||
| Net (loss) income |
(31 | ) | 71,466 | |||||||
|
|
|
|
|
|||||||
| Attributable to: |
||||||||||
| Equity holders of SSR Mining |
6,379 | 69,316 | ||||||||
| Non-controlling interest |
(6,410 | ) | 2,150 | |||||||
|
|
|
|
|
|||||||
| Net income per share attributable to equity holders of SSR Mining |
||||||||||
| Basic |
21 | $ | 0.05 | $ | 0.58 | |||||
| Diluted |
21 | $ | 0.05 | $ | 0.57 | |||||
The accompanying notes are an integral part of the consolidated financial statements
| SSR Mining Inc. | Financial Statements Year-End 2018 | 7
|
Consolidated Statements of Comprehensive (Loss) Income
SSR Mining Inc.
(expressed in thousands of United States dollars)
| 2018 | 2017 | |||||||
| $ | $ | |||||||
| Net (loss) income |
(31 | ) | 71,466 | |||||
|
|
|
|
|
|||||
| Other comprehensive (loss) income |
||||||||
| Items that will not be reclassified to net income: |
||||||||
| (Loss) gain on marketable securities, at FVTOCI, net of tax $6,059 and ($4,729) |
(37,686 | ) | 25,948 | |||||
| Items that may be subsequently reclassified to net income: |
||||||||
| Unrealized (loss) gain on effective portion of derivative, net of tax $850 and ($246) |
(2,907 | ) | 526 | |||||
|
|
|
|
|
|||||
| Total other comprehensive (loss) income |
(40,593 | ) | 26,474 | |||||
|
|
|
|
|
|||||
| Total comprehensive (loss) income |
(40,624 | ) | 97,940 | |||||
|
|
|
|
|
|||||
| Attributable to: |
||||||||
| Equity holders of SSR Mining |
(34,214 | ) | 95,790 | |||||
| Non-controlling interest |
(6,410 | ) | 2,150 | |||||
The accompanying notes are an integral part of the consolidated financial statements
| SSR Mining Inc. | Financial Statements Year-End 2018 | 8
|
Consolidated Statements of Changes in Shareholders’ Equity
SSR Mining Inc.
(expressed in thousands of United States dollars)
| Total | ||||||||||||||||||||||||||||||||||
| Common Shares | equity | |||||||||||||||||||||||||||||||||
| Equity | attributable | |||||||||||||||||||||||||||||||||
| component | to equity | |||||||||||||||||||||||||||||||||
| Other | of | holders of | Non- | |||||||||||||||||||||||||||||||
| reserves | convertible | SSR | controlling | Total | ||||||||||||||||||||||||||||||
| Shares | Amount | (note 16) | notes | Deficit | Mining | interest | equity | |||||||||||||||||||||||||||
| Note | 000’s | $ | $ | $ | $ | $ | $ | $ | ||||||||||||||||||||||||||
| Balance, January 1, 2017 |
119,401 | 1,043,555 | (1,014 | ) | 68,347 | (209,009 | ) | 901,879 | — | 901,879 | ||||||||||||||||||||||||
| Exercise of stock options |
15 | 440 | 3,678 | (1,339 | ) | — | — | 2,339 | — | 2,339 | ||||||||||||||||||||||||
| Equity-settled share-based compensation |
15 | — | — | 2,219 | — | — | 2,219 | — | 2,219 | |||||||||||||||||||||||||
| Recognition of joint venture |
3 | — | — | (1,342 | ) | — | — | (1,342 | ) | 18,573 | 17,231 | |||||||||||||||||||||||
| Funding from non-controlling interest |
16 | — | — | — | — | — | — | 2,320 | 2,320 | |||||||||||||||||||||||||
| Total comprehensive income for the year |
— | — | 26,474 | — | 69,316 | 95,790 | 2,150 | 97,940 | ||||||||||||||||||||||||||
|
|
|
|
|
|
|
|
|
|
|
|
|
|
|
|
|
|||||||||||||||||||
| Balance, December 31, 2017 |
119,841 | 1,047,233 | 24,998 | 68,347 | (139,693 | ) | 1,000,885 | 23,043 | 1,023,928 | |||||||||||||||||||||||||
|
|
|
|
|
|
|
|
|
|
|
|
|
|
|
|
|
|||||||||||||||||||
| Exercise of stock options |
15 | 899 | 8,184 | (2,864 | ) | — | — | 5,320 | — | 5,320 | ||||||||||||||||||||||||
| Equity-settled share-based compensation |
15 | — | — | 2,156 | — | — | 2,156 | — | 2,156 | |||||||||||||||||||||||||
| Funding from non-controlling interest |
16 | — | — | — | — | — | — | 15,196 | 15,196 | |||||||||||||||||||||||||
| Total comprehensive (loss) income for the year |
— | — | (40,593 | ) | — | 6,379 | (34,214 | ) | (6,410 | ) | (40,624 | ) | ||||||||||||||||||||||
|
|
|
|
|
|
|
|
|
|
|
|
|
|
|
|
|
|||||||||||||||||||
| Balance, December 31, 2018 |
120,740 | 1,055,417 | (16,303 | ) | 68,347 | (133,314 | ) | 974,147 | 31,829 | 1,005,976 | ||||||||||||||||||||||||
|
|
|
|
|
|
|
|
|
|
|
|
|
|
|
|
|
|||||||||||||||||||
The accompanying notes are an integral part of the consolidated financial statements
| SSR Mining Inc. | Financial Statements Year-End 2018 | 9
|
Consolidated Statements of Cash Flows
SSR Mining Inc.
(expressed in thousands of United States dollars)
| Note | 2018 $ |
2017 $ |
||||||||||
| Cash flows from operating activities |
||||||||||||
| Net (loss) income for the year |
(31 | ) | 71,466 | |||||||||
| Adjustments for: |
||||||||||||
| Depreciation, depletion and amortization |
100,479 | 102,482 | ||||||||||
| Net finance expense |
20,564 | 26,467 | ||||||||||
| Impairment reversal |
— | (24,357 | ) | |||||||||
| Income tax expense |
8,121 | 3,121 | ||||||||||
| Non-cash foreign exchange gain |
(13,002 | ) | (4,373 | ) | ||||||||
| Net changes in non-cash working capital items |
26 | (30,934 | ) | (4,886 | ) | |||||||
| Other operating activities |
26 | 6,883 | 3,610 | |||||||||
|
|
|
|
|
|||||||||
| Cash generated from operating activities before interest and taxes |
92,080 | 173,530 | ||||||||||
| Moratorium paid |
(5,683 | ) | (9,270 | ) | ||||||||
| Interest paid |
(13,831 | ) | (15,235 | ) | ||||||||
| Income taxes paid |
(12,797 | ) | (4,300 | ) | ||||||||
|
|
|
|
|
|||||||||
| Cash generated by operating activities |
59,769 | 144,725 | ||||||||||
|
|
|
|
|
|||||||||
| Cash flows from investing activities |
||||||||||||
| Purchase of property, plant and equipment |
(67,747 | ) | (28,897 | ) | ||||||||
| Capitalized stripping costs |
(7,489 | ) | (22,863 | ) | ||||||||
| Underground mine development costs |
(9,074 | ) | (8,294 | ) | ||||||||
| Capitalized exploration costs |
(13,473 | ) | (5,368 | ) | ||||||||
| Chinchillas project costs |
(60,248 | ) | (11,432 | ) | ||||||||
| Closing payment on formation of joint venture, net of cash acquired |
— | (12,972 | ) | |||||||||
| Loan to joint venture partner |
(8,032 | ) | — | |||||||||
| Investment in marketable securities |
6 | (23,057 | ) | — | ||||||||
| Net proceeds from sale of marketable securities |
6 | 63,445 | 68,641 | |||||||||
| Interest received |
9,219 | 3,944 | ||||||||||
| Other investing activities |
526 | 1,747 | ||||||||||
|
|
|
|
|
|||||||||
| Cash used in investing activities |
(115,930 | ) | (15,494 | ) | ||||||||
|
|
|
|
|
|||||||||
| Cash flows from financing activities |
||||||||||||
| Proceeds from exercise of stock options |
5,320 | 2,281 | ||||||||||
| Funding from non-controlling interest |
15,196 | 2,320 | ||||||||||
|
|
|
|
|
|||||||||
| Cash generated by financing activities |
20,516 | 4,601 | ||||||||||
|
|
|
|
|
|||||||||
| Effect of foreign exchange rate changes on cash and cash equivalents |
(5,007 | ) | (1,095 | ) | ||||||||
|
|
|
|
|
|||||||||
| Increase (decrease) in cash and cash equivalents |
(40,652 | ) | 132,737 | |||||||||
| Cash and cash equivalents, beginning of year |
459,864 | 327,127 | ||||||||||
|
|
|
|
|
|||||||||
| Cash and cash equivalents, end of year |
419,212 | 459,864 | ||||||||||
|
|
|
|
|
|||||||||
Supplemental cash flow information (note 26)
The accompanying notes are an integral part of the consolidated financial statements
| SSR Mining Inc. | Financial Statements Year-End 2018 | 10
|
Notes to the Consolidated Financial Statements
SSR Mining Inc.
(tabular amounts expressed in thousands of United States dollars unless otherwise stated)
| 1. | NATURE OF OPERATIONS |
SSR Mining Inc. (“we”, “us”, “our” or “SSR Mining”) is a company incorporated under the laws of the Province of British Columbia, Canada and our shares are publicly listed on the Toronto Stock Exchange in Canada and the NASDAQ Global Market in the United States. Together with our subsidiaries, we (the “Group”) are principally engaged in the operation, acquisition, exploration and development of precious metal resource properties located in the Americas. We have three producing mines and a portfolio of precious metal dominant projects located throughout the Americas. SSR Mining Inc. is the ultimate parent of the Group.
Our address is Suite 800, 1055 Dunsmuir Street, PO Box 49088, Vancouver, British Columbia, V7X 1G4.
Our focus is on safe, profitable gold and silver production from our Marigold mine in Nevada, U.S., Seabee Gold Operation in Saskatchewan, Canada and our 75% owned Puna Operations in Jujuy, Argentina, and to advance, as market and project conditions permit, our other principal development projects towards development and commercial production.
| 2. | SUMMARY OF SIGNIFICANT ACCOUNTING POLICIES |
The principal accounting policies applied in the preparation of these consolidated financial statements are set out below.
| a) | Basis of preparation |
These consolidated financial statements have been prepared in accordance with International Financial Reporting Standards as issued by the International Accounting Standards Board (“IFRS”). The comparative information has also been prepared on this basis, details of which are given below.
These statements were authorized for issue by our Board of Directors on February 21, 2019.
| b) | Accounting convention |
These consolidated financial statements have been prepared on the historical cost basis, except for the revaluation of certain financial instruments, which are measured at fair value as described in note 2(r).
| c) | Basis of consolidation |
These consolidated financial statements incorporate the financial statements of SSR Mining Inc. and all of our subsidiaries (note 25(b)).
| (i) | Subsidiaries |
Subsidiaries are all entities (including structured entities) over which we have control. We control an entity when we are exposed to, or have rights to, variable returns from our involvement with the entity and have the ability to affect those returns through our power over the entity.
| SSR Mining Inc. | Financial Statements Year-End 2018 | 11
|
Notes to the Consolidated Financial Statements
SSR Mining Inc.
(tabular amounts expressed in thousands of United States dollars unless otherwise stated)
| 2. | SUMMARY OF SIGNIFICANT ACCOUNTING POLICIES (Continued) |
The financial statements of subsidiaries are included in the consolidated financial statements from the date on which control is transferred to us until the date that control ceases.
All intercompany transactions and balances have been eliminated on consolidation.
| d) | Business combinations |
A business combination is defined as an acquisition of assets and liabilities that constitute a business. A business is an integrated set of activities and assets that is capable of being conducted and managed for the purpose of providing a return to us and our shareholders. A business consists of inputs, including non-current assets, and processes, including operational processes, that when applied to those inputs have the ability to create outputs that provide a return to us and our shareholders. A business also includes those assets and liabilities that do not necessarily have all the inputs and processes required to produce outputs, but can be integrated with our inputs and processes or we could easily replicate the processes to create outputs. When acquiring a set of activities or assets in the exploration and development stage, which may not have outputs, we consider other factors to determine whether the set of activities or assets is a business. Those factors include, but are not limited to, whether the set of activities or assets:
| • | Has begun planned principal activities; |
| • | Has employees, intellectual property and other inputs and processes that could be applied to those inputs; |
| • | Is pursuing a plan to produce outputs; and |
| • | Will be able to obtain access to customers that will purchase the outputs. |
Not all of the above factors need to be present for a particular integrated set of activities or assets in the exploration and development stage to qualify as a business.
Acquisitions of businesses are accounted for using the acquisition method. The consideration transferred in a business combination is measured at fair value, which is calculated as the sum of the acquisition-date fair value of the assets and liabilities transferred. The results of businesses acquired during the period are included in the consolidated financial statements from the date of acquisition. The identifiable assets, liabilities and contingent liabilities of the businesses which can be measured reliably are recorded at fair values at the date of acquisition. Provisional fair values are finalized within 12 months of the acquisition date. Acquisition-related costs are expensed as incurred. Measurement period adjustments are adjustments that arise from additional information obtained during the measurement period (which cannot exceed one year from the acquisition date) about facts and circumstances that existed at the acquisition date.
| e) | Foreign currency translation |
| (i) | Functional and presentation currency |
Items included in the financial statements of each of our subsidiaries are measured using the currency of the primary economic environment in which the particular entity operates (the “functional currency”). SSR Mining and all of our subsidiaries have a functional currency of United States dollars.
The consolidated financial statements are presented in United States dollars.
| (ii) | Transactions and balances |
Foreign currency transactions are translated into the functional currency using the exchange rates prevailing at the date of the transaction. Monetary assets and liabilities are translated using the period-end exchange rates. Foreign currency gains and losses resulting from the settlement of such transactions and from the translation at period-end exchange rates of monetary assets and liabilities denominated in foreign currencies are recognized in the consolidated statements of (loss) income.
| SSR Mining Inc.
|
Financial Statements Year-End 2018 | 12 |
Notes to the Consolidated Financial Statements
SSR Mining Inc.
(tabular amounts expressed in thousands of United States dollars unless otherwise stated)
| 2. | SUMMARY OF SIGNIFICANT ACCOUNTING POLICIES (Continued) |
| f) | Revenue recognition |
Our primary source of revenue is from the sale of gold doré or bullion and metal-bearing concentrate. Revenue is recognized in the consolidated financial statements when the following conditions are met:
| • | the significant risks and rewards of ownership have passed to the customer; |
| • | neither continuing managerial involvement, to the degree usually associated with ownership, nor effective control over the good sold, has been retained; |
| • | the amount of revenue can be measured reliably; |
| • | it is probable that economic benefits associated with the sale will flow to us; and |
| • | the costs incurred or to be incurred in respect of the sale can be measured reliably. |
Revenue from the sale of gold doré or bullion is recognized on the trade settlement date when funds are received.
Revenue from the sale of concentrate is recorded net of charges for treatment, refining and penalties. Net revenues from the sale of by-products are included within revenue.
Concentrate sales are recognized on a provisional basis using our estimate of contained metals. Final settlement is based on applicable commodity prices, based on contractually determined quotational periods, and receipt of final weights and assays, which typically occurs two to six months after shipment.
Variations between the price recorded when revenue was initially recognized and the actual final price are caused by changes in metal prices. This feature causes concentrate receivables to be measured at fair value through profit and loss (“FVTPL”).
The above revenue recognition policy is applicable to contracts where revenue transactions were completed in 2017. With any contracts where revenue transactions were completed or entered into in 2018 accounted for in accordance with IFRS 15 Revenue from Contracts with Customers (“IFRS 15”) (note 2v)).
| g) | Cash and cash equivalents |
Cash and cash equivalents include cash on hand and held at banks and short-term investments with an original maturity of 90 days or less, which are readily convertible into a known amount of cash and excludes any restricted cash that is not available for use by us.
| SSR Mining Inc.
|
Financial Statements Year-End 2018 | 13 |
Notes to the Consolidated Financial Statements
SSR Mining Inc.
(tabular amounts expressed in thousands of United States dollars unless otherwise stated)
| 2. | SUMMARY OF SIGNIFICANT ACCOUNTING POLICIES (Continued) |
| h) | Inventory |
Stockpiled ore, leach pad inventory and finished goods are valued at the lower of average cost and estimated net realizable value (“NRV”). Cost includes all direct costs incurred in production including direct labour and materials, freight, depreciation, depletion and amortization and directly attributable overhead costs. NRV is calculated using the estimated price at the time of sale based on prevailing and forecast metal prices less estimated future production costs to convert the inventory into saleable form and all associated selling costs.
Any write-downs of inventory to NRV are recorded within cost of sales in the consolidated statements of (loss) income. If there is a subsequent increase in the value of inventory, the previous write-downs to NRV are reversed up to cost to the extent that the related inventory has not been sold.
Stockpiled ore inventory represents ore that has been extracted from the mine and is available for further processing. The cost of stockpiled ore inventory is derived from the current mining costs incurred up to the point of stockpiling the ore and are removed at average cost as ore is processed. Quantities of stockpiled ore are verified by periodic surveys.
The recovery of gold and by-products from certain oxide ore is achieved through a heap leaching process. Under this method, ore is stacked on leach pads and treated with a chemical solution that dissolves the gold contained within the ore. The resulting pregnant solution is further processed in a plant where the gold is recovered in doré. The cost of leach pad inventory is derived from current mining and leaching costs and removed as ounces of gold are recovered at the average cost per recoverable ounce of gold on the leach pads. Estimates of recoverable gold in the leach pads are calculated based on the quantities of ore placed on the leach pads (measured tonnes added to the leach pads), the grade of ore placed on the leach pads (based on assay data), and a recovery percentage.
Finished goods inventory includes metal concentrates at site and in transit and doré at a site or refinery or bullion in a metal account.
Materials and supplies inventories are valued at the lower of average cost and NRV. Costs include acquisition, freight and other directly attributable costs. A regular review is undertaken to determine the extent of any provision for obsolescence.
Inventory that is not planned to be processed or used within one year is classified as non-current.
| i) | Mineral properties |
Capitalized costs of mineral properties include the following:
| • | Costs of acquiring exploration and development stage properties in asset acquisitions, or the value attributed to properties acquired in a business combination; |
| • | Economically recoverable exploration and evaluation expenses; |
| • | Expenditures incurred to develop mining properties; |
| • | Certain costs incurred during production; |
| • | Estimates of close down and restoration costs; and |
| • | Borrowing costs incurred that are attributable to qualifying mineral properties. |
| SSR Mining Inc. | Financial Statements Year-End 2018 | 14
|
Notes to the Consolidated Financial Statements
SSR Mining Inc.
(tabular amounts expressed in thousands of United States dollars unless otherwise stated)
| 2. | SUMMARY OF SIGNIFICANT ACCOUNTING POLICIES (Continued) |
| (i) | Acquisition of mineral properties |
The costs of acquiring exploration and development stage properties, including transaction costs, in an asset purchase are capitalized as an exploration and evaluation asset or a mineral property at cost. The value attributed to acquiring mineral properties at an operating mine in a business combination is recognized as a mineral property. The value attributed to acquiring exploration potential in a business combination is recognized as an exploration and evaluation asset.
| (ii) | Exploration and evaluation expenditures |
Exploration expenditures are the costs incurred in the initial search for mineral deposits with economic potential or in the process of obtaining more information about existing mineral deposits. Exploration expenditures typically include costs associated with acquiring the rights to explore, prospecting, sampling, mapping, diamond drilling and other work involved in searching for Mineral Resources, as defined by National Instrument 43-101 - Standards of Disclosure for Mineral Projects (“NI 43-101”). Evaluation expenditures are costs incurred to establish the technical and commercial viability of developing mineral deposits identified through exploration activities or by acquisition.
Evaluation expenditures include the cost of: (i) further defining the volume and grade of deposits through drilling of core samples, trenching and sampling activities in an ore body; (ii) determining the optimal methods of extraction and metallurgical and treatment processes; (iii) studies related to surveying, transportation and infrastructure requirements; (iv) permitting activities; and (v) economic evaluations to determine whether development of mineralized material is commercially justified including preliminary economic assessments, pre-feasibility and final feasibility studies. Exploration and evaluation expenditures are expensed until it has been determined that a property is technically feasible and commercially viable, in which case subsequent evaluation costs incurred to develop a mineral property are capitalized.
| (iii) | Development expenditures |
Once we have met the criteria for capitalization of exploration and evaluation expenditures, the carrying value of the exploration and evaluation asset is reclassified as a mineral property. All costs, including pre-operating costs are capitalized until the point that the mineral property is capable of operating as intended by us. This is determined by: (i) completion of operational commissioning of major mine and plant components; (ii) operating results being achieved consistently for a period of time; (iii) indicators that these operating results will be continued; and (iv) other factors being present, including one or more of the following: a significant portion of the plant/mill capacity being achieved; a significant portion of available funding being directed towards operating activities; a predetermined, reasonable period of time being passed; or significant milestones for the development of the mineral property being achieved.
In open pit mining operations, it is necessary to incur costs to remove waste material in order to access the ore body, which is known as stripping, with the stripping ratio being the ratio of waste material to ore. Stripping costs incurred prior to the production stage of a mining property (pre-stripping costs) are capitalized as part of the carrying amount of the related mining property.
Once the mineral property is capable of operating as intended, further operating costs, including depreciation, depletion and amortization, are included within inventory as incurred.
| SSR Mining Inc. | Financial Statements Year-End 2018 | 15
|
Notes to the Consolidated Financial Statements
SSR Mining Inc.
(tabular amounts expressed in thousands of United States dollars unless otherwise stated)
| 2. | SUMMARY OF SIGNIFICANT ACCOUNTING POLICIES (Continued) |
| (iv) | Costs incurred during production |
During the production phase of an open pit mine, where stripping activities result in improved access to ore, we recognize a capitalized stripping asset when it is probable that the future economic benefit of the improved access will flow to us, the ore to which access has been improved is identifiable, and costs can be reliably measured. Typically identifiable components of an ore body correspond to the phases of a mine plan. Within each identifiable component, the average stripping ratio is estimated; the cost of waste removal in excess of the stripping ratio is capitalized, and the cost of waste and ore removal in line with the average stripping ratio is recorded in inventory. The capitalized stripping asset is amortized using a unit of production method over the identified component of the ore body.
At underground mining operations, we incur development costs to build new shafts, drifts and ramps that enable us to access ore underground. The time over which we will continue to incur these costs depends on the mine life. These underground development costs are capitalized as incurred. Capitalized underground development costs incurred to enable access to specific areas of the underground mine, and which only provide an economic benefit over the period of mining that area, are depreciated on a units of production basis relating to that particular area of the mine.
| (v) | Borrowing costs |
Borrowing costs attributable to the acquisition, construction or production of an asset that takes a substantial period of time to construct are capitalized as part of the cost of the asset until the asset is substantially ready for its intended use or sale. Where funds have been borrowed specifically to finance an asset, the amount capitalized is the actual borrowing costs incurred. Where the funds used to finance an asset form part of general borrowings, the amount capitalized is calculated using a weighted average of rates applicable to our relevant general borrowings during the period.
| j) | Plant and equipment |
Plant and equipment is stated at cost less accumulated depreciation and accumulated impairment charges.
The cost of an item of plant and equipment includes the purchase price or construction cost, any costs directly attributable to bringing the asset to the location and condition necessary for its intended use, an initial estimate of the costs of dismantling and removing the item and restoring the site on which it is located, and for qualifying assets, the associated borrowing costs.
Where an item of plant and equipment is comprised of major components with different useful lives, the components are accounted for as separate items of plant and equipment.
Costs incurred for major overhaul of existing equipment and sustaining capital are capitalized as plant and equipment and are subject to depreciation once they are available for use. Major overhauls include improvement programs that increase the productivity or extend the useful life of an asset beyond that initially envisaged. The costs of routine maintenance and repairs that do not constitute improvement programs are accounted for as a cost of inventory.
| k) | Depreciation |
| (i) | Mineral properties |
Our mineral properties are classified as either those being subject to depletion or not yet subject to depletion. On acquisition of a mineral property, we prepare an estimate of the fair value attributable to Mineral Reserves, Mineral Resources and exploration potential attributable to the property. The fair value attributable to Mineral Resources is classified to mineral properties not subject to depletion. As Mineral Resources are converted into Mineral Reserves at operating properties a portion of the asset balance is reclassified as subject to depletion using an average cost per ounce of Mineral Resource.
| SSR Mining Inc. | Financial Statements Year-End 2018 | 16
|
Notes to the Consolidated Financial Statements
SSR Mining Inc.
(tabular amounts expressed in thousands of United States dollars unless otherwise stated)
| 2. | SUMMARY OF SIGNIFICANT ACCOUNTING POLICIES (Continued) |
Mineral properties subject to depletion are depleted using the units-of-production method. In applying the units-of-production method over the recoverable ounces to which the asset specifically relates, depletion is calculated using the recoverable ounces extracted from the mine in the period as a percentage of the total recoverable ounces expected to be extracted in current and future periods based on Mineral Reserves.
No amortization is charged during the evaluation and development phases as the asset is not available for use.
| (ii) | Plant and equipment |
The carrying amounts of plant and equipment are depreciated to their estimated residual value over the estimated useful lives of the specific assets concerned, or the estimated life-of-mine (“LOM”) or lease, if shorter. Depreciation starts on the date when the asset is available for its intended use. The major categories of plant and equipment are depreciated on a straight-line basis using the estimated lives indicated below:
| Computer equipment |
3 - 7 years | |
| Furniture and fixtures |
7 years | |
| Vehicles |
2 - 5 years | |
| Mining equipment |
5 - 10 years | |
| Mobile equipment components |
2 - 9 years | |
| Buildings |
LOM | |
| Mine plant equipment |
LOM | |
| Underground infrastructure |
LOM | |
| Leasehold improvements |
Lease term |
Land is not depreciated.
Assets under construction are not depreciated until available for their intended use.
We conduct a review of residual values, useful lives and depreciation methods employed for property, plant and equipment annually, and when events and circumstances indicate that such a review should be made. Any changes in estimates that arise from this review are accounted for prospectively.
| l) | Goodwill |
Business acquisitions are accounted for using the acquisition method whereby acquired assets and liabilities are recorded at fair value as of the date of acquisition with the excess of the acquisition amount over such fair value being recorded as goodwill and allocated to cash generating units (“CGUs”). CGUs are the smallest identifiable group of assets that generate cash inflows that are largely independent of the cash inflows from other assets or groups of assets. Each individual mining interest that is an operating mine is typically a CGU.
Goodwill arises principally because of the following factors: (i) the ability to capture buyer-specific synergies arising upon a transaction; and (ii) the requirement to record a deferred tax liability for the difference between the assigned values and the tax bases of the assets acquired and liabilities assumed in a business combination.
| SSR Mining Inc.
|
Financial Statements Year-End 2018 | 17 |
Notes to the Consolidated Financial Statements
SSR Mining Inc.
(tabular amounts expressed in thousands of United States dollars unless otherwise stated)
| 2. | SUMMARY OF SIGNIFICANT ACCOUNTING POLICIES (Continued) |
| m) | Review of asset carrying values and impairment assessment |
Goodwill is not amortized; instead it is tested annually for impairment. In addition, at each reporting period we assess whether there is an indication that goodwill is impaired and, if there is such an indication, we would test for goodwill impairment at that time.
Non-financial assets that are subject to amortization or depreciation are reviewed for impairment whenever events or changes in circumstances indicate that the carrying amount may not be recoverable.
We conduct reviews to assess for any indications of impairment of asset values. External factors such as changes in current and forecast metal prices, operating costs and other market factors are also monitored to assess for indications of impairment.
If any such indication exists, an estimate of the recoverable amount is undertaken, being the higher of an asset’s fair value less costs to dispose (“FVLCTD”) and value in use (“VIU”). If the asset’s carrying amount exceeds its recoverable amount then an impairment loss is recognized in the consolidated statements of (loss) income.
FVLCTD is defined as the amount that would be obtained from the sale of the asset in an orderly transaction between market participants at the measurement date. Fair value of mineral assets is generally determined as the present value of the estimated future cash flows expected to arise from the continued use of the asset, including any expansion prospects.
VIU is determined as the present value of the estimated future cash flows expected to arise from the continued use of the asset in its present form and from its ultimate disposal.
Impairment is normally assessed at the level of CGUs, which are identified as the smallest identifiable group of assets that generates cash inflows that are largely independent of the cash inflows from other assets.
Non-financial assets, other than goodwill, that have been impaired are tested for possible reversal of the impairment whenever events or changes in circumstances indicate that the impairment may have reversed. When a reversal of a previous impairment is recorded, the reversal amount is adjusted for depreciation that would have been recorded had the impairment not taken place. Goodwill that has been previously impaired is not reversed.
| n) | Share capital |
Common shares issued by us are recorded at the net proceeds received which is the fair value of the consideration received less costs incurred in connection with the issue.
| o) | Share-based payments |
Equity-settled share-based payment arrangements such as our stock option plan are initially measured at fair value at the date of grant, which is recognized as a share-based compensation expense in the consolidated statements of (loss) income over the vesting period, with a corresponding increase to equity. We estimate the fair value of stock options granted using the Black-Scholes option pricing model and estimate the expected forfeiture rate at the date of grant.
Arrangements considered to be cash-settled are the Directors’ Deferred Share Unit (“DSU”) Plan, the Restricted Share Unit (“RSU”) Plan and the Performance Share Unit (“PSU”) Plan. The fair values of these are recognized as share-based compensation expenses in the consolidated statements of (loss) income over the vesting period, with a corresponding increase to accrued liabilities. The fair value of DSUs, PSUs, and RSUs is estimated based on the quoted market price of our common shares and are remeasured at each reporting period.
When awards are forfeited because non-market based vesting conditions are not satisfied, the expense previously recognized is proportionately reversed.
| SSR Mining Inc.
|
Financial Statements Year-End 2018 | 18 |
Notes to the Consolidated Financial Statements
SSR Mining Inc.
(tabular amounts expressed in thousands of United States dollars unless otherwise stated)
| 2. | SUMMARY OF SIGNIFICANT ACCOUNTING POLICIES (Continued) |
| p) | Taxation |
The income tax expense for the period is comprised of current and deferred tax, and is recognized in the consolidated statements of (loss) income except to the extent that it relates to items recognized directly in shareholders’ equity, in which case the tax is recognized in equity.
| (i) | Current income tax |
Current tax for each of our taxable entities is based on the local taxable profit for the period at the local statutory tax rates enacted or substantively enacted at the date of the consolidated statements of financial position.
| (ii) | Deferred tax |
Deferred tax is recognized, using the liability method, on temporary differences between the carrying value of assets and liabilities in the consolidated statements of financial position and the corresponding tax bases used in the computation of taxable profit. Deferred tax is determined using tax rates and tax laws that are enacted or substantively enacted at the date of the consolidated statements of financial position and are expected to apply when the related deferred tax asset is realized or the deferred tax liability is settled.
Deferred tax assets and liabilities are not recognized if the temporary difference arises on the initial recognition of assets and liabilities in a transaction other than a business combination, that at the time of the transaction, affects neither the taxable nor the accounting profit or loss.
Deferred tax liabilities are recognized for taxable temporary differences associated with investments in subsidiaries and associates, and interests in joint ventures, except where the timing of the reversal of the temporary difference is controlled by us and it is probable that the temporary difference will not reverse in the foreseeable future.
Deferred tax assets are recognized for all deductible temporary differences to the extent that it is probable that taxable profits will be available to be utilized against those deductible temporary differences. Deferred tax assets are reviewed at each reporting date and amended to the extent that it is no longer probable that the related tax benefit will be realized. The change in the net deferred income tax asset or liability is included in income except for deferred income tax relating to equity items which is recognized directly in equity. Deferred tax assets and liabilities are offset when there is a legally enforceable right to offset the current tax assets against the current tax liabilities and when they relate to income taxes levied by the same taxation authority and we intend to settle our current tax assets and liabilities on a net basis.
| (iii) | Royalties and other tax arrangements |
Royalties and other arrangements are treated as taxation arrangements when they have the characteristics of income tax. This is considered to be the case when they are imposed under government authority and the amount payable is calculated by reference to an income measure. Obligations arising from royalty arrangements that do not satisfy these criteria are recognized as current liabilities and included within cost of sales.
| (iv) | Value added tax (“VAT”) |
VAT may be paid in countries where recoverability is uncertain. In these cases, VAT payments are either deferred within exploration and evaluation assets or inventory costs, or expensed if related to exploration and evaluation costs. If we ultimately recover the amounts that have been deferred, the amount received will be applied to reduce any associated asset. If the amounts were previously expensed, the recovery will be recognized in the consolidated statements of (loss) income.
| SSR Mining Inc.
|
Financial Statements Year-End 2018 | 19 |
Notes to the Consolidated Financial Statements
SSR Mining Inc.
(tabular amounts expressed in thousands of United States dollars unless otherwise stated)
| 2. | SUMMARY OF SIGNIFICANT ACCOUNTING POLICIES (Continued) |
| q) | Income per share |
Basic income per share is calculated by dividing the net income attributable to our shareholders by the weighted average number of shares outstanding during the reporting period.
Diluted income per share is calculated by adjusting the weighted average number of shares outstanding to assume conversion of all potentially dilutive share equivalents, such as stock options and convertible notes. The “treasury stock method” is used for the assumed proceeds upon exercise of the dilutive instruments to determine the number of shares assumed to be purchased at the average market price during the period.
| r) | Financial instruments |
We classify our financial instruments in the following categories: at FVTPL, fair value through other comprehensive income (“FVTOCI”) or at amortized cost.
| (i) | Classification |
We determine the classification of financial instruments at initial recognition.
Financial assets
| • | Debt The classification of debt instruments is driven by our business model for managing the financial assets and their contractual cash flow characteristics. A debt instrument is measured at amortized cost if the objective of the business model is to hold the debt instrument for the collection of contractual cash flows, and the asset’s contractual cash flows are comprised solely of payments of principal and interest. They are classified as current or non-current assets based on their maturity date. If the business model is not to hold the asset, it is classified as FVTPL. |
| • | Equity Equity instruments that are held for trading are classified as FVTPL. For other equity instruments, on the day of acquisition we can make an irrevocable election (on an instrument-by-instrument basis) to designate them as at FVTOCI. |
Financial liabilities
Financial liabilities are measured at amortized cost, unless they are required to be measured at FVTPL (such as instruments held for trading or derivatives) or we have opted to measure at FVTPL.
| (ii) | Measurement |
Financial assets and liabilities at FVTPL
Financial assets and liabilities at FVTPL are initially recognized at fair value and transaction costs are expensed in the consolidated statements of (loss) income. Realized and unrealized gains and losses arising from changes in the fair value of the financial assets or liabilities held at FVTPL are included in the consolidated statements of (loss) income in the period in which they arise. Where we have opted to designate a financial liability at FVTPL, any changes associated with our own credit risk will be recognized in OCI.
Financial assets at FVTOCI
Investments in equity instruments at FVTOCI are initially recognized at fair value plus transaction costs. Subsequently, they are measured at fair value, with gains and losses arising from changes from initial recognition recognized in OCI.
Financial assets and liabilities at amortized cost
Financial assets and liabilities at amortized cost are initially recognized at fair value, and subsequently carried at amortized cost less any impairment.
| SSR Mining Inc.
|
Financial Statements Year-End 2018 | 20 |
Notes to the Consolidated Financial Statements
SSR Mining Inc.
(tabular amounts expressed in thousands of United States dollars unless otherwise stated)
| 2. | SUMMARY OF SIGNIFICANT ACCOUNTING POLICIES (Continued) |
Derivative financial instruments
When we enter into derivative contracts, these are intended to reduce the exposures related to assets and liabilities, or forecast transactions. Derivatives are classified as FVTPL unless designated as hedges, as described below.
Derivatives embedded in financial liabilities are treated as separate derivatives when their risks and characteristics are not closely related to their host contracts. However, the classification approach described above is applied to all financial assets, including those that contain embedded derivatives, without the need to separate the embedded derivative from the host contract. Commodity-based derivatives resulting from provisional sales prices of metals in concentrate are classified as FVTPL with changes in value recognized in revenue.
| (iii) | Impairment of financial assets |
Impairment of financial assets at amortized cost
We recognize a loss allowance for expected credit losses on financial assets that are measured at amortized cost.
At each reporting date, we measure the loss allowance for the financial asset at an amount equal to the lifetime expected credit losses if the credit risk on the financial asset has increased significantly since initial recognition. If at the reporting date, the financial asset has not increased significantly since initial recognition, we measure the loss allowance for the financial asset at an amount equal to twelve month expected credit losses.
Impairment losses on financial assets carried at amortized cost are reversed in subsequent periods if the expected credit losses are reversed after the impairment was recognized.
| (iv) | Derecognition |
Derecognition of financial assets and liabilities
Financial assets are derecognized when the investments mature or are sold, and substantially all the risks and rewards of ownership have been transferred. A financial liability is derecognized when the obligation under the liability is discharged, canceled or expired. Gains and losses on derecognition are recognized within finance income and finance costs, respectively. Gains or losses on financial assets classified as FVTOCI remain within accumulated OCI.
| (v) | Fair value of financial instruments |
The fair values of quoted investments are based on current prices. If the market for a financial asset is not active (and for unlisted securities), we establish fair value by using valuation techniques. These include the use of recent arm’s length transactions, reference to other instruments that are substantially the same, discounted cash flow analysis, and option pricing models refined to reflect the financial asset’s specific circumstances.
| (vi) | Hedge accounting |
Derivative Instruments
Derivative instruments are recorded at fair value on the consolidated statements of financial position, classified based on contractual maturity. Derivative instruments are classified as either hedges of the fair value of recognized assets or liabilities or of firm commitments (“fair value hedges”), hedges of highly probable forecast transactions (“cash flow hedges”) or non-hedge derivatives. Derivatives designated as either a fair value or cash flow hedge that are expected to be highly effective in achieving offsetting changes in fair value or cash flows are assessed on an ongoing basis to determine that they actually have been highly effective throughout the financial reporting periods for which they were designated. Derivative assets and derivative liabilities are shown separately in the consolidated statements of financial position unless there is a legal right to offset and intent to settle on a net basis.
| SSR Mining Inc.
|
Financial Statements Year-End 2018 | 21 |
Notes to the Consolidated Financial Statements
SSR Mining Inc.
(tabular amounts expressed in thousands of United States dollars unless otherwise stated)
| 2. | SUMMARY OF SIGNIFICANT ACCOUNTING POLICIES (Continued) |
Fair Value Hedges
Changes in the fair value of derivatives that are designated and qualify as fair value hedges are recorded in the consolidated statements of (loss) income, together with any changes in the fair value of the hedged asset or liability or firm commitment that is attributable to the hedged risk.
Cash Flow Hedges
The effective portion of changes in the fair value of derivatives that are designated and qualify as cash flow hedges is recognized in OCI. The gain or loss relating to the ineffective portion is recognized in the consolidated statements of (loss) income. Amounts accumulated in OCI are transferred to the consolidated statements of (loss) income in the period when the forecasted transaction impacts earnings. When the forecasted transaction that is hedged results in the recognition of a non-financial asset or a non-financial liability, the gains and losses previously deferred in OCI are transferred from OCI and included in the measurement of the initial carrying amount of the asset or liability.
When a derivative designated as a cash flow hedge expires or is sold and the forecasted transaction is still expected to occur, any cumulative gain or loss relating to the derivative that is recorded in OCI at that time remains in OCI and is recognized in the consolidated statements of (loss) income when the forecasted transaction occurs. When a forecasted transaction is no longer expected to occur, the cumulative gain or loss that was recorded in OCI is immediately transferred to the consolidated statements of (loss) income.
Non-Hedge Derivatives
Derivative instruments that do not qualify as either fair value or cash flow hedges are recorded at their fair value at the balance sheet date, with changes in fair value recognized in the consolidated statements of (loss) income.
| s) | Provisions for close down and restoration and for environmental clean-up costs |
Close down and restoration costs include dismantling and demolition of infrastructure, the removal of residual materials and remediation of disturbed areas. Estimated close down and restoration costs are provided for in the accounting period when the obligation arising from the related disturbance occurs, based on the net present value of estimated future costs. The cost estimates are updated during the life of the operation to reflect known development, e.g. revisions to cost estimates and to the estimated lives of the operations, and are subject to formal reviews at regular intervals.
The initial closure provision together with changes resulting from changes in estimated cash flows or discount rates are adjusted within the property, plant and equipment asset to which the provision relates. If no asset remains any change in a provision is charged or credited to the consolidated statements of (loss) income in the period. These costs are then depreciated over the life of the asset to which they relate, typically using the units of production method. The accretion or unwinding of the discount applied in establishing the net present value of provisions is charged to the consolidated statements of (loss) income as a finance expense.
| t) | Leases |
Leases which transfer substantially all of the benefits and risks incidental to the ownership of property are accounted for as finance leases. Finance leases are capitalized at the lease commencement at the lower of the fair market value of the leased property and the net present value of the minimum lease payments. Each lease payment is allocated between the liability and finance charge. The property, plant and equipment acquired under finance leases are depreciated over the shorter of the asset’s useful life and the lease term.
All other leases are accounted for as operating leases wherein rental payments are expensed as incurred.
| SSR Mining Inc.
|
Financial Statements Year-End 2018 | 22 |
Notes to the Consolidated Financial Statements
SSR Mining Inc.
(tabular amounts expressed in thousands of United States dollars unless otherwise stated)
| 2. | SUMMARY OF SIGNIFICANT ACCOUNTING POLICIES (Continued) |
| u) | Significant accounting judgments and estimates |
The preparation of financial statements in conformity with IFRS requires the use of judgments and/or estimates that affect the amounts reported and disclosed in the consolidated financial statements and related notes. These judgments and estimates are based on management’s best knowledge of the relevant facts and circumstances, having regard to previous experience, but actual results may differ materially from the amounts included in the financial statements. Information about such judgments and estimation is contained in the accounting policies and/or notes to the consolidated financial statements, and the judgments and other sources of estimation uncertainty that have a risk of resulting in a material adjustment to the carrying amounts of assets and liabilities within the next year are summarized below.
Areas of judgment that have the most significant effect on the application of accounting policies in the consolidated financial statements are:
| • | Review of non-current asset carrying values and impairment assessment; |
| • | Determination of capitalized stripping activities; |
| • | Determination of capitalization of underground development activities; |
| • | Determination of useful lives of property, plant and equipment; |
| • | Close down and restoration provision; |
| • | Deferred tax assets and liabilities; |
| • | Determination of commencement of commercial production; |
| • | Functional currency; |
| • | Contingencies; and |
| • | Determination of the timing of derecognition of exploration and evaluation assets. |
Key sources of estimation uncertainty that have a risk of resulting in a material adjustment to the carrying amounts of assets and liabilities within the next year are summarized below:
| • | Review of non-current asset carrying values and impairment assessment; |
| • | Mineral Reserves and Mineral Resources estimates; |
| • | Determination of useful lives of property, plant and equipment; |
| • | Valuation of inventory; |
| • | Valuation of goodwill (note 3); |
| • | Close down and restoration provision; |
| • | Determination of the fair values of share-based compensation; |
| • | Valuation of financial instruments; |
| • | Deferred tax assets and liabilities; and |
| • | Contingencies. |
Each of these judgments and estimates is considered in more detail below.
| SSR Mining Inc.
|
Financial Statements Year-End 2018 | 23 |
Notes to the Consolidated Financial Statements
SSR Mining Inc.
(tabular amounts expressed in thousands of United States dollars unless otherwise stated)
| 2. | SUMMARY OF SIGNIFICANT ACCOUNTING POLICIES (Continued) |
Review of non-current asset carrying values and impairment assessment
In accordance with our accounting policy (note 2(m)), goodwill is tested for impairment annually and each asset or CGU is evaluated every reporting period to determine whether there are any indicators of impairment. If an impairment test is required, a formal estimate of recoverable amount is performed and an impairment charge is recognized to the extent that the carrying amount exceeds the recoverable amount. The recoverable amount of an asset or CGU of assets is measured at the higher of FVLCTD or VIU.
The evaluation of asset carrying values for indications of impairment includes judgments of both external and internal sources of information, including such factors as market and economic conditions, metal prices and forecasts, production budgets and forecasts, and LOM estimates.
The determination of FVLCTD and VIU requires management to make estimates and assumptions about expected production based on current estimates of recoverable metal, commodity prices, operating costs, taxes and export duties, inflation and foreign exchange, salvage value, future capital expenditures and discount rates. The estimates and assumptions are subject to risk and uncertainty; hence, there is the possibility that changes in circumstances will alter these projections, which may impact the recoverable amount of the assets. In such circumstances, some or all of the carrying value of the assets may be further impaired or the impairment charge reversed with the impact recorded in the consolidated statements of (loss) income.
In our impairment assessment at December 31, 2018, it was determined that there were indicators of potential impairment on the $64 million carrying value of the Pitarrilla project which resulted in us assessing the recoverable amount of the asset, which has been identified as a CGU. The recoverable amount of the Pitarrilla project was determined to be the FVLCTD, which is based upon the CGU’s estimated future after-tax cash flows. The cash flows were determined based on cash flow projections, which incorporate our estimates of forecast metal prices, production based on current estimates of recoverable underground Mineral Resources and future operating costs and capital expenditures. We used a silver price of $17.75 per ounce in the cash flow projections, based on market consensus forecasts. Projected cash flows under the FVLCTD model are after-tax and discounted at 8.5% using an estimated weighted average cost of capital of a market participant adjusted for project and country specific risks. We concluded that these discounted cash flows exceeded the carrying value of the Pitarrilla project and no impairment was required.
Average silver prices would have had to decrease by more than approximately 3% or the discount rate would have to increase to approximately 9.2% for the Project to be impaired.
Mineral Reserves and Mineral Resources estimates
We estimate Mineral Reserves and Mineral Resources based on information prepared by qualified persons as defined by NI 43-101. Mineral Reserves are used in the calculation of depreciation, amortization and impairment charges, for forecasting the timing of the payment of close down and restoration costs, and future taxes. In assessing the life of a mine for accounting purposes, Mineral Resources are only taken into account where there is a high degree of confidence of economic extraction. There are numerous uncertainties inherent in estimating Mineral Reserves, and assumptions that are valid at the time of estimation may change significantly when new information becomes available. Changes in the forecast prices of commodities, exchange rates, production costs or recovery rates may change the economic status of Mineral Reserves and may, ultimately, result in Mineral Reserves estimates being revised. Such changes in Mineral Reserves could impact depreciation and amortization rates, asset carrying values and the provision for close down and restoration.
| SSR Mining Inc.
|
Financial Statements Year-End 2018 | 24 |
Notes to the Consolidated Financial Statements
SSR Mining Inc.
(tabular amounts expressed in thousands of United States dollars unless otherwise stated)
| 2. | SUMMARY OF SIGNIFICANT ACCOUNTING POLICIES (Continued) |
Determination of capitalized stripping activities
We determine whether stripping costs incurred during the production phase of a surface mining operation provide improved access to a component of an ore body that will be mined in a future period, and whether the costs can be reliably measured. We have to apply judgment when identifying components of the mine over which stripping costs are capitalized, in estimating the average stripping ratio for each component, and in using judgment to determine the period over which the capitalized stripping asset is amortized.
Determination of capitalization of underground development activities
We determine whether development costs incurred during the production phase of an underground mining operation provide improved access to a component of an ore body that will be mined in a future period, and whether the costs can be reliably measured. We have to apply judgment when identifying components of the mine over which development costs are capitalized and in determining the period over which the capitalized underground asset is amortized.
Determination of useful lives of property, plant and equipment
We use the units of production method to deplete mineral properties, whereby depletion is calculated using the quantity of ore extracted from the mine in the period as a percentage of the total quantity of ore expected to be extracted in current and future periods. Other assets are depreciated using the straight-line method, which includes significant management judgment to determine useful lives and residual values.
Valuation of inventory
Stockpiled ore and finished goods
Stockpiled ore and finished goods are valued at the lower of average cost and NRV. NRV is calculated as the estimated price at the time of sale based on prevailing and forecast metal prices less estimated future production costs to convert the inventory into saleable form and associated selling costs. The determination of forecast sales price, recovery rates, grade, assumed contained metal in stockpiles and production and selling costs requires significant assumptions that may impact the stated value of our inventory and lead to changes in NRV.
Leach pad inventory
In determining the value of the leach pad, we make estimates of quantities and grades of ore stacked on leach pads and in-process, and the recoverable gold in this material to determine the total inventory. Changes in these estimates can result in a change in carrying amounts of inventory, as well as cost of sales. The determination of forecast sales price, recovery rates, grade, assumed contained metal in leach pad inventory and production and selling costs requires significant assumptions that may impact the stated value of our leach pad inventory and lead to changes in NRV.
Material and supplies inventory
In determining the value of material and supplies inventory, we make estimates of the amounts to be used and realizable value through disposals or sales. Changes in these estimates can result in a change in carrying amounts of inventory, as well as cost of sales.
| SSR Mining Inc.
|
Financial Statements Year-End 2018 | 25 |
Notes to the Consolidated Financial Statements
SSR Mining Inc.
(tabular amounts expressed in thousands of United States dollars unless otherwise stated)
| 2. | SUMMARY OF SIGNIFICANT ACCOUNTING POLICIES (Continued) |
Close down and restoration provision
Close down and restoration costs are a consequence of exploration activities and mining, and the majority of close down and restoration costs are incurred near the end of the LOM. Our accounting policy requires the recognition of such provisions when the obligation occurs. The initial provisions are periodically reviewed during the life of the operation to reflect known developments, e.g. updated cost estimates and revisions to the estimated lives of operations. Although the ultimate cost to be incurred is uncertain, we estimate our costs based on studies using current restoration standards and techniques. The initial closure provisions together with changes, other than those arising from the discount applied in establishing the net present value of the provision, are capitalized within mineral properties and depleted over the lives of the assets to which they relate.
The ultimate magnitude of these costs is uncertain, and cost estimates can vary in response to many factors including changes to the relevant legal requirements, whether closure plans achieve intended reclamation goals, the emergence of new restoration techniques or experience at other mine sites, local inflation rates and exchange rates when liabilities are anticipated to be settled in a currency other than the United States dollar. The expected timing of expenditure can also change, for example, in response to changes in Mineral Reserves, production rates or economic conditions. As a result there could be significant adjustments to the provision for close down and restoration, which would affect future financial results.
Deferred tax assets and liabilities
The determination of our tax expense for the period and deferred tax assets and liabilities involves significant estimation and judgment by management. In determining these amounts, we interpret tax legislation in a variety of jurisdictions and make estimates of the expected timing of the reversal of deferred tax assets and liabilities. We also make estimates of future earnings which affect the extent to which potential future tax benefits may be used. We are subject to assessments by various taxation authorities, which may interpret legislation differently. These differences may affect the final amount or the timing of the payment of taxes. We provide for such differences where known based on our best estimate of the probable outcome of these matters.
Determination of commencement of commercial production
The determination of when a mine is in the condition necessary for it to be capable of operating in the manner intended by management (referred to as “commercial production”) is a matter of significant judgment which impacts when the Company recognizes revenue, operating costs and depreciation and depletion in the statement of profit and loss. In making this determination, management considers whether (a) the major capital expenditures to bring the mine to the condition necessary for it to be capable of operating in the manner intended was complete; (b) ramping up to nameplate design capacity has been achieved for the operations; (c) the mine and mill were meeting performance design criteria such as mining rates, haulage targets, hourly throughput and process recovery; and (d) a saleable product could be produced.
Functional currency
The determination of a subsidiary’s functional currency often requires significant judgment where the primary economic environment in which the subsidiary operates may not be clear. This can have a significant impact on our consolidated results based on the foreign currency translation methods described in note 2(e).
| SSR Mining Inc.
|
Financial Statements Year-End 2018 | 26 |
Notes to the Consolidated Financial Statements
SSR Mining Inc.
(tabular amounts expressed in thousands of United States dollars unless otherwise stated)
| 2. | SUMMARY OF SIGNIFICANT ACCOUNTING POLICIES (Continued) |
Contingencies
Contingencies can be either possible assets or liabilities arising from past events which, by their nature, will only be resolved when one or more future events not wholly within our control occur or fail to occur. The assessment of such contingencies inherently involves the exercise of significant judgment and estimates of the outcome of future events. In assessing loss contingencies related to legal, tax or regulatory proceedings that are pending against us or unasserted claims, that may result in such proceedings or regulatory or government actions that may negatively impact our business or operations, we evaluate with our legal counsel the perceived merits of any legal, tax or regulatory proceedings, unasserted claims or actions. Also evaluated are the perceived merits of the nature and amount of relief sought or expected to be sought, when determining the amount, if any, to recognize as a contingent liability or assessing the impact on the carrying value of assets. Contingent assets or liabilities are not recognized in the consolidated financial statements.
Determination of the timing of derecognition of exploration and evaluation assets
Judgment is required in assessing certain criteria to determine when derecognition of an exploration and evaluation asset has occurred.
| v) | Change in accounting policies |
We adopted the requirements of IFRS 15 Revenue from Contracts with Customers (“IFRS 15”) as of January 1, 2018. IFRS 15 covers principles that an entity shall apply to report useful information to users of financial statements about the nature, amount, timing, and uncertainty of revenue and cash flows arising from a contract with a customer. We elected to apply IFRS 15 using a modified retrospective approach by recognizing the cumulative effect of initially adopting IFRS 15 as an adjustment to the opening balance sheet at January 1, 2018. Therefore, the comparative information has not been restated and continues to be reported under IAS 18 Revenue. The details of accounting policy changes and the quantitative impact of these changes are described below.
Gold doré and bullion sales
IFRS 15 requires that revenue from contracts with customers be recognized upon the transfer of control over goods or services to the customer. The recognition of revenue upon transfer of control to the customer is consistent with our revenue recognition policy as set out in note 2(f) to our audited consolidated financial statements, as the condition is satisfied on gold doré and bullion sales when title transfers to the customer. Accordingly, upon adoption, this requirement under IFRS 15 resulted in no impact to our financial statements, as the timing of revenue recognition on our gold bullion sales is unchanged.
Concentrate sales
We performed an assessment of our existing concentrate sales agreements and determined that there is no change in the timing of revenue recognition under IFRS 15. The point of transfer of risks and rewards and transfer of control for concentrate sales occur at the same time. IFRS 15 identifies that the shipping component associated with certain concentrate sales may be a separate performance obligation, which would require a portion of the revenue to be deferred and recognized as the obligation is fulfilled. We have determined that the deferred revenue would be insignificant and thus, have not accounted for the shipping component as a separate performance obligation.
IFRS 15 does not consider changes in the fair value of the concentrate receivable measured at fair value through profit and loss as revenue from contracts with customers. Accordingly, we have separately presented the changes as other revenue in note 17.
| SSR Mining Inc.
|
Financial Statements Year-End 2018 | 27 |
Notes to the Consolidated Financial Statements
SSR Mining Inc.
(tabular amounts expressed in thousands of United States dollars unless otherwise stated)
| 2. | SUMMARY OF SIGNIFICANT ACCOUNTING POLICIES (Continued) |
New Accounting Policy
As a result of IFRS 15, we have adopted the accounting policy set out below, effective January 1, 2018.
Our primary source of revenue is from the sale of gold doré or bullion and metal-bearing concentrate.
Initially we determine what performance obligations our contracts with customers create, and where applicable, allocate the consideration expected to be received between different the performance obligations on the basis of relative stand-alone selling prices. Revenue is then recognized when all of our performance obligations are satisfied. A performance obligation is satisfied when control of the underlying goods or services for that particular performance obligation is transferred to the customer. Control is defined as the ability to direct the use of and obtain substantially all of the remaining benefits from the asset underlying the good or service. In order to evaluate the point in time at which control of the asset has been transferred to a customer we consider the following indicators:
| • | title to the asset has transferred; |
| • | physical possession of the asset has transferred; |
| • | we have a present right to payment for the asset; |
| • | the customer has accepted the asset; and |
| • | the customer has the significant risks and rewards of ownership of the asset |
Gold doré and bullion sales
Gold doré and bullion is sold primarily to bullion banks in the London spot market. The sales price is fixed on the date of sale based on the gold spot price. Generally, we record revenue from gold bullion sales at the time of physical delivery, which is also the date that title to the gold passes, and cash is received.
Concentrate sales
Under the terms of concentrate sales contracts with independent trading and smelting companies; typically, provisional payment is received based upon the estimated metal content and metal prices at the date of shipment. The final quantity of metal sold is then determined through a settlement process at a date after the product has been delivered, with metal sales prices being based on a specified future date after shipment based on market prices. We record revenues under these contracts at the point that control has passed, which is when the risk and rewards of ownership pass to our customers, typically at port of loading or port of unloading based on the terms of the contract. We estimate the consideration to be received based upon provisional assays adjusted for expected final settlement differences, and using forward market prices on the expected date that final sales prices will be determined.
Variations between the price recorded at the revenue recognition date and the actual final price set under the sales contracts are caused by changes in market prices, which result in the existence of a trade receivable financial instrument that is recorded at fair value through profit and loss (“FVTPL”) each period until final settlement occurs. Changes in fair value are included in other revenue in the consolidated statement of income.
| SSR Mining Inc.
|
Financial Statements Year-End 2018 | 28 |
Notes to the Consolidated Financial Statements
SSR Mining Inc.
(tabular amounts expressed in thousands of United States dollars unless otherwise stated)
| 2. | SUMMARY OF SIGNIFICANT ACCOUNTING POLICIES (Continued) |
| w) | Future accounting changes |
IFRS 16 Leases
On January 13, 2016, the IASB issued IFRS 16 Leases, which will replace IAS 17 Leases. The standard introduces a single lessee accounting model and requires a lessee to recognize assets and liabilities for all leases with a term of more than twelve months, unless the underlying asset is of low value. A lessee is required to recognize a right-of-use asset representing its right to use the underlying asset and a lease liability representing its obligation to make lease payments. The standard is effective for annual reporting periods beginning on or after January 1, 2019. SSR Mining intends to adopt IFRS 16 for the annual reporting period beginning on January 1, 2019 and apply the following practical expedients on initial application:
| • | application only to contracts that were previously identified as leases, and; |
| • | electing to not recognize leases for which the underlying asset is of low value or considered to be a short-term lease. |
We anticipate using the modified retrospective with cumulative effect method of adoption.
The application of IFRS 16 will not have any impact on the amounts recognized in our consolidated financial statements for finance leases where an asset and a related liability for the lease arrangement have been recognized or where SSR Mining is a lessor.
Our assessment of non-cancellable operating lease commitments indicates that our arrangements will meet the definition of a lease under IFRS 16, and therefore, at January 1, 2019, we will recognize a right-of-use asset and a corresponding liability in respect of these leases.
Our operating lease commitments have been disclosed in note 9.
| 3. | ACQUISITIONS AND CHANGE IN INTEREST ON MINERAL PROPERTIES |
| a) | Puna Operations Joint Venture |
On March 31, 2017, we exercised our option on the Chinchillas project and on May 31, 2017 formed a jointly owned company with Golden Arrow Resources Corporation (“Golden Arrow”) called Puna Operations Inc. (“Puna Operations”) for the development of the property. The jointly owned company, holding the Pirquitas and Chinchillas properties, is owned 75% by SSR Mining and we are the operator. This transaction is expected to extend the Puna Operations operating life by approximately eight years.
Under the terms of the arrangement we paid the option exercise payment to Golden Arrow of $12,972,000, net of cash acquired.
At May 31, 2017 we recognized an asset of $28,839,000 representing the fair value of the Chinchillas mineral property acquired. In addition, we recognized a non-controlling interest of $18,573,000. As we retain control of Puna Operations, the difference between the carrying value of the assets acquired and liabilities assumed and the non-controlling interest, was recognized in equity attributable to our shareholders, which totalled $1,342,000.
| SSR Mining Inc.
|
Financial Statements Year-End 2018 | 29 |
Notes to the Consolidated Financial Statements
SSR Mining Inc.
(tabular amounts expressed in thousands of United States dollars unless otherwise stated)
| 3. | ACQUISITIONS AND CHANGE IN INTEREST ON MINERAL PROPERTIES (Continued) |
| b) | Acquisition of Seabee Gold Operation and Goodwill |
On May 31, 2016, we completed the acquisition of Claude Resources Inc. and its Seabee Gold Operation. The acquisition was a business combination and has been accounted for in accordance with the measurement and recognition provisions of IFRS 3. IFRS 3 requires that the purchase consideration be allocated to the assets acquired and liabilities assumed in a business combination based upon their estimated fair values at the date of acquisition.
As part of the purchase price allocation, we recognized goodwill of $ 49,786,000 on the transaction. We performed the annual goodwill impairment test at December 31, 2018. For the purposes of the goodwill impairment test, the recoverable amount of the Seabee Gold Operation, which is considered to be the CGU, has been determined using a FVLCTD calculation, which exceeded VIU. The valuation was based on cash flow projections, which incorporate our estimates of forecast metal prices, foreign exchange rates, production based on current estimates of recoverable Mineral Reserves and Mineral Resources, future exploration potential, future operating costs and capital expenditures. Projected cash flows under the FVLCTD model are after-tax and discounted using an estimated weighted average cost of capital of a market participant adjusted for asset specific risks. Commodity prices are our estimates of the views of market participants, including a long-term gold price of $ 1,300 per ounce and the long-term foreign exchange rate of $1.25 Canadian/USD $1.00 . The post-tax real discount rates adjusted for asset specific risks used for the impairment assessments was 7.0%. The calculated recoverable amount of the CGU exceeded the carrying value at December 31, 2018, and therefore no impairment charge has been recorded.
| 4. | CASH AND CASH EQUIVALENTS |
| December 31, 2018 $ |
December 31, 2017 $ |
|||||||
| Cash |
209,518 | 131,589 | ||||||
| Short-term investments |
209,694 | 328,275 | ||||||
|
|
|
|
|
|||||
| 419,212 | 459,864 | |||||||
|
|
|
|
|
|||||
| 5. | TRADE AND OTHER RECEIVABLES |
| December 31, 2018 $ |
December 31, 2017 $ |
|||||||
| Trade receivables |
11,287 | 14,848 | ||||||
| Value added tax receivables (note 11) |
12,811 | 7,004 | ||||||
| Prepayments and deposits |
10,880 | 8,875 | ||||||
| Income tax receivable |
2,947 | 1,213 | ||||||
| Other taxes receivable |
4,274 | 4,824 | ||||||
| Other receivables |
642 | 1,288 | ||||||
|
|
|
|
|
|||||
| 42,841 | 38,052 | |||||||
|
|
|
|
|
|||||
No trade receivables are past due and all are expected to be settled within twelve months.
Credit risk is further discussed in note 24(b). We did not hold any collateral for any receivable amounts outstanding at December 31, 2018 or December 31, 2017.
| SSR Mining Inc.
|
Financial Statements Year-End 2018 | 30 |
Notes to the Consolidated Financial Statements
SSR Mining Inc.
(tabular amounts expressed in thousands of United States dollars unless otherwise stated)
| 6. | MARKETABLE SECURITIES |
| December 31, 2018 $ |
December 31, 2017 $ |
|||||||
| Balance, beginning of year |
114,001 | 148,944 | ||||||
| Additions |
22,674 | 5,295 | ||||||
| Disposals |
(63,445 | ) | (72,132 | ) | ||||
| Fair value adjustments |
(43,688 | ) | 31,894 | |||||
|
|
|
|
|
|||||
| Balance, end of year |
29,542 | 114,001 | ||||||
|
|
|
|
|
|||||
During 2018, we purchased 8.2 million common shares of SilverCrest Metals Inc. (“SilverCrest”) for total consideration of $23.1 million and sold our remaining position of 9.0 million common shares of Pretium Resources Inc. (“Pretium”) for pre-tax cash proceeds of approximately $63.4 million. The fair value adjustments in 2018 related primarily to the Pretium shares.
On acquisition of the SilverCrest shares, we recognized an expense of $ 2.8 million related to the premium paid for the shares over the prevailing market price. Due to the subsequent increase in the SilverCrest share price, we recognized a gain of $4.3 million in Other Comprehensive Income at December 31, 2018.
The SilverCrest common shares are subject to a hold period of four months from their December 7, 2018 acquisition date.
| 7. | INVENTORY |
| December 31, 2018 $ |
December 31, 2017 $ |
|||||||
| Current: |
||||||||
| Finished goods |
23,433 | 19,262 | ||||||
| Stockpiled ore |
18,195 | 6,806 | ||||||
| Leach pad inventory |
162,335 | 128,783 | ||||||
| Materials and supplies |
28,785 | 27,730 | ||||||
|
|
|
|
|
|||||
| 232,748 | 182,581 | |||||||
| Non-current materials and supplies (note 8) |
2,006 | 3,973 | ||||||
|
|
|
|
|
|||||
| 234,754 | 186,554 | |||||||
|
|
|
|
|
|||||
As at December 31, 2018, we had total provisions of $3,436,000 (2017 - $7,250,000) for supplies inventory that we no longer expect to utilize.
Following the formation of our Puna Operations in 2017, which extended the operating life of the Pirquitas plant, we partially reversed our existing provision against supplies inventory by $6,342,000.
| SSR Mining Inc. | Financial Statements Year-End 2018 | 31
|
Notes to the Consolidated Financial Statements
SSR Mining Inc.
(tabular amounts expressed in thousands of United States dollars unless otherwise stated)
| 8. | OTHER ASSETS |
| December 31, 2018 | December 31, 2017 | |||||||||||||||
| Current | Non-current | Current | Non-current | |||||||||||||
| $ | $ | $ | $ | |||||||||||||
| Financial assets: |
||||||||||||||||
| Restricted cash (1) |
— | 2,035 | — | 3,079 | ||||||||||||
| Deferred consideration (2, 3) |
7,345 | 11,289 | 2,394 | 15,639 | ||||||||||||
| Derivative asset |
— | — | 1,287 | — | ||||||||||||
| Loan receivable from JV Partner (4) |
— | 8,214 | — | — | ||||||||||||
| Non-financial assets: |
||||||||||||||||
| Non-current value added tax receivable (note 11) |
— | 5,991 | — | 6,751 | ||||||||||||
| Non-current inventory (note 7) |
— | 2,006 | — | 3,973 | ||||||||||||
| Held for sale |
1,431 | — | 1,418 | — | ||||||||||||
|
|
|
|
|
|
|
|
|
|||||||||
| 8,776 | 29,535 | 5,099 | 29,442 | |||||||||||||
|
|
|
|
|
|
|
|
|
|||||||||
| (1) | We have cash and security deposits in relation to our close down and restoration provisions of $1,934,000 (December 31, 2017 - $1,895,000). |
| (2) | On November 1, 2016, we sold our Diablillos and M-18 properties in Argentina to AbraPlata Resource Corp (“AbraPlata”) (formerly Huayra Minerals Corporation) for consideration of: |
| • | 19.9% equity stake in Abra Plata, with free carried interest until the completion of a financing of $5,000,000 or more, valued at $2,887,000. By December 31, 2018, the financing had been completed; |
| • | Cash payments of $14,100,000 over the following five years ($1,350,000 received by December 31, 2018), valued initially at $7,452,000 using a discount rate of 20%; and |
| • | We have retained a 1.0% net smelter returns royalty on production from each of the projects. |
As at December 31, 2018 a payment from AbraPlata due on November 1, 2018 was 61 days past due. However, as the deferred consideration remains fully collateralized by the asset (whose fair value approximates the carrying value of the deferred consideration) an expected credit loss provision was not recorded (note 24b)).
| (3) | On May 2, 2017, we sold our Berenguela project in Peru to Valor Resources Limited (“Valor”) for consideration of: |
| • | 145,881,177 shares of Valor, valued at $1,098,000; |
| • | Additional shares from financing received in 2018, valued initially at $520,000; |
| • | Cash payment of $12,000,000 over the next 5 years ($550,000 received by December 31, 2018), originally valued at $6,726,000 using a discount rate of 15%; and |
| • | We have retained a 1.0% net smelter returns royalty on production from the project. |
| (4) | As of July 6, 2018, we entered into a credit agreement with Golden Arrow (the “Credit Agreement”) for a non-revolving term loan (the “Loan”) in an aggregate principal amount equal to $10,000,000. The Loan matures on July 22, 2020. |
The proceeds borrowed under the Credit Agreement are required to be used by Golden Arrow to fund its contributions under the shareholders’ agreement we entered into with Golden Arrow on May 31, 2017, as the sole shareholders of Puna Operations. The Loan is secured by Golden Arrow’s ownership and equity interests in Puna Operations.
The Loan bears interest (computed on the basis of the actual number of days elapsed over a year of 365 days and compounded monthly) at a rate per annum equal to the US Base Rate (as such term is defined in the Credit Agreement) plus 10%. Interest on the loan accrues from and including the date of each borrowing under the Credit Agreement, compounded monthly, and shall be capitalized and payable on the maturity date.
| SSR Mining Inc. | Financial Statements Year-End 2018 | 32
|
Notes to the Consolidated Financial Statements
SSR Mining Inc.
(tabular amounts expressed in thousands of United States dollars unless otherwise stated)
| 9. | PROPERTY, PLANT AND EQUIPMENT |
| December 31, 2018 | ||||||||||||||||||||
| Plant and equipment (1) $ |
Mineral properties subject to depletion (3) $ |
Mineral properties not yet subject to depletion (2)(3)(5) $ |
Exploration and evaluation assets $ |
Total $ |
||||||||||||||||
| Cost |
||||||||||||||||||||
| Balance, beginning of year |
545,090 | 393,273 | 121,854 | 91,579 | 1,151,796 | |||||||||||||||
| Additions |
102,275 | 33,371 | 13,771 | 956 | 150,373 | |||||||||||||||
| Disposals |
(15,485 | ) | — | — | (1,307 | ) | (16,792 | ) | ||||||||||||
| Costs written off |
(9,998 | ) | — | — | — | (9,998 | ) | |||||||||||||
| Change in estimate of close down and restoration provision |
— | 3,269 | — | — | 3,269 | |||||||||||||||
| Transfers |
— | 33,635 | (33,635 | ) | — | — | ||||||||||||||
|
|
|
|
|
|
|
|
|
|
|
|||||||||||
| Balance, end of year |
621,882 | 463,548 | 101,990 | 91,228 | 1,278,648 | |||||||||||||||
|
|
|
|
|
|
|
|
|
|
|
|||||||||||
| Accumulated depreciation |
||||||||||||||||||||
| Balance, beginning of year |
(315,261 | ) | (177,906 | ) | — | — | (493,167 | ) | ||||||||||||
| Charge for the year |
(44,772 | ) | (61,414 | ) | — | — | (106,186 | ) | ||||||||||||
| Disposals |
12,728 | 12,728 | ||||||||||||||||||
| Write off |
9,152 | — | — | — | 9,152 | |||||||||||||||
|
|
|
|
|
|
|
|
|
|
|
|||||||||||
| Balance, end of year |
(338,153 | ) | (239,320 | ) | — | — | (577,473 | ) | ||||||||||||
|
|
|
|
|
|
|
|
|
|
|
|||||||||||
| Net book value at December 31, 2018 |
283,729 | 224,228 | 101,990 | 91,228 | 701,175 | |||||||||||||||
|
|
|
|
|
|
|
|
|
|
|
|||||||||||
| SSR Mining Inc. | Financial Statements Year-End 2018 | 33
|
Notes to the Consolidated Financial Statements
SSR Mining Inc.
(tabular amounts expressed in thousands of United States dollars unless otherwise stated)
| 9. | PROPERTY, PLANT AND EQUIPMENT (Continued) |
| December 31, 2017 | ||||||||||||||||||||
| Plant and equipment (1) $ |
Mineral properties subject to depletion(3) $ |
Mineral properties not yet subject to depletion(2)(3)(5) $ |
Exploration and evaluation assets(4) $ |
Total $ |
||||||||||||||||
| Cost |
||||||||||||||||||||
| Balance, beginning of year |
509,008 | 306,277 | 133,560 | 92,720 | 1,041,565 | |||||||||||||||
| Additions |
33,738 | 43,118 | 33,589 | 758 | 111,203 | |||||||||||||||
| Disposals |
(13,555 | ) | — | — | (1,000 | ) | (14,555 | ) | ||||||||||||
| Impairment reversal |
24,357 | — | — | — | 24,357 | |||||||||||||||
| Property write downs |
— | (747 | ) | — | (899 | ) | (1,646 | ) | ||||||||||||
| Change in estimate of close down and restoration provision |
(8,458 | ) | (670 | ) | — | — | (9,128 | ) | ||||||||||||
| Transfers |
— | 45,295 | (45,295 | ) | — | — | ||||||||||||||
|
|
|
|
|
|
|
|
|
|
|
|||||||||||
| Balance, end of year |
545,090 | 393,273 | 121,854 | 91,579 | 1,151,796 | |||||||||||||||
|
|
|
|
|
|
|
|
|
|
|
|||||||||||
| Accumulated depreciation |
||||||||||||||||||||
| Balance, beginning of year |
(276,170 | ) | (101,567 | ) | — | — | (377,737 | ) | ||||||||||||
| Charge for the year |
(50,915 | ) | (76,339 | ) | — | — | (127,254 | ) | ||||||||||||
| Disposals |
11,824 | — | — | — | 11,824 | |||||||||||||||
|
|
|
|
|
|
|
|
|
|
|
|||||||||||
| Balance, end of year |
(315,261 | ) | (177,906 | ) | — | — | (493,167 | ) | ||||||||||||
|
|
|
|
|
|
|
|
|
|
|
|||||||||||
| Net book value at December 31, 2017 |
229,829 | 215,367 | 121,854 | 91,579 | 658,629 | |||||||||||||||
|
|
|
|
|
|
|
|
|
|
|
|||||||||||
| (1) | Includes assets under construction of $44,858,000 at December 31, 2018 (December 31, 2017 - $17,307,000). |
| (2) | Includes assets under construction of $Nil at December 31, 2018 (December 31, 2017 - $3,715,000). |
| (3) | We converted Inferred Mineral Resources to Mineral Reserves at our Seabee Gold Operation and correspondingly have transferred $33,635,000 (December 31, 2017 - $45,295,000) from mineral properties not yet subject to depletion to being subject to depletion. |
| (4) | On January 16, 2017, we entered into an option agreement with Silver One Resources Inc. (“Silver One”) in respect of our Candelaria project in the United States for consideration consisting of $1,000,000 worth of Silver One shares issued on January 20, 2017, and three annual installments of $1,000,000 worth of Silver One shares. Under the terms of this agreement, Silver One has three years to evaluate the Candelaria project. On January 19, 2019, we received the third installment of $1,000,000 worth of Silver One shares. |
| (5) | We have changed the presentation of the Pitarrilla project in all periods presented in the tables above from exploration and evaluation assets to mineral properties not yet subject to depletion. |
Impairment reversal of non-current assets
On May 31, 2017 we formed the jointly-owned Puna Operations (note 3). As a result of this transaction the operating life extension was considered to be an indicator of reversal of previous impairments that had been recognized against Pirquitas plant assets.
The maximum impairment reversal that is permitted is to return the asset balance to the carrying value at which it would have been had no previous impairments been recorded, which was $24,357,000 higher than the existing carrying value.
We determined that the fair value less cost to dispose of the cash generating unit significantly exceeded the maximum permitted impairment reversal. A discounted cash flow analysis was performed using a discount rate of 10% and the following estimated metal prices;
| SSR Mining Inc. | Financial Statements Year-End 2018 | 34
|
Notes to the Consolidated Financial Statements
SSR Mining Inc.
(tabular amounts expressed in thousands of United States dollars unless otherwise stated)
| 9. | PROPERTY, PLANT AND EQUIPMENT (Continued) |
| 2017 | 2018 | 2019 | 2020 | LT | ||||||||||||||||
| Silver / oz |
$ | 17.93 | $ | 18.72 | $ | 19.14 | $ | 19.53 | $ | 19.65 | ||||||||||
| Lead / lb |
$ | 1.01 | $ | 1.03 | $ | 1.02 | $ | 0.99 | $ | 0.94 | ||||||||||
| Zinc / lb |
$ | 1.27 | $ | 1.31 | $ | 1.24 | $ | 1.18 | $ | 1.06 | ||||||||||
As a result we recognized an impairment reversal of $24,357,000 in 2017.
Capital commitments and operating leases
In addition to entering into various operational commitments in the normal course of business, we had commitments of approximately $29,989,000 at December 31, 2018 (2017 - $10,207,000) for construction activities at our sites and projects.
Operating leases are recognized as an operating cost in the consolidated statements of income on a straight-line basis over the lease term. At December 31, 2018, we have operating lease commitments totaling $5,260,000 of which $513,000 is expected to be paid within a year, $2,425,000 is expected to be paid within two to five years and $2,322,000 is expected to be paid within six to ten years.
| 10. | CURRENT AND DEFERRED INCOME TAX |
Income tax expense differs from the amount that would be computed by applying the Canadian statutory rate of 27% (2017- 26%) to income before income taxes. The reasons for the differences are as follows:
| Years ended December 31 |
2018 $ |
2017 $ |
||||||
| Income before taxes |
8,090 | 74,587 | ||||||
| Statutory tax rate |
27.00 | % | 26.00 | % | ||||
|
|
|
|
|
|||||
| Expected income tax |
2,184 | 19,392 | ||||||
| Decrease resulting from: |
||||||||
| Permanent differences |
25,408 | (17,048 | ) | |||||
| Foreign exchange |
(13,714 | ) | 4,806 | |||||
| Differences in foreign and future tax rates |
(1,086 | ) | 48,167 | |||||
| Mining & overseas withholding tax |
4,955 | 5,134 | ||||||
| Expired losses |
2,928 | 3,658 | ||||||
| Restructure |
114,100 | — | ||||||
| Change in estimates in respect of prior years |
1,501 | (484 | ) | |||||
| Movement in deferred tax not recognized |
(128,066 | ) | (60,540 | ) | ||||
| Other |
(89 | ) | 36 | |||||
|
|
|
|
|
|||||
| Total income tax expense |
8,121 | 3,121 | ||||||
|
|
|
|
|
|||||
| Current tax expense |
8,043 | 3,094 | ||||||
| Deferred tax expense |
78 | 27 | ||||||
|
|
|
|
|
|||||
| Total income tax expense |
8,121 | 3,121 | ||||||
|
|
|
|
|
|||||
| SSR Mining Inc. | Financial Statements Year-End 2018 | 35
|
Notes to the Consolidated Financial Statements
SSR Mining Inc.
(tabular amounts expressed in thousands of United States dollars unless otherwise stated)
| 10. | CURRENT AND DEFERRED INCOME TAX (Continued) |
In the normal course of business we are subject to assessment by taxation authorities in various jurisdictions. These authorities may have different interpretations of tax legislation or tax agreements than those applied by us in computing current and deferred income taxes. These different interpretations may alter the timing or amounts of taxable income or deductions. The final amounts of taxes to be paid or recovered depends on a number of factors including the outcome of audits, appeals and negotiation. We provide for potential differences in interpretation based on the best estimate of the probable outcome of these matters. Changes in these estimates could result in material adjustments to our current and future income taxes.
Restructure of the Argentine Operation
We have restructured our Argentine operations by recharacterizing our intercompany loan to equity and transferring the Chinchillas assets into the same wholly owned subsidiary of Puna Operations that holds the Pirquitas plant. The restructuring was designed to increase the efficiency and administration of the operation and reduce the risk related to historic tax positions. The restructuring resulted in elimination of previously unrecognized deferred tax assets resulting in a movement in deferred tax not recognized of $125.7 million and a change to tax expense of $114.1 million reflecting the recharacterization of the intercompany loan to equity, an increase in tax basis of mining assets, and current tax expense of $4.7 million in the year.
Pretium
We sold the remaining position of 9.0 million Pretium common shares for pre-tax cash proceeds of approximately $63.4 million. The related tax impact is included in Other Comprehensive Income. In the period a $7.8 million income tax payable was recognized relating to the sales of the Pretium shares.
The tax effected items that give rise to significant portions of the deferred income tax assets and deferred income tax liabilities for the years ended December 31, 2018 and 2017 are presented below:
| Balance as at December 31, 2018 | ||||||||||||||||||||||||||||
| Net balance at beginning of year $ |
Recognized in statement of income $ |
Recognized in OCI $ |
AMT refund $ |
Net $ |
Deferred tax assets $ |
Deferred tax liabilities $ |
||||||||||||||||||||||
| Marketable securities |
(13,205 | ) | 376 | 13,867 | — | 1,038 | 1,038 | — | ||||||||||||||||||||
| Inventory |
(7,244 | ) | 3,733 | — | — | (3,511 | ) | — | (3,511 | ) | ||||||||||||||||||
| Property, plant and equipment |
(81,294 | ) | (10,452 | ) | — | — | (91,746 | ) | 940 | (92,686 | ) | |||||||||||||||||
| Close down and restoration provision |
1,787 | 1,567 | — | — | 3,354 | 3,354 | — | |||||||||||||||||||||
| Convertible notes |
(4,056 | ) | 1,820 | — | — | (2,236 | ) | — | (2,236 | ) | ||||||||||||||||||
| Carry forward tax loss and tax credits |
21,830 | (6,469 | ) | — | — | 15,361 | 15,361 | — | ||||||||||||||||||||
| Mining and foreign withholding tax |
(39,227 | ) | (1,916 | ) | — | — | (41,143 | ) | — | (41,143 | ) | |||||||||||||||||
| Executive compensation plans |
2,065 | 1,918 | — | — | 3,983 | 3,983 | — | |||||||||||||||||||||
| Deductibility of other taxes |
9,021 | 424 | — | — | 9,445 | 9,445 | — | |||||||||||||||||||||
| Other |
(4,253 | ) | 8,921 | 850 | (449 | ) | 5,069 | 5,200 | (131 | ) | ||||||||||||||||||
|
|
|
|
|
|
|
|
|
|
|
|
|
|
|
|||||||||||||||
| Net deferred tax (liabilities) assets before set-off |
(114,576 | ) | (78 | ) | 14,717 | (449 | ) | (100,386 | ) | 39,321 | (139,707 | ) | ||||||||||||||||
| Offset tax |
— | — | — | — | — | (31,798 | ) | 31,798 | ||||||||||||||||||||
|
|
|
|
|
|
|
|
|
|
|
|
|
|
|
|||||||||||||||
| Net deferred tax (liabilities) assets |
(114,576 | ) | (78 | ) | 14,717 | (449 | ) | (100,386 | ) | 7,523 | (107,909 | ) | ||||||||||||||||
|
|
|
|
|
|
|
|
|
|
|
|
|
|
|
|||||||||||||||
| SSR Mining Inc. | Financial Statements Year-End 2018 | 36
|
Notes to the Consolidated Financial Statements
SSR Mining Inc.
(tabular amounts expressed in thousands of United States dollars unless otherwise stated)
| 10. | CURRENT AND DEFERRED INCOME TAX (Continued) |
| Balance as at December 31, 2017 | ||||||||||||||||||||||||
| Net balance at beginning of year $ |
Recognized in statement of income $ |
Recognized in OCI $ |
Net $ |
Deferred tax assets $ |
Deferred tax liabilities $ |
|||||||||||||||||||
| Marketable securities |
(16,949 | ) | — | 3,744 | (13,205 | ) | — | (13,205 | ) | |||||||||||||||
| Inventory |
(1,984 | ) | (5,260 | ) | — | (7,244 | ) | — | (7,244 | ) | ||||||||||||||
| Property, plant and equipment |
(96,614 | ) | 15,320 | — | (81,294 | ) | 1,016 | (82,310 | ) | |||||||||||||||
| Close down and restoration provision |
3,917 | (2,130 | ) | — | 1,787 | 1,787 | — | |||||||||||||||||
| Convertible notes |
(5,497 | ) | 1,441 | — | (4,056 | ) | (4,056 | ) | ||||||||||||||||
| Carry forward tax loss and tax credits |
20,682 | 3,404 | (2,256 | ) | 21,830 | 21,830 | — | |||||||||||||||||
| Mining and foreign withholding tax |
(37,151 | ) | (2,076 | ) | — | (39,227 | ) | — | (39,227 | ) | ||||||||||||||
| Executive compensation plans |
2,582 | (517 | ) | — | 2,065 | 2,065 | — | |||||||||||||||||
| Deductibility of other taxes |
9,459 | (438 | ) | — | 9,021 | 9,021 | — | |||||||||||||||||
| Other |
5,764 | (9,771 | ) | (246 | ) | (4,253 | ) | 2,895 | (7,148 | ) | ||||||||||||||
|
|
|
|
|
|
|
|
|
|
|
|
|
|||||||||||||
| Net deferred tax (liabilities) assets before set-off |
(115,791 | ) | (27 | ) | 1,242 | (114,576 | ) | 38,614 | (153,190 | ) | ||||||||||||||
| Offset tax |
— | — | — | — | (38,614 | ) | 38,614 | |||||||||||||||||
|
|
|
|
|
|
|
|
|
|
|
|
|
|||||||||||||
| Net deferred tax (liabilities) assets |
(115,791 | ) | (27 | ) | 1,242 | (114,576 | ) | — | (114,576 | ) | ||||||||||||||
|
|
|
|
|
|
|
|
|
|
|
|
|
|||||||||||||
As at December 31, 2018, there was a deferred tax liability of $17,617,000 (December 31, 2017 - $22,744,000) for temporary differences of $58,724,000 (December 31, 2017 - $75,814,000) related to investments in subsidiaries. However, this liability was not recognized because we control the dividend policy of our subsidiaries (i.e. we control the timing of reversal of the related taxable temporary differences and we are satisfied that they will not reverse in the foreseeable future).
We recognize tax benefits on losses or other deductible amounts generated in countries where the probable criteria for the recognition of deferred tax assets has been met. Our unrecognized deductible temporary differences and unused tax losses for which no deferred tax asset is recognized consist of the following amounts:
| Years ended December 31 |
2018 $ |
2017 $ |
||||||
| Inventory |
— | 11,237 | ||||||
| Property, plant and equipment |
3,330 | 79,336 | ||||||
| Close down and restoration provision |
30,677 | 38,027 | ||||||
| Carry forward tax loss and tax credits |
7,962 | 396,830 | ||||||
| Mineral and foreign withholding tax |
567 | — | ||||||
| Other items |
3,883 | 75,327 | ||||||
|
|
|
|
|
|||||
| Unrecognized deductible temporary differences |
46,419 | 600,757 | ||||||
|
|
|
|
|
|||||
| SSR Mining Inc.
|
Financial Statements Year-End 2018 | 37 |
Notes to the Consolidated Financial Statements
SSR Mining Inc.
(tabular amounts expressed in thousands of United States dollars unless otherwise stated)
| 10. | CURRENT AND DEFERRED INCOME TAX (Continued) |
Due to the restructure of our Argentine operation the amount of previously unrecognized deferred tax assets was reduced including a decrease in tax loss carry forward of $356.5 million.
At December 31, 2018, we had the following estimated tax operating losses available to reduce future taxable income, including both losses for which deferred tax assets are utilized to offset applicable deferred tax liabilities and losses for which deferred tax assets are not recognized as listed in the table above. Losses expire at various dates and amounts between 2019 and 2038.
| As at December 31, 2018 |
$ | |||
| Argentina |
17,324 | |||
| Mexico |
41,601 | |||
| Peru |
71 | |||
| Canada |
4,256 | |||
| U.S.A. |
9,482 | |||
|
|
|
|||
| Tax operating losses |
72,734 | |||
|
|
|
|||
| 11. | VALUE ADDED TAX RECEIVABLE |
| December 31, 2018 $ |
December 31, 2017 $ |
|||||||
| Current (note 5) |
12,811 | 7,004 | ||||||
| Non-current (note 8) |
5,991 | 6,751 | ||||||
|
|
|
|
|
|||||
| 18,802 | 13,755 | |||||||
|
|
|
|
|
|||||
VAT paid in Argentina in relation to the Puna Operations is recoverable under Argentina law during the production stage of a mine and we apply to the Argentina government to recover the applicable VAT on an ongoing basis. There have, at times, been significant delays in obtaining final approvals and, therefore, the collection of VAT and the classification reflects best estimates of timing of recoveries.
The VAT receivables balance in Argentina is denominated in Argentine pesos. Accordingly, foreign currency fluctuations could materially impact the value of the VAT receivables in U.S. dollars, as discussed further in note 24(a)(ii).
We believe that the remaining balance is fully recoverable and have not provided an allowance, as discussed further in note 24(b).
| SSR Mining Inc.
|
Financial Statements Year-End 2018 | 38 |
Notes to the Consolidated Financial Statements
SSR Mining Inc.
(tabular amounts expressed in thousands of United States dollars unless otherwise stated)
| 12. | TRADE AND OTHER PAYABLES |
| December 31, 2018 | December 31, 2017 | |||||||
| $ | $ | |||||||
| Trade payables |
15,896 | 16,740 | ||||||
| Accrued liabilities |
43,589 | 29,574 | ||||||
| Accrued royalties |
4,542 | 6,276 | ||||||
| Derivative liabilities |
2,798 | — | ||||||
| Income taxes payable |
8,463 | 4,385 | ||||||
| Accrued interest on convertible notes (note 14(a)) |
3,178 | 3,178 | ||||||
|
|
|
|
|
|||||
| 78,466 | 60,153 | |||||||
|
|
|
|
|
|||||
| 13. | PROVISIONS |
| December 31, 2018 | December 31, 2017 | |||||||||||||||
| Current | Non-current | Current | Non-current | |||||||||||||
| $ | $ | $ | $ | |||||||||||||
| Moratorium (1) |
4,570 | 14,487 | 9,085 | 36,952 | ||||||||||||
| Close down and restoration provision (2) |
211 | 61,961 | 978 | 57,352 | ||||||||||||
| Other provisions |
7 | — | 1,250 | — | ||||||||||||
|
|
|
|
|
|
|
|
|
|||||||||
| 4,788 | 76,448 | 11,313 | 94,304 | |||||||||||||
|
|
|
|
|
|
|
|
|
|||||||||
| (1) | We entered into a fiscal stability agreement with the Federal Government of Argentina in 1998 for production from the Puna Operations. In December 2007, the National Customs Authority of Argentina (Dirección Nacional de Aduanas) (“Customs”) levied an export duty of approximately 10% from concentrate for projects with fiscal stability agreements pre-dating 2002 and Customs had asserted that the Puna Operations was subject to this duty. We had previously challenged the legality of the export duty applied to silver concentrate. |
On March 31, 2017, we entered into the tax moratorium system in Argentina to resolve the export duty dispute. Under the conditions of the moratorium, which converted the export duty liability to ARS, we agreed to pay ARS 1,057,444,000 ($68,621,000 undiscounted) with a 5% down payment initially and the balance in installments over 60 months. Outstanding ARS amounts are subject to interest at a minimum rate of 1.5% per month.
With our entry into the tax moratorium for resolution of our export duty dispute, we are no longer challenging the legality of the application of the export duty other than with respect to our right for reimbursement of the $6,646,000 of export duty that we paid.
| (2) | Our close down and restoration provision relates to the restoration and closure of our mining operations and exploration and evaluation assets (note 9). |
| SSR Mining Inc. | Financial Statements Year-End 2018 | 39
|
Notes to the Consolidated Financial Statements
SSR Mining Inc.
(tabular amounts expressed in thousands of United States dollars unless otherwise stated)
| 13. | PROVISIONS (Continued) |
The changes in the close down and restoration provision during the years ended December 31, 2018 and December 31, 2017 were as follows:
| December 31, 2018 | December 31, 2017 | |||||||
| $ | $ | |||||||
| Balance, beginning of year |
58,330 | 63,909 | ||||||
| Settled during the year |
(852 | ) | (926 | ) | ||||
| Accretion expense |
3,459 | 3,380 | ||||||
| Foreign exchange gain (loss) |
(504 | ) | 396 | |||||
| Revisions and new estimated cash flows |
1,739 | (8,429 | ) | |||||
|
|
|
|
|
|||||
| Balance, end of year |
62,172 | 58,330 | ||||||
|
|
|
|
|
|||||
| Less: current portion |
(211 | ) | (978 | ) | ||||
|
|
|
|
|
|||||
| Non-current close down and restoration provision |
61,961 | 57,352 | ||||||
|
|
|
|
|
|||||
Following notice of our intent to exercise our option on the Chinchillas project in 2017 (note 3), we re-assessed the estimated timing of reclamation cash flows for the Pirquitas property. The extension of the life of the Pirquitas plant has resulted in cash flows related to decommissioning the plant and reclamation of the mine site being extended out by approximately eight years. The impact was a reduction of our close down and restoration provision of $8,317,000, of which $8,458,000 recorded against the carrying value of the plant, and $141,000 was recognized as a benefit in the income statement as the associated mineral property asset had been fully depreciated.
Material provisions are calculated as the present value of estimated future net cash outflows based on the following key assumptions:
| • | Discount interest rates: Marigold mine 2.8% (2017 - 2.6%), Puna Operations 9.9% (2017 - 9.9%), Seabee Gold Operation 2.3% (2017 - 2.3%). |
| • | Settlement of obligations are expected to occur over the next 20 years at the Marigold mine, 15 years at the Puna Operations and 11 years at the Seabee Gold Operation. |
| • | A 1% change in the discount rate would increase or decrease the provision on a consolidated basis by approximately $5,559,000, while holding other assumptions consistent. |
| 14. | DEBT AND CREDIT FACILITY |
| a) | Debt |
We have $265,000,000 of senior convertible unsecured notes (the “Notes”) outstanding. The Notes mature on February 1, 2033 and bear a contractual interest rate of 2.875% per annum, payable semi-annually in arrears on February 1 and August 1 of each year. The Notes are convertible into our common shares at a fixed conversion rate, subject to certain anti-dilution adjustments. In addition, if certain fundamental changes occur to us, holders of the Notes may be entitled to an increased conversion rate. The Notes are convertible into our common shares at an initial conversion rate of 50 common shares per $1,000 principal amount of Notes converted, representing an initial conversion price of $20.00 per common share.
At any time before February 1, 2020, we may redeem all or part of the Notes for cash, but only if the last reported sale price of our common shares for 20 or more trading days in a period of 30 consecutive trading days exceeds 130% of the conversion price. On or after February 1, 2020, we may redeem the Notes in full or in part, for cash.
Holders of the Notes have the right to require us to repurchase all or part of their Notes on February 1 of each of 2020, 2023 and 2028, or upon certain fundamental corporate changes. The repurchase price will be equal to 100% of the principal amount of the Notes being converted, plus accrued and unpaid interest to the repurchase date.
| SSR Mining Inc. | Financial Statements Year-End 2018 | 40
|
Notes to the Consolidated Financial Statements
SSR Mining Inc.
(tabular amounts expressed in thousands of United States dollars unless otherwise stated)
| 14. | DEBT AND CREDIT FACILITY (Continued) |
At initial recognition, the net proceeds of the Notes were bifurcated into their debt and equity components. The fair value of the debt portion of $178,358,000 was estimated using a discounted cash flow model method based on an expected life of seven years and a discount rate of 8.5%. The residual of $77,723,000 ($68,347,000 net of deferred tax) was allocated to equity.
The debt portion has been recorded at amortized cost, net of transaction costs, and is accreted over the expected life using the effective interest method. The movement in the debt portion of the Notes during the years ended December 31, 2018 and 2017 are comprised of the following:
| December 31, 2018 | December 31, 2017 | |||||||
| $ | $ | |||||||
| Balance, beginning of year |
236,358 | 223,211 | ||||||
| Accretion of discount |
14,371 | 13,147 | ||||||
| Interest accrued in period |
7,619 | 7,619 | ||||||
| Interest paid |
(7,619 | ) | (7,619 | ) | ||||
|
|
|
|
|
|||||
| Balance, end of year |
250,729 | 236,358 | ||||||
| Accrued interest outstanding (note 12) |
(3,178 | ) | (3,178 | ) | ||||
|
|
|
|
|
|||||
| Non-current portion of Notes outstanding |
247,551 | 233,180 | ||||||
|
|
|
|
|
|||||
| b) | Credit facility |
On August 4, 2015, we entered into a $75,000,000 senior secured revolving credit facility (the “Credit Facility”) with a syndicate of banks. The Credit Facility may be used for reclamation bonding, working capital and other general corporate purposes. During 2017 we extended the maturity of our Credit Facility to June 8, 2020, and concurrently reduced applicable margins, increased covenant flexibility and added a $25,000,000 accordion feature.
Amounts that are borrowed under the Credit Facility will incur variable interest at London Interbank Offered Rate plus an applicable margin ranging from 2.25% to 3.75% determined based on our net leverage ratio. The Credit Facility also provides for financial letters of credit at 66% of the applicable margin and undrawn fees are 25% of the applicable margin.
All debts, liabilities and obligations under the Credit Facility are guaranteed by our material subsidiaries and secured by certain of our assets, certain of our material subsidiaries, and pledges of the securities of our material subsidiaries. In connection with the Credit Facility, we must also maintain certain net tangible worth and ratios for interest coverage and net leverage. As at December 31, 2018 we were in compliance with these covenants.
As at December 31, 2018, we had utilized $8,000,000 (December 31, 2017 - $7,700,000) of the Credit Facility to support certain letters of credit.
| 15. | SHARE CAPITAL AND SHARE-BASED PAYMENTS |
| a) | Authorized capital |
We have unlimited authorized common shares with no par value.
During 2017, we implemented a new share compensation plan for stock options, performance share units and restricted share units with the first units being issued under the plan in 2018. The new plan provides for treasury settlement up to an aggregate total of 6.5% of our issued and outstanding common shares.
| SSR Mining Inc. | Financial Statements Year-End 2018 | 41
|
Notes to the Consolidated Financial Statements
SSR Mining Inc.
(tabular amounts expressed in thousands of United States dollars unless otherwise stated)
| 15. | SHARE CAPITAL AND SHARE-BASED PAYMENTS (Continued) |
| b) | Stock options |
Our existing incentive plan, approved by our shareholders, under which options to purchase common shares may be granted to officers, employees and others at the discretion of the Board of Directors. The exercise price of each option is set at the date of grant and shall not be less than the closing market price of our stock on the award date. The options can be granted for a maximum term of 10 years with vesting provisions determined by the Board of Directors. Currently, the vesting periods range up to three years, and the term is seven years. New shares from treasury are issued on the exercise of stock options.
The changes in stock options issued during the years ended December 31, 2018 and December 31, 2017 are as follows:
| 2018 | 2017 | |||||||||||||||
| Weighted | Weighted | |||||||||||||||
| Number of stock | average exercise | Number of | average exercise | |||||||||||||
| options | price (C$/option) | stock options | price (C$/option) | |||||||||||||
| Outstanding, beginning of year |
2,976,360 | 9.35 | 3,038,707 | 8.52 | ||||||||||||
| Granted |
668,664 | 11.84 | 489,305 | 12.50 | ||||||||||||
| Exercised |
(899,050 | ) | (7.79 | ) | (440,317 | ) | (6.60 | ) | ||||||||
| Expired |
(56,700 | ) | (14.15 | ) | — | — | ||||||||||
| Forfeited |
(50,525 | ) | (12.70 | ) | (111,335 | ) | (11.25 | ) | ||||||||
|
|
|
|
|
|
|
|
|
|||||||||
| Outstanding, end of year |
2,638,749 | 10.35 | 2,976,360 | 9.35 | ||||||||||||
|
|
|
|
|
|
|
|
|
|||||||||
During the year ended December 31, 2018, options granted to officers and employees had exercise prices ranging from C$11.07 to C$13.39 (December 31, 2017 - C$12.01 to C$14.12) and expiry dates ranging from January 1, 2025 to April 1, 2025.
As of December 31, 2018, incentive stock options constitute 2.2% (2017 - 2.5%) of issued and outstanding common share capital. The aggregate intrinsic value of vested share options (market value less exercise price) at December 31, 2018 was $11,898,000 (December 31, 2017 - $4,076,000).
The weighted average fair value of stock options granted during the year ended December 31, 2018 and year ended December 31, 2017 were estimated to be C$5.06 and C$5.97 per stock option, respectively, at the grant date using the Black-Scholes option pricing model, based on the following assumptions:
| Years ended December 31 |
2018 | 2017 | ||||||
| Forfeiture rate (%) |
3.0 | 3.0 | ||||||
| Dividend yield (%) |
— | — | ||||||
| Average risk-free interest rate (%) |
1.88 | 1.00 | ||||||
| Expected life (years) |
4.2 | 4.2 | ||||||
| Volatility (%) |
55.8 | 60.9 | ||||||
Option pricing models require the input of highly subjective assumptions. The expected life of the options considered such factors as the average length of time similar option grants in the past have remained outstanding prior to exercise and the vesting period of the grants. Volatility was estimated based upon historical price observations over the expected term. Changes in the subjective input assumptions can materially affect the estimated fair value of the options.
The weighted average share price, at the date of grant, of stock options granted in 2018 was C$11.84 (2017 - C$12.50).
The weighted average share price at the date of the exercise of stock options in 2018 was C$14.13 (2017 - C$13.50).
| SSR Mining Inc. | Financial Statements Year-End 2018 | 42
|
Notes to the Consolidated Financial Statements
SSR Mining Inc.
(tabular amounts expressed in thousands of United States dollars unless otherwise stated)
| 15. | SHARE CAPITAL AND SHARE-BASED PAYMENTS (Continued) |
The following table summarizes information about stock options outstanding and exercisable at December 31, 2018:
| Stock options outstanding | Stock options exercisable | |||||||||||||||
| Weighted average | ||||||||||||||||
| remaining | Weighted average | |||||||||||||||
| Stock options | contractual life | Stock options | exercise price | |||||||||||||
| Exercise prices (C$) |
outstanding | (years) | exercisable | (C$/option) | ||||||||||||
| 3.30 - 7.02 |
321,592 | 2.5 | 321,592 | 5.83 | ||||||||||||
| 7.03 - 7.36 |
630,045 | 3.4 | 401,717 | 7.19 | ||||||||||||
| 7.37 - 11.95 |
700,836 | 4.3 | 324,536 | 9.05 | ||||||||||||
| 11.96 - 24.41 |
986,276 | 3.7 | 443,859 | 15.56 | ||||||||||||
|
|
|
|
|
|
|
|
|
|||||||||
| 2,638,749 | 3.6 | 1,491,704 | 9.79 | |||||||||||||
|
|
|
|
|
|
|
|
|
|||||||||
| c) | Deferred Share Units |
Non-executive directors may elect to receive all or a portion of their annual compensation in the form of DSUs which are linked to the value of our common shares. DSUs are issued on a quarterly basis under the terms of the DSU Plan, at the market value of our common shares at the date of grant. DSUs vest immediately and are redeemable in cash on the date the director ceases to be our director.
| 2018 | 2017 | |||||||
| Years ended December 31 |
Number of DSUs | Number of DSUs | ||||||
| Outstanding, beginning of year |
608,763 | 535,579 | ||||||
| Granted |
107,318 | 73,184 | ||||||
| Redeemed |
(182,383 | ) | — | |||||
|
|
|
|
|
|||||
| Outstanding, end of year |
533,698 | 608,763 | ||||||
|
|
|
|
|
|||||
DSUs granted in the year ended December 31, 2018 had a fair value of C$12.49 per unit (2017 - C$12.95). DSUs are cash-settled instruments and, therefore, the fair value of the outstanding DSUs at the end of each reporting period is recognized as an accrued liability with the associated compensation cost recorded in general and administrative expenses. As at December 31, 2018, the fair value was C$16.50 per unit (December 31, 2017 - C$11.07 per unit).
At December 31, 2018, an accrued liability of $6,455,000 (2017 - $5,372,000) was outstanding.
| d) | Restricted Share Units |
RSUs are granted to employees based on the value of our share price at the date of grant. The awards have a graded vesting schedule over a three-year period. The terms of the plan provide the Board of Directors the discretion to elect to settle the units in either cash or shares.
To date, all RSUs have been cash-settled and, therefore, are recognized as a liability, with fair value remeasurement at each reporting period. The associated compensation cost is recorded in general and administrative expenses unless directly attributable to our operations, whereby it is included in cost of inventory, or exploration and evaluation costs.
| SSR Mining Inc. | Financial Statements Year-End 2018 | 43
|
Notes to the Consolidated Financial Statements
SSR Mining Inc.
(tabular amounts expressed in thousands of United States dollars unless otherwise stated)
| 15. | SHARE CAPITAL AND SHARE-BASED PAYMENTS (Continued) |
| 2018 | 2017 | |||||||
| Years ended December 31 |
Number of RSUs | Number of RSUs | ||||||
| Outstanding, beginning of year |
541,006 | 704,055 | ||||||
| Granted |
322,935 | 242,565 | ||||||
| Settled |
(276,983 | ) | (313,003 | ) | ||||
| Forfeited |
(161,863 | ) | (92,611 | ) | ||||
|
|
|
|
|
|||||
| Outstanding, end of year |
425,095 | 541,006 | ||||||
|
|
|
|
|
|||||
RSUs granted in the year ended December 31, 2018 had a weighted average fair value of C$11.47 per unit (2017 - C$14.06 per unit). RSUs settled in the year ended December 31, 2018 were settled at a fair value of C$12.33 per unit (2017 - C$13.98). As at December 31, 2018, the fair value was C$16.50 per unit (December 31, 2017 - C$11.07 per unit).
At December 31, 2018, an accrued liability of $2,949,000 (2017 - $3,339,000) was outstanding.
| e) | Performance Share Units |
PSUs are granted to senior executives, and vest after a performance period of three years. The vesting of these awards is based on our total shareholder return in comparison to our peer group and awards vested range from 0% to 200% of initial PSUs granted. The terms of the plan provide the Board of Directors the discretion to elect to settle PSUs in either cash or shares.
To date, all PSUs have been cash-settled and, therefore, are recognized as a liability, with fair value remeasurement at each reporting period. The associated compensation cost is recorded in general and administrative expenses.
| 2018 | 2017 | |||||||
| Years ended December 31 |
Number of PSUs | Number of PSUs | ||||||
| Outstanding, beginning of year |
391,432 | 524,550 | ||||||
| Granted |
174,900 | 159,850 | ||||||
| Settled |
(255,232 | ) | (190,000 | ) | ||||
| Forfeited |
— | (102,968 | ) | |||||
|
|
|
|
|
|||||
| Outstanding, end of year |
311,100 | 391,432 | ||||||
|
|
|
|
|
|||||
PSUs granted in the year ended December 31, 2018 had a weighted average fair value of C$10.72 per unit (2017 - C$12.62 per unit). PSUs settled in the year ended December 31, 2018 were settled at a value of C$23.09 per unit (December 31, 2017 - C$13.97). As at December 31, 2018, the estimated weighted average value was C$26.76 per unit (2017 - C$9.47 per unit).
At December 31, 2018, an accrued liability of $7,230,000 (2017 - $1,299,000) was outstanding.
| SSR Mining Inc. | Financial Statements Year-End 2018 | 44
|
Notes to the Consolidated Financial Statements
SSR Mining Inc.
(tabular amounts expressed in thousands of United States dollars unless otherwise stated)
| 15. | SHARE CAPITAL AND SHARE-BASED PAYMENTS (Continued) |
| f) | Share-based compensation |
Total share-based compensation, including all equity and cash-settled arrangements, for the years ended December 31, 2018 and 2017 has been recognized in the consolidated financial statements as follows:
| Years ended December 31 |
2018 $ |
2017 $ |
||||||
| Equity-settled |
||||||||
| Cost of inventory |
160 | 190 | ||||||
| General and administrative expense |
1,958 | 1,988 | ||||||
| Exploration, evaluation and reclamation expenses |
39 | 41 | ||||||
| Cash-settled |
||||||||
| Cost of inventory |
1,024 | 1,639 | ||||||
| General and administrative expense |
11,412 | 2,237 | ||||||
| Exploration, evaluation and reclamation expenses |
125 | — | ||||||
|
|
|
|
|
|||||
| Total |
14,718 | 6,095 | ||||||
|
|
|
|
|
|||||
| 16. | OTHER RESERVES AND NON-CONTROLLING INTEREST |
| a) | Reserves |
| 2018 | 2017 | |||||||
| $ | $ | |||||||
| Foreign currency translation reserve |
||||||||
| At beginning of year |
781 | 781 | ||||||
|
|
|
|
|
|||||
| At end of year |
781 | 781 | ||||||
|
|
|
|
|
|||||
| Revaluation reserves |
||||||||
| At beginning of year |
3,353 | (23,121 | ) | |||||
| Gain on marketable securities at FVTOCI, net of tax |
(37,686 | ) | 25,948 | |||||
| Unrealized gain on effective portion of derivative, net of tax |
(2,907 | ) | 526 | |||||
|
|
|
|
|
|||||
| At end of year |
(37,240 | ) | 3,353 | |||||
|
|
|
|
|
|||||
| Share-based compensation reserve |
||||||||
| At beginning of year |
50,404 | 49,524 | ||||||
| Stock options exercised |
(2,864 | ) | (1,339 | ) | ||||
| Share-based compensation |
2,156 | 2,219 | ||||||
|
|
|
|
|
|||||
| At end of year |
49,696 | 50,404 | ||||||
|
|
|
|
|
|||||
| Other |
||||||||
| At beginning of year |
(29,540 | ) | (28,198 | ) | ||||
| Recognition of joint venture |
— | (1,342 | ) | |||||
|
|
|
|
|
|||||
| At end of year |
(29,540 | ) | (29,540 | ) | ||||
|
|
|
|
|
|||||
| Total other reserves at December 31 |
(16,303 | ) | 24,998 | |||||
|
|
|
|
|
|||||
| SSR Mining Inc. | Financial Statements Year-End 2018 | 45
|
Notes to the Consolidated Financial Statements
SSR Mining Inc.
(tabular amounts expressed in thousands of United States dollars unless otherwise stated)
| 16. | OTHER RESERVES AND NON-CONTROLLING INTEREST (Continued) |
| b) | Non-controlling Interest |
| 2018 | 2017 | |||||||
| $ | $ | |||||||
| At beginning of year |
23,043 | — | ||||||
| Recognition of non-controlling interest |
— | 18,573 | ||||||
| Funding from non-controlling interest |
15,196 | 2,320 | ||||||
| Total comprehensive (loss) income for the year attributable to non-controlling interest |
(6,410 | ) | 2,150 | |||||
|
|
|
|
|
|||||
| Total non-controlling interest at December 31 |
31,829 | 23,043 | ||||||
|
|
|
|
|
|||||
| 17. | REVENUE |
| Years ended December 31 |
2018 $ |
2017 $ |
||||||
| Gold doré and bullion sales |
365,996 | 358,790 | ||||||
| Concentrate sales |
57,461 | 88,823 | ||||||
| Other revenue |
(2,782 | ) | 1,160 | |||||
|
|
|
|
|
|||||
| 420,675 | 448,773 | |||||||
|
|
|
|
|
|||||
| 18. | OPERATING COSTS BY NATURE |
| a) | Cost of sales |
| Years ended December 31 |
2018 $ |
2017 $ |
||||||
| Cost of inventory |
245,111 | 242,998 | ||||||
| Depletion, depreciation and amortization |
98,719 | 102,416 | ||||||
| Moratorium (settlement) (note 13) |
— | (4,303 | ) | |||||
| (Recovery) of inventory provision (note 7) |
— | (5,710 | ) | |||||
| Restructuring costs |
— | 109 | ||||||
|
|
|
|
|
|||||
| 343,830 | 335,510 | |||||||
|
|
|
|
|
|||||
| SSR Mining Inc. | Financial Statements Year-End 2018 | 46
|
Notes to the Consolidated Financial Statements
SSR Mining Inc.
(tabular amounts expressed in thousands of United States dollars unless otherwise stated)
| 18. | OPERATING COSTS BY NATURE (Continued) |
| b) | General and administrative expenses |
| Years ended December 31 |
2018 $ |
2017 $ |
||||||
| Salaries and benefits |
12,157 | 9,029 | ||||||
| Share-based compensation |
13,371 | 4,225 | ||||||
| Consulting and professional fees |
3,036 | 2,288 | ||||||
| Travel expense |
1,044 | 562 | ||||||
| Rent expense |
842 | 703 | ||||||
| Insurance expense |
676 | 569 | ||||||
| Computer expenses |
668 | 789 | ||||||
| Depreciation and amortization |
194 | 202 | ||||||
| Shareholder and investor relations |
99 | 323 | ||||||
| Listing and filing fees |
249 | 251 | ||||||
| Directors fees and expenses |
347 | 227 | ||||||
| Other expenses |
258 | 1,139 | ||||||
|
|
|
|
|
|||||
| 32,941 | 20,307 | |||||||
|
|
|
|
|
|||||
| 19. | FINANCE INCOME AND EXPENSES |
| a) | Interest earned and other finance income |
| Years ended December 31 |
2018 $ |
2017 $ |
||||||
| Interest earned |
9,219 | 4,132 | ||||||
| Accretion income on deferred consideration |
2,542 | 1,998 | ||||||
|
|
|
|
|
|||||
| Total interest earned and other finance income |
11,761 | 6,130 | ||||||
|
|
|
|
|
|||||
| b) | Interest expense and other finance expenses |
| Years ended December 31 |
2018 $ |
2017 $ |
||||||
| Interest expense on convertible notes (note 14) |
(7,619 | ) | (7,619 | ) | ||||
| Accretion expense on convertible notes (note 14) |
(14,371 | ) | (13,147 | ) | ||||
| Accretion of close down and restoration provision (note 13) |
(3,459 | ) | (3,380 | ) | ||||
| Interest on moratorium |
(6,212 | ) | (7,616 | ) | ||||
| Other finance expenses |
(1,969 | ) | (3,108 | ) | ||||
|
|
|
|
|
|||||
| Total interest expense and other finance expenses |
(33,630 | ) | (34,870 | ) | ||||
|
|
|
|
|
|||||
| SSR Mining Inc. | Financial Statements Year-End 2018 | 47
|
Notes to the Consolidated Financial Statements
SSR Mining Inc.
(tabular amounts expressed in thousands of United States dollars unless otherwise stated)
| 20. | OTHER (EXPENSES) INCOME |
| Years ended December 31 |
2018 $ |
2017 $ |
||||||
| Loss on disposal of plant and equipment |
(5,344 | ) | (3,068 | ) | ||||
| Expense related to the premium paid for shares over the prevailing market price |
(2,782 | ) | — | |||||
| Write-down of mineral properties |
— | (906 | ) | |||||
| Royalty income |
— | 1,417 | ||||||
| Other |
(1,023 | ) | (510 | ) | ||||
|
|
|
|
|
|||||
| (9,149 | ) | (3,067 | ) | |||||
|
|
|
|
|
|||||
| 21. | INCOME PER SHARE |
The calculations of basic and diluted income per share for the years ended December 31, 2018 and 2017 are based on the following:
| Years ended December 31 |
2018 $ |
2017 $ |
||||||
| (Loss) Income for the year |
(31 | ) | 71,466 | |||||
|
|
|
|
|
|||||
| Non-controlling interest |
(6,410 | ) | 2,150 | |||||
| Income attributable to equity holders of SSR Mining used in the calculation of income per share |
6,379 | 69,316 | ||||||
|
|
|
|
|
|||||
| Weighted average number of common shares issued (thousands) |
120,137 | 119,593 | ||||||
| Adjustments for dilutive instruments: |
||||||||
| Stock options (thousands) |
1,217 | 1,088 | ||||||
|
|
|
|
|
|||||
| Weighted average number of common shares for diluted income per share (thousands) |
121,354 | 120,681 | ||||||
|
|
|
|
|
|||||
| Basic income per share |
$ | 0.05 | $ | 0.58 | ||||
| Diluted income per share |
$ | 0.05 | $ | 0.57 | ||||
| SSR Mining Inc. | Financial Statements Year-End 2018 | 48
|
Notes to the Consolidated Financial Statements
SSR Mining Inc.
(tabular amounts expressed in thousands of United States dollars unless otherwise stated)
| 22. | OPERATING SEGMENTS |
We are a resource company focused on the operation, acquisition, exploration and development of precious metal resource properties located in the Americas.
An operating segment is defined as a component:
| • | that engages in business activities from which it may earn revenues and incur expenses; |
| • | whose operating results are reviewed regularly by the entity’s chief operating decision maker; and |
| • | for which discrete financial information is available. |
We have identified operating segments based on the information used by our President and Chief Executive Officer (who is considered to be the chief operating decision maker) to manage the business. We primarily manage our business by looking at individual resource projects and typically segregate these projects between production, development and exploration.
For reporting purposes, exploration and evaluation projects have been aggregated into a single reportable segment as they all have similar characteristics and do not exceed the quantitative thresholds for individual disclosure. We have assessed that all exploration and evaluation segments have similar characteristics as they are engaged in similar activities (mineral exploration) and none of the segments are income-producing.
Our three operating properties, the Marigold mine, the Seabee Gold Operation and the Puna Operations, are considered as individual operating segments which derive their revenues from the sale of precious and other metals. The corporate division earns income that is considered incidental to our activities and therefore does not meet the definition of an operating segment. Consequently, the following reporting segments have been identified:
| • | Marigold mine; |
| • | Seabee Gold Operation; |
| • | Puna Operations; and |
| • | Exloration, evaluation and development properties. |
| SSR Mining Inc. | Financial Statements Year-End 2018 | 49
|
Notes to the Consolidated Financial Statements
SSR Mining Inc.
(tabular amounts expressed in thousands of United States dollars unless otherwise stated)
| 22. | OPERATING SEGMENTS (Continued) |
The following is a summary of the reported amounts of income or loss, and the carrying amounts of assets and liabilities by operating segment:
|
Year ended and at December 31, 2018 |
Marigold mine $ |
Seabee Gold Operation $ |
Puna Operations (1) $ |
Exploration, evaluation and development properties $ |
Other reconciling items (2) $ |
Total $ |
||||||||||||||||||
| Revenue |
250,341 | 115,655 | 54,679 | — | — | 420,675 | ||||||||||||||||||
|
|
|
|
|
|
|
|
|
|
|
|
|
|||||||||||||
| Cost of inventory |
(143,380 | ) | (46,054 | ) | (55,677 | ) | — | — | (245,111 | ) | ||||||||||||||
| Depletion, depreciation and amortization |
(56,748 | ) | (38,818 | ) | (3,153 | ) | — | — | (98,719 | ) | ||||||||||||||
|
|
|
|
|
|
|
|
|
|
|
|
|
|||||||||||||
| Cost of sales |
(200,128 | ) | (84,872 | ) | (58,830 | ) | — | — | (343,830 | ) | ||||||||||||||
|
|
|
|
|
|
|
|
|
|
|
|
|
|||||||||||||
| Income from mine operations |
50,213 | 30,783 | (4,151 | ) | — | — | 76,845 | |||||||||||||||||
|
|
|
|
|
|
|
|
|
|
|
|
|
|||||||||||||
| Exploration, evaluation and reclamation expenses |
(769 | ) | (7,703 | ) | 919 | (2,857 | ) | (3,599 | ) | (14,009 | ) | |||||||||||||
| Operating income (loss) |
43,399 | 20,657 | (8,457 | ) | (2,801 | ) | (22,903 | ) | 29,895 | |||||||||||||||
| Income (loss) before income tax |
26,239 | 20,204 | (9,066 | ) | (2,751 | ) | (26,536 | ) | 8,090 | |||||||||||||||
|
|
|
|
|
|
|
|
|
|
|
|
|
|||||||||||||
| Total assets |
478,187 | 448,891 | 185,298 | 71,830 | 336,932 | 1,521,138 | ||||||||||||||||||
| Non-current assets |
235,242 | 321,802 | 121,890 | 69,263 | 26,498 | 774,695 | ||||||||||||||||||
| Total liabilities |
(79,210 | ) | (93,017 | ) | (62,243 | ) | (6,330 | ) | (274,362 | ) | (515,162 | ) | ||||||||||||
|
|
|
|
|
|
|
|
|
|
|
|
|
|||||||||||||
| Year ended and at December 31, 2017 |
Marigold mine $ |
Seabee Gold Operation $ |
Puna Operations (1) $ |
Exploration, evaluation and development properties $ |
Other reconciling items (2) $ |
Total $ |
||||||||||||||||||
| Revenue |
250,825 | 108,334 | 89,614 | — | — | 448,773 | ||||||||||||||||||
|
|
|
|
|
|
|
|
|
|
|
|
|
|||||||||||||
| Cost of inventory |
(129,176 | ) | (51,683 | ) | (62,139 | ) | — | — | (242,998 | ) | ||||||||||||||
| Depletion, depreciation and amortization |
(54,983 | ) | (40,375 | ) | (7,058 | ) | — | — | (102,416 | ) | ||||||||||||||
| Export duties reversal (note 13) |
— | — | 4,303 | — | — | 4,303 | ||||||||||||||||||
| Restructuring costs (note 18) |
— | — | (109 | ) | — | — | (109 | ) | ||||||||||||||||
| Inventory (provision) reversal (note 7) |
— | (632 | ) | 6,342 | — | — | 5,710 | |||||||||||||||||
|
|
|
|
|
|
|
|
|
|
|
|
|
|||||||||||||
| Cost of sales |
(184,159 | ) | (92,690 | ) | (58,661 | ) | — | — | (335,510 | ) | ||||||||||||||
|
|
|
|
|
|
|
|
|
|
|
|
|
|||||||||||||
| Income from mine operations |
66,666 | 15,644 | 30,953 | — | — | 113,263 | ||||||||||||||||||
|
|
|
|
|
|
|
|
|
|
|
|
|
|||||||||||||
| Exploration, evaluation and reclamation expenses |
(1,875 | ) | (5,050 | ) | (324 | ) | (8,357 | ) | (375 | ) | (15,981 | ) | ||||||||||||
| Impairment reversal (note 9) |
— | — | 24,357 | — | — | 24,357 | ||||||||||||||||||
| Operating income (loss) |
64,935 | 10,594 | 52,788 | (8,360 | ) | (18,625 | ) | 101,332 | ||||||||||||||||
| Income (loss) before income tax |
63,959 | 10,126 | 46,379 | (14,840 | ) | (31,037 | ) | 74,587 | ||||||||||||||||
|
|
|
|
|
|
|
|
|
|
|
|
|
|||||||||||||
| Total assets |
436,815 | 418,210 | 200,590 | 72,825 | 409,014 | 1,537,454 | ||||||||||||||||||
| Non-current assets |
222,800 | 346,647 | 77,112 | 71,782 | 798 | 719,139 | ||||||||||||||||||
| Total liabilities |
(73,526 | ) | (92,050 | ) | (77,850 | ) | (6,496 | ) | (263,604 | ) | (513,526 | ) | ||||||||||||
|
|
|
|
|
|
|
|
|
|
|
|
|
|||||||||||||
| (1) | Following the formation of the Puna Operations joint venture in 2017, the Pirquitas property was combined with the Chinchillas project into the Puna Operations operating segment and the segment has been amended accordingly. We consolidate Puna Operations which includes non-controlling interest portion of revenues, and income (loss) from mine operations for the year ended December 31, 2018 of $13,077,000 and $(1,243,000), respectively, (2017: $12,361,000 and $4,039,000) |
| (2) | Other reconciling items refer to items that are not reported as part of segment performance as they are managed on a corporate basis. |
| SSR Mining Inc.
|
Financial Statements Year-End 2018 | 50 |
Notes to the Consolidated Financial Statements
SSR Mining Inc.
(tabular amounts expressed in thousands of United States dollars unless otherwise stated)
| 22. | OPERATING SEGMENTS (Continued) |
Revenue by product
Our Marigold mine and Seabee Gold Operation produce gold in doré form. This is unrefined gold bullion bars usually consisting of in excess of 90% gold that is refined to pure gold bullion prior to sale to our customers, which are typically bullion banks.
Puna Operations produces silver, zinc and lead concentrates, which are sold to smelters or traders for further refining. During 2018, one customer accounted for 51% (2017 - 7%) of our concentrate revenue.
| Years ended December 31 |
2018 % |
2017 % |
||||||
| Gold |
87 | 80 | ||||||
| Silver |
12 | 20 | ||||||
| Zinc |
1 | — | ||||||
| Lead |
— | — | ||||||
Non-current assets by location
| December 31, 2018 $ |
December 31, 2017 $ |
|||||||
| Canada |
357,783 | 348,455 | ||||||
| United States |
236,054 | 224,612 | ||||||
| Argentina |
113,534 | 79,250 | ||||||
| Mexico |
66,749 | 66,131 | ||||||
| Other |
575 | 691 | ||||||
|
|
|
|
|
|||||
| Total |
774,695 | 719,139 | ||||||
|
|
|
|
|
|||||
| SSR Mining Inc.
|
Financial Statements Year-End 2018 | 51 |
Notes to the Consolidated Financial Statements
SSR Mining Inc.
(tabular amounts expressed in thousands of United States dollars unless otherwise stated)
| 23. | FINANCIAL INSTRUMENTS AND FAIR VALUE MEASUREMENTS |
Our financial instruments include cash and cash equivalents, trade receivables, marketable securities, other financial assets, trade and other payables, moratorium and our Notes.
| a) | Financial assets and liabilities by category |
| At December 31, 2018 |
Amortized cost $ |
FVTPL $ |
FVTOCI $ |
Total $ |
||||||||||||
| Financial assets |
||||||||||||||||
| Cash and cash equivalents (note 4) |
— | 419,212 | — | 419,212 | ||||||||||||
| Trade receivables (1) (note 5) |
— | 11,287 | — | 11,287 | ||||||||||||
| Marketable securities (note 6) |
— | — | 29,542 | 29,542 | ||||||||||||
| Other financial assets (note 8) |
25,172 | 3,711 | — | 28,883 | ||||||||||||
|
|
|
|
|
|
|
|
|
|||||||||
| Total financial assets |
25,172 | 434,210 | 29,542 | 488,924 | ||||||||||||
|
|
|
|
|
|
|
|
|
|||||||||
| Financial liabilities |
||||||||||||||||
| Trade and other payables |
54,118 | 15,885 | — | 70,003 | ||||||||||||
| Non-current portion of debt (note 14(a)) |
247,551 | — | — | 247,551 | ||||||||||||
|
|
|
|
|
|
|
|
|
|||||||||
| Total financial liabilities |
301,669 | 15,885 | — | 317,554 | ||||||||||||
|
|
|
|
|
|
|
|
|
|||||||||
| At December 31, 2017 |
Amortized cost $ |
FVTPL $ |
FVTOCI $ |
Total $ |
||||||||||||
| Financial assets |
||||||||||||||||
| Cash and cash equivalents (note 4) |
— | 459,864 | — | 459,864 | ||||||||||||
| Trade receivables (1) (note 5) |
— | 14,848 | — | 14,848 | ||||||||||||
| Marketable securities (note 6) |
— | — | 114,001 | 114,001 | ||||||||||||
| Other financial assets (note 8) |
14,773 | 7,626 | — | 22,399 | ||||||||||||
|
|
|
|
|
|
|
|
|
|||||||||
| Total financial assets |
14,773 | 482,338 | 114,001 | 611,112 | ||||||||||||
|
|
|
|
|
|
|
|
|
|||||||||
| Financial liabilities |
||||||||||||||||
| Trade and other payables |
45,759 | 10,009 | — | 55,768 | ||||||||||||
| Non-current portion of debt (note 14(a)) |
233,180 | — | — | 233,180 | ||||||||||||
|
|
|
|
|
|
|
|
|
|||||||||
| Total financial liabilities |
278,939 | 10,009 | — | 288,948 | ||||||||||||
|
|
|
|
|
|
|
|
|
|||||||||
| (1) | Certain trade receivables are classified as FVTPL due to the derivative identified through provisional pricing arrangements discussed in note 2(f). |
| SSR Mining Inc. | Financial Statements Year-End 2018 | 52
|
Notes to the Consolidated Financial Statements
SSR Mining Inc.
(tabular amounts expressed in thousands of United States dollars unless otherwise stated)
| 23. | FINANCIAL INSTRUMENTS AND FAIR VALUE MEASUREMENTS (Continued) |
| b) | Fair value of financial instruments |
| December 31, 2018 | December 31, 2017 | |||||||||||||||
| Carrying value $ |
Fair value $ |
Carrying value $ |
Fair value $ |
|||||||||||||
| Trade receivables |
11,287 | 11,287 | 14,848 | 14,848 | ||||||||||||
| Marketable securities (note 6) |
29,542 | 29,542 | 114,001 | 114,001 | ||||||||||||
| Other financial assets (note 8) |
28,883 | 28,883 | 22,399 | 22,399 | ||||||||||||
| Non-current portion of debt (note 14(a)) (1) |
(247,551 | ) | (263,675 | ) | (233,180 | ) | (259,578 | ) | ||||||||
|
|
|
|
|
|
|
|
|
|||||||||
| (177,839 | ) | (193,963 | ) | (81,932 | ) | (108,330 | ) | |||||||||
|
|
|
|
|
|
|
|
|
|||||||||
| (1) | The fair value of the Notes includes both the debt and equity components. |
The carrying values of cash and cash equivalents and trade and other payables approximate their fair values due to their short maturity.
Fair value hierarchy
Assets and liabilities that are held at fair value are categorized based on a valuation hierarchy which is determined by the valuation methodology utilized:
| Fair value at December 31, 2018 | ||||||||||||||||
| Quoted prices in active market (1) $ |
Significant other observable inputs (2) $ |
Significant unobservable inputs (3) $ |
Total $ |
|||||||||||||
| Recurring measurements |
||||||||||||||||
| Trade receivables |
— | 11,287 | — | 11,287 | ||||||||||||
| Marketable securities (note 6) |
29,542 | — | — | 29,542 | ||||||||||||
| Other financial assets |
— | — | 3,711 | 3,711 | ||||||||||||
| Accrued liabilities |
— | (16,649 | ) | — | (16,649 | ) | ||||||||||
|
|
|
|
|
|
|
|
|
|||||||||
| 29,542 | (5,362 | ) | 3,711 | 27,891 | ||||||||||||
|
|
|
|
|
|
|
|
|
|||||||||
| Fair values disclosed |
||||||||||||||||
| Convertible notes |
(263,675 | ) | — | — | (263,675 | ) | ||||||||||
|
|
|
|
|
|
|
|
|
|||||||||
| (263,675 | ) | — | — | (263,675 | ) | |||||||||||
|
|
|
|
|
|
|
|
|
|||||||||
| SSR Mining Inc.
|
Financial Statements Year-End 2018 | 53 |
Notes to the Consolidated Financial Statements
SSR Mining Inc.
(tabular amounts expressed in thousands of United States dollars unless otherwise stated)
| 23. | FINANCIAL INSTRUMENTS AND FAIR VALUE MEASUREMENTS (Continued) |
| Fair value at December 31, 2017 | ||||||||||||||||
| Quoted prices in active market (1) $ |
Significant other observable inputs (2) $ |
Significant unobservable inputs (3) $ |
Total $ |
|||||||||||||
| Recurring measurements |
||||||||||||||||
| Trade receivables |
— | 14,848 | — | 14,848 | ||||||||||||
| Marketable securities (note 6) |
114,001 | — | — | 114,001 | ||||||||||||
| Other financial assets |
— | — | 6,338 | 6,338 | ||||||||||||
| Derivative assets |
— | 1,287 | — | 1,287 | ||||||||||||
| Accrued liabilities |
— | (10,009 | ) | — | (10,009 | ) | ||||||||||
|
|
|
|
|
|
|
|
|
|||||||||
| 114,001 | 6,126 | 6,338 | 126,465 | |||||||||||||
|
|
|
|
|
|
|
|
|
|||||||||
| Non-recurring measurement |
||||||||||||||||
| Deferred consideration |
— | — | 7,399 | 7,399 | ||||||||||||
|
|
|
|
|
|
|
|
|
|||||||||
| — | — | 7,399 | 7,399 | |||||||||||||
|
|
|
|
|
|
|
|
|
|||||||||
| Fair values disclosed |
||||||||||||||||
| Convertible notes |
(259,578 | ) | — | — | (259,578 | ) | ||||||||||
|
|
|
|
|
|
|
|
|
|||||||||
| (259,578 | ) | — | — | (259,578 | ) | |||||||||||
|
|
|
|
|
|
|
|
|
|||||||||
| (1) | Marketable securities of publicly quoted companies, consisting of FVTOCI investments are valued using a market approach based upon unadjusted quoted prices in an active market obtained from securities exchanges. The fair value disclosed for our Notes is also included in Level 1, as the basis of valuation uses a quoted price in an active market. |
| (2) | Trade receivables from provisional invoices are included in Level 2 as the basis of valuation uses quoted commodity forward prices. Accrued liabilities relating to DSUs, RSUs, and PSUs and derivative assets and liabilities are included in Level 2 as the basis of valuation uses quoted prices in active markets. |
| (3) | Certain items of deferred consideration from the sale of exploration and evaluation assets (note 8) is included in Level 3, as certain assumptions used in the calculation of the fair value are not based on observable market data as detailed in note 2(r)(v). During the year ended December 31, 2018, we transferred $nil from Level 3 to Level 1. During 2017, we transferred $2,057,000 from Level 3 to Level 1 following the reverse take-over (“RTO”) of Huayra Minerals Corporation (“HMC”) the shares of a previously private company that we classified as Level 3 became publicly traded as AbraPlata Resource Corp. and the fair value is now based upon observable market data (note 8). |
| 24. | FINANCIAL RISK MANAGEMENT |
We are exposed to a variety of financial risks as a result of our operations, including market risk (which includes price risk, currency risk and interest rate risk), credit risk and liquidity risk. Our overall risk management strategy seeks to reduce potential adverse effects on our financial performance. Risk management is carried out under policies approved by our Board of Directors.
We may, from time to time, use foreign exchange contracts, commodity price contracts, equity hedges and interest rate swaps to manage our exposure to fluctuations in foreign currency, metal and energy prices, marketable securities values and interest rates. We do not have a practice of trading derivatives. Our use of derivatives is limited to specific programs to manage fluctuations in foreign exchange, diesel prices and marketable securities risks, which are subject to the oversight of our Board of Directors.
The risks associated with our financial instruments, and the policies on how we mitigate those risks are set out below. This is not intended to be a comprehensive discussion of all risks.
| SSR Mining Inc.
|
Financial Statements Year-End 2018 | 54 |
Notes to the Consolidated Financial Statements
SSR Mining Inc.
(tabular amounts expressed in thousands of United States dollars unless otherwise stated)
| 24. | FINANCIAL RISK MANAGEMENT (Continued) |
| a) | Market Risk |
This is the risk that the fair values of financial instruments will fluctuate owing to changes in market prices. The significant market risks to which we are exposed are price risk, currency risk and interest rate risk.
| (i) | Price Risk |
This is the risk that the fair values or future cash flows of our financial instruments will fluctuate because of changes in market prices. Income from mine operations in the next year depends on the metal prices for gold and silver, lead and zinc and also prices of input commodities such as diesel. These prices are affected by numerous factors that are outside of our control, such as:
| • | global or regional consumption patterns; |
| • | the supply of, and demand for, these commodities; |
| • | speculative activities; |
| • | the availability and costs of substitutes; |
| • | inflation; and |
| • | political and economic conditions, including interest rates and currency values. |
The principal financial instruments that we hold which are impacted by commodity prices are our silver concentrate trade receivables. The majority of our sales agreements are subject to pricing terms that settle within one to three months after delivery of concentrate, and this adjustment period represents our trade receivable exposure to variations in commodity prices.
We have not hedged the price of any metal as part of our overall corporate strategy.
We hedge a portion of our diesel consumption with the objective of securing future costs. We executed swap and option contracts under a risk management policy approved by our Board of Directors. In addition, due to the ice road supply at the Seabee Gold Operation, we purchase annual consumable supplies in advance at prices which are generally fixed at time of purchase, not during period of use.
A 10% increase or decrease in the silver prices as at December 31, 2018, with all other variables held constant, would have resulted in a $891,000 (December 31, 2017 - $987,000) increase or decrease to our trade receivables and after-tax net income.
As we do not have trade receivables for gold sales, movements in gold prices will not impact the value of any financial instruments.
The costs relating to our production activities vary depending on market prices on mining consumables including diesel fuel and electricity.
During 2018, under our risk management policy we have used swaps and options to manage a portion of our cost of diesel.
| SSR Mining Inc. | Financial Statements Year-End 2018 | 55
|
Notes to the Consolidated Financial Statements
SSR Mining Inc.
(tabular amounts expressed in thousands of United States dollars unless otherwise stated)
| 24. | FINANCIAL RISK MANAGEMENT (Continued) |
Marigold Mine
Our instruments are based on the ultra low sulphur Gulf Coast diesel index for diesel consumed at the Marigold mine. As at December 31, 2018, the spot price of diesel was $1.56/gallon and we have hedged the following future anticipated usage at the Marigold mine:
| 2019 | 2020 | |||||||
| Gallons hedged (in thousands) |
5,364 | 3,600 | ||||||
| Estimated usage |
52.6 | % | 35.3 | % | ||||
| Floor price ($/gallon) |
1.70 | 1.75 | ||||||
| Cap price ($/gallon) |
2.34 | 2.36 | ||||||
For the year ended December 31, 2018, for the Marigold mine we had a mark-to-market loss of $ 1,544,000 (2017 - gain of $117,000) on outstanding diesel fuel hedges recognized in other comprehensive income. As and when it is determined to be favourable, we may execute additional diesel fuel hedges under our risk management policy.
Seabee Gold Operation
Our instruments are based on the US New York Harbour diesel index for diesel consumed at the Seabee Gold Operation. As at December 31, 2018, the spot price of diesel was $0.44/litre and we have hedged the following future anticipated usage at the Seabee mine:
| 2019 | 2020 | |||||||
| Litres hedged (in thousands) |
3,188 | — | ||||||
| Estimated usage |
75 | % | — | |||||
| Floor price ($/litre) |
0.46 | — | ||||||
| Cap price ($/litre) |
0.55 | — | ||||||
For the year ended December 31, 2018, for the Seabee Gold Operation we had a mark-to-market loss of $144,000 (December 31, 2017 - $Nil) on outstanding diesel fuel hedges recognized in other comprehensive income. As and when it is determined to be favourable, we may execute additional diesel fuel hedges under our risk management policy.
We hold certain investments in marketable securities which are measured at fair value, being the closing price of each equity investment at the balance sheet date. We are exposed to changes in share prices which would result in gains and losses being recognized in OCI. A 10% change in prices would have a $2,555,000 impact on total comprehensive income at December 31, 2018 (December 31, 2017 - $9,861,000). We did not hedge any securities in 2018 or 2017.
| SSR Mining Inc. | Financial Statements Year-End 2018 | 56
|
Notes to the Consolidated Financial Statements
SSR Mining Inc.
(tabular amounts expressed in thousands of United States dollars unless otherwise stated)
| 24. | FINANCIAL RISK MANAGEMENT (Continued) |
| (ii) | Currency Risk |
Currency risk is the risk that the fair values or future cash flows of our financial instruments and other assets and liabilities will fluctuate because of changes in foreign currency rates. Our financial instruments are exposed to currency risk where those instruments are denominated in currencies that are not the same as the functional currency of the entity that holds them; exchange gains and losses in these situations impact earnings.
The following are the most significant areas of exposure to currency risk, shown in thousands of U.S. dollars:
| December 31, 2018 | ||||||||
| Canadian dollar | Argentine peso | |||||||
| Cash |
7,982 | 1,604 | ||||||
| Value added tax receivable |
145 | 17,039 | ||||||
| Trade and other payables (excluding VAT and income taxes) |
(22,974 | ) | (9,908 | ) | ||||
| Provisions |
— | (19,056 | ) | |||||
|
|
|
|
|
|||||
| Total |
(14,847 | ) | (10,321 | ) | ||||
|
|
|
|
|
|||||
| December 31, 2017 | ||||||||
| Canadian dollar | Argentine peso | |||||||
| Cash |
5,342 | 17,223 | ||||||
| Value added tax receivable |
206 | 12,242 | ||||||
| Other financial assets |
200 | 884 | ||||||
| Trade and other payables (excluding VAT and income taxes) |
(17,017 | ) | (5,021 | ) | ||||
| Provisions |
— | (47,287 | ) | |||||
|
|
|
|
|
|||||
| Total |
(11,269 | ) | (21,959 | ) | ||||
|
|
|
|
|
|||||
We monitor and manage this risk with the objective of ensuring our company-wide exposure to negative fluctuations in currencies against the U.S. dollar is managed.
Over the course of 2018, ARS continued to devalue by approximately 102% compared to 17% in 2017. Following our entry into the moratorium in Argentina in 2017, our U.S. dollar export duty provision was converted into an Argentine peso liability (note 13). Correspondingly, we now have a net Argentine peso liability position which has resulted in foreign exchange gains as a result of the devaluation of the Argentine peso.
The Canadian dollar was relatively stable through most of 2018, ending the year having depreciated by 8.7% (2017 - appreciated by 7%) and closing at $1.36 Canadian dollar per $1.00 U.S. dollar. This has negatively impacted the value of our marketable securities and our Canadian dollar cash, while having a marginally positive impact on our Canadian operating costs and liabilities in U.S. dollar terms.
| SSR Mining Inc. | Financial Statements Year-End 2018 | 57
|
Notes to the Consolidated Financial Statements
SSR Mining Inc.
(tabular amounts expressed in thousands of United States dollars unless otherwise stated)
| 24. | FINANCIAL RISK MANAGEMENT (Continued) |
The acquisition of the Seabee Gold Operation in 2016 materially increased our exposure to Canadian dollar operating and capital costs. Under our risk management policy, we have entered into options to manage this exposure. As at December 31, 2018, we had the following hedge positions outstanding:
| 2019 | 2020 | |||||||
| Notional amount (in thousands of Canadian dollars) |
54,140 | 30,000 | ||||||
| Estimated usage |
71.2 | % | 40.3 | % | ||||
| Floor level (Canadian dollars per $1 U.S. dollar) |
1.2500 | 1.2614 | ||||||
| Cap level (Canadian dollars per $1 U.S. dollar) |
1.3348 | 1.3710 | ||||||
For the year ended December 31, 2018, we had a mark-to-market loss of $1,572,000 (2017 - gain of $412,000) on outstanding hedges recognized in other comprehensive income.
A 10% increase or decrease in the U.S. dollar exchange rate, as at December 31, 2018 and December 31, 2017, on financial assets and liabilities denominated in the following currencies, with all other variables held constant, would have resulted in the following impact to our total comprehensive income for the years ended December 31, 2018 and December 31, 2017, respectively:
| Years ended December 31 |
2018 $ |
2017 $ |
||||||
| Canadian dollar |
1,084 | 701 | ||||||
| Argentine peso |
715 | 1,460 | ||||||
| (iii) | Interest Rate Risk |
Interest rate risk is the risk that the fair values or future cash flows of our financial instruments will fluctuate because of changes in market interest rates. Interest rate risk arises from the interest rate impact on our cash and cash equivalents and our moratorium liability because these are the only financial instruments we hold that are impacted by interest based on variable market interest rates. The Notes have a fixed interest rate and are not exposed to fluctuations in interest rates. A change in interest rates would impact the fair value of the Notes, but because we record the Notes at amortized cost, there would be no impact on our financial results. We monitor our exposure to interest rates closely and have not entered into any derivative contracts to manage our risk.
The resolution of the moratorium in Argentina in 2017 increased our exposure to this risk as the outstanding liability incurs interest based on variable rates with a floor of 1.5% per month.
As at December 31, 2018, the weighted average interest rate earned on our cash and cash equivalents was 2.4% (December 31, 2017 - 0.97%). With other variables unchanged, a 1% change in the annualized interest rate would impact after-tax net income by $3,372,000 (2017 - $2,368,000).
| b) | Credit Risk |
Credit risk is the risk that a third party might fail to discharge its obligations under the terms of a financial contract. Our credit risk is limited to the following instruments:
| (i) | Credit risk related to financial institutions and cash deposits |
Under our investment policy, investments are made only in highly-rated financial institutions and corporate and government securities. We diversify our holdings and consider the risk of loss associated with investments to be low.
| SSR Mining Inc. | Financial Statements Year-End 2018 | 58
|
Notes to the Consolidated Financial Statements
SSR Mining Inc.
(tabular amounts expressed in thousands of United States dollars unless otherwise stated)
| 24. | FINANCIAL RISK MANAGEMENT (Continued) |
| (ii) | Credit risk related to trade receivables |
We are exposed to credit risk through our trade receivables on concentrate sales, which are principally with internationally-recognized counterparties. Payments of receivables are scheduled, routine and received within a contractually agreed time frame. We manage this risk by requiring provisional payments of at least 75% of the value of the concentrate shipped and through utilizing multiple counterparties.
| (iii) | Credit risk related to other financial assets |
Our credit risk with respect to other financial assets includes deferred consideration following the sales of various mineral properties and our loan receivable from our joint venture partner. We have security related to these payments in the event of default.
We also have credit risk through our significant VAT receivables and Puna credits balance that is collectible from the government of Argentina. The balance is expected to be recoverable in full, however due to legislative rules and the complex collection process, a significant portion of the asset is classified as non-current until government approval of the recovery claim is approved.
Our maximum exposure to credit risk as at December 31, 2018 and December 31, 2017 was as follows:
| December 31, 2018 $ |
December 31, 2017 $ |
|||||||
| Cash and cash equivalents |
419,212 | 459,864 | ||||||
| Value added tax receivable |
18,802 | 13,755 | ||||||
| Trade receivables and other assets |
11,287 | 14,848 | ||||||
| Other financial assets |
28,883 | 22,399 | ||||||
|
|
|
|
|
|||||
| 478,184 | 510,866 | |||||||
|
|
|
|
|
|||||
At December 31, 2018, no amounts were held as collateral except those discussed above related to other financial assets.
| c) | Liquidity Risk |
Liquidity risk is the risk that we will not be able to meet our obligations under our financial instruments as they fall due. We manage our liquidity risk through a rigorous planning and budgeting process, which is reviewed and updated on a regular basis, to help determine the funding requirements to support our current operations, expansion and development plans, and by managing our capital structure as described in note 24(d). Our objective is to ensure that there are sufficient committed financial resources to meet our business requirements for a minimum of twelve months.
To supplement corporate liquidity, we have a Credit Facility (note 14(b)) of which we utilized $8,000,000 (December 31, 2017 - $7,700,000) to secure certain letters of credit.
In addition, we use surety bonds to support certain environmental bonding obligations. As at December 31, 2018, we had surety bonds totaling $54,053,000 outstanding (December 31, 2017 - $61,186,000).
| SSR Mining Inc. | Financial Statements Year-End 2018 | 59
|
Notes to the Consolidated Financial Statements
SSR Mining Inc.
(tabular amounts expressed in thousands of United States dollars unless otherwise stated)
| 24. | FINANCIAL RISK MANAGEMENT (Continued) |
The following is a maturity profile of financial liabilities and moratorium commitments presenting undiscounted cash flows to the contractual maturity date:
| Payments due by period (as at December 31, 2018) | At December 31, 2017 |
|||||||||||||||||||||||
| Less than one year $ |
1 - 3 years $ |
4-5 years $ |
After 5 years $ |
Total $ |
Total $ |
|||||||||||||||||||
| Trade and other payables |
70,003 | — | — | — | 70,003 | 52,590 | ||||||||||||||||||
| Moratorium |
4,570 | 14,487 | — | — | 19,057 | 46,037 | ||||||||||||||||||
| Notes (i) |
— | 265,000 | — | — | 265,000 | 265,000 | ||||||||||||||||||
| Interest on convertible notes (i) |
7,619 | 3,809 | — | — | 11,428 | 19,047 | ||||||||||||||||||
|
|
|
|
|
|
|
|
|
|
|
|
|
|||||||||||||
| Total contractual obligations |
82,192 | 283,296 | — | — | 365,488 | 382,674 | ||||||||||||||||||
|
|
|
|
|
|
|
|
|
|
|
|
|
|||||||||||||
| (i) | The Notes mature in 2033 but are redeemable in part or in full at the option of the holder on February 1 at each of 2020, 2023, and 2028, or upon fundamental corporate changes. They are also redeemable by us in part or in full on and after February 1, 2018 (note 14). |
In our opinion, working capital at December 31, 2018 together with future cash flows from operations are sufficient to support our commitments through 2019.
| d) | Capital management |
Our objectives when managing capital are:
| • | to safeguard our ability to continue as a going concern in order to develop and operate our current projects and pursue strategic growth initiatives; and |
| • | to maintain a flexible capital structure which lowers the cost of capital. |
In assessing our capital structure, we include in our assessment the components of shareholders’ equity and our Notes. In order to facilitate the management of capital requirements, we prepare annual expenditure budgets and continuously monitor and review actual and forecasted cash flows. The annual and updated budgets are monitored and approved by the Board of Directors.
To maintain or adjust the capital structure, we may, from time to time, issue new shares, issue new debt, repay debt or dispose of non-core assets. We expect our current capital resources will be sufficient to carry out our exploration plans and support operations through the current operating period.
As of December 31, 2018, we were in compliance with our externally-imposed financial covenants in relation to the Credit Facility (note 14(b)). Our Notes (note 14) do not contain any financial covenants.
| SSR Mining Inc. | Financial Statements Year-End 2018 | 60
|
Notes to the Consolidated Financial Statements
SSR Mining Inc.
(tabular amounts expressed in thousands of United States dollars unless otherwise stated)
| 25. | RELATED PARTY TRANSACTIONS |
| a) | Key management compensation |
Key management includes our directors (executive and non-executive) and other key officers, including the Chief Executive Officer, Chief Financial Officer and Chief Operating Officer. The compensation paid or payable to key management for employee services is shown below:
| Years ended December 31 |
2018 $ |
2017 $ |
||||||
| Salaries and other short-term employee benefits |
2,589 | 2,240 | ||||||
| Post-employment benefits |
83 | 30 | ||||||
| Termination benefits |
1,379 | — | ||||||
| Share-based compensation (i) |
10,819 | 3,176 | ||||||
|
|
|
|
|
|||||
| Total compensation |
14,870 | 5,446 | ||||||
|
|
|
|
|
|||||
| (i) | Share-based compensation includes mark-to-market adjustments on cumulative DSU and PSU positions as reported in the consolidated statements of (loss) income. |
| b) | Principal Subsidiaries |
The consolidated financial statements include our accounts and the accounts of our wholly-owned subsidiaries, the most significant as at December 31, 2018 of which are presented in the following table:
| Subsidiary |
Location | Ownership | Principal project or purpose | |||||
| Marigold Mining Company |
USA | 100 | % | Marigold | ||||
| SGO Mining Inc. (formerly Claude Resources Inc.) |
Canada | 100 | % | Seabee Gold Operation | ||||
| Puna Operations Inc. |
Canada | 75 | % | Puna Operations | ||||
| SSR Durango, S.A. de C.V. |
Mexico | 100 | % | Pitarrilla | ||||
| Intertrade Metals Limited Partnership |
Canada | 100 | % | Sales and marketing | ||||
| 26. | SUPPLEMENTAL CASH FLOW INFORMATION |
Changes in working capital items during the years ended December 31, 2018 and 2017 are as follows:
| Years ended December 31 |
2018 $ |
2017 $ |
||||||
| Trade and other receivables |
(4,234 | ) | 23,232 | |||||
| Inventory |
(40,144 | ) | (10,973 | ) | ||||
| Trade and other payables |
18,753 | (10,117 | ) | |||||
| Provisions |
(5,309 | ) | (7,028 | ) | ||||
|
|
|
|
|
|||||
| (30,934 | ) | (4,886 | ) | |||||
|
|
|
|
|
|||||
| SSR Mining Inc. | Financial Statements Year-End 2018 | 61
|
Notes to the Consolidated Financial Statements
SSR Mining Inc.
(tabular amounts expressed in thousands of United States dollars unless otherwise stated)
| 26. | SUPPLEMENTAL CASH FLOW INFORMATION (Continued) |
Other adjustments for non-cash income statement items during the years ended December 31, 2018 and 2017 are as follows:
| Years ended December 31 |
2018 $ |
2017 $ |
||||||
| Share-based payments |
2,157 | 2,219 | ||||||
| Export duty adjustment in cost of sales |
— | (4,303 | ) | |||||
| Change in estimate of close down and restoration provision |
1,580 | 141 | ||||||
| Write down of fixed assets |
2,771 | 1,719 | ||||||
| Other |
375 | 3,834 | ||||||
|
|
|
|
|
|||||
| 6,883 | 3,610 | |||||||
|
|
|
|
|
|||||
During the years ended December 31, 2018 and 2017, we conducted the following non-cash investing and financing transactions:
| Years ended December 31 |
2018 $ |
2017 $ |
||||||
| Marketable securities received for sale of exploration and evaluation assets (note 6) |
1,751 | 992 | ||||||
| Transfer of share-based payment reserve upon exercise of stock options |
(2,864 | ) | (1,339 | ) | ||||
| Acquisition of Chinchillas mineral property (note 3) |
— | 28,839 | ||||||
| SSR Mining Inc. | Financial Statements Year-End 2018 | 62
|
Exhibit 99.4
Mine Safety Information Pursuant to Section 1503(a) of the
Dodd-Frank Wall Street Reform and Consumer Protection Act
The following table shows, for the Company’s U.S. mine for which the Company is an operator and that is subject to the Federal Mine Safety and Health Act of 1977 (the “Mine Act”) and administered by the U.S. Labor Department’s Mine Safety and Health Administration (“MSHA”), the information required by Section 1503(a) of the Dodd-Frank Wall Street Reform and Consumer Protection Act (the “Dodd-Frank Act”). Section references below are to sections of the Mine Act.
| Year Ended December 31, 2018 | ||||||||||||||||||||||||||||||||||||||||
| Mine or Operation1: |
Total # of “Significant and Violations §1042 |
Total # of Orders Issued Under §104(b)3 |
Total # of |
Total # of Flagrant Violations Under §110(b)(2)5 |
Total # of Imminent Danger Orders Under §107(a)6 |
Total Amount of Proposed Assessments from MSHA under the Mine Act7 |
Total # of Mining- Related Fatalities8 |
Pending Legal Actions as of Last Day of 20189 |
Legal Actions Instituted During 201810 |
Legal Actions Resolved During 201811 |
||||||||||||||||||||||||||||||
| Marigold Mine (MSHA ID# 2602081) |
3 | 0 | 0 | 0 | 0 | $ | 42,694 | 0 | 0 | 2 | 2 | |||||||||||||||||||||||||||||
| 1 | MSHA assigns an identification number to each mine or operation and may or may not assign separate identification numbers to related facilities. |
| 2 | Represents the total number of citations issued by MSHA under Section 104 of the Mine Act for violations of health or safety standards that could significantly and substantially contribute to a serious injury if left unabated. |
| 3 | Represents the total number of orders issued under Section 104(b) of the Mine Act, which represents a failure to abate a citation issued under Section 104(a) of the Mine Act within the period prescribed by MSHA. This results in an order of immediate withdrawal from the area of the mine affected by the condition until MSHA determines the violation has been abated. |
| 4 | Represents the total number of citations and orders issued by MSHA under Section 104(d) of the Mine Act for unwarrantable failure to comply with mandatory health or safety standards. |
| 5 | Represents the total number of flagrant violations identified by MSHA under Section 110(b)(2) of the Mine Act. |
| 6 | Represents the total number of imminent danger orders issued under Section 107(a) of the Mine Act. |
| 7 | Amount represents the total United States dollar value of proposed assessments received from MSHA during the year ended December 31, 2018. |
| 8 | Represents the total number of mining-related fatalities at mines subject to the Mine Act pursuant to Section 1503(a)(1)(G) of the Dodd-Frank Act. |
| 9 | Represents the total number of legal actions pending as of December 31, 2018 before the Federal Mine Safety and Health Review Commission as required by Section 1503(a) of the Dodd-Frank Act. See “Pending Legal Actions” section below for additional detail. |
| 10 | Represents the total number of legal actions instituted during the year ended December 31, 2018 before the Federal Mine Safety and Health Review Commission. Two citations were issued in December 2017 and formerly contested in January 2018. |
| 11 | Represents the total number of legal actions resolved during the year ended December 31, 2018 before the Federal Mine Safety and Health Review Commission. |
Pattern or Potential Pattern of Violations
In addition, as required by the reporting requirements regarding mine safety included in Section 1503(a)(2) of the Dodd-Frank Act, for the year ended December 31, 2018, the Company’s U.S. mine for which the Company is an operator has not received written notice from MSHA of:
| (a) | a pattern of violations of mandatory health or safety standards that are of such nature as could have significantly and substantially contributed to the cause and effect of coal or other mine health or safety hazards under Section 104(e) of the Mine Act; or |
| (b) | the potential to have such a pattern. |
Pending Legal Actions
The number of legal actions pending as of December 31, 2018, with respect to the mine set forth in the table above, that fall into each of the following categories is as follows:
| (a) | Contests of citations and orders: 0 |
| (b) | Contests of proposed penalties: 0 |
| (c) | Complaints for compensation: 0 |
| (d) | Complaints of discharge, discrimination or interference: 0 |
| (e) | Applications for temporary relief: 0 |
| (f) | Appeals of judges’ decisions or orders to the Federal Mine Safety and Health Review Commission: 0 |
Exhibit 99.5
CERTIFICATION PURSUANT TO RULE 13a-14 OR 15d-14 OF THE SECURITIES EXCHANGE ACT OF 1934,
AS ADOPTED PURSUANT TO SECTION 302 OF THE SARBANES-OXLEY ACT OF 2002
I, Paul Benson, certify that:
| 1. | I have reviewed this Annual Report on Form 40-F of SSR Mining Inc.; |
| 2. | Based on my knowledge, this report does not contain any untrue statement of a material fact or omit to state a material fact necessary to make the statements made, in light of the circumstances under which such statements were made, not misleading with respect to the period covered by this report; |
| 3. | Based on my knowledge, the financial statements, and other financial information included in this report, fairly present in all material respects the financial condition, results of operations and cash flows of the issuer as of, and for, the periods presented in this report; |
| 4. | The issuer’s other certifying officer and I are responsible for establishing and maintaining disclosure controls and procedures (as defined in Exchange Act Rules 13a-15(e) and 15d-15(e)) and internal control over financial reporting (as defined in Exchange Act Rules 13a-15(f) and 15d-15(f)) for the issuer and have: |
| (a) | Designed such disclosure controls and procedures, or caused such disclosure controls and procedures to be designed under our supervision, to ensure that material information relating to the issuer, including its consolidated subsidiaries, is made known to us by others within those entities, particularly during the period in which this report is being prepared; |
| (b) | Designed such internal control over financial reporting, or caused such internal control over financial reporting to be designed under our supervision, to provide reasonable assurance regarding the reliability of financial reporting and the preparation of financial statements for external purposes in accordance with generally accepted accounting principles; |
| (c) | Evaluated the effectiveness of the issuer’s disclosure controls and procedures and presented in this report our conclusions about the effectiveness of the disclosure controls and procedures, as of the end of the period covered by this report based on such evaluation; and |
| (d) | Disclosed in this report any change in the issuer’s internal control over financial reporting that occurred during the period covered by the annual report that has materially affected, or is reasonably likely to materially affect, the issuer’s internal control over financial reporting; and |
| 5. | The issuer’s other certifying officer and I have disclosed, based on our most recent evaluation of internal control over financial reporting, to the issuer’s auditors and the audit committee of the issuer’s board of directors (or persons performing the equivalent function): |
| (a) | All significant deficiencies and material weaknesses in the design or operation of internal control over financial reporting which are reasonably likely to adversely affect the issuer’s ability to record, process, summarize and report financial information; and |
| (b) | Any fraud, whether or not material, that involves management or other employees who have a significant role in the issuer’s internal control over financial reporting. |
| Dated: March 11, 2019 |
||||||
| /s/ Paul Benson | ||||||
| Paul Benson | ||||||
| President and Chief Executive Officer | ||||||
Exhibit 99.6
CERTIFICATION PURSUANT TO RULE 13a-14 OR 15d-14 OF THE SECURITIES EXCHANGE ACT OF 1934,
AS ADOPTED PURSUANT TO SECTION 302 OF THE SARBANES-OXLEY ACT OF 2002
I, Gregory J. Martin, certify that:
| 1. | I have reviewed Annual Report on Form 40-F of SSR Mining Inc.; |
| 2. | Based on my knowledge, this report does not contain any untrue statement of a material fact or omit to state a material fact necessary to make the statements made, in light of the circumstances under which such statements were made, not misleading with respect to the period covered by this report; |
| 3. | Based on my knowledge, the financial statements, and other financial information included in this report, fairly present in all material respects the financial condition, results of operations and cash flows of the issuer as of, and for, the periods presented in this report; |
| 4. | The issuer’s other certifying officer and I are responsible for establishing and maintaining disclosure controls and procedures (as defined in Exchange Act Rules 13a-15(e) and 15d-15(e)) and internal control over financial reporting (as defined in Exchange Act Rules 13a-15(f) and 15d-15(f)) for the issuer and have: |
| (a) | Designed such disclosure controls and procedures, or caused such disclosure controls and procedures to be designed under our supervision, to ensure that material information relating to the issuer, including its consolidated subsidiaries, is made known to us by others within those entities, particularly during the period in which this report is being prepared; |
| (b) | Designed such internal control over financial reporting, or caused such internal control over financial reporting to be designed under our supervision, to provide reasonable assurance regarding the reliability of financial reporting and the preparation of financial statements for external purposes in accordance with generally accepted accounting principles; |
| (c) | Evaluated the effectiveness of the issuer’s disclosure controls and procedures and presented in this report our conclusions about the effectiveness of the disclosure controls and procedures, as of the end of the period covered by this report based on such evaluation; and |
| (d) | Disclosed in this report any change in the issuer’s internal control over financial reporting that occurred during the period covered by the annual report that has materially affected, or is reasonably likely to materially affect, the issuer’s internal control over financial reporting; and |
| 5. | The issuer’s other certifying officer and I have disclosed, based on our most recent evaluation of internal control over financial reporting, to the issuer’s auditors and the audit committee of the issuer’s board of directors (or persons performing the equivalent function): |
| (a) | All significant deficiencies and material weaknesses in the design or operation of internal control over financial reporting which are reasonably likely to adversely affect the issuer’s ability to record, process, summarize and report financial information; and |
| (b) | Any fraud, whether or not material, that involves management or other employees who have a significant role in the issuer’s internal control over financial reporting. |
| Dated: March 11, 2019 |
||||||
| /s/ Gregory J. Martin | ||||||
| Gregory J. Martin | ||||||
| Senior Vice President and | ||||||
| Chief Financial Officer | ||||||
Exhibit 99.7
CERTIFICATION PURSUANT TO 18 U.S.C. SECTION 1350, AS ADOPTED
PURSUANT TO SECTION 906 OF THE SARBANES-OXLEY ACT OF 2002
In connection with the Annual Report on Form 40-F of SSR Mining Inc. (the “Company”) for the year ended December 31, 2018, as filed with the Securities and Exchange Commission on the date hereof (the “Report”), I, Paul Benson, President and Chief Executive Officer of the Company, certify, pursuant to 18 U.S.C. Section 1350, as adopted pursuant to Section 906 of the Sarbanes-Oxley Act of 2002, that to the best of my knowledge:
| 1. | The Report fully complies with the requirements of Section 13(a) or 15(d) of the Securities Exchange Act of 1934; and |
| 2. | The information contained in the Report fairly presents, in all material respects, the financial condition and results of operations of the Company. |
| By: |
/s/ Paul Benson | |
| Paul Benson | ||
| President and Chief Executive Officer |
Dated: March 11, 2019
Exhibit 99.8
CERTIFICATION PURSUANT TO 18 U.S.C. SECTION 1350, AS ADOPTED
PURSUANT TO SECTION 906 OF THE SARBANES-OXLEY ACT OF 2002
In connection with the Annual Report on Form 40-F of SSR Mining Inc. (the “Company”) for the year ended December 31, 2018, as filed with the Securities and Exchange Commission on the date hereof (the “Report”), I, Gregory J. Martin, Senior Vice President and Chief Financial Officer of the Company, certify, pursuant to 18 U.S.C. Section 1350, as adopted pursuant to Section 906 of the Sarbanes-Oxley Act of 2002, that to the best of my knowledge:
| 1. | The Report fully complies with the requirements of Section 13(a) or 15(d) of the Securities Exchange Act of 1934; and |
| 2. | The information contained in the Report fairly presents, in all material respects, the financial condition and results of operations of the Company. |
| By: |
/s/ Gregory J. Martin | |
| Gregory J. Martin | ||
| Senior Vice President and Chief Financial Officer |
Dated: March 11, 2019
Exhibit 99.9
Consent of Independent Registered Public Accounting Firm
We hereby consent to the incorporation by reference in this Annual Report on Form 40-F for the year ended December 31, 2018 of SSR Mining Inc. of our report dated February 21, 2019, relating to the consolidated financial statements, and the effectiveness of internal control over financial reporting, which appears in Exhibit 99.3 incorporated by reference in this Annual Report.
We also consent to the incorporation by reference in the Registration Statements on Form S-8 (No. 333-219848, 333-185498, 333-196116 and 333-198092) of SSR Mining Inc. of our report dated February 21, 2019 referred to above. We also consent to reference to us under the heading “Interests of Experts,” which appears in the Annual Information Form included in Exhibit 99.1 incorporated by reference in this Annual Report on Form 40-F, which is incorporated by reference in such Registration Statements.
| /s/ PricewaterhouseCoopers LLP |
| Chartered Professional Accountants |
| Vancouver, British Columbia |
| Canada |
| March 11, 2019 |
Exhibit 99.10
CONSENT OF EXPERT
I hereby consent to the use of and reference to my name, Bruce Butcher, P.Eng., and the information that I reviewed and approved, as described or incorporated by reference in (i) SSR Mining Inc.’s Annual Report on Form 40-F for the year ended December 31, 2018, and (ii) SSR Mining Inc.’s Registration Statements on Form S-8 (File No. 333-219848, 333-185498, 333-196116 and 333-198092), filed with the United States Securities and Exchange Commission.
Dated this 11th day of March, 2019.
Yours very sincerely,
| /s/ “Bruce Butcher” |
| Bruce Butcher, P.Eng. |
Exhibit 99.11
CONSENT OF EXPERT
I hereby consent to the use of and reference to my name, F. Carl Edmunds, P.Geo., and the information that I reviewed and approved, as described or incorporated by reference in (i) SSR Mining Inc.’s Annual Report on Form 40-F for the year ended December 31, 2018, and (ii) SSR Mining Inc.’s Registration Statements on Form S-8 (File No. 333-219848, 333-185498, 333-196116 and 333-198092), filed with the United States Securities and Exchange Commission.
Dated this 11th day of March, 2019.
Yours very sincerely,
| /s/ “F. Carl Edmunds” |
| F. Carl Edmunds, P.Geo. |
Exhibit 99.12
CONSENT OF EXPERT
I hereby consent to the use of and reference to my name, Trevor J. Yeomans, ACSM, P.Eng., and report, NI 43-101 Technical Report on the Marigold Mine, Humboldt County, Nevada dated effective December 31, 2017 (the “Report”), and the information contained in the Report that I prepared, or reviewed and approved, as described or incorporated by reference in (i) SSR Mining Inc.’s Annual Report on Form 40-F for the year ended December 31, 2018, and (ii) SSR Mining Inc.’s Registration Statements on Form S-8 (File No. 333-219848, 333-185498, 333-196116 and 333-198092), filed with the United States Securities and Exchange Commission.
Dated this 11th day of March, 2019.
| Yours very sincerely, |
| /s/ “Trevor J. Yeomans” |
| Trevor J. Yeomans, ACSM, P.Eng. |
Exhibit 99.13
CONSENT OF EXPERT
I hereby consent to the use of and reference to my name, James N. Carver, SME Registered Member, and report, NI 43-101 Technical Report on the Marigold Mine, Humboldt County, Nevada dated effective December 31, 2017 (the “Report”), and the information contained in my Report, as described or incorporated by reference in (i) SSR Mining Inc.’s Annual Report on Form 40-F for the year ended December 31, 2018, and (ii) SSR Mining Inc.’s Registration Statements on Form S-8 (File No. 333-219848, 333-185498, 333-196116 and 333-198092), filed with the United States Securities and Exchange Commission.
Dated this 11th day of March, 2019.
| Yours very sincerely, |
| /s/ “James N. Carver” |
| James N. Carver, SME Registered Member |
Exhibit 99.14
CONSENT OF EXPERT
I hereby consent to the use of and reference to my name, James Frost, P.E., and the information that I reviewed and approved, as described or incorporated by reference in (i) SSR Mining Inc.’s Annual Report on Form 40-F for the year ended December 31, 2018, and (ii) SSR Mining Inc.’s Registration Statements on Form S-8 (File No. 333-219848, 333-185498, 333-196116 and 333-198092), filed with the United States Securities and Exchange Commission.
Dated this 11th day of March, 2019.
| Yours very sincerely, |
| /s/ “James Frost” |
| James Frost, P.E. |
Exhibit 99.15
CONSENT OF EXPERT
I hereby consent to the use of and reference to my name, Karthik Rathnam, MAusIMM (CP), and report, NI 43-101 Technical Report on the Marigold Mine, Humboldt County, Nevada dated effective December 31, 2017 (the “Report”), and the information contained in my Report, as described or incorporated by reference in (i) SSR Mining Inc.’s Annual Report on Form 40-F for the year ended December 31, 2018, and (ii) SSR Mining Inc.’s Registration Statements on Form S-8 (File No. 333-219848, 333-185498, 333-196116 and 333-198092), filed with the United States Securities and Exchange Commission.
Dated this 11th day of March, 2019.
| Yours very sincerely, |
| /s/ “Karthik Rathnam” |
| Karthik Rathnam, MAusIMM (CP) |
Exhibit 99.16
CONSENT OF EXPERT
I hereby consent to the use of and reference to my name, Thomas Rice, SME Registered Member, and report, NI 43-101 Technical Report on the Marigold Mine, Humboldt County, Nevada USA, dated effective December 31, 2017 (the “Report”), and the information contained in my Report, as described or incorporated by reference in (i) SSR Mining Inc.’s Annual Report on Form 40-F for the year ended December 31, 2018, and (ii) SSR Mining Inc.’s Registration Statements on Form S-8 (File No. 333-219848, 333-185498, 333-196116 and 333-198092), filed with the United States Securities and Exchange Commission.
Dated this 11th day of March, 2019.
Yours very sincerely,
| /s/ “Thomas Rice” |
| Thomas Rice, SME Registered Member |
Exhibit 99.17
CONSENT OF EXPERT
I hereby consent to the use of and reference to my name, Cameron Chapman, P.Eng., and the information that I reviewed and approved, as described or incorporated by reference in (i) SSR Mining Inc.’s Annual Report on Form 40-F for the year ended December 31, 2018, and (ii) SSR Mining Inc.’s Registration Statements on Form S-8 (File No. 333-219848, 333-185498, 333-196116 and 333-198092), filed with the United States Securities and Exchange Commission.
Dated this 11th day of March, 2019.
Yours very sincerely,
| /s/ “Cameron Chapman” |
| Cameron Chapman, P.Eng. |
Exhibit 99.18
CONSENT OF EXPERT
I hereby consent to the use of and reference to my name, Kevin Fitzpatrick, P.Eng., and the information that I reviewed and approved, as described or incorporated by reference in (i) SSR Mining Inc.’s Annual Report on Form 40-F for the year ended December 31, 2018, and (ii) SSR Mining Inc.’s Registration Statements on Form S-8 (File No. 333-219848, 333-185498, 333-196116 and 333-198092), filed with the United States Securities and Exchange Commission.
Dated this 11th day of March, 2019.
Yours very sincerely,
| /s/ “Kevin Fitzpatrick” |
| Kevin Fitzpatrick, P.Eng. |
Exhibit 99.19
CONSENT OF EXPERT
I hereby consent to the use of and reference to my name, Jeffrey Kulas, P. Geo., and report, NI 43-101 Technical Report for the Seabee Gold Operation, Saskatchewan, Canada dated October 20, 2017 (the “Report”), as described or incorporated by reference in (i) SSR Mining Inc.’s Annual Report on Form 40-F for the year ended December 31, 2018, and (ii) SSR Mining Inc.’s Registration Statements on Form S-8 (File No. 333-219848, 333-185498, 333-196116 and 333-198092), filed with the United States Securities and Exchange Commission.
Dated this 11th day of March, 2019.
Yours very sincerely,
| /s/ “Jeffrey Kulas” |
| Jeffrey Kulas, P. Geo. |
Exhibit 99.20
CONSENT OF EXPERT
I hereby consent to the use of and reference to my name, Michael Selby, P.Eng., and report, NI 43-101 Technical Report for the Seabee Gold Operation, Saskatchewan, Canada dated October 20, 2017 (the “Report”), and the information contained in my Report, as described or incorporated by reference in (i) SSR Mining Inc.’s Annual Report on Form 40-F for the year ended December 31, 2018, and (ii) SSR Mining Inc.’s Registration Statements on Form S-8 (File No. 333-219848, 333-185498, 333-196116 and 333-198092), filed with the United States Securities and Exchange Commission.
Dated this 11th day of March, 2019.
Yours very sincerely,
| /s/ “Michael Selby” |
| Michael Selby, P.Eng. |
Exhibit 99.21
CONSENT OF EXPERT
I hereby consent to the use of and reference to my name, Dominic Chartier, P.Geo., and report, NI 43-101 Technical Report for the Seabee Gold Operation, Saskatchewan, Canada dated October 20, 2017 (the “Report”), and the information contained in my Report, as described or incorporated by reference in (i) SSR Mining Inc.’s Annual Report on Form 40-F for the year ended December 31, 2018, and (ii) SSR Mining Inc.’s Registration Statements on Form S-8 (File No. 333-219848, 333-185498, 333-196116 and 333-198092), filed with the United States Securities and Exchange Commission.
Dated this 11th day of March, 2019.
Yours very sincerely,
| /s/ “Dominic Chartier” |
| Dominic Chartier, P.Geo. Senior Consultant (Geology) SRK Consulting (Canada) Inc. |
Exhibit 99.22
CONSENT OF EXPERT
I hereby consent to the use of and reference to my name, Mark Liskowich, P.Geo., and report, NI 43-101 Technical Report for the Seabee Gold Operation, Saskatchewan, Canada dated October 20, 2017 (the “Report”), and the information contained in my Report, as described or incorporated by reference in (i) SSR Mining Inc.’s Annual Report on Form 40-F for the year ended December 31, 2018, and (ii) SSR Mining Inc.’s Registration Statements on Form S-8 (File No. 333-219848, 333-185498, 333-196116 and 333-198092), filed with the United States Securities and Exchange Commission.
Dated this 11th day of March, 2019.
Yours very sincerely,
| /s/ “Mark Liskowich” |
| Mark Liskowich, P.Geo. Principal Consultant (Environment) SRK Consulting (Canada) Inc. |
Exhibit 99.23
CONSENT OF EXPERT
I hereby consent to the use of and reference to my name, Sebastien Bernier, P.Geo., and the information that I reviewed and approved, as described or incorporated by reference in (i) SSR Mining Inc.’s Annual Report on Form 40-F for the year ended December 31, 2018, and (ii) SSR Mining Inc.’s Registration Statements on Form S-8 (File No. 333-219848, 333-185498, 333-196116 and 333-198092), filed with the United States Securities and Exchange Commission.
Dated this 11th day of March, 2019.
Yours very sincerely,
| /s/ “Sebastien Bernier” |
| Sebastien Bernier, P.Geo. |
Serious News for Serious Traders! Try StreetInsider.com Premium Free!
You May Also Be Interested In
- SSR MINING INC. (NASDAQ: SSRM) DEADLINE ALERT: Bernstein Liebhard LLP Reminds SSR Mining Inc. Investors of Upcoming Deadline
- International Horticultural Exhibition 2024 Chengdu Opens
- Robbins LLP Reminds IRobot Corporation Shareholders of the Pending May 7, 2024 Lead Plaintiff Deadline
Create E-mail Alert Related Categories
SEC FilingsSign up for StreetInsider Free!
Receive full access to all new and archived articles, unlimited portfolio tracking, e-mail alerts, custom newswires and RSS feeds - and more!
