

Form 10-Q Meta Platforms, Inc. For: Mar 31
 Tweet
Tweet Share
ShareUNITED STATES
SECURITIES AND EXCHANGE COMMISSION
Washington, D.C. 20549
____________________________________________
FORM 10-Q
____________________________________________
(Mark One)
For the quarterly period ended March 31, 2022
or
For the transition period from to
Commission File Number: 001-35551
____________________________________________

(Exact name of registrant as specified in its charter)
____________________________________________
| (State or other jurisdiction of incorporation or organization) | (I.R.S. Employer Identification Number) | ||||
(Address of principal executive offices and Zip Code)
(650 ) 543-4800
(Registrant's telephone number, including area code)
____________________________________________
Securities registered pursuant to Section 12(b) of the Act:
| Title of each class | Trading symbol(s) | Name of each exchange on which registered | |||||||||
Indicate by check mark whether the registrant (1) has filed all reports required to be filed by Section 13 or 15(d) of the Securities Exchange Act of 1934 (Exchange Act) during the preceding 12 months (or for such shorter period that the registrant was required to file such reports), and (2) has been subject to such filing requirements for the past 90 days. Yes ☒ No ☐
Indicate by check mark whether the registrant has submitted electronically every Interactive Data File required to be submitted pursuant to Rule 405 of Regulation S-T (§ 232.405 of this chapter) during the preceding 12 months (or for such shorter period that the registrant was required to submit such files). Yes ☒ No ☐
Indicate by check mark whether the registrant is a large accelerated filer, an accelerated filer, a non-accelerated filer, a smaller reporting company, or an emerging growth company. See the definitions of "large accelerated filer," "accelerated filer," "smaller reporting company," and "emerging growth company" in Rule 12b-2 of the Exchange Act.
| ☒ | Accelerated filer | ☐ | |||||||||||||||
| Non-accelerated filer | ☐ | Smaller reporting company | |||||||||||||||
| Emerging growth company | |||||||||||||||||
| If an emerging growth company, indicate by check mark if the registrant has elected not to use the extended transition period for complying with any new or revised financial accounting standards provided pursuant to Section 13(a) of the Exchange Act. | ☐ | ||||||||||||||||
Indicate the number of shares outstanding of each of the issuer's classes of Common Stock, as of the latest practicable date.
| Class | Number of Shares Outstanding | ||||||||||
| Class A Common Stock | $0.000006 par value | shares outstanding as of April 22, 2022 | |||||||||
| Class B Common Stock | $0.000006 par value | shares outstanding as of April 22, 2022 | |||||||||
Meta Platforms, Inc.
Form 10-Q
For the Quarterly Period Ended March 31, 2022
TABLE OF CONTENTS
| Page | ||||||||
| Item 1. | ||||||||
| Item 2. | ||||||||
| Item 3. | ||||||||
| Item 4. | ||||||||
| Item 1. | ||||||||
| Item 1A. | ||||||||
| Item 2. | ||||||||
| Item 6. | ||||||||
2
NOTE ABOUT FORWARD-LOOKING STATEMENTS
This Quarterly Report on Form 10-Q contains forward-looking statements. All statements contained in this Quarterly Report on Form 10-Q other than statements of historical fact, including statements regarding our future results of operations and financial position, our business strategy and plans, and our objectives for future operations, are forward-looking statements. The words "believe," "may," "will," "estimate," "continue," "anticipate," "intend," "expect," and similar expressions are intended to identify forward-looking statements. We have based these forward-looking statements largely on our current expectations and projections about future events and trends that we believe may affect our financial condition, results of operations, business strategy, short-term and long-term business operations and objectives, and financial needs. These forward-looking statements are subject to a number of risks, uncertainties and assumptions, including those described in Part II, Item 1A, "Risk Factors" in this Quarterly Report on Form 10-Q. Moreover, we operate in a very competitive and rapidly changing environment. New risks emerge from time to time. It is not possible for our management to predict all risks, nor can we assess the impact of all factors on our business or the extent to which any factor, or combination of factors, may cause actual results to differ materially from those contained in any forward-looking statements we may make. In light of these risks, uncertainties and assumptions, the future events and trends discussed in this Quarterly Report on Form 10-Q may not occur and actual results could differ materially and adversely from those anticipated or implied in the forward‑looking statements.
We undertake no obligation to revise or publicly release the results of any revision to these forward-looking statements, except as required by law. Given these risks and uncertainties, readers are cautioned not to place undue reliance on such forward‑looking statements.
In October 2021, we changed our corporate name from Facebook, Inc. to Meta Platforms, Inc. We will not distinguish between our prior and current corporate name and will refer to our current corporate name throughout this Quarterly Report on Form 10-Q. As such, unless expressly indicated or the context requires otherwise, the terms "Meta," "company," "we," "us," and "our" in this document refer to Meta Platforms, Inc., a Delaware corporation, and, where appropriate, its subsidiaries. The term "Family" refers to our Facebook, Instagram, Messenger, and WhatsApp products. For references to accessing Meta's products on the "web" or via a "website," such terms refer to accessing such products on personal computers. For references to accessing Meta's products on "mobile," such term refers to accessing such products via a mobile application or via a mobile-optimized version of our websites such as m.facebook.com, whether on a mobile phone or tablet.
3
LIMITATIONS OF KEY METRICS AND OTHER DATA
The numbers for our key metrics are calculated using internal company data based on the activity of user accounts. We have historically reported the numbers of our daily active users (DAUs), monthly active users (MAUs), and average revenue per user (ARPU) (collectively, our "Facebook metrics") based on user activity only on Facebook and Messenger and not on our other products. Beginning with our Annual Report on Form 10-K for the year ended December 31, 2019, we also report our estimates of the numbers of our daily active people (DAP), monthly active people (MAP), and average revenue per person (ARPP) (collectively, our "Family metrics") based on the activity of users who visited at least one of Facebook, Instagram, Messenger, and WhatsApp (collectively, our "Family" of products) during the applicable period of measurement. We believe our Family metrics better reflect the size of our community and the fact that many people are using more than one of our products. As a result, over time we intend to report our Family metrics as key metrics in place of DAUs, MAUs, and ARPU in our periodic reports filed with the Securities and Exchange Commission.
While these numbers are based on what we believe to be reasonable estimates of our user base for the applicable period of measurement, there are inherent challenges in measuring usage of our products across large online and mobile populations around the world. The methodologies used to measure these metrics require significant judgment and are also susceptible to algorithm or other technical errors. In addition, we are continually seeking to improve our estimates of our user base, and such estimates may change due to improvements or changes in our methodology. We regularly review our processes for calculating these metrics, and from time to time we discover inaccuracies in our metrics or make adjustments to improve their accuracy, which can result in adjustments to our historical metrics. Our ability to recalculate our historical metrics may be impacted by data limitations or other factors that require us to apply different methodologies for such adjustments. We generally do not intend to update previously disclosed Family metrics for any such inaccuracies or adjustments that are within the error margins disclosed below.
In addition, our Family metrics and Facebook metrics estimates will differ from estimates published by third parties due to differences in methodology.
Family Metrics
Many people in our community have user accounts on more than one of our products, and some people have multiple user accounts within an individual product. Accordingly, for our Family metrics, we do not seek to count the total number of user accounts across our products because we believe that would not reflect the actual size of our community. Rather, our Family metrics represent our estimates of the number of unique people using at least one of Facebook, Instagram, Messenger, and WhatsApp. We do not require people to use a common identifier or link their accounts to use multiple products in our Family, and therefore must seek to attribute multiple user accounts within and across products to individual people. To calculate these metrics, we rely upon complex techniques, algorithms and machine learning models that seek to count the individual people behind user accounts, including by matching multiple user accounts within an individual product and across multiple products when we believe they are attributable to a single person, and counting such group of accounts as one person. These techniques and models require significant judgment, are subject to data and other limitations discussed below, and inherently are subject to statistical variances and uncertainties. We estimate the potential error in our Family metrics primarily based on user survey data, which itself is subject to error as well. While we expect the error margin for our Family metrics to vary from period to period, we estimate that such margin generally will be approximately 3% of our worldwide MAP. At our scale, it is very difficult to attribute multiple user accounts within and across products to individual people, and it is possible that the actual numbers of unique people using our products may vary significantly from our estimates, potentially beyond our estimated error margins. As a result, it is also possible that our Family metrics may indicate changes or trends in user numbers that do not match actual changes or trends.
To calculate our estimates of Family DAP and MAP, we currently use a series of machine learning models that are developed based on internal reviews of limited samples of user accounts and calibrated against user survey data. We apply significant judgment in designing these models and calculating these estimates. For example, to match user accounts within individual products and across multiple products, we use data signals such as similar device information, IP addresses, and user names. We also calibrate our models against data from periodic user surveys of varying sizes and frequency across our products, which are inherently subject to error. The timing and results of such user surveys have in the past contributed, and may in the future contribute, to changes in our reported Family metrics from period to period. In addition, our data limitations may affect our understanding of certain details of our business and increase the risk of error for our Family metrics estimates.
4
Our techniques and models rely on a variety of data signals from different products, and we rely on more limited data signals for some products compared to others. For example, as a result of limited visibility into encrypted products, we have fewer data signals from WhatsApp user accounts and primarily rely on phone numbers and device information to match WhatsApp user accounts with accounts on our other products. Similarly, although Messenger Kids users are included in our Family metrics, we do not seek to match their accounts with accounts on our other applications for purposes of calculating DAP and MAP. Any loss of access to data signals we use in our process for calculating Family metrics, whether as a result of our own product decisions, actions by third-party browser or mobile platforms, regulatory or legislative requirements, or other factors, also may impact the stability or accuracy of our reported Family metrics, as well as our ability to report these metrics at all. Our estimates of Family metrics also may change as our methodologies evolve, including through the application of new data signals or technologies, product changes, or other improvements in our user surveys, algorithms, or machine learning that may improve our ability to match accounts within and across our products or otherwise evaluate the broad population of our users. In addition, such evolution may allow us to identify previously undetected violating accounts (as defined below).
We regularly evaluate our Family metrics to estimate the percentage of our MAP consisting solely of "violating" accounts. We define "violating" accounts as accounts which we believe are intended to be used for purposes that violate our terms of service, including bots and spam. In the fourth quarter of 2021, we estimated that approximately 3% of our worldwide MAP consisted solely of violating accounts. Such estimation is based on an internal review of a limited sample of accounts, and we apply significant judgment in making this determination. For example, we look for account information and behaviors associated with Facebook and Instagram accounts that appear to be inauthentic to the reviewers, but we have limited visibility into WhatsApp user activity due to encryption. In addition, if we believe an individual person has one or more violating accounts, we do not include such person in our violating accounts estimation as long as we believe they have one account that does not constitute a violating account. From time to time, we disable certain user accounts, make product changes, or take other actions to reduce the number of violating accounts among our users, which may also reduce our DAP and MAP estimates in a particular period. We intend to disclose our estimates of the percentage of our MAP consisting solely of violating accounts on an annual basis. Violating accounts are very difficult to measure at our scale, and it is possible that the actual number of violating accounts may vary significantly from our estimates.
The numbers of Family DAP and MAP discussed in this Quarterly Report on Form 10-Q, as well as ARPP, do not include users on our other products, unless they would otherwise qualify as DAP or MAP, respectively, based on their other activities on our Family products.
Facebook Metrics
We regularly evaluate our Facebook metrics to estimate the number of "duplicate" and "false" accounts among our MAUs. A duplicate account is one that a user maintains in addition to his or her principal account. We divide "false" accounts into two categories: (1) user-misclassified accounts, where users have created personal profiles for a business, organization, or non-human entity such as a pet (such entities are permitted on Facebook using a Page rather than a personal profile under our terms of service); and (2) violating accounts, which represent user profiles that we believe are intended to be used for purposes that violate our terms of service, such as bots and spam. The estimates of duplicate and false accounts are based on an internal review of a limited sample of accounts, and we apply significant judgment in making this determination. For example, to identify duplicate accounts we use data signals such as identical IP addresses and similar user names, and to identify false accounts we look for names that appear to be fake or other behavior that appears inauthentic to the reviewers. Any loss of access to data signals we use in this process, whether as a result of our own product decisions, actions by third-party browser or mobile platforms, regulatory or legislative requirements, or other factors, also may impact the stability or accuracy of our estimates of duplicate and false accounts. Our estimates also may change as our methodologies evolve, including through the application of new data signals or technologies or product changes that may allow us to identify previously undetected duplicate or false accounts and may improve our ability to evaluate a broader population of our users. Duplicate and false accounts are very difficult to measure at our scale, and it is possible that the actual number of duplicate and false accounts may vary significantly from our estimates.
In the fourth quarter of 2021, we estimated that duplicate accounts may have represented approximately 11% of our worldwide MAUs. We believe the percentage of duplicate accounts is meaningfully higher in developing markets such as the Philippines and Vietnam, as compared to more developed markets. In the fourth quarter of 2021, we estimated that false accounts may have represented approximately 5% of our worldwide MAUs. Our estimation of false accounts can vary as a result of episodic spikes in the creation of such accounts, which we have seen originate more frequently in specific countries
5
such as Indonesia, Nigeria, and Vietnam. From time to time, we disable certain user accounts, make product changes, or take other actions to reduce the number of duplicate or false accounts among our users, which may also reduce our DAU and MAU estimates in a particular period. We intend to disclose our estimates of the number of duplicate and false accounts among our MAUs on an annual basis.
The numbers of DAUs and MAUs discussed in this Quarterly Report on Form 10-Q, as well as ARPU, do not include users on Instagram, WhatsApp, or our other products, unless they would otherwise qualify as DAUs or MAUs, respectively, based on their other activities on Facebook.
User Geography
Our data regarding the geographic location of our users is estimated based on a number of factors, such as the user's IP address and self-disclosed location. These factors may not always accurately reflect the user's actual location. For example, a user may appear to be accessing Facebook from the location of the proxy server that the user connects to rather than from the user's actual location. The methodologies used to measure our metrics are also susceptible to algorithm or other technical errors, and our estimates for revenue by user location and revenue by user device are also affected by these factors.
6
PART I—FINANCIAL INFORMATION
Item 1.Financial Statements
META PLATFORMS, INC.
CONDENSED CONSOLIDATED BALANCE SHEETS
(In millions, except for number of shares and par value)
(Unaudited)
| March 31, 2022 | December 31, 2021 | ||||||||||
| Assets | |||||||||||
| Current assets: | |||||||||||
| Cash and cash equivalents | $ | $ | |||||||||
| Marketable securities | |||||||||||
| Accounts receivable, net | |||||||||||
| Prepaid expenses and other current assets | |||||||||||
| Total current assets | |||||||||||
| Equity investments | |||||||||||
| Property and equipment, net | |||||||||||
| Operating lease right-of-use assets | |||||||||||
| Intangible assets, net | |||||||||||
| Goodwill | |||||||||||
| Other assets | |||||||||||
| Total assets | $ | $ | |||||||||
| Liabilities and stockholders' equity | |||||||||||
| Current liabilities: | |||||||||||
| Accounts payable | $ | $ | |||||||||
| Partners payable | |||||||||||
| Operating lease liabilities, current | |||||||||||
| Accrued expenses and other current liabilities | |||||||||||
| Deferred revenue and deposits | |||||||||||
| Total current liabilities | |||||||||||
| Operating lease liabilities, non-current | |||||||||||
| Other liabilities | |||||||||||
| Total liabilities | |||||||||||
| Commitments and contingencies | |||||||||||
| Stockholders' equity: | |||||||||||
Common stock, $ | |||||||||||
| Additional paid-in capital | |||||||||||
| Accumulated other comprehensive loss | ( | ( | |||||||||
| Retained earnings | |||||||||||
| Total stockholders' equity | |||||||||||
| Total liabilities and stockholders' equity | $ | $ | |||||||||
See Accompanying Notes to Condensed Consolidated Financial Statements.
7
META PLATFORMS, INC.
CONDENSED CONSOLIDATED STATEMENTS OF INCOME
(In millions, except per share amounts)
(Unaudited)
| Three Months Ended March 31, | |||||||||||
| 2022 | 2021 | ||||||||||
| Revenue | $ | $ | |||||||||
| Costs and expenses: | |||||||||||
| Cost of revenue | |||||||||||
| Research and development | |||||||||||
| Marketing and sales | |||||||||||
| General and administrative | |||||||||||
| Total costs and expenses | |||||||||||
| Income from operations | |||||||||||
| Interest and other income, net | |||||||||||
| Income before provision for income taxes | |||||||||||
| Provision for income taxes | |||||||||||
| Net income | $ | $ | |||||||||
| Earnings per share attributable to Class A and Class B common stockholders: | |||||||||||
| Basic | $ | $ | |||||||||
| Diluted | $ | $ | |||||||||
| Weighted-average shares used to compute earnings per share attributable to Class A and Class B common stockholders: | |||||||||||
| Basic | |||||||||||
| Diluted | |||||||||||
| Share-based compensation expense included in costs and expenses: | |||||||||||
| Cost of revenue | $ | $ | |||||||||
| Research and development | |||||||||||
| Marketing and sales | |||||||||||
| General and administrative | |||||||||||
| Total share-based compensation expense | $ | $ | |||||||||
See Accompanying Notes to Condensed Consolidated Financial Statements.
8
META PLATFORMS, INC.
CONDENSED CONSOLIDATED STATEMENTS OF COMPREHENSIVE INCOME
(In millions)
(Unaudited)
| Three Months Ended March 31, | |||||||||||
| 2022 | 2021 | ||||||||||
| Net income | $ | $ | |||||||||
| Other comprehensive loss: | |||||||||||
| Change in foreign currency translation adjustment, net of tax | ( | ( | |||||||||
| Change in unrealized gain (loss) on available-for-sale investments and other, net of tax | ( | ( | |||||||||
| Comprehensive income | $ | $ | |||||||||
See Accompanying Notes to Condensed Consolidated Financial Statements.
9
META PLATFORMS, INC.
CONDENSED CONSOLIDATED STATEMENTS OF STOCKHOLDERS' EQUITY
(In millions)
(Unaudited)
| Three Months Ended March 31, 2022 | Three Months Ended March 31, 2021 | ||||||||||||||||||||||||||||||||||||||||||||||||||||||||||||||||||||||
| Class A and Class B Common Stock | Additional Paid-In Capital | Accumulated Other Comprehensive Loss | Retained Earnings | Total Stockholders' Equity | Class A and Class B Common Stock | Additional Paid-In Capital | Accumulated Other Comprehensive Income | Retained Earnings | Total Stockholders' Equity | ||||||||||||||||||||||||||||||||||||||||||||||||||||||||||||||
| Shares | Par Value | Shares | Par Value | ||||||||||||||||||||||||||||||||||||||||||||||||||||||||||||||||||||
| Balances at beginning of period | $ | $ | $ | ( | $ | $ | $ | $ | $ | $ | $ | ||||||||||||||||||||||||||||||||||||||||||||||||||||||||||||
| Issuance of common stock | — | — | — | — | — | — | — | — | — | — | |||||||||||||||||||||||||||||||||||||||||||||||||||||||||||||
| Shares withheld related to net share settlement | ( | — | ( | — | ( | ( | ( | — | ( | — | ( | ( | |||||||||||||||||||||||||||||||||||||||||||||||||||||||||||
| Share-based compensation | — | — | — | — | — | — | — | — | |||||||||||||||||||||||||||||||||||||||||||||||||||||||||||||||
| Share repurchases | ( | — | — | — | ( | ( | ( | — | — | — | ( | ( | |||||||||||||||||||||||||||||||||||||||||||||||||||||||||||
| Other comprehensive loss | — | — | — | ( | — | ( | — | — | — | ( | — | ( | |||||||||||||||||||||||||||||||||||||||||||||||||||||||||||
| Net income | — | — | — | — | — | — | — | — | |||||||||||||||||||||||||||||||||||||||||||||||||||||||||||||||
| Balances at end of period | $ | $ | $ | ( | $ | $ | $ | $ | $ | $ | $ | ||||||||||||||||||||||||||||||||||||||||||||||||||||||||||||
See Accompanying Notes to Condensed Consolidated Financial Statements.
10
META PLATFORMS, INC.
CONDENSED CONSOLIDATED STATEMENTS OF CASH FLOWS
(In millions)
(Unaudited)
| Three Months Ended March 31, | |||||||||||
| 2022 | 2021 | ||||||||||
| Cash flows from operating activities | |||||||||||
| Net income | $ | $ | |||||||||
| Adjustments to reconcile net income to net cash provided by operating activities: | |||||||||||
| Depreciation and amortization | |||||||||||
| Share-based compensation | |||||||||||
| Deferred income taxes | ( | ||||||||||
| Other | ( | ( | |||||||||
| Changes in assets and liabilities: | |||||||||||
| Accounts receivable | |||||||||||
| Prepaid expenses and other current assets | ( | ||||||||||
| Other assets | ( | ( | |||||||||
| Accounts payable | ( | ( | |||||||||
| Partners payable | ( | ( | |||||||||
| Accrued expenses and other current liabilities | ( | ||||||||||
| Deferred revenue and deposits | ( | ||||||||||
| Other liabilities | ( | ||||||||||
| Net cash provided by operating activities | |||||||||||
| Cash flows from investing activities | |||||||||||
| Purchases of property and equipment | ( | ( | |||||||||
| Proceeds relating to property and equipment | |||||||||||
| Purchases of marketable securities | ( | ( | |||||||||
| Sales of marketable securities | |||||||||||
| Maturities of marketable securities | |||||||||||
| Acquisitions of businesses and intangible assets | ( | ||||||||||
| Other investing activities | ( | ( | |||||||||
| Net cash used in investing activities | ( | ( | |||||||||
| Cash flows from financing activities | |||||||||||
| Taxes paid related to net share settlement of equity awards | ( | ( | |||||||||
| Repurchases of Class A common stock | ( | ( | |||||||||
| Principal payments on finance leases | ( | ( | |||||||||
| Net change in overdraft in cash pooling entities | ( | ||||||||||
| Other financing activities | ( | ||||||||||
| Net cash used in financing activities | ( | ( | |||||||||
| Effect of exchange rate changes on cash, cash equivalents, and restricted cash | ( | ( | |||||||||
| Net increase (decrease) in cash, cash equivalents, and restricted cash | ( | ||||||||||
| Cash, cash equivalents, and restricted cash at beginning of the period | |||||||||||
| Cash, cash equivalents, and restricted cash at end of the period | $ | $ | |||||||||
| Reconciliation of cash, cash equivalents, and restricted cash to the condensed consolidated balance sheets | |||||||||||
| Cash and cash equivalents | $ | $ | |||||||||
| Restricted cash, included in prepaid expenses and other current assets | |||||||||||
| Restricted cash, included in other assets | |||||||||||
| Total cash, cash equivalents, and restricted cash | $ | $ | |||||||||
See Accompanying Notes to Condensed Consolidated Financial Statements.
11
META PLATFORMS, INC.
CONDENSED CONSOLIDATED STATEMENTS OF CASH FLOWS
(In millions)
(Unaudited)
| Three Months Ended March 31, | |||||||||||
| 2022 | 2021 | ||||||||||
| Supplemental cash flow data | |||||||||||
| Cash paid for income taxes, net | $ | $ | |||||||||
| Non-cash investing and financing activities: | |||||||||||
| Property and equipment in accounts payable and accrued expenses and other current liabilities | $ | $ | |||||||||
| Acquisition of businesses in accrued expenses and other current liabilities and other liabilities | $ | $ | |||||||||
| Settlement of convertible notes in exchange of equity securities in other current assets | $ | $ | |||||||||
| Other current assets through financing arrangement in accrued expenses and other current liabilities | $ | $ | |||||||||
| Repurchases of Class A common stock in accrued expenses and other current liabilities | $ | $ | |||||||||
See Accompanying Notes to Condensed Consolidated Financial Statements.
12
META PLATFORMS, INC.
NOTES TO CONDENSED CONSOLIDATED FINANCIAL STATEMENTS
(Unaudited)
Note 1. Summary of Significant Accounting Policies
Basis of Presentation
The accompanying unaudited condensed consolidated financial statements have been prepared in accordance with generally accepted accounting principles in the United States (GAAP) and applicable rules and regulations of the Securities and Exchange Commission regarding interim financial reporting. Certain information and note disclosures normally included in the financial statements prepared in accordance with GAAP have been condensed or omitted pursuant to such rules and regulations. As such, the information included in this quarterly report on Form 10-Q should be read in conjunction with the consolidated financial statements and accompanying notes included in our Annual Report on Form 10-K for the year ended December 31, 2021.
The condensed consolidated balance sheet as of December 31, 2021 included herein was derived from the audited financial statements as of that date, but does not include all disclosures including notes required by GAAP.
The condensed consolidated financial statements include the accounts of Meta Platforms, Inc., its subsidiaries where we have controlling financial interests, and any variable interest entities for which we are deemed to be the primary beneficiary. All intercompany balances and transactions have been eliminated.
The accompanying condensed consolidated financial statements reflect all normal recurring adjustments that are necessary to present fairly the results for the interim periods presented. Interim results are not necessarily indicative of the results for the full year ending December 31, 2022.
Use of Estimates
Preparation of condensed consolidated financial statements in conformity with GAAP requires the use of estimates and judgments that affect the reported amounts in the condensed consolidated financial statements and accompanying notes. These estimates form the basis for judgments we make about the carrying values of our assets and liabilities, which are not readily apparent from other sources. We base our estimates and judgments on historical information and on various other assumptions that we believe are reasonable under the circumstances. GAAP requires us to make estimates and judgments in several areas, including, but not limited to, those related to revenue recognition, valuation of equity investments, income taxes, loss contingencies, valuation of long-lived assets including goodwill, intangible assets, and property and equipment, and their associated estimated useful lives, credit losses of available-for-sale debt securities, credit losses of accounts receivable, fair value of financial instruments, and leases. These estimates are based on management's knowledge about current events and expectations about actions we may undertake in the future. Actual results could differ materially from those estimates.
Significant Accounting Policies
There have been no material changes to our significant accounting policies from our Annual Report on Form 10-K for the fiscal year ended December 31, 2021.
Recently Adopted Accounting Pronouncements
On January 1, 2022, we early adopted Accounting Standards Update (ASU) No. 2021-08, Business Combinations (Topic 805): Accounting for Contract Assets and Contract Liabilities from Contracts with Customers (ASU 2021-08), which clarifies that an acquirer of a business should recognize and measure contract assets and contract liabilities in a business combination in accordance with Accounting Standards Codification (ASC) Topic 606, Revenue from Contracts with Customers (Topic 606). The adoption of this new standard did not have a material impact on our condensed consolidated financial statements.
13
Accounting Pronouncements Not Yet Adopted
In November 2021, the Financial Accounting Standards Board issued ASU No. 2021-10, Government Assistance (Topic 832): Disclosure by Business Entities about Government Assistance (ASU 2021-10), which requires the disclosure of government assistance received by most business entities relating to: (1) the types of government assistance received; (2) the accounting for such assistance; and (3) the effect of the assistance on a business entity's financial statements. This guidance will be effective for our annual financial statements for the year ended December 31, 2022. We are currently evaluating the impact of the new guidance on our consolidated financial statements.
Note 2. Revenue
Revenue disaggregated by revenue source and by segment consists of the following (in millions). For comparative purposes, amounts in the prior period have been recast:
| Three Months Ended March 31, | |||||||||||
| 2022 | 2021 | ||||||||||
| Advertising | $ | $ | |||||||||
| Other revenue | |||||||||||
| Family of Apps | |||||||||||
| Reality Labs | |||||||||||
| Total revenue | $ | $ | |||||||||
Revenue disaggregated by geography, based on the addresses of our customers, consists of the following (in millions):
| Three Months Ended March 31, | |||||||||||
| 2022 | 2021 | ||||||||||
United States and Canada(1) | $ | $ | |||||||||
Europe(2) | |||||||||||
| Asia-Pacific | |||||||||||
Rest of World(2) | |||||||||||
| Total revenue | $ | $ | |||||||||
(1) United States revenue was $11.10 billion and $10.75 billion for the three months ended March 31, 2022 and 2021, respectively.
(2) Europe includes Russia and Turkey, and Rest of World includes Africa, Latin America, and the Middle East.
Our total deferred revenue was $565 million and $596 million as of March 31, 2022 and December 31, 2021, respectively. As of March 31, 2022, we expect $472 million of our deferred revenue to be realized in less than a year.
Note 3. Earnings per Share
We compute earnings per share (EPS) of Class A and Class B common stock using the two-class method. As the liquidation and dividend rights for both Class A and Class B common stock are identical, the undistributed earnings are allocated on a proportionate basis to the weighted-average number of common shares outstanding for the period.
Basic EPS is computed by dividing net income by the weighted-average number of shares of our Class A and Class B common stock outstanding.
For the calculation of diluted EPS, net income for basic EPS is adjusted by the effect of dilutive securities, including awards under our equity compensation plans.
In addition, the computation of the diluted EPS of Class A common stock assumes the conversion of our Class B
14
For the three months ended March 31, 2022, 48 million shares of Class A common stock equivalents of RSUs were excluded from the diluted EPS calculation as including them would have an anti-dilutive effect. RSUs with anti-dilutive effect were not material for the three months ended, March 31, 2021.
Basic and diluted EPS are the same for each class of common stock because they are entitled to the same liquidation and dividend rights.
The numerators and denominators of the basic and diluted EPS computations for our common stock are calculated as follows (in millions, except per share amounts):
| Three Months Ended March 31, | |||||||||||||||||||||||
| 2022 | 2021 | ||||||||||||||||||||||
| Class A | Class B | Class A | Class B | ||||||||||||||||||||
| Basic EPS: | |||||||||||||||||||||||
| Numerator | |||||||||||||||||||||||
| Net income | $ | $ | $ | $ | |||||||||||||||||||
| Denominator | |||||||||||||||||||||||
| Shares used in computation of basic earnings per share | |||||||||||||||||||||||
| Basic EPS | $ | $ | $ | $ | |||||||||||||||||||
| Diluted EPS: | |||||||||||||||||||||||
| Numerator | |||||||||||||||||||||||
| Net income | $ | $ | $ | $ | |||||||||||||||||||
| Reallocation of net income as a result of conversion of Class B to Class A common stock | |||||||||||||||||||||||
| Reallocation of net income to Class B common stock | ( | ( | |||||||||||||||||||||
| Net income for diluted EPS | $ | $ | $ | $ | |||||||||||||||||||
| Denominator | |||||||||||||||||||||||
| Shares used in computation of basic earnings per share | |||||||||||||||||||||||
| Conversion of Class B to Class A common stock | |||||||||||||||||||||||
| Weighted-average effect of dilutive RSUs | |||||||||||||||||||||||
| Shares used in computation of diluted earnings per share | |||||||||||||||||||||||
| Diluted EPS | $ | $ | $ | $ | |||||||||||||||||||
15
Note 4. Cash and Cash Equivalents and Marketable Securities
The following table sets forth the cash and cash equivalents and marketable securities by major security type (in millions):
| March 31, 2022 | December 31, 2021 | ||||||||||
| Cash and cash equivalents: | |||||||||||
| Cash | $ | $ | |||||||||
| Money market funds | |||||||||||
| U.S. government securities | |||||||||||
| U.S. government agency securities | |||||||||||
| Certificates of deposit and time deposits | |||||||||||
| Corporate debt securities | |||||||||||
| Total cash and cash equivalents | |||||||||||
| Marketable securities: | |||||||||||
| U.S. government securities | |||||||||||
| U.S. government agency securities | |||||||||||
| Corporate debt securities | |||||||||||
| Total marketable securities | |||||||||||
| Total cash and cash equivalents and marketable securities | $ | $ | |||||||||
The following table summarizes our available-for-sale marketable securities with unrealized losses as of March 31, 2022, aggregated by major security type and the length of time that individual securities have been in a continuous loss position (in millions):
| March 31, 2022 | |||||||||||||||||||||||||||||||||||
| Less than 12 months | 12 months or greater | Total | |||||||||||||||||||||||||||||||||
| Fair Value | Unrealized losses | Fair Value | Unrealized losses | Fair Value | Unrealized losses | ||||||||||||||||||||||||||||||
| U.S. government securities | $ | $ | ( | $ | $ | ( | $ | $ | ( | ||||||||||||||||||||||||||
| U.S. government agency securities | ( | ( | ( | ||||||||||||||||||||||||||||||||
| Corporate debt securities | ( | ( | ( | ||||||||||||||||||||||||||||||||
| Total | $ | $ | ( | $ | $ | ( | $ | $ | ( | ||||||||||||||||||||||||||
The gross unrealized gains on our marketable securities were not material as of March 31, 2022 and December 31, 2021. The gross unrealized losses were $996 million and not material as of March 31, 2022 and December 31, 2021, respectively. The allowance for credit losses on our marketable securities was not material as of March 31, 2022 and December 31, 2021.
The following table classifies our marketable securities by contractual maturities (in millions):
| March 31, 2022 | |||||
| Due within one year | $ | ||||
| Due after one year to five years | |||||
| Total | $ | ||||
16
Note 5. Equity Investments
Our equity investments are investments in equity securities of privately-held companies without readily determinable fair values. The following table summarizes our equity investments that were measured using measurement alternative and equity method (in millions):
| March 31, 2022 | December 31, 2021 | ||||||||||
| Equity investments under measurement alternative: | |||||||||||
| Initial cost | $ | $ | |||||||||
| Cumulative upward adjustments | |||||||||||
| Cumulative impairment/downward adjustments | ( | ( | |||||||||
| Carrying value | |||||||||||
| Equity investments under equity method | |||||||||||
| Total equity investments | $ | $ | |||||||||
Note 6. Fair Value Measurements
The following table summarizes our assets measured at fair value and the classification by level of input within the fair value hierarchy (in millions):
| Fair Value Measurement at Reporting Date Using | ||||||||||||||||||||
| Description | March 31, 2022 | Quoted Prices in Active Markets for Identical Assets (Level 1) | Significant Other Observable Inputs (Level 2) | |||||||||||||||||
| Cash equivalents: | ||||||||||||||||||||
| Money market funds | $ | $ | $ | |||||||||||||||||
| U.S. government securities | ||||||||||||||||||||
| Certificates of deposit and time deposits | ||||||||||||||||||||
| Corporate debt securities | ||||||||||||||||||||
| Marketable securities: | ||||||||||||||||||||
| U.S. government securities | ||||||||||||||||||||
| U.S. government agency securities | ||||||||||||||||||||
| Corporate debt securities | ||||||||||||||||||||
| Total cash equivalents and marketable securities | $ | $ | $ | |||||||||||||||||
17
| Fair Value Measurement at Reporting Date Using | ||||||||||||||||||||
| Description | December 31, 2021 | Quoted Prices in Active Markets for Identical Assets (Level 1) | Significant Other Observable Inputs (Level 2) | |||||||||||||||||
| Cash equivalents: | ||||||||||||||||||||
| Money market funds | $ | $ | $ | |||||||||||||||||
| U.S. government securities | ||||||||||||||||||||
| U.S. government agency securities | ||||||||||||||||||||
| Certificates of deposit and time deposits | ||||||||||||||||||||
| Corporate debt securities | ||||||||||||||||||||
| Marketable securities: | ||||||||||||||||||||
| U.S. government securities | ||||||||||||||||||||
| U.S. government agency securities | ||||||||||||||||||||
| Corporate debt securities | ||||||||||||||||||||
| Total cash equivalents and marketable securities | $ | $ | $ | |||||||||||||||||
We classify our cash equivalents and marketable securities within Level 1 or Level 2 because we use quoted market prices or alternative pricing sources and models utilizing market observable inputs to determine their fair value.
We also have assets and liabilities classified within Level 3 because factors used to develop the estimated fair value are unobservable inputs that are not supported by market activity. As of March 31, 2022, assets and liabilities remeasured at fair value within Level 3 during the three months ended March 31, 2022 were not material. As of December 31, 2021, included in the total $6.78 billion of equity investments, $913 million was remeasured at fair value during the year ended December 31, 2021 and was classified within Level 3 of the fair value measurement hierarchy on a non-recurring basis. The gains and losses as the result of the remeasurements were not material for the three months ended March 31, 2022 and 2021. For information regarding equity investments, see Note 5 — Equity Investments.
Note 7. Property and Equipment
Property and equipment, net consists of the following (in millions):
| March 31, 2022 | December 31, 2021 | ||||||||||
| Land | $ | $ | |||||||||
| Servers and network assets | |||||||||||
| Buildings | |||||||||||
| Leasehold improvements | |||||||||||
| Equipment and other | |||||||||||
| Finance lease right-of-use assets | |||||||||||
| Construction in progress | |||||||||||
| Property and equipment, gross | |||||||||||
| Less: Accumulated depreciation | ( | ( | |||||||||
| Property and equipment, net | $ | $ | |||||||||
Construction in progress includes costs mostly related to construction of data centers, network infrastructure, and office buildings. Depreciation expense on property and equipment was $2.12 billion and $1.85 billion for the three months ended March 31, 2022 and 2021, respectively.
18
Note 8. Leases
We have entered into various non-cancelable operating lease agreements mostly for certain of our offices, data centers, colocations, and land. We have also entered into various non-cancelable finance lease agreements for certain network infrastructure. Our leases have original lease periods expiring between the remainder of 2022 and 2093. Many leases include one or more options to renew. We do not assume renewals in our determination of the lease term unless the renewals are deemed to be reasonably assured. Our lease agreements generally do not contain any material residual value guarantees or material restrictive covenants.
The components of lease costs are as follows (in millions):
| Three Months Ended March 31, | |||||||||||
| 2022 | 2021 | ||||||||||
| Finance lease cost | |||||||||||
| Amortization of right-of-use assets | $ | $ | |||||||||
| Interest | |||||||||||
| Operating lease cost | |||||||||||
| Variable lease cost and other, net | |||||||||||
| Total lease cost | $ | $ | |||||||||
Supplemental balance sheet information related to leases is as follows:
| March 31, 2022 | December 31, 2021 | ||||||||||
| Weighted-average remaining lease term | |||||||||||
| Finance leases | |||||||||||
| Operating leases | |||||||||||
| Weighted-average discount rate | |||||||||||
| Finance leases | % | % | |||||||||
| Operating leases | % | % | |||||||||
The following is a schedule, by years, of maturities of lease liabilities as of March 31, 2022 (in millions):
| Operating Leases | Finance Leases | ||||||||||
| The remainder of 2022 | $ | $ | |||||||||
| 2023 | |||||||||||
| 2024 | |||||||||||
| 2025 | |||||||||||
| 2026 | |||||||||||
| Thereafter | |||||||||||
| Total undiscounted cash flows | |||||||||||
| Less: Imputed interest | ( | ( | |||||||||
| Present value of lease liabilities | $ | $ | |||||||||
| $ | $ | ||||||||||
| Present value of lease liabilities | $ | $ | |||||||||
19
The table above does not include lease payments that were not fixed at commencement or lease modification. As of March 31, 2022, we have additional operating and finance leases, that have not yet commenced, with lease obligations of approximately $9.78 billion and $1.63 billion, respectively, mostly for offices, data centers, and network infrastructure. These operating and finance leases will commence between the remainder of 2022 and 2028 with lease terms of greater than one year to 30 years.
Supplemental cash flow information related to leases is as follows (in millions):
| Three Months Ended March 31, | |||||||||||
| 2022 | 2021 | ||||||||||
| Cash paid for amounts included in the measurement of lease liabilities: | |||||||||||
| Operating cash flows for operating leases | $ | $ | |||||||||
| Operating cash flows for finance leases | $ | $ | |||||||||
| Financing cash flows for finance leases | $ | $ | |||||||||
| Lease liabilities arising from obtaining right-of-use assets: | |||||||||||
| Operating leases | $ | $ | |||||||||
| Finance leases | $ | $ | |||||||||
Note 9. Acquisitions, Goodwill and Intangible Assets
During the three months ended March 31, 2022, we completed several business acquisitions with total cash consideration transferred of $774 million, which in aggregate was allocated to $182 million of intangible assets, $759 million of goodwill, and $167 million of net liabilities assumed. Goodwill generated from all business acquisitions completed was primarily attributable to expected synergies from future growth and potential monetization opportunities. The amount of goodwill generated that was deductible for tax purposes was not material. Acquisition-related costs were immaterial and were expensed as incurred in the condensed consolidated statements of operations. Pro forma historical results of operations related to these business acquisitions have not been presented because they are not material to our condensed consolidated financial statements, either individually or in the aggregate. We have included the financial results of these acquired businesses in our condensed consolidated financial statements from their respective dates of acquisition.
Changes in the carrying amount of goodwill by reportable segment for the three months ended March 31, 2022 are as follows (in millions):
| Family of Apps | Reality Labs | Total | |||||||||||||||
| Goodwill at December 31, 2021 | $ | $ | $ | ||||||||||||||
| Acquisitions | |||||||||||||||||
| Adjustments | ( | ( | |||||||||||||||
| Goodwill at March 31, 2022 | $ | $ | $ | ||||||||||||||
20
The following table sets forth the major categories of the intangible assets and the weighted‑average remaining useful lives for those assets that are not already fully amortized (in millions):
| March 31, 2022 | December 31, 2021 | ||||||||||||||||||||||||||||||||||||||||
| Weighted-Average Remaining Useful Lives (in years) | Gross Carrying Amount | Accumulated Amortization | Net Carrying Amount | Gross Carrying Amount | Accumulated Amortization | Net Carrying Amount | |||||||||||||||||||||||||||||||||||
| Acquired technology | $ | $ | ( | $ | $ | $ | ( | $ | |||||||||||||||||||||||||||||||||
| Acquired patents | ( | ( | |||||||||||||||||||||||||||||||||||||||
| Trade names | ( | ( | |||||||||||||||||||||||||||||||||||||||
| Other | ( | ( | |||||||||||||||||||||||||||||||||||||||
| Total finite-lived assets | ( | ( | |||||||||||||||||||||||||||||||||||||||
| Total indefinite-lived assets | N/A | — | — | ||||||||||||||||||||||||||||||||||||||
| Total intangible assets | $ | $ | ( | $ | $ | $ | ( | $ | |||||||||||||||||||||||||||||||||
Amortization expense of intangible assets was $40 million and $118 million for the three months ended March 31, 2022 and 2021, respectively.
As of March 31, 2022, expected amortization expense for the unamortized finite-lived intangible assets for the next five years and thereafter is as follows (in millions):
| The remainder of 2022 | $ | ||||
| 2023 | |||||
| 2024 | |||||
| 2025 | |||||
| 2026 | |||||
| Thereafter | |||||
| Total | $ | ||||
Note 10. Commitments and Contingencies
Guarantee
In 2018, we established a multi-currency notional cash pool for certain of our entities with a third-party bank provider. Actual cash balances are not physically converted and are not commingled between participating legal entities. As part of the notional cash pool agreement, the bank extends overdraft credit to our participating entities as needed, provided that the overall notionally pooled balance of all accounts in the pool at the end of each day is at least zero. In the unlikely event of a default by our collective entities participating in the pool, any overdraft balances incurred would be guaranteed by Meta Platforms, Inc.
21
Contractual Commitments
We have $22.73 billion of non-cancelable contractual commitments as of March 31, 2022, which are primarily related to our investments in servers, network infrastructure, and Reality Labs. The following is a schedule, by years, of non-cancelable contractual commitments as of March 31, 2022 (in millions):
| The remainder of 2022 | $ | ||||
| 2023 | |||||
| 2024 | |||||
| 2025 | |||||
| 2026 | |||||
| Thereafter | |||||
| Total | $ | ||||
Additionally, as part of the normal course of business, we have entered into multi-year agreements to purchase renewable energy that do not specify a fixed or minimum volume commitment or to purchase certain server components that do not specify a fixed or minimum price commitment. We enter into these agreements in order to secure either volume or price. Using the projected market prices or expected volume consumption, the total estimated spend as of March 31, 2022 is approximately $8.75 billion, the majority of which is due beyond five years . The ultimate spend under these agreements may vary and will be based on prevailing market prices or actual volume purchased.
Legal and Related Matters
Beginning on March 20, 2018, multiple putative class actions and derivative actions were filed in state and federal courts in the United States and elsewhere against us and certain of our directors and officers alleging violations of securities laws, breach of fiduciary duties, and other causes of action in connection with our platform and user data practices as well as the misuse of certain data by a developer that shared such data with third parties in violation of our terms and policies, and seeking unspecified damages and injunctive relief. Beginning on July 27, 2018, two putative class actions were filed in federal court in the United States against us and certain of our directors and officers alleging violations of securities laws in connection with the disclosure of our earnings results for the second quarter of 2018 and seeking unspecified damages. These two actions subsequently were transferred and consolidated in the U.S. District Court for the Northern District of California with the putative securities class action described above relating to our platform and user data practices. On September 25, 2019, the district court granted our motion to dismiss the consolidated putative securities class action, with leave to amend. On November 15, 2019, a second amended complaint was filed in the consolidated putative securities class action. On August 7, 2020, the district court granted our motion to dismiss the second amended complaint, with leave to amend. On October 16, 2020, a third amended complaint was filed in the consolidated putative securities class action. On December 20, 2021, the district court granted our motion to dismiss the third amended complaint, with prejudice. On January 17, 2022, the plaintiffs filed a notice of appeal of the order dismissing their case, and the appeal is now pending before the U.S. Court of Appeals for the Ninth Circuit. With respect to the multiple putative class actions filed against us beginning on March 20, 2018 alleging fraud and violations of consumer protection, privacy, and other laws in connection with the same matters, several of the cases brought on behalf of consumers in the United States were consolidated in the U.S. District Court for the Northern District of California. On September 9, 2019, the court granted, in part, and denied, in part, our motion to dismiss the consolidated putative consumer class action. In addition, our platform and user data practices, as well as the events surrounding the misuse of certain data by a developer, became the subject of U.S. Federal Trade Commission (FTC), state attorneys general, and other government inquiries in the United States, Europe, and other jurisdictions. We entered into a settlement and modified consent order to resolve the FTC inquiry, which took effect in April 2020. Among other matters, our settlement with the FTC required us to pay a penalty of $5.0 billion which was paid in April 2020 upon the effectiveness of the modified consent order. The state attorneys general inquiry and certain government inquiries in other jurisdictions remain ongoing. On July 16, 2021, a stockholder derivative action was filed in Delaware Chancery Court against certain of our directors and officers asserting breach of fiduciary duty and related claims relating to our historical platform and user data practices, as well as our settlement with the FTC. On July 20, 2021, other stockholders filed an amended derivative complaint in a related Delaware Chancery Court action, asserting breach of fiduciary duty and related claims against certain of our current and former directors and officers in connection with our historical platform and user data practices. On
22
November 4, 2021, the lead plaintiffs filed a second amended and consolidated complaint in the stockholder derivative action. We believe the lawsuits described above are without merit, and we are vigorously defending them.
We also notify the Irish Data Protection Commission (IDPC), our lead European Union privacy regulator under the General Data Protection Regulation (GDPR), of certain other personal data breaches and privacy issues, and are subject to inquiries and investigations by the IDPC and other European regulators regarding various aspects of our regulatory compliance. The GDPR is still a relatively new law and draft decisions in investigations by the IDPC are subject to review by other European privacy regulators as part of the GDPR's consistency mechanism, which may lead to significant changes in the final outcome of such investigations. As a result, the interpretation and enforcement of the GDPR, as well as the imposition and amount of penalties for non-compliance, are subject to significant uncertainty. Although we are vigorously defending our regulatory compliance, we have accrued significant amounts for loss contingencies related to these inquiries and investigations in Europe, and we believe there is a reasonable possibility that additional accruals for losses related to these matters could be material in the aggregate.
We are also subject to other government inquiries and investigations relating to our business activities and disclosure practices. For example, beginning in September 2021, we became subject to government investigations and requests relating to a former employee's allegations and release of internal company documents concerning, among other things, our algorithms, advertising and user metrics, and content enforcement practices, as well as misinformation and other undesirable activity on our platform, and user well-being. Beginning on October 27, 2021, multiple putative class actions and derivative actions were filed in the U.S. District Court for the Northern District of California against us and certain of our directors and officers alleging violations of securities laws, breach of fiduciary duties, and other causes of action in connection with the same matters. We believe these lawsuits are without merit, and we are vigorously defending them.
On March 8, 2022, a putative class action was filed in the U.S. District Court for the Northern District of California against us and certain of our directors and officers alleging violations of securities laws in connection with the disclosure of our earnings results for the fourth quarter of 2021 and seeking unspecified damages. We believe this lawsuit is without merit, and we are vigorously defending it.
Beginning on August 15, 2018, multiple putative class actions were filed against us alleging that we inflated our estimates of the potential audience size for advertisements, resulting in artificially increased demand and higher prices. The cases were consolidated in the U.S. District Court for the Northern District of California and seek unspecified damages and injunctive relief. In a series of rulings in 2019, 2021, and 2022, the court dismissed certain of the plaintiffs' claims, but permitted its fraud and unfair competition claims to proceed. On March 29, 2022, the court granted the plaintiffs' motion for class certification. We believe this lawsuit is without merit, and we are vigorously defending it.
In addition, we are subject to litigation and other proceedings involving law enforcement and other regulatory agencies, including in particular in Brazil, Russia, and other countries in Europe, in order to ascertain the precise scope of our legal obligations to comply with the requests of those agencies, including our obligation to disclose user information in particular circumstances. A number of such instances have resulted in the assessment of fines and penalties against us. We believe we have multiple legal grounds to satisfy these requests or prevail against associated fines and penalties, and we intend to vigorously defend such fines and penalties.
With respect to the cases, actions, and inquiries described above, we evaluate the associated developments on a regular basis and accrue a liability when we believe a loss is probable and the amount can be reasonably estimated. In addition, we believe there is a reasonable possibility that we may incur a loss in some of these matters. With respect to the matters described above that do not include an estimate of the amount of loss or range of possible loss, such losses or range of possible losses either cannot be estimated or are not individually material, but we believe there is a reasonable possibility that they may be material in the aggregate.
We are also party to various other legal proceedings, claims, and regulatory, tax or government inquiries and investigations that arise in the ordinary course of business. For example, we are subject to various litigation and government inquiries and investigations, formal or informal, by competition authorities in the United States, Europe, and other jurisdictions. Such investigations, inquiries, and lawsuits concern, among other things, our business practices in the areas of social networking or social media services, digital advertising, and/or mobile or online applications, as well as our acquisitions. For example, in June 2019 we were informed by the FTC that it had opened an antitrust investigation of our
23
company. On December 9, 2020, the FTC filed a complaint against us in the U.S. District Court for the District of Columbia alleging that we engaged in anticompetitive conduct and unfair methods of competition in violation of Section 5 of the Federal Trade Commission Act and Section 2 of the Sherman Act, including by acquiring Instagram in 2012 and WhatsApp in 2014 and by maintaining conditions on access to our platform. In addition, beginning in the third quarter of 2019, we became the subject of antitrust investigations by the U.S. Department of Justice and state attorneys general. On December 9, 2020, the attorneys general from 46 states, the territory of Guam, and the District of Columbia filed a complaint against us in the U.S. District Court for the District of Columbia alleging that we engaged in anticompetitive conduct in violation of Section 2 of the Sherman Act, including by acquiring Instagram in 2012 and WhatsApp in 2014 and by maintaining conditions on access to our platform. The complaint also alleged that we violated Section 7 of the Clayton Act by acquiring Instagram and WhatsApp. The complaints of the FTC and attorneys general both sought a permanent injunction against our company's alleged violations of the antitrust laws, and other equitable relief, including divestiture or reconstruction of Instagram and WhatsApp. On June 28, 2021, the court granted our motions to dismiss the complaints filed by the FTC and attorneys general, dismissing the FTC's complaint with leave to amend and dismissing the attorneys general's case without prejudice. On July 28, 2021, the attorneys general filed a notice of appeal of the order dismissing their case and that appeal is now pending before the U.S. Court of Appeals for the District of Columbia Circuit. On August 19, 2021, the FTC filed an amended complaint, and on October 4, 2021, we filed a motion to dismiss this amended complaint. On January 11, 2022, the court denied our motion to dismiss the FTC's amended complaint. Multiple putative class actions have also been filed in state and federal courts in the United States and in the United Kingdom against us alleging violations of antitrust laws and other causes of action in connection with these acquisitions and/or other alleged anticompetitive conduct, and seeking damages and injunctive relief. Several of the cases brought on behalf of certain advertisers and users in the United States were consolidated in the U.S. District Court for the Northern District of California. On January 14, 2022, the court granted, in part, and denied, in part, our motion to dismiss the consolidated actions. We believe these lawsuits are without merit, and we are vigorously defending them.
The ultimate outcome of the legal and related matters described in this section, such as whether the likelihood of loss is remote, reasonably possible, or probable, or if and when the reasonably possible range of loss is estimable, is inherently uncertain. Therefore, if one or more of these matters were resolved against us for amounts in excess of management's estimates of loss, our results of operations and financial condition, including in a particular reporting period in which any such outcome becomes probable and estimable, could be materially adversely affected.
For information regarding income tax contingencies, see Note 12 — Income Taxes.
Indemnifications
In the normal course of business, to facilitate transactions of services and products, we have agreed to indemnify certain parties with respect to certain matters. We have agreed to hold certain parties harmless against losses arising from a breach of representations or covenants, or out of intellectual property infringement or other claims made by third parties. These agreements may limit the time within which an indemnification claim can be made and the amount of the claim. In addition, we have entered into indemnification agreements with our officers, directors, and certain employees, and our certificate of incorporation and bylaws contain similar indemnification obligations.
24
Note 11. Stockholders' Equity
Share Repurchase Program
Our board of directors has authorized a share repurchase program of our Class A common stock, which commenced in January 2017 and does not have an expiration date. As of December 31, 2021, $38.79 billion remained available and authorized for repurchases under this program. During the three months ended March 31, 2022, we repurchased and subsequently retired 34 million shares of our Class A common stock for an aggregate amount of $9.39 billion. As of March 31, 2022, $29.41 billion remained available and authorized for repurchases.
The timing and actual number of shares repurchased under the repurchase program depend on a variety of factors, including price, general business and market conditions, and other investment opportunities, and shares may be repurchased through open market purchases or privately negotiated transactions, including through the use of trading plans intended to qualify under Rule 10b5-1 under the Securities Exchange Act of 1934, as amended.
Share-based Compensation Plans
We have one active share-based employee compensation plan, the 2012 Equity Incentive Plan, which was amended in each of June 2016 and February 2018 (Amended 2012 Plan). Our Amended 2012 Plan provides for the issuance of incentive and nonqualified stock options, restricted stock awards, stock appreciation rights, RSUs, performance shares, and stock bonuses to qualified employees, directors, and consultants. Shares that are withheld in connection with the net settlement of RSUs or forfeited under our stock plan are added to the reserves of the Amended 2012 Plan.
Effective January 1, 2022, there were 136 million shares of our Class A common stock reserved for future issuance under our Amended 2012 Plan. Pursuant to the automatic increase provision under our Amended 2012 Plan, the number of shares reserved for issuance increases automatically on January 1 of each of the calendar years during the term of the Amended 2012 Plan, which will continue through April 2026, by a number of shares of Class A common stock equal to the lesser of (i) 2.5 % of the total issued and outstanding shares of our Class A common stock as of the immediately preceding December 31st or (ii) a number of shares determined by our board of directors.
The following table summarizes the activities for our unvested RSUs for the three months ended March 31, 2022:
| Number of Shares | Weighted-Average Grant Date Fair Value Per Share | ||||||||||
| (in thousands) | |||||||||||
| Unvested at December 31, 2021 | $ | ||||||||||
| Granted | $ | ||||||||||
| Vested | ( | $ | |||||||||
| Forfeited | ( | $ | |||||||||
| Unvested at March 31, 2022 | $ | ||||||||||
The fair value as of the respective vesting dates of RSUs that vested during the three months ended March 31, 2022 and 2021 was $2.43 billion and $2.83 billion, respectively. The income tax benefit recognized related to awards vested during the three months ended March 31, 2022 and 2021 was $514 million and $605 million, respectively.
25
Note 12. Income Taxes
Our tax provision for interim periods is determined using an estimated annual effective tax rate, adjusted for discrete items arising in that quarter. In each quarter, we update the estimated annual effective tax rate and make a year-to-date adjustment to the provision. The estimated annual effective tax rate is subject to significant volatility due to several factors, including our ability to accurately predict the proportion of our income (loss) before provision for income taxes in multiple jurisdictions, the U.S. tax benefits from foreign derived intangible income, the effects of tax law changes, the effects of acquisitions, and the integration of those acquisitions.
Our gross unrecognized tax benefits were $9.77 billion and $9.81 billion on March 31, 2022 and December 31, 2021, respectively. These unrecognized tax benefits were primarily accrued for the uncertainties related to transfer pricing with our foreign subsidiaries, which include licensing of intellectual property, providing services and other transactions, as well as for uncertainties with our research tax credits. If the gross unrecognized tax benefits as of March 31, 2022 were realized in a future period, this would result in a tax benefit of $5.81 billion within our provision of income taxes at such time. The amount of interest and penalties accrued was $889 million and $960 million as of March 31, 2022 and December 31, 2021, respectively. We expect to continue to accrue unrecognized tax benefits for certain recurring tax positions.
We are subject to taxation in the United States and various other state and foreign jurisdictions. The material jurisdictions in which we are subject to potential examination include the United States and Ireland. We are under examination by the Internal Revenue Service (IRS) for our 2014 through 2019 tax years. Our 2020 and subsequent tax years remain open to examination by the IRS and the Irish Revenue Commissioners.
In July 2016, we received a Statutory Notice of Deficiency (Notice) from the IRS related to transfer pricing with our foreign subsidiaries in conjunction with the examination of the 2010 tax year. While the Notice applies only to the 2010 tax year, the IRS stated that it will also apply its position for tax years subsequent to 2010 and has done so in years covered by the second Notice described below. We do not agree with the position of the IRS and have filed a petition in the Tax Court challenging the Notice. On January 15, 2020, the IRS's amendment to answer was filed stating that it planned to assert at trial an adjustment that is higher than the adjustment stated in the Notice. The first session of the trial was completed in March 2020 and a second session commenced in October 2021. Based on the information provided, we believe that, if the IRS prevails in its updated position, this could result in an additional federal tax liability of an estimated, aggregate amount of up to approximately $9.0 billion in excess of the amounts in our originally filed U.S. return, plus interest and any penalties asserted.
In March 2018, we received a second Notice from the IRS in conjunction with the examination of our 2011 through 2013 tax years. The IRS applied its position from the 2010 tax year to each of these years and also proposed new adjustments related to other transfer pricing with our foreign subsidiaries and certain tax credits that we claimed. If the IRS prevails in its position for these new adjustments, this could result in an additional federal tax liability of up to approximately $680 million in excess of the amounts in our originally filed U.S. returns, plus interest and any penalties asserted. We do not agree with the positions of the IRS in the second Notice and have filed a petition in the Tax Court challenging the second Notice.
We have previously accrued an estimated unrecognized tax benefit consistent with the guidance in ASC 740, Income Taxes (ASC 740), that is lower than the potential additional federal tax liability from the positions taken by the IRS in the two Notices and its Pretrial Memorandum. In addition, if the IRS prevails in its positions related to transfer pricing with our foreign subsidiaries, the additional tax that we would owe would be partially offset by a reduction in the tax that we owe under the mandatory transition tax on accumulated foreign earnings from the 2017 Tax Cuts and Jobs Act. As of March 31, 2022, we have not resolved these matters and proceedings continue in the Tax Court.
We believe that adequate amounts have been reserved in accordance with ASC 740 for any adjustments to the provision for income taxes or other tax items that may ultimately result from these examinations. The timing of the resolution, settlement, and closure of any audits is highly uncertain, and it is reasonably possible that the balance of gross
26
Note 13. Segment and Geographical Information
We report our financial results for our two reportable segments: Family of Apps (FoA) and Reality Labs (RL). FoA includes Facebook, Instagram, Messenger, WhatsApp, and other services. RL includes augmented and virtual reality related consumer hardware, software, and content. Our operating segments are the same as our reportable segments.
Our Chief Executive Officer is our chief operating decision maker (CODM), who allocates resources to and assesses the performance of each operating segment using information about the operating segment's revenue and income (loss) from operations. Our CODM does not evaluate operating segments using asset or liability information.
Revenue and costs and expenses are generally directly attributed to our segments. These costs and expenses include certain product development related operating expenses, costs associated with partnership arrangements, consumer hardware product costs, content costs, and legal-related costs. Indirect costs are allocated to segments based on a reasonable allocation methodology, when such costs are significant to the performance measures of the operating segments. Indirect cost of revenue is allocated to our segments based on usage, such as costs related to the operation of our data centers and technical infrastructure. Indirect operating expenses, such as facilities, information technology, certain shared research and development activities, recruiting, and physical security expenses, are mostly allocated based on headcount.
The following table sets forth our segment information of revenue and income (loss) from operations (in millions). For comparative purposes, amounts in the prior period have been recast:
| Three Months Ended March 31, | |||||||||||
| 2022 | 2021 | ||||||||||
| Revenue: | |||||||||||
| Family of Apps | $ | $ | |||||||||
| Reality Labs | |||||||||||
| Total revenue | $ | $ | |||||||||
| Income (loss) from operations: | |||||||||||
| Family of Apps | $ | $ | |||||||||
| Reality Labs | ( | ( | |||||||||
| Total income from operations | $ | $ | |||||||||
For information regarding revenue disaggregated by geography, see Note 2 — Revenue.
The following table sets forth our long-lived assets by geographic area, which consist of property and equipment, net and operating lease right-of-use assets (in millions):
| March 31, 2022 | December 31, 2021 | ||||||||||
| United States | $ | $ | |||||||||
Rest of the world(1) | |||||||||||
| Total long-lived assets | $ | $ | |||||||||
(1) No individual country, other than disclosed above, exceeded 10% of our total long-lived assets for any period presented.
27
Item 2.Management's Discussion and Analysis of Financial Condition and Results of Operations
You should read the following discussion of our financial condition and results of operations in conjunction with our condensed consolidated financial statements and the related notes included elsewhere in this Quarterly Report on Form 10-Q and with our audited consolidated financial statements included in our Annual Report on Form 10-K for the year ended December 31, 2021, as filed with the Securities and Exchange Commission. In addition to our historical condensed consolidated financial information, the following discussion contains forward-looking statements that reflect our plans, estimates, and beliefs. Our actual results could differ materially from those discussed in the forward-looking statements. Factors that could cause or contribute to these differences include those discussed below and elsewhere in this Quarterly Report on Form 10-Q, particularly in Part II, Item 1A, "Risk Factors." For a discussion of limitations in the measurement of certain of our community metrics, see the section entitled "Limitations of Key Metrics and Other Data" in this Quarterly Report on Form 10-Q.
To supplement our condensed consolidated financial statements, which are prepared and presented in accordance with generally accepted accounting principles in the United States (GAAP), we present revenue on a constant currency basis, which is a non-GAAP financial measure. Revenue on a constant currency basis is presented in the section entitled "—Revenue—Foreign Exchange Impact on Revenue." To calculate revenue on a constant currency basis, we translated revenue for the three months ended March 31, 2022 using the prior year's monthly exchange rates for our settlement or billing currencies other than the U.S. dollar.
This non-GAAP financial measure is not intended to be considered in isolation or as a substitute for, or superior to, financial information prepared and presented in accordance with GAAP. This measure may be different from non-GAAP financial measures used by other companies, limiting its usefulness for comparison purposes. Moreover, presentation of revenue on a constant currency basis is provided for year-over-year comparison purposes, and investors should be cautioned that the effect of changing foreign currency exchange rates has an actual effect on our operating results. We believe this non-GAAP financial measure provides investors with useful supplemental information about the financial performance of our business, enables comparison of financial results between periods where certain items may vary independent of business performance, and allows for greater transparency with respect to key metrics used by management in operating our business.
Executive Overview of First Quarter Results
Our financial results and key community metrics for the first quarter of 2022 are as follows:
Consolidated and segment results:
We report our financial results for our two reportable segments: Family of Apps (FoA) and Reality Labs (RL). FoA includes Facebook, Instagram, Messenger, WhatsApp, and other services. RL includes our augmented and virtual reality related consumer hardware, software, and content. For comparative purposes, amounts in the prior period have been recast:
| Family of Apps | Reality Labs | Total | |||||||||||||||||||||||||||||||||||||||||||||||||||
| Three Months Ended March 31, | Year-over-Year % Change | Three Months Ended March 31, | Year-over-Year % Change | Three Months Ended March 31, | Year-over-Year % Change | ||||||||||||||||||||||||||||||||||||||||||||||||
| 2022 | 2021 | 2022 | 2021 | 2022 | 2021 | ||||||||||||||||||||||||||||||||||||||||||||||||
| (dollars in millions) | |||||||||||||||||||||||||||||||||||||||||||||||||||||
| Revenue | $ | 27,213 | $ | 25,637 | 6% | $ | 695 | $ | 534 | 30% | $ | 27,908 | $ | 26,171 | 7% | ||||||||||||||||||||||||||||||||||||||
| Costs and expenses | $ | 15,729 | $ | 12,432 | 27% | $ | 3,655 | $ | 2,361 | 55% | $ | 19,384 | $ | 14,793 | 31% | ||||||||||||||||||||||||||||||||||||||
| Income (loss) from operations | $ | 11,484 | $ | 13,205 | (13)% | $ | (2,960) | $ | (1,827) | (62)% | $ | 8,524 | $ | 11,378 | (25)% | ||||||||||||||||||||||||||||||||||||||
| Operating margin | 42 | % | 52 | % | (426) | % | (342) | % | 31 | % | 43 | % | |||||||||||||||||||||||||||||||||||||||||
•Net income was $7.47 billion, with diluted earnings per share of $2.72 for the three months ended March 31, 2022.
•Capital expenditures, including principal payments on finance leases, were $5.55 billion for the three months ended March 31, 2022.
•Effective tax rate was 16% for the three months ended March 31, 2022.
•Cash and cash equivalents and marketable securities were $43.89 billion as of March 31, 2022.
•Headcount was 77,805 as of March 31, 2022, an increase of 28% year-over-year.
28
Family of Apps metrics:
•Family daily active people (DAP) was 2.87 billion on average for March 2022, an increase of 6% year-over-year.
•Family monthly active people (MAP) was 3.64 billion as of March 31, 2022, an increase of 6% year-over-year.
•Facebook daily active users (DAUs) were 1.96 billion on average for March 2022, an increase of 4% year-over-year.
•Facebook monthly active users (MAUs) were 2.94 billion as of March 31, 2022, an increase of 3% year-over-year.
•Ad impressions delivered across our Family of Apps in the first quarter of 2022 increased by 15% year-over-year, and the average price per ad in the first quarter of 2022 decreased by 8% year-over-year.
Our mission is to give people the power to build community and bring the world closer together. All of our products, including our apps, share the vision of helping to bring the metaverse to life.
In the first quarter of 2022, we continued to focus on our main revenue growth priorities: (i) helping marketers use our products to connect with consumers and (ii) making our ads more relevant and effective. We also continued to invest based on the following company priorities: (i) continue making progress on the major social issues facing the internet and our company, including privacy, safety, and security; (ii) build new experiences that meaningfully improve people's lives today and set the stage for even bigger improvements in the future; (iii) keep building our business by supporting the millions of businesses that rely on our services to grow and create jobs; and (iv) communicate more transparently about what we're doing and the role our services play in the world.
Our advertising revenue growth in the first quarter of 2022 was adversely affected by reduced marketer spending as a result of limitations on our ad targeting and measurement tools arising from changes to the iOS operating system beginning in 2021. We expect that future advertising revenue growth will continue to be adversely affected by these and other limitations on our ad targeting and measurement tools arising from changes to the regulatory environment and third-party mobile operating systems and browsers.
The COVID-19 pandemic has also impacted our business and results of operations, with a varied impact on the demand for and pricing of our ads from period to period. While we experienced a reduction in advertising demand and a related decline in pricing during the onset of the pandemic, we believe the pandemic subsequently contributed to an acceleration in the growth of online commerce, and we experienced increasing demand for advertising as a result of this trend. More recently, we believe this growth has declined, and we saw continued softening of advertising demand in the first quarter of 2022 as many activities that shifted online during COVID-19 related lockdowns returned in person. We may experience reduced advertising demand and related declines in pricing in future periods to the extent this trend continues, which could adversely affect our advertising revenue growth. The impact of the pandemic on the demand for and pricing of our advertising services, as well as on our overall results of operations, remains uncertain for the foreseeable future.
Other global and regional business, macroeconomic, and geopolitical conditions also have had, and we believe will continue to have, an impact on our user growth and engagement and advertising revenue growth. For example, competitive products and services have reduced some users' engagement with our products and services. In response to competitive pressures, we have introduced new features such as Reels, which is growing in usage but is not currently monetized at the same rate as our feed or Stories products. We also have seen a deceleration in our community growth rates as the size of our community continues to increase. In addition, in connection with the war in Ukraine, access to Facebook and Instagram was restricted in Russia and the services were then prohibited by the Russian government, which adversely affected user growth and engagement in the first quarter of 2022. These trends adversely affected advertising revenue growth in the first quarter of 2022, including softness in the second half of the quarter that coincided with the war in Ukraine, and we expect will continue to affect our advertising revenue growth in the foreseeable future. In addition, the appreciation of the U.S. dollar relative to other foreign currencies had a negative impact on our advertising revenue in the first quarter of 2022. General economic uncertainty as a result of these conditions globally or regionally may adversely affect advertising demand and therefore our revenue and business.
We anticipate that additional investments in our servers, data center capacity, network infrastructure, and office facilities, as well as scaling our headcount to support our growth, including in our Reality Labs initiatives, will continue to drive expense growth in 2022. In 2022, we also expect that our year-over-year total expense growth rates may significantly exceed our year-over-year revenue growth rates, which would adversely affect our operating margin and profitability.
29
Trends in Our Family Metrics
The numbers for our key Family metrics, our DAP, MAP, and average revenue per person (ARPP), do not include users on our other products unless they would otherwise qualify as DAP or MAP, respectively, based on their other activities on our Family products.
Trends in the number of people in our community affect our revenue and financial results by influencing the number of ads we are able to show, the value of our ads to marketers, the volume of Payments transactions, as well as our expenses and capital expenditures. Substantially all of our daily and monthly active people (as defined below) access our Family products on mobile devices.
•Daily Active People (DAP). We define a daily active person as a registered and logged-in user of Facebook, Instagram, Messenger, and/or WhatsApp (collectively, our "Family" of products) who visited at least one of these Family products through a mobile device application or using a web or mobile browser on a given day. We do not require people to use a common identifier or link their accounts to use multiple products in our Family, and therefore must seek to attribute multiple user accounts within and across products to individual people. Our calculations of DAP rely upon complex techniques, algorithms, and machine learning models that seek to estimate the underlying number of unique people using one or more of these products, including by matching user accounts within an individual product and across multiple products when we believe they are attributable to a single person, and counting such group of accounts as one person. As these techniques and models require significant judgment, are developed based on internal reviews of limited samples of user accounts, and are calibrated against user survey data, there is necessarily some margin of error in our estimates. We view DAP, and DAP as a percentage of MAP, as measures of engagement across our products. For additional information, see the section entitled "Limitations of Key Metrics and Other Data" in this Quarterly Report on Form 10-Q.
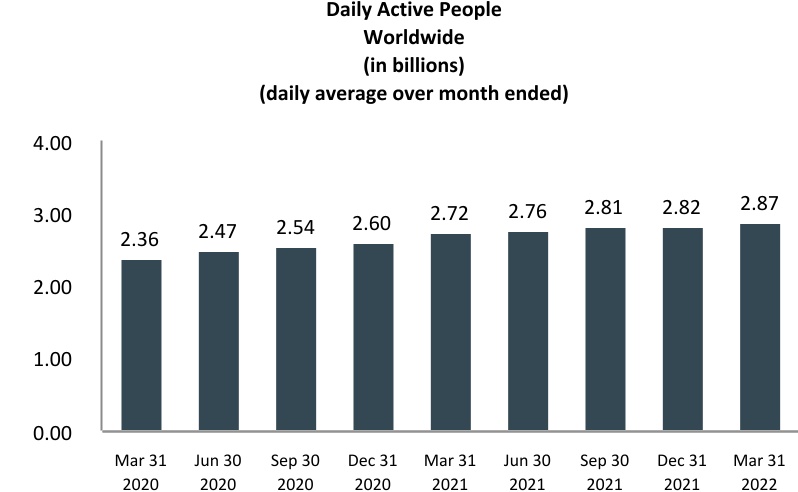
| DAP/MAP: | 79% | 79% | 79% | 79% | 79% | 79% | 78% | 79% | 79% | ||||||||||||||||||||
Note: We report the numbers of DAP and MAP as specific amounts, but these numbers are estimates of the numbers of unique people using our products and are subject to statistical variances and errors. While we expect the error margin for these estimates to vary from period to period, we estimate that such margin generally will be approximately 3% of our worldwide MAP. At our scale, it is very difficult to attribute multiple user accounts within and across products to individual people, and it is possible that the actual numbers of unique people using our products may vary significantly from our estimates, potentially beyond our estimated error margins. For additional information, see the section entitled "Limitations of Key Metrics and Other Data" in this Quarterly Report on Form 10-Q. In the second quarter of 2020, we updated our Family metrics calculations to reflect recent data from a periodic WhatsApp user survey and to incorporate certain methodology improvements, and we estimate such updates contributed an aggregate of approximately 40 million DAP to our reported worldwide DAP in June 2020. In the first quarter of 2021, we updated our Family metrics calculations to maintain calibration of our models against recent user survey data, and we estimate such update contributed an aggregate of approximately 60 million DAP to our reported worldwide DAP in March 2021.
Worldwide DAP increased 6% to 2.87 billion on average during March 2022 from 2.72 billion during March 2021.
30
•Monthly Active People (MAP). We define a monthly active person as a registered and logged-in user of one or more Family products who visited at least one of these Family products through a mobile device application or using a web or mobile browser in the last 30 days as of the date of measurement. We do not require people to use a common identifier or link their accounts to use multiple products in our Family, and therefore must seek to attribute multiple user accounts within and across products to individual people. Our calculations of MAP rely upon complex techniques, algorithms, and machine learning models that seek to estimate the underlying number of unique people using one or more of these products, including by matching user accounts within an individual product and across multiple products when we believe they are attributable to a single person, and counting such group of accounts as one person. As these techniques and models require significant judgment, are developed based on internal reviews of limited samples of user accounts, and are calibrated against user survey data, there is necessarily some margin of error in our estimates. We view MAP as a measure of the size of our global active community of people using our products. For additional information, see the section entitled "Limitations of Key Metrics and Other Data" in this Quarterly Report on Form 10-Q.
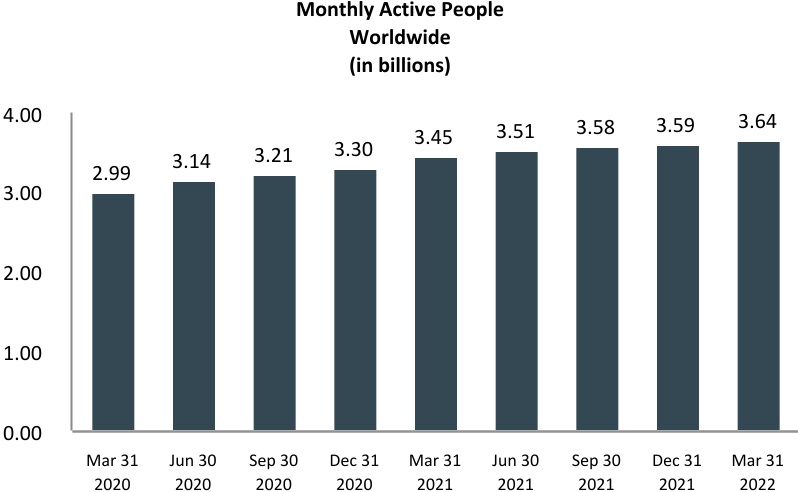
Note: We report the numbers of DAP and MAP as specific amounts, but these numbers are estimates of the numbers of unique people using our products and are subject to statistical variances and errors. While we expect the error margin for these estimates to vary from period to period, we estimate that such margin generally will be approximately 3% of our worldwide MAP. At our scale, it is very difficult to attribute multiple user accounts within and across products to individual people, and it is possible that the actual numbers of unique people using our products may vary significantly from our estimates, potentially beyond our estimated error margins. For additional information, see the section entitled "Limitations of Key Metrics and Other Data" in this Quarterly Report on Form 10-Q. In the second quarter of 2020, we updated our Family metrics calculations to reflect recent data from a periodic WhatsApp user survey and to incorporate certain methodology improvements, and we estimate such updates contributed an aggregate of approximately 50 million MAP to our reported worldwide MAP in June 2020. In the first quarter of 2021, we updated our Family metrics calculations to maintain calibration of our models against recent user survey data, and we estimate such update contributed an aggregate of approximately 70 million MAP to our reported worldwide MAP in March 2021.
As of March 31, 2022, we had 3.64 billion MAP, an increase of 6% from 3.45 billion as of March 31, 2021.
31
•Average Revenue Per Person (ARPP). We define ARPP as our total revenue during a given quarter, divided by the average of the number of MAP at the beginning and end of the quarter. While ARPP includes all sources of revenue, the number of MAP used in this calculation only includes users of our Family products as described in the definition of MAP above. We estimate that the share of revenue from users who are not also MAP was not material.
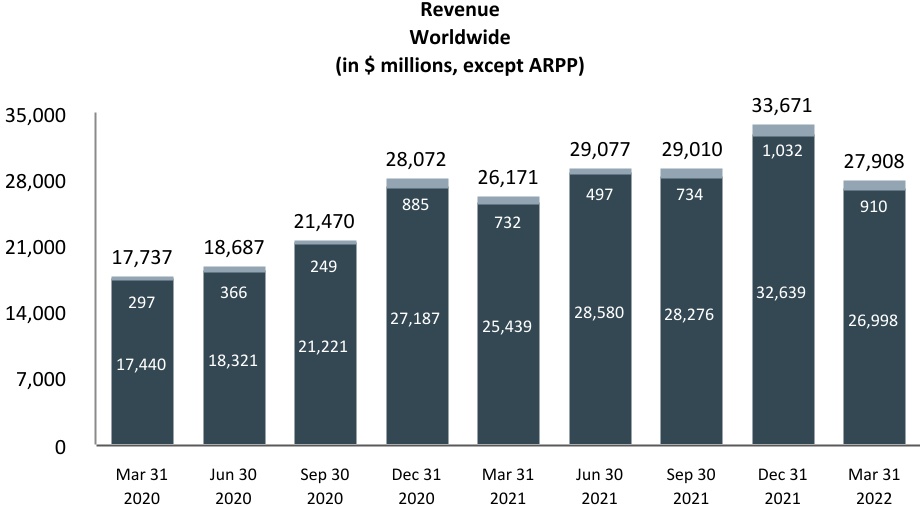
| ARPP: | $6.03 | $6.10 | $6.76 | $8.62 | $7.75 | $8.36 | $8.18 | $9.39 | $7.72 | ||||||||||||||||||||
 | Ad Revenue |  | Non-Ad Revenue | ||||||||||||||||||||||||||
Note: Non-advertising revenue includes RL revenue generated from the delivery of consumer hardware products and FoA Other revenue, which consists of net fees we receive from developers using our Payments infrastructure and revenue from various other sources.
During the first quarter of 2022, worldwide ARPP was $7.72, a slight decrease compared to the first quarter of 2021.
32
Trends in Our Facebook User Metrics
The numbers for our key Facebook metrics, our DAUs, MAUs, and average revenue per user (ARPU), do not include users on Instagram, WhatsApp, or our other products, unless they would otherwise qualify as DAUs or MAUs, respectively, based on their other activities on Facebook.
Trends in the number of users affect our revenue and financial results by influencing the number of ads we are able to show, the value of our ads to marketers, the volume of Payments transactions, as well as our expenses and capital expenditures. Substantially all of our daily and monthly active users (as defined below) access Facebook on mobile devices.
•Daily Active Users (DAUs). We define a daily active user as a registered and logged-in Facebook user who visited Facebook through our website or a mobile device, or used our Messenger application (and is also a registered Facebook user), on a given day. We view DAUs, and DAUs as a percentage of MAUs, as measures of user engagement on Facebook.
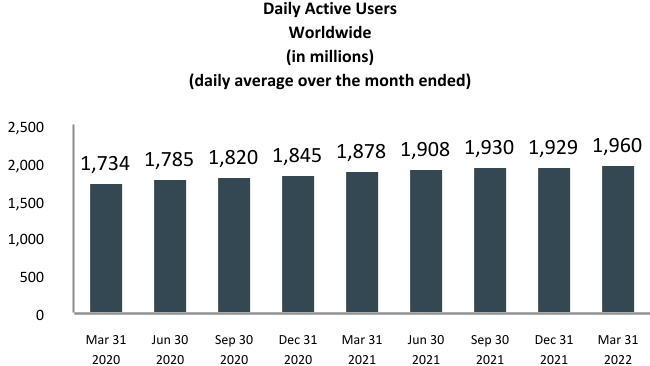
| DAU/MAU: | 67% | 66% | 66% | 66% | 66% | 66% | 66% | 66% | 67% | ||||||||||||||||||||
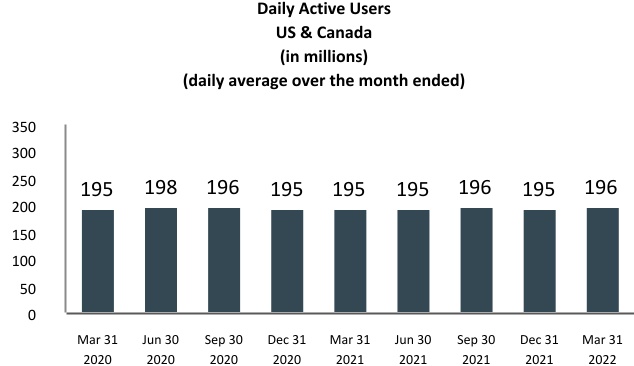
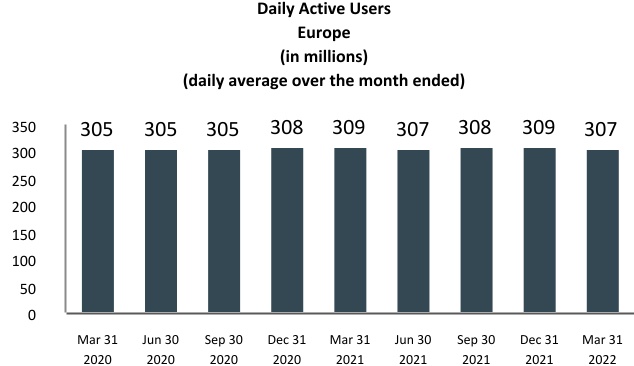
| DAU/MAU: | 77% | 77% | 77% | 76% | 75% | 75% | 75% | 74% | 75% | DAU/MAU: | 75% | 74% | 74% | 74% | 73% | 73% | 73% | 72% | 73% | ||||||||||||||||||||||||||||||||||||||||
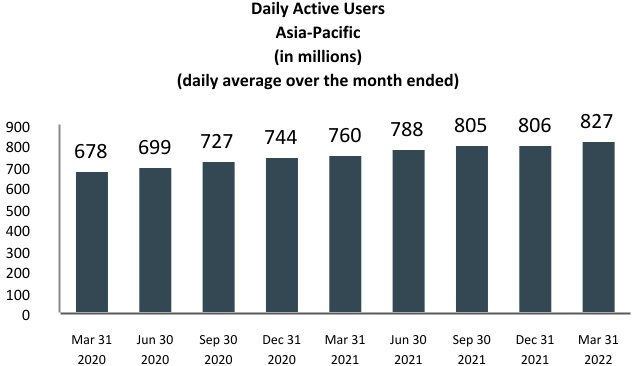
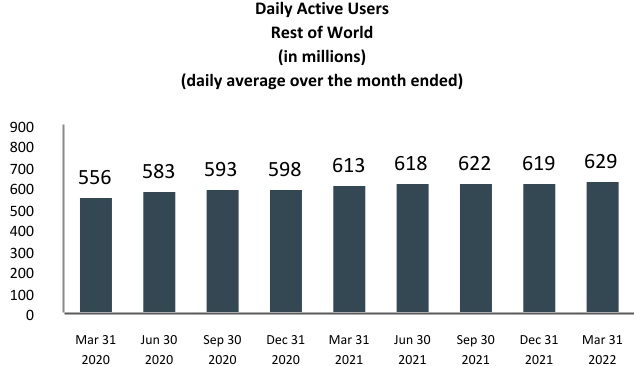
| DAU/MAU: | 62% | 61% | 62% | 62% | 62% | 62% | 63% | 63% | 64% | DAU/MAU: | 65% | 65% | 65% | 65% | 65% | 65% | 66% | 65% | 66% | ||||||||||||||||||||||||||||||||||||||||
Note: For purposes of reporting DAUs, MAUs, and ARPU by geographic region, Europe includes all users in Russia and Turkey and Rest of World includes all users in Africa, Latin America, and the Middle East.
33
Worldwide DAUs increased 4% to 1.96 billion on average during March 2022 from 1.88 billion during March 2021. Users in India, Bangladesh, and Vietnam represented the top three sources of growth in DAUs during March 2022, relative to the same period in 2021.
•Monthly Active Users (MAUs). We define a monthly active user as a registered and logged-in Facebook user who visited Facebook through our website or a mobile device, or used our Messenger application (and is also a registered Facebook user), in the last 30 days as of the date of measurement. MAUs are a measure of the size of our global active user community on Facebook.
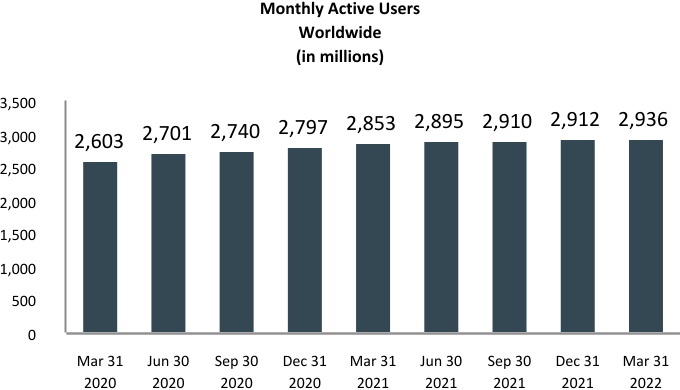
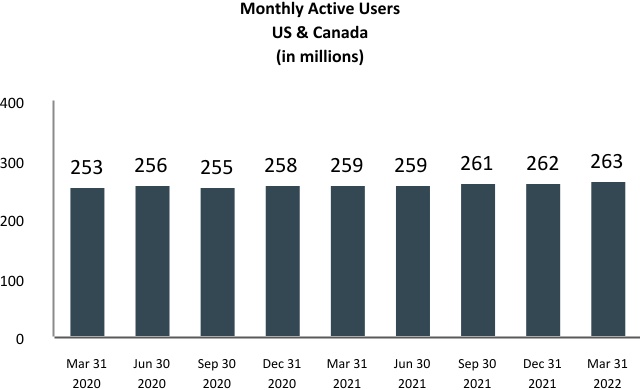
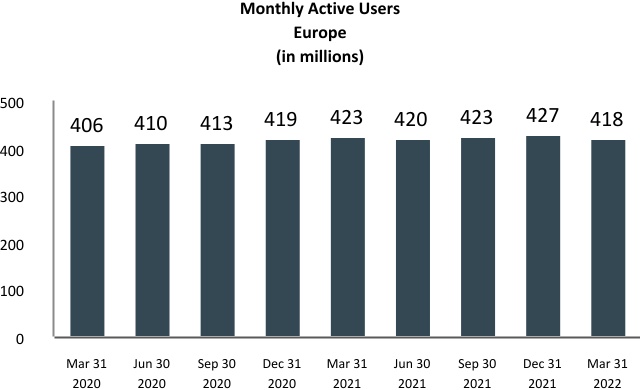
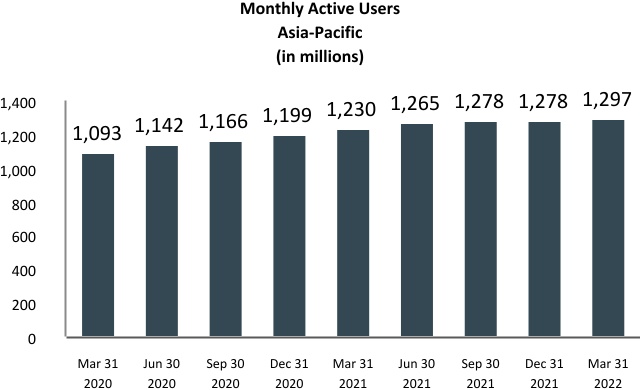
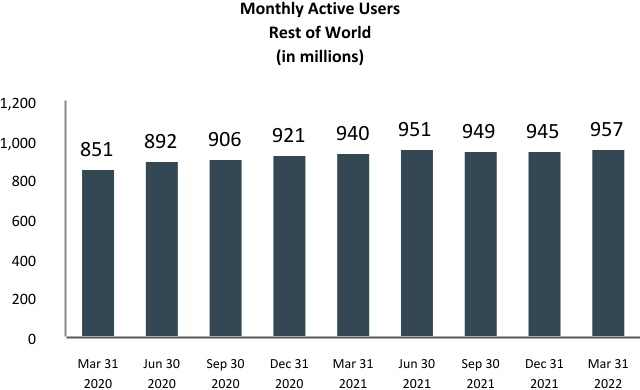
As of March 31, 2022, we had 2.94 billion MAUs, an increase of 3% from March 31, 2021. Users in India, Bangladesh, and Vietnam represented the top three sources of growth in the first quarter of 2022, relative to the same period in 2021.
34
Trends in Our Monetization by Facebook User Geography
We calculate our revenue by user geography based on our estimate of the geography in which ad impressions are delivered, virtual and digital goods are purchased, or consumer hardware products are shipped. We define ARPU as our total revenue in a given geography during a given quarter, divided by the average of the number of MAUs in the geography at the beginning and end of the quarter. While ARPU includes all sources of revenue, the number of MAUs used in this calculation only includes users of Facebook and Messenger as described in the definition of MAU above. While the share of revenue from users who are not also Facebook or Messenger MAUs has grown over time, we estimate that revenue from users who are Facebook or Messenger MAUs represents the substantial majority of our total revenue. See "Average Revenue Per Person (ARPP)" above for our estimates of trends in our monetization of our Family products. The geography of our users affects our revenue and financial results because we currently monetize users in different geographies at different average rates. Our revenue and ARPU in regions such as United States & Canada and Europe are relatively higher primarily due to the size and maturity of those online and mobile advertising markets. For example, ARPU in the first quarter of 2022 in the United States & Canada region was more than 10 times higher than in the Asia-Pacific region.
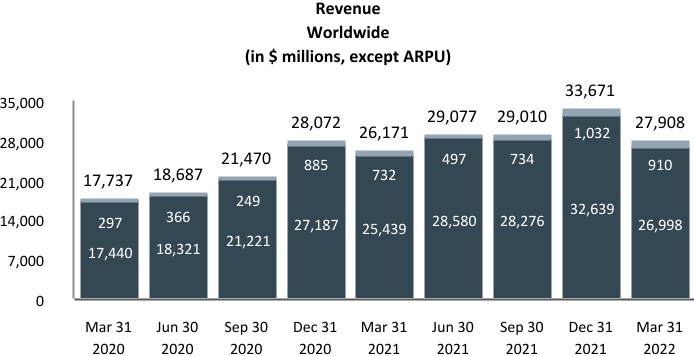
| ARPU: | $6.95 | $7.05 | $7.89 | $10.14 | $9.27 | $10.12 | $10.00 | $11.57 | $9.54 | ||||||||||||||||||||
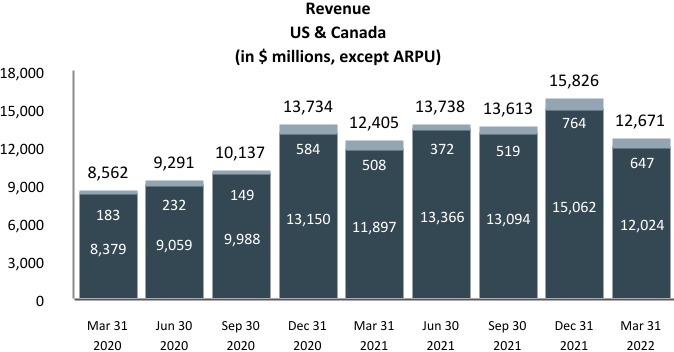
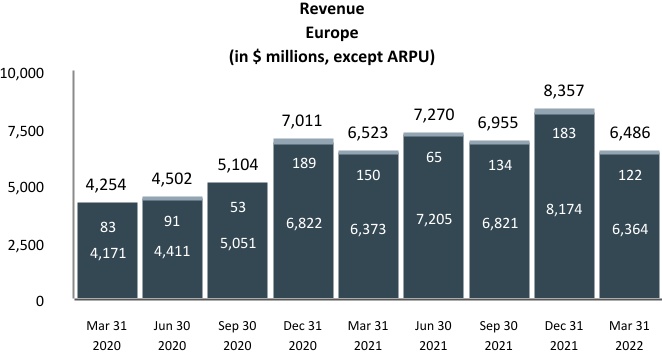
| ARPU: | $ | 34.18 | $ | 36.49 | $ | 39.63 | $ | 53.56 | $ | 48.03 | $ | 53.01 | $ | 52.34 | $ | 60.57 | $ | 48.29 | ARPU: | $10.64 | $11.03 | $12.41 | $16.87 | $15.49 | $17.23 | $16.50 | $19.68 | $15.35 | |||||||||||||||||||||||||||||||
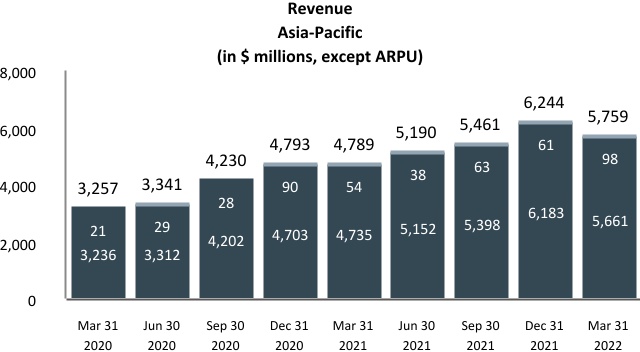
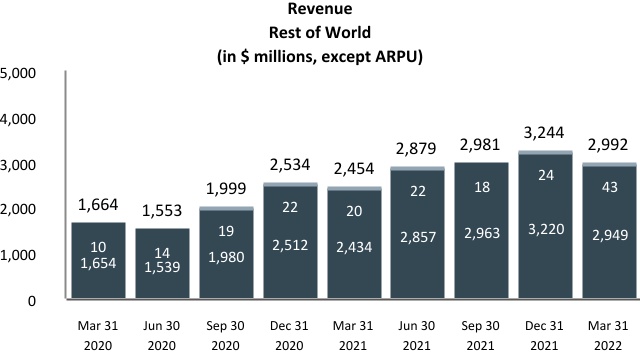
| ARPU: | $3.06 | $2.99 | $3.67 | $4.05 | $3.94 | $4.16 | $4.30 | $4.89 | $4.47 | ARPU: | $1.99 | $1.78 | $2.22 | $2.77 | $2.64 | $3.05 | $3.14 | $3.43 | $3.14 | ||||||||||||||||||||||||||||||||||||||||
| Ad Revenue | | Non-Ad Revenue | ||||||||||||||||||||||||||||||||||||||||||||||||||||||||
35
Note: Non-advertising revenue includes RL revenue generated from the delivery of consumer hardware products and FoA Other revenue, which consists of net fees we receive from developers using our Payments infrastructure and revenue from various other sources.
Our revenue by user geography in the charts above is geographically apportioned based on our estimation of the geographic location of our users when they perform a revenue-generating activity. This allocation differs from our revenue disaggregated by geography disclosure in Note 2 — Revenue in our condensed consolidated financial statements included in Part I, Item 1, "Financial Statements" where revenue is geographically apportioned based on the addresses of our customers.
During the first quarter of 2022, worldwide ARPU was $9.54, an increase of 3% from the first quarter of 2021. Over this period, ARPU increased by 19% in Rest of World, 13% in Asia-Pacific and 1% in United States & Canada, and decreased by 1% in Europe. In addition, user growth was more rapid in geographies with relatively lower ARPU, such as Asia-Pacific and Rest of World. We expect that user growth in the future will be primarily concentrated in those regions where ARPU is relatively lower, such that worldwide ARPU may continue to increase at a slower rate relative to ARPU in any geographic region, or potentially decrease even if ARPU increases in each geographic region.
36
Components of Results of Operations
Revenue
Family of Apps (FoA)
Advertising. We generate substantially all of our revenue from advertising. Our advertising revenue is generated by displaying ad products on Facebook, Instagram, Messenger, and third-party affiliated websites or mobile applications. Marketers pay for ad products either directly or through their relationships with advertising agencies or resellers, based on the number of impressions delivered or the number of actions, such as clicks, taken by users.
We recognize revenue from the display of impression-based ads in the contracted period in which the impressions are delivered. Impressions are considered delivered when an ad is displayed to a user. We recognize revenue from the delivery of action-based ads in the period in which a user takes the action the marketer contracted for. The number of ads we show is subject to methodological changes as we continue to evolve our ads business and the structure of our ads products. We calculate price per ad as total advertising revenue divided by the number of ads delivered, representing the effective price paid per impression by a marketer regardless of their desired objective such as impression or action. For advertising revenue arrangements where we are not the principal, we recognize revenue on a net basis.
Other revenue. Other revenue consists of net fees we receive from developers using our Payments infrastructure and revenue from various other sources.
Reality Labs (RL)
RL revenue is generated from the delivery of consumer hardware products, such as Meta Quest, Facebook Portal, and wearables, and related software and content.
Cost of Revenue and Operating Expenses
Cost of revenue. Our cost of revenue consists primarily of expenses associated with the delivery and distribution of our products. These include expenses related to the operation of our data centers and technical infrastructure, such as depreciation expense from servers, network infrastructure and buildings, as well as payroll and related expenses which include share-based compensation for employees on our operations teams, and energy and bandwidth costs. Cost of revenue also includes costs associated with partner arrangements, including traffic acquisition costs and credit card and other fees related to processing customer transactions; RL cost of products sold; and content costs.
Research and development. Research and development expenses consist primarily of payroll and related expenses which include share-based compensation, facilities-related costs for employees on our engineering and technical teams who are responsible for developing new products as well as improving existing products, and professional services.
Marketing and sales. Marketing and sales expenses consist primarily of marketing and promotional expenses and payroll and related expenses which include share-based compensation for our employees engaged in sales, sales support, marketing, business development, and customer service functions. Our marketing and sales expenses also include professional services such as content reviewers to support our community and product operations.
General and administrative. General and administrative expenses consist primarily of legal-related costs, which include accruals for estimated fines, settlements, or other losses in connection with legal and related matters, as well as other legal fees; payroll and related expenses which include share-based compensation for certain of our executives as well as our legal, finance, human resources, corporate communications and policy, and other administrative employees; other taxes, such as digital services taxes, other tax levies, and gross receipts taxes; and professional services.
37
Results of Operations
The following table sets forth our condensed consolidated statements of income data (in millions):
| Three Months Ended March 31, | |||||||||||
| 2022 | 2021 | ||||||||||
| Revenue | $ | 27,908 | $ | 26,171 | |||||||
| Costs and expenses: | |||||||||||
| Cost of revenue | 6,005 | 5,131 | |||||||||
| Research and development | 7,707 | 5,197 | |||||||||
| Marketing and sales | 3,312 | 2,843 | |||||||||
| General and administrative | 2,360 | 1,622 | |||||||||
| Total costs and expenses | 19,384 | 14,793 | |||||||||
| Income from operations | 8,524 | 11,378 | |||||||||
| Interest and other income, net | 384 | 125 | |||||||||
| Income before provision for income taxes | 8,908 | 11,503 | |||||||||
| Provision for income taxes | 1,443 | 2,006 | |||||||||
| Net income | $ | 7,465 | $ | 9,497 | |||||||
The following table sets forth our condensed consolidated statements of income data (as a percentage of revenue)(1):
| Three Months Ended March 31, | |||||||||||
| 2022 | 2021 | ||||||||||
| Revenue | 100 | % | 100 | % | |||||||
| Costs and expenses: | |||||||||||
| Cost of revenue | 22 | 20 | |||||||||
| Research and development | 28 | 20 | |||||||||
| Marketing and sales | 12 | 11 | |||||||||
| General and administrative | 8 | 6 | |||||||||
| Total costs and expenses | 69 | 57 | |||||||||
| Income from operations | 31 | 43 | |||||||||
| Interest and other income, net | 1 | — | |||||||||
| Income before provision for income taxes | 32 | 44 | |||||||||
| Provision for income taxes | 5 | 8 | |||||||||
| Net income | 27 | % | 36 | % | |||||||
____________________________________
(1) Percentages have been rounded for presentation purposes and may differ from unrounded results.
Share-based compensation expense included in costs and expenses (in millions):
| Three Months Ended March 31, | |||||||||||
| 2022 | 2021 | ||||||||||
| Cost of revenue | $ | 160 | $ | 118 | |||||||
| Research and development | 1,941 | 1,408 | |||||||||
| Marketing and sales | 216 | 174 | |||||||||
| General and administrative | 181 | 130 | |||||||||
| Total share-based compensation expense | $ | 2,498 | $ | 1,830 | |||||||
38
Share-based compensation expense included in costs and expenses (as a percentage of revenue)(1):
| Three Months Ended March 31, | |||||||||||
| 2022 | 2021 | ||||||||||
| Cost of revenue | 1 | % | — | % | |||||||
| Research and development | 7 | 5 | |||||||||
| Marketing and sales | 1 | 1 | |||||||||
| General and administrative | 1 | — | |||||||||
| Total share-based compensation expense | 9 | % | 7 | % | |||||||
____________________________________
(1) Percentages have been rounded for presentation purposes and may differ from unrounded results.
Revenue
The following table sets forth our revenue by source and by segment. For comparative purposes, amounts in the prior period have been recast:
| Three Months Ended March 31, | |||||||||||||||||
| 2022 | 2021 | % change | |||||||||||||||
| (dollars in millions) | |||||||||||||||||
| Advertising | $ | 26,998 | $ | 25,439 | 6 | % | |||||||||||
| Other revenue | 215 | 198 | 9 | % | |||||||||||||
| Family of Apps | 27,213 | 25,637 | 6 | % | |||||||||||||
| Reality Labs | 695 | 534 | 30 | % | |||||||||||||
| Total revenue | $ | 27,908 | $ | 26,171 | 7 | % | |||||||||||
Family of Apps
FoA revenue in the three months ended March 31, 2022 increased $1.58 billion, or 6%, compared to the same period in 2021. The increase was mostly driven by an increase in advertising revenue.
Advertising
Advertising revenue in the three months ended March 31, 2022 increased $1.56 billion or 6%, compared to the same period in 2021 as a result of an increase in the number of ads delivered, partially offset by a decrease in the average price per ad. During the three months ended March 31, 2022, the number of ads delivered increased by 15%, as compared with an increase of approximately 12% in the same period in 2021, driven by an increase in ads delivered in Asia-Pacific and Rest of World and partially offset by a decrease in ads delivered in the United States and Canada region. The increase in the ads delivered during the three months ended March 31, 2022 was driven by increases in the number and frequency of ads displayed across our products and an increase in users. During the three months ended March 31, 2022, the average price per ad decreased by 8%, as compared with an increase of approximately 30% in the same period in 2021. The decrease in average price per ad was primarily driven by an increasing proportion of the number of ads delivered in geographies and in products such as video and Stories that monetize at lower rates, as well as an unfavorable foreign exchange impact. We anticipate that future advertising revenue growth will be driven by a combination of price and the number of ads delivered.
39
Reality Labs
RL revenue in the three months ended March 31, 2022 increased $161 million, or 30%, compared to the same period in 2021. The increase in RL revenue was primarily driven by an increase in the volume of our consumer hardware products sold.
Foreign Exchange Impact on Revenue
The general strengthening of the U.S. dollar relative to certain foreign currencies for the three months ended March 31, 2022 compared to the same period in 2021 had an unfavorable impact on revenue. If we had translated revenue for the three months ended March 31, 2022 using the prior year's monthly exchange rates for our settlement or billing currencies other than the U.S. dollar, our total revenue and advertising revenue would have been $28.80 billion and $27.89 billion, respectively. Using these constant rates, total revenue and advertising revenue would have been $893 million and $888 million higher than actual total revenue and advertising revenue, respectively, for the three months ended March 31, 2022.
Cost of revenue
| Three Months Ended March 31, | |||||||||||||||||
| 2022 | 2021 | % change | |||||||||||||||
| (dollars in millions) | |||||||||||||||||
| Cost of revenue | $ | 6,005 | $ | 5,131 | 17 | % | |||||||||||
| Percentage of revenue | 22 | % | 20 | % | |||||||||||||
Cost of revenue in the three months ended March 31, 2022 increased $874 million, or 17%, compared to the same period in 2021. The increase was primarily due to an increase in operational expenses related to our data centers and technical infrastructure; higher costs associated with partner arrangements, including traffic acquisition and payment processing costs; and an increase in content costs.
Research and development
| Three Months Ended March 31, | |||||||||||||||||
| 2022 | 2021 | % change | |||||||||||||||
| (dollars in millions) | |||||||||||||||||
| Research and development | $ | 7,707 | $ | 5,197 | 48 | % | |||||||||||
| Percentage of revenue | 28 | % | 20 | % | |||||||||||||
Research and development expenses in the three months ended March 31, 2022 increased $2.51 billion, or 48%, compared to the same period in 2021. The increase was mainly due to higher payroll and related expenses as a result of a 35% growth in employee headcount from March 31, 2021 to March 31, 2022 in engineering and other technical functions supporting our continued investment in our family of products and Reality Labs.
Marketing and sales
| Three Months Ended March 31, | |||||||||||||||||
| 2022 | 2021 | % change | |||||||||||||||
| (dollars in millions) | |||||||||||||||||
| Marketing and sales | $ | 3,312 | $ | 2,843 | 16 | % | |||||||||||
| Percentage of revenue | 12 | % | 11 | % | |||||||||||||
Marketing and sales expenses in the three months ended March 31, 2022 increased $469 million, or 16%, compared to the same period in 2021. The increase was mainly due to increases in payroll and related expenses and marketing and
40
promotional expenses. Our payroll and related expenses increased as a result of a 14% increase in employee headcount from March 31, 2021 to March 31, 2022 in our marketing and sales functions.
General and administrative
| Three Months Ended March 31, | |||||||||||||||||
| 2022 | 2021 | % change | |||||||||||||||
| (dollars in millions) | |||||||||||||||||
| General and administrative | $ | 2,360 | $ | 1,622 | 45 | % | |||||||||||
| Percentage of revenue | 8 | % | 6 | % | |||||||||||||
General and administrative expenses in the three months ended March 31, 2022 increased $738 million, or 45%, compared to the same period in 2021. The increase was mainly due to increases in legal-related costs as well as payroll and related expenses. Our payroll and related expenses increased mainly due to a 29% increase in employee headcount from March 31, 2021 to March 31, 2022 in our general and administrative functions.
See Note 10 — Commitments and Contingencies in the notes to the condensed consolidated financial statements included in Part I, Item 1, and "Legal Proceedings" contained in Part II, Item 1 of this Quarterly Report on Form 10-Q for additional information regarding estimated fines, settlements, or other losses in connection with legal-related costs.
Segment profitability
The following table sets forth income (loss) from operations by segment. For comparative purposes, amounts in the prior period have been recast:
| Three Months Ended March 31, | |||||||||||||||||
| 2022 | 2021 | % change | |||||||||||||||
| (dollars in millions) | |||||||||||||||||
| Family of Apps | $ | 11,484 | $ | 13,205 | (13) | % | |||||||||||
| Reality Labs | (2,960) | (1,827) | (62) | % | |||||||||||||
| Total income from operations | $ | 8,524 | $ | 11,378 | (25) | % | |||||||||||
Family of Apps
FoA income from operations in the three months ended March 31, 2022 decreased $1.72 billion, or 13%, compared to the same period in 2021. The decrease was due to an increase in costs and expenses, mainly due to an increase in payroll and related expenses as a result of higher employee headcount, increases in costs related to our data centers and technical infrastructure and higher legal-related costs.
Reality Labs
RL loss from operations in the three months ended March 31, 2022 increased $1.13 billion, or 62%, compared to the same period in 2021. The increase in loss from operations was primarily driven by increases in payroll and related expenses due to a growth in RL headcount, research and development expenses, and cost of consumer hardware products sold.
41
Interest and other income, net
| Three Months Ended March 31, | |||||||||||||||||
| 2022 | 2021 | % change | |||||||||||||||
| (dollars in millions) | |||||||||||||||||
| Interest income, net | $ | 76 | $ | 118 | (36) | % | |||||||||||
| Foreign currency exchange gains (losses), net | 54 | (93) | 158 | % | |||||||||||||
| Other income, net | 254 | 100 | 154 | % | |||||||||||||
| Interest and other income, net | $ | 384 | $ | 125 | 207 | % | |||||||||||
Interest and other income, net in the three months ended March 31, 2022 increased $259 million compared to the same period in 2021. The increase was mainly due to an increase in other income, net from a gain on the sale of certain intangible assets in the three months ended March 31, 2022.
Provision for income taxes
| Three Months Ended March 31, | |||||||||||||||||
| 2022 | 2021 | % change | |||||||||||||||
| (dollars in millions) | |||||||||||||||||
| Provision for income taxes | $ | 1,443 | $ | 2,006 | (28) | % | |||||||||||
| Effective tax rate | 16 | % | 17 | % | |||||||||||||
Our provision for income taxes in the three months ended March 31, 2022 decreased $563 million, or 28%, compared to the same period in 2021, primarily due to the decrease in income from operations.
Our effective tax rate decreased in the three months ended March 31, 2022 compared to the same period in 2021, mostly due to an increase in tax benefit from foreign-derived intangible income, partially offset by a decrease in excess tax benefits recognized from share-based compensation.
Effective Tax Rate Items. Our effective tax rate in the future will depend upon the proportion between the following items and income before provision for income taxes: U.S. tax benefits from foreign-derived intangible income, tax effects from share-based compensation, tax effects of integrating intellectual property from acquisitions, settlement of tax contingency items, tax effects of changes in our business, and the effects of changes in tax law.
The accounting for share-based compensation may increase or decrease our effective tax rate based upon the difference between our share-based compensation expense and the deductions taken on our tax return, which depend upon the stock price at the time of employee award vesting. If our stock price remains constant to the April 22, 2022 price, and absent any changes to U.S. tax law, we expect our effective tax rate for the full year of 2022 to be above the first quarter rate and in the high teens. This includes the effects of the mandatory capitalization and amortization of research and development expenses incurred in 2022, as required by the 2017 Tax Cuts and Jobs Act (Tax Act). The mandatory capitalization requirement increases our cash tax liabilities but also decreases our effective tax rate due to increasing the foreign-derived intangible income deduction. If the mandatory capitalization requirement is deferred by a change in law, our effective tax rate in 2022 could be a few percentage points higher when compared to current law and our cash tax liabilities could be several billion dollars lower.
Integrating intellectual property from acquisitions into our business generally involves intercompany transactions that have the impact of increasing our provision for income taxes. Consequently, our provision for income taxes and our effective tax rate may initially increase in the period of an acquisition and integration. The magnitude of this impact will depend upon the specific type, size, and taxing jurisdictions of the intellectual property as well as the relative contribution to income in subsequent periods.
See Note 12 — Income Taxes in the notes to the condensed consolidated financial statements included in Part I, Item 1, of this Quarterly Report on Form 10-Q for additional information regarding income tax contingencies.
42
Liquidity and Capital Resources
Our principal sources of liquidity are our cash and cash equivalents, marketable securities, and cash generated from operations. Cash and cash equivalents and marketable securities consist mostly of cash on deposit with banks, investments in money market funds, investments in U.S. government securities, U.S. government agency securities, and investment grade corporate debt securities. Cash and cash equivalents and marketable securities were $43.89 billion as of March 31, 2022, a decrease of $4.11 billion from December 31, 2021. The majority of the decrease was due to $9.51 billion for repurchases of our Class A common stock, $5.55 billion for capital expenditures, including principal payments on finance leases, $925 million of taxes paid related to net share settlement of employee restricted stock unit (RSU) awards, and $853 million for acquisitions of businesses and intangible assets, partially offset by $14.08 billion of cash generated from operations.
Cash paid for income taxes was $502 million during the three months ended March 31, 2022. As of March 31, 2022, our federal net operating loss carryforward was $8.19 billion and our federal tax credit carryforward was $460 million. We anticipate the utilization of a significant portion of these net operating losses and credits within two years.
Our board of directors has authorized a share repurchase program of our Class A common stock, which commenced in January 2017 and does not have an expiration date. As of December 31, 2021, $38.79 billion remained available and authorized for repurchases under this program. During the three months ended March 31, 2022, we repurchased and subsequently retired 34 million shares of our Class A common stock for an aggregate amount of $9.39 billion. As of March 31, 2022, $29.41 billion remained available and authorized for repurchases.
The following table presents our cash flows (in millions):
| Three Months Ended March 31, | |||||||||||
| 2022 | 2021 | ||||||||||
| Net cash provided by operating activities | $ | 14,076 | $ | 12,242 | |||||||
| Net cash used in investing activities | $ | (4,779) | $ | (4,874) | |||||||
| Net cash used in financing activities | $ | (10,660) | $ | (5,185) | |||||||
Cash Provided by Operating Activities
Cash provided by operating activities during the three months ended March 31, 2022 primarily consisted of net income adjusted for certain non-cash items, such as $2.50 billion of share-based compensation expense and $2.16 billion of depreciation and amortization. The increase in cash flows from operating activities during the three months ended March 31, 2022, compared to the same period in 2021, was mostly due to an increase in cash collected from our customers and lower cash payments of income taxes, partially offset by an increase in payments to our vendors as a result of higher operating spending and timing of payments.
Cash Used in Investing Activities
Cash used in investing activities during the three months ended March 31, 2022 consisted mostly of $5.31 billion of net purchases of property and equipment as we continued to invest in data centers, servers, network infrastructure, and office facilities, and $853 million for acquisitions of businesses and intangible assets, partially offset by $1.40 billion proceeds from net sales of marketable securities. The amount of cash used in investing activities during the three months ended March 31, 2022 was consistent with the same period in 2021.
We anticipate making capital expenditures of approximately $29 billion to $34 billion in 2022.
Cash Used in Financing Activities
Cash used in financing activities during the three months ended March 31, 2022 mostly consisted of $9.51 billion for repurchases of our Class A common stock and $925 million of taxes paid related to net share settlement of RSUs. The increase in cash used in financing activities during the three months ended March 31, 2022, compared to the same period in 2021, was mostly due to an increase in repurchases of our Class A common stock.
43
Material Cash Requirements
We currently anticipate that our available funds and cash flow from operations will be sufficient to meet our operational cash needs and fund our share repurchase program for at least the next 12 months and thereafter for the foreseeable future.
Leases and contractual commitments
Our operating lease obligations mostly include, among others, certain of our offices, data centers, colocations, and land and our finance lease obligations include certain network infrastructure. Our contractual commitments are primarily related to our investments in servers, network infrastructure, and Reality Labs.
Taxes
As of March 31, 2022, other liabilities include long-term taxes payable of $1.51 billion related to a one-time transition tax payable incurred as a result of the Tax Act. As permitted by the Tax Act, we will pay the transition tax in annual interest-free installments through 2025. Our other liabilities also include $4.39 billion related to the uncertain tax positions as of March 31, 2022. Due to uncertainties in the timing of the completion of tax audits, the timing of the resolution of these positions is uncertain and we are unable to make a reasonably reliable estimate of the timing of payments.
Contingencies
We are involved in legal proceedings, claims, and regulatory, tax or government inquiries and investigations. We record a liability when we believe that it is both probable that a liability has been incurred, and that the amount can be reasonably estimated. If we determine there is a reasonable possibility that we may incur a loss and the loss or range of loss can be estimated, we disclose the possible loss in the accompanying notes to the condensed consolidated financial statements to the extent material. Significant judgment is required to determine both probability and the estimated amount of loss. Such matters are inherently unpredictable and subject to significant uncertainties, some of which are beyond our control. Should any of these estimates and assumptions change or prove to be incorrect, it could have a material impact on our results of operations, financial position, and cash flows.
See Note 8 — Leases, Note 10 — Commitments and Contingencies, and Note 12 — Income Taxes in the notes to the condensed consolidated financial statements included in Part I, Item 1, and "Legal Proceedings" contained in Part II, Item 1 of this Quarterly Report on Form 10-Q for additional information regarding leases and contractual commitments, taxes, and contingencies.
44
Critical Accounting Policies and Estimates
Our condensed consolidated financial statements are prepared in accordance with U.S. GAAP. The preparation of these condensed consolidated financial statements requires us to make estimates and assumptions that affect the reported amounts of assets, liabilities, revenue, costs and expenses, and related disclosures. On an ongoing basis, we evaluate our estimates and assumptions based on historical experience and on various other assumptions that we believe are reasonable under the circumstances. Our actual results could differ from these estimates under different assumptions or conditions. Refer to "Critical Accounting Policies and Estimates" contained in Part II, Item 7 of our Annual Report on Form 10-K for the year ended December 31, 2021 for a complete discussion of our critical accounting policies and estimates. There have been no material changes to our critical accounting policies and estimates since our Annual Report on Form 10-K for the year ended December 31, 2021.
45
Item 3.Quantitative and Qualitative Disclosures About Market Risk
We are exposed to market risks, including changes to foreign currency exchange rates, interest rates, and equity investment risk.
Foreign Currency Exchange Risk
We have foreign currency risks related to our revenue and operating expenses denominated in currencies other than the U.S. dollar, primarily the Euro. Accordingly, changes in exchange rates, and in particular a strengthening of the U.S. dollar, have in the past, and may in the future, negatively affect our revenue and other operating results as expressed in U.S. dollars.
We have experienced and will continue to experience fluctuations in our net income as a result of transaction gains or losses related to revaluing monetary asset and liability balances that are denominated in currencies other than the functional currency of the entities in which they are recorded. At this time, we have not entered into, but in the future we may enter into, derivatives or other financial instruments in an attempt to hedge our foreign currency exchange risk. It is difficult to predict the effect hedging activities would have on our results of operations. A foreign currency gain, net, of $54 million and a foreign currency loss, net, of $93 million were recognized in the three months ended March 31, 2022 and 2021, respectively, as interest and other income, net in our condensed consolidated statements of income.
Interest Rate Sensitivity
Our exposure to changes in interest rates relates primarily to interest earned and market value on our cash and cash equivalents and marketable securities.
Our cash and cash equivalents and marketable securities consist of cash, certificates of deposit, time deposits, money market funds, U.S. government securities, U.S. government agency securities, and investment grade corporate debt securities. Our investment policy and strategy are focused on preservation of capital and supporting our liquidity requirements. Changes in U.S. interest rates affect the interest earned on our cash and cash equivalents and marketable securities, and the market value of those securities. A hypothetical 100 basis point increase in interest rates would have resulted in a decrease of $678 million and $714 million in the market value of our available-for-sale debt securities as of March 31, 2022 and December 31, 2021, respectively. Any realized gains or losses resulting from such interest rate changes and from the current unrealized losses would only occur if we sold the investments prior to maturity.
Equity Investment Risk
Our equity investments are subject to a wide variety of market-related risks that could have a material impact on the carrying value of our holdings. We continually evaluate our equity investments in privately-held companies.
Our equity investments are investments in equity securities of privately-held companies without readily determinable fair values. We elected to account for most of our equity investments using the measurement alternative, which is cost, less any impairment, adjusted for changes in fair value resulting from observable transactions for identical or similar investments of the same issuer. We perform a qualitative assessment at each reporting date to determine whether there are triggering events for impairment. The qualitative assessment considers factors such as, but not limited to, the investee's financial condition and business outlook; industry and sector performance; economic or technological environment; and other relevant events and factors affecting the investee. Valuations of our equity investments are complex due to the lack of readily available market data and observable transactions. Volatility in the global economic climate and financial markets, including the recent and ongoing impact of the COVID‑19 pandemic, could result in a material impairment charge on our equity investments. Equity investments accounted for under the equity method were immaterial as of March 31, 2022 and December 31, 2021. Our total equity investments had a carrying value of $6.78 billion as of March 31, 2022 and December 31, 2021.
For additional information about our equity investments, see Note 5 — Equity Investments in the notes to the condensed consolidated financial statements included in Part I, Item 1 of this Quarterly Report on Form 10-Q.
46
Item 4.Controls and Procedures
Evaluation of Disclosure Controls and Procedures
Our management, with the participation of our chief executive officer (CEO) and chief financial officer (CFO), has evaluated the effectiveness of our disclosure controls and procedures (as defined in Rules 13a- 15(e) and 15d- 15(e) under the Securities Exchange Act of 1934, as amended (Exchange Act)), as of the end of the period covered by this Quarterly Report on Form 10-Q. Based on such evaluation, our CEO and CFO have concluded that as of March 31, 2022, our disclosure controls and procedures are designed at a reasonable assurance level and are effective to provide reasonable assurance that information we are required to disclose in reports that we file or submit under the Exchange Act is recorded, processed, summarized, and reported within the time periods specified in the rules and forms of the Securities and Exchange Commission, and that such information is accumulated and communicated to our management, including our CEO and CFO, as appropriate, to allow timely decisions regarding required disclosure.
Changes in Internal Control
There were no changes in our internal control over financial reporting identified in management's evaluation pursuant to Rules 13a-15(d) or 15d-15(d) of the Exchange Act during the period covered by this Quarterly Report on Form 10-Q that materially affected, or are reasonably likely to materially affect, our internal control over financial reporting.
Limitations on Effectiveness of Controls and Procedures
In designing and evaluating the disclosure controls and procedures and internal control over financial reporting, management recognizes that any controls and procedures, no matter how well designed and operated, can provide only reasonable assurance of achieving the desired control objectives. In addition, the design of disclosure controls and procedures and internal control over financial reporting must reflect the fact that there are resource constraints and that management is required to apply judgment in evaluating the benefits of possible controls and procedures relative to their costs.
47
PART II—OTHER INFORMATION
Item 1.Legal Proceedings
Beginning on March 20, 2018, multiple putative class actions and derivative actions were filed in state and federal courts in the United States and elsewhere against us and certain of our directors and officers alleging violations of securities laws, breach of fiduciary duties, and other causes of action in connection with our platform and user data practices as well as the misuse of certain data by a developer that shared such data with third parties in violation of our terms and policies, and seeking unspecified damages and injunctive relief. Beginning on July 27, 2018, two putative class actions were filed in federal court in the United States against us and certain of our directors and officers alleging violations of securities laws in connection with the disclosure of our earnings results for the second quarter of 2018 and seeking unspecified damages. These two actions subsequently were transferred and consolidated in the U.S. District Court for the Northern District of California with the putative securities class action described above relating to our platform and user data practices. On September 25, 2019, the district court granted our motion to dismiss the consolidated putative securities class action, with leave to amend. On November 15, 2019, a second amended complaint was filed in the consolidated putative securities class action. On August 7, 2020, the district court granted our motion to dismiss the second amended complaint, with leave to amend. On October 16, 2020, a third amended complaint was filed in the consolidated putative securities class action. On December 20, 2021, the district court granted our motion to dismiss the third amended complaint, with prejudice. On January 17, 2022, the plaintiffs filed a notice of appeal of the order dismissing their case, and the appeal is now pending before the U.S. Court of Appeals for the Ninth Circuit. With respect to the multiple putative class actions filed against us beginning on March 20, 2018 alleging fraud and violations of consumer protection, privacy, and other laws in connection with the same matters, several of the cases brought on behalf of consumers in the United States were consolidated in the U.S. District Court for the Northern District of California. On September 9, 2019, the court granted, in part, and denied, in part, our motion to dismiss the consolidated putative consumer class action. In addition, our platform and user data practices, as well as the events surrounding the misuse of certain data by a developer, became the subject of U.S. Federal Trade Commission (FTC), state attorneys general, and other government inquiries in the United States, Europe, and other jurisdictions. We entered into a settlement and modified consent order to resolve the FTC inquiry, which took effect in April 2020 and required us to pay a penalty of $5.0 billion and to significantly enhance our practices and processes for privacy compliance and oversight. The state attorneys general inquiry and certain government inquiries in other jurisdictions remain ongoing and could subject us to additional substantial fines and costs, require us to change our business practices, divert resources and the attention of management from our business, or adversely affect our business. On July 16, 2021, a stockholder derivative action was filed in Delaware Chancery Court against certain of our directors and officers asserting breach of fiduciary duty and related claims relating to our historical platform and user data practices, as well as our settlement with the FTC. On July 20, 2021, other stockholders filed an amended derivative complaint in a related Delaware Chancery Court action, asserting breach of fiduciary duty and related claims against certain of our current and former directors and officers in connection with our historical platform and user data practices. On November 4, 2021, the lead plaintiffs filed a second amended and consolidated complaint in the stockholder derivative action. We believe the lawsuits described above are without merit, and we are vigorously defending them.
We also notify the Irish Data Protection Commission (IDPC), our lead European Union privacy regulator under the General Data Protection Regulation (GDPR), of certain other personal data breaches and privacy issues, and are subject to inquiries and investigations by the IDPC and other European regulators regarding various aspects of our regulatory compliance. For example, in August 2020, we received a preliminary draft decision from the IDPC that preliminarily concluded that Meta Platforms Ireland's reliance on Standard Contractual Clauses in respect of European user data does not achieve compliance with the GDPR and preliminarily proposed that such transfers of user data from the European Union to the United States should therefore be suspended. Meta Platforms Ireland challenged procedural aspects of this IDPC inquiry in a judicial review commenced in the Irish High Court in September 2020. On May 14, 2021, the court rejected Meta Platforms Ireland's procedural challenges, and the inquiry subsequently recommenced. In February 2022, we received a revised preliminary draft decision in which the IDPC maintained its preliminary conclusion that Meta Platforms Ireland's transfers of European user data from the European Union to the United States should be suspended as they relate to users of the Facebook service. We believe a final decision in this inquiry may issue as early as the second half of 2022. For additional information, see Part II, Item 1A, "Risk Factors—Our business is subject to complex and evolving U.S. and foreign laws and regulations regarding privacy, data use and data protection, content, competition, safety and consumer protection, e‑commerce, and other matters" in this Quarterly Report on Form 10-Q. Any such inquiries or investigations could subject us
48
to substantial fines and costs, require us to change our business practices, divert resources and the attention of management from our business, or adversely affect our business.
In addition, we are subject to various litigation and government inquiries and investigations, formal or informal, by competition authorities in the United States, Europe, and other jurisdictions. Such investigations, inquiries, and lawsuits concern, among other things, our business practices in the areas of social networking or social media services, digital advertising, and/or mobile or online applications, as well as our acquisitions. For example, in June 2019 we were informed by the FTC that it had opened an antitrust investigation of our company. On December 9, 2020, the FTC filed a complaint against us in the U.S. District Court for the District of Columbia alleging that we engaged in anticompetitive conduct and unfair methods of competition in violation of Section 5 of the Federal Trade Commission Act and Section 2 of the Sherman Act, including by acquiring Instagram in 2012 and WhatsApp in 2014 and by maintaining conditions on access to our platform. In addition, beginning in the third quarter of 2019, we became the subject of antitrust investigations by the U.S. Department of Justice and state attorneys general. On December 9, 2020, the attorneys general from 46 states, the territory of Guam, and the District of Columbia filed a complaint against us in the U.S. District Court for the District of Columbia alleging that we engaged in anticompetitive conduct in violation of Section 2 of the Sherman Act, including by acquiring Instagram in 2012 and WhatsApp in 2014 and by maintaining conditions on access to our platform. The complaint also alleged that we violated Section 7 of the Clayton Act by acquiring Instagram and WhatsApp. The complaints of the FTC and attorneys general both sought a permanent injunction against our company's alleged violations of the antitrust laws, and other equitable relief, including divestiture or reconstruction of Instagram and WhatsApp. On June 28, 2021, the court granted our motions to dismiss the complaints filed by the FTC and attorneys general, dismissing the FTC's complaint with leave to amend and dismissing the attorneys general's case without prejudice. On July 28, 2021, the attorneys general filed a notice of appeal of the order dismissing their case and that appeal is now pending before the U.S. Court of Appeals for the District of Columbia Circuit. On August 19, 2021, the FTC filed an amended complaint, and on October 4, 2021, we filed a motion to dismiss this amended complaint. On January 11, 2022, the court denied our motion to dismiss the FTC's amended complaint. Multiple putative class actions have also been filed in state and federal courts in the United States and in the United Kingdom against us alleging violations of antitrust laws and other causes of action in connection with these acquisitions and/or other alleged anticompetitive conduct, and seeking damages and injunctive relief. Several of the cases brought on behalf of certain advertisers and users in the United States were consolidated in the U.S. District Court for the Northern District of California. On January 14, 2022, the court granted, in part, and denied, in part, our motion to dismiss the consolidated actions. We believe these lawsuits are without merit, and we are vigorously defending them. The result of such litigation, investigations or inquiries could subject us to substantial monetary remedies and costs, interrupt or require us to change our business practices, divert resources and the attention of management from our business, or subject us to other structural or behavioral remedies that adversely affect our business.
We are also subject to other government inquiries and investigations relating to our business activities and disclosure practices. For example, beginning in September 2021, we became subject to government investigations and requests relating to a former employee's allegations and release of internal company documents concerning, among other things, our algorithms, advertising and user metrics, and content enforcement practices, as well as misinformation and other undesirable activity on our platform, and user well-being. Beginning on October 27, 2021, multiple putative class actions and derivative actions were filed in the U.S. District Court for the Northern District of California against us and certain of our directors and officers alleging violations of securities laws, breach of fiduciary duties, and other causes of action in connection with the same matters. We believe these lawsuits are without merit, and we are vigorously defending them.
On March 8, 2022, a putative class action was filed in the U.S. District Court for the Northern District of California against us and certain of our directors and officers alleging violations of securities laws in connection with the disclosure of our earnings results for the fourth quarter of 2021 and seeking unspecified damages. We believe this lawsuit is without merit, and we are vigorously defending it.
Beginning on August 15, 2018, multiple putative class actions were filed against us alleging that we inflated our estimates of the potential audience size for advertisements, resulting in artificially increased demand and higher prices. The cases were consolidated in the U.S. District Court for the Northern District of California and seek unspecified damages and injunctive relief. In a series of rulings in 2019, 2021, and 2022, the court dismissed certain of the plaintiffs' claims, but permitted its fraud and unfair competition claims to proceed. On March 29, 2022, the court granted the plaintiffs' motion for class certification. We believe this lawsuit is without merit, and we are vigorously defending it.
49
In addition, we are subject to litigation and other proceedings involving law enforcement and other regulatory agencies, including in particular in Brazil, Russia, and other countries in Europe, in order to ascertain the precise scope of our legal obligations to comply with the requests of those agencies, including our obligation to disclose user information in particular circumstances. A number of such instances have resulted in the assessment of fines and penalties against us. We believe we have multiple legal grounds to satisfy these requests or prevail against associated fines and penalties, and we intend to vigorously defend such fines and penalties.
We are also party to various other legal proceedings, claims, and regulatory, tax or government inquiries and investigations that arise in the ordinary course of business, and we may in the future be subject to additional legal proceedings and disputes.
50
Item 1A. Risk Factors
Certain factors may have a material adverse effect on our business, financial condition, and results of operations. You should consider carefully the risks and uncertainties described below, in addition to other information contained in this Quarterly Report on Form 10-Q, including our condensed consolidated financial statements and related notes. The risks and uncertainties described below are not the only ones we face. Additional risks and uncertainties that we are unaware of, or that we currently believe are not material, may also become important factors that adversely affect our business. If any of the following risks actually occurs, our business, financial condition, results of operations, and future prospects could be materially and adversely affected. In that event, the trading price of our Class A common stock could decline, and you could lose part or all of your investment.
Summary Risk Factors
Our business is subject to a number of risks, including risks that may prevent us from achieving our business objectives or may adversely affect our business, financial condition, results of operations, cash flows, and prospects. These risks are discussed more fully below and include, but are not limited to, risks related to:
Risks Related to Our Product Offerings
•our ability to add and retain users and maintain levels of user engagement with our products;
•the loss of, or reduction in spending by, our marketers;
•reduced availability of data signals used by our ad targeting and measurement tools;
•ineffective operation with mobile operating systems or changes in our relationships with mobile operating system partners;
•failure of our new products, or changes to our existing products, to attract or retain users or generate revenue;
Risks Related to Our Business Operations and Financial Results
•our ability to compete effectively;
•unfavorable media coverage and other risks affecting our ability to maintain and enhance our brands;
•the COVID-19 pandemic, including its impact on our advertising business;
•volatile or slower user and revenue growth rates in the future;
•acquisitions and our ability to successfully integrate our acquisitions;
•our ability to build, maintain, and scale our technical infrastructure, and risks associated with disruptions in our service;
•operating our business in multiple countries around the world;
•litigation, including class action lawsuits;
Risks Related to Government Regulation and Enforcement
•government restrictions on access to Facebook or our other products, or other actions that impair our ability to sell advertising, in their countries;
•complex and evolving U.S. and foreign privacy, data use and data protection, content, competition, consumer protection, and other laws and regulations;
•the impact of government investigations, enforcement actions, and settlements, including litigation and investigations by privacy and competition authorities;
51
•our ability to comply with regulatory and legislative privacy requirements, including our consent order with the Federal Trade Commission (FTC);
Risks Related to Data, Security, and Intellectual Property
•the occurrence of security breaches, improper access to or disclosure of our data or user data, and other cyber incidents or undesirable activity on our platform;
•our ability to obtain, maintain, protect, and enforce our intellectual property rights; and
Risks Related to Ownership of Our Class A Common Stock
•limitations on the ability of holders of our Class A Common Stock to influence corporate matters due to the dual class structure of our common stock and the control of a majority of the voting power of our outstanding capital stock by our founder, Chairman, and CEO.
Risks Related to Our Product Offerings
If we fail to retain existing users or add new users, or if our users decrease their level of engagement with our products, our revenue, financial results, and business may be significantly harmed.
The size of our user base and our users' level of engagement across our products are critical to our success. Our financial performance has been and will continue to be significantly determined by our success in adding, retaining, and engaging active users of our products that deliver ad impressions, particularly for Facebook and Instagram. We anticipate that our active user growth rate will continue to generally decline over time as the size of our active user base increases. In addition, we have experienced, and expect to continue to experience, fluctuations and declines in the size of our active user base in one or more markets from time to time, particularly in markets where we have achieved higher penetration rates. User growth and engagement are also impacted by a number of other factors, including competitive products and services, such as TikTok, that have reduced some users' engagement with our products and services, as well as global and regional business, macroeconomic, and geopolitical conditions. For example, beginning in the first quarter of 2020, we experienced significant increases in the size and engagement of our active user base across a number of regions as a result of the COVID-19 pandemic. More recently, we have seen these pandemic-related trends subside. We are unable to predict the impact of the pandemic on user growth and engagement with any certainty, and these trends may continue to be subject to volatility. In addition, in connection with the war in Ukraine, access to Facebook and Instagram was restricted in Russia and these services were then prohibited by the Russian government, which led to slight declines on a quarter-over-quarter basis in the number of DAUs and MAUs on Facebook in Europe in the first quarter of 2022. Any future declines in the size of our active user base may adversely impact our ability to deliver ad impressions and, in turn, our financial performance.
If people do not perceive our products to be useful, reliable, and trustworthy, we may not be able to attract or retain users or otherwise maintain or increase the frequency and duration of their engagement. A number of other social networking companies that achieved early popularity have since seen their active user bases or levels of engagement decline, in some cases precipitously. There is no guarantee that we will not experience a similar erosion of our active user base or engagement levels. Our user engagement patterns have changed over time, and user engagement can be difficult to measure, particularly as we introduce new and different products and services. Any number of factors can negatively affect user retention, growth, and engagement, including if:
•users increasingly engage with other competitive products or services;
•we fail to introduce new features, products, or services that users find engaging or if we introduce new products or services, or make changes to existing products and services, that are not favorably received;
•users feel that their experience is diminished as a result of the decisions we make with respect to the frequency, prominence, format, size, and quality of ads that we display;
•users have difficulty installing, updating, or otherwise accessing our products on mobile devices as a result of actions by us or third parties that we rely on to distribute our products and deliver our services;
•user behavior on any of our products changes, including decreases in the quality and frequency of content
52
shared on our products and services;
•we are unable to continue to develop products for mobile devices that users find engaging, that work with a variety of mobile operating systems and networks, and that achieve a high level of market acceptance;
•there are decreases in user sentiment due to questions about the quality or usefulness of our products or our user data practices, concerns about the nature of content made available on our products, or concerns related to privacy, safety, security, well-being, or other factors;
•we are unable to manage and prioritize information to ensure users are presented with content that is appropriate, interesting, useful, and relevant to them;
•we are unable to obtain or attract engaging third-party content;
•we are unable to successfully maintain or grow usage of and engagement with mobile and web applications that integrate with our products;
•users adopt new technologies where our products may be displaced in favor of other products or services, or may not be featured or otherwise available;
•there are changes mandated by legislation, government and regulatory authorities, or litigation that adversely affect our products or users;
•we are unable to offer a number of our most significant products and services, including Facebook and Instagram, in Europe, or are otherwise limited in our business operations, as a result of European regulators, courts, or legislative bodies determining that our reliance on Standard Contractual Clauses (SCCs) or other legal bases we rely upon to transfer user data from the European Union to the United States is invalid;
•there is decreased engagement with our products, or failure to accept our terms of service, as part of privacy-focused changes that we have implemented or may implement in the future, whether voluntarily, in connection with the General Data Protection Regulation (GDPR), the European Union's ePrivacy Directive, the California Consumer Privacy Act (CCPA), or other laws, regulations, or regulatory actions, or otherwise;
•technical or other problems prevent us from delivering our products in a rapid and reliable manner or otherwise affect the user experience, such as security breaches or failure to prevent or limit spam or similar content;
•we adopt terms, policies, or procedures related to areas such as sharing, content, user data, or advertising, or we take, or fail to take, actions to enforce our policies, that are perceived negatively by our users or the general public, including as a result of decisions or recommendations from the independent Oversight Board regarding content on our platform;
•we elect to focus our product decisions on longer-term initiatives that do not prioritize near-term user growth and engagement (for example, we have announced plans to focus product decisions on optimizing the young adult experience in the long term);
•we make changes in how we promote different products and services across our family of products;
•initiatives designed to attract and retain users and engagement are unsuccessful or discontinued, whether as a result of actions by us, third parties, or otherwise;
•third-party initiatives that may enable greater use of our products, including low-cost or discounted data plans, are scaled back or discontinued, or the pricing of data plans otherwise increases;
•there is decreased engagement with our products as a result of taxes imposed on the use of social media or other mobile applications in certain countries, internet shutdowns, or other actions by governments that affect the accessibility of our products in their countries (for example, beginning in the first quarter of 2022, our user growth and engagement were adversely affected by the war in Ukraine and service restrictions imposed by the Russian government);
53
•we fail to provide adequate customer service to users, marketers, developers, or other partners;
•we, developers whose products are integrated with our products, or other partners and companies in our industry are the subject of adverse media reports or other negative publicity, including as a result of our or their user data practices; or
•our current or future products, such as our development tools and application programming interfaces that enable developers to build, grow, and monetize mobile and web applications, reduce user activity on our products by making it easier for our users to interact and share on third-party mobile and web applications.
From time to time, certain of these factors have negatively affected user retention, growth, and engagement to varying degrees. If we are unable to maintain or increase our user base and user engagement, particularly for our significant revenue‑generating products like Facebook and Instagram, our revenue and financial results may be adversely affected. Any significant decrease in user retention, growth, or engagement could render our products less attractive to users, marketers, and developers, which is likely to have a material and adverse impact on our ability to deliver ad impressions and, accordingly, our revenue, business, financial condition, and results of operations. As our active user growth rate continues to slow, we will become increasingly dependent on our ability to maintain or increase levels of user engagement and monetization in order to drive revenue growth.
We generate substantially all of our revenue from advertising. The loss of marketers, or reduction in spending by marketers, could seriously harm our business.
Substantially all of our revenue is currently generated from third parties advertising on Facebook and Instagram. As is common in the industry, our marketers do not have long-term advertising commitments with us. Many of our marketers spend only a relatively small portion of their overall advertising budget with us. Marketers will not continue to do business with us, or they will reduce the budgets they are willing to commit to us, if we do not deliver ads in an effective manner, if they do not believe that their investment in advertising with us will generate a competitive return relative to other alternatives, or if they are not satisfied for any other reason. We have implemented, and we will continue to implement, changes to our user data practices. Some of these changes reduce our ability to effectively target ads, which has to some extent adversely affected, and will continue to adversely affect, our advertising business. If we are unable to provide marketers with a suitable return on investment, the pricing of our ads may not increase, or may decline, in which case our revenue and financial results may be harmed.
Our advertising revenue can also be adversely affected by a number of other factors, including:
•decreases in user engagement, including time spent on our products;
•our inability to continue to increase user access to and engagement with our products;
•product changes or inventory management decisions we may make that change the size, format, frequency, or relative prominence of ads displayed on our products or of other unpaid content shared by marketers on our products;
•our inability to maintain or increase marketer demand, the pricing of our ads, or both;
•our inability to maintain or increase the quantity or quality of ads shown to users;
•changes to the content or application of third-party policies that limit our ability to deliver, target, or measure the effectiveness of advertising, including changes by mobile operating system and browser providers such as Apple and Google;
•adverse government actions or legislative, regulatory, or other legal developments relating to advertising, including developments that may impact our ability to deliver, target, or measure the effectiveness of advertising;
•user behavior or product changes that may reduce traffic to features or products that we successfully monetize, such as our feed and Stories products, including as a result of increased usage of our Reels or other video or messaging products;
54
•reductions of advertising by marketers due to our efforts to implement or enforce advertising policies that protect the security and integrity of our platform;
•the availability, accuracy, utility, and security of analytics and measurement solutions offered by us or third parties that demonstrate the value of our ads to marketers, or our ability to further improve such tools;
•loss of advertising market share to our competitors, including if prices to purchase our ads increase or if competitors offer lower priced, more integrated, or otherwise more effective products;
•limitations on our ability to offer a number of our most significant products and services, including Facebook and Instagram, in Europe as a result of European regulators, courts, or legislative bodies determining that our reliance on SCCs or other legal bases we rely upon to transfer user data from the European Union to the United States is invalid;
•changes in our marketing and sales or other operations that we are required to or elect to make as a result of risks related to complying with foreign laws or regulatory requirements or other government actions;
•decisions by marketers to reduce their advertising as a result of announcements by us or adverse media reports or other negative publicity involving us, our user data practices, our advertising metrics or tools, content on our products, our interpretation, implementation, or enforcement of policies relating to content on our products (including as a result of decisions or recommendations from the independent Oversight Board), developers with mobile and web applications that are integrated with our products, or other companies in our industry;
•reductions of advertising by marketers due to objectionable content made available on our products by third parties, questions about our user data practices or the security of our platform, concerns about brand safety or potential legal liability, or uncertainty regarding their own legal and compliance obligations (for example, a number of marketers announced that they paused advertising with us in July 2020 due to concerns about content on our products);
•the effectiveness of our ad targeting or degree to which users opt in or out of the use of data for ads, including as a result of product changes and controls that we have implemented or may implement in the future in connection with the GDPR, ePrivacy Directive, California Consumer Privacy Act (CCPA), the proposed Digital Markets Act (DMA), other laws, regulations, regulatory actions, or litigation, or otherwise, that impact our ability to use data for advertising purposes;
•the degree to which users cease or reduce the number of times they engage with our ads;
•changes in the way advertising on mobile devices or on personal computers is measured or priced;
•the success of technologies designed to block the display of ads or ad measurement tools;
•changes in the composition of our marketer base or our inability to maintain or grow our marketer base; and
•the impact of macroeconomic and geopolitical conditions, whether in the advertising industry in general, or among specific types of marketers or within particular geographies (for example, the war in Ukraine and service restrictions imposed by the Russian government have adversely affected our advertising business in Europe and other regions).
From time to time, certain of these factors have adversely affected our advertising revenue to varying degrees. The occurrence of any of these or other factors in the future could result in a reduction in demand for our ads, which may reduce the prices we receive for our ads, or cause marketers to stop advertising with us altogether, either of which would negatively affect our revenue and financial results.
55
Our advertising revenue is dependent on targeting and measurement tools that incorporate data signals from user activity on websites and services that we do not control, and changes to the regulatory environment, third-party mobile operating systems and browsers, and our own products have impacted, and we expect will continue to impact, the availability of such signals, which will adversely affect our advertising revenue.
We rely on data signals from user activity on websites and services that we do not control in order to deliver relevant and effective ads to our users. Our advertising revenue is dependent on targeting and measurement tools that incorporate these signals, and any changes in our ability to use such signals will adversely affect our business. For example, legislative and regulatory developments, such as the GDPR, ePrivacy Directive, and CCPA, have impacted, and we expect will continue to impact, our ability to use such signals in our ad products. In particular, we have seen an increasing number of users opt to control certain types of ad targeting in Europe following adoption of the GDPR, which will increase further with expanded control over certain third-party data as part of our ePrivacy Directive compliance, and we have introduced product changes that limit data signal use for certain users in California following adoption of the CCPA. Regulatory guidance or decisions or new legislation in these or other jurisdictions, such as the proposed DMA, may require us to make additional changes to our products in the future that further reduce our ability to use these signals.
In addition, mobile operating system and browser providers, such as Apple and Google, have implemented product changes and/or announced future plans to limit the ability of websites and application developers to collect and use these signals to target and measure advertising. For example, in 2021, Apple made certain changes to its products and data use policies in connection with changes to its iOS operating system that reduce our and other iOS developers' ability to target and measure advertising, which has negatively impacted, and we expect will continue to negatively impact, the size of the budgets marketers are willing to commit to us and other advertising platforms. In addition, we have implemented, and may continue to implement, product changes that give users the ability to limit our use of such data signals to improve ads and other experiences on our products and services, including our Off-Facebook Activity tool and our worldwide offering of certain product changes we implemented in connection with the GDPR.
These developments have limited our ability to target and measure the effectiveness of ads on our platform and negatively impacted our advertising revenue. For example, our advertising revenue has been negatively impacted by marketer reaction to targeting and measurement challenges associated with iOS changes beginning in 2021. If we are unable to mitigate these developments as they take further effect in the future, our targeting and measurement capabilities will be materially and adversely affected, which would in turn significantly impact our future advertising revenue growth.
Our user growth, engagement, and monetization on mobile devices depend upon effective operation with mobile operating systems, networks, technologies, products, and standards that we do not control.
The substantial majority of our revenue is generated from advertising on mobile devices. There is no guarantee that popular mobile devices will continue to feature our products, or that mobile device users will continue to use our products rather than competing products. We are dependent on the interoperability of our products with popular mobile operating systems, networks, technologies, products, and standards that we do not control, such as the Android and iOS operating systems and mobile browsers. Any changes, bugs, or technical issues in such systems, or changes in our relationships with mobile operating system partners, handset manufacturers, browser developers, or mobile carriers, or in the content or application of their terms of service or policies that degrade our products' functionality, reduce or eliminate our ability to update or distribute our products, give preferential treatment to competitive products, limit our ability to deliver, target, or measure the effectiveness of ads, or charge fees related to the distribution of our products or our delivery of ads could adversely affect the usage of our products and monetization on mobile devices. For example, Apple previously released an update to its Safari browser that limits the use of third-party cookies, which reduces our ability to provide the most relevant ads to our users and impacts monetization, and also released changes to iOS that limit our ability to target and measure ads effectively. We expect that any similar changes to its, Google's, or other browser or mobile platforms will further limit our ability to target and measure the effectiveness of ads and impact monetization. Additionally, in order to deliver high quality mobile products, it is important that our products work well with a range of mobile technologies, products, systems, networks, and standards that we do not control, and that we have good relationships with handset manufacturers, mobile carriers, and browser developers. We may not be successful in maintaining or developing relationships with key participants in the mobile ecosystem or in developing products that operate effectively with these technologies, products, systems, networks, or standards. In the event that it is more difficult for our users to access and use our products on their mobile devices, or if our users choose not to access or use our products on their mobile devices or use mobile products that do not
56
offer access to our products, our user growth and user engagement could be harmed. From time to time, we may also take actions regarding the distribution of our products or the operation of our business based on what we believe to be in our long-term best interests. Such actions may adversely affect our users and our relationships with the operators of mobile operating systems, handset manufacturers, mobile carriers, browser developers, other business partners, or advertisers, and there is no assurance that these actions will result in the anticipated long-term benefits. In the event that our users are adversely affected by these actions or if our relationships with such third parties deteriorate, our user growth, engagement, and monetization could be adversely affected and our business could be harmed. We have in the past experienced challenges in operating with mobile operating systems, networks, technologies, products, and standards that we do not control, and any such occurrences in the future may negatively impact our user growth, engagement, and monetization on mobile devices, which may in turn materially and adversely affect our business and financial results.
Our new products and changes to existing products could fail to attract or retain users or generate revenue and profits.
Our ability to retain, increase, and engage our user base and to increase our revenue depends heavily on our ability to continue to evolve our existing products and to create successful new products, both independently and in conjunction with developers or other third parties. We may introduce significant changes to our existing products or acquire or introduce new and unproven products, including using technologies with which we have little or no prior development or operating experience. For example, we do not have significant experience with consumer hardware products or virtual or augmented reality technology, which may adversely affect our ability to successfully develop and market these products and technologies. We continue to incur substantial costs, and we may not be successful in generating profits, in connection with these efforts. In addition, the introduction of new products, or changes to existing products, may result in new or enhanced governmental or regulatory scrutiny, litigation, or other complications that could adversely affect our business and financial results. We have also invested, and expect to continue to invest, significant resources in growing our messaging products to support increasing usage of such products. We have historically monetized messaging in only a limited fashion, and we may not be successful in our efforts to generate meaningful revenue or profits from messaging over the long term. In addition, we are moving forward with plans to implement end-to-end encryption across our messaging services, as well as facilitate cross-app communication between these platforms, which plans have drawn governmental and regulatory scrutiny in multiple jurisdictions. If our new or enhanced products fail to engage users, marketers, or developers, or if our business plans are unsuccessful, we may fail to attract or retain users or to generate sufficient revenue, operating margin, or other value to justify our investments, and our business may be adversely affected.
We make product and investment decisions that may not prioritize short-term financial results and may not produce the long-term benefits that we expect.
We frequently make product and investment decisions that may not prioritize short-term financial results if we believe that the decisions are consistent with our mission and benefit the aggregate user experience and will thereby improve our financial performance over the long term. For example, we have implemented, and we will continue to implement, changes to our user data practices. Some of these changes reduce our ability to effectively target ads, which has to some extent adversely affected, and will continue to adversely affect, our advertising business. For example, our Off-Facebook Activity tool enables users to place limits on our storage and use of information about their interactions with advertisers' apps and websites, which reduces our ability to deliver the most relevant and effective ads to our users. Similarly, from time to time we update our News Feed ranking algorithm to optimize the user experience, and these changes have had, and may in the future have, the effect of reducing time spent and some measures of user engagement with Facebook, which could adversely affect our financial results. From time to time, we also change the size, frequency, or relative prominence of ads as part of our product and monetization strategies. In addition, we have made, and we expect to continue to make, other changes to our products which may adversely affect the distribution of content of publishers, marketers, and developers, and could reduce their incentive to invest in their efforts on our products. We also may introduce new features or other changes to existing products, or introduce new stand-alone products, that attract users away from properties, formats, or use cases where we have more proven means of monetization, such as our feed products. In addition, as we focus on growing users and engagement across our family of products, from time to time these efforts have reduced, and may in the future reduce, engagement with one or more products and services in favor of other products or services that we monetize less successfully or that are not growing as quickly. For example, we plan to continue to promote Reels, which we do not currently monetize at the same rate as our feed or Stories products. These decisions may adversely affect our business and results of operations and may not produce the long-term benefits that we expect.
57
We may not be successful in our metaverse strategy and investments, which could adversely affect our business, reputation, or financial results.
We believe the metaverse, an embodied internet where people have immersive experiences beyond two-dimensional screens, is the next evolution in social technology. In 2021, we announced a shift in our business and product strategy to focus on helping to bring the metaverse to life. We expect this will be a complex, evolving, and long-term initiative that will involve the development of new and emerging technologies, continued investment in infrastructure as well as privacy, safety, and security efforts, and collaboration with other companies, developers, partners, and other participants. However, the metaverse may not develop in accordance with our expectations, and market acceptance of features, products, or services we build for the metaverse is uncertain. In addition, we have limited experience with consumer hardware products and virtual and augmented reality technology, which may enable other companies to compete more effectively than us. We may be unsuccessful in our research and product development efforts, including if we are unable to develop relationships with key participants in the metaverse or develop products that operate effectively with metaverse technologies, products, systems, networks, or standards. Our metaverse efforts may also divert resources and management attention from other areas of our business. We expect to continue to make significant investments in virtual and augmented reality and other technologies to support these efforts, and our ability to support these efforts is dependent on generating sufficient profits from other areas of our business. In addition, as our metaverse efforts evolve, we may be subject to a variety of existing or new laws and regulations in the United States and international jurisdictions, including in the areas of privacy and e-commerce, which may delay or impede the development of our products and services, increase our operating costs, require significant management time and attention, or otherwise harm our business. As a result of these or other factors, our metaverse strategy and investments may not be successful in the foreseeable future, or at all, which could adversely affect our business, reputation, or financial results.
If we are not able to maintain and enhance our brands, our ability to expand our base of users, marketers, and developers may be impaired, and our business and financial results may be harmed.
We believe that our brands have significantly contributed to the success of our business. We also believe that maintaining and enhancing our brands is critical to expanding our base of users, marketers, and developers. Many of our new users are referred by existing users. Maintaining and enhancing our brands will depend largely on our ability to continue to provide useful, reliable, trustworthy, and innovative products, which we may not do successfully. We may introduce new products or terms of service or policies that users do not like, which may negatively affect our brands. Additionally, the actions of our developers or advertisers may affect our brands if users do not have a positive experience using third-party mobile and web applications integrated with our products or interacting with parties that advertise through our products. We will also continue to experience media, legislative, or regulatory scrutiny of our actions or decisions regarding user privacy, data use, encryption, content, product design, algorithms, advertising, competition, and other issues, including actions or decisions in connection with elections, the COVID-19 pandemic, or geopolitical events, which has in the past adversely affected, and may in the future adversely affect, our reputation and brands. For example, beginning in September 2021, we became the subject of media, legislative, and regulatory scrutiny as a result of a former employee's allegations and release of internal company documents relating to, among other things, our algorithms, advertising and user metrics, and content enforcement practices, as well as misinformation and other undesirable activity on our platform, and user well-being. In addition, in March 2018, we announced developments regarding the misuse of certain data by a developer that shared such data with third parties in violation of our terms and policies. We also may fail to respond expeditiously or appropriately to the sharing of objectionable content on our services or objectionable practices by advertisers or developers, or to otherwise enforce our policies or address user concerns, which has occurred in the past and which could erode confidence in our brands. Our brands may also be negatively affected by the actions of users that are deemed to be hostile or inappropriate to other users, by the actions of users acting under false or inauthentic identities, by the use of our products or services to disseminate information that is deemed to be misleading (or intended to manipulate opinions), by perceived or actual efforts by governments to obtain access to user information for security-related purposes or to censor certain content on our platform, by the use of our products or services for illicit or objectionable ends, including, for example, any such actions around the pandemic, geopolitical events, or elections in the United States and around the world, by decisions or recommendations regarding content on our platform from the independent Oversight Board, by research or media reports concerning the perceived or actual impacts of our products or services on user well-being, or by our decisions regarding whether to remove content or suspend participation on our platform by persons who violate our community standards or terms of service. Maintaining and enhancing our brands will require us to make substantial investments and these investments may not be successful. Certain of our actions, such as the foregoing matter regarding developer misuse of data and concerns around our
58
handling of political speech and advertising, hate speech, and other content, as well as user well-being issues, have eroded confidence in our brands and may continue to do so in the future. If we fail to successfully promote and maintain our brands or if we incur excessive expenses in this effort, our business and financial results may be adversely affected.
We may not be able to continue to successfully maintain or grow usage of and engagement with mobile and web applications that integrate with our products.
We have made and are continuing to make investments to enable developers to build, grow, and monetize mobile and web applications that integrate with our products. Such existing and prospective developers may not be successful in building, growing, or monetizing mobile and/or web applications that create and maintain user engagement. Additionally, developers may choose to build on other platforms, including mobile platforms controlled by third parties, rather than building products that integrate with our products. We are continuously seeking to balance the distribution objectives of our developers with our desire to provide an optimal user experience, and we may not be successful in achieving a balance that continues to attract and retain such developers. For example, from time to time, we have taken actions to reduce the volume of communications from these developers to users on our products with the objective of enhancing the user experience, and such actions have reduced distribution from, user engagement with, and our monetization opportunities from, mobile and web applications integrated with our products. In addition, as part of our efforts related to privacy, safety, and security, we conduct investigations and audits of platform applications from time to time, and we also have announced several product changes that restrict developer access to certain user data. In some instances, these actions, as well as other actions to enforce our policies applicable to developers, have adversely affected, or will adversely affect, our relationships with developers. If we are not successful in our efforts to maintain or grow the number of developers that choose to build products that integrate with our products or if we are unable to continue to build and maintain good relations with such developers, our user growth and user engagement and our financial results may be adversely affected.
Risks Related to Our Business Operations and Financial Results
Our business is highly competitive. Competition presents an ongoing threat to the success of our business.
We compete with companies providing connection, sharing, discovery, and communication products and services to users online, as well as companies that sell advertising to businesses looking to reach consumers and/or develop tools and systems for managing and optimizing advertising campaigns. We face significant competition in every aspect of our business, including, but not limited to, companies that facilitate the ability of users to share, communicate, and discover content and information online or enable marketers to reach their existing or prospective audiences, including, for example, Alphabet (Google and YouTube), Amazon, Apple, ByteDance (TikTok), Microsoft, Snap (Snapchat), Tencent (WeChat), and Twitter. We compete to attract, engage, and retain people who use our products, to attract and retain businesses that use our free or paid business and advertising services, and to attract and retain developers who build compelling mobile and web applications that integrate with our products. We also compete with companies that develop and deliver consumer hardware and virtual and augmented reality products and services. As we introduce or acquire new products, as our existing products evolve, or as other companies introduce new products and services, including as part of efforts to develop the metaverse, we may become subject to additional competition.
Some of our current and potential competitors may have greater resources, experience, or stronger competitive positions in certain product segments, geographic regions, or user demographics than we do. For example, some of our competitors may be domiciled in different countries and subject to political, legal, and regulatory regimes that enable them to compete more effectively than us. These factors may allow our competitors to respond more effectively than us to new or emerging technologies and changes in market conditions. We believe that some users, particularly younger users, are aware of and actively engaging with other products and services similar to, or as a substitute for, our products and services, and we believe that some users have reduced their use of and engagement with our products and services in favor of these other products and services. In the event that users increasingly engage with other products and services, we may experience a decline in use and engagement in key user demographics or more broadly, in which case our business would likely be harmed.
Our competitors may develop products, features, or services that are similar to ours or that achieve greater acceptance, may undertake more far-reaching and successful product development efforts or marketing campaigns, or may adopt more aggressive pricing policies. Some competitors may gain a competitive advantage against us in areas where we operate, including: by making acquisitions; by limiting our ability to deliver, target, or measure the effectiveness of ads; by imposing
59
fees or other charges related to our delivery of ads; by making access to our products more difficult or impossible; by making it more difficult to communicate with our users; or by integrating competing platforms, applications, or features into products they control such as mobile device operating systems, search engines, browsers, or e-commerce platforms. For example, each of Apple and Google have integrated competitive products with iOS and Android, respectively. In addition, Apple has released changes to iOS that limit our ability, and the ability of others in the digital advertising industry, to target and measure ads effectively. As a result, our competitors may, and in some cases will, acquire and engage users or generate advertising or other revenue at the expense of our own efforts, which would negatively affect our business and financial results. In addition, from time to time, we may take actions in response to competitive threats, but we cannot assure you that these actions will be successful or that they will not negatively affect our business and financial results.
We believe that our ability to compete effectively depends upon many factors both within and beyond our control, including:
•the popularity, usefulness, ease of use, performance, and reliability of our products compared to our competitors' products;
•the size and composition of our user base;
•the engagement of users with our products and competing products;
•our ability to attract and retain businesses who use our free or paid business and advertising services;
•the timing and market acceptance of products, including developments and enhancements to our or our competitors' products;
•our safety and security efforts and our ability to protect user data and to provide users with control over their data;
•our ability to distribute our products to new and existing users;
•our ability to monetize our products;
•the frequency, size, format, quality, and relative prominence of the ads displayed by us or our competitors;
•customer service and support efforts;
•marketing and selling efforts, including our ability to measure the effectiveness of our ads and to provide marketers with a compelling return on their investments;
•our ability to establish and maintain developers' interest in building mobile and web applications that integrate with our products;
•our ability to establish and maintain publisher interest in integrating their content with our products;
•changes mandated by legislation, regulatory authorities, or litigation, some of which may have a disproportionate effect on us;
•acquisitions or consolidation within our industry, which may result in more formidable competitors;
•our ability to attract, retain, and motivate talented employees, particularly software engineers, designers, and product managers;
•our ability to cost-effectively manage and grow our operations; and
•our reputation and brand strength relative to those of our competitors.
If we are not able to compete effectively, our user base, level of user engagement, and ability to deliver ad impressions may decrease, we may become less attractive to developers and marketers, and our revenue and results of operations may be materially and adversely affected.
60
Our financial results will fluctuate from quarter to quarter and are difficult to predict.
Our quarterly financial results have fluctuated in the past and will fluctuate in the future. Additionally, we have a limited operating history with the current scale of our business, which makes it difficult to forecast our future results. As a result, you should not rely upon our past quarterly financial results as indicators of future performance. You should take into account the risks and uncertainties frequently encountered by companies in rapidly evolving markets. Our financial results in any given quarter can be influenced by numerous factors, many of which we are unable to predict or are outside of our control, including:
•our ability to maintain and grow our user base and user engagement, particularly for our products that deliver ad impressions;
•our ability to attract and retain marketers in a particular period;
•our ability to recognize revenue or collect payments from marketers in a particular period, including as a result of the effects of the COVID-19 pandemic;
•fluctuations in spending by our marketers due to seasonality, such as historically strong spending in the fourth quarter of each year, episodic regional or global events, including the COVID-19 pandemic, or other factors;
•the frequency, prominence, size, format, and quality of ads shown to users;
•the success of technologies designed to block the display of ads;
•changes to the content or application of third-party policies that limit our ability to deliver, target, or measure the effectiveness of advertising, including changes by mobile operating system and browser providers such as Apple and Google;
•the pricing of our ads and other products;
•the diversification and growth of revenue sources beyond advertising on Facebook and Instagram;
•our ability to generate revenue from Payments, or the sale of our consumer hardware products or other products we may introduce in the future;
•changes to existing products or services or the development and introduction of new products or services by us or our competitors;
•user behavior or product changes that may reduce traffic to features or products that we successfully monetize;
•increases in marketing, sales, and other operating expenses that we will incur to grow and expand our operations and to remain competitive, including costs related to our data centers and technical infrastructure;
•costs related to our privacy, safety, security, and content review efforts, including as a result of implementing changes to our practices, whether voluntarily, in connection with laws, regulations, regulatory actions, or decisions or recommendations from the independent Oversight Board, or otherwise;
•costs and expenses related to the development, manufacturing, and delivery of our consumer hardware products;
•our ability to maintain gross margins and operating margins;
•costs related to acquisitions, including costs associated with amortization and additional investments to develop the acquired technologies;
•charges associated with impairment of any assets on our balance sheet;
•our ability to obtain equipment, components, and labor for our data centers and other technical infrastructure in a timely and cost-effective manner;
•system failures or outages or government blocking, which could prevent us from serving ads for any period of
61
time;
•breaches of security or privacy, and the costs associated with any such breaches and remediation;
•changes in the manner in which we distribute our products or inaccessibility of our products due to third-party actions;
•fees paid to third parties for content or the distribution of our products;
•refunds or other concessions provided to advertisers;
•share-based compensation expense, including acquisition-related expense;
•adverse litigation judgments, settlements, or other litigation-related costs;
•changes in the legislative or regulatory environment, including with respect to privacy, data protection, and content, or actions by governments or regulators, including fines, orders, or consent decrees;
•the overall tax rate for our business, which is affected by the mix of income we earn in the U.S. and in jurisdictions with different tax rates, the effects of share-based compensation, the effects of integrating intellectual property from acquisitions, the effects of changes in our business or structure, and the effects of discrete items such as legal and tax settlements and tax elections;
•the impact of changes in tax laws or judicial or regulatory interpretations of tax laws, which are recorded in the period such laws are enacted or interpretations are issued, and may significantly affect the effective tax rate of that period;
•tax obligations that may arise from resolutions of tax examinations, including the examination we are currently under by the Internal Revenue Service (IRS), that materially differ from the amounts we have anticipated;
•fluctuations in currency exchange rates and changes in the proportion of our revenue and expenses denominated in foreign currencies;
•trading activity in our share repurchase program;
•fluctuations in the market values of our investments in marketable securities, in the valuation of our equity investments, and in interest rates;
•changes in U.S. generally accepted accounting principles; and
•changes in regional or global business, macroeconomic, or geopolitical conditions, including as a result of the COVID-19 pandemic, which may impact the other factors described above.
Unfavorable media coverage negatively affects our business from time to time.
We receive a high degree of media coverage around the world. Unfavorable publicity regarding, for example, our privacy practices, advertising policies, product changes, product quality, litigation or regulatory activity, government surveillance, the actions of our advertisers, the actions of our developers whose products are integrated with our products, the use of our products or services for illicit or objectionable ends, the substance or enforcement of our community standards, terms of service, or other policies, the actions of our users, the quality and integrity of content shared on our platform, the perceived or actual impacts of our products or services on user well-being, or the actions of other companies that provide similar services to ours, has in the past, and could in the future, adversely affect our reputation. For example, we have been the subject of significant media coverage involving concerns around our handling of political speech and advertising, hate speech, and other content, as well as user well-being issues, and we continue to receive negative publicity related to these topics. Beginning in September 2021, we became the subject of significant media coverage as a result of allegations and the release of internal company documents by a former employee. In addition, we have been, and may in the future be, subject to negative publicity in connection with our handling of misinformation and other illicit or objectionable use of our products or services, including in connection with the COVID-19 pandemic, geopolitical events, and elections in the United States and around the world. Any such negative publicity could have an adverse effect on the size, engagement, and loyalty of our user
62
base and marketer demand for advertising on our products, which could result in decreased revenue and adversely affect our business and financial results, and we have experienced such adverse effects to varying degrees from time to time.
The COVID-19 pandemic has previously had, and may in the future have, a significant adverse impact on our advertising revenue and also exposes our business to other risks.
The COVID-19 pandemic has resulted in authorities implementing numerous preventative measures from time to time to contain or mitigate the outbreak of the virus, such as travel bans and restrictions, limitations on business activity, quarantines, and shelter-in-place orders. These measures have caused, and are continuing to cause, business slowdowns or shutdowns in certain affected countries and regions, which have previously significantly impacted our business and results of operations. While we experienced a significant adverse impact on our advertising revenue growth during the onset of the pandemic, we believe that the pandemic subsequently contributed to an acceleration in the growth of online commerce, which in turn increased demand for our advertising services. More recently, we believe this growth of online commerce has declined, and we may experience reduced advertising demand and related declines in pricing in future periods to the extent this trend continues, which could adversely affect our advertising revenue growth. The demand for and pricing of our advertising services may be materially and adversely impacted by the pandemic for the foreseeable future, and we are unable to predict the duration or degree of such impact with any certainty. In addition to the impact on our advertising business, the pandemic exposes our business, operations, and workforce to a variety of other risks, including:
•volatility in the size of our user base and user engagement, particularly for our messaging products, whether as a result of shelter-in-place measures or other factors;
•delays in product development or releases, or reductions in manufacturing production and sales of consumer hardware, as a result of inventory shortages, supply chain or labor shortages;
•increased misuse of our products and services or user data by third parties, including improper advertising practices or other activity inconsistent with our terms, contracts, or policies, misinformation or other illicit or objectionable material on our platforms, election interference, or other undesirable activity;
•significant volatility and disruption of global financial markets, which could cause fluctuations in currency exchange rates or negatively impact our ability to access capital in the future;
•illnesses to key employees, or a significant portion of our workforce, which may result in inefficiencies, delays, and disruptions in our business; and
•increased volatility and uncertainty in the financial projections we use as the basis for estimates used in our financial statements.
Any of these developments may adversely affect our business, harm our reputation, or result in legal or regulatory actions against us. The persistence of COVID-19, and the preventative measures implemented to help limit the spread of the illness, have impacted, and will continue to impact, our ability to operate our business and may materially and adversely impact our business, financial condition, and results of operations.
Our rates of growth may be volatile, and we expect they will decline over time in the future.
We have in the past experienced, and may in the future experience, volatility in our user and revenue growth rates. In the long term, we expect that our user growth rate will generally decline over time as the size of our active user base increases, and the size of our active user base may fluctuate or decline in one or more markets, particularly as we achieve greater market penetration. We also expect our revenue growth rate will continue to decline over time as our revenue increases to higher levels. As our growth rates experience volatility or decline, investors' perceptions of our business may be adversely affected and the trading price of our Class A common stock could decline.
Our costs are continuing to grow, and some of our investments, particularly our investments in virtual and augmented reality, have the effect of reducing our operating margin and profitability. If our investments are not successful longer-term, our business and financial performance will be harmed.
Operating our business is costly, and we expect our expenses to continue to increase in the future as we broaden our user base, as users increase the amount and types of content they consume and the data they share with us, for example with
63
respect to video, as we develop and implement new products, as we market new and existing products and promote our brands, as we continue to expand our technical infrastructure, as we continue to invest in new and unproven technologies, including artificial intelligence and machine learning, and as we continue to hire additional employees and contractors to support our expanding operations, including our efforts to focus on privacy, safety, security, and content review. In addition, from time to time we are subject to settlements, judgments, fines, or other monetary penalties in connection with legal and regulatory developments that may be material to our business. We are also continuing to increase our investments in new platforms and technologies, including as we continue our efforts related to building the metaverse. Some of these investments, particularly our significant investments in virtual and augmented reality, have generated only limited revenue and reduced our operating margin and profitability, and we expect the adverse financial impact of such investments to continue for the foreseeable future. For example, our investments in Reality Labs reduced our 2021 overall operating profit by approximately $10 billion, and we expect our investments to increase in future periods. If our investments are not successful longer-term, our business and financial performance will be harmed.
We plan to continue to make acquisitions and pursue other strategic transactions, which could impact our financial condition or results of operations and may adversely affect the price of our common stock.
As part of our business strategy, we have made and intend to continue to make acquisitions to add specialized employees and complementary companies, products, or technologies, and from time to time may enter into other strategic transactions such as investments and joint ventures. We may not be able to find suitable acquisition candidates, and we may not be able to complete acquisitions or other strategic transactions on favorable terms, or at all, including as a result of regulatory challenges. For example, in 2021, the United Kingdom Competition and Markets Authority issued an order directing us to divest our Giphy acquisition, which we have appealed. In some cases, the costs of such acquisitions or other strategic transactions may be substantial, and there is no assurance that we will realize expected synergies from future growth and potential monetization opportunities for our acquisitions or a favorable return on investment for our strategic investments.
We may pay substantial amounts of cash or incur debt to pay for acquisitions or other strategic transactions, which has occurred in the past and could adversely affect our liquidity. The incurrence of indebtedness would also result in increased fixed obligations and increased interest expense, and could also include covenants or other restrictions that would impede our ability to manage our operations. We may also issue equity securities to pay for acquisitions and we regularly grant RSUs to retain the employees of acquired companies, which could increase our expenses, adversely affect our financial results, and result in dilution to our stockholders. In addition, any acquisitions or other strategic transactions we announce could be viewed negatively by users, marketers, developers, or investors, which may adversely affect our business or the price of our Class A common stock.
We may also discover liabilities, deficiencies, or other claims associated with the companies or assets we acquire that were not identified in advance, which may result in significant unanticipated costs. The effectiveness of our due diligence review and our ability to evaluate the results of such due diligence are dependent upon the accuracy and completeness of statements and disclosures made or actions taken by the companies we acquire or their representatives, as well as the limited amount of time in which acquisitions are executed. In addition, we may fail to accurately forecast the financial impact of an acquisition or other strategic transaction, including tax and accounting charges. Acquisitions or other strategic transactions may also result in our recording of significant additional expenses to our results of operations and recording of substantial finite-lived intangible assets on our balance sheet upon closing. Any of these factors may adversely affect our financial condition or results of operations.
We may not be able to successfully integrate our acquisitions, and we incur significant costs to integrate and support the companies we acquire.
The integration of acquisitions requires significant time and resources, particularly with respect to companies that have significant operations or that develop products where we do not have prior experience, and we may not manage these processes successfully. We continue to make substantial investments of resources to support our acquisitions, which has in the past resulted, and we expect will in the future result, in significant ongoing operating expenses and the diversion of resources and management attention from other areas of our business. We cannot assure you that these investments will be successful. If we fail to successfully integrate the companies we acquire, we may not realize the benefits expected from the transaction and our business may be harmed.
64
Our business is dependent on our ability to maintain and scale our technical infrastructure, and any significant disruption in our service could damage our reputation, result in a potential loss of users and engagement, and adversely affect our financial results.
Our reputation and ability to attract, retain, and serve our users is dependent upon the reliable performance of our products and our underlying technical infrastructure. We have in the past experienced, and may in the future experience, interruptions in the availability or performance of our products from time to time. Our systems may not be adequately designed or may not operate with the reliability and redundancy necessary to avoid performance delays or outages that could be harmful to our business. If our products are unavailable when users attempt to access them, or if they do not load as quickly as expected, users may not use our products as often in the future, or at all, and our ability to serve ads may be disrupted, any of which could adversely affect our business and financial performance. We have experienced such issues to varying degrees from time to time. For example, in October 2021, a combination of an error and a bug resulted in an approximately six-hour outage of our services. In addition, as the amount and types of information shared on our products continue to grow and evolve, as the usage patterns of our global community continue to evolve, and as our internal operational demands continue to grow, we will need an increasing amount of technical infrastructure, including network capacity and computing power, to continue to satisfy our needs. It is possible that we may fail to continue to effectively scale and grow our technical infrastructure to accommodate these increased demands, which may adversely affect our user engagement and advertising revenue growth. In addition, our business may be subject to interruptions, delays, or failures resulting from earthquakes, adverse weather conditions, other natural disasters, power loss, terrorism, geopolitical conflict, other physical security threats, cyber-attacks, or other catastrophic events. Global climate change could result in certain types of natural disasters occurring more frequently or with more intense effects. Any such events may result in users being subject to service disruptions or outages and we may not be able to recover our technical infrastructure and user data in a timely manner to restart or provide our services, which may adversely affect our financial results. We also have been, and may in the future be, subject to increased energy or other costs to maintain the availability or performance of our products in connection with any such events.
In 2020, the increase in the use of our products as a result of the COVID-19 pandemic increased demands on our technical infrastructure. We may not be able to accommodate any such demands in the future, including as a result of our reduced data center operations and personnel working remotely during the pandemic.
A substantial portion of our network infrastructure is provided by third parties. Any disruption or failure in the services we receive from these providers could harm our ability to handle existing or increased traffic and could significantly harm our business. Any financial or other difficulties these providers face may adversely affect our business, and we exercise little control over these providers, which increases our vulnerability to problems with the services they provide. Due to the effects of the COVID-19 pandemic, we have experienced, and expect to continue to experience, supply and labor shortages and other disruptions in logistics and the supply chain for our technical infrastructure. As a result, we have had to make certain changes to our procurement practices, and in the future we may not be able to procure sufficient components, equipment, or services from third parties to satisfy our needs, or we may be required to procure such components, equipment, or services on unfavorable terms.
Any of these developments may result in interruptions in the availability or performance of our products, require unfavorable changes to existing products, delay the introduction of future products, or otherwise adversely affect our business and financial results.
We could experience unforeseen difficulties in building and operating key portions of our technical infrastructure.
We have designed and built our own data centers and key portions of our technical infrastructure through which we serve our products, and we plan to continue to significantly expand the size of our infrastructure primarily through data centers, subsea and terrestrial fiber optic cable systems, and other projects. The infrastructure expansion we are undertaking is complex and involves projects in multiple locations around the world, including in emerging markets that expose us to increased risks relating to anti-corruption compliance and political challenges, among others. We have in the past suspended, and may in the future suspend, certain of these projects as a result of the COVID-19 pandemic. Additional unanticipated delays or disruptions in the completion of these projects, including due to any shortage of labor necessary in building portions of such projects, or availability of components, challenges in obtaining required government or regulatory approvals, or other geopolitical challenges or actions by governments, whether as a result of the pandemic, trade disputes, or otherwise, may lead
65
to increased project costs, operational inefficiencies, interruptions in the delivery or degradation of the quality or reliability of our products, or impairment of assets on our balance sheet. In addition, there may be issues related to this infrastructure that are not identified during the testing phases of design and implementation, which may only become evident after we have started to fully utilize the underlying equipment, that could further degrade the user experience or increase our costs. Further, much of our technical infrastructure is located outside the United States, and it is possible that action by a foreign government, or our response to such government action, could result in the impairment of a portion of our technical infrastructure, which may interrupt the delivery or degrade the quality or reliability of our products and lead to a negative user experience or increase our costs. Any of these events could adversely affect our business, reputation, or financial results.
Real or perceived inaccuracies in our community and other metrics may harm our reputation and negatively affect our business.
The numbers for our key metrics, which include our Family metrics (DAP, MAP, and average revenue per person (ARPP)) and Facebook metrics (DAUs, MAUs, and average revenue per user (ARPU)), are calculated using internal company data based on the activity of user accounts. While these numbers are based on what we believe to be reasonable estimates of our user base for the applicable period of measurement, there are inherent challenges in measuring usage of our products across large online and mobile populations around the world. The methodologies used to measure these metrics require significant judgment and are also susceptible to algorithm or other technical errors. In addition, we are continually seeking to improve our estimates of our user base, and such estimates may change due to improvements or changes in our methodology. We regularly review our processes for calculating these metrics, and from time to time we discover inaccuracies in our metrics or make adjustments to improve their accuracy, which can result in adjustments to our historical metrics. Our ability to recalculate our historical metrics may be impacted by data limitations or other factors that require us to apply different methodologies for such adjustments. We generally do not intend to update previously disclosed Family metrics for any such inaccuracies or adjustments that are within the error margins disclosed below.
In addition, our Family metrics and Facebook metrics estimates will differ from estimates published by third parties due to differences in methodology.
Many people in our community have user accounts on more than one of our products, and some people have multiple user accounts within an individual product. Accordingly, for our Family metrics, we do not seek to count the total number of user accounts across our products because we believe that would not reflect the actual size of our community. Rather, our Family metrics represent our estimates of the number of unique people using at least one of Facebook, Instagram, Messenger, and WhatsApp. We do not require people to use a common identifier or link their accounts to use multiple products in our Family, and therefore must seek to attribute multiple user accounts within and across products to individual people. To calculate these metrics, we rely upon complex techniques, algorithms and machine learning models that seek to count the individual people behind user accounts, including by matching multiple user accounts within an individual product and across multiple products when we believe they are attributable to a single person, and counting such group of accounts as one person. These techniques and models require significant judgment, are subject to data and other limitations discussed below, and inherently are subject to statistical variances and uncertainties. We estimate the potential error in our Family metrics primarily based on user survey data, which itself is subject to error as well. While we expect the error margin for our Family metrics to vary from period to period, we estimate that such margin generally will be approximately 3% of our worldwide MAP. At our scale, it is very difficult to attribute multiple user accounts within and across products to individual people, and it is possible that the actual numbers of unique people using our products may vary significantly from our estimates, potentially beyond our estimated error margins. As a result, it is also possible that our Family metrics may indicate changes or trends in user numbers that do not match actual changes or trends.
To calculate our estimates of Family DAP and MAP, we currently use a series of machine learning models that are developed based on internal reviews of limited samples of user accounts and calibrated against user survey data. We apply significant judgment in designing these models and calculating these estimates. For example, to match user accounts within individual products and across multiple products, we use data signals such as similar device information, IP addresses, and user names. We also calibrate our models against data from periodic user surveys of varying sizes and frequency across our products, which are inherently subject to error. The timing and results of such user surveys have in the past contributed, and may in the future contribute, to changes in our reported Family metrics from period to period. In addition, our data limitations may affect our understanding of certain details of our business and increase the risk of error for our Family metrics estimates. Our techniques and models rely on a variety of data signals from different products, and we rely on more limited data signals
66
for some products compared to others. For example, as a result of limited visibility into encrypted products, we have fewer data signals from WhatsApp user accounts and primarily rely on phone numbers and device information to match WhatsApp user accounts with accounts on our other products. Similarly, although Messenger Kids users are included in our Family metrics, we do not seek to match their accounts with accounts on our other applications for purposes of calculating DAP and MAP. Any loss of access to data signals we use in our process for calculating Family metrics, whether as a result of our own product decisions, actions by third-party browser or mobile platforms, regulatory or legislative requirements, or other factors, also may impact the stability or accuracy of our reported Family metrics, as well as our ability to report these metrics at all. Our estimates of Family metrics also may change as our methodologies evolve, including through the application of new data signals or technologies, product changes, or other improvements in our user surveys, algorithms, or machine learning that may improve our ability to match accounts within and across our products or otherwise evaluate the broad population of our users. In addition, such evolution may allow us to identify previously undetected violating accounts (as defined below).
We regularly evaluate our Family metrics to estimate the percentage of our MAP consisting solely of "violating" accounts. We define "violating" accounts as accounts which we believe are intended to be used for purposes that violate our terms of service, including bots and spam. In the fourth quarter of 2021, we estimated that approximately 3% of our worldwide MAP consisted solely of violating accounts. Such estimation is based on an internal review of a limited sample of accounts, and we apply significant judgment in making this determination. For example, we look for account information and behaviors associated with Facebook and Instagram accounts that appear to be inauthentic to the reviewers, but we have limited visibility into WhatsApp user activity due to encryption. In addition, if we believe an individual person has one or more violating accounts, we do not include such person in our violating accounts estimation as long as we believe they have one account that does not constitute a violating account. From time to time, we disable certain user accounts, make product changes, or take other actions to reduce the number of violating accounts among our users, which may also reduce our DAP and MAP estimates in a particular period. We intend to disclose our estimates of the percentage of our MAP consisting solely of violating accounts on an annual basis. Violating accounts are very difficult to measure at our scale, and it is possible that the actual number of violating accounts may vary significantly from our estimates.
We also regularly evaluate our Facebook metrics to estimate the number of "duplicate" and "false" accounts among our MAUs. A duplicate account is one that a user maintains in addition to his or her principal account. We divide "false" accounts into two categories: (1) user-misclassified accounts, where users have created personal profiles for a business, organization, or non-human entity such as a pet (such entities are permitted on Facebook using a Page rather than a personal profile under our terms of service); and (2) violating accounts, which represent user profiles that we believe are intended to be used for purposes that violate our terms of service, such as bots and spam. The estimates of duplicate and false accounts are based on an internal review of a limited sample of accounts, and we apply significant judgment in making this determination. For example, to identify duplicate accounts we use data signals such as identical IP addresses and similar user names, and to identify false accounts we look for names that appear to be fake or other behavior that appears inauthentic to the reviewers. Any loss of access to data signals we use in this process, whether as a result of our own product decisions, actions by third-party browser or mobile platforms, regulatory or legislative requirements, or other factors, also may impact the stability or accuracy of our estimates of duplicate and false accounts. Our estimates also may change as our methodologies evolve, including through the application of new data signals or technologies or product changes that may allow us to identify previously undetected duplicate or false accounts and may improve our ability to evaluate a broader population of our users. Duplicate and false accounts are very difficult to measure at our scale, and it is possible that the actual number of duplicate and false accounts may vary significantly from our estimates.
In the fourth quarter of 2021, we estimated that duplicate accounts may have represented approximately 11% of our worldwide MAUs. We believe the percentage of duplicate accounts is meaningfully higher in developing markets such as the Philippines and Vietnam, as compared to more developed markets. In the fourth quarter of 2021, we estimated that false accounts may have represented approximately 5% of our worldwide MAUs. Our estimation of false accounts can vary as a result of episodic spikes in the creation of such accounts, which we have seen originate more frequently in specific countries such as Indonesia, Nigeria, and Vietnam. From time to time, we disable certain user accounts, make product changes, or take other actions to reduce the number of duplicate or false accounts among our users, which may also reduce our DAU and MAU estimates in a particular period. We intend to disclose our estimates of the number of duplicate and false accounts among our MAUs on an annual basis.
Other data limitations also may affect our understanding of certain details of our business. For example, while user-provided data indicates a decline in usage among younger users, this age data may be unreliable because a disproportionate
67
number of our younger users register with an inaccurate age. Accordingly, our understanding of usage by age group may not be complete.
In addition, our data regarding the geographic location of our users is estimated based on a number of factors, such as the user's IP address and self-disclosed location. These factors may not always accurately reflect the user's actual location. For example, a user may appear to be accessing Facebook from the location of the proxy server that the user connects to rather than from the user's actual location. The methodologies used to measure our metrics are also susceptible to algorithm or other technical errors, and our estimates for revenue by user location and revenue by user device are also affected by these factors.
In addition, from time to time we provide, or rely on, certain other metrics and estimates, including those relating to the reach and effectiveness of our ads. Many of our metrics involve the use of estimations and judgments, and our metrics and estimates are subject to software bugs, inconsistencies in our systems, and human error. Such metrics and estimates also change from time to time due to improvements or changes in our terminology or methodology, including as a result of loss of access to data signals we use in calculating such metrics and estimates. We have in the past been, and may in the future be, subject to litigation as well as marketer, regulatory, and other inquiries regarding the accuracy of such metrics and estimates. Where marketers, developers, or investors do not perceive our metrics or estimates to be accurate, or where we discover material inaccuracies in our metrics or estimates, we may be subject to liability, our reputation may be harmed, and marketers and developers may be less willing to allocate their budgets or resources to our products that deliver ad impressions, which could negatively affect our business and financial results.
We cannot assure you that we will effectively manage our growth.
Our employee headcount and the scope and complexity of our business have increased significantly, with the number of employees increasing to 77,805 as of March 31, 2022 from 60,654 as of March 31, 2021, and we expect headcount growth to continue for the foreseeable future. In addition, we plan to continue to hire a number of employees and contractors to continue to bolster various privacy, safety, security, and content review initiatives as well as other functions to support our expected growth. The growth and expansion of our business and products create significant challenges for our management, operational, and financial resources, including managing multiple relationships with users, marketers, developers, and other third parties. As our operations and the number of our third-party relationships continue to grow, our information technology systems or our internal controls and procedures may not be adequate to support such growth. In addition, some members of our management do not have significant experience managing a large global business operation, so our management may not be able to manage such growth effectively. Additionally, many of our personnel are currently working remotely, and we may experience challenges to productivity and collaboration as some personnel return to our offices and some personnel transition to working remotely on a regular basis. To effectively manage our growth, we must continue to adapt to a remote work environment; improve our operational, financial, and management processes and systems; and effectively expand, train, and manage our personnel. As our organization continues to grow, and we are required to implement more complex organizational management structures, we may find it increasingly difficult to maintain the benefits of our corporate culture, including our ability to quickly develop and launch new and innovative products. This could negatively affect our business performance.
We have significant international operations and plan to continue expanding our operations abroad where we have more limited operating experience, and this may subject us to increased business, economic, and legal risks that could affect our financial results.
We have significant international operations and plan to continue the international expansion of our business operations and the translation of our products. We currently make Facebook available in more than 100 different languages, and we have offices or data centers in more than 30 different countries. We may enter new international markets where we have limited or no experience in marketing, selling, and deploying our products. Our products are generally available globally, but some or all of our products or functionality may not be available in certain markets due to legal and regulatory complexities. For example, several of our products are not generally available in China. We also outsource certain operational functions to third-party vendors globally. If we fail to deploy, manage, or oversee our international operations successfully, our business may suffer. In addition, we are subject to a variety of risks inherent in doing business internationally, including:
•political, social, or economic instability;
68
•risks related to legal, regulatory, and other government scrutiny applicable to U.S. companies with sales and operations in foreign jurisdictions, including with respect to privacy, tax, law enforcement, content, trade compliance, supply chain, competition, consumer protection, intellectual property, environmental, health and safety, licensing, and infrastructure matters;
•potential damage to our brand and reputation due to compliance with local laws, including potential censorship or requirements to provide user information to local authorities;
•enhanced difficulty in reviewing content on our platform and enforcing our community standards across different languages and countries;
•fluctuations in currency exchange rates and compliance with currency controls;
•foreign exchange controls and tax and other regulations and orders that might prevent us from repatriating cash earned in countries outside the United States or otherwise limit our ability to move cash freely, and impede our ability to invest such cash efficiently;
•higher levels of credit risk and payment fraud;
•enhanced difficulties of integrating any foreign acquisitions;
•burdens of complying with a variety of foreign laws, including laws related to taxation, content removal, content moderation, data localization, data protection, e-commerce and payments, and regulatory oversight;
•reduced protection for intellectual property rights in some countries;
•difficulties in staffing, managing, and overseeing global operations and the increased travel, infrastructure, and legal compliance costs associated with multiple international locations, including difficulties arising from personnel working remotely;
•compliance with statutory equity requirements and management of tax consequences; and
•geopolitical events affecting us, our marketers or our industry, including trade disputes, armed conflicts, and pandemics.
In addition, we must manage the potential conflicts between locally accepted business practices in any given jurisdiction and our obligations to comply with laws and regulations, including anti-corruption laws or regulations applicable to us, such as the U.S. Foreign Corrupt Practices Act and the U.K. Bribery Act 2010. We also must manage our obligations to comply with laws and regulations related to import and export controls, trade restrictions, and sanctions, including regulations established by the U.S. Office of Foreign Assets Control. Government agencies and authorities have a broad range of civil and criminal penalties they may seek to impose against companies for violations of anti-corruption laws or regulations, import and export controls, trade restrictions, sanctions, and other laws, rules, and regulations.
If we are unable to expand internationally and manage the complexity of our global operations successfully, our financial results could be adversely affected. We also may be required to or elect to cease or modify our operations or the offering of our products and services in certain regions, including as a result of the risks described above, which could adversely affect our business, user growth and engagement, and financial results.
We face design, manufacturing, and supply chain risks that, if not properly managed, could adversely impact our financial results.
We face a number of risks related to design, manufacturing, and supply chain management with respect to our consumer hardware products. For example, the consumer hardware products we sell from time to time have had, and in the future may have, quality issues resulting from the design or manufacture of the products, or from the software used in the products. Sometimes, these issues may be caused by components we purchase from other manufacturers or suppliers. Our brand and financial results could be adversely affected by any such quality issues, other failures to meet our customers' expectations, or findings of our consumer hardware products to be defective.
69
We rely on third parties to manufacture and manage the logistics of transporting and distributing our consumer hardware products, which subjects us to a number of risks that have been exacerbated as a result of the COVID-19 pandemic. We have experienced, and may in the future experience, supply or labor shortages or other disruptions in logistics and the supply chain, which could result in shipping delays and negatively impact our operations, product development, and sales. We could be negatively affected if we are not able to engage third parties with the necessary capabilities or capacity on reasonable terms, or if those we engage with fail to meet their obligations (whether due to financial difficulties, manufacturing or supply constraints, or other reasons), or make adverse changes in the pricing or other material terms of such arrangements with them. The manufacturing, distribution, and sale of our consumer hardware products also may be negatively impacted by macroeconomic conditions, geopolitical challenges, trade disputes, or other actions by governments that subject us to supply shortages, increased costs, or supply chain disruptions.
We also require the suppliers and business partners of our consumer hardware products to comply with laws and certain company policies regarding sourcing practices and standards on labor, health and safety, the environment, and business ethics, but we do not control them or their practices and standards. If any of them violates laws, fails to implement changes in accordance with newly enacted laws, or implements practices or standards regarded as unethical, corrupt, or non-compliant, we could experience supply chain disruptions, government action or fines, canceled orders, or damage to our reputation.
We face inventory risk with respect to our consumer hardware products.
We are exposed to inventory risks with respect to our consumer hardware products as a result of rapid changes in product cycles and pricing, unsafe or defective merchandise, supply chain disruptions, changes in consumer demand and consumer spending patterns, changes in consumer tastes with respect to our consumer hardware products, and other factors. The demand for our products can also change significantly between the time inventory or components are ordered and the date of sale. While we endeavor to accurately predict these trends and avoid overstocking or understocking consumer hardware products we may sell, from time to time we have experienced difficulties in accurately predicting and meeting the consumer demand for our products. In addition, when we begin selling or manufacturing a new consumer hardware product or enter new international markets, it may be difficult to establish vendor relationships, determine appropriate product or component selection, and accurately forecast demand. The acquisition of certain types of inventory or components may require significant lead-time and prepayment and they may not be returnable. Any one of the foregoing factors may adversely affect our operating results.
We are involved in numerous class action lawsuits and other litigation matters that are expensive and time consuming, and, if resolved adversely, could harm our business, financial condition, or results of operations.
We are involved in numerous lawsuits, including stockholder derivative lawsuits and putative class action lawsuits, many of which claim statutory damages and/or seek significant changes to our business operations, and we anticipate that we will continue to be a target for numerous lawsuits in the future. Because of the scale of our user, advertiser, and developer base, the plaintiffs in class action cases filed against us typically claim enormous monetary damages even if the alleged per-user or entity harm is small or non-existent. In addition, we have faced, currently face, and will continue to face additional class action lawsuits based on claims related to advertising, antitrust, privacy, biometrics, content, algorithms, employment, activities on our platform, consumer protection, or product performance or other claims related to the use of consumer hardware and software, including virtual reality technology and products, which are new and unproven. For example, we are currently the subject of multiple putative class action suits in connection with our platform and user data practices and the misuse of certain data by a developer that shared such data with third parties in violation of our terms and policies; the disclosure of our earnings results for the second quarter of 2018; our acquisitions of Instagram and WhatsApp, as well as other alleged anticompetitive conduct; a former employee's allegations and release of internal company documents beginning in September 2021; the disclosure of our earnings results for the fourth quarter of 2021; and allegations that we inflated our estimates of the potential audience size for advertisements, resulting in artificially increased demand and higher prices. The results of any such lawsuits and claims cannot be predicted with certainty, and any negative outcome from any such lawsuits could result in payments of substantial monetary damages or fines, or undesirable changes to our products or business practices, and accordingly our business, financial condition, or results of operations could be materially and adversely affected.
There can be no assurances that a favorable final outcome will be obtained in all our cases, and defending any lawsuit is costly and can impose a significant burden on management and employees. Any litigation to which we are a party may
70
result in an onerous or unfavorable judgment that may not be reversed upon appeal or in payments of substantial monetary damages or fines, or we may decide to settle lawsuits on similarly unfavorable terms, which has occurred in the past and which could adversely affect our business, financial conditions, or results of operations.
We may have exposure to greater than anticipated tax liabilities.
Our tax obligations, including income and non-income taxes, are based in part on our corporate operating structure and intercompany arrangements, including the manner in which we operate our business, develop, value, manage, protect, and use our intellectual property, and the valuations of our intercompany transactions. The tax laws applicable to our business, including the laws of the United States and other jurisdictions, are subject to interpretation and certain jurisdictions are aggressively interpreting their laws in new ways in an effort to raise additional tax revenue from companies such as Meta. We are subject to regular review and audit by U.S. federal, state, and foreign tax authorities. Tax authorities may disagree with certain positions we have taken, including our methodologies for valuing developed technology or intercompany arrangements, and any adverse outcome of such a review or audit could increase our worldwide effective tax rate, increase the amount of non-income taxes imposed on our business, and harm our financial position, results of operations, and cash flows. For example, in 2016 and 2018, the IRS issued formal assessments relating to transfer pricing with our foreign subsidiaries in conjunction with the examination of the 2010 through 2013 tax years. Although we disagree with the IRS's position and are litigating this issue, the ultimate resolution is uncertain and, if resolved in a manner unfavorable to us, may adversely affect our financial results.
The determination of our worldwide provision for income taxes and other tax liabilities requires significant judgment by management, and there are many transactions where the ultimate tax determination is uncertain. Our provision for income taxes is determined by the manner in which we operate our business, and any changes to such operations or laws applicable to such operations may affect our effective tax rate. Although we believe that our provision for income taxes and estimates of our non-income tax liabilities are reasonable, the ultimate settlement may differ from the amounts recorded in our financial statements and may materially affect our financial results in the period or periods for which such determination is made.
Our future income tax rates could be volatile and difficult to predict due to changes in jurisdictional profit split, changes in the amount and recognition of deferred tax assets and liabilities, or by changes in tax laws, regulations, or accounting principles.
Changes in tax laws or tax rulings could materially affect our financial position, results of operations, and cash flows.
The tax regimes we are subject to or operate under, including income and non-income taxes, are unsettled and may be subject to significant change. Changes in tax laws or tax rulings, or changes in interpretations of existing laws, could materially affect our financial position, results of operations, and cash flows. For example, the 2017 Tax Cuts and Jobs Act (Tax Act) enacted in December 2017 had a significant impact on our tax obligations and effective tax rate for the fourth quarter of 2017. The issuance of additional regulatory or accounting guidance related to the Tax Act, or other executive or Congressional actions in the United States or globally could materially increase our tax obligations and significantly impact our effective tax rate in the period such guidance is issued or such actions take effect, and in future periods. In addition, many countries have recently proposed or recommended changes to existing tax laws or have enacted new laws that could significantly increase our tax obligations in many countries where we do business or require us to change the manner in which we operate our business.
Over the last several years, the Organization for Economic Cooperation and Development has been working on a Base Erosion and Profit Shifting Project that, if implemented, would change various aspects of the existing framework under which our tax obligations are determined in many of the countries in which we do business. In 2021, more than 140 countries tentatively signed on to a framework that imposes a minimum tax rate of 15%, among other provisions. As this framework is subject to further negotiation and implementation by each member country, the timing and ultimate impact of any such changes on our tax obligations are uncertain. Similarly, the European Commission and several countries have issued proposals that would apply to various aspects of the current tax framework under which we are taxed. These proposals include changes to the existing framework to calculate income tax, as well as proposals to change or impose new types of non-income taxes, including taxes based on a percentage of revenue. For example, several jurisdictions have proposed or enacted taxes applicable to digital services, which include business activities on digital advertising and online marketplaces, and which apply to our business.
71
The European Commission has conducted investigations in multiple countries focusing on whether local country tax rulings or tax legislation provides preferential tax treatment that violates European Union state aid rules and concluded that certain member states, including Ireland, have provided illegal state aid in certain cases. These investigations may result in changes to the tax treatment of our foreign operations.
Due to the large and expanding scale of our international business activities, many of these types of changes to the taxation of our activities described above could increase our worldwide effective tax rate, increase the amount of non-income taxes imposed on our business, and harm our financial position, results of operations, and cash flows. Such changes may also apply retroactively to our historical operations and result in taxes greater than the amounts estimated and recorded in our financial statements.
Given our levels of share-based compensation, our tax rate may vary significantly depending on our stock price.
The tax effects of the accounting for share-based compensation may significantly impact our effective tax rate from period to period. In periods in which our stock price varies from the grant price of the share-based compensation vesting in that period, we will recognize excess tax benefits or deficiencies that will impact our effective tax rate. For example, in the three months ended March 31, 2022, tax deficiencies recognized from share-based compensation increased our provision for income taxes by $5 million, which did not significantly impact our effective tax rate as compared to the tax rate without such deficiencies. In future periods in which our stock price varies in comparison to the grant price of the share-based compensation vesting in that period, our effective tax rate may be inversely impacted. The amount and value of share-based compensation issued relative to our earnings in a particular period will also affect the magnitude of the impact of share-based compensation on our effective tax rate. These tax effects are dependent on our stock price, which we do not control, and a decline in our stock price could significantly increase our effective tax rate and adversely affect our financial results.
If our goodwill or intangible assets become impaired, we may be required to record a significant charge to earnings.
We review our intangible assets for impairment when events or changes in circumstances indicate the carrying value may not be recoverable, such as a decline in stock price and market capitalization. We test goodwill for impairment at the reporting unit level at least annually. If such goodwill or intangible assets are deemed to be impaired, an impairment loss equal to the amount by which the carrying amount exceeds the fair value of the assets would be recognized. We may be required to record a significant charge in our financial statements during the period in which any impairment of our goodwill or intangible assets is determined, which would negatively affect our results of operations.
The loss of one or more of our key personnel, or our failure to attract and retain other highly qualified personnel in the future, could harm our business.
We currently depend on the continued services and performance of our key personnel, including Mark Zuckerberg and Sheryl K. Sandberg. Although we have entered into employment agreements with Mr. Zuckerberg and Ms. Sandberg, the agreements have no specific duration and constitute at-will employment. In addition, many of our key technologies and systems are custom-made for our business by our personnel. The loss of key personnel, including members of management as well as key engineering, product development, marketing, and sales personnel, could disrupt our operations and have an adverse effect on our business.
As we continue to grow, we cannot guarantee we will continue to attract and retain the personnel we need to maintain our competitive position. In particular, we intend to continue to hire a significant number of technical personnel in the foreseeable future, and we expect to continue to face significant challenges in hiring such personnel, particularly for engineering talent, whether as a result of competition with other companies or other factors. As we continue to mature, the incentives to attract, retain, and motivate employees provided by our equity awards or by future arrangements may not be as effective as in the past, and if we issue significant equity to attract additional employees or to retain our existing employees, we would incur substantial additional share-based compensation expense and the ownership of our existing stockholders would be further diluted. Our ability to attract, retain, and motivate employees may also be adversely affected by stock price volatility. In addition, restrictive immigration policies or legal or regulatory developments relating to immigration may negatively affect our efforts to attract and hire new personnel as well as retain our existing personnel. If we do not succeed in attracting, hiring, and integrating excellent personnel, or retaining and motivating existing personnel, we may be unable to grow effectively.
72
Our CEO has control over key decision making as a result of his control of a majority of the voting power of our outstanding capital stock.
Mark Zuckerberg, our founder, Chairman, and CEO, is able to exercise voting rights with respect to a majority of the voting power of our outstanding capital stock and therefore has the ability to control the outcome of matters submitted to our stockholders for approval, including the election of directors and any merger, consolidation, or sale of all or substantially all of our assets. This concentrated control could delay, defer, or prevent a change of control, merger, consolidation, or sale of all or substantially all of our assets that our other stockholders support, or conversely this concentrated control could result in the consummation of such a transaction that our other stockholders do not support. This concentrated control could also discourage a potential investor from acquiring our Class A common stock, which has limited voting power relative to the Class B common stock, and might harm the trading price of our Class A common stock. In addition, Mr. Zuckerberg has the ability to control the management and major strategic investments of our company as a result of his position as our CEO and his ability to control the election or, in some cases, the replacement of our directors. In the event of his death, the shares of our capital stock that Mr. Zuckerberg owns will be transferred to the persons or entities that he has designated. As a board member and officer, Mr. Zuckerberg owes a fiduciary duty to our stockholders and must act in good faith in a manner he reasonably believes to be in the best interests of our stockholders. As a stockholder, even a controlling stockholder, Mr. Zuckerberg is entitled to vote his shares, and shares over which he has voting control as governed by a voting agreement, in his own interests, which may not always be in the interests of our stockholders generally.
We cannot guarantee that our share repurchase program will be fully consummated or that it will enhance long-term stockholder value. Share repurchases could also increase the volatility of the trading price of our stock and will diminish our cash reserves.
Although our board of directors has authorized a share repurchase program that does not have an expiration date, the program does not obligate us to repurchase any specific dollar amount or to acquire any specific number of shares of our Class A common stock. We cannot guarantee that the program will be fully consummated or that it will enhance long-term stockholder value. The program could affect the trading price of our stock and increase volatility, and any announcement of a termination of this program may result in a decrease in the trading price of our stock. In addition, this program will diminish our cash reserves.
Risks Related to Government Regulation and Enforcement
Actions by governments that restrict access to Facebook or our other products in their countries, censor or moderate content on our products in their countries, or otherwise impair our ability to sell advertising in their countries, could substantially harm our business and financial results.
Governments from time to time seek to censor or moderate content available on Facebook or our other products in their country, restrict access to our products from their country partially or entirely, or impose other restrictions that may affect the accessibility of our products in their country for an extended period of time or indefinitely. For example, user access to Facebook and certain of our other products has been or is currently restricted in whole or in part in China, Iran, and North Korea. In addition, government authorities in other countries may seek to restrict user access to our products if they consider us to be in violation of their laws or a threat to public safety or for other reasons, and certain of our products have been restricted by governments in other countries from time to time. For example, in June 2020, Hong Kong adopted a National Security Law that provides authorities with the ability to obtain information, remove and block access to content, and suspend user services, and if we are found to be in violation of this law then the use of our products may be restricted. In addition, if we are required to or elect to make changes to our marketing and sales or other operations in Hong Kong as a result of the National Security Law, our revenue and business in the region will be adversely affected. In addition, in connection with the war in Ukraine in the first quarter of 2022, access to Facebook and Instagram was restricted in Russia and the services were then prohibited by the Russian government, which has adversely affected, and will likely continue to adversely affect, our revenue and business in the region. It is also possible that government authorities could take action that impairs our ability to sell advertising, including in countries where access to our consumer-facing products may be blocked or restricted. For example, we generate meaningful revenue from a limited number of resellers representing advertisers based in China, and it is possible that the Chinese government could take action that reduces or eliminates our China-based advertising revenue, whether as a result of the trade dispute with the United States, in response to content issues or information requests in Hong Kong or elsewhere, or for other reasons, or take other action against us, such as imposing taxes or other penalties, which could adversely affect our financial results. Similarly, if we are found to be out of compliance with certain legal
73
requirements for social media companies in Turkey, the Turkish government could take action to reduce or eliminate our Turkey-based advertising revenue or otherwise adversely impact access to our products. In the event that content shown on Facebook or our other products is subject to censorship, access to our products is restricted, in whole or in part, in one or more countries, we are required to or elect to make changes to our operations, or other restrictions are imposed on our products, or our competitors are able to successfully penetrate new geographic markets or capture a greater share of existing geographic markets that we cannot access or where we face other restrictions, our ability to retain or increase our user base, user engagement, or the level of advertising by marketers may be adversely affected, we may not be able to maintain or grow our revenue as anticipated, and our financial results could be adversely affected.
Our business is subject to complex and evolving U.S. and foreign laws and regulations regarding privacy, data use and data protection, content, competition, safety and consumer protection, e-commerce, and other matters. Many of these laws and regulations are subject to change and uncertain interpretation, and could result in claims, changes to our products and business practices, monetary penalties, increased cost of operations, or declines in user growth or engagement, or otherwise harm our business.
We are subject to a variety of laws and regulations in the United States and abroad that involve matters central to our business, including privacy, data use, data protection and personal information, biometrics, encryption, rights of publicity, content, intellectual property, advertising, marketing, distribution, data security, data retention and deletion, data localization and storage, data disclosure, artificial intelligence, electronic contracts and other communications, competition, protection of minors, consumer protection, civil rights, telecommunications, product liability, e-commerce, taxation, economic or other trade controls including sanctions, anti-corruption and political law compliance, securities law compliance, and online payment services. The introduction of new products, expansion of our activities in certain jurisdictions, or other actions that we may take may subject us to additional laws, regulations, or other government scrutiny. In addition, foreign data protection, privacy, content, competition, consumer protection, and other laws and regulations can impose different obligations or be more restrictive than those in the United States.
These U.S. federal and state and foreign laws and regulations, which in some cases can be enforced by private parties in addition to government entities, are constantly evolving and can be subject to significant change. As a result, the application, interpretation, and enforcement of these laws and regulations are often uncertain, particularly in the new and rapidly evolving industry in which we operate, and may be interpreted and applied inconsistently from country to country and inconsistently with our current policies and practices. For example, regulatory or legislative actions affecting the manner in which we display content to our users or obtain consent to various practices could adversely affect user growth and engagement. Such actions could affect the manner in which we provide our services or adversely affect our financial results.
We are also subject to evolving laws and regulations that dictate whether, how, and under what circumstances we can transfer, process and/or receive certain data that is critical to our operations, including data shared between countries or regions in which we operate and data shared among our products and services. For example, in 2016, the European Union and United States agreed to a transfer framework for data transferred from the European Union to the United States, called the Privacy Shield, but the Privacy Shield was invalidated in July 2020 by the Court of Justice of the European Union (CJEU). In addition, the other bases upon which Meta relies to transfer such data, such as Standard Contractual Clauses (SCCs), have been subjected to regulatory and judicial scrutiny. For example, the CJEU considered the validity of SCCs as a basis to transfer user data from the European Union to the United States following a challenge brought by the Irish Data Protection Commission (IDPC). Although the CJEU upheld the validity of SCCs in July 2020, our continued reliance on SCCs will be the subject of future regulatory consideration. In particular, in August 2020, we received a preliminary draft decision from the IDPC that preliminarily concluded that Meta Platforms Ireland's reliance on SCCs in respect of European user data does not achieve compliance with the GDPR and preliminarily proposed that such transfers of user data from the European Union to the United States should therefore be suspended. Meta Platforms Ireland challenged procedural aspects of this IDPC inquiry in a judicial review commenced in the Irish High Court in September 2020. In May 2021, the court rejected Meta Platforms Ireland's procedural challenges and the inquiry subsequently recommenced. In February 2022, we received a revised preliminary draft decision in which the IDPC maintained its preliminary conclusion that Meta Platforms Ireland's transfers of European user data from the European Union to the United States should be suspended as they relate to users of the Facebook service. We believe a final decision in this inquiry may issue as early as the second half of 2022. On March 25, 2022, the European Union and United States announced that they had reached an agreement in principle on a new Trans-Atlantic Data Privacy Framework, which will be translated into legal documents to be adopted in the European Union and United States to provide a renewed basis for transatlantic data transfers. However, if a new transatlantic data transfer
74
framework is not adopted and we are unable to continue to rely on SCCs or rely upon other alternative means of data transfers from Europe to the United States, we will likely be unable to offer a number of our most significant products and services, including Facebook and Instagram, in Europe, which would materially and adversely affect our business, financial condition, and results of operations. In addition, we have been managing investigations and lawsuits in Europe, India, and other jurisdictions regarding the August 2016 update to WhatsApp's terms of service and privacy policy and its sharing of certain data with other Meta products and services, including a lawsuit currently pending before the Supreme Court of India, and also became subject to government inquiries and lawsuits regarding the 2021 update to WhatsApp's terms of service and privacy policy. If we are unable to transfer data between and among countries and regions in which we operate, or if we are restricted from sharing data among our products and services, it could affect our ability to provide our services, the manner in which we provide our services or our ability to target ads, which could adversely affect our financial results.
We have been subject to other significant legislative and regulatory developments in the past, and proposed or new legislation and regulations could significantly affect our business in the future. For example, we have implemented a number of product changes and controls as a result of requirements under the European General Data Protection Regulation (GDPR), and may implement additional changes in the future. The GDPR also requires submission of personal data breach notifications to our lead European Union privacy regulator, the IDPC, and includes significant penalties for non-compliance with the notification obligation as well as other requirements of the regulation. The GDPR is still a relatively new law, its interpretation is still evolving, and draft decisions in investigations by the IDPC are subject to review by other European privacy regulators as part of the GDPR's consistency mechanism, which may lead to significant changes in the final outcome of such investigations. As a result, the interpretation and enforcement of the GDPR, as well as the imposition and amount of penalties for non-compliance, are subject to significant uncertainty. In addition, Brazil, the United Kingdom, and other countries have enacted similar data protection regulations imposing data privacy-related requirements on products and services offered to users in their respective jurisdictions. The California Consumer Privacy Act (CCPA), which took effect in January 2020, and its successor, the California Privacy Rights Act (CPRA), which will take effect in January 2023, also establish certain transparency rules and create new data privacy rights for users, including limitations on our use of certain sensitive personal information and more ability for users to control how their data is shared with third parties. Other states have proposed or enacted similar comprehensive privacy laws that afford users with similar data privacy rights and controls. These laws and regulations are evolving and subject to interpretation, and resulting limitations on our advertising services, or reductions of advertising by marketers, have to some extent adversely affected, and will continue to adversely affect, our advertising business. For example, regulators continue to issue guidance concerning the ePrivacy Directive's requirements regarding the use of cookies and similar technologies. In addition, effective December 2020, the ePrivacy Directive includes additional limitations on the use of data across messaging products and includes significant penalties for non-compliance. Changes to our products or business practices as a result of these or similar developments may adversely affect our advertising business. Similarly, there are a number of legislative proposals in the European Union, the United States, at both the federal and state level, as well as other jurisdictions that could impose new obligations or limitations in areas affecting our business. For example, the proposed DMA in the European Union and pending proposals to modify competition laws in the United States and other jurisdictions could cause us to incur significant compliance costs and could potentially impose new restrictions and requirements on companies like ours, including in areas such as the combination of data across services, mergers and acquisitions, and product design. While the DMA is expected to be enacted in 2022, the requirements under the final regulation will likely be subject to further interpretation and regulatory engagement. In addition, some countries, such as India, are considering or have passed legislation implementing data protection requirements or requiring local storage and processing of data or similar requirements that could increase the cost and complexity of delivering our services. New legislation or regulatory decisions that restrict our ability to collect and use information about minors may also result in limitations on our advertising services or our ability to offer products and services to minors in certain jurisdictions.
These laws and regulations, as well as any associated claims, inquiries, or investigations or any other government actions, have in the past led to, and may in the future lead to, unfavorable outcomes including increased compliance costs, delays or impediments in the development of new products, negative publicity and reputational harm, increased operating costs, diversion of management time and attention, and remedies that harm our business, including fines or demands or orders that we modify or cease existing business practices.
75
We have been subject to regulatory and other government investigations, enforcement actions, and settlements, and we expect to continue to be subject to such proceedings and other inquiries in the future, which could cause us to incur substantial costs or require us to change our business practices in a manner materially adverse to our business.
We receive formal and informal inquiries from government authorities and regulators regarding our compliance with laws and regulations, many of which are evolving and subject to interpretation. We are and expect to continue to be the subject of investigations, inquiries, data requests, requests for information, actions, and audits in the United States, Europe, and around the world, particularly in the areas of privacy, data protection, law enforcement, consumer protection, civil rights, content moderation, and competition, as we continue to grow and expand our operations. In addition, we are currently, and may in the future be, subject to regulatory orders or consent decrees. For example, data protection, competition, and consumer protection authorities in the European Union and other jurisdictions have initiated actions, investigations, or administrative orders seeking to restrict the ways in which we collect and use information, or impose sanctions, and other authorities may do the same. In addition, beginning in March 2018, we became subject to FTC, state attorneys general, and other government inquiries in the United States, Europe, and other jurisdictions in connection with our platform and user data practices as well as the misuse of certain data by a developer that shared such data with third parties in violation of our terms and policies. In July 2019, we entered into a settlement and modified consent order to resolve the FTC inquiry, which was approved by the federal court and took effect in April 2020. Among other matters, our settlement with the FTC required us to pay a penalty of $5.0 billion and to significantly enhance our practices and processes for privacy compliance and oversight. The state attorneys general inquiry and certain government inquiries in other jurisdictions remain ongoing. Beginning in September 2018, we also became subject to IDPC and other government inquiries in connection with a third-party cyber-attack that exploited a vulnerability in Facebook's code to steal user access tokens and access certain profile information from user accounts on Facebook. We also notify the IDPC, our lead European Union privacy regulator under the GDPR, and other regulators of certain other personal data breaches and privacy issues, and are subject to inquiries and investigations by the IDPC and other regulators regarding various aspects of our regulatory compliance.
In addition, we are subject to various litigation and formal and informal inquiries and investigations by competition authorities in the United States, Europe, and other jurisdictions, which relate to many aspects of our business, including with respect to users and advertisers, as well as our industry. Such inquiries, investigations, and lawsuits concern, among other things, our business practices in the areas of social networking or social media services, digital advertising, and/or mobile or online applications, as well as our acquisitions. For example, in June 2019 we were informed by the FTC that it had opened an antitrust investigation of our company. In addition, beginning in the third quarter of 2019, we became the subject of antitrust inquiries and investigations by the U.S. Department of Justice and state attorneys general. Beginning in December 2020, we also became subject to lawsuits by the FTC and the attorneys general from 46 states, the territory of Guam, and the District of Columbia in the U.S. District Court for the District of Columbia alleging that we violated antitrust laws, including by acquiring Instagram in 2012 and WhatsApp in 2014 and by maintaining conditions on access to our platform, among other things. The complaints of the FTC and attorneys general both sought a permanent injunction against our company's alleged violations of the antitrust laws, and other equitable relief, including divestiture or reconstruction of Instagram and WhatsApp. We are also subject to other government inquiries and investigations relating to our business activities and disclosure practices. For example, beginning in September 2021, we became subject to government investigations and requests relating to allegations and the release of internal company documents by a former employee.
Orders issued by, or inquiries or enforcement actions initiated by, government or regulatory authorities could cause us to incur substantial costs, expose us to unanticipated civil and criminal liability or penalties (including substantial monetary remedies), interrupt or require us to change our business practices in a manner materially adverse to our business, result in negative publicity and reputational harm, divert resources and the time and attention of management from our business, or subject us to other structural or behavioral remedies that adversely affect our business, and we have experienced some of these adverse effects to varying degrees from time to time.
Compliance with our FTC consent order, the GDPR, the CCPA, the ePrivacy Directive, and other regulatory and legislative privacy requirements require significant operational resources and modifications to our business practices, and any compliance failures may have a material adverse effect on our business, reputation, and financial results.
We are engaged in ongoing privacy compliance and oversight efforts, including in connection with our modified consent order with the FTC, requirements of the GDPR, and other regulatory and legislative requirements around the world, such as the CCPA and the ePrivacy Directive. In particular, we are maintaining a comprehensive privacy program in
76
connection with the FTC consent order that includes substantial management and board of directors oversight, stringent operational requirements and reporting obligations, prohibitions against making misrepresentations relating to user data, a process to regularly certify our compliance with the privacy program to the FTC, and regular assessments of our privacy program by an independent third-party assessor, which has been and will continue to be challenging and costly to maintain and enhance. These compliance and oversight efforts are increasing demand on our systems and resources, and require significant new and ongoing investments, including investments in compliance processes, personnel, and technical infrastructure. We are reallocating resources internally to assist with these efforts, and this has had, and will continue to have, an adverse impact on our other business initiatives. In addition, these efforts require substantial modifications to our business practices and make some practices such as product and ads development more difficult, time-consuming, and costly. As a result, we believe our ability to develop and launch new features, products, and services in a timely manner has been and will continue to be adversely affected. We also expect that our privacy compliance and oversight efforts will require significant time and attention from our management and board of directors. The requirements of the FTC consent order and other privacy-related laws and regulations are complex and apply broadly to our business, and from time to time we notify relevant authorities of instances where we are not in full compliance with these requirements or otherwise discover privacy issues, and we expect to continue to do so as any such issues arise in the future. In addition, regulatory and legislative privacy requirements are constantly evolving and can be subject to significant change and uncertain interpretation. For example, we may be subject to new restrictions and requirements under the proposed DMA, including in areas such as the combination of data across services and product design. If we are unable to successfully implement and comply with the mandates of the FTC consent order, GDPR, CCPA, ePrivacy Directive, DMA, or other regulatory or legislative requirements, or if we are found to be in violation of the consent order or other applicable requirements, we may be subject to regulatory or governmental investigations or lawsuits, which may result in significant monetary fines, judgments, or other penalties, and we may also be required to make additional changes to our business practices. Any of these events could have a material adverse effect on our business, reputation, and financial results.
We may incur liability as a result of information retrieved from or transmitted over the internet or published using our products or as a result of claims related to our products, and legislation regulating content on our platform may require us to change our products or business practices and may adversely affect our business and financial results.
We have faced, currently face, and will continue to face claims relating to information or content that is published or made available on our products, including our policies and enforcement actions with respect to such information or content. In particular, the nature of our business exposes us to claims related to defamation, dissemination of misinformation or news hoaxes, discrimination, harassment, intellectual property rights, rights of publicity and privacy, personal injury torts, laws regulating hate speech or other types of content, online safety, consumer protection, and breach of contract, among others. This risk is enhanced in certain jurisdictions outside the United States where our protection from liability for third-party actions may be unclear or where we may be less protected under local laws than we are in the United States. For example, in April 2019, the European Union passed a directive (the European Copyright Directive) expanding online platform liability for copyright infringement and regulating certain uses of news content online, which member states are currently implementing into their national laws. In addition, the European Union revised the European Audiovisual Media Service Directive to apply to online video-sharing platforms, which member states have begun to implement. In the United States, there have been, and continue to be, various legislative and executive efforts to remove or restrict the scope of the protections available to online platforms under Section 230 of the Communications Decency Act, as well as to impose new obligations on online platforms with respect to commerce listings, user content, counterfeit goods and copyright-infringing material, and our current protections from liability for third-party content in the United States could decrease or change. We could incur significant costs investigating and defending such claims and, if we are found liable, significant damages. We could also face fines, orders restricting or blocking our services in particular geographies, or other government-imposed remedies as a result of content hosted on our services. For example, legislation in Germany and India has resulted in the past, and may result in the future, in the imposition of fines or other penalties for failure to comply with certain content removal, law enforcement cooperation, and disclosure obligations. Numerous other countries in Europe, the Middle East, Asia-Pacific, and Latin America are considering or have implemented similar legislation imposing potentially significant penalties, including fines, service throttling, or advertising bans, for failure to remove certain types of content or follow certain processes. For example, we have been subject to fines and may in the future be subject to other penalties in connection with social media legislation in Turkey, and we have been subject to fines and service blocking and prohibition in Russia. Content-related legislation also has required us in the past, and may require us in the future, to change our products or business practices, increase our costs, or otherwise impact our operations or our ability to provide services in certain geographies. For example, the European Copyright Directive requires certain online services to obtain authorizations for copyrighted content or to implement
77
measures to prevent the availability of that content, which may require us to make substantial investments in compliance processes. Member states' laws implementing the European Copyright Directive may also require online platforms to pay for content. In addition, our compliance costs may significantly increase as a result of the Digital Services Act proposed in the European Union, which is expected to take effect in 2023, and other content-related legislative developments such as online safety bills in Ireland and the United Kingdom. In the United States, changes to Section 230 of the Communications Decency Act or new state or federal content-related legislation may increase our costs or require significant changes to our products, business practices, or operations, which could adversely affect user growth and engagement. Any of the foregoing events could adversely affect our business and financial results.
Payment transactions may subject us to additional regulatory requirements and other risks that could be costly and difficult to comply with or that could harm our business.
Several of our products offer Payments functionality, including enabling our users to purchase virtual and digital goods from developers that offer applications using our Payments infrastructure, send money to other users, and make donations to certain charitable organizations, among other activities. We are subject to a variety of laws and regulations in the United States, Europe, and elsewhere, including those governing anti-money laundering and counter-terrorist financing, money transmission, stored value, gift cards and other prepaid access instruments, electronic funds transfer, virtual currency, consumer protection, charitable fundraising, trade sanctions, and import and export restrictions. Depending on how our Payments products evolve, we may also be subject to other laws and regulations including those governing gambling, banking, and lending. In some jurisdictions, the application or interpretation of these laws and regulations is not clear. To increase flexibility in how our use of Payments may evolve and to mitigate regulatory uncertainty, we have received certain payments licenses in the United States, the European Economic Area, and other jurisdictions, which will generally require us to demonstrate compliance with many domestic and foreign laws in these areas. Our efforts to comply with these laws and regulations could be costly and result in diversion of management time and effort and may still not guarantee compliance. In the event that we are found to be in violation of any such legal or regulatory requirements, we may be subject to monetary fines or other penalties such as a cease and desist order, or we may be required to make product changes, any of which could have an adverse effect on our business and financial results.
In addition, we are subject to a variety of additional risks as a result of Payments transactions, including: increased costs and diversion of management time and effort and other resources to deal with bad transactions or customer disputes; potential fraudulent or otherwise illegal activity by users, developers, employees, or third parties; restrictions on the investment of consumer funds used to transact Payments; and additional disclosure and reporting requirements. We have also launched certain payments functionality on WhatsApp and have announced plans to develop digital payments products and services, which may subject us to many of the foregoing risks and additional licensing requirements.
Our digital payments initiatives subject us to significant regulatory scrutiny and other risks that could adversely affect our business, reputation, or financial results.
We are pursuing digital payments initiatives, such as Novi, a digital wallet that we expect to offer as both a standalone application and subsequently integrated in other Meta products. These initiatives may use blockchain-based assets, such as the USDP stablecoin issued by Paxos Trust Company, which is being used in a Novi pilot program in the United States and Guatemala beginning in October 2021. Our future initiatives to support commerce in the metaverse also may use blockchain-based assets in digital payments. Use of blockchain-based assets in payments are a relatively new and unproven technology, and the laws and regulations surrounding them are uncertain and evolving. These digital payments efforts have drawn significant scrutiny from governments and regulators in multiple jurisdictions and we expect that scrutiny to continue. We are participating in responses to inquiries from governments and regulators related to our digital payments initiatives, and adverse government or regulatory actions or negative publicity resulting from such participation may adversely affect our reputation and harm our business.
As our digital payments initiatives evolve, we may be subject to a variety of laws and regulations in the United States and international jurisdictions, including those governing payments, financial services, virtual currency, anti-money laundering, counter-terrorism financing, trade sanctions, data protection, tax, consumer protection, and competition. In many jurisdictions, the application or interpretation of these laws and regulations is not clear, particularly with respect to evolving laws and regulations that are applied to blockchain and digital payments. In addition, Novi has also received state money transmitter licenses in the United States, with more pending approval, and has other financial services license applications pending in certain other countries that would allow us to conduct digital wallet activities in those countries. These licenses,
78
laws, and regulations, as well as any associated inquiries or investigations, may delay or impede the development of digital payments products and services we offer, increase our operating costs, require significant management time and attention, or otherwise harm our business.
In addition, market acceptance of digital payments products and services is subject to significant uncertainty. As such, there can be no assurance that digital payments products and services we offer will be made available in a timely manner, or at all. We do not have significant prior experience with blockchain-based technology, which may adversely affect our ability to successfully develop and market such digital payments products and services. We will also incur increased costs in connection with these efforts, and our investments may not be successful. Any of these events could adversely affect our business, reputation, or financial results.
Risks Related to Data, Security, and Intellectual Property
Security breaches, improper access to or disclosure of our data or user data, other hacking and phishing attacks on our systems, or other cyber incidents could harm our reputation and adversely affect our business.
Our industry is prone to cyber-attacks by third parties seeking unauthorized access to our data or users' data or to disrupt our ability to provide service. Our products and services involve the collection, storage, processing, and transmission of a large amount of data. Any failure to prevent or mitigate security breaches and improper access to or disclosure of our data or user data, including personal information, content, or payment information from users, or information from marketers, could result in the loss, modification, disclosure, destruction, or other misuse of such data, which could harm our business and reputation and diminish our competitive position. In addition, computer malware, viruses, social engineering (such as spear phishing attacks), scraping, and general hacking continue to be prevalent in our industry, have occurred on our systems in the past, and will occur on our systems in the future. We also regularly encounter attempts to create false or undesirable user accounts, purchase ads, or take other actions on our platform for purposes such as spamming, spreading misinformation, or other objectionable ends. As a result of our prominence, the size of our user base, the types and volume of personal data and content on our systems, and the evolving nature of our products and services (including our efforts involving new and emerging technologies), we believe that we are a particularly attractive target for such breaches and attacks, including from nation states and highly sophisticated, state-sponsored, or otherwise well-funded actors, and we experience heightened risk from time to time as a result of geopolitical events. Our efforts to address undesirable activity on our platform also increase the risk of retaliatory attacks. Such breaches and attacks may cause interruptions to the services we provide, degrade the user experience, cause users or marketers to lose confidence and trust in our products, impair our internal systems, or result in financial harm to us. Our efforts to protect our company data or the information we receive, and to disable undesirable activities on our platform, may also be unsuccessful due to software bugs or other technical malfunctions; employee, contractor, or vendor error or malfeasance, including defects or vulnerabilities in our vendors' information technology systems or offerings; government surveillance; breaches of physical security of our facilities or technical infrastructure; or other threats that evolve. In addition, third parties may attempt to fraudulently induce employees or users to disclose information in order to gain access to our data or our users' data. Cyber-attacks continue to evolve in sophistication and volume, and inherently may be difficult to detect for long periods of time. Although we have developed systems and processes that are designed to protect our data and user data, to prevent data loss, to disable undesirable accounts and activities on our platform, and to prevent or detect security breaches, we cannot assure you that such measures will provide absolute security, that we will be able to react in a timely manner, or that our remediation efforts will be successful. The changes in our work environment as a result of certain personnel working remotely could also impact the security of our systems, as well as our ability to protect against attacks and detect and respond to them quickly.
In addition, some of our developers or other partners, such as those that help us measure the effectiveness of ads, may receive or store information provided by us or by our users through mobile or web applications integrated with our products. We provide limited information to such third parties based on the scope of services provided to us. However, if these third parties or developers fail to adopt or adhere to adequate data security practices, or in the event of a breach of their networks, our data or our users' data may be improperly accessed, used, or disclosed.
We experience such cyber-attacks and other security incidents of varying degrees from time to time, and we incur significant costs in protecting against or remediating such incidents. In addition, we are subject to a variety of laws and regulations in the United States and abroad relating to cybersecurity and data protection, as well as obligations under our modified consent order with the FTC. As a result, affected users or government authorities could initiate legal or regulatory actions against us in connection with any actual or perceived security breaches or improper access to or disclosure of data,
79
which has occurred in the past and which could cause us to incur significant expense and liability or result in orders or consent decrees forcing us to modify our business practices. Such incidents or our efforts to remediate such incidents may also result in a decline in our active user base or engagement levels. Any of these events could have a material and adverse effect on our business, reputation, or financial results.
For example, in September 2018, we announced our discovery of a third-party cyber-attack that exploited a vulnerability in Facebook's code to steal user access tokens, which were then used to access certain profile information from approximately 29 million user accounts on Facebook. The events surrounding this cyber-attack became the subject of Irish Data Protection Commission and other government inquiries. Any such inquiries could subject us to substantial fines and costs, require us to change our business practices, divert resources and the attention of management from our business, or adversely affect our business.
We anticipate that our ongoing efforts related to privacy, safety, security, and content review will identify additional instances of misuse of user data or other undesirable activity by third parties on our platform.
In addition to our efforts to mitigate cybersecurity risks, we are making significant investments in privacy, safety, security, and content review efforts to combat misuse of our services and user data by third parties, including investigations and audits of platform applications, as well as other enforcement efforts. As a result of these efforts we have discovered and announced, and anticipate that we will continue to discover and announce, additional incidents of misuse of user data or other undesirable activity by third parties. We may not discover all such incidents or activity, whether as a result of our data or technical limitations, including our lack of visibility over our encrypted services, the scale of activity on our platform, the allocation of resources to other projects, or other factors, and we may be notified of such incidents or activity by the independent privacy assessor required under our modified consent order with the FTC, the media, or other third parties. Such incidents and activities have in the past, and may in the future, include the use of user data or our systems in a manner inconsistent with our terms, contracts or policies, the existence of false or undesirable user accounts, election interference, improper advertising practices, activities that threaten people's safety on- or offline, or instances of spamming, scraping, data harvesting, unsecured datasets, or spreading misinformation. We may also be unsuccessful in our efforts to enforce our policies or otherwise remediate any such incidents. Consequences of any of the foregoing developments include negative effects on user trust and engagement, harm to our reputation and brands, changes to our business practices in a manner adverse to our business, and adverse effects on our business and financial results. Any such developments may also subject us to additional litigation and regulatory inquiries, which could subject us to monetary penalties and damages, divert management's time and attention, and lead to enhanced regulatory oversight.
Our products and internal systems rely on software and hardware that is highly technical, and any errors, bugs, or vulnerabilities in these systems, or failures to address or mitigate technical limitations in our systems, could adversely affect our business.
Our products and internal systems rely on software and hardware, including software and hardware developed or maintained internally and/or by third parties, that is highly technical and complex. In addition, our products and internal systems depend on the ability of such software and hardware to store, retrieve, process, and manage immense amounts of data. The software and hardware on which we rely has contained, and will in the future contain, errors, bugs, or vulnerabilities, and our systems are subject to certain technical limitations that may compromise our ability to meet our objectives. Some errors, bugs, or vulnerabilities inherently may be difficult to detect and may only be discovered after the code has been released for external or internal use. For example, in September 2018, we announced our discovery of a third-party cyber-attack that exploited a vulnerability in Facebook's code to steal user access tokens and access certain profile information from user accounts on Facebook. Errors, bugs, vulnerabilities, design defects, or technical limitations within the software and hardware on which we rely, or human error in using such systems, have in the past led to, and may in the future lead to, outcomes including a negative experience for users and marketers who use our products, compromised ability of our products to perform in a manner consistent with our terms, contracts, or policies, delayed product introductions or enhancements, targeting, measurement, or billing errors, compromised ability to protect the data of our users and/or our intellectual property or other data, or reductions in our ability to provide some or all of our services. For example, we make commitments to our users as to how their data will be used within and across our products, and our systems are subject to errors, bugs and technical limitations that may prevent us from fulfilling these commitments reliably. In addition, any errors, bugs, vulnerabilities, or defects in our systems or the software and hardware on which we rely, failures to properly address or mitigate the technical limitations in our systems, or associated degradations or interruptions of service or failures to fulfill our commitments to our users, have in the past led to, and may in the future lead to, outcomes including damage to our
80
reputation, loss of users, loss of marketers, loss of revenue, regulatory inquiries, litigation, or liability for fines, damages, or other remedies, any of which could adversely affect our business and financial results.
If we are unable to protect our intellectual property, the value of our brands and other intangible assets may be diminished, and our business may be adversely affected.
We rely and expect to continue to rely on a combination of confidentiality, assignment, and license agreements with our employees, consultants, and third parties with whom we have relationships, as well as trademark, copyright, patent, trade secret, and domain name protection laws, to protect our proprietary rights. In the United States and internationally, we have filed various applications for protection of certain aspects of our intellectual property, and we currently hold a significant number of registered trademarks and issued patents in multiple jurisdictions and have acquired patents and patent applications from third parties. Third parties may knowingly or unknowingly infringe our proprietary rights, third parties may challenge proprietary rights held by us, and pending and future trademark and patent applications may not be approved. In addition, effective intellectual property protection may not be available in every country in which we operate or intend to operate our business. In any or all of these cases, we may be required to expend significant time and expense in order to prevent infringement or to enforce our rights. Although we have generally taken measures to protect our proprietary rights, there can be no assurance that others will not offer products or concepts that are substantially similar to ours and compete with our business. In addition, we regularly contribute software source code under open source licenses and have made other technology we developed available under other open licenses, and we include open source software in our products. As a result of our open source contributions and the use of open source in our products, we may license or be required to license or disclose code and/or innovations that turn out to be material to our business and may also be exposed to increased litigation risk. If the protection of our proprietary rights is inadequate to prevent unauthorized use or appropriation by third parties, the value of our brands and other intangible assets may be diminished and competitors may be able to more effectively mimic our products, services, and methods of operations. Any of these events could have an adverse effect on our business and financial results.
We are currently, and expect to be in the future, party to patent lawsuits and other intellectual property rights claims that are expensive and time consuming and, if resolved adversely, could have a significant impact on our business, financial condition, or results of operations.
Companies in the internet, technology, and media industries own large numbers of patents, copyrights, trademarks, and trade secrets, and frequently enter into litigation based on allegations of infringement, misappropriation, or other violations of intellectual property or other rights. In addition, various "non-practicing entities" that own patents and other intellectual property rights often attempt to aggressively assert their rights in order to extract value from technology companies. Furthermore, from time to time we may introduce or acquire new products, including in areas where we historically have not competed, which could increase our exposure to patent and other intellectual property claims from competitors and non-practicing entities.
From time to time, we receive notice from patent holders and other parties alleging that certain of our products and services, or user content, infringe their intellectual property rights. We presently are involved in a number of intellectual property lawsuits, and as we face increasing competition and gain an increasingly high profile, we expect the number of patent and other intellectual property claims against us to grow. Defending patent and other intellectual property litigation is costly and can impose a significant burden on management and employees, and there can be no assurances that favorable final outcomes will be obtained in all cases. In addition, plaintiffs may seek, and we may become subject to, preliminary or provisional rulings in the course of any such litigation, including potential preliminary injunctions requiring us to cease some or all of our operations. We may decide to settle such lawsuits and disputes on terms that are unfavorable to us. Similarly, if any litigation to which we are a party is resolved adversely, we may be subject to an unfavorable judgment that may not be reversed upon appeal. The terms of such a settlement or judgment may require us to cease some or all of our operations or pay substantial amounts to the other party. In addition, we may have to seek a license to continue practices found to be in violation of a third party's rights, which may not be available on reasonable terms, or at all, and may significantly increase our operating costs and expenses. As a result, we may also be required to develop alternative non-infringing technology or practices or discontinue the practices. The development of alternative non-infringing technology or practices could require significant effort and expense, could result in less effective technology or practices or otherwise negatively affect the user experience, or may not be feasible. We have experienced unfavorable outcomes in such disputes and litigation in the past, and our business, financial condition, and results of operations could be adversely affected as a result of an unfavorable resolution of the disputes and litigation referred to above.
81
Risks Related to Ownership of Our Class A Common Stock
The trading price of our Class A common stock has been and will likely continue to be volatile.
The trading price of our Class A common stock has been, and is likely to continue to be, volatile. Since shares of our Class A common stock were sold in our initial public offering in May 2012 at a price of $38.00 per share, our stock price has ranged from $17.55 to $384.33 through March 31, 2022. In addition to the factors discussed in this Quarterly Report on Form 10-Q, the trading price of our Class A common stock has in the past fluctuated and may in the future fluctuate significantly in response to numerous factors, many of which are beyond our control, including:
•actual or anticipated fluctuations in our revenue and other operating results for either of our reportable segments;
•the financial projections we may provide to the public, any changes in these projections, or our failure to meet these projections;
•actions of securities analysts who initiate or maintain coverage of us, changes in financial estimates by any securities analysts who follow our company, or our failure to meet these estimates or the expectations of investors;
•additional shares of our stock being sold into the market by us, our existing stockholders, or in connection with acquisitions, or the anticipation of such sales;
•investor sentiment with respect to our competitors, our business partners, and our industry in general;
•announcements by us or our competitors of significant products or features, technical innovations, acquisitions, strategic partnerships, joint ventures, or capital commitments;
•announcements by us or estimates by third parties of actual or anticipated changes in the size of our user base, the level of user engagement, or the effectiveness of our ad products;
•changes in operating performance and stock market valuations of technology companies in our industry, including our developers and competitors;
•price and volume fluctuations in the overall stock market, including as a result of trends in the economy as a whole;
•the inclusion, exclusion, or deletion of our stock from any trading indices, such as the S&P 500 Index;
•media coverage of our business and financial performance;
•lawsuits threatened or filed against us, or developments in pending lawsuits;
•adverse government actions or legislative or regulatory developments relating to advertising, competition, content, privacy, or other matters, including interim or final rulings by tax, judicial, or regulatory bodies;
•trading activity in our share repurchase program; and
•other events or factors, including those resulting from war, incidents of terrorism, pandemics, and other disruptive external events, or responses to these events.
In addition, the stock markets have experienced extreme price and volume fluctuations that have affected and continue to affect the market prices of equity securities of many technology companies. We are currently subject to securities litigation in connection with our platform and user data practices and the misuse of certain data by a developer that shared such data with third parties in violation of our terms and policies; the disclosure of our earnings results for the second quarter of 2018; a former employee's allegations and release of internal company documents beginning in September 2021; and the disclosure of our earnings results for the fourth quarter of 2021. We may experience more such litigation following future periods of volatility. Any securities litigation could subject us to substantial costs, divert resources and the attention of management from our business, and adversely affect our business.
82
We do not intend to pay cash dividends for the foreseeable future.
We have never declared or paid cash dividends on our capital stock. We currently intend to retain any future earnings to finance the operation and expansion of our business and fund our share repurchase program, and we do not expect to declare or pay any cash dividends in the foreseeable future. As a result, you may only receive a return on your investment in our Class A common stock if the trading price of your shares increases.
The dual class structure of our common stock and a voting agreement between certain stockholders have the effect of concentrating voting control with our CEO and certain other holders of our Class B common stock; this will limit or preclude your ability to influence corporate matters.
Our Class B common stock has ten votes per share and our Class A common stock has one vote per share. Stockholders who hold shares of Class B common stock, including certain of our executive officers, employees, and directors and their affiliates, together hold a substantial majority of the voting power of our outstanding capital stock. Because of the ten-to-one voting ratio between our Class B and Class A common stock, the holders of our Class B common stock collectively control a majority of the combined voting power of our common stock and therefore are able to control all matters submitted to our stockholders for approval so long as the shares of Class B common stock represent at least 9.1% of all outstanding shares of our Class A and Class B common stock. This concentrated control will limit or preclude your ability to influence corporate matters for the foreseeable future.
Transfers by holders of Class B common stock will generally result in those shares converting to Class A common stock, subject to limited exceptions, such as certain transfers effected for estate planning or charitable purposes. The conversion of Class B common stock to Class A common stock will have the effect, over time, of increasing the relative voting power of those holders of Class B common stock who retain their shares in the long term. If, for example, Mr. Zuckerberg retains a significant portion of his holdings of Class B common stock for an extended period of time, he could, in the future, continue to control a majority of the combined voting power of our outstanding capital stock.
Our status as a "controlled company" could make our Class A common stock less attractive to some investors or otherwise harm our stock price.
Because we qualify as a "controlled company" under the corporate governance rules for Nasdaq-listed companies, we are not required to have a majority of our board of directors be independent, nor are we required to have a compensation committee or an independent nominating function. In the future we could elect not to have a majority of our board of directors be independent or not to have a compensation committee or an independent nominating function. Accordingly, should the interests of our controlling stockholder differ from those of other stockholders, the other stockholders may not have the same protections afforded to stockholders of companies that are subject to all of the corporate governance rules for Nasdaq-listed companies. Our status as a controlled company could make our Class A common stock less attractive to some investors or otherwise harm our stock price.
Delaware law and provisions in our certificate of incorporation and bylaws could make a merger, tender offer, or proxy contest difficult, thereby depressing the trading price of our Class A common stock.
Our status as a Delaware corporation and the anti-takeover provisions of the Delaware General Corporation Law may discourage, delay, or prevent a change in control by prohibiting us from engaging in a business combination with an interested stockholder for a period of three years after the person becomes an interested stockholder, even if a change of control would be beneficial to our existing stockholders. In addition, our current certificate of incorporation and bylaws contain provisions that may make the acquisition of our company more difficult, including the following:
•until the first date on which the outstanding shares of our Class B common stock represent less than 35% of the combined voting power of our common stock, any transaction that would result in a change in control of our company requires the approval of a majority of our outstanding Class B common stock voting as a separate class;
•we currently have a dual class common stock structure, which provides Mr. Zuckerberg with the ability to control the outcome of matters requiring stockholder approval, even if he owns significantly less than a majority of the shares of our outstanding Class A and Class B common stock;
83
•when the outstanding shares of our Class B common stock represent less than a majority of the combined voting power of common stock, certain amendments to our certificate of incorporation or bylaws will require the approval of two-thirds of the combined vote of our then-outstanding shares of Class A and Class B common stock;
•when the outstanding shares of our Class B common stock represent less than a majority of the combined voting power of our common stock, vacancies on our board of directors will be able to be filled only by our board of directors and not by stockholders;
•when the outstanding shares of our Class B common stock represent less than a majority of the combined voting power of our common stock, our board of directors will be classified into three classes of directors with staggered three-year terms and directors will only be able to be removed from office for cause;
•when the outstanding shares of our Class B common stock represent less than a majority of the combined voting power of our common stock, our stockholders will only be able to take action at a meeting of stockholders and not by written consent;
•only our chairman, our chief executive officer, our president, or a majority of our board of directors are authorized to call a special meeting of stockholders;
•advance notice procedures apply for stockholders to nominate candidates for election as directors or to bring matters before an annual meeting of stockholders;
•our certificate of incorporation authorizes undesignated preferred stock, the terms of which may be established, and shares of which may be issued, without stockholder approval; and
•certain litigation against us can only be brought in Delaware.
84
Item 2.Unregistered Sales of Equity Securities and Use of Proceeds
a) Sales of Unregistered Securities
None.
c) Issuer Purchases of Equity Securities
The following table summarizes the share repurchase activity for the three months ended March 31, 2022:
Total Number of Shares Purchased(1) | Average Price Paid Per Share(2) | Total Number of Shares Purchased as Part of Publicly Announced Programs(1) | Approximate Dollar Value of Shares that May Yet Be Purchased Under the Plans or Programs(1) | ||||||||||||||||||||
| (in thousands) | (in thousands) | (in millions) | |||||||||||||||||||||
| January 1 - 31, 2022 | 19,687 | $ | 316.45 | 19,687 | $ | 32,563 | |||||||||||||||||
| February 1 - 28, 2022 | 5,918 | $ | 224.75 | 5,918 | $ | 31,233 | |||||||||||||||||
| March 1 - 31, 2022 | 8,666 | $ | 210.79 | 8,666 | $ | 29,406 | |||||||||||||||||
| 34,271 | 34,271 | ||||||||||||||||||||||
____________________________________
(1)Our board of directors has authorized a share repurchase program of our Class A common stock, which commenced in January 2017 and does not have an expiration date. As of December 31, 2021, $38.79 billion remained available for repurchases under this program. The timing and actual number of shares repurchased depend on a variety of factors, including price, general business and market conditions, and other investment opportunities, and shares may be repurchased through open market purchases or privately negotiated transactions, including through the use of trading plans intended to qualify under Rule 10b5-1 under the Exchange Act.
(2)Average price paid per share includes costs associated with the repurchases.
85
Item 6.Exhibits
| Exhibit | Incorporated by Reference | Filed Herewith | ||||||||||||||||||||||||||||||||||||
| Number | Exhibit Description | Form | File No. | Exhibit | Filing Date | |||||||||||||||||||||||||||||||||
| 10.1 | 10-Q | 001-35551 | 10.3 | July 25, 2019 | ||||||||||||||||||||||||||||||||||
| 10.2 | X | |||||||||||||||||||||||||||||||||||||
| 10.3 | X | |||||||||||||||||||||||||||||||||||||
| 31.1 | X | |||||||||||||||||||||||||||||||||||||
| 31.2 | X | |||||||||||||||||||||||||||||||||||||
| 32.1# | X | |||||||||||||||||||||||||||||||||||||
| 32.2# | X | |||||||||||||||||||||||||||||||||||||
| 101.INS | Inline XBRL Instance Document (the instance document does not appear in the Interactive Data File because its XBRL tags are embedded within the Inline XBRL document). | X | ||||||||||||||||||||||||||||||||||||
| 101.SCH | Inline XBRL Taxonomy Extension Schema Document. | X | ||||||||||||||||||||||||||||||||||||
| 101.CAL | Inline XBRL Taxonomy Extension Calculation Linkbase Document. | X | ||||||||||||||||||||||||||||||||||||
| 101.DEF | Inline XBRL Taxonomy Extension Definition Linkbase Document. | X | ||||||||||||||||||||||||||||||||||||
| 101.LAB | Inline XBRL Taxonomy Extension Labels Linkbase Document. | X | ||||||||||||||||||||||||||||||||||||
| 101.PRE | Inline XBRL Taxonomy Extension Presentation Linkbase Document. | X | ||||||||||||||||||||||||||||||||||||
| 104 | Cover Page Interactive Data File (formatted as inline XBRL and contained in Exhibit 101). | X | ||||||||||||||||||||||||||||||||||||
# This certification is deemed not filed for purposes of Section 18 of the Securities Exchange Act of 1934, as amended (Exchange Act), or otherwise subject to the liability of that section, nor shall it be deemed incorporated by reference into any filing under the Securities Act of 1933, as amended, or the Exchange Act.
86
SIGNATURES
Pursuant to the requirements of the Securities Exchange Act of 1934, the Registrant has duly caused this Quarterly Report on Form 10-Q to be signed on its behalf by the undersigned, thereunto duly authorized, in the City of Menlo Park, State of California, on this 27th day of April 2022.
| META PLATFORMS, INC. | ||||||||
| Date: April 27, 2022 | /s/ DAVID M. WEHNER | |||||||
David M. Wehner Chief Financial Officer (Principal Financial Officer) | ||||||||
| Date: April 27, 2022 | /s/ SUSAN J.S. TAYLOR | |||||||
Susan J.S. Taylor Chief Accounting Officer (Principal Accounting Officer) | ||||||||
87
Serious News for Serious Traders! Try StreetInsider.com Premium Free!
You May Also Be Interested In
- SES AI Corporation Securities Fraud Class Action Result of Weak Revenue Guidance and 37% Stock Decline - Investors may Contact Lewis Kahn, Esq, at Kahn Swick & Foti, LLC
- Eleven SBSB Partners Named to 2026 Lawdragon 500 X – The Next Generation List
- Albuquerque Regional Economic Alliance: State, City Back Spacecraft Manufacturer, Adding 152 Jobs
Create E-mail Alert Related Categories
SEC FilingsSign up for StreetInsider Free!
Receive full access to all new and archived articles, unlimited portfolio tracking, e-mail alerts, custom newswires and RSS feeds - and more!