

Form 10-K/A FREEPORT-MCMORAN INC For: Dec 31
 Tweet
Tweet Share
ShareExhibit 31.1
Certification
I, Richard C. Adkerson, certify that:
1.I have reviewed this Amendment No. 1 to the annual report on Form 10-K/A of Freeport-McMoRan Inc.; and
2.Based on my knowledge, this report does not contain any untrue statement of a material fact or omit to state a material fact necessary to make the statements made, in light of the circumstances under which such statements were made, not misleading with respect to the period covered by this report.
Dated: February 18, 2022 | |||||
By: /s/ Richard C. Adkerson | |||||
Richard C. Adkerson | |||||
Chairman of the Board and | |||||
Chief Executive Officer | |||||
Exhibit 31.2
Certification
I, Kathleen L. Quirk, certify that:
1.I have reviewed this Amendment No. 1 to the annual report on Form 10-K/A of Freeport-McMoRan Inc.; and
2.Based on my knowledge, this report does not contain any untrue statement of a material fact or omit to state a material fact necessary to make the statements made, in light of the circumstances under which such statements were made, not misleading with respect to the period covered by this report.
Dated: February 18, 2022 | |||||
By: /s/ Kathleen L. Quirk | |||||
Kathleen L. Quirk | |||||
President and Chief Financial Officer | |||||
Exhibit 96.2

Technical Report Summary of
Mineral Reserves and Mineral Resources
for
Grasberg Minerals District
Papua, Indonesia
| Effective Date: | December 31, 2021 | ||||
| Report Date: | January 31, 2022 | ||||
IMPORTANT NOTE
This Technical Report Summary (TRS) has been prepared for Freeport-McMoRan Inc. (FCX) in support of the disclosure and filing requirements of the United States (U.S.) Securities and Exchange Commission (SEC) under Subpart 1300 of Regulation S-K. The quality of information, conclusions, and estimates contained herein apply as of the date of this TRS. Events (including changes to the assumptions, conditions, and/or qualifications outlined in this TRS) may have occurred since the date of this TRS, which may substantially alter the conclusions and opinions herein. Any use of this TRS by a third-party beyond its intended use is at that party’s sole risk.
CAUTIONARY STATEMENT
This TRS contains forward-looking statements in which potential future performance is discussed. The words “anticipates,” “may,” “can,” “plans,” “believes,” “estimates,” “expects,” “projects,” “targets,” “intends,” “likely,” “will,” “should,” “could,” “to be,” “potential,” “assumptions,” “guidance,” “aspirations,” “future,” and any similar expressions are intended to identify those assertions as forward-looking statements. Forward-looking statements are all statements other than statements of historical facts, such as plans, projections, forecasts, or expectations relating to business outlook, strategy, goals, or targets; ore grades and processing rates; production and sales volumes; unit net cash costs; net present values; economic assessments; capital expenditures; operating costs; operating or Life-of-Mine (LOM) plans; cash flows; PT-FI’s financing, construction, and completion of additional domestic smelting capacity in Indonesia in accordance with the terms of its special mining license (IUPK); FCX’s commitments to deliver responsibly produced copper, including plans to implement and validate all of its operating sites under the Copper Mark and to comply with other disclosure frameworks; improvements in operating procedures and technology innovations; potential environmental and social impacts; exploration efforts and results; development and production activities, rates and costs; future organic growth opportunities; tax rates; export quotas and duties; impact of price changes in the commodities FCX produces, primarily copper; mineral resource and mineral reserve estimates and recoveries; and information pertaining to the financial and operating performance and mine life of the Grasberg minerals district mines.
Readers are cautioned that forward-looking statements in this TRS are necessarily based on opinions and estimates of the Qualified Persons (QPs) authoring this TRS, are not guarantees of future performance, and actual results may differ materially from those anticipated, expected, projected, or assumed in the forward-looking statements. Material assumptions regarding forward-looking statements are discussed in this TRS, where applicable. In addition to such assumptions, the forward-looking statements are inherently subject to significant business, economic and competitive uncertainties, and contingencies. Important factors that can cause actual results to differ materially from those anticipated in the forward-looking statements include, but are not limited to, supply of, demand for, and prices of the commodities FCX produces, primarily copper; changes in cash requirements, financial position, financing, or investment plans; changes in general market, economic, tax, regulatory, or industry conditions; reductions in liquidity and access to capital; the ongoing COVID-19 pandemic and any future public health crisis; political and social risks; operational risks inherent in mining, with higher inherent risks in underground mining; availability and increased costs associated with mining inputs and labor; fluctuations in price and availability of commodities purchased, including higher prices for fuel, steel, power, labor, and other consumables contributing to higher costs; constraints on supply, logistics, and transportation services; mine sequencing; changes in mine plans or operational modifications, delays, deferrals, or cancellations; production rates; timing of shipments; results of technical, economic, or feasibility studies; potential inventory adjustments; potential impairment of long-lived mining assets; the potential effects of violence in Indonesia generally and in the province of Papua; the Indonesia government’s extension of PT-FI’s export license after March 15, 2022; satisfaction of requirements in accordance with PT-FI’s IUPK to extend mining rights from 2031 through 2041; the Indonesia government’s approval of a deferred schedule for completion of additional domestic smelting capacity in Indonesia; expected results from improvements in operating procedures and technology, including innovation initiatives; industry risks; financial condition of FCX’s customers, suppliers, vendors, partners, and affiliates; cybersecurity incidents; labor relations, including labor-related work stoppages and costs; compliance with applicable environmental, health and safety laws and regulations; weather- and climate-related risks; environmental risks and litigation results; FCX’s ability to comply with its responsible production commitments under specific frameworks and any changes to such frameworks; and other factors described in more detail under the heading “Risk Factors” contained in Part I, Item 1A. of FCX’s Annual Report on Form 10-K for the year ended December 31, 2021, filed with the SEC.
Investors are cautioned that many of the assumptions upon which the forward-looking statements are based are likely to change after the date the forward-looking statements are made, including for example commodity prices, which FCX cannot control, and production volumes and costs or technological solutions and innovation, some aspects of which FCX may not be able to control. Further, FCX may make changes to its business plans that could affect its results. FCX and the QPs who authored this TRS caution investors that FCX undertakes no obligation to update any forward-looking statements, which speak only as of the date made, notwithstanding any changes in the assumptions, changes in business plans, actual experience, or other changes.
This TRS also contains financial measures such as site cash costs and unit net cash costs per pound of metal and free cash flow, which are not recognized under U.S. generally accepted accounting principles.
Qualified Person Signature Page
| Mine: | Grasberg minerals district | ||||
| Effective Date: | December 31, 2021 | ||||
| Report Date: | January 31, 2022 | ||||
| /s/ Andrew Issel | |||||
| Andrzej (Andrew) H. Issel, P.Geo., RM-SME | |||||
| Director Resource Estimation and Reporting- PT-FI | |||||
| /s/ Tim Casten | |||||
| Tim Casten, P.E. | |||||
| Vice President Underground Planning | |||||
| /s/ Ari Partanen | |||||
| Ari Partanen, P.E., RM-SME | |||||
| Vice President Technical Services | |||||
 | Technical Report Summary for Grasberg minerals district, Papua, Indonesia | ||||
Table of Contents
| as of December 31, 2021 | iv | ||||
| Technical Report Summary for Grasberg minerals district, Papua, Indonesia | ||||
List of Tables
List of Figures
| as of December 31, 2021 | v | ||||
| Technical Report Summary for Grasberg minerals district, Papua, Indonesia | ||||
1EXECUTIVE SUMMARY | ||
This Technical Report Summary (TRS) is prepared by Qualified Persons (QPs) for Freeport-McMoRan Inc. (FCX), a leading international mining company with headquarters located in Phoenix, Arizona, United States (U.S.). The purpose of this TRS is to report mineral reserve and mineral resource estimates at the Grasberg minerals district using estimation parameters as of December 31, 2021.
1.1Property Description, Current Status, and Ownership
The Grasberg minerals district is a copper, gold, and silver porphyry skarn deposit located in the remote highlands of the Sudirman Mountain Range in the eastern province of Papua, Indonesia, on the western half of the island of New Guinea. The district includes the following operating underground mines: Grasberg Block Cave (GBC), Deep Mill Level Zone (DMLZ), and Big Gossan (BG). The Grasberg minerals district also includes Kucing Liar (KL), which began development in 2021. The Deep Ore Zone (DOZ) ceased production at the end of 2021 and Grasberg open-pit (GRS_OP) in 2019.
The mine operates 365 days per year on a 24 hour per day schedule. Mining and ore processing operations are currently in production and the mineral district is considered a production stage property.
PT Freeport Indonesia (PT-FI) is a limited liability company, organized under the laws of the Republic of Indonesia. PT-FI operates the mines in the Grasberg minerals district. On December 21, 2018, FCX completed the transaction with the Indonesia government regarding PT-FI’s long-term mining rights and share ownership. Following the transaction, FCX has a 48.76 percent share ownership in PT-FI and the remaining 51.24 percent share ownership is collectively held by PT Indonesia Asahan Aluminum (Persero) (PT Inalum, also known as MIND ID), an Indonesia state-owned enterprise, and PT Indonesia Papua Metal Dan Mineral (formerly known as PT Indocopper Investama), which is expected to be owned by PT Inalum and the provincial/regional government in Papua, Indonesia. The arrangements related to the transaction also provide for FCX and the other pre-transaction PT-FI shareholders to initially retain the economics of the revenue and cost sharing arrangements under the former unincorporated joint venture with Rio Tinto plc (Rio Tinto). As a result, FCX's economic interest in PT-FI is expected to approximate 81 percent through 2022 and 48.76 percent thereafter.
Since 1967, PT-FI has been the only operator of exploration and mining activities in the approximately 24,600-acre operating area under a Special Mining Business Permit “Ijin Usaha Pertambangan Khusus” (IUPK). Under the terms of the IUPK, PT-FI has been granted mining rights through 2031, with rights to extend its mining rights through 2041, subject to, among other things, PT-FI’s completion of construction of additional domestic smelting capacity totaling 2 million metric tons of concentrate per year by the end of 2023 (an extension of which has been requested due to COVID-19 mitigation measures subject to the approval of the Indonesia government), and fulfilling its defined fiscal obligations to the Indonesia government.
1.2Geology and Mineralization
The ore bodies are located within and around two main igneous intrusions: the Grasberg monzodiorite and the Ertsberg diorite. The host rocks of these ore bodies include both
| as of December 31, 2021 | 6 | ||||
| Technical Report Summary for Grasberg minerals district, Papua, Indonesia | ||||
carbonate and clastic rocks that form the ridge crests and upper flanks of the Sudirman Range and the igneous rocks of monzonitic to dioritic composition that intrude them. The igneous-hosted ore bodies (GBC, and portions of the DMLZ) occur as vein stockworks and disseminations of copper sulfides, dominated by chalcopyrite and to a lesser extent bornite. The sedimentary-rock hosted ore bodies (portions of the DMLZ, KL and all of the BG) occur as magnetite-rich, calcium/magnesian skarn replacements, whose location and orientation are strongly influenced by major faults and by the chemistry of the carbonate rocks along the margins of the intrusions.
Grasberg minerals district economic copper, gold, and silver mineralization is hosted in porphyries and skarns. The primary sulfide mineralization is chalcopyrite, with lesser bornite, chalcocite, and covellite. Gold concentrations usually occur as inclusions within the copper sulfide minerals, although in some parts of deposits gold can also be strongly associated with pyrite.
1.3Mineral Reserve Estimate
Mineral reserves are summarized from the Life-of-Mine (LOM) plan, which is the compilation of the relevant modifying factors for establishing an operational, economically viable mine plan.
Mineral reserves have been evaluated considering the modifying factors for conversion of measured and indicated resource classes into proven and probable reserves. Inferred resources are considered as waste in the LOM plan. The details of the relevant modifying factors included in the estimation of mineral reserves are discussed in Sections 10 through 21.
The LOM plan includes the planned production to be extracted from the mine designs.
As a point of reference, the mineral reserve estimate reports the ore inventories from the LOM plan containing copper, gold, and silver metal and reported as commercially recoverable metal.
Table 1.1 summarizes the mineral reserves reported on a 100 percent property ownership basis. The mineral reserve estimate is based on commodity prices of $2.50 per pound copper, $1,200 per ounce gold, and $15 per ounce silver.
| as of December 31, 2021 | 7 | ||||
| Technical Report Summary for Grasberg minerals district, Papua, Indonesia | ||||
Table 1.1 – Summary of Mineral Reserves

The mineral reserve estimate has been prepared using industry accepted practice and conforms to the disclosure requirements of the U.S. Securities and Exchange Commission (SEC) under Subpart 1300 of Regulation S-K (S-K1300). Mineral reserve and mineral resource estimates are evaluated annually, providing the opportunity to reassess the assumed conditions. All the technical and economic issues likely to influence the prospect of economic extraction are anticipated to be resolved under the stated assumed conditions.
1.4Mineral Resource Estimate
Mineral resources are evaluated using the application of technical and economic factors to a geologic resource block model to generate digital surfaces of mining limits, using specialized geologic and mine planning computer software. The resulting surfaces volumetrically identify material as potentially economical, using the assumed parameters. Mineral resources are the resultant contained metal inventories.
The mineral resource estimate is the inventory of material identified as having a reasonable likelihood for economic extraction inside the mineral resource economic mining limit, less the mineral reserve volume, as applicable. The modifying factors are applied to measured, indicated, and inferred resource classifications to evaluate commercially recoverable metal. As a point of reference, the in-situ ore containing copper, gold, and silver metal are inventoried and reported by ore body.
The reported mineral resource estimate in Table 1.2 is exclusive of the reported mineral reserve, on a 100 percent property ownership basis. The mineral resource estimate is based on commodity prices of $3.00 per pound copper, $1,200 per ounce gold, and $20 per ounce silver.
| as of December 31, 2021 | 8 | ||||
| Technical Report Summary for Grasberg minerals district, Papua, Indonesia | ||||
Table 1.2 – Summary of Mineral Resources

| as of December 31, 2021 | 9 | ||||
| Technical Report Summary for Grasberg minerals district, Papua, Indonesia | ||||
The mineral resource estimate has been prepared using industry accepted practice and conforms to the disclosure requirements of S-K1300. Mineral reserve and mineral resource estimates are evaluated annually providing the opportunity to reassess the assumed conditions. Although all the technical and economic issues likely to influence the prospect of economic extraction of the resource are anticipated to be resolved under the stated assumed conditions, no assurance can be given that the estimated mineral resource will become proven and probable mineral reserves.
1.5Capital and Operating Cost Estimates
The capital and operating costs are estimated by the property’s operations, engineering, management, and accounting personnel in consultation with FCX corporate staff, as appropriate. The cost estimates are applicable to the planned production, mine schedule, and equipment requirements for the LOM plan. The capital costs are summarized in Table 1.3.
Table 1.3 – Capital Costs
| $ billions | |||||
| Mine | $7.5 | ||||
| Concentrator | 3.9 | ||||
| Supporting Infrastructure | 2.3 | ||||
| Total Capital Expenditures | $13.7 | ||||
Capital costs include development and sustaining projects for the production of the scheduled reserves. Capital cost estimates are derived from current capital costs based on extensive experience gained from many years of operating the property and do not include inflation. FCX and the PT-FI mine staff review actual costs periodically and refine cost estimates as appropriate.
The operating costs for the LOM plan are summarized in Table 1.4.
Table 1.4 – Operating Costs
| $ billions | |||||
| Mine | $15.9 | ||||
| Processing | 13.5 | ||||
| Balance | 12.4 | ||||
| Total site cash operating costs | 41.9 | ||||
| Freight | 2.2 | ||||
| Treatment charges | 9.4 | ||||
| Royalties & export duties | 4.8 | ||||
| By-product credits ($1,200 Au price) | (33.9) | ||||
| Total net cash costs | $24.4 | ||||
| Unit net cash cost at $1,200 Au price ($ per pound of copper) | $0.76 | ||||
| Unit net cash cost at $1,800 Au price ($ per pound of copper) | $0.29 | ||||
The operating cost estimates are derived from current operating costs and practices based on extensive experience gained from many years of operating the property and do not include inflation.
| as of December 31, 2021 | 10 | ||||
| Technical Report Summary for Grasberg minerals district, Papua, Indonesia | ||||
1.6Permitting Requirements
In the QP’s opinion, the Grasberg minerals district has adequate plans and programs in place, is in good standing with Indonesian environmental regulatory authorities, and no current conditions represent a material risk to continued operations. The Grasberg minerals district staff has a high level of understanding of the requirements of environmental compliance, permitting, and local stakeholders in order to facilitate the development of the mineral reserve and mineral resource estimates. The periodic inspections by governmental agencies, FCX corporate staff, third-party reviews, and regular reporting confirm this understanding.
In 2020, PT-FI initiated a new environmental impact analysis Analisis Mengenai Dampak Lingkungan (AMDAL) in preparation for the proposed extension of the east and west levees to maintain the tailings within the Modified Ajkwa Deposition Area (ModADA) deposition area. PT-FI continues to work with the Indonesian Ministry of Environment and Forestry (MoEF) to address full approval of the Environmental and Social Impact Assessment (ESIA), which is currently estimated to be received in 2022. PT-FI is currently undergoing regulatory review of technical approvals, the next stage of the overall permitting process.
1.7Conclusions and Recommendations
FCX and the QPs believe that the geologic interpretation and modeling of exploration data, economic analysis, mine design and sequencing, process scheduling, and operating and capital cost estimation have been developed using accepted industry practices and that the stated mineral reserves and mineral resources comply with SEC regulations. Periodic reviews by third-party consultants confirm these conclusions.
No recommendations for additional work are identified for the reported mineral reserves and mineral resources as of December 31, 2021.
2INTRODUCTION | ||
This TRS is prepared by QPs for FCX, a leading international mining company with headquarters located in Phoenix, Arizona, U.S. The purpose of this TRS is to report mineral reserve and mineral resource estimates at the Grasberg minerals district using estimation parameters as of December 31, 2021.
2.1Terms of Reference and Sources of Information
FCX owns and operates several affiliates or subsidiaries. This TRS uses the name “FCX” interchangeably for Freeport-McMoRan Inc. and its consolidated subsidiaries.
FCX operates large, long-lived, geographically diverse assets with significant proven and probable reserves of copper, gold, and molybdenum. FCX has a dynamic portfolio of operating, expansion, and growth projects in the copper industry and is the world’s largest producer of molybdenum.
FCX maintains standards, procedures, and controls in support of estimating mineral reserves and mineral resources. The QPs annually review the estimates of mineral reserves, mineral resources, supporting documentation, and compliance to internal
| as of December 31, 2021 | 11 | ||||
| Technical Report Summary for Grasberg minerals district, Papua, Indonesia | ||||
controls. Based on their review, the QPs recommend approval of the mineral reserve and mineral resource statements to FCX senior management.
The reported estimates and supporting background information, conclusions, and opinions contained herein are based on company reports, property data, public information, and assumptions supplied by FCX employees and other third-party sources including the reports and documents listed in Section 24 of this TRS, available at the time of writing this TRS.
Unless otherwise stated, all figures and images were prepared by FCX. Units of measurement referenced in this TRS are based on local convention in use at the property and currency is expressed in U.S. dollars.
The effective date of this TRS is December 31, 2021. FCX has previously reported mineral reserves and mineralized material for the Grasberg minerals district but has not filed a TRS with the SEC.
The estimates in this TRS supersede any previous estimates of mineral reserves and mineral resources for the Grasberg minerals district.
Mineral reserves and mineral resources are reported in accordance with the requirements of S-K1300.
2.2Qualified Persons
This TRS has been prepared by the following QPs:
•Andrzej (Andrew) H. Issel, Director Resource Estimation and Reporting - PT-FI
•Timothy Casten, Vice President Underground Planning
•Ari Partanen, Vice President Technical Services
Andrew Issel is employed by FCX and has visited the site regularly, at various times throughout his career. He is a Registered Member of the Society of Mining, Metallurgy and Exploration (RM-SME) and a Professional Geoscientist (P.Geo.) of the Association of Professional Geoscientists of Ontario, Canada. He has numerous years of direct and supervisory experience in mineral resource estimation and reserve reporting, geology evaluation, exploration, and ore body modelling. His experience includes: 16 years - porphyry copper and gold deposits in Papua, Indonesia; 4 years Carlin type gold deposits in Nevada; 8 years - Abitibi type gold deposits in Canada; 4 years - iron ore in South Africa; and 1 year coal in South Africa. He has a master’s degree from the Faculty of Natural Sciences in the field of Geology from Wroclaw University in Poland. In his role as Director Resource Estimation and Reporting - PT-FI, he provides expert technical support for the geologic effort in Papua, Indonesia, with a focus on characterization, evaluation, and quantification of mineral deposits and other ore body attributes. He has a leading role and responsibility for resource estimation and reserve reporting. His most recent visit to PT-FI was in November 2019.
Tim Casten is employed by FCX and worked at the site in Papua, Indonesia from 1997 to 2002 in a variety of roles. Mr. Casten has a bachelor’s degree in mining engineering from the Camborne School of Mines, UK and a Master of Science degree in Mining Engineering from the Mackay School of Mines, University of Nevada-Reno, U.S. He is a registered Professional Engineer (P.E.) in Mining in the State of Arizona and a member
| as of December 31, 2021 | 12 | ||||
| Technical Report Summary for Grasberg minerals district, Papua, Indonesia | ||||
of the Society of Mining, Metallurgy and Exploration. He has worked in the mining industry for over 30 years, primarily in metalliferous underground operations. Since 2002, he has managed a team of engineers and technicians who support the PT-FI underground operations. His team has responsibility for mine planning, mine design, feasibility level studies, and underground reserves. Since 2002, he has been based in the FCX corporate office. Mr. Casten regularly visits the site with his most recent visit to PT-FI in December 2019.
Ari Partanen is employed by FCX and has visited the site regularly, at various times throughout his career. He is a RM-SME and a member of Engineers Australia with chartered P.E. status. He has a doctoral degree from the Australian National University in Systems Engineering, a Bachelor of Engineering degree in Electrical and Electronic Engineering from James Cook University of North Queensland, and a Graduate Certificate in Mineral Economics from Curtin University of Technology in Western Australia. He has worked in the mining industry for over 30 years primarily with processing of copper-gold, copper-cobalt, and iron ore deposits. He has worked at Grasberg minerals district in Papua, Indonesia from 2000 to 2004 in a variety of roles in the concentrator area. Since 2008, he has been based in the FCX corporate office leading a team of metallurgists who support the PT-FI oreflow, concentrator, and dewatering plant operations. His team collaborates with the site personnel on operational improvements. He also has responsibility for strategic metallurgy, including metallurgical ore characterization of future ores, process design of future facilities and mill forecasting, including metal recoveries and concentrate grades for reserve reporting. His most recent visit to PT-FI was in February 2020.
The QPs reviewed the reasonableness of the background information for the estimates. The details of the QPs’ responsibilities for this TRS are outlined in Table 2.1.
Table 2.1 – Qualified Person Responsibility
| Qualified Person | Responsibility | ||||
| Andrew Issel | Sections 2 through 9, 11, 17, 21 through 26, and corresponding sections of the Executive Summary | ||||
| Tim Casten | Sections 2, 12, 13, 15, 16, 18 through 26, and corresponding sections of the Executive Summary | ||||
| Ari Partanen | Sections 2, 10, 14, 21 through 26, and corresponding sections of the Executive Summary | ||||
3PROPERTY DESCRIPTION AND LOCATION | ||
The Grasberg minerals district is a copper, gold, and silver porphyry skarn deposit located in the remote highlands of the Sudirman Mountain Range in the eastern province of Papua, Indonesia, on the western half of the island of New Guinea. The district includes the following operating underground mines: GBC, DMLZ, and BG. The Grasberg minerals district also includes Kucing Liar (KL), which began development in 2021. The Deep Ore Zone (DOZ) ceased production at the end of 2021 and Grasberg open-pit (GRS_OP) in 2019.
| as of December 31, 2021 | 13 | ||||
| Technical Report Summary for Grasberg minerals district, Papua, Indonesia | ||||
The mine operates 365 days per year on a 24 hour per day schedule. Mining and ore processing operations are currently in production and the mineral district is considered a production stage property.
3.1Property Location
The property location map is illustrated in Figure 3.1.
Figure 3.1 – Property Location Map

The property is located at latitude 4.08 degrees south and longitude 137.12 degrees east using the World Geodetic System 84 coordinate system.
3.2Ownership
PT-FI is a limited liability company, organized under the laws of the Republic of Indonesia. PT-FI operates the mines in the Grasberg minerals district. On December 21, 2018, FCX completed a transaction with the Indonesia government regarding PT-FI’s long-term mining rights and share ownership. Following the transaction, FCX has a 48.76 percent share ownership in PT-FI and the remaining 51.24 percent share ownership is collectively held by PT Inalum, an Indonesia state-owned enterprise, and PT Indonesia Papua Metal Dan Mineral (formerly known as PT Indocopper Investama), which is expected to be owned by PT Inalum and the provincial/regional government in Papua, Indonesia. The arrangements related to the transaction also provide for FCX and the other pre-transaction PT-FI shareholders to initially retain the economics of the
| as of December 31, 2021 | 14 | ||||
| Technical Report Summary for Grasberg minerals district, Papua, Indonesia | ||||
revenue and cost sharing arrangements under the former unincorporated joint venture with Rio Tinto plc (Rio Tinto). As a result, FCX's economic interest in PT-FI is expected to approximate 81 percent through 2022 and 48.76 percent thereafter.
3.3Land Tenure
Since 1967, PT-FI has been the only operator of exploration and mining activities in the approximately 24,600-acre operating area under the IUPK. Figure 3.2 shows a map of the land claim status.
| as of December 31, 2021 | 15 | ||||
| Technical Report Summary for Grasberg minerals district, Papua, Indonesia | ||||
Figure 3.2 – Map of the IUPK Project Area

| as of December 31, 2021 | 16 | ||||
| Technical Report Summary for Grasberg minerals district, Papua, Indonesia | ||||
3.4Mineral Rights and Significant Permitting
The Indonesian government granted PT-FI an IUPK replacing its former Contract of Work (COW) with the Government of Indonesia (GOI) enabling PT-FI to conduct operations in the Grasberg minerals district through 2041. Under the terms of the IUPK, PT-FI has been granted an extension of mining rights through 2031, with rights to extend its mining rights through 2041, subject to, among other things, PT-FI completing the construction of additional domestic smelting capacity in Indonesia (the schedule for which is under discussion) and fulfilling its defined fiscal obligations to the Indonesia government. The IUPK, and related documentation, contains legal and fiscal terms and is legally enforceable through 2041. The IUPK may not be extended through 2041 if PT-FI fails to abide by the terms and conditions of the IUPK and applicable laws and regulations.
In connection with PT-FI’s 2018 agreement with the Indonesia government to secure the extension of its long-term mining rights, PT-FI committed to construct additional domestic smelting capacity totaling 2 million metric tons of concentrate per year by the end of 2023 (an extension of which has been requested due to COVID-19 mitigation measures subject to approval of the Indonesia government). During 2020, PT-FI notified the Indonesia government of schedule delays resulting from the COVID-19 pandemic and continues to review with the government a revised schedule for satisfying its commitment.
The IUPK also requires PT-FI to pay duties on concentrate exports of 5 percent, declining to 2.5 percent when development progress for additional smelting capacity in Indonesia exceeds 30 percent, and eliminated when development progress for additional smelting capacity in Indonesia exceeds 50 percent.
The Indonesian government regulations address the export of unrefined metals including copper concentrate and anode slimes and other matters related to the mining sector. PT-FI’s export license for copper concentrate is valid for 1-year periods, subject to review and approval by the Indonesian government every 6 months, depending on greenfield smelter construction progress.
In March 2021, PT-FI received a 1-year extension of its concentrate export license through March 15, 2022. Regulations include a permit to export anode slimes which is necessary for PT Smelting (PT-FI’s 39.5-percent-owned copper smelter and refinery located in Gresik, Indonesia) to continue operating. PT Smelting’s export license for anode slimes expires on December 9, 2022.
3.5Comment on Factors and Risks Affecting Access, Title, and Ability to Perform Work
FCX and PT-FI believe all major permits and approvals are in place to support operations at the Grasberg minerals district. Based on the LOM plan, additional permits will become necessary in the future for river diversion out of the tailings management area as discussed in Section 17. Such processes to obtain these permits and the associated timelines are understood and similar permits have been granted in the past. FCX and PT-FI have environmental, land, water, and permitting departments that monitor and review all aspects of property ownership and permit requirements so that they are maintained in good standing and any issues are addressed in a timely manner.
| as of December 31, 2021 | 17 | ||||
| Technical Report Summary for Grasberg minerals district, Papua, Indonesia | ||||
The mineral district has a partially unionized workforce and has been subject to various lawsuits and work stoppages over the operating history of the mine. FCX and PT-FI understand the importance of the workforce and work in good faith to resolve conflicts.
As of December 31, 2021, FCX and PT-FI believe the mine’s access, payments for titles and rights to the mineral claims, and ability to perform work on the property are all in good standing. Further, to the extent known to the QPs, there are no significant encumbrances, factors, or risks that may affect the ability to perform work in support of the estimates of mineral reserves and mineral resources.
4ACCESSIBILITY, CLIMATE, PHYSIOGRAPHY, LOCAL RESOURCES, AND INFRASTRUCTURE | ||
PT-FI is located at 4 degrees south latitude in Papua, Indonesia and covers a range of environmental and physiographic zones.
4.1Accessibility
The PT-FI project area lies within the highlands of the Jayawijaya Mountain Range. Access to the project area is from either the portsite in Amamapare on the Tipeoka River or the international airport in Timika approximately 43 kilometers north of the portsite. An all-weather gravel access road connects the portsite to the site and it is the primary access point for people and materials to enter the operations area. The access road spans from the portsite to the mill site while passing the city of Timika, the PT-FI town of Kuala Kencana, and the PT-FI town of Tembagapura in the Mimika Regency. The mill site is at milepost (MP) 74. A bus service is provided for transporting workers. Helicopters service day-to-day operations. Planes out of Timika are operated by a privatized partner and commercial flights provide routine transportation to and from Jakarta and other Indonesia cities.
4.2Climate
The climate in the project area can be categorized as a tropical monsoon climate; however, climate conditions are highly variable due to changes in elevation. In general, the lowland and coastal areas exhibit a hot, wet, and humid climate, whereas the highlands have a wet, moderate to cool climate.
Annual rainfall ranges from less than 300 centimeters in the highest elevations to 500 centimeters in Tembagapura. Temperatures at the portsite are warm with a range from 19 to 38 degrees Celsius. Temperatures at the mine site are cool with a range from minus 2 degrees Celsius to 22 degrees Celsius. It is typical for part of the project area to be under cloud cover daily.
4.3Physiography
The terrain between the southern portsite in the lowlands to the northward mining area ranges from mangrove swamp and jungle to extremely rugged mountains. The main PT-FI town of Tembagapura is in a temperate mountain valley at an elevation of roughly 1,900 meters.
The deposits are located approximately 96 kilometers north from the coast among elevations ranging between 2,900 to 4,200 meters above sea level.
| as of December 31, 2021 | 18 | ||||
| Technical Report Summary for Grasberg minerals district, Papua, Indonesia | ||||
4.4Local Resources and Infrastructure
Infrastructure is in place to support mining operations. Section 15 contains additional detail regarding site infrastructure.
The mine maintains company-owned townsites at the operation. The primary accommodations for project workers are in Tembagapura, its suburbs Hidden Valley and Ridge Camp in the highlands and Kuala Kencana in the lowlands. Tembagapura houses many of the workers and management associated with mining and processing operations. North of Tembagapura, Ridge Camp is another on-site major housing facility for the mine along with office buildings, remote control mining and maintenance facilities. Ridge Camp is the primary access point to the underground ore bodies.
Supplies are delivered by truck up the main access road to storage facilities across the operations. PT-FI has sole control of ships to transport fuel, supplies, and general cargo to the project area. PT-FI maintains purchasing offices in Jakarta and Surabaya in Indonesia and in Australia, Singapore, and the U.S.
Water sources for the project are a combination of naturally occurring mountain streams and water derived from our underground operations. FCX and PT-FI believe it has sufficient water resources to support current and future operations.
PT-FI is currently powered by an on-site coal-fired power plant, with installed capacity of 198MW, built in 1998. Diesel generators, installed starting on the 1970s through the1990s, with an installed capacity of 130MW, currently supply peaking and backup electrical power generating capacity. To support the additional energy requirements as result of the ramp-up of the underground mines, PT-FI is constructing a new 129MW dual-fuel power plant (DFPP) at the portsite to provide an additional 129MW of firm capacity to support the increased power requirements as the underground mine ramp-up. The DFPP is designed using high-efficiency dual fuel reciprocating engines on a flexible platform that can operate on either diesel fuel or natural gas, providing PT-FI future optionality to adjust the fuel type and increase plant capacity.
Site operations are adequately staffed with experienced operational, technical, and administrative personnel. FCX and PT-FI believe all necessary supplies are available as needed.
5HISTORY | ||
The Grasberg minerals district hosts two copper-gold-silver rich porphyry and skarn hosted systems.
The Ertsberg/Gunung Bijih (GB) “Ore Mountain” ore body was exposed at surface and mapped by the Colijn Expedition in 1936. GB was rediscovered many years later in 1960 by the Freeport Sulfur Company. In 1967, PT-FI entered into an initial 30-year COW with the GOI to mine the GB ore body. PT-FI drilled the GB in the late 1960s and mined it in the 1970s using open-pit techniques.
Following the GB finding was the discovery of the Gunung Bijih Timur (GBT) “Ore Mountain East” ore body 1 kilometer east of the GB open-pit. GBT was discovered by geologists mapping outcrops in the early 1970s during the evaluation of the GB. Exploration drilling in 1975 showed the potential for GBT and it was mined as a block
| as of December 31, 2021 | 19 | ||||
| Technical Report Summary for Grasberg minerals district, Papua, Indonesia | ||||
cave from 1981 to 1994. GBT was the beginning of the upper portion of the Ertsberg East Skarn System (EESS), starting block cave operations in 1981. GBT open-pit was part of the GBT discovery but the GBT block cave was prioritized, and the open-pit portion was moved to resource classification.
The Dom ore body was discovered by geologists mapping outcrops in the early 1970s during the evaluation of the GB. Exploration drilling for Dom occurred from 1976 to 1977. Extensive drilling continued in the mid-1980s showing Dom has both open-pit and block cave potential. The geomechanical studies of rolling rock and slope stability issues related to mining of the Dom identified unacceptable levels of risk to mill Amole Ridge facilities below. In 2007, Dom was moved in the schedule to post-KL mining and reported as a mineral resource.
Discovery of the Intermediate Ore Zone (IOZ) was followed by DOZ situated beneath in the late 1970s. DOZ began mining as an open stope mine in 1989 and was converted to block caving techniques in 2000 and was depleted by the end of 2021.
The Grasberg deposit was discovered in 1988. The size and geology of the ore body allowed for open-pit mining from 1990 to 2019 and subsequent block cave mining beginning in 2019.
Since 1990, additional ore bodies have been discovered and delineated, namely DMLZ, BG, and KL. BG is located on the southwest side of the Ertsberg Diorite and started mining with open stope techniques in 2014. DMLZ is the lowest portion of the EESS deposit and has been mined as a block cave since 2015. KL was discovered southwest of the Grasberg deposit and started development in 2021.
The Grasberg minerals district is a well-developed property currently in operation and all previous exploration and development work has been incorporated where appropriate in the access and operation of the property. Exploration or development work is included in the data described in Sections 6 through 11 of this TRS.
6GEOLOGICAL SETTING, MINERALIZATION, AND DEPOSIT | ||
6.1Regional Geology
The Grasberg minerals district lies adjacent to the boundary of the Australian and Indo-Pacific plates as shown in Figure 6.1. The geology of the region relates to the collisional delamination tectonics when the Australian and Indo-Pacific mega plates collided along the Derewo zone, located approximately 35 kilometers north of the Grasberg minerals district. This impact caused the continental plate break-off, folded the Jayawijaya mountain range and upwelled magma into the Grasberg minerals district. The ascension of magma from the upper mantle and differentiation into a calc-alkaline type of intrusion triggered copper and gold mineralization.
| as of December 31, 2021 | 20 | ||||
| Technical Report Summary for Grasberg minerals district, Papua, Indonesia | ||||
Figure 6.1 – Tectonic Map in Relation to Grasberg Minerals District

6.2Deposit Geology
The Grasberg minerals district is situated on the crest of the Jayawijaya mountain range at elevations over 2,000 meters with the highest peak, Puncak Mandala at 4,760 meters. Ore deposits in the Grasberg minerals district have economic copper, gold, and silver mineralization in porphyries and skarns. The primary sulfide mineralization is chalcopyrite, with lesser bornite, chalcocite, and covellite. Gold concentrations usually occur as inclusions within the copper sulfide minerals although in some parts of deposits gold can also be strongly associated with pyrite. The district geology map is shown in Figure 6.2.
| as of December 31, 2021 | 21 | ||||
| Technical Report Summary for Grasberg minerals district, Papua, Indonesia | ||||
Figure 6.2 – Grasberg Minerals District Geologic Map (Plan View)

Figure 6.3 and Figure 6.4 provide a location reference for the stratigraphy, intrusions, and mineralized deposits.
| as of December 31, 2021 | 22 | ||||
| Technical Report Summary for Grasberg minerals district, Papua, Indonesia | ||||
Figure 6.3 – Grasberg Minerals District Geologic Map and Cross Section

Figure 6.4 – EESS Geologic Cross Section

| as of December 31, 2021 | 23 | ||||
| Technical Report Summary for Grasberg minerals district, Papua, Indonesia | ||||
There are five major ore bodies in the district, all occurring within the center of the Grasberg minerals district:
•Grasberg Intrusive Complex (GIC) includes the GBC and the depleted GRS_OP.
•EESS includes DMLZ and depleted GBT, IOZ, DOZ.
•BG.
•KL (development stage mineral reserve).
•Dom (classified as mineral resource).
The ore bodies are located within and around two main igneous intrusions: the Grasberg monzodiorite and the Ertsberg diorite. The host rocks of these ore bodies include both carbonate and clastic rocks that form the ridge crests and upper flanks of the Sudirman Range and the igneous rocks of monzonitic to dioritic composition that intrude them. The igneous-hosted ore bodies (GBC and portions of the DMLZ) occur as vein stockworks and disseminations of copper sulfides, dominated by chalcopyrite and to a lesser extent bornite. The sedimentary-rock hosted ore bodies (portions of the DMLZ, KL and all of the BG) occur as magnetite-rich, calcium/magnesian skarn replacements, whose location and orientation are strongly influenced by major faults and by the chemistry of the carbonate rocks along the margins of the intrusions.
6.2.1Structural Geology
The compressional regime played a fundamental role in the structural geometry of the Grasberg minerals district. The collision of Australian and Pacific plates that occurred approximately 8 million years ago caused folding and uplift in the central range of the Jayawijaya Mountains causing rock units to shorten, forming the west-northwest by east-southeast oriented syncline/anticline systems including the Yellow Valley Syncline (YVS) with peaks up to 5,000 meters. The movement of west-northwest trending left lateral faults paired with the northeast striking faults formed pull-apart structures that facilitated magma emplacement.
Ductile and brittle deformation contributed to folding reverse-thrust faults and bedding slip faults in the district. The reverse fault structures occur parallel to the regional fold trend, some with kilometer-scale offsets followed with later strike-slip left-lateral movement. These regional west-northwest by east-southeast structures are cut in places by northeast-southwest trending strike-slip faults which have left-lateral offsets ranging from a few meters to more rarely a few hundred meters.
Chemically reactive sedimentary host rocks combined with pre-conditioned structural zones, enabled fluid to pass through and minerals to precipitate within. The combination of the magma chemical composition, the magma cupola forcing its way to the surface and the reactivation of structures which hydrofractured surrounding rocks, subsequently formed stock-work veined, porphyry copper and gold ore bodies. The GIC was emplaced in the pull-apart basin generated by the Riedel system of west-northwest by east-southeast striking faults and the northeast-southwest trending Grasberg Fault movements that occurred within the YVS axis. The Ertsberg intrusive complex was emplaced along the opening of west-northwest by east-southeast faults.
| as of December 31, 2021 | 24 | ||||
| Technical Report Summary for Grasberg minerals district, Papua, Indonesia | ||||
6.2.2Rock Types
The sedimentary rock units of the Grasberg minerals district are classified into the two main groups of formations from oldest to youngest as described below and shown in Figure 6.5:
Kembelangan Group is approximately 3,400 meters thick, consists largely of siliciclastic rocks, and is divided into four formations:
•Middle to Upper Jurassic Kopai.
•Upper Jurassic to Lower Cretaceous Woniwogi.
•Lower to Middle Cretaceous Piniya.
•Upper Cretaceous Ekmai.
New Guinea Limestone Group is approximately 1,700 meters thick, is carbonate-dominated, and divided into four formations:
•Paleocene Waripi.
•Eocene Faumai.
•Oligocene Sirga.
•Upper Oligocene to Middle Miocene Kais.
| as of December 31, 2021 | 25 | ||||
| Technical Report Summary for Grasberg minerals district, Papua, Indonesia | ||||
Figure 6.5 – Stratigraphy of Grasberg Minerals District

| as of December 31, 2021 | 26 | ||||
| Technical Report Summary for Grasberg minerals district, Papua, Indonesia | ||||
The northern and central portions of the district are dominated by the 1.7 kilometer thick, largely carbonate rocks of the Lower to Middle Cenozoic New Guinea Limestone Group. Kais is the uppermost part of the New Guinea Limestone Group and is a 1.2 kilometer thick fossiliferous limestone. The Kais limestone is underlain by the 30-meters-thick quartz-carbonate sandstone of the Sirga formation, a district stratigraphic marker. Below the Sirga formation is the 150-meters-thick, massive-bedded, clean limestone of the Faumai formation. The lowermost New Guinea Limestone Group and Cenozoic unit is the Waripi formation, a 300-meters-thick anhydrite nodule-bearing dolomitic limestone, containing thin but laterally continuous quartz sandstone beds. All New Guinea Limestone Group carbonate formations can host high-grade copper and gold skarn mineralization, but the most susceptible unit is the lower part of the Waripi formation.
The New Guinea Limestone Group is underlain by predominantly siliciclastic rocks of the Cretaceous-Jurassic Kembelangan Group, the upper part of which comprises the Ekmai formation, which has three members. In increasing age, these are the 3 to 5-meters-thick Ekmai shale, the 100-meters-thick Ekmai Limestone (a calcareous mudstone), and the 600-meters-thick Ekmai sandstone. The shale member forms an important marker horizon which contains hornfels within the district and is seldom mineralized, even where units above and below have high-grade copper and gold skarn. The Ekmai limestone is altered to skarn and hornfels. The Ekmai sandstone is arkosic in nature. Both units commonly host disseminated to fracture-controlled, ore-grade mineralization where they underlie the larger skarn ore bodies.
There are two main intrusive bodies in the district: the GIC and the Ertsberg diorite.
The GIC is comprised of three major and several subordinate, distinct igneous phases. The Main Grasberg Intrusive (MGI) monzodiorite stock intruded through the center of the early formed dioritic fragmental rocks of the Dalam diatreme. Volcanic pyroclastic and flow-dome rocks of Dalam age outcrop and covered much of the pre-mining surface of the GIC. An erosional window in the south-central portion of the deposit exposed MGI-related quartz stockwork hosted copper and gold mineralization at the surface. The late stage intrusion of the South Kali dykes (monzonites), truncated the ore body and signaled the close of the igneous system. These dykes are post-mineralization and are structurally controlled, tabular units which intrude the complex from a separate stock southeast of the GIC.
All intrusions in the Ertsberg District are potassium rich, alkalic intrusions. These rocks are classified as monzodiorites, quartz monzodiorites, monzonites, trachyandesites, and trachydacites. The location, size, and shape of the intrusions in the district varies with time. Older intrusions (4 to 5 million years old) such as the South Wanagon Suite and the Utikinogon Suite are small sills, ranging from meters to hundreds of square meters in area, on the south side of the district. Intermediate intrusions (3 to 4 million years old) such as the Kay, Idenberg, and Lembah Tembaga stocks are “plug-like” in shape and measure hundreds of square meters in area. The younger intrusions (2.6 to 3.5 million years old) like Grasberg and Ertsberg are large composite intrusions or stocks (kilometer scale) and occur further to the north.
6.2.3Alteration and Mineralization
Mineralization occurred in a short timeframe between 2.5 to 3.5 million years, shortly after the emplacement of the metal-laden associated igneous rocks. All the porphyry and skarn copper ore bodies in the area contain gold and silver as additional metals. The
| as of December 31, 2021 | 27 | ||||
| Technical Report Summary for Grasberg minerals district, Papua, Indonesia | ||||
structurally controlled porphyry systems in the district are derived from potassium-rich magmas, dioritic to monzonitic in composition. Exoskarn and associated mineralization is mainly present in the New Guinea Limestone Group rocks, particularly within the dolomite of the Waripi formation, but also within the Cretaceous Ekmai limestone and sandstone.
The bulk of the mineralization in the district occurs within potassic-altered intrusive rocks or within prograde skarn assemblages. Chalcopyrite is the dominant ore mineral in all ore bodies. Bornite prevalence increases with depth in both the Grasberg porphyry and the Ertsberg skarns, but rarely dominates. Covellite is a common constituent in phyllic-altered (sericite-pyrite) zones. It is the dominant copper-bearing mineral in distal portions of KL and is common in the very local, argillic alteration zones at Grasberg and KL, along with other high sulfidation state sulfides. Supergene chalcocite was a minor constituent of the low-grade Grasberg ores to as much as 300 meters below original topography within the highly permeable, anhydrite-depleted “poker chip” zone. Oxide copper minerals are insignificant in all ore bodies, except for Dom where malachite and chrysocolla are abundant.
In the EESS, approximately 80 percent of gold in the prograde skarn and potassic alteration-hosted ores in the deposits occurs as free inclusions in chalcopyrite, bornite, and digenite; the remainder occurs in pyrite and silicate gangue minerals. In zones with intense phyllic and/or advanced argillic alteration, early formed, gold bearing chalcopyrite is converted to covellite with pyrite and gold is taken up in the pyrite lattice. This is especially the case in the highly altered ores in parts of KL and at the deeper margins of the Grasberg deposit. Gold is typically fine grained and not visible. Silver appears to be contained largely within the crystal lattice of the copper-bearing sulfides.
Lead (as galena), zinc (as sphalerite), and arsenic (as arsenopyrite and enargite) generally occur in low concentrations and limited locations. These accessory sulfide minerals are most common at margins of mineralization (BG and KL) and in distal fault-fracture systems, commonly accompanied by anomalous gold values and generally in areas of elevated pyrite and/or pyrrhotite. Pyrite (and lesser pyrrhotite) is relatively uncommon in the potassic alteration and prograde skarn-hosted ores, but can reach high concentrations in the lower grade phyllic and retrograde skarn alteration zones at ore body margins, such as the Heavy Sulfide Zone at GBC, KL, and on margins of DMLZ and BG. Thermal metamorphism of the carbonate rocks is evident in the occurrence of marble aureoles around all the intrusions in the district. Marbleization extends outward from the contact between 50 and 1,000 meters. The inner boundary is commonly sharp, beginning at either the igneous/sedimentary rock contact or at the skarn front. The shale member of the Ekmai formation tends to alter to hornfels outward from the igneous contacts (Leys et al., 2012).
7EXPLORATION | ||
The exploration history at the Grasberg minerals district is extensive, starting in the late 1960s and continuing through today. The data, methods, and historical activities presented in this section document actions that led to the initial and continued development of the mine, but are not intended to convey any discussion or disclosure of a new, material exploration target as defined by S-K1300.
The Grasberg minerals district hosts two copper-gold-silver rich porphyry and skarn hosted systems. Using a non-economic cutoff grade of 0.1 percent copper, the
| as of December 31, 2021 | 28 | ||||
| Technical Report Summary for Grasberg minerals district, Papua, Indonesia | ||||
Grasberg-related system contains approximately 7.5 billion metric tons grading on average 0.70 percent copper and 0.64 parts per million gold in two main deposits, the Grasberg porphyry system, and the KL skarn. The Ertsberg-related system contains roughly 3.6 billion metric tons grading on average 0.60 percent copper and 0.44 parts per million gold (Leys et al., 2012).
Exploration potential exists below mineral reserves as extensions of current mineralization trend. Current operation of the Grasberg minerals district includes routine drilling programs focusing on delineation of deposits, hydrology, metallurgy, and geomechanical programs.
Major exploration summary:
•GRS_OP (Depleted) – Exploration began in 1988. The Grasberg and Kucing Liar (GRSKL) model contains 5,265 drill holes with 1,943 assayed holes containing 95,655 samples totaling 324,290 meters within the final pit. The average drill hole spacing was less than 50 meters in the late LOM. Currently, there are no drilling activities in the open-pit. The GRS_OP produced over 27 billion pounds of copper and 46 million ounces of gold in the 30-year period from 1990 through 2019.
•GBC – Exploration began in 1996. The GRSKL model contains 5,265 drill holes with 838 assayed holes containing 61,844 samples totaling 184,668 meters within the GBC reserve. The average drill hole spacing is 49 meters within the reserve. Current drilling includes infill, dewatering, and geomechanical drill programs.
•DMLZ – Exploration began in 2003. The EESS model contains 5,360 drill holes with 1,278 assayed holes containing 76,717 samples totaling 170,338 meters within the DMLZ reserve. The average drill hole spacing is within the reserve is 54 meters. Current drilling activities include: infill delineation, hydrofracking, and dewatering holes.
•BG – Exploration began at the end of 1991. The BG model contains 1,306 drill holes with 1,017 assayed holes containing 25,542 samples totaling 70,818 meters within the 1 percent Equivalent Copper Grade (EqCu) mineralized envelope. The average drill hole spacing is 30 meters within the reserve. Current drilling includes infill programs to assist with grade control.
•DOZ – Exploration began in the late 1980s. The EESS model contains 5,360 drill holes with 979 assayed holes containing 45,728 samples totaling 111,036 meters within the DOZ reserve. The average drill hole spacing is 42 meters within the reserve. Currently, DOZ does not have any active drilling and is mined out.
•KL – Exploration began in 1994. The GRSKL model contains 5,265 drill holes with 167 assayed holes containing 10,809 samples totaling 31,482 meters within the KL reserve. The average drill hole spacing is 61 meters within the reserve. Current drilling includes infill, metallurgy, and geomechanical programs.
7.1Drilling and Sampling Methods
The majority of exploration activity in the district was drilled from underground with some historical surface core drilling. All drilling used for geologic modelling at PT-FI has utilized diamond core drilling methods since the initial development of the GB deposit.
| as of December 31, 2021 | 29 | ||||
| Technical Report Summary for Grasberg minerals district, Papua, Indonesia | ||||
Current drilling diameters are generally HQ-size diameter (63.5mm) and may reduce to NQ-size (47.6mm) for holes deeper than 600 meters. The drill hole database at PT-FI consists of a variety of drill core sizes ranging from BQ size (36.4mm) to PQ-size (85.0mm). Earlier drill programs often collared NQ holes and reduced to BQ for deeper drilling. Most of the material estimated with BQ diameter drilling has already been mined out.
The exploration programs completed at PT-FI (drilling, sampling, and logging) are appropriate and up to industry standard. Drill hole intervals are on average 3 meters but can range from 0.5 to 6 meters. Drilling sample quality and core recovery is good over the project area.
7.2Collar / Downhole Surveys
All drill hole collar locations are measured by the mine survey department and stored in the drill hole database. Downhole surveys are collected using the Reflex Gyro, which is not affected by the local magnetic field.
Historically, downhole surveys used the Acid Tube method and occasionally Sperry Sun surveys, but the highly magnetic terrain rendered this latter technique subject to inaccuracy. During the mid-1990s downhole survey methods transitioned to the more reliable Maxibor survey tool and transitioned to the currently method of Reflex Gyro. The earliest drilling programs had only collar surveys with the downhole survey projected in a straight line to the end of hole.
7.3Drill Hole Distribution
The Grasberg minerals district drill hole database ending in 2021 contains 11,698 drill holes including exploration, geological, delineation, geomechanical, and hydrological data. Assay data is available for 9,057 holes containing 793,053 copper assays, 756,568 gold assays, and 765,741 silver assays. Drilling outside of mineralized domains is reviewed on a case by case basis and are generally not assayed. Figure 7.1 is a map illustrating assayed diamond drill holes (DDH) within the IUPK project area.
| as of December 31, 2021 | 30 | ||||
| Technical Report Summary for Grasberg minerals district, Papua, Indonesia | ||||
Figure 7.1 – Assayed DDHs within Grasberg Minerals District (Plan View)

7.4Sample Quality
To maintain sample quality PT-FI has an established a Chain-of-Custody system. The database houses a reporting program used to track sample location and progress. Documentation is prepared prior to DDH core transportation from the drill rig to an intermediate handling facility where samples are subsequently loaded into secured transport containers for delivery to the centralized core handling facility in Timika. Shipment and arrival of samples is confirmed using Chain-of-Custody paperwork and a web-based confirmation system. The whole system is checked annually by a third-party reviewer.
| as of December 31, 2021 | 31 | ||||
| Technical Report Summary for Grasberg minerals district, Papua, Indonesia | ||||
7.5Sample Logging
DDH core is logged in two phases: a quick log at the drill rig and a more detailed geologic log at the core handling facility by site personnel. A quick log of majority rock type takes place by the project geologist after the driller stores the core in a box. The whole core is then transported to the centralized core logging facility where a number of tasks are completed including core photos, detailed geologic logging, geomechanical logging, density measurements, magnetic susceptibility recording, and core splitting.
The core is washed and photographed prior to logging. Point load tests are completed on selected whole core from each assay interval with the broken core being returned to the core tray prior to sampling. A whole core specimen (10 to 15 centimeters long) is selected from each sample interval for density determination and is subsequently stored as skeleton for future reference.
7.6Hydrogeology
PT-FI conducts field testing for hydrogeologic parameter determination used for groundwater modeling. Secondary permeability (mainly fractured rock and structure) is the main control on water movement. The hydrogeology monitoring program includes:
•Surface and underground piezometer monitoring of water table position and pore pressure.
•Measurements of rainfall and water flow in catchments as an indication of groundwater recharge rates from precipitation.
•Sampling for water chemistry analysis.
Data collected is analyzed and used to support groundwater movement interpretation. Rock type, alteration and structure, combined with water level measurements, flow interception during drilling, hydraulic testing using pumping, airlift or gravity drains, water sampling and recharge estimation are used for hydrogeology boundary characterization and interpretation within a conceptual hydrogeologic model. Characterization determines the ability of the hydrologic units to produce flow based upon their hydraulic properties.
Numerical models are constructed to simulate water flow using the geologic features in the conceptual model including regional faults, structure, alteration, karstification, rivers, surface water, along with past and future mining areas. Where hydraulic testing is not possible, a model calibration process for water level and flow is used to give the best estimate of hydraulic properties.
7.7Geomechanical Data
Geomechanical logging is performed at the centralized core logging facility in Timika. All DDH core is systematically and uniformly geomechanically logged and tested unless otherwise instructed. Logging procedures follow industry-standard methods agreed upon between PT-FI and its consultants. Geomechanical logging is carried out as soon as possible after drilling, taking care that the core is disturbed as little as possible. Geomechanical measurements are taken using the following methods:
•Rock Quality Designation (RQD)/Fracture Frequency – measures the fracture spacing/density on which rock mass strength partly depends, with other principal factors being fracture orientation and joint condition logging.
| as of December 31, 2021 | 32 | ||||
| Technical Report Summary for Grasberg minerals district, Papua, Indonesia | ||||
•Point Load – measurements are intended as an index test for the strength classification of rock materials. Measurements are taken at 15-meters intervals while recording failure types, structures, and vein descriptions. The selected sample must have length at least equal to the core diameter measured along the core axis.
•Televiewer – provides high-resolution oriented images of drill hole wall capturing geomechanical data including: lithology, structure, and fracture stress orientation.
In general, rock mass strength is defined spatially based on the laboratory strength testing and distributions of vein intensities. Rock strengths are determined for intact failure types (where the sample test breaks only through intact rock) and combined failure types (where the sample fails through both intact rock and structure).
7.8Comment on Exploration
In the opinion of the QP:
•The exploration programs completed at PT-FI (drilling, sampling, and logging) are appropriate for geologic resource modeling.
•The data spacing and distribution is sufficient to establish the degree of geological and grade continuity appropriate for mineral reserve and mineral resource estimation.
•The geomechanical core testing and hydrogeologic records are appropriate to support mine designs.
8SAMPLE PREPARATION, ANALYSES, AND SECURITY | ||
8.1Sampling Techniques and Sample Preparation
DDH core is collected by the core handling crew from the drill rig and taken to Kasuang Yard for transport packing by loading into secured transport containers. Core is given a modified drill hole identification number in Kasuang prior to arrival in Timika. PT-FI personnel use a dedicated core transport truck to deliver core to a facility in Timika for logging, storage, and sample preparation. The arrival of DDH’s from Kasuang to the Timika is confirmed using a dispatch system and the modified drill hole identification number is replaced with the original.
The Core Processing Facility in Timika is operated and controlled by PT-FI. The Data Administration team tracks the movement of core samples across the project site. The location of every drill hole sample and its status in the system is reported to management.
The logging geologist marks the beginning and end points for each sample interval. Sample intervals are 3 meters, although the geologist may choose a shorter interval if the geology or deposit-specific protocols indicate otherwise.
The core is split longitudinally using conventional splitters. A unique sample number is assigned to each sample and logged into the database. Half of the core is returned to the core box while the other half is bagged for shipment to PT Sucofindo Kuala Kencana (SFKK) laboratory for assays with transfer documentation.
| as of December 31, 2021 | 33 | ||||
| Technical Report Summary for Grasberg minerals district, Papua, Indonesia | ||||
The samples are transferred to the SFKK laboratory, checked in, prepared for assay, and assayed. The assay results are reported, and the PT-FI and SFKK analysis of quality assurance and quality control (QA/QC) are compared and reported.
Exploration holes are stored permanently while hydrology holes and other holes outside the reserve are stored temporarily and discarded after 6 months.
8.2Assaying Methods
Copper is initially assayed using a 0.2-gram aliquot with 3-acid digest and flame atomic absorption spectroscopy (AAS). If the initial assay is greater than 0.50 percent copper, the assay is rerun as an “ore grade” sample. Ore grade samples are a 0.5-gram sample run using the same methods as above. If the initial assay is greater than 2 percent copper, the sample is rerun by titration with a 1.0-gram aliquot.
Gold is fire assayed using a 30-gram aliquot with AAS finish unless the overlimit of plus 15 gram per metric ton is reached, in which case a gravimetric finish is used.
Reject splits are retained for future metallurgical work and for duplicate coarse reject analysis.
8.3Sampling and Assay QA/QC
PT-FI geologists provide assay instructions to the current primary laboratory, SFKK. After assaying, all pulps are returned to the core shed in Timika. Historically, the primary assay laboratory has changed over time. Laboratories are internationally and/or domestically certified as follows:
•SFKK is an external laboratory located in Kuala Kencana. The laboratory is ISO 9001:2015, ISO 17020:2012, ISO 17025:2017 and SMKS PP50:2012 certified.
•PT Geoservices-GeoAssay (GA) is an external laboratory located in Jakarta. GA is ISO 17025:2018 accredited and has a KAN LP-463-IDN certification.
•SGS-Indoassay is an external laboratory located in Jakarta. The laboratory has ISO 17025:2008 and SNI ISO/IEC certifications.
•The Mill 74 laboratory is a company-owned laboratory located in the highlands that supports production sampling and is used for production reconciliation at PT-FI. The assay results are not used in the resource modeling estimation process.
The procedures used by PT-FI and SFKK for QA/QC on core samples are as follows:
•Duplicate assays are inserted on a 1 in 10 basis completed by SFKK as a precision or repeatability check on the assay result with duplicate prepared pulps.
•Duplicate rejects are inserted on a 1 in 25 basis completed by SFKK as a precision or repeatability check on the sample pulp preparation process by re-pulping coarse rejects and submitting for assay. Coarse reject samples are also screen analyzed to confirm the size is 95 percent passing 4 millimeters.
•Standard Certified Reference Materials (CRM) are inserted on a 1 in 15 to 20 basis by PT-FI for assay by SFKK and/or the check labs. CRM values are blind to the laboratory.
| as of December 31, 2021 | 34 | ||||
| Technical Report Summary for Grasberg minerals district, Papua, Indonesia | ||||
•Blanks are inserted on a 1 per batch basis by PT-FI. The blank material is currently made up from barren limestone half core from dewatering drill holes. The purpose of blank insertions is to confirm that there is no contamination between samples due to sample preparation errors at the laboratory.
•QA/QC data is located in the drill hole database. All QA/QC check assays are examined for acceptability using QA/QC tools in the database software. Assays that meet QA/QC requirements are accepted into the database; those that did not are rejected and reruns are ordered.
SFKK maintains internal and independent QA/QC procedures in addition to the PT-FI mandated procedures above.
•Standards are also inserted by SFKK on a 1 in 20 basis as an internal laboratory control.
•Blanks are also inserted by SFKK as an internal control.
•A reagent blank is inserted into the AAS sample stream by SFKK as an internal control.
Secondary laboratory checks are performed as part of the QA/QC procedures. Pulps are sent to a third-party laboratory as check assays on a 1 in 15 basis. The current external secondary check laboratory is Intertek in Jakarta. Historically GA and SGS-Indoassay had been used as secondary labs.
PT-FI analyzes the results of the QA/QC sampling regularly and generates reports to management as well as sharing the results during monthly meetings between PT-FI and the SFKK laboratory. In addition, QA/QC performance is independently verified by a third-party consultant annually.
8.4Bulk Density Measurements
Drill core is skeletonized by retaining 10 to 15 centimeter samples selected every 3 meters. These samples are used for density determinations. Specific gravity (SG) is measured by drying the sample, weighing in air, and weighing while immersed in water. SG is calculated using the formula below:
SG = weight in air / (weight in air – weight in water)
Assumes water has an SG of 1 and surface tension is not a factor.
Weighing crushed rock or highly altered rock is difficult, so only solid core is weighed. A factor is applied to the bulk measurement to compensate for fractured samples and considers RQD, broken, and crushed measurements. QA/QC checks are conducted every 50 meters using the water-air weight method and caliper method after the ends of the samples are cut perpendicular to the core axis with a diamond saw.
8.5Comment on Sample Preparation, Analyses and Security
In the QP’s opinion, sample preparation, analytical methods, security protocols, and QA/QC performance are adequate and supports the use of these analytical data for mineral reserve and resource estimation.
| as of December 31, 2021 | 35 | ||||
| Technical Report Summary for Grasberg minerals district, Papua, Indonesia | ||||
9DATA VERIFICATION | ||
9.1Data Entry and Management
PT-FI has a team dedicated to data administration and QA/QC. The Data Administration team manages the master drill hole database and provides QA/QC services for PT-FI. The database is physically housed on a secure server and is automatically backed up. The database is protected by restricting user access and permissions on both the server and within the program. Permissions are assigned by a designated database administrator.
Pre-configured rules are used to maintain data integrity for all stages of data entry within the program. These rules are incorporated for drill hole planning, collar, downhole surveys, geological and geomechanical logging, sampling, assay results, and QA/QC. The program has importers and data entry objects with built-in validation that can be used to produce reports and graphs to inform the database managers of unusual data. The Data Administration team verifies that data in the master database is complete and quality control is performed regularly.
The primary laboratory SFKK utilizes a commercially available Laboratory Information Management System (LIMS) to control, store, and transfer analytical results electronically. Data entry errors are reduced in comparison to past systems because assay results from instrumentation report directly to the LIMS software package.
Annual checks of the database are performed by the PT-FI resource geology team in addition to the Data Administration team at the site. These checks include:
•Identifying new drilling added since prior year and comparing summary statistics to the previous year’s database.
•Identifying database values that have changed since prior year and verifying that any changes can be explained and justified. This includes checking the collar, survey, and assay data.
9.2Comment on Data Verification
As confirmation of the mineral reserve and resource process, third-party consultants are hired annually to perform verification studies. This study includes the database, geological models, and estimation verification. A third-party analysis of PT-FI data confirmed there are no issues in the mineral resource estimation and reporting and complies with mining industry standards.
Starting in November 2009, the consultant developed a Data Acquisition and Maintenance checklist for PT-FI. This checklist incorporates a review of the data acquisition tasks required for the reserve and resource reporting. The verification process is completed by the consultant during the annual technical review.
In summary, data verification for PT-FI has been performed by FCX personnel and external consultants contracted by FCX. Based on reviews of this work, it is the QP’s opinion that the PT-FI drill hole database and other supporting geologic data align with accepted industry practices and are adequate for use in mineral reserve and mineral resource estimation.
| as of December 31, 2021 | 36 | ||||
| Technical Report Summary for Grasberg minerals district, Papua, Indonesia | ||||
10MINERAL PROCESSING AND METALLURGICAL TESTING | ||
Mineral reserves and mineral resources are evaluated to be processed using hydrometallurgy and/or concentrating (mill) operations. The applicable processes and testing are discussed below.
10.1Hydrometallurgical Testing and Recovery
Hydrometallurgical processes are not in use at the Grasberg minerals district.
10.2Concentrating Metallurgical Testing and Recovery
Geometallurgical testwork for PT-FI has been performed at FCX’s Technology Center facilities (TCT) laboratory (ISO 9001:2015 certified) in Tucson, Arizona since 2009. Prior to that, testwork was performed by Crescent Technology at their laboratory in Belle Chasse, Louisiana. Additionally, geometallurgical testwork has been completed by SGS Mineral Services (SGS) in Lakefield, Ontario. The QA/QC procedures for the hardness testing include repeats, duplicates, and periodic round robin testing with internal and external laboratories. For flotation testing and associated assays the main QA/QC methodology is by use of repeats and duplicates.
Geometallurgical testing has been conducted to characterize the response of ore samples to comminution and flotation processes and to develop predictive models to forecast recovery and concentrate grades by ore type. The geometallurgical tests are conducted at the scale of a laboratory bench, or in the case of comminution testing with equipment of a laboratory scale. The testwork includes flotation tests and associated assays, JK Ore Hardness Drop Weight testing, Bond Work Index (BWI) testing, and mineralogical analysis including quantitative evaluation of minerals by scanning electron microscopy, known as QEMScan and x-ray diffraction. Testing has been extended beyond the bench scale to either large-scale batch testing or operating a pilot plant facility to generate additional data required for the design of facilities needed to treat the ore.
Table 10.1 summarizes the current modeled LOM overall recovery. These recoveries are a tonnage-weighted summation of modeled recoveries by ore type for each of the deposits.
Table 10.1 – Modeled LOM Recovery
| Ore body | Copper Recovery (%) | Gold Recovery (%) | Silver Recovery (%) | Final Concentrate Grade (%Copper) | ||||||||||
| GBC | 86.7 | 65.9 | 72.4 | 25.3 | ||||||||||
| DMLZ | 87.9 | 81.2 | 83.4 | 27.7 | ||||||||||
| BG | 94.6 | 69.8 | 83.2 | 29.0 | ||||||||||
| KL | 86.1 | 53.8 | 50.9 | 21.5 | ||||||||||
Fluorine is present in the ore, with higher levels in DMLZ and GBC ores, and therefore the mill and dewatering plant operations are managed with the objective to maintain fluorine levels in the copper concentrate shipments to less than 1000 parts per million.
| as of December 31, 2021 | 37 | ||||
| Technical Report Summary for Grasberg minerals district, Papua, Indonesia | ||||
10.3Comment on Mineral Processing and Metallurgical Testing and Recoveries
The comminution and flotation response of GBC, DMLZ, and BG have been characterized and are well understood and spatially representative.
Significant drilling has been undertaken on the KL low pyrite ore body to understand flotation and comminution response on the existing concentrator facilities. Additional drilling is ongoing to further define the KL low pyrite ore body. Flotation testwork on drill hole core samples continued through 2021 at the TCT laboratory, while flotation pilot plant testing planned for 2022 will be conducted by SGS in Lakefield, Ontario.
In the opinion of the QP, the geometallurgical testwork completed on representative samples is appropriate to establish reasonable processing estimates for the different copper-gold porphyry and skarn style mineralization encountered in the deposits. The mill and dewatering plant processes and associated recovery factors are considered appropriate to support mineral reserve and mineral resource estimation and mine planning.
11MINERAL RESOURCE ESTIMATE | ||
Mineral resources are evaluated using the application of technical and economic factors to a geologic resource block model to generate digital surfaces or solids of mining limits, using specialized geologic and mine planning computer software. The resulting surfaces or solids volumetrically identify material as potentially economical, using the assumed parameters. Mineral resources are the resultant contained metal inventories.
11.1Resource Block Model
Relevant geologic and analytical information is incorporated into a three-dimensional digital representation referred to as a geologic resource block model. Mineral resources at PT-FI are based on block models for each of the following mining areas:
•GRSKL including GBC and the depleted GRS_OP.
•EESS incorporating DMLZ, GBT open-pit, Dom and depleted GBT, IOZ, DOZ.
•BG.
The resource block models for PT-FI were updated in August 2021 and contain all drilling results available by mid-July 2021. Each block model is discussed in the following subsections with a focus on major metals.
11.1.1Compositing Strategy
PT-FI uses 15-meter length composites starting at the collar for GRSKL and EESS. Several items are composited including metals, SG, and magnetic susceptibility. A minimum recovered length of 4.5-meter intact core within a 15-meter composite is required for the composite to be used for grade estimation. Composites with poor core recovery are rejected during the estimation process. Composites are not split or broken at geologic boundaries.
BG has a smaller selective mining unit and therefore a shorter, 5-meter length composite broken by geologic boundaries.
| as of December 31, 2021 | 38 | ||||
| Technical Report Summary for Grasberg minerals district, Papua, Indonesia | ||||
Prior to estimation, composites are flagged by rock type and alteration. Composites are also capped at a maximum value with differing caps for copper, gold, and silver for each estimation domain for each ore body.
11.1.2Statistical Evaluation
Industry standard geostatistical approaches are used in addition to ore body knowledge from PT-FI geologists in evaluating the geologic model.
Geostatistical analysis of drill hole data is evaluated using classical statistical parameters (mean, standard deviation, number of samples, etc.). Histograms and cumulative frequency plots are used to conduct detailed analyses of sample population data. Assay and composite statistics are compared for each domain.
Outlier evaluations are performed using log probability plots as well as visual checks to determine capping levels. In many cases, a second level of outlier restriction is applied during estimation where composite values above a certain “high-yield threshold” cannot influence a block estimate beyond a distance which is smaller than the full distance specified by the search ellipse. Contact plots are used to analyze boundaries between the various domains.
Geologic continuity is determined using correlograms, pair-wise-relative, and/or variogram models. Drill hole data is assessed along multiple orientations for each estimation domain for copper, gold, and silver. The nugget is derived from downhole variogram models. Search ellipse anisotropy ratios in most cases conform directly to the anisotropy ratios of the correlogram/variogram models for the respective estimation domain. As a general rule, the search distances conform to 2/3 of the variogram in mineralized estimation zones.
11.1.3Block Model Setup
The GRSKL and EESS block models have 15 by 15 by 15 meter block sizes, providing adequate resolution for engineering and production. This block size is appropriate for porphyry copper mineralization, drill hole spacing, and block cave mining. The mineralization of the BG ore body is narrow and requires a smaller 5 by 5 by 5 meter block size to accommodate more selective stope mining.
Details of the block model setup are shown in Table 11.1.
Table 11.1 – Grasberg Minerals District Block Model Dimensions

UTM= Universal Transverse Mercator
| as of December 31, 2021 | 39 | ||||
| Technical Report Summary for Grasberg minerals district, Papua, Indonesia | ||||
Each block model is rotated following the major stratigraphy direction of the district as shown in Figure 11.1 and Figure 11.2.
Figure 11.1 – Block Model Extents with Reserve Shapes (Plan View)

| as of December 31, 2021 | 40 | ||||
| Technical Report Summary for Grasberg minerals district, Papua, Indonesia | ||||
Figure 11.2 – Block Model Extents with Reserve Shapes (Looking NE)

11.1.4Topography
Topography for the original pre-mine and estimated end of year (including the depleted open-pit mining and expected block cave subsidence zones) topographic surfaces are coded in the block model, as shown in Figure 11.3.
| as of December 31, 2021 | 41 | ||||
| Technical Report Summary for Grasberg minerals district, Papua, Indonesia | ||||
Figure 11.3 – Topography and Block Model Limits

11.1.5Geologic Model Interpretation
The regional geologic model is maintained by the Geologic Data Management group at the PT-FI jobsite and is updated on a quarterly basis. Annual resource model updates require the geologic model that is provided to the resource estimation group includes updated interpretations based on the latest data available.
The three-dimensional model covers the Grasberg minerals district and uses drill hole logs and underground mapping to construct wireframes for the following:
•Stratigraphy.
•Intrusions.
•Alteration.
•Faults.
Geology interpretation is done on cross sections perpendicular to the regional strike and are guided by level-plan contours. Cross section spacing varies depending on the level of detail required for each wireframe.
11.1.6Grade Estimates
Structural, lithological, and mineralized/unmineralized wireframes are combined to create estimation domains. Cutoffs reflecting mineralization boundaries are low enough to not
| as of December 31, 2021 | 42 | ||||
| Technical Report Summary for Grasberg minerals district, Papua, Indonesia | ||||
interfere with the continuity of the grade distribution at the economic cutoff grade and high enough to demarcate a reasonable limit of potential economic mineralization.
Estimation for copper, gold, and silver are interpolated using Ordinary Kriging (OK) and include a high-yield restriction to manage high-grade outliers in addition to capping. GRSKL additionally uses Locally Varying Anisotropy within the main intrusive units to better capture the “horseshoe-like” geometry of the ore body.
The following are general parameters used for the OK estimation of copper, gold, and silver:
•Minimum of 3 and maximum of 10 composites.
•Maximum of 4 composites per drill hole.
•Search ellipse radius along major directions of continuity reduced to 2/3 of the variogram range.
•High-yield samples ranges are additionally restricted using a smaller search radius, further limiting the influence of high-grade samples.
In general, hard boundaries are used for mineralized/unmineralized domains and between sedimentary and intrusive units. Soft boundaries are used in certain circumstances, such as in BG between the shale/limestone units due to the thin bedding of the shale unit.
A background detection limit grade is assigned for copper, gold, and silver for unestimated blocks. Models are validated using both visual and geostatistical methods.
11.1.7Bulk Density
Bulk density or in-place dry density is estimated based on the measured density values for each drill hole interval. SG is composited to 15 meters for block caves and 5 meters for open stope mines separated by estimation zones and values are then converted to final bulk density. The procedures applied are identical in all PT-FI deposits. The main steps for the bulk density process are:
•The uncorrected density and bulk density factor are estimated by OK method.
•A factor is developed from geomechanical data which incorporates RQD, percent broken, and percent crushed to approximate the voids ratio in the rock mass.
•The final bulk density for mineral reserve and mineral resource estimation is the reduced density by the correction factor.
11.1.8Mineral Resource Classification
Mineral resources are classified into categories of measured, indicated, and inferred. Each category represents a decreasing level of confidence in the estimation of grade values. Measured, indicated, and inferred blocks are classified according to geological continuity, distance to the closest sample, number of drill holes, and the Kriging variance derived during the estimation of copper grades for each ore body.
•Measured requires a minimum of 2 drill holes contributing data to the estimate, statistically established distance to the nearest composite and Kriging variance below a defined measured threshold.
| as of December 31, 2021 | 43 | ||||
| Technical Report Summary for Grasberg minerals district, Papua, Indonesia | ||||
•Indicated requires a minimum of 2 drill holes contributing data to the estimate, statistically established distance to the nearest composite and Kriging variance below a defined indicated threshold.
•Inferred requires only 1 drill hole, beyond indicated distance and a Kriging variance threshold.
Inferred blocks have their grades set for the final reported variables used in the determination of mineral reserve to the analytical detection limit (near zero). Detailed classification parameters are shown in Table 11.2.
| as of December 31, 2021 | 44 | ||||
| Technical Report Summary for Grasberg minerals district, Papua, Indonesia | ||||
Table 11.2 – Summary of Resource Classification Criteria for Mineralized Domains

| as of December 31, 2021 | 45 | ||||
| Technical Report Summary for Grasberg minerals district, Papua, Indonesia | ||||
11.1.9Model Validation and Performance
The geologic resource model is evaluated by visual inspection, statistical analyses, comparison to previous models and to production data. Block model values and drill hole data are visually examined. The review verifies that areas of high-grade and low-grade blocks and samples align with ore body knowledge. These inspections have shown that block model values compare well with the drill hole composites.
Statistical analyses such as mean, standard deviation, minimum, maximum, and coefficients of variation along with cumulative frequency plots are used to validate the interpolated blocks against drill hole composites, grade-tonnage curves, and reconciliation to production. Block model OK results are compared with the composite data and nearest neighbor estimates. Variable estimations are compared to previous years estimates. Models are exchanged with other members of the resource group for peer review.
A third-party consultant conducts an annual review of the resource models and estimation processes and provides a verification report. The review concluded that the methods and procedures used by PT-FI for mineral resource and reserve evaluation are performed in a manner consistent with good engineering and geologic practice.
FCX corporate standards are that the resource model should be within 10 percent of production for tonnage, grade, and contained or recoverable metal over a 12-month period. The models for PT-FI meet FCX standards.
11.1.10Comment on Geologic Resource Model
In the opinion of the QP:
•The resource model has been completed using accepted industry practices.
•The model is suitable for estimation of mineral reserves and mineral resources.
•The model is adequate to provide reliable inputs to mine planning, geomechanics and metallurgy.
•The PT-FI geology staff has a good understanding of the lithology, structure, alteration, and copper mineral types in the district. The understanding of the controls on mineralization are adequate to support estimation of mineral reserves and mineral resources.
•The understanding and interpretation of ore types based on copper-gold mineralogy is a key component to supporting classification of mineral reserves and mineral resources by process method.
11.2Resource Evaluation
Mineral resource estimates are developed by applying technical and economic modifying factors to the geologic block model to identify material with potential for economic extraction. The process of evaluation is iterative involving an initial draft using the assumptions, understanding the implications of the resulting economical mining limits, and adjusting the assumptions as warranted for subsequent evaluations.
Mineral resource estimates are determined using measured, indicated, and inferred classified materials as viable ore sources during evaluations with the modifying factors.
| as of December 31, 2021 | 46 | ||||
| Technical Report Summary for Grasberg minerals district, Papua, Indonesia | ||||
11.2.1Economic Assumptions
FCX executive management establish reasonable long-term metal pricing to be used in determining mineral reserves and mineral resources. These prices are based on reviewing external market projections, historical prices, comparison of peer mining company reported price estimates, and internal capital investment guidelines. The long-term sale prices align the company’s strategy for evaluating the economic feasibility of the mineral reserves and mineral resources.
Unit costs are derived from current operating forecasts benchmarked against historical results and other similar operations. Additional input from appropriate internal FCX departments such as Global Supply Chain, Sales and Marketing, and Finance and Accounting are considered when developing the economic assumptions.
To recognize the relationship between commodity prices and principal consumable cost drivers, FCX scales unit costs to reflect the cost environment associated with the reported metal prices. This is evidenced in the differences in economic assumptions between mineral reserves and mineral resources.
The metal price and cost assumptions are used over the timeframe of the expected life of the mine and reflect steady state operating conditions in the metal price cost environment. Details of the economic assumptions are outlined in Table 11.3.
11.2.2Processing Recoveries
Processing recoveries are outlined in Section 10.
11.2.3Physical Constraints
The evaluation of the resource is within the IUPK boundary and there are no physical constraints considered.
11.2.4Cutoff Grades
A cutoff grade is used to determine whether material should be mined and if that material should be processed as ore or left unmined.
The mine planning software evaluates the revenue and cost for each block in the block model to determine the value, using the provided assumptions. The following formula demonstrates how the cutoff grades are determined.
Internal cutoff grade = Sum of [processing costs + general site and sustaining costs] / Sum of [payable recoverable metal * (metal price – metal refining and sales costs)]
A break-even cutoff grade calculation is similar to the internal cutoff grade formula but includes mining costs. Blocks with grades above the break-even cutoff grade generate positive value, while blocks with grades above the internal cutoff grade minimize negative value. The cutoff grades reported for mineral resources reflect the internal cutoff grades based on the software results.
Input parameters are applied to individual deposits and distinct ore types as appropriate. Unique parameters can result in distinct cutoff grades. Cutoff grades are reported in
| as of December 31, 2021 | 47 | ||||
| Technical Report Summary for Grasberg minerals district, Papua, Indonesia | ||||
terms of EqCu defining the relative value of all commercially recoverable metals in terms of copper by ore processing methods.
An internal cutoff grade is used as the lower limit for consideration for ore/waste selection when there is incremental ore processing capacity available and the incremental feed can be accessed without any incremental capital input.
In the block caves, a similar situation arises for incremental ore that can be produced from an existing drawpoint. In this case, the assumption is that as long as there are no additional costs associated with maintaining the drawpoint, then lower grade increments can be pulled and processed as long as they fill spare capacity and provide a marginal benefit to the project. For the block caves, it is unreasonable to expect that continued draw from depleted drawpoints can be sustained before repair and redevelopment costs begin to arise. Therefore, overpull of significant incremental tonnages cannot be justified at the internal cutoff beyond the expected life of the drawpoint. Delineation of an incremental “overpull” resource, above a block cave’s planned height of draw must recognize the incremental costs associated with maintaining the draw infrastructure beyond its planned life.
This approach provides realistic economic criteria for defining overpull resources. Overpull resources represent an opportunity to the operation should circumstances allow for its production. As a block cave’s production level is abandoned, the overlying portion of the overpull resource is extinguished.
Conceptually the cutoff grade for overpull should be higher than the internal cutoff grade for each mine, but smaller than the breakeven cutoff grade for determining resources outside of already developed mining areas.
•The assumption is that there would be higher mining costs associated with producing ore from these overpulled drawpoints.
•These higher costs would include more extensive drawpoint and panel repair, increased wet muck production, possibly requiring a minimum economic recovery and other factors that result from mining of very high, mature draw columns in an aging production block.
11.2.5Economic and Technical Assumptions
The economic and technical assumptions used for the generation of potentially economical mining limits for mineral resources are summarized in Table 11.3.
| as of December 31, 2021 | 48 | ||||
| Technical Report Summary for Grasberg minerals district, Papua, Indonesia | ||||
Table 11.3 – Economic and Technical Assumptions for Mineral Resource Evaluation

| as of December 31, 2021 | 49 | ||||
| Technical Report Summary for Grasberg minerals district, Papua, Indonesia | ||||
It is noted in comparison of current metal prices, mineral reserve and mineral resource price estimates reported by peer mining companies, and market analyst forecasted long-term prices that the assumed price of copper could be considered conservative. Although these sources serve as reference points, higher metal prices and associated costs indicate that additional mineral resources would be profitable in higher metal price environments thus extending the projected life of the mine. As such, the copper price assumptions are considered appropriate for determining mineral reserves and mineral resources.
11.3Mineral Resource Statement
The mineral resource estimate is the inventory of material identified as having a reasonable likelihood for economic extraction inside the mineral resource economical mining limit, less the mineral reserve volume, as applicable. The modifying factors are applied to measured, indicated, and inferred resource classifications to evaluate commercially recoverable metal. As a point of reference, the in-situ ore containing copper, gold, and silver metal are inventoried and reported by ore body.
The reported mineral resource estimate in Table 11.4 is exclusive of the reported mineral reserve, on a 100 percent property ownership basis. The mineral resource estimate is based on commodity prices of $3.00 per pound copper, $1,200 per ounce gold, and $20 per ounce silver.
| as of December 31, 2021 | 50 | ||||
| Technical Report Summary for Grasberg minerals district, Papua, Indonesia | ||||
Table 11.4 – Summary of Mineral Resources

| as of December 31, 2021 | 51 | ||||
| Technical Report Summary for Grasberg minerals district, Papua, Indonesia | ||||
Extraction of the mineral resource may require significant capital investment, specific market conditions, expanded or new processing facilities, additional material storage facilities, changes to mine designs, or other material changes to the current operation.
In the opinion of the QP, risk factors that may materially affect the mineral resource estimate include (but are not limited to):
•Metal price and other economic assumptions.
•Changes in interpretations of continuity and geometry of mineralization zones.
•Changes in parameter assumptions related to the mine design evaluation including geotechnical, mining, processing capabilities, and metallurgical recoveries.
•Changes in assumptions made as to the continued ability to access and operate the site, retain mineral and surface rights and titles, maintain the operation within environmental and other regulatory permits, and social acceptance to operate.
Uncertainty in geological resource modeling is monitored by reconciling model performance against actual production results, as part of the FCX geologic resource model verification process.
11.4Comment on Mineral Resource Estimate
The mineral resource estimate has been prepared using industry accepted practice and conforms to the disclosure requirements of S-K1300. Mineral reserve and mineral resource estimates are evaluated annually providing the opportunity to reassess the assumed conditions. Although all the technical and economic issues likely to influence the prospect of economic extraction of the resource are anticipated to be resolved under the stated assumed conditions, no assurance can be given that the estimated mineral resource will become proven and probable mineral reserves.
12MINERAL RESERVE ESTIMATE | ||
Mineral reserves are summarized from the LOM plan, which is the compilation of the relevant modifying factors for establishing an operational, economically viable mine plan. The LOM plan incorporates:
•Scheduling material movements for ore and waste from designed final mining excavation plans with a set of internal development sequences, based on the results of the resource evaluation process.
•Planned production from scheduled deliveries to processing facilities, considering metallurgical recoveries, and planned processing rates and activities.
•Capital and operating cost estimates for achieving the planned production.
•Assumptions for major commodity prices and other key consumable usage estimates.
•Revenues and cash flow estimates.
•Financial analysis including tax considerations.
Mineral reserves have been evaluated considering the modifying factors for conversion of measured and indicated resource classes into proven and probable reserves. Inferred resources are considered as waste in the LOM plan. The details of the relevant modifying factors included in the estimation of mineral reserves are discussed in Sections 10 through 21.
| as of December 31, 2021 | 52 | ||||
| Technical Report Summary for Grasberg minerals district, Papua, Indonesia | ||||
The LOM plan includes the planned production to be extracted from the in-situ mine designs.
12.1Cutoff Grade Strategy
The cutoff grade strategy is a result of the mine plan development, determined by the economic evaluation of the mineral reserves via strategic long-range mine and business planning. Economic cutoff grades are determined from the LOM planning results and can vary based on processing throughput expectations, ore availability, future ore and overburden or waste requirements, and other factors encountered as the mine operates. This approach is consistent with accepted mining industry practice. Cutoff grades reported are the minimum grades expected to be delivered to a processing facility.
12.2Economic and Technical Assumptions
The economic and technical assumptions used in the generation of economical mining limits for mineral reserves are summarized in Table 12.1. Economic reserve assumptions are developed in the same manner as the resource evaluation described in section 11.2.1.
| as of December 31, 2021 | 53 | ||||
| Technical Report Summary for Grasberg minerals district, Papua, Indonesia | ||||
Table 12.1 – Economic and Technical Assumptions for Mineral Reserve Evaluation

*BG uses an elevated cut-off grade of 1.70% EqCu for mineral reserves.
| as of December 31, 2021 | 54 | ||||
| Technical Report Summary for Grasberg minerals district, Papua, Indonesia | ||||
12.3Mineral Reserve Statement
As a point of reference, the mineral reserve estimate reports ore inventories from the LOM plan containing copper, gold, and silver metal and reported as commercially recoverable metal.
Table 12.2 summarizes the mineral reserves reported on a 100 percent property ownership basis. The mineral reserve estimate is based on commodity prices of $2.50 per pound copper, $1,200 per ounce gold, and $15 per ounce silver.
Table 12.2 – Summary of Mineral Reserves
In the opinion of the QP, risk factors that may materially affect the mineral reserve estimate include (but are not limited to):
•Metal price and other economic assumptions.
•Changes in interpretations of continuity and geometry of mineralization zones.
•Changes in parameter assumptions related to the mine design evaluation including geotechnical, mining, processing capabilities, and metallurgical recoveries.
•Changes in assumptions made as to the continued ability to access and operate the site, retain mineral and surface rights and titles, maintain the operation within environmental and other regulatory permits, and social acceptance to operate.
As confirmation of the mineral reserve and resource process, third-party consultants reviewed and verified the mineral reserve estimate for the Grasberg minerals district concluding that the consultant “has formed the opinion that the PT-FI reserve estimates
| as of December 31, 2021 | 55 | ||||
| Technical Report Summary for Grasberg minerals district, Papua, Indonesia | ||||
are within the limits of acceptable engineering error and that the estimated reserves conform to the definitions within S-K1300”.
The positive economics of the financial analysis of the LOM plan demonstrate the economic viability of the mineral reserve estimate.
12.4Comment on Mineral Reserve Estimate
The mineral reserve estimate has been prepared using industry accepted practice and conforms to the disclosure requirements of S-K1300. Mineral reserve and mineral resource estimates are evaluated annually, providing the opportunity to reassess the assumed conditions. All the technical and economic issues likely to influence the prospect of economic extraction are anticipated to be resolved under the stated assumed conditions.
Mineral reserve estimates consider technical, economic, and environmental, and regulatory parameters containing inherent risks. Changes in grade and/or metal recovery estimation, realized metal prices, and operating and capital costs have a direct relationship to the cash flow and profitability of the mine. Other aspects such as changes to environmental or regulatory requirements could alter or restrict the operating performance of the mine. Significant differences from the parameters used in this TRS would justify a re-evaluation of the reported mineral reserve and mineral resource estimates. Mine site administration and FCX dedicate significant resources to managing these risks.
13MINING METHODS | ||
The Grasberg minerals district has a long operational history and mining conditions are well understood by jobsite and FCX corporate staff. All of the currently active operations are underground mines. The mining method for each reserve is as follows:
•GBC: block/panel cave mine.
•DMLZ: block/panel cave mine.
•BG: open stope mine.
•KL: block/panel cave mine.
13.1Mine Design
Many mine method parameters are applied at PT-FI to prepare mine designs, based on over 40 years of underground production experience. A few generalities exist, such as undercut placement over the production drifts, production level layouts, ore pass locations, chute cutouts, general ventilation requirements, and drain level locations. However, most of the final design involves numerous iterations, with input from operations, in order to best meet operational and cost objectives. Once the final design is approved, minor changes can occur without disruption to the operational development process, as development mining of the infrastructure and main levels is executed several years ahead of placing the initial portion of the ore panels into active production.
Mine designs are developed using specialized mine design computer software.
| as of December 31, 2021 | 56 | ||||
| Technical Report Summary for Grasberg minerals district, Papua, Indonesia | ||||
13.1.1Mine Design Parameters
Geomechanical recommendations for each of the operating mines are determined and reviewed by FCX engineers and third-party consultants. These recommendations are based on comprehensive geomechanical testing, studies, and the geomechanical monitoring procedures in the field.
The geomechanical properties of the rock determine the rock parameters for the panel cave design and all other underground facilities. The rock mass response of these properties to the mining process are considered when designing the mining method and setting the reserves at each mine.
13.1.2Geomechanical and Hydrological Modeling
The rock stability of the underground mines is monitored with a variety of geomechanical piezometer instrumentation and sensors. The geomechanical instruments measure the movement in the rock and the measurements are used to monitor and manage any movement and stability concerns. Typical instrumentation includes time-domain reflectometry, open-hole camera monitoring, radar units, scanning units, and seismic monitoring. Groundwater is monitored to check flow and pressure to help manage any safety and stability concerns.
13.1.3Final Mine Design
Using specialized computer software, mine designs are developed with key considerations that include:
•Compliance with the geomechanical recommendations.
•Implementation of geomechanical model data, including general geology, in-situ rock properties, structural data, and mass classification.
•Proper geometric dimensioning for underground structures, such as pillars, stopes, and openings.
•Access for entry and egress.
•Underground roadways design.
•Mechanization and efficiencies, such as matching equipment and fleets.
•Ventilation requirements.
•Dilution considerations.
•Infrastructure and supplies.
Mine designs are reviewed for compliance to key parameters and reasonableness with comparison to historical and current operating practices. Figure 13.1 is a three-dimensional perspective view of the Grasberg minerals district showing the layout and mineral reserve shapes of the mines.
| as of December 31, 2021 | 57 | ||||
| Technical Report Summary for Grasberg minerals district, Papua, Indonesia | ||||
Figure 13.1 – Perspective View of the Grasberg Minerals District Underground Mines

During 2021 there were four active underground mining operations in the Grasberg minerals district: GBC (ultimately targeting 135,000 metric tons of ore per day), DMLZ block cave mine (ultimately targeting 80,000 metric tons of ore per day), and BG open stoping operation (targeting 7,000 metric tons of ore per day), and DOZ block cave mine (targeting 20,000 metric tons of ore per day). The KL ore body is another large caving operation that started development in 2021 and PT-FI anticipates will begin ore production in 2028. The GRS_OP was in production from 1990 to 2019. The concentrating plant has a planned peak capacity of approximately 240,000 metric tons of ore per day.
13.2Mine Plan Development
The mine plan is developed based on supplying ore to the processing facilities. The mine production schedule is produced using specialized industry software. The software evaluates the block model and applies various mixing mechanisms such as fines migration, rilling, toppling, and vertical movement of material. The algorithms that control this mixing are proprietary to the software, based on over 30 years of development and standard practice in the industry. Numerous inputs allow customization of the mixing properties and calibration to actual cave performance. With the mixing model created, the software produces a production schedule based on planned production rates,
| as of December 31, 2021 | 58 | ||||
| Technical Report Summary for Grasberg minerals district, Papua, Indonesia | ||||
drawpoint opening sequence, estimated draw rates, and other inputs. The production schedule reports the tonnage and grade per time period and is used for the metal forecasting process.
The Grasberg minerals district is one of the largest producing underground operations in the world. No stripping is required as all production is generated from underground mining. Underground mine development is typically between 35 and 40 kilometers of tunneling annually. The BG mine uses an open stoping with paste backfill method and typically emplaces between 600,000 to 700,000 cubic meters of paste per year.
Dilution of the reserve is accounted for by modeling the entry of material into the mixing model from previously caved zones and open-pit failures. The mine plan is scheduled to achieve a total of 240,000 metric tons of ore per day as the different mining operations ramp-up. This is expected to be achieved from four operating mines supplying ore to the mill: GBC, DMLZ, BG and KL.
The mine production rate and expected mine life are illustrated in Figure 13.2.
Figure 13.2 – Tonnage Per Day by Operating Mine

13.3Mine Operations
Mine unit operations include drilling, blasting to develop access, undercuts, drawbell development, ore raise development, drawpoint development, cave initiation, as well as loading and hauling. Support equipment is used for maintaining underground access roads, underground crushers, conveyors, and other mine services.
| as of December 31, 2021 | 59 | ||||
| Technical Report Summary for Grasberg minerals district, Papua, Indonesia | ||||
Required underground mining equipment varies by individual operation and includes that equipment required to develop and construct the mines as well as production support. The primary mining fleet consists of load-haul-dump loaders with 11 metric ton capacity and haul trucks with 55 to 60 metric ton capacity.
The site is in operation with experienced management and sufficient personnel. The mine operates 365 days per year on a 24 hour per day schedule. Operational, technical, and administrative staff are on-site to support the operation. As of December 31, 2021, the underground mine division has approximately 5,200 employees.
14PROCESSING AND RECOVERY METHODS | ||
The process facilities operate 365 days per year with exceptions for maintenance. The facilities have a long operating history. FCX and PT-FI anticipate that the site will have adequate energy, water, process materials, and permits to continue operating throughout the LOM.
14.1Concentrator Processing Description
The concentrator facilities located at MP74 are at an elevation of 2,800 to 2,900 meters above sea level and approximately 110 kilometers from the portsite dewatering and shipping facilities. The concentrators treat primary crushed ore conveyed from underground mines to surface stockpiles at MP74.
The first processing facilities treating Ertsberg pit ores were commissioned in 1973 and have seen incremental capacity enhancements over the years. Ore is processed in the mill, which produces a copper concentrate by flotation. Ore is delivered from the mine to an underground primary crusher where it is crushed and then conveyed to coarse ore mill stockpiles that feed the concentrators. Ore is conveyed from the mill stockpiles to the copper concentrators.
Ore enters the C1/C2 concentrator, where the secondary crushers accept scalped feed and are followed by a tertiary crushing circuit operating in closed circuit with vibrating screens, which provide the initial size reduction. Scalped screen undersize slurry, known as crusher slurry, is fed to hydrocyclones ahead of the C1/C2 ball mill circuit, with the classified fines fraction reporting directly to flotation, bypassing ball milling, and the classified coarse fraction to ball mill feed. A portion of the crusher slurry can also be transferred to the C3/C4 ball mill grinding circuit. Tertiary crusher screen undersize is fed to the High-Pressure Grinding Roll (HPGR). HPGR product is delivered to fine-ore storage bins for ultimate feed to the ball mill circuit. Ball mill discharge slurry is pumped to hydrocyclones where it is classified. The hydrocyclone underflow (coarse fraction) returns to ball mills for further grinding. A slipstream of the hydrocyclone underflow reports to the Knelson gravity circuit to improve coarse gold recovery. The hydrocyclone overflow (fine fraction) reports to rougher flotation for copper and gold recovery. Rougher concentrate advances to regrind mills and cleaner flotation to produce a final concentrate. A slipstream of regrind hydrocyclone underflow reports to a Knelson gravity circuit to improve gold recovery. Knelson concentrate is combined with the final flotation concentrate.
| as of December 31, 2021 | 60 | ||||
| Technical Report Summary for Grasberg minerals district, Papua, Indonesia | ||||
For the C3/C4 concentrator, ore enters the primary grinding circuit, where it is processed through a semi-autogenous grinding (SAG) mill. SAG mill product discharges onto vibrating screens. The screen oversize is conveyed to cone crushers, where pebbles are crushed before being recycled back to the SAG mill feed. An option exists to direct the crushed pebbles to the vibrating screens. The screen undersize is pumped to hydrocyclones where it is classified. The majority of hydrocyclone underflow (coarse fraction) reports to ball mills for further grinding. A slipstream of the hydrocyclone underflow reports to the Knelson gravity circuit to improve coarse gold recovery. The ball mill discharge mixes with Knelson wet screen undersize before being pumped back to the hydrocyclones. The hydrocyclone overflow (fine fraction) reports to rougher flotation for copper and gold recovery. Rougher concentrate advances to regrind mills and cleaner flotation to produce a final copper and gold concentrate. A slipstream of regrind hydrocyclone underflow reports to a Knelson gravity circuit to improve gold recovery. Knelson concentrate is combined with the final flotation concentrate.
The nominal processing rate used in the LOM plan is provided in Table 14.1.
Table 14.1 – Summary of Processing Facilities
| Facility | Purpose / Comments / Capacity | ||||
| Concentrators 1 and 2 | Commonly referred to as C1/C2 or the North/South concentrators. Size reduction is achieved with 2 secondary crushers on scalped feed, followed by 8 tertiary crushers in closed circuit with screens, then 2 HPGRs in quaternary crushing duty, followed by 8 ball mills prior to rougher and then cleaner flotation. Combined milling capacity is approximately 65k dmt per day. | ||||
| Concentrator 3 | Commonly referred to as C3 or the SAG1 concentrator. SAG mill in closed circuit with a pebble crusher followed by 2 parallel ball mills for size reduction prior to rougher and cleaner flotation. Milling capacity is approximately 34k dmt per day. | ||||
| Concentrator 4 | Commonly referred to as C4 or the SAG2 concentrator. SAG mill in closed circuit with 2 pebble crushers followed by 4 parallel ball mills for size reduction prior to rougher and cleaner flotation. The C3 and C4 concentrators share a common cleaner circuit located in the C3 concentrator building. Milling capacity is approximately 75k dmt per day. | ||||
| Concentrate Pumphouse and Pipeline | Thickeners, storage tanks, positive displacement pumps and carbon steel slurry pipeline (3x 6” diameter, 1x 5” diameter) to deliver copper concentrate to dewatering plant facilities at portsite. Nominal capacity is approximately 3.0M dmt per year. | ||||
| Dewatering Plant | 3 vacuum and 2 pressure filtration systems to reduce moisture content from 65% solids to less than 9.8% moisture. Nominal capacity is approximately 2.7M dmt per year. | ||||
| Ship Loading | Storage barns, conveyors, loading dock and lightering barge to load copper concentrate to bulk cargo vessels for sale globally. Nominal capacity is approximately 3.0M dmt per year. | ||||
Copper concentrate from all concentrators is thickened before it advances to the pumphouse to be delivered by pipeline to the port facilities. At the portsite, the dewatering plant filters and stores the final product in a concentrate storage building. Copper concentrate is then loaded onto bulk cargo ships for global sale to off-site smelters.
Milled material that does not float is called tailings and has a low-value mineral content. Flotation tailings advance to tailings thickeners where process water is recovered and recycled back to the concentrators. Thickened tailings flow by gravity to the tailings
| as of December 31, 2021 | 61 | ||||
| Technical Report Summary for Grasberg minerals district, Papua, Indonesia | ||||
storage facility known as the ModADA. Limestone is added to the mill feed as needed to maintain the neutral geochemistry of the mill tailings.
Figure 14.1 provides a simplified schematic of the C1 and C2 concentrators. Figure 14.2 provides a simplified schematic of the C3 and C4 concentrators.
| as of December 31, 2021 | 62 | ||||
| Technical Report Summary for Grasberg minerals district, Papua, Indonesia | ||||
Figure 14.1 – Current C1 and C2 Concentrators Schematic

| as of December 31, 2021 | 63 | ||||
| Technical Report Summary for Grasberg minerals district, Papua, Indonesia | ||||
Figure 14.2 – Current C3 and C4 Concentrators Schematic

| as of December 31, 2021 | 64 | ||||
| Technical Report Summary for Grasberg minerals district, Papua, Indonesia | ||||
The processing facility performance is reviewed regularly, and adjustments are made as necessary to improve performance and reduce costs.
14.2Processing Requirements
The PT-FI mill has been operating since 1973 and all equipment and processes are proven in an industrial application. Adequate supplies for energy, water, process materials, and sufficient personnel are currently available to maintain operations and are anticipated throughout the LOM plan. Process materials are provided to the jobsite on an as-needed basis through the FCX and PT-FI global supply chain departments. The actual consumption of key processing supplies varies depending on ore feed and operating conditions in the plants. Table 14.2 includes the typical ranges of consumption for key processing requirements.
Table 14.2 – Processing Facilities Consumables
| Parameter | Typical Value | ||||
| Energy for Process (kWh/t ore) | 24 | ||||
| Fresh Water (gpm) | 31,000 | ||||
| Process Water Recycle (gpm) | 77,700 | ||||
| Mill Liners (kg steel/t ore) | 0.06 | ||||
| Grinding Balls (kg steel/t ore) | 1.1 | ||||
| Primary Collector (g/t ore) | 40 | ||||
| Secondary Collector (g/t ore) | 15 | ||||
| Frother (g/t ore) | 20 | ||||
| Lime (kg/t ore) | 1.0 | ||||
| Flocculant (g/t ore) | 13.0 | ||||
Diesel (gal/t copper concentrate) | 2.3 | ||||
Consumable and personnel requirements for the processing facilities are expected to be near current levels in the near-term with variation dependent on production levels in the various unit operations. As of December 31, 2021, the MP74 concentrating area and portsite dewatering plant had 631 PT-FI employees and 1,121 contractors for a total staffing of 1,752.
14.3Future Processing Capital Projects
The projects listed below are included in the LOM plan and are necessary to achieve the stated mill tonnages, recoveries, and concentrate grades. The process design criteria is informed by data from laboratory testing at bench scale and if necessary, at the pilot plant scale:
SAG3
•SAG3 is required to maintain total mill capacity in line with the historical nominal value of 240,000 metric tons of ore per day. This is because the underground ore is not transferred to the mill via ore passes of 600-meter vertical height which naturally provides a significant amount of gravity assisted comminution, as was the case for the now depleted Grasberg open-pit ore. SAG3 is expected to be operational in 2023.
| as of December 31, 2021 | 65 | ||||
| Technical Report Summary for Grasberg minerals district, Papua, Indonesia | ||||
Copper Cleaner
•The current SAG concentrator copper cleaner circuit is undersized for the higher rougher concentrate production volumes associated with GBC and KL ore due to higher pyrite levels than previously experienced with open-pit ores.
•The new copper cleaner will improve concentrate grade and recovery by increasing rougher flotation capacity, adding regrind power with the use of high intensity grinding mill technology to improve mineral liberation, and installing a new 2-stage cleaner using staged flotation reactor cell technology. The new GBC copper cleaner is planned to be operational in 2024.
•The GBC cleaner is planned to be expanded for 2026 and again in 2032 in order for it to be able to treat additional volume of rougher concentrate generated by KL ore.
Pyrite Cleaner and Pyrite Tailings Storage
•In order to maintain the mill tailings at neutral geochemistry with a 50 percent factor of safety during the mine life, a pyrite flotation circuit is planned to be online in 2029. This circuit will treat copper cleaner tailings to float a stream known as pyrite tailings. The pyrite tailings will be pumped to the lowlands via slurry pipelines to a pyrite tailings storage facility. The balance of the cleaner tailings will report to the normal mill tailings stream.
Vertical Pressure Filter #3 (VPA3)
•The current filtration capacity of the dewatering plant at portsite is 2.7 million dry metric tons per annum.
•A third pressure filter is in progress to provide capacity up to and beyond the in-country smelting constraint of 3.0 million dry metric tons per annum. VPA3 is expected to be operational in 2023.
•A fourth VPA (VPA4) is planned for 2032 to treat increased levels of concentrate production. The VPA3 layout allows for the installation of VPA4.
Makaha Lime Plant:
•A 200 tpd expansion of the Makaha lime plant that produces milk-of-lime, a reagent, used for pH adjustment in flotation is planned for operation in 2029.
15SITE INFRASTRUCTURE | ||
The site infrastructure at PT-FI has been established over the history of the project and supports the current operations. The current major mine infrastructure includes: waste rock storage facilities, temporary stockpiles, riverine tailings management system, power and electrical systems, water usage systems, various on-site warehouses and maintenance shops, and offices required for administration, engineering, maintenance and other related mine and processing operations. The communication system at PT-FI includes internet and telephone access connected by hard-wire, fiberoptic, and mobile networks. Access to the property is discussed further in Section 4 of this TRS. The general location of the site infrastructure is shown in Figure 15.1 and Figure 15.2.
| as of December 31, 2021 | 66 | ||||
| Technical Report Summary for Grasberg minerals district, Papua, Indonesia | ||||
Figure 15.1 – Site Infrastructure Plan View

Figure 15.2 – Site Infrastructure Cross Section

| as of December 31, 2021 | 67 | ||||
| Technical Report Summary for Grasberg minerals district, Papua, Indonesia | ||||
15.1Waste Rock Storage Facilities
Waste rock stockpiles are used to store overburden and other waste rock materials that was produced during the development and production of the now depleted open-pit mine. The transition to underground mining was completed in 2019, eliminating the need for new overburden stockpiles. As of December 31, 2021, PT-FI continues reclamation of the West Wanagon overburden stockpile. Other highlands stockpiles are being regraded and the top surface capped with limestone. Monitoring of the stockpiles and storm water runoff will continue through the life of operations.
15.2Mill Stockpiles
Ore is delivered from the mine to an underground primary crusher where it is crushed and then conveyed to coarse ore mill stockpiles that feed the concentrators. Ore is conveyed from the mill stockpiles to the copper concentrators.
15.3Controlled Riverine Tailings Management
PT-FI operates a controlled riverine tailings management system called the ModADA located on the southern coastal plain of the island of Papua, Indonesia. Tailings produced at the mill in the highlands are transported roughly 45 kilometers downstream to the ModADA in the lowlands with an elevation of 0 to 150 meters by way of a steep, unnavigable river that originates near the mill. Deposited sediments in the ModADA comprise tailings from the mill and other mine-derived sediments, as well as naturally occurring sediment produced from erosive processes typical for the area. Engineered levees to the east and west of the ModADA running a total length of approximately 120 kilometers laterally contain depositing sediments in the land and estuary portions of the permitted deposition area.
The current ModADA levee system has been constructed over a period of many years and will continue to be constructed in future years for mill tailings management and flood protection. Trained site engineers and construction quality assurance crews conduct inspections of the levee system.
15.4Power and Electrical
The Grasberg minerals district electrical power is supplied by a 198MW coal-fired plant at portsite and 130MW of diesel generator capacity located at the mill. A twin circuit 230kV transmission line connects the portsite area and main power plants to the mill and mine operations areas.
There is 30MW of installed power generating capacity (25MW of firm capacity) and a 20kV distribution system that provides power for the lowlands support areas including MP38, Lowlands Industrial Park and Kuala Kencana.
One of PT-FI’s partners provides expertise in the area of maintaining and operating its power plants.
To support the additional energy requirements as result of the ramp-up of the underground mines, PT-FI is constructing a new 129MW DFPP at the portsite to provide an additional 129MW of firm capacity to support the increased power requirements as the underground mine ramp-up, and will allow the existing diesel generators to be transitioned to provide only back up and peaking requirements. The DFPP is designed
| as of December 31, 2021 | 68 | ||||
| Technical Report Summary for Grasberg minerals district, Papua, Indonesia | ||||
using high-efficiency dual fuel reciprocating engines on a flexible platform that can operate on either diesel fuel or natural gas, providing PT-FI future optionality to adjust the fuel type and increase plant capacity.
15.5Water Usage
Water sources for the project are a combination of naturally occurring mountain streams and water derived from our underground operations.
Potable and domestic use water is sourced from the fresh water supply and distributed using a network of pipelines. Process facilities operate using a combination of fresh and recycled water from the concentrator dewatering system and outflows from the underground mines. The underground mines utilize water sourced from dewatering activities.
15.6Product Handling
Steel pipelines are used to transport copper concentrate from the mill to the dewatering and storage barn facilities at portsite. The concentrate is pumped in these pipelines to a ridge above the Tembagapura townsite from which it flows by gravity to the portsite. The pipelines are buried or laid on the shoulder of the access road.
Ship loading facilities transport the dried concentrate (dried to 9 percent moisture for dust control) from the storage barns to the dock at the portsite facilities in Amamapare, Papua. Incoming freight and fuel are also unloaded at a separate cargo dock at portsite for delivery to their ultimate destinations in the lowlands, Tembagapura, the mill area, or the mines.
15.7Logistics, Supplies, and Site Administration
The operation has common management and services, as well as a logistics network that includes warehouses, vehicles, and personnel required to distribute and store the large quantity of supplies used by the operation and its workforce. A bus service is provided to the workplaces. Helicopters service day-to-day operations and the exploration activities. Planes operated by a privatized partner and commercial flights provide routine transportation to Jakarta and other Indonesian cities.
PT-FI has ships under PT-FI control to transport fuel, supplies, and general cargo to the site. PT-FI maintains a number of purchasing offices in Indonesia as well as in Singapore and the U.S. Warehouses are maintained at various locations throughout the site.
The remote location of the project requires that the operation be completely self-sufficient with an infrastructure capable of sustaining over 20,000 employees and contractors, along with many of their dependents. As such, supporting infrastructure has been built, improved, and expanded over the life of the project, including townsites providing employees with services ranging from retail stores, restaurants, residential facilities, schools, libraries, banks, postal services, training and recreational facilities, and health service facilities.
| as of December 31, 2021 | 69 | ||||
| Technical Report Summary for Grasberg minerals district, Papua, Indonesia | ||||
16MARKET STUDIES | ||
The Grasberg mine produces copper in a concentrate, with gold and silver also contained in the concentrate.
16.1Market for Mine Products
Copper is an internationally traded commodity and its prices are determined by the major metal exchanges. Prices on these exchanges generally reflect the worldwide balance of copper supply and demand and can be volatile and cyclical. In general, demand for copper reflects the rate of underlying world economic growth, particularly in industrial production and construction. FCX believes copper will continue to be essential in these basic uses as well as contribute significantly to new technologies for clean energy, to advance communications and to enhance public health.
Gold and silver are used for jewelry, coinage, and bullion as well as various industrial and electronic applications. Gold and silver can be readily sold on numerous markets throughout the world. Benchmark prices are generally based on London Bullion Market Association (London) quotations.
FCX owns smelting, refining, and product conversion facilities for copper products, operated as separate business segments. Sales between FCX’s business segments are based on terms similar to arms-length transactions with third-parties at the time of the sale.
PT-FI sells its copper concentrates at market rates to major copper smelters worldwide as well as to major trading companies with whom FCX has built and maintained long-term relationships. PT-FI’s sales agreements with major trading companies are generally established annually, although some extend unless or until terminated with 1-year notice. The pricing provisions in PT-FI’s concentrate sales agreements are consistent with international terms and conditions for the sale of copper concentrates and are relatively standardized. The underlying copper price is determined by and fluctuates with, the commodity exchange price while the treatment and refining charges and premiums are negotiated annually based on market conditions.
16.2Commodity Prices Forecast and Contracts
Long-term metal price projections for reserve estimation are:
•$2.50 per pound copper
•$1,200 per ounce gold
•$15 per ounce silver
All contracts currently necessary for supplies and services to maintain the Grasberg minerals district facilities and production are in place and are renewed or replaced within timeframes and conditions of common industry practices.
FCX and the QPs believe that the marketing and metal price assumptions for metal products are suitable to support the financial analysis of the mineral reserve evaluation. Further information regarding the sale and marketing of the mine’s metal products are discussed in FCX’s Annual Report on Form 10-K for the year ended December 31, 2021.
| as of December 31, 2021 | 70 | ||||
| Technical Report Summary for Grasberg minerals district, Papua, Indonesia | ||||
17ENVIRONMENTAL STUDIES, PERMITTING, AND SOCIAL IMPACT | ||
The Grasberg minerals district adheres to FCX environmental and sustainability programs, including policies and management systems regarding environmental, permitting, and community issues. The Grasberg minerals district has implemented an Environmental Management System that is certified to the internationally recognized ISO-14001:2015 standard. FCX’s programs are based on policies and systems that align with the International Council on Mining and Metals Sustainable Development Framework and the Copper Mark. FCX routinely evaluates implementation of these policies through internal and external independent assessments and publicly reports on its performance.
Further discussion regarding environmental, permitting, and social or community impacts is available in the latest FCX Annual Report on Sustainability.
17.1Environmental Considerations
Environmental monitoring is ongoing at Grasberg and will continue over the life of the operations and beyond through closure. Key monitoring areas include air, water, waste management, reclamation, and biodiversity including terrestrial and aquatic ecosystems. PT-FI continues to monitor these baselines and impact studies regularly at compliance points and report to required agencies.
Various changes in mining techniques and processing options have been implemented as a result of the depletion of the Grasberg open-pit in 2019. Updated environmental impact studies, environmental management and monitoring plans have been completed and are currently under review by the GOI.
PT-FI is currently in the process of completing an ESIA for facilities and activities associated with the transition from open-pit mining to underground operations, including the addition of a new SAG unit at the mill, construction of additional power facilities at the port, and southern extension of the east and west levees to safely maintain the tailings within the ModADA deposition area, as approved by the 300k AMDAL.
17.2Permitting
FCX and PT-FI believe that all major permits and approvals are in place to support operations at the Grasberg minerals district, however additional permits will likely be necessary in the future. PT-FI holds multiple permits from national, provincial, and regency regulatory agencies, including groundwater use permits, effluent and air discharge permits, solid and hazardous waste storage and management permits and protected forest borrow-to-use permits. Where permits have specific terms, renewal applications are made to the relevant regulatory authority as required, prior to the end of the permit term.
PT-FI routinely reports monitoring results to the Mimika Regency and provincial Papua Government as well to the MoEF. The MoEF issued to PT-FI Borrow to Use of Forest Area Permits (IPPKH), and the Determination of Planting Locations for Watershed Rehabilitation. Under conditions of the IPPKH issuance, PT-FI is legally required to revegetate an equal area of previously degraded land.
| as of December 31, 2021 | 71 | ||||
| Technical Report Summary for Grasberg minerals district, Papua, Indonesia | ||||
In 2020, PT-FI initiated a new AMDAL in preparation for the proposed extension of the east and west levees to maintain the tailings within the ModADA deposition area. PT-FI continues to work with the MoEF to address full approval of the ESIA, which is currently estimated to be received in 2022. PT-FI is currently undergoing regulatory review of technical approvals, the next stage of the overall permitting process.
17.3Waste and Tailings Storage, Monitoring, and Water Management
PT-FI has developed and continues to implement detailed, comprehensive mine waste and tailings management programs to meet regulations and FCX environmental management practices. PT-FI also follows FCX’s tailings management and stewardship program.
PT-FI operates a controlled riverine tailings management system implemented based on methods approved and permitted by the GOI. Tailings are transported from the concentrating facility along with water and a small quantity of concentrating reagents. Reagents added as part of the concentrating process have been demonstrated to dissipate within a short distance of the concentrating facility.
The PT-FI tailings management system uses an unnavigable river to transport the tailings and other mine-derived sediments from the concentrator area in the highlands along with natural sediments to a large engineered and managed deposition area in the lowlands, called the ModADA. The river is not used for potable water, agriculture, fishing or other domestic or commercial uses. Levees have been constructed on both the east and west sides of the ModADA to laterally contain the depositional footprint of the tailings and natural sediment within the designated area. Quantities of finer tailings and other sediments deposit in the estuary and the sea to the south.
PT-FI is also actively engaged with the MoEF’s Tailings RoadMap Task Force, which is engaging third-party expertise to examine the viability of additional management techniques and activities, which may increase sediment retention, prevent future erosion, create new habitat, and identify beneficial uses of tailings as a resource for local communities.
17.4Mine Closure Plans
A detailed Mine Closure Plan and 5-year reclamation plan have been approved by GOI regulators as required by Indonesian law. The plans are reviewed annually and revised every 5 years. Required reclamation bonds are in place. In the future, additional approval will be required for the diversion of the Aghawagon/Otomona River out of the ModADA at the end of mine life.
PT-FI completed an updated Mine Closure Plan in June 2019 to reflect PT-FI production operations until 2041. On July 2, 2019, PT-FI obtained approval for changes to the Mine Closure Plan through the Decree of the Directorate General of Mineral and Coal. The total closure cost estimate in the LOM plan is approximately $1.2 billion based on a cash flow schedule for the implementation of closure and post closure tasks. PT-FI has complied with the annual renewal of the financial guarantees corresponding to the closure plan.
| as of December 31, 2021 | 72 | ||||
| Technical Report Summary for Grasberg minerals district, Papua, Indonesia | ||||
17.5Local Stakeholder Considerations and Agreements
As part of the ongoing permitting and compliance obligations with the regional and national agency authorizations and as part of the mine’s commitment to local stakeholder engagement, PT-FI is dedicated to local community and social matters. PT-FI seeks to conduct its activities in a transparent manner that promotes proactive and open relationships with the local community, government, and other stakeholders to maximize the positive impacts of its operations and mitigate potential adverse impacts throughout the LOM plan.
PT-FI recognizes the rights of the Indigenous Peoples living within its project area and works with local stakeholders to address these rights on an ongoing basis. This can include land rights agreements, provision of community development programs involving the construction of housing, places of worship, community centers and other infrastructure, as well as provision of employment opportunities.
In 1996, PT-FI established the Freeport Partnership Fund for Community Development and completed the conversion of the fund into an Indonesian Foundation (YPMAK) during 2019. Leaders from the local indigenous groups, churches and the local government manage this fund with minority representation from FCX. PT-FI is contributing 1 percent of its gross revenues annually to this fund. In addition, PT-FI has established land rights trust funds administered by local representatives and PT-FI focusing on socio-economic resources, human rights, and environmental issues.
PT-FI seeks to prioritize local and regional purchases and hiring with the additional objectives to promote community development through the prioritization of acquisition of local and regional goods and services, according to its requirements and technical specifications.
17.6Comment on Environmental Compliance, Permitting, and Local Engagement
In the QP’s opinion, the Grasberg minerals district has adequate plans and programs in place, is in good standing with Indonesian environmental regulatory authorities, and no current conditions represent a material risk to continued operations. The Grasberg minerals district staff has a high level of understanding of the requirements of environmental compliance, permitting, and local stakeholders in order to facilitate the development of the mineral reserve and mineral resource estimates. The periodic inspections by governmental agencies, FCX corporate staff, third-party reviews, and regular reporting confirm this understanding.
18CAPITAL AND OPERATING COSTS | ||
The capital and operating costs are estimated by the property’s operations, engineering, management, and accounting personnel in consultation with FCX corporate staff, as appropriate. The cost estimates are applicable to the planned production, mine schedule, and equipment requirements for the LOM plan. The capital costs are summarized in Table 18.1.
| as of December 31, 2021 | 73 | ||||
| Technical Report Summary for Grasberg minerals district, Papua, Indonesia | ||||
Table 18.1 – Capital Costs
| $ billions | |||||
| Mine | $ | 7.5 | |||
| Concentrator | 3.9 | ||||
| Supporting Infrastructure | 2.3 | ||||
| Total Capital Expenditures | $ | 13.7 | |||
Estimates are derived from current costs and adjusted to the reserve price environment. The estimates are not adjusted for escalation or exchange rate fluctuations. Actual realized costs are reviewed periodically and estimates are refined as required.
Capital costs include development and sustaining projects for the production of the scheduled reserves. Capital cost estimates are derived from current capital costs based on extensive experience gained from many years of operating the property and do not include inflation. FCX and the PT-FI mine staff review actual costs periodically and refine cost estimates as appropriate.
Mine capital costs include development of the KL ore body as well as sustaining development for the GBC and DMLZ deposits. Concentrator capital costs include sustaining capital for the mill complex as well as capital expenditures at the processing facilities to optimize the handling of underground ore from the GBC, DMLZ and KL deposits. Increases in power loads at these processing facilities and the underground mines are expected to require additional power generation with capital expenditures for new power generation, upgrades to existing transmission lines, and refurbishment of the existing three coal units.
The operating costs for the LOM plan are summarized in Table 18.2.
| as of December 31, 2021 | 74 | ||||
| Technical Report Summary for Grasberg minerals district, Papua, Indonesia | ||||
Table 18.2 – Operating Costs

The operating cost estimates are derived from current operating costs and practices based on extensive experience gained from many years of operating the property and do not include inflation. The operating cost estimates reflect certain pricing assumptions, primarily for energy and foreign exchange rates, that are reflective of the copper market environment ($2.50 per pound copper price) at which the reserve plan has been prepared. As the property has a long operating history, FCX believes that the accuracy of the cost estimates is better than the minimum of approximately +/- 25 percent required for a pre-feasibility study level of mineral reserves as per S-K1300, and the level of risk in the cost forecasting is low. FCX and the PT-FI mine staff review actual costs periodically and refine cost estimates as appropriate.
The LOM plan summary in this TRS is developed to support the economic viability of the mineral reserves. The latest guidance regarding updated operational forecast cost estimates are available in FCX’s Annual Report on Form 10-K for the year ended December 31, 2021, filed with the SEC.
| as of December 31, 2021 | 75 | ||||
| Technical Report Summary for Grasberg minerals district, Papua, Indonesia | ||||
19ECONOMIC ANALYSIS | ||
The LOM plan includes comprehensive operational drivers (mine and corresponding processing plans, metal production schedules and corresponding equipment plans) and financial estimates (revenues, capital costs, operating costs, downstream processing, freight, taxes and royalties, etc.) to produce the reserves over the life of the property. The LOM plan is an operational and financial model that also forecasts annual cash flows of the production schedule of the reserves for the life of the property under the assumed pricing and cost assumptions. The LOM plan is used for economic analyses, sensitivity testing, and mine development evaluations.
The financial forecast incorporates revenues and operating costs for all produced metals, processing streams, and overall site management for the life of the property. The economic analysis summary in Table 19.1 includes the material drivers of the economic value for the property and includes the net present value (NPV) of the unleveraged after-tax free cash flows as the key metric for the economic value of the property’s reserve plan under these pricing and cost assumptions. This analysis does not include economic measures such as internal rate of return or payback period for capital since these measures are not applicable (and are not calculable) for an on-going operation that does not have a significant upfront capital investment to be recovered.
| as of December 31, 2021 | 76 | ||||
| Technical Report Summary for Grasberg minerals district, Papua, Indonesia | ||||
Table 19.1 – Economic Analysis

The key drivers of the economic value of the property include the market prices, metal grades and recoveries, and costs. Depending on the changes in these key drivers, FCX can adjust operating plans (in the near-term as well as the long-term, as appropriate) to minimize negative impacts to the overall economic value of the property.
Table 19.2 summarizes the economic impact of changes to these key drivers on the property’s NPV (as included in Table 19.1). The sensitivities are estimates for the
| as of December 31, 2021 | 77 | ||||
| Technical Report Summary for Grasberg minerals district, Papua, Indonesia | ||||
changes in each key drivers’ effect on the base plan summarized for the production of the mineral reserves over the life of the property.
Table 19.2 – Sensitivity Analysis

The after-tax NPV of the LOM plan is most sensitive to price, followed by grades and recovery, and then operating costs. The sensitivity analysis does not reflect changes in mine plans or costs with changes in the reported driver. Sustained periods in these economic scenarios would warrant a re-evaluation of the LOM plan assumptions, planned development, and reported mineral reserves.
Table 19.3 summarizes the LOM plan including the annual metal production volumes, mine plan schedule, capital and operating cost estimates, unit net cash costs, and unleveraged after-tax free cash flows over the life of the property. Free cash flow is the operating cash flow less the capital costs and is a key metric to demonstrate the cash that the property is projected to generate from its operations after capital investments for the reserve production plan at assumed pricing and cost assumptions. The property’s ability to create value from the reserves is determined by its ability to generate positive free cash flow. The summary demonstrates the favorable free cash flow generated from the property’s LOM plan under the assumptions. This economic analysis supports the economic viability of the mineral reserves statement.
| as of December 31, 2021 | 78 | ||||
| Technical Report Summary for Grasberg minerals district, Papua, Indonesia | ||||
Table 19.3 – LOM Plan Summary

20ADJACENT PROPERTIES | ||
As of December 31, 2021, there are no adjacent properties impacting the Grasberg minerals district mineral reserve or mineral resource estimates.
21OTHER RELEVANT DATA AND INFORMATION | ||
In the opinion of the QPs, there is no additional information necessary for the mineral reserve and mineral resource estimates in this TRS. Further discussion regarding operational risks, health and safety programs, and other business aspects of the mine are available in FCX’s Annual Report on Form 10-K for the year ended December 31, 2021.
22INTERPRETATION AND CONCLUSIONS | ||
Estimates of mineral reserves and mineral resources are prepared by and are the responsibility of FCX employees. All relevant geologic, engineering, economic, metallurgical, and other data is prepared according to FCX developed procedures and guidelines based on accepted industry practices. FCX maintains a process of verifying and documenting the mineral reserve and mineral resource estimates, information for
| as of December 31, 2021 | 79 | ||||
| Technical Report Summary for Grasberg minerals district, Papua, Indonesia | ||||
which are located at the mine site and FCX corporate offices. FCX conducts ongoing studies of its ore bodies to optimize economic value and to manage risk.
FCX and the QPs believe that the geologic interpretation and modeling of exploration data, economic analysis, mine design and sequencing, process scheduling, and operating and capital cost estimation have been developed using accepted industry practices and that the stated mineral reserves and mineral resources comply with SEC regulations. Periodic reviews by third-party consultants confirm these conclusions.
The Grasberg minerals district is a large-scale producing mining property that has been operated by FCX and its predecessors for many years. Mineral reserve and mineral resource estimates consider technical, economic, environmental, and regulatory parameters containing inherent risks. Changes in grade and/or metal recovery estimation, realized metal prices, and operating and capital costs have a direct relationship to the cash flow and profitability of the mine. Other aspects such as changes to environmental or regulatory requirements could alter or restrict the operating performance of the mine. Significant differences from the parameters used in this TRS would justify a re-evaluation of the reported mineral reserve and mineral resource estimates. Mine site administration and FCX dedicate significant resources to managing these risks.
23RECOMMENDATIONS | ||
Although ongoing initiatives in productivity and recovery improvements are underway, the mineral reserves and mineral resources are based on the stated long-term metal prices and corresponding technical and economic performance data.
No recommendations for additional work are identified for the reported mineral reserves and mineral resources as of December 31, 2021.
24REFERENCES | ||
Leys, C. A., Cloos, M., New, B. T. E., and MacDonald, G. D. (2012). Copper ± Molybdenum Deposits of the Ertsberg-Grasberg District, Papua, Indonesia. Society of Economic Geologists, Inc., Special Publication (16), 215–235.
25RELIANCE ON INFORMATION PROVIDED BY THE REGISTRANT | ||
FCX is experienced in managing the challenges and requirements of operating at local, regional, national, and international levels to support requirements for successfully mining metals throughout the world, using functioning divisions, departments, and teams, organized at mine sites and at the corporate level, that are tasked with meeting and supporting FCX business and operations requirements. These closely integrated departments are focused on subjects that may be peripheral to the direct production of salable metals but are essential to meeting all business requirements for FCX and to navigating the many aspects of modern mining.
As an illustrative example of the FCX organization, within the Corporate Support and Marketing division, there are departments of Finance and Accounting, Financial Reporting, Taxes, General Counsel, Communications, and Business Development groups. Other corporate teams are similarly organized to provide additional broad
| as of December 31, 2021 | 80 | ||||
| Technical Report Summary for Grasberg minerals district, Papua, Indonesia | ||||
services. These departments support and integrate with the operating divisions providing requirements and information. A mine site, as part of the operating divisions, will be organized into its own management teams including Mine Management, Operations, Maintenance and Construction, Processing Management, Finance and Accounting, Social Responsibility and Community Development, Environmental, Regional Supply Chain, and Human Resources. These staffed teams are organized to provide responses to the many mining requirements, and they are expert in conducting their specific duties. They represent reliable sources for information and as such, they have been consulted to prepare, support, and characterize the information in this TRS.
Specific to the preparation of this TRS, FCX departments have provided the following categories of information:
•Macro-economic trends, data, interest rates, and assumptions.
•Marketing information.
•Legal matters outside of QP expertise.
•Environmental matters outside of QP expertise.
•Accommodations through community development to local groups.
•Governmental factors outside of QP expertise.
The QPs prepared Sections 3, 4, 5, 15, 16, 17, 18, 19, 20, and 21 of this TRS in reliance on the information provided by FCX above.
As explained, FCX corporate and mine site divisions that provided information for this TRS are business-directed areas that must produce reliable information in support of FCX business objectives. This organizational form contributes to producing expected results for FCX and provides appropriate information supporting mineral reserves and mineral resource estimates.
| as of December 31, 2021 | 81 | ||||
| Technical Report Summary for Grasberg minerals district, Papua, Indonesia | ||||
26GLOSSARY – UNITS OF MEASURE AND ABBREVIATIONS | ||
| Unit | Unit of Measure | ||||
| #, No. | number | ||||
| $ | U.S. Dollar | ||||
| % | percent | ||||
| dmt | dry metric ton | ||||
| g | gram | ||||
| gal | gallon | ||||
| gpm | gallon per minute | ||||
| k | thousand | ||||
| kg | kilogram | ||||
| km | kilometer | ||||
| ktpd | thousand metric tons per day | ||||
| kV | kilovolt | ||||
| kWh | kilowatt-hour | ||||
| lb | U.S. pound | ||||
| m | meter | ||||
| M | million | ||||
| mm | millimeter | ||||
| MW | megawatt | ||||
| oz | troy ounce | ||||
| t | metric ton | ||||
| Abbreviation | Description | ||||
| AAS | Atomic Absorption Spectroscopy | ||||
| AMDAL | Analisis Mengenai Dampak Lingkungan | ||||
| Au | Gold | ||||
| BG | Big Gossan | ||||
| BWI | Bond Work Index | ||||
| COW | Contract of Work | ||||
| CRM | Certified Reference Material | ||||
| Cu | Copper | ||||
| DDH | Diamond Drill Hole | ||||
| DFPP | Dual-Fuel Power Plant | ||||
| DMLZ | Deep Mill Level Zone | ||||
| DOZ | Deep Ore Zone | ||||
| EESS | Ertsberg East Skarn System | ||||
| EqCu | Equivalent Copper Grade | ||||
| ESIA | Environmental and Social Impact Assessment | ||||
| FCX | Freeport-McMoRan Inc. and its consolidated subsidiaries | ||||
| GA | PT Geoservices-GeoAssay | ||||
| GB | Gunung Bijih | ||||
| GBC | Grasberg Block Cave | ||||
| GBT | Gunung Bijih Timur | ||||
| as of December 31, 2021 | 82 | ||||
| Technical Report Summary for Grasberg minerals district, Papua, Indonesia | ||||
| GIC | Grasberg Intrusive Complex | ||||
| GOI | Government of Indonesia | ||||
| GRS_OP | Grasberg Open-Pit | ||||
| GRSKL | Grasberg and Kucing Liar | ||||
| HPGR | High-Pressure Grinding Roll | ||||
| IOZ | Intermediate Ore Zone | ||||
| IPPKH | Borrow to Use of Forest Area Permits | ||||
| IUPK | Ijin Usaha Pertambangan Khusus (Special Mining Business Permit) | ||||
| KL | Kucing Liar | ||||
| LIMS | Laboratory Information Management System | ||||
| LOM | Life-of-Mine | ||||
| MGI | Main Grasberg Intrusive | ||||
| ModADA | Modified Ajkwa Deposition Area | ||||
| MoEF | Ministry of Environment and Forestry (Indonesia) | ||||
| MP | Mile post | ||||
| NA | Not Applicable | ||||
| NPV | Net Present Value | ||||
| OK | Ordinary Kriging | ||||
| P.E. | Professional Engineer | ||||
| P.Geo. | Professional Geoscientist | ||||
| PT-FI | PT Freeport Indonesia (subsidiary of FCX) | ||||
| QA/QC | Quality Assurance and Quality Control | ||||
| QP | Qualified Person | ||||
| RM-SME | Registered Member of the Society of Mining, Metallurgy and Exploration (U.S.) | ||||
| RQD | Rock Quality Designation | ||||
| SAG | Semi-Autogenous Grinding | ||||
| SEC | Securities and Exchange Commission (U.S.) | ||||
| SFKK | PT Sucofindo Kuala Kencana | ||||
| SG | Specific Gravity | ||||
| SGS | SGS Mineral Services | ||||
| S-K1300 | Subpart 1300 of SEC Regulation S-K | ||||
| TCT | FCX’s Technology Center facilities in Tucson, Arizona | ||||
| TRS | Technical Report Summary | ||||
| U.S. | United States | ||||
| UTM | Universal Transverse Mercator | ||||
| VPA | Vertical Pressure Filter | ||||
| YVS | Yellow Valley Syncline | ||||
| as of December 31, 2021 | 83 | ||||
Exhibit 96.3

Technical Report Summary of
Mineral Reserves and Mineral Resources
for
Morenci Mine
Arizona, U.S.
| Effective Date: | December 31, 2021 | ||||
| Report Date: | January 31, 2022 | ||||
IMPORTANT NOTE
This Technical Report Summary (TRS) has been prepared for Freeport-McMoRan Inc. (FCX) in support of the disclosure and filing requirements of the United States (U.S.) Securities and Exchange Commission (SEC) under Subpart 1300 of Regulation S-K. The quality of information, conclusions, and estimates contained herein apply as of the date of this TRS. Events (including changes to the assumptions, conditions, and/or qualifications outlined in this TRS) may have occurred since the date of this TRS, which may substantially alter the conclusions and opinions herein. Any use of this TRS by a third-party beyond its intended use is at that party’s sole risk.
CAUTIONARY STATEMENT
This TRS contains forward-looking statements in which potential future performance is discussed. The words “anticipates,” “may,” “can,” “plans,” “believes,” “estimates,” “expects,” “projects,” “targets,” “intends,” “likely,” “will,” “should,” “could,” “to be,” “potential,” “assumptions,” “guidance,” “aspirations,” “future” and any similar expressions are intended to identify those assertions as forward-looking statements. Forward-looking statements are all statements other than statements of historical facts, such as plans, projections, forecasts or expectations relating to business outlook, strategy, goals, or targets; ore grades and processing rates; production and sales volumes; unit net cash costs; net present values; economic assessments; capital expenditures; operating costs; operating or Life-of-Mine (LOM) plans; cash flows; FCX’s commitments to deliver responsibly produced copper, including plans to implement and validate all of its operating sites under The Copper Mark, and to comply with other disclosure frameworks; improvements in operating procedures and technology innovations; potential environmental and social impacts; exploration efforts and results; development and production activities, rates and costs; future organic growth opportunities; tax rates; export quotas and duties; impact of price changes in the commodities FCX produces, primarily copper; mineral resource and mineral reserve estimates and recoveries; and information pertaining to the financial and operating performance and mine life of the Morenci mine.
Readers are cautioned that forward-looking statements in this TRS are necessarily based on opinions and estimates of the Qualified Persons (QPs) authoring this TRS, are not guarantees of future performance, and actual results may differ materially from those anticipated, expected, projected or assumed in the forward-looking statements. Material assumptions regarding forward-looking statements are discussed in this TRS, where applicable. In addition to such assumptions, the forward-looking statements are inherently subject to significant business, economic and competitive uncertainties, and contingencies. Important factors that can cause actual results to differ materially from those anticipated in the forward-looking statements include, but are not limited to, supply of and demand for, and prices of, the commodities FCX produces, primarily copper; changes in cash requirements, financial position, financing or investment plans; changes in general market, economic, tax, regulatory, or industry conditions; reductions in liquidity and access to capital; the ongoing COVID-19 pandemic and any future public health crisis; political and social risks; operational risks inherent in mining, with higher inherent risks in underground mining; availability and increased costs associated with mining inputs and labor; fluctuations in price and availability of commodities purchased, including higher prices for fuel, steel, power, labor, and other consumables contributing to higher costs; constraints on supply and logistics, including transportation services; mine sequencing; changes in mine plans or operational modifications, delays, deferrals, or cancellations; production rates; timing of shipments; results of technical, economic, or feasibility studies; potential inventory adjustments; potential impairment of long-lived mining assets; expected results from improvements in operating procedures and technology, including innovation initiatives; industry risks; financial condition of FCX’s customers, suppliers, vendors, partners, and affiliates; cybersecurity incidents; labor relations, including labor-related work stoppages and costs; compliance with applicable environmental, health and safety laws and regulations; weather- and climate-related risks; environmental risks and litigation results; FCX’s ability to comply with its responsible production commitments under specific frameworks and any changes to such frameworks; and other factors described in more detail under the heading “Risk Factors” contained in Part I, Item 1A. of FCX’s Annual Report on Form 10-K for the year ended December 31, 2021, filed with the SEC.
Investors are cautioned that many of the assumptions upon which the forward-looking statements are based are likely to change after the date the forward-looking statements are made, including for example commodity prices, which FCX cannot control, and production volumes and costs or technological solutions and innovation, some aspects of which FCX may not be able to control. Further, FCX may make changes to its business plans that could affect its results. FCX and the QPs who authored this TRS caution investors that FCX undertakes no obligation to update any forward-looking statements, which speak only as of the date made, notwithstanding any changes in the assumptions, changes in business plans, actual experience, or other changes.
This TRS also contains financial measures such as site cash costs and unit net cash costs per pound of metal and free cash flow, which are not recognized under U.S. generally accepted accounting principles.
Qualified Person Signature Page
| Mine: | Morenci | ||||
| Effective Date: | December 31, 2021 | ||||
| Report Date: | January 31, 2022 | ||||
| /s/ James Young | |||||
| James Young, P.Eng., RM-SME | |||||
| Manager of Mine Planning – Reserves | |||||
| /s/ Paul Albers | |||||
| Paul Albers, P.Geo., RM-SME | |||||
| Exploration Leader – Americas | |||||
| /s/ Luis Tejada | |||||
| Luis Tejada, Ing. Geol. Peru, RM-SME | |||||
| Manager of Geomechanical Engineering | |||||
| /s/ Jacklyn Steeples | |||||
| Jacklyn Steeples, RM-SME | |||||
| Manager of Processing Operational Improvement | |||||
| /s/ Leonard Hill | |||||
| Leonard Hill, RM-SME | |||||
| Director of Metallurgy and Strategic Planning | |||||
| Technical Report Summary for Morenci Mine, Arizona, U.S. | ||||
Table of Contents
| as of December 31, 2021 | iv | ||||
| Technical Report Summary for Morenci Mine, Arizona, U.S. | ||||
List of Tables
List of Figures
| as of December 31, 2021 | v | ||||
| Technical Report Summary for Morenci Mine, Arizona, U.S. | ||||
1EXECUTIVE SUMMARY | ||
This Technical Report Summary (TRS) is prepared by Qualified Persons (QPs) for Freeport-McMoRan Inc. (FCX), a leading international mining company with headquarters located in Phoenix, Arizona, United States (U.S.). The purpose of this TRS is to report mineral reserve and mineral resource estimates at the Morenci mine using estimation parameters as of December 31, 2021.
1.1Property Description, Current Status, and Ownership
The Morenci mine is an open-pit copper and molybdenum mining complex. The mine is located in Greenlee County, Arizona, approximately 50 miles northeast of the city of Safford on U.S. Highway 191.
The mine operates 365 days per year on a 24 hour per day schedule. Mining and ore processing operations are currently in production and the mine is considered a production stage property.
The Morenci mine is an unincorporated joint venture owned 72 percent by FCX, with the remaining 28 percent owned by Sumitomo Metal Mining Arizona, Inc. (15 percent) and Sumitomo Metal Mining Morenci, Inc. (13 percent). Each partner takes in kind its share of Morenci’s production. FCX is the operator of the joint venture and holds registered title to the mineral claims.
As of December 31, 2021, the Morenci mine encompasses approximately 61,700 acres, comprising 51,300 acres of fee lands and 10,400 acres of unpatented mining claims held on public mineral estate and numerous state or federal permits, easements and rights-of-ways.
1.2Geology and Mineralization
The mineral deposits of the Morenci district consist of copper oxide, secondary sulfide, and primary sulfide mineralization associated with a large porphyry copper system. Geologic studies indicate that a complex series of Tertiary igneous intrusive rocks were emplaced within Precambrian-age granite and overlying Paleozoic and Mesozoic sedimentary rocks. A porphyry copper deposit formed and was associated with the emplacement and crystallization of intrusive rocks. Several cycles of leaching and enrichment of the primary sulfides formed the secondary sulfide enrichment blanket and copper oxide zones currently being mined. Mineralization spans approximately 5 miles in a north-south direction and 4 miles in an east-west direction.
1.3Mineral Reserve Estimate
Mineral reserves are summarized from the Life-of-Mine (LOM) plan, which is the compilation of the relevant modifying factors for establishing an operational, economically viable mine plan.
Mineral reserves have been evaluated considering the modifying factors for conversion of measured and indicated resource classes into proven and probable reserves. Inferred resources are considered as waste in the LOM plan. The details of the relevant modifying factors included in the estimation of mineral reserves are discussed in Sections 10 through 21.
| as of December 31, 2021 | 6 | ||||
| Technical Report Summary for Morenci Mine, Arizona, U.S. | ||||
The LOM plan includes the planned production to be extracted from the in-situ mine designs and from previously extracted material, known as Work-In-Process (WIP) inventories. WIP includes material on crushed leach and Run of Mine (ROM) leach pads for processing, and in stockpiles set aside to be rehandled and processed at a future date. WIP is estimated as of December 31, 2021 from production of reported deliveries through mid-year and the expected production to the end of the year.
As a point of reference, the mineral reserve estimate reports the in-situ ore and WIP inventories from the LOM plan containing copper and molybdenum metal and reported as commercially recoverable metal.
Table 1.1 summarizes the mineral reserves reported on a 100 percent property ownership basis. The mineral reserve estimate is based on commodity prices of $2.50 per pound copper and $10 per pound molybdenum.
Table 1.1 – Summary of Mineral Reserves

The mineral reserve estimate has been prepared using industry accepted practice and conforms to the disclosure requirements of the U.S. Securities and Exchange Commission (SEC) under Subpart 1300 of Regulation S-K (S-K1300). Mineral reserve and mineral resource estimates are evaluated annually, providing the opportunity to reassess the assumed conditions. All the technical and economic issues likely to
| as of December 31, 2021 | 7 | ||||
| Technical Report Summary for Morenci Mine, Arizona, U.S. | ||||
influence the prospect of economic extraction are anticipated to be resolved under the stated assumed conditions.
1.4Mineral Resource Estimate
Mineral resources are evaluated using the application of technical and economic factors to a geologic resource block model and employing optimization algorithms to generate digital surfaces of mining limits, using specialized geologic and mine planning computer software. The resulting surfaces volumetrically identify material as potentially economical, using the assumed parameters. Mineral resources are the resultant contained metal inventories.
The mineral resource estimate is the inventory of material identified as having a reasonable likelihood for economic extraction inside the mineral resource economic mining limit, less the mineral reserve volume, as applicable. The modifying factors are applied to measured, indicated, and inferred resource classifications to evaluate commercially recoverable metal. As a point of reference, the in-situ ore containing copper, and molybdenum metal are inventoried and reported by intended processing method.
The reported mineral resource estimate in Table 1.2 is exclusive of the reported mineral reserve, on a 100 percent property ownership basis. The mineral resource estimate is based on commodity prices of $3.00 per pound copper and $12 per pound molybdenum.
| as of December 31, 2021 | 8 | ||||
| Technical Report Summary for Morenci Mine, Arizona, U.S. | ||||
Table 1.2 – Summary of Mineral Resources

The mineral resource estimate has been prepared using industry accepted practice and conforms to the disclosure requirements of S-K1300. Mineral reserve and mineral resource estimates are evaluated annually providing the opportunity to reassess the assumed conditions. Although all the technical and economic issues likely to influence the prospect of economic extraction of the resource are anticipated to be resolved under the stated assumed conditions, no assurance can be given that the estimated mineral resource will become proven and probable mineral reserves.
1.5Capital and Operating Cost Estimates
The capital and operating costs are estimated by the property’s operations, engineering, management, and accounting personnel in consultation with FCX corporate staff, as appropriate. The cost estimates are applicable to the planned production, mine schedule, and equipment requirements for the LOM plan. The capital costs are summarized in Table 1.3.
| as of December 31, 2021 | 9 | ||||
| Technical Report Summary for Morenci Mine, Arizona, U.S. | ||||
Table 1.3 – Sustaining Capital Costs
| $ billions | |||||
| Mine | $0.9 | ||||
| Leach and SX/EW | 1.8 | ||||
| Concentrator | 0.8 | ||||
| Supporting Infrastructure and Environmental | 0.2 | ||||
| Total Capital Expenditures | $3.7 | ||||
Estimates are derived from current costs and adjusted to the reserve price environment. The estimates are not adjusted for escalation or exchange rate fluctuations. Actual realized costs are reviewed periodically, and estimates are refined as required.
Capital costs are primarily sustaining projects consisting of mine equipment replacements and planned site infrastructure projects, most notably to increase leach pad and tailings storage facility (TSF) capacities over the production of the scheduled reserves. Capital cost estimates are derived from current capital costs based on extensive experience gained from many years of operating the property and do not include inflation. FCX and the Morenci mine staff review actual costs periodically and refine cost estimates as appropriate.
The operating costs for the LOM plan are summarized in Table 1.4.
Table 1.4 – Operating Costs
| $ billions | |||||
| Mine | $11.0 | ||||
| Leach and SX/EW | 5.4 | ||||
| Concentrator | 5.9 | ||||
| Balance | 3.8 | ||||
| Total site cash operating costs | 26.1 | ||||
| Freight | 0.6 | ||||
| Treatment charges | 0.5 | ||||
| By-product credits | (1.3) | ||||
| Total net cash costs | $25.9 | ||||
| Unit net cash cost ($ per pound of copper) | $1.98 | ||||
Estimates are derived from current costs and adjusted to the reserve price environment. The estimates are not adjusted for escalation or exchange rate fluctuations. Actual realized costs are reviewed periodically, and estimates are refined as required.
The operating cost estimates are derived from current operating costs and practices based on extensive experience gained from many years of operating the property and do not include inflation.
1.6Permitting Requirements
In the QP’s opinion, the Morenci mine has adequate plans and programs in place, is in good standing with environmental regulatory authorities, and no current conditions represent a material risk to continued operations. The Morenci mine staff have a high
| as of December 31, 2021 | 10 | ||||
| Technical Report Summary for Morenci Mine, Arizona, U.S. | ||||
level of understanding of the requirements of environmental compliance, permitting, and local stakeholders in order to facilitate the development of the mineral reserve and mineral resource estimates. The periodic inspections by governmental agencies, FCX corporate staff, third-party reviews, and regular reporting confirm this understanding.
Based on the LOM plan, additional permits will be necessary in the future for continued operation of the Morenci mine, including Aquifer Protection Permit (APP) amendment applications and obtaining of Arizona Department Environmental Quality (ADEQ) approval for increased leach pad stockpile and tailings storage capacities under the existing APP.
1.7Conclusions and Recommendations
FCX and the QPs believe that the geologic interpretation and modeling of exploration data, economic analysis, mine design and sequencing, process scheduling, and operating and capital cost estimation have been developed using accepted industry practices and that the stated mineral reserves and mineral resources comply with SEC regulations. Periodic reviews by third-party consultants confirm these conclusions.
No recommendations for additional work are identified for the reported mineral reserves and mineral resources as of December 31, 2021.
2INTRODUCTION | ||
This TRS is prepared by QPs for FCX, a leading international mining company with headquarters located in Phoenix, Arizona, U.S. The purpose of this TRS is to report mineral reserve and mineral resource estimates at the Morenci mine using estimation parameters as of December 31, 2021.
2.1Terms of Reference and Sources of Information
FCX owns and operates several affiliates or subsidiaries. This TRS uses the name “FCX” interchangeably for Freeport-McMoRan Inc. and its consolidated subsidiaries.
FCX operates large, long-lived, geographically diverse assets with significant proven and probable reserves of copper, gold, and molybdenum. FCX has a dynamic portfolio of operating, expansion, and growth projects in the copper industry and is the world’s largest producer of molybdenum.
FCX maintains standards, procedures, and controls in support of estimating mineral reserves and mineral resources. The QPs, including the Manager of Mine Planning – Reserves, annually review the estimates of mineral reserves and mineral resources prepared by mine site and FCX corporate employees, the supporting documentation, and compliance to internal controls. Based on their review, the QPs recommend approval of the mineral reserve and mineral resource statements to FCX senior management.
The reported estimates and supporting background information, conclusions, and opinions contained herein are based on company reports, property data, public information, and assumptions supplied by FCX employees and other third-party sources including the reports and documents listed in Section 24 of this TRS, available at the time of writing this TRS.
| as of December 31, 2021 | 11 | ||||
| Technical Report Summary for Morenci Mine, Arizona, U.S. | ||||
Unless otherwise stated, all figures and images were prepared by FCX. Units of measurement referenced in this TRS are based on local convention in use at the property and currency is expressed in US dollars.
The effective date of this TRS is December 31, 2021. FCX has previously reported mineral reserves and mineralized material for the Morenci mine but has not filed a TRS with the SEC. The estimates in this TRS supersede any previous estimates of mineral reserves and mineral resources for the Morenci mine.
Mineral reserves and mineral resources are reported in accordance with the requirements of S-K1300.
2.2Qualified Persons
This TRS has been prepared by the following QPs:
•James Young, Manager of Mine Planning – Reserves
•Paul Albers, Exploration Leader – Americas
•Luis Tejada, Manager of Geomechanical Engineering
•Jacklyn Steeples, Manager of Processing Operational Improvement
•Leonard Hill, Director of Metallurgy and Strategic Planning
James Young is Manager of Mine Planning – Reserves for the Strategic Planning department of FCX. He has over 20 years of experience working for large-scale, open-pit operations in Peru, Chile, Indonesia, Canada, and the U.S. He holds a Bachelor of Applied Science in Mining and Mineral Process Engineering from the University of British Columbia and is registered as a Professional Engineer (P.Eng.) with Engineers and Geoscientists of British Columbia, Canada. Mr. Young is a Registered Member of the Society of Mining, Metallurgy and Exploration (RM-SME). In his role with FCX, he discusses aspects of the mine with site staff regarding overall approach to mine planning, current operating conditions, targeted production expectations, and options for potential resource development. He has visited the site various times throughout his career. His most recent was on February 6, 2020.
Paul Albers is the Exploration Leader – Americas for the Exploration department of FCX. He has over 16 years of mineral exploration and mining experience, including 11 years in copper-molybdenum porphyry deposits in North America and South America. He holds a Bachelor of Science degree in Geology from St. Norbert College and Master of Science degree in Geology from the University of Minnesota-Duluth. He is registered as a Certified Professional Geologist (P.Geo.) with the State of Minnesota. Mr. Albers is a RM-SME. In his role with FCX, he provides technical support and collaborates with site staff on exploration and mineral resource modeling programs. He has visited the site various times throughout his career. His most recent was on March 11, 2021.
Luis Tejada is Manager of Geomechanical Engineering for the Strategic Planning department of FCX. He has over 20 years of experience working for large-scale, open-pit operations in Peru and the U.S. He holds a Bachelor of Science in Geological Engineering from the San Agustin University in Arequipa, Peru, and is registered as a Geological Engineer (Ing. Geol.) with the Colegio de Ingenieros del Peru. He is a RM-SME. In his role, he provides technical support and collaborates with site staff on geomechanical engineering, slope monitoring systems, mine hydrogeology, options for slope design improvements and slope optimization. He worked at the Morenci mine from
| as of December 31, 2021 | 12 | ||||
| Technical Report Summary for Morenci Mine, Arizona, U.S. | ||||
2016 to 2019 and has visited the site various times since. His most recent visit was on June 18, 2021.
Jacklyn Steeples is Manager of Processing Operational Improvement for FCX and has over 10 years of experience working for large-scale, open-pit copper processing operations including leach and solution extraction (SX) and electrowinning (EW), concentrator, and crush and convey divisions. She holds a Bachelor of Science in Chemical Engineering from the Colorado School of Mines. She is a RM-SME. In her role with FCX, she collaborates with site staff on leach pad placements, SX/EW operations, current operating conditions performance, and improvements for hydrometallurgical operations. She worked at the Morenci mine from 2005 to 2013 and has visited the site various times throughout her career. Her most recent visit to the mine was on August 26, 2020.
Leonard Hill is employed by FCX. He has over 30 years of experience working for large-scale, copper, and molybdenum processing operations in the U.S. With FCX, he has worked in technical services, concentrator operations, supply chain management and operational improvement. He holds a Bachelor of Science degree in Metallurgical Engineering from the Colorado School of Mines and a Master of Business Administration degree in Supply Chain Management from Arizona State University. He is a RM-SME. In his role as Director of Technical Services with FCX, he provides technical support to Morenci mineral processing facilities, including capital project process design, process performance assessments, and process optimization recommendations. His most recent visit to the mine was on March 2, 2020.
The QPs reviewed the reasonableness of the background information for the estimates. The details of the QPs’ responsibilities for this TRS are outlined in Table 2.1.
Table 2.1 – Qualified Person Responsibility
| Qualified Person | Responsibility | ||||
| James Young | Sections 2 through 5, 11.2 through 13.1, 13.1.3 through 13.3, 15 through 26, and corresponding sections of the Executive Summary | ||||
| Paul Albers | Sections 2, 6 through 7.5, 7.8, 8, 9, 11.1, 21 through 26, and corresponding sections of the Executive Summary | ||||
| Luis Tejada | Sections 2, 7.6 through 7.8, 13.1.1, 13.1.2, 21 through 26, and corresponding sections of the Executive Summary | ||||
| Jacklyn Steeples | Sections 2, 10, 12, 14, 15, 18, 21 through 26, and corresponding sections of the Executive Summary | ||||
| Leonard Hill | Sections 2, 10, 12, 14, 15, 18, 21 through 26, and corresponding sections of the Executive Summary | ||||
| as of December 31, 2021 | 13 | ||||
| Technical Report Summary for Morenci Mine, Arizona, U.S. | ||||
3PROPERTY DESCRIPTION AND LOCATION | ||
The Morenci mine is an open-pit copper and molybdenum mining complex. The mine is located in Greenlee County, Arizona, approximately 50 miles northeast of the city of Safford on U.S. Highway 191.
The mine operates 365 days per year on a 24 hour per day schedule. Mining and ore processing operations are currently in production and the mine is considered a production stage property.
3.1Property Location
The property location map is illustrated in Figure 3.1.
Figure 3.1 – Property Location Map

The property is located at latitude 33.07 degrees north and longitude 109.35 degrees west using the World Geodetic System 84 coordinate system.
3.2Ownership
The Morenci mine is an unincorporated joint venture owned 72 percent by FCX, with the remaining 28 percent owned by Sumitomo Metal Mining Arizona, Inc. (15 percent) and Sumitomo Metal Mining Morenci, Inc. (13 percent). Each partner takes in kind its share of Morenci’s production. FCX is the operator of the joint venture and holds registered title to the mineral claims.
| as of December 31, 2021 | 14 | ||||
| Technical Report Summary for Morenci Mine, Arizona, U.S. | ||||
3.3Land Tenure
As of December 31, 2021, the Morenci mine encompasses approximately 61,700 acres, comprising 51,300 acres of fee lands and 10,400 acres of unpatented mining claims held on public mineral estate and numerous state or federal permits, easements, and rights-of-ways. Figure 3.2 shows a map of the land claim status.
Figure 3.2 – Morenci Mine Mineral Claim Map

3.4Mineral Rights and Significant Permitting
The 51,300 acres of fee lands are considered private lands and include the surface and all the mineral rights on this patented land. There is no limit to the depth of the mineral rights or time provisions in which the minerals must be extracted. The fee lands are subject to property taxes.
FCX holds 533 unpatented mining claims, comprising 10,400 acres located in Greenlee County, with the Bureau of Land Management (BLM). FCX pays the annual maintenance fee for maintaining the claims to BLM and has owned and controlled most of these claims for many decades. These mineral claims were obtained from the U.S. federal government. The claims are public records and are on file in the County Recorder’s Office, Greenlee County, located in Clifton, Arizona.
The Morenci mine encompasses one small mineral lease with the state of Arizona. This lease covers approximately 332 acres, less than 1 percent of the Morenci concession. The lease agreement maintains a royalty payment in accordance with production from
| as of December 31, 2021 | 15 | ||||
| Technical Report Summary for Morenci Mine, Arizona, U.S. | ||||
the leased area. As of December 31, 2021, mining has ceased on the leased area and the agreement is set to expire on October 22, 2029.
3.5Comment on Factors and Risks Affecting Access, Title, and Ability to Perform Work
FCX and the Morenci mine staff believe that all major permits and approvals are in place to support operations at the Morenci mine. Based on the LOM plan, additional permits will become necessary in the future for increased capacities to leach pad stockpiles and TSFs as discussed in Section 17. Such processes to obtain these permits and the associated timelines are understood and similar permits have been granted in the past. FCX and the Morenci mine have environmental, land, water, and permitting departments that monitor and review all aspects of property ownership and permit requirements so that they are maintained in good standing and any issues are addressed in a timely manner.
U.S. Highway 191 is located inside the operating areas of the Morenci mine as of December 31, 2021. As the mine develops, the highway is planned to be relocated as needed. The Morenci mine staff have relocated portions of this highway various times throughout the operating history of the mine.
As of December 31, 2021, FCX and the Morenci mine believe the mine’s access, payments for titles and rights to the mineral claims, and ability to perform work on the property are all in good standing. Further, to the extent known to the QPs, there are no significant encumbrances, factors, or risks that may affect the ability to perform work in support of the estimates of mineral reserves and mineral resources.
4ACCESSIBILITY, CLIMATE, PHYSIOGRAPHY, LOCAL RESOURCES, AND INFRASTRUCTURE | ||
The property is located in Greenlee County, Arizona, in the southwestern part of the U.S.
4.1Accessibility
The Morenci mine is accessible by paved road along U.S. Highway 191. The mine is approximately 50 miles northeast of Safford, Arizona. A railway line to the property provides support for delivery of supplies and transport of metal products.
4.2Climate
The property is situated in a mountainous area at an elevation ranging between 2,750 and 6,560 feet above sea level. This region sits on the edge of the Madrean Archipelago, between the northwestern Chihuahuan Desert and the northeastern Sonoran Desert. Average monthly temperatures typically range between 46 and 85-degrees Fahrenheit. The rainfall averages 13 inches per year. The mine operates throughout the year with production marginally affected during periods of heavy rain.
4.3Physiography
Vegetation in the area is a mix of shrubs/forbs and grasses representing the Sonoran Desert scrub and the Chihuahuan Desert species. These include interior chaparral, semidesert grassland, Great Basin conifer woodland, and post-climax conifer woodland.
| as of December 31, 2021 | 16 | ||||
| Technical Report Summary for Morenci Mine, Arizona, U.S. | ||||
4.4Local Resources and Infrastructure
Infrastructure is in place to support mining operations. Section 15 contains additional detail regarding site infrastructure.
The mine maintains a company-owned townsite at the operation. Additional accommodations for mine employees and supplies are available in the nearby communities of Clifton, Safford, Tucson, and Phoenix in Arizona and Lordsburg, Silver City, and Deming in New Mexico.
Water for the Morenci mine is supplied by a combination of sources including decreed surface water rights in the San Francisco River, Chase Creek, and Eagle Creek drainages, groundwater from the Upper Eagle Creek Wellfield, and Central Arizona Project water leased from the San Carlos Apache Tribe and delivered to Morenci via exchange through the Black River Pump Station. FCX and the Morenci mine staff believe Morenci has sufficient water claims through water rights controlled by FCX to cover its operational demands in normal or slightly above-normal climatic conditions; however, FCX is a party to litigation that could impact the mine’s water rights claims or rights to continued use of currently available water supplies, which could adversely affect the water supply for Morenci mine operations.
The Morenci operation’s electrical power is supplied by FCX’s wholly owned subsidiary the Morenci Water and Electric Company (MW&E). MW&E sources its generation services through FCX’s wholly owned subsidiary Freeport-McMoRan Energy Services (FMES) through capacity rights at the Luna Energy Facility in Deming, New Mexico, and other purchase power agreements.
Site operations are adequately staffed with experienced operational, technical, and administrative personnel. FCX and the Morenci mine believe all necessary supplies are available as needed.
5HISTORY | ||
The first record of copper mineralization near Morenci appears in a report prepared by soldiers in January 1863 (Watt, 1956). Early exploration was primarily conducted by prospecting high-grade copper mineralization along lode deposits and fissure veins leading to the development of historical underground mines scattered across the district by the early 1900’s. Systematic churn drilling programs designed to delineate and evaluate this resource commenced in 1912. An extension of the Colorado highway tunnel confirmed the resource was part of the large Clay ore body being mined on the neighboring Arizona Copper property (Patton, 1945, Briggs, 2016). Various producers (namely, the Longfellow Mining Company, Detroit Copper Mining Company, Arizona Copper Company, and the Shannon Copper Company, as well as a number of other smaller producers) developed underground mine workings and integrated concentrator and smelter operations early in the district's history.
By 1921, the various producers had been consolidated under the management of a single company, the Phelps Dodge Corporation (PDC). Modern exploration in the district began in the late 1920’s when PDC drilled many test holes in the Clay ore body. Although grades were too low to warrant mining by underground methods, this drilling demonstrated continuity of mineralization that was amenable to be mined in an open-pit. Subsequent decades of drilling resulted in delineation of mineralization in the Metcalf,
| as of December 31, 2021 | 17 | ||||
| Technical Report Summary for Morenci Mine, Arizona, U.S. | ||||
Coronado, Garfield, Sun Ridge, Western Copper, Shannon, and American Mountain areas.
Underground operations had ceased by 1932 and by the late 1930’s, the district had converted to open-pit operations. The Morenci concentrator was commissioned in 1942 with a reverberatory smelter. An additional concentrator, Metcalf, was constructed in the Morenci district and started receiving ore in 1975. The Morenci smelter was closed in December 1984. Dismantling started in 1993 and was completed by the end of 1996.
In February 1986, PDC sold a 15 percent joint venture interest in the Morenci operation to Sumitomo Metal Mining Arizona, Inc., a jointly owned subsidiary of Sumitomo Metal Mining Company (SMM) (80 percent ownership) and Sumitomo Corporation (20 percent ownership). Morenci's first SX/EW facilities were commissioned in September 1987. During the fall of 1999 the Metcalf concentrator was closed, with the Morenci concentrator placed in care and maintenance status in 2001. Morenci operated as a leach-only operation until 2006 when the Morenci concentrator resumed production, with the addition of a concentrate leach plant (CLP) commissioned in October 2007. In 2009, the Morenci concentrator was placed in care and maintenance status until 2011.
In March 2007, FCX acquired PDC. From 2007 through 2013, FCX completed 868 district wide exploration and infill drill holes totaling approximately 1.7 million feet. In 2014, mining and milling production were expanded with the construction of a new concentrator housed in the old Metcalf concentrator facility. In May 2016, FCX sold an additional 13 percent interest in its Morenci unincorporated joint venture to SMM.
The Morenci mine is a well-developed property currently in operation and all previous exploration and development work has been incorporated where appropriate in the access and operation of the property. Exploration or development work is included in the data described in Sections 6 through 11 of this TRS.
6GEOLOGICAL SETTING, MINERALIZATION, AND DEPOSIT | ||
6.1Regional Geology
The Morenci district is located along the southeastern edge of a transition zone between two major geologic and physiographic provinces. The Colorado Plateau is situated about 20 miles to the north whereas the Basin and Range provinces adjoin the mining district to the south and southeast. The district appears as a triangular window of Precambrian through Tertiary-aged rocks that are surrounded and overlain by younger Tertiary and Quaternary rocks.
6.2Deposit Geology
The mineral deposits of the Morenci district consist of copper oxide, secondary sulfide, and primary sulfide mineralization associated with a large porphyry copper system. Geologic studies indicate a complex series of Tertiary igneous intrusive rocks were emplaced within Precambrian-age granite and overlying Paleozoic and Mesozoic sedimentary rocks as shown in Figure 6.1. A porphyry copper deposit formed and was associated with the emplacement and crystallization of intrusive rocks. Several cycles of leaching and enrichment of the primary sulfides formed the secondary sulfide enrichment blanket and copper oxide zones currently being mined. Mineralization spans approximately 5 miles in a north-south direction and 4 miles in an east-west direction.
| as of December 31, 2021 | 18 | ||||
| Technical Report Summary for Morenci Mine, Arizona, U.S. | ||||
Figure 6.1 – Geologic Map of Lithology in the Morenci District

The Morenci pit in the figure is sometimes referred to as the Ponderosa pit.
| as of December 31, 2021 | 19 | ||||
| Technical Report Summary for Morenci Mine, Arizona, U.S. | ||||
6.2.1Structural Geology
The rocks in the Morenci district have been affected by multiple generations of normal faults reflecting major changes in regional tectonism and stress regimes that have affected the southwestern North American continent and local stress fields (Dickinson, 1989). These structures provided pathways for supergene solutions that were fundamental to the development of secondary sulfide ore bodies in the district. Displacement along normal faults formed basins that localized volcanic and sedimentary cover sequences that preserved the mineralized block from erosion. At least four distinct orientations of faults and veins can be recognized in the Morenci district.
The earliest structural trend consists of high-angle normal faults striking 55 to 75 degrees as shown in Figure 6.2. The Quartzite and Coronado faults placed Paleozoic rocks against Proterozoic granite. Diabase dikes of Tertiary age intruded along the Quartzite and Coronado faults indicate that these structures were open during Laramide intrusive events.
Figure 6.2 – Cross Section of Lithology Through the Western Copper Mining Area

East-west cross section at 15,000 N projected to original topography. Section A-A’ correlates with the Western Copper Mining Area in Figure 6.4. Elevations are in feet.
Northeast-striking normal faults are the dominant structural orientation of the district and are important controls of magmatism and hypogene mineralization. The monzonite porphyry, older granite porphyry stocks and associated dike swarms are elongated along this trend and is the predominant orientation for quartz-sericite-sulfide veins. The San Francisco fault also strikes northeast; however, while the age of this structure is poorly understood, the San Francisco fault juxtaposes Precambrian and Paleozoic rocks against Tertiary to Quaternary volcanics, conglomerates, and gravels indicating it is significantly younger than the majority of northeast trending structures in the district.
Northerly striking faults form major boundaries to the ore bodies in the district. The Chase Creek fault dips 60 to 70 degrees to the east and extends over 9 miles in the central portion of the district.
Northeast-oriented structures are cut and offset by high-angle northwest-striking faults associated with late Cenozoic Basin and Range development. Northwest-striking faults such as the Kingbolt, Copper Mountain, Morenci Canyon, and Apache faults along the southwestern edge of the Morenci pit and the North fault bounding the northeastern edge of the Shannon block are important controls in the distribution of supergene mineralization.
| as of December 31, 2021 | 20 | ||||
| Technical Report Summary for Morenci Mine, Arizona, U.S. | ||||
Structural models are used to guide the interpretation of mineralization fabric and to bound lithological units. Interpretations of district structures were updated in 2016 to incorporate recent drilling and the latest technology for modeling the faults.
6.2.2Rock Types
In the Morenci district, rocks ranging from Early Proterozoic schist and granite through Paleozoic and Cretaceous sedimentary sequences are overlain and intruded by early to middle Tertiary igneous rocks. Following a protracted period of uplift and erosion, the Clifton-Morenci area was covered by up to 3,200 feet of Oligocene volcanic rocks with subsequent erosion resulting in thick late Miocene through Holocene basin deposits that filled structural lows to the east and southwest of the Morenci block.
Major host rocks include the Precambrian basement, which consists of granite to the north and northwest and granodiorite in the southwestern and southeastern portion of the district, and Paleozoic sedimentary rocks which are restricted to fault-bound blocks that occur in the southwestern portion of the district and in the Shannon and Garfield mine areas.
Laramide intrusive activity is manifested in the Morenci district by a staged series of Paleocene to early Eocene hypabyssal intrusions. Laramide stocks, laccoliths, and associated dikes and sills constitute a comagmatic, calc-alkaline series of porphyritic intrusions, ranging in composition from diorite to granodiorite to quartz monzonite and granite. These intrusions are separated into at least six texturally and mineralogically distinct stages. Three of these stages are associated with hydrothermal fluids responsible for porphyry copper-style chalcopyrite-molybdenite stockwork and skarn mineralization: dacite, monzonite, and older granite porphyries. Figure 6.3 shows a regional stratigraphic column and intrusive history of rocks in the district.
| as of December 31, 2021 | 21 | ||||
| Technical Report Summary for Morenci Mine, Arizona, U.S. | ||||
Figure 6.3 – Regional Stratigraphic Column

6.2.3Alteration and Mineralization
Primary hypogene mineralization is associated with emplacement of Laramide-age granodiorite to quartz monzonite stocks and dike swarms intruded into Precambrian granite and Paleozoic sedimentary rocks. Quartz-sericite-sulfide alteration and attendant copper-molybdenum mineralization is temporally and spatially associated with the emplacement and cooling of these intrusions. Low-grade hypogene copper mineralization is manifested as quartz-sericite alteration with pyrite-chalcopyrite-molybdenite stockwork veins that overprinted early quartz-orthoclase and biotite vein assemblages.
The style and sequence of hydrothermal alteration and mineralization in the Morenci district can be characterized from vein mineral assemblages and crosscutting relationships. As in many other well-studied porphyry copper systems (Nielsen, 1968; Phillips, Gambell and Fountain, 1974; Beane and Titley, 1981), alteration and vein assemblages in the Morenci ore body appear to vary systematically from potassic alteration near the core and deep within the deposit to sericite-dominated alteration in the upper and central portions. A propylitic zone is present in the fringes of the deposit. Crosscutting relationships among veins associated with these discrete alteration assemblages reflect the evolution of fluids responsible for copper-molybdenum mineralization. Key characteristics of hypogene mineralization are that the potassic-related assemblages are sulfide poor and do not contain significant amounts of copper and the later sericite dominant assemblages contain the bulk of the copper, principally as chalcopyrite.
The supergene zone characteristically displays a massive white appearance reflecting pervasive argillic alteration. Textural destruction is commonly so intense that even
| as of December 31, 2021 | 22 | ||||
| Technical Report Summary for Morenci Mine, Arizona, U.S. | ||||
coarse-grained granitic textures are obscured, making field identification of lithological units difficult.
Anhydrous skarns containing garnet, diopside, wollastonite, marble and hornfels, and hydrous skarns containing tremolite-actinolite, chlorite, epidote, and magnetite developed where the Laramide porphyries intruded Paleozoic sedimentary units.
Most ore mined from the Morenci district and carried in the current operation is the product of supergene oxidation and enrichment processes. Long-lived multiple supergene cycles resulted in an enriched zone localized in the ancestral Chase Creek Canyon. In supergene sulfide zones, chalcocite occurs as thick coatings and complete replacements of pyrite and chalcopyrite.
The form and distribution of supergene mineral assemblages is largely a function of the physical character of the ore body and the nature of the climate and the hydrologic setting at the time of formation. Faults and fractures provide conduits for infiltration of supergene solutions into the host rocks. Supergene profiles typically mirror the current topographic surface. Enrichment and oxidation zones are generally thicker in valleys and thinner at ridge tops.
The predominant oxide copper mineral is chrysocolla. Chalcocite is the most important secondary copper sulfide mineral, and chalcopyrite and molybdenite are the dominant primary sulfide minerals. The mineralogical ore types are described in Table 6.1. A plan view map and cross section highlighting ore type interpretations are provided in Figure 6.4 and Figure 6.5.
Table 6.1 – Morenci District Mineralogical Ore Types
| Ore Type | Mineralogy | ||||
| Leached Cap | Iron oxide; may contain residual copper oxide and chalcocite. | ||||
| Acid Insoluble Oxide | Native copper, neotocite, tenorite, copper wad, manganese and iron mineraloids; may contain cuprite. | ||||
| Acid Soluble Oxide | Malachite, chrysocolla, azurite, brochantite; may contain minor chalcocite, pyrite and/or cuprite. | ||||
| Mixed Oxide-Sulfide | Chalcocite, pyrite and/or lesser iron and copper oxide minerals. | ||||
| Supergene Sulfide | Chalcocite, pyrite; may contain accessory chalcopyrite, covellite. | ||||
| Mixed Supergene Sulfide | Chalcocite, covellite, chalcopyrite. | ||||
| Mixed Hypogene Sulfide | Chalcopyrite greater than covellite, chalcocite. | ||||
| Hypogene Sulfide | Chalcopyrite/pyrite dominant, may contain lesser bornite and/or covellite. | ||||
| Unmineralized | No visible copper minerals present; may contain pyrite. | ||||
| as of December 31, 2021 | 23 | ||||
| Technical Report Summary for Morenci Mine, Arizona, U.S. | ||||
Figure 6.4 – Mineralogical Ore Types through Western Copper Mining Area

Plan view of 4,525-foot level.
Figure 6.5 – Cross Section of Mineralogical Ore Types through Western Copper Mining Area

East-west cross section at 15,000 N projected to original topography. Elevations are in feet.
| as of December 31, 2021 | 24 | ||||
| Technical Report Summary for Morenci Mine, Arizona, U.S. | ||||
7EXPLORATION | ||
Morenci is a mature mining district with a long history of exploration. The data, methods, and historical activities presented in this section document actions that led to the initial and continued development of the mine but are not intended to convey any discussion or disclosure of a new, material exploration target as defined by S-K1300.
Exploration outside of the current operation is in collaboration with the FCX Exploration Group and incorporated into the geologic model. A drilling program for material characterization and ore delineation is ongoing at the Morenci mine. Multi-purpose geotechnical and environmental drilling is characterized for inclusion into the geologic model. New drilling was included in the update of the geological resource model to support the mineral reserves and mineral resources. Drilling results added for the model update provide local refinement of the geologic interpretations and grade estimates, but do not materially alter these interpretations and estimates on a district-wide scale.
7.1Drilling and Sampling Methods
The district has been drilled using churn, percussion, conventional rotary, diamond drill core, and reverse circulation (RC) techniques with the majority of the drilling comprised of core and RC methods as shown in Table 7.1. Since 1985, core and RC have been the only drilling methods utilized for exploration and infill drilling. Approximately 83 percent of the historical churn drill hole composites have been mined. There are scattered instances of drilling programs undertaken for environmental or other purposes that have used other drilling methods post-1985.
Table 7.1 – Summary of Drill Programs
| Footage | |||||||||||||||||||||||
| Years | Company | # of Holes | Churn | Rotary | Core | RC | Total | ||||||||||||||||
1915 to 1961 | PDC and Others | 569 | 426,748 | 0 | 0 | 0 | 426,748 | ||||||||||||||||
1985 to 1995 | PDC and Others | 51 | 0 | 25,899 | 0 | 0 | 25,899 | ||||||||||||||||
| 1937 to Current | PDC and FCX | 3,007 | 0 | 0 | 4,354,993 | 0 | 4,354,993 | ||||||||||||||||
| 1986 to Current | PDC and FCX | 2,170 | 0 | 0 | 0 | 1,246,557 | 1,246,557 | ||||||||||||||||
| Total | 5,797 | 426,748 | 25,899 | 4,354,993 | 1,246,557 | 6,054,197 | |||||||||||||||||
| % of Total | 7.0 | 0.4 | 71.9 | 20.6 | 100.0 | ||||||||||||||||||
Numbers may not foot due to rounding.
7.2Collar / Downhole Surveys
Collar surveying techniques have changed to reflect technology advances in surveying methods, beginning with transit and stadia, progressing to total-station infrared theodolites, and finally to Global Positioning System (GPS) units today. All coordinates are based on the local mine grid system.
| as of December 31, 2021 | 25 | ||||
| Technical Report Summary for Morenci Mine, Arizona, U.S. | ||||
Historically, downhole surveys were not systematically performed. In recent drilling programs, downhole surveys are completed for all angle drilling and for all holes exceeding 500 feet in depth.
Currently, all core and RC drill holes are surveyed downhole using gyroscopic or magnetic methodologies. Surface recording gyroscopic surveys are conducted on 50-foot intervals down the hole. In cases where downhole surveys are not conducted on shallow holes, values from the hole design are used. Downhole surveys are carefully evaluated to review that the current declination has been accounted for and no magnetic rocks were encountered that would influence the accuracy of the survey method. Survey data are part of the district-wide database and are used in the modeling process to locate drill hole intercepts.
Final reports for collar and downhole surveys are included in the drill hole log files. Original films and survey records are stored in a secure facility. Spatial locations of the drill holes are visually validated in the resource modeling software.
7.3Drill Hole Distribution
Indicated resources are typically drilled on a 400-foot grid. Center holes to that grid with approximately 285-foot spacing are used to delineate measured resources. A 200-foot drill grid is required in some pit areas for planning purposes. First-pass evaluations of areas in the district with favorable geological and mineralogical characteristics are often drilled on an 800-foot grid. Depending on the results, additional drilling is undertaken to obtain the tighter spacing required for measured and indicated resources. Drill programs are guided by geological and mineralogical characteristics and by the district mining sequence.
Most of the holes drilled in the district are vertical and are distributed along east-west and north-south orientations. Angle holes constitute about 12 percent of the drilling and are placed in areas to address local geological and mineralogical requirements. Angle drilling is also used where site access issues make it difficult to intersect a drill target with a vertical hole. A portion of the core and RC holes are “twinned” by the other drilling method in each project area to validate sample assay quality. The distribution of drill holes in the district is shown in Figure 7.1.
| as of December 31, 2021 | 26 | ||||
| Technical Report Summary for Morenci Mine, Arizona, U.S. | ||||
Figure 7.1 – Drill Hole Collar Locations

Topography is as of December 2020. Red dots indicate new holes during 2020. Blue dots
indicate historical drilling included in the model. The purple boundary marks the resource model
extents.
7.4Sample Quality
The current sampling quality is good and is continually being evaluated and validated. Core recovery is consistently in excess of 98 percent. Historically, the core was typically drilled NQ-size diameter (1.875 inches). Since the mid-2000’s, core is typically drilled HQ-size diameter (2.5 inches) except where drilling conditions require reducing to a smaller diameter.
All core and RC samples are taken on 10-foot intervals from the collar. Core samples are split with hydraulic core splitters. A geologist is present during RC drilling to log samples and monitor sample quality. RC samples are split at the drill rig utilizing rotary hydraulic splitters to capture a sample. Split sample analyses show that recovery and grades are
| as of December 31, 2021 | 27 | ||||
| Technical Report Summary for Morenci Mine, Arizona, U.S. | ||||
representative of the material drilled and show no preferential bias of grades due to sampling methods.
Historical churn drill hole samples were evaluated for sample quality by comparing chip board abstracts with the geologic drill log and assay reports. Geologists identified approximately 22,000 feet of historical churn drilling and 24,000 feet of RC drilling as low-quality data that are not used in the geologic resource model.
7.5Sample Logging
Detailed logging is performed on 10-foot assay intervals with finer detail locally as needed. As of 2013, logging is entered directly into a database. Prior to 2013, logging was performed on paper log forms. Historical logs have been scanned and the corresponding survey, assay, and geologic information has been entered into the database.
Geologic logs include detailed descriptions for lithology, alteration, and mineralization. Geomechanical logs include rock quality designation (RQD) and core recovery information. Procedures for RQD, RC, and core logging are documented, and codes and abbreviations are standardized and published in department guidelines. Photographs of drill hole core within the boxes are taken.
7.6Hydrogeology
Hydrogeologic work is part of an innovative workflow that allows reconciliation of observed open-pit slope pore pressures against geotechnical targets and predicted depressurization results. The prediction of expected hydrogeologic responses from the existing and planned additions to the piezometer network, horizontal drain holes, and vertical dewatering wells is generated using a three-dimensional numerical groundwater flow model. Hydrogeological modelling was based on work by third-party consultants from studies completed in 2020.
The Morenci mine works to achieve slope depressurization and dewatering goals and continues to update water management plans to intercept groundwater with horizontal drain hole drilling programs for specific slope depressurization needs, annual piezometer, and vertical wells installation focused on targeted areas, and necessary dewatering rates.
Ongoing hydrogeologic investigation includes:
•Design and implementation of appropriate proactive dewatering and slope depressurization measures including a piezometer network, pilot holes, vertical production wells, and horizontal drain holes.
•Field activities associated with mine dewatering and pit slope depressurization, including RC pilot borehole hydrogeologic logging, airlift and recovery testing and characterization, water quality testing, dewatering well design, and piezometer design and construction.
•Monitoring of production from vertical well and horizontal drain flows, piezometer performance, and pit sump evacuation pumping.
•Routine construction and replacement of a groundwater and pore pressure monitoring system utilizing a piezometer network, pilot holes, dewatering wells, and associated pumping and piping infrastructure.
| as of December 31, 2021 | 28 | ||||
| Technical Report Summary for Morenci Mine, Arizona, U.S. | ||||
7.7Geomechanical Data
Geomechanical work includes an integrated workflow to manage needs that include field investigation, slope stability studies, mine dewatering, and pit slope depressurization. A comprehensive geology model is used as a baseline to integrate the stability models to hypothesize failure mechanisms, define geomechanical domains, estimate strength parameters, and identify slope depressurization targets.
The Morenci mine uses limit equilibrium and numerical models to evaluate slope stability and establish annualized depressurization targets required to achieve the slope stability design acceptance criteria for factor of safety and strength reduction factors. Moreover, stability studies update the recommendations for bench geometries, inter-ramp slope angles, and overall slope configurations. Efforts also include stability studies for certain waste dumps and ROM stockpiles. Geomechanical modelling was based on work by third-party consultants from studies completed in 2020.
Televiewer surveying is used on geomechanical holes. A third-party consultant uses the data collected in conjunction with physical examination of the drill hole core to characterize the orientation and properties of the geologic structures.
Ongoing geomechanical investigation includes:
•Design and implementation of appropriate proactive geotechnical measures including geomechanical core drilling, televiewer surveying, cell mapping, photogrammetry, and rock testing.
•Geomechanical core drilling is planned and executed to characterize the orientation and properties of geologic structures with televiewer surveying to obtain geomechanical parameters, rock testing, and install instrumentation.
•Geomechanical models including RQD are used for predicting the spatial variability and assessing rock quality as it relates to the degree of fracturing within the in-situ rock mass.
•Structure data is collected through cell mapping and photogrammetry to characterize the orientation and properties of geologic structures.
•Rock testing quantities are governed by rock quality and sample availability and include, but not limited to, triaxial tests, uniaxial tests, disk tension tests and small-scale direct shear tests. Testing is performed in accordance with the American Society of Testing and Materials, the International Society for Rock Mechanics, and the British Standards.
•Routine replacement and addition of geomechanical drill holes in areas of interest.
These activities are supervised and guided by an expert group specialized in mining geomechanical, hydrogeology, mine dewatering, and pit slope depressurization allowing completion of the geomechanical and hydrogeologic activities to established FCX mining geomechanical standards. The group consists of site personnel, FCX Corporate Geomechanical and Hydrogeology teams, primary geomechanical and hydrogeological third-party consultants, external reviewers, and industry experts.
| as of December 31, 2021 | 29 | ||||
| Technical Report Summary for Morenci Mine, Arizona, U.S. | ||||
7.8Comment on Exploration
In the opinion of the QPs:
•The exploration programs completed at Morenci (drilling, sampling, and logging) are appropriate for geologic resource modeling.
•The data spacing and distribution is sufficient to establish the degree of geological and grade continuity appropriate for mineral reserve and mineral resource estimation.
•The geomechanical and hydrogeologic programs are appropriate to support slope design recommendations according to the established slope design criteria and mine plans.
8SAMPLE PREPARATION, ANALYSES, AND SECURITY | ||
8.1Sampling Techniques and Sample Preparation
Samples are collected on 10-foot intervals. Historically, the first interval of a drill hole was often shortened in order to get the remainder of the samples to correspond to bench elevations. After 1995, the only modifications to sample length are done to accommodate poor recovery zones, or to correct for errors in splitting and sampling. Splits from these samples are composited into 50-foot intervals that correspond to the mining bench height.
The drill core is hydraulically split, with half being sent for assay and the other half retained in the original core box. Split core to be assayed is stored in labeled sample bags in tote containers on-site until shipment is arranged with the assay laboratory. Sample totes are loaded at the Morenci core processing facility and transported to a third-party laboratory facility, Skyline Assayers and Laboratories Incorporated (Skyline) in Tucson, Arizona by Skyline personnel. Periodically, Morenci core is processed (logged and/or sampled) by the FCX Exploration team at the FCX offices in Tucson or FCX drill hole core facility at the Twin Buttes property in Green Valley, Arizona where it may be hydraulically split or sawed. Sampled core is stored in labeled sample bags in totes until shipment is arranged with Skyline. Samples are transported to Skyline by their personnel.
RC samples are collected at the rig from a rotary splitter. Sample quality is monitored by a FCX geologist and includes evaluating conditions such as water flow rate, downhole contamination, and acidity. A sample split is collected as an abstract for visual characterization and a chip tray is created and retained to reflect the relevant material for reference.
All preparation for samples collected prior to July 2005 was completed at the Morenci Analytical Services facility. A minor amount of historical drilling by other companies on local claim blocks were processed by third-party laboratories in Arizona, Utah, and Texas. Samples collected after this date have been prepared by Skyline. Skyline is accredited in accordance with the recognized International Standard ISO/IEC 17025:2005. Its quality management system has been certified as conforming to the requirements defined in the International Standard ISO 9001:2015 Quality Management Systems. The Morenci mine and Skyline laboratories use identical analytical procedures.
| as of December 31, 2021 | 30 | ||||
| Technical Report Summary for Morenci Mine, Arizona, U.S. | ||||
8.2Assaying Methods
Currently, all samples are analyzed for total copper (TCu), acid-soluble copper (ASCu), ferric sulfate-soluble copper assay, known as quick leach test (QLT), and total molybdenum (TMo). The Morenci Leach Test (MLT) assay was developed in 1991 and was the precursor to the current FCX standard QLT analysis. MLTs were typically run only on 50-foot composites until about 2000. An extensive re-assay program was undertaken to obtain QLT assays data for all available 10-foot pulps; however, historical pulps from areas that were mined out were not submitted to the laboratory for QLT analysis.
Atomic absorption spectroscopy is used for TCu assays, while inductively coupled plasma optical emission spectroscopy is used for TMo analyses. Determinations for total iron, total sulfur, zinc, silver, gold, lead, and total manganese are also performed as required.
QLT determinations are obtained for every 10-foot drill sample with a TCu grade that exceeds 0.10 percent. Specific ranges of QLT have been developed for each mineralogical ore type and are used as a tool combined with the observed mineralogy and TCu and ASCu analyses for consistency and standardization of the mineralogical ore type designation for each drill hole interval. The ranges are based on results from column leach tests using standardized extraction parameters.
8.3Sampling and Assay QA/QC
Quality assurance and quality control (QA/QC) procedures were standardized at Morenci by 2008 and have been consistently followed since 2013. Historical QA/QC programs at Morenci are not well documented and any check sample results prior to 2008 are not currently stored in the Morenci database.
Current procedures at the Morenci mine for QA/QC on drill hole samples are as follows:
•Standards are inserted on a 1 in 20 basis by Morenci for assay by Skyline. The Morenci mine has historically used both commercial standard reference samples as well as internal standards prepared using locally sourced material. The standards are blind to the laboratory and are added to assess accuracy.
•Blanks are utilized and inserted on a 1 in 20 basis to confirm that there is no contamination between samples due to the sample preparation errors at the laboratory. Blanks are derived from washed concrete sand from Safford, Arizona via an on-site concrete batch plant. The blanks are blind to the laboratory.
•Duplicates are analyzed on a 1 in 20 basis at every stage of sample reduction: splitting (sample), crushing (crush), and pulverization (pulp). For core samples, the remaining half of split core, normally reserved for reference and metallurgical testwork, is sent to the laboratory as a duplicate sample. For RC samples, a duplicate sample is collected during drilling from the rig mounted cyclone splitter. The sample duplicates are blind to the laboratory. Crush duplicates and pulp duplicates are prepared by Skyline during sample preparation. Each crush duplicate is taken as a split from the crushed material of the corresponding field duplicate sample and each pulp duplicate is taken as a split from the pulverized material of the corresponding crush duplicate
| as of December 31, 2021 | 31 | ||||
| Technical Report Summary for Morenci Mine, Arizona, U.S. | ||||
sample. Duplicate results are used to assess analytical precision and to evaluate the sampling nomograph.
•Secondary laboratory checks are performed as part of the QA/QC procedures. Pulps containing assays above the threshold of 0.10 percent TCu were sent to the FCX’s Technology Center facilities in Tucson, Arizona (TCT) and re-assayed as a check for analytical bias at Skyline. Standards and blanks are blindly inserted into this batch of samples. The TCT laboratory is accredited under ISO 9001:2015.
•An additional QA/QC measure is the creation of 50-foot laboratory composite samples for assay. These 50-foot analytical composite assays are compared with arithmetic composite values using the 10-foot assay results for the same interval. Prior to implementation of the current check sample insertion procedure outlined above, the comparison of analytical composites to arithmetic composites was the primary quality control measure for drilling results. Currently, this comparison is done periodically during investigation of anomalous results prior to importing analytical results to the drill hole database.
•QA/QC data is entered directly into the drill hole database. All QA/QC check assays are examined for acceptability using QA/QC tools in the database software. Assays that meet QA/QC requirements are accepted into the database; those that did not are rejected and reruns are ordered from Skyline.
•Skyline maintains internal and independent QA/QC procedures.
8.4Bulk Density Measurements
Specific gravity (SG) measurements on spatially distributed drill core samples have shown little variability among rock types, alteration assemblages and copper mineralization. Samples were evaluated using the water displacement method from holes drilled historically and in the 1994 to 1995 drilling campaign by using the following formula:
SG = weight in air / (weight in air – weight in water)
Assumes water has an SG of 1 and surface tension is not a factor.
Based on historical testing, in-situ bedrock is assigned a tonnage factor of 12.5 cubic feet per ton, and stockpile and fill materials are assigned a tonnage factor of 16.5 cubic feet per ton. A 1997 Morenci mine study shows an average in-situ tonnage factor for all rock types of 12.53 cubic feet per ton. The primary host rock in the district is Precambrian granite and tests indicate a tonnage factor of 12.51 cubic feet per ton. These internal studies support the tonnage factor used for in-situ rock. SG measurements are incorporated into the district-wide database.
8.5Comment on Sample Preparation, Analyses and Security
In the QP’s opinion, sample preparation, analytical methods, security protocols, and
QA/QC performance are adequate and supports the use of these analytical data for mineral reserve and resource estimation.
| as of December 31, 2021 | 32 | ||||
| Technical Report Summary for Morenci Mine, Arizona, U.S. | ||||
9DATA VERIFICATION | ||
9.1Data Entry and Management
Drill hole information is maintained in a database and managed by a database manager that has full access and the ability to restrict and monitor access for other end users. This database manager coordinates and controls the entry of all geologic information into the district-wide drill hole database.
Analytical data is loaded into the database directly from the laboratory via software importers. Prior to loading, the information is checked and validated. As needed, analytical results are rejected, and the relevant samples are reanalyzed. There is no manipulation of the assay information.
Outlier evaluations are routinely completed for 10-foot assay intervals for all mineralogical coding. The analytical values are compared to visual estimates as a check of the logging quality and the assay values. Assay intervals are validated and checked against the actual sample intervals.
Collar survey data is loaded directly from GPS units into the database. Collar locations are checked against surveyed topographic surfaces. Downhole surveys are examined for anomalous changes in azimuth and dip between adjacent surveys in cross section before they are imported into the database.
For historical drill holes, collar coordinates, downhole surveys, assays, lithology, mineralogy, fault structure, and alteration codes were manually entered from the original core logging sheets. The transfer and validity of this data has been frequently checked during various model updates throughout the years.
9.2Comment on Data Verification
As confirmation of the mineral reserve and resource process, third-party consultants are occasionally hired to perform verification studies. The Morenci mine was last reviewed for year-end reporting during 2019. The study included database checks and concluded that the lithological logs and assay sheets correlate well with the lithology and mineralization observed in the core and no discrepancies were identified in total or acid soluble copper or molybdenum grades when comparing Skyline assay certificates from assay data in the drill hole database.
The QP has been involved in recent model audits of the Morenci mine including reviews of the drill hole data. The data has been verified and no limitations have been identified. Furthermore, the QP worked on Morenci drill hole core logging and various aspects of resource model updates from 2011 to 2016.
In summary, data verification for the Morenci mine has been performed by mine site and FCX corporate staff, and external consultants contracted by FCX. Based on reviews of this work, it is the QP’s opinion that the Morenci mine drill hole database and other supporting geologic data align with accepted industry practices and are adequate for use in mineral reserve and mineral resource estimation.
| as of December 31, 2021 | 33 | ||||
| Technical Report Summary for Morenci Mine, Arizona, U.S. | ||||
10MINERAL PROCESSING AND METALLURGICAL TESTING | ||
Mineral reserves and mineral resources are evaluated to be processed using hydrometallurgy and/or concentrating (mill) operations. The applicable processes and testing are discussed below.
10.1Hydrometallurgical Testing and Recovery
Hydrometallurgical recovery is estimated based on the recoverable copper content and the time required to extract the recoverable copper. The final recovery is realized only after multiple leaching passes or cycles on the stockpiles. A leach cycle consists of solution application to a leach pad, followed by a rest period without solution application. Subsequent leach cycles recover diminishing portions of remaining copper.
Hydrometallurgical recoveries at the Morenci mine have been developed from a combination of assay results to determine the range of mineral solubilities, column leach testing using standardized practices by the FCX’s Technology Center (TC) facilities outside Safford, Arizona, on-site pilot plant testing, and monitoring of field results. The TC is FCX owned and operated, and the analytical labs are ISO 9001:2015 certified. Recoverable copper content and kinetic recovery curves vary by ore type and applied leach cycles. Leach production results are tracked over many years to confirm actual hydrometallurgical recoveries. The long-term leach recoveries by ore type and process are listed in Table 10.1 for hydrometallurgy operations.
Table 10.1 – Hydrometallurgical Recoveries
| Ore Type Description | Copper Recovery by Process (%) | ||||||||||||||||
| MFL | S-ROM | X-ROM | Low-Grade | MEH | |||||||||||||
| Leached Cap | — | 47.7 | — | 29.1 | — | ||||||||||||
| Mixed Oxide-Sulfide | 82.6 | 53.6 | 53.6 | 33.9 | — | ||||||||||||
| Supergene Sulfide | 79.6 | 51.5 | 51.5 | 28.9 | |||||||||||||
| Hypogene Sulfide | — | — | — | 4.8 | 24.3 | ||||||||||||
| Acid Soluble Oxide | 86.1 | 59.6 | 64.6 | 43.6 | — | ||||||||||||
| Acid Insoluble Oxide | — | 47.7 | 47.7 | 29.1 | — | ||||||||||||
| Mixed Hypogene Sulfide | — | 21.8 | — | 13.9 | 24.8 | ||||||||||||
| Mixed Supergene Sulfide | 51.2 | 31.6 | 31.6 | 19.3 | 39.5 | ||||||||||||
Crushed leach ore has sufficient grade to facilitate crushing and conveying to the leach pads in order to improve liberation of the contained copper minerals. This is the Mine for Leach (MFL) process. ROM leach pad stockpiles receive ores that are transported directly to the pads. Sulfide and oxide ROM leach pads (S-ROM, X-ROM) are used to distinguish mineralogies. Low-Grade ROM leach pads are dumped into thicker lifts than other pads with a resultant lower estimated recovery. Morenci Engineered Heap (MEH) are ROM leach pad stockpiles where air is added to facilitate recovery of sulfide mineralogy. Discounts in recovery are made to recognize differing host lithologies.
Additional supergene sulfide ore testing is underway to validate recovery assumptions for this material for ROM processing. Supergene sulfide is a principal ore type delivered to the leach pad stockpiles. Based on improvements in particle size and leach solution
| as of December 31, 2021 | 34 | ||||
| Technical Report Summary for Morenci Mine, Arizona, U.S. | ||||
chemistry, column testing is in process to verify an appropriate recovery estimate, which may increase from current assumptions.
Field results are a combination of ore type deliveries to the leaching processes. Actual results of the aggregate copper recovery compare favorably to the estimated recoveries and it is the QP’s opinion that the recovery estimates and kinetic recovery curves are reasonable.
10.2Concentrating Metallurgical Testing and Recovery
The estimated copper recovery of the concentrating process has been validated with actual concentrator performance data. Table 10.2 and Table 10.3 summarizes copper and molybdenum recoveries.
Table 10.2 – Concentrator Copper Recoveries
| Ore Type Description | Copper Recovery (%) | ||||
| Supergene Sulfide | 81.7 | ||||
| Hypogene Sulfide | 86.7 | ||||
| Supergene Mixed | 79.8 | ||||
| Hypogene Mixed | 86.7 | ||||
Table 10.3 – Concentrator Molybdenum Recoveries
| Mine Areas | Molybdenum Recovery (%) | |||||||
| Morenci Concentrator | Metcalf Concentrator | |||||||
| Western Copper and Ponderosa Areas | 51.0 | 49.3 | ||||||
| All Other Areas | 34.0 | 32.3 | ||||||
Discounts in recovery are made to recognize differing host lithologies. Due to ore blending, it is not possible to measure concentrator recovery by ore type. The aggregate copper recovery compares favorably with estimated recovery, indicating that recovery estimates are reasonable and applicable to current operations and mineral reserve and resource estimation.
Copper recovery has been approximately 1 percent higher than estimated over recent years. During the same time period, molybdenum recovery has been approximately 5 percent lower than estimated, primarily due to collective flotation circuit performance. Supergene sulfide, hypogene sulfide, supergene mixed and hypogene mixed ores are anticipated to be the principal concentrator ore types, so the copper and molybdenum model recovery estimates are reasonable and are adequate for both LOM and near-term forecasting, since they represent current operating performance when processing these ores.
Significant metallurgical testing has been conducted by Morenci metallurgical staff and TC personnel to develop a data set that will be used for geometallurgical modeling. The major metallurgical activities included flotation and comminution testing and
| as of December 31, 2021 | 35 | ||||
| Technical Report Summary for Morenci Mine, Arizona, U.S. | ||||
mineralogical analysis including quantitative evaluation of minerals by scanning electron microscopy and x-ray diffraction. Details of geometallurgical testwork include:
•Geometallurgical test program on 67 drill hole samples collected from the Western Copper open-pit area conducted during 2015 to 2017. Scope of work for the program included laboratory kinetic flotation tests and Bond Work Index comminution tests to support the development of a throughput model and to generate rougher flotation response data to support development of recovery models.
•Geometallurgical flotation test program on 161 drill hole samples during 2016 to support development of recovery models.
10.3Comment on Mineral Processing and Metallurgical Testing and Recoveries
In the opinion of the QPs, the metallurgical testwork completed has been appropriate to establish reasonable processing methods for the different mineralization styles encountered in the deposits. Geometallurgical samples are properly selected to represent future ores, and recovery factors have been confirmed from production data collected from ore processed in the open-pit. As a result, the processing and associated recovery factors are considered appropriate to support mineral reserve and mineral resource estimation and mine planning.
11MINERAL RESOURCE ESTIMATE | ||
Mineral resources are evaluated using the application of technical and economic factors to a geologic resource block model and employing optimization algorithms to generate digital surfaces of mining limits, using specialized geologic and mine planning computer software. The resulting surfaces volumetrically identify material as potentially economical, using the assumed parameters. Mineral resources are the resultant contained metal inventories.
11.1Resource Block Model
Relevant geologic and analytical information is incorporated into a three-dimensional digital representation, referred to as a geologic resource block model. The Morenci mine resource block model was updated on January 22, 2021, with an effective date for exploration drill hole data of December 14, 2020. The Morenci resource block model includes mineralogical ore type interpretations for the Morenci district based on drilling and projections from production data and interpolation parameters which distinguish geostatistical domains between the Western Copper area and the remainder of the district, to recognize unique geologic trends between mining areas.
11.1.1Compositing Strategy
Ten-foot drill hole assay intervals are combined into 50-foot composites, corresponding to the mine bench height. No minimum or maximum length requirement is imposed on the compositing routine; however, holes shallower than 45 degrees are composited to a fixed length of 50 feet, preventing excessive composite lengths for flatter holes.
Grade interpolation requires a minimum composite length of 25 feet, which corresponds to half the bench height. The composites are assigned a mineralogical ore type code based on the majority ore type present in the assay intervals that comprise the
| as of December 31, 2021 | 36 | ||||
| Technical Report Summary for Morenci Mine, Arizona, U.S. | ||||
composite. Outlier evaluations of assay grades and ore type codes are performed and validated against the composite ore type codes so that they are representative of the composite make-up. All ore type outliers are evaluated by a geologist and assigned an ore type code.
In order to improve the transition of interpolated grades across ore type boundaries, composites are assigned one or more modal ore types. Modal ore types are assigned based on the mineralogical ore types of the sample intervals within the composite and the TCu, ASCu, and QLT grades of the composite.
11.1.2Statistical Evaluation
Assay values and geologic codes for each mineralogical ore type are evaluated using classical statistical parameters (mean, standard deviation, number of samples, etc.). Histograms and cumulative frequency plots are used to conduct detailed analyses of sample population data. Assay and composite statistics are compared for each ore type. Outlier evaluations of TCu, ASCu, and QLT versus mineralogy codes are routinely performed on the basis of assigned ore type for each assay interval and composite sample intervals. The comparison between the sample types and outlier evaluations of these samples are integral parts of the modeling process and are utilized for consistency and standardization of the ore type code assignment.
General relative variograms are calculated for each ore type and models are fit to the experimental data to evaluate continuity of grade and directional trends within ore type domains. Experimental variograms are fit with nested models. Nested models provide a better fit to the variogram data, especially for sample pairs nearest to the origin. Use of nested models improves local grade estimation and slightly extends the range for selected ore types.
The Morenci district model is split into seven lithological and structural domains for interpolation. In domains where blast hole data is available in sufficient quantity, anisotropy defined by this blast hole data is used to generate the directions for the drill hole variograms. The rest of the district domains use variograms generated strictly from exploration drill hole data. The distance, range, nugget, sill, and spatial variance values obtained from the variogram for each ore type are dependent on the mineralization style and geology for that specific area of the district. These variogram parameters are evaluated by cross validation techniques for kriging and inverse distance interpolation methods. Point validation is performed to calibrate variogram parameters. Mean absolute difference among kriged block values and mean grade of composites used to assign grade is also optimized through point validation techniques.
11.1.3Block Model Setup
Model limits and block sizes for the geologic resource block model are shown in Table 11.1. The Morenci model is a single district-scale block model constructed using geological modeling software. The model is not rotated, and coordinates are based on the Morenci mine coordinate system. The spatial limits of the model encompass the known extents of mineralization. Horizontal block size is based on geostatistical rules and the size of the smallest geological features that can be reasonably modeled. Vertical block size matches the bench height for the Morenci mine open-pit operations.
| as of December 31, 2021 | 37 | ||||
| Technical Report Summary for Morenci Mine, Arizona, U.S. | ||||
Table 11.1 – Morenci Block Model Parameters
| Direction | Minimum | Maximum | Size (feet) | # of Blocks | ||||||||||
| X-East | -23,040 | 0 | 80 | 288 | ||||||||||
| Y-North | 4,960 | 32,000 | 80 | 338 | ||||||||||
| Z-Elevation | -2,000 | 7,500 | 50 | 190 | ||||||||||
11.1.4Topography
Three types of topographic representations are used in the geologic resource model. The original, current, and planned stockpile topographic surfaces are provided by the site mine engineering staff. Geological features are interpreted to original topography. The estimated year-end topographic surface is used for mine planning and to estimate remaining in-situ mineral reserves and mineral resources.
11.1.5Geologic Model Interpretation
Mineralogical ore types are interpreted on cross sections and bench levels and are updated with blast hole and drill hole data. East-west and north-south cross sections spaced at 200-foot increments are interpreted. Levels are interpreted at the mid-bench height every 50 feet. There are 117 east-west sections, 116 north-south sections, and 102 level plans interpreted.
Large district-scale faults have been interpreted and are used to constrain lithology and ore type interpretations. Lithology is coded using Nearest Neighbor (NN) assignment from drill hole composites followed by coding from level plan polygons in areas that have section and level interpretation or from three-dimensional wireframe solids generated from drill hole and blast hole data. Ore type interpretations are guided by rock types and structural fabrics.
11.1.6Grade Estimates
Grade interpolation and search distances for Ordinary Kriging (OK), Inverse Distance Weighting (IDW), and NN methods are based on the statistical and geostatistical analyses. Copper grade interpolation is constrained by similar ore types in the drill hole composites, block model boundaries, variography of each ore type, and by geologic and mineralogical ore type features of the deposit. Interpolation constraints utilize geologic matching of modal ore type in composites with block ore type to create soft boundaries for supergene and hypogene copper mineralization. Molybdenum uses grade shell boundaries with modal ore type matching on concentrator versus copper leach ore types.
Distribution of block model grades are evaluated visually, statistically compared to corresponding drill hole and composite values, and vetted against production data. TCu, ASCu, and TMo grades from Area Influenced Kriging (AIK) are used for mine planning purposes with the exception of one domain that utilizes a combination of OK with grade shells for TCu and ASCu that performs better in predicting narrow zones of grade that are recognized in the domain.
A minimum of 1 composite is required to interpolate a block, using a maximum search distance of 800 feet in all directions. The maximum number of composites is set to 12 (maximum of 3 per hole), requiring at least 4 holes for the estimation. Validation of these
| as of December 31, 2021 | 38 | ||||
| Technical Report Summary for Morenci Mine, Arizona, U.S. | ||||
methods comes from geostatistical evaluation of composite data, grade-tonnage curves, and reconciliation to production models. Interpolation search distances are derived from variogram modeling and are spatially appropriate for a porphyry copper system.
For all other interpolation methods, ore type specific high-grade restrictor values are determined via geostatistical outlier analysis and composite grades above these restrictor values are capped at the restrictor value when used to interpolate blocks more than 50 feet from the high-grade composite.
11.1.7Bulk Density
Since bulk density has minimal variability between the different rock types, all blocks coded as hard rock are assigned a tonnage factor of 12.5 cubic feet per ton. All blocks coded as stockpile and fill material are assigned a tonnage factor of 16.5 cubic feet per ton.
11.1.8Mineral Resource Classification
Drill hole spacing and the number of composites used for interpolation are key components in evaluating the uncertainty of mineral resource estimates. Approximately 92 percent of the drilling at the Morenci mine is core and RC. Suspect drill holes have been identified so as not to be used; therefore, sample type is not a consideration in assessing uncertainty of the mineral resource estimates.
FCX’s experience with porphyry copper deposits has established drill hole spacing criteria that provide estimates of ore tonnage, grade and contained and recoverable metal meeting corporate standards for each process method. The required drill hole spacing considers uncertainty in grade estimates as well as geometric uncertainty associated with geologic interpretation of copper ore types, rock types, copper, and molybdenum grade shells. Experience has shown that drill spacing of 285 and 400 feet are adequate for determination of measured and indicated mineral resources, respectively, and inferred resources can be projected up to 800 feet from a drill hole.
Resource classification is established based on a single set of criteria across the district, using restrictions on the total number of composites used and the number of composites per drill hole as a proxy for drill hole spacing. To establish resource classification, the following parameters are used:
•The distance to the closest composite used for interpolation.
•The average distance to all composites used.
•The number of composites and the number of drill holes used.
These items are used in conjunction with geostatistical analyses and the criteria described above to establish measured, indicated, and inferred resource classifications as shown in Table 11.2.
| as of December 31, 2021 | 39 | ||||
| Technical Report Summary for Morenci Mine, Arizona, U.S. | ||||
Table 11.2 – Resource Classification Criteria
| Resource Classification | Minimum # Composites | Maximum Range (feet) | ||||||
| Measured | 12 | 285 | ||||||
| Indicated | 8 | 400 | ||||||
| Indicated | 6 | 285 | ||||||
| Inferred | 1 | 800 | ||||||
Range is the average distance to the composites. Maximum range is the maximum allowed average distance to composites for resource classification assignment. The maximum ranges correlate with the district drill hole sample spacing for each resource classification. Indicated resource classification is determined by either strategy using less composites at a closer range or more composites at a further range.
11.1.9Model Validation and Performance
The geologic resource model is evaluated by visual inspection, statistical analyses, and comparison with the blast hole model. Reconciliations between the resource model and blast hole models provide a measure of uncertainty associated with mineral resource classification.
Cross sections and level plans showing block model codes and drill hole composites are visually examined to verify proper coding of rock type and mineralogical ore type. Similarly, block model grades are compared with supporting composite values. These inspections show that block model values compare well with the drill hole composites.
Comparisons among assay, composite, and block model grades are performed for each mineralogical ore type as an integral part of the model process. Estimated grades in the model are evaluated by statistical analyses including cumulative probability plots of assays, composites, and blocks. The cumulative probability plots are developed to review that the block grade distributions mimic the distributions of the underlying data. Block model AIK, OK, and IDW results are compared with the composite data and NN estimates.
As confirmation of the mineral reserve and resource process, third-party consultants are occasionally hired to perform verification studies. The Morenci mine was last reviewed for year-end reporting during 2019, concluding that “the block model was developed using industry standard practices and is a fair and reasonable representation of the drill hole data”.
FCX corporate standards are that the resource model should be within 10 percent of the blast hole model for tonnage, grade, and contained or recoverable metal over a 12-month period. For sites such as the Morenci mine with multiple processing methods, comparisons are made for each, but consideration is given to the processing method that represents the greatest proportion of production. The comparison between the resource model and the blast hole model indicates that the resource model meets FCX criteria.
| as of December 31, 2021 | 40 | ||||
| Technical Report Summary for Morenci Mine, Arizona, U.S. | ||||
11.1.10Comment on Geologic Resource Model
The Morenci mine has a long history of mining and has been the subject of numerous geological studies. In the opinion of the QP, who is a member of the FCX Resource Model Audit Team and has participated in reviews of the most recent model updates:
•The Morenci geology staff has a good understanding of the lithology, structure, alteration, and copper mineral types in the district. The understanding of the controls on mineralization are adequate to support estimation of mineral reserves and mineral resources.
•The understanding and interpretation of ore types based on copper mineralogy is a key component to supporting classification of mineral reserves and mineral resources by process method.
•The geological knowledge of the district is sufficient to provide reliable inputs to mine planning, geomechanics and metallurgy.
•The geologic resource model has been completed using accepted industry practices.
•The model is suitable for estimation of mineral reserves and mineral resources.
11.2Resource Evaluation
Mineral resource estimates are developed by applying technical and economic modifying factors to the geologic block model to identify material with potential for economic extraction. The process of evaluation is iterative involving an initial draft using the assumptions, understanding the implications of the resulting economical mining limits, and adjusting the assumptions as warranted for subsequent evaluations.
Mineral resource estimates are determined using measured, indicated, and inferred classified materials as viable ore sources during evaluations with the modifying factors.
11.2.1Economic Assumptions
FCX executive management establish reasonable long-term metal pricing to be used in determining mineral reserves and mineral resources. These prices are based on reviewing external market projections, historical prices, comparison of peer mining company reported price estimates, and internal capital investment guidelines. The long-term sale prices align the company’s strategy for evaluating the economic feasibility of the mineral reserves and mineral resources.
Unit costs are derived from current operating forecasts benchmarked against historical results and other similar operations. Additional input from appropriate internal FCX departments such as Global Supply Chain, Sales and Marketing, and Finance and Accounting are considered when developing the economic assumptions.
To recognize the relationship between commodity prices and principal consumable cost drivers, FCX scales unit costs to reflect the cost environment associated with the reported metal prices. This is evidenced in the differences in economic assumptions between mineral reserves and mineral resources.
The metal price and cost assumptions are used over the timeframe of the expected life of the mine and reflect steady-state operating conditions in the metal price cost environment. Details of the economic assumptions are outlined in Table 11.3.
| as of December 31, 2021 | 41 | ||||
| Technical Report Summary for Morenci Mine, Arizona, U.S. | ||||
11.2.2Processing Recoveries
Processing recoveries are outlined in Section 10.
11.2.3Physical Constraints
Slope angle recommendations are provided by FCX geomechanical groups and third-party consultants. The recommendations are derived from empirical analysis of geological and hydrogeological modeling, drill hole results, and in-field measurements.
Boundary limits for resource evaluation include property ownership and permitting limits, and additional major infrastructure relocation requiring capital investment for boundary expansions.
11.2.4Time-Value Discounting
To recognize the time delay in extracting increasingly deeper portions of the mine as part of the mining process, FCX uses bench discount factoring for resource evaluation processes. This factor discounts each block’s value relative to the block’s elevation in the geologic block model, effectively assigning a higher relative value to material located closer to the surface than deeper material, which cannot be accessed until overlying material has been removed.
Additionally, hydrometallurgical processes achieve final recoveries after a period of years of repeated solution applications whereas concentrating process recoveries are realized on a more immediate timeframe. In recognition of this distinction, a time-value discount is applied to hydrometallurgical recovery based on the planned recovery curves.
11.2.5Cutoff Grades
A cutoff grade is used to determine whether material should be mined and if that material should be processed as ore or routed as waste. The mine planning software evaluates the revenue and cost for each block in the block model to determine routing, selecting material that has a reasonable basis for economic extraction using the provided assumptions. The following formula demonstrates how the cutoff grades are determined within the software:
Internal cutoff grade = Sum of [processing costs + general site and sustaining costs] / Sum of [payable recoverable metal * (metal price – metal refining and sales costs)]
A break-even cutoff grade calculation is similar to the internal cutoff grade formula but includes mining costs. Blocks with grades above the break-even cutoff grade generate positive value, while blocks with grades above the internal cutoff grade minimize negative value. The cutoff grades reported for mineral resources reflect the internal cutoff grades based on economical destination routing from the software results.
Input parameters are applied to individual deposits and distinct ore types as appropriate. Unique parameters can result in distinct cutoff grades. Cutoff grades are reported in terms of an Equivalent Copper Grade (EqCu) defining the relative value of all commercially recoverable metals in terms of copper by ore processing methods.
| as of December 31, 2021 | 42 | ||||
| Technical Report Summary for Morenci Mine, Arizona, U.S. | ||||
11.2.6Economic and Technical Assumptions
The economic and technical assumptions used for the generation of potentially economical mining limits are summarized in Table 11.3.
Table 11.3 – Economic and Technical Assumptions for Resource Evaluation
It is noted in comparison of current metal prices, mineral reserve and mineral resource price estimates reported by peer mining companies, and market analyst forecasted long-term prices that the assumed price of copper could be considered conservative. Although these sources serve as reference points, higher metal prices and associated costs indicate that additional mineral resources would be profitable in higher metal price environments thus extending the projected life of the mine. As such, the copper price assumptions are considered appropriate for determining mineral reserves and mineral resources.
| as of December 31, 2021 | 43 | ||||
| Technical Report Summary for Morenci Mine, Arizona, U.S. | ||||
11.3Mineral Resource Statement
The mineral resource estimate is the inventory of material identified as having a reasonable likelihood for economic extraction inside the mineral resource economical mining limit, less the mineral reserve volume, as applicable. The modifying factors are applied to measured, indicated, and inferred resource classifications to evaluate commercially recoverable metal. As a point of reference, the in-situ ore containing copper and molybdenum metal are inventoried and reported by intended processing method.
The reported mineral resource estimate in Table 11.4 is exclusive of the reported mineral reserve, on a 100 percent property ownership basis. The mineral resource estimate is based on commodity prices of $3.00 per pound copper and $12 per pound molybdenum.
Table 11.4 – Summary of Mineral Resources
Extraction of the mineral resource may require significant capital investment, specific market conditions, expanded or new processing facilities, additional material storage facilities, changes to mine designs, or other material changes to the current operation.
| as of December 31, 2021 | 44 | ||||
| Technical Report Summary for Morenci Mine, Arizona, U.S. | ||||
In the opinion of the QP, risk factors that may materially affect the mineral resource estimate include (but are not limited to):
•Metal price and other economic assumptions.
•Changes in interpretations of continuity and geometry of mineralization zones.
•Changes in parameter assumptions related to the mine design evaluation including geotechnical, mining, processing capabilities, and metallurgical recoveries.
•Changes in assumptions made as to the continued ability to access and operate the site, retain mineral and surface rights and titles, maintain the operation within environmental and other regulatory permits, and social acceptance to operate.
Uncertainty in geological resource modeling is monitored by reconciling model performance against actual production results, as part of the FCX geologic resource model verification process.
11.4Comment on Mineral Resource Estimate
The mineral resource estimate has been prepared using industry accepted practice and conforms to the disclosure requirements of S-K1300. Mineral reserve and mineral resource estimates are evaluated annually providing the opportunity to reassess the assumed conditions. Although all the technical and economic issues likely to influence the prospect of economic extraction of the resource are anticipated to be resolved under the stated assumed conditions, no assurance can be given that the estimated mineral resource will become proven and probable mineral reserves.
12MINERAL RESERVE ESTIMATE | ||
Mineral reserves are summarized from the LOM plan, which is the compilation of the relevant modifying factors for establishing an operational, economically viable mine plan. The LOM plan incorporates:
•Scheduling material movements for ore and waste from designed final mining excavation plans with a set of internal development sequences, based on the results of the resource evaluation process.
•Planned production from scheduled deliveries to processing facilities, considering metallurgical recoveries, and planned processing rates and activities.
•Capital and operating cost estimates for achieving the planned production.
•Assumptions for major commodity prices and other key consumable usage estimates.
•Revenues and cash flow estimates.
•Financial analysis including tax considerations.
Mineral reserves have been evaluated considering the modifying factors for conversion of measured and indicated resource classes into proven and probable reserves. Inferred resources are considered as waste in the LOM plan. The details of the relevant modifying factors included in the estimation of mineral reserves are discussed in Sections 10 through 21.
| as of December 31, 2021 | 45 | ||||
| Technical Report Summary for Morenci Mine, Arizona, U.S. | ||||
The LOM plan includes the planned production to be extracted from the in-situ mine designs and from previously extracted material, known as WIP inventories. WIP includes material on crushed leach and ROM leach pads for processing, and in stockpiles set aside to be rehandled and processed at a future date. WIP is estimated as of December 31, 2021 from production of reported deliveries through mid-year and the expected production to the end of the year.
12.1Cutoff Grade Strategy
The cutoff grade strategy is a result of the mine plan development, determined by the economic evaluation of the mineral reserves via strategic long-range mine and business planning. Economic cutoff grades are determined from the LOM planning results and can vary based on processing throughput expectations, ore availability, future ore and overburden requirements, and other factors encountered as the mine operates. This approach is consistent with accepted mining industry practice. Cutoff grades reported are the minimum grades expected to be delivered to a processing facility.
12.2Mineral Reserve Statement
As a point of reference, the mineral reserve estimate reports the in-situ ore and WIP inventories from the LOM plan containing copper and molybdenum metal and reported as commercially recoverable metal.
Table 12.1 summarizes the mineral reserves reported on a 100 percent property ownership basis. The mineral reserve estimate is based on commodity prices of $2.50 per pound copper and $10 per pound molybdenum.
| as of December 31, 2021 | 46 | ||||
| Technical Report Summary for Morenci Mine, Arizona, U.S. | ||||
Table 12.1 – Summary of Mineral Reserves
In the opinion of the QP, risk factors that may materially affect the mineral reserve estimate include (but are not limited to):
•Metal price and other economic assumptions.
•Changes in interpretations of continuity and geometry of mineralization zones.
•Changes in parameter assumptions related to the mine design evaluation including geotechnical, mining, processing capabilities, and metallurgical recoveries.
•Changes in assumptions made as to the continued ability to access and operate the site, retain mineral and surface rights and titles, maintain the operation within environmental and other regulatory permits, and social acceptance to operate.
As confirmation of the mineral reserve and resource process, third-party consultants are occasionally hired to perform verification studies. The Morenci mine was last reviewed for year-end reporting during 2019, concluding that “the reserves reported by Morenci mine are consistent with industry standard practices”.
| as of December 31, 2021 | 47 | ||||
| Technical Report Summary for Morenci Mine, Arizona, U.S. | ||||
The positive economics of the financial analysis of the LOM plan demonstrate the economic viability of the mineral reserve estimate.
12.3Comment on Mineral Reserve Estimate
The mineral reserve estimate has been prepared using industry accepted practice and conforms to the disclosure requirements of S-K1300. Mineral reserve and mineral resource estimates are evaluated annually, providing the opportunity to reassess the assumed conditions. All the technical and economic issues likely to influence the prospect of economic extraction are anticipated to be resolved under the stated assumed conditions.
Mineral reserve estimates consider technical, economic, and environmental, and regulatory parameters containing inherent risks. Changes in grade and/or metal recovery estimation, realized metal prices, and operating and capital costs have a direct relationship to the cash flow and profitability of the mine. Other aspects such as changes to environmental or regulatory requirements could alter or restrict the operating performance of the mine. Significant differences from the parameters used in this TRS would justify a re-evaluation of the reported mineral reserve and mineral resource estimates. Mine site administration and FCX dedicate significant resources to managing these risks.
13MINING METHODS | ||
The Morenci mine has a long operational history and mining conditions are well understood by the site and FCX corporate staff. The mining method is a conventional truck and shovel, open-pit operation.
13.1Mine Design
The results of the reserve economical mining limit evaluation discussed in Section 11 is used as guides to develop the final mine design and the phased pushback designs for mine sequencing. Mine designs are developed using specialized mine design computer software.
13.1.1Pit Slope Design Parameters
Slope angle recommendations are determined and reviewed by FCX engineers and third-party consultants. These recommendations are based on comprehensive geomechanical testing, studies, and the geomechanical monitoring procedures in the field.
Haul roads and geomechanical catchment berms or step-ins, in conjunction with the recommended inter-ramp slope angles, determine the overall pit slope angles for the design. Inter-ramp slope angles account for differences in rock quality and can include single or double bench designs and various catch bench widths. Ten pit slope domains have been defined at the pit areas, each with different design inter-ramp slope angles. The inter-ramp slope angles vary between 37 to 54 degrees and bench face angles vary between 68 to 75 degrees.
Figure 13.1 provides the pit slope domain areas for the Morenci mine. Pit wall slopes are designed with inter-ramp slope angles assigned to each of those domains.
| as of December 31, 2021 | 48 | ||||
| Technical Report Summary for Morenci Mine, Arizona, U.S. | ||||
Figure 13.1 – Pit Slope Domains

13.1.2Geomechanical and Hydrological Modeling
Geomechanical and hydrological modeling is discussed in Section 7.
The performance of the open-pit wall slopes is monitored with a network of geomechanical and hydrogeological instrumentation. The Morenci mine uses instrumentation that includes slope stability radars, laser scanners, satellite monitoring, extensometers, inclinometers, time domain reflectometry, piezometers, seismic blast monitoring, GPS tracking, and robotic survey stations. Groundwater and pore pressure
| as of December 31, 2021 | 49 | ||||
| Technical Report Summary for Morenci Mine, Arizona, U.S. | ||||
are controlled with dewatering wells and horizontal drain holes for specific slope depressurization needs as the pit area increases during the life of the mine. The monitoring plan defines responsibilities and outlines the monitoring procedures and trigger points for the initiation of specified remedial measures if movement is detected, and it is the basis for the design of any required remedial measures.
13.1.3Final Mine Design
Using specialized computer software, mine designs are developed with key considerations that include:
•Compliance with the geomechanical recommendations.
•Reasonable haul road widths and effective grades.
•Operational bench height that is safely manageable with the loading equipment, in single and/or double bench configurations where allowable.
•Adequate mining width for practical mining.
•Locating pit exits near to material destinations as practical.
•Infrastructure location requirements and other boundary restrictions.
•Mine sequencing that maintains continuous production throughout the mine life.
Mine designs are reviewed for compliance to key parameters and reasonableness with comparison to historical and current operating practices. The reserve final mine design is illustrated in Figure 13.2.
| as of December 31, 2021 | 50 | ||||
| Technical Report Summary for Morenci Mine, Arizona, U.S. | ||||
Figure 13.2 – Final Mine Design

The final mine design is approximately 3.4 miles in width (east-west) and 4.5 miles in length (north-south). The expected depth of the pit is about 3,700 feet, ranging from 2,550 to 6,250 feet above sea level. Mining is designed to take place on 50-foot benches, with pit slopes allowing for double bench configuration where feasible.
The haul ramps are planned with a width of 130 feet and with a 10 percent grade but can vary in different sections of the ramp. They are designed to accommodate the current truck fleet.
| as of December 31, 2021 | 51 | ||||
| Technical Report Summary for Morenci Mine, Arizona, U.S. | ||||
13.2Mine Plan Development
The mine plan is developed based on supplying ore to the processing facilities considering equipment production rates, the mining advance rate through the deposit, ore/waste routing, waste stripping requirements, material storage facility capacities, and expansion opportunities. LOM plan schedules are developed using specialized mine planning software.
The mine plan is developed utilizing measured and indicated mineral resource material only. Resource material that is classified as inferred within the mine design is considered waste for LOM planning and mineral reserve estimation.
The deposit is a typical disseminated porphyry type copper deposit, where contact dilution is incorporated into the grade estimation process. As a result, no additional dilution assumption is applied.
Mining ore block recovery is directly related to the mining dilution. Mining recovery in open-pit mines tends to be very high, particularly in disseminated deposits associated with large loading equipment. As result, mining ore block recovery is assumed at 100 percent.
The mine plan is scheduled to ramp up to deliver a targeted average mill production rate of 150,000 tons of ore per day by 2024 through 2036, then reduces to an average of 90,000 for the final years. The plan is scheduled to ramp up to deliver a targeted average crushed leach production rate of 90,000 tons of ore per day by 2023. ROM leach deliveries are variable with an average of 367,000 tons of ore per day. The LOM plan stripping ratio (waste tonnage over ore tonnage) at the Morenci mine is 0.41. Mining activities are projected to end in 2041, when the current reserves are expected to be exhausted.
The mine production rate and expected mine life are illustrated in Figure 13.3.
Figure 13.3 – Total Tonnage Planned Material Movement
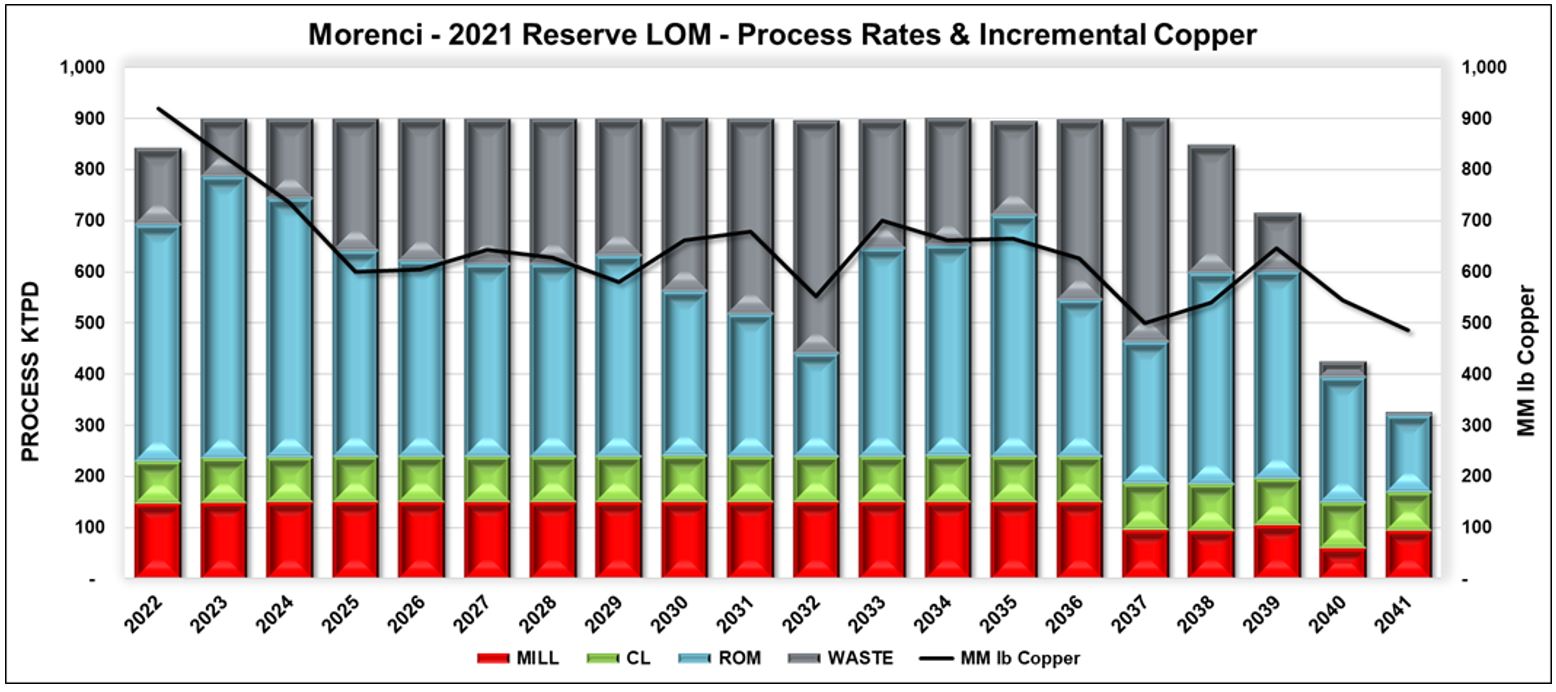
The LOM plan does not include plans for underground development. There is limited backfilling of the open-pit planned to accommodate the U.S. Highway 191 relocation and
| as of December 31, 2021 | 52 | ||||
| Technical Report Summary for Morenci Mine, Arizona, U.S. | ||||
improve haulage flexibility between the Western Copper and Ponderosa mine areas. Future studies could further these options as viable improvements to the mine plan development.
13.3Mine Operations
Mine unit operations include drilling, blasting, loading, hauling, and auxiliary support.
Primary production equipment is used to mine ore and waste, and as of December 31, 2021, comprises of 14 blast hole drills, 13 electric rope shovels with bucket sizes ranging from 62 to 74 cubic yards, 5 front end loaders, and 154 trucks with a 267-ton payload factor. The primary production equipment is supported by a fleet of ancillary equipment including track dozers, wheel loaders, motor graders, backhoes, and water trucks. Support equipment is used for building access roads, road maintenance, and other mine services.
The LOM plan includes equipment units up to 13 electric rope shovels and 159 haul trucks. Mine equipment is replaced or rebuilt after its useful life is achieved. Costs for mine equipment replacements and additions are accounted for in the financial modeling.
The site is in operation with experienced management and sufficient personnel. The mine operates 365 days per year on a 24 hour per day schedule. Operational, technical, and administrative staff are on-site to support the operation. As of December 31, 2021, mine operations have 1,706 employees with additional contractors available as needed.
14PROCESSING AND RECOVERY METHODS | ||
The process facilities operate 365 days per year with exceptions for maintenance. The facilities have a long operating history. FCX and the Morenci mine anticipate that the site will have adequate energy, water, process materials, and permits to continue operating throughout the LOM plan. Figure 14.1 illustrates an overview process map.
| as of December 31, 2021 | 53 | ||||
| Technical Report Summary for Morenci Mine, Arizona, U.S. | ||||
Figure 14.1 – Site Process Diagram

Ore can be directed through hydrometallurgical or concentrating facilities. The hydrometallurgical operation consists of crushed and ROM leach pads, stacking equipment for ore placement, a CLP facility, four SX plants, and three EW facilities. The hydrometallurgical process produces a high-quality copper cathode.
Primary and certain secondary sulfide ores are processed in the concentrating facilities. The concentrating operation contains two concentrators and a molybdenum processing plant, which produce a copper concentrate and a molybdenum concentrate.
These processing methodologies are accepted industry practices for the types of mineralization found at the mine site and are supported by recovery results.
14.1Hydrometallurgical Processing Description
Oxide and secondary sulfide ores from the mine are delivered to leach pads. The SX/EW plant is designed to extract copper from the pregnant leach solutions (PLS) collected from the site’s leach pads. Copper is extracted from the ores by using a grid solution system to deliver an aqueous solution containing acid from the plant, called raffinate, to the leach pads. As this acidic solution passes through the heaped material, it extracts copper in the form of copper ions in the PLS.
The PLS is delivered to the SX/EW plant via collection ditches, ponds, and pumping systems. The process takes PLS and extracts the copper ions in extraction mixer-settlers. The copper is extracted via a liquid ion-exchange reagent carried in diluent. A chemical reaction selectively causes the copper to transfer from the PLS to the organic phase. The barren raffinate leaving the SX plant is pumped to the leach pads to extract additional copper from the stacked ore. The loaded organic phase is separated and flows to a strip mixer-settler where the copper is transferred from the organic to the electrolyte that is circulated to the EW plant.
| as of December 31, 2021 | 54 | ||||
| Technical Report Summary for Morenci Mine, Arizona, U.S. | ||||
The electrolyte is filtered and heated before being passed through the EW cells where the copper is plated onto stainless steel blanks. Once an adequate amount of copper has plated out of solution as cathodes, these are removed from the cells, washed, and the copper sheets are mechanically harvested. Figure 14.2 illustrates the hydrometallurgical copper transfer cycle.
Figure 14.2 – Hydrometallurgical Transfer Process

A diagram illustrating the Morenci mine’s hydrometallurgical process is shown in Figure 14.3. The SX plants have the ability to run over 100,000 gallons per minute PLS flow and the EW tank house cathode production capacity is approximately 900 million pounds per year.
Figure 14.3 – Hydrometallurgical Process Diagram

In addition to the crushed and ROM leach and SX/EW processes, the Morenci mine has a CLP as an intermediary process, which takes final copper concentrate produced from the concentrator process and subjects the concentrate to pressure oxidation converting
| as of December 31, 2021 | 55 | ||||
| Technical Report Summary for Morenci Mine, Arizona, U.S. | ||||
copper from solid form into liquid copper ions. The resulting solution contains higher concentrations of copper and acid than the typical solutions from the heap leaching process. The solutions are combined with other PLS sources and processed through the SX/EW plants and copper cathode is produced as a final product for shipment to market.
Hydrometallurgical recoveries are tracked from the leach stockpiles through to the production of copper cathode. Items that can affect the rate of recovery through the stockpiles include but are not limited to: application rate and method, particle size, leach cycle as days under leach, acid addition and consumption, solution chemistry, ore type and mineralization, pyrite content, stacking methodology, and stacking height.
Recoveries are tracked over multiple years. Additionally, performance is reviewed periodically through FCX corporate audits to monitor that recoveries are on track to being achieved and continue to be appropriate.
14.2Concentrator Processing Description
Primary and secondary sulfide ores are processed in the concentrators, which produce a copper concentrate and a molybdenum concentrate. The copper concentrate is either shipped off-site to market or processed on-site through the CLP process.
Ore is delivered from the mine to the primary crushers where it is crushed and conveyed to a coarse ore stockpile that feeds the concentrators. Ore is conveyed from the stockpile to the Morenci concentrator where it is stage crushed through secondary and tertiary cone crushers before being conveyed to a fine ore storage bin. It is then fed to 32 primary ball mills that operate in closed circuit with spiral classifiers to liberate copper and molybdenum minerals from gangue minerals. These classifiers return coarse particles to the mills for further grinding and advance fine particles to collective flotation for copper and molybdenum recovery. Concentrate from the first stage of flotation advances to regrind mills and cleaner flotation stages that produce an intermediate copper/molybdenum concentrate. This concentrate is thickened before it advances to the copper/molybdenum separation flotation circuit.
Ore is also conveyed from the coarse ore stockpile to a separate secondary crushing facility for the Metcalf concentrator. Product from these secondary cone crushers is advanced to a tertiary hydraulic roll crusher (HRC) before being conveyed to a surge bin that supplies the primary grinding circuit. Ore is conveyed from the surge bin to wet screens that feed the primary ball mills. Wet screen oversize is recycled back to the HRC for further crushing. Wet screen undersize mixes with ball mill product and this stream is classified in hydrocyclones, with coarse particles returning to the ball mills and fine particles advancing to the collective flotation circuit for recovery of copper and molybdenum. Concentrate advances to regrind mills and cleaner flotation producing an intermediate concentrate. The copper/molybdenum concentrate is thickened before combining with Morenci concentrate and advancing to the copper/molybdenum separation flotation circuit.
The copper/molybdenum separation flotation circuit consists of a primary flotation stage and four cleaner flotation stages. The purpose of the flotation circuit is to produce separate marketable concentrates. Tailings from the primary flotation stage is final copper concentrate, which advances to a thickener. Thickener underflow is either sent to CLP for further processing or filtered and stored in the concentrate storage building. Filtered copper concentrate is then loaded in railcars or truck-trailer road vehicles and
| as of December 31, 2021 | 56 | ||||
| Technical Report Summary for Morenci Mine, Arizona, U.S. | ||||
shipped to an off-site smelter. Molybdenum concentrate is produced from the fourth cleaner flotation stage. From there it is thickened, filtered, and packaged into supersacks prior to being shipped to off-site conversion facilities.
Flotation tailings from both concentrators advance to tailings thickeners where process water is recovered and recycled back to the concentrators. Conventionally thickened tailings flow via gravity down an open channel launder to pump stations where they are pumped to the TSFs. Figure 14.4 illustrates a process flow diagram of the Morenci and Metcalf facilities.
Figure 14.4 – Morenci and Metcalf Concentrator Process Flow Diagram

The processing facility performance is reviewed regularly, and adjustments are made as necessary to improve performance and reduce costs.
14.3Processing Requirements
Adequate supplies for energy, water, process materials, and sufficient personnel are currently available to maintain operations and are anticipated throughout the LOM plan. Process materials are provided to site on an as-needed basis through the FCX and the Morenci mine global supply chain departments. The actual consumption of key processing supplies varies depending on ore feed and operating conditions in the plants. Table 14.1 includes the typical ranges of consumption for key processing requirements.
| as of December 31, 2021 | 57 | ||||
| Technical Report Summary for Morenci Mine, Arizona, U.S. | ||||
Table 14.1 – Processing Facilities Consumables
| Parameter | Typical Range | |||||||
| Concentrator Energy (kWh per ton ore) | 14 to 17 | |||||||
| Hydrometallurgical Energy (kWh per pound of copper) | 1.5 to 2.0 | |||||||
| Mill Process Water (gallon per ton ore) | 110 to 140 | |||||||
| Hydrometallurgical Makeup Water (gallon per minute) | 2,800 to 4,700 | |||||||
| Process Materials | ||||||||
| Liners and Wear Parts (pounds of steel per ton ore) | 0.3 to 0.5 | |||||||
| Balls (pounds of steel per ton ore) | 1.0 to 1.5 | |||||||
| Primary Collector (pounds per ton ore) | 0.03 to 0.05 | |||||||
| Lime (pounds per ton ore) | 2.75 to 3.25 | |||||||
| Acid (pounds acid per ton ore) | 4 to 7 | |||||||
Consumable and personnel requirements for the processing facilities are expected to be near current levels in the near-term with variation dependent on production levels in the various unit operations. As of December 31, 2021, the concentrating operations have 496 employees and the hydrometallurgical operations have 729 employees. Contractors are available as needed.
15SITE INFRASTRUCTURE | ||
The site infrastructure at the Morenci mine has been established over the history of the project and supports the current operations. The current major mine infrastructure includes waste rock storage facilities, ROM leach pads, crushed leach pads and stacking systems, temporary stockpiles, TSFs, power and electrical systems, water usage systems, various on-site warehouses and maintenance shops including large-scale mine truck shops, and offices required for administration, engineering, maintenance, and other related mine and processing operations. The communication system at site includes internet and telephone access connected by hard-wire, fiberoptic, and mobile networks. Access to the property is discussed further in Section 4 of this TRS. The site infrastructure is shown in Figure 15.1.
| as of December 31, 2021 | 58 | ||||
| Technical Report Summary for Morenci Mine, Arizona, U.S. | ||||
Figure 15.1 – Site Infrastructure Map

| as of December 31, 2021 | 59 | ||||
| Technical Report Summary for Morenci Mine, Arizona, U.S. | ||||
15.1Waste Rock Storage Facilities
The Morenci LOM plan considers placing mined waste material in the waste rock storage facilities. There is sufficient capacity to handle the waste deliveries as scheduled in the LOM plan.
15.2Leach Pads and Stockpiles
The Morenci mine utilizes stockpiles including ROM and crushed leach pads. Mined material is routed directly to the ROM leach pads whereas the crushed leach pads receive mined material that has been reduced in size through a primary crushing stage. The LOM plan includes leach placements concluding in 2041 with the leach pads continuing to be leached through 2044 when the SX/EW plant is expected to conclude operations. Additional leach pad stockpile capacity is required in the LOM plan. A placeholder of estimated costs for the additional capacity is included in the financial analysis.
The mine also has temporary mill stockpiles. Mined material is directed to these stockpiles to be rehandled and processed through the concentrators later. The mill stockpiles have sufficient capacity for the planned deliveries in the LOM plan.
Leach pads, stockpiles, and waste rock storage facilities are surveyed regularly, and daily production records are used to track the mine deliveries.
15.3Tailings Storage Facilities
There are multiple TSFs managed at the Morenci mine that receive flotation tailings from the concentrators. The flotation tailings are thickened and pumped to the TSFs where they are deposited, and water is recycled back to the mill. The TSFs are generally located south of the mills.
The TSFs, as currently designed, lack sufficient storage capacity for the entire planned mineral reserves estimate in the LOM plan. Options to increase capacity have been identified in potential raises to the currently designed TSFs and alternate locations for an additional TSF. Having been through the permitting processes previously and given the current capacity is sufficient until 2034 at planned rates, FCX and the Morenci mine anticipate having sufficient tailings storage available as required in the LOM plan. A placeholder of estimated costs for the additional capacity is included in the LOM plan financial analysis.
15.4Power and Electrical
The Morenci mine’s electrical power is supplied by MW&E. MW&E is a retail utility regulated by the Arizona Corporation Commission. MW&E sources its generation services through FMES. FMES is a Federal Energy Regulatory Commission licensed exempt wholesale generator with transmission and generation rights throughout Arizona and New Mexico. The mine’s power is delivered through transmission agreements with Tucson Electric Power Company, El Paso Electric, and Arizona Electric Power Cooperative. MW&E has contracted with FMES for 125MW of capacity rights at the Luna Energy Facility and other term purchase power agreements. Morenci also has 24MW of natural gas fired combustion turbines on-site able to provide electrical power when required.
| as of December 31, 2021 | 60 | ||||
| Technical Report Summary for Morenci Mine, Arizona, U.S. | ||||
15.5Water Usage
The Morenci mine’s water is supplied by a combination of sources including decreed surface water rights in the San Francisco River, Chase Creek, and Eagle Creek drainages, groundwater from the Upper Eagle Creek Wellfield, and Central Arizona Project water leased from the San Carlos Apache Tribe and delivered to Morenci via exchange through the Black River Pump Station. Makeup water supply is sourced from the Lower Eagle Creek (LEC) diversion and delivery system. Potable and domestic use water is sourced from the LEC makeup water supply. Process facilities operate using a combination of fresh and recycled water from the in-pit dewatering system, reclaim wells, and existing TSFs.
15.6Product Handling
Copper concentrate and cathode is loaded by FCX to be shipped off-site by railcars or trucks. Molybdenum concentrate is shipped off-site via truck. Third-party shipping is used for both rail and truck transport.
15.7Logistics, Supplies, and Site Administration
The operation has common management and services, as well as a logistics network that includes warehouses, vehicles, and personnel required to distribute and store the large quantity of supplies used by the operation and its workforce. Warehouses are maintained at various locations throughout the site.
Supporting infrastructure in Morenci has been built, improved, and expanded over the life of the project, including a townsite providing employees and their dependents with services ranging from retail stores, restaurants, residential facilities, schools, libraries, banks, postal services, training and recreational facilities to health service facilities.
16MARKET STUDIES | ||
The Morenci mine produces copper concentrate and cathode products. A molybdenum concentrate is also produced.
16.1Market for Mine Products
Copper is an internationally traded commodity, and its prices are determined by the major metal exchanges. Prices on these exchanges generally reflect the worldwide balance of copper supply and demand and can be volatile and cyclical. In general, demand for copper reflects the rate of underlying world economic growth, particularly in industrial production and construction. FCX believes copper will continue to be essential in these basic uses as well as contribute significantly to new technologies for clean energy, to advance communications, and to enhance public health.
Molybdenum is a key alloying element in steel and the raw material for several chemical-grade products used in catalysts, lubrication, smoke suppression, corrosion inhibition, and pigmentation. Molybdenum, as a high-purity metal, is also used in electronics such as flat-panel displays and in super alloys used in aerospace. Reference prices for molybdenum are available in several publications including Metals Week, CRU Report, and Metal Bulletin.
| as of December 31, 2021 | 61 | ||||
| Technical Report Summary for Morenci Mine, Arizona, U.S. | ||||
FCX owns smelting, refining, and product conversion facilities for copper and molybdenum products, operated as separate business segments. Sales between FCX’s business segments are based on terms similar to arms-length transactions with third-parties at the time of the sale.
A portion of Morenci mine’s copper concentrate is processed through FCX’s wholly owned copper smelter in Miami, Arizona and refinery and rod mill located in El Paso, Texas and through FCX’s wholly owned subsidiary smelting and refining operation in Huelva, Spain. A portion of Morenci’s copper cathode is converted to copper rod in FCX’s wholly owned rod mills located in Miami and El Paso. The resultant copper rod from FCX’s North America rod mills is sold to downstream wire and cable producers throughout North America while the electro-refined copper cathode produced in Spain is sold to third-party consumers and merchant traders throughout Europe and the Mediterranean region. The balance of copper concentrate and cathode is sold to third-party smelters or consumers and merchant traders.
The mine’s molybdenum concentrate is processed through FCX’s wholly owned roaster operations at Ft. Madison in Iowa, Sierrita mine in Arizona, and at Rotterdam in the Netherlands, and a portion through the concentrate leach process at FCX’s Bagdad mine in Arizona. The resultant molybdenum products from the Rotterdam plant supply the chemical and steel industries in Europe while the material from the U.S. plants supply the industries in the U.S. and Asia. Climax Molybdenum Company, FCX’s wholly owned subsidiary, administers the molybdenum business segment.
Most of the copper and molybdenum products resulting from the Morenci mine are sold to customers with whom FCX has built and maintained long-term relationships. The majority of the sales agreements are negotiated annually and are relatively standardized. The underlying copper price is determined by, and fluctuates with, the commodity exchange price while the treatment and refining charges and premiums are negotiated annually based on market conditions. The underlying molybdenum price is determined by published Platts Metals Week index reference pricing, which is determined by globally reported spot transaction reporting.
16.2Commodity Prices Forecast and Contracts
Long-term metal price projections for reserve estimation are:
•$2.50 per pound copper
•$10 per pound molybdenum
All contracts currently necessary for supplies and services to maintain the Morenci mine’s facilities and production are in place and are renewed or replaced within timeframes and conditions of common industry practices.
FCX and the QPs believe that the marketing and metal price assumptions for metal products are suitable to support the financial analysis of the mineral reserve evaluation. Further information regarding the sale and marketing of the mine’s metal products are discussed in FCX’s Annual Report on Form 10-K for the year ended December 31, 2021.
| as of December 31, 2021 | 62 | ||||
| Technical Report Summary for Morenci Mine, Arizona, U.S. | ||||
17ENVIRONMENTAL STUDIES, PERMITTING, AND SOCIAL IMPACT | ||
The Morenci mine adheres to FCX’s environmental and sustainability programs, including policies and management systems regarding environmental, permitting, and community issues. Morenci has implemented an Environmental Management System that is certified to the internationally recognized ISO-14001:2015 standard. FCX’s programs are based on policies and systems that align with the International Council on Mining and Metals Sustainable Development Framework and the Copper Mark. FCX routinely evaluates implementation of these policies through internal and external independent assessments and publicly reports on its performance.
Further discussion regarding environmental, permitting, and social or community impacts is available in the latest FCX Annual Report on Sustainability.
17.1Environmental Considerations
Environmental monitoring is ongoing at the Morenci mine and will continue over the life of the operations and beyond through closure. The Morenci mine has received multiple environmental regulatory approvals from the State of Arizona, Greenlee County, and federal agencies for the operation and closure of the mine. Many of these regulatory approvals had public participation components. Several of these authorizations required that the Morenci mine conduct environmental baselines and impact studies for environmental resources including, but not limited to, air quality, surface and groundwater quality, landscape, soil, climate, traffic, biodiversity, and cultural resources. The Morenci mine continues to monitor these baselines and impact studies regularly at compliance points and report to required agencies.
17.2Permitting
FCX and the Morenci mine staff believe that all major permits and approvals are in place to support operations at the Morenci mine, however additional permits will likely be necessary in the future. Where permits have specific terms, renewal applications are made to the relevant regulatory authority as required, prior to the end of the permit term.
The Morenci mine has obtained multiple Clean Water Act (CWA) Section 404 permits from the U.S. Army Corps of Engineers in support of past and ongoing mine operations. Mining activities authorized by these permits are complete and Morenci is now monitoring several mitigation sites as required by these permits. Morenci reports monitoring results to the Army Corps of Engineers. Morenci is evaluating CWA Section 404 applicability for the incremental expansion of its mining facilities.
An area-wide APP from ADEQ is a key permit that authorizes design, construction, operation, monitoring, reporting, and closure of mining facilities that have the potential to discharge to groundwater. The permit requires that the Morenci mine operate these facilities to prevent an exceedance of the State of Arizona Aquifer Water Quality standards at designated point of compliance wells, which are monitored on a routine basis. Results of this monitoring are reported to ADEQ as per conditions in the permit.
Based on the LOM plan, additional permits will be necessary in the future for continued operation of the Morenci mine, including APP amendment applications and obtaining ADEQ approval for increased leach pad stockpile and tailings storage capacities under the existing APP. The Morenci mine staff submitted an APP amendment application to
| as of December 31, 2021 | 63 | ||||
| Technical Report Summary for Morenci Mine, Arizona, U.S. | ||||
ADEQ in August of 2021 and expects to obtain permit coverage in 2022. Additional projects that would require an amendment to the APP are being evaluated. Closure strategies will be developed for these proposed facilities as part of the permitting process.
Consistent with State of Arizona rules and regulations for mine closure and reclamation, the Morenci mine has an approved closure strategy through its APP for closure and post-closure monitoring and maintenance of its active facilities such as TSFs, waste and leach pad stockpiles, and associated process water impoundments. The Morenci mine also has an approved mine reclamation plan with the Arizona State Mine Inspector Office for surface reclamation that will be implemented following cessation of mine operations in coordination with the closure strategy. Both state programs require development and agency approval of cost estimates and the establishment of financial assurance. The Morenci mine maintains financial assurance with the State of Arizona for these programs.
17.3Waste and Tailings Storage, Monitoring, and Water Management
The Morenci mine has developed and continues to implement detailed, comprehensive mine waste and tailings management programs to meet the applicable State of Arizona environmental protection regulations and FCX environmental management practices. These programs include State of Arizona APP requirements and the Engineer of Record designs, for the specific cases of TSFs and certain leach pad stockpiles. The site also follows FCX’s tailings management and stewardship program.
17.4Mine Closure Plans
ADEQ governs facility closure under the state’s APP program and requires preparation of a closure strategy, post closure plan, and development of cost estimates and financial assurance for permitted facilities such as TSFs, leach pad stockpiles, and other mine facilities. Separately, the Arizona State Mine Inspector’s Office requires mines to develop mine reclamation plans that describe steps to stabilize the mine site following cessation of operations to achieve an approved post mining land use. The Morenci mine closure strategy and mine reclamation plan are two documents, developed by third-parties, that consider long-term physical and chemical stability and implementation of approved post mining land uses for the site following the end of mine operations. The closure strategy and reclamation plan detail tasks to be performed at closure and the post-closure phase of the mine’s life cycle. The Morenci mine’s APP requires updates to the closure strategy cost estimate every six years. The Morenci mine has State of Arizona approved closure strategies for its waste rock and leach pad stockpiles, tailings, and other water management facilities subject to APP. The next update to the closure strategy is due to be submitted to ADEQ in 2022 for review and approval. Following ADEQ approval of the revised closure strategy cost estimate, FCX will provide ADEQ with an updated financial assurance for this update.
The closure strategy for the Morenci mine APP facilities incorporates various approaches including, but not limited to, removal and reclamation of process water impoundments, in-place closure of TSFs and leach pad stockpiles, and post closure monitoring and maintenance of closed facilities and points of compliance wells. Closure of TSFs includes regrading tailings and installing soil cover systems incorporating revegetation that manage water through evaporation and transpiration. Water management systems are intended to stabilize closed facilities, minimize erosion, and protect water resources.
| as of December 31, 2021 | 64 | ||||
| Technical Report Summary for Morenci Mine, Arizona, U.S. | ||||
The total closure cost estimate for the LOM plan is approximately $0.4 billion based on a cash flow schedule for the implementation of closure, post closure, and reclamation tasks. The Morenci mine has satisfied the State of Arizona’s financial assurance requirements by using a variety of mechanisms, primarily involving FCX’s performance guarantees and financial capability demonstrations.
17.5Local Stakeholder Considerations and Agreements
As part of the ongoing permitting and compliance obligations with the county, state, and federal agency authorizations and as part of the mine’s commitment to local stakeholder engagement, the Morenci mine is dedicated to local community and social matters. The Morenci mine seeks to conduct its activities in a transparent manner that promotes proactive and open relationships with the local community, government, and other stakeholders to maximize the positive impacts of its operations and mitigate potential adverse impacts throughout the LOM plan.
The Morenci mine seeks to provide opportunities to support economic development by purchasing local goods and services. To support and grow the capacity of local businesses in the region, FCX maintains working relationships with various local business development organizations.
In addition, the Morenci mine seeks to provide opportunities to support economic development by hiring and training employees from local and regional communities. The mine is located in rural Arizona with a relatively low population density and as such, the Morenci mine directly or indirectly employs a relatively large portion of the local and regional labor force.
17.6Comment on Environmental Compliance, Permitting, and Local Engagement
In the QP’s opinion, the Morenci mine has adequate plans and programs in place, is in good standing with environmental regulatory authorities, and no current conditions represent a material risk to continued operations. The Morenci mine staff have a high level of understanding of the requirements of environmental compliance, permitting, and local stakeholders in order to facilitate the development of the mineral reserve and mineral resource estimates. The periodic inspections by governmental agencies, FCX corporate staff, third-party reviews, and regular reporting confirm this understanding.
18CAPITAL AND OPERATING COSTS | ||
The capital and operating costs are estimated by the property’s operations, engineering, management, and accounting personnel in consultation with FCX corporate staff, as appropriate. The cost estimates are applicable to the planned production, mine schedule, and equipment requirements for the LOM plan. The capital costs are summarized in Table 18.1.
Table 18.1 – Sustaining Capital Costs
| $ billions | |||||
| Mine | $0.9 | ||||
| Leach and SX/EW | 1.8 | ||||
| Concentrator | 0.8 | ||||
| as of December 31, 2021 | 65 | ||||
| Technical Report Summary for Morenci Mine, Arizona, U.S. | ||||
| Supporting Infrastructure and Environmental | 0.2 | ||||
| Total Capital Expenditures | $3.7 | ||||
Estimates are derived from current costs and adjusted to the reserve price environment. The estimates are not adjusted for escalation or exchange rate fluctuations. Actual realized costs are reviewed periodically, and estimates are refined as required.
Capital costs are primarily sustaining projects consisting of mine equipment replacements and planned site infrastructure projects, most notably to increase leach pad and TSF capacities over the production of the scheduled reserves. Capital cost estimates are derived from current capital costs based on extensive experience gained from many years of operating the property and do not include inflation. FCX and the Morenci mine staff review actual costs periodically and refine cost estimates as appropriate.
The operating costs for the LOM plan are summarized in Table 18.2.
Table 18.2 – Operating Costs
| $ billions | |||||
| Mine | $11.0 | ||||
| Leach and SX/EW | 5.4 | ||||
| Concentrator | 5.9 | ||||
| Balance | 3.8 | ||||
| Total site cash operating costs | 26.1 | ||||
| Freight | 0.6 | ||||
| Treatment charges | 0.5 | ||||
| By-product credits | (1.3) | ||||
| Total net cash costs | $25.9 | ||||
| Unit net cash cost ($ per pound of copper) | $1.98 | ||||
Estimates are derived from current costs and adjusted to the reserve price environment. The estimates are not adjusted for escalation or exchange rate fluctuations. Actual realized costs are reviewed periodically, and estimates are refined as required.
The operating cost estimates are derived from current operating costs and practices based on extensive experience gained from many years of operating the property and do not include inflation. The operating cost estimates reflect certain pricing assumptions, primarily for energy and foreign exchange rates, that are reflective of the copper market environment ($2.50 per pound copper price) at which the reserve plan has been prepared. As the property has a long operating history, FCX believes that the accuracy of the cost estimates is better than the minimum of approximately +/- 25 percent required for a pre-feasibility study level of mineral reserves as per S-K1300, and the level of risk in the cost forecasting is low. FCX and the Morenci mine staff review actual costs periodically and refine cost estimates as appropriate.
The LOM plan summary in this TRS is developed to support the economic viability of the mineral reserves. The latest guidance regarding updated operational forecast cost estimates are available in FCX’s Annual Report on Form 10-K for the year ended December 31, 2021, filed with the SEC.
| as of December 31, 2021 | 66 | ||||
| Technical Report Summary for Morenci Mine, Arizona, U.S. | ||||
19ECONOMIC ANALYSIS | ||
The LOM plan includes comprehensive operational drivers (mine and corresponding processing plans, metal production schedules and corresponding equipment plans) and financial estimates (revenues, capital costs, operating costs, downstream processing, freight, taxes and royalties, etc.) to produce the reserves over the life of the property. The LOM plan is an operational and financial model that also forecasts annual cash flows of the production schedule of the reserves for the life of the property under the assumed pricing and cost assumptions. The LOM plan is used for economic analyses, sensitivity testing, and mine development evaluations.
The financial forecast incorporates revenues and operating costs for all produced metals, processing streams, and overall site management for the life of the property. The economic analysis summary in Table 19.1 includes the material drivers of the economic value for the property and includes the net present value (NPV) of the unleveraged after-tax free cash flows as the key metric for the economic value of the property’s reserve plan under these pricing and cost assumptions. This analysis does not include economic measures such as internal rate of return or payback period for capital since these measures are not applicable (and are not calculable) for an on-going operation that does not have a significant upfront capital investment to be recovered.
Table 19.1 – Economic Analysis
| Metal Prices | |||||
| Copper ($ per pound) | $2.50 | ||||
| Molybdenum ($ per pound) | $10 | ||||
| Life of Mine Plan | |||||
| Copper (billion pounds) | 13.1 | ||||
| Molybdenum (billion pounds) | 0.2 | ||||
| Ore (billion tons) | 4.3 | ||||
| Copper grade (%) | 0.23 | ||||
| Copper metallurgical recovery (%) | 65.5 | ||||
| Capital costs ($ billions) | $3.7 | ||||
| Site cash operating costs ($ billions) | $26.1 | ||||
| Unit net cash cost ($ per pound) | $1.98 | ||||
| Economic Assumptions and Metrics | |||||
| Discount Rate (%) | 8 | ||||
| Corporate Tax Rate (%) | 23 | ||||
| Severance Tax (%) (Arizona mines) | 1.3 | ||||
| Net present value @ 8% ($ billions) | $1.2 | ||||
| Internal rate of return (%) | NA* | ||||
| Payback (years) | NA* | ||||
*Not Applicable (NA) as the property is an on-going operation with no significant negative initial cashflow/initial investment to be recovered.
| as of December 31, 2021 | 67 | ||||
| Technical Report Summary for Morenci Mine, Arizona, U.S. | ||||
The key drivers of the economic value of the property include the copper market price, copper grades and recoveries, and costs. Depending on the changes in these key drivers, FCX can adjust operating plans (in the near-term as well as the long-term, as appropriate) to minimize negative impacts to the overall economic value of the property.
Table 19.2 summarizes the economic impact of changes to these key drivers on the property’s NPV (as included in Table 19.1). The sensitivities are estimates for the changes in each key drivers’ effect on the base plan summarized for the production of the mineral reserves over the life of the property.
Table 19.2 – Sensitivity Analysis
| Incremental Impact to NPV | |||||||||||
Sensitivity Analysis ($ billions) | + 5% Change | - 5% Change | |||||||||
| Copper price | $0.67 | $(0.67) | |||||||||
| Copper grade/recovery | 0.57 | (0.57) | |||||||||
| Capital cost | (0.10) | 0.10 | |||||||||
| Operating cost | (0.53) | 0.53 | |||||||||
| Discount rate | (0.04) | 0.04 | |||||||||
Sensitivity analysis does not reflect changes in mine plans or costs with changes in above items.
The after-tax NPV of the LOM plan is most sensitive to copper price, followed by grades and recovery, and then operating costs. The sensitivity analysis does not reflect changes in mine plans or costs with changes in the reported driver. Sustained periods in these economic scenarios would warrant a re-evaluation of the LOM plan assumptions, planned development, and reported mineral reserves.
Table 19.3 summarizes the LOM plan including the annual metal production volumes, mine plan schedule, capital and operating cost estimates, unit net cash costs, and unleveraged after-tax free cash flows over the life of the property. Free cash flow is the operating cash flow less the capital costs and is a key metric to demonstrate the cash that the property is projected to generate from its operations after capital investments for the reserve production plan at assumed pricing and cost assumptions. The property’s ability to create value from the reserves is determined by its ability to generate positive free cash flow. The summary demonstrates the favorable free cash flow generated from the property’s LOM plan under the assumptions. This economic analysis supports the economic viability of the mineral reserves statement.
| as of December 31, 2021 | 68 | ||||
| Technical Report Summary for Morenci Mine, Arizona, U.S. | ||||
Table 19.3 – LOM Plan Summary
| 2022-2026 | 2027-2031 | 2032-2036 | 2037-2044 | |||||||||||
| Metal Prices | ||||||||||||||
| Copper ($ per pound) | $2.50 | $2.50 | $2.50 | $2.50 | ||||||||||
| Molybdenum ($ per pound) | $10 | $10 | $10 | $10 | ||||||||||
| Annual Averages | ||||||||||||||
| Copper (billion pounds/year) | 0.74 | 0.64 | 0.65 | 0.36 | ||||||||||
| Molybdenum (million pounds/year) | 7 | 13 | 7 | 3 | ||||||||||
| Ore processed (billion tons/year) | 0.25 | 0.22 | 0.22 | 0.11 | ||||||||||
| Copper grade (%) | 0.22 | 0.23 | 0.23 | 0.22 | ||||||||||
| Copper metallurgical recovery (%) | 63.4 | 66.7 | 63.9 | 69.2 | ||||||||||
| Capital costs ($ billions/year) | $0.35 | $0.17 | $0.20 | $0.01 | ||||||||||
| Site cash operating costs ($ billions/year) | $1.41 | $1.35 | $1.38 | $0.66 | ||||||||||
| Unit net cash cost ($ per pound) | $1.92 | $2.03 | $2.14 | $1.83 | ||||||||||
| Free cash flow ($ billions/year) | $0.06 | $0.15 | $0.05 | $0.20 | ||||||||||
Summary of annual cash flow forecast based on annual production schedule for the life of the property.
20ADJACENT PROPERTIES | ||
As of December 31, 2021, there are no adjacent properties impacting the Morenci mine mineral reserve or mineral resource estimates.
21OTHER RELEVANT DATA AND INFORMATION | ||
Recent news articles have identified the mining industry as a potential area for review for increased participation of U.S. state or federal revenues potentially through increased taxes, royalties, or other such programs. The mineral reserve and resource estimates in this TRS use the assumptions as previously stated; however, increased taxation would have a direct impact on the cash flows of the property. Any enacted legislation would be incorporated into future mineral reserve and resource estimates.
In the opinion of the QPs, there is no additional information necessary for the mineral reserve and mineral resource estimates in this TRS. Further discussion regarding operational risks, health and safety programs, and other business aspects of the mine are available in FCX’s Annual Report on Form 10-K for the year ended December 31, 2021.
22INTERPRETATION AND CONCLUSIONS | ||
Estimates of mineral reserves and mineral resources are prepared by and are the responsibility of FCX employees. All relevant geologic, engineering, economic, metallurgical, and other data is prepared according to FCX developed procedures and guidelines based on accepted industry practices. FCX maintains a process of verifying
| as of December 31, 2021 | 69 | ||||
| Technical Report Summary for Morenci Mine, Arizona, U.S. | ||||
and documenting the mineral reserve and mineral resource estimates, information for which are located at the mine site and FCX corporate offices. FCX conducts ongoing studies of its ore bodies to optimize economic value and to manage risk.
FCX and the QPs believe that the geologic interpretation and modeling of exploration data, economic analysis, mine design and sequencing, process scheduling, and operating and capital cost estimation have been developed using accepted industry practices and that the stated mineral reserves and mineral resources comply with SEC regulations. Periodic reviews by third-party consultants confirm these conclusions.
The Morenci mine is a large-scale producing mining property that has been operated by FCX and its predecessors for many years. Mineral reserve and mineral resource estimates consider technical, economic, environmental, and regulatory parameters containing inherent risks. Changes in grade and/or metal recovery estimation, realized metal prices, and operating and capital costs have a direct relationship to the cash flow and profitability of the mine. Other aspects such as changes to environmental or regulatory requirements could alter or restrict the operating performance of the mine. Significant differences from the parameters used in this TRS would justify a re-evaluation of the reported mineral reserve and mineral resource estimates. Mine site administration and FCX dedicate significant resources to managing these risks.
23RECOMMENDATIONS | ||
Although ongoing initiatives in productivity and recovery improvements are underway, the mineral reserves and mineral resources are based on the stated long-term metal prices and corresponding technical and economic performance data.
No recommendations for additional work are identified for the reported mineral reserves and mineral resources as of December 31, 2021.
24REFERENCES | ||
Beane, R. E., and Titley, S. R. (1981). Porphyry Copper Deposits Part II. Hydrothermal alteration and mineralization. In B. J. Skinner (Ed.), Economic Geology, Seventy-Fifth Anniversary Volume, 235-269.
Briggs, D., (2016). History of the Copper Mountain (Morenci) Mining District, Greenlee County, Arizona, Arizona Geological Survey, Contributed Report CR-16-C,77 p, 2 appendices.
Dickinson, W. R. (1989). Tectonic setting of Arizona through geologic time. In J. P. Jenney and S. J. Reynolds (Eds.), Geologic Evolution of Arizona: Arizona Geological Society Digest, v. 17, 1-16.
Nielsen, R. L. (1968). Hypogene texture and mineral zoning in a copper-bearing granodiorite porphyry stock, Santa Rita, New Mexico. Economic Geology, v. 63(1), 37-50.
Patton, J. M., (1945). The History of Clifton (M.A. Thesis), University of Arizona, Tucson, Arizona, 243 p.
| as of December 31, 2021 | 70 | ||||
| Technical Report Summary for Morenci Mine, Arizona, U.S. | ||||
Phillips, C. H., Gambell, N. A., and Fountain, D. S. (1974). Hydrothermal alteration, mineralization, and zoning in the Ray deposit. Economic Geology, v. 69(8), 1237-1250.
Watt, R. (1956). History of Morenci, Arizona. (M.A. Thesis), University of Arizona, Tucson, Arizona, 157 p.
25RELIANCE ON INFORMATION PROVIDED BY THE REGISTRANT | ||
FCX is experienced in managing the challenges and requirements of operating at local, regional, national, and international levels to support requirements for successfully mining metals throughout the world, using functioning divisions, departments, and teams, organized at mine sites and at the corporate level, that are tasked with meeting and supporting FCX business and operations requirements. These closely integrated departments are focused on subjects that may be peripheral to the direct production of salable metals but are essential to meeting all business requirements for FCX and to navigating the many aspects of modern mining.
As an illustrative example of the FCX organization, within the Corporate Support and Marketing division, there are departments of Finance and Accounting, Financial Reporting, Taxes, General Counsel, Communications, and Business Development groups. Other corporate teams are similarly organized to provide additional broad services. These departments support and integrate with the operating divisions providing requirements and information. A mine site, as part of the operating divisions, will be organized into its own management teams including Mine Management, Operations, Maintenance and Construction, Processing Management, Finance and Accounting, Social Responsibility and Community Development, Environmental, Regional Supply Chain, and Human Resources. These staffed teams are organized to provide responses to the many mining requirements, and they are expert in conducting their specific duties. They represent reliable sources for information and as such, they have been consulted to prepare, support, and characterize the information in this TRS.
Specific to the preparation of this TRS, FCX departments have provided the following categories of information:
•Macro-economic trends, data, interest rates, and assumptions.
•Marketing information.
•Legal matters outside of QP expertise.
•Environmental matters outside of QP expertise.
•Accommodations through community development to local groups.
•Governmental factors outside of QP expertise.
The QPs prepared Sections 3, 4, 5, 15, 16, 17, 18, 19, 20, and 21 of this TRS in reliance on the information provided by FCX above.
As explained, FCX corporate and mine site divisions that provided information for this TRS are business-directed areas that must produce reliable information in support of FCX business objectives. This organizational form contributes to producing expected results for FCX and provides appropriate information supporting mineral reserves and mineral resource estimates.
| as of December 31, 2021 | 71 | ||||
| Technical Report Summary for Morenci Mine, Arizona, U.S. | ||||
26GLOSSARY – UNITS OF MEASURE AND ABBREVIATIONS | ||
| Unit | Unit of Measure | ||||
| # | number | ||||
| $ | U.S. Dollar | ||||
| % | percent | ||||
| dst | dry short ton | ||||
| ft | feet | ||||
| kWh | kilowatt-hour | ||||
| lb | U.S. pound | ||||
| M | million | ||||
| MW | megawatt | ||||
| wst | wet short ton | ||||
| Abbreviation | Description | ||||
| ADEQ | Arizona Department of Environmental Quality | ||||
| AIK | Area Influenced Kriging | ||||
| APP | Aquifer Protection Permit | ||||
| ASCu | Acid-Soluble Copper | ||||
| BLM | Bureau of Land Management (U.S.) | ||||
| CLP | Concentrate Leach Plant | ||||
| CWA | Clean Water Act (U.S.) | ||||
| EqCu | Equivalent Copper Grade | ||||
| EW | Electrowinning | ||||
| FCX | Freeport-McMoRan Inc. and its consolidated subsidiaries | ||||
| FMES | Freeport-McMoRan Energy Services | ||||
| GPS | Global Positioning System | ||||
| HRC | Hydraulic Roll Crusher | ||||
| IDW | Inverse Distance Weighting | ||||
| Ing. Geol. | Geological Engineer (Peru) | ||||
| LEC | Lower Eagle Creek | ||||
| LOM | Life-of-Mine | ||||
| MEH | Morenci Engineered Heap | ||||
| MFL | Mine for Leach | ||||
| MLT | Morenci Leach Test | ||||
| MW&E | Morenci Water and Electric Company | ||||
| NA | Not Applicable | ||||
| NN | Nearest Neighbor | ||||
| NPV | Net Present Value | ||||
| OK | Ordinary Kriging | ||||
| P.Eng. | Professional Engineer (Canada) | ||||
| P.Geo. | Professional Geologist | ||||
| PDC | Phelps Dodge Corporation | ||||
| PLS | Pregnant Leach Solution | ||||
| QA/QC | Quality Assurance and Quality Control | ||||
| QLT | Quick Leach Test, ferric sulfate-soluble copper assay | ||||
| QP | Qualified Person | ||||
| as of December 31, 2021 | 72 | ||||
| Technical Report Summary for Morenci Mine, Arizona, U.S. | ||||
| RC | Reverse Circulation | ||||
| RM-SME | Registered Member of the Society of Mining, Metallurgy and Exploration (U.S.) | ||||
| ROM | Run of Mine | ||||
| RQD | Rock Quality Designation | ||||
| SEC | Securities and Exchange Commission (U.S.) | ||||
| SG | Specific Gravity | ||||
| S-K1300 | Subpart 1300 of SEC Regulation S-K | ||||
| SMM | Sumitomo Metal Mining Company | ||||
| S-ROM | Sulfide Run of Mine | ||||
| SX | Solution Extraction | ||||
| SX/EW | Solution Extraction and Electrowinning | ||||
| TC | FCX’s Technology Center facilities near Safford, Arizona | ||||
| TCT | FCX’s Technology Center facilities in Tucson, Arizona | ||||
| TCu | Total Copper | ||||
| TMo | Total Molybdenum | ||||
| TRS | Technical Report Summary | ||||
| TSF | Tailings Storage Facility | ||||
| U.S. | United States | ||||
| WIP | Work-In-Process | ||||
| X-ROM | Oxide Run of Mine | ||||
| as of December 31, 2021 | 73 | ||||
Serious News for Serious Traders! Try StreetInsider.com Premium Free!
You May Also Be Interested In
- Ambiq Announces Pricing of Upsized Public Offering
- GTN and Koscom to build Korea's Global Order Hub
- Find Your Summer Shine in Murrieta
Create E-mail Alert Related Categories
SEC FilingsSign up for StreetInsider Free!
Receive full access to all new and archived articles, unlimited portfolio tracking, e-mail alerts, custom newswires and RSS feeds - and more!