

Form 10-K CSB BANCORP INC /OH For: Dec 31
 Tweet
Tweet Share
ShareUNITED STATES
SECURITIES AND EXCHANGE COMMISSION
WASHINGTON, D.C. 20549
FORM 10-K
(Mark one)
[X] ANNUAL REPORT PURSUANT TO SECTIONS 13 OR 15(d) OF THE SECURITIES EXCHANGE ACT OF 1934
For the fiscal year ended December 31, 2018
OR
[ ] TRANSITION REPORT UNDER SECTION 13 OR 15(d) OF THE SECURITIES EXCHANGE ACT OF 1934
For the transition period from to
Commission File No. 0-21714
CSB BANCORP, INC.
(Exact name of registrant as specified in its charter)
| Ohio | 34-1687530 | |
| (State or other jurisdiction of incorporation or organization) | (I.R.S. Employer Identification No.) |
91 North Clay Street, Millersburg, Ohio 44654
(Address of principal executive offices) (Zip code)
Registrant’s telephone number, including area code 330.674.9015
Securities registered under Section 12(b) of the Act: None
Securities registered under Section 12(g) of the Act:
Common Shares, $6.25 par value
(Title of class)
| Indicate by check mark if the registrant is a well-known seasoned issuer, as defined in Rule 405 of the Securities Act. |
( ) Yes (X) No |
| Indicate by check mark if the registrant is not required to file reports pursuant to Section 13 or Section 15(d) of the Act. |
( ) Yes (X) No |
Indicate by check mark whether the registrant (1) has filed all reports required to be filed by Section 13 or 15(d) of the Securities Exchange Act of 1934 during the preceding 12 months (or for such shorter period that the registrant was required to file such reports), and (2) has been subject to such filing requirements for the past 90 days. (X) Yes ( ) No
Indicate by check mark whether the registrant has submitted electronically every Interactive Data File required to be submitted pursuant to Rule 405 of Regulation S-T (§232.405 of this chapter) during the preceding 12 months (or for such shorter period that the registrant was required to submit such files). (X) Yes ( ) No
Indicate by check mark if disclosure of delinquent filers pursuant to Item 405 of Regulation S-K (§229.405 of this chapter) is not contained herein, and will not be contained, to the best of registrant’s knowledge, in definitive proxy or information statements incorporated by reference in Part III of this Form 10-K or any amendment to this Form 10-K. ( )
Indicate by check mark whether the registrant is a large accelerated filer, an accelerated filer, a non-accelerated filer, a smaller reporting company, or emerging growth company. See the definitions of “large accelerated filer,” “accelerated filer,” “smaller reporting company,” and “emerging growth company” in Rule 12b-2 of the Exchange Act.
Large accelerated filer ( ) Accelerated filer (X) Non-accelerated filer ( ) Smaller reporting company (X) Emerging growth company ( )
If an emerging growth company, indicate by check mark if the registrant has elected not to use the extended transition period for complying with any new or revised financial accounting standards provided pursuant to Section 13(a) of the Exchange Act. [ ]
| Indicate by check mark whether the registrant is a shell company (as defined in Rule 12b-2 of the Exchange Act). |
( ) Yes (X) No |
Indicate by check mark whether the registrant is an emerging growth company as defined in Rule 405 of the Securities Act of 1933 (§230.405 of this chapter) or Rule 12b-2 of the Securities Exchange Act of 1934 (§240.12b-2 of this chapter). Emerging growth company [ ]
At June 30, 2018, the aggregate market value of the voting common equity held by non-affiliates of the registrant, based on a price of $39.00 per common share (such price being the last trade price on such date) was $98.5 million.
At March 15, 2019, there were issued and outstanding 2,742,242 of the registrant’s common shares, $6.25 par value.
DOCUMENTS INCORPORATED BY REFERENCE
Portions of CSB Bancorp Inc.’s 2018 Annual Report to Shareholders, which is filed as Exhibit 13 to this Form 10-K,
are incorporated by reference in Parts I and II of this Form 10-K.
Portions of CSB Bancorp Inc.’s Proxy Statement for the 2019 Annual Meeting of Shareholders are incorporated by
reference in Part III of this Form 10-K.
PART I
ITEM 1. BUSINESS.
General
CSB Bancorp, Inc. (“CSB”), is a registered financial holding company under the Bank Holding Company Act of 1956, as amended, and was incorporated under the laws of the State of Ohio in 1991. The Commercial and Savings Bank of Millersburg, Ohio (the “Bank”), an Ohio banking corporation chartered in 1879, is a wholly-owned subsidiary of CSB. The Bank is a member of the Federal Reserve System, and its deposits are insured up to the maximum amount provided by law by the Federal Deposit Insurance Corporation (“FDIC”). The primary regulators of the Bank are the Federal Reserve Board and the Ohio Division of Financial Institutions. CSB Investment Services, LLC, an Ohio limited liability company (“CSB Investment”), is a wholly owned subsidiary of CSB that is licensed to engage in the business of insurance in the State of Ohio. In this Annual Report on Form 10-K, CSB and its subsidiaries are sometimes collectively referred to as the “Company.”
Cautionary Statement Regarding Forward-Looking Information
Certain statements contained in this Annual Report on Form 10-K, which are not statements of historical fact, constitute forward-looking statements within the meaning of the Private Securities Litigation Reform Act of 1995. Words such as “anticipate”, “estimates”, “may”, “feels”, “expects”, “believes”, “plans”, “will”, “would”, “should”, “could” and similar expressions are intended to identify these forward-looking statements but are not the exclusive means of identifying such statements. Examples of forward-looking statements include: (i) projections of income or expense, earnings per share, the payment or non-payment of dividends, capital structure, and other financial items; (ii) statements of plans and objectives of the Company and of its management or Board of Directors, including those relating to products or services; (iii) statements of future economic performance; and (iv) statements of assumptions underlying such statements. Forward-looking statements are subject to risks and uncertainties that may cause actual results to differ materially. Factors that could cause or contribute to such differences include, without limitation, risks and uncertainties detailed from time to time in the Company’s filings with the SEC, including without limitation the risk factors disclosed in Item 1A of this Annual Report on Form 10-K.
Other factors not currently anticipated may also materially and adversely affect the Company’s business, financial condition, results of operations, or cash flows. There can be no assurance that future results will meet expectations. While the Company believes that the forward-looking statements in this Annual Report on Form 10-K are reasonable, the reader should not place undue reliance on any forward-looking statement. In addition, these statements speak only as of the date made. The Company does not undertake, and expressly disclaims, any obligation to update or alter any statements whether as a result of new information, future events, or otherwise, except as may be required by applicable law.
The Private Securities Litigation Reform Act of 1995 provides a “safe harbor” for forward-looking statements to encourage companies to provide prospective information so long as those statements are identified as forward-looking and are accompanied by meaningful cautionary statements identifying important factors that could cause actual results to differ materially from those discussed in the forward-looking statements. The Company desires to take advantage of the “safe harbor” provisions of the Private Securities Litigation Reform Act of 1995.
Business Overview and Lending Activities
CSB operates primarily through the Bank and CSB Investment, providing a wide range of banking, trust, financial, and brokerage services to corporate, institutional, and individual customers throughout northeast Ohio. The Bank provides retail and commercial banking services to its customers, including checking and savings accounts, time deposits, IRAs, safe deposit facilities, personal loans, commercial loans, real estate mortgage loans, installment loans, night depository facilities, brokerage, and trust services.
2
The Bank provides residential real estate, commercial real estate, commercial, and consumer loans to customers located primarily in Holmes, Stark, Tuscarawas, Wayne and portions of surrounding counties in Ohio. The Bank’s market area has historically exhibited relatively stable economic conditions. Economic activity in the Company’s market area has been increasing at a steady pace for the past nine years. Reported unemployment levels at December 2018 in the four primary counties served by the Company ranged between 3.5% and 5.2%. These levels increased slightly from December 2017. Labor markets continued hiring at a softer pace during the year. Wage increases accelerated during 2018. The local housing market continues to improve with supply relatively tight. Elevated costs of building materials have contributed to increased housing construction costs. Consumer confidence in the economy has been a primary driver for the strong housing demand and higher consumer spending.
Certain risks are involved in providing loans, including, but not limited to, the borrowers’ ability and willingness to repay the debt. Before the Bank extends a new loan or renews an existing loan to a customer, these risks are assessed through a review of the borrower’s past and current credit history, the collateral being used to secure the transaction if any, and other factors. For all commercial loan relationships greater than $300,000 the Bank’s internal credit department performs an annual risk rating review. In addition to this review, an independent, outside loan review firm is engaged to review a sample of watch list and adversely classified credits over $250,000 and a sample of commercial loan relationships greater than $250,000. The outside loan review will also assess management’s current credit grades and provide commentary with regard to assigned ratings and the need for a credit to be classified as a troubled debt restructuring, as well as assess management’s specific loan loss reserves for loans included in their sample that are considered to be impaired. In addition, any loan over $100,000 identified as a problem credit by management and/or the external loan review consultants is assigned to the Bank’s “loan watch list,” has a written action plan created, and is subject to ongoing review at least quarterly by the Bank’s credit department and the assigned loan officer to ensure appropriate action is taken if deterioration continues.
Commercial loan rates are variable and fixed, and include operating lines of credit and term loans made to small businesses, primarily based on their ability to repay the loan from the cash flow of the business. Business assets such as equipment, accounts receivable, and inventory typically secure such loans. When the borrower is not an individual, the Bank generally obtains the personal guarantee of the business owner. These loans typically involve larger loan balances, are generally dependent on the cash flow of the business, and thus may be subject to a greater extent to adverse conditions in the general economy or in a specific industry. Management reviews the borrower’s cash flows when deciding whether to grant the credit in order to evaluate whether estimated future cash flows will be adequate to service principal and interest of the new obligation in addition to existing obligations.
Commercial real estate loans are primarily secured by borrower-occupied business real estate and are dependent on the ability of the related business to generate adequate cash flow to service the debt. Commercial real estate loans are generally originated with a loan-to-value ratio of 80% or less. Commercial construction loans are secured by commercial real estate and in most cases the Bank also provides the permanent financing. The Bank monitors advances and the maximum loan to value ratio is typically limited to the lesser of 90% of cost or 80% of appraisal value. Management performs much of the same analysis when deciding whether to grant a commercial real estate loan as when deciding whether to grant a commercial loan.
Residential real estate loans carry both fixed and variable rates and are secured by the borrower’s residence. Such loans are made based on the borrower’s ability to make repayment from employment and other income. Management assesses the borrower’s ability and willingness to repay the debt through review of credit history and ratings, verification of employment and other income, review of debt-to-income ratios, and other measures of repayment ability. The Bank generally makes these loans in amounts of 80% or less of the value of the collateral or up to 95% of collateral value with private mortgage insurance. An appraisal from a qualified real estate appraiser or an evaluation based on comparable market values is obtained for substantially all loans secured by real estate. Residential construction loans are secured by residential real estate that generally will be occupied by the borrower upon completion. The Bank usually makes the permanent loan at the end of the construction phase. Generally, construction loans are made in amounts of 80% or less of the value of the as-completed collateral.
Home equity lines of credit are made to individuals and are secured by second or first mortgages on the borrower’s residence. Loans are based on similar credit and appraisal criteria used for residential real estate loans; however, loans up to 100% of the value of the property may be approved for borrowers with excellent credit histories. These loans typically bear interest at variable rates and require minimum monthly payments of the accrued interest.
Installment loans to individuals include unsecured loans and loans secured by recreational vehicles (“RV’s”), automobiles, and other consumer assets. Consumer loans for the purchase of new RV’s and new automobiles generally do not exceed 125% of Dealer Invoice on RV’s or 110% of the Manufacturer’s Suggested Retail Price
3
(MSRP) of an automobile. Loans for used RV’s and automobiles do not exceed 120% of the “clean trade-in value” as reported in the current “NADA” used guides. Overdraft protection loans are unsecured personal lines of credit to individuals who have demonstrated good credit character with reasonably assured sources of income and satisfactory credit histories. Consumer loans generally involve more risk than residential mortgage loans because of the type and nature of collateral and, in certain types of consumer loans, absence of collateral. Since these loans are generally repaid from ordinary income of the individual or family unit, repayment may be adversely affected by job loss, divorce, ill health, or by a general decline in economic conditions. The Bank assesses the borrower’s ability and willingness to repay through a review of credit history, credit ratings, debt-to-income ratios, and other measures of repayment ability.
While CSB’s chief decision-makers monitor the revenue streams of the various financial products and services, operations are managed and financial performance is evaluated on a Company-wide basis. Accordingly, all of the Company’s banking operations are considered by management to be aggregated in one reportable operating segment. For a discussion of the Company’s financial performance for the fiscal year ended December 31, 2018, see the Consolidated Financial Statements and Notes to the Consolidated Financial Statements found in Item 8 of this Annual Report on Form 10-K.
Employees
At December 31, 2018, the Company had 190 employees, 153 of which were employed on a full-time basis. CSB has no separate employees not also employed by the Bank. No employees are covered by collective bargaining agreements. Employees are provided benefit programs, some of which are contributory. Management considers its employee relations to be good.
Competition
The financial services industry is highly competitive. In its primary market area of Holmes, Stark, Tuscarawas, Wayne and surrounding Ohio counties, the Bank competes for new deposit dollars and loans with other commercial banks, including both large regional banks and smaller community banks, as well as savings and loan associations, credit unions, finance companies, insurance companies, brokerage firms, investment companies, and technology-based providers of financial services (sometimes referred to as “fintech” companies).
Competition within the financial service industry continues to increase as a result of mergers between, and expansion of, financial service providers within and outside of the Company’s primary market areas. In addition, securities firms and insurance companies that have elected to become financial holding companies may acquire commercial banks and other financial institutions, which can create additional competitive pressure.
Management believes the primary factors in competing for loans and deposits are interest rates, availability of services, quality of customer service, convenience, and name recognition. Some of the Company’s competitors may have greater resources and as such, higher lending limits, or fewer regulatory constraints and lower cost structures, all of which may adversely affect the Company’s ability to compete.
Investor Relations
The Company’s website address is www.csb1.com. The Company makes available its Annual Report on Form 10-K, Quarterly Reports on Form 10-Q, Current Reports on Form 8-K, and all amendments to those reports, free of charge on its website as soon as reasonably practicable after such material is electronically filed with the Securities and Exchange Commission (the “SEC”). The Company also makes available through its website, other reports filed with the SEC under the Securities Exchange Act of 1934, as amended (the “Exchange Act”), including its proxy statements and reports filed by officers and directors under Section 16(a) of the Exchange Act, as well as the Company’s Code of Ethics. The Company does not intend for information contained in its website to be incorporated by reference into this Annual Report on Form 10-K.
In addition, the Company’s filings are available on the SEC’s website at www.sec.gov free of charge as soon as reasonably practicable after the Company has filed the above referenced reports.
Supervision and Regulation of CSB and the Bank
CSB and the Bank are subject to extensive regulation by federal and state regulatory agencies. The regulation of financial holding companies and their subsidiaries by bank regulatory agencies is intended primarily for the protection of consumers, depositors, federal deposit insurance funds, and the banking system as a whole and not for the protection of shareholders.
4
CSB is a bank holding company that has registered with the Federal Reserve Board (“FRB”) as a financial holding company under the Bank Holding Company Act, as amended (the “BHC Act”). Pursuant to the Gramm-Leach-Bliley Act of 1999 (“GLBA”), a bank holding company may become a financial holding company if it meets certain capital requirements and is “well-managed” and each of its subsidiary banks is “well-capitalized” under regulatory “prompt corrective action” provisions, is “well-managed,” and has at least a “satisfactory” rating under the Community Reinvestment Act (“CRA”). CSB has been a financial holding company since 2005. No prior regulatory approval is required for a financial holding company to acquire certain companies, other than banks and savings associations, that are financial in nature as determined by the FRB. The financial holding company and its subsidiaries must continue to meet the above described requirements in order to continue to engage in activities that are financial in nature without being subjected to regulatory actions or restrictions, which could include a requirement to divest of the subsidiary or subsidiaries.
GLBA defines “financial in nature” to include securities underwriting, dealing, and market making; sponsoring mutual funds and investment companies; insurance underwriting and agency activities; merchant banking activities; and activities that the FRB has determined to be closely related to banking. As a financial holding company, CSB is subject to regulation, examination, and supervision by the FRB under the BHC Act. CSB is also subject to the disclosure and regulatory requirements of the Securities Exchange Act of 1933, as amended, the Securities Exchange Act of 1934, as amended, and the regulations promulgated thereunder, as administered by the SEC.
The Bank, as an Ohio state-chartered bank and member of the Federal Reserve System, is subject to regulation, supervision, and examination by the Ohio Division of Financial Institutions and the FRB. Because the FDIC insures its deposits, the Bank is also subject to certain FDIC regulations. The FDIC is an independent federal agency which insures the deposits, up to prescribed statutory limits, of federally-insured banks and savings associations, and safeguards the safety and soundness of the financial institution industry. The Bank’s deposits are insured up to applicable limits by the Deposit Insurance Fund of the FDIC and the Bank is subject to deposit insurance assessments to maintain the Deposit Insurance Fund. In addition, the Bank is subject to regulations promulgated by the Consumer Financial Protection Bureau (the “CFPB”) established by the Dodd-Frank Wall Street Reform and Consumer Protection Act enacted in July 2010 (the “Dodd-Frank Act”).
The earnings, dividends, and other aspects of the operations and activities of CSB and the Bank are affected by state and federal laws and regulations, and by policies of various regulatory authorities. These policies include, for example, statutory maximum lending rates, requirements on maintenance of reserves against deposits, domestic monetary policies of the FRB, United States fiscal and economic policies, international currency regulations, and monetary policies, certain restrictions on relationships with many phases of the securities business, and capital adequacy, and liquidity restraints.
The following information describes selected federal and state statutory and regulatory provisions that have, or could have, a material impact on the Company’s business. This discussion is qualified in its entirety by reference to the full text of the particular statutory or regulatory provisions. These statutes and regulations are continually under review by the United States Congress and state legislatures, and state and federal regulatory agencies. A change in statutes, regulations, or regulatory policies applicable to CSB and its subsidiaries could have a material effect on their respective businesses.
Regulation of Bank Holding Companies
As a financial holding company under GLBA, CSB’s activities are subject to extensive regulation by the FRB. CSB is required to file reports with the FRB and provide such additional information as the FRB may require, and is subject to regular examination and inspection by the FRB.
The FRB has extensive enforcement authority over bank holding companies, including the ability to assess civil money penalties, issue cease and desist orders, and require that a bank holding company divest subsidiaries (including subsidiary banks). The FRB may initiate enforcement actions for violations of laws and regulations, and for unsafe and unsound practices. Under FRB policies, a bank holding company is expected to act as a “source of strength” to its subsidiary banks and to commit resources to support those subsidiary banks. Under this policy, the FRB may require a bank holding company to contribute additional capital to an undercapitalized subsidiary bank.
The BHC Act requires the prior approval of the FRB in cases where a bank holding company proposes to acquire direct or indirect ownership or control of more than 5% of the voting shares of any bank that is not already majority-owned by it, acquire all or substantially all of the assets of another bank or another financial or bank holding company, or merge or consolidate with any other financial or bank holding company.
5
The FRB also regulates and provides limitations on transactions between affiliates of a bank holding company, loans to directors and officers of bank affiliates, securities transactions, and liability for losses incurred by commonly controlled banks in certain circumstances.
Economic Growth, Regulatory Relief and Consumer Protection Act
On May 25, 2018, the Economic Growth, Regulatory Relief, and Consumer Protection Act (the “Regulatory Relief Act”) was signed into law. The Regulatory Relief Act was designed to provide regulatory relief for banking organizations, particularly for all but the very largest, those with assets in excess of $250 billion. Bank holding companies with assets of less than $100 billion are no longer subject to enhanced prudential standards, and those with assets between $100 billion and $250 billion will be relieved of those requirements in 18 months, unless the FRB takes action to maintain those standards. Certain regulatory requirements applied only to banks with assets in excess of $50 billion and so did not apply to CSB even before the enactment of the Regulatory Relief Act.
The Regulatory Relief Act also provides that the banking regulators must adopt regulations implementing the provision that banking organizations with assets of less than $10 billion are permitted to satisfy capital standards and be considered “well capitalized” under the prompt corrective action framework if their leverage ratios of tangible assets to average consolidated assets is between 8% and 10%, unless the bank’s federal banking agency determines that the organization’s risk profile warrants a more stringent leverage ratio. The Office of the Comptroller of the Currency (“OCC”), the FRB, and the FDIC have proposed for comment the leverage ratio framework for any banking organization with total consolidated assets of less than $10 billion, limited amounts of certain types of assets and off-balance sheet exposures, and a community bank leverage ratio greater than 9%. The community bank leverage ratio would be calculated as the ratio of tangible equity capital divided by average total consolidated assets. Tangible equity capital would be defined as total bank equity capital or total holding company equity capital, as applicable, prior to including minority interests, and excluding accumulated other comprehensive income, deferred tax assets arising from net operating loss and tax credit carry forwards, goodwill and other intangible assets (other than mortgage servicing assets). Average total assets would be calculated in a manner similar to the current tier 1 leverage ratio denominator in that amounts deducted from the community bank leverage ratio numerator would also be excluded from the community bank leverage ratio denominator.
The OCC, the FRB, and the FDIC also adopted a rule providing banking organizations the option to phase in over a three-year period the day-one adverse effects on regulatory capital that may result from the adoption of new current expected credit loss methodology accounting under U. S. generally accepted accounting principles (“GAAP”).
The Regulatory Relief Act also relieves bank holding companies and banks with assets of less than $100 billion in assets from certain record-keeping, reporting, and disclosure requirements.
Regulatory Capital
The FRB adopted risk-based capital guidelines for bank holding companies and state member banks, designed to absorb losses. The guidelines provide a systematic analytical framework, which makes regulatory capital requirements sensitive to differences in risk profiles among banking organizations, takes off-balance sheet exposures expressly into account in evaluating capital adequacy and minimizes disincentives to holding liquid, low-risk assets. Capital levels as measured by these standards are also used to categorize financial institutions for purposes of certain Prompt Corrective Action regulatory provisions.
Basel III Capital Rules (“Basel III”) became effective on January 1, 2015, and contain a new capital conservation buffer and deductions from common equity capital that phased in from January 1, 2016, through January 1, 2019, and deductions from common equity tier 1 capital that have mostly phased in as of January 1, 2019.
The rules include (a) a new common equity tier 1 capital ratio of at least 4.5%, (b) a minimum tier 1 capital ratio of 6.0%, (c) a minimum capital to risk-weighted assets ratio of 8.0%, and (d) a minimum leverage ratio of 4%.
Common equity for the common equity tier 1 capital ratio includes common stock (plus related surplus) and retained earnings, plus limited amounts of minority interests in the form of common stock, less the majority of certain regulatory deductions.
Tier 1 capital includes common equity as defined for the common equity tier 1 capital ratio, plus certain non-cumulative preferred stock and related surplus, cumulative preferred stock and related surplus, and trust preferred securities that have been grandfathered (but which are not permitted going forward), and limited amounts of minority interests in the form of additional tier 1 capital instruments, less certain deductions.
6
Tier 2 capital, which can be included in the total capital ratio, includes certain capital instruments (such as subordinated debt) and limited amounts of the allowance for loan and lease losses, subject to new eligibility criteria, less applicable deductions.
The deductions from common equity tier 1 capital include goodwill and other intangibles, certain deferred tax assets, mortgage-servicing assets above certain levels, gains on sale in connection with a securitization, investments in a banking organization’s own capital instruments, and investments in the capital of unconsolidated financial institutions (above certain levels).
Under the guidelines, capital is compared to the relative risk related to the balance sheet. To derive the risk included in the balance sheet, one of several risk weights is applied to different balance sheet and off-balance sheet assets, primarily based on the relative credit risk of the counterparty. The capital amounts and classification are also subject to qualitative judgments by the regulators about components, risk weightings, and other factors.
The rules place restrictions on the payment of capital distributions, including dividends, and certain discretionary bonus payments to executive officers if the Company does not hold a capital conservation buffer of greater than 2.5% composed of common equity tier 1 capital above its minimum risk-based capital requirements, or if its eligible retained income is negative in that quarter and its capital conservation buffer ratio was less than 2.5% at the beginning of the quarter. The capital conservation buffer was phased in beginning January 1, 2016 at 0.625% and is fully phased in at 2.50% effective January 1, 2019. Pursuant to the FRB’s Small Bank Holding Company Policy statement (“SBHC Policy”), a bank holding company with assets of less than $1 billion and meeting certain other requirements is not required to comply with the consolidated capital requirements until such company exceeds $1 billion in assets or is otherwise determined by the FRB not to qualify as a small bank holding company. At December 31, 2018, CSB was deemed to be a small bank holding company under the SBHC Policy and was not required to comply with the FRB’s regulatory capital requirements. The Bank, however, must comply with the new capital requirements.
The implementation of Basel III did not have a material impact on CSB’s or the Bank’s capital ratios.
Prompt Corrective Action
The federal banking agencies have established a system of “prompt corrective action” to resolve certain of the problems of undercapitalized institutions. This system is based on five capital level categories for insured depository institutions: “well capitalized,” “adequately capitalized,” “undercapitalized,” “significantly undercapitalized”, and “critically undercapitalized.”
The federal banking agencies may (or in some cases must) take certain supervisory actions depending upon a bank’s capital level. For example, the banking agencies must appoint a receiver or conservator for a bank within 90 days after it becomes “critically undercapitalized” unless the bank’s primary regulator determines, with the concurrence of the FDIC, that other action would better achieve regulatory purposes. Banking operations otherwise may be significantly affected depending on a bank’s capital category. For example, a bank that is not “well capitalized” generally is prohibited from accepting brokered deposits and offering interest rates on deposits higher than the prevailing rate in its market, and the holding company of any undercapitalized depository institution must guarantee, in part, specific aspects of the bank’s capital plan for the plan to be acceptable.
In order to be “well-capitalized,” a bank must have a minimum common equity tier 1 capital ratio of 6.5%, a total risk-based capital ratio of at least 10%, a tier 1 risk-based capital ratio of at least 8%, and a leverage ratio of at least 5%, and the bank must not be subject to any written agreement, order, capital directive, or prompt corrective action directive to meet and maintain a specific capital level for any capital measure.
As of December 31, 2018, the Bank met the ratio requirements in effect at that date to be deemed “well-capitalized.” See Note 12 of the Notes to Consolidated Financial Statements located on page 51 of CSB’s 2018 Annual Report, which is incorporated herein by reference. Management of the Company believes the Bank also meets the capital requirements to be deemed “well-capitalized” under the new guidelines.
Deposit Insurance
Substantially all of the deposits of the Bank are insured up to applicable limits by the Deposit Insurance Fund of the FDIC, and the Bank is assessed quarterly deposit insurance premiums to maintain the Deposit Insurance Fund. Insurance premiums for each insured institution are determined based upon the institution’s capital level and supervisory rating provided to the FDIC by the institution’s primary federal regulator and other information deemed
7
by the FDIC to be relevant to the risk posed to the Deposit Insurance Fund by the institution. The assessment rate is then applied to the amount of the institution’s assessment base to determine the institution’s insurance premium. The deposit insurance assessment base is calculated on average assets less average tangible equity.
The FDIC assesses a quarterly deposit insurance premium on each insured institution based on risk characteristics of the institution and may also impose special assessments in emergency situations. The premiums fund the Deposit Insurance Fund (“DIF”). Pursuant to the Dodd-Frank Act, the FDIC has established 2.0% as the designated reserve ratio (“DRR”), which is the amount in the DIF as a percentage of all DIF insured deposits. In March 2016, the FDIC adopted final rules designed to meet the statutory minimum DRR of 1.35% by September 30, 2020, the deadline imposed by the Dodd-Frank Act. The Dodd-Frank Act requires the FDIC to offset the effect on institutions with assets of less than $10 billion of the increase in the statutory minimum DRR to 1.35% from the former statutory minimum of 1.15%. Although the FDIC’s new rules reduced assessment rates on all banks, they imposed a surcharge on banks with assets of $10 billion or more to be paid until the DRR reaches 1.35%. The DRR reached 1.36% at September 30, 2018. The rules also provide assessment credits to banks with assets of less than $10 billion for the portion of their assessments that contribute to the increase of the DRR to 1.35%. Such credits will be applied when the reserve ratio is at least 1.38%. The rules further changed the method of determining risk-based assessment rates for established banks with less than $10 billion in assets to better ensure that banks taking on greater risks pay more for deposit insurance than banks that take on less risk.
In addition, all FDIC-insured institutions are required to pay assessments to fund interest payments on bonds issued by the Financing Corporation, which was established by the government to recapitalize a predecessor to the DIF. These assessments will continue until the Financing Corporation bonds mature in September of 2019. The Financing Corporation has projected that the last assessment will be collected on the March 29, 2019, FDIC invoice.
As insurer, the FDIC is authorized to conduct examinations of, and to require reporting by, federally-insured institutions. It also may prohibit any federally-insured institution from engaging in any activity the FDIC determines by regulation or order to pose a serious threat to the Deposit Insurance Fund. The FDIC also has the authority to take enforcement actions against insured institutions. Insurance of deposits may be terminated by the FDIC upon a finding that the institution has engaged or is engaging in unsafe and unsound practices, is in an unsafe or unsound condition to continue operations, or has violated any applicable law, regulation, rule, order, or condition imposed by the FDIC or written agreement entered into with the FDIC.
The management of the Bank does not know of any practice, condition, or violation that might lead to termination of deposit insurance.
Fiscal and Monetary Policies
The business and earnings of the Company are affected significantly by the fiscal and monetary policies of the United States Government and its agencies. These policies are used in varying degrees and combinations to directly affect the availability of bank loans and deposits, as well as the interest rates charged on loans and paid on deposits. CSB is particularly affected by the policies of the FRB, which has regulatory authority over the supply of money and credit in the United States.
The monetary policies of the FRB have had a significant effect on the operating results of financial institutions in the past and are expected to continue to have significant effects in the future. In view of the changing conditions in the economy, the money markets, and the activities of monetary and fiscal authorities, the Company can make no definitive predictions as to future changes in interest rates, credit availability, or deposit levels.
Limits on Dividends and Other Payments
There are various legal limitations on the extent to which subsidiary banks may finance or otherwise supply funds to their parent holding companies. Under applicable federal and state laws, subsidiary banks may not, subject to certain limited exceptions, make loans or extensions of credit to, or investments in the securities of, their bank holding companies. Subsidiary banks are also subject to collateral security requirements for any loan or extension of credit permitted by such exceptions.
Payments of dividends by the Bank are limited by applicable state and federal laws and regulations. The ability of CSB to obtain funds for the payment of dividends and for other cash requirements is largely dependent on the amount of dividends that may be declared by the Bank. However, the FRB expects CSB to serve as a source of strength for the Bank and may require CSB to retain capital for further investment in the Bank, rather than pay dividends to CSB shareholders. Payment of dividends by the Bank may be restricted at any time at the discretion of
8
its applicable regulatory authorities, if they deem such dividends to constitute an unsafe or unsound banking practice. These provisions could have the effect of limiting CSB’s ability to pay dividends on its common shares.
FRB policy requires CSB to provide notice to the FRB in advance of the payment of a dividend to CSB’s shareholders under certain circumstances and states that insured banks and bank holding companies should generally only pay dividends out of current operating earnings. The FRB may disapprove of a dividend payment if the FRB determines that the payment would be an unsafe or unsound practice.
Consumer Protection Laws and Regulations
Banks are subject to regular examination to ensure compliance with federal statutes and regulations applicable to their business, including consumer protection statutes and implementing regulations. Potential penalties under these laws include, but are not limited to, fines. The Dodd-Frank Act established the CFPB, which has extensive regulatory and enforcement powers over consumer financial products and services. The CFPB has adopted numerous rules with respect to consumer protection laws, amending some existing regulations and adopting new ones, and has commenced enforcement actions. The following are just some of the consumer protection laws applicable to the Bank:
| ● | Community Reinvestment Act of 1977: imposes a continuing and affirmative obligation to fulfill the credit needs of its entire community, including low- and moderate-income neighborhoods. |
| ● | Equal Credit Opportunity Act: prohibits discrimination in any credit transaction on the basis of any of various criteria. |
| ● | Truth in Lending Act: requires that credit terms are disclosed in a manner that permits a consumer to understand and compare credit terms more readily and knowledgeably. |
| ● | Fair Housing Act: makes it unlawful for a lender to discriminate in its housing-related lending activities against any person on the basis of any of certain criteria. |
| ● | Home Mortgage Disclosure Act: requires financial institutions to collect data that enables regulatory agencies to determine whether the financial institutions are serving the housing credit needs of the communities in which they are located. |
| ● | Real Estate Settlement Procedures Act: requires that lenders provide borrowers with disclosures regarding the nature and cost of real estate settlements and prohibits abusive practices that increase borrowers’ costs. |
| ● | Privacy provisions of the Gramm-Leach-Bliley Act: requires financial institutions to establish policies and procedures to restrict the sharing of non-public customer data with non-affiliated parties and to protect customer information from unauthorized access |
The banking regulators also use their authority under the Federal Trade Commission Act to take supervisory or enforcement action with respect to unfair or deceptive acts or practices by banks that may not necessarily fall within the scope of specific banking or consumer finance law.
In October 2017, the CFPB issued a final rule (the “Payday Rule”) with respect to certain consumer loans to be effective on January 16, 2018, although compliance with most sections is required starting on August 19, 2019. The first major part of the rule makes it an unfair and abusive practice for a lender to make short-term and longer-term loans with balloon payments (with certain exceptions) without reasonably determining that the borrower has the ability to repay the loan. The second major part of the rule applies to the same types of loans as well as certain other longer-term loans that are repaid directly from the borrower’s account. The rule states that it is an unfair and abusive practice for the lender to withdraw payment from the borrower’s account after two consecutive payment attempts have failed, unless the lender obtains the consumer’s new and specific authorization to make further withdrawals from the account. The rule also requires lenders to provide certain notices to the borrower before attempting to withdraw payment on a covered loan from the borrower’s account.
On February 6, 2019, the CFPB issued two proposals with respect to the Payday Rule. First, the CFPB proposed to delay the compliance date for the mandatory underwriting provisions of the Payday Rule to November 19, 2020. It has requested comments on the proposed delay to be made within 30 days. Second, the CFPB proposed to rescind provisions of the Payday Rule that: (1) provide that it is an unfair and abusive practice for a lender to make a covered short-term or longer-term balloon-payment loan without reasonably determining that the consumer has the ability to repay the loan according to its terms; (2) prescribe mandatory underwriting requirements for making the ability-to-repay determination; (3) provide exemptions of certain loans from the mandatory underwriting requirements; and (4) provide related definitions, reporting and recordkeeping requirements. The CFPB has requested comments to be made within 90 days on this proposal. These proposals do not change the provisions of the Payday Rule that address lender payment practices with respect to covered loans. The CFPB also stated that it
9
will be considering other changes to the Payday Rule in response to requests received for exemptions of certain types of lenders or loan products and may commence separate additional rulemaking initiatives. The Company is evaluating the proposal and believes the types of consumer credit extended by the Company will be excluded or exempted under the Rule.
Customer Privacy
Under the GLBA, federal banking agencies have adopted rules that limit the ability of banks and other financial institutions to disclose non-public information about consumers to nonaffiliated third parties. These limitations require distribution of privacy policies to consumers and, in some circumstances, allow consumers to prevent disclosure of certain personal information to nonaffiliated third parties.
USA Patriot Act
In response to the events of September 11, 2001, the Uniting and Strengthening of America by Providing Appropriate Tools Required to Intercept and Obstruct Terrorism Act of 2001 (the “Patriot Act”) was signed into law in October, 2001. The Patriot Act provides for financial institutions to establish programs and procedures to combat money laundering and terrorist financing. In addition, federal banking agencies are required, when reviewing bank holding company acquisition and bank merger applications, to take into account the effectiveness of the anti-money laundering policies, procedures, and controls of the applicants.
The Bank has established policies and procedures to be compliant with the requirements of the Patriot Act.
Corporate Governance
The Sarbanes-Oxley Act of 2002 (“SOX”) effected broad reforms to areas of financial disclosure and corporate governance. The Board of Directors reviews the Company’s corporate governance practices on a continuing basis. In accordance with section 302(a) of SOX, written certifications by CSB’s Chief Executive Officer and Chief Financial Officer are required to certify that CSB’s quarterly and annual reports filed with the SEC do not contain any untrue statement of a material fact or fail to state a material fact. CSB has also implemented a program designed to comply with Section 404 of SOX, which includes identification of significant processes and accounts, documentation of the design of control effectiveness over process and entity-level controls, and testing of the operating effectiveness of key controls. As of June 30, 2017, the market value of CSB’s common shares held by nonaffiliates exceeded $75 million, as a result of which CSB is required to provide annually an auditor’s attestation and report on management’s assessment of internal control over financial reporting. Management’s assessment of internal controls over financial reporting and the Independent Registered Public Accounting Firm opinion on internal control over financial reporting are located on pages 22 and 23 of CSB’s 2018 Annual Report.
Effect of Environmental Regulation
Compliance with federal, state, and local provisions regulating the discharge of materials into the environment, or otherwise relating to the protection of the environment, has not had a material effect upon the capital expenditures, earnings, or competitive position of CSB or its subsidiaries. CSB believes the nature of the operations of its subsidiaries has little, if any, environmental impact. CSB, therefore, anticipates no material capital expenditures for environmental control facilities for its current fiscal year or for the foreseeable future.
CSB believes its primary exposure to environmental risk is through the lending activities of the Bank. In cases where management believes environmental risk potentially exists, the Bank mitigates environmental risk exposure by requiring environmental site assessments at the time of loan origination to confirm collateral quality as to commercial real estate parcels posing higher than normal potential for environmental impact, as determined by reference to present and past uses of the subject property and adjacent sites.
10
Executive and Incentive Compensation
In June 2010, the federal banking agencies issued joint interagency guidance on incentive compensation policies (the “Joint Guidance”) intended to ensure that the incentive compensation policies of banking organizations do not undermine the safety and soundness of such organizations by encouraging excessive risk-taking. This principles-based guidance, which covers all employees that have the ability to materially affect the risk profile of an organization, either individually or as part of a group, is based upon the key principles that a banking organization’s incentive compensation arrangements should: (i) provide incentives that do not encourage risk-taking beyond the organization’s ability to effectively identify and manage risks; (ii) be compatible with effective internal controls and risk management; and (iii) be supported by strong corporate governance, including active and effective oversight by the organization’s board of directors.
Pursuant to the Joint Guidance, the FRB will review as part of a regular, risk-focused examination process, the incentive compensation arrangements of financial institutions such as the Company. Such review will be tailored to each organization based on the scope and complexity of the organization’s activities and the prevalence of incentive compensation arrangements. The findings of the supervisory initiatives will be included in reports of examination and deficiencies will be incorporated into the institution’s supervisory ratings, which can affect the institution’s ability to make acquisitions and take other actions. Enforcement actions may be taken against an institution if its incentive compensation arrangements, or related risk-management control or governance processes, pose a risk to the organization’s safety and soundness and prompt and effective measures are not being taken to correct the deficiencies.
The Company’s board and management believe its policies and procedures related to Executive and Incentive Compensation are compliant with the Joint Guidance.
Future Legislation
Various and significant legislation affecting financial institutions and the financial industry is from time to time adopted by the U.S. Congress and state legislatures, and regulatory agencies frequently adopt or amend regulations. Such legislation and regulation may continue to change banking laws and regulations and the operating environment of CSB and its subsidiaries in substantial and unpredictable ways, and could significantly increase or decrease costs of doing business, limit or expand permissible activities, or affect the competitive balance among financial institutions. The nature and extent of future legislative and regulatory changes affecting financial institutions remains very unpredictable.
11
Statistical Disclosures
The following schedules present, for the periods indicated, certain financial and statistical information of the Company as required under the SEC’s Industry Guide 3 “Statistical Disclosures by Bank Holding Companies,” or a specific reference as to the location of required disclosures in the Company’s 2018 Annual Report.
Distribution of Assets, Liabilities, and Stockholders’ Equity; Interest Rates and Interest Differential
The information set forth under the heading, “Average Balance Sheets and Net Interest Margin Analysis” located on page 10 of the Company’s 2018 Annual Report is incorporated by reference herein.
The information set forth under the heading, “Rate/Volume Analysis of Changes in Income and Expense” located on page 11 of the Company’s 2018 Annual Report is incorporated by reference herein.
Investment Portfolio
The following is a schedule of the fair value of securities at December 31:
| (Dollars in thousands) | ||||||||||||||||||
| Securites available-for-sale, at fair value | 2018 | 2017 | 2016 | |||||||||||||||
| U.S. Treasury security |
$ | 996 | $ | 998 | $ | 1,001 | ||||||||||||
| U.S. Government agencies |
7,170 | 8,229 | 6,402 | |||||||||||||||
| Mortgage-backed securities of government agencies |
44,901 | 49,701 | 55,837 | |||||||||||||||
| Other mortgage-backed securities |
- | - | 65 | |||||||||||||||
| Asset-backed securities of government agencies |
1,024 | 1,169 | 1,266 | |||||||||||||||
| State and political subdivisions |
23,125 | 27,141 | 29,708 | |||||||||||||||
| Corporate bonds |
8,312 | 10,425 | 9,516 | |||||||||||||||
|
|
|
|
|
|
|
|
|
| ||||||||||
| Total available-for-sale |
$ | 85,528 | $ | 97,663 | $ | 103,795 | ||||||||||||
|
|
|
|
|
|
|
|
|
| ||||||||||
| Securities held-to-maturity, at fair value |
||||||||||||||||||
| U.S. Government agencies |
$ | 9,098 | $ | 9,265 | $ | 9,093 | ||||||||||||
| Mortgage-backed securities of government agencies |
11,020 | 11,531 | 14,351 | |||||||||||||||
| State and political subdivisions |
- | 4,695 | - | |||||||||||||||
|
|
|
|
|
|
|
|
|
| ||||||||||
| Total held-to-maturity |
$ | 20,118 | $ | 25,491 | $ | 23,444 | ||||||||||||
|
|
|
|
|
|
|
|
|
| ||||||||||
| Equity securities |
$ | 83 | $ | 89 | $ | 80 | ||||||||||||
|
|
|
|
|
|
|
|
|
| ||||||||||
12
The following is a schedule of maturities for each category of debt securities and the related weighted average yield of such securities as of December 31, 2018:
| One Year or Less | After One Year Through Five Years |
Maturing After Five Years |
After Ten Years | Total | ||||||||||||||||||||||||||||||||||||||||||||||||||||||||
| (Dollars in thousands) | Amortized Cost |
Yield | Amortized Cost |
Yield | Amortized Cost |
Yield | Amortized Cost |
Yield | Amortized Cost |
Yield | ||||||||||||||||||||||||||||||||||||||||||||||||||
|
Available-for-sale: |
||||||||||||||||||||||||||||||||||||||||||||||||||||||||||||
| U.S. Treasury | $ | 997 | 2.27 | % | $ | - | - | % | $ | - | - | % | $ | - | - | % | $ | 997 | 2.27 | % | ||||||||||||||||||||||||||||||||||||||||
| U.S. Government agencies | - | - | 5,500 | 2.05 | 1,850 | 2.25 | - | - | 7,350 | 2.10 | ||||||||||||||||||||||||||||||||||||||||||||||||||
| Mortgage-backed securities of government agencies | 23 | 2.85 | 1,997 | 1.97 | 4,891 | 2.59 | 38,833 | 2.58 | 45,744 | 2.56 | ||||||||||||||||||||||||||||||||||||||||||||||||||
| Asset-backed securities of government agencies | - | - | - | - | - | - | 1,040 | 3.59 | 1,040 | 3.59 | ||||||||||||||||||||||||||||||||||||||||||||||||||
| State and political subdivisions | 1,428 | 2.54 | 6,140 | 2.37 | 15,714 | 2.27 | - | - | 23,282 | 2.32 | ||||||||||||||||||||||||||||||||||||||||||||||||||
| Corporate bonds |
1,000 | 2.30 | 3,674 | 2.89 | 3,472 | 3.48 | 500 | 4.00 | 8,646 | 3.12 | ||||||||||||||||||||||||||||||||||||||||||||||||||
|
|
|
|
|
|
|
|
|
|
|
|
|
|
|
|
||||||||||||||||||||||||||||||||||||||||||||||
| Total |
$ | 3,448 | 2.40 | % | $ | 17,311 | 2.33 | % | $ | 25,927 | 2.49 | % | $ | 40,373 | 2.63 | % | $ | 87,059 | 2.52 | % | ||||||||||||||||||||||||||||||||||||||||
|
|
|
|
|
|
|
|
|
|
|
|
|
|
|
|
||||||||||||||||||||||||||||||||||||||||||||||
|
Held-to-maturity: |
||||||||||||||||||||||||||||||||||||||||||||||||||||||||||||
| U.S. Government agencies | $ | - | - | % | $ | 483 | 2.19 | % | $ | 3,000 | 2.00 | % | $ | 5,999 | 2.01 | % | $ | 9,482 | 2.01 | % | ||||||||||||||||||||||||||||||||||||||||
| Mortgage-backed securities of government agencies | - | - | - | - | - | - | 11,206 | 2.06 | 11,206 | 2.06 | ||||||||||||||||||||||||||||||||||||||||||||||||||
|
|
|
|
|
|
|
|
|
|
|
|
|
|
|
|
||||||||||||||||||||||||||||||||||||||||||||||
| Total |
$ | - | - | % | $ | 483 | 2.19 | % | $ | 3,000 | 2.00 | % | $ | 17,205 | 2.04 | % | $ | 20,688 | 2.04 | % | ||||||||||||||||||||||||||||||||||||||||
|
|
|
|
|
|
|
|
|
|
|
|
|
|
|
|
||||||||||||||||||||||||||||||||||||||||||||||
The weighted average yields are calculated using amortized cost of investments and are based on coupon rates for securities purchased at par value, and on effective interest rates considering amortization or accretion if securities were purchased at a premium or discount. The weighted average yield on tax-exempt obligations is presented on a tax-equivalent basis based on the Company’s marginal federal income tax rate of 21%.
13
Loan Portfolio
Total loans on the balance sheet are comprised of the following classifications at December 31:
| (Dollars in thousands) | 2018 | 2017 | 2016 | 2015 | 2014 | |||||||||||||||||||||||||
| Commercial |
$ | 146,875 | $ | 140,273 | $ | 134,268 | $ | 123,143 | $ | 123,813 | ||||||||||||||||||||
| Commercial real estate |
183,605 | 179,663 | 159,475 | 148,775 | 139,695 | |||||||||||||||||||||||||
| Residential real estate |
167,296 | 157,172 | 144,489 | 125,775 | 121,684 | |||||||||||||||||||||||||
| Construction and land development |
31,227 | 22,886 | 23,428 | 15,452 | 17,446 | |||||||||||||||||||||||||
| Consumer |
19,402 | 16,306 | 13,308 | 9,268 | 7,913 | |||||||||||||||||||||||||
|
|
|
|
|
|
|
|
|
|
|
|
|
|
|
| ||||||||||||||||
| Total loans |
$ | 548,405 | $ | 516,300 | $ | 474,968 | $ | 422,413 | $ | 410,551 | ||||||||||||||||||||
|
|
|
|
|
|
|
|
|
|
|
|
|
|
|
| ||||||||||||||||
| The following is a schedule of maturities of loans based on contract terms and assuming no amortization or prepayments, excluding residential real estate mortgage and installment loans, as of December 31, 2018:
|
| |||||||||||||||||||||||||||||
| Maturing | ||||||||||||||||||||||||||||||
| (Dollars in thousands) |
One Year
or Less |
One
Through
Five Years |
After Five
Years |
Total | ||||||||||||||||||||||||||
| Commercial |
$ | 79,593 | $ | 41,105 | $ | 26,177 | $ | 146,875 | ||||||||||||||||||||||
| Commercial real estate |
6,495 | 14,337 | 162,773 | 183,605 | ||||||||||||||||||||||||||
| Construction and land development |
2,321 | 1,671 | 27,235 | 31,227 | ||||||||||||||||||||||||||
|
|
|
|
|
|
|
|
|
|
|
|
|
|||||||||||||||||||
| Total |
$ | 88,409 | $ | 57,113 | $ | 216,185 | $ | 361,707 | ||||||||||||||||||||||
|
|
|
|
|
|
|
|
|
|
|
|
|
|||||||||||||||||||
The following is a schedule of fixed rate and variable rate commercial, commercial real estate and construction and land development loans due after one year from December 31, 2018.
| (Dollars in thousands) | Fixed Rate | Variable Rate | ||||||||||
| Total commercial, commercial real estate and construction and land development loans due after one year |
$ | 43,713 | $ | 229,585 | ||||||||
The following schedule summarizes nonaccrual, past due and restructured loans.
| (Dollars in thousand) | 2018 | 2017 | 2016 | 2015 | 2014 | |||||||||||||||||||||||||
|
Loans accounted for on a nonaccural basis |
$ |
|
3,155 |
|
$ |
|
6,081 |
|
$ |
|
1,449 |
|
$ |
|
1,576 |
|
$ |
|
3,668 |
| ||||||||||
| Accruing loans that are contractually past due 90 days or more as to interest or principal payments | 174 | 441 | 235 | 105 | 281 | |||||||||||||||||||||||||
|
|
|
|
|
|
|
|
|
|
|
|
|
|
|
| ||||||||||||||||
| Total |
$ | 3,329 | $ | 6,522 | $ | 1,684 | $ | 1,681 | $ | 3,949 | ||||||||||||||||||||
|
|
|
|
|
|
|
|
|
|
|
|
|
|
|
| ||||||||||||||||
The policy for placing loans on nonaccrual status is to cease accruing interest on loans when management believes that collection of interest is doubtful, when commercial loans are past due as to principal and interest 90 days or more or when mortgage loans are past due as to principal and interest 120 days or more, except that in certain circumstances interest accruals are continued on loans deemed by management to be well-secured and in process of collection. In such cases, loans are individually evaluated in order to determine whether to continue income recognition after 90 days beyond the due date. When loans are placed on nonaccrual, any accrued interest is charged against interest income.
14
Information regarding impaired loans at December 31 is as follows:
| (Dollars in thousands) | 2018 | 2017 | 2016 | |||||||||||||||
| Total recorded investment of impaired loans |
$ | 3,860 | $ | 7,882 | $ | 7,173 | ||||||||||||
| Less portion for which no allowance for loan loss is allocated |
3,122 | 5,565 | 3,326 | |||||||||||||||
| Portion of impaired loan balance for which an allowance for loan losses is allocated |
738 | 2,317 | 3,847 | |||||||||||||||
| Portion of allowance for loan losses allocated to the impaired loan balance at December 31 |
101 | 244 | 729 | |||||||||||||||
For the year ended December 31, 2018, interest income recognized on impaired loans amounted to $113 thousand, while $371 thousand would have been recognized had the loans been performing under their contractual terms. For the year ended December 31, 2017, interest income recognized on impaired loans amounted to $123 thousand, while $426 thousand would have been recognized had the loans been performing under their contractual terms. For the year ended December 31, 2016, interest income recognized on impaired loans amounted to $312 thousand while $426 thousand would have been recognized had the loans been performing under their contractual terms.
Impaired loans are comprised of commercial, commercial real estate, and residential real estate loans, and are carried at the present value of expected cash flows discounted at the loan’s effective interest rate or at fair value of the collateral if the loan is collateral dependent. A portion of the allowance for loan losses is allocated to impaired loans.
Smaller-balance homogeneous loans are evaluated for impairment in total. Such loans include residential first-mortgage loans secured by one to four-family residences, residential construction loans, automobile loans, home equity loans, and second-mortgage loans. These consumer loans are included in nonaccrual and past due disclosures above as well as impaired loans when they become nonperforming. Commercial loans and mortgage loans secured by other properties are evaluated individually for impairment. When analysis of borrower operating results and financial condition indicates that underlying cash flows of the borrower’s business are not adequate to meet its debt service requirements, the loan is evaluated for impairment. Impaired loans or portions thereof, are charged-off when deemed uncollectible.
At December 31, 2018, no loans were identified that management had serious doubts about the borrowers’ ability to comply with present loan repayment terms that are not included in the tables set forth above. On a monthly basis, the Company internally classifies certain loans based on various factors. At December 31, 2018, these amounts, including impaired and nonperforming loans, amounted to $29 million of substandard loans and $0 doubtful loans.
As of December 31, 2018, there were no concentrations of loans greater than 10% of total loans that were not otherwise disclosed as a category of loans in the loan portfolio table set forth above.
15
Summary of Loan Loss Experience
The following schedule presents an analysis of the allowance for loan losses, average loan data, and related ratios for the years ended December 31:
| (Dollars in thousands) | 2018 | 2017 | 2016 | 2015 | 2014 | |||||||||||||||||||||||||||||||||||
| LOANS |
||||||||||||||||||||||||||||||||||||||||
| Average loans outstanding during period |
$ | 535,506 | $ | 497,048 | $ | 448,941 | $ | 412,147 | $ | 405,973 | ||||||||||||||||||||||||||||||
|
|
|
|
|
|
|
|
|
|
|
|
|
|
|
|
||||||||||||||||||||||||||
| ALLOWANCE FOR LOAN LOSSES |
||||||||||||||||||||||||||||||||||||||||
| Balance at beginning of period |
$ | 5,604 | $ | 5,291 | $ | 4,662 | $ | 4,381 | $ | 5,085 | ||||||||||||||||||||||||||||||
| Loans charged-off: |
||||||||||||||||||||||||||||||||||||||||
| Commercial |
823 | 1,184 | 297 | 109 | 1,005 | |||||||||||||||||||||||||||||||||||
| Commercial real estate |
103 | - | 50 | 61 | 379 | |||||||||||||||||||||||||||||||||||
| Residential real estate |
37 | - | 12 | 132 | 27 | |||||||||||||||||||||||||||||||||||
| Construction and land development |
- | - | - | - | - | |||||||||||||||||||||||||||||||||||
| Consumer |
119 | 20 | 59 | 46 | 11 | |||||||||||||||||||||||||||||||||||
|
|
|
|
|
|
|
|
|
|
|
|
|
|
|
|
||||||||||||||||||||||||||
| Total loans charged-off |
1,082 | 1,204 | 418 | 348 | 1,422 | |||||||||||||||||||||||||||||||||||
|
|
|
|
|
|
|
|
|
|
|
|
|
|
|
|
||||||||||||||||||||||||||
| Recoveries of loans previously charged-off: |
||||||||||||||||||||||||||||||||||||||||
| Commercial |
61 | 361 | 214 | 199 | 28 | |||||||||||||||||||||||||||||||||||
| Commercial real estate |
1 | - | 334 | 13 | 8 | |||||||||||||||||||||||||||||||||||
| Residential real estate |
3 | 8 | 5 | 18 | 25 | |||||||||||||||||||||||||||||||||||
| Construction and land development |
- | - | - | - | - | |||||||||||||||||||||||||||||||||||
| Consumer |
4 | 3 | 1 | 10 | 14 | |||||||||||||||||||||||||||||||||||
|
|
|
|
|
|
|
|
|
|
|
|
|
|
|
|
||||||||||||||||||||||||||
| Total loans recoveries |
69 | 372 | 554 | 240 | 75 | |||||||||||||||||||||||||||||||||||
|
|
|
|
|
|
|
|
|
|
|
|
|
|
|
|
||||||||||||||||||||||||||
| Net loans (recovered) charged-off |
1,013 | 832 | (136 | ) | 108 | 1,347 | ||||||||||||||||||||||||||||||||||
| Provision charged to operating expense |
1,316 | 1,145 | 493 | 389 | 643 | |||||||||||||||||||||||||||||||||||
|
|
|
|
|
|
|
|
|
|
|
|
|
|
|
|
||||||||||||||||||||||||||
| Balance at end of period |
$ | 5,907 | $ | 5,604 | $ | 5,291 | $ | 4,662 | $ | 4,381 | ||||||||||||||||||||||||||||||
|
|
|
|
|
|
|
|
|
|
|
|
|
|
|
|
||||||||||||||||||||||||||
| Ratio of net charge-offs to average loans outstanding for period |
0.19 | % | 0.17 | % | (0.03 | ) | % | 0.03 | % | 0.33 | % | |||||||||||||||||||||||||||||
The allowance for loan losses balance and provision charged to expense are determined by management based on periodic reviews of the loan portfolio, past loan loss experience, economic conditions, and various other circumstances subject to change over time. In making this judgment, management reviews selected large loans, as well as impaired loans, other delinquent, nonaccrual and problem loans, and loans to industries experiencing economic difficulties. The collectability of these loans is evaluated after considering current operating results and financial position of the borrower, estimated market value of collateral, guarantees and the Company’s collateral position versus other creditors. Judgments, which are necessarily subjective, as to the probability of loss and amount of such loss are formed on these loans, as well as other loans taken together.
16
The following schedule is a breakdown of the allowance for loan losses allocated by type of loan and related ratios. While management’s periodic analysis of the adequacy of the allowance for loan losses may allocate portions of the allowance for specific problem-loan situations, the entire allowance is available for any loan charge-offs that occur.
| Allocation of the Allowance for Loan Losses | ||||||||||||||||||||||||||||||||||||||||||||||||||
| (Dollars in thousands) | ||||||||||||||||||||||||||||||||||||||||||||||||||
| Allowance Amount |
Percentage of Loans in Each Category to Total Loans |
Allowance Amount |
Percentage of Loans in Each Category to Total Loans |
Allowance Amount |
Percentage of Loans in Each Category to Total Loans |
Allowance Amount |
Percentage of Loans Category to Total Loans |
Allowance Amount |
Percentage of Loans in Each Category to Total Loans |
|||||||||||||||||||||||||||||||||||||||||
|
|
|
|
|
|
|
|
|
|
|
|
|
|
|
|
||||||||||||||||||||||||||||||||||||
| December 31, 2018 | December 31, 2017 | December 31, 2016 | December 31, 2015 | December 31, 2014 | ||||||||||||||||||||||||||||||||||||||||||||||
| Commercial | $ | 2,178 | 26.78 | % | $ | 1,813 | 27.17 | % | $ | 2,207 | 28.27 | % | $ | 1,664 | 29.15 | % | $ | 1,289 | 30.16 | % | ||||||||||||||||||||||||||||||
| Commercial real estate | 1,791 | 33.48 | 1,735 | 34.80 | 1,264 | 33.58 | 1,271 | 35.22 | 1,524 | 34.02 | ||||||||||||||||||||||||||||||||||||||||
| Residential real estate | 1,245 | 30.51 | 1,273 | 30.44 | 1,189 | 30.42 | 1,086 | 29.78 | 1,039 | 29.64 | ||||||||||||||||||||||||||||||||||||||||
| Construction & land development | 258 | 5.69 | 237 | 4.43 | 178 | 4.93 | 123 | 3.66 | 142 | 4.25 | ||||||||||||||||||||||||||||||||||||||||
| Consumer | 306 | 3.54 | 175 | 3.16 | 141 | 2.80 | 86 | 2.19 | 60 | 1.93 | ||||||||||||||||||||||||||||||||||||||||
| Unallocated | 129 | 371 | 312 | 432 | 327 | |||||||||||||||||||||||||||||||||||||||||||||
|
|
|
|
|
|
|
|
|
|
|
|
|
|
|
|
||||||||||||||||||||||||||||||||||||
| Total |
$ | 5,907 | 100.00 | % | $ | 5,604 | 100.00 | % | $ | 5,291 | 100.00 | % | $ | 4,662 | 100.00 | % | $ | 4,381 | 100.00 | % | ||||||||||||||||||||||||||||||
|
|
|
|
|
|
|
|
|
|
|
|
|
|
|
|
||||||||||||||||||||||||||||||||||||
17
Deposits
The following is a schedule of average deposit amounts and average rates paid on each category for the periods indicated:
| Average Amounts Outstanding Year ended December 31, |
Average Rate Paid Year ended December 31, |
|||||||||||||||||||||||||||||
|
|
|
|
|
|
|
|
|
|
|
|
||||||||||||||||||||
| (Dollars in thousands) | 2018 | 2017 | 2016 | 2018 | 2017 | 2016 | ||||||||||||||||||||||||
| Noninterest-bearing demand |
$ | 175,439 | $ | 169,803 | $ | 156,287 | N/A | N/A | N/A | |||||||||||||||||||||
| Interest-bearing demand |
117,879 | 101,081 | 83,956 | 0.30 | % | 0.13 | % | 0.04 | % | |||||||||||||||||||||
| Savings deposits |
180,718 | 170,694 | 163,271 | 0.37 | 0.18 | 0.08 | ||||||||||||||||||||||||
| Time deposits |
115,610 | 111,650 | 116,427 | 1.18 | 0.82 | 0.73 | ||||||||||||||||||||||||
|
|
|
|
|
|
|
|
|
|
||||||||||||||||||||||
| Total deposits |
$ | 589,646 | $ | 553,228 | $ | 519,941 | ||||||||||||||||||||||||
|
|
|
|
|
|
|
|
|
|
||||||||||||||||||||||
The Bank does not have any material deposits by foreign depositors.
The following is a schedule of maturities of time certificates of deposit in amounts of $100,000 or more, as of December 31, 2018:
| (Dollars in thousands) | ||||||||
| Three months or less |
$ | 5,229 | ||||||
| Over three through six months |
6,488 | |||||||
| Over six through twelve months |
9,937 | |||||||
| Over twelve months |
26,874 | |||||||
|
|
|
| ||||||
| Total |
$ | 48,528 | ||||||
|
|
|
| ||||||
Return on Equity and Assets
| 2018 | 2017 | 2016 | ||||||||||
| Return on average assets |
1.31 | % | 1.02 | % | 1.03 | % | ||||||
| Return on average shareholders’ equity |
12.89 | 10.33 | 10.44 | |||||||||
| Dividend payout ratio |
28.57 | 32.45 | 31.71 | |||||||||
| Average shareholders‘ equity to average assets |
10.19 | 9.92 | 9.91 | |||||||||
Short-Term Borrowings
Short-term borrowings consist of securities sold under agreements to repurchase, short-term advances through the Federal Home Loan Bank, and federal funds purchased. Securities sold under agreements to repurchase mature one (1) business day from the transaction date. Federal funds purchased generally have overnight terms. Information concerning short-term borrowings is summarized as follows:
| (Dollars in thousands) | 2018 | 2017 | 2016 | |||||||||||||||
| Securities sold under agreements to repurchase, federal funds purchased and short-term advances at year-end | $ | 37,415 | $ | 39,480 | $ | 48,742 | ||||||||||||
| Average balance outstanding |
41,334 | 50,445 | 51,801 | |||||||||||||||
| Maximum outstanding at any month end during the year |
44,155 | 56,932 | 55,642 | |||||||||||||||
| Weighted-average interest rate at year-end |
1.01 | % | 0.39 | % | 0.16 | % | ||||||||||||
| Weighted-average rate during the year |
0.81 | 0.29 | 0.14 | |||||||||||||||
18
ITEM 1A. RISK FACTORS.
Risks Related to the Company’s Business
Consumers may decide not to use banks to complete their financial transactions.
Technology and other changes are allowing parties to utilize alternative methods to complete financial transactions that historically have involved banks. Consumers can now maintain funds in brokerage accounts or mutual funds that would have historically been held as bank deposits. Consumers can also complete transactions such as paying bills and/or transferring funds directly without the assistance of banks. The process of eliminating banks as intermediaries could result in the loss of fee income, as well as the loss of customer deposits and the related income generated from those deposits. The loss of these revenue streams and the lower cost deposits as a source of funds could have a material adverse effect on the Company’s business, financial condition, or results of operations.
Strong competition within the market in which the Company operates could reduce its ability to attract and retain business.
Competition in the financial services industry is intense, as the Company competes with banks, credit unions, savings and loan associations, securities dealers, finance and insurance companies, mortgage brokers, and investment advisors. As a result of their size and ability to achieve economies of scale, certain of the Company’s competitors offer a broader range of products and services, or in some cases a lower cost operating model, than the Company can offer. The OCC has recently announced that it will accept applications for national bank charters from nondepository financial technology companies to engage in banking activities. In addition, the Company’s ability to achieve its financial objectives will depend on its ability to deliver or expand product delivery systems and technology required by customers.
Unauthorized disclosure of sensitive or confidential client or customer information whether through a breach of the Company’s computer systems or otherwise, could severely harm the Company’s business.
As part of the Company’s business, it collects, processes, and retains sensitive and confidential client and customer information on behalf of the Company’s subsidiaries and other third parties. Despite the security measures the Company has in place, its facilities and systems, and those of the Company’s third-party service providers, may be vulnerable to security breaches. Any security breach involving the misappropriation, loss or other unauthorized disclosure of confidential customer information, whether by the Company or by its vendors, could severely damage the Company’s reputation, cause a loss of customer confidence, expose it to risks of litigation and liability, or disrupt the Company’s operations and may have a material adverse effect on the Company’s business.
A failure in or breach of the Company’s technology infrastructure, or those of third parties with whom the Company has relationships, could result in a material adverse effect on the Company’s operations, reputation, cash flows, financial condition, and results of operation.
The Company is very dependent upon the use of technology to operate its business. The Company processes a large number of transactions every day and maintains and transmits confidential client and employee information through its technology systems.
The Company’s dependence upon automated systems to record and process the Bank’s transactions poses the risk that technical system flaws, employee errors, tampering or manipulation of those systems, or attacks by third parties will result in losses and may be difficult to detect. The Company’s inability to use these information systems at critical points in time could unfavorably impact the timeliness and efficiency of its business operations. In recent years, some banks have experienced denial of service attacks in which individuals or organizations flood the bank’s website with extraordinarily high volumes of traffic, with the goal and effect of disrupting the ability of the bank to process transactions. The Company could also be adversely affected if one of its employees causes a significant operational break-down or failure, either as a result of human error or where an individual purposefully sabotages or fraudulently manipulates the Company’s operations or systems. The Company is further exposed to the risk that third-party service providers may be unable to fulfill their contractual obligations or will be affected by the same risks as the Bank has. These disruptions may interfere with service to the Bank’s customers, cause additional regulatory scrutiny, and result in a financial loss or liability. The Company is also at risk of the impact of natural disasters, terrorism, and international hostilities on its systems or for the effects of outages or other failures involving power or communications systems operated by others.
19
Employees could engage in fraudulent, improper or unauthorized activities on behalf of clients, or improper use of confidential information. The Company may not be able to prevent employee errors or misconduct, and the precautions taken to detect this type of activity might not be effective in all cases. Employee errors or misconduct could subject the Company to civil claims for negligence or regulatory enforcement actions, including fines and restrictions on the Company’s business.
In addition, there have been instances where financial institutions have been victims of fraudulent activity in which criminals pose as customers to initiate wire and automated clearinghouse transactions out of customer accounts. The recent massive breach of the systems of a credit bureau presents additional threats as criminals now have more information about a larger portion of the country’s population than past breaches have involved, which could be used by criminals to pose as customers initiating transfers of money from customer accounts. Although the Company has policies and procedures in place to verify the authenticity of the Company’s customers, it cannot assure that such policies and procedures will prevent all fraudulent transfers. Such activity can result in financial liability and harm to the Company’s reputation.
Management cannot be certain that the security controls it has adopted will prevent unauthorized access to its computer systems or those of its third-party service providers, whom it requires to maintain similar controls. A security breach of the computer systems and loss of confidential information, such as customer account numbers or personal information could result in a loss of customers’ confidence and, thus, loss of business. In addition, unauthorized access to or use of sensitive data could subject the Company to litigation and liability and costs to prevent further such occurrences.
Further, the Company may be affected by data breaches at retailers and other third parties who participate in data interchanges with the Company and its customers that involve the theft of customer credit and debit card data, which may include the theft of debit card PIN numbers and commercial card information used to make purchases at such retailers and other third parties. Such data breaches could result in the Company incurring significant expenses to reissue debit cards and cover losses, which could result in a material adverse effect on the Company’s results of operations.
The Company’s assets at risk for cyber-attacks include financial assets and non-public information belonging to customers. The Company uses several third-party vendors who have access to the Company’s assets via electronic media. Certain cyber security risks arise due to this access, including cyber espionage, blackmail, ransom, and theft. As cyber and other data security threats continue to evolve, the Company may be required to expend significant additional resources to continue to modify and enhance its protective measures or to investigate and remediate any security vulnerabilities.
The Company may not be able to attract and retain skilled people.
The Company’s success depends, in large part, on the ability to attract and retain key people. Succession planning includes the continuity of both the Board of Directors and the management team. Competition for the best people in most activities in which the Company engages can be intense, and it may not be able to attract, hire, or retain the people the Company wants or needs. In order to attract and retain qualified employees, the Company must compensate them at market levels. If the Company is unable to continue to attract and retain qualified employees, or do so at rates necessary to maintain the Company’s competitive position, the Company’s performance could suffer, and, in turn, adversely affect the Company’s business, financial condition, or results of operation.
The Company’s exposure to credit risk could adversely affect its earnings and financial condition.
Credit risk is the risk of losing principal and interest income because borrowers fail to repay loans. The Company’s earnings may be negatively impacted if it fails to manage credit risk, as the origination of loans is an integral part of the Company’s business. Factors which may affect the ability of borrowers to repay loans include a slowing of the local economy in which the Company operates, a downturn in one or more business sectors in which the Company’s customers operate, or a rapid increase in interest rates. All of the Company’s loan portfolios, particularly commercial and industrial loans may be affected by the impact of higher interest rates. There has been some price appreciation in the housing market across the Company’s footprint, reflecting improved sales and decreased inventories of houses to be sold. A return to further declines in home values and reduced levels of home sales in the Company’s market may have a negative effect on the Company’s business, financial condition, or results of operation.
20
The Company’s allowance for loan losses may be insufficient.
The Company maintains an allowance for loan losses to cover current, probable loan losses in the Company’s loan portfolio. Management makes various assumptions and judgments about the collectability of its loan portfolio, including the creditworthiness of its borrowers and the value of the real estate and other assets serving as collateral for the repayment of loans. Through a periodic review and consideration of the loan portfolio, management determines the amount of the allowance for loan losses by considering general market conditions, credit quality of the loan portfolio, the collateral supporting the loans, and performance of customers relative to their financial obligations with the Company. The amount of future losses is susceptible to changes in economic, operating and other conditions, including changes in interest rates, which may be beyond the Company’s control and these losses may exceed current estimates. The Company cannot fully predict the amount, timing of losses, or whether the loss allowance will be adequate in the future. If the Company’s assumptions prove to be incorrect, the allowance for loan losses may not be sufficient to cover losses inherent in the Company’s loan portfolio, resulting in additions to the allowance. Excessive loan losses and significant additions to the Company’s allowance for loan losses could have a material adverse impact on the Company’s business, financial condition, and results of operations. Any such increase in the Company’s allowance for loan losses or loan charge-offs as required by these regulatory authorities might have a material adverse effect on the Company’s business, financial condition, or results of operations.
The Financial Accounting Standards board (“FASB”) finalized its guidance eliminating the probable recognition threshold for credit losses on financial assets measured at amortized cost. The Update would require financial assets be presented at the net amount expected to be collected. Under this current expected credit loss model (“CECL”), an entity would record at the time of origination, as an allowance, its estimate of credit losses expected throughout the life of the loan as opposed to the current practice of recording losses when it is probable that a loss event has occurred. The Update for Financial Instruments-Credit Losses is required January 1, 2020. The guidance may require the Company to maintain a larger allowance for loan losses in the future than existing guidance currently requires.
The Company has significant exposure to risks associated with commercial and commercial real estate loans.
As of December 31, 2018, approximately 66% of the Company’s loan portfolio consisted of commercial, commercial real estate, and construction loans. These loans are generally viewed as having more inherent risk of default than residential mortgage or consumer loans. The repayment of these loans often depends on the successful operation of a business. These loans are more likely to be adversely affected by weak conditions in the economy. Also, the commercial loan balance per borrower is typically larger than that of residential mortgage loans and consumer loans, indicating higher potential losses on an individual loan basis. The deterioration of one or a few of these loans could cause a significant increase in nonperforming loans and a reduction in interest income. An increase in nonperforming loans could result in an increase in the provision for loan losses and an increase in loan charge-offs, both of which could have a material adverse effect on the Company’s business, financial condition, and results of operations.
If the Bank forecloses on collateral property and owns the underlying real estate, the Bank may be subject to the increased costs associated with the ownership of real property, resulting in reduced revenue.
The Bank may have to foreclose on collateral property to protect its investment and may thereafter own and operate such property, in which case it will be exposed to the risks inherent in the ownership of real estate. The amount that the Bank, as a mortgagee, may realize after a default is dependent upon factors outside of the Bank’s control, including, but not limited to: (i) general or local economic conditions: (ii) neighborhood values; (iii) interest rates; (iv) real estate tax rates; (v) operating expenses of the mortgaged properties; (vi) supply of and demand for rental units or properties; (vii) ability to obtain and maintain adequate occupancy of the properties; (viii) zoning laws; (ix) governmental rules, regulations and fiscal policies; and (x) acts of God. Certain expenditures associated with the ownership of real estate, principally real estate taxes and maintenance costs, may adversely affect the income from the real estate. Therefore, the cost of operating a real property may exceed the rental income earned from such property, and the Bank may have to advance funds in order to protect its investment, or the Bank may be required to dispose of the real property at a loss. The Bank may also acquire properties with hazardous substances that must be removed or remediated, the costs of which could be substantial, and the Bank may not be able to recover such costs from the responsible parties. The foregoing expenditures and costs could adversely affect the Company’s ability to generate revenues, resulting in reduced levels of profitability.
21
The Company is subject to liquidity risk.
The Company requires liquidity to extend credit and repay liabilities on a timely basis at a reasonable cost. The Company’s access to funding sources in amounts adequate to finance its activities or on terms that are acceptable to it could be impaired by factors that affect it specifically or the financial services industry or general economy. Factors that could reduce its access to liquidity sources include a downturn in the north central Ohio market, difficult credit markets, aggressive competitor actions due to liquidity needs, or adverse regulatory actions. The Company’s access to deposits may also be affected by the liquidity needs of its depositors. The Company’s primary source of liquidity is its supply of deposits from consumer and commercial customers which are payable on demand or upon several days’ notice, while by comparison, a substantial portion of its assets are loans, which cannot be called or sold in the same time frame. The Company historically has been able to replace maturing deposits and advances as necessary, but it might not be able to readily replace such funds in the future, if a large number of its depositors sought to withdraw their accounts, regardless of the reason. A failure to maintain adequate liquidity could have a material adverse effect on the Company’s business, financial condition, or results of operations.
The Company may not be able to successfully implement planned growth as part of its business strategy and may incur expenses and risks related to such growth efforts.
The Company’s ability to grow successfully will depend on a variety of factors, including the continued availability of desirable business opportunities. There can be no assurance when or if such growth opportunities will be available.
During the past decade, the Company’s growth has been accomplished through a combination of organic growth, de novo branching and acquisitions. The Company may acquire other financial institutions or parts of institutions in the future, open new branches, and consider new lines of business and new products or services. Such expansions of its business may involve a number of expenses and risks, generally not attendant with organic growth efforts. Such expenses and risks include:
| ● | The time and costs associated with identifying and evaluating potential acquisitions or new products or services; |
| ● | The potential inaccuracy of estimates and judgments used to evaluate credit, operation management and market risk with respect to the target institutions; |
| ● | The time and costs of evaluating new markets, hiring local management and opening new offices, and the delay between commencing these activities and the generation of profits from the expansion; |
| ● | The Company’s ability to finance an acquisition or other expansion and the possible dilution to the Company’s existing shareholders; |
| ● | The diversion of management’s attention to the negotiation of a transaction and the integration of the operations and personnel of the combining businesses; |
| ● | Entry into unfamiliar markets; |
| ● | The possible failure of the introduction of new products and services into the Company’s existing business; |
| ● | The incurrence and possible impartment of goodwill associated with an acquisition and possible adverse short-term effects on the Company’s results of operations; and |
| ● | The risk of loss of key employees and customers. |
Failure to manage the Company’s growth effectively could have a material adverse effect on its business, future prospects, financial condition, or results of operations and could adversely affect the Company’s ability to successfully implement its business strategy.
22
The Company may need to raise capital in the future, but capital may not be available when needed or at acceptable terms.
Federal and state banking regulators require CSB and the Bank to maintain adequate levels of capital to support its operations. The Company may need to raise additional capital in the future to support its business or to finance acquisitions, if any, or the Company may otherwise elect to raise additional capital in anticipation of future growth opportunities
The Company’s ability to raise additional capital for CSB’s or the Bank’s needs will depend on conditions at that time in the capital markets, overall economic conditions, CSB’s financial performance and condition, and other factors, many of which are outside the Company’s control. There is no assurance that, if needed, CSB will be able to raise additional capital on favorable terms or at all. An inability to raise additional capital may have a material adverse effect on the Company’s ability to expand operations, and on the Company’s financial condition, results of operations, and future prospects.
The Bank may be required to repurchase loans it has sold or indemnify loan purchasers under the terms of the sale agreements, which could adversely affect the Company’s liquidity, results of operations, and financial condition.
When the Bank sells a mortgage loan, it agrees to repurchase or substitute a mortgage loan if it is later found to have breached any representation or warranty the Bank made about the loan or if the borrower is later found to have committed fraud in connection with the origination of the loan. While the Bank has underwriting policies and procedures designed to avoid breaches of representations and warranties as well as borrower fraud, the Bank cannot be sure that no breach or fraud will ever occur. Required repurchases, substitutions, or indemnifications could have an adverse effect on the Company’s liquidity, results of operations, and financial condition.
The trading volume and price of CSB’s common shares can be volatile.
CSB’s common shares are very thinly traded and therefore, susceptible to price swings. CSB’s common shares are traded on the OTC market under the symbol “CSBB;” however, the investment community does not actively follow CSB’s common shares. Given the lower trading volume of CSB’s common shares, significant sales of CSB’s common shares, or the expectation of significant sales, could cause CSB’s share price to fall.
The Company’s organizational documents may have the effect of discouraging a third party from acquiring the Company by means of a tender offer, proxy contest, or otherwise.
The Company’s articles of incorporation contain provisions that make it more difficult for a third party to gain control or acquire the Company without the consent of its board of directors. These provisions also could discourage proxy contests and may make it more difficult for dissident shareholders to elect representatives as directors and take other corporate actions. These provisions of the Company’s governing documents may have the effect of delaying, deferring, or preventing a transaction or a change in control that might be in the best interests of the Company’s shareholders.
23
Risks Relating to Economic and Market Conditions
Difficult market conditions and economic trends could adversely affect the financial services industry and the Company’s business.
The Company’s success depends, to a certain extent, upon local and national economic and political conditions as well as governmental monetary policies. The election of a new United States President in 2016 has resulted in substantial changes in economic and political conditions for the United States, and has impacted global relations in matters such as trade policy. Economic turmoil in Europe and Asia and changes in oil production in the Middle East both affect the economy and stock prices in the United States. The timing and circumstances of the United Kingdom leaving the European Union (Brexit) and their effects on the United States are unknown.
Conditions such as inflation, recession, unemployment, changes in interest rates, money supply, and other factors beyond the Company’s control may adversely affect asset quality, deposit levels, and loan demand and therefore, the Company’s earnings. Because the Company has a significant amount of real estate loans, decreases in real estate values could adversely affect the value of property used as collateral and the Company’s ability to sell the collateral upon foreclosure. Adverse changes in the economy may also have a negative effect on the ability of borrowers to make timely repayments of their loans, which would have an adverse impact on the Company’s earnings. If during a period of reduced real estate values, the Company is required to liquidate the collateral securing loans to satisfy the debt or to increase its allowance for loan losses, it could materially reduce the Company’s profitability and adversely affect its financial condition. The substantial majority of the Company’s loans are to individuals and businesses located in Holmes, Stark, Tuscarawas, Wayne and Counties in Ohio. Consequently, significant declines in north central Ohio real estate values could have a material adverse effect on the Company’s business, financial condition, or results of operations.
Changes in interest rates could adversely affect income and financial condition.
The Company’s results of operation and financial condition are substantially dependent upon net interest income, which is the difference between interest earned from loans and investments and interest paid on interest bearing deposits and borrowings. Market interest rates are largely beyond the Company’s control, and they fluctuate in response to general economic conditions and the policies of various governmental and regulatory agencies, in particular the FRB, as well as competitive factors. Changes in interest rates will influence the origination of loans, the purchase of investments, the level of prepayments on the Company’s loans and investments, and the receipt of payments on mortgage-backed securities, resulting in fluctuations of income and cash flow. Changes in interest rates also can affect the value of loans, securities, mortgage servicing rights, and assets under management. Although fluctuations in market interest rates are neither completely predictable nor controllable, the Company’s Asset Liability Committee (ALCO) meets regularly to monitor the Company’s interest rate sensitivity position and oversee the Company’s financial risk management by establishing policies and operating limits. Rising interest rates may adversely affect the ability of borrowers to pay the principal or interest on loans and may lead to an increase in nonperforming assets and a reduction of interest income recognized. The Board reviews interest rate conditions monthly and management maintains continuous surveillance of interest rate risk exposures. Fixed rate investment securities will lose value during rising rates and certain investment securities, notably mortgage backed securities will experience a decrease in in prepayments of principal and interest, which will extend their maturity. For more information, see Item 7A, Quantitative and Qualitative Disclosures about Market Risk in this Annual Report on Form 10-K, which summarizes the Company’s exposure to interest rate risk.
24
A transition away from LIBOR as a reference rate for financial contracts could negatively affect the Company’s income and expenses and the value of various financial contracts.
LIBOR is used extensively in the U.S. and globally as a benchmark for various commercial and financial contracts, including adjustable rate mortgages, corporate debt, interest rate swaps, and other derivatives. LIBOR is set based on interest rate information reported by certain banks, which may stop reporting such information after 2021. It is uncertain at this time whether LIBOR will change or cease to exist or the extent to which those entering into financial contracts will transition to any other particular benchmark. Other benchmarks may perform differently than LIBOR or alternative benchmarks have performed in the past or have other consequences that cannot currently be anticipated. It is also uncertain what will happen with instruments that rely on LIBOR for future interest rate adjustments and which remain outstanding if LIBOR ceases to exist. The Company has no loans tied to LIBOR and has 5 investment securities tied to LIBOR with a fair market value of $2.7 million held at December 31, 2018. One investment of $566 thousand matures in 2020 and the remaining $2.1 million in investment securities receive principal repayment monthly. The potential transition away from LIBOR is not expected to have a significant direct impact on the Company’s financial statements. However, the extent of indirect impacts from financial market adjustments to the absence of LIBOR are unknown at this time.
Adverse changes in the financial markets may adversely impact the Company’s results of operations.
The capital and credit markets have been experiencing unprecedented levels of volatility since 2008. While the Company generally invests in securities with limited credit risk, certain investment securities the Company holds possess higher credit risk since they represent beneficial interests in structured investments collateralized by residential mortgages. Regardless of the level of credit risk, all investment securities are subject to changes in market value due to changing interest rates and implied credit spreads. Structured investments have at times been subject to significant market volatility due to the uncertainty of credit ratings, deterioration in credit losses occurring within certain types of residential mortgages, changes in prepayments of the underlying collateral, and the lack of transparency related to the investment structures and the collateral underlying the structured investment vehicles.
A default by another larger financial institution could adversely affect financial markets generally.
The commercial soundness of many financial institutions may be closely interrelated as a result of relationships between the institutions. As a result, concerns about, or a default or threatened default by, one institution could lead to significant market-wide liquidity and credit problems, losses or defaults by other institutions. This “systemic risk” may adversely affect the Company’s business.
25
Risks Related to Legal, Regulatory, and Accounting Changes
Legislative, regulatory, or accounting changes or actions could adversely impact the Company or the businesses in which it is engaged.
The Company and its subsidiaries are subject to broad state and federal regulation, supervision, and legislation that govern almost all aspects of its operations. Laws and regulations may change from time to time and are primarily intended for the protection of consumers, depositors, and the Deposit Insurance Fund, and not to benefit the Company’s shareholders. Changes to laws and regulations or other actions by regulatory agencies may negatively impact the Company or its ability to increase the value of its business. Regulatory authorities have extensive discretion in connection with their supervisory and enforcement activities, including the imposition of restrictions on the operation of an institution, the classification of assets by an institution, and the adequacy of an institution’s allowance for loan losses. Additionally, actions by regulatory agencies could cause the Company to devote significant time and resources to defending the Company’s business and may lead to penalties that materially affect the Company and its shareholders.
As discussed earlier, comprehensive revisions to the regulatory capital framework were included in the final rule adopted by the FRB in July 2014 based upon the Basel III capital standards. The final rule specifically revises what qualifies as regulatory capital, raises minimum requirements, and introduces the concept of additional capital buffers. The need to maintain more and higher quality capital as well as greater liquidity going forward could limit the Company’s business activities, including lending, and the Company’s ability to expand, either organically or through acquisitions. In addition, the new liquidity standards could require the Company to increase the Company’s holdings of highly liquid short-term investments, thereby reducing the Company’s ability to invest in longer-term assets even if longer-term assets are more desirable from a balance sheet management perspective.
In addition to laws, regulations, and actions directed at the operations of banks in general, the CFPB has adopted regulations directed at consumer lending in particular. As discussed above, in October 2017, the CFPB issued the Payday Rule with respect to certain consumer loans to be effective on January 16, 2018, although compliance with most sections to be required starting on August 19, 2019. Then, on February 6, 2019, the CFPB issued two proposals with respect to the Payday Rule. These proposals do not change the provisions of the Payday Rule that address lender payment practices with respect to covered loans. The CFPB also stated that it will be considering other changes to the Payday Rule in response to requests received for exemptions of certain types of lenders or loan products and may commence separate additional rulemaking initiatives. The Company is currently assessing the expected effect of this new rule on the Bank’s lending businesses and on the Company’s financial condition and results of operations. The costs of complying with this regulation or a determination to discontinue certain types of consumer lending in light of the expense of compliance could have an adverse effect on the financial conditions and results of operations of the Company. The Company believes its current consumer lending practices will be exempt from the Rule and its proposed amendments.
Changes in tax laws could adversely affect the Company’s financial condition and results of operations.
The Company is subject to extensive federal, state, and local taxes, including income, excise, sales/use, payroll, franchise, withholding, and ad valorem taxes. Changes to the Company’s taxes could have a material adverse effect on our results of operations. In addition, the Company’s customers are subject to a wide variety of federal, state, and local taxes. Changes in taxes paid by the Company’s customers, including changes in the deductibility of mortgage loan related expenses, may adversely affect their ability to purchase homes or consumer products, which could adversely affect their demand for the Company’s loans and deposit products. In addition, such negative effects on the Company’s customers could result in defaults on the loans the Bank has made and decrease the value of mortgage-backed securities in which the Company has invested.
On December 22, 2017, H.R.1, formally known as the “Tax Cuts and Jobs Act,” was enacted into law. This new tax legislation, among other changes, limits the amount of state, federal, and local taxes that taxpayers are permitted to deduct on their individual tax returns and eliminates other deductions in their entirety. Such limits and eliminations may result in customer defaults on loans the Bank has made and decrease the value of mortgage-backed securities in which the Company has invested.
26
Increases in FDIC insurance premiums may have a material adverse effect on the Company’s earnings.
Increased bank failures for several years commencing in 2008 greatly increased resolution costs of the FDIC and depleted the deposit insurance fund. In order to maintain a strong funding position and restore reserve ratios of the deposit insurance fund, the FDIC took a number of actions, including increasing assessment rates of insured institutions, requiring riskier institutions to pay a larger share of premiums by factoring in rate adjustments based on secured liabilities and unsecured debt levels, changing the assessment base and requiring a prepayment of assessments for over three years.
The Company is generally unable to control the amount of premiums that the Bank is required to pay for FDIC insurance. If there are additional financial institution failures, the Bank may be required to pay even higher FDIC premiums. Increases in FDIC insurance premiums may materially adversely affect the Company’s results of operations and its ability to continue to pay dividends on our common shares at the current rate or at all. The FDIC has recently adopted rules revising its assessments in a manner benefitting banks with assets totaling less than $10 billion. There can be no assurance though, that assessments will not be changed in the future.
Changes in accounting standards, policies, estimates, or procedures could impact the Company’s reported financial condition or results of operations.
Entities that set generally applicable accounting standards, such as the FASB, the Securities and Exchange Commission, and other regulatory boards periodically change the financial accounting and reporting standards that govern the preparation of the Company’s consolidated financial statements. These changes can be difficult to predict and can materially affect how the Company records and reports its financial condition and results of operations. In some cases, the Company could be required to apply a new or revised standard retroactively, which would result in the restatement of the Company’s financial statements for prior periods.
In June 2016, FASB issued a new accounting standard for recognizing current expected credit losses, commonly referred to as CECL. CECL will result in earlier recognition of credit losses and requires consideration of not only past and current events but also reasonable and supportable forecasts that affect collectability. The Company will be required to comply with the new standard in the first quarter of 2020. Upon adoption of CECL, credit loss allowances may increase, which would decrease retained earnings and regulatory capital. The federal banking regulators have adopted a regulation that will allow banks to phase in the day-one impact of CECL on regulatory capital over three years. CECL implementation poses operational risk, including the failure to properly transition internal processes or systems, which could lead to call report errors, financial misstatements, or operational losses.
Management’s accounting policies and methods are fundamental to how the Company records and reports its financial condition and results of operations. The Company’s management must exercise judgment in selecting and applying many of these accounting policies and methods in order to ensure that they comply with GAAP and reflect management’s judgment as to the most appropriate manner in which to record and report our financial condition and results of operations. In some cases, management must select the accounting policy or method to apply from two or more alternatives, any of which might be reasonable under the circumstances yet might result in reporting materially different amounts than would have been reported under a different alternative.
Management has identified several accounting policies that are considered significant to the presentation of our financial condition and results of operations because they require management to make particularly subjective and/or complex judgments about matters that are inherently uncertain and because of the likelihood that materially different amounts would be reported under different conditions or using different assumptions. Because of the inherent uncertainty of estimates about these matters, no assurance can be given that the application of alternative policies or methods might not result in the Company reporting materially different amounts.
The Bank’s ability to pay dividends is subject to regulatory limitations which, to the extent the Company requires such dividends in the future, may affect its ability to pay dividends or repurchase its stock.
As a financial holding company, CSB is a separate legal entity from the Bank and does not have significant operations of its own. Dividends from the Bank provide a significant source of capital for CSB. The availability of dividends from the Bank is limited by various statutes and regulations. The FRB or Ohio Division of Financial Institutions, as the Bank’s primary regulators, could assert that the payment of dividends or other payments by the Bank are an unsafe or unsound practice. In the event the Bank is unable to pay dividends to CSB, CSB may not be able to pay its obligations as they become due, repurchase its stock, or pay dividends on its common stock. Consequently, the potential inability to receive dividends from the Bank could adversely affect CSB’s business, financial condition, results of operations, or prospects.
27
Periodic regulatory reviews may affect the Company’s operations and financial condition.
The Company is subject to periodic reviews from state and federal regulators, which may impact our operations and our financial condition. As part of the regulatory review, the loan portfolio and the allowance for loan losses are evaluated. As a result, the incurred loss identified on loans or the assigned loan rating could change and may require us to increase our provision for loan losses or loan charge-offs. In addition, any downgrade in loan ratings could impact our level of impaired loans or classified assets. Any increase in our provision for loan losses or loan charge-offs as required by these regulatory authorities could have a material adverse effect on our financial condition and results of operations. Findings of deficiencies in compliance with regulations could result in restrictions on our activities or even a loss in our financial holding company status.
The Company may be a defendant from time to time in the future in a variety of litigation and other actions, which could have a material adverse effect on its business, financial condition, or results of operations.
The Company may be subject to claims or legal action from customers, employees, or others. Financial institutions are facing a growing number of significant class actions, including those based on the manner or calculation of interest on loans and the assessments of overdraft fees. Future litigation could include claims for substantial compensatory and/or punitive damages or claims for indeterminate amounts of damages. Like other financial institutions, the Company and the Bank are also subject to risk from potential employee misconduct, including non-compliance with policies and improper use or disclosure of confidential information. The Company’s insurance may not cover all claims that may be asserted against it, and any claims asserted against the Company, regardless of merit or eventual outcome, may harm its reputation. Should the ultimate judgments or settlements in any litigation exceed the Company’s insurance coverage, it could have a material adverse effect on the Company’s business, financial condition, or results of operations. In addition, the Company may not be able to obtain appropriate types or levels of insurance in the future, nor may the Company be able to obtain adequate replacement policies with acceptable terms, if at all.
28
ITEM 1B. UNRESOLVED STAFF COMMENTS.
Not applicable.
ITEM 2. PROPERTIES.
The Bank operates fifteen banking centers as noted below:
| Location | Address | Owned | Leased | |||
| Walnut Creek | 4980 Old Pump Street, Walnut Creek, Ohio 44687 | X | ||||
| Winesburg | 2225 U.S. 62, Winesburg, Ohio 44690 | X | ||||
| Sugarcreek | 127 South Broadway, Sugarcreek, Ohio 44681 | X | ||||
| Charm | 4440 C.R. 70, Charm, Ohio 44617 | X | ||||
| Clinton Commons | 2102 Glen Drive, Millersburg, Ohio 44654 | X | ||||
| Berlin | 4587 S.R. 39 Suite B, Berlin, Ohio 44610 | X | ||||
| South Clay | 91 South Clay Street, Millersburg, Ohio 44654 | X | ||||
| Shreve | 333 West South Street, Shreve, Ohio 44676 | X | ||||
| Orrville | 119 West High Street, Orrville, Ohio 44667 | X | ||||
| Gnadenhutten | 100 South Walnut Street, Gnadenhutten, Ohio 44629 | X | ||||
| New Philadelphia | 635 West High Avenue, New Philadelphia, Ohio 44663 | X | ||||
| North Canton | 1210 North Main Street, North Canton, Ohio 44720 | X | ||||
| Wooster | 405 East Liberty Street, Wooster, Ohio 44691 | X | ||||
| Wooster | 3562 Commerce Parkway, Wooster, Ohio 44691 | X | ||||
| Wooster | 350 East Liberty Street | X | ||||
| Operations Center | 91 North Clay Street, Millersburg, Ohio 44654 | X | ||||
The Bank considers its physical properties to be in good operating condition and suitable for the purposes for which they are being used. All properties owned by the Bank are unencumbered by any mortgage or security interest and in management’s opinion, are adequately insured.
ITEM 3. LEGAL PROCEEDINGS.
In the normal course of business, CSB is subject to pending and threatened legal actions, including claims for which material relief or damages are sought. Although CSB is not able to predict the outcome of such actions, after reviewing pending and threatened actions, management believes that the outcome of any or all such actions will not have a material adverse effect on the results of operations, the financial position, or shareholders’ equity of CSB. Further, there are no material legal proceedings in which any director, executive officer, principal shareholder, or affiliate of CSB is a party or has a material interest that is adverse to CSB or the Bank.
ITEM 4. MINE SAFETY DISCLOSURES.
Not applicable.
PART II
ITEM 5. MARKET FOR REGISTRANT’S COMMON EQUITY AND RELATED STOCKHOLDER MATTERS.
Information contained in the section captioned “Common Stock and Shareholder Information” on page 21 of the Annual Report is incorporated herein by reference.
29
PERFORMANCE GRAPH
The following graph compares the yearly stock change and the cumulative total shareholder return on CSB’s Common Shares during the five-year period ended December 31, 2018, with the cumulative total return on the Standard and Poor’s 500 Stock Index and the NASDAQ Community Bank Stock Index. The comparison assumes $100 was invested on December 31, 2013 in CSB’s Common Shares and in each of the indicated indices and assumes reinvestment of dividends.
| 2013 |
2014 |
2015 |
2016 |
2017 |
2018 | |||||||||||||||||||
| CSBB |
$ | 100 | $ | 120 | $ | 138 | $ | 180 | $ | 197 | $ | 235 | ||||||||||||
| S & P 500 |
100 | 114 | 115 | 129 | 157 | 149 | ||||||||||||||||||
| NASDAQ Bank |
100 | 105 | 115 | 159 | 163 | 139 |
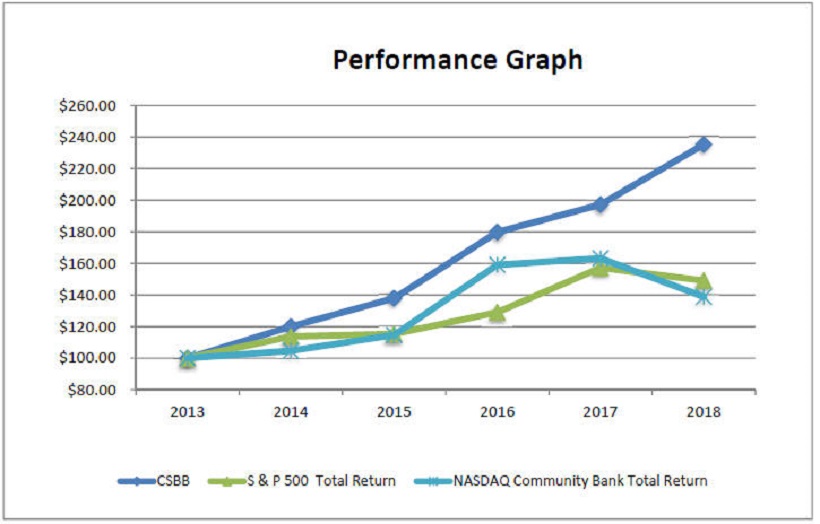
ISSUER PURCHASES OF EQUITY SECURITIES
On July 7, 2005, CSB filed a Current Report on Form 8-K with the SEC announcing that its Board of Directors approved a Stock Repurchase Program authorizing the repurchase of up to 10% of CSB’s Common Shares then outstanding. Repurchases may be made from time to time as market and business conditions warrant, in the open market, through block purchases and in negotiated private transactions. The Stock Repurchase Program has no scheduled expiration date. CSB did not repurchase any of its Common Shares during 2018.
30
ITEM 6. SELECTED FINANCIAL DATA.
Information contained in the section captioned “Selected Financial Data” on page 8 of the Annual Report is incorporated herein by reference.
ITEM 7. MANAGEMENT’S DISCUSSION AND ANALYSIS OF FINANCIAL CONDITION AND RESULTS OF OPERATIONS.
Information contained in the section captioned “2018 Financial Review” on pages 7 through 21 of the Annual Report is incorporated herein by reference.
ITEM 7A. QUANTITATIVE AND QUALITATIVE DISCLOSURES ABOUT MARKET RISK.
Information contained in the section captioned “Quantitative and Qualitative Disclosures About Market Risk” on pages 17 through 19 of the Annual Report is incorporated herein by reference.
ITEM 8. FINANCIAL STATEMENTS AND SUPPLEMENTARY DATA.
Information contained in the Consolidated Financial Statements and related notes and the Report of Independent Registered Public Accounting Firm thereon, on pages 23 through 59 of the Annual Report is incorporated herein by reference.
ITEM 9. CHANGES IN AND DISAGREEMENTS WITH ACCOUNTANTS ON ACCOUNTING AND FINANCIAL DISCLOSURE.
None.
ITEM 9A. CONTROLS AND PROCEDURES.
Disclosure Controls And Procedures
With the participation of the Company’s management, including the Company’s Chief Executive Officer and Chief Financial Officer, an evaluation of the effectiveness of the Company’s disclosure controls and procedures (as defined in Rules 13a-15(e) and 15d-15(e) of the Securities Exchange Act of 1934) was performed, as of the end of the period covered by this Annual Report on Form 10-K. Based on this evaluation, the Chief Executive Officer and Chief Financial Officer have concluded that the Company’s disclosure controls and procedures were effective.
Internal Control over Financial Reporting
Information contained in the Report On Management’s Assessment of Internal Control Over Financial Reporting and in the Report of Independent Registered Public Accounting Firm on pages 22 through 24 of the Annual Report is incorporated herein by reference.
Changes In Internal Control Over Financial Reporting
There have been no changes during the quarter ended December 31, 2018, in the Company’s internal controls over financial reporting (as defined in Rules 13a-15(e) and 15d-15(e) of the Securities Exchange Act of 1934) that have materially affected, or are reasonably likely to materially affect, the Company’s internal control over financial reporting.
Item 9B. Other Information.
None
31
PART III
ITEM 10. DIRECTORS, EXECUTIVE OFFICERS, AND CORPORATE GOVERNANCE.
The information required by Item 401 of Regulation S-K concerning the directors of the Company and the nominees for election as directors of the Company at the Annual Meeting of Shareholders to be held on April 24, 2019 (the “2019 Annual Meeting”), is incorporated herein by reference from the information to be included under the captions “Proposal One – Election of Directors,” “Nominees for Election of Directors,” and “Directors Continuing in Office” in the Company’s definitive proxy statement relating to the 2019 Annual Meeting to be filed with the SEC (the “2019 Proxy Statement”) no later than 120 days after December 31, 2018. The information required by Item 401 of Regulation S-K concerning the executive officers of the Company is incorporated herein by reference from the information to be included under the caption “Executive Officers” in the 2019 Proxy Statement.
Compliance with Section 16(a) of the Securities Exchange Act of 1934, as amended
The information required by Item 405 of Regulation S-K is incorporated herein by reference from the disclosure to be included under the caption, “Section 16(a) Beneficial Ownership Reporting Compliance” in the 2019 Proxy Statement.
Code of Ethics
The Company has adopted a Code of Ethics that applies to its senior financial officers, including the Chief Executive Officer and Chief Financial Officer. The Company has posted its Code of Ethics on its website at www.csb1.com; select Investor Relations/Corporate Profile/Governance Documents. The Company plans to satisfy SEC disclosure requirements regarding any amendments to, or waiver of, the Code of Ethics relating to its Chief Executive Officer or Chief Financial Officer, and persons performing similar functions, by posting such information on the Company’s website or by making any necessary filings with the SEC. Any person may receive a copy of our Code of Ethics free of charge upon request by calling the Company during business hours or by sending a written request.
Procedures for Recommending Director Nominees
Information concerning the procedures by which shareholders may recommend nominees to the Company’s Board of Directors can be found under the caption “Shareholder Recommendations” in the 2019 Proxy Statement. These procedures have not materially changed from those described in the 2018 Proxy Statement.
Audit Committee
The information required by Items 407(d)(4) and (d)(5) of Regulation S-K is incorporated herein by reference from the disclosure to be included under the sections “Membership and Meetings of the Board and its Committees” and the subsection “Committees of the Board of Directors – Audit Committee” in the 2019 Proxy Statement.
ITEM 11. EXECUTIVE COMPENSATION.
The information required by Item 402 of Regulation S-K is incorporated herein by reference from the disclosure to be included under the sections “Discussion of Executive Compensation Programs” and “Executive Compensation and Other Information” and the subsection “Directors’ Compensation” under the section captioned “Membership and Meetings of the Board and its Committees” in the 2019 Proxy Statement.
The information required by Item 407(e)(4) of Regulation S-K is incorporated herein by reference from the disclosure to be included under the section “Compensation Committee Interlocks and Insider Participation” in the 2019 Proxy Statement.
The information required by Item 407(e)(5) of Regulation S-K is incorporated herein by reference from the disclosure to be included under the section “The Compensation Committee Report” in the 2019 Proxy Statement.
32
ITEM 12. SECURITY OWNERSHIP OF CERTAIN BENEFICIAL OWNERS AND MANAGEMENT AND RELATED STOCKHOLDER MATTERS.
Equity Compensation Plan Information
None.
Security Ownership of Certain Beneficial Owners and Management
The information required by Item 403 of Regulation S-K is incorporated herein by reference from the disclosure to be included under the section “Beneficial Ownership of Management and Certain Beneficial Owners” in the 2019 Proxy Statement.
ITEM 13. CERTAIN RELATIONSHIPS AND RELATED TRANSACTIONS, AND DIRECTOR INDEPENDENCE.
The information required by Item 404 of Regulation S-K is incorporated herein by reference from the disclosure to be included under the section “Certain Relationships and Related Transactions” in the 2019 Proxy Statement.
The information required by Item 407(a) of Regulation S-K is incorporated herein by reference from the disclosure to be included under the section “Membership and Meetings of the Board and its Committees” in the 2019 Proxy Statement.
ITEM 14. PRINCIPAL ACCOUNTANT FEES AND SERVICES.
The information required by this Item 14 is incorporated herein by reference from the disclosure to be included under the section “Independent Registered Public Accounting Firm Fees” and subsection “Audit Committee Procedures for Pre-Approval of Services by the Independent Public Accounting Firm” in the 2019 Proxy Statement.
PART IV
ITEM 15. EXHIBITS AND FINANCIAL STATEMENT SCHEDULES.
(a)(1) Financial Statements
The Consolidated Financial Statements (and report thereon) listed below are incorporated by reference from CSB Bancorp, Inc.’s 2018 Annual Report as noted:
Report of Independent Registered Public Accounting Firm (S.R. Snodgrass) –pgs. 23-24.
Consolidated Balance Sheets at December 31, 2018 and 2017–pg. 25.
Consolidated Statements of Income for the years ended December 31, 2018, 2017 and 2016–pg. 26.
Consolidated Statements of Comprehensive Income for the years ended December 31, 2018, 2017 and 2016–pg. 27.
Consolidated Statements of Changes in Shareholders’ Equity for the years ended December 31, 2018, 2017 and 2016–pg. 27.
Consolidated Statements of Cash Flows for the years ended December 31, 2018, 2017 and 2016–pgs. 28-29.
Notes to Consolidated Financial Statements–pgs. 30-59.
(a)(2) Financial Statement Schedules
All schedules for which provision is made in the applicable accounting regulation of the Securities and Exchange Commission are not required under the related instructions or are inapplicable and have been omitted.
ITEM 16. FORM 10-K SUMMARY.
None.
33
(a)(3) Exhibits
The documents listed below are filed with this Annual Report on Form 10-K as exhibits or incorporated into this Annual Report on Form 10-K by reference as noted:
| Exhibit Number |
Description of Document | |
| 3.1 | ||
| 3.1.1 | ||
| 3.2 | Code of Regulations of CSB Bancorp, Inc. (incorporated by reference to Registrant’s Form 10-SB). | |
| 3.2.1 | ||
| 4 | Form of Certificate of Common Shares of CSB Bancorp, Inc. (incorporated by reference to Registrant’s Form 10-SB)(P). | |
| 10.1 | ||
| 10.2 | ||
| 10.3 | ||
| 10.4 | ||
| 13 | ||
| 21 | ||
| 23.1 | ||
| 31.1 | ||
| 31.2 | ||
| 32.1 | ||
| 32.2 | ||
| 101 | The following materials from CSB’s 2018 Annual Report to Shareholders formatted in XBRL (Extensible Business Reporting Language): (i) Consolidated Balance Sheets (ii) Consolidated Statements of Income (iii) Consolidated Statements of Comprehensive Income (iv) Consolidated Statements of Changes in Shareholders’ Equity (v) Consolidated Statements of Cash Flows and (vi) Notes to Consolidated Financial Statements. | |
34
SIGNATURES
Pursuant to the requirements of Section 13 or 15(d) of the Securities Exchange Act of 1934, the registrant has duly caused this report to be signed on its behalf by the undersigned, thereunto duly authorized.
| CSB BANCORP, INC. | ||
| /s/ Eddie L. Steiner | ||
| Date: March 15, 2019 |
Eddie L. Steiner, President and Chief Executive Officer | |
Pursuant to the requirements of the Securities Exchange Act of 1934, this report has been signed below by the following persons on behalf of the registrant and in the capacities indicated on March 15, 2019.
| Signatures | Title | |
| /s/ Eddie L. Steiner |
President and Chief Executive Officer | |
| Eddie L. Steiner |
||
| /s/ Paula J. Meiler |
Senior Vice President and Chief Financial Officer | |
| Paula J. Meiler |
||
| /s/ Pamela S. Basinger |
Vice President and Principal Accounting Officer | |
| Pamela S. Basinger |
||
| /s/ Robert K. Baker |
Director | |
| Robert K. Baker |
||
| /s/ Vikki G. Briggs |
Director | |
| Vikki G. Briggs |
||
| /s/ Julian L. Coblentz |
Director | |
| Julian L. Coblentz |
||
| /s/ Cheryl M. Kirkbride |
Director | |
| Cheryl M. Kirkbride |
||
| /s/ J. Thomas Lang |
Director | |
| J. Thomas Lang |
||
| /s/ Jeffery A. Robb, Sr. |
Director | |
| Jeffery A. Robb, Sr. |
||
| /s/ John R. Waltman |
Director | |
| John R. Waltman |
||
35
Exhibit 13

|
| ||||


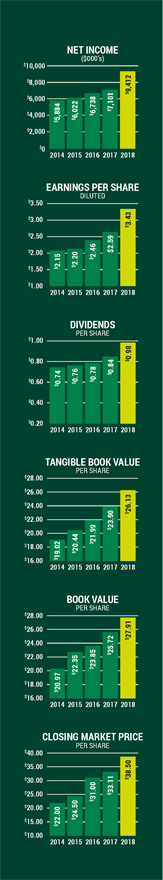
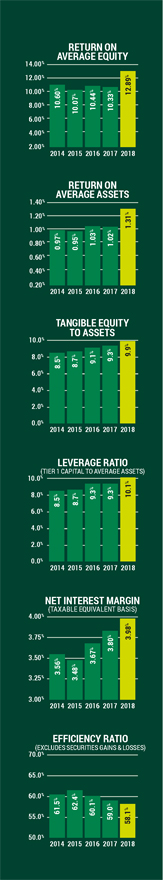


| 2018 FINANCIAL REVIEW
INTRODUCTION CSB Bancorp, Inc. (the “Company” or “CSB”) was incorporated under the laws of the State of Ohio in 1991 and is a registered financial holding company. The Company’s wholly-owned subsidiaries are The Commercial and Savings Bank (the “Bank”) and CSB Investment Services, LLC. The Bank is chartered under the laws of the State of Ohio and was organized in 1879. The Bank is a member of the Federal Reserve System, with deposits insured by the Federal Deposit Insurance Corporation, and its primary regulators are the Ohio Division of Financial Institutions and the Federal Reserve Board. The Company, through the Bank, provides retail and commercial banking services to its customers including checking and savings accounts, time deposits, cash management, safe deposit facilities, personal loans, commercial loans, real estate mortgage loans, installment loans, IRAs, night depository facilities, and trust and brokerage services. Its customers are located primarily in Holmes, Stark, Tuscarawas, Wayne, and portions of surrounding counties in Ohio. Economic activity in the Company’s market area is reporting stable demand after strengthening at a steady pace for the past nine years. The expansion has been most prevalent in small to mid-sized manufacturing and across various professional and non-professional service sectors. Reported unemployment levels at December 2018 ranged from 3.5% to 5.2% in the four primary counties served by the Company. These levels increased slightly from December 2017. Labor markets continued hiring at a softer pace during the year. Wage increases accelerated during 2018 for most entry level jobs and to a lesser extent middle-skills jobs in certain sectors such as banking and construction. The local housing market continues to improve with supply still relatively tight. Elevated costs of building materials have contributed to increased housing construction costs. Consumer confidence in the economy has been a primary driver for housing demand and higher consumer spending. |
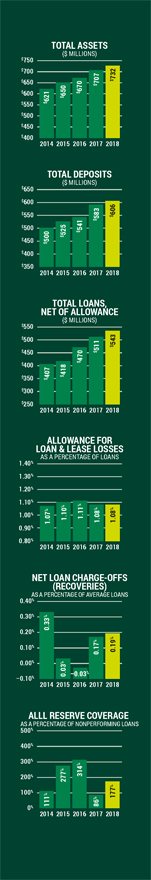
| |
|
FORWARD-LOOKING STATEMENTS Certain statements contained in Management’s Discussion and Analysis of Financial Condition and Results of Operations are not related to historical results, but are forward-looking statements within the meaning of the Private Securities Litigation Reform Act of 1995. These statements involve a number of risks and uncertainties. Any forward-looking statements made by the Company herein and in future reports and statements are not guarantees of future performance. Actual results may differ materially from those in forward-looking statements because of various risk factors as discussed in this annual report and the Company’s Annual Report on Form 10-K. The Company does not undertake, and specifically disclaims, any obligation to publicly release the result of any revisions to any forward-looking statements to reflect the occurrence of unanticipated events or circumstances after the date of such statements.
| ||
|
|

2018 FINANCIAL REVIEW
The economic value of equity is calculated by subjecting the period-end balance sheet to changes in interest rates and measuring the impact of the changes on the values of the assets and liabilities. Hypothetical changes in interest rates are then applied to the financial instruments. Then the cash flows and fair values are again estimated using these hypothetical rates. For the net interest income estimates, the hypothetical rates are applied to the financial instruments based on the assumed cash flows.
Management periodically measures and reviews the Economic Value of Equity at Risk with the Board. At December 31, 2018, the market value of equity as a percent of base in a 400 basis point rising rate environment indicates increases of 22.8% and 20.0% as of December 31, 2018 and 2017, respectively. The Company was within all Board-approved limits at December 31, 2017 and is slightly outside the Board-approved 20% limit for a 200 basis point decrease in interest rates at December 31, 2018. The variance is due to the increase in overnight cash held by the Bank at year-end 2018.
SIGNIFICANT ASSUMPTIONS AND OTHER CONSIDERATIONS
The above analysis is based on numerous assumptions, including relative levels of market interest rates, loan prepayments, and reactions of depositors to changes in interest rates and this should not be relied upon as being indicative of actual results. Further, the analysis does not contemplate all actions the Company may undertake in response to changes in interest rates.
U.S. Treasury securities, obligations of U.S. Government corporations and agencies, obligations of states and political subdivisions will generally repay at their stated maturity or if callable prior to their final maturity date. Mortgage-backed security payments increase when interest rates are low and decrease when interest rates rise. Most of the Company’s loans permit the borrower to prepay the principal balance prior to maturity without penalty. The likelihood of prepayment depends on a number of factors: current interest rate and interest rate index (if any) on the loan, the financial ability of the borrower to refinance, the economic benefit to be obtained from refinancing, availability of refinancing at attractive terms, as well as economic conditions in specific geographic areas, which affect the sales and price levels of residential, and commercial property. In a changing interest rate environment, prepayments may increase or decrease on fixed and adjustable rate loans depending on the current relative levels and expectations of future short-term and long-term interest rates. Prepayments on adjustable rate loans generally increase when long-term interest rates fall or are at historically low levels relative to short-term interest rates, thus making fixed rate loans more desirable. While savings and checking deposits generally may be withdrawn upon the customer’s request without prior notice, a continuing relationship with customers resulting in future deposits and withdrawals is generally predictable, leading to a dependable and uninterrupted source of funds. Time deposits generally have early withdrawal penalties, which discourage customer withdrawal prior to maturity. Short-term borrowings have fixed maturities. Certain advances from the FHLB carry prepayment penalties and are expected to be repaid in accordance with their contractual terms.
FAIR VALUE MEASUREMENTS
The Company discloses the estimated fair value of its financial instruments at December 31, 2018 and 2017 in Note 15 to the consolidated financial statements.
OFF-BALANCE SHEET ARRANGEMENTS, CONTRACTUAL OBLIGATIONS, AND CONTINGENT LIABILITIES AND COMMITMENTS
The following table summarizes the Company’s loan commitments, including letters of credit, as of December 31, 2018:
|
|
Amount of Commitment to Expire Per Period
|
| ||||||||||||||||||
|
|
|
|||||||||||||||||||
| (Dollars in thousands) Type of Commitment |
Total Amount |
Less than 1 year |
1 to 3 Years |
3 to 5 Years |
Over 5 Years |
|||||||||||||||
|
|
||||||||||||||||||||
| Commercial lines of credit |
$ | 100,295 | $ | 94,863 | $ | 534 | $ | 138 | $ | 4,760 | ||||||||||
| Real estate lines of credit |
59,363 | 1,727 | 5,401 | 7,672 | 44,563 | |||||||||||||||
| Consumer lines of credit |
755 | 755 | – | – | – | |||||||||||||||
| Credit cards lines of credit |
4,762 | 4,762 | – | – | – | |||||||||||||||
| Overdraft privilege |
7,082 | 7,082 | – | – | – | |||||||||||||||
| Commercial real estate loan commitments |
– | – | – | – | – | |||||||||||||||
| Letters of credit |
1,045 | 889 | 35 | 121 | – | |||||||||||||||
|
|
|
|
|
|
|
|
|
|
|
|||||||||||
| Total commitments |
$ | 173,302 | $ | 110,078 | $ | 5,970 | $ | 7,931 | $ | 49,323 | ||||||||||
|
|
|
|
|
|
|
|
|
|
|
|||||||||||
All lines of credit represent either fee-paid or legally binding loan commitments for the loan categories noted. Letters of credit are also included in the amounts noted in the table since the Company requires that each letter of credit be supported by a loan agreement. The commercial and consumer lines represent both unsecured and secured obligations. The real estate lines are secured by mortgages on residential property. It is anticipated that a significant portion of these lines will expire without being drawn upon.


WOOSTER BANKING CENTER OPENING
We are in the process of a new building construction in the heart of downtown Wooster to allow room for growth. We purchased property at 350 E. Liberty Street for the purpose of constructing a full-service banking center with drive-thru lanes. Construction began in September, with plans to move across the street from our current leased building and open for business in the new facility in late spring or early summer 2019. Our Wooster Milltown Banking Center will remain open. You can see additional renderings of the building at https://www.csb1.com/csb-wooster-downtown.


CSB CORPORATE HEADQUARTERS
91 North Clay Street, P.O. Box 232, Millersburg, OH 44654

|
The Commercial & Savings Bank |

|

EXHIBIT 21
SUBSIDIARIES OF CSB BANCORP, INC.
The Commercial and Savings Bank of Millersburg, Ohio, an Ohio-chartered commercial bank (100% owned).
CSB Investment Services, LLC, an Ohio limited liability company (100% owned).
EXHIBIT 23.1
CONSENT OF INDEPENDENT REGISTERED PUBLIC ACCOUNTING FIRM
We consent to the incorporation by reference in the Registration Statement File No. 333-130082 on Form S-8 of CSB Bancorp, Inc. and in the Registration Statement on Form S-8 of The Commercial & Savings Bank 401(k) Retirement Plan of our report dated February 26, 2019 relating to our audit of the consolidated financial statements and internal control over financial reporting, which is incorporated included in the Annual Report on Form 10-K of CSB Bancorp, Inc. for the year ended December 31, 2018.
/s/ S.R. Snodgrass P.C.
Cranberry Township, Pennsylvania
March 15, 2019
EXHIBIT 31.1
SECTION 302 CERTIFICATION
Chief Executive Officer
I, Eddie L. Steiner, certify that:
| 1. | I have reviewed this annual report on Form 10-K of CSB Bancorp, Inc.; |
| 2. | Based on my knowledge, this report does not contain any untrue statement of a material fact or omit to state a material fact necessary to make the statements made, in light of the circumstances under which such statements were made, not misleading with respect to the period covered by this annual report; |
| 3. | Based on my knowledge, the financial statements, and other financial information included in this report, fairly present in all material respects the financial condition, results of operations and cash flows of the registrant as of, and for, the periods presented in this annual report; |
| 4. | The registrant’s other certifying officer and I are responsible for establishing and maintaining disclosure controls and procedures (as defined in Exchange Act Rules 13a-15(e) and 15d-15(e)) and internal control over financial reporting (as defined by Exchange Act Rules 13a-15(f) and 15d-15(f)) for the registrant and have: |
| a) | Designed such disclosure controls and procedures or caused such disclosure controls and procedures to be designed under our supervision, to ensure that material information relating to the registrant, including its consolidated subsidiaries, is made known to us by others within those entities, particularly during the period in which this report is being prepared; |
| b) | Designed such internal control over financial reporting, or caused such internal control over financial reporting to be designed under our supervision, to provide reasonable assurance regarding the reliability of financial reporting and the preparation of financial statements for external purposes in accordance with generally accepted accounting principles; |
| c) | Evaluated the effectiveness of the registrant’s disclosure controls and procedures and presented in this report our conclusions about the effectiveness of the disclosure controls and procedures, as of the end of the period covered by this report based on such evaluation; and |
| d) | Disclosed in this report any change in the registrant’s internal control over financial reporting that occurred during the registrant’s most recent fiscal quarter that has materially affected, or is reasonably likely to materially affect, the registrant’s internal control over financial reporting; and |
| 5. | The registrant’s other certifying officer and I have disclosed, based on our most recent evaluation of internal control over financial reporting, to the registrant’s auditors and the audit committee of the registrant’s board of directors (or persons performing the equivalent functions): |
| a) | All significant deficiencies and material weaknesses in the design or operation of internal control over financial reporting which are reasonably likely to adversely affect the registrant’s ability to record, process, summarize and report financial information; and |
| b) | Any fraud, whether or not material, that involves management or other employees who have a significant role in the registrant’s internal control over financial reporting. |
Date: March 15, 2019
| /s/ Eddie L. Steiner |
| Eddie L. Steiner |
| President and Chief Executive Officer |
EXHIBIT 31.2
SECTION 302 CERTIFICATION
Senior Vice President and Chief Financial Officer
I, Paula J. Meiler, certify that:
| 1. | I have reviewed this annual report on Form 10-K of CSB Bancorp, Inc.; |
| 2. | Based on my knowledge, this report does not contain any untrue statement of a material fact or omit to state a material fact necessary to make the statements made, in light of the circumstances under which such statements were made, not misleading with respect to the period covered by this annual report; |
| 3. | Based on my knowledge, the financial statements, and other financial information included in this report, fairly present in all material respects the financial condition, results of operations and cash flows of the registrant as of, and for, the periods presented in this annual report; |
| 4. | The registrant’s other certifying officer and I are responsible for establishing and maintaining disclosure controls and procedures (as defined in Exchange Act Rules 13a-15(e) and 15d-15(e)) and internal control over financial reporting (as defined by Exchange Act Rules 13a-15(f) and 15d-15(f)) for the registrant and have: |
| a) | Designed such disclosure controls and procedures or caused such disclosure controls and procedures to be designed under our supervision, to ensure that material information relating to the registrant, including its consolidated subsidiaries, is made known to us by others within those entities, particularly during the period in which this report is being prepared; |
| b) | Designed such internal control over financial reporting, or caused such internal control over financial reporting to be designed under our supervision, to provide reasonable assurance regarding the reliability of financial reporting and the preparation of financial statements for external purposes in accordance with generally accepted accounting principles; |
| c) | Evaluated the effectiveness of the registrant’s disclosure controls and procedures and presented in this report our conclusions about the effectiveness of the disclosure controls and procedures, as of the end of the period covered by this report based on such evaluation; and |
| d) | Disclosed in this report any change in the registrant’s internal control over financial reporting that occurred during the registrant’s most recent fiscal quarter that has materially affected, or is reasonably likely to materially affect, the registrant’s internal control over financial reporting; and |
| 5. | The registrant’s other certifying officer and I have disclosed, based on our most recent evaluation of internal control over financial reporting, to the registrant’s auditors and the audit committee of the registrant’s board of directors (or persons performing the equivalent functions): |
| a) | All significant deficiencies and material weaknesses in the design or operation of internal control over financial reporting which are reasonably likely to adversely affect the registrant’s ability to record, process, summarize and report financial information; and |
| b) | Any fraud, whether or not material, that involves management or other employees who have a significant role in the registrant’s internal control over financial reporting. |
Date: March 15, 2019
| /s/ Paula J. Meiler |
|
Paula J. Meiler |
| Senior Vice President and |
| Chief Financial Officer |
EXHIBIT 32.1
Certification Pursuant to
18 U.S.C. Section 1350,
As Adopted Pursuant to
Section 906 of the Sarbanes-Oxley Act of 2002
In connection with the Annual Report of CSB Bancorp, Inc. (the “Company”) on Form 10-K for the fiscal year ended December 31, 2018, as filed with the Securities and Exchange Commission on the date hereof (the “Report”), I, Eddie L. Steiner, Chief Executive Officer of the Company, certify, pursuant to 18 U.S.C. Section 1350, as adopted pursuant to Section 906 of the Sarbanes-Oxley Act of 2002, that to the best of my knowledge:
(1) The Report fully complies with the requirements of Section 13(a) or 15(d) of the Securities Exchange Act of 1934, and
(2) The information contained in the Report fairly presents, in all material respects, the financial condition and results of operations of the Company.
| /s/ Eddie L. Steiner |
|
Eddie L. Steiner |
| President and Chief Executive Officer |
March 15, 2019
EXHIBIT 32.2
Certification Pursuant to
18 U.S.C. Section 1350,
As Adopted Pursuant to
Section 906 of the Sarbanes-Oxley Act of 2002
In connection with the Annual Report of CSB Bancorp, Inc. (the “Company”) on Form 10-K for the fiscal year ended December 31, 2018, as filed with the Securities and Exchange Commission on the date hereof (the “Report”), I, Paula J. Meiler, Senior Vice President and Chief Financial Officer of the Company, certify, pursuant to 18 U.S.C. Section 1350, as adopted pursuant to Section 906 of the Sarbanes-Oxley Act of 2002, that to the best of my knowledge:
(1) The Report fully complies with the requirements of Section 13(a) or 15(d) of the Securities Exchange Act of 1934, and
(2) The information contained in the Report fairly presents, in all material respects, the financial condition and results of operations of the Company.
| /s/ Paula J. Meiler |
|
Paula J. Meiler |
| Senior Vice President and |
| Chief Financial Officer |
March 15, 2019
Serious News for Serious Traders! Try StreetInsider.com Premium Free!
You May Also Be Interested In
- CSB Bancorp, Inc. Reports First Quarter Earnings
- Dimensional Fund Advisors Ltd. : Form 8.3 - QUANEX BUILDING PRODUCTS - Ordinary Shares
- Dimensional Fund Advisors Ltd. : Form 8.3 - TRITAX BIG BOX REIT PLC - Ordinary Shares
Create E-mail Alert Related Categories
SEC FilingsSign up for StreetInsider Free!
Receive full access to all new and archived articles, unlimited portfolio tracking, e-mail alerts, custom newswires and RSS feeds - and more!
