

Form 10-K AMERICAN WOODMARK CORP For: Apr 30
 Tweet
Tweet Share
ShareUNITED STATES SECURITIES AND EXCHANGE COMMISSION
Washington, D.C. 20549
FORM 10-K
ACT OF 1934
For the fiscal year ended April 30 , 2022
or
ACT OF 1934
For the transition period from _______________ to _______________
Commission File Number: 000-14798
(Exact name of registrant as specified in its charter)
| (State or other jurisdiction of incorporation or organization) | (I.R.S. Employer Identification No.) | |||||||||||||
| (Address of principal executive offices) | (Zip Code) | |||||||||||||
(540 ) 665-9100
(Registrant's telephone number, including area code)
Securities registered pursuant to Section 12(b) of the Act:
| Title of each class | Trading Symbol(s) | Name of each exchange on which registered | ||||||
Securities registered pursuant to Section 12(g) of the Act: None
Indicate by check mark if the registrant is a well-known seasoned issuer, as defined in Rule 405 of the Securities Act.
Indicate by check mark if the registrant is not required to file reports pursuant to Section 13 or Section 15(d) of the Act.
Yes ☐ No ☒
Indicate by check mark whether the registrant (1) has filed all reports required to be filed by Section 13 or 15(d) of the Securities Exchange Act of 1934 during the preceding 12 months (or for such shorter period that the registrant was required to file such reports), and (2) has been subject to such filing requirements for the past 90 days. Yes ☒ No ☐
Indicate by check mark whether the registrant has submitted electronically every Interactive Data File required to be submitted pursuant to Rule 405 of Regulation S-T (§ 232.405 of this chapter) during the preceding 12 months (or for such shorter period that the registrant was required to submit such files).
Indicate by check mark whether the registrant is a large accelerated filer, an accelerated filer, a non-accelerated filer, a smaller reporting company or an emerging growth company. See the definitions of "large accelerated filer," "accelerated filer," "smaller reporting company" and "emerging growth company" in Rule 12b-2 of the Exchange Act.
| ☒ | Accelerated filer | ☐ | ||||||||||||
| Non-accelerated filer | ☐ | Smaller reporting company | ||||||||||||
| Emerging growth company | ||||||||||||||
If an emerging growth company, indicate by check mark if the registrant has elected not to use the extended transition period for complying with any new or revised financial accounting standards provided pursuant to Section 13(a) of the Exchange
Act. ☐
Indicate by check mark whether the registrant has filed a report on and attestation to its management's assessment of the effectiveness of its internal control over financial reporting under Section 404(b) of the Sarbanes-Oxley Act (15 U.S.C. 7262(b)) by the registered public accounting firm that prepared or issued its audit report. ☒
Indicate by check mark whether the registrant is a shell company (as defined in Rule 12b-2 of the Act).
Yes ☐ No ☒
The aggregate market value of the registrant's Common Stock, no par value, held by non-affiliates of the registrant as of October 30, 2021, the last business day of the Company's most recent second quarter was $1,129,507,601 .
As of June 17, 2022, 16,593,644 shares of the Registrant's Common Stock were outstanding.
DOCUMENTS INCORPORATED BY REFERENCE
Portions of the Registrant's definitive Proxy Statement for the Annual Meeting of Shareholders to be held on August 18, 2022 ("Proxy Statement") are incorporated by reference into Part III of this Form 10-K.
American Woodmark Corporation
2022 Annual Report on Form 10-K
TABLE OF CONTENTS
| PART I | ||||||||
| Item 1. | ||||||||
| Item 1A. | ||||||||
| Item 1B. | ||||||||
| Item 2. | ||||||||
| Item 3. | ||||||||
| Item 4. | ||||||||
| PART II | ||||||||
| Item 5. | ||||||||
| Item 6. | ||||||||
| Item 7. | 18 | |||||||
| Item 7A. | ||||||||
| Item 8. | ||||||||
| Item 9. | 60 | |||||||
| Item 9A. | ||||||||
| Item 9B. | ||||||||
| PART III | ||||||||
| Item 10. | ||||||||
| Item 11. | ||||||||
| Item 12. | ||||||||
| Item 13. | ||||||||
| Item 14. | ||||||||
| PART IV | ||||||||
| Item 15. | ||||||||
| Item 16. | ||||||||
| 67 | ||||||||
2
PART I
Item 1. BUSINESS
Our Company
American Woodmark Corporation ("American Woodmark," the "Company," "we," "our" or "us") was incorporated in 1980 by the four principal managers of the Boise Cascade Cabinet Division through a leveraged buyout of that division. We operated privately until 1986 when we became a public company through a registered public offering of common stock.
From design to installation, we believe we offer a higher level of service than our competitors, serving both national and regional markets with the most relevant options. This makes us the cabinetmaker of choice for many homeowners, builders, designers, dealers, distributors, and retailers across the country. Our customer base is expanding as we build our portfolio of brands and reach new markets beyond kitchen and bath. Aspirational yet grounded, we've embraced an ambitious, strategic vision that will advance us boldly into the future.
Our annual reports on Form 10-K, quarterly reports on Form 10-Q, current reports on Form 8-K, proxy statements, and all amendments to those reports are available free of charge on our website, americanwoodmark.com, as soon as reasonably practicable after such material is electronically filed with, or furnished to, the Securities and Exchange Commission. The contents of our website are not, however, part of, or incorporated by reference into, this report.
Our Business
American Woodmark celebrates the creativity in all of us. With over 10,000 employees and more than a dozen brands, we're one of the nation's largest cabinet manufacturers. From inspiration to installation, we help people find their unique style and turn their home into a space for self-expression. By partnering with major home centers, builders, and dealers, we spark the imagination of homeowners and designers and bring their vision to life. Across our service and distribution centers, our corporate office and manufacturing facilities, you'll always find the same commitment to customer satisfaction, integrity, teamwork, and excellence.
Our Products
We offer a wide variety of products that fall into product lines including kitchen cabinetry, bath cabinetry, office cabinetry, home organization and hardware. Our cabinetry products are available in a variety of designs, finishes and finish colors and door styles.
We offer products in the following categories: made-to-order and stock. Made-to-order products typically utilize higher grade materials with more options as compared to stock and are all special ordered and shipped directly to the home from the factory. Our home organization products are exclusively stock products. Our kitchen cabinetry and bath cabinetry are offered across all product categories (made-to-order and stock) and our office cabinetry is offered as stock. Our stock products represent cash and carry products and are sold through home centers, while our made-to-order products are sold through home centers, builders, and independent dealers and distributors.
Our Market
Our products are sold on a national basis across the United States to the remodeling and new home construction markets. We service these markets through three primary channels: home centers, builders, and independent dealers and distributors. We distribute our products to each market channel directly from our assembly plants and through a third party logistics network.
Our Customers
We serve three main categories of customers: home center customers, builders, and independent dealers and distributors.
Home Center Customers
Contractors, builders, remodelers, and do-it-yourself homeowners use our products primarily for repair and remodel ("R&R") projects. Products for R&R projects are predominately purchased through home centers such as Home Depot and Lowe's. Due to the market presence, store network and customer reach of these large home centers, our strategy has been to develop long-term strategic relationships with both Home Depot and Lowe's to distribute our products. During the fiscal year ended April 30,
3
2022 ("fiscal 2022"), Home Depot and Lowe's combined accounted for approximately 48.0% of net sales of the Company. The loss of either Home Depot or Lowe's as a customer would have a material adverse effect on us.
Builders
The builder business represents a large portion of our overall revenue and has historically been a strategic component of our go-to-market strategy. We serve the majority of the top U.S. builders with a high degree of geographic concentration around major metro areas where single family starts are most robust. We also serve multi-family builders, primarily in the Southwest Region of the U.S. Our various service center locations are close to these builders and enable us to deliver exceptional service to our builder partners. During fiscal 2022, builders accounted for approximately 39.3% of net sales of the Company.
Independent Dealers & Distributors
In 2010, we expanded our business into the dealer channel with the launch of the Waypoint Living Spaces® brand. Today, we sell this brand to over 1,800 regional and local dealers across the country. The dealer channel of the market is the largest by volume, characterized by a high degree of entrepreneurship and one that rewards suppliers that deliver great service. Our ability to provide superior value delivered with exceptional service has helped drive our expansion into this channel and this channel will continue to be a strong growth and market share opportunity for us. Within our distributor channel we also sell our Timberlake® brand through a network of regional distributors who are focused on selling a complete variety of building materials to small and midsized builders and contractors within their local markets. During fiscal 2022, independent dealers and distributors accounted for approximately 12.7% of net sales of the Company.
Manufacturing, Distribution and Service
Our manufacturing facilities are strategically located to serve our customers, which enhances our ability to provide high quality, value priced products with low production costs. We manufacture our products across 17 facilities located in Maryland, Indiana, West Virginia, Georgia, Arizona, Kentucky, Virginia, California, Texas, North Carolina, and Tijuana, Mexico. The geographic distribution of our facilities throughout the United States, together with our third party logistics network for the American Woodmark business and beneficial freight arrangements with home centers, enable us to provide a "short supply chain" to our U.S. customers. The ordering patterns of Home Depot and Lowe's, our two biggest customers, require suppliers to have sufficient manufacturing capacity to meet demand and to serve a large number (frequently hundreds to thousands) of stores. They impose strict logistics and performance criteria on us. The scale and strategic locations of our manufacturing facilities help us to meet these demands of the home center customers, as well as provide a logistics platform that we can leverage for builders and dealers. We distribute our products through one stand-alone distribution center, distribution centers located in some of our manufacturing facilities, and other third party locations to maximize efficiency. Our vertically-integrated production and assembly lines, standardized product construction, and investments in automation have allowed us to continuously improve productivity, and develop an expertise in wood processing and yield-maximizing technologies. We have standardized our raw material inputs and a number of our production processes, which reduces logistical requirements to manufacture and gives us increased economies of scale in sourcing these inputs. Certain of our inputs are also partially processed by our vendors, which reduces cost. In addition, our production of labor-intensive manufacturing and fabrication processes in our three Tijuana, Mexico facilities has enabled us to keep overall labor costs low while maintaining higher quality, greater speed-to-market and transportation cost advantage over Asian based manufacturers.
We provide complete turnkey installation services to our direct builder customers via our network of eight primary service centers that are strategically located throughout the United States in Virginia, Texas, North Carolina, Georgia, Florida, Arizona and California.
We regularly evaluate our organizational productivity and supply chains and assess opportunities to reduce costs and enhance quality. We strive to improve quality, speed and flexibility to meet changing and uncertain market conditions, as well as manage cost inflation, including wages and employee medical costs.
Raw Materials and Suppliers
The primary raw materials used in our products include hard maple, cherry, and beech lumber and plywood. Additional raw materials include paint, particleboard, medium density fiberboard, high density fiberboard, manufactured components, and hardware. We purchase these and other raw materials from more than one source and generally believe them to be readily available. We rely on outside suppliers for some of our key components and do not typically enter into long-term contracts with our suppliers or sourcing partners. We source a portion of our components from third parties in Asia. The distances involved in these arrangements, together with the differences in business practices, shipping and delivery requirements, and laws and
4
regulations add complexity to our supply chain logistics and increase the potential for interruptions in our production scheduling. In addition, prices and availability of these components may be affected by world market conditions and government policies and tariffs that impacted fiscal 2022 and may continue into fiscal 2023.
Competition
We operate in a highly fragmented industry that is composed of several thousand local, regional, and national manufacturers. Most of our competitors compete on a local or regional basis, but others, like us, compete on a national basis as well. Our competitors include importers and large consolidated operations as well as relatively small, local cabinet manufacturers. Moreover, companies in other building products industries may compete with us. Competitive factors within the industry include pricing, quality, product availability, service, delivery time, and relationships with customers. Our principal means for competition is our breadth and variety of product offerings, expanded service capabilities, geographic reach, competitive price points for our products, and affordable quality. We believe we are a top three manufacturer of kitchen, bath, and home organization products in the United States based on publicly available information.
Environmental Matters and Regulatory Matters
Our operations are subject to federal, state and local environmental laws and regulations relating to, among other things, the generation, storage, handling, emission, transportation, and discharge of regulated materials into the environment. Permits are required for certain of our operations, and these permits are subject to revocation, modification, and renewal by issuing authorities. Governmental authorities have the power to enforce compliance with their regulations, and violations may result in the payment of fines or the entry of injunctions, or both. We may also incur liabilities for investigation and clean-up of soil or groundwater contamination on or emanating from current or formerly owned and operated properties, or at offsite locations at which regulated materials are located where we are identified as a responsible party. Discovery of currently unknown conditions could require responses that could result in significant costs.
Intellectual Property
We maintain trademarks, copyrights, and trade secrets. We sell many of our products under a number of registered and unregistered trademarks, which we believe are widely recognized in our industry. We rely on trade secrets and confidentiality agreements to develop and maintain our competitive position. Monitoring the unauthorized use of our intellectual property is difficult, and the steps we have taken may not prevent unauthorized use of our intellectual property. The disclosure or misappropriation of our intellectual property could harm our ability to protect our rights and our competitive position. If we must litigate to protect our rights, we may incur significant expenses and divert significant attention from our business operations. To date, we have not relied on material patents in operating our business.
Seasonality
Our business has been subject to seasonal influences, with higher sales typically realized in our first and fourth fiscal quarters. General economic forces and changes in our customer mix have reduced seasonal fluctuations in revenue over the past few years and this trend is expected to continue. The costs of the Company's products are subject to inflationary pressures and commodity price fluctuations. The Company has generally been able, over time, to recover the effects of inflation and commodity price fluctuations through sales price increases, although, as we experienced in fiscal 2022 and continue to experience, there usually is a 6-9 month lag before our sales price increases catch up to such fluctuations.
Human Capital Resources
Employees
As of April 30, 2022, we employed over 10,000 full-time employees, with approximately 271 unionized employees in Anaheim, California. We believe that our employee relations and relationship with the union representing the employees in Anaheim are good.
Culture and Core Values
At American Woodmark, the way we conduct our business and interact with our customers, vendors, and the communities in which we operate is driven by our core principles of Customer Satisfaction, Integrity, Teamwork, and Excellence. These principles also guide our interactions with employees and serve as a basis for setting goals for and evaluating our employees. By living out these principles, we believe we will be best positioned to attract, develop, and promote a broad range of talent and
5
to conduct our business in a responsible, ethical, and professional manner. To that end, we have, among other things, established policies under which we strive to:
•Engage with our key stakeholders, including employees, to ensure their needs and concerns are heard and addressed, and if appropriate, incorporated into our strategy;
•Maintain a safe and enriching working environment where all employees are treated with respect and are able to achieve their full potential;
•Encourage employees to volunteer in our communities through internally or externally organized events;
•Fund the American Woodmark Foundation, which serves as a vehicle for our employees to serve the community; and
•Provide scholarship opportunities to family members for our employees.
Training
Training is an important part of attracting and retaining a qualified workforce. Through our training programs, we seek to ensure that each employee is engaged, and has opportunities to succeed and advance his or her career. We invest a significant number of hours annually in onboarding, cultural, safety, supervisory, and managerial training activities. Through these activities, as well as our tuition reimbursement programs, executive development opportunities, formal and informal cross-training activities, and other operational training offerings, we strive to establish American Woodmark as an organization dedicated to providing the training and development opportunities necessary to maintain a well-qualified workforce connected to and invested in our continued operational success.
Our training is designed and developed at the corporate and local level in order to further our goals of enterprise alignment and local integration. We prefer a leader-led approach to training whenever possible in order to foster engagement, relationship building, networking, and shared learning experiences. Depending on the course, our training and development opportunities are offered on an on-demand, semi-annual, annual, or biannual basis.
Safety
We have established comprehensive safety programs throughout our operations to provide our employees with the tools they need to comply with the safety standards established under federal, state, and local laws and regulations or independently by us. Our safety leadership teams monitor our safety programs and related benchmarking with the goal of improving safety across the Company. Our rate of incidents recordable under the standards of the Occupational Safety and Health Administration (“OSHA”) per one hundred employees per year, also known as the OSHA recordable rate, was 1.40 during fiscal 2022.
In the early stages of the COVID-19 pandemic, we enforced social distancing and enhanced health, safety and sanitation measures, and implemented necessary procedures and support to enable a significant portion of our office personnel to work remotely. We also imposed travel restrictions, transitioned meetings from in-person to virtual formats where possible, and made other operational adjustments in furtherance of the continued safety of our workforce.
Diversity and Inclusion
We are an equal opportunity employer and strive to create an environment free from discrimination and harassment and in which each employee is valued, treated with dignity and respect, and managed in an inclusive manner. We believe that a workplace that encourages the interaction of different perspectives and backgrounds creates superior solutions, approaches, and innovations. Five years ago, we commissioned the first formal team to better understand and evaluate inclusion and diversity at American Woodmark. Since that time, we have taken deliberate steps to educate our leaders and increase internal awareness within our workforce. Among these actions were the following: establishment of Right Environment Councils in each of our locations in an attempt to more effectively engage and connect with employees of all levels as well as the communities in which we serve; enhancing our employee engagement survey process to include measures specific to inclusion and diversity; creation of an external consultant partnership; establishment of our Inclusion, Diversity, Equity, and Alignment (IDEA) team; launching an enterprise-wide inclusion and diversity strategy, and most recently the inclusion of representation metrics as part of our organizational scorecard and incentive pay components. Going forward, we intend to continue our strategy with the goal of enhancing our culture of inclusion while increasing the diversity of people, thought, and perspectives represented throughout our company.
Our Competitive Strengths
Market Leader with Nationwide Manufacturing and Distribution Network
We believe our company holds the number two or three market position in the United States cabinet market with an estimated 10% market share based on publicly available information. We are one of a select number of market participants with a national manufacturing and distribution footprint, which includes 17 manufacturing facilities in the United States and Mexico and eight primary service centers and one distribution center located throughout the United States. Our operating footprint provides us an
6
ability to service our builder, dealer, and home center customers on a national basis, and we offer a broad set of products to serve our customers across a variety of price points. Our facilities are primarily located in or near major metropolitan markets to facilitate efficient product distribution to our customers. We believe the scale and breadth of our operations differentiate us and result in a competitive advantage providing superior customer service, low-cost distribution, and on-time delivery.
Comprehensive Product Offering with Diversified End-Markets
We believe that the diversity of our product portfolio across categories, channels, and end-markets benefits our financial performance, both in periods of growth and cyclicality. Our made-to-order offerings provide products for customers looking for a designer product, which can be used for both new home construction and remodeling applications. Our stock offering allows us to further serve our existing end-markets through the addition of a lower price point product that is well-suited for areas of growing demand such as new home construction targeting the first-time homebuyer. We also offer turnkey cabinet solutions for our builder customers which we believe is a unique aspect of our service platform. Our turnkey solution provides in-house design and measurement as well as installation service. We believe the ability to leverage our labor and expertise is a value-added service to our builder customers which has helped strengthen our position in the new home construction market.
Deep Relationships with Leading Retailers
We have built strong and stable relationships with a base of long-standing customers across home centers, builders, and independent dealers and distributors. We have an average relationship length of 20 plus years with our top 10 customers, including long-standing relationships with Home Depot and Lowe's. We believe our customers value our national manufacturing and distribution footprint, which allows us to meet demanding logistics and performance criteria. We believe our focus on providing exceptional customer service and a quality product at a competitive price have enabled us to establish ourselves as a vendor of choice.
Best-in-Class Manufacturing Capabilities
We operate 17 manufacturing facilities across the United States and Mexico. Our vertically-integrated production and assembly lines, standardized product construction, and investments in automation, have allowed us to continuously improve productivity and efficiency. We have standardized our raw material inputs and a number of our production processes, which reduces logistical requirements and provides increased economies of scale in sourcing these inputs. Our labor-intensive manufacturing and fabrication processes in Mexico offer a low cost alternative to Asian based manufacturers, while providing a quality product with lower transportation costs.
Experienced Management Team
We have assembled an executive team from leading organizations with a deep base of management experience within industrial manufacturing companies. Our President and Chief Executive Officer, M. Scott Culbreth, joined our team in 2014 as the Chief Financial Officer and was named Chief Executive Officer in 2020. Mr. Culbreth's career in the manufacturing industry has been highlighted with multiple leadership roles in finance. Our other senior executives all have over twenty plus years of experience working for multi-national companies, with individual backgrounds in manufacturing, finance, and marketing.
Item 1A. RISK FACTORS
There are a number of risks and uncertainties that may affect the Company's business, results of operations, and financial condition. These risks and uncertainties could cause future results to differ from past performance or expected results, including results described in statements elsewhere in this report that constitute "forward-looking statements" under the Private Securities Litigation Reform Act of 1995. Additional risks and uncertainties not presently known to the Company or currently believed to be immaterial also may adversely impact the Company's business. Should any risks or uncertainties develop into actual events, these developments could have material adverse effects on the Company's business, financial condition, and results of operations. These risks and uncertainties, which the Company considers to be most relevant to specific business activities, include, but are not limited to, the following. Additional risks and uncertainties that may affect the Company's business, results of operations, and financial condition are discussed elsewhere in this report, including in Item 7. "Management's Discussion and Analysis of Financial Condition and Results of Operations" under the headings "Forward-Looking Statements," "Seasonality," and "Outlook for Fiscal 2023" and Item 7A. "Quantitative and Qualitative Disclosures about Market Risk."
7
Risks related to our business and industry
Because of the concentration of our sales to our two largest customers, the loss of either customer or a significant reduction in orders from either customer could adversely affect our financial results. Home Depot and Lowe's collectively accounted for approximately 48.0% of total net sales during the fiscal year 2022. We do not typically enter into long-term sales contracts with Home Depot or Lowe's and our sales usually occur on a "purchase order" basis. Our customers can make significant changes in their purchase volumes and can seek to significantly affect the prices we receive for our products and services and the other terms and conditions on which we do business. They have in the past discontinued, and may in the future choose to discontinue, purchasing some or all of our products with little or no notice. In the past, purchase volumes from our customers, including Home Depot and Lowe's, have fluctuated substantially, and we expect such fluctuations to occur from time to time in the future. Any reduction in, or termination of, our sales to either Home Depot or Lowe's could have a material adverse effect on our business, financial condition, or results of operations.
In addition, the potential for orders from these large retail customers to increase significantly from time to time requires us to have sufficient manufacturing capacity. These large retailers also impose strict logistics and performance criteria and fines. Failure to comply with these obligations may result in these customers reducing or stopping their purchase of our products.
We could also experience delays or defaults in payment from Home Depot or Lowe's, which could adversely affect our business, financial condition or results of operations. The loss of a substantial portion of our order volumes or revenue from either Home Depot or Lowe's for any reason would have a material adverse effect on our business, financial condition, or results of operations.
Our business primarily relies on U.S. home improvement, repair and remodel and new home construction activity levels, all of which are impacted by risks associated with fluctuations in the housing market. Downward changes in the general economy, the housing market, or other business conditions could adversely affect our results of operations, cash flows, and financial condition. Our business primarily relies on home improvement, repair and remodel and new home construction activity levels in the United States. The housing market is sensitive to changes in economic conditions and other factors, such as the level of employment, access to labor, consumer confidence, consumer income, availability of financing and interest rate levels, and recent concerns with the housing market. Adverse changes in any of these conditions generally, or in any of the markets where we operate, could decrease demand and could adversely impact our businesses by:
•causing consumers to delay or decrease homeownership;
•making consumers more price conscious resulting in a shift in demand to smaller, less expensive homes;
•making consumers more reluctant to make investments in their existing homes, including kitchen and bath repair and remodel projects; or
•making it more difficult to secure loans for major renovations.
Fluctuating raw material and energy costs could have a material adverse effect on our business and results of operations. We purchase various raw materials, including, among others, wood, wood-based, and resin products, which are subject to price fluctuations that could materially increase our manufacturing costs as we experienced in fiscal 2022 and are continuing to experience. Further, increases in energy costs increase our production costs and also the cost to transport our products, each of which could have a material adverse effect on our business and results of operations. In addition, some of our suppliers have consolidated and other suppliers may do so in the future. Combined with increased demand, such consolidation could increase the price of our supplies and raw materials.
We also may be unwilling or unable to pass on to customers commensurate cost increases. Competitive considerations and customer resistance to price increases may delay or make us unable to adjust selling prices. To the extent we are unable to either re-engineer or otherwise offset increased costs or are unwilling or unable to build price increases into our sales prices, our margins will be negatively affected. Even if we are able to increase our selling prices, sustained price increases for our products may lead to sales declines and loss of market share, particularly if our competitors do not increase their prices, and there is usually a six to month lag before we are able to see the results of our pricing actions. Conversely, when raw materials or energy prices decline, we may receive customer pressure to reduce our sales prices.
These prices are market-based and fluctuate based on factors beyond our control. We do not have long-term fixed supply agreements and do not hedge against price fluctuations. We, therefore, cannot predict our raw materials or energy costs for the coming year.
Prolonged economic downturns may adversely impact our sales, earnings, and liquidity. Our industry historically has been cyclical in nature and has fluctuated with economic cycles. During economic downturns, our industry could experience longer periods of recession and greater declines than the general economy. We believe that our industry is significantly influenced by
8
economic conditions generally and particularly by housing activity, consumer confidence, the level of personal discretionary spending, demographics, and credit availability. These factors may affect not only the ultimate consumer of our products, but also may impact home centers, builders, and our other primary customers. As a result, a worsening of economic conditions could adversely affect our sales and earnings as well as our cash flow and liquidity.
COVID-19 has adversely affected our business, financial performance, and operating results and its continuing and future impacts as well as the impacts from other future pandemics could adversely affect our business, financial performance, and operating results. COVID-19 has negatively impacted the global and U.S. economy, disrupted consumer spending and global supply chains, and created significant volatility and disruption in financial markets.
In the initial stages of the COVID-19 pandemic, we were negatively impacted as demand for our products significantly decreased at the initial height of the pandemic in the fourth quarter of fiscal 2020 and first quarter of fiscal 2021, "stay at home" orders and other work disruptions created disruptions to our business operations and our supply chain has been negatively impacted by rising materials and logistics costs. More recently we have experienced supply chain and shipping interruptions and constraints, volatility in demand for our products caused by sudden and significant changes in production levels by our suppliers, disruptions in our manufacturing and supply arrangements caused by the loss or disruption of essential manufacturing and supply elements such as raw materials or other product components, transportation, work force, force majeure events, and other manufacturing and distribution capabilities, like the temporary suspension of our Mexican operations in April 2020. We've also experienced disruptions to our operations related to COVID-19 as a result of absenteeism by infected or ill employees, or absenteeism by employees who elect not to come to work due to the illness affecting others at our facilities, or due to quarantines, or as a result of the tight labor market we are currently experiencing.
The ultimate impact of the COVID-19 pandemic, or future pandemics, on our business, results of operations, financial condition, and cash flows remains uncertain and cannot be predicted. The continued impact on our business as a result of the COVID-19 pandemic, or other future pandemics, (directly or indirectly) could materially adversely affect our results of operations, financial condition, cash flows, prospects, and the trading prices of our common stock.
The U.S. cabinetry industry is highly competitive, and market share losses could occur. We operate within a highly competitive U.S. cabinetry industry, which is characterized by competition from a number of other manufacturers. Competition is further intensified during economic downturns. We compete with numerous large national and regional home products companies for, among other things, customers, orders from Home Depot and Lowe's, raw materials, skilled management, and labor resources. Purchase volumes from our main home center customers have fluctuated substantially from time to time in the past, and we expect such fluctuations to occur from time to time in the future.
Some of our competitors may have greater financial, marketing, and other resources than we do and, therefore, may be able to adapt to changes in customer preferences more quickly, devote more resources to the marketing and sale of their products, generate greater national brand recognition, or adopt more aggressive pricing policies than we can. In addition, some of our competitors may resort to price competition to sustain or gain market share and manufacturing capacity utilization, and we may have to adjust the prices on some of our products to stay competitive, which could reduce our revenues.
We also face competition with respect to some of our products from competitors in countries with lower regulatory, safety, environmental, and other costs, such as China, Vietnam and Malaysia. These competitors may also benefit from certain local government subsidies or other incentives that are not available to us.
We may not ultimately succeed in competing with other manufacturers and distributors in our market, which may have a material adverse effect on our business, financial condition, or results of operations.
Our failure to develop new products or respond to changing consumer preferences and purchasing practices could have a material adverse effect on our business, financial condition, or results of operations. The U.S. cabinetry industry is subject to changing consumer trends, demands, and preferences. The uncertainties associated with developing and introducing new products, such as gauging changing consumer preferences and successfully developing, manufacturing, marketing, and selling new products, could lead to, among other things, rejection of a new product line, reduced demand and price reductions for our products. If our products do not keep up with consumer trends, demands, and preference, we could lose market share, which could have a material adverse effect on our business, financial condition, or results of operations.
Changes to consumer shopping habits and potential trends toward "online" purchases could also impact our ability to compete. Further, the volatile and challenging economic environment of recent years has caused shifts in consumer trends, demands, preferences and purchasing practices, and changes in the business models and strategies of our customers. Shifts in consumer
9
preferences, which may or may not be long-term, have altered the quantity, type, and prices of products demanded by the end-consumer and our customers. If we do not timely and effectively identify and respond to these changing consumer preferences and purchasing practices, our relationships with our customers could be harmed, the demand for our products could be reduced, and our market share could be negatively affected.
We may fail to fully realize the anticipated benefits of our growth strategy within the home center, dealer and homebuilder channels. Part of our growth strategy depends on expanding our business in the dealer and homebuilder channels. We may fail to compete successfully against other companies that are already established providers within the dealer and homebuilder channels. Demand for our products within the home center, homebuilder and dealer channels may not grow, or might even decline. In addition, we may not accurately gauge consumer preferences and successfully develop, manufacture, and market our products at a national level. Further, the implementation of our growth strategy may place additional demands on our administrative, operational, and financial resources and may divert management's attention away from our existing business and increase the demands on our financial systems and controls. If our management is unable to effectively manage growth, our business, financial condition, or results of operations could be adversely affected. If our growth strategy is not successful then our revenue and earnings may not grow as anticipated or may decline, we may not be profitable, or our reputation and brand may be damaged. In addition, we may change our financial strategy or other components of our overall business strategy if we believe our current strategy is not effective, if our business or markets change, or for other reasons, which may cause fluctuations in our financial results.
Manufacturing expansion to add capacity, manufacturing realignments, and other cost savings programs could result in a decrease in our near-term earnings. We continually review our manufacturing operations. These reviews could result in the expansion of capacity, manufacturing realignments, and various cost savings programs, such as our closure of the Humboldt, Tennessee manufacturing plant in fiscal 2021. Effects of manufacturing expansion, realignments, or cost savings programs could result in a decrease in our short-term earnings until the additional capacity is in place, cost reductions are achieved, and/or production volumes stabilize. Such manufacturing expansions, realignments, and programs involve substantial planning, often require capital investments, and may result in charges for fixed asset impairments or obsolescence and substantial severance costs. We also cannot assure you that we will achieve all of the intended cost savings. Our ability to achieve cost savings and other benefits within expected time frames is subject to many estimates and assumptions. These estimates and assumptions are subject to significant economic, competitive, and other uncertainties, some of which are beyond our control. If these estimates and assumptions are incorrect, if we experience delays, or if other unforeseen events occur, our business, financial condition, and results of operations could be materially and adversely affected. In addition, downturns in the economy could potentially have a larger impact on the Company as a result of any added capacity.
We manufacture our products internationally and are exposed to risks associated with doing business globally. We manufacture our products in the United States and Mexico and sell our products in the United States and Canada. Accordingly, we are subject to risks associated with potential disruption caused by changes in political, monetary, economic, and social environments, including civil and political unrest, terrorism, possible expropriation, local labor conditions, changes in laws, regulations, and policies of foreign governments and trade disputes with the United States (including tariffs), and compliance with U.S. laws affecting activities of U.S. companies abroad, including tax laws, economic sanctions, and enforcement of contract and intellectual property rights.
We are also subject to the Foreign Corrupt Practices Act and other anti-bribery laws. While we have implemented safeguards and policies to discourage these practices by our employees and agents, our existing safeguards and policies to assure compliance and any future improvements may prove to be less than effective and our employees or agents may engage in conduct for which we might be held responsible. If employees violate our policies, we may be subject to regulatory sanctions. Violations of these laws or regulations could result in sanctions including fines, debarment from export privileges, and penalties and could have a material adverse effect on our business, financial condition, or results of operations.
We may hedge certain foreign currency transactions in the future; however, a change in the value of the currencies may impact our financial statements when translated into U.S. dollars. In addition, fluctuations in currency can adversely impact the cost position in local currency of our products, making it more difficult for us to compete. Our success will depend, in part, on our ability to effectively manage our business through the impact of these potential changes.
In addition, we source raw materials and components from Asia where we have recently experienced higher manufacturing costs and longer lead times due to currency fluctuations, higher wage rates, labor shortages, and higher raw material costs, and we have also experienced higher shipping costs and shipping delays. Our international operations and sourcing of materials (including from Asia and Mexico) could be harmed by a variety of factors including, but not limited to:
•increases in transportation costs or transportation delays;
•work stoppages and labor strikes;
10
•introduction of non-native invasive organisms into new environments;
•recessionary trends in international markets;
•legal and regulatory changes and the burdens and costs of our compliance with a variety of laws, including export controls, import and customs trade restrictions, tariffs and other regulations including those related to the COVID-19 pandemic such as the temporary suspension of our operations in Mexico in April 2020;
•fluctuations in exchange rates, particularly the value of the U.S. dollar relative to other currencies; and
•political unrest, terrorism, and economic instability.
If any of these or other factors were to render the conduct of our business in a particular country undesirable or impractical, our business, financial condition, or results of operations could be materially adversely affected.
The inability to obtain raw materials from suppliers in a timely manner would adversely affect our ability to manufacture and market our products. Our ability to offer a wide variety of products depends on our ability to obtain an adequate supply of components from manufacturers and other suppliers, particularly wood-based and resin products. Transportation and container delays may adversely impact our supply chain. Additionally, failure by our suppliers to provide us with quality products on commercially reasonable terms, and to comply with legal requirements for business practices, could have a material adverse effect on our business, financial condition, or results of operations. Furthermore, we rely heavily or, in certain cases, exclusively, on outside suppliers for some of our key components. While we do not rely exclusively on any one supplier for any particular raw materials, the loss of a major supplier could increase our costs to obtain raw materials until we obtain an adequate alternative source.
We typically do not enter into long-term contracts with our suppliers or sourcing partners. Instead, most raw materials and sourced goods are obtained on a "purchase order" basis. Although these components are generally obtainable in sufficient quantities from other sources, resourcing them from another supplier could take time. Financial, operating, or other difficulties encountered by our suppliers or sourcing partners, or changes in our relationships with them could result in manufacturing or sourcing interruptions, delays, and inefficiencies, and prevent us from manufacturing enough products to meet customer demands.
Certain of our customers have been expanding and may continue to expand through consolidation and internal growth, which may increase their buying power, which could materially and adversely affect our sales, results of operations, and financial position. Certain of our customers are large companies with significant buying power. In addition, potential further consolidation in the distribution channels could enhance the ability of certain of our customers to seek more favorable terms, including pricing, for the products that they purchase from us. Accordingly, our ability to maintain or raise prices in the future may be limited, including during periods of raw material and other cost increases. If we are forced to reduce prices or to maintain prices during periods of increased costs, or if we lose customers because of pricing or other methods of competition, our sales, operating results, and financial position may be materially and adversely affected.
Risks related to indebtedness
Our level and terms of indebtedness could adversely affect our business and liquidity position. Our consolidated indebtedness level could have important consequences to us, including, among other things, increasing our vulnerability to general economic and industry conditions; requiring a portion of our cash flow used in operations to be dedicated to the payment of principal and interest on our indebtedness, therefore reducing our liquidity and our ability to use our cash flow to fund our operations, capital expenditures and future business opportunities; exposing us to the risk of increased interest rates, and corresponding increased interest expense, because borrowings under our credit facilities are at variable rates of interest; reducing funds available for working capital, capital expenditures, acquisitions, and other general corporate purposes, due to the costs, and expenses associated with such debt; limiting our ability to obtain additional financing for working capital, capital expenditures, debt service requirements, acquisitions, and general corporate, or other purposes; and limiting our ability to adjust to changing marketplace conditions and placing us at a competitive disadvantage compared to our competitors who may have less debt.
If our cash flows and capital resources are insufficient to fund our debt service obligations, we may be forced to reduce or delay capital expenditures, sell assets, seek additional capital, or restructure or refinance our indebtedness. These alternative measures may not be successful and may not permit us to meet our scheduled debt service obligations, which could cause us to default on our debt obligations and impair our liquidity. In the event of a default under any of our indebtedness, the holders of the defaulted debt could elect to declare all the funds borrowed to be due and payable, together with accrued and unpaid interest. The lenders under our credit facilities could also elect to terminate their commitments thereunder and cease making further loans, and such lenders could institute foreclosure proceedings against their collateral, all of which could adversely affect our financial condition in a material way.
11
The credit agreement that governs our credit facility imposes operating and financial restrictions on us and our subsidiaries, which may prevent us from capitalizing on business opportunities or otherwise negatively impact our business. The credit agreement that governs our credit facility imposes operating and financial restrictions on us. These restrictions limit our ability and the ability of our subsidiaries to, among other things, to incur additional indebtedness, create additional liens on its assets, make certain investments, dispose of assets, or engage in a merger or other similar transaction or engage in transactions with affiliates, subject, in each case, to the various exceptions and conditions described in the credit agreement. The negative covenants further restrict the ability of the Company and certain of its subsidiaries to make certain restricted payments, including, in the case of the Company, the payment of dividends, and the repurchase of common stock, in certain limited circumstances.
As a result of these restrictions, each of which is subject to certain exceptions and qualifications, we may be limited as to how we conduct our business and we may be unable to raise additional debt or equity financing to compete effectively or to take advantage of new business opportunities. The terms of any future indebtedness we may incur could include more restrictive covenants. We cannot assure you that we will be able to maintain compliance with these existing covenants in the future and, if we fail to do so, that we will be able to obtain waivers from the lenders and/or amend the covenants.
Our failure to comply with the restrictive covenants described above as well as other terms of our indebtedness and/or the terms of any future indebtedness from time to time could result in an event of default, which, if not cured or waived, could result in us being required to repay these borrowings before their due date. If we are forced to refinance these borrowings on less favorable terms or cannot refinance these borrowings, our results of operations and financial condition could be adversely affected.
Other general risks applicable to us and our business
We may incur future goodwill impairment charges or other asset impairment charges which could negatively impact our future results of operations and financial condition. We recorded significant goodwill as a result of the acquisition of RSI Home Products, Inc. (the "RSI Acquisition" or "RSI") in fiscal year 2018. Goodwill and other acquired intangible assets represent a substantial portion of our assets. We also have long-lived assets consisting of property and equipment and other identifiable intangible assets which we review both on an annual basis as well as when events or circumstances indicate that the carrying amount of an asset may not be recoverable. If a determination is made that a significant impairment in value of goodwill, other intangible assets, or long-lived assets has occurred, such determination could require us to impair a substantial portion of our assets. Asset impairments could have a material adverse effect on our financial condition and results of operations.
The implementation of our Enterprise Resource Planning system could disrupt our business. We are in the process of implementing a common Enterprise Resource Planning (ERP) system across the Company and went live with the first wave of the system, including procurement, general ledger, accounts payable, and projects and fixed assets, in the second half of fiscal 2022, with other processes following thereafter. Although we currently expect the ERP implementation to increase efficiencies by leveraging a common, cloud-based system throughout the Company and standardizing processes and reporting, our ERP system implementation may not result in improvements that outweigh its costs and may disrupt our operations. Our inability to mitigate existing and future disruptions could adversely affect our sales, earnings, financial condition and liquidity. The ERP system implementation subjects us to substantial costs and inherent risks associated with migrating from our legacy systems. These costs and risks could include, but are not limited to:
•significant capital and operating expenditures;
•disruptions to our domestic and international supply chains;
•inability to fill customer orders accurately and on a timely basis, or at all;
•inability to process payments to suppliers, vendors and associates accurately and in a timely manner;
•disruption to our system of internal controls;
•inability to fulfill our SEC or other governmental reporting requirements in a timely or accurate manner;
•inability to fulfill federal, state, or local tax filing requirements in a timely or accurate manner; and
•increased demands on management and staff time to the detriment of other corporate initiatives.
Our operations may be adversely affected by information systems interruptions or intrusions. We rely on a number of information technology systems to process, transmit, store, and manage information to support our business activities. Increased global cybersecurity vulnerabilities, threats, and more sophisticated and targeted attacks pose a risk to our information technology systems. We have established security policies, processes, and layers of defense designed to help identify and protect against intentional and unintentional misappropriation or corruption of our systems and information and disruption of our operations. Despite these efforts, systems may be damaged, disrupted, or shut down due to attacks by unauthorized access, malicious software, undetected intrusion, hardware failures, or other events, and in these circumstances our disaster recovery
12
planning may be ineffective or inadequate. These breaches or intrusions could lead to business interruption, exposure of proprietary or confidential information, data corruption, damage to our reputation, exposure to litigation, and increased operational costs. Such events could have a material adverse impact on our business, financial condition and results of operation. In addition, we could be adversely affected if any of our significant customers or suppliers experience any similar events that disrupt their business operations or damage their reputation.
Increased compliance costs or liabilities associated with environmental regulations could have a material adverse effect on our business, financial condition, or results of operations. Our facilities are subject to numerous environmental laws, regulations and permits, including those governing emissions to air, discharges to water, storage, treatment and disposal of waste, remediation of contaminated sites, and protection of worker health and safety. We may not be in complete compliance with these laws, regulations, or permits at all times. Our efforts to comply with environmental requirements do not remove the risk that we may incur material liabilities, fines or penalties for, among other things, releases of regulated materials occurring on or emanating from current or formerly owned or operated properties or any associated offsite disposal location, or for contamination discovered at any of our properties from activities conducted by previous occupants. Liability for environmental contamination or a release of hazardous materials may be joint and several, so that we may be held responsible for more than our share of the contamination or other damages, or even for the entire share.
Changes in environmental laws and regulations or the discovery of previously unknown contamination or other liabilities relating to our properties and operations could result in significant environmental liabilities that could impact our business, financial condition, or results of operation. In addition, we may incur capital and other costs to comply with increasingly stringent environmental laws and enforcement policies. These laws, including, for example, the regulations relating to formaldehyde emissions promulgated by the California Air Resources Board, require us to rely on compliance by our suppliers of raw materials. Should a supplier fail to comply with such regulations, notify us of non-compliance, or provide us with a product that does not comply, we could be subject to disruption in our business and incur substantial liabilities.
Unauthorized disclosure of confidential information provided to us by customers, employees or third parties could harm our business. We rely on the internet and other electronic methods to transmit confidential information and store confidential information on our networks. If there were a disclosure of confidential information provided by, or concerning, our employees, customers or other third parties, including through inadvertent disclosure, unapproved dissemination, or unauthorized access, our reputation could be harmed and we could be subject to civil or criminal liability and regulatory actions.
Changes in government and industry regulatory standards could have a material adverse effect on our business, financial condition, or results of operations. Government regulations pertaining to health and safety and environmental concerns continue to emerge, domestically as well as internationally, including regulations due to the COVID-19 pandemic. These regulations include the Occupational Safety and Health Administration and other worker safety regulations for the protection of employees, as well as regulations for the protection of consumers. It is necessary for us to comply with current requirements (including requirements that do not become effective until a future date), and even more stringent requirements could be imposed on our products or processes. Compliance with these regulations may require us to alter our manufacturing and installation processes and our sourcing. For example, our manufacturing locations enhanced cleaning processes, established health screening procedures, modified work centers and material flows with established social distancing practices in response to the COVID-19 pandemic in accordance with guidelines provided by the U.S. Centers for Disease Control and Prevention, as well as local and state health departments. Such actions could increase our capital expenditures and adversely impact our business, financial condition or results of operations, and our inability to effectively and timely meet such regulations could adversely impact our competitive position.
We could continue to pursue growth opportunities through either acquisitions, mergers or internally developed projects, which may be unsuccessful or may adversely affect our future financial condition and operating results. We could continue to pursue opportunities for growth through either acquisitions, mergers, or internally developed projects as part of our growth strategy. We cannot assure you that we will be successful in integrating an acquired business or that an internally developed project will perform at the levels we anticipate. We may pay for future acquisitions using cash, stock, the assumption of debt, or a combination of these. Future acquisitions could result in dilution to existing shareholders and to earnings per share. In addition, we may fail to identify significant liabilities or risks associated with a given acquisition that could adversely affect our future financial condition, and operating results or result in us paying more for the acquired business or assets than they are worth.
Our ability to operate and our growth potential could be materially and adversely affected if we cannot employ, train, and retain qualified personnel at a competitive cost. Many of the products that we manufacture and assemble require manual processes in plant environments. We believe that our success depends upon our ability to attract, employ, train, and retain qualified personnel with the ability to design, manufacture, and assemble these products. In addition, our ability to expand our
13
operations depends in part on our ability to increase our skilled labor force as the housing market continues to recover in the United States. The COVID-19 pandemic has put significant pressure on our ability to employ, train, and retain qualified personnel at a competitive cost. Further, a significant increase in the wages paid by competing employers could result in a reduction of our qualified labor force, increases in the wage rates that we must pay, or both. In addition, we believe that our success depends in part on our ability to quickly and effectively train additional workforce to handle the increased volume and production while minimizing labor inefficiencies and maintaining product quality in a housing market recovery. If either of these events were to occur, our cost structure could increase, our margins could decrease, and any growth potential could be impaired.
Our failure to maintain acceptable quality standards could result in significant unexpected costs. Any failure to maintain acceptable quality standards could require us to recall or redesign such products, or pay substantial damages, any of which would result in significant unexpected costs. We may also have difficulty controlling the quality of products or components sourced from other manufacturers, so we are exposed to risks relating to the quality of such products and to limitations on our recourse against such suppliers. Further, any claim or product recall could result in adverse publicity against us, which could decrease our credibility, harm our reputation, adversely affect our sales, or increase our costs. Defects in our products could also result in decreased orders or sales to our customers, which could have a material adverse effect on our business, financial condition or results of operations.
Natural disasters could have a material adverse effect on our business, financial condition, or results of operations. Many of our facilities are located in regions that are vulnerable to natural disasters and other risks, such as earthquakes, fires, floods, tropical storms, hurricanes, and snow and ice, which at times have disrupted the local economy and posed physical risks to our property. In addition, the continued threat of terrorism and heightened security and military action in response to this threat, or any future acts of terrorism, may cause further disruptions to the economies of the United States and other countries. Our redundant, multiple site capacity may not be sufficient in the event of a natural disaster, terrorist act or other catastrophic event. Such disruptions could, among other things, disrupt our manufacturing or distribution facilities and result in delays or cancellations of customer orders for our products, which in turn could have a material adverse effect on our business, financial condition and results of operations. Further, if a natural disaster occurs in a region from which we derive a significant portion of our revenue, end-user customers in that region may delay or forego purchases of our products, which may materially and adversely impact our operating results for a particular period.
Item 1B. UNRESOLVED STAFF COMMENTS
None.
Item 2. PROPERTIES
We own our corporate office located in Winchester, Virginia. In addition, we lease eight manufacturing facilities, one manufacturing facility/service center, and one distribution center in the United States and Mexico and own eight manufacturing facilities located primarily in the eastern and southern United States. We also lease seven primary service centers, ten satellite service centers, and four additional offices located throughout the United States that support the sale and distribution of products to each market channel. We consider our properties suitable for our business and adequate for our needs and believe that, if necessary, we could find additional and/or replacement facilities to lease without suffering a material adverse effect on our business.
Item 3. LEGAL PROCEEDINGS
The Company is involved in suits and claims in the normal course of business, including, without limitation, product liability and general liability claims and claims pending before the Equal Employment Opportunity Commission. On at least a quarterly basis, the Company consults with its legal counsel to ascertain the reasonable likelihood that such claims may result in a loss. As required by ASC Topic 450, "Contingencies" ("ASC 450"), the Company categorizes the various suits and claims into three categories according to their likelihood for resulting in potential loss: those that are probable, those that are reasonably possible, and those that are deemed to be remote. The Company accounts for these loss contingencies in accordance with ASC 450. Where losses are deemed to be probable and estimable, accruals are made. Where losses are deemed to be reasonably possible, a range of loss estimate is determined and considered for disclosure. In determining these loss range estimates, the Company considers known values of similar claims and consults with independent counsel.
The Company believes that the aggregate range of estimated loss stemming from the various suits and asserted and unasserted claims which were deemed to be either probable or reasonably possible was not material as of April 30, 2022.
14
Item 4. MINE SAFETY DISCLOSURES
None.
EXECUTIVE OFFICERS OF THE REGISTRANT
Executive officers of the Company are elected by the Board of Directors and generally hold office until the next annual election of officers. There are no family relationships between any executive officer and any other officer or director of the Company or any arrangement or understanding between any executive officer and any other person pursuant to which such officer was elected. The executive officers of the Company are as follows:
| Name | Age | Position(s) Held During Past Five Years | |||||||||
| M. Scott Culbreth | 51 | Company President and Chief Executive Officer from July 2020 to present; Company Senior Vice President and Chief Financial Officer from February 2014 to July 2020. | |||||||||
| Paul Joachimczyk | 50 | Company Vice President and Chief Financial Officer from July 2020 to present; Vice President, Financial Planning and Analysis, from February 2019 to July 2020; Vice President of Finance and Corporate Controller at TopBuild Corp. from October 2016 to June 2018; CFO - Functional Transformation at Stanley Black & Decker, Inc. from May 2014 to July 2016. | |||||||||
| Robert J. Adams, Jr. | 56 | Company Senior Vice President, Manufacturing and Technical Operations from August 2015 to present; Company Vice President of Value Stream Operations from September 2012 to August 2015; Company Vice President of Manufacturing and Engineering from April 2012 to September 2012. | |||||||||
| Teresa M. May | 57 | Company Senior Vice President and Chief Marketing Officer from April 2020 to present; Senior Vice President and Chief Marketing Officer of Asurion from May 2018 to April 2020; Vice President of Owens Corning from March 2012 to March 2018. | |||||||||
PART II
Item 5. MARKET FOR REGISTRANT'S COMMON EQUITY, RELATED STOCKHOLDER MATTERS AND ISSUER PURCHASES OF EQUITY SECURITIES
Market Information
American Woodmark Corporation common stock is listed on The NASDAQ Global Select Market under the "AMWD" symbol.
As of June 17, 2022 there were approximately 18,200 total shareholders of the Company's common stock, including 6,200 shareholders of record and 12,000 beneficial owners whose shares are held in "street" name by securities broker-dealers or other nominees. The Company's shareholders also include approximately 58% of the Company's employees who are eligible to participate in the American Woodmark Corporation Retirement Savings Plan. The Company does not currently pay cash dividends and has no current intention to do so in the near future. The determination as to the payment of future dividends will be made by the Board of Directors (the "Board") from time to time and will depend on the Company's then current financial condition, capital requirements, and results of operations, as well as any other factors then deemed relevant by the Board, and will be subject to applicable restrictions in the credit agreement governing the Company's credit facility
Stock Performance Graph
The performance graph shown below compares the percentage change in the cumulative total shareholder return on our common stock against the cumulative total return of the Russell 2000 Index and Standard & Poor's Household Durables Index for the period from April 30, 2017 through April 30, 2022. The graph assumes an initial investment of $100 and the reinvestment of dividends. The graph is based on historical data and is not intended to be a forecast or indication of future performance of American Woodmark common stock.
15
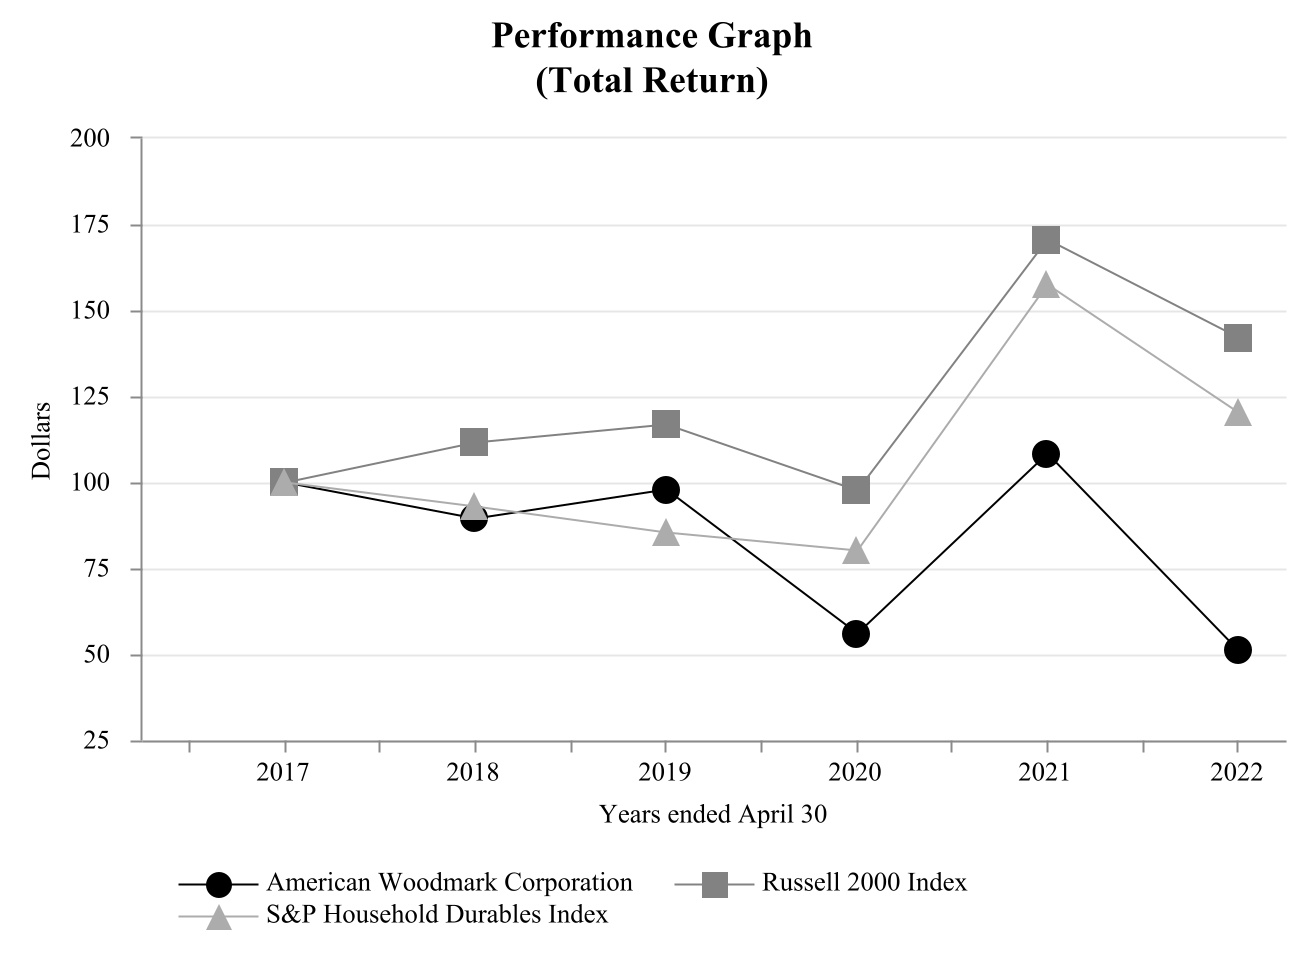
| 2017 | 2018 | 2019 | 2020 | 2021 | 2022 | |||||||||||||||||||||||||||||||||
| American Woodmark Corporation | $100.00 | $89.40 | $97.90 | $55.90 | $108.20 | $51.00 | ||||||||||||||||||||||||||||||||
| Russell 2000 Index | $100.00 | $111.50 | $116.70 | $97.60 | $170.60 | $141.90 | ||||||||||||||||||||||||||||||||
| S&P Household Durables Index | $100.00 | $92.80 | $85.30 | $80.10 | $157.50 | $120.10 | ||||||||||||||||||||||||||||||||
The graph and related information above are not deemed to be "filed" with the Securities and Exchange ("SEC") for purposes of Section 18 of the Securities Exchange Act of 1934, as amended, or incorporated by reference into any future filing made by us with the SEC, except to the extent that we specifically incorporate it by reference into any such filing.
Item 6. [Reserved.]
16
Item 7. MANAGEMENT'S DISCUSSION AND ANALYSIS OF FINANCIAL CONDITION AND RESULTS OF OPERATIONS
Results of Operations
The following table sets forth certain income and expense items as a percentage of net sales:
| PERCENTAGE OF NET SALES | |||||||||||||||||
| Fiscal Years Ended April 30 | |||||||||||||||||
| 2022 | 2021 | 2020 | |||||||||||||||
| Net sales | 100.0 | % | 100.0 | % | 100.0 | % | |||||||||||
| Cost of sales and distribution | 87.8 | 81.5 | 80.2 | ||||||||||||||
| Gross profit | 12.2 | 18.5 | 19.8 | ||||||||||||||
| Selling and marketing expenses | 5.0 | 5.1 | 5.0 | ||||||||||||||
| General and administrative expenses | 5.3 | 6.5 | 6.9 | ||||||||||||||
| Restructuring charges, net | — | 0.3 | — | ||||||||||||||
| Operating income | 1.9 | 6.6 | 7.9 | ||||||||||||||
| Pension settlement, net | 3.7 | — | — | ||||||||||||||
| Interest expense/other (income) expense, net | 0.5 | 2.0 | 1.9 | ||||||||||||||
| Income before income taxes | (2.3) | 4.6 | 6.0 | ||||||||||||||
| Income tax expense | (0.7) | 1.1 | 1.5 | ||||||||||||||
| Net income | (1.6) | 3.5 | 4.5 | ||||||||||||||
The following discussion should be read in conjunction with the Consolidated Financial Statements and the related notes contained elsewhere in this report.
Forward-Looking Statements
This annual report contains statements concerning the Company's expectations, plans, objectives, future financial performance, and other statements that are not historical facts. These statements may be "forward-looking statements" within the meaning of the Private Securities Litigation Reform Act of 1995. In most cases, the reader can identify forward-looking statements by words such as "anticipate," "estimate," "forecast," "expect," "believe," "should," "could," "would," "plan," "may," "intend," "estimate," "prospect," "goal," "will," "predict," "potential," or other similar words. Forward-looking statements contained in this report, including elsewhere in "Management's Discussion and Analysis of Financial Condition and Results of Operations," are based on current expectations and our actual results may differ materially from those projected in any forward-looking statements. In addition, the Company participates in an industry that is subject to rapidly changing conditions and there are numerous factors that could cause the Company to experience a decline in sales and/or earnings or deterioration in financial condition. Factors that could cause actual results to differ materially from those in forward-looking statements made in this report include but are not limited to:
•the loss of or a reduction in business from one or more of our key customers;
•negative developments in the macro-economic factors that impact our performance such as the U.S. housing market, general economy, unemployment rates, and consumer sentiment and the impact of such developments on our and our customers' business, operations, and access to financing;
•an inability to obtain raw materials in a timely manner or fluctuations in raw material, transportation, and energy costs due to inflation;
•a failure to attract and retain certain members of management or other key employees or other negative labor developments, including increases in the cost of labor;competition from other manufacturers and the impact of such competition on pricing and promotional levels;
•an inability to develop new products or respond to changing consumer preferences and purchasing practices;
•increased buying power of large customers and the impact on our ability to maintain or raise prices;
•a failure to effectively manage manufacturing operations, alignment, and capacity or an inability to maintain the quality of our products;
•the impairment of goodwill, other intangible assets, or our long-lived assets;
17
•information systems interruptions or intrusions or the unauthorized release of confidential information concerning customers, employees, or other third parties;
•the cost of compliance with, or liabilities related to, environmental or other governmental regulations or changes in governmental or industry regulatory standards, especially with respect to health and safety and the environment;
•risks associated with the implementation of our growth strategy;
•risks related to sourcing and selling products internationally and doing business globally, including the imposition of tariffs or duties on those products;
•unexpected costs resulting from a failure to maintain acceptable quality standards;
•changes in tax laws or the interpretations of existing tax laws;
•the impact of COVID-19 on our business, the global and U.S. economy, and our employees, customers, and suppliers;
•the occurrence of significant natural disasters, including earthquakes, fires, floods, hurricanes, or tropical storms;
•the unavailability of adequate capital for our business to grow and compete; and
•limitations on operating our business as a result of covenant restrictions under our indebtedness, our ability to pay amounts due under our credit facilities and our other indebtedness, and interest rate increases.
Additional information concerning the factors that could cause actual results to differ materially from those in forward-looking statements is contained in this annual report, including elsewhere in "Management's Discussion and Analysis of Financial Condition and Results of Operations" and under Item 1A. "Risk Factors," and Item 7A. "Quantitative and Qualitative Disclosures about Market Risk." While the Company believes that these risks are manageable and will not adversely impact the long-term performance of the Company, these risks could, under certain circumstances, have a material adverse impact on its operating results and financial condition.
Any forward-looking statement that the Company makes speaks only as of the date of this annual report. The Company undertakes no obligation to publicly update or revise any forward-looking statements or cautionary factors, as a result of new information, future events or otherwise, except as required by law.
Overview
American Woodmark Corporation manufactures and distributes kitchen, bath and home organization products for the remodeling and new home construction markets. Its products are sold on a national basis directly to home centers and builders and through a network of independent dealers and distributors. At April 30, 2022, the Company operated 17 manufacturing facilities in the United States and Mexico and eight primary service centers and one distribution center located throughout the United States.
Financial Overview
A number of general market factors impacted the Company's business in fiscal 2022, including:
•The unemployment rate decreased by 41% compared to April 2021, to 3.6% as of April 2022 according to data provided by the U.S. Department of Labor;
•Increase in single family housing starts during the Company's fiscal 2022 of 13%, as compared to the Company's fiscal 2021, according to the U.S. Department of Commerce;
•Mortgage interest rates increased with a 30-year fixed mortgage rate of 5.1% in April 2022, an increase of approximately 204 basis points compared to April 2021;
•The median price of existing homes sold in the U.S. rose by 16.4% during the Company's fiscal 2022, according to data provided by the National Association of Realtors;
•Consumer sentiment, as reported by the University of Michigan, averaged 26.2% lower during the Company's fiscal 2022 than in its prior fiscal year; and
•Cabinet sales, as reported by members of the Kitchen Cabinet Manufacturers Association (KCMA), increased by 14.4% during fiscal 2022 versus the prior fiscal year.
The Company's largest remodeling customers and competitors continued to utilize sales promotions in the Company's product category during fiscal 2022. The Company strives to maintain its promotional levels in line with market activity, with a goal of
18
remaining competitive. The Company experienced lower promotional levels during fiscal 2022 than those experienced in its prior fiscal year. Sales in the remodel channel increased 5.2% during the fiscal year.
Sales in the new construction channel increased 8.6% during fiscal 2022 due to a rise in new housing starts and an increase in sales in the opening price point cabinets in our Origins by Timberlake brand.
The Company increased its net sales by 6.5% during fiscal 2022, which was driven by growth in the home center, builder and independent dealers and distributors channels.
Gross margin for fiscal 2022 was 12.2%, a decrease from 18.5% in fiscal 2021. The decrease in gross margin was primarily due to higher material and logistics costs, supply chain disruptions, and increases related to wage and retention programs. This was partially offset by the increase in sales creating leverage of our fixed expenses in our operating platforms.
The Company incurred a net loss of $29.7 million in fiscal 2022, net income of $61.2 million in fiscal 2021, and net income of $73.7 in fiscal 2020. The net loss in fiscal 2022 is primarily due to onetime pension settlement charges of $68.5 million related to the termination of the Company's pension plan.
The Company regularly considers the need for a valuation allowance against its deferred tax assets. The Company has been profitable for the past 9 years. As of April 30, 2022, the Company had total deferred tax assets of $40.8 million net of valuation allowance, down from $45.2 million of deferred tax assets net of valuation allowance at April 30, 2021. Deferred tax assets are reduced by a valuation allowance when, after considering all positive and negative evidence, it is determined that it is more likely than not that some portion, or all, of the deferred tax asset will not be realized. The Company has recorded a valuation allowance related to deferred tax assets for certain state investment tax credit ("ITC") carryforwards. These credits expire in various years beginning in fiscal 2028. The Company believes based on positive evidence of the housing industry improvement along with 9 consecutive years of profitability that the Company will more likely than not realize all other remaining deferred tax assets.
The Company also regularly assesses its long-lived assets to determine if any impairment has occurred. The Company has concluded that none of its long-lived assets were impaired as of April 30, 2022.
Results of Operations
| FISCAL YEARS ENDED APRIL 30 | |||||||||||||||||||||||||||||
| (Dollars in thousands) | 2022 | 2021 | 2020 | 2022 vs. 2021 PERCENT CHANGE | 2021 vs. 2020 PERCENT CHANGE | ||||||||||||||||||||||||
| Net sales | $ | 1,857,186 | $ | 1,744,014 | $ | 1,650,333 | 6.5 | % | 5.7 | % | |||||||||||||||||||
| Gross profit | 226,444 | 322,118 | 326,562 | (29.7) | % | (1.4) | % | ||||||||||||||||||||||
| Selling and marketing expenses | 92,555 | 89,011 | 83,092 | 4.0 | % | 7.1 | % | ||||||||||||||||||||||
| General and administrative expenses | 97,547 | 112,521 | 113,353 | (13.3) | % | (0.7) | % | ||||||||||||||||||||||
| Interest expense, net | 10,189 | 23,128 | 29,027 | (55.9) | % | (20.3) | % | ||||||||||||||||||||||
Net Sales
Net sales for fiscal 2022 increased 6.5% to $1,857.2 million from the prior fiscal year. The Company experienced growth in the home center, builder and independent dealers and distributors channels.
Net sales for fiscal 2021 increased 5.7% to $1,744.0 million from the prior fiscal year. The Company experienced growth in the home center, builder and independent dealers and distributors channels.
Gross Profit
Gross profit as a percentage of sales decreased to 12.2% in fiscal 2022 as compared with 18.5% in fiscal 2021. The decrease in gross profit margin was primarily due to higher material and logistics costs, and increases related to wage and retention programs. This was partially offset by the increase in sales creating leverage of our fixed expenses in our operating platforms.
19
Gross profit as a percentage of sales decreased to 18.5% in fiscal 2021 as compared with 19.8% in fiscal 2020. The decrease in gross profit margin was primarily due to higher material and logistics costs, investments made to establish our distribution center in Texas, and increases related to wage and retention programs. This was partially offset by the increase in sales creating leverage of our fixed expenses in our operating platforms.
Selling and Marketing Expenses
Selling and marketing costs increased by $3.5 million or 4.0% during fiscal 2022 versus the prior year. Selling and marketing expenses in fiscal 2022 were 5.0% of net sales, compared with 5.1% of net sales in fiscal 2021
Selling and marketing expenses in fiscal 2021 and fiscal 2020 were both 5.1% of net sales. Selling and marketing costs increased by $5.9 million or 7% during fiscal 2021 versus the prior year.
General and Administrative Expenses
General and administrative expenses decreased by $15.0 million or 13.3% during fiscal 2022 versus the prior fiscal year. General and administrative costs decreased to 5.3% of net sales in fiscal 2022 compared with 6.5% of net sales in fiscal 2021. The decrease in general and administrative expenses was primarily due to controlled spending and reduced incentive costs.
General and administrative expenses decreased by $0.8 million or 0.7% during fiscal 2021 versus the prior fiscal year. General and administrative costs decreased to 6.5% of net sales in fiscal 2021 compared with 6.9% of net sales in fiscal 2020.
Effective Income Tax Rates
The Company generated pre-tax loss of $43.0 million during fiscal 2022. The Company's effective tax rate increased from 24.1% in fiscal 2021 to 30.8% in fiscal 2022 primarily due to the pre-tax loss and benefit from higher federal income tax credits. The Company's effective tax rate decreased from 25.5% in fiscal 2020 to 24.1% in fiscal 2021. The lower effective tax rate was primarily due to the benefit from federal income tax credits.
Non-GAAP Financial Measures
We have reported our financial results in accordance with U.S. generally accepted accounting principles ("GAAP"). In addition, we have presented in this report the non-GAAP measures described below.
A reconciliation of these non-GAAP financial measures to the most directly comparable financial measures calculated and presented in accordance with GAAP is set forth below.
Management believes these non-GAAP financial measures provide an additional means of analyzing the current period's results against the corresponding prior period's results. However, these non-GAAP financial measures should be viewed in addition to, and not as a substitute for, the Company's reported results prepared in accordance with GAAP. Our non-GAAP financial measures are not meant to be considered in isolation or as a substitute for comparable GAAP measures and should be read only in conjunction with our consolidated financial statements prepared in accordance with GAAP.
EBITDA, Adjusted EBITDA and Adjusted EBITDA margin
We use EBITDA, Adjusted EBITDA, and Adjusted EBITDA margin in evaluating the performance of our business, and we use each in the preparation of our annual operating budgets and as indicators of business performance and profitability. We believe EBITDA, Adjusted EBITDA, and Adjusted EBITDA margin allow us to readily view operating trends, perform analytical comparisons, and identify strategies to improve operating performance. Additionally, Adjusted EBITDA is a key measurement used in our Term Loans to determine interest rates and financial covenant compliance.
We define EBITDA as net income (loss) adjusted to exclude (1) income tax expense (benefit), (2) interest expense, net, (3) depreciation and amortization expense, and (4) amortization of customer relationship intangibles and trademarks. We define Adjusted EBITDA as EBITDA adjusted to exclude (1) expenses related to the RSI Acquisition and the subsequent restructuring charges that the Company incurred related to the acquisition, (2) non-recurring restructuring charges, (3) net gain/loss on debt forgiveness and modification, (4) stock-based compensation expense, (5) gain/loss on asset disposals, (6) change in fair value of foreign exchange forward contracts, and (7) pension settlement charges. We believe Adjusted EBITDA, when presented in conjunction with comparable GAAP measures, is useful for investors because management uses Adjusted EBITDA in evaluating the performance of our business.
20
We define Adjusted EBITDA margin as Adjusted EBITDA as a percentage of net sales.
Adjusted EPS per diluted share
We use Adjusted EPS per diluted share in evaluating the performance of our business and profitability. Management believes that this measure provides useful information to investors by offering additional ways of viewing the Company's results by providing an indication of performance and profitability excluding the impact of unusual and/or non-cash items. We define Adjusted EPS per diluted share as diluted earnings per share excluding the per share impact of (1) expenses related to the RSI Acquisition and the subsequent restructuring charges that the Company incurred related to the acquisition, (2) non-recurring restructuring charges, (3) the amortization of customer relationship intangibles and trademarks, (4) net gain/loss on debt forgiveness and modification, (5) pension settlement charges, and (6) the tax benefit of RSI Acquisition expenses and subsequent restructuring charges, the net gain/loss on debt forgiveness and modification, and the amortization of customer relationship intangibles and trademarks. The amortization of intangible assets is driven by the RSI Acquisition and will recur in future periods. Management has determined that excluding amortization of intangible assets from our definition of Adjusted EPS per diluted share will better help it evaluate the performance of our business and profitability and we have also received similar feedback from some of our investors regarding the same.
Free cash flow
To better understand trends in our business, we believe that it is helpful to subtract amounts for capital expenditures consisting of cash payments for property, plant and equipment and cash payments for investments in displays from cash flows from continuing operations which is how we define free cash flow. Management believes this measure gives investors an additional perspective on cash flow from operating activities in excess of amounts required for reinvestment. It also provides a measure of our ability to repay our debt obligations.
A reconciliation of these non-GAAP financial measures and the most directly comparable measures calculated and presented in accordance with GAAP are set forth in the following tables:
21
| Reconciliation of EBITDA, Adjusted EBITDA and Adjusted EBITDA margin | ||||||||||||||||||||
| FISCAL YEARS ENDED APRIL 30, | ||||||||||||||||||||
| (Dollars in thousands) | 2022 | 2021 | 2020 | |||||||||||||||||
| Net income (loss) (GAAP) | $ | (29,722) | $ | 61,193 | $ | 73,653 | ||||||||||||||
| Add back: | ||||||||||||||||||||
| Income tax expense (benefit) | (13,257) | 19,500 | 25,275 | |||||||||||||||||
| Interest expense, net | 10,189 | 23,128 | 29,027 | |||||||||||||||||
| Depreciation and amortization expense | 50,939 | 51,100 | 49,513 | |||||||||||||||||
| Amortization of customer relationship intangibles and trademarks | 45,667 | 47,889 | 49,000 | |||||||||||||||||
| EBITDA (Non-GAAP) | $ | 63,816 | $ | 202,810 | $ | 226,468 | ||||||||||||||
| Add back: | ||||||||||||||||||||
| Acquisition and restructuring related expenses (1) | 80 | 174 | 221 | |||||||||||||||||
| Non-recurring restructuring charges, net (2) | 183 | 5,848 | — | |||||||||||||||||
| Pension settlement, net | 68,473 | — | — | |||||||||||||||||
| Change in fair value of foreign exchange forward contracts (3) | — | (1,102) | 1,102 | |||||||||||||||||
| Net loss on debt forgiveness and modification (4) | — | 13,792 | — | |||||||||||||||||
| Stock-based compensation expense | 4,708 | 4,598 | 3,989 | |||||||||||||||||
| Loss on asset disposal | 697 | 384 | 2,629 | |||||||||||||||||
| Adjusted EBITDA (Non-GAAP) | $ | 137,957 | $ | 226,504 | $ | 234,409 | ||||||||||||||
| Net Sales | $ | 1,857,186 | $ | 1,744,014 | $ | 1,650,333 | ||||||||||||||
| Net income margin (GAAP) | (1.6) | % | 3.5 | % | 4.5 | % | ||||||||||||||
| Adjusted EBITDA margin (Non-GAAP) | 7.4 | % | 13.0 | % | 14.2 | % | ||||||||||||||
(1) Acquisition and restructuring related expenses are comprised of expenses related to the RSI Acquisition and the subsequent restructuring charges that the Company incurred related to the acquisition.
(2) Non-recurring restructuring charges are comprised of expenses incurred related to the permanent layoffs due to COVID-19 and the closure of the manufacturing plant in Humboldt, Tennessee. Fiscal year 2021 includes accelerated depreciation expense of $1.3 million and gain on asset disposal of $2.2 million related to Humboldt.
(3) In the normal course of business the Company is subject to risk from adverse fluctuations in foreign exchange rates. The Company manages these risks through the use of foreign exchange forward contracts. The changes in the fair value of the forward contracts are recorded in other (income) expense, net in the operating results.
(4) The Company recognized net loss on debt modification totaling $13.8 million for fiscal year 2021 related to the restructuring of its debt.
A reconciliation of EBITDA, Adjusted EBITDA and Adjusted EBITDA margin as projected for fiscal 2023 is not provided because we do not forecast net income as we cannot, without unreasonable effort, estimate or predict with certainty various components of net income.
22
| Adjusted EPS per diluted share | ||||||||||||||||||||
| FISCAL YEARS ENDED APRIL 30, | ||||||||||||||||||||
| (Dollars in thousands, except share and per share data) | 2022 | 2021 | 2020 | |||||||||||||||||
| Net income (loss) (GAAP) | $ | (29,722) | $ | 61,193 | $ | 73,653 | ||||||||||||||
| Add back: | ||||||||||||||||||||
| Acquisition and restructuring related expenses | 80 | 174 | 221 | |||||||||||||||||
| Non-recurring restructuring charges, net | 183 | 5,848 | — | |||||||||||||||||
| Pension settlement, net | 68,473 | — | — | |||||||||||||||||
| Amortization of customer relationship intangibles and trademarks | 45,667 | 47,889 | 49,000 | |||||||||||||||||
| Net loss on debt forgiveness and modification | — | 13,792 | — | |||||||||||||||||
| Tax benefit of add backs | (29,859) | (17,467) | (12,305) | |||||||||||||||||
| Adjusted net income (Non-GAAP) | $ | 54,822 | $ | 111,429 | $ | 110,569 | ||||||||||||||
| Weighted average diluted shares (GAAP) | 16,592,358 | 17,036,730 | 16,952,480 | |||||||||||||||||
| Add back: potentially anti-dilutive shares (1) | 48,379 | — | — | |||||||||||||||||
| Weighted average diluted shares (Non-GAAP) | 16,640,737 | 17,036,730 | 16,952,480 | |||||||||||||||||
| EPS per diluted share (GAAP) | $ | (1.79) | $ | 3.59 | $ | 4.34 | ||||||||||||||
| Adjusted EPS per diluted share (Non-GAAP) | $ | 3.29 | $ | 6.54 | $ | 6.52 | ||||||||||||||
(1) Potentially dilutive securities for the twelve-month period ended April 30, 2022 have not been considered in the GAAP calculation of net loss per shares as effect would be anti-dilutive.
| Free cash flow | ||||||||||||||||||||
| FISCAL YEARS ENDED APRIL 30, | ||||||||||||||||||||
| (Dollars in thousands) | 2022 | 2021 | 2020 | |||||||||||||||||
| Cash provided by operating activities | $ | 24,445 | $ | 151,763 | $ | 177,542 | ||||||||||||||
| Less: Capital expenditures (1) | 51,582 | 46,318 | 40,739 | |||||||||||||||||
| Free cash flow | $ | (27,137) | $ | 105,445 | $ | 136,803 | ||||||||||||||
(1) Capital expenditures consist of cash payments for property, plant and equipment and cash payments for investments in displays.
Outlook for Fiscal 2023
We expect mid-teens to high-teens growth rate in net sales for fiscal 2023 versus fiscal 2022. The growth rate is highly dependent upon overall industry, economic growth trends, material constraints, labor impacts, interest rates and consumer behaviors. Our previously announced price increases will continue to take effect at various stages throughout fiscal 2023, with pricing being realized first in our new construction channel, followed by dealer distributor and then home centers.
Our outlook for adjusted EBITDA margin percent for fiscal 2023 will range from high single digit to low double-digit EBITDA. Inflationary pressures for raw materials, fuel and logistics will continue at least through the first half of fiscal 2023, and we expect margins will expand sequentially throughout the second quarter of fiscal 2023 through the fourth quarter of fiscal 2023 as our price realization grows and efficiencies with manufacturing operations improve.
We will continue our investment back into the business by increasing our capital investment rate to a range of 3.0 to 3.5% of net sales. These investments will range from the continuation of our ERP journey to get on the cloud, digital investments in our customer experience and reinvesting in our manufacturing facilities to help reduce labor dependencies, improve quality and increase capacity. We are choosing to make these additional investments into our core business which will help improve sales and enhance our margins in the future.
23
Additional risks and uncertainties that could affect the Company's results of operations and financial condition are discussed elsewhere in this annual report, including under "Forward-Looking Statements," and elsewhere in "Management's Discussion and Analysis of Financial Condition and Results of Operations," as well as under Item 1A. "Risk Factors" and Item 7A. "Quantitative and Qualitative Disclosures about Market Risk."
Liquidity and Capital Resources
The Company's cash and cash equivalents totaled $22.3 million at April 30, 2022, representing a $68.7 million decrease from its April 30, 2021 levels. At April 30, 2022, total long-term debt (including current maturities) was $508.9 million, a decrease of $12.8 million from the balance at April 30, 2021. The Company's ratio of long-term debt to total capital was 39.6% at April 30, 2022, compared with 40.4% at April 30, 2021. The Company's main source of liquidity is its cash and cash equivalents on hand and cash generated from its operating activities, which we expect to continue into fiscal 2023. Approximately $237.0 million was available under this facility as of April 30, 2022. See Note F — Loans Payable and Long-Term Debt for further discussion on our indebtedness.
On April 22, 2021, the Company amended and restated the Prior Credit Agreement. The amended and restated credit agreement (the "A&R Credit Agreement") provides for a $500 million revolving loan facility with a $50 million sub-facility for the issuance of letters of credit (the "Revolving Facility") and a $250 million term loan facility (the "Term Loan Facility"). Also on April 22, 2021, the Company borrowed the entire $250 million under the Term Loan Facility and approximately $264 million under the Revolving Facility to fund, in part, the repayment in full of the amounts then outstanding under the Prior Credit Agreement and the redemption of the Senior Notes. The Company is required to repay the Term Loan Facility in specified quarterly installments. The Revolving Facility and Term Loan Facility mature on April 22, 2026.
The A&R Credit Agreement includes certain financial covenants that require the Company to maintain (i) a "Consolidated Interest Coverage Ratio" of no less than 2.00 to 1.00 and (ii) a "Total Net Leverage Ratio" of no greater than 4.00 to 1.00, subject, in each case, to certain limited exceptions.
The A&R Credit Agreement includes certain additional covenants, including negative covenants that restrict the ability of the Company and certain of its subsidiaries to incur additional indebtedness, create additional liens on its assets, make certain investments, dispose of its assets or engage in a merger or other similar transaction or engage in transactions with affiliates, subject, in each case, to the various exceptions and conditions described in the A&R Credit Agreement. The negative covenants further restrict the ability of the Company and certain of its subsidiaries to make certain restricted payments, including, in the case of the Company, the payment of dividends and the repurchase of common stock, in certain limited circumstances. See Note F — Loans Payable and Long-Term Debt for a discussion of interest rates under the new A&R Credit Agreement and our compliance with the covenants in the credit agreement.
As of April 30, 2022 and 2021, the Company had no off-balance sheet arrangements.
OPERATING ACTIVITIES
Cash provided by operating activities in fiscal 2022 was $24.4 million, compared with $151.8 million in fiscal 2021. The decrease in the Company's cash from operating activities was driven primarily by a decrease in net income and decreased cash flows from inventories, accrued marketing expenses, other accrued expenses, and accounts payable, which were partially offset by an increase in cash flows from customer receivables.
Cash provided by operating activities in fiscal 2021 was $151.8 million, compared with $177.5 million in fiscal 2020. The decrease in the Company's cash from operating activities was driven primarily by a decrease in net income and decreased cash flows from customer receivables and inventories, which were partially offset by an increase in cash flows from accounts payable and accrued marketing expenses.
The Company made no contributions to its pension plan in fiscal 2022, 2021, and made contributions of $0.5 million to its pension plans during fiscal 2020.The Company recognized a pension settlement charge of $68.3 million in fiscal 2022.
INVESTING ACTIVITIES
The Company's investing activities primarily consist of capital expenditures and investments in promotional displays. Net cash used by investing activities in fiscal 2022 was $51.6 million, compared with $42.4 million in fiscal 2021 and $38.9 million in fiscal 2020. Investments in property, plant and equipment for fiscal 2022 were $44.1 million, compared with $35.7 million in
24
fiscal 2021 and $31.7 million in fiscal 2020. Investments in promotional displays were $7.5 million in fiscal 2022, compared with $10.6 million in fiscal 2021 and $9.1 million in fiscal 2020.
FINANCING ACTIVITIES
The Company realized a net outflow of $41.6 million from financing activities in fiscal 2022 compared with a net outflow of $115.3 million in fiscal 2021, and a net outflow of $99.2 million in fiscal 2020. During fiscal 2022, $15.5 million, net, was used to repay long-term debt, compared with approximately $82.5 million in fiscal 2021 and $98.5 million in fiscal 2020.
On August 22, 2019, the Board authorized a stock repurchase program of up to $50 million of the Company's common shares. On May 25, 2021, the Board authorized a stock repurchase program of up to $100 million of the Company's outstanding common shares. In conjunction with this authorization the Board cancelled the remaining portion of the $50 million existing authorization, of which the Company had repurchased $20 million in the fourth quarter of fiscal 2021. The Company repurchased $25.0 million during fiscal 2022 and $20.0 million during fiscal 2021. The Company did not repurchase any of its shares during the fiscal year ended April 30, 2020.
Cash flow from operations combined with accumulated cash and cash equivalents on hand are expected to be more than sufficient to support forecasted working capital requirements, service existing debt obligations, and fund capital expenditures for fiscal 2023.
Future minimum annual commitments for contractual obligations under term loans, the Revolving Facility, capital and operating lease obligations, and other long-term debt amount to $27.6 million in fiscal 2023, $77.6 million in fiscal 2024-25, $505.3 million in fiscal 2026-27, and $30.5 million in fiscal 2028 and thereafter.
SEASONALITY
Our business has been subject to seasonal influences, with higher sales typically realized in our first and fourth fiscal quarters, however sales were down in the fourth quarter of fiscal 2020 and the first quarter of fiscal 2021 due to the COVID-19 pandemic. General economic forces and changes in our customer mix have reduced seasonal fluctuations in revenue over the past few years. The costs of the Company's products are subject to inflationary pressures and commodity price fluctuations. The Company has generally been able over time to recover the effects of inflation and commodity price fluctuations through sales price increases.
For additional discussion of risks that could affect the Company and its business, see "Forward-Looking Statements" above, as well as Item 1A. "Risk Factors" and Item 7A. "Quantitative and Qualitative Disclosures About Market Risk."
CRITICAL ACCOUNTING POLICIES AND ESTIMATES
Management has chosen accounting policies that are necessary to give reasonable assurance that the Company's operational results and financial position are accurately and fairly reported. The significant accounting policies of the Company are disclosed in Note A to the Consolidated Financial Statements included in this annual report. The following discussion addresses the accounting policies that management believes have the greatest potential impact on the presentation of the financial condition and operating results of the Company for the periods being reported and that require the most judgment.
Management regularly reviews these critical accounting policies and estimates with the Audit Committee of the Board.
Revenue Recognition. The Company utilizes signed sales agreements that provide for transfer of title to the customer at the time of shipment or upon delivery based on the contractual terms. The Company must estimate the amount of sales that have been transferred to third-party carriers but not delivered to customers as the carriers are not able to report real-time what has been delivered and thus there is a delay in reporting to the Company. The estimate is calculated using a lag factor determined by analyzing the actual difference between shipment date and delivery date of orders over the past 12 months. Revenue is recognized on those shipments which the Company believes have been delivered to the customer.
The Company recognizes revenue based on the invoice price less allowances for sales returns, cash discounts, and other deductions as required under GAAP. Collection is reasonably assured as determined through an analysis of accounts receivable data, including historical product returns and the evaluation of each customer's ability to pay. Allowances for sales returns are based on the historical relationship between shipments and returns. The Company believes that its historical experience is an accurate reflection of future returns.
25
Pensions. Prior to April 30, 2020, the Company had two non-contributory defined benefit pension plans covering many of the Company's employees hired prior to April 30, 2012. Effective April 30, 2012, the Company froze all future benefit accruals under the Company's hourly and salaried defined benefit pension plans. Effective April 30, 2020, these plans were merged into one plan. Effective December 31, 2020 the Plan was terminated in a standard termination and benefits were distributed on December 2, 2021.
Goodwill. Goodwill represents the excess of purchase price over the fair value of net assets acquired. The Company does not amortize goodwill but evaluates for impairment annually, or whenever events or changes in circumstances indicate that the carrying value may not be recoverable.
In accordance with the accounting standards, an entity has the option first to assess qualitative factors to determine whether events and circumstances indicate that it is more likely than not that goodwill is impaired. If after such assessment an entity concludes that the asset is not impaired, then the entity is not required to take further action. However, if an entity concludes otherwise, then it is required to determine the fair value of the asset using a quantitative impairment test, and if impaired, the associated assets must be written down to fair value. There were no impairment charges related to goodwill for the fiscal years 2022, 2021, and 2020..
The on-going COVID-19 pandemic, Russia's military actions in Ukraine, related global supply chain constraints, and higher raw material costs have created volatility, uncertainty and economic disruption for the Company, our customers and vendors, and the markets in which we do business. We have experienced production delays, disruptions in component availability, increased pricing both for labor and parts, lower levels of factory utilization and higher logistics, transportation, energy, and operational costs. Such business conditions are expected to continue into fiscal 2023. In addition, as of April 30, 2022, our stock price has declined to $46.85.
It is possible that, during the fiscal 2023 or beyond, business conditions could deteriorate from the current state, our current or prospective customers could materially postpone, reduce or even forgo purchases of our products and services to a greater extent than we currently anticipate, or our common stock price could fluctuate. Such fluctuation could be caused by uncertainty about the severity and length of the COVID-19 pandemic, and its impact on global activity.
A significant decline in our customers' spending that is greater than we anticipate or a shift in funding priorities may also have a negative effect on future orders, sales, income and cash flows and we might be required to perform a quantitative assessment during fiscal 2023 or beyond. If assumed net sales and cash flow projections are not achieved in future periods or our common stock price declines from its fiscal 2022 year end price, our goodwill could be at risk of failing the quantitative assessment and goodwill and intangibles could be impaired.
Intangible Assets. Intangible assets consist of customer relationship intangibles. The Company amortizes the cost of intangible assets over their estimated useful lives, six years, unless such lives are deemed indefinite. The Company reviews its intangible assets for impairment when events or changes in circumstances indicate that the carrying amount of an asset may not be recoverable. There were no impairment charges related to other intangible assets for the fiscal years 2022, 2021, and 2020.
RECENT ACCOUNTING PRONOUNCEMENTS
In December 2019, the FASB issued ASU No. 2019-12, "Income Taxes (Topic 740): Simplifying the Accounting for Income Taxes," which simplifies the accounting for income taxes by removing certain exceptions for recognizing deferred taxes for investments, performing intraperiod tax allocations and calculating income taxes in interim periods. The amendments also improve consistent application of and simplify GAAP for other areas of Topic 740 by clarifying and amending existing guidance. ASU 2019-12 became effective for the Company beginning May 1, 2021. The Company has reviewed the provisions of this new pronouncement and the adoption of this guidance did not have an impact on the Company's consolidated financial statements.
In March 2020, the FASB issued ASU No. 2020-04 "Reference Rate Reform (Topic 848): Facilitation of the Effects of Reference Rate Reform on Financial Reporting." These amendments provide temporary optional guidance to ease the potential burden in accounting for reference rate reform. The ASU provides optional expedients and exceptions for applying generally accepted accounting principles to contract modifications and hedging relationships, subject to meeting certain criteria, that reference LIBOR or another reference rate expected to be discontinued. It is intended to help stakeholders during the global market-wide reference rate transition period. The guidance is effective for all entities as of March 12, 2020 through December 31, 2022 and can be adopted as of any date from the beginning of an interim period that includes or is subsequent to March 12, 2020. The Company has identified loans and other financial instruments that are directly or indirectly influenced by LIBOR and does not expect the adoption of ASU 2020-04 to have a material impact on its consolidated financial statements.
26
Item 7A. QUANTITATIVE AND QUALITATIVE DISCLOSURES ABOUT MARKET RISK
The costs of the Company's products are subject to inflationary pressures and commodity price fluctuations. The Company has generally been able, over time, to recover the effects of inflation and commodity price fluctuations through sales price increases.
Our revolving credit facility, initial term loan facility and delayed draw term loan facility, include a variable interest rate component. As a result, we are subject to interest rate risk with respect to such floating-rate debt. A 100 basis point increase in the variable interest rate component of our borrowings as of April 30, 2022 would increase our annual interest expense by approximately $3.1 million.
In May 2021, we entered into interest rate swaps to hedge approximately $200 million of our variable interest rate debt. See Note J — Derivative Financial Instruments for further discussion.
The Company enters into foreign exchange forward contracts principally to offset currency fluctuations in transactions denominated in certain foreign currencies, thereby limiting our exposure to risk that would otherwise result from changes in exchange rates. The periods of the foreign exchange forward contracts correspond to the periods of the transactions denominated in foreign currencies.
The Company does not currently use commodity or similar financial instruments to manage its commodity price risks.
27
Item 8. FINANCIAL STATEMENTS AND SUPPLEMENTARY DATA
CONSOLIDATED BALANCE SHEETS
| APRIL 30 | |||||||||||
| (in thousands, except share and per share data) | 2022 | 2021 | |||||||||
| ASSETS | |||||||||||
| Current Assets | |||||||||||
| Cash and cash equivalents | $ | $ | |||||||||
| Customer receivables, net | |||||||||||
| Inventories | |||||||||||
| Prepaid expenses and other | |||||||||||
| Total Current Assets | |||||||||||
| Property, plant and equipment, net | |||||||||||
| Operating lease right-of-use assets | |||||||||||
| Customer relationships intangibles, net | |||||||||||
| Goodwill, net | |||||||||||
| Promotional displays, net | |||||||||||
| Deferred income taxes | |||||||||||
| Other assets | |||||||||||
| TOTAL ASSETS | $ | $ | |||||||||
| LIABILITIES AND SHAREHOLDERS' EQUITY | |||||||||||
| Current Liabilities | |||||||||||
| Accounts payable | $ | $ | |||||||||
| Current maturities of long-term debt | |||||||||||
| Short-term lease liability - operating | |||||||||||
| Accrued compensation and related expenses | |||||||||||
| Accrued marketing expenses | |||||||||||
| Other accrued expenses | |||||||||||
| Total Current Liabilities | |||||||||||
| Long-term debt, less current maturities | |||||||||||
| Deferred income taxes | |||||||||||
| Long-term lease liability - operating | |||||||||||
| Other long-term liabilities | |||||||||||
| Shareholders' Equity | |||||||||||
Preferred stock, $ | |||||||||||
Common stock, | |||||||||||
| Retained earnings | |||||||||||
| Accumulated other comprehensive income (loss) | ( | ||||||||||
| Total Shareholders' Equity | |||||||||||
| TOTAL LIABILITIES AND SHAREHOLDERS' EQUITY | $ | $ | |||||||||
See notes to consolidated financial statements.
28
CONSOLIDATED STATEMENTS OF OPERATIONS
| FISCAL YEARS ENDED APRIL 30 | |||||||||||||||||
| (in thousands, except per share data) | 2022 | 2021 | 2020 | ||||||||||||||
| Net sales | $ | $ | $ | ||||||||||||||
| Cost of sales and distribution | |||||||||||||||||
| Gross Profit | |||||||||||||||||
| Selling and marketing expenses | |||||||||||||||||
| General and administrative expenses | |||||||||||||||||
| Restructuring charges, net | ( | ||||||||||||||||
| Operating Income | |||||||||||||||||
| Interest expense, net | |||||||||||||||||
| Pension settlement, net | |||||||||||||||||
| Other expense, net | |||||||||||||||||
| Income (Loss) Before Income Taxes | ( | ||||||||||||||||
| Income tax expense (benefit) | ( | ||||||||||||||||
| Net Income (Loss) | $ | ( | $ | $ | |||||||||||||
| SHARE INFORMATION | |||||||||||||||||
| Earnings (loss) per share | |||||||||||||||||
| Basic | $ | ( | $ | $ | |||||||||||||
| Diluted | $ | ( | $ | $ | |||||||||||||
See notes to consolidated financial statements.
CONSOLIDATED STATEMENTS OF COMPREHENSIVE INCOME
| FISCAL YEARS ENDED APRIL 30 | |||||||||||||||||
| (in thousands) | 2022 | 2021 | 2020 | ||||||||||||||
| Net income (loss) | $ | ( | $ | $ | |||||||||||||
| Other comprehensive income (loss), net of tax: | |||||||||||||||||
Change in pension benefits, net of taxes of $ | ( | ( | |||||||||||||||
Change in cash flow hedges (swap), net of deferred taxes of $ | |||||||||||||||||
| Total Comprehensive Income | $ | $ | $ | ||||||||||||||
See notes to consolidated financial statements.
29
CONSOLIDATED STATEMENTS OF SHAREHOLDERS' EQUITY
| ACCUMULATED | |||||||||||||||||||||||||||||
| OTHER | TOTAL | ||||||||||||||||||||||||||||
| COMMON STOCK | RETAINED | COMPREHENSIVE | SHAREHOLDERS' | ||||||||||||||||||||||||||
| (in thousands, except share data) | SHARES | AMOUNT | EARNINGS | LOSS | EQUITY | ||||||||||||||||||||||||
| Balance, April 30, 2019 | $ | $ | $ | ( | $ | ||||||||||||||||||||||||
| Net income | — | — | — | ||||||||||||||||||||||||||
| Other comprehensive loss, net of tax | — | — | — | ( | ( | ||||||||||||||||||||||||
| Stock-based compensation | — | — | — | ||||||||||||||||||||||||||
| Exercise of stock-based compensation awards, net of amounts withheld for taxes | ( | — | — | ( | |||||||||||||||||||||||||
| Employee benefit plan contributions | — | — | |||||||||||||||||||||||||||
| Balance, April 30, 2020 | $ | $ | $ | ( | $ | ||||||||||||||||||||||||
| Net income | — | — | — | ||||||||||||||||||||||||||
| Other comprehensive loss, net of tax | — | — | — | ( | ( | ||||||||||||||||||||||||
| Stock-based compensation | — | — | — | ||||||||||||||||||||||||||
| Exercise of stock-based compensation awards, net of amounts withheld for taxes | ( | — | — | ( | |||||||||||||||||||||||||
| Stock repurchases | ( | ( | ( | — | ( | ||||||||||||||||||||||||
| Employee benefit plan contributions | — | — | |||||||||||||||||||||||||||
| Balance, April 30, 2021 | $ | $ | $ | ( | $ | ||||||||||||||||||||||||
| Net loss | — | — | ( | — | ( | ||||||||||||||||||||||||
| Other comprehensive income, net of tax | — | — | — | ||||||||||||||||||||||||||
| Stock-based compensation | — | — | — | ||||||||||||||||||||||||||
| Exercise of stock-based compensation awards, net of amounts withheld for taxes | ( | — | — | ( | |||||||||||||||||||||||||
| Stock repurchases | ( | ( | ( | — | ( | ||||||||||||||||||||||||
| Employee benefit plan contributions | — | — | |||||||||||||||||||||||||||
| Balance, April 30, 2022 | $ | $ | $ | $ | |||||||||||||||||||||||||
See notes to consolidated financial statements.
30
CONSOLIDATED STATEMENTS OF CASH FLOWS
| FISCAL YEARS ENDED APRIL 30 | |||||||||||||||||
| (in thousands) | 2022 | 2021 | 2020 | ||||||||||||||
| OPERATING ACTIVITIES | |||||||||||||||||
| Net income (loss) | $ | ( | $ | $ | |||||||||||||
| Adjustments to reconcile net income (loss) to net cash and | |||||||||||||||||
| cash equivalents provided by operating activities: | |||||||||||||||||
| Depreciation and amortization | |||||||||||||||||
| Net (gain) loss on disposal of property, plant and equipment | ( | ||||||||||||||||
| Reduction in carrying amount of operating lease right-of-use assets | |||||||||||||||||
| Amortization of debt issuance costs | |||||||||||||||||
| Unrealized (gain) loss on foreign exchange forward contracts | ( | ||||||||||||||||
| Loss on extinguishment of debt | |||||||||||||||||
| Stock-based compensation expense | |||||||||||||||||
| Deferred income taxes | ( | ( | ( | ||||||||||||||
| Pension contributions in excess of (less than) expense | ( | ( | |||||||||||||||
| Pension settlement, net | |||||||||||||||||
| Contributions of employer stock to employee benefit plan | |||||||||||||||||
| Other non-cash items | |||||||||||||||||
| Changes in operating assets and liabilities (net of acquired assets and liabilities): | |||||||||||||||||
| Customer receivables | ( | ( | |||||||||||||||
| Inventories | ( | ( | ( | ||||||||||||||
| Income taxes receivable | ( | ||||||||||||||||
| Prepaid expenses and other assets | ( | ( | ( | ||||||||||||||
| Accounts payable | ( | ||||||||||||||||
| Accrued compensation and related expenses | ( | ( | |||||||||||||||
| Operating lease liabilities | ( | ( | ( | ||||||||||||||
| Marketing and other accrued expenses | ( | ( | |||||||||||||||
| Net Cash Provided by Operating Activities | |||||||||||||||||
| INVESTING ACTIVITIES | |||||||||||||||||
| Payments to acquire property, plant and equipment | ( | ( | ( | ||||||||||||||
| Proceeds from sales of property, plant and equipment | |||||||||||||||||
| Maturities of certificates of deposit | |||||||||||||||||
| Investment in promotional displays | ( | ( | ( | ||||||||||||||
| Net Cash Used by Investing Activities | ( | ( | ( | ||||||||||||||
| FINANCING ACTIVITIES | |||||||||||||||||
| Payments of long-term debt | ( | ( | ( | ||||||||||||||
| Proceeds from long-term debt | |||||||||||||||||
| Proceeds from issuance of common stock and other | |||||||||||||||||
| Repurchase of common stock | ( | ( | |||||||||||||||
| Withholding of employee taxes related to stock-based compensation | ( | ( | ( | ||||||||||||||
| Debt issuance cost | ( | ( | |||||||||||||||
| Premium paid on debt extinguishment | ( | ||||||||||||||||
31
| FISCAL YEARS ENDED APRIL 30 | |||||||||||||||||
| (in thousands) | 2022 | 2021 | 2020 | ||||||||||||||
| Net Cash Used by Financing Activities | ( | ( | ( | ||||||||||||||
| Net (Decrease) Increase in Cash and Cash Equivalents | ( | ( | |||||||||||||||
| Cash and Cash Equivalents, Beginning of Year | |||||||||||||||||
| Cash and Cash Equivalents, End of Year | $ | $ | $ | ||||||||||||||
| Supplemental cash flow information: | |||||||||||||||||
| Non-cash investing and financing activities: | |||||||||||||||||
| Property, plant and equipment | $ | $ | $ | ||||||||||||||
| Cash paid during the period for: | |||||||||||||||||
| Interest | $ | $ | $ | ||||||||||||||
| Income taxes | $ | $ | $ | ||||||||||||||
See notes to consolidated financial statements.
32
NOTES TO CONSOLIDATED FINANCIAL STATEMENTS
Note A — Summary of Significant Accounting Policies
American Woodmark Corporation ("American Woodmark," the "Company," "we," "our" or "us") manufactures and distributes kitchen, bath, and home organization products for the remodeling and new home construction markets. Its products are sold on a national basis directly to home centers and builders and through a network of independent dealers and distributors. The Company operates within a single reportable segment primarily within the U.S.; long-lived assets and sales outside the U.S. are not significant.
The following is a description of the Company's significant accounting policies:
Revenue Recognition: Our principal performance obligations are the sale of kitchen, bath, and home organization products. The Company recognizes revenue as control of our products is transferred to our customers, which is at the time of shipment or upon delivery based on the contractual terms with our customers. Revenue is measured as the amount of consideration we expect to receive in exchange for transferring goods to our customers. Payment terms on our product sales normally range from 30 to 90 days. Taxes assessed by a governmental authority that we collect are excluded from revenue. The expected costs associated with our contractual warranties are recognized as expense when the products are sold. See Note L — Commitments and Contingencies for further discussion.
When revenue is recognized, we record estimates to reduce revenue for customer programs and incentives in order to determine the amount of consideration the Company will ultimately be entitled to receive. Customer programs and incentives are considered variable consideration, and include price discounts, volume-based incentives, promotions, and cooperative advertising. The Company includes variable consideration in revenue only to the extent that it is probable that a significant reversal in the amount of cumulative revenue recognized will not occur when the variable consideration is resolved. This determination is made based upon known customer programs and incentive offerings at the time of sale, and expected sales volume forecasts as it relates to our volume-based incentives. This determination is updated each reporting period. In addition, for certain customer program incentives, we receive an identifiable benefit (goods or services) in exchange for the consideration given and record the associated expenditure in selling, general and administrative expenses.
We account for shipping and handling costs that occur before the customer has obtained control of a product as a fulfillment activity rather than as a promised service. These costs are classified within costs of sales and distribution.
Inventories: On May 1, 2021, the Company changed its accounting method for inventory valuation for inventories which previously utilized a last-in, first-out ("LIFO") basis to a first-in, first-out ("FIFO") basis. As of April 30, 2022 and 2021, inventories accounted for under the LIFO method would have represented approximately 44 %, and 43 %, respectively, of the Company's total inventories during each of the respective periods. We believe this change in accounting method is preferable as it: (i) results in a uniform method to value our inventory across the entire organization; (ii) improves comparability with our peers; (iii) is expected to better reflect the current value of inventory on the consolidated balance sheets and would result in a better matching of revenue and expense, and (iv) is reflective of the physical flow of inventory.
All prior periods presented in the Consolidated Financial Statements have been retrospectively adjusted to apply the effects of the change in accounting method from the LIFO method to FIFO method of accounting. As of April 30, 2021, the cumulative effect of the change increased inventories by $17.9 million, partially offset by $4.5 million in deferred income taxes resulting in an impact to retained earnings of approximately $13.3 million. There was no impact on total cash provided by operating
33
The following tables reflect the effect of the change in accounting method on our current period Consolidated Financial Statements (in thousands except for per share amounts):
| Consolidated Statement of Income for the year ended April 30, 2022 | |||||||||||||||||
| As Computed under previous method | Effect of Change | As Reported under FIFO | |||||||||||||||
| Cost of sales and distribution | $ | $ | ( | $ | |||||||||||||
| Gross Profit | $ | $ | $ | ||||||||||||||
| Operating Income | $ | $ | $ | ||||||||||||||
| Income (Loss) Before Income Taxes | $ | ( | $ | $ | ( | ||||||||||||
| Income tax expense (benefit) | $ | ( | $ | $ | ( | ||||||||||||
| Net Income (Loss) | $ | ( | $ | $ | ( | ||||||||||||
| Net earnings (loss) per share, basic | $ | ( | $ | $ | ( | ||||||||||||
| Net earnings (loss) per share, diluted | $ | ( | $ | $ | ( | ||||||||||||
| Consolidated Balance Sheet as of April 30,2022 | |||||||||||||||||
| As Computed under previous method | Effect of Change | As Reported under FIFO | |||||||||||||||
| Inventories | $ | $ | $ | ||||||||||||||
| Total current assets | $ | $ | $ | ||||||||||||||
| Total assets | $ | $ | $ | ||||||||||||||
| Other accrued expenses | $ | $ | $ | ||||||||||||||
| Total current liabilities | $ | $ | $ | ||||||||||||||
| Retained earnings | $ | $ | $ | ||||||||||||||
| Total shareholders' equity | $ | $ | $ | ||||||||||||||
| Total liabilities and shareholders' equity | $ | $ | $ | ||||||||||||||
| Consolidated Statement of Cash Flows for the year ended April 30, 2022 | |||||||||||||||||
| As Computed under previous method | Effect of Change | As Reported under FIFO | |||||||||||||||
| Net Income (Loss) | $ | ( | $ | $ | ( | ||||||||||||
| Inventories | $ | ( | $ | ( | $ | ( | |||||||||||
| Income taxes receivable | $ | ( | $ | $ | ( | ||||||||||||
34
| Consolidated Statement of Shareholders' equity for the year ended April 30, 2022 | |||||||||||||||||
| As Computed under previous method | Effect of Change | As Reported under FIFO | |||||||||||||||
| Net Income (Loss) | $ | ( | $ | $ | ( | ||||||||||||
| Total shareholders' equity | $ | $ | $ | ||||||||||||||
| Consolidated Statement of Comprehensive income for the year ended April 30, 2022 | |||||||||||||||||
| As Computed under previous method | Effect of Change | As Reported under FIFO | |||||||||||||||
| Net Income (Loss) | $ | ( | $ | $ | ( | ||||||||||||
| Total Comprehensive Income | $ | $ | $ | ||||||||||||||
As a result of the retrospective application of the change in accounting method, certain line items in our Consolidated Financial Statements and related notes were adjusted as follows:
| Consolidated Statement of Income for the year ended April 30, 2021 | |||||||||||||||||
| As Previously Reported | Effect of Change | As Adjusted | |||||||||||||||
| Cost of sales and distribution | $ | $ | ( | $ | |||||||||||||
| Gross Profit | $ | $ | $ | ||||||||||||||
| Operating Income | $ | $ | $ | ||||||||||||||
| Income Before Income Taxes | $ | $ | $ | ||||||||||||||
| Income tax expense | $ | $ | $ | ||||||||||||||
| Net Income | $ | $ | $ | ||||||||||||||
| Net earnings per share, basic | $ | $ | $ | ||||||||||||||
| Net earnings per share, diluted | $ | $ | $ | ||||||||||||||
| Consolidated Balance Sheet as of April 30, 2021 | |||||||||||||||||
| As Previously Reported | Effect of Change | As Adjusted | |||||||||||||||
| Inventories | $ | $ | $ | ||||||||||||||
| Total current assets | $ | $ | $ | ||||||||||||||
| Total assets | $ | $ | $ | ||||||||||||||
| Deferred income taxes | $ | $ | $ | ||||||||||||||
| Retained earnings | $ | $ | $ | ||||||||||||||
| Total shareholders' equity | $ | $ | $ | ||||||||||||||
| Total liabilities and shareholders' equity | $ | $ | $ | ||||||||||||||
| Consolidated Statement of Cash Flows for the year ended April 30, 2021 | |||||||||||||||||
| As Previously Reported | Effect of Change | As Adjusted | |||||||||||||||
| Net income | $ | $ | $ | ||||||||||||||
| Deferred income taxes | $ | ( | $ | $ | ( | ||||||||||||
| Inventories | $ | ( | $ | ( | $ | ( | |||||||||||
35
| Consolidated Statement of Shareholders' equity for the year ended April 30, 2021 | |||||||||||||||||
| As Previously Reported | Effect of Change | As Adjusted | |||||||||||||||
| Net income | $ | $ | $ | ||||||||||||||
| Total shareholders' equity | $ | $ | $ | ||||||||||||||
| Consolidated Statement of Comprehensive income for the year ended April 30, 2021 | |||||||||||||||||
| As Previously Reported | Effect of Change | As Adjusted | |||||||||||||||
| Net income | $ | $ | $ | ||||||||||||||
| Total Comprehensive Income | $ | $ | $ | ||||||||||||||
| Consolidated Statement of Income for the year ended April 30, 2020 | |||||||||||||||||
| As Previously Reported | Effect of Change | As Adjusted | |||||||||||||||
| Cost of sales and distribution | $ | $ | $ | ||||||||||||||
| Gross Profit | $ | $ | ( | $ | |||||||||||||
| Operating Income | $ | $ | ( | $ | |||||||||||||
| Income Before Income Taxes | $ | $ | ( | $ | |||||||||||||
| Income tax expense | $ | $ | ( | $ | |||||||||||||
| Net Income | $ | $ | ( | $ | |||||||||||||
| Net earnings per share, basic | $ | $ | ( | $ | |||||||||||||
| Net earnings per share, diluted | $ | $ | ( | $ | |||||||||||||
| Consolidated Statement of Cash Flows for the year ended April 30, 2020 | |||||||||||||||||
| As Previously Reported | Effect of Change | As Adjusted | |||||||||||||||
| Net income | $ | $ | ( | $ | |||||||||||||
| Deferred income taxes | $ | ( | $ | ( | $ | ( | |||||||||||
| Inventories | $ | ( | $ | $ | ( | ||||||||||||
| Consolidated Statement of Shareholders' equity for the year ended April 30, 2020 | |||||||||||||||||
| As Previously Reported | Effect of Change | As Adjusted | |||||||||||||||
| Net income | $ | $ | ( | $ | |||||||||||||
| Total shareholders' equity | $ | $ | $ | ||||||||||||||
| Consolidated Statement of Comprehensive income for the year ended April 30, 2020 | |||||||||||||||||
| As Previously Reported | Effect of Change | As Adjusted | |||||||||||||||
| Net income | $ | $ | ( | $ | |||||||||||||
| Total Comprehensive Income | $ | $ | ( | $ | |||||||||||||
| Consolidated Statement of Stockholders' equity for the year ended April 31, 2019 | |||||||||||||||||
| As Previously Reported | Effect of Change | As Adjusted | |||||||||||||||
| Retained earnings as of April 30, 2019 | $ | $ | $ | ||||||||||||||
| Total shareholders' equity as of April 30,2019 | $ | $ | $ | ||||||||||||||
36
Goodwill: Goodwill represents the excess of purchase price over the fair value of net assets acquired. The Company does not amortize goodwill but evaluates for impairment annually, or whenever events or changes in circumstances indicate that the carrying value may not be recoverable.
In accordance with the accounting standards, an entity has the option first to assess qualitative factors to determine whether events and circumstances indicate that it is more likely than not that goodwill is impaired. If after such assessment an entity concludes that the asset is not more likely than not impaired, the entity is not required to take further action. However, if an entity concludes otherwise, it is required to determine the fair value of the asset using a quantitative impairment test, and if impaired, the associated assets must be written down to fair value. During fiscal years 2022, 2021, and 2020, the Company concluded no
Intangible Assets: Intangible assets consist of customer relationship intangibles. The Company amortizes the cost of intangible assets over their estimated useful lives, six years , unless such lives are deemed indefinite. The Company reviews its intangible assets for impairment when events or changes in circumstances indicate that the carrying amount of an asset may not be recoverable. During fiscal years 2022, 2021, and 2020, the Company concluded no
Self Insurance: The Company is self-insured for certain costs related to employee medical coverage, workers' compensation liability, general liability, auto liability, and property insurance. The Company maintains stop-loss coverage with third-party insurers to limit total exposure. The Company establishes a liability at each balance sheet date based on estimates for a variety of factors that influence the Company's ultimate cost. In the event that actual experience is substantially different from the
37
estimates, the financial results for the period could be adversely affected. The Company believes that the methodologies used to estimate insurance liabilities are an accurate reflection of the liabilities as of the date of the consolidated balance sheets.
Derivative Financial Instruments: The Company uses derivatives as part of the normal business operations to manage its exposure to fluctuations in interest rates associated with variable interest rate debt and foreign exchange rates. The Company has established policies and procedures that govern the risk management of these exposures. The primary objective in managing these exposures is to add stability to interest expense, manage the Company's exposure to interest rate movements, and manage the risk from adverse fluctuations in foreign exchange rates.
The Company uses interest rate swap contracts to manage interest rate exposures. The Company records derivatives in the condensed consolidated balance sheets at fair value. Changes in the fair value of derivatives designated as cash flow hedges are recorded in accumulated other comprehensive income (loss), and subsequently reclassified into earnings in the period the hedged forecasted transaction affects earnings. If a derivative is deemed to be ineffective, the change in fair value of the derivative is recognized directly in earnings.
The Company also manages risks through the use of foreign exchange forward contracts. The Company recognizes its outstanding forward contracts in the condensed consolidated balance sheets at their fair values. The Company does not designate the forward contracts as accounting hedges. The changes in the fair value of the forward contracts are recorded in other (income) expense, net in the condensed consolidated statements of income.
Recent Accounting Pronouncements: In December 2019, the FASB issued ASU No. 2019-12, "Income Taxes (Topic 740): Simplifying the Accounting for Income Taxes," which simplifies the accounting for income taxes by removing certain exceptions for recognizing deferred taxes for investments, performing intraperiod tax allocations and calculating income taxes in interim periods. The amendments also improve consistent application of and simplify GAAP for other areas of Topic 740 by clarifying and amending existing guidance. ASU 2019-12 became effective for the Company beginning May 1, 2021. The Company has reviewed the provisions of this new pronouncement and the adoption of this guidance did not have an impact on the Company's consolidated financial statements.
In March 2020, the FASB issued ASU No. 2020-04 "Reference Rate Reform (Topic 848): Facilitation of the Effects of Reference Rate Reform on Financial Reporting." These amendments provide temporary optional guidance to ease the potential burden in accounting for reference rate reform. The ASU provides optional expedients and exceptions for applying generally accepted accounting principles to contract modifications and hedging relationships, subject to meeting certain criteria, that reference LIBOR or another reference rate expected to be discontinued. It is intended to help stakeholders during the global market-wide reference rate transition period. The guidance is effective for all entities as of March 12, 2020 through December 31, 2022 and can be adopted as of any date from the beginning of an interim period that includes or is subsequent to March 12, 2020. The Company has identified loans and other financial instruments that are directly or indirectly influenced by LIBOR and does not expect the adoption of ASU 2020-04 to have a material impact on its consolidated financial statements.
Reclassifications: Certain reclassifications have been made to prior period balances to conform to the current year presentation.
Note B — Customer Receivables
The components of customer receivables were:
| APRIL 30 | |||||||||||
| (in thousands) | 2022 | 2021 | |||||||||
| Gross customer receivables | $ | $ | |||||||||
| Less: | |||||||||||
| Allowance for doubtful accounts | ( | ( | |||||||||
| Allowance for returns and discounts | ( | ( | |||||||||
| Net customer receivables | $ | $ | |||||||||
38
Note C — Inventories
The components of inventories were:
| APRIL 30 | |||||||||||
| (in thousands) | 2022 | 2021 | |||||||||
| Raw materials | $ | $ | |||||||||
| Work-in-process | |||||||||||
| Finished goods | |||||||||||
| Total inventories | $ | $ | |||||||||
Effective May 1, 2021, the Company changed its accounting principle for inventory valuation from a LIFO basis to a FIFO basis. See Note A — Summary of Significant Accounting Policies for additional information on the effect of the change.
Note D — Property, Plant and Equipment
The components of property, plant and equipment were:
| APRIL 30 | |||||||||||
| (in thousands) | 2022 | 2021 | |||||||||
| Land | $ | $ | |||||||||
| Buildings and improvements | |||||||||||
| Buildings and improvements - financing leases | |||||||||||
| Machinery and equipment | |||||||||||
| Machinery and equipment - financing leases | |||||||||||
| Software | |||||||||||
| Construction in progress | |||||||||||
| Less accumulated amortization and depreciation | ( | ( | |||||||||
| Total | $ | $ | |||||||||
Amortization and depreciation expense on property, plant and equipment amounted to $38.0 million, $38.3 million, and $36.9 million in fiscal years 2022, 2021, and 2020, respectively. Accumulated amortization on financing leases included in the above table amounted to $32.8 million and $33.0 million as of April 30, 2022 and 2021, respectively.
Note E — Customer Relationships Intangibles
The components of customer relationships intangibles were:
| APRIL 30 | |||||||||||
| (in thousands) | 2022 | 2021 | |||||||||
| Customer relationship intangibles | $ | $ | |||||||||
| Less accumulated amortization | ( | ( | |||||||||
| Total | $ | $ | |||||||||
Customer relationships intangibles are amortized over the estimated useful lives on a straight-line basis over six years . Amortization expense on customer relationships intangibles amounted to $45.7 million for the year ended April 30, 2022. Amortization expense on customer relationships intangibles and trademarks amounted to $47.9 million for the year ended April 30, 2021.
39
Note F — Loans Payable and Long-Term Debt
Maturities of long-term debt are as follows:
| FISCAL YEARS ENDING APRIL 30 | |||||||||||||||||||||||||||||||||||||||||||||||
| (in thousands) | 2023 | 2024 | 2025 | 2026 | 2027 | 2028 AND THERE-AFTER | TOTAL OUTSTANDING AS OF APRIL 30, 2022 | TOTAL OUTSTANDING AS OF APRIL 30, 2021 | |||||||||||||||||||||||||||||||||||||||
| Term loans | $ | $ | $ | $ | $ | $ | $ | $ | |||||||||||||||||||||||||||||||||||||||
| Revolving credit | |||||||||||||||||||||||||||||||||||||||||||||||
| Finance lease obligations | |||||||||||||||||||||||||||||||||||||||||||||||
| Other long-term debt | |||||||||||||||||||||||||||||||||||||||||||||||
| Total | $ | $ | $ | $ | $ | $ | $ | $ | |||||||||||||||||||||||||||||||||||||||
| Debt issuance costs | $ | ( | $ | ( | |||||||||||||||||||||||||||||||||||||||||||
| Current maturities | $ | ( | $ | ( | |||||||||||||||||||||||||||||||||||||||||||
| Total long-term debt | $ | $ | |||||||||||||||||||||||||||||||||||||||||||||
Term Loans and Revolving Credit Facility
On December 29, 2017, the Company entered into a credit agreement (the "Prior Credit Agreement") with a syndicate of lenders and Wells Fargo Bank, National Association, as administrative agent. The Prior Credit Agreement provided for a $100 million revolving loan facility with a $25 million sub-facility for the issuance of letters of credit, a $250 million initial term loan facility and a $250 million delayed draw term loan facility. The Company borrowed the entire $250 million under the initial term loan facility, the entire $250 million under the delayed draw term loan facility and approximately $50 million under the revolving loan facility in connection with the acquisition of RSI Home Products, Inc. ("RSI") and the refinancing of certain senior notes assumed from RSI (the "RSI Notes"). The facilities under the Prior Credit Agreement were scheduled to mature on December 29, 2022.
On April 22, 2021, the Company amended and restated the Prior Credit Agreement. The amended and restated credit agreement (the "A&R Credit Agreement") provides for a $500 million revolving loan facility with a $50 million sub-facility for the issuance of letters of credit (the "Revolving Facility") and a $250 million term loan facility (the "Term Loan Facility"). Also on April 22, 2021, the Company borrowed the entire $250 million under the Term Loan Facility and approximately $264 million under the Revolving Facility to fund, in part, the repayment in full of the amounts then outstanding under the Prior Credit Agreement and the redemption of the Senior Notes (as defined below). The Company is required to repay the Term Loan Facility in specified quarterly installments. The Revolving Facility and Term Loan Facility mature on April 22, 2026.
As of April 30, 2022, and 2021, $237.5 million and $250.0 million, respectively, was outstanding on the Term Loan Facility. As of April 30, 2022, and 2021, $263.0 million and $264.0 million, respectively, was outstanding under the Revolving Facility. Outstanding letters of credit under the Revolving Facility were $11.7 million as of April 30, 2022, leaving approximately $225.3 million in available capacity under the Revolving Facility as of April 30, 2022. Outstanding letters of credit under the Revolving Facility were $8.3 million, as of April 30, 2021, leaving approximately $227.7 million in available capacity under
40
the Revolving Facility as of April 30, 2021. The outstanding balances noted above approximate fair value as the facilities have a floating interest rate.
Amounts outstanding under the Term Loan Facility and the Revolving Facility bear interest based on a fluctuating rate measured by reference to either, at the Company's option, a base rate plus an applicable margin or LIBOR plus an applicable margin, with the applicable margin being determined by reference to the Company's then-current "Secured Net Leverage Ratio." The Company also incurs a quarterly commitment fee on the average daily unused portion of the Revolving Facility during the applicable quarter at a rate per annum also determined by reference to the Company's then-current "Secured Net Leverage Ratio." In addition, a letter of credit fee accrues on the face amount of any outstanding letters of credit at a per annum rate equal to the applicable margin on LIBOR loans, payable quarterly in arrears. As of April 30, 2022, the applicable margin with respect to base rate loans and LIBOR loans was 1.00 % and 2.00 %, respectively, and the commitment fee was 0.20 %. The A&R Credit Agreement includes provisions providing for the transition from LIBOR to a replacement benchmark upon the occurrence of certain events. The Company does not currently expect any such transition to materially impact its financing costs.
The A&R Credit Agreement includes certain financial covenants that require the Company to maintain (i) a "Consolidated Interest Coverage Ratio" of no less than 2.00 to 1.00 and (ii) a "Total Net Leverage Ratio" of no greater than 4.00 to 1.00, subject, in each case, to certain limited exceptions.
The A&R Credit Agreement includes certain additional covenants, including negative covenants that restrict the ability of the Company and certain of its subsidiaries to incur additional indebtedness, create additional liens on its assets, make certain investments, dispose of its assets, or engage in a merger or other similar transaction or engage in transactions with affiliates, subject, in each case, to the various exceptions and conditions described in the A&R Credit Agreement. The negative covenants further restrict the ability of the Company and certain of its subsidiaries to make certain restricted payments, including, in the case of the Company, the payment of dividends and the repurchase of common stock, in certain limited circumstances.
As of April 30, 2022, the Company was in compliance with all covenants included in the A&R Credit Agreement.
The Company's obligations under the A&R Credit Agreement are guaranteed by the Company's domestic subsidiaries and the obligations of the Company and its domestic subsidiaries under the A&R Credit Agreement and their guarantees, respectively, are secured by a pledge of substantially all of their respective personal property.
The Senior Notes
On February 12, 2018, the Company issued $350 million in aggregate principal amount of 4.875 % Senior Notes due 2026 (the "Senior Notes") and utilized the proceeds, together with the proceeds from the delayed draw term loan under the Prior Credit Agreement, to refinance the RSI Notes. The Senior Notes were guaranteed by the Company's domestic subsidiaries and were scheduled to mature on March 15, 2026. On April 26, 2021 , the Company redeemed in full the Senior Notes at a redemption price equal to 102.438 % of the principal amount of the Senior Notes, plus accrued and unpaid interest to the redemption date.
Financing Lease Obligations
The Company has various financing leases with interest rates between 2.0 % and 4.6 %. The leases require monthly payments and expire by December 31, 2026. The outstanding amounts owed as of April 30, 2022, and 2021, were $5.0 million and $5.5 million, respectively.
Other Long-term Debt
On January 25, 2016, the Company entered into a New Markets Tax Credit ("NMTC") financing agreement, pursuant to section 45D of the Internal Revenue Code of 1986, as amended, and Kentucky Revised Statutes Sections 141.432 through 141.434, to take advantage of a tax credit related to working capital and capital improvements at its Monticello, Kentucky facility. This financing agreement was structured with unrelated third party financial institutions (the "Investors"), their wholly-owned investment funds ("Investment Funds") and their wholly-owned community development entities ("CDEs") in connection with our participation in qualified transactions under the NMTC program. In exchange for substantially all of the benefits derived from the tax credits, the Investors made a contribution of $2.3 million, net of syndication fees, to the project. Upon closing the transaction, a wholly owned subsidiary of the Company provided a $4.3 million loan receivable to the Investment Funds, which is included in other long term assets in the accompanying consolidated balance sheets. The Company also entered into loan agreements aggregating $6.6 million payable to the CDEs sponsoring the project. The loans have a term of 30 years with an aggregate interest rate of approximately 1.2 %. As of April 30, 2022, and 2021, the Company had drawn $6.7 million of the loan proceeds, which is included in long-term debt in the accompanying consolidated balance sheets. The NMTC is subject to
41
recapture for a period of seven years , the compliance period. During the compliance period, the Company is required to comply with various regulations and contractual provisions that apply to the NMTC arrangement. We do not anticipate any credit recaptures will be required in connection with this arrangement. This transaction also includes a put/call feature which becomes enforceable at the end of the compliance period whereby we may be obligated or entitled to repurchase the Investors' interest in the Investment Funds. The value attributable to the put/call is nominal. Direct costs of $0.3 million incurred in structuring the financing arrangement are deferred and will be recognized as expense over the term of the loans (30 years).
On March 8, 2022, the Company entered into a $0.4 million loan agreement with the West Virginia Water Development Authority acting on behalf of the West Virginia Infrastructure and Jobs Development Council and the Hardy County Rural Development Authority as part of the Company's capital improvements at the South Branch Primewood facility located in Hardy County, West Virginia. The loan agreement expires on March 8, 2025 and bears no interest rate. The loan agreement is secured by a sole first lien on the real property and fixtures associated with the facility. It defers principal and interest during the term of the obligation and forgives any outstanding balance at March 8, 2025, if the Company complies with certain employment levels at the facility.
Note G — Earnings Per Share
The following table summarizes the computations of basic and diluted earnings per share:
| FISCAL YEARS ENDED APRIL 30 | |||||||||||||||||
| (in thousands, except per share amounts) | 2022 | 2021 | 2020 | ||||||||||||||
| Numerator used in basic and diluted earnings per common share: | |||||||||||||||||
| Net income (loss) | $ | ( | $ | $ | |||||||||||||
| Denominator: | |||||||||||||||||
| Denominator for basic earnings per common share - | |||||||||||||||||
| weighted-average shares | |||||||||||||||||
| Effect of dilutive securities: | |||||||||||||||||
| Stock options and restricted stock units | |||||||||||||||||
| Denominator for diluted earnings per common share - | |||||||||||||||||
| weighted-average shares and assumed conversions | |||||||||||||||||
| Net earnings (loss) per share | |||||||||||||||||
| Basic | $ | ( | $ | $ | |||||||||||||
| Diluted | $ | ( | $ | $ | |||||||||||||
Potentially dilutive securities of 48,379 for the fiscal year ended April 30, 2022, have not been considered in the calculation of net loss per share as the effect would be anti-dilutive. There were no
42
Note H — Stock-Based Compensation
The Company has various stock-based compensation plans. The Company issues restricted stock units ("RSUs") to key employees and non-employee directors. Total compensation expense related to stock-based awards for the fiscal years ended April 30, 2022, 2021, and 2020 was $4.7 million, $4.6 million, and $4.0 million, respectively. The Company recognizes stock-based compensation costs net of an estimated forfeiture rate for those shares expected to vest on a straight-line basis over the requisite service period of the award. The Company estimates the forfeiture rates based upon its historical experience.
Stock Incentive Plans
At April 30, 2022, the Company had RSU awards outstanding under two different plans: (1) 2016 employee stock incentive plan; and (2) 2015 non-employee directors equity ownership plan. As of April 30, 2022, there were 508,968 shares of common stock available for future stock-based compensation awards under the Company's stock incentive plans.
Methodology Assumptions
For purposes of determining the fair value of RSUs, the Company uses the closing stock price of its common stock as reported on the NASDAQ Global Select Market on the date of grant. The fair value of the Company's RSU awards is expensed on a straight-line basis over the vesting period of the RSUs to the extent the Company believes it is probable the related performance criteria, if any, will be met.
Restricted Stock Unit Activity:
The Company's RSUs granted to employees cliff-vest over a three-year period from date of grant, while RSUs granted to non-employee directors vest daily over a two-year period from date of grant. Directors were granted service-based RSUs only, while employees were awarded both service-based and performance-based RSUs ("PBRSUs") in fiscal years 2022, 2021, and 2020. The PBRSUs granted in fiscal 2022, 2021, and 2020 are earned based on achievement of a number of goals pertaining to the Company's financial performance during three one-year performance periods and the achievement of certain cultural goals for the three-year period. Employees who satisfy the vesting criteria will receive a proportional amount of PBRSUs based upon the Compensation Committee's assessment of the Company's achievement of the performance criteria.
43
| PERFORMANCE-BASED RSUs | SERVICE-BASED RSUs | TOTAL RSUs | WEIGHTED AVERAGE GRANT DATE FAIR VALUE | ||||||||||||||||||||
| Issued and outstanding, April 30, 2019 | $ | ||||||||||||||||||||||
| Granted | $ | ||||||||||||||||||||||
| Cancelled due to non-achievement of performance goals | ( | ( | $ | ||||||||||||||||||||
| Settled in common stock | ( | ( | ( | $ | |||||||||||||||||||
| Forfeited | ( | ( | ( | $ | |||||||||||||||||||
| Issued and outstanding, April 30, 2020 | $ | ||||||||||||||||||||||
| Granted | $ | ||||||||||||||||||||||
| Cancelled due to non-achievement of performance goals | ( | ( | $ | ||||||||||||||||||||
| Settled in common stock | ( | ( | ( | $ | |||||||||||||||||||
| Forfeited | ( | ( | ( | $ | |||||||||||||||||||
| Issued and outstanding, April 30, 2021 | $ | ||||||||||||||||||||||
| Granted | $ | ||||||||||||||||||||||
| Cancelled due to non-achievement of performance goals | ( | ( | $ | ||||||||||||||||||||
| Settled in common stock | ( | ( | ( | $ | |||||||||||||||||||
| Forfeited | ( | ( | ( | $ | |||||||||||||||||||
| Issued and outstanding, April 30, 2022 | $ | ||||||||||||||||||||||
As of April 30, 2022, there was $13.6 million of total unrecognized compensation expense related to unvested RSUs granted under the Company's stock-based compensation plans. This expense is expected to be recognized over a weighted-average period of 1.6 years.
For the fiscal years ended April 30, 2022, 2021, and 2020 stock-based compensation expense was allocated as follows:
| (in thousands) | 2022 | 2021 | 2020 | ||||||||||||||
| Cost of sales and distribution | $ | $ | $ | ||||||||||||||
| Selling and marketing expenses | |||||||||||||||||
| General and administrative expenses | |||||||||||||||||
| Stock-based compensation expense, before income taxes | $ | $ | $ | ||||||||||||||
Restricted Stock Tracking Units:
During fiscal 2022, the Board approved grants of 5,794 cash-settled performance-based restricted stock tracking units ("RSTUs") and 3,096 cash-settled service-based RSTUs for more junior level employees. Each performance-based RSTU entitles the recipient to receive a payment in cash equal to the fair market value of a share of the Company's common stock as of the payment date if applicable performance and cultural conditions are met and the recipient remains continuously employed with the Company until the units vest. The service-based RSTUs entitle the recipients to receive a payment in cash equal to the fair market value of a share of our common stock as of the payment date if they remain continuously employed with the Company until the units vest. All of the RSTUs cliff-vest three years from the grant date. The fair value of each cash-settled RSTU award is remeasured at the end of each reporting period and the liability is adjusted, and related expense recorded, based on the new fair value. The expense recongnized in fiscal 2022, 2021, and 2020, and the liability as of April 30, 2022 and 2021, related to RSTUs is not significant.
44
Note I — Employee Benefit and Retirement Plans
Retirement Savings Plans
Under the American Woodmark Corporation Retirement Savings Plan (the "Plan"), essentially all employees are immediately eligible to participate in the Plan. Participants are eligible for 401(k) matching contributions based upon the employee’s contribution to the Plan. All participants employed at the end of the fiscal year and hired prior to November 2 of the fiscal year are eligible for a discretionary profit-sharing contribution.
Discretionary profit-sharing contributions ranging from 0 -5 % of net income, based on predetermined net income levels of the Company, may be made annually in the form of Company stock. The Company recognized expenses for profit-sharing contributions of $0.8 million, $2.9 million, and $3.7 million in fiscal years 2022, 2021, and 2020, respectively.
The Company matches 100 % of an employee's annual 401(k) contributions to the Plan up to 4 % of annual compensation.
The expense for 401(k) matching contributions for both plans was $11.7 million, $11.9 million, and $10.1 million, in fiscal years 2022, 2021, and 2020, respectively.
Pension Benefits
Prior to April 30, 2020, the Company had two defined benefit pension plans covering many of the Company's employees hired prior to April 30, 2012. Effective April 30, 2012, the Company froze all future benefit accruals under the Company's defined benefit pension plans.
Effective April 30, 2020, these plans were merged into one plan (the "Pension Plan"). The Pension Plan provides defined benefits based on years of service and final average earnings (for salaried employees) or benefit rate (for hourly employees). Effective December 31, 2020 (the "Plan Termination Date"), the Pension Plan was terminated in a standard termination and benefits were distributed on December 2, 2021.
The following provides a reconciliation of benefit obligations, plan assets and funded status of the Company's non-contributory Pension Plan as of April 30:
| APRIL 30 | |||||||||||
| (in thousands) | 2022 | 2021 | |||||||||
| CHANGE IN PROJECTED BENEFIT OBLIGATION | |||||||||||
| Projected benefit obligation at beginning of year | $ | $ | |||||||||
| Interest cost | |||||||||||
| Actuarial gains (losses) | ( | ||||||||||
| Benefits paid | ( | ( | |||||||||
| Settlements | ( | ||||||||||
| Projected benefit obligation at end of year | $ | $ | |||||||||
| CHANGE IN PLAN ASSETS | |||||||||||
| Fair value of plan assets at beginning of year | $ | $ | |||||||||
| Actual return on plan assets | |||||||||||
| Benefits paid | ( | ( | |||||||||
| Settlements | ( | ||||||||||
| Fair value of plan assets at end of year | $ | $ | |||||||||
| Funded status of the plan | $ | $ | ( | ||||||||
45
| APRIL 30 | |||||||||||||||||
| (in thousands) | 2022 | 2021 | 2020 | ||||||||||||||
| COMPONENTS OF NET PERIODIC PENSION BENEFIT COST | |||||||||||||||||
| Interest cost | $ | $ | $ | ||||||||||||||
| Expected return on plan assets | ( | ( | ( | ||||||||||||||
| Recognized net actuarial loss | |||||||||||||||||
| Amortization of net loss from prior years | |||||||||||||||||
| Settlement charge | |||||||||||||||||
| Pension benefit cost | $ | $ | ( | $ | ( | ||||||||||||
The components of net periodic pension benefit cost do not include service costs or prior service costs due to the Pension Plan being frozen.
Actuarial Assumptions: The discount rate at April 30 was used to measure the year-end benefit obligations and the earnings effects for the subsequent year. Actuarial assumptions used to determine benefit obligations and earnings effects for the Pension Plan follows:
| FISCAL YEARS ENDED APRIL 30 | |||||||||||
| 2022 | 2021 | ||||||||||
| WEIGHTED-AVERAGE ASSUMPTIONS TO DETERMINE BENEFIT OBLIGATIONS | |||||||||||
| Discount rate | |||||||||||
| FISCAL YEARS ENDED APRIL 30 | |||||||||||||||||
| 2022 | 2021 | 2020 | |||||||||||||||
| WEIGHTED-AVERAGE ASSUMPTIONS TO DETERMINE NET PERIODIC PENSION BENEFIT COST | |||||||||||||||||
| Discount rate | |||||||||||||||||
| Expected return on plan assets | |||||||||||||||||
The Company based the discount rate on a current yield curve developed from a portfolio of high-quality fixed-income investments with maturities consistent with the projected benefit payout period. The long-term rate of return on assets was determined based on consideration of historical and forward-looking returns and the current and expected asset allocation strategy.
The method used to determine the service and interest costs is known as the spot rate approach, under which individual spot rates along the yield curve that correspond with the timing of each benefit payment are used.
In developing the expected long-term rate of return assumption for the assets of the Pension Plan, the Company evaluated input from its third party pension plan asset managers, including their review of asset class return expectations and long-term inflation assumptions.
The Company amortizes experience gains and losses, as well as the effects of changes in actuarial assumptions and plan provisions, over the average remaining lifetime of employees expected to receive benefits under the Pension Plan.
Contributions: The Company funded the Pension Plan in amounts sufficient to meet minimum funding requirements under applicable employee benefit and tax laws plus additional amounts the Company deemed appropriate.
The Company made no contributions to its Pension Plan in fiscal 2022 and made contributions of $0.5 million in fiscal 2021.
46
Plan Assets: Pension assets by major category and the type of fair value measurement as of April 30, 2022 and 2021 are presented in the following tables:
| FAIR VALUE MEASUREMENTS AT APRIL 30, 2022 | |||||||||||||||||||||||
| (in thousands) | TOTAL | QUOTED PRICES IN ACTIVE MARKETS (LEVEL 1) | SIGNIFICANT OBSERVABLE INPUTS (LEVEL 2) | SIGNIFICANT UNOBSERVABLE INPUTS (LEVEL 3) | |||||||||||||||||||
| Cash Equivalents | $ | $ | $ | $ | |||||||||||||||||||
| Total plan assets | $ | $ | |||||||||||||||||||||
| FAIR VALUE MEASUREMENTS AT APRIL 30, 2021 | |||||||||||||||||||||||
| (in thousands) | TOTAL | QUOTED PRICES IN ACTIVE MARKETS (LEVEL 1) | SIGNIFICANT OBSERVABLE INPUTS (LEVEL 2) | SIGNIFICANT UNOBSERVABLE INPUTS (LEVEL 3) | |||||||||||||||||||
| Cash Equivalents | $ | $ | $ | $ | |||||||||||||||||||
| Fixed Income Funds: | |||||||||||||||||||||||
| Investment Grade Fixed Income | |||||||||||||||||||||||
| Total plan assets | $ | $ | $ | $ | |||||||||||||||||||
Note J--Derivative Financial Instruments
Interest Rate Swap Contracts
The Company enters into interest rate swap contracts to manage variability in the amount of known or expected cash payments related to portions of its variable rate debt. On May 28, 2021, the Company entered into four interest rate swaps with an aggregate notional amount of $200 million to hedge part of the variable rate interest payments under the Term Loan Facility. The interest rate swaps became effective on May 28, 2021 and will terminate on May 30, 2025. The interest rate swaps economically convert a portion of the variable rate debt to fixed rate debt. The Company receives floating interest payments monthly based on one-month LIBOR and pays a fixed rate of 0.5980 % to the counterparty.
The interest rate swaps are designated as cash flow hedges. Changes in fair value are recorded to other comprehensive income. The risk management objective in using interest rate swaps is to add stability to interest expense and to manage the Company's exposure to interest rate movements. Interest rate swaps designated as cash flow hedges involve the receipt of variable amounts from a counterparty in exchange for the Company making fixed-rate payments over the life of the contract agreements without exchange of the underlying notional amount. Realized gains or losses from interest rate swaps are recorded in earnings, as a component of interest expense, net to offset variability in interest expense associated with the underlying debt's cash flows.
For the year ended April 30, 2022, unrealized gains, net of deferred taxes, of $10.2 million, were recorded in other comprehensive income, and $0.9 million of realized losses were reclassified out of accumulated other comprehensive loss to interest expense due to payments made to the swap counterparties. As of April 30, 2022, the Company anticipates reclassifying approximately $3.5 million of net hedging gains from accumulated other comprehensive income into earnings during the next 12 months to offset the variability of the hedged items during this period. Since the Company did not have outstanding interest rate swaps in the prior year, there were no gains or losses recorded for the year ended April 30, 2021.
Foreign Exchange Forward Contracts
At April 30, 2022, the Company held no forward contracts.
Note K — Income Taxes
47
2020. This and the CARES Act provisions applicable to the Company have been applied to the current year ending April 30, 2022.
Income tax expense was comprised of the following:
| FISCAL YEARS ENDED APRIL 30 | |||||||||||||||||
| (in thousands) | 2022 | 2021 | 2020 | ||||||||||||||
| CURRENT | |||||||||||||||||
| Federal | $ | $ | $ | ||||||||||||||
| State | |||||||||||||||||
| Foreign | |||||||||||||||||
| Total current expense | |||||||||||||||||
| DEFERRED | |||||||||||||||||
| Federal | ( | ( | ( | ||||||||||||||
| State | ( | ( | ( | ||||||||||||||
| Foreign | ( | ( | ( | ||||||||||||||
| Total deferred benefit | ( | ( | ( | ||||||||||||||
| Total expense (benefit) | ( | ||||||||||||||||
| Other comprehensive income (loss) | ( | ( | |||||||||||||||
| Total comprehensive income tax expense | $ | $ | $ | ||||||||||||||
The Company's effective income tax rate varied from the federal statutory rate as follows:
| FISCAL YEARS ENDED APRIL 30 | |||||||||||||||||
| 2022 | 2021 | 2020 | |||||||||||||||
| Federal statutory rate | % | % | % | ||||||||||||||
| Effect of: | |||||||||||||||||
| Federal income tax credits | % | ( | % | ( | % | ||||||||||||
| Stock compensation | ( | ( | |||||||||||||||
| Uncertain tax positions | |||||||||||||||||
| Meals and entertainment | ( | ||||||||||||||||
| Valuation allowance for deferred taxes | |||||||||||||||||
| Foreign | |||||||||||||||||
| Other | ( | ||||||||||||||||
| State income taxes, net of federal tax effect | |||||||||||||||||
| Effective income tax rate | % | % | % | ||||||||||||||
48
The significant components of deferred tax assets and liabilities were as follows:
| APRIL 30 | |||||||||||
| (in thousands) | 2022 | 2021 | |||||||||
| Deferred tax assets: | |||||||||||
| Accounts receivable | $ | $ | |||||||||
| Pension benefits | |||||||||||
| Product liability | |||||||||||
| Employee benefits | |||||||||||
| Tax credit carryforwards | |||||||||||
| Operating leases liabilities | |||||||||||
| Other | |||||||||||
| Gross deferred tax assets, before valuation allowance | |||||||||||
| Valuation allowance | ( | ( | |||||||||
| Gross deferred tax assets, after valuation allowance | |||||||||||
| Deferred tax liabilities: | |||||||||||
| Pension benefits | |||||||||||
| Inventory | |||||||||||
| Depreciation | |||||||||||
| Intangibles | |||||||||||
| Operating leases right-of-use assets | |||||||||||
| Interest rate swaps | |||||||||||
| Other | |||||||||||
| Gross deferred tax liabilities | |||||||||||
| Net deferred tax liability | $ | $ | |||||||||
We have not recorded deferred income taxes applicable to undistributed earnings of foreign subsidiaries that are indefinitely reinvested in foreign operations. Undistributed earnings that are indefinitely reinvested in foreign operations are not significant as of April 30, 2022.
The Company recorded a valuation allowance related to deferred tax assets for certain state investment tax credit ("ITC") carryforwards and foreign tax credit ("FTC") carryforwards. Deferred tax assets are reduced by a valuation allowance when, after considering all positive and negative evidence, it is determined that it is more likely than not that some portion, or all, of the deferred tax asset will not be realized. The Company determined that there will not be sufficient foreign source income to fully utilize the current year and carry forward FTCs. Therefore, the Company updated the valuation allowance for the current year activity of $0.2 million related to FTCs.
The gross amount of state tax credit carryforwards related to state ITCs as of April 30, 2022 and 2021 was $3.7 million and $3.8 million, respectively. These credits expire in various years beginning in fiscal 2028. Net of the federal impact and related valuation allowance, the Company recorded $0.4 million and $0.5 million of deferred tax assets related to these credits as of April 30, 2022 and 2021, respectively. The Company accounts for ITCs under the deferral method, under which the tax benefit from the ITC is deferred and amortized into income tax expense over the book life of the related property. As of April 30, 2022 and 2021, a deferred credit balance of $0.4 million and $0.5 million, respectively, is included in other liabilities on the consolidated balance sheets.
The gross amount of FTC carryforwards as of April 30, 2022 and 2021 is $1.9 million and $1.7 million, respectively, which begin to expire in fiscal 2029.
49
The following table summarizes the activity related to unrecognized tax benefits, excluding the federal tax benefit of state tax deductions:
| APRIL 30 | |||||||||||
| (in thousands) | 2022 | 2021 | |||||||||
| Change in Unrecognized Tax Benefits | |||||||||||
| Balance at beginning of year | $ | $ | |||||||||
| Additions based on tax positions related to the current year | |||||||||||
| Additions based on tax positions of prior years | |||||||||||
| Statute of limitations lapses | ( | ||||||||||
| Reductions for tax positions of prior years settlements | ( | ||||||||||
| Balance at end of year | $ | $ | |||||||||
Note L — Commitments and Contingencies
Legal Matters
The Company is involved in suits and claims in the normal course of business, including without limitation product liability and general liability claims, and claims pending before the Equal Employment Opportunity Commission. On at least a quarterly basis, the Company consults with its legal counsel to ascertain the reasonable likelihood that such claims may result in a loss. As required by ASC Topic 450, "Contingencies" ("ASC 450"), the Company categorizes the various suits and claims into three categories according to their likelihood for resulting in potential loss: those that are probable, those that are reasonably possible and those that are deemed to be remote. Where losses are deemed to be probable and estimable, accruals are made. Where losses are deemed to be reasonably possible, a range of loss estimates is determined and considered for disclosure. In determining these loss range estimates, the Company considers known values of similar claims and consultation with independent counsel.
The Company believes that the aggregate range of loss stemming from the various suits and asserted and unasserted claims which were deemed to be either probable or reasonably possible is not material as of April 30, 2022.
Product Warranty
The Company estimates outstanding warranty costs based on the historical relationship between warranty claims and revenues. The warranty accrual is reviewed monthly to verify that it properly reflects the remaining obligation based on the anticipated expenditures over the balance of the obligation period. Adjustments are made when actual warranty claim experience differs from estimates. Warranty claims are generally made within two months of the original shipment date.
The following is a reconciliation of the Company's warranty liability:
| APRIL 30 | |||||||||||
| (in thousands) | 2022 | 2021 | |||||||||
| PRODUCT WARRANTY RESERVE | |||||||||||
| Beginning balance | $ | $ | |||||||||
| Accrual for warranties | |||||||||||
| Settlements | ( | ( | |||||||||
| Ending balance at fiscal year end | $ | $ | |||||||||
50
Note M — Revenue Recognition
The Company disaggregates revenue from contracts with customers into major sales distribution channels as these categories depict the nature, amount, timing, and uncertainty of revenues and cash flows that are affected by economic factors. The following table disaggregates our consolidated revenue by major sales distribution channels for the years ended April 30, 2022, 2021, and 2020:
| FISCAL YEARS ENDED APRIL 30 | |||||||||||||||||
| (in thousands) | 2022 | 2021 | 2020 | ||||||||||||||
| Home center retailers | $ | $ | $ | ||||||||||||||
| Builders | |||||||||||||||||
| Independent dealers and distributors | |||||||||||||||||
| Net Sales | $ | $ | $ | ||||||||||||||
Note N — Credit Concentration
Financial instruments that potentially subject the Company to concentrations of risk consist primarily of cash and cash equivalents and accounts receivable. The Company maintains its cash and cash equivalents with major financial institutions and such balances may, at times, exceed Federal Deposit Insurance Corporation insurance limits. The Company has not experienced any losses in such accounts and believes it is not exposed to any significant risk on cash.
Credit is extended to customers based on an evaluation of each customer's financial condition and generally collateral is not required. The Company's customers operate in the new home construction and home remodeling markets.
The Company maintains an allowance for bad debt based upon management's evaluation and judgment of potential net loss. The allowance is estimated based upon historical experience, the effects of current developments and economic conditions and of each customer's current and anticipated financial condition. Estimates and assumptions are periodically reviewed and updated. Any resulting adjustments to the allowance are reflected in current operating results.
At April 30, 2022, the Company's two largest customers, Customers A and B, represented 33.8 % and 19.9 % of the Company's gross customer receivables, respectively. At April 30, 2021, Customers A and B represented 34.3 % and 22.1 % of the Company's gross customer receivables, respectively.
The following table summarizes the percentage of net sales to the Company's two largest customers for the last three fiscal years:
| PERCENT OF ANNUAL NET SALES | |||||||||||||||||
| 2022 | 2021 | 2020 | |||||||||||||||
| Customer A | |||||||||||||||||
| Customer B | |||||||||||||||||
Note O — Leases
Operating Leases - ROU assets related to operating leases are presented as Operating lease right-of-use assets on the consolidated balance sheet. Lease liabilities related to operating leases with lease terms greater than twelve months are presented in Short-term lease liability - operating and Long-term lease liability - operating on the consolidated balance sheet.
Operating lease ROU assets and lease liabilities are recognized at the commencement date based on the present value of the future lease payments over the lease term. The discount rate used to determine the present value of the lease payments is the rate implicit in the lease unless that rate cannot be readily determined, in which case, the Company utilizes its incremental borrowing rate in determining the present value of the future lease payments. The incremental borrowing rate is the rate of interest that the Company would have to pay to borrow on a collateralized basis over a similar term an amount equal to the lease payments in a similar economic environment. Operating lease ROU assets may also include any cumulative prepaid or accrued rent when the lease payments are uneven throughout the lease term. The ROU assets and lease liabilities may also include options to extend or terminate the lease when it is reasonably certain that the Company will exercise that option. The ROU asset includes any lease payments made and lease incentives received prior to the commencement date. The Company has lease
51
arrangements with lease and non-lease components which are accounted for separately. Non-lease components of the lease payments are expensed as incurred and are not included in determining the present value.
Finance Leases - ROU assets related to finance leases are presented in Property, plant and equipment, net on the consolidated balance sheet. Lease liabilities related to finance leases are presented in Current maturities of long-term debt and Long-term debt, less current maturities on the consolidated balance sheet.
Finance lease ROU assets and lease liabilities are recognized at the commencement date based on the present value of the future lease payments over the lease term. The discount rate used to determine the present value of the lease payments is the rate implicit in the lease unless that rate cannot be readily determined, in which case, the Company utilizes its incremental borrowing rate in determining the present value of the future lease payments. The incremental borrowing rate is the rate of interest that the Company would have to pay to borrow on a collateralized basis over a similar term an amount equal to the lease payments in a similar economic environment.
The components of lease costs were as follows:
| FISCAL YEAR ENDED APRIL 30, | ||||||||||||||||||||
| (in thousands) | 2022 | 2021 | 2020 | |||||||||||||||||
| Finance lease cost: | ||||||||||||||||||||
| Reduction in the carrying value of right-of-use assets | $ | $ | $ | |||||||||||||||||
| Interest on lease liabilities | ||||||||||||||||||||
| Operating lease cost | ||||||||||||||||||||
Additional information related to leases was as follows:
| FISCAL YEAR ENDED APRIL 30, | ||||||||||||||||||||
| (in thousands) | 2022 | 2021 | 2020 | |||||||||||||||||
| Cash paid for amounts included in the measurement of lease liabilities: | ||||||||||||||||||||
| Operating cash flows for finance leases | $ | $ | $ | |||||||||||||||||
| Operating cash flows for operating leases | ||||||||||||||||||||
| Financing cash flows for financing leases | ||||||||||||||||||||
| Right-of-use assets obtained in exchange for new finance lease liabilities | ||||||||||||||||||||
| Right-of-use assets obtained in exchange for new operating lease liabilities | ||||||||||||||||||||
| Weighted average remaining lease term (years) | ||||||||||||||||||||
| Weighted average remaining lease term - finance leases | ||||||||||||||||||||
| Weighted average remaining lease term - operating leases | ||||||||||||||||||||
| Weighted average discount rate | ||||||||||||||||||||
| Weighted average discount rate - finance leases | % | % | % | |||||||||||||||||
| Weighted average discount rate - operating leases | % | % | % | |||||||||||||||||
52
The following is a reconciliation of future undiscounted cash flows to the operating and finance lease liabilities, and the related ROU assets, presented on the consolidated balance sheet as of April 30, 2022:
| FISCAL YEAR | OPERATING (in thousands) | FINANCING (in thousands) | ||||||||||||
| 2023 | $ | $ | ||||||||||||
| 2024 | ||||||||||||||
| 2025 | ||||||||||||||
| 2026 | ||||||||||||||
| 2027 | ||||||||||||||
| Thereafter | ||||||||||||||
| Total lease payments | ||||||||||||||
| Less imputed interest | ( | ( | ||||||||||||
| Total lease liability | $ | $ | ||||||||||||
| ( | ( | |||||||||||||
| $ | $ | |||||||||||||
| $ | $ | |||||||||||||
NOTE P — Restructuring Charges
During June 2020, the Company's Board approved the closure and eventual disposal of its manufacturing plant located in Humboldt, Tennessee. Operations ceased at the Humboldt plant in July 2020. During the third quarter of fiscal 2021, the Company sold the Humboldt plant and recognized a gain of $2.3 million on the sale. During fiscal 2022 and 2021, the Company recognized pre-tax restructuring charges, net of $0.3 million and $4.4 million, respectively, related to the closure of the plant.
In the fourth quarter of fiscal 2020 and the first quarter of fiscal 2021, the Company implemented nationwide reductions in force, which were substantially completed in the fourth quarter of fiscal 2020 and first quarter of fiscal 2021. During fiscal 2022, 2021 and 2020, the Company recognized pre-tax restructuring charges, net of $(0.1 ) million, $1.4 million and $0.2 million, respectively, related to these reductions in force, which were primarily severance and separation costs.
During fiscal years 2022, 2021, and 2020, the Company recognized total pre-tax restructuring charges, net of $0.2 million, $5.8 million, and $(18,000 ), respectively.
Note Q — Fair Value Measurements
The Company utilizes the hierarchy of fair value measurements to classify certain of its assets and liabilities based upon the following definitions:
Level 1 – Investments with quoted prices in active markets for identical assets or liabilities. The Company's cash equivalents are invested in money market funds, mutual funds and certificates of deposit. The Company's mutual fund investment assets represent contributions made and invested on behalf of the Company's named executive officers in a supplementary employee retirement plan.
Level 2 – Investments with observable inputs other than Level 1 prices such as quoted prices for similar assets or liabilities; quoted prices in markets that are not active; or other inputs that are observable or can be corroborated by observable market data for substantially the full term of the assets or liabilities.
Level 3 – Investments with unobservable inputs that are supported by little or no market activity and that are significant to the fair value of the assets or liabilities. The Company has no Level 3 assets or liabilities measured on a recurring basis.
The fair value measurement of assets held by the Company's defined benefit pension plans is discussed in Note I.
The Company's financial instruments include cash and equivalents, marketable securities, and other investments; accounts receivable and accounts payable; interest rate swap and foreign exchange forward contracts; and short- and long-term debt. The carrying values of cash and equivalents, accounts receivable and payable, and short-term debt on the condensed consolidated
53
balance sheets approximate their fair value due to the short maturities of these items. The interest rate swap and foreign exchange forward contracts were marked to market and therefore represent fair value. The fair values of these contracts are determined based on inputs that are readily available in public markets or can be derived from information available in publicly quoted markets. The following table summarizes the fair value of assets and liabilities that are recorded in the Company's consolidated financial statements as of April 30, 2022 and 2021 at fair value on a recurring basis (in thousands):
| FAIR VALUE MEASUREMENTS AS OF APRIL 30, 2022 | |||||||||||||||||
| LEVEL 1 | LEVEL 2 | LEVEL 3 | |||||||||||||||
| ASSETS: | |||||||||||||||||
| Mutual funds | $ | $ | $ | ||||||||||||||
| Interest rate swap contracts | |||||||||||||||||
| Total assets at fair value | $ | $ | $ | ||||||||||||||
| FAIR VALUE MEASUREMENTS AS OF APRIL 30, 2021 | |||||||||||||||||
| LEVEL 1 | LEVEL 2 | LEVEL 3 | |||||||||||||||
| ASSETS: | |||||||||||||||||
| Mutual funds | $ | $ | $ | ||||||||||||||
54
Report of Independent Registered Public Accounting Firm
To the Shareholders and Board of Directors
American Woodmark Corporation:
Opinion on the Consolidated Financial Statements
We have audited the accompanying consolidated balance sheets of American Woodmark Corporation and subsidiaries (the Company) as of April 30, 2022 and 2021, the related consolidated statements of operations, comprehensive income, shareholders’ equity, and cash flows for each of the years in the three-year period ended April 30, 2022, and the related notes and financial statement schedule II (collectively, the consolidated financial statements). In our opinion, the consolidated financial statements present fairly, in all material respects, the financial position of the Company as of April 30, 2022 and 2021, and the results of its operations and its cash flows for each of the years in the three-year period ended April 30, 2022, in conformity with U.S. generally accepted accounting principles.
We also have audited, in accordance with the standards of the Public Company Accounting Oversight Board (United States) (PCAOB), the Company’s internal control over financial reporting as of April 30, 2022, based on criteria established in Internal Control – Integrated Framework (2013) issued by the Committee of Sponsoring Organizations of the Treadway Commission, and our report dated June 29, 2022 expressed an adverse opinion on the effectiveness of the Company’s internal control over financial reporting.
Change in Accounting Principle
As discussed in Note A to the consolidated financial statements, the Company has elected to change its method of accounting for inventory costing from the LIFO method to the FIFO method as of May 1, 2019.
Basis for Opinion
These consolidated financial statements are the responsibility of the Company’s management. Our responsibility is to express an opinion on these consolidated financial statements based on our audits. We are a public accounting firm registered with the PCAOB and are required to be independent with respect to the Company in accordance with the U.S. federal securities laws and the applicable rules and regulations of the Securities and Exchange Commission and the PCAOB.
We conducted our audits in accordance with the standards of the PCAOB. Those standards require that we plan and perform the audit to obtain reasonable assurance about whether the consolidated financial statements are free of material misstatement, whether due to error or fraud. Our audits included performing procedures to assess the risks of material misstatement of the consolidated financial statements, whether due to error or fraud, and performing procedures that respond to those risks. Such procedures included examining, on a test basis, evidence regarding the amounts and disclosures in the consolidated financial statements. Our audits also included evaluating the accounting principles used and significant estimates made by management, as well as evaluating the overall presentation of the consolidated financial statements. We believe that our audits provide a reasonable basis for our opinion.
Critical Audit Matter
The critical audit matter communicated below is a matter arising from the current period audit of the consolidated financial statements that was communicated or required to be communicated to the audit committee and that: (1) relates to accounts or disclosures that are material to the consolidated financial statements and (2) involved our especially challenging, subjective, or complex judgments. The communication of a critical audit matter does not alter in any way our opinion on the consolidated financial statements, taken as a whole, and we are not, by communicating the critical audit matter below, providing a separate opinion on the critical audit matter or on the accounts or disclosures to which it relates.
Assessment of goodwill recoverability
As discussed in Note A to the consolidated financial statements and disclosed in the consolidated balance sheet, the carrying amount of goodwill as of April 30, 2022 was $767.6 million. The Company evaluates its goodwill for impairment annually on February 1, or whenever events or changes in circumstances indicate that it is more likely than not the carrying value of goodwill may not be recoverable. The Company performed a qualitative impairment test for goodwill which resulted in no impairment.
55
We identified the assessment of events or changes in circumstances that may indicate that the fair value of the reporting unit is below its carrying value as a critical audit matter. A higher degree of auditor judgment was required to evaluate these events or changes in circumstances as a result of uncertainty in the economy, including raw material costs. These events or changes in circumstances could have a significant effect on the Company’s qualitative impairment assessment and the determination of whether further quantitative analysis of goodwill impairment was required.
The following are the primary procedures we performed to address this critical audit matter. We evaluated the design and tested the operating effectiveness of certain controls related to the goodwill process. This included a control related to the Company’s assessment of events or changes in circumstances, including raw material costs, that may indicate the fair value of the reporting unit is below its carrying value. We evaluated the Company’s assessment of events or changes in circumstances that may indicate the fair value of the reporting unit is below its carrying value through comparison to the Company’s market capitalization and macroeconomic information contained in third-party analyst reports on the Company and other third-party information.
/s/ KPMG LLP
We have served as the Company's auditor since 2004.
Richmond, Virginia
June 29, 2022
56
Report of Independent Registered Public Accounting Firm
To the Shareholders and Board of Directors
American Woodmark Corporation:
Opinion on Internal Control Over Financial Reporting
We have audited American Woodmark Corporation and subsidiaries' (the Company) internal control over financial reporting as of April 30, 2022, based on criteria established in Internal Control – Integrated Framework (2013) issued by the Committee of Sponsoring Organizations of the Treadway Commission. In our opinion, because of the effect of the material weaknesses, described below, on the achievement of the objectives of the control criteria, the Company has not maintained effective internal control over financial reporting as of April 30, 2022, based on criteria established in Internal Control – Integrated Framework (2013) issued by the Committee of Sponsoring Organizations of the Treadway Commission.
We also have audited, in accordance with the standards of the Public Company Accounting Oversight Board (United States) (PCAOB), the consolidated balance sheets of the Company as of April 30, 2022 and 2021, the related consolidated statements of operations, comprehensive income, shareholders’ equity, and cash flows for each of the years in the three-year period ended April 30, 2022, and the related notes and financial statement schedule II (collectively, the consolidated financial statements), and our report dated June 29, 2022 expressed an unqualified opinion on those consolidated financial statements.
A material weakness is a deficiency, or a combination of deficiencies, in internal control over financial reporting, such that there is a reasonable possibility that a material misstatement of the company’s annual or interim financial statements will not be prevented or detected on a timely basis. The material weaknesses related to the following have been identified and included in management’s assessment.
The Company did not have effective general information technology controls (GITCs) related to information technology (IT) change management within the Made to Order (MTO) business environment. Further, the Company did not have effective controls in the MTO change management process to ensure changes were tested and approved by management on a timely basis. As a result, process level automated controls and manual controls that are dependent on the completeness and accuracy of information derived from the affected IT systems were ineffective because they could have been adversely impacted.
The Company did not have effective GITCs related to the enterprise resource planning (ERP) system implemented in the fourth fiscal quarter of the year that impacted processes related to procurement, general ledger, accounts payable, and projects and fixed assets. As a result, process level automated controls and manual controls that are dependent on the completeness and accuracy of information derived from the affected IT system were ineffective because they had not been designed and implemented or because they could have been adversely impacted. These deficiencies resulted from ineffective risk assessment and monitoring activities related to the implementation of the ERP system.
The material weaknesses were considered in determining the nature, timing, and extent of audit tests applied in our audit of the 2022 consolidated financial statements, and this report does not affect our report on those consolidated financial statements.
Basis for Opinion
The Company’s management is responsible for maintaining effective internal control over financial reporting and for its assessment of the effectiveness of internal control over financial reporting, included in the accompanying Management's Annual Report on Internal Control over Financial Reporting. Our responsibility is to express an opinion on the Company’s internal control over financial reporting based on our audit. We are a public accounting firm registered with the PCAOB and are required to be independent with respect to the Company in accordance with the U.S. federal securities laws and the applicable rules and regulations of the Securities and Exchange Commission and the PCAOB.
We conducted our audit in accordance with the standards of the PCAOB. Those standards require that we plan and perform the audit to obtain reasonable assurance about whether effective internal control over financial reporting was maintained in all material respects. Our audit of internal control over financial reporting included obtaining an understanding of internal control over financial reporting, assessing the risk that a material weakness exists, and testing and evaluating the design and operating effectiveness of internal control based on the assessed risk. Our audit also included performing such other procedures as we considered necessary in the circumstances. We believe that our audit provides a reasonable basis for our opinion.
57
Definition and Limitations of Internal Control Over Financial Reporting
A company’s internal control over financial reporting is a process designed to provide reasonable assurance regarding the reliability of financial reporting and the preparation of financial statements for external purposes in accordance with generally accepted accounting principles. A company’s internal control over financial reporting includes those policies and procedures that (1) pertain to the maintenance of records that, in reasonable detail, accurately and fairly reflect the transactions and dispositions of the assets of the company; (2) provide reasonable assurance that transactions are recorded as necessary to permit preparation of financial statements in accordance with generally accepted accounting principles, and that receipts and expenditures of the company are being made only in accordance with authorizations of management and directors of the company; and (3) provide reasonable assurance regarding prevention or timely detection of unauthorized acquisition, use, or disposition of the company’s assets that could have a material effect on the financial statements.
Because of its inherent limitations, internal control over financial reporting may not prevent or detect misstatements. Also, projections of any evaluation of effectiveness to future periods are subject to the risk that controls may become inadequate because of changes in conditions, or that the degree of compliance with the policies or procedures may deteriorate.
/s/ KPMG LLP
Richmond, Virginia
June 29, 2022
58
Item 9. CHANGES IN AND DISAGREEMENTS WITH ACCOUNTANTS ON ACCOUNTING AND FINANCIAL DISCLOSURE
None.
Item 9A. CONTROLS AND PROCEDURES
Evaluation of Disclosure Controls and Procedures.
The Company’s management evaluated, with the participation of the Company’s principal executive officer and principal financial officer, the effectiveness of the Company’s disclosure controls and procedures (as defined in Rules 13a-15(e) and 15d-15(e) under the Securities Exchange Act of 1934, as amended (the Exchange Act)) as of April 30, 2022. Based on this evaluation, Company management, including the principal executive officer and principal financial officer, concluded that the Company’s disclosure controls and procedures were not effective as of April 30, 2022 because of two material weaknesses in internal control over financial reporting described below.
Notwithstanding such material weaknesses in our internal control over financial reporting, Company management, including our principal executive officer and principal financial officer, concluded that our consolidated financial statements in this Annual Report present fairly, in all material respects, our financial position, results of operations and cash flows for the periods presented, in conformity with U.S. generally accepted accounting principles.
Management’s Annual Report on Internal Control over Financial Reporting.
Management is responsible for establishing and maintaining adequate internal control over financial reporting, as defined in Rules 13a-15(f) and 15d-15(f) under the Exchange Act. Our internal control over financial reporting is designed to provide reasonable assurance regarding the reliability of financial reporting and the preparation of financial statements for external purposes in accordance with U.S. generally accepted accounting principles and includes those policies and procedures that (1) pertain to the maintenance of records that, in reasonable detail, accurately and fairly reflect the transactions and dispositions of the assets of the Company; (2) provide reasonable assurance that transactions are recorded as necessary to permit preparation of financial statements in accordance with generally accepted accounting principles, and that receipts and expenditures of the Company are being made only in accordance with authorizations of management and directors of the Company; and (3) provide reasonable assurance regarding prevention or timely detection of unauthorized acquisition, use, or disposition of the Company’s assets that could have a material effect on the financial statements. All internal control systems, no matter how well designed and operated, have inherent limitations. Because of these inherent limitations, a system of internal control over financial reporting may not prevent or detect misstatements, and even those systems determined to be effective can provide only reasonable assurance with respect to financial statement preparation and presentation.
A material weakness is a deficiency, or combination of deficiencies, in internal control over financial reporting, such that there is a reasonable possibility that a material misstatement of annual or interim financial statements will not be prevented or detected on a timely basis.
Management, under the supervision of our principal executive officer and principal financial officer, and under the oversight of the Audit Committee, conducted an assessment of the Company’s internal control over financial reporting as of April 30, 2022, using the criteria set forth by the Committee of Sponsoring Organizations of the Treadway Commission in Internal Control-Integrated Framework (2013). Based on its assessment, our management concluded that the Company’s internal control over financial reporting was not effective as of April 30, 2022 because of the material weaknesses in our internal control over financial reporting described below.
Information Technology Change Management
The Company did not have effective general information technology controls (GITCs) related to information technology (IT) change management within the Made to Order (MTO) business environment. Specifically, the Company did not have proper segregation of duties between users that develop systems updates and have access to migrate database changes into production. Further, the Company did not have effective controls in the MTO change management process to ensure changes were tested and approved by management on a timely basis. As a result, process level automated controls and manual controls that are dependent on the completeness and accuracy of information derived from the affected IT systems were ineffective because they could have been adversely impacted.
Risk Assessment, Control Activities and Monitoring Activities Related to New System Implementation
The Company did not have effective GITCs related to the enterprise resource planning (ERP) system implemented in the fourth fiscal quarter of the year that impacted processes related to procurement, general ledger, accounts payable, and projects and fixed assets. The Company did not design and maintain effective user access controls that adequately restricted or monitored user and privileged access to the IT environment. Further, program change, and computer operations controls related to the IT environment, which are dependent upon the adequate design and effectiveness of user access controls, were also ineffective, because of the ineffective user access and monitoring controls. As a result, process level automated controls and manual controls that are dependent on the completeness and accuracy of information derived from the affected IT system were
59
ineffective because they had not been designed and implemented or because they could have been adversely impacted. These deficiencies resulted from ineffective risk assessment and monitoring activities related to the implementation of the ERP system.
We did not identify any misstatements to the consolidated financial statements as of and for the year ended April 30, 2022 because of these control deficiencies. However, these control deficiencies created a reasonable possibility that a material misstatement to the consolidated financial statements would not be prevented or detected on a timely basis, and therefore we concluded that the deficiencies represent material weaknesses in our internal control over financial reporting and our internal control over financial reporting was not effective as of April 30, 2022.
The Company’s independent registered public accounting firm, KPMG LLP (KPMG), who audited the consolidated financial statements included in this report, has issued an adverse opinion on the effectiveness of the Company’s internal control over financial reporting. KPMG’s report appears beginning on page 58 of this Annual Report.
Remediation Plans
We plan to implement several steps, as described below, to remediate the material weaknesses described in this Item 9A. Company management is committed to take the necessary steps to ensure that our internal control over financial reporting is designed and operating effectively.
Information Technology Change Management
Our remediation/mitigation plan includes, but is not limited to:
a.The deployment of Netwrix/SQL Monitor to track all changes that occur within the production environment with biweekly management reviews.
b.Immediate removal of developer access to monitoring logs and the hiring of a Database Administrator to support and remove developer access to the production environment.
c.Enhance the procedures to include additional review and approval by the appropriate personnel, prior to deployment.
d.Additional training for staff and management to ensure completeness and accuracy of the monitoring activities.
Risk Assessment, Control Activities and Monitoring Activities Related to New System Implementation
We are actively evaluating available remediation options, and expect our remediation plan to include, but not be limited to, an organizational assessment to ensure capable skillsets are responsible for managing applicable controls and processes and the assessment and implementation of a tool set that provides structure and detective privileged access monitoring capability. Once we decide on a final remediation plan, appropriate funding approval, project planning and detailed scheduling will be completed and a target date for implementation will be selected. We will provide additional details concerning our remediation plan for this material weakness in future periodic reports once the remediation plan is finalized.
Except for the implementation of the ERP system discussed above, there has been no change in the Company’s internal control over financial reporting during the fiscal quarter ended April 30, 2022, that has materially affected, or is reasonably likely to materially affect, the Company’s internal control over financial reporting.
Item 9B. OTHER INFORMATION
None.
PART III
Item 10. DIRECTORS, EXECUTIVE OFFICERS AND CORPORATE GOVERNANCE
In response to this Item, and in accordance with General Instruction G(3) of Form 10-K:
(1)the information concerning the Company's directors is set forth under the caption "Item 1 - Election of Directors - Information Regarding Nominees" in the Company's Proxy Statement for its Annual Meeting of Shareholders to be held on August 18, 2022 ("Proxy Statement") and is incorporated in this Item by reference;
(2)the information concerning the Company's executive officers is set forth under the caption "Executive Officers of the Registrant" in Part I of this report and is incorporated in this Item by reference;
(3)the information concerning compliance with Section 16(a) of the Exchange Act is set forth under the caption "Delinquent Section 16(a) Reports" in the Proxy Statement and is incorporated in this Item by reference;
60
(4)the information concerning the Code of Business Conduct and Ethics governing the Company's Chief Executive Officer, Chief Financial Officer, Controller, and Treasurer is set forth under the caption "Corporate Governance – Codes of Business Conduct and Ethics" in the Proxy Statement and is incorporated in this Item by reference;
(5)the information concerning material changes, if any, in the procedures by which security holders may recommend nominees to the Company's Board of Directors is set forth under the caption "Corporate Governance – Procedures for Shareholder Nominations of Directors" in the Proxy Statement and is incorporated in this Item by reference; and
(6)the information concerning the Audit Committee of the Company's Board of Directors, including the members of the Audit Committee and the Board's determination concerning whether certain members of the Audit Committee are "audit committee financial experts" as that term is defined under Item 407(d)(5) of Regulation S-K is set forth under the captions "Corporate Governance – Board of Directors and Committees – Audit Committee" in the Proxy Statement and is incorporated in this Item by reference.
Item 11. EXECUTIVE COMPENSATION
In response to this Item, and in accordance with General Instruction G(3) of Form 10-K, the information set forth under the captions "Executive Compensation," "Compensation Committee Report," "Compensation Committee Interlocks and Insider Participation," "Company's Compensation Policies and Practices Relating to Risk Management" and "Non-Management Directors' Compensation" in the Proxy Statement is incorporated in this Item by reference.
Item 12. SECURITY OWNERSHIP OF CERTAIN BENEFICIAL OWNERS AND MANAGEMENT AND RELATED STOCKHOLDER MATTERS
In response to this Item, and in accordance with General Instruction G(3) of Form 10-K, the information set forth under the caption "Security Ownership" in the Proxy Statement is incorporated in this Item by reference.
Equity Compensation Plans
The following table summarizes information about the Company's equity compensation plans as of April 30, 2022:
| Equity Compensation Plan Information | ||||||||||||||||||||
| Plan Category | Number of securities to be issued upon exercise of outstanding options, warrants and rights | Weighted average exercise price of outstanding options, warrants and rights | Number of securities remaining available for future issuance under equity compensation plans (excluding securities reflected in column (a)) | |||||||||||||||||
| (a) | (b) | (c) | ||||||||||||||||||
Equity compensation plans approved by security holders(1) | — | $ | — | 508,968 | ||||||||||||||||
| Options | — | $ | — | |||||||||||||||||
| Performance-based restricted stock units | 154,610 | N/A | (2) | |||||||||||||||||
| Service-based restricted stock units | 147,234 | N/A | (2) | |||||||||||||||||
Equity compensation plans not approved by security holders(3) | — | $ | — | — | ||||||||||||||||
| Total | 301,844 | $ | — | 508,968 | ||||||||||||||||
| (1) | At April 30, 2022, the Company had restricted stock unit awards outstanding under two different plans: 2016 Employee Stock Incentive Plan and 2015 Non-Employee Directors Restricted Stock Unit Plan. | ||||
| (2) | Excludes exercise price for restricted stock units issued under the 2016 Employee Stock Incentive Plan and 2015 Non-Employee Directors Restricted Stock Unit Plan because they are converted into common stock on a one-for-one basis at no additional cost. | ||||
| (3) | The Company does not have equity compensation plans that have not been approved by the Company's security holders. | ||||
61
Item 13. CERTAIN RELATIONSHIPS AND RELATED TRANSACTIONS, AND DIRECTOR INDEPENDENCE
In response to this Item, and in accordance with General Instruction G(3) of Form 10-K, the information set forth under the captions "Certain Related Party Transactions" and "Corporate Governance – Director Independence" in the Proxy Statement is incorporated in this Item by reference.
Item 14. PRINCIPAL ACCOUNTING FEES AND SERVICES
In response to this Item, and in accordance with General Instruction G(3) of Form 10-K, the information concerning fees and services of the Company's principal accounting firm set forth under the captions "Report of the Audit Committee - Independent Auditor Fee Information" and "Report of the Audit Committee - Pre-Approval Policies and Procedures" in the Proxy Statement is incorporated in this Item by reference.
PART IV
Item 15. EXHIBITS AND FINANCIAL STATEMENT SCHEDULES
(a)1. Financial Statements
The following consolidated financial statements of American Woodmark Corporation are incorporated by reference to Item 8 of this report:
Consolidated Balance Sheets as of April 30, 2022 and 2021.
Consolidated Statements of Income – for each year of the three-year period ended April 30, 2022.
Consolidated Statements of Comprehensive Income – for each year of the three-year period ended April 30, 2022.
Consolidated Statements of Shareholders' Equity – for each year of the three-year period ended April 30, 2022.
Consolidated Statements of Cash Flows – for each year of the three-year period ended April 30, 2022.
Notes to Consolidated Financial Statements.
Report of Independent Registered Public Accounting Firm.(KPMG LLP , Richmond, VA , Auditor Firm ID: 185 )
Management's Annual Report on Internal Control over Financial Reporting.
Report of Independent Registered Public Accounting Firm – Internal Control over Financial Reporting.
(a)2.Financial Statement Schedules
The following financial statement schedule is filed as a part of this Form 10-K:
Schedule II – Valuation and Qualifying Accounts for each year of the three-year period ended April 30, 2022.
Schedules other than the one listed above are omitted either because they are not required or are inapplicable.
(a)3.Exhibits
| Articles of Incorporation as amended effective August 12, 1987 (incorporated by reference to Exhibit 3.1 to the Registrant's Form 10-Q for the quarter ended January 31, 2003; Commission File No. 000-14798). | |||||
| Articles of Amendment to the Articles of Incorporation effective September 10, 2004 (incorporated by reference to Exhibit 3.1 to the Registrant's Form 8-K as filed on August 31, 2004; Commission File No. 000-14798). | |||||
| Bylaws – as amended effective May 24, 2022 (incorporated by reference to Exhibit 3.1 to the Registrant's Form 8-K as filed on May 25, 2022; Commission File No. 000-14798).. | |||||
| 4.1 | The Articles of Incorporation and Bylaws of the Registrant as currently in effect (incorporated by reference to Exhibits 3.1 and 3.2). | ||||
62
| Description of Capital Stock (incorporated by reference to Exhibit 4.4 to the Registrant's Form 10-K for the fiscal year ended April 30, 2019; Commission File No. 000-14798). | |||||
| Pursuant to Regulation S-K, Item 601(b)(4)(iii), instruments that define the rights of holders of the Registrant's long-term debt securities, where the long-term debt securities authorized under each such instrument do not exceed 10% of the Registrant's total assets, have been omitted and will be furnished to the Securities and Exchange Commission upon request. | |||||
Amendment and Restatement Agreement, dated as of April 22, 2021, by and among American Woodmark Corporation, each Subsidiary of American Woodmark Corporation party thereto, the Lenders party thereto and Wells Fargo Bank, National Association, as Administrative Agent (incorporated by reference to Exhibit 10.1 to the Registrant's Form 8-K as filed on April 26, 2021; Commission File No. 000-14798). | |||||
Amended and Restated Credit Agreement, dated as of April 22, 2021, by and among American Woodmark Corporation, as Borrower, the Lenders referred to therein as Lenders and Wells Fargo Bank, National Association, as Administrative Agent, Swingline Lender and Issuing Lender (incorporated by reference to Exhibit 10.2 to the Registrant's Form 8-K as filed on April 26, 2021; Commission File No. 000-14798). | |||||
| 2015 Non-Employee Directors Restricted Stock Unit Plan (incorporated by reference to Appendix A to the Registrant's Definitive Proxy Statement on Schedule 14A as filed on June 30, 2015; Commission File No. 000-14798). | |||||
| Employment Agreement for Mr. M. Scott Culbreth (incorporated by reference to Exhibit 10.1 to the Registrant's Form 8-K/A as filed on August 25, 2020; Commission File No. 000-14798).* | |||||
| Employment Agreement for Mr. Robert J. Adams, Jr. (incorporated by reference to Exhibit 10.3 to the Registrant's Form 8-K as filed on August 31, 2015; Commission File No. 000-14798).* | |||||
| Amendment to Employment Agreement for Mr. Robert J. Adams, Jr. (incorporated by reference to Exhibit 10.4 to the Registrant's Form 8-K as filed on May 29, 2019; Commission File No. 000-14798).* | |||||
Employment Agreement for Mr. Paul Joachimczyk (incorporated by reference to Exhibit 10.2 to the Registrant's Form 8-K/A filed on August 25, 2020; Commission File No. 000-14798). | |||||
Employment Agreement for Ms. Teresa M. May (incorporated by reference to Exhibit 10.8(c) to the Registrant's Form 10-Q filed on August 26, 2020; Commission File No. 000-14798). | |||||
| Equipment Lease, dated as of June 30, 2004, between the Company and the West Virginia Economic Development Authority (incorporated by reference to Exhibit 10.1(l) to the Registrant's Form 10-Q for the quarter ended July 31, 2004; Commission File No. 000-14798). | |||||
| West Virginia Facility Lease, dated as of July 30, 2004, between the Company and the West Virginia Economic Development Authority (incorporated by reference to Exhibit 10.1(m) to the Registrant's Form 10-Q for the quarter ended July 31, 2004; Commission File No. 000-14798). | |||||
| 2016 Employee Stock Incentive Plan (incorporated by reference to Exhibit A to the Registrant's Definitive Proxy Statement on Schedule 14A as filed on June 29, 2016; Commission File No. 000-14798). | |||||
| Form of Grant Letter used in connection with awards of service-based restricted stock units granted under the Company's 2016 Employee Stock Incentive Plan (incorporated by reference to Exhibit 10.1(a) to the Registrant's Form 10-Q for the quarter ended July 31, 2017; Commission File No. 000-14798).* | |||||
| Form of Grant Letter used in connection with awards of performance-based restricted stock units granted under the Company's 2016 Employee Stock Incentive Plan (incorporated by reference to Exhibit 10.1(b) to the Registrant's Form 10-Q for the quarter ended July 31, 2017; Commission File No. 000-14798).* | |||||
| Form of Grant Letter used in connection with awards of cultural-based restricted stock units granted under the Company's 2016 Employee Stock Incentive Plan (incorporated by reference to Exhibit 10.1(c) to the Registrant's Form 10-Q for the quarter ended July 31, 2017; Commission File No. 000-14798).* | |||||
| Letter of KPMG, LLP, dated as of May 27, 2022, to the Securities and Exchange Commission (incorporated by reference to the Registrant's Current Report on Form 8-K filed May 27, 2022; Commission File No. 000-14798).* | |||||
| Subsidiaries of the Company (Filed Herewith). | |||||
| Consent of KPMG LLP, Independent Registered Public Accounting Firm (Filed Herewith). | |||||
| Certification of the Chief Executive Officer Pursuant to Rule 13a-14(a) of the Exchange Act (Filed Herewith). | |||||
| Certification of the Chief Financial Officer Pursuant to Rule 13a-14(a) of the Exchange Act (Filed Herewith). | |||||
63
| Certification of the Chief Executive Officer and Chief Financial Officer Pursuant to Rule 13a-14(b) of the Exchange Act and 18 U.S.C. Section 1350, as Adopted Pursuant to Section 906 of the Sarbanes-Oxley Act of 2002 (Furnished Herewith). | |||||
| 101 | Interactive Data File for the Registrant's Annual Report on Form 10-K for the year ended April 30, 2022 formatted in Inline XBRL (Inline eXtensible Business Reporting Language): (i) Consolidated Balance Sheets, (ii) Consolidated Statements of Operations, (iii) Consolidated Statements of Comprehensive Income (Loss); (iv) Consolidated Statements of Shareholders' Equity, (v) Consolidated Statements of Cash Flows, and (vi) Notes to Consolidated Financial Statements (Filed Herewith). | ||||
| 104 | Cover Page Interactive Data File (formatted in Inline XBRL and contained in Exhibit 101). | ||||
*Management contract or compensatory plan or arrangement.
64
Schedule II - Valuation and Qualifying Accounts
AMERICAN WOODMARK CORPORATION
(In Thousands)
| Description (a) | Balance at Beginning of Year | Additions (Reductions) Charged to Cost and Expenses | Other | Deductions | Balance at End of Year | ||||||||||||||||||||||||
| Year ended April 30, 2022: | |||||||||||||||||||||||||||||
| Allowance for doubtful accounts | $ | $ | $ | $ | ( | (b) | $ | ||||||||||||||||||||||
| Reserve for cash discounts | $ | $ | (c) | $ | $ | ( | (d) | $ | |||||||||||||||||||||
| Reserve for sales returns and allowances | $ | $ | (c) | $ | $ | ( | $ | ||||||||||||||||||||||
| Year ended April 30, 2021: | |||||||||||||||||||||||||||||
| Allowance for doubtful accounts | $ | $ | $ | $ | ( | (b) | $ | ||||||||||||||||||||||
| Reserve for cash discounts | $ | $ | (c) | $ | $ | ( | (d) | $ | |||||||||||||||||||||
| Reserve for sales returns and allowances | $ | $ | (c) | $ | $ | ( | $ | ||||||||||||||||||||||
| Year ended April 30, 2020: | |||||||||||||||||||||||||||||
| Allowance for doubtful accounts | $ | $ | $ | $ | ( | (b) | $ | ||||||||||||||||||||||
| Reserve for cash discounts | $ | $ | (c) | $ | $ | ( | (d) | $ | |||||||||||||||||||||
| Reserve for sales returns and allowances | $ | $ | (c) | $ | $ | ( | $ | ||||||||||||||||||||||
(a)All reserves relate to accounts receivable.
(b)Principally write-offs, net of collections.
(c)Reduction of gross sales.
(d)Cash discounts granted.
Item 16. Form 10-K Summary
None.
65
SIGNATURES
Pursuant to the requirements of Section 13 or 15(d) of the Securities Exchange Act of 1934, the registrant has duly caused this report to be signed on its behalf by the undersigned, thereunto duly authorized.
| American Woodmark Corporation | ||||||||
| (Registrant) | ||||||||
| June 29, 2022 | /s/ M. SCOTT CULBRETH | |||||||
| M. Scott Culbreth President and Chief Executive Officer | ||||||||
Pursuant to the requirements of the Securities Exchange Act of 1934, this report has been signed below by the following persons on behalf of the registrant and in the capacities and on the dates indicated.
| June 29, 2022 | /s/ M. SCOTT CULBRETH | June 29, 2022 | /s/ PAUL JOACHIMCZYK | |||||||||||||||||
| M. Scott Culbreth President and Chief Executive Officer (Principal Executive Officer) Director | Paul Joachimczyk Vice President and Chief Financial Officer (Principal Financial Officer and Principal Accounting Officer) | |||||||||||||||||||
| June 29, 2022 | /s/ LATASHA M. AKOMA | June 29, 2022 | /s/ ANDREW B. COGAN | |||||||||||||||||
| Latasha M. Akoma Director | Andrew B. Cogan Director | |||||||||||||||||||
| June 29, 2022 | /s/ JAMES G. DAVIS, JR. | June 29, 2022 | /s/ MARTHA M. HAYES | |||||||||||||||||
| James G. Davis, Jr. Director | Martha M. Hayes Director | |||||||||||||||||||
| June 29, 2022 | /s/ DANIEL T. HENDRIX | June 29, 2022 | /s/ DAVID A. RODRIGUEZ | |||||||||||||||||
| Daniel T. Hendrix Director | David A. Rodriguez Director | |||||||||||||||||||
| June 29, 2022 | /s/ VANCE W. TANG | June 29, 2022 | /s/ EMILY C. VIDETTO | |||||||||||||||||
| Vance W. Tang Director, Non-Executive Chair | Emily C. Videtto Director | |||||||||||||||||||
In accordance with Securities and Exchange Commission requirements, the Company will furnish copies of all exhibits to its Form 10-K not contained herein upon receipt of a written request and payment of $0.10 per page to:
Mr. Kevin Dunnigan
Treasury Director
American Woodmark Corporation
P.O. Box 1980
Winchester, Virginia 22604-8090
66
Serious News for Serious Traders! Try StreetInsider.com Premium Free!
You May Also Be Interested In
- Alpha Exploration Announces Final Assay Results Including 5m @ 11.03 g/t Gold at Aburna
- Nel ASA: Hy Stor Energy places gigawatt capacity reservation for Mississippi Clean Hydrogen Hub
- JD.com to Report First Quarter 2024 Financial Results on May 16, 2024
Create E-mail Alert Related Categories
SEC FilingsSign up for StreetInsider Free!
Receive full access to all new and archived articles, unlimited portfolio tracking, e-mail alerts, custom newswires and RSS feeds - and more!
