

Form 10-K 2U, Inc. For: Dec 31
 Tweet
Tweet Share
ShareUse these links to rapidly review the document
UNITED STATES
SECURITIES AND EXCHANGE COMMISSION
Washington, D.C. 20549
FORM 10-K
x | ANNUAL REPORT PURSUANT TO SECTION 13 OR 15(d) OF THE SECURITIES EXCHANGE ACT OF 1934 |
For the fiscal year ended December 31, 2018
or
¨ | TRANSITION REPORT PURSUANT TO SECTION 13 OR 15(d) OF THE SECURITIES EXCHANGE ACT OF 1934 |
For the transition period from to
Commission File Number: 001-36376

2U, INC.
(Exact name of registrant as specified in its charter)
Delaware (State or other jurisdiction of incorporation or organization) | 26-2335939 (I.R.S. Employer Identification No.) |
7900 Harkins Road, Lanham, MD (Address of principal executive offices) | 20706 (Zip Code) |
(301) 892-4350
Registrant’s telephone number, including area code:
Securities registered pursuant to Section 12(b) of the Act:
Title of each class: | Name of exchange on which registered: | |
Common Stock, $0.001 par value per share | The Nasdaq Global Select Market | |
Securities registered pursuant to Section 12(g) of the Act: None
Indicate by check mark if the registrant is a well-known seasoned issuer, as defined in Rule 405 of the Securities Act. Yes x No o
Indicate by check mark if the registrant is not required to file reports pursuant to Section 13 or Section 15(d) of the Act. Yes o No x
Indicate by check mark whether the registrant (1) has filed all reports required to be filed by Section 13 or 15(d) of the Securities Exchange Act of 1934 during the preceding 12 months (or for such shorter period that the registrant was required to file such reports), and (2) has been subject to such filing requirements for the past 90 days. Yes x No o
Indicate by check mark whether the registrant has submitted electronically every Interactive Data File required to be submitted pursuant to Rule 405 of Regulation S-T (§232.405 of this chapter) during the preceding 12 months (or for such shorter period that the registrant was required to submit such files). Yes x No o
Indicate by check mark if disclosure of delinquent filers pursuant to Item 405 of Regulation S-K is not contained herein, and will not be contained, to the best of registrant’s knowledge, in definitive proxy or information statements incorporated by reference in Part III of this Form 10-K or any amendment to this form 10-K. o
Indicate by check mark whether the registrant is a large accelerated filer, an accelerated filer, a non-accelerated filer, a smaller reporting company, or an emerging growth company. See the definitions of “large accelerated filer,” “accelerated filer,” “smaller reporting company” and “emerging growth company” in Rule 12b-2 of the Exchange Act.
Large accelerated filer x | Accelerated filer o | Non-accelerated filer o | Smaller reporting company o Emerging growth company o | |||
If an emerging growth company, indicate by check mark if the registrant has elected not to use the extended transition period for complying with any new or revised financial accounting standards provided pursuant to Section 13(a) of the Exchange Act. o
Indicate by check mark whether the registrant is a shell company (as defined in Rule 12b-2 of the Exchange Act). Yes o No x
The aggregate market value of the 49,091,151 shares held by non-affiliates as of June 30, 2018 (computed based on the closing price on such date as reported on The Nasdaq Global Select Market) was $4,102,056,578.
As of February 20, 2019, there were 58,141,860 shares of the registrant’s common stock, par value $0.001 per share, outstanding.
DOCUMENTS INCORPORATED BY REFERENCE
Portions of the Company’s definitive proxy statement, to be filed pursuant to Regulation 14A under the Securities Exchange Act of 1934, for its 2019 Annual Meeting of Stockholders are incorporated by reference in Part III of this Form 10-K.
2U, Inc.
FORM 10-K
TABLE OF CONTENTS
PAGE | ||||
1
SPECIAL NOTE REGARDING FORWARD-LOOKING STATEMENTS
This Annual Report on Form 10-K contains forward-looking statements within the meaning of the Private Securities Litigation Reform Act of 1995 and which are subject to substantial risks and uncertainties. In some cases, you can identify forward-looking statements by the words “may,” “might,” “will,” “could,” “would,” “should,” “expect,” “intend,” “plan,” “objective,” “anticipate,” “believe,” “estimate,” “predict,” “project,” “potential,” “continue” and “ongoing,” or the negative of these terms, or other comparable terminology intended to identify statements about the future. These statements involve known and unknown risks, uncertainties and other factors that may cause our actual results, levels of activity, performance or achievements to be materially different from the information expressed or implied by these forward-looking statements. Although we believe that we have a reasonable basis for each forward-looking statement contained in this Annual Report on Form 10-K, we caution you that these statements are based on a combination of facts and factors currently known by us and our expectations of the future, about which we cannot be certain. Factors which may cause actual results to differ materially from current expectations include, but are not limited to:
• | trends in the higher education market and the market for online education, and expectations for growth in those markets; |
• | the acceptance, adoption and growth of online learning by colleges and universities, faculty, students, employers, accreditors and state and federal licensing bodies; |
• | our ability to comply with evolving regulations and legal obligations related to data privacy, data protection and information security; |
• | our expectations about the potential benefits of our cloud-based software-as-a-service, or SaaS, technology and technology-enabled services to university clients and students; |
• | our dependence on third parties to provide certain technological services or components used in our platform; |
• | our ability to meet the anticipated launch dates of our graduate programs and short courses; |
• | our expectations about the predictability, visibility and recurring nature of our business model; |
• | our ability to acquire new university clients and expand our graduate programs and short courses with existing university clients; |
• | our ability to successfully integrate the operations of Get Educated International Proprietary Limited, or GetSmarter, achieve the expected benefits of the acquisition and manage, expand and grow the combined company; |
• | our ability to execute our growth strategy in the international, undergraduate and non-degree alternative markets; |
• | our ability to continue to acquire prospective students for our graduate programs and short courses; |
• | our ability to affect or increase student retention in our graduate programs; |
• | our ability to attract, hire and retain qualified employees; |
• | our expectations about the scalability of our cloud-based platform; |
• | our expectations regarding future expenses in relation to future revenue; |
• | potential changes in regulations applicable to us or our university clients; and |
• | our expectations regarding the amount of time our cash balances and other available financial resources will be sufficient to fund our operations. |
2
You should refer to the risks described in Part I, Item 1A “Risk Factors” in this Annual Report on Form 10-K for a discussion of important factors that may cause our actual results to differ materially from those expressed or implied by our forward-looking statements. As a result of these factors, we cannot assure you that the forward-looking statements in this Annual Report on Form 10-K will prove to be accurate. Furthermore, if our forward-looking statements prove to be inaccurate, the inaccuracy may be material. In light of the significant uncertainties in these forward-looking statements, you should not regard these statements as a representation or warranty by us or any other person that we will achieve our objectives and plans in any specified time frame, or at all. We undertake no obligation to publicly update any forward-looking statements, whether as a result of new information, future events or otherwise, except as required by law.
You should read this Annual Report on Form 10-K completely and with the understanding that our actual future results may be materially different from what we expect. We qualify all of our forward-looking statements by these cautionary statements.
In this Annual Report on Form 10-K, the terms “2U,” “Company,” “we,” “us,” and “our” refer to 2U, Inc. and its subsidiaries, unless the context indicates otherwise.
3
PART I
Item 1. Business
Our Mission
Our mission is to improve lives by eliminating the back row in higher education.
Overview
We are a global leader in education technology. For more than a decade, we have been improving lives by powering world-class digital education. As a trusted partner and brand steward of great universities, we build, deliver, and support online graduate programs and certificates for working adults. Our industry-leading short courses, offered by GetSmarter, are designed to equip life-long learners with in-demand career skills.
Over the past decade, we have developed new and innovative tools within our platform to enhance the effectiveness of instructional methods and improve student outcomes and the student experience. During that time, we have also improved our data-driven digital marketing capabilities across our ecosystem of offerings to generate increased student enrollments in a cost effective manner. As a result, demand for our comprehensive platform of integrated technology and services has increased significantly. When 2U was formed in 2008, we had one university client and one 2U-powered graduate program. Today, our university client base has grown to 35, our platform powers 49 graduate programs and over 90 short courses, and from inception to date we have enrolled over 44,000 students in 2U-powered graduate programs and over 86,000 students in our short courses.
Our core strategy is to launch graduate programs and short courses with new and existing university clients, to increase student enrollments and graduations across our portfolio of offerings and to expand our non-degree offerings across the career curriculum continuum. We are also committed to continuously improving our platform to deliver high-quality university and student experiences and outcomes at scale.
Business Segments
We have two reportable segments: the Graduate Program Segment and the Short Course Segment. In our Graduate Program Segment, we target students seeking a full graduate degree of the same quality they would receive on-campus. In our Short Course Segment, we target working professionals seeking career advancement through skills attainment.
The reportable segments represent businesses for which separate financial information is utilized by the chief operating decision maker, our Chief Executive Officer, for the purpose of allocating resources and evaluating performance. Our Graduate Program Segment derives revenue primarily from a contractually specified percentage of the amounts our university clients receive from their students in the 2U-enabled graduate program for tuition and fees, less credit card fees and other specified charges we have agreed to exclude in certain of our universicty client contracts. The Short Course Segment derives revenue directly from students for the tuition and fees paid to enroll in and progress through our short courses. We share a contractually specified percentage of the tuition and fees received from students in each course with the relevant university client.
Our Platform
Our platform, which we refer to as the 2U Operating System, or 2UOS, consists of a seamlessly integrated ecosystem of technology, people and data. Through 2UOS, we provide our university clients with front-end and back-end cloud-based SaaS technology and technology-enabled services. These two components are tightly integrated and optimized with data analysis and machine learning techniques. 2UOS delivers technology with a human touch and is the keystone of our commitment to provide our university clients the tools they need to lead the digital transformation in education.
4
Front-End Technology and Services
2UOS provides the following front-end technology and services to students enrolled in our offerings and to faculty members and university administrators supporting our offerings:
• | Learning Technology. Our online learning platform is a cohesive end-to-end learning and teaching platform, where our university clients can reliably deliver their high-quality educational content to students. For our Graduate Program Segment, our online learning platform replicates an intimate and live classroom environment and is accessible through proprietary web, mobile and TV applications as well as in an offline mode for convenient consumption of asynchronous coursework. With the recent integration of stem-based education tools and collaborative annotation technology and an improved data-driven user experience, we have significantly enhanced the learning experience for students in 2U-powered graduate programs and instruction capabilities for faculty. Our short course offerings are delivered through a separate proprietary learning platform that shares many of the core features of our Graduate Program Segment learning platform, with some exceptions, such as the enhanced features that facilitate the live classroom environment in our graduate program leaning platform. |
• | Live classes. Our graduate degree programs feature live face-to-face classes, in addition to asynchronous content and coursework. From inception to date students in our graduate degree programs have attended over 500,000 live class sessions with an average class size of approximately 13 students. |
• | Success Advisors. We augment each student’s academic experience by providing ongoing personalized non-academic support. In the Graduate Program Segment, we also provide a dedicated team to support and train university administration and faculty on how to use our platform to facilitate outstanding live instruction. In addition, we help our university clients succeed by assisting with faculty recruiting efforts, including attracting, cultivating and vetting a pool of faculty candidates for our university clients. |
• | Accessibility. For students with disabilities, we strive to facilitate accessibility across our platform. This includes designing our online learning platform with clear navigation and flexible, robust content display, ensuring compatibility with screen-reading and keyboard technologies and providing real-time captioning and transcripts for the asynchronous content we produce. We are also able to support certain accommodations requested by students with disabilities, including providing sign language interpretation and real-time captioning for live classes and audio descriptions of videos content we produce. |
• | Admissions. Leveraging our customer relationship management deployments and other technology, our graduate program-dedicated teams work with prospective students as they consider and apply to a program. Once a student has submitted a completed admissions application package, it is routed to and reviewed by the university client’s admissions office, which renders the final admission decision. |
• | Placements. Leveraging a geo-location database and our nationwide network of clinics, hospitals, schools and other sites, our field placement team is dedicated to securing in-program field placement opportunities for students enrolled in our university clients’ graduate programs that have a field placement component. We work closely with faculty to identify and approve sites that meet curriculum requirements. |
• | Hybrid Experiences. Many of our university clients’ graduate programs require students to attend immersions and intensive residencies where students travel to a university client’s physical campus and other locations, where they can engage in collaborative learning experiences with their classmates and professors in person, and develop invaluable personal and professional relationships. We provide the resources and technology to support our university clients in facilitating these experiences. Through our strategic partnership with WeWork, we also provide students in 2U-enabled graduate programs and faculty for both graduate programs and short courses access to WeWork spaces around the world so they have a place to take classes, prepare course materials, study, and collaborate with student groups. |
Back-End Technology and Services
2UOS provides the following back-end technology and services to launch and operate our offerings:
• | Data Architecture. We rely heavily on data across the 2UOS ecosystem and believe our ability to analyze it is a powerful tool for making informed choices. For example, our data architecture provides insights about what programs or courses will be successful, and which prospective students are most likely to convert to enrolled students. |
• | Technology Tools. Our back-end systems and applications automate and simplify a variety of processes for our university clients in our Graduate Program Segment, including admissions, student enrollment and content deployment. |
5
◦ | Graduate Program Launch and Operations Applications. We use an application we call Central Park to unify our suite of applications and better automate the standup of technology infrastructure for new graduate programs. We also use an application we call Uber-Conf to translate graduate program-specific code into a common language to simplify program-specific complexity. These applications simplify the effort to launch new graduate programs and enable non-technology oriented employees to support the data analytics and operational needs across our business. |
◦ | University Systems Integration Applications. We use an application we call Port Authority to integrate our technology with our university clients’ information technology systems. This application automates the student enrollment process, which allows us to more efficiently and quickly enroll students, thereby increasing our student-to-support staff ratios, while reducing the potential for human error. |
◦ | Content Management System. Our content management system enables us and our university clients to author, review and deploy the asynchronous content for our offerings. The content management system includes a set of project management and collaboration tools that allow our university clients’ faculty to seamlessly integrate their work with that of our course production and content development staff. |
◦ | Admissions Application Processing Portal. Our proprietary admissions application system, known as the Online Application and Recommendation System, or OARS, automates the graduate program admissions application process. OARS is integrated with the primary marketing site for each graduate program and directly using data analysis and machine learning techniques, funnels prospective students into each university client’s existing admissions application process and provides automated workflow for that process. |
◦ | Customer Relationship Management. We have developed customer relationship management deployments configured for each university client’s specific graduate program. Each deployment serves as the data hub for scheduling, student acquisition, student application, faculty admissions review, enrollment and student support. Our university clients and our employees review, maintain and track this information to ensure proper coordination. |
• | Curriculum. Leveraging our content management system, our 2U Studios staff and course developers work closely with our university clients’ faculty in a collaborative process to produce high-quality, engaging online coursework and content. |
• | Marketing. Leveraging data analytics and machine learning techniques, we develop targeted, offering-specific digital marketing campaigns that can reach and engage interested and qualified prospective students in a cost-effective manner. Our marketing teams also develop creative assets, such as websites related to the graduate program and short course fields of study, and execute search engine optimization and paid search campaigns aimed at acquiring students cost-effectively. |
• | Compliance. Many of our offerings must comply with state authorization requirements in each state where students reside. We work with most of our university clients to identify and satisfy a complex array of state authorization requirements. |
Our Approach
Our approach in providing 2UOS to our university clients is as follows:
• | Tightly Integrated Technology and Services with a Focus on Quality. We believe that our platform offers extensive features, high configurability, an intuitive user interface and the ability to support synchronous and asynchronous learning at scale. |
• | Data-Driven Methodology. We rely on data to optimize our process for identifying new graduate programs and short courses that have a high likelihood of success. Our algorithm draws on a wide variety of data, including the operating history of our existing offerings, and is based on key market variables, such as the existing market size of an offering, potential student demographics and university characteristics. In addition, we use data analytics and machine learning techniques to focus our marketing efforts on finding prospective students for the right offerings at times when conversion is more likely. |
• | Alignment with University Clients. We serve as brand stewards for our university clients and our relationships are characterized by close, ongoing collaboration with faculty and administrators, as well as a deep integration between their academic missions and our platform. |
6
Key Benefits to University Clients
• | Expanded Reach. Our platform allows university clients to provide their offerings to a greater number of students at the same high quality provided in an on campus environment. This expanded reach increases revenue to the university client and extends the reach of their brands. |
• | New Product Offering. Our Short Course Segment provides university clients the opportunity to launch a new product offering that, in many cases, does not have an on-campus equivalent. Offering short courses to students online allows our university clients to reach students around the world that may not have interest in a full degree program. |
• | Low Financial Risk. The initial investment required to launch a new online graduate program is significant and it takes several years before each new graduate program is operating at full scale. Our revenue share model, combined with long contractual terms in our Graduate Program Segment, enables us to make the investment in technology, integration, content production, marketing, student and faculty support and other services necessary to launch and scale successful graduate programs without significant financial risk to our university clients. |
• | Avoid Need for Multiple Solutions and Hiring. The technology and services included in 2UOS are tightly integrated, and together provide a broad set of capabilities that would otherwise require universities to purchase multiple, disparate point solutions, and hire significant human resources and expertise. |
• | Efficient Marketing. We believe that our broad selection of educational offerings increases our marketing leverage, allowing us to more efficiently acquire additional students and increase enrollments across our entire portfolio of offerings. In addition, we use data analytics and machine learning techniques to focus our marketing efforts on finding prospective students for the right offerings at times when conversion is more likely. In addition, we have optimized our process for identifying new graduate programs and short courses that have a high likelihood of success. Our algorithm draws on a wide variety of data, including the operating history of our existing offerings, and is based on key market variables, such as the existing market size of an offering, potential student demographics and university characteristics. |
Key Benefits to Students
• | Outcomes. Our platform allows students to pursue their education and attain new skills through graduate programs and short courses with leading universities regardless of the student’s location. Career success today increasingly requires people to learn new skills after they have completed an initial degree and entered the workforce. These additional skills and credentials can create upward career mobility, facilitate a job transition to a new field or lead to personal enrichment. |
• | Lower Cost-Burden. Students do not need to move or quit their jobs to enroll in our university clients’ graduate programs. As a result, many students face an overall lower cost burden than attending a similar on-campus program. |
• | Student Support. Students and prospective students of our offerings receive human support beginning with discovering an appropriate offering through graduation or completion. This support may include assistance with the application process, technology assistance throughout the program or course, and placement support for any in-person component of the graduate program. |
7
Our Growth Strategy
We intend to continue our industry leadership as a provider of a digital education platform that enables well-recognized nonprofit colleges and universities to deliver education online. Our approach to growth is disciplined and focused on long-term success. The principal elements of our strategy are to:
• | Add Graduate Programs, Short Courses, University Clients and Students. We intend to add graduate programs and short courses with new and existing university clients, and increase student enrollments in our current portfolio of offerings. |
• | Add New Categories of Offerings. We believe that there is significant international demand for our platform as colleges and universities worldwide seek to extend their brands by accessing the growing global market for higher education. We also believe that there may be significant opportunities in the future to offer high-quality digital education experiences to undergraduate students and expand our non-degree offerings across the career-curriculum continuum. As we evaluate these growth strategies, we periodically consider acquisitions or investment opportunities in complementary businesses, joint ventures, services and technologies and intellectual property rights in an effort to add product offerings, extend our technological leadership or expand the markets in which we operate. We expect to continue to evaluate, and may enter into, acquisitions and investments in the future as opportunities are presented. |
Clients
Graduate Program Segment
In our Graduate Program Segment, we have grown our university client and program base significantly since our inception from one client with one program in one academic discipline in 2008 to 27 clients with 67 programs in 24 academic disciplines today, 49 of which have launched and have students enrolled. A full listing of all 67 announced programs, including the programs we plan to launch in 2019, can be found at investor.2u.com.
Our long-term university client contracts, which typically have 10 to 15 year initial terms, generally do not include termination rights for convenience. Most contracts impose liquidated damages for a university client’s non-renewal, unless the university client otherwise terminates due to our uncured breach.
Our contracts also set forth the parties’ respective rights to offer competitive programs. For example, some contracts permit us to offer competitive programs with other schools whose potential students are not academically qualified or otherwise interested in the program we offer with our client. Other contracts prohibit us from offering competitive programs with a specific list of schools, expressed either by reference to a certain ranking on U.S. News & World Report’s “best” schools list or as a specifically enumerated list of schools negotiated with our university client. In addition, any limitation on our ability to offer competitive programs becomes inapplicable if a university client either refuses to scale the program to accommodate all students qualifying for admission into the program, or raises the program admissions standards above those at the time of contract execution. In addition, our contracts generally prohibit our university clients from offering any online competitive program. Most of our more recent contracts either do not restrict our ability to offer competitive programs or provide for only limited restrictions.
For the years ended December 31, 2018 and 2017, 21% and 27%, respectively, of our consolidated revenue was derived from our programs with University of Southern California, or USC, including our two longest running programs, launched in 2009 and 2010. We expect that these programs will continue to account for a large portion of our revenue until our other university client graduate programs become more mature and achieve significantly higher enrollment levels.
Our programs with Simmons University accounted for 13% and 17% of our consolidated revenue for the years ended December 31, 2018 and 2017, respectively. Our programs with the University of North Carolina accounted for less than 10% and 10% of our consolidated revenue for the years ended December 31, 2018 and 2017, respectively. Our programs with Syracuse University accounted for 10% and 11% of our consolidated revenue for the years ended December 31, 2018 and 2017, respectively.
Short Course Segment
In our Short Course Segment, we currently have nine university clients we are collaborating with to offer more than 90 courses. Our university client contracts in our Short Course Segment are typically shorter in length and less restrictive than our contracts in our Graduate Program Segment.
In our Short Course Segment, revenue is derived from individual students, rather than directly from university clients. For the year ended December 31, 2018, revenue associated with our three largest university clients in this segment accounted for approximately 81% of the segment’s revenue, with each of these three university clients accounting for less than 10% of our
8
consolidated revenue. Of the 17 courses we have launched in 2018, 10 are with these three university clients. We expect these university clients will continue to account for a large portion of our revenue in the Short Course Segment.
Competition
The overall market for technology solutions that enable higher education providers to deliver education online is highly fragmented, rapidly evolving and subject to changing technology, shifting needs of students and educators and frequent introductions of new delivery methods. Several competitors provide platforms that compete with some of the capabilities of our platform. Two such competitors are Pearson Online Learning Services and Wiley Education Services, owned by Pearson and John Wiley & Sons, respectively, both of which are large education and publishing companies. In addition, traditional massive open online course providers have evolved from providing massive open online courses to providing degrees, short course certificates, nano degrees and similar non-degree alternatives and we also face competition from companies providing corporate training programs and online courses taught outside the university environment (e.g., by experts in various fields). Many of these companies provide components of the technology and services we provide and these companies may choose to pursue some of the institutions we target. Moreover, nonprofit colleges and universities may elect to continue using or develop their own online learning solutions in-house.
We expect that the competitive landscape will expand as the market for online education offerings at nonprofit institutions matures. We believe the principal competitive factors in our market include the following:
• | brand awareness and reputation; |
• | ability of online graduate programs and short courses to deliver desired student outcomes; |
• | robustness and evolution of technology solutions; |
• | breadth and depth of service offering; |
• | ability to make significant investments in launching and operating graduate programs; |
• | expertise in marketing, student acquisition and student retention; |
• | quality of student and faculty experience; |
• | ease of deployment and use of technology solutions; |
• | level of customization, configurability, integration, security, scalability and reliability of technology solutions; and |
• | quality of university client base and track record of performance. |
We believe we compete favorably on the basis of these factors. Our ability to remain competitive will depend, to a great extent, upon our ability to consistently deliver our high-quality platform, meet university client needs for content development, acquire, support and retain students and deliver desired student, faculty and university outcomes.
Seasonality
We experience seasonality in our marketing and sales expenses in both our Graduate Program Segment and our Short Course Segment. We typically reduce our paid search and other marketing and sales efforts during late November and December because these efforts are less productive during the holiday season. We generally do not experience pronounced seasonality in our revenue, although revenue can fluctuate significantly from quarter to quarter due to variations driven by the academic schedules of our graduate programs and short courses.
Intellectual Property
We protect our intellectual property by relying on a combination of copyrights, trademarks, trade secrets and contractual agreements. For example, we rely on trademark protection in the United States and various foreign jurisdictions to protect our rights to various marks, including 2U, NO BACK ROW, GETSMARTER and other distinctive logos associated with our brand.
We ensure that we own intellectual property created for us by signing agreements with employees, independent contractors, consultants, companies, and any other third party that creates intellectual property for us that assign any intellectual property rights to us.
9
We have also established business procedures designed to maintain the confidentiality of our proprietary information, including the use of confidentiality agreements with employees, independent contractors, consultants and companies with which we conduct business.
We also purchase or license technology that we incorporate into our technology or services. While it may be necessary in the future to seek or renew licenses relating to various aspects of our technology and services, we believe, based upon past experience and industry practice, such licenses generally could be obtained on commercially reasonable terms.
We continue to evaluate developing and expanding our intellectual property rights in patents, trademarks and copyrights, as available through registration in the United States and internationally.
For important additional information related to our intellectual property position, please review the information set forth in “Risk Factors—Risks Related to Intellectual Property.”
Education Laws and Regulations
The higher education industry is heavily regulated. Institutions of higher education that award degrees and certificates to signify the successful completion of an academic program are subject to regulation from three primary entities: the U.S. Department of Education, or DOE, accrediting agencies and state licensing authorities. Each of these entities promulgates and enforces its own laws, regulations and standards, which we refer to collectively as education laws.
We contract with postsecondary institutions that are subject to education laws. In addition, we ourselves are required to comply with certain education laws as a result of our role as a service provider to institutions of higher education, either directly or indirectly through our contractual arrangements with university clients. Our failure, or that of our university clients, to comply with education laws could adversely impact our operations. As a result, we work closely with our university clients to maintain compliance with education laws.
Federal Laws and Regulations
Under the Higher Education Act of 1965, as amended, or the HEA, institutions offering postsecondary education must comply with certain laws and related regulations promulgated by the DOE in order to participate in the Title IV federal student financial assistance programs. Most of our university clients participate in the Title IV programs.
The HEA and the regulations promulgated thereunder are frequently revised, repealed or expanded. Congress historically has reauthorized and amended the HEA in regular intervals, approximately every seven years. The re-authorization process is currently under way.
The re-authorization of the HEA could alter the regulatory landscape of the higher education industry, and thereby impact the manner in which we conduct business and serve our university clients. In addition, the DOE is independently conducting an ongoing series of rulemakings. The DOE also issues formal and informal guidance instructing institutions of higher education and other covered entities how to comply with various federal laws and regulations. DOE guidance is subject to change and may impact our business model.
Although we are not considered an institution of higher education and we do not directly participate in Title IV programs, we are required to comply with certain regulations promulgated by the DOE as a result of our role as a service provider to institutions that do participate in Title IV programs. These include, for example, regulations governing student privacy under Family Educational Rights and Privacy Act, or FERPA. While online short courses are typically not eligible for Title IV aid, when offered by or on behalf of Title IV eligible institutions, many education laws, such as FERPA, remain applicable to us or our university clients even in the Short Course Segment.
The most material obligations stem from new rules and revisions to existing regulations promulgated by the DOE in 2010 as part of the so-called “program integrity” rules.
While the program integrity rules were targeted at for-profit institutions of higher education, most apply equally to traditional colleges and universities such as our university clients, and they apply in particular to institutions contracting with outside vendors to provide services, particularly in connection with distance education. These rules include principally the incentive compensation rule, the misrepresentation rule, the written arrangements rules and state authorization requirements. The more significant program integrity rules applicable to us or our university clients are discussed in further detail below. Certain of the program integrity rules are under review by the current administration as part of its policy to deregulate and spur innovation in higher education, but revisions to the rules are not expected to become final until 2020.
Incentive Compensation Rule
10
The HEA provides that any institution that participates in the Title IV federal student financial assistance programs must agree with the DOE that the institution will not provide any commission, bonus or other incentive payment to any person or entity engaged in any student recruiting or admission activities.
As part of the program integrity rules, the DOE issued revised regulations regarding incentive compensation effective July 1, 2011. Under the revised regulations, each higher education institution agrees that it will not “provide any commission, bonus, or other incentive payment based in any part, directly or indirectly, upon success in securing enrollments or the award of financial aid, to any person or entity who is engaged in any student recruitment or admission activity, or in making decisions regarding the award of title IV, HEA program funds.” Pursuant to this rule, we are prohibited from offering our covered employees, which are those involved with or responsible for recruiting or admissions activities, any bonus or incentive-based compensation based on the successful recruitment, admission or enrollment of students into a postsecondary institution.
In addition, the revised rule initially raised a question as to whether our company itself, as an entity, is prohibited from entering into tuition revenue-sharing arrangements with university clients. On March 17, 2011, the DOE issued official agency guidance, known as a “Dear Colleague Letter,” or the DCL, providing guidance on this point. The DCL states that “[t]he Department generally views payment based on the amount of tuition generated as an indirect payment of incentive compensation based on success in recruitment and therefore a prohibited basis upon which to measure the value of the services provided” and that “[t]his is true regardless of the manner in which the entity compensates its employees.” But the DCL also provides an important exception to the ban on tuition revenue-sharing arrangements between institutions and third parties. According to the DCL, the DOE does not consider payment based on the amount of tuition generated by an institution to violate the incentive compensation ban if the payment compensates an “unaffiliated third party” that provides a set of “bundled services” that includes recruitment services, such as those we provide. Example 2-B in the DCL is described as a “possible business model” developed “with the statutory mandate in mind.” Example 2-B describes the following as a possible business model:
“A third party that is not affiliated with the institution it serves and is not affiliated with any other institution that provides educational services, provides bundled services to the institution including marketing, enrollment application assistance, recruitment services, course support for online delivery of courses, the provision of technology, placement services for internships, and student career counseling. The institution may pay the entity an amount based on tuition generated for the institution by the entity’s activities for all the bundled services that are offered and provided collectively, as long as the entity does not make prohibited compensation payments to its employees, and the institution does not pay the entity separately for student recruitment services provided by the entity.”
The DCL guidance indicates that an arrangement that complies with Example 2-B will be deemed to be in compliance with the incentive compensation provisions of the HEA and the DOE’s regulations. Our business model and contractual arrangements with our university clients closely follow Example 2-B in the DCL. In addition, we assure that none of our “covered employees” is paid any bonus or other incentive compensation in violation of the rule.
Because the bundled services rule was promulgated in the form of agency guidance issued by the DOE in the form of a DCL and is not codified by statute or regulation, the rule could be altered or removed without prior notice, public comment period or other administrative procedural requirements that accompany formal agency rulemaking. Similarly, a court could invalidate the rule in an action involving our company or our university clients, or in action that does not involve us at all. The revision, removal or invalidation of the bundled services rule by Congress, the DOE or a court could require us to change our business model.
Misrepresentation Rule
The HEA prohibits an institution that participates in the Title IV programs from engaging in any “substantial misrepresentation” regarding three broad subject areas: (1) the nature of the school’s education programs, (2) the school’s financial charges and (3) the employability of the school’s graduates. In 2010, as part of the program integrity rules, the DOE revised its regulations in order to significantly expand the scope of the misrepresentation rule. Although some of the DOE’s most expansive amendments to the misrepresentation rule were overturned by the courts in 2012, most of the 2010 amendments survived and remain in effect.
Under the rule, “misrepresentation” is defined as any false, erroneous or misleading statement, written, visual or oral. This includes even statements that “have the likelihood or tendency to deceive.” Therefore, a statement need not be intentionally deceitful to qualify as a misrepresentation. “Substantial misrepresentation” is defined loosely as a misrepresentation on which the person to whom it was made could reasonably be expected to rely, or has reasonably relied, to that person’s detriment.
11
The current regulation also expands the scope of the original rule to cover statements made by any representative of an institution, including agents, employees and subcontractors, and statements made directly or indirectly to any third party, including state agencies, government officials or the public, and not just to students or prospective students.
Violations of the misrepresentation rule are subject to various sanctions by the DOE and violations may be used as a basis for legal action by third parties. Similar rules apply under state laws or are incorporated in institutional accreditation standards and the Federal Trade Commission, or FTC, applies similar rules prohibiting any unfair or deceptive marketing practices to the education sector. As a result, we and our employees and subcontractors, as agents of our university clients, must use a high degree of care to comply with such rules and are prohibited by contract from making any false, erroneous or misleading statements about our university clients. To avoid an issue under the misrepresentation rule and similar rules, we assure that all marketing materials are approved in advance by our university clients before they are used by our employees and we carefully monitor our subcontractors.
Accreditation Rules and Standards
Accrediting agencies primarily examine the academic quality of the instructional programs of an educational institution, and a grant of accreditation is typically viewed as confirmation that an institution or an institution’s programs meet generally accepted academic standards. Accrediting agencies also review the administrative and financial operations of the institutions they accredit to ensure that each institution has the resources to perform its educational mission. The DOE also relies on accrediting agencies to determine whether institutions qualify to participate in Title IV programs.
In addition to institutional accreditation, colleges and universities may require specialized programmatic accreditation for particular educational programs. Many states and professional associations require professional programs to be accredited, and require individuals to have graduated from accredited programs in order to sit for professional license exams. Programmatic accreditation, while not a sufficient basis for institutional Title IV Program certification by the DOE, assists graduates to practice or otherwise secure appropriate employment in their chosen field. Common fields of study subject to programmatic accreditation include teaching and nursing.
Although we are not an accredited institution and are not required to maintain accreditation, accrediting agencies are responsible for reviewing an accredited institution’s third-party contracts with service providers like us and may require an institution to obtain approval from or to notify the accreditor in connection with such arrangements. One purpose of the notification and approval requirements is to verify that the accredited institution remains responsible for providing academic instruction leading to a credential and provides oversight of other activities undertaken by third parties like us that are within the scope of its accreditation. We work closely with our university clients to assure that the standards of their respective accreditors are met and are not adversely impacted by us.
Accrediting agencies are also responsible for assuring that any “written arrangements” to outsource academic instruction meet accrediting standards and related regulations of the DOE. Our operations are generally not subject to such “written arrangements” rules because academic instruction is provided by our university client institutions and not by us; however, the “written arrangements” rules may apply to online programs in the Short Course Segment to the extent such courses are outsourced by university clients. The “written arrangements” rule is under review by the current administration. Any changes are not expected to be final until 2020.
State Laws and Regulations
Each state has at least one licensing agency responsible for the oversight of educational institutions operating within its jurisdiction. Continued approval by such agencies is necessary for an institution to operate and grant degrees, diplomas or certificates in those states. Moreover, under the HEA, approval by such agencies is necessary to maintain eligibility to participate in Title IV programs. State attorneys general are also active in enforcing education laws, and the level of regulatory oversight varies substantially from state to state.
We and our university clients may be subject to regulation in each state in which we or they own facilities, provide distance education or recruit students. State laws establish standards for, among other things, student instruction, qualifications of faculty, location and nature of facilities, recruiting practices and financial policies. The need to comply with applicable state laws and regulations may limit or delay our ability to market or expand our offerings. In addition, the interpretation of state authorization regulations is subject to substantial discretion by the state agency responsible for enforcing the regulations.
As part of the program integrity rules, the DOE required, among other things, that an institution offering distance learning or online programs secure the approval of those states which require such approval and provide evidence of such approval to the DOE upon request. This regulation dramatically increased the importance of state authorization because failure to obtain it could result in an obligation to return federal funds received by an institution. The U.S. Court of Appeals for the District of Columbia struck down the regulations requiring proof of state approval for online education programs in 2012 on
12
procedural grounds; however, the DOE promulgated similar replacement regulations in December 2016, with an effective date of July 1, 2018. The current administration delayed the effective date of the regulations until 2020 and is considering repealing them outright or making further changes to them, which are expected to be effective in 2020. Repeal of the federal rules would not eliminate the obligation to comply with state law with respect to online programs, but it would reduce the potential liabilities associated with non-compliance.
Most states participate in the State Authorization Reciprocity Agreement, or SARA, governing the licensing of online offerings. All SARA-member institutions may provide online offerings in SARA states without obtaining separate state authorization (this includes externships, recruiting, local advertising, and faculty presence). SARA-member institutions must still obtain a separate authorization in order to open a physical location in another state and are also required to obtain any additional approvals that may be required for offerings leading to professional licensure in a state (e.g., nursing, teaching, or counseling). Most of our university clients are SARA members and the DOE has indicated it will accept participation in a reciprocity agreement as evidence of state approval.
Finally, many programs leading to professional licensure, such as graduate programs in nursing or teaching, also require approval from, and are subject to ongoing oversight by separate state agencies such as state nursing boards. Membership in SARA does not encompass approvals by professional licensing boards, which must be obtained separately.
We monitor state law developments closely and work closely with our university clients to assist them with obtaining any required approvals.
Other Laws
Our activities are also subject to other federal and state laws. These regulations include, but are not limited to, consumer marketing and unfair trade practices laws and regulations, including those promulgated and enforced by the FTC, as well as federal and state data protection and privacy requirements.
Culture and Employees
2U was founded on a set of “guiding principles” that are core to our culture and guide big and small decisions every day. New employees are introduced to the guiding principles in orientation and are expected to bring these guiding principles to life as they work with their teams, interact with our university clients and students or otherwise represent 2U in the community.
• | Cherish each opportunity. Life is short, so treasure every moment. |
• | Give a damn. Care about what you do each day. |
• | Strive for excellence. Don’t settle for second best. |
• | Be bold and fearless. Question the status quo and embrace change. |
• | Be candid, honest and open. Listen to others and offer respectful feedback. |
• | Have fun. Fun is important. Fun is simply better. |
• | Make service your mission. Give the highest level of support to our partners and to one another. |
• | Don’t let the skeptic win. “No” is easy. “Yes” is hard. Fight for “yes.” |
• | Relationships matter. Invest the time, build trust, and value differences. |
This past year, 2U was certified as a Great Place to Work, was named a 2018 Top Workplace by the Denver Post and a Top Workplace by The Washington Post. As of December 31, 2018, we had 2,583 full-time employees and 86 part-time employees. None of our employees are represented by a labor union or covered by a collective bargaining agreement. We consider our relations with our employees to be good.
Other Information
We were incorporated as a Delaware corporation in April 2008 and completed our initial public offering in April 2014. Our principal executive offices are located at 7900 Harkins Road, Lanham, MD 20706, and our telephone number is (301) 892-4350.
You can obtain copies of our Annual Report on Form 10-K, Quarterly Reports on Form 10-Q, Current Reports on Form 8-K, and other filings with the U.S. Securities and Exchange Commission, or the SEC, and all amendments to these filings, free of charge from our website at investor.2u.com or on the SEC’s website at www.sec.gov as soon as reasonably
13
practicable following our filing of any of these reports with the SEC. The contents of these websites are not incorporated into this filing. Further, our references to the URLs for these websites are intended to be inactive textual references only.
Item 1A. Risk Factors
In addition to the other information set forth in this Annual Report on Form 10-K, you should carefully consider the factors discussed in the “Special Note Regarding Forward-Looking Statements” in this Annual Report on Form 10-K.
Risks Related to Our Business Model, Our Operations and Our Growth Strategy
We have a limited operating history, which makes it difficult to predict our future financial and operating results, and we may not achieve our expected financial and operating results in the future.
We were incorporated in 2008 and launched our first graduate program in 2009. In July 2017, we acquired GetSmarter and extended our offerings to include premium online short courses offered in collaboration with universities. As a result of our limited operating history, our ability to forecast our future operating results, including revenue, cash flows and profitability, is limited and subject to a number of uncertainties. We have encountered and will encounter risks and uncertainties frequently experienced by growing companies in the technology industry. If our assumptions regarding these risks and uncertainties are incorrect or change due to factors impacting our targeted markets, or if we do not manage these risks successfully, our operating and financial results may differ materially from our expectations and our business may suffer.
We have incurred significant net losses since inception, and we expect our operating expenses to increase significantly in the foreseeable future, which may make it more difficult for us to achieve and maintain profitability.
We incurred net losses of $38.3 million, $29.4 million and $20.7 million during the years ended December 31, 2018, 2017 and 2016, respectively. We will need to generate and sustain increased revenue levels in future periods to become profitable, and, even if we do, we may not be able to maintain or increase our level of profitability. We anticipate that our operating expenses will increase substantially in the foreseeable future as we undertake increased technology and production efforts to support a growing number of offerings and increase our marketing and sales efforts to drive the acquisition of potential students. In addition, as a public company, we will continue to incur significant accounting, legal and other expenses that we did not incur as a private company. These expenditures will make it harder for us to achieve and maintain profitability. Our efforts to grow our business may be more costly than we expect, and we may not be able to increase our revenue enough to offset our higher operating expenses. If we are forced to reduce our expenses, our growth strategy could be compromised. We may incur significant losses in the future for a number of reasons, including unforeseen expenses, difficulties, complications, delays and other unknown events. As a result, we may be unable to achieve and maintain profitability, and the value of our company and our common stock could decline significantly.
Our business depends heavily on the adoption by colleges and universities of online delivery of their educational offerings. If we fail to attract new university clients, or if new leadership at existing university clients does not have an interest in continuing or expanding online delivery of their educational offerings, our revenue growth and profitability may suffer.
The success of our business depends in large part on our ability to enter into agreements with additional nonprofit colleges and universities to offer their graduate programs and short courses online. In particular, to engage new university clients, we need to convince potential university clients, many of which have been educating students in generally the same types of on-campus programs for hundreds of years, to invest significant time and resources to adjust the manner in which they teach students. The delivery of online education at leading nonprofit colleges and universities is nascent, and many administrators and faculty members have expressed concern regarding the perceived loss of control over the education process that might result from offering content online, as well as skepticism regarding the ability of colleges and universities to provide high-quality education online that maintains the standards they set for their on-campus programs. It may be difficult to overcome this resistance, and online programs of the kind we develop with our university clients may not achieve significant market acceptance. In addition, our university clients have regular turnover in their leadership positions, and there is no guarantee that any new leader will have an interest in continuing or expanding online delivery of the university’s educational offerings. If new leaders at our university clients do not embrace online delivery of educational offerings, we may not be able to add additional offerings with the university client and the university client may attempt to terminate or may not renew their relationship with us.
Our financial performance depends heavily on our ability to acquire qualified potential students for our offerings, and our ability to do so may be affected by circumstances beyond our control.
Building awareness of our offerings is critical to our ability to acquire prospective students for our university clients’ programs and courses and generate revenue. A substantial portion of our expenses is attributable to marketing and sales efforts dedicated to attracting potential students to our offerings. Because we generate revenue based on a portion of the tuition and
14
fees that students pay, it is critical to our success that we identify qualified prospective students for our offerings in a cost-effective manner, and that enrolled students remain active in our offerings until graduation or completion.
The following factors, many of which are largely outside of our control, may prevent us from successfully driving and maintaining student enrollment in our offerings in a cost-effective manner or at all:
• | Negative perceptions about online learning programs. As a non-traditional form of education delivery, prospective students will subject our university clients’ online offerings to increased scrutiny. Online offerings that we or our competitors provide may not be successful or operate efficiently, and new entrants to the field of online learning also may not perform well. Such underperformance could create the perception that online offerings in general are not an effective way to educate students, whether or not our offerings achieve satisfactory performance, which could make it difficult for us to successfully attract prospective students. Students may be reluctant to enroll in online programs and courses for fear that the learning experience may be substandard, that employers may be averse to hiring students who received their education online, or that organizations granting professional licenses or certifications may be reluctant to grant them based on degrees earned through online education. |
• | Ineffective marketing efforts. We invest substantial resources in developing and implementing data-driven marketing strategies that focus on identifying the right potential student at the right time. These marketing efforts make substantial use of search engine optimization, paid search and custom website development and deployment and we rely on a small number of internet search engines and marketing partners. If our execution of this strategy proves to be inefficient or unsuccessful in generating a sufficient quantity of qualified prospective students, or if the costs associated with the execution of this strategy increase, our revenue could be adversely affected. |
• | Damage to university client reputation. Because we market a specific graduate program or course to potential students, the reputations of our university clients are critical to our ability to enroll students. Many factors affecting our university clients’ reputations are beyond our control and can change over time, including their academic performance, ranking among nonprofit educational institutions and university leadership positions. |
• | Lack of interest in an offering. We may encounter difficulties attracting qualified students for graduate programs or courses that are not highly desired or that are relatively new within their fields. Macroeconomic conditions beyond our control may diminish interest in employment in a field, and that could contribute to lack of interest in offerings in the disciplines related to that field. |
• | Our lack of control over admissions decisions for our university clients’ graduate programs. Even if we are able to identify prospective students for a graduate program, there is no guarantee that students will be admitted to that program. In the Graduate Program Segment, the university clients retain complete discretion over admissions decisions, and any changes to admissions standards, or inconsistent application of admissions standards, could affect student enrollment and our ability to generate revenue. |
• | Inability of students to secure funding. Like traditional college and university students, many of the students in our university clients’ graduate programs rely heavily on the availability of third-party financing to pay for the costs of their educations, including tuition. This tuition assistance may include federal or private student loans, scholarships and grants, or benefits or reimbursement provided by the students’ employers. Any developments that reduce the availability of financial aid for higher education generally, or for our university clients’ graduate programs in particular, could impair students’ abilities to meet their financial obligations, which in turn could result in reduced enrollment and harm our ability to generate revenue. |
• | General economic conditions. Student enrollment in our offerings may be affected by changes in global economic conditions. An improvement in economic conditions and, in particular, an improvement in the economic conditions in the U.S. and the U.S. unemployment rate, may reduce demand among potential students for educational services, as they may find adequate employment without additional education. Conversely, a worsening of economic and employment conditions may reduce the willingness of employers to sponsor educational opportunities for their employees or discourage existing or potential students from pursuing additional education due to a perception that there are insufficient job opportunities, increased economic uncertainty or other factors, any of which could adversely impact our ability to attract qualified students to our offerings. If one or more of these factors reduces student demand for our offerings, enrollment could be negatively affected, our costs associated with student acquisition and retention could increase, or both, any of which could materially compromise our ability to grow our revenue or achieve profitability. These developments could also harm our reputation and make it more difficult for us to engage new and existing university clients for new offerings, which would negatively impact our ability to expand our business. |
15
Disruption to or failures of our platform could reduce university client and student satisfaction with our offerings and could harm our reputation.
The performance and reliability of our platform is critical to our operations, reputation and ability to attract new university clients, as well as our student acquisition and retention efforts. Our university clients rely on this technology to offer their programs and courses online, and students access this technology on a frequent basis as an important part of their educational experience. Because our platform is complex and incorporates a variety of hardware and proprietary and third-party software, our platform may have errors or defects that could result in unanticipated downtime for our university clients and students. Web and mobile based applications frequently contain undetected errors when first introduced or when new versions or enhancements are released, and we have from time to time found errors and defects in our technology and new errors and defects may be detected in the future. In addition, we have experienced and may in the future experience temporary system interruptions to our platform for a variety of reasons including network failures, power failures, problems with third-party firmware updates, as well as an overwhelming numbers of users trying to access our platform. Any errors, defects, disruptions or other performance problems with our platform could damage our or our university clients’ reputations, decrease student satisfaction and retention and impact our ability to attract new students and university clients. If any of these problems occur, our university clients could attempt to terminate their agreements with us, or make indemnification or other claims against us. In addition, sustained or recurring disruptions in our platform could adversely affect our and our university clients’ compliance with applicable regulations and accrediting body standards.
We rely upon Amazon Web Services to host certain aspects of our platform and any disruption of or interference with our use of Amazon Web Services could impair our ability to deliver our platform to university clients and students, resulting in university client and student dissatisfaction, damage to our reputation, and harm to our business.
Amazon Web Services, or AWS, provides a distributed computing infrastructure platform for business operations, or what is commonly referred to as a cloud computing service. We have designed our technology and technology-enabled services to use data processing, storage capabilities and other services provided by AWS. Currently, our online learning platform and certain of our front-end and back-end technology and services are run on AWS. Given this, along with the fact that we cannot easily switch our AWS operations to another cloud provider, any disruption of, or interference with our use of, AWS would impact our operations and our business would be adversely impacted. AWS provides us with computing and storage capacity pursuant to an agreement that continues until terminated by either party. AWS may terminate the agreement without cause by providing 30 days’ prior written notice, and may terminate the agreement for cause with 30 days’ prior written notice, including any material default or breach of the agreement by us that we do not cure within the 30-day period. Additionally, AWS has the right to terminate the agreement immediately with notice to us in certain scenarios such as if AWS believes providing the services could create a substantial economic or technical burden or material security risk for AWS, or in order to comply with the law or requests of governmental entities. If any of our arrangements with AWS is terminated, we could experience interruptions in our software as well as delays and additional expenses in arranging new facilities and services.
We utilize third-party data center hosting facilities operated by AWS. Our operations depend, in part, on AWS’s abilities to protect these facilities against damage or interruption from natural disasters, power or telecommunications failures, criminal acts and similar events. The occurrence of spikes in usage volume, a natural disaster, an act of terrorism, vandalism or sabotage, a decision to close a facility without adequate notice, or other unanticipated problems at a facility could result in lengthy interruptions in the availability of our platform, which would result in harm to our business. Also, in the event of damage or interruption, our insurance policies may not adequately compensate us for any losses that we may incur. These factors in turn could further reduce our revenue, subject us to liability or cause our university clients to fail to renew or terminate their contracts, any of which could harm our business.
Our ability to deliver our services is dependent on the development and maintenance of the infrastructure of the Internet by third parties.
The infrastructure of the Internet consists of multiple fragmented networks. Multiple third-party organizations run this infrastructure together under the governance of the Internet Corporation for Assigned Numbers and Names (“ICANN”) and the Internet Assigned Numbers Authority under the stewardship of ICANN. The Internet has experienced outages and other delays resulting from damage to portions of infrastructure, denial-of-service attacks or related cyber incidents, and the Internet could face outages and delays in the future. These outages and delays could reduce the level of Internet usage or result in fragmentation of the Internet, resulting in multiple separate networks lacking interconnection. These scenarios are outside of our control and could impair the delivery of our platform to our university clients and students. Resulting interruptions in our platform or the ability of our university clients or students to access our platform could result in a loss of potential or existing university clients and students, subject us to liability or harm our business.
Our student acquisition efforts depend in large part upon the availability of advertising space through a variety of media.
16
We depend upon the availability of advertising space through a variety of media, including third-party applications on platforms such as Facebook and LinkedIn, to direct traffic to our offerings and acquire new students for our offerings. The availability of advertising space varies, and a shortage of advertising space in any particular media or on any particular platform, or the elimination of a particular medium on which we advertise, could limit our ability to direct traffic to our offerings and acquire new students on a cost-effective basis, any of which could have a material adverse effect on our business, results of operations and financial condition.
The market for our offerings may be limited based on the types of nonprofit colleges and universities we target.
Our target market of selective nonprofit colleges and universities is necessarily limited. Some of the contracts we enter into with our university clients contain limitations on our ability to contract with other institutions to provide the same or a similar offering. In addition, in order to maintain good relations with our university clients we may decide not to approach certain institutions that our university clients regard as their direct competitors to offer similar programs or courses, even if we are allowed to do so under our contracts.
We have agreed to incur, and we may incur in the future, costs to terminate some or all of the exclusivity obligations in certain of our university client contracts.
Certain of our contracts with our university clients limit our ability to enable competitive offerings with other schools. In our Graduate Program Segment, we have determined that enabling some of these contractually prohibited competitive programs may be part of our business strategy. To eliminate some or all of the exclusivity obligations in certain university clients’ contracts with us, we have agreed with certain university clients in our Graduate Program Segment to do some or all of the following: make fixed and contingent cash payments over time, reduce our revenue share over time, and/or make minimum investments in marketing under certain conditions.
We may determine in the future that enabling additional contractually prohibited competitive programs or courses is desirable, and we may therefore agree with additional university clients to incur costs similar to those above to reduce or eliminate the exclusivity obligations contained in their contracts with us.
If the competitive programs or courses we ultimately enable fail to reach scale or cannot be scaled at a reasonable cost, or if we need to incur contingent costs in connection with offering competitive programs or courses, our ability to grow our business and achieve profitability would be impaired.
Attracting new university clients for the launch of new offerings is complex and time-consuming. If we pursue unsuccessful opportunities, we may forgo more profitable opportunities and our operating results and growth would be harmed.
The process of identifying new offerings at selective nonprofit colleges and universities, and then negotiating contracts with potential university clients, is complex and time-consuming. Because of the initial reluctance on the part of some nonprofit colleges and universities to embrace a new method of delivering their education services and the complicated approval process within universities, our sales process to attract and engage a new university client can be lengthy. Depending on the particular college or university and the particular offering, we may face resistance from university administrators or faculty members during the process.
The sales cycle for a new university client often spans one year or longer. In addition, our sales cycle can vary substantially because of a number of factors, including the university client’s approval processes or disagreements over the terms of our offerings. We spend substantial time and management resources on these sales efforts without any assurance that our efforts will result in the launch of a new program or course. If we invest substantial resources pursuing unsuccessful opportunities, we may forgo other more profitable university client relationships, which would harm our operating results and growth.
To launch a new graduate program, we must incur significant expense in technology and content development, as well as marketing and sales, to identify and attract prospective students, and it may be several years, if ever, before we generate revenue from a new program sufficient to recover our costs.
To launch a new graduate program, we must integrate components of our platform with the various student information and other operating systems our university clients use to manage functions within their institutions. In addition, our content development staff must work closely with that university client’s faculty members to produce engaging online coursework and content, and we must commence student acquisition activities. This process of launching a new graduate program is time-consuming and costly and, under our agreements with our university clients, we are primarily responsible for the significant costs of this effort, even before we generate any revenue. Additionally, during the life of our university client agreements, we are responsible for the costs associated with continued marketing, maintaining our platform and providing non-academic and other support for students enrolled in the graduate program. We invest significant resources in these new graduate
17
programs from the beginning of our relationship with a university client, and there is no guarantee that we will ever recoup these costs.
Because our university client agreements provide that we receive a fixed percentage of the tuition that the university clients receive from the students enrolled in their graduate programs, we only begin to recover these costs once students are enrolled and our university clients begin billing students for tuition and fees. The time that it takes for us to recover our investment in a new graduate program depends on a variety of factors, primarily the level of our student acquisition costs and the rate of growth in student enrollment in the program. We estimate that, on average, it takes approximately four to five years after engagement with a university client to fully recover our investment in that university client’s new graduate program. Because of the lengthy period required to recoup our investment in a new graduate program, unexpected developments beyond our control could occur that result in the university client ceasing or significantly curtailing a graduate program before we are able to fully recoup our investment. As a result, we may ultimately be unable to recover the full investment that we make in a new graduate program or achieve our expected level of profitability for the graduate program.
If new offerings do not scale efficiently and in the time frames we expect, our reputation and our revenue will suffer.
Our continued growth and profitability depends on our and our university clients’ ability to successfully scale newly launched offerings. As we continue aggressively growing our business, we plan to continue to hire new employees at a rapid pace, particularly in our marketing and sales team and our technology and content development teams. If we cannot adequately train these new employees, we may not be successful in acquiring potential students for our offerings, which would adversely impact our ability to generate revenue, and our university clients and the students in their programs and courses could lose confidence in the knowledge and capability of our employees. If we cannot quickly and efficiently scale our technology to handle growing student enrollment and new offerings, our university clients’ and their students’ experiences may suffer, which could damage our reputation among colleges and universities and their faculty and students.
In addition, in our Graduate Program Segment, if our university clients cannot quickly develop the infrastructure and hire sufficient faculty and administrators to handle growing student enrollments, our university clients’ and their students’ experiences with our platform may suffer, which could damage our reputation among colleges and universities and their faculty and students.
Our ability to effectively manage any significant growth of new offerings and increasing student enrollment will depend on a number of factors, including our ability to:
• | satisfy existing students in, and attract and enroll new students for, our offerings; |
• | assist our university clients in recruiting qualified faculty to support their expanding enrollments; |
• | assist our university clients in developing and producing an increased volume of course content; |
• | successfully introduce new features and enhancements and maintain a high level of functionality in our platform; and |
• | deliver high-quality support to our university clients and their faculty and students. |
Establishing new offerings or expanding existing offerings will require us to make investments in management and key staff, increase capital expenditures, incur additional marketing expenses and reallocate other resources. If student enrollment in our offerings does not increase, if we are unable to launch new offerings in a cost-effective manner or if we are otherwise unable to manage new offerings effectively, our ability to grow our business and achieve profitability would be impaired, and the quality of our platform and the satisfaction of our university clients and their students could suffer.
Our financial performance depends heavily on student retention within our offerings, and factors influencing student retention may be out of our control.
Once a student is enrolled in a program or course, we and our university client must retain the student over the life of the program or course to generate ongoing revenue. Our strategy involves offering high-quality support to students enrolled in these programs and courses to support their retention. If we do not help students quickly resolve any educational, technological or logistical issues they encounter, otherwise provide effective ongoing support to students or deliver the type of high-quality, engaging educational content that students expect, students may withdraw from the program or course, which would negatively impact our revenue.
In addition, student retention could be compromised by the following factors, many of which are largely outside of our control:
18
• | Reduced support from our university clients. Because revenue from a particular offering is directly attributable to the level of student enrollment in the offering, our ability to grow our revenue from a university client relationship depends on the growth of enrollment in that program. Our university clients could limit enrollment in their offerings, cease providing the offerings altogether or significantly curtail or inhibit our ability to promote their offerings, any of which would negatively impact our revenue. |
• | Lack of support from faculty members in our university clients’ graduate programs. It takes a significant time commitment and dedication from our university clients’ faculty members to work with us to develop course content for their graduate programs and courses designed for an online learning environment. Our university clients’ faculty may be unfamiliar with the development and production process, may not understand the time commitment involved to develop the course content, or may otherwise be resistant to changing the ways in which they present the same content in an on-campus class. Our ability to maintain high student retention will depend in part on our ability to convince our university clients’ faculty of the value in the time and effort they will spend developing the course content. Lack of support from faculty could cause the quality of our graduate programs to decline, which could contribute to decreased student satisfaction and retention in our Graduate Program Segment. |
• | Student dissatisfaction. Enrolled students may drop out of our offerings based on their individual perceptions of the value they are getting from the offering. For example, we may face retention challenges as a result of students’ dissatisfaction with the quality of course content and presentation, dissatisfaction with our university clients’ faculty, changing views of the value of our offerings and perceptions of employment prospects following completion of the program or course. Factors outside our control related to student satisfaction with, and overall perception of, a program or course may contribute to decreased student retention rates for that program. |
• | Personal factors. Factors impacting a student’s willingness and ability to stay enrolled in a program or course include personal factors, such as ability to continue to pay tuition, ability to meet the rigorous demands of the offering, and lack of time to continue classes, all of which are generally beyond our control. |
If student retention is compromised by any of these factors, it could significantly reduce the revenue that we generate from our offerings, which would negatively impact our return on investment for the particular offering, and could compromise our ability to grow our business and achieve profitability.
Of the graduate programs we operate, only a small number contribute a significant portion of our revenue, and loss or material underperformance of any one of these programs could have a disproportionate effect on our business.
In our Graduate Program Segment, we currently have, and for the foreseeable future expect to continue to have, a small number of graduate programs that contribute a meaningful portion of our revenue and generate positive earnings and cash flow. Therefore, if any of these programs were to materially underperform for any reason or if the university client for these programs terminate or do not renew their relationship with us, it would hurt our future financial performance.
A significant portion of our revenue is currently attributable to graduate programs with four university clients. The loss of, or a decline in enrollment in, these programs could significantly reduce our revenue.
We expect that our programs with our four largest university clients in the Graduate Program Segment will continue to account for a large portion of our revenue until our other university client programs become more mature and achieve significantly higher enrollment levels. Any decline in reputation, any increase in tuition, or any changes in policies or leadership at these university clients, could adversely affect the number of students that enroll in these programs. Further, the faculty or administrators of these university clients could become resistant to offering their online programs through our platform, making it more difficult for us to attract and retain students. These university clients are not required to expand student enrollment in these online programs and, upon the expiration of their contracts, they are not required to continue using us as the provider of these or other online programs. If certain of these programs were to materially underperform for any reason or if any of these university clients terminated or did not renew their relationships with us, it would significantly reduce our revenue.
A significant portion of our revenue in the Short Course Segment is attributable to courses with three university clients. The loss of any of these clients, or a decline in enrollment in certain of these courses, could significantly reduce our revenue in this segment.
We expect that our courses with our three largest university clients in the Short Course Segment will continue to account for a large portion of our revenue in this segment. Any decline in these university clients’ reputations or any increase in the fees charged by the university clients for the courses could adversely affect the number of students that enroll in these courses. Further, these university clients could become resistant to offering online courses through our platform. These university clients are not required to continue using us as their provider for online short courses. If any of these university
19
clients elected to end certain courses or to terminate or not renew their relationships with us, it would significantly reduce our revenue in this segment.
The loss, or material underperformance, of any one of our graduate programs could harm our reputation, which could in turn affect our profitability.
We rely on our reputation for delivering high-quality online graduate programs and recommendations from existing university clients to attract potential new university clients. Therefore, the loss of any single graduate program, or the failure of any university client to renew its agreement with us upon expiration, could harm our reputation and impair our ability to pursue our growth strategy and ultimately to become profitable.
If our security measures or those of our third-party service providers are breached or fail and result in unauthorized disclosure of data, we could lose university clients, fail to attract new university clients and be exposed to protracted and costly litigation.
Our platform and computer systems store and transmit proprietary and confidential university, student, and company information, which may include personal information of students, prospective students, faculty and employees, that are subject to stringent legal and regulatory obligations. As a technology company, we face an increasing number of threats to our platform and computer systems including unauthorized activity and access, system viruses, worms, malicious code, denial of service attacks, and organized cyberattacks, any of which could breach our security and disrupt our platform and our university clients’ offerings. The techniques used by computer hackers and cyber criminals to obtain unauthorized access to data or to sabotage computer systems change frequently and generally are not detected until after an incident has occurred. We have implemented certain safeguards and processes to thwart hackers and protect the data in our platform and computer systems. However, our efforts to maintain the security and integrity of our platform, and the cybersecurity measures taken by our third-party service providers may be unable to anticipate, detect or prevent all attempts to compromise our systems. If our security measures are breached or fail as a result of third-party action, employee error, malfeasance or otherwise, it could result in the loss or misuse of proprietary and confidential university, student (including prospective student) and company information, which could subject us to liability, or interrupt our business, potentially over an extended period of time. Any or all of these issues could harm our reputation, adversely affect our ability to attract new university clients and students, cause existing university clients to scale back their offerings or elect not to renew their agreements, cause prospective students not to enroll or students to not stay enrolled in our offerings, or subject us to third-party lawsuits, regulatory fines or other action or liability. Further, any reputational damage resulting from breach of our security measures could create distrust of our company by prospective university clients or students. In addition, our insurance coverage may not be adequate to cover losses associated with such events, and in any case, such insurance may not cover all of the types of costs, expenses and losses we could incur to respond to and remediate a security breach. As a result, we may be required to expend significant additional resources to protect against the threat of these disruptions and security breaches or to alleviate problems caused by such disruptions or breaches.
Many governments have enacted laws that require companies and institutions to notify impacted individuals of data breach incidents, usually in writing. Under the terms of our contracts with our university clients, we would be responsible for the costs of investigating and disclosing data breaches to the university clients’ students. In addition to costs associated with investigating and fully disclosing a data breach, we could be subject to substantial monetary fines or private claims by affected parties and our reputation would likely be harmed.
We have grown rapidly and expect to continue to invest in our growth for the foreseeable future. If we fail to manage this growth effectively, the success of our business model will be compromised.
We have experienced rapid growth in a relatively short period of time, which has placed, and will continue to place, a significant strain on our administrative and operational infrastructure, facilities and other resources. Our ability to manage our operations and growth will require us to continue to expand our marketing and sales personnel, technology team, finance and administration teams, as well as our facilities and infrastructure. We will also be required to refine our operational, financial and management controls and reporting systems and procedures. If we fail to manage this expansion of our business efficiently, our costs and expenses may increase more than we plan and we may not successfully expand our university client base, enhance our platform, develop new offerings with new and existing university clients, attract a sufficient number of qualified students in a cost-effective manner, satisfy the requirements of our existing university clients, respond to competitive challenges or otherwise execute our business plan. Accordingly, our historical revenue growth rate may not continue in the future.
Our ability to manage any significant growth of our business effectively will depend on a number of factors, including our ability to:
• | effectively recruit, integrate, train and motivate a large number of new employees, including our marketing and technology teams, while retaining existing employees; |
20
• | maintain the beneficial aspects of our corporate culture and effectively execute our business plan; |
• | continue to improve our operational, financial and management controls; |
• | protect and further develop our strategic assets, including our intellectual property rights; and |
• | make sound business decisions in light of the scrutiny associated with operating as a public company. |
These activities will require significant capital expenditures and allocation of valuable management and employee resources, and our growth will continue to place significant demands on our management and our operational and financial infrastructure.
We may not be able to effectively manage any future growth in an efficient, cost-effective or timely manner, or at all. In particular, any failure to implement systems enhancements and improvements successfully will likely negatively impact our ability to manage our expected growth, ensure uninterrupted operation of key business systems and comply with the rules and regulations that are applicable to public reporting companies. Moreover, if we do not manage the growth of our business and operations effectively, the quality of our platform could suffer, which could negatively affect our reputation, results of operations and overall business.
We may expand by acquiring or investing in other companies or technologies, which may divert our management’s attention, result in dilution to our shareholders and consume resources that are necessary to sustain our business.
We have in the past and may in the future acquire complementary products, services, technologies or businesses. Negotiating these transactions can be time-consuming, difficult and expensive, and our ability to complete these transactions may often be subject to conditions or approvals that are beyond our control. In addition, we have limited experience in acquiring other companies or technologies. We may not be able to identify desirable additional acquisition targets, may incorrectly estimate the value of an acquisition target or may not be successful in entering into an agreement with any particular target. Consequently, these transactions, even if undertaken and announced, may not close.
An acquisition, investment, or new business relationship may result in unforeseen operating difficulties and expenditures. It is also possible that the integration process could result in material challenges, including, without limitation:
• | the diversion of management’s attention from ongoing business concerns and performance as a result of the devotion of management’s attention to acquisition or integration activities; |
• | managing a larger combined company; |
• | maintaining employee morale and retaining key management and other employees; |
• | the possibility of faulty assumptions underlying expectations regarding the integration process; |
• | retaining existing business and operational relationships and attracting new business and operational relationships; |
• | consolidating corporate and administrative infrastructures and eliminating duplicative operations and inconsistencies in standards, controls, procedures and policies; |
• | coordinating geographically separate organizations; |
• | unanticipated issues in integrating information technology, communications and other systems; |
• | undetected errors or unauthorized use of a third party’s code in the products of the acquired companies or in technology acquired; |
• | breaches to our cybersecurity measures if there are cybersecurity issues we are not aware of at the time of the acquisition; |
• | entry into highly competitive markets in which we have no or limited direct prior experience and where competitors have stronger market positions; and |
• | exposure to unknown liabilities, including claims and disputes by third parties against the companies we acquire. |
Many of these factors will be outside of the combined company’s control and any one of them could result in delays, increased costs, decreased revenues and diversion of management’s time and energy, which could materially affect our financial position, results of operations and cash flows.
21
If we experience difficulties with the integration process following an acquisition, the anticipated benefits of the acquisition may not be realized fully or at all, or may take longer to realize than expected. Moreover, the anticipated benefits of any acquisition, investment, or business relationship may not be realized.
In addition, in connection with an acquisition, investment or new business relationship we may:
• | issue additional equity securities that would dilute current shareholders; |
• | use cash that we may need in the future to operate our business; |
• | incur debt on terms unfavorable to us or that we are unable to repay or that may place burdensome restrictions on our operations; |
• | incur large charges or substantial liabilities; or |
• | become subject to adverse tax consequences. |
Any of these outcomes could harm our business and operating results.
We face competition from established and emerging companies, which could divert university clients or students to our competitors, result in pricing pressure and significantly reduce our revenue.
We expect existing competitors and new entrants to the online learning market to revise and improve their business models constantly in response to challenges from competing businesses, including ours. If these or other market participants introduce new or improved delivery of online education and technology-enabled services that we cannot match or exceed in a timely or cost-effective manner, our ability to grow our revenue and achieve profitability could be compromised.
Some of our competitors and potential competitors have significantly greater resources than we do. Increased competition may result in pricing pressure for us in terms of the percentage of tuition and fees we are able to negotiate to receive. The competitive landscape may also result in longer and more complex sales cycles with a prospective university client or a decrease in our market share among selective nonprofit colleges and universities seeking to offer online graduate programs or short courses, any of which could negatively affect our revenue and future operating results and our ability to grow our business.
Particularly in our Short Course Segment, which has a lower barrier to entry, we are facing increasing competition from traditional massive open online course providers, which have evolved from providing massive open online courses to providing short course certificates, nano degrees and similar non-degree alternatives, as well as from companies that provide corporate training programs and online courses taught outside the university environment (e.g., by experts in various fields).
A number of competitive factors could cause us to lose potential university client and student opportunities or force us to offer our platform on less favorable economic terms, including:
• | competitors may develop service offerings that our potential university clients or students find to be more compelling than ours; |
• | competitors may adopt more aggressive pricing policies and offer more attractive sales terms, adapt more quickly to new technologies and changes in university client and student requirements, and devote greater resources to the acquisition of qualified students than we can; |
• | current and potential competitors may establish cooperative relationships among themselves or with third parties to enhance their products and expand their markets, and our industry is likely to see an increasing number of new entrants and increased consolidation. Accordingly, new competitors or alliances among competitors may emerge and rapidly acquire significant market share; and |
• | colleges and universities may choose to continue using or to develop their own online learning solutions in-house, rather than pay for our platform. |
We may not be able to compete successfully against current and future competitors. In addition, competition may intensify as our competitors raise additional capital and as established companies in other market segments or geographic markets expand into our market segments or geographic markets. If we cannot compete successfully against our competitors, our ability to grow our business and achieve profitability could be impaired.
If for-profit postsecondary institutions, which offer online education alternatives different from ours, perform poorly, it could tarnish the reputation of online education as a whole, which could impair our ability to grow our business.
22
For-profit postsecondary institutions, many of which provide course offerings predominantly online, remain under intense regulatory and other scrutiny, which has led to media attention that has portrayed that sector in an unflattering light. Some for-profit online school operators have been subject to governmental investigations alleging the misuse of public funds, financial irregularities, exaggerated promises to students, and failure to achieve positive outcomes for students, including the inability to obtain employment in their fields. These allegations have attracted significant adverse media coverage and have prompted legislative hearings and regulatory responses. These investigations have focused on specific companies and individuals, and entire industries in the case of marketing and recruiting practices by for-profit higher education companies. Even though we do not market our platform to these institutions, this negative media attention may nevertheless add to skepticism about online higher education generally, including our platform. Allegations of abuse of federal financial aid funds and other statutory violations against for-profit higher education companies could negatively impact our opportunity to succeed due to increased regulation and decreased demand. Any of these factors could negatively impact our ability to increase our university client base and grow our offerings, which would make it difficult to continue to grow our business.
Our internal information technology systems are critical to our business. System integration and implementation issues could disrupt our operations, which could have a material adverse impact on our business or result in significant deficiencies or material weaknesses in our internal controls.
We rely on the efficient and uninterrupted operation of complex information technology systems, including systems for billing, human resources, enterprise resource planning, and customer relationship management. As our business has grown in size and complexity, the growth has placed, and will continue to place, significant demands on our internal information technology systems. To effectively manage this growth, we must commit significant financial resources and personnel to maintain and enhance existing systems and develop or acquire new systems to keep pace with continuing changes in our business and information processing technology as well as evolving industry, regulatory, and accounting standards. If the information we rely upon to run our businesses is determined to be inaccurate or unreliable, or if we fail to properly maintain or enhance our internal information technology systems, we could have operational disruptions, significant deficiencies, or material weaknesses in our internal controls, incur increased operating and administrative expenses, lose our ability to produce timely and accurate financial reports, or suffer other adverse consequences.
If we do not retain our senior management team and key employees, we may not be able to sustain our growth or achieve our business objectives.
Our future success is substantially dependent on the continued service of our senior management team. Because of our small number of university clients and the significant nature of each new university client relationship, our senior management team is heavily involved in the university client identification and sales process, and their expertise is critical in navigating the complex approval processes of large nonprofit colleges and universities. We do not maintain key-person insurance on any of our employees, including our senior management team. The loss of the services of any individual on our senior management team, or failure to find a suitable successor, could make it more difficult to successfully operate our business and achieve our business goals.
Our future success also depends heavily on the retention of our marketing and sales, technology and content development and support teams to continue to attract and retain qualified students in our university clients’ programs and courses, thereby generating revenue for us. In particular, our highly-skilled technology and content development employees provide the technical expertise underlying our bundled technology-enabled services that support our university clients’ programs and courses and the students enrolled in these offerings. Competition for these employees is intense. As a result, we may be unable to attract or retain these key personnel that are critical to our success, resulting in harm to our relationships with university clients, loss of expertise or know-how and unanticipated recruitment and training costs.
In addition, as a result of business acquisitions, current and prospective employees of 2U and any acquired company may experience uncertainty about their future roles following the acquisition. If our employees or the employees of any acquired company depart because of issues relating to uncertainty or perceived difficulties of integration, our ability to realize the anticipated benefits of an acquisition could be adversely impacted.
Our international operations expose us to fluctuations in currency exchange rates that could negatively impact our financial results and cash flows.
After the GetSmarter acquisition, we conduct a more substantial portion of our business outside the U.S. and we accordingly make certain business and resource decisions considering assumptions about foreign currency. As a result, we face exposure to adverse movements in foreign currency exchange rates, in particular with respect to the volatility of the South African rand, or ZAR. While our reporting currency is in U.S. dollars, a portion of our consolidated revenues and expenses are denominated in ZAR, certain of our assets are denominated in ZAR and we have a significant employee base in South Africa. A decrease in the value of the U.S. dollar in relation to the ZAR could increase our cost of doing business in South Africa.
23
Alternatively, if the ZAR depreciates against the U.S. dollar, the value of our ZAR revenues, earnings and assets as expressed in our U.S. dollar financial statements will decline. We have not entered into any hedging transactions in an effort to reduce our exposure to foreign exchange risk. Our exposure to adverse movements in foreign currency exchange rates, including the ZAR, could have a material adverse impact on our financial results and cash flows.
In addition, local political events, financial instability and other factors can lead to economic uncertainty and currency exchange rate fluctuations. For example, the announcement of the Referendum of the U.K.’s Membership of the EU (referred to as “Brexit”), advising for the exit of the U.K. from the EU resulted in significant volatility in the global stock markets and exchange rate fluctuations.
The fluctuations of currencies in which we conduct business can both increase and decrease our overall revenue and expenses for any given fiscal period. Such volatility, even when it increases our revenues or decreases our expenses, impacts our ability to accurately predict our future results and earnings.
We have incurred substantial transaction and integration expenses related to the acquisition of GetSmarter and expect to incur additional integration expenses that could negatively impact our financial results and cash flows.
We have incurred, and expect to continue to incur, a number of non-recurring costs associated with the GetSmarter acquisition and combining the operations of the two companies. For example, we expect to incur costs related to formulating and implementing integration plans, including facilities and systems consolidation costs and employment-related costs. We continue to assess the magnitude of these costs, and additional unanticipated costs may be incurred in the integration of the two companies’ businesses. Any expected efficiencies to offset these costs may not be achieved in the near term, or at all.
We may need additional capital in the future to pursue our business objectives. Additional capital may not be available on favorable terms, or at all, which could compromise our ability to grow our business.
We may need to raise additional funds to respond to business challenges or opportunities, accelerate our growth, develop new offerings or enhance our platform. If we seek to raise additional capital, it may not be available on favorable terms or may not be available at all. In addition, if we have borrowings outstanding under our credit facility, we may be restricted from using the net proceeds of financing transactions for our operating objectives. Lack of sufficient capital resources could significantly limit our ability to manage our business and to take advantage of business and strategic opportunities. Any additional capital raised through the sale of equity or debt securities with an equity component would dilute our stock ownership. If adequate additional funds are not available if and when needed, we may be required to delay, reduce the scope of, or eliminate material parts of our business strategy.
We maintain offices outside of the United States, have international residents that apply to and enroll in our offerings and plan to expand our international business, which exposes us to risks inherent in international operations.
We have a branch office in Hong Kong for marketing and student support. In addition, we currently employ approximately 555 people in South Africa and 6 people in the United Kingdom as a result of the acquisition of GetSmarter, which significantly increased our international operations, including the number of international applicants and students in our offerings. One element of our growth strategy is to continue expanding our international operations and to establish a worldwide client base. Our current international operations and future initiatives will involve a variety of risks that could constrain our operations and compromise our growth prospects, including:
• | the need to localize and adapt online offerings for specific countries, including translation into foreign languages and ensuring that these offerings enable our university clients to comply with local education laws and regulations; |
• | the burden of complying with a wide variety of laws, including those relating to labor and employment matters, education, data protection and privacy; |
• | difficulties in staffing and managing foreign operations, including different pricing environments, longer sales cycles, longer accounts receivable payment cycles and collections issues; |
• | lack of familiarity with and unexpected changes in foreign regulatory requirements; |
• | challenges inherent in efficiently managing an increased number of employees over large geographic distances, including the need to implement appropriate systems, policies, benefits and compliance programs; |
• | new and different sources of competition, and practices which may favor local competitors; |
• | weaker protection for intellectual property and other legal rights than in the United States and practical difficulties in enforcing intellectual property and other rights outside of the United States; |
24
• | compliance challenges related to the complexity of multiple, conflicting and changing governmental laws and regulations, including employment, tax, education, privacy and data protection, and anti-bribery laws and regulations such as the U.S. Foreign Corrupt Practices Act and the U.K. Bribery Act; |
• | increased financial accounting and reporting burdens and complexities; |
• | restrictions on the transfer of funds; |
• | adverse tax consequences, including liabilities for indirect taxes or the potential for required withholding taxes for our overseas employees; |
• | terrorist attacks, acts of violence or war and adverse environmental conditions; |
• | unstable regional and economic political conditions; and |
• | fluctuations in currency exchange rates or restrictions on foreign currency, and the resulting effect on our revenue and expenses. |
Our expansion efforts may not be successful. Our experience with attracting university clients and students in the U.S. may not be relevant to our ability to attract clients and students in other markets. If we invest substantial time and resources to expand our international operations and are unable to attract university clients and students successfully and in a timely manner, our business and operating results will be harmed.
Our operations in South Africa expose us to risks that could have an adverse effect on our business.
We expect to continue adding personnel in South Africa. We may incur costs complying with labor laws, rules and regulations in South Africa, including laws that regulate work time, provide for mandatory compensation in the event of termination of employment for operational reasons, and impose monetary penalties for non-compliance with administrative and reporting requirements in respect of affirmative action policies. Our reliance on a workforce in South Africa also exposes us to disruptions in the business, political, and economic environment in that region, as well as natural disasters and other environmental conditions. Maintenance of a stable political environment is important to our operations in South Africa, and terrorist attacks and acts of violence or war may directly affect our physical facilities and workforce or contribute to general instability. Our operations in South Africa require us to comply with complex local laws and regulatory requirements and expose us to foreign currency exchange rate risk. The economy of South Africa in the past has been, and in the future may continue to be, characterized by rates of inflation and interest rates that are substantially higher than those prevailing in the United States, which could increase our South-African based costs and decrease our operating margins. Our operations in South Africa may also subject us to trade restrictions, exchange control limitations, reduced or inadequate protection for intellectual property rights, security breaches, and other factors that may adversely affect our business. Negative developments in any of these areas could increase our costs of operations or otherwise harm our business.
We might not be able to utilize a portion of our net operating loss carryforwards, which could adversely affect our profitability.
As of December 31, 2018, we had federal net operating loss carryforwards due to prior period losses, which, if not utilized, will begin to expire in 2029. Our gross state net operating loss carryforwards are equal to or less than the federal net operating loss carryforwards and expire over various periods based on individual state tax laws. These net operating loss carryforwards could expire unused and be unavailable to offset future income tax liabilities, which could adversely affect our profitability. In addition, under Section 382 of the Internal Revenue Code of 1986, as amended, if a corporation undergoes an “ownership change,” which is generally defined as a greater than 50% change, by value, in its equity ownership over a three-year period, the corporation’s ability to use its pre-change net operating loss carryforwards and other pre-change tax attributes to offset its post-change income may be limited. Similar rules may apply under state tax laws. During the three-year period ended December 31, 2016, we determined that such an ownership change occurred. Absent a subsequent ownership change, however, all of our historical net operating losses should be available. Therefore, the occurrence of the ownership change during the three-year period ended December 31, 2016 is not expected to limit our ability to carry forward historical net operating losses before expiration. We may experience ownership changes in the future as a result of subsequent shifts in our stock ownership. If a future ownership change occurs and limits our ability to use our historical net operating loss carryforwards, it would harm our future financial statement results by increasing our future tax obligations. We also have net operating loss carryforwards in South Africa and the United Kingdom, and there is no guarantee that entities in these countries will generate enough taxable income to fully utilize them.
We engage some individuals classified as independent contractors, not employees, and if federal or state law mandates that they be classified as employees, our business would be adversely impacted.
25
We engage independent contractors and are subject to the Internal Revenue Service regulations and applicable state law guidelines regarding independent contractor classification. These regulations and guidelines are subject to judicial and agency interpretation, and it could be determined that the independent contractor classification is inapplicable. Further, if legal standards for classification of independent contractors change, it may be necessary to modify our compensation structure for these personnel, including by paying additional compensation or reimbursing expenses. In addition, if our independent contractors are determined to have been misclassified as independent contractors, we would incur additional exposure under federal and state law, workers’ compensation, unemployment benefits, labor, employment and tort laws, including for prior periods, as well as potential liability for employee benefits and tax withholdings. Any of these outcomes could result in substantial costs to us, could significantly impair our financial condition and our ability to conduct our business as we choose, and could damage our reputation and our ability to attract and retain other personnel.
We rely on third-party software to provide certain components of our platform, which may be difficult to obtain or which could cause errors or failures of our platform.
We rely on software licensed from third parties to offer certain components of our technology and services. In addition, we may need to obtain future licenses from third parties to use intellectual property necessary for the continued use of our technology and services, which might not be available to us on acceptable terms, or at all. Any loss of the right to use a component of our technology or services could result in errors or failures of our platform until equivalent technology is either developed by us, or, if available, is identified, obtained and integrated, which could harm our business. Any errors or defects in third-party software could result in errors or a failure of our platform, which could harm our business.
Risks Related to Regulation of Our Business and That of Our University Clients
Our business model relies on university client institutions complying with federal and state laws and regulations.
Higher education is heavily regulated. All of our university clients in the United States and certain university clients outside of the United States participate in Title IV federal student financial assistance programs under the HEA of 1965, as amended, or HEA, and are subject to extensive regulation by the DOE, as well as various state agencies, licensing boards and accrediting commissions. To participate in the Title IV programs, an institution must receive and maintain authorization by the appropriate state education agencies, be accredited by an accrediting commission recognized by the DOE, and be certified by the DOE as an eligible institution. If a university client participating in Title IV was found to be in non-compliance with any of these laws, regulations, standards or policies, the university client could lose some or all access to Title IV program funds, lose the ability to offer certain programs or lose their ability to operate in certain states, any of which could cause our revenue from that university client’s program to decline.
The regulations, standards and policies applicable to our university clients change frequently and are often subject to interpretation. Changes in, or new interpretations of, applicable laws, regulations or standards could compromise our university clients’ accreditation, authorization to operate in various states, permissible activities or use of federal funds under Title IV programs. We cannot predict with certainty how the requirements applied by our university clients’ regulators will be interpreted, or whether our university clients will be able to comply with these requirements in the future.
Our activities are subject to federal and state laws and regulations and other requirements.
Although we are not an institution of higher education, we are required to comply with certain education laws and regulations as a result of our role as a service provider to higher education institutions, either directly or indirectly through our contractual arrangements with university clients. Failure to comply with these laws and regulations could result in breach of contract and indemnification claims and could cause damage to our reputation and impair our ability to grow our business and achieve profitability.
Activities of the U.S. Congress or Department of Education could result in adverse legislation or regulatory action.
The process of re-authorization of the HEA began in 2014 and is ongoing. Congressional hearings will continue to be scheduled by the U.S. Senate Committee on Health, Education, Labor and Pensions, the U.S. House of Representatives Committee on Education and the Workforce and other Congressional committees regarding various aspects of the education industry, including accreditation matters, student debt, student recruiting, cost of tuition, distance learning, competency-based learning, student success and outcomes and other matters.
The increased scrutiny and results-based accountability initiatives in the education sector, as well as ongoing policy differences in Congress regarding spending levels, could lead to significant changes in connection with the reauthorization of the HEA or otherwise. These changes may place new or additional regulatory burdens on postsecondary schools generally, and specific initiatives may be targeted at or have an impact upon companies like us that serve higher education. The adoption of any laws or regulations that limit our ability to provide our bundled services to our university clients could compromise our
26
ability to drive revenue through their programs or make our platform less attractive to them. Congress could also enact laws or regulations that require us to modify our practices in ways that could increase our costs.
In addition, regulatory activities and initiatives of the DOE may have similar consequences for our business even in the absence of Congressional action.
Our business model, which depends on our ability to receive a share of tuition revenue as payment from our university clients, has been validated by a DOE “dear colleague” letter, but such validation is not codified by statute or regulation and may be subject to change.
Each institution that participates in Title IV programs agrees it will not “provide any commission, bonus, or other incentive payment based in any part, directly or indirectly, upon success in securing enrollments or the award of financial aid, to any person or entity who is engaged in any student recruitment or admission activity, or in making decisions regarding the award of Title IV, HEA program funds.” All of our university clients participate in Title IV Programs.
Although this rule, referred to as the incentive compensation rule, generally prohibits entities or individuals from receiving incentive-based compensation payments for the successful recruitment, admission or enrollment of students, the DOE provided guidance in 2011 permitting tuition revenue-sharing arrangements known as the “bundled services rule.” Our current business model relies heavily on the bundled services rule to enter into tuition revenue-sharing agreements with our university clients.
Because the bundled services rule was promulgated in the form of agency guidance issued by the DOE in the form of a “dear colleague” letter, or DCL, and is not codified by statute or regulation, there is risk that the rule could be altered or removed without prior notice, public comment period or other administrative procedural requirements that accompany formal agency rulemaking. Although the DCL represents the current policy of the DOE, the bundled services rule could be reviewed, altered or vacated in the future. In addition, the legal weight the DCL would carry in litigation over the propriety of any specific compensation arrangements under the HEA or the incentive compensation rule is uncertain. We can offer no assurances as to how the DCL would be interpreted by a court. The revision, removal or invalidation of the bundled services rule by Congress, the DOE or a court, whether in an action involving our company or our university clients, or in action that does not involve us, could require us to change our business model and renegotiate the terms of our university client contracts and could compromise our ability to generate revenue.
If we or our subcontractors or agents violate the incentive compensation rule, we could be liable to our university clients for substantial fines, sanctions or other liabilities.
Even though the DCL clarifies that tuition revenue-sharing arrangements with our university clients are permissible, we are still subject to other provisions of the incentive compensation rule that prohibit us from offering to our employees who are involved with or responsible for recruiting or admissions activities any bonus or incentive-based compensation based on the successful identification, admission or enrollment of students into any institution. If we or our subcontractors or agents violate the incentive compensation rule, we could be liable to our university clients for substantial fines, sanctions or other liabilities, including liabilities related to “whistleblower” claims under the federal False Claims Act. Any such claims, even if without merit, could require us to incur significant costs to defend the claim, distract management’s attention and damage our reputation.
If we or our subcontractors or agents violate the misrepresentation rule, or similar federal and state regulatory requirements, we could face fines, sanctions and other liabilities.
We are required to comply with other regulations promulgated by the DOE that affect our student acquisition activities, including the misrepresentation rule. The misrepresentation rule is broad in scope and applies to statements our employees, subcontractors or agents may make about the nature of a university client’s program, a university client’s financial charges or the employability of a university client’s program graduates. A violation of this rule, FTC rules or other federal or state regulations applicable to our marketing activities by an employee, subcontractor or agent performing services for university clients could hurt our reputation, result in the termination of university client contracts, require us to pay fines or other monetary penalties or require us to pay the costs associated with indemnifying a university client from private claims or government investigations.
If our university clients fail to maintain their state authorizations, or we or our university clients violate other state laws and regulations, students in their offerings could be adversely affected and we could lose our ability to operate in that state and provide services to these university clients.
Our university clients must be authorized in certain states to offer online educational offerings, engage in recruiting and operate externships, internships, clinical training or other forms of field experience, depending on state law. The loss of or
27
failure to obtain state authorization would, among other things, limit the ability of a university client to enroll students in that state, render the university client and its students ineligible to participate in Title IV programs in that state, diminish the attractiveness of the university client’s offering and ultimately compromise our ability to generate revenue and become profitable.
In addition, if we or any of our university clients fail to comply with any state agency’s rules, regulations or standards beyond authorizations, the state agency or state attorney general could limit the ability of the university client to offer educational offerings in that state or limit our ability to perform our contractual obligations to our university client in that state.
If our university clients fail to maintain institutional or programmatic accreditation for their offerings, our revenue could be materially affected.
The loss or suspension of a university client’s accreditation or other adverse action by the university client’s institutional or programmatic accreditor would render the institution or its offerings ineligible to participate in Title IV programs, could prevent the university client from offering certain educational offerings and, for certain degree-granting programs, could make it impossible for the graduates of the university client’s program to obtain employment in the profession for which they trained. If any of these results occurs, it could hurt our ability to generate revenue from that offering.
Our future growth could be impaired if our university clients fail to obtain timely approval from applicable regulatory agencies to offer new programs, make substantive changes to existing programs or expand their programs into or within certain states.
Our university clients are required to obtain the appropriate approvals from the DOE and applicable state and accrediting regulatory agencies for new programs or locations, which may be conditioned, delayed or denied in a manner that could impair our strategic plans and future growth. Regulatory constraints have resulted in delays to various approvals our university clients are requesting, and such delays could in turn delay the timing of our ability to generate revenue from our university clients’ programs.
If more state agencies require specialized approval of our university clients’ offerings, our operating costs could rise significantly, approval times could lag or we could be prohibited from operating in certain states.
In addition to state licensing agencies, our university clients may be required to obtain approval from professional licensing boards in certain states to offer specialized programs in specific fields of study. Currently, relatively few states require institutions to obtain professional board approval for their online educational offerings. However, more states could pass laws requiring our university clients’ offerings, such as graduate programs in teaching or nursing, to obtain approval from state professional boards. If a significant number of states pass additional laws requiring schools to obtain professional board approval, the cost of obtaining all necessary state approvals could dramatically increase, which could make our platform less attractive to university clients, and these university clients could be barred from operating in some states entirely.
Evolving regulations and legal obligations related to data privacy, data protection and information security and our actual or perceived failure to comply with such obligations, could have an adverse effect on our business.
The legislative and regulatory framework for privacy and security issues worldwide is rapidly evolving and is likely to remain uncertain for the foreseeable future. In providing our platform to university clients and in operating our business, we collect and process regulated personal information from students, faculty, prospective students and employees. Our handling of this personal information is subject to a variety of laws and regulations, which have been adopted by federal, state and foreign governments to regulate the collection, distribution, use and storage of personal information. Any failure or perceived failure by us to comply with these privacy laws and regulations or any security incident that results in the unauthorized release or transfer of this personal information in our possession, could result in government enforcement actions, litigation, fines and penalties or adverse publicity, all of which could have an adverse effect on our reputation and business.
Various federal, state and foreign legislative, regulatory or other governmental bodies may enact new or additional laws or regulations, or issue rulings that invalidate prior laws or regulations concerning privacy, data storage and data protection that could materially adversely impact our business. For example, in April 2016, the European Parliament and the Council of the European Union formally adopted a comprehensive General Data Protection Regulation (GDPR), which took effect in May 2018. The GDPR introduces new requirements for the protection of personal data of individuals in the EU and substantial fines for non-compliance. As another example, the European ePrivacy Directive (Directive 2002/58/EC, as amended by Directive 2009/136/EC), which obliges EU member states to introduce certain national laws regulating privacy in the electronic communications sector, will soon be replaced by the ePrivacy Regulation. As the text of the ePrivacy Regulation is still under development and in draft form, and as further guidance is issued and interpretations of both the ePrivacy Regulation and the GDPR develop, it is difficult to assess the impact of either on our business or operations, but it may require us to modify our data practices and policies (e.g., in relation to management of cookies and direct marketing messages sent through
28
different media) and we could incur substantial costs as a result. We are also subject to evolving EU laws on data transfer, as we may transfer personal data from the European Economic Area to other jurisdictions. There is currently litigation challenging various EU mechanisms for adequate data transfers and it is uncertain whether various mechanisms, such as the “Privacy Shield” or “model contractual clauses” will be invalidated by the European courts.
Similarly, in the U.S., various states have either passed or proposed privacy laws that will go into effect in the next few years. For example, California passed the California Consumer Privacy Act (CCPA) in 2018 (set to go into effect in 2020), and Massachusetts recently proposed MA Bill SD 341, “An Act relative to consumer data privacy.” There are similar bills pending in a number of other states, as well. CCPA and MA Bill SD 341 each represent a trend toward stronger privacy protections and greater data transparency in the U.S.. Currently, federal law legislates privacy on an industry by industry basis. Without an overarching federal law driving privacy compliance, the risk is high of a patchwork of privacy legislation formed by individual state laws, similar to the states’ approach to breach notification obligations. This could not only increase costs for compliance but also raise the risk of enforcement by individual state Attorneys General.
Complying with these and other changing requirements could cause us to incur substantial costs, or require us to change our business practices, any of which could materially adversely affect our business and operating results.
We are required to comply with The Family Educational Rights and Privacy Act, or FERPA, and failure to do so could harm our reputation and negatively affect our business.
FERPA generally prohibits an institution of higher education participating in Title IV programs from disclosing personally identifiable information from a student’s education records without the student’s consent. Our university clients and their students disclose to us certain information that originates from or comprises a student education record under FERPA. As an entity that provides services to institutions participating in Title IV programs, we are indirectly subject to FERPA, and we may not transfer or otherwise disclose any personally identifiable information from a student record to another party other than in a manner permitted under the statute. If we violate FERPA, it could result in a material breach of contract with one or more of our university clients and could harm our reputation. Further, in the event that we disclose student information in violation of FERPA, the DOE could require a university client to suspend our access to their student information for at least five years.
In our Short Course Segment, we are subject to risks and compliance rules and regulations related to the third-party credit card payment processing platform integrated within our websites or otherwise used by our business.
Students typically use a credit or debit card to pay application and enrollment fees and to make tuition payments for our short courses. We are subject to payment card association operating rules, certification requirements and rules governing electronic funds transfers, which could change or be reinterpreted to make it difficult or impossible for us to comply. We believe that we and the payment processing service providers we use are compliant in all material respects with the Payment Card Industry Data Security Standard. However, there is no guarantee that such compliance will be maintained or that compliance will prevent illegal or improper use of our systems that are integrated with our payment processing providers. If we or any of the third-party payment processors we use fails to be in compliance with applicable credit card rules and regulations, we may be required to migrate to an alternate payment processor which could result in transaction downtime during the migration and/or a loss of students and have a material adverse effect on our business, financial condition and results of operations.
Risks Related to Intellectual Property
We operate in an industry with extensive intellectual property litigation. Claims of infringement against us may hurt our business.
Our success depends, in part, upon our ability to avoid infringing intellectual property rights owned by others and being able to resolve claims of intellectual property infringement without major financial expenditures or adverse consequences. The technology and software fields generally are characterized by extensive intellectual property litigation and many companies that own, or claim to own, intellectual property have aggressively asserted their rights. In addition, we face potential copyright and trademark infringement from the content we produce in connection with our marketing activities, including in websites related to our offerings. From time to time, we may be subject to legal proceedings and claims relating to the intellectual property rights of others, and we expect that third parties will assert intellectual property claims against us, particularly as we expand the complexity and scope of our business. In addition, our university client agreements require us to indemnify our university clients against claims that our platform infringes the intellectual property rights of third parties.
Future litigation may be necessary to defend ourselves or our university clients from intellectual property infringement claims or to establish our proprietary rights. Some of our competitors have substantially greater resources than we do and would be able to sustain the costs of complex intellectual property litigation to a greater degree and for longer periods of time than we could. In addition, patent holding companies that focus solely on extracting royalties and settlements by enforcing
29
patent rights may target us. Regardless of whether claims that we are infringing patents or other intellectual property rights have any merit, these claims are time-consuming and costly to evaluate and defend and could:
• | hurt our reputation; |
• | adversely affect our relationships with our current or future university clients; |
• | cause delays or stoppages in providing our platform; |
• | divert management’s attention and resources; |
• | require technology changes to our software that could cause us to incur substantial cost; |
• | subject us to significant liabilities; and |
• | require us to cease some or all of our activities. |
In addition to liability for monetary damages against us, which may include attorneys’ fees, treble damages in the event of a finding of willful infringement, or, in some circumstances, damages against our university clients, we may be prohibited from developing, commercializing or continuing to provide some or all of our bundled technology-enabled platform unless we obtain licenses from, and pay royalties to, the holders of the patents or other intellectual property rights, which may not be available on commercially favorable terms, or at all.
We may incur liability, or our reputation may be harmed, as a result of the activities of our university clients and students or the content in our online learning environments.
We may be subject to potential liability for the activities of our university clients or students in connection with the data they post or store in our online learning platform. For example, university personnel or students, or our employees or independent contractors, may post to our online learning platform various articles or other third-party content for use in class discussions or within asynchronous lessons.
Various U.S. federal statutes may apply to us with respect to these activities. The Copyright Act of 1976 provides recourse to copyright owners who believe that their rights under U.S. copyright law have been infringed on the internet. Those rights can be limited by operation of the Digital Millennium Copyright Act of 1998, or DMCA, such that we may not be liable for infringing content posted by university clients or students, provided that we follow the procedures for handling copyright infringement claims set forth in the DMCA.
Although statutes and case law in the U.S. have generally shielded us from liability for these activities to date, court rulings in pending or future litigation may narrow the scope of protection afforded us under these laws. In addition, laws governing these activities are unsettled in many international jurisdictions. As a result, we could incur liability to third parties for the unauthorized duplication, distribution or other use of third-party content. Any such claims could subject us to costly litigation and impose a significant strain on our financial resources and management personnel regardless of whether the claims have merit. Our various liability insurance coverages may not cover potential claims of this type adequately or at all, and we may be required to alter or cease our uses of such material, which may include changing or removing content from courses or altering the functionality of our online learning platform, or to pay monetary damages.
Additionally, university personnel or students, or our employees or independent contractors could use our online learning platform to store or process regulated personal information without our knowledge. In the event that our systems experience a data security incident, or an individual or entity accesses information without, or in excess of, proper authorization, we could be subject to data security incident notification laws, as described elsewhere, which may require prompt remediation and notification to individuals. If we are unaware of the data and information stored on our systems, we may be unable to appropriately comply with all legal obligations, and we may be exposed to governmental enforcement or prosecution actions, private litigation, fines and penalties or adverse publicity and these incidents could harm our reputation and business.
Our failure to protect our intellectual property rights could diminish the value of our platform, weaken our competitive position and reduce our revenue.
We regard the protection of our intellectual property, which includes trade secrets, copyrights, trademarks and domain names, as critical to our success. We protect our proprietary information from unauthorized use and disclosure by entering into confidentiality agreements with any party who may come in contact with such information. We also seek to ensure that we own intellectual property created for us by signing agreements with employees, independent contractors, consultants, companies and any other third party who may create intellectual property for us and that assigns their copyright and patent rights to us.
30
However, these arrangements and the other steps we have taken to protect our intellectual property may not prevent the misappropriation of our proprietary information or deter independent development of similar technologies by others.
We pursue the registration of our domain names, trademarks and service marks in the United States and in jurisdictions outside the United States. However, third parties may knowingly or unknowingly infringe on our trademark or service mark rights, third parties may challenge our trademark or service mark rights, and pending or future trademark or service mark applications may not be approved. In addition, effective trademark protection may not be available in every country in which we operate or intend to operate. In any or all cases, we may be required to expend significant time and expense to prevent infringement or enforce our rights.
Monitoring unauthorized use of our intellectual property is difficult and costly. Our efforts to protect our proprietary rights may not be adequate to prevent misappropriation of our intellectual property. Further, we may not be able to detect unauthorized use of, or take appropriate steps to enforce, our intellectual property rights. Our competitors may also independently develop similar technology. In addition, the laws of many countries may not protect our proprietary rights to as great an extent as do the laws of the United States. Further, the laws in the United States and elsewhere change rapidly, and any future changes could adversely affect us and our intellectual property rights. Our failure to meaningfully protect our intellectual property could result in competitors offering services that incorporate our most technologically advanced features, which could seriously reduce demand for our platform. In addition, we may in the future need to initiate litigation such as infringement or administrative proceedings, to protect our intellectual property rights. Litigation, whether we are a plaintiff or a defendant, can be expensive, time-consuming and may divert the efforts of our technical staff and managerial personnel, whether or not such litigation results in a determination that is unfavorable to us. In addition, litigation is inherently uncertain, and thus we may not be able to stop our competitors from infringing upon our intellectual property rights.
The use of “open source” software in our platform could negatively affect our ability to offer our platform and subject us to possible litigation.
A substantial portion of our platform incorporates so-called “open source” software, and we may incorporate additional open source software in the future. Open source software is generally freely accessible, usable and modifiable. Certain open source licenses may, in certain circumstances, require us to offer our platform that incorporates the open source software for no cost, that we make available source code for modifications or derivative works we create based upon, incorporating or using the open source software and that we license such modifications or derivative works under the terms of the particular open source license. Our efforts to monitor the use of open source software in our platform to ensure that no open source software is used in such a way as to require us to disclose our source code when we do not wish to do so, may be unable to prevent such use from occurring. In addition, if a third-party software provider has incorporated certain types of open source software into software we license from such third party without our knowledge, we could, under certain circumstances, be required to comply with the foregoing conditions. If an author or other third party that distributes open source software that we use were to allege that we had not complied with the conditions of one or more of these licenses, we could be required to incur significant legal expenses defending against such allegations and could be subject to significant damages, including being enjoined from offering the component of our platform that contained the open source software and being required to comply with the foregoing conditions, which could disrupt our ability to offer certain components of our platform.
We could also be subject to suits by parties claiming ownership of what we believe to be open source software. The terms of many open source licenses to which we are subject have not been interpreted by U.S. or foreign courts. Accordingly, there is a risk that those licenses could be construed in a manner that imposes unanticipated conditions or restrictions on our ability to offer our platform. Litigation could be costly for us to defend, have a negative effect on our operating results and financial condition and require us to devote additional research and development resources to change our products.
If internet search engines’ methodologies are modified, our search engine optimization capability in connection with our student recruiting efforts could be harmed.
Our search engine optimization capability in connection with our student acquisition efforts substantially depends on various internet search engines, such as Google, to direct a significant amount of traffic to websites related to our offerings. Our ability to influence the number of visitors directed to these websites through search engines is not entirely within our control. For example, search engines frequently revise their algorithms in an attempt to optimize their search result listings. In 2011, Google announced an algorithm change that affected nearly 12% of their U.S. query results. Future changes that may be made by Google or any other search engines could impact our ability to effectively utilize search engine optimization as part of our student acquisition strategies in the long-term. Changes in the methodologies used by search engines to display results could cause the websites related to our offerings to receive less favorable placements, which could reduce the number of prospective students who visit these websites from search engines. Any reduction in the number of prospective students directed to our websites could negatively affect our ability to generate prospective students, and ultimately revenue, through our student acquisition activities.
31
Individuals that appear in content hosted on our online learning platform may claim violation of their rights.
Faculty and students that appear in video segments hosted on our online learning platform may claim that proper assignments, licenses, consents and releases were not obtained for use of their likenesses, images or other contributed content. Our contracts typically require that our university clients ensure that proper assignments, licenses, consents and releases are obtained for their course material, but we cannot know with certainty that they have obtained all necessary rights. Moreover, the laws governing rights of publicity and privacy, and the laws governing faculty ownership of course content, are imprecise and adjudicated on a case-by-case basis, such that the enforcement of agreements to transfer the necessary rights is unclear. As a result, we could incur liability to third parties for the unauthorized duplication, display, distribution or other use of this material. Any such claims could subject us to costly litigation and impose a significant strain on our financial resources and management personnel regardless of whether the claims have merit. Our various liability insurance coverages may not cover potential claims of this type adequately or at all, and we may be required to alter or cease our use of such material, which may include changing or removing content from courses, or to pay monetary damages. Moreover, claims by faculty and students could damage our reputation, regardless of whether such claims have merit.
Risks Related to Ownership of Our Common Stock and Our Status as a Public Company
Our quarterly operating results have fluctuated in the past and may do so in the future, which could cause our stock price to decline.
Our quarterly operating results have historically fluctuated due to seasonality and changes in our business, and our future operating results may vary significantly from quarter to quarter due to a variety of factors, many of which are beyond our control. You should not rely on period-to-period comparisons of our operating results as an indication of our future performance. Factors that may cause fluctuations in our quarterly operating results include, but are not limited to, the following:
• | the timing of our costs incurred in connection with the launch of new graduate programs and the delay in receiving revenue from these new programs, which delay may last for several years; |
• | seasonal variation driven by the semester schedules for our university clients’ graduate programs, which may vary from year to year; |
• | changes in the student enrollment and retention levels in our university clients’ offerings; |
• | changes in our key metrics or the methods used to calculate our key metrics; |
• | changes in tuition rates; |
• | the timing and amount of our marketing and sales expenses; |
• | costs necessary to improve and maintain our platform; |
• | fluctuations in foreign currency exchange rates; |
• | costs related to any acquisition and integration of business and technology; |
• | our ability to effectively integrate businesses and technologies that we acquire; |
• | changes in the prospects of the economy generally, which could alter current or prospective university clients’ or students’ spending priorities, or could increase the time it takes us to launch new offerings. |
Our operating results may fall below the expectations of market analysts and investors in some future periods, which could cause the market price of our common stock to decline substantially.
The trading price of the shares of our common stock may be volatile, and purchasers of our common stock could incur substantial losses.
Our stock price may be volatile. The stock market in general and the market for technology companies in particular have experienced extreme volatility that has often been unrelated to the operating performance of particular companies. As a result of this volatility, investors may not be able to sell their common stock at or above the price paid for the shares. The market price for our common stock may be influenced by many factors, including:
• | actual or anticipated variations in our operating results; |
32
• | variations between our actual operating results and the expectations of securities analysts, investors and the financial community; |
• | changes in financial estimates by us or by any securities analysts who might cover our stock; |
• | conditions or trends in our industry, the stock market or the economy; |
• | the level of demand for our stock, including the amount of short interest in our stock; |
• | stock market price and volume fluctuations of comparable companies and, in particular, those that operate in the software and information technology industries; |
• | announcements by us or our competitors of new product or service offerings, significant acquisitions, strategic partnerships or divestitures; |
• | announcements of investigations or regulatory scrutiny of our operations or lawsuits filed against us; |
• | capital commitments; |
• | investors’ general perception of our company and our business; |
• | recruitment or departure of key personnel; and |
• | sales of our common stock, including sales by our directors and officers or specific stockholders. |
In addition, in the past, stockholders have initiated class action lawsuits against technology companies following periods of volatility in the market prices of these companies’ stock. Such litigation, if instituted against us, could cause us to incur substantial costs and divert management’s attention and resources from our business.
If equity research analysts do not continue to publish research or reports, or publish unfavorable research or reports, about us, our business or our market, our stock price and trading volume could decline.
The trading market for our common stock will be influenced by the research and reports that equity research analysts publish about us and our business. Equity research analysts may elect not to initiate or to continue to provide research coverage of our common stock, and such lack of research coverage may adversely affect the market price of our common stock. Even if we do have equity research analyst coverage, we will not have any control over the analysts or the content and opinions included in their reports. The price of our stock could decline if one or more equity research analysts downgrade our stock or issue other unfavorable commentary or research. If one or more equity research analysts ceases coverage of our company or fails to publish reports on us regularly, demand for our stock could decrease, which in turn could cause our stock price or trading volume to decline. In addition, if our operating results fail to meet the forecasts of analysts, our stock price would likely decline.
Provisions in our corporate charter documents and under Delaware law may prevent or frustrate attempts by our stockholders to change our management and hinder efforts to acquire a controlling interest in us, and the market price of our common stock may be lower as a result.
Provisions in our amended and restated certificate of incorporation and amended and restated bylaws may make it difficult for a third party to acquire, or attempt to acquire, control of our company, even if a change in control is considered favorable by you and other stockholders. For example, our board of directors has the authority to issue up to 5,000,000 shares of preferred stock. The board of directors can fix the price, rights, preferences, privileges, and restrictions of the preferred stock without any further vote or action by our stockholders. An issuance of shares of preferred stock may result in the loss of voting control to other stockholders, which could delay or prevent a change in control transaction. As a result, the market price of our common stock and the voting and other rights of our stockholders may be adversely affected.
Our charter documents also contain other provisions that could have an anti-takeover effect, including:
• | only one of our three classes of directors will be elected each year; |
• | stockholders are not entitled to remove directors other than by a 662/3% vote and only for cause; |
• | stockholders are not permitted to take actions by written consent; |
• | stockholders are not permitted to call a special meeting of stockholders; |
33
• | allowing the board of directors to adopt, amend or repeal our bylaws; and |
• | stockholders are required to give us advance notice of their intention to nominate directors or submit proposals for consideration at stockholder meetings. |
In addition, we are subject to the anti-takeover provisions of Section 203 of the Delaware General Corporation Law, which regulates corporate acquisitions by prohibiting Delaware corporations from engaging in specified business combinations with particular stockholders of those companies. These provisions could discourage potential acquisition proposals and could delay or prevent a change in control transaction. They could also have the effect of discouraging others from making tender offers for our common stock, including transactions that may be in your best interests. These provisions may also prevent changes in our management or limit the price that investors are willing to pay for our stock.
Concentration of ownership of our common stock among our existing executive officers, directors and large stockholders may prevent smaller stockholders from influencing significant corporate decisions.
Our executive officers, directors and current beneficial owners of 5% or more of our common stock and their respective affiliates, in the aggregate, beneficially own a substantial percentage of our outstanding common stock. These persons, acting together, are able to significantly influence all matters requiring stockholder approval, including the election and removal of directors, any merger, consolidation, sale of all or substantially all of our assets, or other significant corporate transactions. The interests of this group of stockholders may not coincide with our interests or the interests of other stockholders.
If we fail to maintain proper and effective internal controls, our ability to produce accurate financial statements on a timely basis could be impaired.
We are subject to the reporting requirements of the Securities Exchange Act of 1934, the Sarbanes-Oxley Act and the rules and regulations of the Nasdaq Global Select Market. The Sarbanes-Oxley Act requires, among other things, that we maintain effective disclosure controls and procedures and internal control over financial reporting. We are required to perform system and process evaluation and testing of our internal control over financial reporting to allow management to report on the effectiveness of our internal control over financial reporting in our Form 10-K filing for that year, as required by Section 404 of the Sarbanes-Oxley Act. This may require us to incur substantial additional professional fees and internal costs to further expand our accounting and finance functions and expend significant management efforts.
We may in the future discover material weaknesses in our system of internal financial and accounting controls and procedures that could result in a material misstatement of our financial statements. In addition, our internal control over financial reporting will not prevent or detect all errors and all fraud. A control system, no matter how well designed and operated, can provide only reasonable, not absolute, assurance that the control system’s objectives will be met. Because of the inherent limitations in all control systems, no evaluation of controls can provide absolute assurance that misstatements due to errors or fraud will not occur or that all control issues and instances of fraud will be detected.
If we are not able to comply with the requirements of Section 404 of the Sarbanes-Oxley Act in a timely manner, or if we are unable to maintain proper and effective internal controls, we may not be able to produce timely and accurate financial statements. If that were to happen, the market price of our stock could decline and we could be subject to sanctions or investigations by the stock exchange on which our common stock is listed, the Securities and Exchange Commission, or SEC, or other regulatory authorities.
Because we do not anticipate paying any cash dividends on our common stock in the foreseeable future, capital appreciation, if any, will be your sole source of gains and you may never receive a return on your investment.
You should not rely on an investment in our common stock to provide dividend income. We have not declared or paid cash dividends on our common stock to date. We currently intend to retain our future earnings, if any, to fund the development and growth of our business. In addition, the terms of our existing credit facility preclude, and the terms of any future debt agreements is likely to similarly preclude, us from paying dividends. As a result, capital appreciation, if any, of our common stock will be your sole source of gain for the foreseeable future. Investors seeking cash dividends should not purchase our common stock.
Item 1B. Unresolved Staff Comments
None.
Item 2. Properties
34
Our headquarters are located in Lanham, Maryland, where we occupy approximately 225,000 square feet under a lease that expires in 2028. We also occupy approximately 53,000 square feet of office space in Brooklyn, New York and approximately 100,000 square feet of office space in Denver, Colorado.
Including our headquarters and the Brooklyn and Denver properties, we lease an aggregate of approximately 421,000 square feet of space, primarily for our Graduate Program Segment, in Maryland, New York, California, Colorado, North Carolina, Virginia and Hong Kong.
We also lease an aggregate of approximately 62,000 square feet of space, primarily for our Short Course Segment, in South Africa and the United Kingdom.
We intend to add new facilities or expand existing facilities as we add employees and believe that we will be able to obtain additional facilities on commercially reasonable terms.
Item 3. Legal Proceedings
We are not presently involved in any legal proceeding or other contingency that, if determined adversely, would individually or in the aggregate have a material adverse effect on its business, operating results, financial condition or cash flows. Accordingly, we do not believe that there is a reasonable possibility that a material loss exceeding amounts already recognized may have been incurred as of the date of the balance sheets presented herein.
Item 4. Mine Safety Disclosures
None.
35
PART II
Item 5. Market for Registrant’s Common Equity, Related Stockholder Matters and Issuer Purchases of Equity Securities
Our common stock has been listed on the Nasdaq Global Select Market since March 28, 2014, under the symbol “TWOU.”
As of February 20, 2019, there were 37 registered stockholders of record for our common stock. The actual number of stockholders is greater than this number of record holders and includes stockholders who are beneficial owners but whose shares are held in street name by brokers and other nominees. This number of holders of record also does not include stockholders whose shares may be held in trust by other entities.
Stock Performance Graph
The graph set forth below compares the cumulative total stockholder return on an initial investment of $100 in our common stock between March 28, 2014 (the date of our initial public offering) and December 31, 2018, with the comparative cumulative total return of such amount over the same period on (i) the Nasdaq Composite Index, (ii) the S&P North American Technology Software Index and (iii) the Russell 3000 Index. We have not paid any cash dividends and, therefore, the cumulative total return calculation for us is based solely upon our stock price appreciation or depreciation and does not include any reinvestment of cash dividends. The graph assumes our closing sales price on March 28, 2014 of $13.98 per share as the initial value of our common stock. The comparisons shown in the graph below are based upon historical data, and are not necessarily indicative of, nor intended to forecast, the potential future stock performance of our common stock.
Comparison of Cumulative Total Return
Through December 31, 2018
Assumes Initial Investment of $100
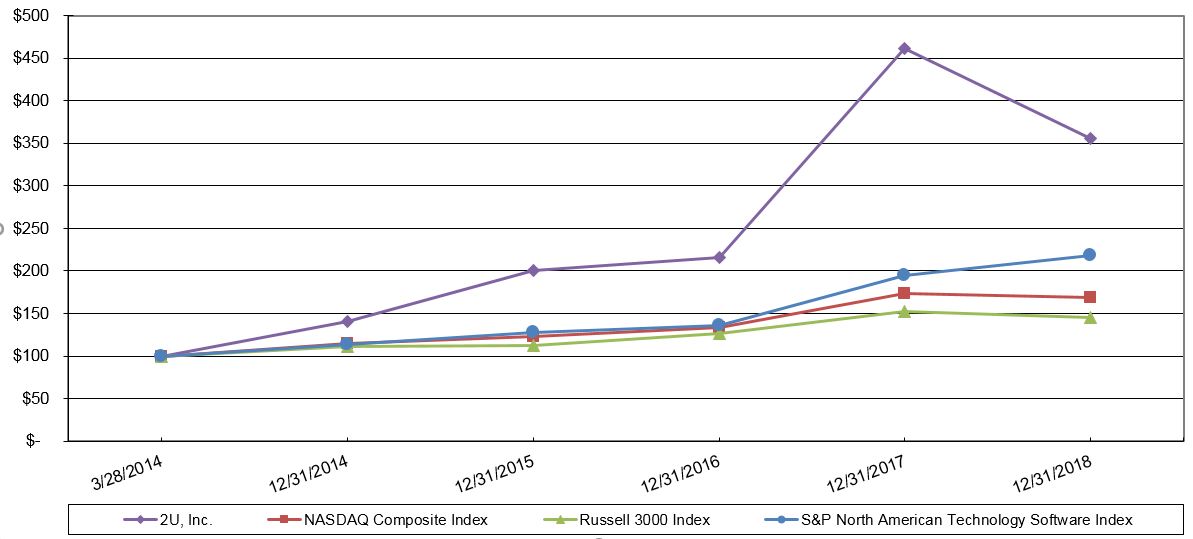
The information presented above in the stock performance graph shall not be deemed to be “soliciting material” or to be “filed” with the SEC or subject to Regulation 14A or 14C, except to the extent that we subsequently specifically request that such information be treated as soliciting material or specifically incorporate it by reference into a filing under the Securities Act of 1933, as amended, or a filing under the Securities Exchange Act of 1934, as amended.
36
Item 6. Selected Financial Data
The following selected consolidated statements of operations data for the years ended December 31, 2018, 2017 and 2016, and the selected consolidated balance sheets data as of December 31, 2018 and 2017 are derived from our audited consolidated financial statements in “Financial Statements and Supplementary Data” included in Part II, Item 8 of this Annual Report on Form 10-K. The selected consolidated statements of operations data for the years ended December 31, 2015 and 2014, and the selected consolidated balance sheets data as of December 31, 2016, 2015 and 2014 are derived from our audited consolidated financial statements, except as otherwise noted, that are not included in this Annual Report on Form 10-K. Our historical results are not necessarily indicative of the results to be expected in the future. The selected consolidated financial data should be read together with Item 7 “Management’s Discussion and Analysis of Financial Condition and Results of Operations” and in conjunction with the consolidated financial statements, related notes, and other financial information included elsewhere in this Annual Report on Form 10-K.
Year Ended December 31, | |||||||||||||||||||
2018 | 2017 | 2016 | 2015 | 2014 | |||||||||||||||
(in thousands, except share and per share amounts) | |||||||||||||||||||
Consolidated Statements of Operations Data: | |||||||||||||||||||
Revenue | $ | 411,769 | $ | 286,752 | $ | 205,864 | $ | 150,194 | $ | 110,239 | |||||||||
Costs and expenses | |||||||||||||||||||
Curriculum and teaching | 23,290 | 6,609 | — | — | — | ||||||||||||||
Servicing and support | 67,203 | 50,767 | 40,982 | 32,047 | 26,858 | ||||||||||||||
Technology and content development | 63,812 | 45,926 | 33,283 | 27,211 | 22,621 | ||||||||||||||
Marketing and sales | 221,015 | 150,923 | 106,610 | 82,911 | 65,218 | ||||||||||||||
General and administrative | 82,989 | 62,665 | 46,021 | 34,123 | 23,420 | ||||||||||||||
Total costs and expenses | 458,309 | 316,890 | 226,896 | 176,292 | 138,117 | ||||||||||||||
Loss from operations | (46,540 | ) | (30,138 | ) | (21,032 | ) | (26,098 | ) | (27,878 | ) | |||||||||
Interest income | 5,173 | 371 | 383 | 167 | 92 | ||||||||||||||
Interest expense | (108 | ) | (87 | ) | (35 | ) | (552 | ) | (1,213 | ) | |||||||||
Other expense, net | (1,722 | ) | (866 | ) | — | (250 | ) | — | |||||||||||
Loss before income taxes | (43,197 | ) | (30,720 | ) | (20,684 | ) | (26,733 | ) | (28,999 | ) | |||||||||
Income tax benefit | 4,867 | 1,297 | — | — | — | ||||||||||||||
Net loss | (38,330 | ) | (29,423 | ) | (20,684 | ) | (26,733 | ) | (28,999 | ) | |||||||||
Preferred stock accretion | — | — | — | — | (89 | ) | |||||||||||||
Net loss attributable to common stockholders | $ | (38,330 | ) | $ | (29,423 | ) | $ | (20,684 | ) | $ | (26,733 | ) | $ | (29,088 | ) | ||||
Net loss per share attributable to common stockholders, basic and diluted | $ | (0.69 | ) | $ | (0.60 | ) | $ | (0.44 | ) | $ | (0.63 | ) | $ | (0.91 | ) | ||||
Weighted-average common shares outstanding used in computing net loss per share attributable to common stockholders, basic and diluted | 55,833,492 | 49,062,611 | 46,609,751 | 42,420,356 | 32,075,107 | ||||||||||||||
Other Financial Data: | |||||||||||||||||||
Adjusted EBITDA (loss)* | $ | 17,655 | $ | 11,416 | $ | 4,541 | $ | (6,629 | ) | $ | (14,779 | ) | |||||||
* | Adjusted EBITDA is a financial measure not in accordance with United States generally accepted accounting principles, or U.S. GAAP. For more information about adjusted EBITDA and a reconciliation of net loss, the most directly comparable financial measure calculated and presented in accordance with U.S. GAAP, to adjusted EBITDA, see the section below titled “Adjusted EBITDA.” |
37
As of December 31, | |||||||||||||||||||
2018 | 2017 | 2016 | 2015 | 2014 | |||||||||||||||
(in thousands) | |||||||||||||||||||
Consolidated Balance Sheets Data: | |||||||||||||||||||
Cash and cash equivalents | $ | 449,772 | $ | 223,370 | $ | 168,730 | $ | 183,729 | $ | 86,929 | |||||||||
Working capital* | 453,200 | 190,053 | 143,629 | 160,310 | 66,220 | ||||||||||||||
Goodwill and amortizable intangible assets, net | 198,457 | 162,749 | 34,131 | 25,024 | 16,813 | ||||||||||||||
Total assets | 807,354 | 482,062 | 244,320 | 231,041 | 113,039 | ||||||||||||||
Total liabilities | 102,345 | 94,230 | 49,083 | 35,252 | 25,028 | ||||||||||||||
Additional paid-in capital | 957,631 | 588,289 | 371,455 | 351,324 | 216,818 | ||||||||||||||
Total stockholders’ equity | 705,009 | 387,832 | 195,237 | 195,789 | 88,011 | ||||||||||||||
* | We define working capital as current assets minus current liabilities. |
Adjusted EBITDA
To provide investors with additional information regarding our financial results, we have provided within this Annual Report on Form 10-K adjusted EBITDA, a non-U.S. GAAP financial measure. We have provided a reconciliation below of net loss, the most directly comparable U.S. GAAP financial measure, to adjusted EBITDA.
We have included adjusted EBITDA in this Annual Report on Form 10-K because it is a key measure used by our management and board of directors to understand and evaluate our core operating performance and trends, to prepare and approve our annual budget and to develop short-and long-term operational plans. In particular, the exclusion of certain expenses in calculating adjusted EBITDA can provide a useful measure for period-to-period comparisons of our core business. Accordingly, we believe that adjusted EBITDA provides useful information to investors and others in understanding and evaluating our operating results in the same manner as our management and board of directors.
Our use of adjusted EBITDA has limitations as an analytical tool, and you should not consider it in isolation or as a substitute for analysis of our financial results as reported under U.S. GAAP. Some of these limitations are:
• | although depreciation and amortization expense are non-cash charges, the assets being depreciated and amortized may have to be replaced in the future, and adjusted EBITDA does not reflect cash capital expenditure requirements for such replacements or for new capital expenditure requirements; |
• | adjusted EBITDA does not reflect changes in, or cash requirements for, our working capital needs; |
• | adjusted EBITDA does not reflect the impact of changes in foreign currency exchange rates; |
• | adjusted EBITDA does not reflect acquisition related gains or losses such as, but not limited to, post-acquisition changes in the value of contingent consideration reflected in operations; |
• | adjusted EBITDA does not reflect the potentially dilutive impact of equity-based compensation; |
• | adjusted EBITDA does not reflect interest or tax payments that may represent a reduction in cash available to us; and |
• | other companies, including companies in our industry, may calculate adjusted EBITDA differently, which reduces its usefulness as a comparative measure. |
Because of these and other limitations, you should consider adjusted EBITDA alongside other U.S. GAAP-based financial performance measures, including various cash flow metrics, net income (loss) and our other U.S. GAAP results. The following table presents a reconciliation of net loss to adjusted EBITDA for each of the periods indicated:
38
Year Ended December 31, | |||||||||||||||||||
2018 | 2017 | 2016 | 2015 | 2014 | |||||||||||||||
(in thousands) | |||||||||||||||||||
Net loss | $ | (38,330 | ) | $ | (29,423 | ) | $ | (20,684 | ) | $ | (26,733 | ) | $ | (28,999 | ) | ||||
Adjustments: | |||||||||||||||||||
Interest income | (5,173 | ) | (371 | ) | (383 | ) | (167 | ) | (92 | ) | |||||||||
Interest expense | 108 | 87 | 35 | 552 | 1,213 | ||||||||||||||
Foreign currency loss | 1,722 | 866 | — | — | — | ||||||||||||||
Depreciation and amortization expense | 32,785 | 19,624 | 9,750 | 7,220 | 5,572 | ||||||||||||||
Income tax benefit | (4,867 | ) | (1,297 | ) | — | — | — | ||||||||||||
Stock-based compensation expense | 31,410 | 21,930 | 15,823 | 12,499 | 7,527 | ||||||||||||||
Total adjustments | 55,985 | 40,839 | 25,225 | 20,104 | 14,220 | ||||||||||||||
Adjusted EBITDA (loss) | $ | 17,655 | $ | 11,416 | $ | 4,541 | $ | (6,629 | ) | $ | (14,779 | ) | |||||||
39
Item 7. Management’s Discussion and Analysis of Financial Condition and Results of Operations
You should read the following discussion and analysis of our financial condition and results of operations in conjunction with our consolidated financial statements and the related notes and other financial information included elsewhere in this Annual Report on Form 10-K. Some of the information contained in this discussion and analysis or set forth elsewhere in this report, including information with respect to our plans and strategy for our business, includes forward-looking statements that involve risks and uncertainties. You should review Item 1A “Risk Factors” and “Special Note Regarding Forward-Looking Statements” in this report for a discussion of important factors that could cause actual results to differ materially from the results described in or implied by the forward-looking statements contained in the following discussion and analysis.
Overview
We are a leading education technology company that well-recognized nonprofit colleges and universities trust to bring them into the digital age. Our comprehensive platform of tightly integrated technology and services provides the digital infrastructure universities need to attract, enroll, educate and support students at scale. With our platform, students can pursue their education anytime, anywhere, without quitting their jobs or moving; and university clients can improve educational outcomes, skills attainment and career prospects for a greater number of students.
We have two reportable segments: the Graduate Program Segment and the Short Course Segment.
• | Our Graduate Program Segment provides services to well-recognized nonprofit colleges and universities primarily in the United States to enable the online delivery of graduate programs. We target students seeking a full graduate degree of the same quality they would receive on-campus. |
• | Our Short Course Segment provides premium online short courses to working professionals around the world through relationships with leading universities in the United States, the United Kingdom and South Africa. We target working professionals seeking career advancement through skills attainment. |
Our core strategy is to launch graduate programs and short courses with new and existing university clients and to increase student enrollments across our portfolio of offerings. We are also committed to continuously improving our platform to deliver high-quality university and student experiences and outcomes at scale.
We are focused on rapidly growing our business and plan to continue to invest for long-term growth, including investments in our marketing activities as we continue to scale current offerings while adding new graduate programs and short courses, investments in our technology platform and infrastructure to deliver new functionality to meet the needs of our university clients and students, and investments in developing content to meet the needs of our accelerating program and offering launch schedules. To support our anticipated growth, we expect to continue to hire new employees (which will increase both our cash and non-cash compensation and benefit costs, including stock-based compensation). As a result, we expect our costs to increase in absolute dollars, but to decrease as a percentage of revenue over time as we achieve economies of scale through the expansion of our business.
Non-cash stock-based compensation expense is a component of compensation cost. Under our current framework for granting equity awards under our 2014 Equity Incentive Plan, the majority of our equity awards are made on or around April 1 of each year and typically have four-year vesting periods. Non-cash stock based compensation expense also includes charges associated with providing our 2017 Employee Stock Purchase Plan.
Certain Trends and Uncertainties
The following represents a summary of certain trends and uncertainties, which could have a significant impact on our financial condition and results of operations. This summary is not intended to be a complete list of potential trends and uncertainties and should be considered along with the factors identified in the section titled “Risk Factors” of this Annual Report on Form 10-K and elsewhere in this report.
• | The risk of a data security breach or service disruption has increased as the frequency, intensity and sophistication of attempted attacks and intrusions from around the world have increased. While we make significant efforts to maintain the security and integrity of our services and computer systems, our cybersecurity measures and the cybersecurity measures taken by our third-party data center facilities may be unable to anticipate, detect or prevent all attempts to compromise our systems. |
• | We and our university clients are subject to certain education regulations, such as the HEA, which are frequently revised, repealed or expanded. The re-authorization of the HEA is currently in process and the outcome could alter the |
40
regulatory landscape of the higher education industry, and thereby impact the manner in which we conduct business and serve our university clients.
• | Our university clients have regular turnover in leadership positions. These changes can have a positive or negative impact on our business. If new leaders do not support online delivery of educational offerings, we may not be able to add additional offerings with the university client or the university client may not renew their relationship with us. New leaders may also make changes in university policies, which could result in changes to admissions standards or application of admissions standards and negatively impact student enrollment in a university client’s 2U-powered graduate programs. |
Our Business Model and Components of Operating Results
The key elements of our business model and components of our operating results are described below.
Revenue
Our Graduate Program Segment derives revenue primarily from contractually specified percentages of the amounts our university clients receive from their students for tuition and fees, less credit card fees and other agreed-upon charges. Most of our contracts with university clients in this segment are long-term and typically have 10 to 15 year initial terms.
Our Short Course Segment derives revenue directly from contracts with students for the tuition and fees paid to enroll in and progress through our short courses. We pay a contractually specified percentage of the gross proceeds received from students for each course to the associated university client for providing short course content and certification, which is recognized on our consolidated statements of operations and comprehensive loss as curriculum and teaching costs. Our contracts with university clients in this segment are typically shorter and less restrictive than our contracts with university clients in our Graduate Program Segment.
The primary driver of our revenue growth across our segments is the increase in the number of student enrollments in our graduate programs and short courses. This in turn is influenced primarily by three factors:
• | our ability to increase the number of graduate programs and short courses offered, either by adding new university clients or by adding graduate programs and short courses with current university clients; |
• | our ability to acquire prospective students for graduate programs and short courses; and |
• | our ability to retain the students who enroll in graduate programs and short courses. |
In the near term, we expect the significant drivers of our consolidated financial results to continue to be our graduate programs with the University of Southern California, Simmons University, the University of North Carolina and Syracuse University, within our Graduate Program Segment. The following table sets forth the percentages of our consolidated revenue earned from these university clients in our Graduate Program Segment for the periods presented:
Year Ended December 31, | ||||||||
2018 | 2017 | 2016 | ||||||
University of Southern California | 21 | % | 27 | % | 34 | % | ||
Simmons University | 13 | % | 17 | % | 18 | % | ||
Syracuse University | 10 | % | 11 | % | <10% | |||
University of North Carolina | <10% | 10 | % | 11 | % | |||
For the year ended December 31, 2018, revenue associated with our three largest university clients in our Short Course Segment accounted for approximately 81% of the segment’s revenue, and each were less than 10% of our consolidated revenue on a combined basis. For the year ended December 31, 2017, revenue associated with our three largest university clients in our Short Course Segment accounted for approximately 82% of the segment’s revenue, which was less than 10% of our consolidated revenue on a combined basis.
Marketing and Sales Costs
Our most significant cost in each fiscal period relates primarily to student acquisition activities across both of our segments. This includes the cost of online advertising and demand generation, as well as cash and non-cash compensation and benefit costs (including stock-based compensation) for our graduate program and short course marketing, marketing analytics and admissions application counseling personnel.
41
We have the primary responsibility for identifying qualified students for our graduate programs and short courses, generating potential student interest and driving applications to the educational offerings. The number of students who enroll in our graduate programs and short courses in any given period is significantly dependent on the amount we have spent on these student acquisition activities in prior periods.
Graduate Program Segment
We typically identify prospective students for our graduate programs between three months and two or more years before they ultimately enroll. For the students currently enrolled in our graduate programs and those who have graduated, the average time from our initial contact with that student to enrollment was approximately eight months. Based on the student retention rates and patterns we have observed in our graduate programs, we estimate that, for our current graduate programs, the average time from a graduate program student’s initial enrollment to graduation will be approximately two years.
Although most of our university clients’ graduate programs span multiple academic terms and, therefore, generate continued revenue beyond the term in which initial enrollments occur, we expect that we will need to continue to incur significant marketing and sales expense for existing graduate programs going forward to generate a continuous pipeline of new enrollments. For new graduate programs, we begin incurring marketing and sales costs as early as nine months prior to the classes beginning.
Accordingly, our marketing and sales expense in any period is an investment we make to generate revenue in future periods. Likewise, revenue generated in any period is largely attributable to the investment made in student acquisition activities in earlier periods. Because marketing and sales expense in any period is almost entirely unrelated to revenue generated in that period, we do not believe it is meaningful to directly compare the two. We believe that the total revenue we will receive over time related to students who enroll in our graduate programs as a result of current period marketing and sales expense, will be significantly greater as a multiple of that current period expense than is implied by the multiple of current period revenue to current period marketing and sales expense as expressed in our financial statements. Further, we believe that our marketing and sales expense in future periods will generally decline as a percentage of the revenue reported in those same periods as our revenue base from returning students in existing programs increases.
We continually manage our marketing and sales expense to ensure that across our portfolio of offerings, our cost to acquire students for these offerings is appropriate for our business model. We use a ratio of attrition adjusted lifetime revenue of a student, or LTR, to the total cost to acquire that student, or TCA, as the measure of our marketing efficiency and to determine how much we are willing to spend to acquire an additional student for any offering. The LTR to TCA ratio may vary across offerings depending on the nature of the offering, where that offering is in its lifecycle and whether we enable the same or similar offerings at other universities.
Short Course Segment
We typically begin incurring marketing and sales costs approximately three months prior to each short course presentation, and our short courses run between six and 16 weeks. As our short courses often have a course length that straddles two fiscal quarters based on the timing of the course start, the marketing and sales expense in any period is a combination of investments we make to generate revenue in the current and subsequent periods. Likewise, revenue generated in any period is attributable to investments made in student acquisition activities in the prior and current periods.
As the majority of our short course student enrollments are attributable to discrete marketing efforts for each short course presentation, we expect that we will need to continue to incur significant marketing and sales expense for each new and recurring short course presentation going forward to generate a continuous pipeline of new enrollments.
Other Costs and Expenses
Our other costs and expenses consist of the following:
Curriculum and teaching. Curriculum and teaching costs are associated with our Short Course Segment and primarily relate to amounts due to our university clients, which are based on contractually specified percentages of the gross proceeds associated with our short course offerings for providing content and certifying courses. This also includes costs to compensate short course facilitators.
Servicing and support. Servicing and support costs consist primarily of cash and non-cash compensation and benefit costs (including stock-based compensation) related to the management and operations of our graduate programs and short courses, providing support for our SaaS technology, as well as supporting students enrolled in our offerings and faculty members. It also includes software licensing, telecommunications, technical support and other costs related to providing access to and support for our platform for our university clients and students. In addition, servicing and support includes costs to
42
facilitate in-program field placements, student immersions and other student enrichment experiences, as well as costs to assist our university clients with their state compliance requirements.
Technology and content development. Technology and content development costs consist primarily of cash and non-cash compensation and benefit costs (including stock-based compensation) and outsourced services costs related to the ongoing improvement and maintenance of our platform, and the developed content for our graduate programs and short courses. It also includes the associated amortization expense related to capitalized technology and content development, as well as hosting and licensing and other costs associated with maintaining our platform in a cloud environment and support for our internal infrastructure.
General and administrative. General and administrative costs consist primarily of cash and non-cash compensation and benefit costs (including stock-based compensation) for employees in our executive, administrative, finance and accounting, legal, communications and human resources functions. It also includes external legal, accounting and other professional fees, and other corporate costs such as insurance and travel that are not related to another function.
Net Interest Income (Expense)
Interest income is derived from interest received on our cash and cash equivalents. Interest expense consists primarily of the amortization of deferred financing costs associated with our line of credit. Net interest income (expense) reflects the aggregation of interest income and interest expense.
Other Income (Expense), Net
Other income (expense), net primarily consists of foreign currency gains and losses.
Income Tax Benefit
Income tax benefit consists of U.S. federal, state and foreign income taxes. Our effective tax rate for the period is based on a mix of higher-taxed and lower-taxed jurisdictions. To date, we have not been required to pay U.S. federal income taxes because of our current and accumulated net operating losses.
Period-to-Period Fluctuations
Our revenue, cash position, accounts receivable, deferred revenue, and sales and marketing expense can fluctuate significantly from quarter to quarter due to variations driven by the academic schedules of our graduate programs and short courses.
Our graduate programs generally start classes for new and returning students an average of four times per year and our short courses have multiple course starts per year. Graduate program courses and short course presentations are not necessarily evenly spaced throughout the year, do not necessarily correspond to the traditional academic calendar and may vary from year to year. As a result, the number of courses our graduate programs and short courses have in session, and therefore the number of students enrolled, will vary from quarter to quarter, leading to variability in our revenue.
Our graduate programs and short courses often have academic terms that straddle two fiscal quarters. Our graduate program university clients generally pay us when they have billed tuition and specified fees to their students, which is typically early in the academic term, and once the drop/add period has passed. We recognize the related revenue ratably over the course of the academic term, beginning on the first day of classes through the last. Our short course students typically pay either in full upon registration of the short course or in full before the end of the short course based on a payment plan. Because we generally receive payments from our graduate program university clients and short course students prior to our ability to recognize the majority of those amounts as revenue, we record deferred revenue at each balance sheet date equal to the excess of the amounts we have billed or received from our graduate program university clients and short course students over the amounts we have recognized as revenue as of that date. For these reasons, our cash flows typically vary considerably from quarter to quarter and our cash position, accounts receivable and deferred revenue typically fluctuate between quarterly balance sheet dates.
Our expense levels across both segments also fluctuate from quarter to quarter, driven primarily by our marketing and sales activity. We typically reduce our paid search and other marketing and sales efforts during late November and December because these efforts are less productive during the holiday season. This generally results in lower total marketing and sales expense during the fourth quarter. In addition, because we begin spending on marketing and sales, and, to a lesser extent, services and support as much as nine months prior to the start of classes for a new graduate program and as much as three months prior to the start of a new short course, these costs as a percentage of revenue fluctuate, sometimes significantly, depending on the timing of new graduate programs and short courses launches.
43
Results of Operations
Full-Year 2018 Highlights
• | Revenue was $411.8 million, an increase of 43.6% from $286.8 million for the year ended December 31, 2017. |
• | Net loss was $(38.3) million, or $(0.69) per share, compared to $(29.4) million, or $(0.60) per share for the year ended December 31, 2017. |
• | Adjusted EBITDA* was $17.7 million, compared to $11.4 million for the year ended December 31, 2017. |
• | We launched 14 new graduate programs and 17 new short courses. |
• | We completed a public offering of common stock in May 2018 in which we sold 3,833,334 shares and received net proceeds of $330.9 million. |
* | Adjusted EBITDA is a financial measure not in accordance with United States generally accepted accounting principles, or U.S. GAAP. For more information about adjusted EBITDA and a reconciliation of net loss, the most directly comparable financial measure calculated and presented in accordance with U.S. GAAP, to adjusted EBITDA, see the section below titled “Adjusted EBITDA.” |
Consolidated Operating Results
Comparison of Years Ended December 31, 2018 and 2017
The following table sets forth selected consolidated statement of operations data for each of the periods indicated.
Year Ended December 31, | |||||||||||||||||||||
2018 | 2017 | Period-to-Period Change | |||||||||||||||||||
Amount | Percentage of Revenue | Amount | Percentage of Revenue | Amount | Percentage | ||||||||||||||||
(dollars in thousands) | |||||||||||||||||||||
Revenue | $ | 411,769 | 100.0 | % | $ | 286,752 | 100.0 | % | $ | 125,017 | 43.6 | % | |||||||||
Costs and expenses | |||||||||||||||||||||
Curriculum and teaching | 23,290 | 5.7 | 6,609 | 2.3 | 16,681 | 252.4 | |||||||||||||||
Servicing and support | 67,203 | 16.3 | 50,767 | 17.7 | 16,436 | 32.4 | |||||||||||||||
Technology and content development | 63,812 | 15.5 | 45,926 | 16.0 | 17,886 | 38.9 | |||||||||||||||
Marketing and sales | 221,015 | 53.7 | 150,923 | 52.6 | 70,092 | 46.4 | |||||||||||||||
General and administrative | 82,989 | 20.2 | 62,665 | 21.9 | 20,324 | 32.4 | |||||||||||||||
Total costs and expenses | 458,309 | 111.4 | 316,890 | 110.5 | 141,419 | 44.6 | |||||||||||||||
Loss from operations | (46,540 | ) | (11.4 | ) | (30,138 | ) | (10.5 | ) | (16,402 | ) | 54.4 | ||||||||||
Interest income | 5,173 | 1.3 | 371 | 0.1 | 4,802 | * | |||||||||||||||
Interest expense | (108 | ) | — | (87 | ) | — | (21 | ) | 24.6 | ||||||||||||
Other expense, net | (1,722 | ) | (0.4 | ) | (866 | ) | (0.3 | ) | (856 | ) | 98.7 | ||||||||||
Loss before income taxes | (43,197 | ) | (10.5 | ) | (30,720 | ) | (10.7 | ) | (12,477 | ) | 40.6 | ||||||||||
Income tax benefit | 4,867 | 1.2 | 1,297 | 0.4 | 3,570 | * | |||||||||||||||
Net loss | $ | (38,330 | ) | (9.3 | )% | $ | (29,423 | ) | (10.3 | )% | $ | (8,907 | ) | 30.3 | |||||||
* | Not meaningful for comparative purposes. |
Our results of operations for the year ended December 31, 2018 included a full year of operations related to our Short Course Segment, whereas the same period of 2017 included only six months of such operations as the acquisition of GetSmarter occurred on July 1, 2017.
The following table sets forth the revenue by segment for each of the periods indicated.
44
Year Ended December 31, | Period-to-Period Change | |||||||||||||
2018 | 2017 | Amount | Percentage | |||||||||||
(dollars in thousands) | ||||||||||||||
Revenue by segment* | ||||||||||||||
Graduate Program Segment | $ | 348,361 | $ | 270,432 | $ | 77,929 | 28.8 | % | ||||||
Short Course Segment | 63,408 | 16,320 | 47,088 | 288.5 | ||||||||||
Total revenue | $ | 411,769 | $ | 286,752 | $ | 125,017 | 43.6 | |||||||
* | Approximately $44,000 of intersegment revenues have been excluded from the year ended December 31, 2018. |
Revenue. Revenue for the year ended December 31, 2018 was $411.8 million, an increase of $125.0 million, or 43.6%, from $286.8 million for the same period of 2017. Graduate Program Segment revenue increased by $77.9 million, or 28.8%. This increase was primarily due to growth in full course equivalent enrollments of 28,774, or 29.1%. Short Course Segment revenue increased by $47.1 million, or 288.5%. This increase was driven by both a growth in full course equivalent enrollments of 21,372, or 197.3%, and an increase in the average revenue per full course equivalent enrollment, from $1,507 to $1,969. Fluctuations in foreign currency exchange rates from those prevailing in the same period of 2017 did not have a material impact on revenue.
Curriculum and Teaching. Curriculum and teaching costs for the year ended December 31, 2018 were $23.3 million, an increase of $16.7 million, or 252.4%, from $6.6 million for the same period of 2017. This was primarily due to an increase in the number of short courses taken in our Short Course Segment.
Servicing and Support. Servicing and support costs for the year ended December 31, 2018 were $67.2 million, an increase of $16.4 million, or 32.4%, from $50.8 million for the same period of 2017. This increase was primarily due to a $12.3 million increase in cash and non-cash compensation and benefit costs, as we increased our headcount in servicing and support by 31% to serve a growing number of students and faculty in existing and new graduate programs and short courses. Additionally, $1.9 million of the increase related to student immersion costs, and $1.1 million of the increase related to rent and other facilities costs. The remainder of the increase related to $1.1 million of higher travel and other servicing and support costs.
Technology and Content Development. Technology and content development costs for the year ended December 31, 2018 were $63.8 million, an increase of $17.9 million, or 38.9%, from $45.9 million for the same period of 2017. This increase was due, in part, to a $7.9 million increase related to higher amortization expense associated with capitalized technology and content development to support the scaling of existing and launching of new graduate programs and short courses. Additionally, $5.4 million of the increase related to cash and non-cash compensation and benefit costs (net of amounts capitalized for technology and content development), as we increased our headcount in technology and content development by 40% to support the scaling of existing and launching of new graduate programs and short courses and $3.0 million of the increase related to higher hosting and licensing costs due to the larger number of courses that have been developed and the continued maintenance and support of our platform and internal infrastructure in a cloud environment. The remainder of the increase related to $1.6 million of other net costs to support and maintain our internal software applications.
Marketing and Sales. Marketing and sales costs for the year ended December 31, 2018 were $221.0 million, an increase of $70.1 million, or 46.4%, from $150.9 million for the same period of 2017. This increase was primarily due to higher direct internet marketing costs of $40.0 million, as we increased our student acquisition activities to drive enrollments in our new and existing graduate programs and short courses. Additionally, $21.7 million of the increase related to higher cash and non-cash compensation and benefit costs, as we increased our headcount in marketing and sales by 32% to drive enrollment and revenue growth in existing and new graduate programs and short courses. The remainder of the increase related to $4.6 million of higher amortization expense related to acquired websites, a $1.9 million increase related to higher rent expense, $1.0 million of higher travel and entertainment costs and $0.9 million related to higher other net cost increases to support our graduate program and short course marketing efforts.
General and Administrative. General and administrative costs for the year ended December 31, 2018 were $83.0 million, an increase of $20.3 million, or 32.4%, from $62.7 million for the same period of 2017. This was primarily due to a $17.8 million increase in cash and non-cash compensation and benefit costs, as we increased our headcount in general and administrative by 27% to support our growing business. Additionally, $2.5 million of the increase related to higher consulting and other professional services, travel costs, depreciation and amortization expense, rent and other facilities costs, partially offset by reductions in year-over-year costs after the integration of our enterprise resource planning system that was completed in the second quarter of 2017.
45
Net Interest Income (Expense). For the year ended December 31, 2018, we earned net interest income of $5.1 million, compared to $284,000 for the same period of 2017, primarily due to a higher cash and cash equivalents balance resulting from our May 2018 public offering of common stock.
Other Expense, Net. For the year ended December 31, 2018, we incurred other expense, net, of $1.7 million, compared to $866,000 in the same period of 2017, primarily due to foreign currency rate fluctuations associated with the operations of our Short Course Segment.
Income Tax Benefit. For the year ended December 31, 2018, we recognized a tax benefit of $4.9 million. Our effective tax rate was approximately 11% for the year ended December 31, 2018. A one-time tax benefit of approximately $2.8 million related to an asset acquisition of certain third-party technologies is included in our income tax benefit for the year ended December 31, 2018. This benefit relates to the reversal of our tax valuation allowance that was no longer needed as a result of establishing a net deferred tax liability. Excluding the one-time tax benefit, our tax benefit of $2.1 million for the year ended December 31, 2018, related to losses generated by operations and the amortization of acquired intangibles in our Short Course Segment that are expected to be realized through future reversing taxable temporary differences. We expect to continue to recognize a tax benefit in the future for our Short Course Segment to the extent that this segment continues to generate pre-tax losses while carrying deferred tax liabilities that are in excess of deferred tax assets. To date, we have not been required to pay U.S. federal income taxes because of our current and accumulated net operating losses.
On December 22, 2017, Staff Accounting Bulletin No. 118 (“SAB 118”) was issued to address the application of U.S. GAAP in situations when a registrant does not have the necessary information available, prepared, or analyzed (including computations) in reasonable detail to complete the accounting for certain income tax effects of the Tax Cuts and Jobs Act of 2017 (“Tax Act”). As of December 31, 2018, we finalized our assessment of the Tax Act, including our determination that no transitional tax is required.
Comparison of Years Ended December 31, 2017 and 2016
The following table sets forth selected consolidated statement of operations data for each of the periods indicated.
Year Ended December 31, | |||||||||||||||||||||
2017 | 2016 | Period-to-Period Change | |||||||||||||||||||
Amount | Percentage of Revenue | Amount | Percentage of Revenue | Amount | Percentage | ||||||||||||||||
(dollars in thousands) | |||||||||||||||||||||
Revenue | $ | 286,752 | 100.0 | % | $ | 205,864 | 100.0 | % | $ | 80,888 | 39.3 | % | |||||||||
Costs and expenses | |||||||||||||||||||||
Curriculum and teaching | 6,609 | 2.3 | — | — | 6,609 | * | |||||||||||||||
Servicing and support | 50,767 | 17.7 | 40,982 | 19.9 | 9,785 | 23.9 | |||||||||||||||
Technology and content development | 45,926 | 16.0 | 33,283 | 16.2 | 12,643 | 38.0 | |||||||||||||||
Marketing and sales | 150,923 | 52.6 | 106,610 | 51.8 | 44,313 | 41.6 | |||||||||||||||
General and administrative | 62,665 | 21.9 | 46,021 | 22.4 | 16,644 | 36.2 | |||||||||||||||
Total costs and expenses | 316,890 | 110.5 | 226,896 | 110.3 | 89,994 | 39.7 | |||||||||||||||
Loss from operations | (30,138 | ) | (10.5 | ) | (21,032 | ) | (10.3 | ) | (9,106 | ) | 43.3 | ||||||||||
Interest income | 371 | 0.1 | 383 | 0.2 | (12 | ) | (3.0 | ) | |||||||||||||
Interest expense | (87 | ) | 0.0 | (35 | ) | 0.0 | (52 | ) | 150.0 | ||||||||||||
Other income (expense), net | (866 | ) | (0.3 | ) | 0.0 | 0.0 | (866 | ) | * | ||||||||||||
Loss before income taxes | (30,720 | ) | (10.7 | ) | (20,684 | ) | (10.1 | ) | (10,036 | ) | 48.5 | ||||||||||
Income tax benefit | 1,297 | 0.4 | — | — | 1,297 | * | |||||||||||||||
Net loss | $ | (29,423 | ) | (10.3 | )% | $ | (20,684 | ) | (10.1 | )% | $ | (8,739 | ) | 42.3 | |||||||
* | Not meaningful for comparative purposes. |
Our results of operations for the year ended December 31, 2017 includes six months of operations related to our Short Course Segment, whereas the same period of 2016 includes no amounts of such operations as the acquisition of GetSmarter occurred on July 1, 2017.
46
The following table sets forth the revenue by segment for each of the periods indicated.
Year Ended December 31, | Period-to-Period Change | |||||||||||||
2017 | 2016 | Amount | Percentage | |||||||||||
(dollars in thousands) | ||||||||||||||
Revenue by segment* | ||||||||||||||
Graduate Program Segment | 270,432 | 205,864 | 64,568 | 31.4 | % | |||||||||
Short Course Segment | 16,320 | — | 16,320 | * | ||||||||||
Total revenue | $ | 286,752 | $ | 205,864 | $ | 80,888 | 39.3 | |||||||
Revenue. Revenue for the year ended December 31, 2017 was $286.8 million, an increase of $80.9 million, or 39.3%, from $205.9 million for the same period of 2016. Graduate Program Segment revenue increased by $64.6 million, or 31.4%. This increase was primarily driven by growth in full course equivalent enrollments of 21,560, or 27.9% and, to a lesser extent, an increase in the average revenue per full course equivalent enrollment, from $2,662 to $2,734. We also reported incremental revenue of $16.3 million for the year ended December 31, 2017 related to our Short Course Segment, which was created as a result of our acquisition of GetSmarter in July of 2017. Fluctuations in foreign currency exchange rates from those prevailing in the same period of 2016 did not have a material impact on revenue.
Curriculum and Teaching. Curriculum and teaching costs for the year ended December 31, 2017 were $6.6 million, and we did not incur any such costs for the same period of 2016 as the acquisition of GetSmarter occurred on July 1, 2017.
Servicing and Support. Servicing and support costs for the year ended December 31, 2017 were $50.8 million, an increase of $9.8 million, or 23.9%, from $41.0 million for the same period of 2016. This increase was primarily due to a $7.5 million increase in cash and non-cash compensation and benefit costs within our Graduate Program Segment, as we increased our headcount by 21% in this area to serve a growing number of students and faculty in new and existing graduate programs. Additionally, $1.4 million of the increase related to rent, other facilities costs and travel costs within our Graduate Program Segment and $0.8 million of the increase related to additional servicing and support costs associated with our Short Course Segment. The remainder of the increase related to other net costs to service and support our Graduate Program Segment.
Technology and Content Development. Technology and content development costs for the year ended December 31, 2017 were $45.9 million, an increase of $12.6 million, or 38.0%, from $33.3 million for the same period of 2016. This increase was due in part to a $4.1 million increase in cash and non-cash compensation and benefit costs (net of amounts capitalized for technology and content development) within our Graduate Program Segment, as we increased our headcount by 30% in this area to support the scaling of existing programs and launch of new graduate programs. Additionally, $5.1 million of the increase related to higher amortization expense associated with capitalized technology and content development, as well as higher hosting and licensing costs within our Graduate Program Segment due to the larger number of courses that have been developed and the continued maintenance of our platform in a cloud environment and $2.8 million of the increase related to additional technology and content development costs associated with our Short Course Segment. The remainder of the increase related to other net costs to support and maintain our internal software applications in our Graduate Program Segment.
Marketing and Sales. Marketing and sales costs for the year ended December 31, 2017 were $150.9 million, an increase of $44.3 million, or 41.6%, from $106.6 million for the same period of 2016. This increase was primarily due to a $19.6 million increase in direct internet marketing costs to acquire students for our Graduate Program Segment. Additionally, $10.1 million of the increase related to cash and non-cash compensation and benefit costs, as we increased our headcount in marketing and sales by 26% within our Graduate Program Segment to acquire students for, and drive revenue growth in, existing and new graduate programs and $8.9 million of the increase related to additional marketing and sales costs associated with our Short Course Segment. The remainder of the increase related to other net costs to support growth within our Graduate Program Segment.
47
General and Administrative. General and administrative costs for the year ended December 31, 2017 were $62.7 million, an increase of $16.6 million, or 36.2%, from $46.0 million for the same period of 2016. This increase was due in part to a $7.5 million increase in cash and non-cash compensation and benefit costs within our Graduate Program Segment, as we increased our headcount by 18% in this area to support our growing business. Additionally, $2.0 million of the increase related to higher consulting and other professional services within our Graduate Program Segment, primarily driven by additional recurring and nonrecurring costs associated with the acquisition of GetSmarter and partially offset by reductions in year-over-year costs after the integration of our enterprise resource planning system, which was completed in the second quarter of 2017. Further, $3.3 million of the increase related to additional general and administrative costs associated with our Short Course Segment and $1.2 million of the increase related to rent, other facilities costs and travel costs within our Graduate Program Segment. The remainder of the increase related to other net costs to support growth within our Graduate Program Segment.
Net Interest Income (Expense). For the year ended December 31, 2017, we earned net interest income of $284,000, a decrease of 18.4%, from $348,000 for the same period of 2016.
Other Income (Expense), Net. For the year ended December 31, 2017, we incurred other expense, net, of $0.9 million primarily due to foreign currency rate fluctuations associated with the acquisition and operations of our Short Course Segment, compared to no activity in the same period of 2016.
Income Tax Benefit. For the year ended December 31, 2017, we recognized a tax benefit of $1.3 million. The tax benefit primarily relates to the GetSmarter acquisition and losses generated from the acquired operations. Our effective tax rate was approximately 4% for the year ended December 31, 2017.
Business Segment Operating Results
We define segment profitability as net income or net loss, as applicable, before net interest income (expense), taxes, depreciation and amortization expense, foreign currency gains or losses, acquisition-related gains or losses and stock-based compensation expense. Some or all of these items may not be applicable in any given reporting period.
The following table reconciles net loss to total segment profitability:
Year Ended December 31, | |||||||||||
2018 | 2017 | 2016 | |||||||||
(in thousands) | |||||||||||
Net loss | $ | (38,330 | ) | $ | (29,423 | ) | $ | (20,684 | ) | ||
Adjustments: | |||||||||||
Interest income | (5,173 | ) | (371 | ) | (383 | ) | |||||
Interest expense | 108 | 87 | 35 | ||||||||
Foreign currency loss | 1,722 | 866 | — | ||||||||
Depreciation and amortization expense | 32,785 | 19,624 | 9,750 | ||||||||
Income tax benefit | (4,867 | ) | (1,297 | ) | — | ||||||
Stock-based compensation expense | 31,410 | 21,930 | 15,823 | ||||||||
Total adjustments | 55,985 | 40,839 | 25,225 | ||||||||
Total segment profitability | $ | 17,655 | $ | 11,416 | $ | 4,541 | |||||
Years Ended December 31, 2018 and 2017
Revenue by segment and segment profitability for the years ended December 31, 2018 and 2017 were as follows:
48
Year Ended December 31, | Period-to-Period Change | |||||||||||||
2018 | 2017 | Amount | Percentage | |||||||||||
(dollars in thousands) | ||||||||||||||
Revenue by segment* | ||||||||||||||
Graduate Program Segment | $ | 348,361 | $ | 270,432 | $ | 77,929 | 28.8 | % | ||||||
Short Course Segment | 63,408 | 16,320 | 47,088 | 288.5 | ||||||||||
Total revenue | $ | 411,769 | $ | 286,752 | $ | 125,017 | 43.6 | |||||||
Segment profitability | ||||||||||||||
Graduate Program Segment | $ | 16,839 | $ | 13,022 | $ | 3,817 | 29.3 | |||||||
Short Course Segment | 816 | (1,606 | ) | 2,422 | (150.8 | ) | ||||||||
Total segment profitability | $ | 17,655 | $ | 11,416 | $ | 6,239 | 54.6 | |||||||
* | Approximately $44,000 of intersegment revenues have been excluded from the year ended December 31, 2018. |
Segment profitability in our Graduate Program Segment for the year ended December 31, 2018 was $16.8 million, an increase of $3.8 million, or 29%, from $13.0 million for the same period of 2017. The primary factor favorably impacting segment profitability in this segment was the year-over-year growth in revenue. Additionally, we experienced a decrease in short-term annual incentive compensation costs and a decline in professional fees following the implementation of an enterprise resource planning system that was largely completed in 2017. We expect to increase investment in the development, marketing and support of newer and newly launching programs in this segment as we continue to scale our operations to prepare for future launches of an increasing number of programs in 2019 as compared to prior periods. Based on timing differences between the addition of costs related to the increased investment and the related recognition of revenue, we expect that there will be significant variability in segment profitability in this segment between periods.
Segment profitability in our Short Course Segment for the year ended December 31, 2018 was $0.8 million, an increase of $2.4 million, or 151%, from $(1.6) million for the same period of 2017. Segment profitability for the year ended December 31, 2018 includes 12 months of operations related to our Short Course Segment, whereas the same period of 2017 includes only six months of such operations as the acquisition of GetSmarter occurred on July 1, 2017. The primary factor favorably impacting segment profitability in this segment was year-over-year growth in revenue. There were also changes in relative expense levels and expense timing in this period of rapid growth for the Short Course Segment, year-over-year. Therefore, changes in segment profitability do not necessarily represent a business trend. Changes in segment profitability are highly dependent upon the timing of new course launches and new course presentations. We expect to increase investment in the development, marketing and support of newer and newly launching courses in this segment. Based on timing differences between the addition of costs related to the increased investment and the related recognition of revenue, we expect that there will be significant variability in segment profitability in this segment between periods.
Years Ended December 31, 2017 and 2016
Revenue by segment and segment profitability for the years ended December 31, 2017 and 2016 were as follows:
Year Ended December 31, | Period-to-Period Change | |||||||||||||
2017 | 2016 | Amount | Percentage | |||||||||||
(dollars in thousands) | ||||||||||||||
Revenue by segment | ||||||||||||||
Graduate Program Segment | 270,432 | $ | 205,864 | $ | 64,568 | 31.4 | % | |||||||
Short Course Segment | 16,320 | — | 16,320 | * | ||||||||||
Total revenue | $ | 286,752 | $ | 205,864 | $ | 80,888 | 39.3 | % | ||||||
Segment profitability | ||||||||||||||
Graduate Program Segment | 13,022 | $ | 4,541 | $ | 8,481 | 186.8 | % | |||||||
Short Course Segment | (1,606 | ) | — | (1,606 | ) | * | ||||||||
Total segment profitability | $ | 11,416 | $ | 4,541 | $ | 6,875 | 151.4 | % | ||||||
* | Not meaningful for comparative purposes. |
49
Segment profitability in our Graduate Program Segment for the year ended December 31, 2017 was $13.0 million, an increase of $8.5 million, or 186.8%, from $4.5 million for the same period of 2016. The period-over-period increase in segment profitability in this segment was primarily due to cost growth outpacing revenue growth, particularly in marketing expenditures and marketing and program staffing, during 2017. We had been scaling operations to prepare for future launches of an increasing number of programs in 2017 and 2018 as compared to 2016.
Segment profitability in our Short Course Segment for the year ended December 31, 2017 was $(1.6) million, compared to zero for the same period of 2016. Segment profitability for the year ended December 31, 2017 includes six months of operations related to our Short Course Segment, whereas the same period of 2016 includes no activity of such operations as the acquisition of GetSmarter occurred on July 1, 2017.
Key Business and Financial Performance Metrics
We use a number of key metrics to evaluate our business, measure our performance, identify trends affecting our business, formulate financial projections and make strategic decisions. In addition to adjusted EBITDA, which we discuss below, and revenue and the components of loss from operations in the section above entitled “Our Business Model and Components of Operating Results,” we utilize full course equivalent enrollments as a key metric to evaluate the success of our growth strategy.
Full Course Equivalent Enrollments in Our University Clients’ Offerings
We measure full course equivalent enrollments for each of the courses offered during a particular period by taking the number of students enrolled in that course and multiplying it by the percentage of the course completed during that period. We add the full course equivalent enrollments for each course within each segment to calculate the total full course equivalent enrollments per segment. This metric allows us to consistently view period over period changes in enrollments by accounting for the fact that many courses we enable straddle two or more fiscal quarters. For example, if a course had 25 enrolled students and 40% of the course was completed during a particular period, we would count the course as having 10 full course equivalent enrollments for that period. Any individual student may be enrolled in more than one course during a period.
Average revenue per full course equivalent enrollment represents our weighted-average revenue per course across the mix of courses being offered during a period in each of our operating segments. This number is derived by dividing the total revenue for a period for each of our operating segments by the number of full course equivalent enrollments within the applicable segment during that same period. This amount may vary from period to period depending on the academic calendars of our university clients, the relative growth rates of our graduate programs and short courses, as applicable, and varying tuition levels, among other factors.
The following table sets forth the full course equivalent enrollments and average revenue per full course equivalent enrollment in our Graduate Program Segment and Short Course Segment for the periods presented.
Year Ended December 31, | |||||||||||
2018 | 2017 | 2016 | |||||||||
Graduate Program Segment | |||||||||||
Full course equivalent enrollments | 127,678 | 98,904 | 77,344 | ||||||||
Average revenue per full course equivalent enrollment | $ | 2,728 | $ | 2,734 | $ | 2,662 | |||||
Short Course Segment | |||||||||||
Full course equivalent enrollments | 32,202 | 10,830 | * | — | |||||||
Average revenue per full course equivalent enrollment | $ | 1,969 | $ | 1,507 | ** | $ | — | ||||
* | We acquired GetSmarter on July 1, 2017 and their results of operations are included in our financial results from the date of acquisition. As such, the full course equivalent enrollment measures of our short courses in 2017 are measured only for the six months ended December 31, 2017. |
** | The calculation of short course average revenue per full course equivalent enrollment includes $0.7 million of revenue that was excluded from the results of operations in the third quarter of 2017, due to an adjustment recorded as part of the valuation of GetSmarter. |
Of the increase in full course equivalent enrollments in our Graduate Program Segment for the years ended December 31, 2018 and 2017, 7,899 or 27.5% and 959 or 4.4%, respectively, were attributable to graduate programs launched
50
during the preceding 12 months. Of the increase in full course equivalent enrollments in our Short Course Segment for the year ended December 31, 2018, 7,266 were attributable to short courses launched during the preceding 12 months.
Adjusted EBITDA
Adjusted EBITDA represents our earnings before net interest income (expense), taxes, depreciation and amortization expense, foreign currency gains or losses, acquisition-related gains or losses and stock-based compensation expense. Adjusted EBITDA is a key measure used by our management and board of directors to understand and evaluate our core operating performance and trends, to prepare and approve our annual budget and to develop short- and long-term operational plans. In particular, the exclusion of certain expenses in calculating adjusted EBITDA can provide a useful measure for period-to-period comparisons of our core business. Accordingly, we believe that adjusted EBITDA provides useful information to investors and others in understanding and evaluating our operating results in the same manner as our management and board of directors.
Adjusted EBITDA is not a measure calculated in accordance with U.S. GAAP, and should not be considered as an alternative to any measure of financial performance calculated and presented in accordance with U.S. GAAP. In addition, adjusted EBITDA may not be comparable to similarly titled measures of other companies because other companies may not calculate adjusted EBITDA in the same manner as we do. We prepare adjusted EBITDA to eliminate the impact of stock-based compensation expense, which we do not consider indicative of our core operating performance.
Our use of adjusted EBITDA has limitations as an analytical tool, and you should not consider it in isolation or as a substitute for analysis of our financial results as reported under U.S. GAAP. Some of these limitations are:
• | although depreciation and amortization expense are non-cash charges, the assets being depreciated and amortized may have to be replaced in the future, and adjusted EBITDA does not reflect cash capital expenditure requirements for such replacements or for new capital expenditure requirements; |
• | adjusted EBITDA does not reflect changes in, or cash requirements for, our working capital needs; |
• | adjusted EBITDA does not reflect the impact of changes in foreign currency exchange rates; |
• | adjusted EBITDA does not reflect acquisition related gains or losses such as, but not limited to, post-acquisition changes in the value of contingent consideration reflected in operations; |
• | adjusted EBITDA does not reflect the potentially dilutive impact of equity-based compensation; |
• | adjusted EBITDA does not reflect interest or tax payments that may represent a reduction in cash available to us; and |
• | other companies, including companies in our industry, may calculate adjusted EBITDA differently, which reduces its usefulness as a comparative measure. |
Because of these and other limitations, you should consider adjusted EBITDA alongside other U.S. GAAP-based financial performance measures, including various cash flow metrics, net income (loss) and our other U.S. GAAP results. The following table presents a reconciliation of net loss to adjusted EBITDA for each of the periods indicated:
Year Ended December 31, | |||||||||||
2018 | 2017 | 2016 | |||||||||
(in thousands) | |||||||||||
Net loss | $ | (38,330 | ) | $ | (29,423 | ) | (20,684 | ) | |||
Adjustments: | |||||||||||
Interest income | (5,173 | ) | (371 | ) | (383 | ) | |||||
Interest expense | 108 | 87 | 35 | ||||||||
Foreign currency loss | 1,722 | 866 | — | ||||||||
Depreciation and amortization expense | 32,785 | 19,624 | 9,750 | ||||||||
Income tax benefit | (4,867 | ) | (1,297 | ) | — | ||||||
Stock-based compensation expense | 31,410 | 21,930 | 15,823 | ||||||||
Total adjustments | 55,985 | 40,839 | 25,225 | ||||||||
Adjusted EBITDA | $ | 17,655 | $ | 11,416 | $ | 4,541 | |||||
Financial Condition: Capital Resources and Liquidity
Capital Expenditures
51
During the year ended December 31, 2018, we had capital asset additions of $87.4 million, which were comprised of $67.2 million in capitalized technology and content development, $7.9 million of trade and domain names, $7.4 million of other property and equipment and $4.9 million of leasehold improvements. The $87.4 million increase consisted of $77.2 million in cash capital expenditures and $5.3 million of non-cash capital expenditures, primarily related to the acquisition of certain long-lived assets for which we have an accrued liability. Due to extended payment terms associated with the timing of cash capital expenditures made more than 90 days after the date of purchase, an additional $4.9 million was classified as cash flows from financing activities in the consolidated statement of cash flows for the year ended December 31, 2018. In 2019, we expect new capital asset additions of approximately $95 to $98 million, of which approximately $12 to $14 million will be funded by landlord leasehold improvement allowances.
Sources of Liquidity
Public Offerings of Common Stock
On May 22, 2018 we sold 3,833,334 shares of our common stock to the public, including 500,000 shares sold pursuant to the underwriters’ over-allotment option, and received net proceeds of $330.9 million. On September 11, 2017 we sold 4,047,500 shares of our common stock to the public, including 547,500 shares sold pursuant to the underwriters’ over-allotment option, and received net proceeds of $189.5 million. We intend to use the net proceeds from both of these public offerings of common stock for working capital and other general corporate purposes, including expenditures for graduate program and short course marketing, technology and content development, in connection with new graduate program and short course launches and growing existing graduate programs and short courses, as well as the strategic acquisitions of, or investments in, complementary products, technologies, solutions or businesses.
Lines of Credit
We currently have a $25.0 million revolving line of credit with Comerica Bank (“Comerica”), which had no amounts outstanding as of December 31, 2018 and 2017. During 2017, we amended our line of credit agreement multiple times to extend the maturity date as well as to receive Comerica’s consent to our acquisition of GetSmarter and our formation of certain subsidiaries in connection therewith. The most recent amendment was effective as of December 31, 2018, to extend the maturity date of the credit agreement through March 31, 2019.
Under this revolving line of credit, we have the option of borrowing funds subject to (i) a base rate, which is equal to 1.5% plus the greater of Comerica’s prime rate, the federal funds rate plus 1% or the 30-day LIBOR plus 1%, or (ii) LIBOR plus 2.5%. For amounts borrowed under the base rate, we may make interest-only payments quarterly, and may prepay such amounts with no penalty. For amounts borrowed under LIBOR, we may make interest-only payments in periods of one, two and three months and will be subject to a prepayment penalty if we repay such borrowed amounts before the end of the interest period.
Borrowings under the line of credit are collateralized by substantially all of our assets. The availability of borrowings under this credit line is subject to our compliance with reporting and financial covenants, including, among other things, that we achieve specified minimum three-month trailing revenue levels during the term of the agreement and specified minimum six-month trailing profitability levels for some of our graduate programs, measured quarterly. In addition, we are required to maintain a minimum adjusted quick ratio, which measures our short-term liquidity, of at least 1.10 to 1.00. As of December 31, 2018 and 2017, our adjusted quick ratios were 12.38 and 5.44, respectively.
The covenants under the line of credit also place limitations on our ability to incur additional indebtedness or to prepay permitted indebtedness, grant liens on or security interests in our assets, carry out mergers and acquisitions, dispose of assets, declare, make or pay dividends, make capital expenditures in excess of specified amounts, make investments, loans or advances, enter into transactions with our affiliates, amend or modify the terms of our material contracts, or change our fiscal year. If we are not in compliance with the covenants under the line of credit, after any opportunity to cure such non-compliance, or we otherwise experience an event of default under the line of credit, the lenders may require repayment in full of all principal and interest outstanding. We are currently in compliance with all such covenants.
Certain of our operating lease agreements entered into require security deposits in the form of cash or an unconditional, irrevocable letter of credit. As of December 31, 2018, we have entered into standby letters of credit totaling $11.5 million, as security deposits for the applicable leased facilities and standby letters of credit totaling $3.5 million in connection with two government grants. These letters of credit reduced the aggregate amount we may borrow under our revolving line of credit to $10.0 million.
Government Grants
52
In June 2017, we entered into a total of two conditional loan agreements with Prince George’s County, Maryland and the State of Maryland for an aggregate amount of $3.5 million, each bearing an interest rate of 3% per annum. These agreements are conditional loan obligations that may be forgiven provided that we attain certain conditions related to employment levels at our Lanham, Maryland headquarters. The loan with the State of Maryland has a maturity date of December 31, 2026, and the loan with Prince George’s County, Maryland has a maturity date of June 22, 2027. The interest expense related to these loans for the years ended December 31, 2018 and 2017 is immaterial.
Working Capital
We define working capital as current assets minus current liabilities. Our working capital as of December 31, 2018 and 2017 was $453.2 million and $190.1 million, respectively. Our cash and cash equivalents balance within working capital as of December 31, 2018 and 2017 was $449.8 million and $223.4 million, respectively. The increase in our working capital in 2018 as compared to 2017 primarily relates to higher cash balances held at year end related to our public offering of common stock in May 2018. We do not enter into investments for trading or speculative purposes. We invest any cash in excess of our immediate requirements in investments designed to preserve the principal balance and provide liquidity. Accordingly, our cash is invested primarily in demand deposit accounts or certificates of deposits that are currently providing only a minimal return.
Cash Flows
The following table summarizes our cash flows for the periods presented:
Year Ended December 31, | |||||||||||
2018 | 2017 | 2016 | |||||||||
(in thousands) | |||||||||||
Cash (used in) provided by: | |||||||||||
Operating activities | $ | (3,120 | ) | $ | 8,106 | $ | 5,210 | ||||
Investing activities | (102,461 | ) | (149,374 | ) | (24,518 | ) | |||||
Financing activities | 333,037 | 196,752 | 4,309 | ||||||||
Effect of exchange rate changes on cash | (1,054 | ) | (844 | ) | — | ||||||
Net increase (decrease) in cash and cash equivalents | $ | 226,402 | $ | 54,640 | $ | (14,999 | ) | ||||
Operating Activities
Cash flows from operating activities have typically been generated from our net income (loss) and by changes in our operating assets and liabilities, particularly from accounts receivable, adjusted for non-cash expense items such as amortization and depreciation expense and stock-based compensation expense.
Cash used in operating activities for the year ended December 31, 2018 was $3.1 million, while cash provided by operating activities for the same period of 2017 was $8.1 million, a change of $11.2 million, or 138.5%. This $11.2 million change in operating cash flows was primarily due to a $25.8 million change in working capital and a $8.9 million increase in net loss. These changes in operating cash flows were partially offset by a $13.2 million increase in depreciation and amortization expense, a $9.5 million increase in stock-based compensation expense and an increase in other net cash inflows of $0.8 million. Our cash flows from operating activities for the year ended December 31, 2018 included a full year of operations related to our Short Course Segment, whereas the same period of 2017 included only six months of such operations as the acquisition of GetSmarter occurred on July 1, 2017.
Cash provided by operating activities for the year ended December 31, 2017 was $8.1 million, an increase of $2.9 million or 55.6% from net cash provided by operating activities of $5.2 million for the same period of 2016. This was primarily due to a $8.7 million increase in net loss and a $5.2 million change in working capital. These decreases in cash were partially offset by a $9.9 million increase in stock-based compensation expense and a $6.1 million increase in depreciation and amortization expense. Of the $8.1 million increase in cash provided by operating activities, $1.7 million is associated with the GetSmarter acquisition.
Investing Activities
Cash used in investing activities for the year ended December 31, 2018 was $102.5 million, a decrease of $46.9 million from $149.4 million for the same period of 2017. This decrease was primarily due to the July 1, 2017 acquisition of GetSmarter for $97.1 million and a $15.3 million decrease in purchases of property, plant and equipment as we moved into new facilities in the prior year. These decreases in outflows were partially offset by an increase of $41.4 million in amortizable intangible assets to support a greater number of launched graduate programs and short courses. The increase in amortizable intangible assets included an increase of $17.3 million in acquisitions of technology to be integrated into our platform,
53
including $9.0 million related to the purchase of WeWork’s intangible assets. Additionally offsetting these items was a $25.0 million outflow related to a short-term investment in a certificate of deposit.
Cash used in investing activities for the year ended December 31, 2017 was $149.4 million, an increase of $124.9 million from $24.5 million for the same period of 2016. This increase was primarily due to $97.1 million in net cash paid to acquire GetSmarter, a $19.7 million increase in purchases of property and equipment for our new office locations, and a $7.1 million increase in additions to amortizable intangible assets to support a greater number of launched graduate programs and short courses.
Financing Activities
Cash provided by financing activities for the year ended December 31, 2018 was $333.0 million, an increase of $136.3 million from $196.8 million for the same period of 2017. This increase was primarily due to an increase of $141.4 million in proceeds received from our public offering of common stock, partially offset by an outflow of $4.9 million related to payments on the acquisition of amortizable intangible assets.
Cash provided by financing activities for the year ended December 31, 2017 was $196.8 million, an increase of $192.4 million from $4.3 million for the same period of 2016. This increase was primarily due to $189.5 million in proceeds received from our public offering of common stock and $2.0 million in net proceeds from borrowings.
Contractual Obligations and Commitments
The following table summarizes our obligations under deferred government grant obligations, non-cancelable operating leases, commitments to certain of our university clients in exchange for contract extensions and various marketing and other rights and purchase obligations as of December 31, 2018. Future events could cause actual payments to differ from these amounts.
Payment due by period | |||||||||||||||||||
Contractual Obligations | Less than 1 year | 1 - 3 years | 3 - 5 years | More than 5 years | Total | ||||||||||||||
(in thousands) | |||||||||||||||||||
Deferred government grant obligations | $ | — | $ | — | $ | — | $ | 3,500 | $ | 3,500 | |||||||||
Operating lease obligations | 12,941 | 27,920 | 27,592 | 68,347 | 136,800 | ||||||||||||||
Future minimum payments to university clients | 10,125 | 1,250 | 1,250 | 3,775 | 16,400 | ||||||||||||||
Purchase obligations | 7,234 | 6,550 | — | — | 13,784 | ||||||||||||||
Total | $ | 30,300 | $ | 35,720 | $ | 28,842 | $ | 75,622 | $ | 170,484 | |||||||||
Other purchase orders made in the ordinary course of business are excluded from the table above. Any amounts for which we are liable under purchase orders are reflected on our consolidated balance sheets as accounts payable and accrued liabilities.
We have entered into an agreement with one university client in our Graduate Program Segment under which we would be obligated to make future minimum program payments in the event that certain program metrics are not achieved. Due to the dependency of these calculations on future program performance, the timing and amounts of any associated contingent payments cannot be reasonably estimated at this time, and have therefore been excluded from the table above.
See Note 6 in the “Notes to Consolidated Financial Statements” included in Part II, Item 8 and “Legal Proceedings” contained in Part I, Item 3 of this Annual Report on Form 10-K for additional information regarding contingencies.
Other
We do not have any off-balance sheet arrangements, as defined in Item 303(a)(4)(ii) of Regulation S-K, such as the use of unconsolidated subsidiaries, structured finance, special purpose entities or variable interest entities.
Critical Accounting Policies and Significant Judgments and Estimates
This management’s discussion and analysis of financial condition and results of operations is based on our consolidated financial statements, which have been prepared in accordance with U.S. GAAP. The preparation of these consolidated financial statements requires us to make estimates and assumptions that affect the reported amounts of assets and liabilities, disclosure of contingent assets and liabilities at the date of the consolidated financial statements, and the reported amounts of revenue and expenses during the reported period. In accordance with U.S. GAAP, we base our estimates on historical experience and on various other assumptions we believe to be reasonable under the circumstances. Actual results may differ from these estimates if conditions differ from our assumptions.
54
While our significant accounting policies are more fully described in Note 2 in the “Notes to Consolidated Financial Statements” included in Part II, Item 8 of this Annual Report on Form 10-K, we believe the following accounting policies are critical to the process of making significant judgments and estimates in preparation of our consolidated financial statements.
Revenue Recognition, Accounts Receivable and Allowance for Doubtful Accounts
On January 1, 2018, we adopted Accounting Standards Update (“ASU”) No. 2014-09, Revenue from Contracts with Customers (Topic 606) and the related amendments using the modified retrospective transition method and concluded that doing so did not have a material impact on the amount and timing of either our revenue or costs. As part of our assessment, we completed reviews of our contracts and evaluated our costs, including costs of obtaining contracts with our university clients and costs associated with content development. Certain of these contract and content costs are capitalized under the new standard. The adoption of ASU 2014-09 did not have a material impact as of January 1, 2018, and no cumulative adjustment was recorded. Further, the amounts reported as of December 31, 2018 on our consolidated balance sheets and our results of operations for the year ended December 31, 2018 reported on our consolidated statements of operations and comprehensive loss would not have been materially different than under legacy U.S. GAAP (i.e., Topic 605).
We generate substantially all of our revenue from contractual arrangements, with either our university clients or students, to provide a comprehensive platform of tightly integrated technology and technology-enabled services that support our graduate programs and short courses.
Performance Obligations
A performance obligation is a promise in a contract to transfer a distinct good or service to the customer. A contract’s transaction price is allocated to each distinct performance obligation and recognized as revenue when, or as, the performance obligation is satisfied.
Our Graduate Program Segment derives revenue primarily from contractually specified percentages of the amounts our university clients receive from their students in 2U-enabled graduate programs for tuition and fees, less credit card fees and other specified charges we have agreed to exclude in certain university contracts. Our contracts with university clients in this segment typically have 10 to 15 year initial terms and have a single performance obligation, as the promises to provide a platform of tightly integrated technology and services that university clients need to attract, enroll, educate and support students are not distinct within the context of the contracts. The single performance obligation is delivered as the university clients receive and consume benefits, which occurs ratably over a series of academic terms. The amounts received from university clients over the term of the arrangement are variable in nature in that they are dependent upon the number of students that are enrolled in the program within each academic term. These amounts are allocated to and are recognized ratably over the related academic term, defined as the period beginning on the first day of classes through the last. Revenue is recognized net of an allowance, which is established for our expected obligation to refund tuition and fees to university clients.
Our Short Course Segment derives revenue directly from contracts with students for the tuition and fees paid to enroll in and progress through our short courses, which run between six and 16 weeks. Our contracts with students in this segment have multiple performance obligations as the delivery of the short course and student support services are each considered distinct performance obligations. These performance obligations are each satisfied ratably over the same short course presentation period, which is defined as the period beginning on the first day of the course through the last. We recognize the gross proceeds received from the students and shares contractually specified percentages with our university clients, for providing short course content and certification, which are recognized as curriculum and teaching costs on our consolidated statements of operations and comprehensive loss. Our contracts with university clients in this segment are typically shorter and less restrictive than our contracts with university clients in our Graduate Program Segment.
We do not disclose the value of unsatisfied performance obligations for our Graduate Program Segment because the variable consideration is allocated entirely to a wholly unsatisfied promise to transfer a service that forms part of a single performance obligation. We do not disclose the value of unsatisfied performance obligations for our Short Course Segment because the performance obligation is part of a contract that has an original duration of less than one year.
Contract Acquisition Costs
We pay commissions to certain of our employees to obtain contracts with university clients in our Graduate Program Segment. These costs are capitalized and recorded on a contract-by-contract basis and amortized using the straight-line method over the expected life, which is generally the length of the contract.
With respect to contract acquisition costs in our Short Course Segment, we have elected to apply the practical expedient in ASC Topic 606 to expense these costs as incurred, as the terms of contracts with students in this segment are less than one year.
55
Payments to University Clients
Pursuant to certain of our contracts in the Graduate Program Segment, we have made, or are obligated to make, payments to university clients at either execution of a contract or at the extension of a contract in exchange for various marketing and other rights. Generally, these amounts are capitalized and amortized as contra revenue over the life of the contract, commencing on the later of when payment is due or when contract revenue recognition begins.
Accounts Receivable, Contract Assets and Liabilities
Balance sheet items related to contracts consist of accounts receivable, net and deferred revenue on our consolidated balance sheets. Included in accounts receivable, net are trade accounts receivable, which are comprised of billed and unbilled revenue. Accounts receivable, net is stated at net realizable value, and we utilize the allowance method to provide for doubtful accounts based on management’s evaluation of the collectability of the amounts due. Our estimates are reviewed and revised periodically based on historical collection experience and a review of the current status of accounts receivable, net. Historically, actual write-offs for uncollectible accounts have not significantly differed from prior estimates. We recognize unbilled revenue when revenue recognition occurs in advance of billings. Unbilled revenue is recognized in our Graduate Program Segment because billings to university clients do not occur until after the academic term has commenced and final enrollment information is available. Our unbilled revenue represents contract assets.
Deferred revenue represents the excess of amounts billed or received as compared to amounts recognized in revenue on our consolidated statements of operations and comprehensive loss as of the end of the reporting period, and such amounts are reflected as a current liability on our consolidated balance sheets. We generally receive payments for our share of tuition and fees from graduate program university clients early in each academic term and from short course students, either in full upon registration for the course or in full before the end of the course based on a payment plan, prior to completion of the service period. These payments are recorded as deferred revenue until the services are delivered or until our obligations are otherwise met, at which time revenue is recognized.
Goodwill
Goodwill is the excess of purchase price over the fair value of identified net assets of the business acquired. Our goodwill balance relates to the acquisition of GetSmarter in 2017. We review goodwill at least annually, as of October 1. Between annual tests, goodwill is reviewed for possible impairment if an event occurs or circumstances change that would more likely than not reduce the fair value of the reporting unit below its carrying value. We will test our goodwill at the reporting unit level, which is an operating segment or one level below an operating segment. We initially assess qualitative factors to determine if it is necessary to perform the two-step goodwill impairment review. We will review our goodwill for impairment using the two-step process if we decide to bypass the qualitative assessment or determine that it is more likely than not that the fair value of a reporting unit is less than its carrying value based on our qualitative assessment. Upon the completion of the two-step process, we may be required to recognize an impairment based on the difference between the carrying value and the fair value of the goodwill recorded.
Internally-Developed Intangible Assets
Capitalized Technology
Capitalized technology includes certain purchased software and technology licenses, direct third-party costs, and internal payroll and payroll-related costs used in the creation of our internal-use software. Software development projects generally include three stages: the preliminary project stage (all costs are expensed as incurred), the application development stage (certain costs are capitalized and certain costs are expensed as incurred) and the post-implementation/operation stage (all costs are expensed as incurred). Costs capitalized in the application development stage include costs of designing the application, coding, integrating our and the university’s networks and systems, and the testing of the software. Capitalization of costs requires judgment in determining when a project has reached the application development stage and the period over which we expect to benefit from the use of that software. Once the software is placed in service, these costs are amortized on the straight-line method over the estimated useful life of the software, which is generally three to five years.
Capitalized Content Development
We develop content for each offering on a course-by-course basis in conjunction with the faculty for each graduate program and short course. University clients and their faculty generally provide materials used for the course in an on-campus setting, including curricula, case studies and other reading materials, and presentations. We are responsible for the conversion of the materials into a format suitable for delivery through our online learning platform, including all expenses associated with this effort. With regard to the Graduate Program Segment, the development of content is part of our single performance obligation and is considered a contract fulfillment cost.
56
The content development costs that qualify for capitalization are third-party direct costs, such as videography, editing and other services associated with creating digital content. Additionally, we capitalize internal payroll and payroll-related costs incurred to create and produce videos and other digital content utilized in the university clients’ offerings for delivery via our online learning platform. Capitalization ends when content has been fully developed by both us and the university client, at which time amortization of the capitalized content development costs begin. The capitalized costs for each offering are recorded on a course-by-course basis and included in capitalized content costs in amortizable intangible assets, net on our consolidated balance sheets. These costs are amortized using the straight-line method over the estimated useful life of the respective course, which is generally four to five years. The estimated useful life corresponds with the planned curriculum refresh rate. This refresh rate is consistent with expected curriculum refresh rates as cited by faculty members for similar on-campus offerings.
Evaluation of Long-Lived Assets
We review long-lived assets, which consist of property and equipment, capitalized technology costs, capitalized content development costs and acquired finite-lived intangible assets, for impairment whenever events or changes in circumstances indicate the carrying value of an asset may not be recoverable. In order to assess the recoverability of the capitalized technology and content development costs, the costs are grouped by the lowest level of independent cash flows (i.e., by degree program or short course, for content development costs). Recoverability of a long-lived asset is measured by a comparison of the carrying value of an asset or asset group to the future undiscounted net cash flows expected to be generated by that asset or asset group. If such assets are not recoverable, the impairment to be recognized is measured by the amount by which the carrying value of an asset exceeds the estimated fair value (discounted cash flow) of the asset or asset group. Our impairment analysis is based upon cumulative results and forecasted performance.
Recent Accounting Pronouncements
Refer to Note 2 in the “Notes to Consolidated Financial Statements” included in Part II, Item 8 of this Annual Report on Form 10-K for a discussion of FASB’s recent accounting pronouncements and their effect on us.
Item 7A. Quantitative and Qualitative Disclosures About Market Risk
Market risk is the risk of loss to future earnings, values or future cash flows that may result from changes in the price of a financial instrument. The value of a financial instrument may change as a result of changes in interest rates, exchange rates, commodity prices, equity prices and other market changes. Our exposure to market risk related to changes in foreign currency exchange rates is deemed moderate as further described below. In addition, we do not use derivative financial instruments for speculative, hedging or trading purposes, although in the future we may enter into exchange rate hedging arrangements to manage the risks described in the succeeding paragraphs.
Interest Rate Risk
We are subject to interest rate risk in connection with potential borrowings available under our bank line of credit which was procured in December 2013 and amended in January 2017. Borrowings under the revolving line of credit bear interest at variable rates. Increases in LIBOR or our lender’s prime rate would increase the amount of interest payable on any borrowings outstanding under this line of credit. No amounts were outstanding as of December 31, 2018 and 2017, respectively.
Foreign Currency Exchange Risk
Prior to July 1, 2017, we did not have significant foreign currency exchange risk. Beginning in the third quarter of 2017, with the acquisition of GetSmarter, we now transact material business in foreign currencies and are exposed to risks resulting from fluctuations in foreign currency exchange rates. Our primary exposures are related to non-U.S. dollar denominated revenue and operating expenses in South Africa and the United Kingdom. Accounts relating to foreign operations are translated into U.S. dollars using prevailing exchange rates at the relevant period end. As a result, we would experience increased revenue and operating expenses in our non-U.S. operations if there were a decline in the value of the U.S. dollar relative to these foreign currencies. Conversely, we would experience decreased revenue and operating expenses in our non-U.S. operations if there were an increase in the value of the U.S. dollar relative to these foreign currencies. Translation adjustments are included as a separate component of stockholders’ equity.
For the years ended December 31, 2018 and 2017, our foreign currency translation adjustment was a loss of $13.8 million and a gain of $5.3 million, respectively. For the years ended December 31, 2018 and 2017, we recognized foreign currency exchange losses of $1.7 million and $0.9 million, respectively, included on our consolidated statements of operations and comprehensive loss.
57
The foreign exchange rate volatility of the trailing 12 months ended December 31, 2018 was 13% and 6% for the South African rand and British pound, respectively. The foreign exchange rate volatility from the date of acquisition of GetSmarter to December 31, 2017 was 10% and 5% for the South African rand and British pound, respectively. A 10% fluctuation of foreign currency exchange rates would have had an immaterial effect on our results of operations and cash flows for all periods presented.
The fluctuations of currencies in which we conduct business can both increase and decrease our overall revenue and expenses for any given fiscal period. Such volatility, even when it increases our revenues or decreases our expenses, impacts our ability to accurately predict our future results and earnings.
Inflation
We do not believe that inflation currently has had a material effect on our business, financial condition or results of operations, though we continue to monitor costs we incur in higher inflationary economies. Additionally, we continue to monitor all inflation-driven costs, regardless of where they are incurred. If our costs were to become subject to significant inflationary pressures, the price increases implemented by our university clients and our own pricing strategies might not fully offset the higher costs, which could harm our business, financial condition and results of operations.
58
Item 8. Financial Statements and Supplementary Data
2U, Inc.
INDEX TO CONSOLIDATED FINANCIAL STATEMENTS
PAGE | |
Consolidated Balance Sheets as of December 31, 2018 and 2017 | |
Consolidated Statements of Operations and Comprehensive Loss for the years ended December 31, 2018, 2017 and 2016 | |
Consolidated Statements of Changes in Stockholders’ Equity for the years ended December 31, 2018, 2017 and 2016 | |
Consolidated Statements of Cash Flows for the years ended December 31, 2018, 2017 and 2016 | |
59
Report of Independent Registered Public Accounting Firm
To the Stockholders and Board of Directors
2U, Inc.:
Opinion on the Consolidated Financial Statements
We have audited the accompanying consolidated balance sheets of 2U, Inc. and subsidiaries (the Company) as of December 31, 2018 and 2017 the related consolidated statements of operations and comprehensive loss, changes in stockholders’ equity, and cash flows for each of the years in the three-year period ended December 31, 2018, and the related notes and financial statement Schedule II—Valuation and Qualifying Accounts (collectively, the consolidated financial statements). In our opinion, the consolidated financial statements present fairly, in all material respects, the financial position of the Company as of December 31, 2018 and 2017, and the results of its operations and its cash flows for each of the years in the three-year period ended December 31, 2018, in conformity with U.S. generally accepted accounting principles.
We also have audited, in accordance with the standards of the Public Company Accounting Oversight Board (United States) (PCAOB), the Company’s internal control over financial reporting as of December 31, 2018, based on criteria established in Internal Control—Integrated Framework (2013) issued by the Committee of Sponsoring Organizations of the Treadway Commission, and our report dated February 26, 2019 expressed an unqualified opinion on the effectiveness of the Company’s internal control over financial reporting.
Change in Accounting Principle
As discussed in Note 2 to the consolidated financial statements, the Company has changed its method of accounting for revenues and related costs in 2018 due to the adoption, effective January 1, 2018, of ASU No. 2014-09, Revenue from Contracts with Customers.
Basis for Opinion
These consolidated financial statements are the responsibility of the Company’s management. Our responsibility is to express an opinion on these consolidated financial statements based on our audits. We are a public accounting firm registered with the PCAOB and are required to be independent with respect to the Company in accordance with the U.S. federal securities laws and the applicable rules and regulations of the Securities and Exchange Commission and the PCAOB.
We conducted our audits in accordance with the standards of the PCAOB. Those standards require that we plan and perform the audit to obtain reasonable assurance about whether the consolidated financial statements are free of material misstatement, whether due to error or fraud. Our audits included performing procedures to assess the risks of material misstatement of the consolidated financial statements, whether due to error or fraud, and performing procedures that respond to those risks. Such procedures included examining, on a test basis, evidence regarding the amounts and disclosures in the consolidated financial statements. Our audits also included evaluating the accounting principles used and significant estimates made by management, as well as evaluating the overall presentation of the consolidated financial statements. We believe that our audits provide a reasonable basis for our opinion.
/s/ KPMG LLP | ||
We have served as the Company’s auditor since 2013.
McLean, Virginia
February 26, 2019
60
Report of Independent Registered Public Accounting Firm
To the Stockholders and Board of Directors
2U, Inc.:
Opinion on Internal Control Over Financial Reporting
We have audited 2U, Inc. and subsidiaries’ (the Company) internal control over financial reporting as of December 31, 2018, based on criteria established in Internal Control—Integrated Framework (2013) issued by the Committee of Sponsoring Organizations of the Treadway Commission. In our opinion, the Company maintained, in all material respects, effective internal control over financial reporting as of December 31, 2018, based on criteria established in Internal Control—Integrated Framework (2013) issued by the Committee of Sponsoring Organizations of the Treadway Commission.
We also have audited, in accordance with the standards of the Public Company Accounting Oversight Board (United States) (PCAOB), the consolidated balance sheets of the Company as of December 31, 2018 and 2017, the related consolidated statements of operations and comprehensive loss, changes in stockholders’ equity, and cash flows for each of the years in the three-year period ended December 31, 2018, and the related notes and financial statement Schedule II—Valuation and Qualifying Accounts (collectively, the consolidated financial statements), and our report dated February 26, 2019 expressed an unqualified opinion on those consolidated financial statements.
Basis for Opinion
The Company’s management is responsible for maintaining effective internal control over financial reporting and for its assessment of the effectiveness of internal control over financial reporting, included in the accompanying Management’s Annual Report on Internal Control Over Financial Reporting. Our responsibility is to express an opinion on the Company’s internal control over financial reporting based on our audit. We are a public accounting firm registered with the PCAOB and are required to be independent with respect to the Company in accordance with the U.S. federal securities laws and the applicable rules and regulations of the Securities and Exchange Commission and the PCAOB.
We conducted our audit in accordance with the standards of the PCAOB. Those standards require that we plan and perform the audit to obtain reasonable assurance about whether effective internal control over financial reporting was maintained in all material respects. Our audit of internal control over financial reporting included obtaining an understanding of internal control over financial reporting, assessing the risk that a material weakness exists, and testing and evaluating the design and operating effectiveness of internal control based on the assessed risk. Our audit also included performing such other procedures as we considered necessary in the circumstances. We believe that our audit provides a reasonable basis for our opinion.
Definition and Limitations of Internal Control Over Financial Reporting
A company’s internal control over financial reporting is a process designed to provide reasonable assurance regarding the reliability of financial reporting and the preparation of financial statements for external purposes in accordance with generally accepted accounting principles. A company’s internal control over financial reporting includes those policies and procedures that (1) pertain to the maintenance of records that, in reasonable detail, accurately and fairly reflect the transactions and dispositions of the assets of the company; (2) provide reasonable assurance that transactions are recorded as necessary to permit preparation of financial statements in accordance with generally accepted accounting principles, and that receipts and expenditures of the company are being made only in accordance with authorizations of management and directors of the company; and (3) provide reasonable assurance regarding prevention or timely detection of unauthorized acquisition, use, or disposition of the company’s assets that could have a material effect on the financial statements.
Because of its inherent limitations, internal control over financial reporting may not prevent or detect misstatements. Also, projections of any evaluation of effectiveness to future periods are subject to the risk that controls may become inadequate because of changes in conditions, or that the degree of compliance with the policies or procedures may deteriorate.
/s/ KPMG LLP | ||
McLean, Virginia | ||
February 26, 2019 | ||
61
2U, Inc.
Consolidated Balance Sheets
(in thousands, except share and per share amounts)
December 31, 2018 | December 31, 2017 | ||||||
Assets | |||||||
Current assets | |||||||
Cash and cash equivalents | $ | 449,772 | $ | 223,370 | |||
Investments | 25,000 | — | |||||
Accounts receivable, net | 32,636 | 14,174 | |||||
Prepaid expenses and other assets | 14,272 | 10,509 | |||||
Total current assets | 521,680 | 248,053 | |||||
Property and equipment, net | 52,299 | 49,055 | |||||
Goodwill | 61,852 | 71,988 | |||||
Amortizable intangible assets, net | 136,605 | 90,761 | |||||
University payments and other assets, non-current | 34,918 | 22,205 | |||||
Total assets | $ | 807,354 | $ | 482,062 | |||
Liabilities and stockholders’ equity | |||||||
Current liabilities | |||||||
Accounts payable and accrued expenses | $ | 27,647 | $ | 22,629 | |||
Accrued compensation and related benefits | 23,001 | 19,017 | |||||
Deferred revenue | 8,345 | 7,024 | |||||
Other current liabilities | 9,487 | 9,330 | |||||
Total current liabilities | 68,480 | 58,000 | |||||
Deferred government grant obligations | 3,500 | 3,500 | |||||
Deferred tax liabilities, net | 6,949 | 10,087 | |||||
Lease-related and other liabilities, non-current | 23,416 | 22,643 | |||||
Total liabilities | 102,345 | 94,230 | |||||
Commitments and contingencies (Note 6) | |||||||
Stockholders’ equity | |||||||
Preferred stock, $0.001 par value, 5,000,000 shares authorized, none issued | — | — | |||||
Common stock, $0.001 par value, 200,000,000 shares authorized, 57,968,493 shares issued and outstanding as of December 31, 2018; 52,505,856 shares issued and outstanding as of December 31, 2017 | 58 | 53 | |||||
Additional paid-in capital | 957,631 | 588,289 | |||||
Accumulated deficit | (244,166 | ) | (205,836 | ) | |||
Accumulated other comprehensive income (loss) | (8,514 | ) | 5,326 | ||||
Total stockholders’ equity | 705,009 | 387,832 | |||||
Total liabilities and stockholders’ equity | $ | 807,354 | $ | 482,062 | |||
See accompanying notes to consolidated financial statements.
62
2U, Inc.
Consolidated Statements of Operations and Comprehensive Loss
(in thousands, except share and per share amounts)
Year Ended December 31, | |||||||||||
2018 | 2017 | 2016 | |||||||||
Revenue | $ | 411,769 | $ | 286,752 | $ | 205,864 | |||||
Costs and expenses | |||||||||||
Curriculum and teaching | 23,290 | 6,609 | — | ||||||||
Servicing and support | 67,203 | 50,767 | 40,982 | ||||||||
Technology and content development | 63,812 | 45,926 | 33,283 | ||||||||
Marketing and sales | 221,015 | 150,923 | 106,610 | ||||||||
General and administrative | 82,989 | 62,665 | 46,021 | ||||||||
Total costs and expenses | 458,309 | 316,890 | 226,896 | ||||||||
Loss from operations | (46,540 | ) | (30,138 | ) | (21,032 | ) | |||||
Interest income | 5,173 | 371 | 383 | ||||||||
Interest expense | (108 | ) | (87 | ) | (35 | ) | |||||
Other expense, net | (1,722 | ) | (866 | ) | — | ||||||
Loss before income taxes | (43,197 | ) | (30,720 | ) | (20,684 | ) | |||||
Income tax benefit | 4,867 | 1,297 | — | ||||||||
Net loss | $ | (38,330 | ) | $ | (29,423 | ) | $ | (20,684 | ) | ||
Net loss per share, basic and diluted | $ | (0.69 | ) | $ | (0.60 | ) | $ | (0.44 | ) | ||
Weighted-average shares of common stock outstanding, basic and diluted | 55,833,492 | 49,062,611 | 46,609,751 | ||||||||
Other comprehensive loss | |||||||||||
Foreign currency translation adjustments, net of tax of $0 for all periods presented | (13,840 | ) | 5,326 | — | |||||||
Comprehensive loss | $ | (52,170 | ) | $ | (24,097 | ) | $ | (20,684 | ) | ||
See accompanying notes to consolidated financial statements.
63
2U, Inc.
Consolidated Statements of Changes in Stockholders’ Equity
(in thousands, except share amounts)
Common Stock | Additional Paid-In Capital | Accumulated Deficit | Accumulated Other Comprehensive Income (Loss) | Total Stockholders’ Equity | ||||||||||||||||||
Shares | Amount | |||||||||||||||||||||
Balance, December 31, 2015 | 45,776,455 | $ | 46 | $ | 351,324 | $ | (155,581 | ) | $ | — | $ | 195,789 | ||||||||||
Exercise of stock options | 1,011,153 | 1 | 4,858 | — | — | 4,859 | ||||||||||||||||
Issuance of common stock in connection with settlement of restricted stock units, net of withholdings | 351,319 | — | (382 | ) | — | — | (382 | ) | ||||||||||||||
Issuance of common stock award | 12,708 | — | (168 | ) | — | — | (168 | ) | ||||||||||||||
Stock-based compensation expense | — | — | 15,823 | — | — | 15,823 | ||||||||||||||||
Net loss | — | — | — | (20,684 | ) | — | (20,684 | ) | ||||||||||||||
Balance, December 31, 2016 | 47,151,635 | 47 | 371,455 | (176,265 | ) | — | 195,237 | |||||||||||||||
Cumulative-effect of accounting change (Note 2) | — | — | 148 | (148 | ) | — | — | |||||||||||||||
Balance, December 31, 2016, adjusted | 47,151,635 | 47 | 371,603 | (176,413 | ) | — | 195,237 | |||||||||||||||
Exercise of stock options | 846,821 | 1 | 6,614 | — | — | 6,615 | ||||||||||||||||
Issuance of common stock in connection with settlement of restricted stock units, net of withholdings | 459,900 | 1 | (1,310 | ) | — | — | (1,309 | ) | ||||||||||||||
Issuance of common stock in connection with a public offering of common stock, net of offering costs | 4,047,500 | 4 | 189,452 | — | — | 189,456 | ||||||||||||||||
Stock-based compensation expense | — | — | 21,930 | — | — | 21,930 | ||||||||||||||||
Net loss | — | — | — | (29,423 | ) | — | (29,423 | ) | ||||||||||||||
Foreign currency translation adjustment | — | — | — | — | 5,326 | 5,326 | ||||||||||||||||
Balance, December 31, 2017 | 52,505,856 | 53 | 588,289 | (205,836 | ) | 5,326 | 387,832 | |||||||||||||||
Exercise of stock options | 1,012,473 | 1 | 7,365 | — | — | 7,366 | ||||||||||||||||
Issuance of common stock in connection with settlement of restricted stock units, net of withholdings | 553,159 | — | (3,451 | ) | — | — | (3,451 | ) | ||||||||||||||
Issuance of common stock in connection with a public offering of common stock, net of offering costs | 3,833,334 | 4 | 330,897 | — | — | 330,901 | ||||||||||||||||
Issuance of common stock in connection with employee stock purchase plan | 63,671 | — | 3,121 | — | — | 3,121 | ||||||||||||||||
Stock-based compensation expense | — | — | 31,410 | — | — | 31,410 | ||||||||||||||||
Net loss | — | — | — | (38,330 | ) | — | (38,330 | ) | ||||||||||||||
Foreign currency translation adjustment | — | — | — | — | (13,840 | ) | (13,840 | ) | ||||||||||||||
Balance, December 31, 2018 | 57,968,493 | $ | 58 | $ | 957,631 | $ | (244,166 | ) | $ | (8,514 | ) | $ | 705,009 | |||||||||
See accompanying notes to consolidated financial statements.
64
2U, Inc.
Consolidated Statements of Cash Flows
(in thousands)
Year Ended December 31, | |||||||||||
2018 | 2017 | 2016 | |||||||||
Cash flows from operating activities | |||||||||||
Net loss | $ | (38,330 | ) | $ | (29,423 | ) | $ | (20,684 | ) | ||
Adjustments to reconcile net loss to net cash (used in) provided by operating activities: | |||||||||||
Depreciation and amortization expense | 32,785 | 19,624 | 9,750 | ||||||||
Stock-based compensation expense | 31,410 | 21,930 | 15,823 | ||||||||
Changes in operating assets and liabilities: | |||||||||||
Accounts receivable, net | (18,497 | ) | (5,634 | ) | (6,885 | ) | |||||
Prepaid expenses and other assets | (4,932 | ) | 1,549 | (1,090 | ) | ||||||
Accounts payable and accrued expenses | 4,724 | 3,504 | (2,459 | ) | |||||||
Accrued compensation and related benefits | 4,046 | 2,504 | 3,086 | ||||||||
Deferred revenue | 1,527 | 1,661 | 528 | ||||||||
Payments to university clients | (11,322 | ) | (13,239 | ) | 2,234 | ||||||
Other liabilities, net | (6,243 | ) | 4,763 | 4,907 | |||||||
Other | 1,712 | 867 | — | ||||||||
Net cash (used in) provided by operating activities | (3,120 | ) | 8,106 | 5,210 | |||||||
Cash flows from investing activities | |||||||||||
Purchase of a business, net of cash acquired | — | (97,102 | ) | — | |||||||
Purchases of property and equipment | (11,996 | ) | (27,316 | ) | (7,648 | ) | |||||
Additions of amortizable intangible assets | (65,190 | ) | (23,823 | ) | (16,728 | ) | |||||
Purchase of investments | (25,000 | ) | — | — | |||||||
Advances made to university clients | (300 | ) | (1,950 | ) | — | ||||||
Advances repaid by university clients | 25 | 817 | — | ||||||||
Other | — | — | (142 | ) | |||||||
Net cash used in investing activities | (102,461 | ) | (149,374 | ) | (24,518 | ) | |||||
Cash flows from financing activities | |||||||||||
Proceeds from issuance of common stock, net of offering costs | 330,901 | 189,463 | — | ||||||||
Proceeds from exercise of stock options | 7,366 | 6,615 | 4,859 | ||||||||
Proceeds from Employee Stock Purchase Plan share purchases | 3,121 | — | — | ||||||||
Proceeds from debt | — | 3,500 | — | ||||||||
Payments on debt | — | (1,517 | ) | — | |||||||
Tax withholding payments associated with settlement of restricted stock units | (3,451 | ) | (1,309 | ) | (378 | ) | |||||
Payments for acquisition of amortizable intangible assets | (4,900 | ) | — | — | |||||||
Other | — | — | (172 | ) | |||||||
Net cash provided by financing activities | 333,037 | 196,752 | 4,309 | ||||||||
Effect of exchange rate changes on cash | (1,054 | ) | (844 | ) | — | ||||||
Net increase (decrease) in cash and cash equivalents | 226,402 | 54,640 | (14,999 | ) | |||||||
Cash and cash equivalents, beginning of period | 223,370 | 168,730 | 183,729 | ||||||||
Cash and cash equivalents, end of period | $ | 449,772 | $ | 223,370 | $ | 168,730 | |||||
See accompanying notes to consolidated financial statements.
65
2U, Inc.
Notes to Consolidated Financial Statements
1. Organization
2U, Inc. (together with its subsidiaries, the “Company”) is a leading education technology company that well-recognized nonprofit colleges and universities trust to bring them into the digital age. The Company’s comprehensive platform of tightly integrated technology and services provides the digital infrastructure universities need to attract, enroll, educate and support students at scale. With the Company’s platform, students can pursue their education anytime, anywhere, without quitting their jobs or moving; and university clients can improve educational outcomes, skills attainment and career prospects for a greater number of students.
On July 1, 2017, the Company completed its acquisition of all of the outstanding equity interests of Get Educated International Proprietary Limited (“GetSmarter”). As a result of the acquisition of GetSmarter, the Company now manages its operations in two operating segments, which are also its two reportable segments: the Graduate Program Segment and the Short Course Segment.
The Company’s Graduate Program Segment provides services to well-recognized nonprofit colleges and universities, primarily in the United States, to enable the online delivery of graduate programs. The Company’s Short Course Segment provides premium online short courses to working professionals around the world through relationships with leading universities in the United States, the United Kingdom and South Africa. Refer to Note 13 for further information on the Company’s segments.
2. Significant Accounting Policies
Basis of Presentation and Principles of Consolidation
The accompanying consolidated financial statements include the accounts of the Company and its wholly-owned subsidiaries and have been prepared in accordance with United States generally accepted accounting principles (“U.S. GAAP”) and include the assets, liabilities, results of operations and cash flows of the Company. All significant intercompany accounts and transactions have been eliminated in consolidation.
Use of Estimates
The preparation of consolidated financial statements in accordance with U.S. GAAP requires management to make certain estimates and assumptions that affect the amounts reported herein. The Company bases its estimates and assumptions on historical experience and on various other factors that it believes to be reasonable under the circumstances. Due to the inherent uncertainty involved in making estimates, actual results reported in future periods may be affected by changes in those estimates. The Company evaluates its estimates and assumptions on an ongoing basis.
Investments
The Company’s investments within current assets on the consolidated balance sheets relate to certificates of deposit with original maturities between three months and one year. As of December 31, 2018, the Company had a $25.0 million certificate of deposit included in investments that qualifies as a Level 1 fair value measurement asset and was stated at cost, which approximates fair value.
Revenue Recognition, Accounts Receivable and Allowance for Doubtful Accounts
On January 1, 2018, the Company adopted Accounting Standards Update (“ASU”) No. 2014-09, Revenue from Contracts with Customers (Topic 606) and the related amendments using the modified retrospective transition method and has concluded that doing so did not have a material impact on the amount and timing of either its revenue or costs. As part of its assessment, the Company completed reviews of its contracts and evaluated its costs, including costs of obtaining contracts with its university clients and costs associated with content development. Certain of these contract and content costs are capitalized under the new standard. The adoption of ASU 2014-09 did not have a material impact as of January 1, 2018, and no cumulative adjustment was recorded. Further, the amounts reported as of December 31, 2018 on the consolidated balance sheets and the results of operations for the year ended December 31, 2018 reported on the consolidated statements of operations and comprehensive loss would not have been materially different than under legacy U.S. GAAP (i.e., Topic 605).
The Company generates substantially all of its revenue from contractual arrangements, with either its university clients or students, to provide a comprehensive platform of tightly integrated technology and technology-enabled services that support its graduate programs and short courses.
66
2U, Inc.
Notes to Consolidated Financial Statements (Continued)
2. Significant Accounting Policies (Continued)
Performance Obligations
A performance obligation is a promise in a contract to transfer a distinct good or service to the customer. A contract’s transaction price is allocated to each distinct performance obligation and recognized as revenue when, or as, the performance obligation is satisfied.
The Graduate Program Segment derives revenue primarily from contractually specified percentages of the amounts the Company’s university clients receive from their students in 2U-enabled graduate programs for tuition and fees, less credit card fees and other specified charges the Company has agreed to exclude in certain university contracts. The Company’s contracts with university clients in this segment typically have 10 to 15 year initial terms and have a single performance obligation, as the promises to provide a platform of tightly integrated technology and services that university clients need to attract, enroll, educate and support students are not distinct within the context of the contracts. The single performance obligation is delivered as the university clients receive and consume benefits, which occurs ratably over a series of academic terms. The amounts received from university clients over the term of the arrangement are variable in nature in that they are dependent upon the number of students that are enrolled in the program within each academic term. These amounts are allocated to and are recognized ratably over the related academic term, defined as the period beginning on the first day of classes through the last. Revenue is recognized net of an allowance, which is established for the Company’s expected obligation to refund tuition and fees to university clients.
The Short Course Segment derives revenue directly from contracts with students for the tuition and fees paid to enroll in and progress through the Company’s short courses, which run between six and 16 weeks. The Company’s contracts with students in this segment have multiple performance obligations as the delivery of the short course and student support services are each considered distinct performance obligations. These performance obligations are each satisfied ratably over the same short course presentation period, which is defined as the period beginning on the first day of the course through the last. The Company recognizes the gross proceeds received from the students and shares contractually specified percentages with its university clients, for providing short course content and certification, which are recognized as curriculum and teaching costs on the Company’s consolidated statements of operations and comprehensive loss. The Company’s contracts with university clients in this segment are typically shorter and less restrictive than the Company’s contracts with university clients in the Graduate Program Segment.
The Company does not disclose the value of unsatisfied performance obligations for the Graduate Program Segment because the variable consideration is allocated entirely to a wholly unsatisfied promise to transfer a service that forms part of a single performance obligation. The Company does not disclose the value of unsatisfied performance obligations for the Short Course Segment because the performance obligation is part of a contract that has an original duration of less than one year.
Contract Acquisition Costs
The Company pays commissions to certain of its employees to obtain contracts with university clients in the Graduate Program Segment. These costs are capitalized and recorded on a contract-by-contract basis and amortized using the straight-line method over the expected life, which is generally the length of the contract.
With respect to contract acquisition costs in the Short Course Segment, the Company has elected to apply the practical expedient in ASC Topic 606 to expense these costs as incurred, as the terms of contracts with students in this segment are less than one year.
Payments to University Clients
Pursuant to certain of the Company’s contracts in the Graduate Program Segment, the Company has made, or is obligated to make, payments to university clients at either execution of a contract or at the extension of a contract in exchange for various marketing and other rights. Generally, these amounts are capitalized and amortized as contra revenue over the life of the contract, commencing on the later of when payment is due or when contract revenue recognition begins.
Accounts Receivable, Contract Assets and Liabilities
Balance sheet items related to contracts consist of accounts receivable, net and deferred revenue on the Company’s consolidated balance sheets. Included in accounts receivable, net are trade accounts receivable, which are comprised of billed and unbilled revenue. Accounts receivable, net is stated at net realizable value, and the Company utilizes the allowance method to provide for doubtful accounts based on management’s evaluation of the collectability of the amounts due. The Company’s estimates are reviewed and revised periodically based on historical collection experience and a review of the current status of
67
2U, Inc.
Notes to Consolidated Financial Statements (Continued)
2. Significant Accounting Policies (Continued)
accounts receivable, net. Historically, actual write-offs for uncollectible accounts have not significantly differed from prior estimates. The Company recognizes unbilled revenue when revenue recognition occurs in advance of billings. Unbilled revenue is recognized in the Graduate Program Segment because billings to university clients do not occur until after the academic term has commenced and final enrollment information is available. The Company’s unbilled revenue represents contract assets.
Deferred revenue represents the excess of amounts billed or received as compared to amounts recognized in revenue on the consolidated statements of operations and comprehensive loss as of the end of the reporting period, and such amounts are reflected as a current liability on the Company’s consolidated balance sheets. The Company generally receives payments for its share of tuition and fees from graduate program university clients early in each academic term and from short course students, either in full upon registration for the course or in full before the end of the course based on a payment plan, prior to completion of the service period. These payments are recorded as deferred revenue until the services are delivered or until the Company’s obligations are otherwise met, at which time revenue is recognized.
Business Combinations
The purchase price of an acquisition is allocated to the assets acquired, including intangible assets, and liabilities assumed, based on their respective fair values at the acquisition date. Acquisition-related costs are expensed as incurred. The excess of the cost of an acquired entity, net of the amounts assigned to the assets acquired and liabilities assumed, is recognized as goodwill. The net assets and results of operations of an acquired entity are included on the Company’s consolidated financial statements from the acquisition date.
Concentration of Credit Risk
Financial instruments that subject the Company to significant concentrations of credit risk consist primarily of cash and cash equivalents and accounts receivable. All of the Company’s cash is held at financial institutions that management believes to be of high credit quality. The Company’s bank accounts exceed federally insured limits at times. The Company has not experienced any losses on cash to date. The Company maintains an allowance for doubtful accounts, if needed, based on collection history.
Cash and Cash Equivalents
Cash and cash equivalents consist of bank checking accounts, money market accounts, investments in certificates of deposit that have an original maturity of three months or less and highly liquid marketable securities with maturities at the time of purchase of three months or less.
Fair Value Measurements
The carrying amounts of certain assets and liabilities, including cash and cash equivalents, accounts receivable, advances to university clients, accounts payable and accrued expenses and other current liabilities, approximate their respective fair values due to their short-term nature.
Fair value is defined as the price that would be received to sell an asset or paid to transfer a liability in an orderly transaction between market participants at the measurement date, based on the Company’s principal or, in the absence of a principal, most advantageous, market for the specific asset or liability.
U.S. GAAP provides for a three-tier fair value hierarchy to classify and disclose all assets and liabilities measured at fair value on a recurring basis, as well as assets and liabilities measured at fair value on a non-recurring basis, in periods subsequent to their initial measurement. The fair value hierarchy requires the Company to use observable inputs when available, and to minimize the use of unobservable inputs when determining fair value. The three tiers are defined as follows:
• | Level 1—Observable inputs that reflect quoted market prices (unadjusted) for identical assets or liabilities in active markets; |
• | Level 2—Observable inputs, other than quoted prices in active markets, that are observable either directly or indirectly in the marketplace for identical or similar assets and liabilities; and |
• | Level 3—Unobservable inputs that are supported by little or no market data, which require the Company to develop its own assumptions about the assumptions market participants would use in pricing the asset or liability based on the best information available in the circumstances. |
68
2U, Inc.
Notes to Consolidated Financial Statements (Continued)
2. Significant Accounting Policies (Continued)
Advances to University Clients
The Company is contractually obligated to pay advances to certain of its university clients in order to fund start-up expenses of the program on behalf of the university client. Advances to university clients are stated at realizable value. Advances are repaid to the Company on terms as required in the respective agreements. The Company recognizes imputed interest income on these advance payments when the related amount of imputed interest is deemed significant. For the years ended December 31, 2018, 2017 and 2016, the Company did not incur a material amount of imputed interest income.
Long-Lived Assets
Property and Equipment
Property and equipment is stated at cost less accumulated depreciation and amortization. Expenditures for major additions, construction and improvements are capitalized. Depreciation and amortization is expensed using the straight-line method over the estimated useful lives of the related assets, which range from three to five years for computer hardware and five to seven years for furniture and office equipment. Leasehold improvements are depreciated on a straight-line basis over the lesser of the remaining term of the leased facility or the estimated useful life of the improvement, which generally ranges from four to approximately 11 years. Useful lives of significant assets are periodically reviewed and adjusted prospectively to reflect the Company’s current estimates of the respective assets’ expected utility. Repair and maintenance costs are expensed as incurred.
Amortizable Intangible Assets
Acquired Intangible Assets. The Company capitalizes purchased intangible assets, such as software, websites and domains, and amortizes them on a straight-line basis over their estimated useful life. Historically, the Company has assessed the useful lives of these acquired intangible assets to be between three and ten years.
Capitalized Technology. Capitalized technology includes certain purchased software and technology licenses, direct third-party costs, and internal payroll and payroll-related costs used in the creation of our internal-use software. Software development projects generally include three stages: the preliminary project stage (all costs are expensed as incurred), the application development stage (certain costs are capitalized and certain costs are expensed as incurred) and the post-implementation/operation stage (all costs are expensed as incurred). Costs capitalized in the application development stage include costs of designing the application, coding, integrating the Company’s and the university’s networks and systems, and the testing of the software. Capitalization of costs requires judgment in determining when a project has reached the application development stage and the period over which the Company expects to benefit from the use of that software. Once the software is placed in service, these costs are amortized using the straight-line method over the estimated useful life of the software, which is generally three to five years.
Capitalized Content Development. The Company develops content for each offering on a course-by-course basis in conjunction with the faculty for each graduate program and short course. University clients and their faculty generally provide materials used for the course in an on-campus setting, including curricula, case studies and other reading materials, and presentations. The Company is responsible for the conversion of the materials into a format suitable for delivery through its online learning platform, including all expenses associated with this effort. With regard to the Graduate Program Segment, the development of content is part of the Company’s single performance obligation and is considered a contract fulfillment cost.
The content development costs that qualify for capitalization are third-party direct costs, such as videography, editing and other services associated with creating digital content. Additionally, the Company capitalizes internal payroll and payroll-related costs incurred to create and produce videos and other digital content utilized in the university clients’ offerings for delivery via the Company’s online learning platform. Capitalization ends when content has been fully developed by both the Company and the university client, at which time amortization of the capitalized content development costs begins. The capitalized costs for each offering are recorded on a course-by-course basis and included in capitalized content costs in amortizable intangible assets, net on the Company’s consolidated balance sheets. These costs are amortized using the straight-line method over the estimated useful life of the respective course, which is generally four to five years. The estimated useful life corresponds with the planned curriculum refresh rate. This refresh rate is consistent with expected curriculum refresh rates as cited by faculty members for similar on-campus offerings.
Evaluation of Long-Lived Assets
69
2U, Inc.
Notes to Consolidated Financial Statements (Continued)
2. Significant Accounting Policies (Continued)
The Company reviews long-lived assets, which consist of property and equipment, capitalized technology costs, capitalized content development costs and acquired finite-lived intangible assets, for impairment whenever events or changes in circumstances indicate the carrying value of an asset may not be recoverable. In order to assess the recoverability of the capitalized technology and content development costs, the costs are grouped by the lowest level of independent cash flows (i.e., by degree program or short course, for content development costs). Recoverability of a long-lived asset is measured by a comparison of the carrying value of an asset or asset group to the future undiscounted net cash flows expected to be generated by that asset or asset group. If such assets are not recoverable, the impairment to be recognized is measured by the amount by which the carrying value of an asset exceeds the estimated fair value (discounted cash flow) of the asset or asset group. The Company’s impairment analysis is based upon cumulative results and forecasted performance.
Non-Cash Long-Lived Asset Additions
During the year ended December 31, 2018, the Company had capital asset additions of $87.4 million in property and equipment and capitalized technology and content development, of which $5.3 million consisted of non-cash capital expenditures, primarily related to the acquisition of certain long-lived assets for which a liability was accrued. Due to extended payment terms associated with the timing of cash capital expenditures made more than 90 days after the date of purchase, an additional $4.9 million was classified as cash flows from financing activities in the consolidated statement of cash flows for the year ended December 31, 2018.
During the year ended December 31, 2017, the Company had capital asset additions of $62.3 million in property and equipment and capitalized technology and content development, of which $11.2 million consisted of non-cash capital expenditures, primarily related to landlord funded leasehold improvements.
Goodwill
Goodwill is the excess of purchase price over the fair value of identified net assets of the business acquired. The Company’s goodwill balance relates to the acquisition of GetSmarter in 2017. The Company reviews goodwill at least annually, as of October 1. Between annual tests, goodwill is reviewed for possible impairment if an event occurs or circumstances change that would more likely than not reduce the fair value of the reporting unit below its carrying value. The Company tests goodwill at the reporting unit level, which is an operating segment or one level below an operating segment. The Company initially assesses qualitative factors to determine if it is necessary to perform the two-step goodwill impairment review. The Company will review goodwill for impairment using the two-step process if it decides to bypass the qualitative assessment or determines that it is more likely than not that the fair value of a reporting unit is less than its carrying value based on a qualitative assessment. Upon the completion of the two-step process, the Company may be required to recognize an impairment based on the difference between the carrying value and the fair value of the goodwill recorded.
Employee Benefits
The Company offers a variety of benefits to its employees (e.g., healthcare, gym memberships and tuition reimbursement). The Company accounts for costs related to providing employee benefits as incurred, unless there is a service requirement, in which case, such costs are recognized over the service commitment period.
70
2U, Inc.
Notes to Consolidated Financial Statements (Continued)
2. Significant Accounting Policies (Continued)
Government Grants
Government grants awarded to the Company in the form of forgivable loans are recorded as “deferred government grant obligations” within long-term liabilities on the consolidated balance sheets until all contingencies are resolved and the grant is determined to be realized.
Income Taxes
Income taxes are accounted for under the asset and liability method, which requires the recognition of deferred tax assets and liabilities for the expected future tax consequences of events that are included in the financial statements. Under this method, the deferred tax assets and liabilities are determined based on the differences between the financial statement and tax bases of the assets and liabilities using enacted tax rates in effect for the year in which the differences are expected to reverse. The effect of a change in tax rates on the deferred tax assets and liabilities is recognized in earnings in the period when the new rate is enacted. Deferred tax assets are subject to periodic recoverability assessments. Valuation allowances are established, when necessary, to reduce deferred tax assets to the amount that more likely than not will be realized. The Company considers all positive and negative evidence relating to the realization of the deferred tax assets in assessing the need for a valuation allowance. The Company currently maintains a full valuation allowance against deferred tax assets in the U.S. and certain entities in the foreign jurisdictions.
The Company records a liability for unrecognized tax benefits resulting from uncertain tax positions taken or expected to be taken in a tax return. The Company accounts for uncertainty in income taxes using a two-step approach for evaluating tax positions. Step one, recognition, occurs when the Company concludes that a tax position, based solely on its technical merits, is more likely than not to be sustained upon examination. Step two, measurement, determines the amount of benefit that is more likely than not to be realized upon ultimate settlement with a taxing authority that has full knowledge of all relevant information. De-recognition of a tax position that was previously recognized would occur if the Company subsequently determines that a tax position no longer meets the more likely than not threshold of being sustained. The Company recognizes interest and penalties, if any, related to unrecognized tax benefits as income tax expense on the consolidated statements of operations and comprehensive loss.
Marketing and Sales Costs
The majority of the marketing and sales costs incurred by the Company are directly related to acquiring students for its university clients’ graduate programs, with lesser amounts related to acquiring students for its short course and marketing and advertising efforts related to the Company’s own brand. For the years ended December 31, 2018, 2017 and 2016, costs related to the Company’s marketing and advertising efforts of its own brand were not material. All such costs are expensed as incurred and reported in marketing and sales expense on the Company’s consolidated statements of operations and comprehensive loss.
As of December 31, 2018 and 2017, the Company had $10.3 million and $11.7 million, respectively, of accrued marketing costs included in accounts payable and accrued expenses on the Company’s consolidated balance sheets.
Leases
The Company leases all of its office facilities and enters into various other lease agreements in conducting its business. At the inception of each lease, the Company evaluates the lease agreement to determine whether the lease is an operating or capital lease. Additionally, many of the Company’s lease agreements contain renewal options, tenant improvement allowances, rent holiday and/or rent escalation clauses. The Company defers tenant improvement allowances and amortizes such balances as a reduction of rent expense over the term of the lease. When rent holidays or rent escalations are included in a lease agreement, the Company records a deferred rent asset or liability on the consolidated financial statements, and records these items in rent expense evenly over the term of the lease.
The Company is also required to make additional payments under operating lease terms for taxes, insurance and other operating expenses incurred during the operating lease period; such items are expensed as incurred. Rental deposits are included as other assets on the consolidated financial statements for lease agreements that require payments in advance or deposits held for security that are refundable, less any damages, at the end of the respective lease.
Stock-Based Compensation
The Company accounts for stock-based compensation awards based on the fair value of the award as of the grant date. For awards subject to service-based vesting conditions, the Company recognizes stock-based compensation expense on a
71
2U, Inc.
Notes to Consolidated Financial Statements (Continued)
2. Significant Accounting Policies (Continued)
straight-line basis over the awards’ requisite service period. Effective April 1, 2017, expected volatility is based on the historical volatilities of the Company’s common stock. Prior to January 1, 2017, the Company adjusted stock-based compensation expense for estimated forfeitures of stock-based awards. As described in the “Recent Accounting Pronouncements” section of this Note, beginning on January 1, 2017, the Company accounts for forfeitures (and the impact on stock-based compensation expense) as they occur. For awards subject to both performance and service-based vesting conditions, the Company recognizes stock-based compensation expense using an accelerated recognition method when it is probable that the performance condition will be achieved.
Foreign Currency Translation
For the portion of the Company’s non-U.S. business where the local currency is the functional currency, operating results are translated into U.S. dollars using the average rate of exchange for the period, and assets and liabilities are converted at the closing rates on the period end date. Gains and losses on translation of these accounts are accumulated and reported as a separate component of stockholder’s equity and comprehensive loss.
For any transaction that is in a currency different from the entity’s functional currency, the Company records a gain or loss based on the difference between the exchange rate at the transaction date and the exchange rate at the transaction settlement date (or rate at period end, if unsettled) as other income (expense), net on the consolidated statements of operations and comprehensive loss.
Recent Accounting Pronouncements
In August 2018, the Financial Accounting Standards Board (“FASB”) issued ASU No. 2018-15, Intangibles—Goodwill and Other—Internal-Use Software (Subtopic 350-40): Customer’s Accounting for Implementation Costs Incurred in a Cloud Computing Arrangement That Is a Service Contract, which requires customers in cloud computing arrangements that are service contracts to follow the internal-use software guidance in ASC 350-40 to determine which implementation costs to capitalize as assets or expense as incurred. The amendments in this ASU are effective for fiscal years beginning after December 15, 2019, with early adoption permitted. The Company adopted this ASU as of July 1, 2018 under the prospective method. During the six months ended December 31, 2018 since the adoption of this ASU, the Company capitalized $0.4 million of implementation costs incurred in its cloud computing arrangements that are service contracts.
In July 2018, the FASB issued ASU No. 2018-09, Codification Improvements, which clarifies and corrects unintended applications of guidance, and makes improvements to several Accounting Standards Codification topics. The applicable amendments in this ASU will be effective for the Company in annual periods beginning after December 15, 2018. The Company does not expect the adoption of this standard to have a material impact on its consolidated financial statements and related disclosures.
In June 2018, the FASB issued ASU No. 2018-07, Compensation—Stock Compensation (Topic 718): Improvements to Nonemployee Share-Based Payment Accounting, which simplifies the accounting for share-based payments to nonemployees. The amendments in this ASU are effective for fiscal years beginning after December 15, 2018, with early adoption permitted. The Company does not expect the adoption of this standard to have a material impact on its consolidated financial statements and related disclosures.
In January 2017, the FASB issued ASU No. 2017-04, Intangibles—Goodwill and Other (Topic 350): Simplifying the Test for Goodwill Impairment, which eliminates step two from the goodwill impairment test and requires an entity to recognize an impairment charge for the amount by which the carrying amount of a reporting unit exceeds its fair value, up to the amount of goodwill allocated to that reporting unit. The amendments in this ASU are effective for fiscal years beginning after December 15, 2019, with early adoption permitted. The Company expects that the adoption of this standard will impact its consolidated financial statements and related disclosures only to the extent that a future goodwill impairment test results in the recognition of an impairment charge.
In August 2016, the FASB issued ASU No. 2016-15, Statement of Cash Flows (Topic 230): Classification of Certain Cash Receipts and Cash Payments. The ASU addresses eight specific cash flow issues with the objective of reducing the existing diversity in practice surrounding how certain transactions are classified in the statement of cash flows. The amendments in this ASU were effective for fiscal years beginning after December 15, 2017. The Company adopted this ASU on January 1, 2018. Adoption of this standard did not have a material impact on the Company’s consolidated statements of cash flows and related disclosures.
72
2U, Inc.
Notes to Consolidated Financial Statements (Continued)
2. Significant Accounting Policies (Continued)
In March 2016, the FASB issued ASU No. 2016-09, Compensation—Stock Compensation (Topic 718): Improvements to Employee Share-Based Payment Accounting. The ASU simplifies various aspects related to the accounting and presentation of share-based payments. The guidance also allows employers to withhold shares to satisfy minimum statutory withholding requirements up to the employees’ maximum individual tax rate without causing the award to be classified as a liability. Additionally, the guidance stipulates that cash paid by an employer to a taxing authority when directly withholding shares for tax withholding purposes should be classified as a financing activity on the statement of cash flows, and allows companies to elect an accounting policy to either estimate the share-based award forfeitures (and expense) or account for forfeitures (and expense) as they occur. The amendments in this ASU are effective for fiscal years beginning after December 15, 2016. The Company adopted this ASU on January 1, 2017. In connection with the adoption of this standard, the Company elected to no longer apply an estimated forfeiture rate and will instead account for forfeitures as they occur. Accordingly, the Company applied the modified retrospective adoption approach, which resulted in a $0.1 million cumulative-effect reduction to retained earnings with an offset to additional paid-in-capital.
In February 2016, the FASB issued ASU No. 2016-02, Leases (Topic 842). The ASU introduces a model for lessees requiring most leases to be reported on the balance sheet. The amendments in this ASU are effective for fiscal years beginning after December 15, 2018, and the Company will adopt this ASU in the first quarter of 2019. In July 2018, the FASB issued ASU No. 2018-10, Codification Improvements to Topic 842, Leases and ASU No. 2018-11, Leases (Topic 842): Targeted Improvements. ASU No. 2018-10 clarifies ambiguous or potentially conflicting guidance in ASU No. 2016-02, but is not expected to have a material impact on the Company. ASU No. 2018-11 provides entities with an additional transition method to adopt Topic 842. Under the new transition method, an entity initially applies the new lease standard at the adoption date, rather than at the beginning of the earliest period presented, and recognizes a cumulative effect adjustment to the opening balance of retained earnings in the period of adoption. The Company has elected this transition method upon the adoption date of January 1, 2019. In December 2018, the FASB issued ASU No. 2018-20, Leases (Topic 842): Narrow-Scope Improvements for Lessors, to add clarity to lessor accounting for sales taxes, certain lessor costs and certain requirements related to variable payments in contracts. ASU No. 2018-20 is not expected to have a material impact on the Company.
A number of optional practical expedients may be applied in transition. The Company does not intend to recognize right-of-use assets or lease liabilities for leases with a term of 12 months or less, as permitted by the short-term lease practical expedient. In transition, the Company plans to apply the package of practical expedients that permit entities to not reassess (i) whether expired or existing contracts contain a lease under the new standard, (ii) the lease classification for expired or existing leases, or (iii) whether previously capitalized initial direct costs would qualify for capitalization under the new standard. The Company plans to apply the practical expedient that permits a lessee to account for lease and non-lease components in a contract as a single lease component. In addition, the Company does not intend to use hindsight during transition.
The Company is currently evaluating the effect that this ASU will have on its consolidated financial statements and related disclosures and is in the process of considering changes to its systems and processes. Upon adoption, the Company expects to record right-of-use assets of approximately $33 million, which have been adjusted for accrued rent, and the remaining balance of any lease incentives upon transition, and corresponding lease liabilities of approximately $58 million on the consolidated balance sheets for its operating leases. This ASU is not expected to have a material impact on the consolidated statements of operations and comprehensive loss or the consolidated statements of cash flows.
3. Business Combination
On July 1, 2017, the Company, through a wholly owned subsidiary (“2U South Africa”), completed its acquisition of all of the outstanding equity interests of Get Educated International Proprietary Limited (“GetSmarter”) pursuant to a Share Sale Agreement, dated as of May 1, 2017 (the “Share Sale Agreement”), as amended by an addendum, dated as of June 29, 2017, for a net purchase price of $98.7 million in cash. In addition, 2U South Africa agreed to pay a potential earn out payment of up to $20.0 million, subject to the achievement of certain financial milestones in calendar years 2017 and 2018. As of December 31, 2018, the financial milestones were not met and no earn out payment was due. The valuation of the assets acquired and liabilities assumed (i.e., purchase price allocation) was completed as of December 31, 2017.
The Company has completed its valuation of the assets acquired and liabilities assumed of GetSmarter. The following table summarizes the estimated fair values of the assets acquired and liabilities assumed as of the date of the acquisition:
73
2U, Inc.
Notes to Consolidated Financial Statements (Continued)
3. Business Combination (continued)
Estimated Average Useful Life (in years) | Purchase Price Allocation | ||||
(in thousands) | |||||
Cash and cash equivalents | $ | 1,584 | |||
Current assets | 3,676 | ||||
Property and equipment, net | 479 | ||||
Amortizable intangible assets: | |||||
Capitalized technology | 3 | 2,800 | |||
Capitalized content development | 4 | 5,000 | |||
University client relationships | 9 | 28,000 | |||
Trade names and domain names | 10 | 8,900 | |||
Goodwill | 68,172 | ||||
Current liabilities | (9,031 | ) | |||
Non-current liabilities | (10,894 | ) | |||
$ | 98,686 | ||||
The unaudited pro forma combined financial information below is presented for illustrative purposes and does not purport to represent what the results of operations would actually have been if the business combination occurred as of the date indicated or what the results would be for any future periods. The following table presents the Company’s unaudited pro forma combined revenue, pro forma combined net loss and pro forma combined net loss per share for the year ended December 31, 2017 as if the acquisition of GetSmarter had occurred on January 1, 2017:
Year Ended Year Ended December 31, 2017 | ||||
(in thousands, except per share amounts) | ||||
Pro forma revenue | $ | 294,446 | ||
Pro forma net loss | (37,267 | ) | ||
Pro forma net loss per share, basic and diluted | $ | (0.76 | ) | |
4. Property and Equipment, Net
Property and equipment, net consisted of the following as of:
December 31, 2018 | December 31, 2017 | ||||||
(in thousands) | |||||||
Computer hardware | $ | 5,114 | $ | 2,663 | |||
Furniture and office equipment | 14,888 | 11,210 | |||||
Leasehold improvements | 45,158 | 42,086 | |||||
Leasehold improvements in process | 1,940 | 194 | |||||
Total | 67,100 | 56,153 | |||||
Accumulated depreciation and amortization | (14,801 | ) | (7,098 | ) | |||
Property and equipment, net | $ | 52,299 | $ | 49,055 | |||
Depreciation expense of property and equipment was $8.9 million, $5.5 million and $1.7 million for the years ended December 31, 2018, 2017 and 2016, respectively.
74
2U, Inc.
Notes to Consolidated Financial Statements (Continued)
5. Goodwill and Amortizable Intangible Assets (continued)
5. Goodwill and Amortizable Intangible Assets
The table below summarizes the changes in the carrying amount of goodwill by reportable segment:
Graduate Program Segment | Short Course Segment | Total | |||||||||
(in thousands) | |||||||||||
Balance as of December 31, 2016 | $ | — | $ | — | $ | — | |||||
Acquisition of GetSmarter | — | 68,172 | 68,172 | ||||||||
Foreign currency translation adjustments | — | 3,816 | 3,816 | ||||||||
Balance as of December 31, 2017 | — | 71,988 | 71,988 | ||||||||
Foreign currency translation adjustments | — | (10,136 | ) | (10,136 | ) | ||||||
Balance as of December 31, 2018 | $ | — | $ | 61,852 | $ | 61,852 | |||||
Amortizable intangible assets consisted of the following as of:
December 31, 2018 | December 31, 2017 | ||||||||||||||||||||||||
Estimated Average Useful Life (in years) | Gross Carrying Amount | Accumulated Amortization | Net Carrying Amount | Gross Carrying Amount | Accumulated Amortization | Net Carrying Amount | |||||||||||||||||||
(in thousands) | |||||||||||||||||||||||||
Capitalized technology | 3-5 | $ | 68,291 | $ | (16,945 | ) | $ | 51,346 | $ | 27,108 | $ | (9,486 | ) | $ | 17,622 | ||||||||||
Capitalized content development | 4-5 | 79,725 | (31,662 | ) | 48,063 | 55,872 | (21,417 | ) | 34,455 | ||||||||||||||||
University client relationships | 9 | 25,616 | (4,269 | ) | 21,347 | 29,443 | (1,636 | ) | 27,807 | ||||||||||||||||
Trade names and domain names | 8-10 | 18,793 | (2,944 | ) | 15,849 | 12,119 | (1,242 | ) | 10,877 | ||||||||||||||||
Total amortizable intangible assets, net | $ | 192,425 | $ | (55,820 | ) | $ | 136,605 | $ | 124,542 | $ | (33,781 | ) | $ | 90,761 | |||||||||||
The amounts presented above include $40.3 million and $15.6 million of in process capitalized technology and content development as of December 31, 2018 and December 31, 2017, respectively.
During 2018, the Company acquired certain third-party technologies to enhance the Company’s platform, which is referred to as the 2U Operating System, or 2UOS, for aggregate consideration of $9.5 million. These amounts are classified as capitalized technology within amortizable intangible assets, net, on the Company’s consolidated balance sheets. Additionally, during the same period the Company purchased several active websites and additional domains for consideration of $7.6 million to support the marketing efforts of certain graduate programs. As of December 31, 2018, these acquired assets are classified in trade names and domain names within amortizable intangible assets, net, on the Company’s consolidated balance sheets.
In the first quarter of 2018, the Company entered into an agreement with WeWork Companies, Inc. (“WeWork”) and Flatiron School, Inc., a wholly owned subsidiary of WeWork, to purchase a perpetual source code license for the Learn.co platform and certain integration software development services for $14.5 million. As of December 31, 2018, the Company has recorded capitalized technology of $13.2 million related to this agreement in amortizable intangible assets, net on the Company’s consolidated balance sheets. The remaining $1.3 million is payable under the agreement in connection with the performance of certain software development services. In addition, the Company entered into a multi-year agreement to purchase Global Access Memberships to WeWork spaces around the world that will be provided to students in 2U-powered online graduate programs as well as to faculty and lead convenors of its offerings, an agreement to offer $5 million in scholarships to certain WeWork community members and employees, and collaborate on additional mutually agreed upon projects.
75
The Company recorded amortization expense related to amortizable intangible assets of $23.9 million, $14.0 million and $8.0 million for the years ended December 31, 2018, 2017 and 2016, respectively. As of December 31, 2018, the estimated future amortization expense for amortizable intangible assets placed in service is as follows (in thousands):
2019 | $ | 25,244 | |
2020 | 21,814 | ||
2021 | 16,420 | ||
2022 | 12,405 | ||
2023 | 7,690 | ||
Thereafter | 12,730 | ||
Total | $ | 96,303 | |
6. Commitments and Contingencies
Legal Contingencies
From time to time, the Company may become involved in legal proceedings or be subject to claims (e.g., related to regulatory, employment or indirect tax matters) in the ordinary course of its business. The Company is not presently involved in any legal proceeding or other contingency that, if determined adversely to it, would individually or in the aggregate have a material adverse effect on its business, operating results, financial condition or cash flows. Accordingly, the Company does not believe that there is a reasonable possibility that a material loss exceeding amounts already recognized may have been incurred as of the date of the balance sheets presented herein.
Marketing and Sales Commitments
Certain of the agreements entered into between the Company and its university clients in the Graduate Program Segment require the Company to commit to meet certain staffing and spending investment thresholds related to marketing and sales activities. In addition, certain of the agreements in the Graduate Program Segment require the Company to invest up to agreed upon levels in marketing the programs to achieve specified program performance. The Company believes it is currently in compliance with all such commitments.
Future Minimum Payments to University Clients
Pursuant to certain of the Company’s contracts in the Graduate Program Segment, the Company has made, or is obligated to make, payments to university clients in exchange for contract extensions and various marketing and other rights. As of December 31, 2018, the future minimum payments due to university clients were as follows (in thousands):
2019 | $ | 10,125 | |
2020 | 625 | ||
2021 | 625 | ||
2022 | 625 | ||
2023 | 625 | ||
Thereafter | 3,775 | ||
Total future minimum payments to university clients | $ | 16,400 | |
Contingent Payments
The Company has entered into an agreement with one university client in the Graduate Program Segment under which the Company would be obligated to make future minimum payments in the event that certain program metrics are not achieved. Due to the dependency of these calculations on future program performance, the timing and amounts of any associated contingent payments cannot be reasonably estimated at this time, and have therefore been excluded from the table above.
76
7. Leases
The Company leases office facilities under non-cancelable operating leases in Maryland, New York, California, Colorado, North Carolina, Virginia, Hong Kong, South Africa and the United Kingdom. The Company also leases office equipment under non-cancelable leases. As of December 31, 2018, the future minimum lease payments were as follows (in thousands):
2019 | $ | 12,941 | |
2020 | 14,020 | ||
2021 | 13,900 | ||
2022 | 13,633 | ||
2023 | 13,959 | ||
Thereafter | 68,347 | ||
Total future minimum lease payments | $ | 136,800 | |
The future minimum lease payments due under non-cancelable operating lease arrangements contain fixed rent increases over the term of the lease. Rent expense on these operating leases is recognized over the term of the lease on a straight-line basis. The excess of rent expense over actual lease payments is reported in non-current liabilities on the accompanying consolidated balance sheets. The deferred rent liability related to these leases totaled $8.9 million and $6.5 million as of December 31, 2018 and 2017, respectively. The Company does not have any subleases as of December 31, 2018.
Total rent expense from non-cancelable operating lease agreements (net of sublease income of zero, zero and $0.3 million) was $9.3 million, $8.5 million and $5.8 million for the years ended December 31, 2018, 2017 and 2016, respectively.
8. Debt
Lines of Credit
On December 31, 2013, the Company entered into a credit agreement with Comerica Bank (“Comerica”) for a revolving line of credit with an aggregate commitment not to exceed $37.0 million. On December 31, 2015, the Company amended this credit agreement to reduce the aggregate amount it may borrow to $25.0 million. In June 2017, the Company and Comerica amended this credit agreement pursuant to which, among other things, Comerica consented to the Company’s acquisition of GetSmarter and the Company’s formation of certain subsidiaries in connection therewith. On December 31, 2018, the Company amended this credit agreement to extend the maturity date through March 31, 2019. No amounts were outstanding under this credit agreement as of December 31, 2018 or 2017. The Company intends to extend this agreement under comparable terms, prior to expiration.
Under this revolving line of credit, the Company has the option of borrowing funds subject to (i) a base rate, which is equal to 1.5% plus the greater of Comerica’s prime rate, the federal funds rate plus 1% or the 30-day LIBOR plus 1%, or (ii) LIBOR plus 2.5%. For amounts borrowed under the base rate, the Company may make interest-only payments quarterly, and may prepay such amounts with no penalty. For amounts borrowed under LIBOR, the Company makes interest-only payments in periods of one, two and three months and will be subject to a prepayment penalty if such borrowed amounts are repaid before the end of the interest period.
Borrowings under the line of credit are collateralized by substantially all of the Company’s assets. The availability of borrowings under this credit line is subject to compliance with reporting and financial covenants, including, among other things, that the Company achieves specified minimum three-month trailing revenue levels during the term of the agreement and specified minimum six-month trailing profitability levels for some university client programs, measured quarterly. In addition, the Company is required to maintain a minimum adjusted quick ratio, which measures short-term liquidity, of at least 1.10 to 1.00. As of December 31, 2018 and 2017, the Company’s adjusted quick ratio was 12.38 and 5.44, respectively.
The covenants under the line of credit also place limitations on the Company’s ability to incur additional indebtedness or to prepay permitted indebtedness, grant liens on or security interests in its assets, carry out mergers and acquisitions, dispose of assets, declare, make or pay dividends, make capital expenditures in excess of specified amounts, make investments, loans or advances, enter into transactions with affiliates, amend or modify the terms of material contracts, or change its fiscal year. If the Company is not in compliance with the covenants under the line of credit, after any opportunity to cure such non-compliance, or it otherwise experiences an event of default under the line of credit, the lenders may require repayment in full of all principal
77
and interest outstanding. The Company is currently in compliance with all such covenants.
Certain of the Company’s operating lease agreements require security deposits in the form of cash or an unconditional, irrevocable letter of credit. As of December 31, 2018, the Company has entered into standby letters of credit totaling $11.5 million as security deposits for the applicable leased facilities. Additionally, in June 2017, the Company entered into standby letters of credit totaling $3.5 million in connection with two government grants, as described later in this Note. These letters of credit reduced the aggregate amount the Company may borrow under its revolving line of credit to $10.0 million.
The Company’s Short Course Segment had $1.9 million of revolving debt facilities bearing interest at a rate of 10.25%, with an original maturity date of December 31, 2017. These facilities were extended with a borrowing base of $1.3 million and matured on March 31, 2018. As of December 31, 2018, there were no amounts outstanding under these facilities.
Government Grants
On June 22, 2017, the Company executed a conditional loan agreement and received financing from Prince George’s County, Maryland that provides for a grant in the form of a forgivable loan of $1.5 million. The financing was secured by a letter of credit pursuant to the Company’s line of credit with Comerica. The conditional loan obligation is recorded as “deferred government grant obligations” on the consolidated balance sheets. The proceeds from this loan are to be used in connection with the relocation of 2U’s headquarters, leasehold improvements thereto and other purposes. The loan has a maturity date of June 22, 2027, and bears interest at a rate of 3% per annum. If 2U does not employ at least 650 employees at its Lanham headquarters at any time during the term of the loan period or otherwise defaults on the loan, the entire principal balance, plus accrued interest, will become due and payable. If 2U does not employ at least 1,300 employees at its Lanham headquarters by January 1, 2020, the Company will be required to repay a prorated portion of the loan ($2,252 per employee, for every employee below 1,300), plus interest. During the year ended December 31, 2018, the Company did not incur a material amount of interest expense on this forgivable loan.
On June 27, 2017, 2U Harkins Road LLC (a wholly owned subsidiary of the Company) executed a loan agreement and received financing from the Department of Commerce (a principal department of the State of Maryland) that provides for a grant in the form of a forgivable loan of $2.0 million. The financing was secured by a letter of credit pursuant to the Company’s line of credit with Comerica. The conditional loan obligation is recorded as “deferred government grant obligations” on the consolidated balance sheets. The proceeds from this loan are to be used in connection with the relocation of 2U’s headquarters, leasehold improvements thereto and other purposes. The loan has a maturity date of December 31, 2026, and bears interest at a rate of 3% per annum. If 2U does not employ at least 650 employees at its Lanham headquarters at any time during the term of the loan period or otherwise defaults on the loan, the entire principal balance, plus accrued interest, will become due and payable. If 2U does not employ at least 1,600 employees at its Lanham headquarters by December 31, 2020, and at each December 31 thereafter through 2026, the Company will be required to repay a prorated portion of the loan ($2,105 per employee, for every employee below 1,600), plus interest. During the year ended December 31, 2018, the Company did not incur a material amount of interest expense on this forgivable loan.
9. Income Taxes
The following table presents the components of loss before income taxes:
Year Ended December 31, | |||||||||||
2018 | 2017 | 2016 | |||||||||
(in thousands) | |||||||||||
Loss before income taxes: | |||||||||||
United States | $ | (33,339 | ) | $ | (25,002 | ) | $ | (20,684 | ) | ||
Foreign | (9,858 | ) | (5,718 | ) | — | ||||||
Total | $ | (43,197 | ) | $ | (30,720 | ) | $ | (20,684 | ) | ||
For the year ended December 31, 2018, the Company had a tax benefit of $4.9 million, which was solely related to a deferred tax benefit. For the year ended December 31, 2017, the Company had a tax benefit of $1.3 million, which was solely related to a deferred tax benefit. For the year ended December 31, 2016, the Company did not have a current or deferred tax provision or benefit.
78
2U, Inc.
Notes to Consolidated Financial Statements (Continued)
9. Income Taxes (Continued)
A reconciliation between the Company’s statutory federal income tax rate and the effective tax rate is presented below:
Year Ended December 31, | ||||||||
2018 | 2017 | 2016 | ||||||
U.S. statutory federal income tax rate | 21.0 | % | 35.0 | % | 35.0 | % | ||
Increase (decrease) resulting from: | ||||||||
U.S. state income taxes, net of federal benefits | 0.9 | 9.9 | 5.5 | |||||
Foreign tax rate differential | 1.1 | (1.4 | ) | — | ||||
Non-deductible expenses | (2.6 | ) | (1.8 | ) | (1.5 | ) | ||
Stock-based compensation | 30.0 | 40.9 | (2.9 | ) | ||||
Change in valuation allowance | (39.3 | ) | 29.8 | (36.6 | ) | |||
Change in tax rate | (0.1 | ) | (108.0 | ) | — | |||
Other | 0.3 | (0.2 | ) | 0.5 | ||||
Effective tax rate | 11.3 | % | 4.2 | % | 0.0 | % | ||
The significant components of the Company’s deferred tax assets and liabilities are as follows:
As of December 31, | |||||||
2018 | 2017 | ||||||
(in thousands) | |||||||
Deferred tax assets: | |||||||
Accrued expenses and other | $ | 2,580 | $ | 2,395 | |||
Accrued compensation and related benefits | 3,395 | 3,524 | |||||
Rebate reserve | 5 | 20 | |||||
Deferred rent | 6,388 | 6,924 | |||||
Stock-based compensation | 8,279 | 6,874 | |||||
Deferred income | 257 | 191 | |||||
Foreign net operating loss carryforwards | 1,543 | 1,704 | |||||
U.S. net operating loss carryforwards | 96,809 | 69,425 | |||||
Valuation allowance | (88,061 | ) | (71,101 | ) | |||
Total deferred tax assets | $ | 31,195 | $ | 19,956 | |||
Deferred tax liabilities: | |||||||
Prepaid expenses and other | $ | (95 | ) | $ | (355 | ) | |
Capitalized content development costs | (11,866 | ) | (8,600 | ) | |||
Capitalized software development costs | (13,388 | ) | (4,356 | ) | |||
Property and equipment | (4,038 | ) | (4,720 | ) | |||
Intangibles | (8,757 | ) | (12,012 | ) | |||
Total deferred tax liabilities | $ | (38,144 | ) | $ | (30,043 | ) | |
Net deferred tax liabilities | $ | (6,949 | ) | $ | (10,087 | ) | |
As of December 31, 2018, the Company had a U.S. net operating loss (“NOL”) carryforward of approximately $373.5 million, of which $254.5 million expires between 2029 and 2037. The Company generated $119.0 million of U.S. NOLs for the year ended December 31, 2018. In accordance with the Tax Cuts and Jobs Act of 2017 (the “Tax Act”), U.S. NOLs arising in a tax year ending after 2017 will not expire. The gross amount of the state NOL carryforwards is equal to or less than the federal NOL carryforwards and expires over various periods based on individual state tax laws. The Company also had an NOL carryforward of $5.8 million in its foreign jurisdictions, which does not expire. A full valuation allowance has been established to offset its net deferred tax assets in the U.S., and certain foreign jurisdictions as the Company has not generated taxable income since inception and does not have sufficient deferred tax liabilities to recover the deferred tax assets in these jurisdictions. The total increase in the valuation allowance was $17.0 million for the year ended December 31, 2018. The utilization of the NOL carryforwards to reduce future income taxes will depend on the Company’s ability to generate sufficient taxable income prior to the expiration of the NOL carryforwards. Under the provisions of Internal Revenue Code Section 382, certain substantial changes in the Company’s ownership may result in a limitation on the amount of U.S. net operating loss carryforwards that could be utilized annually to offset future taxable income and taxes payable. The Company does not expect such limitation, if any, to impact the use of the net operating losses prior to their expiration.
79
2U, Inc.
Notes to Consolidated Financial Statements (Continued)
9. Income Taxes (Continued)
As of December 31, 2018 and 2017, the Company has not recognized any amounts for uncertain tax positions.
The Company has analyzed its filing positions in all significant federal, state and foreign jurisdictions where it is required to file income tax returns, as well as open tax years in these jurisdictions. With few exceptions, the Company is no longer subject to U.S. federal, state and local tax examinations by tax authorities for the years prior to 2015, though the NOL carryforwards can be adjusted upon audit and could impact taxes owed in open tax years. No income tax returns are currently under examination by the taxing authorities.
On December 22, 2017, the Tax Act was enacted into law and contains certain key tax provisions that affect the Company. The Tax Act affects the Company by (i) reducing the U.S. tax rate to 21%, effective January 1, 2018, (ii) impacting the values of the Company’s deferred assets and liabilities, (iii) changing the Company’s ability to utilize future net operating losses and (iv) requiring a one-time tax on any of the Company’s unrepatriated foreign earnings and profits (“E&P”) in 2017.
Pursuant to U.S. GAAP, changes in tax rates and tax laws are accounted for in the period of enactment, and the resulting effects are included as components of the income tax provision related to continuing operations within the same period. Therefore, the following changes in the tax laws were accounted for in 2017. The Company’s deferred tax assets and liabilities and offsetting valuation allowance have been remeasured at the new enacted tax rate as of December 31, 2017. The amount of U.S. net operating losses that the Company has available as of December 31, 2017 and the Company’s ability to utilize them to reduce future taxable income is not impacted by the Tax Act. However, the Tax Act may impact the amount and ability to utilize net operating losses generated by the Company in the future. Additionally, the Company had negative cumulative foreign earnings and profits as of December 31, 2017, and therefore, did not incur any transition tax in 2017.
The Company was required to recognize the effect of the tax law changes in the period of enactment, such as re-measuring its U.S. deferred tax assets and liabilities, as well as reassessing the net realizability of deferred tax assets and liabilities. In December 2017, the SEC issued Staff Accounting Bulletin No. 118, Income Tax Accounting Implications of the Tax Cuts and Jobs Act (“SAB 118”), which allowed entities to record provisional amounts during a measurement period not to extend beyond one year from the enactment date. The Company considered its E&P and other items to be provisional and has since completed its analysis within the measurement period in accordance with SAB 118. The Company recorded no adjustment to the income tax benefit (expense) on the Company’s consolidated statements of operations during the re-measurement period and finalized its E&P position, which resulted in no transition tax due, as originally estimated.
The Tax Act includes Global Intangible Low-Taxed Income (“GILTI”) provisions that require a company to include in its U.S. income tax return foreign subsidiary earnings in excess of an allowable return on the foreign subsidiary’s tangible assets. Due to foreign subsidiary losses, this provision does not apply to the Company in 2018. Another significant section of the Tax Act, the Base Erosion Anti-Abuse Tax (“BEAT”), will not apply to the Company’s 2018 tax year as the Company does not meet the minimum revenue requirements under the BEAT. As these taxes may become applicable in the future, the Company will continue to monitor the potential impact.
10. Stockholders’ Equity
On May 22, 2018, the Company sold 3,833,334 shares of its common stock to the public, including 500,000 shares sold pursuant to the underwriters’ over-allotment option, and received net proceeds of $330.9 million. On September 11, 2017, the Company sold 4,047,500 shares of its common stock to the public, including 547,500 shares sold pursuant to the underwriters’ over-allotment option, and received net proceeds of $189.5 million. The Company intends to use the net proceeds from both of these public offerings of common stock for working capital and other general corporate purposes, including expenditures for graduate program and short course marketing, technology and content development, in connection with new graduate program and short course launches and growing existing graduate programs and short courses, as well as strategic acquisitions of, or investments in, complementary products, technologies, solutions or businesses.
As of December 31, 2018, the Company was authorized to issue 205,000,000 total shares of capital stock, consisting of 200,000,000 shares of common stock and 5,000,000 shares of preferred stock. As of December 31, 2018, the Company had reserved a total of 12,352,406 of its authorized shares of common stock for future issuance as follows:
80
2U, Inc.
Notes to Consolidated Financial Statements (Continued)
10. Stockholders' Equity (continued)
Outstanding stock options | 4,057,788 | |
Outstanding restricted stock units | 1,139,045 | |
Available for future issuance under Amended and Restated 2014 Equity Incentive Plan | 6,219,244 | |
Available for future issuance under 2017 Employee Stock Purchase Plan | 936,329 | |
Total shares of common stock reserved for future issuance | 12,352,406 | |
11. Stock-Based Compensation
The Company provides equity-based compensation awards to employees, independent contractors and directors as an effective means for attracting, retaining and motivating such individuals. The Company maintains two share-based compensation plans: the Amended and Restated 2014 Equity Incentive Plan (the “2014 Plan”) and the 2008 Stock Incentive Plan (the “2008 Plan”). Upon the effective date of the 2014 Plan in January 2014, the Company ceased using the 2008 Plan to grant new equity awards, and began using the 2014 Plan for grants of new equity awards.
2014 Plan
In February 2014, the Company’s stockholders approved the 2014 Plan. The 2014 Plan provides for the grant of incentive stock options to the Company’s employees and its parent and subsidiary corporations’ employees, and for the grant of nonstatutory stock options, restricted stock awards, restricted stock unit awards, stock appreciation rights, performance stock awards and other forms of stock compensation to the Company’s employees, consultants and directors. The 2014 Plan also provides for the grant of performance-based cash awards to the Company’s employees, consultants and directors.
A total of 2,800,000 shares of the Company’s common stock were initially reserved for issuance pursuant to the 2014 Plan. In addition, the shares reserved for issuance under the 2014 Plan include (a) those shares reserved but unissued under the 2008 Plan, and (b) shares returned to the 2008 Plan as the result of expiration or termination of awards (provided that the maximum number of shares that may be added to the 2014 Plan pursuant to (a) and (b) is 5,943,348 shares). The number of shares of the Company’s common stock that may be issued under the 2014 Plan will automatically increase on January 1st of each year, for a period of ten years, from January 1, 2015 continuing through January 1, 2024, by 5% of the total number of shares of the Company’s common stock outstanding on December 31st of the preceding calendar year, or a lesser number of shares as may be determined by the Company’s board of directors. The shares available for issuance increased by 2,896,365 and 2,625,292 on January 1, 2019 and 2018, respectively, pursuant to the automatic share reserve increase provision under the 2014 Plan.
In addition, shares subject to outstanding stock awards granted under the 2008 Plan and 2014 Plan that (i) expire or terminate for any reason prior to exercise or settlement; (ii) are forfeited because of the failure to meet a contingency or condition required to vest such shares or otherwise return to the Company; or (iii) are reacquired or withheld (or not issued) to satisfy a tax withholding obligation in connection with an award or to satisfy the purchase price or exercise price of a stock award, return to the 2014 Plan’s share reserve and become available for future grant under the 2014 Plan, up to the maximum number of shares of 5,943,348.
As of December 31, 2018, the Company had 6,219,244 shares reserved for issuance under the 2014 Plan. Further, as of December 31, 2018, under the 2014 Plan, options to purchase 2,687,726 shares of the Company’s common stock were outstanding at a weighted-average exercise price of $38.58 per share and 1,139,045 restricted stock units were outstanding.
2008 Plan
In October 2008, the Company’s stockholders approved the Company’s 2008 Plan. The 2008 Plan was most recently amended on May 8, 2013. The 2008 Plan provided for the grant of incentive stock options to the Company’s employees and the employees of the Company’s subsidiaries, and for the grant of nonstatutory stock options, restricted stock awards and deferred stock awards to the Company’s employees, directors and consultants. The Company ceased granting equity awards under the 2008 Plan, and accordingly, as of January 30, 2014, no shares were available for future grant under the 2008 Plan. However, the 2008 Plan will continue to govern the terms and conditions of outstanding awards granted thereunder.
As of December 31, 2018, options to purchase 1,370,062 shares of the Company’s common stock were outstanding under the 2008 Plan at a weighted-average exercise price of $4.95 per share.
Stock Options
81
2U, Inc.
Notes to Consolidated Financial Statements (Continued)
11. Stock-Based Compensation (Continued)
The terms of stock option grants, including the exercise price per share and vesting periods, are determined by the Company’s board of directors or the compensation committee thereof. Stock options are granted at exercise prices of not less than the estimated fair market value of the Company’s common stock at the date of grant. Stock options are generally subject to service-based vesting conditions and vest at various times from the date of the grant, with most options vesting in tranches, generally over a period of four years. Stock options granted under the 2014 Plan and the 2008 Plan are subject to service-based vesting conditions, and generally expire ten years from the grant date.
The Company values stock options using the Black-Scholes-Merton option pricing model, which requires the input of subjective assumptions, including the risk-free interest rate, expected life of the option, expected stock price volatility and dividend yield. The risk-free interest rate assumption is based upon observed interest rates for constant maturity U.S. Treasury securities consistent with the expected term of the Company’s employee stock options. The expected life represents the period of time the stock options are expected to be outstanding and is based on the “simplified method.” Under the “simplified method,” the expected life of an option is presumed to be the mid-point between the vesting date and the end of the contractual term. The Company uses the “simplified method” due to the lack of sufficient historical exercise data to provide a reasonable basis upon which to otherwise estimate the expected life of the stock options. Expected volatility is based on the historical volatility of the Company’s common stock over the estimated expected life of the stock options. The Company assumes no dividend yield because dividends are not expected to be paid in the near future, which is consistent with the Company’s history of not declaring or paying dividends to date.
The following table summarizes the assumptions used for estimating the fair value of the stock options granted for the periods presented.
Year Ended December 31, | |||||
2018 | 2017 | 2016 | |||
Risk-free interest rate | 2.3% - 3.0% | 2.0% - 2.1% | 1.1% - 1.9% | ||
Expected term (years) | 5.97 - 6.77 | 6.00 - 6.08 | 5.43 - 6.50 | ||
Expected volatility | 44% - 45% | 46% - 49% | 50% | ||
Dividend yield | 0% | 0% | 0% | ||
The following is a summary of the stock option activity for the year ended December 31, 2018:
Number of Options | Weighted-Average Exercise Price per Share | Weighted-Average Remaining Contractual Term (in years) | Aggregate Intrinsic Value (in thousands) | ||||||||
Outstanding balance as of December 31, 2017 | 4,559,176 | $ | 15.10 | 5.89 | 225,283 | ||||||
Granted | 668,390 | 84.06 | 8.76 | ||||||||
Exercised | (1,012,473 | ) | 7.27 | 2.34 | |||||||
Forfeited | (157,305 | ) | 45.59 | ||||||||
Expired | — | — | |||||||||
Outstanding balance as of December 31, 2018 | 4,057,788 | 27.23 | 5.95 | 113,211 | |||||||
Exercisable as of December 31, 2018 | 2,910,317 | 14.07 | 4.91 | 104,444 | |||||||
The weighted-average grant date fair value of the Company’s stock options granted during the years ended December 31, 2018, 2017 and 2016 was $39.66, $19.65 and $11.41 per share, respectively.
The total unrecognized compensation cost related to the unvested options as of December 31, 2018 was $28.9 million and will be recognized over a weighted-average period of approximately 2.9 years.
The aggregate intrinsic value of the options exercised during the years ended December 31, 2018, 2017 and 2016 was $54.0 million, $24.9 million and $24.9 million, respectively.
Restricted Stock Units
Throughout 2018 and 2017, the Company granted restricted stock units under the 2014 Plan to the Company’s directors and certain of the Company’s employees. The terms of the restricted stock unit grants under the 2014 Plan, including the vesting periods, are determined by the Company’s board of directors or the compensation committee thereof. Restricted
82
2U, Inc.
Notes to Consolidated Financial Statements (Continued)
11. Stock-Based Compensation (Continued)
stock units are generally subject to service-based vesting conditions and vest at various times from the date of the grant, with most restricted stock units vesting in equal annual tranches, generally over a period of four years.
The following is a summary of restricted stock unit activity for the year ended December 31, 2018:
Number of Restricted Stock Units | Weighted-Average Grant Date Fair Value per Share | |||||
Outstanding balance as of December 31, 2017 | 1,413,423 | $ | 29.95 | |||
Granted | 536,502 | 81.55 | ||||
Vested | (595,866 | ) | 25.79 | |||
Forfeited | (215,014 | ) | 50.90 | |||
Outstanding balance as of December 31, 2018 | 1,139,045 | 52.47 | ||||
The total compensation cost related to the nonvested restricted stock units not yet recognized as of December 31, 2018 was $43.8 million and will be recognized over a weighted-average period of approximately 2.2 years.
Employee Stock Purchase Plan
The Company’s 2017 Employee Stock Purchase Plan (the “ESPP”) provides (i) for two offering periods each year and (ii) that the purchase price for shares of the Company’s common stock purchased under the ESPP will be 90% of the lesser of the fair market value of the 2U’s common stock on the purchase date or the fair market value of 2U’s common stock on the first day of the offering period. Notwithstanding the foregoing, the Compensation Committee of the Company’s Board of Directors may exercise its discretion, subject to certain conditions, to make changes to certain aspects of the ESPP including, but not limited to, the length of the offering periods and that the purchase price will be 85% of the lesser of the fair market value of 2U’s common stock on the purchase date or the fair market value of 2U’s common stock on the first day of the offering period. Participating eligible employees select a rate of payroll deduction between 1% and 15% of their salary or wage compensation received from the Company as in effect at the start of the offering period, with the aggregate purchase of each offering period limited to a maximum fair market value of $25,000 per employee per year. Participation in the ESPP began on January 1, 2018. The ESPP is intended to qualify as an employee stock purchase plan under Section 423 of the Internal Revenue Code. A maximum of 1,000,000 shares of 2U’s common stock may be issued under the ESPP, subject to adjustments for certain capital transactions.
During the year ended December 31, 2018, an aggregate of 63,671 shares of 2U’s common stock were purchased in accordance with the ESPP. Net proceeds from the issuance of shares of 2U’s common stock under the ESPP for the year ended December 31, 2018 were $3.1 million. As of December 31, 2018, 936,329 shares remain available for purchase under the ESPP.
Stock-Based Compensation Expense
Stock-based compensation expense related to stock-based awards, as well as the ESPP, is included in the following line items on the accompanying consolidated statements of operations and comprehensive loss:
Year Ended December 31, | |||||||||||
2018 | 2017 | 2016 | |||||||||
(in thousands) | |||||||||||
Curriculum and teaching | $ | 14 | $ | 3 | $ | — | |||||
Servicing and support | 4,764 | 4,036 | 3,245 | ||||||||
Technology and content development | 4,094 | 3,306 | 2,392 | ||||||||
Marketing and sales | 2,743 | 1,742 | 1,317 | ||||||||
General and administrative | 19,795 | 12,843 | 8,869 | ||||||||
Total stock-based compensation expense | $ | 31,410 | $ | 21,930 | $ | 15,823 | |||||
Prior to January 1, 2017, the Company adjusted stock-based compensation expense for estimated forfeitures of stock-based awards. As described in the “Recent Accounting Pronouncements” section of Note 2, beginning on January 1, 2017, the Company accounts for forfeitures (and the impact on stock-based compensation expense) as they occur.
12. Net Loss per Share
83
Diluted net loss per share is the same as basic net loss per share for all periods presented because the effects of potentially dilutive items were anti-dilutive, given the Company’s net loss. The following securities have been excluded from the calculation of weighted-average shares of common stock outstanding because the effect is anti-dilutive for the years ended December 31, 2018, 2017 and 2016:
Year Ended December 31, | ||||||||
2018 | 2017 | 2016 | ||||||
Stock options | 4,057,788 | 4,559,176 | 4,882,237 | |||||
Restricted stock units | 1,139,045 | 1,413,423 | 1,412,934 | |||||
Basic and diluted net loss per share is calculated as follows:
Year Ended December 31, | |||||||||||
2018 | 2017 | 2016 | |||||||||
Numerator (in thousands): | |||||||||||
Net loss | $ | (38,330 | ) | $ | (29,423 | ) | (20,684 | ) | |||
Denominator: | |||||||||||
Weighted-average shares of common stock outstanding, basic and diluted | 55,833,492 | 49,062,611 | 46,609,751 | ||||||||
Net loss per share, basic and diluted | $ | (0.69 | ) | $ | (0.60 | ) | $ | (0.44 | ) | ||
13. Segment and Geographic Information
The Company’s operations consist of two operating segments, which are also its two reportable segments: the Graduate Program Segment and the Short Course Segment. The Company’s Graduate Program Segment provides services to well-recognized nonprofit colleges and universities, primarily in the United States, to enable the online delivery of graduate programs. The Company’s Short Course Segment provides premium online short courses to working professionals around the world through relationships with leading universities in the United States, the United Kingdom and South Africa.
Graduate Program Segment
For the year ended December 31, 2018, three university clients each accounted for 10% or more of the Company’s consolidated revenue, as follows: $86.9 million, $54.2 million and $42.7 million, which equaled 21%, 13% and 10% of the Company’s consolidated revenue, respectively. For the year ended December 31, 2017, four university clients each accounted for 10% or more of the Company’s consolidated revenue, as follows: $77.6 million, $48.2 million, $30.1 million and $28.3 million, which equaled 27%, 17%, 11% and 10% of the Company’s consolidated revenue, respectively.
As of December 31, 2018, two university clients each accounted for 10% or more of the Company’s consolidated accounts receivable, net balance, as follows: $11.9 million and $11.8 million, which equaled 36% and 36% of the Company’s consolidated accounts receivable, net balance, respectively. As of December 31, 2017, two university clients each accounted for 10% or more of the Company’s consolidated accounts receivable, net balance, as follows: $9.4 million and $2.0 million, which equaled 67% and 14% of the Company’s consolidated accounts receivable, net balance, respectively.
Short Course Segment
For the year ended December 31, 2018 and 2017, there were no customers or individual university clients that had revenue associated with it that accounted for 10% or more of the Company’s consolidated revenue. In addition, as of December 31, 2018 and December 31, 2017, no customers had accounts receivable, net balances that accounted for 10% or more of the Company’s consolidated accounts receivable, net balance, as customers are individual students or third parties paying on their behalf, rather than university clients.
For the year ended December 31, 2018, offerings associated with three university clients each accounted for 10% or more of the segment’s revenue, and when combined, accounted for approximately 81% of the segment’s revenue. For the year ended December 31, 2017, offerings associated with three university clients each accounted for 10% or more of the segment’s revenue, and when combined, accounted for approximately 82% of the segment’s revenue.
84
2U, Inc.
Notes to Consolidated Financial Statements (Continued)
13. Segment and Geographic Information (Continued)
Segment Performance
The following table summarizes financial information regarding each reportable segment’s results of operations for the periods presented:
Year Ended December 31, | |||||||||||
2018 | 2017 | 2016 | |||||||||
(in thousands) | |||||||||||
Revenue by segment* | |||||||||||
Graduate Program Segment | $ | 348,361 | $ | 270,432 | $ | 205,864 | |||||
Short Course Segment | 63,408 | 16,320 | — | ||||||||
Total revenue | $ | 411,769 | $ | 286,752 | $ | 205,864 | |||||
Segment profitability** | |||||||||||
Graduate Program Segment | $ | 16,839 | $ | 13,022 | $ | 4,541 | |||||
Short Course Segment | 816 | (1,606 | ) | — | |||||||
Total segment profitability | $ | 17,655 | $ | 11,416 | $ | 4,541 | |||||
Segment profitability margin*** | |||||||||||
Graduate Program Segment | 4.8 | % | 4.8 | % | 2.2 | % | |||||
Short Course Segment | 1.3 | (9.8 | ) | — | |||||||
Total segment profitability margin | 4.3 | 3.9 | 2.2 | ||||||||
* | The Company has excluded approximately $44,000 of intersegment revenues from the year ended December 31, 2018. |
** | The Company defines segment profitability as net income or net loss, as applicable, before net interest income (expense), taxes, depreciation and amortization expense, foreign currency gains or losses, acquisition-related gains or losses and stock-based compensation expense. Some or all of these items may not be applicable in any given reporting period. |
*** | The Company defines segment profitability margin as segment profitability as a percentage of the respective segment’s revenue. |
The following table reconciles net loss to total segment profitability:
Year Ended December 31, | |||||||||||
2018 | 2017 | 2016 | |||||||||
(in thousands) | |||||||||||
Net loss | $ | (38,330 | ) | $ | (29,423 | ) | $ | (20,684 | ) | ||
Adjustments: | |||||||||||
Interest income | (5,173 | ) | (371 | ) | (383 | ) | |||||
Interest expense | 108 | 87 | 35 | ||||||||
Foreign currency loss | 1,722 | 866 | — | ||||||||
Depreciation and amortization expense | 32,785 | 19,624 | 9,750 | ||||||||
Income tax benefit | (4,867 | ) | (1,297 | ) | — | ||||||
Stock-based compensation expense | 31,410 | 21,930 | 15,823 | ||||||||
Total adjustments | 55,985 | 40,839 | 25,225 | ||||||||
Total segment profitability | $ | 17,655 | $ | 11,416 | $ | 4,541 | |||||
85
2U, Inc.
Notes to Consolidated Financial Statements (Continued)
13. Segment and Geographic Information (Continued)
The Company’s total assets by segment are as follows:
December 31, 2018 | December 31, 2017 | ||||||
(in thousands) | |||||||
Total assets | |||||||
Graduate Program Segment | $ | 702,827 | $ | 359,597 | |||
Short Course Segment | 104,527 | 122,465 | |||||
Total assets | $ | 807,354 | $ | 482,062 | |||
Trade Accounts Receivable and Contract Liabilities
The Company’s trade accounts receivable and contract liabilities in each segment are as follows:
December 31, 2018 | December 31, 2017 | ||||||
(in thousands) | |||||||
Trade accounts receivable | |||||||
Graduate Program Segment accounts receivable, net of allowance for doubtful accounts of $0 for all periods presented | $ | 31,110 | $ | 12,520 | |||
Graduate Program Segment unbilled revenue | 265 | 666 | |||||
Short Course Segment accounts receivable, net of allowance for doubtful accounts of $257 and $287 as of December 31, 2018 and 2017, respectively | 982 | 988 | |||||
Total trade accounts receivable | $ | 32,357 | $ | 14,174 | |||
Contract liabilities | |||||||
Graduate Program Segment deferred revenue | $ | 2,864 | $ | 2,523 | |||
Short Course Segment deferred revenue | 5,481 | 4,501 | |||||
Total contract liabilities | $ | 8,345 | $ | 7,024 | |||
For the Graduate Program Segment, revenue recognized during the year ended December 31, 2018 that was included in the deferred revenue balance at the beginning of the year was $2.5 million. For the Short Course Segment, revenue recognized during the year ended December 31, 2018 that was included in the deferred revenue balance at the beginning of the year was $4.5 million.
Contract Acquisition Costs
The Graduate Program Segment had $0.3 million of net capitalized contract acquisition costs as of December 31, 2018. For the year ended December 31, 2018, the Company capitalized $0.3 million and recorded an immaterial amount of amortization expense in the Graduate Program Segment.
Geographical Information
The Company’s non-U.S. revenue, which is based upon the currency of the country in which the university client primarily operates, was $33.9 million and $10.0 million for the years ended December 31, 2018 and 2017, respectively, and was sourced entirely from the Short Course Segment’s operations outside of the U.S. The Company’s long-lived tangible assets in non-U.S. countries as of December 31, 2018 and December 31, 2017 totaled approximately $1.2 million and $0.7 million, respectively.
86
14. Retirement Plan
The Company has established a 401(k) plan for eligible employees to contribute up to 100% of their compensation, limited by the IRS-imposed maximum contribution amount. The Company matches 33% of each employee’s contribution up to 6% of the employee’s salary deferral each plan year. For the years ended December 31, 2018, 2017 and 2016, the Company made employer contributions of $2.1 million, $1.3 million and $1.1 million, respectively.
15. Related Party Transactions
During the year ended December 31, 2016, the Company subleased office space to an entity that was, upon execution of the sublease in 2011, a greater than 5% stockholder. The lease required the subtenant to reimburse the Company for the allocated cost of the office space subleased. The Company had no transactions with this related party during the years ended December 31, 2018 and 2017, other than the repayment of a $0.1 million security deposit in connection with the expiration of the sublease in December 2016. For the year ended December 31, 2016, the Company recorded $0.3 million as rental income from this related entity.
During the year ended December 31, 2016, the Company utilized the marketing and event planning services of a company that is partially owned by one of the Company’s former executives. The Company had no transactions with this related party during the years ended December 31, 2018 and 2017. The Company recorded $1.4 million for the expenses incurred related to the services provided by this related party for the year ended December 31, 2016. No amounts were due to the related party or recorded in accounts payable on the consolidated balance sheets as of December 31, 2018 and 2017.
16. Quarterly Financial Information (Unaudited)
The following tables set forth certain unaudited quarterly financial data for 2018 and 2017. This unaudited information has been prepared on the same basis as the audited information included elsewhere in this Annual Report and includes all adjustments necessary to present fairly the information set forth therein. The operating results are not necessarily indicative of results for any future period.
Three Months Ended | |||||||||||||||
March 31, 2018 | June 30, 2018 | September 30, 2018 | December 31, 2018 | ||||||||||||
(in thousands, except share and per share amounts) | |||||||||||||||
Revenue | $ | 92,288 | $ | 97,423 | $ | 106,963 | $ | 115,095 | |||||||
Costs and expenses | |||||||||||||||
Curriculum and teaching | 4,307 | 6,007 | 6,351 | 6,625 | |||||||||||
Servicing and support | 15,233 | 17,297 | 16,586 | 18,087 | |||||||||||
Technology and content development | 13,840 | 15,235 | 16,361 | 18,376 | |||||||||||
Marketing and sales | 53,058 | 58,376 | 60,548 | 49,033 | |||||||||||
General and administrative | 21,869 | 22,480 | 18,974 | 19,666 | |||||||||||
Total costs and expenses | 108,307 | 119,395 | 118,820 | 111,787 | |||||||||||
Income (loss) from operations | (16,019 | ) | (21,972 | ) | (11,857 | ) | 3,308 | ||||||||
Interest income | 342 | 912 | 1,799 | 2,120 | |||||||||||
Interest expense | (27 | ) | (27 | ) | (27 | ) | (27 | ) | |||||||
Other expense, net | (395 | ) | (825 | ) | (273 | ) | (229 | ) | |||||||
Income (loss) before income taxes | (16,099 | ) | (21,912 | ) | (10,358 | ) | 5,172 | ||||||||
Income tax benefit (expense) | 1,228 | 3,565 | 414 | (340 | ) | ||||||||||
Net income (loss) | $ | (14,871 | ) | $ | (18,347 | ) | $ | (9,944 | ) | $ | 4,832 | ||||
Net income (loss) per share, basic | $ | (0.28 | ) | $ | (0.33 | ) | $ | (0.17 | ) | $ | 0.08 | ||||
Net income (loss) per share, diluted | $ | (0.28 | ) | $ | (0.33 | ) | $ | (0.17 | ) | $ | 0.08 | ||||
Weighted-average shares used in computing net income (loss) per share, basic | 52,687,299 | 54,981,192 | 57,663,361 | 57,924,666 | |||||||||||
Weighted-average shares used in computing net income (loss) per share, diluted | 52,687,299 | 54,981,192 | 57,663,361 | 60,666,682 | |||||||||||
87
2U, Inc.
Notes to Consolidated Financial Statements (Continued)
16. Quarterly Financial Information (Unaudited) (continued)
Three Months Ended | |||||||||||||||
March 31, 2017 | June 30, 2017 | September 30, 2017 | December 31, 2017 | ||||||||||||
(in thousands, except share and per share amounts) | |||||||||||||||
Revenue | $ | 64,829 | $ | 64,995 | $ | 70,250 | $ | 86,678 | |||||||
Costs and expenses | |||||||||||||||
Curriculum and teaching | — | — | 1,792 | 4,817 | |||||||||||
Servicing and support | 10,925 | 13,458 | 12,939 | 13,445 | |||||||||||
Technology and content development | 9,205 | 11,140 | 12,735 | 12,846 | |||||||||||
Marketing and sales | 34,670 | 37,242 | 41,311 | 37,700 | |||||||||||
General and administrative | 13,664 | 13,930 | 17,227 | 17,844 | |||||||||||
Total costs and expenses | 68,464 | 75,770 | 86,004 | 86,652 | |||||||||||
Income (loss) from operations | (3,635 | ) | (10,775 | ) | (15,754 | ) | 26 | ||||||||
Interest income | 196 | 53 | 18 | 104 | |||||||||||
Interest expense | — | (1 | ) | (36 | ) | (50 | ) | ||||||||
Other income (expense), net | — | (1,031 | ) | 59 | 106 | ||||||||||
Income (loss) before income taxes | (3,439 | ) | (11,754 | ) | (15,713 | ) | 186 | ||||||||
Income tax benefit (expense) | — | — | 974 | 323 | |||||||||||
Net income (loss) | $ | (3,439 | ) | $ | (11,754 | ) | $ | (14,739 | ) | $ | 509 | ||||
Net income (loss) per share, basic | $ | (0.07 | ) | $ | (0.25 | ) | $ | (0.30 | ) | $ | 0.01 | ||||
Net income (loss) per share, diluted | $ | (0.07 | ) | $ | (0.25 | ) | $ | (0.30 | ) | $ | 0.01 | ||||
Weighted-average shares used in computing net income (loss) per share, basic | 47,237,341 | 47,668,397 | 48,961,914 | 52,330,067 | |||||||||||
Weighted-average shares used in computing net income (loss) per share, diluted | 47,237,341 | 47,668,397 | 48,961,914 | 56,593,108 | |||||||||||
88
Item 9. Changes in and Disagreements with Accountants on Accounting and Financial Disclosure
None.
Item 9A. Controls and Procedures
Disclosure Controls and Procedures
Under the supervision and with the participation of our management, including our Chief Executive Officer and Chief Financial Officer, we have evaluated the effectiveness of our disclosure controls and procedures pursuant to the Securities Exchange Act of 1934 Rules 13a-15 and 15d-15 as of the end of the period covered by this report. Based on that evaluation, our Chief Executive Officer and Chief Financial Officer have concluded that these disclosure controls and procedures are effective.
Management’s Annual Report on Internal Control Over Financial Reporting
Management is responsible for establishing and maintaining adequate internal control over financial reporting for the Company. With the participation of our Chief Executive Officer and Chief Financial Officer, management conducted an evaluation of the effectiveness of our internal control over financial reporting as of December 31, 2018 based on the Internal Control—Integrated Framework (2013) issued by the Committee of Sponsoring Organizations of the Treadway Commission. Based on this evaluation, management concluded that our internal control over financial reporting was effective as of December 31, 2018.
Our independent registered public accounting firm, KPMG LLP, has issued an audit report on the effectiveness of our internal control over financial reporting, which appears in Item 8 of this report.
Changes in Internal Control Over Financial Reporting
We made no changes in our internal control over financial reporting during the three months ended December 31, 2018 that have materially affected, or are reasonably likely to materially affect, our internal control over financial reporting, other than changes in controls to integrate the business we acquired in the GetSmarter acquisition.
Item 9B. Other Information
Not applicable.
89
PART III
We will file a definitive Proxy Statement for our 2019 Annual Meeting of Stockholders or our 2019 Proxy Statement with the SEC, pursuant to Regulation 14A, not later than 120 days after the end of our fiscal year. Accordingly, certain information required by Part III has been omitted under General Instruction G(3) to Form 10-K. Only those sections of the 2019 Proxy Statement that specifically address the items set forth herein are incorporated by reference.
Item 10. Directors, Executive Officers and Corporate Governance
The information required by Item 10 is hereby incorporated by reference to the sections of our 2019 Proxy Statement under the captions “Board of Directors and Committees,” “Election of Directors,” “Management,” “Section 16(a) Beneficial Ownership Reporting Compliance” and “Code of Business Conduct and Ethics for Employees, Executive Officers and Directors.”
Item 11. Executive Compensation
The information required by Item 11 is hereby incorporated by reference to the sections of our 2019 Proxy Statement under the captions “Executive Compensation,” “Director Compensation” and “Compensation Committee Interlocks and Insider Participation.”
Item 12. Security Ownership of Certain Beneficial Owners and Management and Related Stockholder Matters
The information required by Item 12 is hereby incorporated by reference to the sections of our 2019 Proxy Statement under the captions “Security Ownership of Certain Beneficial Owners and Management” and “Securities Authorized for Issuance under Equity Compensation Plans.”
Item 13. Certain Relationships and Related Transactions, and Director Independence
The information required by Item 13 is hereby incorporated by reference to the sections of our 2019 Proxy Statement under the captions “Transactions with Related Parties” and “Director Independence.”
Item 14. Principal Accounting Fees and Services
The information required by Item 14 is hereby incorporated by reference to the section of our 2019 Proxy Statement under the caption “Independent Registered Public Accounting Firm Fees.”
90
PART IV
Item 15. Exhibits, Financial Statement Schedules
(a) Exhibits
See the Exhibit Index immediately following the signature page of this Annual Report on Form 10-K.
(b) Financial Statement Schedules
Schedule II—Valuation and Qualifying Accounts (in thousands)
Balance at Beginning of Period | Additions Charged to Expense/Against Revenue | Deductions | Balance at End of Period | |||||||||||
Allowance for doubtful accounts: | ||||||||||||||
Year ended December 31, 2018 | $ | 287 | $ | 571 | $ | (601 | ) | 257 | ||||||
Year ended December 31, 2017 | — | 287 | — | 287 | ||||||||||
Year ended December 31, 2016 | — | — | — | — | ||||||||||
Balance at Beginning of Period | Additions | Deductions | Balance at End of Period | |||||||||||
Income tax valuation allowance: | ||||||||||||||
Year ended December 31, 2018 | $ | 71,101 | $ | 16,960 | $ | — | 88,061 | |||||||
Year ended December 31, 2017 | 62,297 | 17,967 | (9,163 | ) | 71,101 | |||||||||
Year ended December 31, 2016 | 54,739 | 7,558 | — | 62,297 | ||||||||||
Item 16. Form 10-K Summary
None.
91
SIGNATURES
Pursuant to the requirements of Section 13 or 15(d) of the Securities Exchange Act of 1934, the registrant has duly caused this report to be signed on its behalf by the undersigned, thereunto duly authorized:
2U, Inc. February 26, 2019 | ||||||
By: | /s/ CHRISTOPHER J. PAUCEK | |||||
Name: | Christopher J. Paucek | |||||
Title: | Chief Executive Officer and Director | |||||
POWER OF ATTORNEY
KNOW ALL PERSONS BY THESE PRESENTS, that each person whose signature appears below constitutes and appoints Christopher J. Paucek, Catherine A. Graham and Matthew J. Norden, or each of them, as his true and lawful attorneys-in-fact and agents, each with the full power of substitution, for him and in his name, place or stead, in any and all capacities, to sign any amendments to this report and to file the same, with exhibits thereto, and other documents in connection therewith, with the Securities and Exchange Commission, hereby ratifying and confirming all that either of said attorneys-in-fact, or substitute or substitutes, may do or cause to be done by virtue hereof.
Pursuant to the requirements of the Securities Act of 1934, this Annual Report on Form 10-K has been signed by the following persons on behalf of the registrant and in the capacities and on the dates indicated.
92
Signature | Title | Date | ||||
/s/ CHRISTOPHER J. PAUCEK | Chief Executive Officer and Director (Principal Executive Officer) | February 26, 2019 | ||||
Christopher J. Paucek | ||||||
/s/ CATHERINE A. GRAHAM | Chief Financial Officer (Principal Financial Officer) | February 26, 2019 | ||||
Catherine A. Graham | ||||||
/s/ JOHN B. ELLIS | Chief Accounting Officer (Principal Accounting Officer) | February 26, 2019 | ||||
John B. Ellis | ||||||
/s/ PAUL A. MAEDER | Director and Chairman of the Board | February 26, 2019 | ||||
Paul A. Maeder | ||||||
/s/ TIMOTHY M. HALEY | Director | February 26, 2019 | ||||
Timothy M. Haley | ||||||
/s/ JOHN M. LARSON | Director | February 26, 2019 | ||||
John M. Larson | ||||||
/s/ CORETHA M. RUSHING | Director | February 26, 2019 | ||||
Coretha M. Rushing | ||||||
/s/ ROBERT M. STAVIS | Director | February 26, 2019 | ||||
Robert M. Stavis | ||||||
/s/ SALLIE L. KRAWCHECK | Director | February 26, 2019 | ||||
Sallie L. Krawcheck | ||||||
/s/ EARL LEWIS | Director | February 26, 2019 | ||||
Earl Lewis | ||||||
/s/ EDWARD S. MACIAS | Director | February 26, 2019 | ||||
Edward S. Macias | ||||||
/s/ VALERIE B. JARRETT | Director | February 26, 2019 | ||||
Valerie B. Jarrett | ||||||
/s/ GREGORY PETERS | Director | February 26, 2019 | ||||
Gregory Peters | ||||||
/s/ ALEXIS MAYBANK | Director | February 26, 2019 | ||||
Alexis Maybank | ||||||
93
SPECIAL NOTE REGARDING EXHIBITS
In reviewing the agreements included as exhibits to this Annual Report on Form 10-K, please remember they are included to provide you with information regarding their terms and are not intended to provide any other factual or disclosure information about the Company or the other parties to the agreements. The agreements contain representations and warranties by each of the parties to the applicable agreement. These representations and warranties have been made solely for the benefit of the other parties to the applicable agreement and:
• | should not in all instances be treated as categorical statements of fact, but rather as a way of allocating the risk to one of the parties if those statements prove to be inaccurate; |
• | have been qualified by disclosures that were made to the other party in connection with the negotiation of the applicable agreement, which disclosures are not necessarily reflected in the agreement; |
• | may apply standards of materiality in a way that is different from what may be viewed as material to you or other investors; and |
• | were made only as of the date of the applicable agreement or such other date or dates as may be specified in the agreement and are subject to more recent developments. |
Accordingly, these representations and warranties may not describe the actual state of affairs as of the date they were made or at any other time. Additional information about the Company may be found elsewhere in this Annual Report on Form 10-K and the Company’s other public filings, which are available without charge through the SEC’s website at http://www.sec.gov.
The Company acknowledges that, notwithstanding the inclusion of the foregoing cautionary statements, it is responsible for considering whether additional specific disclosures of material information regarding material contractual provisions are required to make the statements in this report not misleading.
94
Exhibit Index
Exhibit Number | Description | Form | File No. | Exhibit Number | Filing Date | Filed Herewith | |||||||
10-Q | 001-36376 | 2.1 | May 4, 2017 | ||||||||||
8-K | 001-36376 | 2.2 | July 3, 2017 | ||||||||||
8-K | 001-36376 | 3.1 | April 4, 2014 | ||||||||||
8-K | 001-36376 | 3.2 | April 4, 2014 | ||||||||||
S-1/A | 333-194079 | 4.2 | March 17, 2014 | ||||||||||
S-1 | 333-194079 | 10.1 | February 21, 2014 | ||||||||||
S-1 | 333-194079 | 10.2 | February 21, 2014 | ||||||||||
S-1/A | 333-194079 | 10.2.1 | March 17, 2014 | ||||||||||
10-K | 001-36376 | 10.2.2 | March 10, 2016 | ||||||||||
S-1 | 333-194079 | 10.6 | February 21, 2014 | ||||||||||
S-1 | 333-194079 | 10.7 | February 21, 2014 | ||||||||||
S-1 | 333-194079 | 10.8 | February 21, 2014 | ||||||||||
S-1 | 333-194079 | 10.9 | February 21, 2014 | ||||||||||
10-Q | 001-36376 | 10.1 | August 2, 2018 | ||||||||||
10-Q | 001-36376 | 10.2 | August 2, 2018 | ||||||||||
95
Exhibit Number | Description | Form | File No. | Exhibit Number | Filing Date | Filed Herewith | |||||||
10-Q | 001-36376 | 10.3 | August 2, 2018 | ||||||||||
10-Q | 001-36376 | 10.1 | May 12, 2014 | ||||||||||
S-1/A | 333-194079 | 10.14 | March 17, 2014 | ||||||||||
S-1 | 333-194079 | 10.15 | February 21, 2014 | ||||||||||
10-Q | 001-36376 | 10.4 | August 2, 2018 | ||||||||||
S-1 | 333-194079 | 10.4 | February 21, 2014 | ||||||||||
10-K | 001-36376 | 10.16 | February 24, 2017 | ||||||||||
10-K | 001-36376 | 10.17 | February 24, 2017 | ||||||||||
10-K | 001-36376 | 10.18 | February 24, 2017 | ||||||||||
X | |||||||||||||
X | |||||||||||||
X | |||||||||||||
X | |||||||||||||
X | |||||||||||||
X | |||||||||||||
101.INS | XBRL Instance Document. | X | |||||||||||
101.SCH | XBRL Taxonomy Extension Schema Document. | X | |||||||||||
96
Exhibit Number | Description | Form | File No. | Exhibit Number | Filing Date | Filed Herewith | |||||||
101.CAL | XBRL Taxonomy Extension Calculation Linkbase Document. | X | |||||||||||
101.DEF | XBRL Taxonomy Extension Definition Linkbase Document. | X | |||||||||||
101.LAB | XBRL Taxonomy Extension Label Linkbase Document. | X | |||||||||||
101.PRE | XBRL Taxonomy Extension Presentation Linkbase Document. | X | |||||||||||
* | Portions of this exhibit, indicated by asterisks, have been omitted pursuant to a request for confidential treatment and have been separately filed with the Securities and Exchange Commission. |
† | Indicates management contract or compensatory plan. |
97
EXHIBIT 21.1
Subsidiaries of 2U, Inc.
Name of Subsidiary | Jurisdiction of Incorporation or Organization | |
CritiqueIt, Inc. | California | |
2U HK LLC | Delaware | |
2U Harkins Road LLC | Delaware | |
2U NYC, LLC | Delaware | |
2U GetSmarter, LLC | Delaware | |
2U GetSmarter (US) LLC | Delaware | |
K2017143886 (South Africa) Proprietary Limited | South Africa | |
Get Educated International Proprietary Limited | South Africa | |
Get Educated Proprietary Limited | South Africa | |
2U GetSmarter (UK) Limited | The United Kingdom | |
GetSmarter Online Limited | The United Kingdom | |
2U Group (UK) Limited | The United Kingdom | |
QuickLinks -- Click here to rapidly navigate through this document
EXHIBIT 23.1
Consent of Independent Registered Public Accounting Firm
The Board of Directors
2U, Inc.:
We consent to the incorporation by reference in the registration statements (No. 333-227546) on Form S-3 and (Nos. 333-194943 and 333-221964) on Form S-8 of 2U, Inc. of our reports dated February 26, 2019, with respect to the consolidated balance sheets of 2U, Inc. and subsidiaries as of December 31, 2018 and 2017, the related consolidated statements of operations and comprehensive loss, changes in stockholders’ equity, and cash flows for each of the years in the three-year period ended December 31, 2018, and the related notes and financial statement Schedule II—Valuation and Qualifying Accounts (collectively, the consolidated financial statements), and the effectiveness of internal control over financial reporting as of December 31, 2018, which reports appear in the December 31, 2018 annual report on Form 10-K of 2U, Inc.
Our report dated February 26, 2019 on the consolidated financial statements refers to a change in the method of accounting for revenues and related costs in 2018 due to the adoption, effective January 1, 2018, of ASU No. 2014-09, Revenue from Contracts with Customers.
/s/ KPMG LLP | ||
McLean, Virginia
February 26, 2019
EXHIBIT 31.1
CERTIFICATION OF CHIEF EXECUTIVE OFFICER
I, Christopher J. Paucek, certify that:
1. | I have reviewed this Annual Report on Form 10-K of 2U, Inc.; |
2. | Based on my knowledge, this report does not contain any untrue statement of a material fact or omit to state a material fact necessary to make the statements made, in light of the circumstances under which such statements were made, not misleading with respect to the period covered by this report; |
3. | Based on my knowledge, the financial statements, and other financial information included in this report, fairly present in all material respects the financial condition, results of operations and cash flows of the registrant as of, and for, the periods presented in this report; |
4. | The registrant’s other certifying officer(s) and I are responsible for establishing and maintaining disclosure controls and procedures (as defined in Exchange Act Rules 13a-15(e) and 15d-15(e)) and internal control over financial reporting (as defined in Exchange Act Rules 13a-15(f) and 15d-15(f)) for the registrant and have: |
a) | Designed such disclosure controls and procedures, or caused such disclosure controls and procedures to be designed under our supervision, to ensure that material information relating to the registrant, including its consolidated subsidiaries, is made known to us by others within those entities, particularly during the period in which this report is being prepared; |
b) | Designed such internal control over financial reporting, or caused such internal control over financial reporting to be designed under our supervision, to provide reasonable assurance regarding the reliability of financial reporting and the preparation of financial statements for external purposes in accordance with generally accepted accounting principles; |
c) | Evaluated the effectiveness of the registrant’s disclosure controls and procedures and presented in this report our conclusions about the effectiveness of the disclosure controls and procedures, as of the end of the period covered by this report based on such evaluation; and |
d) | Disclosed in this report any change in the registrant’s internal control over financial reporting that occurred during the registrant’s most recent fiscal quarter (the registrant’s fourth fiscal quarter in the case of an annual report) that has materially affected, or is reasonably likely to materially affect, the registrant’s internal control over financial reporting; and |
5. | The registrant’s other certifying officer(s) and I have disclosed, based on our most recent evaluation of internal control over financial reporting, to the registrant’s auditors and the audit committee of the registrant’s board of directors (or persons performing the equivalent functions): |
a) | All significant deficiencies and material weaknesses in the design or operation of internal control over financial reporting which are reasonably likely to adversely affect the registrant’s ability to record, process, summarize and report financial information; and |
b) | Any fraud, whether or not material, that involves management or other employees who have a significant role in the registrant’s internal control over financial reporting. |
Date: February 26, 2019 | By: | /s/ CHRISTOPHER J. PAUCEK | ||
Name: | Christopher J. Paucek | |||
Title: | Chief Executive Officer | |||
EXHIBIT 31.2
CERTIFICATION OF CHIEF FINANCIAL OFFICER
I, Catherine A. Graham, certify that:
1. | I have reviewed this Annual Report on Form 10-K of 2U, Inc.; |
2. | Based on my knowledge, this report does not contain any untrue statement of a material fact or omit to state a material fact necessary to make the statements made, in light of the circumstances under which such statements were made, not misleading with respect to the period covered by this report; |
3. | Based on my knowledge, the financial statements, and other financial information included in this report, fairly present in all material respects the financial condition, results of operations and cash flows of the registrant as of, and for, the periods presented in this report; |
4. | The registrant’s other certifying officer(s) and I are responsible for establishing and maintaining disclosure controls and procedures (as defined in Exchange Act Rules 13a-15(e) and 15d-15(e)) and internal control over financial reporting (as defined in Exchange Act Rules 13a-15(f) and 15d-15(f)) for the registrant and have: |
a) | Designed such disclosure controls and procedures, or caused such disclosure controls and procedures to be designed under our supervision, to ensure that material information relating to the registrant, including its consolidated subsidiaries, is made known to us by others within those entities, particularly during the period in which this report is being prepared; |
b) | Designed such internal control over financial reporting, or caused such internal control over financial reporting to be designed under our supervision, to provide reasonable assurance regarding the reliability of financial reporting and the preparation of financial statements for external purposes in accordance with generally accepted accounting principles; |
c) | Evaluated the effectiveness of the registrant’s disclosure controls and procedures and presented in this report our conclusions about the effectiveness of the disclosure controls and procedures, as of the end of the period covered by this report based on such evaluation; and |
d) | Disclosed in this report any change in the registrant’s internal control over financial reporting that occurred during the registrant’s most recent fiscal quarter (the registrant’s fourth fiscal quarter in the case of an annual report) that has materially affected, or is reasonably likely to materially affect, the registrant’s internal control over financial reporting; and |
5. | The registrant’s other certifying officer(s) and I have disclosed, based on our most recent evaluation of internal control over financial reporting, to the registrant’s auditors and the audit committee of the registrant’s board of directors (or persons performing the equivalent functions): |
a) | All significant deficiencies and material weaknesses in the design or operation of internal control over financial reporting which are reasonably likely to adversely affect the registrant’s ability to record, process, summarize and report financial information; and |
b) | Any fraud, whether or not material, that involves management or other employees who have a significant role in the registrant’s internal control over financial reporting. |
Date: February 26, 2019 | By: | /s/ CATHERINE A. GRAHAM | ||
Name: | Catherine A. Graham | |||
Title: | Chief Financial Officer | |||
EXHIBIT 32.1
CERTIFICATION OF CEO PURSUANT TO
18 U.S.C. SECTION 1350,
AS ADOPTED PURSUANT TO
SECTION 906 OF THE SARBANES-OXLEY ACT OF 2002
In connection with the Annual Report on Form 10-K of 2U, Inc. (the “Company”) for the year ended December 31, 2018 as filed with the Securities and Exchange Commission on the date hereof (the “Report”), I, Christopher J. Paucek, as Chief Executive Officer of the Company, do hereby certify, pursuant to 18 U.S.C. Section 1350, as adopted pursuant to Section 906 of the Sarbanes-Oxley Act of 2002, that, to the best of my knowledge:
(1) | The Report fully complies with the requirements of Section 13(a) or 15(d) of the Securities Exchange Act of 1934; and |
(2) | The information contained in the Report fairly presents, in all material respects, the financial condition and results of operations of the Company. |
Date: February 26, 2019 | By: | /s/ CHRISTOPHER J. PAUCEK | ||
Name: | Christopher J. Paucek | |||
Title: | Chief Executive Officer | |||
This certification accompanies the Report pursuant to Section 906 of the Sarbanes-Oxley Act of 2002 and shall not, except to the extent required by the Sarbanes-Oxley Act of 2002, be deemed filed by the Company for purposes of Section 18 of the Securities Exchange Act of 1934, as amended.
A signed original of this written statement required by Section 906 of the Sarbanes-Oxley Act of 2002 has been provided to the Company and will be retained by the Company and furnished to the Securities and Exchange Commission or its staff upon request.
EXHIBIT 32.2
CERTIFICATION OF CFO PURSUANT TO
18 U.S.C. SECTION 1350,
AS ADOPTED PURSUANT TO
SECTION 906 OF THE SARBANES-OXLEY ACT OF 2002
In connection with the Annual Report on Form 10-K of 2U, Inc. (the “Company”) for the year ended December 31, 2018 as filed with the Securities and Exchange Commission on the date hereof (the “Report”), I, Catherine A. Graham, as Chief Financial Officer of the Company, do hereby certify, pursuant to 18 U.S.C. Section 1350, as adopted pursuant to Section 906 of the Sarbanes-Oxley Act of 2002, that, to the best of my knowledge:
(1) | The Report fully complies with the requirements of Section 13(a) or 15(d) of the Securities Exchange Act of 1934; and |
(2) | The information contained in the Report fairly presents, in all material respects, the financial condition and results of operations of the Company. |
Date: February 26, 2019 | By: | /s/ CATHERINE A. GRAHAM | ||
Name: | Catherine A. Graham | |||
Title: | Chief Financial Officer | |||
This certification accompanies the Report pursuant to Section 906 of the Sarbanes-Oxley Act of 2002 and shall not, except to the extent required by the Sarbanes-Oxley Act of 2002, be deemed filed by the Company for purposes of Section 18 of the Securities Exchange Act of 1934, as amended.
A signed original of this written statement required by Section 906 of the Sarbanes-Oxley Act of 2002 has been provided to the Company and will be retained by the Company and furnished to the Securities and Exchange Commission or its staff upon request.
Serious News for Serious Traders! Try StreetInsider.com Premium Free!
You May Also Be Interested In
- 2U, Inc. (TWOU) PT Lowered to $0.75 at Morgan Stanley
- BWXT Announces Expansion of Cambridge Manufacturing Plant to Support Global Nuclear Power Market
- CMUV Bancorp Announces 2024 1st Quarter Financial Results & Notice of Annual Shareholder Meeting
Create E-mail Alert Related Categories
SEC FilingsSign up for StreetInsider Free!
Receive full access to all new and archived articles, unlimited portfolio tracking, e-mail alerts, custom newswires and RSS feeds - and more!
