

Form N-CSRS/A MainGate Trust For: May 31
 Tweet
Tweet Share
ShareSECURITIES AND EXCHANGE COMMISSION
Washington, D.C. 20549
(Exact name of registrant as specified in charter)
(Address of principal executive offices) (Zip code)
(Name and address of agent for service)
|
(a)
|
|


MainGate MLP Fund
Class A (AMLPX)
Class C (MLCPX)
Class I (IMLPX)
6075 Poplar Avenue, Suite 720 | Memphis, TN 38119 | 855.MLP.FUND (855.657.3863) | www.maingatefunds.com
Semi-Annual Report
May 31, 2022
(Unaudited) – Restated
SEMI - ANNUAL REPORT 2022 ● 3
Table of CONTENTS
MainGate mlp fund
The MainGate MLP Fund had the following performance as of May 31, 2022 compared to the S&P 500 Index and the Alerian MLP Total Return Index.
| cumulative returns | average annual returns | |||||||||||||
| Inception | Fiscal | Since | 1 | 5 | 10 | Since | ||||||||
| Date | YTD | Inception | Year | Year | Year | Inception | ||||||||
| MainGate MLP Fund – Class A | 2/17/11 | 34.54% | 45.94% | 36.60% | 1.75% | 3.43% | 3.41% | |||||||
| without load | ||||||||||||||
| MainGate MLP Fund – Class A | 2/17/11 | 26.90% | 37.55% | 28.77% | 0.56% | 2.81% | 2.87% | |||||||
| with 5.75% maximum front-end load | ||||||||||||||
| MainGate MLP Fund – Class I | 2/17/11 | 34.80% | 50.11% | 36.78% | 1.99% | 3.68% | 3.67% | |||||||
| S&P 500 Index | 2/17/11 | -8.85% | 285.61% | -0.30% | 13.38% | 14.40% | 12.71% | |||||||
| Alerian MLP Total Return Index | 2/17/11 | 32.43% | 34.68% | 27.52% | 2.62% | 2.60% | 2.67% | |||||||
| MainGate MLP Fund – Class C | 3/31/14 | 34.20% | -9.27% | 35.54% | 0.97% | NA | -1.18% | |||||||
| without load | ||||||||||||||
| MainGate MLP Fund – Class C | 3/31/14 | 33.20% | -9.27% | 34.54% | 0.97% | NA | -1.18% | |||||||
| with 1.00% Contingent Deferred | ||||||||||||||
| Sales Charge | ||||||||||||||
| S&P 500 Index | 3/31/14 | -8.85% | 158.11% | -0.30% | 13.38% | NA | 12.31% | |||||||
| Alerian MLP Total Return Index | 3/31/14 | 32.43% | -8.50% | 27.52% | 2.62% | NA | -1.08% | |||||||
Expense Ratios (Gross/Net): A Shares = 1.70%/1.70% | C Shares = 2.45%/2.45% | I Shares = 1.45%/1.45%. Net expense ratios represent the percentages paid by investors and reflect a 0.00% deferred income tax expense which represents the performance impact of accrued deferred tax liabilities across the Fund, not individual share classes, for the fiscal year ended November 30, 2021 (the Fund did not have a current tax expense or benefit due to a valuation allowance). The Fund’s adviser has contractually agreed to cap the Fund’s total annual operating expenses (excluding brokerage fees and commissions; Class A 12b-1 fees; borrowing costs; taxes, such as Deferred Income Tax Expense; and extraordinary expenses) at 1.50% through March 31, 2023. The performance data shown For Class C with load reflects the Class C maximum deferred sales charge of 1.00%. Deferred income tax expense/(benefit) represents an estimate of the Fund’s potential tax expense/(benefit) if it were to recognize the unrealized gains/(losses) in the portfolio. An estimate of deferred income tax expense/(benefit) depends upon the Fund’s net investment income/(loss) and realized and unrealized gains/(losses) on its portfolio, which may vary greatly on a daily, monthly and annual basis depending on the nature of the Fund’s investments and their performance. An estimate of deferred income tax expenses/(benefit) cannot be reliably predicted from year to year.
The performance data quoted represents past performance. Past performance is no guarantee of future results. The investment return and the principal value of an investment will fluctuate and shares, when redeemed, may be worth more or less than their original cost. Current performance may be lower or higher than the information quoted. To obtain performance information current to the most recent month-end please call 855.MLP.FUND (855.657.3863). Performance data shown for Class A shares with load reflects the maximum sales charge of 5.75%. Performance data shown for Class C shares with load reflects the maximum deferred sales charge of 1.00%. Performance data shown for Class I shares does not reflect the deduction of a sales load or fee. Performance data shown “Without Load” does not reflect the deduction of the sales load or fee. If reflected, the load or fee would reduce the performance quoted.
SEMI - ANNUAL REPORT 2022 ● 5
Second Quarter 2022 – “Air Pocket”
The second quarter 2022 Alerian MLP Total Return Index (AMZX)1 performance of -7.4% did not match the strong quarterly operating results reported by Midstream companies during the quarter. If we had written this letter on May 31st, everything would have synced. But then June happened, and like the rest of the market, the AMZX was influenced during the month by several questions regarding the impacts of broader macro-economic forces and a resulting push/pull between fundamentals and market technicals.
Our companies had a terrific fundamental quarter. On a weighted average2 basis, the Portfolio:
| ● | Beat earnings before interest, taxes, depreciation and amortization (EBITDA)3 expectations by 6.5%, representing 11.2% year-over-year (Y/Y) growth, |
| ● | Saw estimated 2022 distributable cash flow (DCF)4 per unit/share (DCF/u) growth increase to 14.9%, +530 basis points (bps)5 quarter-over-quarter (Q/Q)6, |
| ● | Increased Distributions 6.3% Q/Q, and |
| ● | Had a 2.95x coverage ratio7 due to higher DCF/u. |
Portfolio positioning continues to favor natural gas and natural gas liquids (NGL) companies with fully integrated value chains, lower balance sheet leverage, and upside opportunities to increase equity holder returns through increases in distributions, increased buyback activity and special distributions/dividends.
We believe June’s performance was more a result of an “air pocket” that saw macro, multi-factor, and technical traders strongly de-grossing commodities, energy, and other sectors which had previously held up well year-to-date (YTD), as recession odds and rate hikes ticked higher, without enough buyer support to soak it up. Rarely is there ever counterbalancing support when sell-offs are that fast. Commentary from trading desks indicated new buyers who had waited for a pullback emerged mid-month. However, the Biden Administration floated several energy-related trial balloons in an attempt to jawbone consumer energy prices lower, which may have weakened sentiment and kept the AMZX from a meaningful recovery into quarter-end.
Let’s also keep perspective: Midstream and Energy in general have been solid performers in 2022. The S&P 500 Energy Sector Index8 and the AMZX are up 31.6% and 10.0% YTD, respectively, and fared even better relative to the broader market, which had its worst first half in 50 years with the S&P 500 Index9 down 20.0%. We expect we will look back at June 2022 as a recalibration that saw market participants reduce equity exposure in their portfolios, and allowed Energy to be better positioned for continued outperformance.
Fundamental catalysts remain in place, and we find the composition of S&P 500 earnings growth estimates to be striking in its underappreciation of the Energy sector. Analysts’ expectations for 2022 estimated earnings growth for the S&P 500 Index as a whole is 10.3%, with over 50% of the growth coming from Energy, which represents <5% of the index’s sector weight10. If we carry it forward on a next twelve months (NTM) basis, the Energy sector still contributes >20% of the estimated total earnings growth. How does this not play a bigger role in allocators’ decisions? We discussed in our May earnings recap that for all the talk about a recession, analysts are seeminly doing a poor job of decreasing estimates.
(1) Alerian MLP Index: A capitalization-weighted index of the most prominent energy Master Limited Partnerships. Visit http://www.alerian.com/indices/amz-index for more information, including performance. You cannot invest directly in an index. (2) Weighted Average: An calculation in which each quantity to be averaged is assigned a weight that represents its relative importance. (3) Earnings Before Interest, Taxes, Depreciation and Amortization (EBITDA): Essentially net income with interest, taxes, depreciation, and amortization added back to it; can be used to analyze and compare profitability between companies and industries because it eliminates the effects of financing and accounting decisions. (4) Distributable Cash Flow: Measured as earnings before interest, taxes, depreciation and amortization (EBITDA) available to pay unitholders after reserving for maintenance capital expenditures and payment of interest expense. (5) Basis Points (bps): A common unit of measure for interest rates and other percentages in finance. One basis point is equal to 1/100th of 1%, or 0.01%. In decimal form, one basis point appears as 0.0001 (0.01/100). (6) Distributable cash flow growth refers to the estimated 2022 weighted average Distributable Cash Flow (DCF) growth rate. DCF growth rate for the portfolio’s holdings does not guarantee a corresponding increase in the market value of the holding or the portfolio. DCF data is CCM-calculated consensus of Wall Street estimates. (7) Distribution Coverage Ratio: An MLP’s distributable cash flow divided by the total amount of distributions it paid out. (8) S&P 500 Utility Index: Comprises those companies included in the S&P 500 that are classified as members of the Global Industry Classification Standard utilities sector. (9) S&P 500: A free-float capitalization-weighted index published since 1957 of the prices of 500 large-cap common stocks actively traded in the United States. (10) UBS Securities LLC as of 6/28/22.
6 | MainGate mlp fund
The chart below shows the dislocations between conjecture and earnings forecasts, and the evidence to date leads us to believe Energy earnings estimates should hold up better through next year and perhaps may be viewed more favorably than other sectors.
Earnings Estimates Are Most Wrong in Recessions

Bloomberg Markets Live, “Analysts Estimates are Mostly Wrong in Recessions”, June 29, 2022
Assuming the old rules of “buy things that are going up” and “buy things that are inexpensive” still hold, this has us believing even more strongly that Midstream could outperform as investors have gone through a cleansing in June, and Midstream could likely see upside in this scenario.
Interesting as well, we continued to receive incremental commentary from both Wall Street Energy analysts and broad market strategists saying the environmental, social, governance (ESG) headwind to Energy investment may be turning to a tailwind, particularly among European investors who have been the strongest adopters of ESG guidelines in their investment mandates. Since April, the analysts/strategists reported increased face-to-face exposure with a broad group of European investors who have suffered in performance due to a more stringent investment mandate, which has only become starker the past 4 months as Europe has found itself very poorly positioned for energy supplies. Relayed conversations indicated ESG mandates are expanding to include Energy companies, and, in particular, to increase exposure to companies focused on natural gas as it now presents a longer-term investment thesis, and remains a way to dissuade further use of coal.
Capacity Short
It’s All About Capacity
Allow us to cut through all the rhetoric about the supply of oil, such as what is OPEC’s11 spare capacity, are producers drilling enough, etc. The current high price of consumer fuels is a result of a lack of refining capacity brought about by global policy initiatives to incentivize an energy transition. These inept policies created a mismatch of supply and demand that was then further exacerbated by the Russia/Ukraine conflict.
(11) OPEC (Organization of the Petroleum Exporting Countries): An international organization and economic cartel whose mission is to coordinate the policies of the oil-producing countries. The goal is to secure a steady income to the member states and to collude in influencing world oil prices through economic means.
SEMI - ANNUAL REPORT 2022 ● 7
Looking at the U.S., refining capacity has declined back to levels last seen in 2014 after peaking at a little over 19 million barrels per day (MMBpd) in 2020. We can point to specific reasons why capacity has been reduced—hurricane damage, conversion to renewable fuels (diesel grade), etc. – but the overarching reason for less refining capacity is due to political headwinds discouraging new investment. Of course, new refining capacity could potentially be brought online to alleviate price pressure, but investing in new refining capacity requires a 30–40-year outlook and current policy signals an aggressive transition timeline to more electric vehicles and less refined products for transportation. It is no surprise with today’s policy backdrop, it is difficult for refiners to justify the investment.
Annual U.S. Refinery Atmospheric Crude Oil Distillation Capacity (2013-2022)
Million barrels per calendar day as of January 1
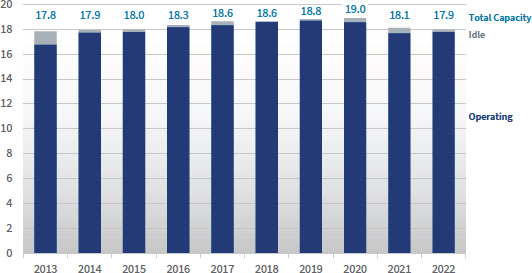
EIA, “Today in Energy: U.S. Refinery Capacity Decreased During 2021 for Second Consecutive Year”, June 26, 2022
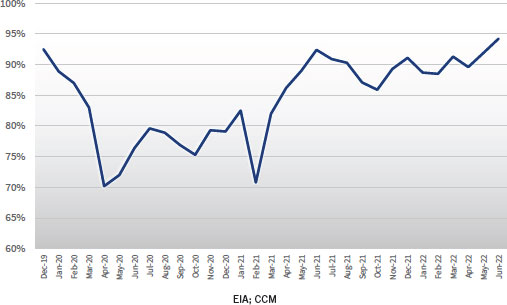
We should note U.S. refiners are doing their part to supply the market with product from existing capacity as utilization is at an all-time high:
U.S. Refinery Utilization
8 | MainGate mlp fund
Turning to global refining capacity, it has increased by 7.8 MMBpd since 2010, but two things underneath the surface are affecting flows. First, Russia is a major producer of diesel and its rejection by its former buyers in Europe has forced Russian refined products elsewhere. This has turned Europe into the incremental buyer for non-Russian products barrels on the global market. This is not much different from how Europe has become the incremental buyer for all liquefied natural gas (LNG) cargoes, being more or less price agnostic for both fuels. Second, the vast majority of the global refining capacity has been added in China which has added 7.4 MMBpd12. Even though China has bought relatively less crude oil during the past 6 months due to reduced activity from Covid-19 lockdowns, they have not placed their spare refined products barrels on the global market. Market speculation is they see the impact sanctions have had on Russia, and given they are a “hydrocarbon-poor” nation (relative to their scale), it’s in their national interest to store all refined products barrels they can.
The point of this capacity review is to acknowledge that, yes, the input costs on a price per barrel basis are higher, but the corresponding price-at-the-pump for gasoline is also dislocated even higher due to capacity limitations. Our analysis suggests deterred refinery investment has caused at least a $1.35+ premium per gallon of gas. We arrive at this conclusion by extrapolating the crack spread over time and interpolate that $105-110 per barrel of crude should deliver $3.25-3.50 per gallon of refined gasoline versus the current $4.85 national average13. This can also be put into context in the following chart:
Crude Oil vs Gasoline Prices

EIA, JPMAM; May 2022 from JP Morgan Asset Management, “Eye on the Market”, June 27, 2022
As much as commentators, journalists and the like want to compare this to the 1970s gasoline crisis, we believe the narratives are different. Yes, both economic events have soaring inflation and high gas prices; however, the 1970s energy crisis was one of supply due solely to the Arab oil embargo. Today’s event is mainly due to available capacity to refine. We expect inflation to ebb and flow with supply chains and consumer behaviors shifting as we continue to normalize societally, post-Covid. As we’ve written in previous newsletters, we can foresee constraints to supply without required investments, which are at least $1 trillion behind schedule according to Shell’s CEO14. J.P. Morgan analysts also presented a case this quarter estimating the U.S. may potentially undershoot supply by 20% through the end of the decade15.
(12) Citigroup Global Markets; CCM Analysis. (13) AAA National Average Gas Price, 6/30/22. https://gasprices.aaa.com/. (14) Bloomberg, LP “Shell’s CEO Paints a Bleak Picture on Global Energy Supply”, June 29, 2022. (15) JP Morgan, “Global Energy Outlook”, April 20, 2022; Bloomberg, LP.
SEMI - ANNUAL REPORT 2022 ● 9
Unfortunately, the capacity solutions being discussed in the near term are not great for consumers. Producing more oil doesn’t solve the capacity issue. A gasoline tax holiday would only incentivize more demand when refiners are having a hard time keeping up as is. Relaxing the summertime Reid Vapor Pressure (RVP) rules could add anywhere from 100–500 thousand barrels per day (MBpd) of capacity, but relaxing would increase emissions (not favored by the Biden Administration and many of its constituents), and could introduce safety hazards (not favored by anyone).
The only plausible solution in the medium to long term would be for the government to get into the refining business since they have a history of absorbing zero or negative returns for greater societal benefits. We have seen no such discussion of this idea, and, at current, it is pure fantasy.
Freeport LNG
On June 8th, Freeport LNG, a private company with 12 million tons per annum (MTPA) of capacity (2.1 billion cubic feet (Bcf) per day), experienced a fire at its Quintana Isle Liquefaction facility, which caused the company to take all the capacity offline. On June 14th, the company announced the facility would be offline for 90 days and they do not expect a full restart until the end of the year. This end of the year guidance also assumes they have met all the requirements laid out by the Pipeline Hazardous Materials Safety Administration (PHMSA) on June 30th.
The results from this fire are positive and negative, beyond the one overwhelming positive that no one was injured. Because U.S. capacity to export natural gas is reduced, this means more supplies at home which translates to lower (relatively) natural gas prices for consumers, and a greater supply of gas to be placed in gas storage ahead of winter, though we still forecast natural gas storage be near the bottom of 5-year inventory levels heading into heating season. Unfortunately for global customers, particularly those in Europe who need it most, prices have surged even higher and there’s less available to fill for winter supplies. This has caused Germany, the Netherlands and others to turn coal facilities back on to create electricity while gas is stored for winter usage across various industries beyond just power generation.
As it relates to Midstream, gas pipelines are predominantly full and are expected to remain so. There is still a strong bid for the remaining 10 Bcf/d of international demand, summer has started particularly warm, and coal remains logistically constrained (the most recent example of capacity constraint), which has caused it to rise in price with natural gas, not in substitution of gas. Therefore, even though gas spot prices ended June approximately 43% lower than where they were before the fire, they remain supportive enough for producers to grow supplies in a disciplined manner to a growing market.
Recession Fears – Demand Destruction?
Increased odds of a U.S. recession and fears of demand destruction are the primary culprits we can fundamentally link to the weak quarterly performance. The higher expectations for recession are based on the -1.9% Q1:22 final gross domestic product (GDP)16 reading, and the Atlanta Fed recently decreasing Q2:22 GDP growth to -1.0% from 0.0% previously17. While we think the fundamental set up for crude oil remains strong due to the aforementioned capacity issues, we’re respectful that market perceptions of a recession could continue to bleed into commodity prices, fundamentally justified or not. Most investors and allocators we talk to agree with the fundamental story regarding their Midstream investment, but most of them also have concerns about what a potential swift decrease in the price of oil could do towards correlative performance. Let us try to look through these concerns.
Demand is still recovering, and due to the lack of capacity described above it appears there are more tailwinds than headwinds to fuel consumption. “Revenge travel” remains a strong theme summer-to-date, particularly with the additional holiday observed this year with Juneteenth18. We have seen a slowing of the incremental growth rate of consumption due to seasonality, but we’re still seeing modest growth, not demand destruction. Additionally, jet travel has started off strong this summer and should continue through the next few months as travelers typically book months in advance. Pertaining to Midstream companies with refined products pipelines, even if the forecasted recession broke historical course and turned demand growth negative, these assets should see little impact to cash flows19 due to the implementation of the annual tariff increase, which this year is ~8.7% higher.
(16) Gross Domestic Product (GDP): The monetary value of all goods and services produced within a country’s borders in a specific time period (typically one year). (17) Federal Reserve Bank of Atlanta, GDP Now, June 30, 2022. https://www.atlantafed.org/cqer/research/gdpnow (18) WSJ, “How America’s Summer Vacation Came Back Stronger Than Ever”, July 1, 2022.
10 | MainGate mlp fund
We do not negate the potential for a swift decrease in the price of oil in this volatile market, but that is not our base case. If it happens, we expect any move lower to be more technical than fundamental, and therefore, we would expect a quick recovery. Many of you know our thesis — the era of cheap oil is over. It is increasingly being articulated at major bank and commodities research houses, and this backdrop may continue through the end of the decade. We also find the below chart to be helpful. Ultimately, the chart highlights a pretty stable price cycle.
Commodities Around Recessions

Bloomberg LP
Currently, we see increasing global demand support as China emerges from its enforced Covid lockdowns. This is confirmed by Saudi Aramco’s August pricing to Asia, which confirmed a nearly $10 premium to Brent, indicating there may be a dislocation between physical markets and trading markets20. There’s also the potential for EU nations and their allies to impose sanctions on Russian crude oil, which would take more barrels off the market (would place upward pressure on price), or for Russia to weaponize exports as has been rumored in the press.
As it affects Midstream companies, we would see little impact to volumes or cash flow. Even if the price falls to $60 or 70 per barrel, for instance, producers are adequately compensated to produce oil in accordance with their budgeted plans whether the oil is consumed in the U.S. or goes to international destinations through export docks. Midstream companies would continue to benefit from this growth primarily on a fee-based basis.
“Greenflation” Impacting Transition Technologies
As global investors begin to understand the ramifications of the end of zero percent rates, we’re also witnessing what happens to the cost of the commodity inputs of energy transition investments due to inflation, politicization, substitution, supply chain constraints, and other factors, all of which are conveniently summarized as “greenflation”. In an unfortunate combination of the two, Ford announced commodity costs and interest rate assumptions have already wiped out the profitability of their heralded Mustang Mach-E21 – that was fast. Unsurprisingly to us, reality is broadening to the entire EV market forecast. Stellantis, the maker of Dodge, Chrysler, Jeep, Fiat and many other brands (14 total worldwide), is calling for greater balance in the transition to EVs, predicting “doom” due to commodity prices if automakers are forced to comply with global policy makers’ plans to phase out internal combustion engines. To comply with policy goals, they forecast commodity prices need to decrease 40% by 2030, which looks quite precarious given the current pricing environment22.
(19) Cash Flow: A measurement of the cash generating capability of a company by adding non-cash charges (e.g. depreciation) and interest expense to pretax income. (20) Bloomberg, LP “Saudis Raise Oil Prices to Near Record as Demand Seems Robust”, July 5, 2022. (21) Bloomberg, LP, “Ford’s Mustang Mach-E Profit Wiped Out by Commodity Costs”, June 14, 2022.
SEMI - ANNUAL REPORT 2022 ● 11
Prices for Metals Needed for the Energy Transition
Have Risen Dramatically Since Jan ‘21 (Price Increase Since Jan ‘21)
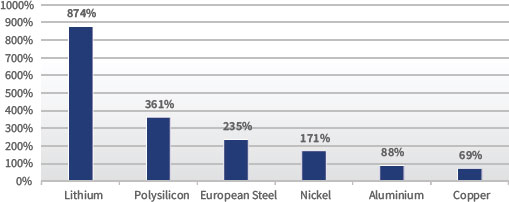
Bloomberg Finance L.P. from JP Morgan, “Global Energy Outlook”, April 20, 2022
And if the commodity prices weren’t enough to rethink the economics of scaling into the transition, we’re also seeing increased examples of electric vehicles that aren’t quite ready for prime time. Whether it’s battery fires23, loss of power24, or simply the wheels falling off25, the road to this part of the transition story looks bumpier than forecasted. While the costs are one thing, automakers need reliable products to help consumers get over other fears such as refueling, total cost of ownership, and long-term reliability if EV forecasts are to be achieved.
We strongly reiterate our support of a transition to a cleaner energy future, just one that is better balanced to create less economic and societal disruption. We also believe Midstream remains an excellent, and inexpensive, way to play the growth in transition assets over the next decade. In this quarter alone, 8 new energy transition projects were announced bringing the total announced projects to 59 in the past 15 months.
Items Worth a Quick Comment
On June 30th, the U.S. Supreme Court found in favor of the plaintiffs in West Virginia v. Environmental Protection Agency (EPA)26, asserting the EPA overstepped its bounds when it instituted the Clean Power Plan (CPP)27 during the Obama Administration28.
In short, this decision places the authority previously asserted by the EPA back with the legislative branch, in this case Congress, which must legislate regulatory action on the scale of the CPP, rather than have an Administration circumvent this process. Our opinion of this decision is similar to a general theme expressed in this letter and in prior commentary: this brings balance back to Energy Transition plans. If this decision had ruled in favor of the EPA, it would’ve emboldened a more aggressive path towards the transition, and, as we highlighted in Greenflation, this could’ve been devastating to the U.S. economic system. If nothing else, even though this wasn’t the intent, the CPP has pushed traditional energy companies to accelerate their own plans towards a cleaner future, which we expect to continue.
(22) Bloomberg, LP, “Stellantis Warns of Car Market Collapse If EVs Don’t Get Cheaper”, June 29, 2022. (23) Bloomberg, LP, “GM Resurrects Bolt EV with Ad Blitz Amid Federal Battery Probe”, April 6, 2022. (24) Bloomberg, LP, “Ford Recalls 48,924 Mustang Mach-Es in Setback for EV Plan”, June, 14, 2022. (25) Bloomberg, LP, “The Wheels Have Come off Electric Vehicles”, June 29, 2022. (26) Environmental Protection Agency (EPA): An agency of the U.S. federal government which was created for the purpose of protecting human health and the environment by writing and enforcing regulations based on laws passed by Congress. (27) Clean Power Plan: An Obama administration policy aimed at combating anthropogenic climate change (global warming) that was first proposed by the Environmental Protection Agency in June 2014. (28) WSJ, “Supreme Court Puts Brakes on EPA in Far-Reaching Decision”, June 30, 2022.
12 | MainGate mlp fund
There has also been media attention on the subject of a windfall profits tax on “energy” companies. This is much more than a long putt because as legal experts surmise this would take congressional approval, and the Senate’s swing voter Senator Joe Manchin (D, WV) – not to say any other of his party constituents – has said it’s a non-starter. Assuming this idea was to circumvent established precedent, we don’t see a scenario where Midstream becomes ensnared due to the mostly fee-based nature of their contracts.
Potential Total Return Components
We covered valuation29 in depth in the first quarter 2022 newsletter, and we think it is helpful in this letter to consider the components of total return as we think they remain favorable. Needless to say, with improved results, and an improved outlook, valuation became even more attractive with the AMZX’s Price/DCF closing at 5.6x as of 6/30/22. We believe Midstream remains one of the best values in the market.
As of 6/30/22, the forecasted 2022e distribution/dividend yield on the Portfolio was 7.2%. Consensus estimates indicate a 35.8% weighted average distribution/dividend growth rate in 2022e and 9.8% in 2023e30. Much of the 2022e growth rate was announced in 1H:22, but there is potential for additional growth this year as evidenced by the growth rate ticking higher 300 bps Q/Q. For this analysis, we’ll focus on the 9.8% estimate. Adding the 7.2% yield31 and the 9.8% distribution/dividend growth rate for 2023e, it would imply a potential distribution/dividend-based yield + growth expectation of 17%, undiscounted.
Taking a slightly different view to focus on organic growth of cash flow instead of distribution/dividend growth (removing management capital allocation decisions), the consensus 2022e DCF/u growth rate is 14.9% and 2023e is 6.9%, both of which we believe reflect conservativism32. Using the average growth on a rolling two-year basis, we arrive at 10.8% DCF/u growth plus a 7.2% yield, which implies a potential expectation of 18.0% total return, undiscounted.
In addition to not assuming any change in valuation, we would reiterate the strength of the Portfolio’s coverage ratio at 2.95x, and continue to rhetorically ask “what will these companies do with all the excess cash flow?” There is ample coverage to increase the return of capital to equity holders, and thusly the total return profile is well-supported by management capital allocation levers. Our position is consistent and we strongly reiterate our preference for buybacks at current valuations, while increasing cash distribution and dividends at more favorable valuation levels.
Conclusion
Thank you to our investors. Although Midstream equities closed the second quarter on a weaker note than expected, with an impressive fundamental quarter and improved outlook, we believe forward return expectations have only strengthened.
We covered a lot of ground in this letter to address numerous questions coming in from a number of investors and other market participants. If you’d like to dial into any of these topics in greater depth, we encourage you, as always, to reach out to your MainGate representative as we look forward to more fulsome discussions with you.
Sincerely,
 |
 |
| Geoffrey P. Mavar, Chairman | Matthew G. Mead, CEO |
(29) Valuation: The process of determining the current worth of an asset or a company. (30) This is not a forecast of the portfolio’s future performance. Yield growth for the portfolio’s holdings does not guarantee a corresponding increase in the market value of the holding or the portfolio. Distribution and dividend estimates sourced from Bloomberg, LP. (31) Yield: Refers to the interest or dividends received from a security and is usually expressed annually as a percentage based on the investment’s cost, its current market value or its face value. (32) Weighted average distributable cash flow growth refers to the estimated 2022 or 2023 (as indicated) weighted average Distributable Cash Flow (DCF) growth rate. DCF growth rate for the portfolio’s holdings does not guarantee a corresponding increase in the market value of the holding or the portfolio. DCF data is CCM-calculated consensus of Wall Street estimates.
SEMI - ANNUAL REPORT 2022 ● 13
PAST PERFORMANCE DOES NOT GUARANTEE FUTURE RESULTS.
The information contained in this report is authorized for use when preceded or accompanied by a prospectus.
Mutual fund investing involves risk. Principal loss is possible. The Fund is nondiversified, meaning it may concentrate its assets in fewer individual holdings than a diversified fund. Therefore, the Fund is more exposed to individual stock volatility than a diversified fund.
The Fund will invest in Master Limited Partnerships (MLPs) which concentrate investments in the natural resource sector and are subject to the risks of energy prices and demand and the volatility of commodity investments. Damage to facilities and infrastructure of MLPs may significantly affect the value of an investment and may incur environmental costs and liabilities due to the nature of their business. MLPs are subject to significant regulation and may be adversely affected by changes in the regulatory environment.
MLPs are subject to certain risks inherent in the structure of MLPs, including complex tax structure risks, limited ability for election or removal of management, limited voting rights, potential dependence on parent companies or sponsors for revenues to satisfy obligations, and potential conflicts of interest between partners, members and affiliates. When the Fund invests in MLPs that operate energy-related businesses, its return on investment will be highly dependent on energy prices, which can be highly volatile.
Tax Risks: An investment in the Fund does not receive the same tax advantages as a direct investment in the MLP. The Fund is treated as a regular corporation or “C” corporation and is therefore subject to U.S. federal income tax on its taxable income at rates applicable to corporations (currently at a rate of 21%) as well as state and local income taxes. MLP Funds accrue deferred income taxes for future tax liabilities associated with the portion of MLP distributions considered to be a tax- deferred return of capital and for any net operating gains as well as capital appreciation of its investments. This deferred tax liability is reflected in the daily NAV and as a result the MLP Fund’s after-tax performance could differ significantly from the underlying assets even if the pre-tax performance is closely tracked. The potential tax benefits from investing in MLPs depend on them being treated as partnerships for federal income tax purposes. If the MLP is deemed to be a corporation then its income would be subject to federal taxation, reducing the amount of cash available for distribution to the Fund which could result in a reduction of the Fund’s value.
Investments in smaller companies involve additional risks, such as limited liquidity and greater volatility. Investments in foreign securities involve greater volatility and political, economic and currency risks and differences in accounting methods.
Chickasaw Capital Management, LLC gives no guarantees with respect to the success of its investment management services and has not authorized any person to represent or guarantee any particular investment results. Any historical data provided herein are solely for the purpose of illustrating past performance and not as a representation or prediction that such performance could or will be achieved in the future. Securities are subject to numerous risks, including market, currency, economic, political and business risks. Investments in securities will not always be profitable, and investors may lose money, including principal. Past performance is no guarantee of future results. This is not an offer or solicitation with respect to the purchase or sale of any security.
Chickasaw Capital Management, LLC does not provide legal, tax or accounting advice. Any statement contained in this communication concerning U.S. tax matters is not intended or written to be used, and cannot be used, for the purpose of avoiding penalties imposed on the relevant taxpayer. Clients of Chickasaw Capital Management, LLC should obtain their own independent tax advice based on their particular circumstances. Opinions expressed are current opinions as of the date appearing in this material only. No part of this material may be copied, photocopied or duplicated in any form, by any means, or redistributed without the prior written consent of Chickasaw Capital Management, LLC.
Opinions expressed are those of Chickasaw Capital Management, LLC and are subject to change, are not guaranteed, and should not be considered investment advice.
Fund holdings and sector allocations are subject to change at any time and should not be considered a recommendation to buy or sell any security. Please refer to the schedule of investments for a complete listing of Fund holdings.
References to market or composite indices, benchmarks or other measures of relative market performance over a specified period of time (each, an “index”) are provided for your information only. Reference to this index does not imply that the portfolio will achieve returns, volatility or other results similar to the index. The composition of the index may not reflect the manner in which a portfolio is constructed in relation to expected or achieved returns, portfolio guidelines, restrictions, sectors, correlations, concentrations, volatility or tracking error targets, all of which are subject to change over time. Indices are unmanaged. The figures for the indices do not reflect the deduction of any fees or expenses which would reduce returns. Investors cannot invest directly in indices.
The Alerian MLP Index is a composite of the most prominent energy Master Limited Partnerships that provides investors with an unbiased, comprehensive benchmark for this emerging asset class. The index, which is calculated using a float-adjusted, capitalization-weighted methodology, is disseminated real-time on a price-return basis (NYSE: AMZ), and the corresponding total-return index is disseminated daily (NYSE: AMZX). Relevant data points such as dividend yield are also published daily. For index values, constituents, and announcements regarding constituent changes, please visit www.alerian.com.
“Alerian MLP Index”, “AlerianMLP Total Return Index”, “AMZ” and “AMZX” are service marks of GKD Index Partners, LLC d/b/a Alerian (“Alerian”) and their use is granted under a license from Alerian. Alerian does not guarantee the accuracy and/or completeness of the Alerian MLP Index or any data included therein and Alerian shall have no liability for any errors, omissions, interruptions or defects therein. Alerian makes no warranty, express or implied, representations or promises, as to results to be obtained by Licensee, or any other person or entity from the use of the Alerian MLP Index or any data included therein. Alerian makes no express or implied warranties, representations or promises, regarding the originality, merchantability, suitability, non-infringement, or fitness for a particular purpose or use with respect to the Alerian MLP Index or any data included therein. Without limiting any of the foregoing, in no event shall Alerian have any liability for any indirect, special, incidental, or consequential damages (including lost profits), arising out of the Alerian MLP Index or any data included therein, even if notified of the possibility of such damages.
The Energy MLP Classification Standard (“EMCS”) was developed by and is the exclusive property (and a service mark) of GKD Index Partners, LLC d/b/a Alerian (“Alerian”) and its use is granted under a license from Alerian. Alerian makes no warranties, express or implied, or representations with respect to such standard or classification (or the results to be obtained by the use thereof), and hereby expressly disclaims all warranties of originality, accuracy, completeness, merchantability, suitability, non-infringement, or fitness for a particular purpose with respect to any such standard or classification. No warranty is given that the standard or classification will conform to any description thereof or be free of omissions, errors, interruptions, or defects. Without limiting any of the foregoing, in no event shall Alerian have any liability for any indirect, special, incidental, or consequential damages (including lost profits), arising out of any such standard or classification, even if notified of the possibility of such damages.
S&P 500 Total Return Index tracks the total return of the S&P 500 Index, an index of 500 stocks chosen for market size, liquidity and industry grouping, among other factors. Dividends are reinvested. The S&P 500 is designed to be a leading indicator of U.S. equities and is meant to reflect the risk/return characteristics of the large cap universe.
The S&P 500 Energy comprises those companies included in the S&P 500 that are classified as members of the GICS® energy sector.
Brent is a blend of crude oil recovered from the North Sea in the early 1960s, whose price is used as a benchmark for the commodity’s prices.
Crack Spread: A crack spread refers to the overall pricing difference between a barrel of crude oil and the petroleum products refined from it. It is an industry-specific type of gross processing margin. The “crack” being referred to is an industry term for breaking apart crude oil into the component products, including gases like propane, heating fuel, gasoline, light distillates, like jet fuel, intermediate distillates, like diesel fuel, and heavy distillates, like grease.
Distributable Cash Flow (DCF) is calculated as net income plus depreciation and other noncash items, less maintenance capital expenditure requirements. Distributable cash flow (DCF) data is CCM calculated consensus of Wall Street estimates. The estimated consensus weighted average distributable cash flow (DCF) per unit growth rate for the AMZ and our Model Portfolio incorporates market expectations by using the average annual growth rate using rolling-forward 24-month data. DCF growth rate is not a forecast of the portfolio’s future performance. DCF growth rate for the portfolio’s holdings does not guarantee a corresponding increase in the market value of the holding or the portfolio.
Distribution Coverage Ratio is calculated as cash available to limited partners divided by cash distributed to limited partners. It gives an indication of an MLP’s ability to make dividend payments to limited partner investors from operating cash flows. MLPs with a coverage ratio of in excess of 1.0 times are able to meet their dividend payments without external financing.
Distributions are quarterly payments, similar to dividends, made to Limited Partner (LP) and General Partner (GP) investors. These amounts are set by the GP and are supported by an MLP’s operating cash flows.
EBITDA is earnings before interest rates taxes depreciation and amortization.
Leverage is net debt divided by EBITDA.
Yield refers to the cash dividend or distribution divided by the share or unit price at a particular point in time.
This material is provided for informational and educational purposes only and should not be construed as investment advice or an offer or solicitation to buy or sell any security, product or service.
Investment Advisor: Chickasaw Capital Management, LLC | 6075 Poplar Avenue, Memphis, Tennessee 38119 | p 901.537.1866 or 800.743.5410, f 901.537.1890 | [email protected]
Portfolio Managers: Geoffrey P. Mavar, Principal | Matthew G. Mead, Principal Earnings Growth is not a measure of the Fund’s future performance. Distributed by Quasar Distributors, LLC.
14 | MainGate mlp fund
Hypothetical Growth of a $10,000 Investment | unaudited

This chart illustrates the performance of a hypothetical $10,000 investment during the time period shown. Assumes reinvestment of dividends and capital gains. This chart does not imply any future performance.
Hypothetical Growth of a $1,000,000 Investment | unaudited

This chart illustrates the performance of a hypothetical $1,000,000 investment made in Class I shares during the time period shown. Assumes reinvestment of dividends and capital gains. This chart does not imply any future performance.
SEMI - ANNUAL REPORT 2022 ● 15
Average Annual Returns | May 31, 2022 | unaudited
| 1 Year | 5 Year | 10 Year | Since Inception | Inception Date | ||||||
| Class A (without sales load) | 36.60% | 1.75% | 3.43% | 3.41% | 2/17/11 | |||||
| Class A (with sales load) | 28.77% | 0.56% | 2.81% | 2.87% | 2/17/11 | |||||
| Class C | 35.54% | 0.97% | NA | -1.18% | 3/31/14 | |||||
| Class C (with CDSC) | 34.54% | 0.97% | NA | -1.18% | 3/31/14 | |||||
| Class I | 36.78% | 1.99% | 3.68% | 3.67% | 2/17/11 | |||||
| S&P 500 Index | -0.30% | 13.38% | 14.40% | 12.71% | 2/17/11 | |||||
| S&P 500 Index | -0.30% | 13.38% | NA | 12.31% | 3/31/14 | |||||
| Alerian MLP Total Return Index | 27.52% | 2.62% | 2.60% | 2.67% | 2/17/11 | |||||
| Alerian MLP Total Return Index | 27.52% | 2.62% | NA | -1.08% | 3/31/14 |
Performance data quoted represents past performance; past performance does not guarantee future results. The investment return and principal value of an investment will fluctuate so that an investor’s shares, when redeemed, may be worth more or less than their original cost. Current performance of the Fund may be lower or higher than the performance quoted. Performance data current to the most recent month end may be obtained by calling 855.MLP.FUND (855.657.3863) or by visiting www.maingatefunds.com.
Class A (with sales load) performance reflects the maximum sales charge of 5.75%. Class C (with CDSC) performance reflects the 1.00% contingent deferred sales charge. Class I is not subject to a sales charge or CDSC.
The S&P 500 Index is a broad based unmanaged index of 500 stocks, which is widely recognized as representative of the equity market in general. The Alerian MLP Total Return Index is a capped, float-adjusted, capitaliziation-weighted index, whose constituents earn the majority of their cash flow from midstream activities involving energy commodities.
You cannot invest directly in an index.
The graph and table do not reflect the deduction of taxes that a shareholder would pay on Fund distributions or the redemption of the Fund shares.
16 | MainGate mlp fund
As a shareholder of the Fund, you incur two types of costs: (1) transaction costs, including sales charges (loads) on purchase payments, reinvested dividends, or other distributions; and exchange fees; and (2) ongoing costs, including management fees; distribution and/or service (12b-1) fees; and other Fund expenses. This example is intended to help you understand your ongoing costs (in dollars) of investing in the Fund and to compare these costs with the ongoing costs of investing in other mutual funds. The example is based on an investment of $1,000 invested at the beginning of the period and held for the six-month period from December 1, 2021 to May 31, 2022.
Actual Expenses
For each class, the first line of the table below provides information about actual account values and actual expenses. You may use the information in this line, together with the amount you invested, to estimate the expenses that you paid over the period. Simply divide your account value by $1,000 (for example, an $8,600 account value divided by $1,000 = 8.6), then multiply the result by the number in the first line under the heading entitled “Expenses Paid During Period” to estimate the expenses you paid on your account during this period.
Hypothetical Example for Comparison Purposes
For each class, the second line of the table below provides information about hypothetical account values and hypothetical expenses based on the Fund’s actual expense ratio and an assumed rate of return of 5% per year before expenses, which is not the Fund’s actual return. The hypothetical account values and expenses may not be used to estimate the actual ending account balance or expense you paid for the period. You may use this information to compare the ongoing costs of investing in the Fund and other funds. To do so, compare this 5% hypothetical example with the 5% hypothetical examples that appear in the shareholder reports of the other funds.
Please note that the expenses shown in the table are meant to highlight your ongoing costs only and do not reflect any transactional costs, such as sales charges (loads) or exchange fees. Therefore, the second line of the table for each class is useful in comparing ongoing costs only, and will not help you determine the relative total costs of owning different funds. In addition, if transaction costs were included, your costs would have been higher.
| Beginning Account Value (12/01/21) |
Ending Account Value (5/31/22) |
Expenses Paid During Period(1) (12/01/21 – 5/31/22) |
Net Annualized Expense Ratio(2) |
|||||
| Class A Actual | $1,000.00 | $1,336.92 | $9.90 | 1.70% | ||||
| Class A Hypothetical | $1,000.00 | $1,016.45 | $8.55 | 1.70% | ||||
| (5% return before expenses) | ||||||||
| Class C Actual | $1,000.00 | $1,329.78 | $14.23 | 2.45% | ||||
| Class C Hypothetical | $1,000.00 | $1,012.72 | $12.29 | 2.45% | ||||
| (5% return before expenses) | ||||||||
| Class I Actual | $1,000.00 | $1,340.77 | $8.46 | 1.45% | ||||
| Class I Hypothetical | $1,000.00 | $1,017.70 | $7.29 | 1.45% | ||||
| (5% return before expenses) |
| (1) | Expenses are equal to the Fund’s annualized expense ratio multiplied by the average account value over the period, multiplied by 182 days (the number of days in the most recent period)/365 days (to reflect the period), for Class A, Class C and Class I. |
| (2) | Annualized expense ratio excludes current and deferred income and franchise tax expense. |
SEMI - ANNUAL REPORT 2022 ● 17
Allocation of Portfolio Assets
May 31, 2022 | unaudited
(expressed as a percentage of total investments)
 Natural Gas Gathering/Processing* Natural Gas Gathering/Processing* |
40.2% |
 Crude/Refined Products Pipelines and Storage* Crude/Refined Products Pipelines and Storage* |
36.8% |
 Natural Gas/Natural Gas Liquid Pipelines and Storage* Natural Gas/Natural Gas Liquid Pipelines and Storage* |
23.0% |

*Master Limited Partnerships and Related Companies
Schedule of Investments | May 31, 2022 | (as restated, note 10) | unaudited
| Master Limited Partnerships and Related Companies - 98.8%(1) | Shares | Fair Value | |||
| Crude/Refined Products Pipelines and Storage - 36.4%(1) | |||||
| Canada - 0.4%(1) | |||||
| Enbridge, Inc. | 80,000 | $3,692,000 | |||
| United States - 36.0%(1) | |||||
| Genesis Energy, L.P. | 1,675,000 | 20,502,000 | |||
| Magellan Midstream Partners, L.P. | 1,200,000 | 62,040,000 | |||
| MPLX, L.P. | 2,950,000 | 97,202,500 | |||
| Phillips 66 | 270,000 | 27,218,700 | |||
| Plains All American Pipeline, L.P. | 2,975,000 | 33,885,250 | |||
| Plains GP Holdings, L.P. | 3,750,000 | 44,850,000 | |||
| Shell Midstream Partners, L.P. | 1,400,000 | 19,796,000 | |||
| 305,494,450 | |||||
| Total Crude/Refined Products Pipelines and Storage | 309,186,450 | ||||
| Natural Gas/Natural Gas Liquid Pipelines and Storage - 22.7%(1) | |||||
| Canada - 0.4%(1) | |||||
| TC Energy Corporation | 60,000 | 3,470,400 | |||
| United States - 22.3%(1) | |||||
| Cheniere Energy, Inc. | 75,000 | 10,257,750 | |||
| Energy Transfer, L.P. | 7,700,000 | 89,782,000 | |||
| Enterprise Products Partners, L.P. | 2,325,000 | 63,751,500 | |||
| Kinder Morgan, Inc. | 425,000 | 8,368,250 | |||
| Williams Companies, Inc. | 480,000 | 17,788,800 | |||
| 189,948,300 | |||||
| Total Natural Gas/Natural Gas Liquid Pipelines and Storage | 193,418,700 | ||||
| Natural Gas Gathering/Processing - 39.7%(1) | |||||
| United States - 39.7%(1) | |||||
| Antero Midstream Corporation | 725,000 | 7,873,500 | |||
| Crestwood Equity Partners, L.P. | 400,000 | 11,656,000 | |||
| DCP Midstream, L.P. | 1,025,000 | 36,807,750 | |||
| Enlink Midstream, LLC | 6,900,000 | 78,660,000 | |||
| Targa Resources Corporation | 1,300,000 | 93,626,000 | |||
| Western Midstream Partners, L.P. | 3,940,000 | 108,941,000 | |||
| Total Natural Gas Gathering/Processing | 337,564,250 | ||||
| Total Master Limited Partnerships and Related Companies (Cost $392,510,396) | 840,169,400 | ||||
| Total Investments - 98.8% (Cost $392,510,396)(1) | 840,169,400 | ||||
| Other Assets in Excess of Liabilities - 1.2%(1) | 9,876,947 | ||||
| Net Assets - 100.0%(1) | $850,046,347 |
(1) Calculated as a percentage of net assets.
| 18 | | MainGate mlp fund | The accompanying notes are an integral part of the financial statements. |
Statement of Assets and Liabilities
May 31, 2022 | (as restated, note 10) | unaudited
Assets
| Investments at fair value (cost $392,510,396) | $840,169,400 |
| Cash(1) | 10,367,621 |
| Receivable for Fund shares sold | 1,374,820 |
| Dividends receivable | 378,104 |
| Prepaid expenses | 219,716 |
| Total assets | 852,509,661 |
| Liabilities | |
| Payable for Fund shares redeemed | 1,137,979 |
| Payable to Adviser | 866,700 |
| Payable for 12b-1 distribution fee | 47,643 |
| Payable to Trustees | 23,868 |
| Payable to Custodian | 9,767 |
| Accrued expenses and other liabilities | 377,357 |
| Total liabilities | 2,463,314 |
| Net assets | $850,046,347 |
| Net Assets Consist of | |
| Additional paid-in capital | $1,084,408,704 |
| Total distributable earnings, net of deferred taxes | (234,362,357) |
| Net assets | $850,046,347 |
| (1) | The Fund maintains cash in bank accounts which, at times, may exceed United States Federally insured limits. |
| Unlimited shares authorized, no par value | Class A | Class C | Class I |
| Net assets | $37,372,214 | $20,585,685 | $792,088,448 |
| Shares issued and outstanding | 5,569,144 | 3,293,296 | 112,788,303 |
| Net asset value, redemption price and minimum offering price per share | $6.71 | $6.25 | $7.02 |
| Maximum offering price per share ($6.71/0.9425) | $7.12 | NA | NA |
For the Six Months Ended
May 31, 2022 | (as restated, note 10) | unaudited
Investment Income
| Distributions received from master limited partnerships | $21,767,313 |
| Less: return of capital on distributions from master limited partnerships | (21,767,313) |
| Distribution income received in excess of return of capital | |
| from master limited partnerships | — |
| Dividends from common stock(2,3) | 7,023,625 |
| Total Investment Income | 7,023,625 |
| (2) | The return of capital amount from C-Corporations was $3,341,521. (See Note 2) |
| (3) | Net of foreign withholding tax of $31,751. |
Expenses
| Advisory fees | 4,998,953 |
| Administrator fees | 278,315 |
| Transfer agent expense | 141,071 |
| Insurance expense | 114,661 |
| Professional fees | 67,353 |
| Trustees’ fees | 47,868 |
| Registration fees | 44,166 |
| Compliance fees | 33,655 |
| Reports to shareholders | 31,976 |
| Custodian fees and expenses | 24,476 |
| Franchise tax expense | 12,466 |
| Fund accounting fees | 529 |
| 12b-1 distribution fee - Class A | 42,516 |
| 12b-1 distribution fee - Class C | 93,816 |
| Other expenses | 374 |
| Total Expenses | 5,932,195 |
| Net Investment Gain, before taxes | 1,091,430 |
| Current and deferred tax benefit/(expense)(4) | — |
| Net Investment Gain, net of taxes | 1,091,430 |
| Realized and Unrealized Gain/(Loss) on Investments | |
| Net realized gain/(loss) on investments, before taxes | 46,557,039 |
| Current and deferred tax benefit/(expense)(4) | — |
| Net realized gain/(loss) on investments, net of taxes | 46,557,039 |
| Net change in unrealized appreciation/depreciation on investments, before taxes | 191,979,441 |
| Deferred tax benefit/(expense)(4) | — |
| Net change in unrealized appreciation/depreciation on investments, net of taxes | 191,979,441 |
| Net realized and unrealized gain/(loss) on investments | 238,536,480 |
| Increase in Net Assets Resulting from Operations | $239,627,910 |
| (4) | Any tax benefit/(expense) was fully offset by a valuation allowance recorded as of May 31, 2022. |
| The accompanying notes are an integral part of the financial statements. | SEMI - ANNUAL REPORT 2022 ● 19 |
Statements of Changes in Net Assets
| For the Six Months | ||
| Operations | Ended May 31, 2022 | | |
| (as restated, note 10) | unaudited | Year Ended November 30, 2021 | |
| Net investment gain/(loss), net of deferred tax benefit/(expense) | $1,091,430 | $(10,146,785) |
| Net realized gain/(loss) on investments, net of deferred tax benefit/(expense) | 46,557,039 | (18,854,705) |
| Net change in unrealized appreciation/depreciation on investments, net of deferred tax benefit/(expense) | 191,979,441 | 317,060,430 |
| Increase/(Decrease) in net assets resulting from operations | 239,627,910 | 288,058,940 |
|
Dividends and Distributions to Class A Shareholders |
||
| Net investment income | (398,264) | (385,041) |
| Return of capital | (739,633) | (2,181,901) |
| Dividends and Distributions to Class C Shareholders | ||
| Net investment income | (232,986) | (233,611) |
| Return of capital | (432,688) | (1,323,793) |
| Dividends and Distributions to Class I Shareholders | ||
| Net investment income | (8,344,284) | (8,832,111) |
| Return of capital | (15,496,526) | (50,048,630) |
| Total dividends and distributions to Fund shareholders | (25,644,381) | (63,005,087) |
|
Capital Share Transactions (Note 8) |
||
| Proceeds from shareholder subscriptions | 58,692,591 | 139,804,363 |
| Dividend reinvestments | 21,127,433 | 51,077,187 |
| Payments for redemptions | (176,974,392) | (475,247,699) |
| Increase/(Decrease) in net assets from capital share transactions | (97,154,368) | (284,366,149) |
| Total increase/(decrease) in net assets | 116,829,161 | (59,312,296) |
|
Net Assets |
||
| Beginning of period | 733,217,186 | 792,529,482 |
| End of period | $850,046,347 | $733,217,186 |
| 20 | | MainGate mlp fund | The accompanying notes are an integral part of the financial statements. |
Financial Highlights: Class A Shares
| Per Share Data(1) | Six Months Ended May 31, 2022 | (as restated, note 10) | unaudited |
Year Ended November 30, 2021 |
Year Ended November 30, 2020 |
Year Ended November 30, 2019 |
Year Ended November 30, 2018 |
Year Ended November 30, 2017 |
| Net Asset Value, beginning of period | $5.15 | $3.91 | $5.65 | $7.17 | $8.25 | $9.89 |
| Income from Investment Operations | ||||||
| Net investment gain (loss)(2) | 0.00* | (0.07) | (0.06) | (0.05) | (0.09) | (0.11) |
| Net realized and unrealized gain (loss) on investments | 1.76 | 1.71 | (1.22) | (0.84) | (0.36) | (0.90) |
| Total increase (decrease) from investment operations | 1.76 | 1.64 | (1.28) | (0.89) | (0.45) | (1.01) |
| Less Distributions to Shareholders | ||||||
| Net investment income | (0.07) | (0.06) | — | — | — | — |
| Return of capital | (0.13) | (0.34) | (0.46) | (0.63) | (0.63) | (0.63) |
| Total distributions to shareholders | (0.20) | (0.40) | (0.46) | (0.63) | (0.63) | (0.63) |
| Net Asset Value, end of period | $6.71 | $5.15 | $3.91 | $5.65 | $7.17 | $8.25 |
| Total Investment Return | 34.54%(3) | 42.66% | (22.61)% | (13.71)% | (6.24)% | (10.86)% |
| Supplemental Data and Ratios | ||||||
| Net assets, end of period | $37,372,214 | $30,569,903 | $28,693,359 | $60,839,754 | $93,423,336 | $140,857,758 |
| Ratio of Expenses to Average Net Assets(4,5,6) | ||||||
| Net deferred income and franchise tax (benefit) expense | 0.00%‡ | 0.02% | 0.01% | 0.01% | 0.00%‡ | 0.01% |
| Expenses (excluding net deferred income and franchise tax (benefit) expense) before (waiver) recoupment | 1.70% | 1.68% | 1.72% | 1.69% | 1.66% | 1.65% |
| Expenses (excluding net deferred income and franchise tax (benefit) expense) after (waiver) recoupment | 1.70% | 1.68% | 1.72% | 1.69% | 1.66% | 1.65% |
| Expenses (including net deferred income and franchise tax (benefit) expense) before (waiver) recoupment | 1.70% | 1.70% | 1.73% | 1.70% | 1.66% | 1.66% |
| Net Fund Expenses(4,5,6) | 1.70% | 1.70% | 1.73% | 1.70% | 1.66% | 1.66% |
| Ratio of Net Investment Income (Loss) to Average Net Assets(4,5,6) | ||||||
| Net investment income (loss) (excluding net deferred tax benefit and franchise tax benefit (expense)) before waiver (recoupment) | 0.06% | (1.44)% | (1.32)% | (0.71)% | (1.05)% | (1.11)% |
| Net investment income (loss) (excluding net deferred tax benefit and franchise tax benefit (expense)) after waiver (recoupment) | 0.06% | (1.44)% | (1.32)% | (0.71)% | (1.05)% | (1.11)% |
| Net investment income (loss) (including net deferred tax benefit and franchise tax benefit (expense)) before waiver (recoupment) | 0.06% | (1.46)% | (1.33)% | (0.72)% | (1.05)% | (1.12)% |
| Net Investment Income (Loss)(4,5,6) | 0.06% | (1.46)% | (1.33)% | (0.72)% | (1.05)% | (1.12)% |
| Portfolio turnover rate(7) | 1.05%(3) | 20.80% | 36.65% | 66.39% | 44.57% | 19.35% |
* Less than one cent per share.
‡ Less than 0.01%.
(1) Information presented relates to a share of Class A for the entire period. (2) Calculated using average shares outstanding method. (3) Not annualized. (4) For periods less than one full year all income and expenses are annualized. (5) For the period from December 1, 2021 to May 31, 2022, the Fund accrued $12,466 in franchise tax expense, of which $530 is attributable to Class A. For the year ended November 30, 2021, the Fund accrued $149,925 in franchise tax expense, of which $5,904 is attributable to Class A. For the year ended November 30, 2020, the Fund accrued $87,319 in franchise tax expense, of which $3,733 is attributable to Class A. For the year ended November 30, 2019, the Fund accrued $85,100 in franchise tax expense, of which $5,253 is attributable to Class A. For the year ended November 30, 2018, the Fund accrued $26,903 in franchise tax expense, of which $1,982 is attributable to Class A. For the year ended November 30, 2017, the Fund accrued $148,000 in franchise tax expense, of which $14,756 is attributable to Class A. (6) The Fund did not accrue a deferred tax expense or benefit. (7) Portfolio turnover is calculated on the basis of the Fund as a whole without distinguishing between the classes of shares issued.
| The accompanying notes are an integral part of the financial statements. | SEMI - ANNUAL REPORT 2022 ● 21 |
Financial Highlights: Class C Shares
| Per Share Data(1) | Six Months Ended May 31, 2022 | (as restated, note 10) | unaudited |
Year Ended November 30, 2021 |
Year Ended November 30, 2020 |
Year Ended November 30, 2019 |
Year Ended November 30, 2018 |
Year Ended November 30, 2017 |
| Net Asset Value, beginning of period | $4.82 | $3.72 | $5.43 | $6.97 | $8.09 | $9.78 |
| Income from Investment Operations | ||||||
| Net investment loss(2) | (0.02) | (0.10) | (0.08) | (0.10) | (0.14) | (0.17) |
| Net realized and unrealized gain (loss) on investments | 1.65 | 1.60 | (1.17) | (0.81) | (0.35) | (0.89) |
| Total increase (decrease) from investment operations | 1.63 | 1.50 | (1.25) | (0.91) | (0.49) | (1.06) |
| Less Distributions to Shareholders | ||||||
| Net investment income | (0.07) | (0.06) | — | — | — | — |
| Return of capital | (0.13) | (0.34) | (0.46) | (0.63) | (0.63) | (0.63) |
| Total distributions to shareholders | (0.20) | (0.40) | (0.46) | (0.63) | (0.63) | (0.63) |
| Net Asset Value, end of period | $6.25 | $4.82 | $3.72 | $5.43 | $6.97 | $8.09 |
| Total Investment Return | 34.20%(3) | 41.02% | (22.99)% | (14.42)% | (6.88)% | (11.51)% |
| Supplemental Data and Ratios | ||||||
| Net assets, end of period | $20,585,685 | $17,119,406 | $16,108,024 | $33,310,916 | $52,049,211 | $62,803,141 |
| Ratio of Expenses to Average Net Assets(4,5,6) | ||||||
| Net deferred income and franchise tax (benefit) expense | 0.00%‡ | 0.02% | 0.01% | 0.01% | 0.00%‡ | 0.01% |
| Expenses (excluding net deferred income and franchise tax (benefit) expense) before (waiver) recoupment | 2.45% | 2.43% | 2.46% | 2.44% | 2.41% | 2.40% |
| Expenses (excluding net deferred income and franchise tax (benefit) expense) after (waiver) recoupment | 2.45% | 2.43% | 2.46% | 2.44% | 2.41% | 2.40% |
| Expenses (including net deferred income and franchise tax (benefit) expense) before (waiver) recoupment | 2.45% | 2.45% | 2.47% | 2.45% | 2.41% | 2.41% |
| Net Fund Expenses(4,5,6) | 2.45% | 2.45% | 2.47% | 2.45% | 2.41% | 2.41% |
| Ratio of Net Investment Income (Loss) to Average Net Assets(4,5,6) | ||||||
| Net investment income (loss) (excluding net deferred tax benefit and franchise tax benefit (expense)) before waiver (recoupment) | (0.69)% | (2.19)% | (2.06)% | (1.46)% | (1.80)% | (1.86)% |
| Net investment income (loss) (excluding net deferred tax benefit and franchise tax benefit (expense)) after waiver (recoupment) | (0.69)% | (2.19)% | (2.06)% | (1.46)% | (1.80)% | (1.86)% |
| Net investment income (loss) (including net deferred tax benefit and franchise tax benefit (expense)) before waiver (recoupment) | (0.69)% | (2.21)% | (2.07)% | (1.47)% | (1.80)% | (1.87)% |
| Net Investment Income (Loss)(4,5,6) | (0.69)% | (2.21)% | (2.07)% | (1.47)% | (1.80)% | (1.87)% |
| Portfolio turnover rate(7) | 1.05%(3) | 20.80% | 36.65% | 66.39% | 44.57% | 19.35% |
‡ Less than 0.01%.
(1) Information presented relates to a share of Class C for the entire period. (2) Calculated using average shares outstanding method. (3) Not annualized. (4) For periods less than one full year all income and expenses are annualized. (5) For the period from December 1, 2021 to May 31, 2022, the Fund accrued $12,466 in franchise tax expense, of which $292 is attributable to Class C. For the year ended November 30, 2021, the Fund accrued $149,925 in franchise tax expense, of which $3,367 is attributable to Class C. For the year ended November 30, 2020, the Fund accrued $87,319 in franchise tax expense, of which $2,149 is attributable to Class C. For the year ended November 30, 2019, the Fund accrued $85,100 in franchise tax expense, of which $2,996 is attributable to Class C. For the year ended November 30, 2018, the Fund accrued $26,903 in franchise tax expense, of which $1,007 is attributable to Class C. For the year ended November 30, 2017, the Fund accrued $148,000 in franchise tax expense, of which $5,467 is attributable to Class C. (6) The Fund did not accrue a deferred tax expense or benefit. (7) Portfolio turnover is calculated on the basis of the Fund as a whole without distinguishing between the classes of shares issued.
| 22 | | MainGate mlp fund | The accompanying notes are an integral part of the financial statements. |
Financial Highlights: Class I Shares
| Per Share Data(1) | Six Months Ended May 31, 2022 | (as restated, note 10) | unaudited |
Year Ended November 30, 2021 |
Year Ended November 30, 2020 |
Year Ended November 30, 2019 |
Year Ended November 30, 2018 |
Year Ended November 30, 2017 |
| Net Asset Value, beginning of period | $5.37 | $4.06 | $5.83 | $7.36 | $8.43 | $10.07 |
| Income from Investment Operations | ||||||
| Net investment gain (loss)(2) | 0.01 | (0.06) | (0.05) | (0.03) | (0.07) | (0.08) |
| Net realized and unrealized gain (loss) on investments | 1.84 | 1.77 | (1.26) | (0.87) | (0.37) | (0.93) |
| Total increase (decrease) from investment operations | 1.85 | 1.71 | (1.31) | (0.90) | (0.44) | (1.01) |
| Less Distributions to Shareholders | ||||||
| Net investment income | (0.07) | (0.06) | — | — | — | — |
| Return of capital | (0.13) | (0.34) | (0.46) | (0.63) | (0.63) | (0.63) |
| Total distributions to shareholders | (0.20) | (0.40) | (0.46) | (0.63) | (0.63) | (0.63) |
| Net Asset Value, end of period | $7.02 | $5.37 | $4.06 | $5.83 | $7.36 | $8.43 |
| Total Investment Return | 34.80%(3) | 42.82% | (22.42)% | (13.48)% | (5.98)% | (10.66)% |
| Supplemental Data and Ratios | ||||||
| Net assets, end of period | $792,088,448 | $685,527,877 | $747,728,099 | $967,800,549 | $1,220,133,792 | $1,403,597,144 |
| Ratio of Expenses to Average Net Assets(4,5,6) | ||||||
| Net deferred income and franchise tax (benefit) expense | 0.00%‡ | 0.02% | 0.01% | 0.01% | 0.00%‡ | 0.01% |
| Expenses (excluding net deferred income and franchise tax (benefit) expense) before (waiver) recoupment | 1.45% | 1.43% | 1.46% | 1.44% | 1.41% | 1.40% |
| Expenses (excluding net deferred income and franchise tax (benefit) expense) after (waiver) recoupment | 1.45% | 1.43% | 1.46% | 1.44% | 1.41% | 1.40% |
| Expenses (including net deferred income and franchise tax (benefit) expense) before (waiver) recoupment | 1.45% | 1.45% | 1.47% | 1.45% | 1.41% | 1.41% |
| Net Fund Expenses(4,5,6) | 1.45% | 1.45% | 1.47% | 1.45% | 1.41% | 1.41% |
| Ratio of Net Investment Income (Loss) to Average Net Assets(4,5,6) | ||||||
| Net investment income (loss) (excluding net deferred tax benefit and franchise tax benefit (expense)) before waiver (recoupment) | 0.31% | (1.19)% | (1.07)% | (0.46)% | (0.80)% | (0.86)% |
| Net investment income (loss) (excluding net deferred tax benefit and franchise tax benefit (expense)) after waiver (recoupment) | 0.31% | (1.19)% | (1.07)% | (0.46)% | (0.80)% | (0.86)% |
| Net investment income (loss) (including net deferred tax benefit and franchise tax benefit (expense)) before waiver (recoupment) | 0.31% | (1.21)% | (1.08)% | (0.47)% | (0.80)% | (0.87% |
| Net Investment Income (Loss)(4,5,6) | 0.31% | (1.21)% | (1.08)% | (0.47)% | (0.80)% | (0.87)% |
| Portfolio turnover rate(7) | 1.05%(3) | 20.80% | 36.65% | 66.39% | 44.57% | 19.35% |
‡ Less than 0.01%.
(1) Information presented relates to a share of Class I for the entire period. (2) Calculated using average shares outstanding method. (3) Not annualized. (4) For periods less than one full year all income and expenses are annualized. (5) For the period from December 1, 2021 to May 31, 2022, the Fund accrued $12,466 in franchise tax expense, of which $11,643 is attributable to Class I. For the year ended November 30, 2021, the Fund accrued $149,925 in franchise tax expense, of which $140,654 is attributable to Class I. For the year ended November 30, 2020, the Fund accrued $87,319 in franchise tax expense, of which $81,437 is attributable to Class I. For the year ended November 30, 2019, the Fund accrued $85,100 in franchise tax expense, of which $76,851 is attributable to Class I. For the year ended November 30, 2018, the Fund accrued $26,903 in franchise tax expense, of which $23,914 is attributable to Class I. For the year ended November 30, 2017, the Fund accrued $148,000 in franchise tax expense, of which $127,777 is attributable to Class I. (6) The Fund did not accrue a deferred tax expense or benefit. (7) Portfolio turnover is calculated on the basis of the Fund as a whole without distinguishing between the classes of shares issued.
| The accompanying notes are an integral part of the financial statements. | SEMI - ANNUAL REPORT 2022 ● 23 |
May 31, 2022 | unaudited
1. Organization
MainGate MLP Fund (the “Fund”), a series of MainGate Trust (the “Trust”), is registered under the Investment Company Act of 1940 as an open-end, non-diversified investment company. The Trust was established under the laws of Delaware by an Agreement and Declaration of Trust dated November 3, 2010. The Fund’s investment objective is total return. Class A and Class I commenced operations on February 17, 2011. Class C commenced operations on March 31, 2014.
The Fund offers three classes of shares: Class A, Class C and Class I. Depending on the size of the initial purchase, Class A shares are subject to a maximum 5.75% front-end sales charge or a 1.00% contingent deferred sales charge if shares are redeemed within 18 months. Class C shares have no front-end sales charge, but are subject to a 1.00% contingent deferred sales charge within 12 months of redemption. Class I shares have no sales charge. Class A shareholders pay Rule 12b-1 fees at the annual rate of 0.25% of average daily net assets. Class C shareholders pay Rule 12b-1 fees at the annual rate of 1.00% of average daily net assets. For the period ended May 31, 2022, contingent deferred sales charges of $– and $17 were incurred by Class A and Class C shareholders, respectively.
The Fund is an investment company and accordingly follows the investment company accounting and reporting guidance of the Financial Accounting Standards Board (FASB) Accounting Standards Board Codification Topic 946 Financial Services— Investment Companies.
2. Significant Accounting Policies
A. Use of Estimates. The preparation of financial statements in conformity with accounting principles generally accepted in the United States of America requires management to make estimates and assumptions that affect the reported amount of assets and liabilities and disclosure of contingent assets and liabilities at the date of the financial statements and the recognition of distribution income and the reported amounts of increases and decreases in net assets from operations during the reporting period. Actual results could differ from those estimates.
B. Investment Valuation. The Fund uses the following valuation methods to determine fair value as either current market value for investments for which market quotations are available, or if not available, a fair value, as determined in good faith pursuant to such policies and procedures as may be approved by the Trust’s Board of Trustees (“Board of Trustees”) from time to time. The valuation of the portfolio securities of the Fund currently includes the following processes:
| ● | Equity Securities: Securities listed on a securities exchange or an automated quotation system for which quotations are readily available, including securities traded over the counter, will be valued at the last quoted sale price on the principal exchange on which they are traded on the valuation date (or at approximately 4:00 p.m. Eastern Time if a security’s principal exchange is normally open at that time), or, if there is no such reported sale on the valuation date, at the most recent quoted bid price. |
| ● | Fixed Income Securities: Debt and fixed income securities will be priced by independent, third-party pricing agents approved by the Board of Trustees. These third-party pricing agents will employ methodologies that they believe are appropriate, including actual market transactions, broker-dealer supplied valuations, matrix pricing, or other electronic data processing techniques. These techniques generally consider such factors as security prices, yields, maturities, call features, ratings and developments relating to specific securities in arriving at valuations. Debt obligations with remaining maturities of sixty days or less will be valued at their amortized cost, which approximates fair market value. |
| ● | Foreign Securities: Foreign securities are often principally traded on markets that close at different hours than U.S. markets. Such securities will be valued at their most recent closing prices on the relevant principal exchange even if the close of that exchange is earlier than the time of the Fund’s net asset value (“NAV”) calculation. However, securities traded in foreign markets which remain open as of the time of the NAV calculation will be valued at the most recent sales price as of the time of the NAV calculation. In addition, prices for certain foreign securities may be obtained from the Fund’s approved pricing sources. The Adviser also monitors for the occurrence of significant events that may cast doubts on the reliability of previously obtained market prices for foreign securities held by the Fund. The prices for foreign securities will be reported in local currency and converted to U.S. dollars using currency exchange rates. Exchange rates will be provided daily by recognized independent pricing agents. The exchange rates used for the conversion will be captured as of the London close each day. |
C. Security Transactions, Investment Income and Expenses. Security transactions are accounted for on the date the securities are purchased or sold (trade date). Realized gains and losses are reported on a specific identified cost basis. Interest income is recognized on the accrual basis, including amortization of premiums and accretion of discounts. Distributions are recorded on the ex-dividend date. Distributions received from the Fund’s investments in master limited partnerships (“MLPs”), including MLP general partnership interests, generally are comprised of ordinary income and return of capital. Withholding taxes on foreign dividends have been provided for in accordance with the Fund’s understanding of the applicable country’s tax rules and regulations.
| 24 | | MainGate mlp fund | The accompanying notes are an integral part of the financial statements. |
For financial statement purposes, the Fund uses return of capital and income estimates to allocate the distribution income received. Such estimates are based on historical information available from each MLP and other industry sources. These estimates may subsequently be revised based on information received from MLPs after their tax reporting periods are concluded, as the actual character of these distributions is not known until after the fiscal year end of the Fund.
The Fund estimates the allocation of investment income and return of capital for the distributions received from MLPs within the Statement of Operations. For the period ended May 31, 2022, the Fund has estimated approximately 100% of the distributions from MLPs taxed as partnerships to be return of capital. Distributions from common stocks may also include income and return of capital. The Fund records the character of distributions received during the year based on estimates available. The characterization of distributions received by the Fund may be subsequently revised based on the information received from the MLPs and common stock after their tax reporting periods conclude.
Expenses are recorded on the accrual basis.
D. Dividends and Distributions to Shareholders (as restated, note 10). The Fund intends to make quarterly distributions from net income, which include the amount received as cash distributions from MLPs and common stock dividends. These activities will be reported in the Statements of Changes in Net Assets.
Dividends and distributions to shareholders are recorded on the ex- dividend date. Dividends are reinvested in the Fund unless specifically instructed otherwise by a shareholder. The character of dividends and distributions to shareholders made during the period may differ from their ultimate characterization for federal income tax purposes. For the period ended May 31, 2022, the Fund’s dividends and distributions were expected to be comprised of 35% income and 65% return of capital. The tax character of distributions paid for the period ended May 31, 2022, will be determined in early 2023.
E. Federal Income Taxation. The Fund, taxed as a corporation, is obligated to pay federal and state income tax on its taxable income. Currently, the federal income tax rate for a corporation is 21%.
The Fund invests its assets primarily in MLPs, which generally are treated as partnerships for federal income tax purposes. As a limited partner in the MLPs, the Fund reports its allocable share of the MLP’s taxable income in computing its own taxable income. The Fund’s tax expense or benefit is included in the Statement of Operations based on the component of income or gains (losses) to which such expense or benefit relates. Deferred income taxes reflect the net tax effects of temporary differences between the carrying amounts of assets and liabilities for financial reporting purposes and the amounts used for income tax purposes. A valuation allowance is recognized if, based on the weight of available evidence, it is more likely than not that some portion or all of the deferred income tax asset will not be realized.
The Fund’s policy is to classify interest and penalties associated with underpayment of federal and state income taxes as an income tax expense on the Statement of Operations. For the period ended May 31, 2022, the Fund did not have interest or penalties associated with underpayment of income taxes.
F. Indemnifications. Under the Fund’s organizational documents, its officers and trustees are indemnified against certain liabilities arising out of the performance of their duties to the Fund. In addition, in the normal course of business, the Fund may enter into contracts that provide general indemnification to other parties. The Fund’s maximum exposure under these arrangements is unknown, as this would involve future claims that may be made against the Fund that have not yet occurred, and may not occur. However, the Fund has not had prior claims or losses pursuant to these contracts.
3. Fair Value Measurements
Various inputs that are used in determining the fair value of the Fund’s investments are summarized in the three broad levels listed below:
| ● | Level 1: unadjusted quoted prices in active markets for identical securities that the Fund has the ability to access |
| ● | Level 2: other significant observable inputs (including quoted prices for similar securities, interest rates, prepayment speeds, credit risk, etc.) |
| ● | Level 3: significant unobservable inputs (including the Fund’s own assumptions in determining the fair value of investments) |
The inputs or methodology used for valuing securities are not necessarily an indication of the risk associated with investing in those securities.
These inputs are summarized in the three broad levels that follow.
SEMI - ANNUAL REPORT 2022 ● 25
| Fair Value Measurements at Reporting Date Using: | ||||||||
| Description | Fair Value at May 31, 2022 |
Quoted Prices in Active Markets for Identical Assets (Level 1) |
Significant Other Observable Inputs (Level 2) |
Significant Unobservable Inputs (Level 3) |
||||
| Equity Securities | ||||||||
| Master Limited Partnerships and and Related Companies(1) | $840,169,400 | $840,169,400 | $— | $— | ||||
| Total | $840,169,400 | $840,169,400 | $— | $— | ||||
(1) All other industry classifications are identified in the Schedule of Investments.
4. Concentration Risk
The Fund seeks to achieve its investment objective by investing, under normal market conditions, at least 80% of its net assets (plus any borrowings for investment purposes) in MLP interests under normal circumstances as determined in the prospectus.
5. Agreements and Related Party Transactions
The Trust has entered into an Investment Advisory Agreement (the “Agreement”) with Chickasaw Capital Management, LLC (the “Adviser”). Under the terms of the Agreement, the Fund pays the Adviser a fee, payable at the end of each calendar month, at an annual rate equal to 1.25% of the average daily net assets of the Fund.
The Adviser has agreed to waive its advisory fee and/or reimburse certain operating expenses of the Fund, until at least March 31, 2023, but only to the extent necessary so that the Fund’s total annual expenses, excluding brokerage fees and commissions; borrowing costs (such as (a) interest and (b) dividend expenses on securities sold short); taxes, including deferred income tax expense/(benefit) and franchise taxes; any indirect expenses, such as acquired fund fees and expenses; Class A 12b-1 fees, Class C 12b-1 fees, and extraordinary expenses, do not exceed 1.50% of the average daily net assets of each class of the Fund. Any payment by the Adviser of the Fund’s operating, organizational and offering expenses are subject to repayment by the Fund in the three fiscal years following the fiscal year in which the payment was made; provided that the Fund is able to make the repayment without exceeding the 1.50% expense limitation.
Waived fees and reimbursed Fund expenses, including prior year expenses, are subject to potential recoupment by year of expiration. During the period ended May 31, 2022, the Fund did not waive or recoup expenses. At May 31, 2022, there were no prior year amounts subject to potential recoupment.
Certain Trustees and Officers of the Trust/Fund are also Officers of the Adviser or Vigilant Compliance, LLC (“Vigilant”).
The Fund has engaged Vigilant to provide compliance services including the appointment of the Fund’s Chief Compliance Officer. Effective October 1, 2015, the Fund pays Vigilant a monthly fee of $4,728 for net assets up to $1.7 billion, $5,228 for net assets between $1.7 billion and $2.0 billion, $5,728 for net assets between $2.0 billion and $2.5 billion, and $6,000 for net assets above $2.5 billion with each rate subject to a 2% annual increase.
Quasar Distributors, LLC (“Quasar”), a wholly owned broker-dealer subsidiary of Foreside Financial Group, LLC (“Foreside”), serves as the Fund’s distributor. The Fund has adopted a plan of distribution under Rule 12b-1 of the 1940 Act applicable to Class A and Class C shares. Class A shareholders pay Rule 12b-1 fees at the annual rate of 0.25% of average daily net assets. Class C shareholders pay Rule 12b-1 fees at the annual rate of 1.00% of average daily net assets. For the period ended May 31, 2022, 12b-1 distribution expenses of $42,516 and $93,816 were accrued by Class A and Class C shares, respectively.
The Fund reimbursed the Advisor for fees paid to financial intermediaries such as banks, broker-dealers, financial advisors or other financial institutions for sub-transfer agency, sub-administration and other services that the financial intermediaries provided to their clients. The financial intermediaries are the record owners of the Fund on the Fund’s records through omnibus accounts, other group accounts, retirement plans or accounts traded through registered securities clearing agents. These fees are fees that the Fund is obligated to pay to such intermediaries, and the fees may vary based on, for example, the nature of services provided. The fees paid to such intermediaries by the Fund is only a portion of the full fee that is paid to the intermediaries, and the Advisor is obligated to pay the remaining amount. These amounts are included within 12b-1 distribution fees on the Statement of Operations.
26 | MainGate mlp fund
The Fund has engaged U.S. Bancorp Fund Services, LLC d/b/a U.S. Bank Global Fund Services (“Fund Services”) to provide administration and accounting services to the Fund. The Fund pays Fund Services a monthly fee computed at an annual rate of 0.10% of the first $75,000,000 of the Fund’s average daily net assets, 0.08% on the next $250,000,000 of average daily net assets and 0.05% on the balance of the Fund’s average daily net assets, with a minimum annual fee of $64,000 plus $12,000 per share class fee, imposed upon the Fund reaching certain asset levels.
Fund Services serves as the Fund’s transfer agent, dividend paying agent, and agent for the automatic dividend reinvestment plan. The Fund pays the transfer agent a $45,000 flat fee, imposed upon the Fund reaching certain asset levels, plus transaction and other out-of-pocket charges.
U.S. Bank, N.A. serves as the Fund’s custodian. The Fund pays the custodian a monthly fee computed at an annual rate of 0.0075% of the first $250 million of market value and 0.0050% of the balance, with a minimum annual fee of $4,800, imposed upon Fund reaching certain asset levels, plus transaction and other out-of-pocket charges.
6. Income Taxes
Deferred income taxes reflect the net tax effects of temporary differences between the carrying amounts of assets and liabilities for financial reporting purposes and the amounts used for income tax purposes. Such temporary differences are principally:
(i) taxes on unrealized gains/(losses), which are attributable to the temporary difference between fair market value and tax basis, (ii) the net tax effects of temporary differences between the carrying amounts of assets and liabilities for financial reporting and income tax purposes and (iii) the net tax benefit of accumulated net operating losses and capital loss carryforwards. Deferred tax assets and liabilities are measured using effective tax rates expected to apply to taxable income in the years such temporary differences are realized or otherwise settled. To the extent the Fund has a deferred tax asset, consideration is given to whether or not a valuation allowance is required. A valuation allowance is required if, based on the evaluation criterion provided by ASC 740, Income Taxes (ASC 740), it is more likely-than-not some portion or all of the deferred tax asset will not be realized. Among the factors considered in assessing the Fund’s valuation allowance are: the nature, frequency and severity of current and cumulative losses, forecasts of future profitability, the duration of the statutory carryforward periods, significant redemptions, and the associated risks that operating and capital loss carryforwards may expire unused.
At May 31, 2022, the Fund determined a valuation allowance was required.
Changes to the factors considered in assessing the Fund’s valuation allowance may result in the Fund revising its position as to the recoverability of its deferred tax assets which may result in a change to the valuation allowance at a later date and could have a material impact on the Fund’s net asset value and results of operations in the period it is recorded.
Components of the Fund’s deferred tax assets and liabilities as of May 31, 2022, are as follows:
Deferred tax assets:
| Net operating loss carryforward (tax basis) | $53,114,302 |
| Capital loss carryforward (tax basis) | 71,101,833 |
| Other | 29,641 |
| Total deferred tax asset | 124,245,776 |
| Valuation allowance | (31,471,934) |
| Less: Deferred tax liabilities: | |
| Unrealized gains on investment securities (tax basis) – net | 92,773,842 |
| Net deferred tax asset | $— |
The net operating loss carryforward is available to offset future taxable income. The Fund has the following net operating loss and capital loss carryforward amounts:
| Fiscal Period Ended Net Operating Loss | Amount | Expiration |
| November 30, 2015 | $5,246,685 | November 30, 2035 |
| November 30, 2016 | 62,681,569 | November 30, 2036 |
| November 30, 2017 | 77,956,625 | November 30, 2037 |
| November 30, 2018 | 46,816,412 | November 30, 2038 |
| November 30, 2020 | 23,244,346 | Indefinite |
| November 30, 2021 | 18,283,404 | Indefinite |
| Total Fiscal Period Ended Net Operating Loss | $234,229,041 |
During the period ended May 31, 2022, the Fund utilized $5,548,079 of NOLs.
| Fiscal Period Ended Net Capital Loss | Amount | Expiration |
| November 30, 2018 | $9,656,541 | November 30, 2023 |
| November 30, 2019 | 146,554,196 | November 30, 2024 |
| November 30, 2020 | 160,284,519 | November 30, 2025 |
| Total Fiscal Period Ended Net Capital Loss | $316,495,256 |
During the period ended May 31, 2022, the Fund utilized $22,045,729 of capital loss carry forwards.
SEMI - ANNUAL REPORT 2022 ● 27
For corporations, capital losses can only be used to offset capital gains and cannot be used to offset ordinary income. The capital loss may be carried forward for 5 years and, accordingly, would begin to expire as of November 30, 2022. The net operating loss prior to the Tax Cuts and Jobs Act (“TCJA”) can be carried forward for 20 years and, accordingly, would begin to expire as of November 30, 2035. Any net operating losses arising in tax years beginning after December 31, 2017 will have an indefinite carry forward period. The TCJA also established a limitation for any net operating losses generated in tax years beginning after December 31, 2017 to the lesser of the aggregate of available net operating losses or 80% of taxable income before any net operating losses utilization. On March 27, 2020 the Coronavirus Aid, Relief, and Economic Stability Act (CARES Act) was signed into law. The CARES Act delays the application of the 80% net operating loss limitation to tax years ending November 30, 2022 and beyond.
Total income tax expense (current and deferred) differs from the amount computed by applying the federal statutory income tax rate of 21% to net investment income (loss) and realized and unrealized gains (losses) on investments before taxes for the period ended May 31, 2022, as follows:
| Total Tax Expense (Benefit) | Amount | Rate |
| Tax Expense (Benefit) at Statutory Rates | $50,321,860 | 21.00% |
| State Income Tax Expense (Benefit) | ||
| (Net of Federal Benefit) | 3,511,438 | 1.47% |
| Tax Expense (Benefit) on Permanent Items(1) | 3,665 | 0.00% |
| Provision to Return Adjustment | (1,398,844) | (0.58)% |
| Change in State Rate | 340,716 | 0.14% |
| Change in Valuation Allowance | (52,778,835) | (22.03)% |
| Total Tax Expense (Benefit) | 0.00% |
(1) Permanent Items are made up of dividends received deductions, non-deductible expenses from K-1s, and tax exempt income from K-1s.
At May 31, 2022, the Fund did not have current or deferred tax expense or benefit due to the use of NOL and capital loss carryforwards which are fully offset by a valuation allowance.
At May 31, 2022, the tax cost basis of investments was $409,121,612 and gross unrealized appreciation and depreciation of investments for federal income tax purposes were as follows:
| Gross unrealized appreciation | $444,314,380 |
| Gross unrealized depreciation | (13,266,592) |
| Net unrealized appreciation | $431,047,778 |
The differences between book-basis and tax-basis unrealized appreciation (depreciation) are primarily due to timing differences of income recognition from the Fund’s MLP investments and wash sales on security transactions.
The Fund recognizes the tax benefits of uncertain tax positions only where the position is “more likely than not” to be sustained assuming examination by tax authorities. Management has analyzed the Fund’s tax positions, and has concluded that no liability for unrecognized tax benefits should be recorded related to uncertain tax positions taken on U.S. tax returns and state tax returns filed or expected to be filed since inception of the Fund. No income tax returns are currently under examination. The tax years since 2018 remain subject to examination by the tax authorities in the United States. Due to the nature of the Fund’s investments, the Fund may be required to file income tax returns in several states. The Fund is not aware of any tax positions for which it is reasonably possible that the total amounts of unrecognized tax benefits will change materially in the next 12 months.
7. Investment Transactions
For the period ended May 31, 2022, the Fund purchased (at cost) and sold securities (proceeds) in the amount of $8,335,028 and $115,339,408 (excluding short-term securities), respectively.
28 | MainGate mlp fund
8. Share Transactions
Transactions of shares of the Fund were as follows:
| For the Six Months Ended May 31, 2022 | Year Ended November 30, 2021 | |||||||
| Class A Shares | Amount | Shares | Amount | Shares | ||||
| Sold | $2,121,879 | 347,463 | $2,819,037 | 578,401 | ||||
| Dividends Reinvested | 972,154 | 157,264 | 2,163,880 | 437,998 | ||||
| Redeemed | (5,207,877) | (876,486) | (11,627,502) | (2,407,559) | ||||
| Net Decrease | $(2,113,844) | (371,759) | $(6,644,585) | (1,391,160) | ||||
| For the Six Months Ended May 31, 2022 | Year Ended November 30, 2021 | |||||||
| Class C Shares | Amount | Shares | Amount | Shares | ||||
| Sold | $360,814 | 66,240 | $802,078 | 186,428 | ||||
| Dividends Reinvested | 543,629 | 94,289 | 1,287,797 | 276,686 | ||||
| Redeemed | (2,232,071) | (417,516) | (5,706,264) | (1,248,560) | ||||
| Net Decrease | $(1,327,628) | (256,987) | $(3,616,389) | (785,446) | ||||
| For the Six Months Ended May 31, 2022 | Year Ended November 30, 2021 | |||||||
| Class I Shares | Amount | Shares | Amount | Shares | ||||
| Sold | $56,209,898 | 9,145,544 | $136,183,248 | 26,584,269 | ||||
| Dividends Reinvested | 19,611,650 | 3,042,753 | 47,625,510 | 9,345,027 | ||||
| Redeemed | (169,534,444) | (27,037,626) | (457,913,933) | (92,328,898) | ||||
| Net Decrease | $(93,712,896) | (14,849,329) | $(274,105,175) | (56,399,602) | ||||
9. Risk Factors
The global outbreak of COVID-19 has disrupted economic markets and the prolonged economic impact is uncertain. The operational and financial performance of the issuers of securities in which the Fund invests depends on future developments, including the duration and spread of the outbreak, and such uncertainty may in turn impact the value of the Fund’s investments. COVID-19 has had a material adverse effect on global, national and local economies, which could impact MLPs and midstream companies in which the Fund invests as a result of lower energy prices and an uncertain outlook, which could limit production growth and drive increased credit risk for MLP counterparties.
Global tensions, particularly between Russia, the U.S. and a number of European states, have heightened significantly as a result of Russia’s invasion of Ukraine, and the escalation of hostilities between the two countries. The outbreak of hostilities between the two countries could result in more widespread conflict and could have a severe adverse effect on the region and the markets. In addition, sanctions imposed on Russia by the United States and other countries, and any sanctions imposed in the future could have a significant adverse impact on the Russian economy and related markets. The price and liquidity of investments may fluctuate widely as a result of the conflict and related events. How long such conflict and related events will last and whether it will escalate further cannot be predicted, nor its effect on the Fund.
10. Restatement
Subsequent to the issuance of the May 31, 2022 financial statements, the Fund determined that the name of an investment in the Schedule of Investments and certain information in the Statement of Operations were not properly reported in the financial statements.
Additionally, the Fund determined that the characterization of distributions to shareholders presented in the financial statements as either ordinary income or return of capital had not been properly accounted for on the financial statements of the Fund.
As a result, the Fund has restated each of its Schedule of Investments, Statement of Assets and Liabilities, Statement of Operations, Statements of Changes in Net Assets, and Financial Highlights, as of and for the six months ended May 31, 2022. In addition to the restated financial statements, the information contained in Note 2.D. to the financial statements was restated as part of the restatement.
SEMI - ANNUAL REPORT 2022 ● 29
The restatement adjustments had no effect on the reported shares, fair values or cost of investments, as reported in the Schedule of Investments; the reported total investment income or net investment gain, as reported in the Statement of Operations; or the reported net assets or net asset values, as reported throughout the financial statements.
The following summarizes the impact of the restatement and excludes balances that were not restated:
Schedule of Investments
May 31, 2022 | (as restated, note 10) | unaudited
| Previously Reported | As Restated |
| Phillips 66 Partners, L.P. | Phillips 66 |
| Statement of Assets and Liabilities | ||||
| May 31, 2022 | (as restated, note 10) | unaudited | ||||
| Net Assets Consist of | ||||
| Previously Reported | As Restated | |||
| Additional paid-in capital | $1,101,077,551 | $1,084,408,704 | ||
| Total distributable earnings, net of deferred taxes | (251,031,204) | (234,362,357) |
Statement of Operations
For the Six Months Ended May 31, 2022 | (as restated, note 10) | unaudited
| Investment Income | ||||
| Previously Reported | As Restated | |||
| Distributions received from master limited partnerships | $52,529,635 | $21,767,313 | ||
| Less: return of capital on distributions from master limited partnerships | (52,529,635) | (21,767,313) |
| Previously Reported | As Restated |
| (2) The return of capital amount from C-Corporations was $7,217,115. (See Note 2) | (2) The return of capital amount from C-Corporations was $3,341,521. (See Note 2) |
| (3) Net of foreign withholding tax of $91,013. | (3) Net of foreign withholding tax of $31,751. |
Statements of Changes in Net Assets
| Operations | For the Six Months Ended May 31, 2022 | (as restated, note 10) | unaudited | ||||
| Previously Reported | As Restated | ||||
| Dividends and Distributions to Class A Shareholders | |||||
| Net investment income | ($1,137,897) | ($398,264) | |||
| Return of capital | — | (739,633) | |||
| Dividends and Distributions to Class C Shareholders | |||||
| Net investment income | (665,674) | (232,986) | |||
| Return of capital | — | (432,688) | |||
| Dividends and Distributions to Class I Shareholders | |||||
| Net investment income | (23,840,810) | (8,344,284) | |||
| Return of capital | — | (15,496,526) | |||
30 | MainGate mlp fund
Financial Highlights: Class A Shares
| Per Share Data(1) | Six Months Ended May 31, 2022 | (as restated, note 10) | unaudited | ||||
| Less Distributions to Shareholders | |||||
| Previously Reported | As Restated | ||||
| Net investment income | ($0.20) | ($0.07) | |||
| Return of capital | — | (0.13) | |||
Financial Highlights: Class C Shares
| Per Share Data(1) | Six Months Ended May 31, 2022 | (as restated, note 10) | unaudited | ||||
| Less Distributions to Shareholders | |||||
| Previously Reported | As Restated | ||||
| Net investment income | ($0.20) | ($0.07) | |||
| Return of capital | — | (0.13) | |||
Financial Highlights: Class I Shares
| Per Share Data(1) | Six Months Ended May 31, 2022 | (as restated, note 10) | unaudited | ||||
| Less Distributions to Shareholders | |||||
| Previously Reported | As Restated | ||||
| Net investment income | ($0.20) | ($0.07) | |||
| Return of capital | — | (0.13) | |||
Notes to Financial Statements
May 31, 2022 | (as restated, note 10) | unaudited
Previously Reported
D. Dividends and Distributions to Shareholders. The Fund intends to make quarterly distributions from net income, which include the amount received as cash distributions from MLPs and common stock dividends. These activities will be reported in the Statements of Changes in Net Assets.
Dividends and distributions to shareholders are recorded on the ex- dividend date. The character of dividends and distributions to shareholders made during the period may differ from their ultimate characterization for federal income tax purposes. For the period ended May 31, 2022, the Fund’s dividends and distributions were expected to be comprised of 100% income. The tax character of distributions paid for the period ended May 31, 2022, will be determined in early 2023.
As Restated
D. Dividends and Distributions to Shareholders (as restated, note 10). The Fund intends to make quarterly distributions from net income, which include the amount received as cash distributions from MLPs and common stock dividends. These activities will be reported in the Statements of Changes in Net Assets.
Dividends and distributions to shareholders are recorded on the ex- dividend date. Dividends are reinvested in the Fund unless specifically instructed otherwise by a shareholder. The character of dividends and distributions to shareholders made during the period may differ from their ultimate characterization for federal income tax purposes. For the period ended May 31, 2022, the Fund’s dividends and distributions were expected to be comprised of 35% income and 65% return of capital. The tax character of distributions paid for the period ended May 31, 2022, will be determined in early 2023.
SEMI - ANNUAL REPORT 2022 ● 31
11. Subsequent Events
The Fund has adopted standards which establish general standards of accounting for disclosure of events that occur after the Statement of Assets and Liabilities date, but before the financial statements are issued. The Fund has performed an evaluation of subsequent events through the date the financial statements were issued.
On July 18, 2022 the Fund declared a distribution payable of $0.100 per share, to Class A shareholders, Class C shareholders, and Class I shareholders of record on July 19, 2022, and payable on July 20, 2022.
May 31, 2022 | unaudited
Trustee and Officer Compensation
The Fund does not compensate any of its trustees who are interested persons nor any of its officers. For the period ended May 31, 2022, the aggregate compensation paid by the Fund to the independent trustees was $48,000. The Fund did not pay any special compensation to any of its trustees or officers. The Fund’s Statement of Additional Information includes additional information about the trustees and is available on the Fund’s Web site at www.maingatefunds.com or the SEC’s Web site at www.sec.gov.
Cautionary Note Regarding
Forward-Looking Statements
This report contains “forward-looking statements” as defined under the U.S. federal securities laws. Generally, the words “believe,” “expect,” “intend,” “estimate,” “anticipate,” “project,” “will” and similar expressions identify forward-looking statements, which generally are not historical in nature. Forward-looking statements are subject to certain risks and uncertainties that could cause actual results to materially differ from the Fund’s historical experience and its present expectations or projections indicated in any forward-looking statements. These risks include, but are not limited to, changes in economic and political conditions; regulatory and legal changes; MLP industry risk; concentration risk; energy sector risk; commodities risk; MLP and other tax risks, such as deferred tax assets and liabilities risk; and other risks discussed in the Fund’s filings with the SEC. You should not place undue reliance on forward-looking statements, which speak only as of the date they are made. The Fund undertakes no obligation to update or revise any forward-looking statements made herein. There is no assurance that the Fund’s investment objectives will be attained.
Proxy Voting Policies
A description of the policies and procedures that the Fund uses to determine how to vote proxies relating to portfolio securities owned by the Fund and information regarding how the Fund voted proxies relating to the portfolio of securities during the most recent 12-month period ended June 30 is available to shareholders without charge by visiting the SEC’s Web site at www.sec.gov.
Portfolio Holdings Disclosure
The Fund files its complete schedule of portfolio holdings for the first and third quarters of each fiscal year with the SEC on Part F of Form N-PORT. The Fund’s Part F of Form N-PORT and statement of additional information are available without charge by visiting the SEC’s Web site at www.sec.gov. In addition, you may review and copy the Fund’s Part F of Form N-PORT at the SEC’s Public Reference Room in Washington D.C. You may obtain information on the operation of the Public Reference Room by calling (800) SEC-0330.
Householding
In an effort to decrease costs, the Fund intends to reduce the number of duplicate prospectuses, annual and semi-annual reports, proxy statements and other similar documents you receive by sending only one copy of each to those addresses shared by two or more accounts and to shareholders that the Transfer Agent reasonably believes are from the same family or household. Once implemented, if you would like to discontinue householding for your accounts, please call toll-free at 855.MLP.FUND (855.657.3863) to request individual copies of these documents. Once the Transfer Agent receives notice to stop householding, the Transfer Agent will begin sending individual copies thirty days after receiving your request. This policy does not apply to account statements.
Liquidity Risk Management Program | unaudited
In accordance with Rule 22e-4 under the Investment Company Act of 1940, as amended, the Fund has adopted a written liquidity risk management program (the “Program”) designed to assess and manage the Fund’s liquidity risk, which is the risk that the Fund could not meet shareholder redemption requests without significant dilution of remaining Fund shareholders. The Board of Trustees has approved the appointment of the Adviser to administer the Program. The Adviser uses certain market and liquidity classification data provided by a third party in fulfilling its responsibilities as the administrator of the Program.
32 | MainGate mlp fund
Rule 22e-4 and the Program further require the Board of Trustees to review, no less frequently than annually, a written report prepared by the Adviser that addresses the operation of the Program and assesses its adequacy and effectiveness of implementation, including, if applicable, any material changes to the Program. The Adviser presented an annual report on the Program to the Board of Trustees at a meeting of the Board of Trustees held in April 2022. The report covered the period of April 1, 2021 to March 31, 2022 and addressed the assessment, management and review of the Fund’s liquidity risk by the Adviser as administrator of the Program, as well as the Adviser’s classification of the liquidity of the Fund’s portfolio investments. The Adviser recommended in the report that the Fund continue to determine that it primarily holds assets that are highly liquid investments, and thus not adopt a highly liquid investment minimum. The Adviser concluded in the report that the Program is reasonably designed to assess and manage the Fund’s liquidity risk, and has operated adequately and effectively to manage the Fund’s liquidity risk during the period covered by the report. In addition, the Adviser concluded in the report that there were no liquidity events during the period covered by the report that materially adversely impacted the Fund’s ability to timely meet redemptions without dilution to existing shareholders, and that no material changes were made to the Program since its full implementation.
Management Agreement Renewal | unaudited
The Board of Trustees (the “Board”) of MainGate MLP Fund (the “Fund”) oversees the management of the Fund and, as required by law, annually determines whether to approve the continuation of the Fund’s Investment Advisory Agreement (the “Advisory Agreement”) with Chickasaw Capital Management, LLC (the “Advisor”). The Board requests and evaluates information that it deems reasonably necessary under the circumstances in connection with this annual review.
At the Board’s meeting held in January 2022, the Trustees, including the Trustees who are not “interested persons” (as that term is defined in the Investment Company Act of 1940) of the Fund or of the Advisor (the “Independent Trustees”), approved the continuation of the Advisory Agreement for an additional year. In considering the renewal of the Advisory Agreement, the Trustees reviewed a variety of materials related to the Fund and the Advisor, and they examined the Advisor’s ability to provide high quality investment management services to the Fund. The Trustees considered the qualifications and experience of the Advisor’s portfolio managers who are responsible for the day-to-day management of the Fund’s portfolio, as well as the qualifications and experience of the other individuals at the Advisor who provide services to the Fund. The Trustees also considered the Advisor’s investment strategies and research and decision-making processes, its ability to attract and retain capable advisory, research and compliance personnel and the costs associated with retaining such personnel, the capability of the Advisor’s senior management and staff, and the level of skill required to manage the Fund. In addition, the Trustees discussed with the Advisor information about the Advisor’s risk management process.
In considering the renewal of the Advisory Agreement and reviewing these materials, the Board was assisted by outside legal counsel and the Fund’s independent Chief Compliance Officer. The Fund’s portfolio managers responded to the Trustees’ questions regarding the Advisor’s services and personnel, as well as the Fund’s fees, performance and peer group comparisons. The following were prominent considerations in the Trustees’ determination to continue the Advisory Agreement:
A. Nature, Extent, and Quality of Services: The Trustees considered that the Advisor’s services to the Fund include providing a continuous investment program for the Fund, adhering to the Fund’s investment policies and restrictions, complying with applicable compliance and regulatory obligations, serving as administrator for the Fund’s Liquidity Risk Management Program, and voting proxies on behalf of the Fund. The Trustees considered the qualifications and experience of the Advisor’s portfolio managers who are responsible for the day-to- day management of the Fund’s portfolio. The Trustees considered that Messrs. Mavar and Mead, the principal executives of the Advisor and the Fund’s portfolio managers, have been investing clients’ assets in MLPs on a discretionary basis since 1996. The Trustees also discussed the experience of the research team of the Advisor, and noted that the Advisor has added a number of new research analysts and other staff since the Fund’s inception.
The Trustees also considered the Advisor’s investment philosophy and research and decision-making processes, the Advisor’s ability to attract and retain capable research and advisory personnel, the capability of the senior management and staff, and the level of skill required to manage the Fund’s specialized midstream MLP portfolio. In addition, the Trustees discussed with the Advisor information about a pending claim and the Advisor’s risk management process, including its role as administrator of the Fund’s Liquidity Risk Management Program. The Trustees noted with approval that the Advisor had previously activated its Business Continuity Plan in response to the COVID-19 pandemic, and reported no issues with its workforce operating from remote locations. They also noted that the Advisor has adopted a cybersecurity policy and engaged an independent firm to conduct regular cybersecurity reviews.
B. Fund Performance. The Trustees reviewed and discussed information regarding the Fund’s Class I performance over various periods. The Trustees reviewed comparisons of the Fund’s performance for periods ended December 31, 2021 to the performance of: (i) the Fund’s peer group comprised of comparable MLP-focused mutual funds; (ii) the Advisor’s composite of separately managed MLP accounts (the “SMA Composite”); (iii) the S&P 500 Index and the Alerian MLP Index; and (iv) a private MLP fund managed by the Advisor. The Trustees noted that the Fund had performed better than all but one of its peers for the one-year period, and had strong long-term relative performance, outperforming three funds in its peer group since the Fund’s first full month of operations (March 2011). The Trustees also considered that the Fund, along with the MLP peer group funds, had outperformed the S&P 500 Index over the one -year period, but had underperformed the S&P 500 Index over the three-, and five-year periods, and since March 2011. The Trustees considered the Advisor’s representation that much of the Fund’s underperformance relative to the S&P 500 Index was the result of the general downturn in MLPs and the energy markets compared to the broader equity markets. The Trustees noted that the Fund had outperformed the Alerian MLP Index on an annualized and cumulative basis since March 2011. The Trustees reviewed information about the performance of the Advisor’s SMA Composite and private MLP fund, compared to the performance of the Fund. The Trustees considered the Advisor’s representation that any variations in their performance compared to the Fund primarily were due to the timing of cash flows and taxes.
SEMI - ANNUAL REPORT 2022 ● 33
C. Costs of the services provided and profits realized by the Advisor. The Trustees considered the advisory fee paid by the Fund under the Advisory Agreement and compared information concerning the Fund’s advisory fee to the advisory fees of its peer group. The Trustees observed that the Fund’s advisory fee is lower than the Advisor’s standard advisory fee for separately managed MLP accounts, and identical to the fee charged by the Advisor to its private MLP fund. The Trustees noted that the Fund’s advisory fee is higher than the advisory fees paid by other peer group funds, and higher than the average fees charged to the Advisor’s separately managed MLP account and wrap fee account clients. The Trustees considered the Fund’s advisory fee in light of the services provided by the Advisor to the Fund and the Fund’s strong long-term performance relative to its peers. The Trustees also noted that the Advisor has agreed to continue to waive its advisory fee and/ or reimburse expenses of the Fund to the extent that the Fund’s total annual operating expenses (excluding certain items, such as deferred tax and extraordinary expenses) exceed 1.50% through March 31, 2023. The Trustees observed that the Fund’s total annual operating expenses are currently below this level. The Trustees noted that the Fund’s total annual operating expense ratio for Class I shares is lower than the average expense ratio for funds included in Morningstar’s Energy LP category. The Trustees also considered information regarding advisory fees charged by the Advisor to its separately managed account clients that invest in MLPs. The Trustees observed that, in comparison to the Fund’s advisory fee, the Advisor earns both lower and higher advisory fees from separately managed accounts and a lower advisory fee from sub-advisory/wrap fee program accounts. The Trustees took into consideration that, relative to the Fund, the Advisor’s administrative, management and reporting responsibilities with respect to its wrap fee, sub-advisory and separately managed accounts are less extensive. Overall, the Trustees considered the Advisor’s profitability and noted, that, whether or not marketing expenses are taken into consideration, the Advisor is earning a profit from managing the Fund, although the profit percentage was not excessive compared to profit percentages reported for other large advisory firms. The Trustees also evaluated other direct and indirect benefits of the advisory relationship to the Advisor, including any “fallout benefits,” such as 12b-1 fees. The Trustees considered the Advisor’s representation that it does not have, and does not currently expect to enter into, any soft dollar arrangements with respect to the Fund. The Trustees also noted the Advisor’s representation that any 12b-1 fees are used solely for eligible marketing expenses of the Fund. The Trustees concluded that the Fund’s current advisory fee represents reasonable compensation to the Advisor in light of the nature and quality of services provided to the Fund, the fees paid by comparable funds, and the profitability of the Advisor with respect to the Fund.
D. Economies of scale. In determining the reasonableness of the Fund’s advisory fee and the Advisor’s profitability, the Trustees also considered the extent to which economies of scale might be realized by the Advisor if the assets of the Fund were to grow, and the extent to which this is reflected in the Fund’s advisory fee. The Advisor noted that, in light of the size of the Fund, the profitability of the Advisory Agreement, and the Fund’s advisory fee, the Advisor was not realizing benefits from economies of scale in managing the Fund to such an extent that the advisory fee could be reduced or advisory fee breakpoints introduced at this time.
Based upon their review, the Trustees, including the Independent Trustees, unanimously determined, in the exercise of their business judgement, that they were satisfied with the quality of investment advisory services provided by the Advisor, that the fees to be paid to the Advisor under the Advisory Agreement are reasonable, given the scope and quality of the services rendered by the Advisor, and that continuation of the Advisory Agreement would be in the best interest of the Fund.
34 | MainGate mlp fund
The following is a description of the Fund’s policies regarding disclosure of nonpublic personal information that you provide to the Fund or that the Fund collects from other sources. In the event that you hold shares of the Fund through a broker-dealer or other financial intermediary, the privacy policy of your financial intermediary would govern how your nonpublic personal information would be shared with nonaffiliated third parties.
Categories of Information the Fund Collects. The Fund collects the following nonpublic personal information about you:
| ● | Information the Fund receives from you on applications or other forms, correspondence, or conversations (such as your name, address, phone number, social security number, and date of birth); and |
| ● | Information about your transactions with the Fund, its affiliates, or others (such as your account number and balance, payment history, cost basis information, and other financial information). |
Categories of Information the Fund Discloses. The Fund does not disclose any nonpublic personal information about its current or former shareholders to unaffiliated third parties, except as required or permitted by law. The Fund is permitted by law to disclose all of the information it collects, as described above, to service providers (such as the Fund’s custodian, administrator, transfer agent, accountant and legal counsel) to process your transactions and otherwise provide services to you.
Confidentiality and Security. The Fund restricts access to your nonpublic personal information to those persons who require such information to provide products or services to you. The Fund maintains physical, electronic, and procedural safeguards that comply with federal standards to guard your nonpublic personal information.
Disposal of Information. The Fund, through its transfer agent, has taken steps to reasonably ensure that the privacy of your nonpublic personal information is maintained at all times, including in connection with the disposal of information that is no longer required to be maintained by the Fund. Such steps shall include, whenever possible, shredding paper documents and records prior to disposal, requiring off-site storage vendors to shred documents maintained in such locations prior to disposal, and erasing and/or obliterating any data contained on electronic media in such a manner that the information can no longer be read or reconstructed.
SEMI - ANNUAL REPORT 2022 ● 35
May 31, 2022
Board of Trustees
Geoffrey P. Mavar*, Chairman of the Board
Robert A. Reed, Lead Independent Trustee
David C. Burns, Independent Trustee
Moss W. Davis, Independent Trustee
Marshall K. Gramm, Independent Trustee
Matthew G. Mead*, Interested Trustee
Barry A. Samuels, Independent Trustee
Darrison N. Wharton, Independent Trustee
Officers
Matthew G. Mead*, President and Chief Executive Officer
Geoffrey P. Mavar*, Treasurer and Chief Financial Officer
Gerard Scarpati, Chief Compliance Officer
Andrew E. Garrett*, Secretary
Investment Adviser
Chickasaw Capital Management, LLC
6075 Poplar Avenue, Suite 720, Memphis, TN 38119
Distributor
Quasar Distributors, LLC
111 East Kilbourn Avenue, Suite 2200, Milwaukee, WI 53202
Custodian
U.S. Bank, N.A.
1555 North River Center Drive, Suite 302, Milwaukee, WI 53212
Transfer Agent
U.S. Bancorp Fund Services, LLC
615 East Michigan Street, 3rd Floor, Milwaukee, WI 53202
Administrator
U.S. Bancorp Fund Services, LLC
d/b/a U.S. Bank Global Fund Services
811 East Wisconsin Avenue, 8th Floor, Milwaukee, WI 53202
Legal Counsel
Bryan Cave Leighton Paisner LLP
One Metropolitan Square, St. Louis, MO 63102
Independent Registered Public Accounting Firm
BDO USA, LLP
6410 Poplar Avenue, Suite 750, Memphis, TN 38119
*Employed by Chickasaw Capital Management, LLC.
36 | MainGate mlp fund
Notes
SEMI - ANNUAL REPORT 2022 ● 37

|
(b)
|
Not applicable.
|
|
(a)
|
Schedule of Investments is included as part of the report to shareholders filed under Item 1 of this Form.
|
|
(b)
|
Not Applicable.
|
|
(a)
|
(1) Any code of ethics or amendment thereto, that is the subject of the disclosure required by Item 2, to the extent that the registrant intends to satisfy Item 2 requirements through filing an
exhibit. Incorporated by reference to the Registrant’s Form N-CSR filed February 7, 2012.
|
ATTACHMENTS / EXHIBITS
Serious News for Serious Traders! Try StreetInsider.com Premium Free!
You May Also Be Interested In
- ROSEN, A LEADING LAW FIRM, Encourages VinFast Auto Ltd. f/k/a Black Spade Acquisition Co. Investors to Secure Counsel Before Important Deadline in Securities Class Action – VFS
- Perk Labs Announces Closing of Non-Brokered Private Placements
- Cerrado Gold Announces Possible Late Filing of Annual Financial Statements
Create E-mail Alert Related Categories
SEC FilingsSign up for StreetInsider Free!
Receive full access to all new and archived articles, unlimited portfolio tracking, e-mail alerts, custom newswires and RSS feeds - and more!
