

Form N-CSRS PERRITT FUNDS INC For: Apr 30
 Tweet
Tweet Share
ShareUNITED STATES
SECURITIES AND EXCHANGE COMMISSION
Washington, D.C. 20549
SECURITIES AND EXCHANGE COMMISSION
Washington, D.C. 20549
FORM N-CSR
CERTIFIED SHAREHOLDER REPORT OF REGISTERED
MANAGEMENT INVESTMENT COMPANIES
Investment Company Act file number 811-21556
Perritt Funds, Inc.
(Exact name of registrant as specified in charter)
(Exact name of registrant as specified in charter)
300 South Wacker Drive, Suite 600, Chicago, IL 60606
(Address of principal executive offices) (Zip code)
(Address of principal executive offices) (Zip code)
Michael J. Corbett, 300 South Wacker Drive, Suite 600, Chicago, IL 60606
(Name and address of agent for service)
(Name and address of agent for service)
1-312-669-1650
Registrant's telephone number, including area code
Date of fiscal year end: October 31, 2022
Date of reporting period: November 1, 2021 through April 30, 2022
Item 1. Reports to Stockholders.
|
(a)
|
|
MicroCap Opportunities Fund
Ultra MicroCap Fund
Semi-Annual Report
April 30, 2022
(Unaudited)

The PERRITT MICROCAP OPPORTUNITIES FUND will, under normal circumstances, invest at least 80% of its net assets in a diversified portfolio of common stocks of United States companies that at the time of initial purchase
have a market capitalization (equity market value) that is below $500 million (referred to as “micro-cap” companies). The Fund seeks to invest in micro-cap companies that have demonstrated above-average growth in revenues and/or earnings,
possess relatively low levels of long-term debt, have a high percentage of their shares owned by company management, and possess modest price-to-sales ratios and price-to-earnings ratios that are below their long-term annual growth rate. At
times, the Fund may also invest in “special situations” such as companies that possess valuable patents, companies undergoing restructuring, and companies involved in large share repurchase programs. Investors should expect the Fund to contain a
mix of both value-priced and growth stocks.
The PERRITT ULTRA MICROCAP FUND will, under normal circumstances, invest at least 80% of its net assets in a diversified portfolio of common stocks of United States companies that at the time of initial purchase have a
market capitalization (equity market value) that is below $300 million (referred to as “micro-cap” companies). The Fund seeks to invest in micro-cap companies that have a high percentage of their shares owned by company management, possess
relatively low levels of long-term debt, have a potential for above average growth in revenues and/or earnings, and possess reasonable valuations based on the ratios of price-to-sales, price-to-earnings, and price-to-book values. The micro-cap
companies in which the Fund may invest include “early stage” companies, which are companies that are in a relatively early stage of development with market capitalizations that are below $50 million. At times, the Fund may also invest in
unseasoned companies, companies that are undergoing corporate restructuring, initial public offerings, and companies believed to possess undervalued assets.
|
Table of Contents
|
Semi-Annual Report
April 30, 2022
(Unaudited)
|
Perritt MicroCap Opportunities Fund
|
|
|
From the Portfolio Managers
|
2
|
|
Performance
|
6
|
|
Ten Largest Common Stock Holdings
|
8
|
|
Allocation of Portfolio Investments
|
9
|
|
Perritt Ultra MicroCap Fund
|
|
|
From the Portfolio Managers
|
10
|
|
Performance
|
14
|
|
Ten Largest Common Stock Holdings
|
16
|
|
Allocation of Portfolio Investments
|
17
|
|
Perritt Funds
|
|
|
Schedules of Investments
|
18
|
|
Statements of Assets and Liabilities
|
26
|
|
Statements of Operations
|
27
|
|
Statements of Changes in Net Assets
|
28
|
|
Financial Highlights
|
30
|
|
Notes to Financial Statements
|
32
|
|
Expense Example
|
41
|
|
Advisory Agreement Renewal
|
43
|
|
Directors and Officers
|
47
|
|
Information
|
50
|
1
Perritt MicroCap Opportunities Fund
|
Portfolio Manager’s Message
|

Michael Corbett,
Portfolio Manager
The micro-cap market entered bear market territory in the first six months of our fiscal 2022. Bear markets are defined as declines of more than 20%, and the Russell Microcap Index declined 21.14% for the six-month
period ended April 30, 2022. While your Fund certainly experienced weakness over the past six months, the performance was significantly better than that of the overall market. For the six months ended April 30, 2022, the Perritt MicroCap
Opportunities Fund declined 12.94%. We attributed the better performance results to the value discipline used within the security selection. We believe the overall market is in a massive rotation from so-called sexy investments to more quality
investments, which we believe will bode well for the Fund’s future relative performance. We will discuss those quality dynamics in more detail, but here are some details of the Fund’s investments in the past six months.
The Fund’s strong relative performance to the benchmark can be attributed to security selection within a few industries along with allocation to certain industries. Despite the market’s weakness over the past six
months, we had several individual holdings that managed to provide gains in the period. In fact, we had two investments, Assertio Holdings (ASRT) and Hudson Global (HSON), that gained about 100% in the past six months. Both companies have had
stellar operating results, and the future still looks bright for both. In terms of sectors, the health care sector of the Russell Microcap Index declined a remarkable 42.60% in the past six months, while our health care investments only declined
7.70%. The material performance difference is related to weakness among companies without earnings and/or operating cash flow. Since we prefer companies with positive earnings, the Fund was able to avoid this performance disaster. This is a
nice segue to why we believe the market is experiencing a massive rotation.
We believe a massive rotation to higher quality investments is underway and is directly related to Federal Reserve raising interest rates along with higher interest rates within the bond market. With recent inflation
readings topping 8%, the Federal Reserve has made it clear that they need to raise interest rates. The bond market has also responded as the 10-year bond rose from less than 1% during 2021 to nearly 3% in May 2022. While it is difficult to
predict how high the Federal Reserve will hike interest rates or how high interest rates will rise within the bond market, the direction is clear, and the impact is obvious to us. Higher rates impact future returns and investor willingness to
accept the promise of positive earnings in the future. In other words, investors become less willing to maintain investments in companies with negative earnings and negative cash flow. As a reminder, we define high quality investments as
companies with positive earnings and positive operating cash flow. While higher interest rates scare some investors, we welcome them. We wrote a white paper recently that documented that rising interest rates do not harm future returns of
microcap stocks. Please review our white paper on “Interest Rate Hikes and Micro-cap Performance” on our website: https://www.perrittcap.com/interest-rate-hikes-and-micro-cap-stock-performance/.
2
Perritt MicroCap Opportunities Fund
During the past six months, we sold nine companies from the Fund’s portfolio. We sold three companies: Intricon, Tristate Capital and Zix Corporation after receiving acquisition offers. Two companies were sold after
reaching their long-term price targets. There were three additional companies sold due to reaching their long-term price targets, but these companies also exceeded our definition of a microcap stocks. Lastly, we sold one company after the
long-term outlook for their business declined. With the proceeds from these sales, we purchased eight new companies for the portfolio, which were from seven different industries.
As of April 30, 2022, the Fund’s portfolio contained the common stocks of eighty-eight companies. The Fund’s 10 largest holdings and detailed descriptions can be found in the following pages of this report. Based on
our earnings estimates, the Fund’s portfolio is trading at a little more than ten times our 2023 earnings estimate. Stocks in the portfolio are priced at slightly more than 1.1 times trailing revenue, and the median market capitalization is
approximately $194 million. Finally, the average stock in the Fund is trading at 1.5 times book value and less than 7 times our 2023 estimate of Enterprise Value to EBITDA (earnings before interest taxes depreciation and amortization). The
valuation characteristics for the MicroCap Opportunities Fund are significantly lower than the Fund’s benchmark Russell Microcap Index. Lastly, it is important to note than more than 50% of the companies within the Russell Microcap Index are not
profitable, which compares to only 10% for the Perritt MicroCap Opportunities Fund.
I want to thank my fellow shareholders for their continued support and confidence in the Perritt Capital Management team. I have been a shareholder of the Fund for more than 30 years and have nearly half of my liquid
investments in the Perritt Funds. The Perritt team remains dedicated to investing in high quality micro-cap companies at attractive valuations. If you have any questions or comments about this report or your investment in the Perritt MicroCap
Opportunities Fund, please call us toll-free at (800) 331-8936 or visit our web site at www.perrittcap.com. Please refer to the prospectus for information about the Fund’s investment objectives and strategies.

Michael Corbett
President
3
Perritt MicroCap Opportunities Fund
Mutual fund investing involves risk. Principal loss is possible. The Funds invest in smaller companies, which involve additional risks, such as limited liquidity and greater volatility. The Funds
invest in micro-cap companies which tend to perform poorly during times of economic stress.
Past performance does not guarantee future results.
Earnings Growth is not a measure of the Fund’s future performance.
Opinions expressed are subject to change at any time, are not guaranteed and should not be considered investment advice. Please refer to the Schedule of Investments in the report for more complete information regarding
Fund holdings. Fund holdings and sector allocations are subject to change and should not be considered a recommendation to buy or sell any security.
Russell Microcap Index is a capitalization weighted index of 2,000 small cap and micro-cap stocks that captures the smallest 1,000 companies in the Russell 2000, plus 1,000
smaller U.S.-based listed stocks.
One cannot invest directly in an index. The index is used herein for comparative purposes in accordance with SEC regulations.
Book Value is the net asset value of a company calculated as total assets minus intangible asset (patents, goodwill) and liabilities.
Enterprise Value is a measure of a company’s total value, often used as a more comprehensive alternative to equity market capitalization. EV includes in its calculation the market
capitalization of a company but also short-term and long-term debt as well as any cash on the company’s balance sheet.
Enterprise value to EBITDA Equals market capitalization + preferred shares + minority interest + debt -total cash divided by EBITDA.
The semi-annual report must be preceded or accompanied by a prospectus.
The Perritt Funds are distributed by Quasar Distributors, LLC.
4
(This Page Intentionally Left Blank.)
5
Perritt MicroCap Opportunities Fund
|
Performance* (Unaudited)
|
April 30, 2022
|
Perritt MicroCap Opportunities Fund versus
Russell Microcap® Index and Russell 2000® Index

There are several ways to evaluate a fund’s historical performance. You can look at the total percentage change in value, the average annual percentage change, or the growth of a hypothetical $10,000 investment. Each
performance figure includes changes in a fund’s share price, plus reinvestment of any dividends (or income) and capital gains (the profits the fund earns when it sells stocks that have grown in value).
Cumulative total returns reflect the Fund’s actual performance over a set period. For example, if you invested $1,000 in a fund that had a 5% return over one year, you would end up with $1,050. You can compare the
Fund’s returns to the Russell 2000® Index, which reflects a popular measure of the stock performance of small companies, and the Russell Microcap® Index, which measures the performance of the micro-cap segment of the U.S. equity market.
Average annual total returns take the Fund’s actual (or cumulative) return and show you what would have happened if the Fund had performed at a constant rate each year.
|
*
|
The graph illustrates the performance of a hypothetical $10,000 investment made in the period presented. Assumes reinvestment of dividends and capital gains, but does not reflect the effect
of any applicable sales charge or redemption fees or the deduction of taxes that a shareholder would pay on the Fund’s distributions or the redemption of the Fund shares. The graph does not imply any future performance. It is not
possible to invest directly in an index.
|
6
Perritt MicroCap Opportunities Fund
|
Performance (Unaudited) (Continued)
|
April 30, 2022
|
|
Average Annual Total Returns*
|
|||||
|
Period ended April 30, 2022
|
|||||
|
|
Past
|
Past
|
Past
|
Past
|
Past
|
|
|
1 Year
|
5 Years
|
10 Years
|
15 Years
|
25 Years
|
|
Perritt MicroCap Opportunities Fund
|
(7.57)%
|
3.35%
|
7.56%
|
4.75%
|
9.26%
|
|
Russell Microcap® Index
|
(20.42)%
|
7.26%
|
10.09%
|
6.00%
|
n/a
|
|
(reflects no deduction
|
|||||
|
for fees and expenses)
|
|||||
|
Russell 2000® Index
|
(16.87)%
|
7.24%
|
10.06%
|
7.11%
|
8.41%
|
|
(reflects no deduction
|
|||||
|
for fees and expenses)
|
Performance data quoted represents past performance; past performance does not guarantee future results. The investment return and principal value of an investment will fluctuate so that an
investor’s shares, when redeemed, may be worth more or less than their original cost. Current performance of the Fund may be lower or higher than the performance quoted. Performance data current to the most recent month end is available by
calling 800-331-8936.
|
*
|
The performance data quoted does not reflect the deduction of taxes that a shareholder would pay on the Fund’s distributions or the 2% redemption or exchange fee for shares held 90 days or
less. If reflected, total return would be reduced.
|
The Fund’s gross expense ratio is 1.56% and is as of the most recent prospectus dated February 28, 2022. Please see the Fund’s Financial Highlights in this report for the most recent expense ratio.
Russell Microcap Index is a capitalization weighted index of 2,000 small cap and micro-cap stocks that captures the smallest 1,000 companies in the Russell 2000, plus 1,000 smaller U.S.-based listed
stocks.
Russell 2000 Index is a small-cap stock market index that makes up the smallest 2,000 stocks in the Russell 3000 Index.
7
Perritt MicroCap Opportunities Fund
|
Ten Largest Common Stock Holdings (Unaudited)
|
Silvercrest Asset Management Group Inc. (SAMG) is a wealth management firm that provides financial advisory and related family office services in the United States. The company
serves ultra-high net worth individuals and families, as well as their trusts; endowments; foundations; and other institutional investors. It also manages funds of funds and other investment funds.
Northern Technologies International, Corp. (NTIC) develops and markets rust and corrosion inhibiting products and services to automotive, electronics, electrical mechanical,
military, retail consumer, and oil and gas markets.
DLH Holdings Corp. (DLHC) provides healthcare, logistics, and technical services and solutions to Federal Government agencies including the Department of Veteran Affairs, the
Department of Defense, and other government clients.
Radiant Logistics, Inc. (RLGT) operates as a third-party logistics and multi-modal transportation services company primarily in the United States and Canada. The company offers
domestic and international air and ocean freight forwarding services; and freight brokerage services, including truckload, less than truckload, and intermodal services.
U.S. Global Investors, Inc. (GROW) is a publicly owned investment manager. The firm primarily provides its services to investment companies. It also provides its services to
pooled investment vehicles. The firm manages equity and fixed income mutual funds, hedge funds and exchange traded funds. It also invests in the public equity and fixed income markets across the globe.
Legacy Housing Corp. (LEGH) builds, sells, and finances manufactured homes and tiny houses primarily in the southern United States. The company manufactures and provides for the
transport of mobile homes; and offers wholesale financing to dealers and mobile home parks, as well as a range of homes.
Hudson Global, Inc. (HSON) provides talent solutions for mid-to-large-cap multinational companies and government agencies under the Hudson RPO brand in the Americas, the Asia
Pacific, and Europe. It offers recruitment process outsourcing (RPO) services.
A-Mark Precious Metals, Inc. (AMRK) together with its subsidiaries, operates as a precious metals trading company. It operates in three segments: Wholesale Sales & Ancillary
Services, Secured Lending, and Direct-to-Consumer.
Miller Industries, Inc. (MLR) engages in the manufacture and sale of towing and recovery equipment. It offers wreckers, such as conventional tow trucks and recovery vehicles.
The company also provides transport trailers for moving multiple vehicles, auto auctions, car dealerships, leasing companies, and other similar applications.
Evolution Petroleum Corp. (EPM) an oil and natural gas company, engages in the development, production, ownership, and management of oil and gas properties in the United States.
Fund holdings and/or sector allocations are subject to change at any time and
are not recommendations to buy or sell any security.
Please refer to the Schedule of Investments in this report for a complete list of Fund holdings.
8
Perritt MicroCap Opportunities Fund
|
Allocation of Portfolio Investments (Unaudited)
|
April 30, 2022
|

The sector classifications represented in the graph above and industry classifications represented in
the Schedule of Investments are in accordance with Global Industry Classification Standard
(GICS®), which was developed by and/or is the exclusive property of MSCI, Inc. and Standard &
Poor Financial Services LLC. Percentages are based on total investments, at value.
|
Note:
|
For presentation purposes, the Fund has grouped some of the industry categories. For purposes of categorizing securities for compliance with section 8(b)(1) of the Investment Company Act of
1940, the Fund uses more specific industry classifications.
|
9
Perritt Ultra MicroCap Fund
|
Portfolio Managers’ Message
|

Matthew Brackmann,
Portfolio Manager
The Perritt Ultra Microcap Fund outperformed the Russell Microcap Index for the first half of fiscal year 2022 on a net of fee basis, posting a loss of -20.15% versus a loss for the Index of -21.14%. The start of the
year 2022 saw a steep sell off in the markets that created a challenging environment for investors across most categories of investments. Operationally, our portfolio companies had to endure everything from supply chain & labor shortages,
unexpected energy price increases, and in a handful of circumstances having direct exposure to the Ukrainian-Russian conflict. However, we were encouraged by the most recent earnings season and the general optimism around both the strength of
the economy and our portfolio companies’ prospects going forward.
2022 has brought a sense of being taken “out of the frying pan and into the fire” for investors. After two years of dealing with the uncertainties of COVID and the transformational shifts it has brought to the way we
all go about business, 2022 brought much of the newly established assumptions about the future to a grinding halt. The long-term impacts of shifts in supply chain due to changes in consumption trends and key material shortages coupled with the
unexpected increase in energy prices due to the Ukrainian-Russian conflict brought headline Consumer Price Index (inflation) prints of 8.3% on an annualized basis as of April 2022. This has led to an end to the growth driven equity markets of
the previous decade, a sudden sell off 8-9% on a calendar YTD basis in aggregate bond funds that is unlike anything we have seen in the past several decades and the advent of several implemented and expected rate increases from the Fed. Despite
these challenging headwinds, we believe that our portfolio companies remain well positioned to prosper going forward and our optimism has been reflected in the tone and results of our companies’ operating results so far this year.
While the news headlines may have investors climbing a wall of worry, the operating results from our portfolio companies were strong during the most recent reporting quarter. As we had detailed many of our companies
use COVID as an opportunity to adjust their business models and emerge leaner and poised for success. One example we would like to highlight is Sensus Healthcare (SRTS), a manufacturer of dermatological medical devices. COVID proved detrimental
to their business model as the procedures their products address were largely cancelled due to elective procedures being delayed. During that time, they continued to make key investments in their sales force as well as, make adjustments to their
model in the form of a recently announced divestiture of non-core assets, which brought an additional $15 million in cash onto the balance sheet. This divestiture was announced in concurrence with revenue growth of 232% due to rebounding from a
low baseline as well a substantial cash reserve of $32.8 million as a result of their operational success and asset sale, part of which they committed to returning to shareholders in the form of a stock buy-back program and the remainder of which
is available to fund growth opportunities. This success is reflected in the performance of the stock, which is up 76.5% for the six months from October 31, 2021 through April 30, 2022, with the
10
Perritt Ultra MicroCap Fund
healthcare sector within the Russell Microcap Index returning -42.65%. We believe that the market will continue to focus on quality investments such as Sensus as the market moves away from more speculative growth
investments that dominated the previous cycle.
Since our last update, we have exited eight positions and added five. Two were sold due to adverse news events while six were sold due to declining fundamentals or failure of management to execute on stated goals. The
five names that were added were drawn from across sectors and included both earlier stage companies with exciting opportunities in their end markets as well as more established profitable enterprises. We would like to highlight Chicago Atlantic
Real Estate Finance (REFI), a private mortgage lender to the cannabis industry as a recent addition that has also been highlighted in our Marvelous Microcap series and can be accessed on our website.
As of April 30, 2022, the Fund holds the common stock of seventy-seven companies which is lower than the previous report. As we had stated in the October letter to shareholders, we had been examining several names for
potential sales, the result of which was the six that were sold due to declining fundamentals. We continue to evaluate several names for potential addition and have recently begun hosting in person meetings with management teams again as part of
the process which is a welcome relief after two years of Zoom calls.
Regarding current portfolio valuations, based on our earnings estimates, the Fund’s portfolio is trading at a 15.6x forward price to earnings. The median price to sales ratio is 1.3x, the median price to book is 1.6x
and price to trailing twelve month’s earnings of 16.3x. The median market cap for the Fund is at $87 million. By comparison, the Russell Microcap Index has a price to sales ratio of 2.1x, a price to book ratio of 1.7x and a trailing
twelve-month P/E of 11.4. The median market cap for the Index is $167 million.
We want to genuinely thank our fellow shareholders for their continued support and confidence in the Perritt Capital Management team. Each member of our investment committee as well as many other employees have made
continued investment in this Fund over the years and remain shareholders alongside all of you. We also wish you and your loved ones well and wish you all continued good health as we emerge from the trials of the past year. If you have any
questions or comments about this report or your investment in the Perritt Ultra MicroCap Fund, please call us toll- free at (800) 331-8936 or visit our web site at www.perrittcap.com. Please refer to the prospectus for information about the
Fund’s investment objectives and strategies.

Matt Brackmann
Portfolio Manager
11
Perritt Ultra MicroCap Fund
Past performance does not guarantee future results.
Earnings Growth is not a measure of the Fund’s future performance.
Opinions expressed are subject to change at any time, are not guaranteed and should not be considered investment advice.
Please refer to the Schedule of Investments in the report for more complete information regarding Fund holdings. Fund holdings and sector allocations are subject to change and should not be considered a recommendation
to buy or sell any security.
Any tax or legal information provided is merely a summary of our understanding and interpretation of some of the current income tax regulations and not exhaustive. Investors must consult their tax advisor or legal
counsel for advice and information concerning their situation. Neither the Fund nor any of its representatives may give legal or tax advice.
Mutual fund investing involves risk. Principal loss is possible. The Funds invest in smaller companies, which involve additional risks, such as limited liquidity and greater volatility. The Funds
invest in microcap companies which tend to perform poorly during times of economic stress. The Ultra MicroCap Fund may invest in early-stage companies which tend to be more volatile and somewhat more speculative than investments in more
established companies.
Russell Microcap Index is a capitalization weighted index of 2,000 small cap and micro-cap stocks that captures the smallest 1,000 companies in the Russell 2000, plus 1,000
smaller U.S.-based listed stocks.
Consumer Price Index (CPI) measures the monthly change in prices paid by U.S. consumers. The U.S. Bureau of Labor Statistics calculates the CPI as a weighted average of prices
for a basket of goods and services representative of aggregate U.S. consumer spending. CPI is one of the most popular measures of inflation and deflation.
One cannot invest directly in an index.
Price-to-Book (P/B) is a ratio used to compare a stock’s market value to its book value. It is calculated by dividing the current closing price of the stock by the latest
quarter’s book value per share.
Price-to-Sales (P/S) is a valuation ratio that compares a company’s stock price to its revenues. The price-to-sales ratio is an indicator of the value placed on each dollar of a
company’s sales or revenues.
Trailing Price-to Earnings (P/E) is calculated by taking the current stock price and dividing it by the trailing earnings per share (EPS) for the past 12 months.
Forward price-to-earnings (forward P/E) is a version of the ratio of price-to-earnings (P/E) that uses forecasted earnings for the P/E calculation. The forecasted earnings used
in the formula typically uses either projected earnings for the following 12 months or for the next full-year fiscal (FY) period.
The semi-annual report must be preceded or accompanied by a prospectus.
The Perritt Funds are distributed by Quasar Distributors, LLC.
12
(This Page Intentionally Left Blank.)
13
Perritt Ultra MicroCap Fund
|
Performance* (Unaudited)
|
April 30, 2022
|
Perritt Ultra MicroCap Fund versus
Russell Microcap® Index and Russell 2000® Index
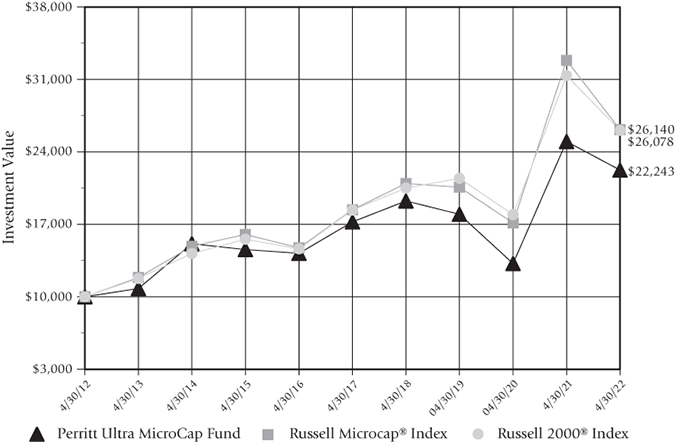
There are several ways to evaluate a fund’s historical performance. You can look at the total percentage change in value, the average annual percentage change, or the growth of a hypothetical $10,000 investment. Each
performance figure includes changes in a fund’s share price, plus reinvestment of any dividends (or income) and capital gains (the profits the fund earns when it sells stocks that have grown in value).
Cumulative total returns reflect the Fund’s actual performance over a set period. For example, if you invested $1,000 in a fund that had a 5% return over one year, you would end up with $1,050. You can compare the
Fund’s returns to the Russell 2000® Index, which reflects a popular measure of the stock performance of small companies, and the Russell Microcap® Index, which measures the performance of the micro-cap segment of the U.S. equity market.
Average annual total returns take the Fund’s actual (or cumulative) return and show you what would have happened if the Fund had performed at a constant rate each year.
|
*
|
The graph illustrates the performance of a hypothetical $10,000 investment made in the period presented. Assumes reinvestment of dividends and capital gains, but does not reflect the effect
of any applicable sales charge or redemption fees or the deduction of taxes that a shareholder would pay on the Fund’s distributions or the redemption of Fund shares. The graph does not imply any future performance. It is not possible
to invest directly in an index.
|
14
Perritt Ultra MicroCap Fund
|
Performance (Unaudited) (Continued)
|
April 30, 2022
|
|
Average Annual Total Returns*
|
||||
|
Period ended April 30, 2022
|
||||
|
|
Past
|
Past
|
Past
|
Past
|
|
|
1 Year
|
5 Years
|
10 Years
|
15 Years
|
|
Perritt Ultra MicroCap Fund
|
(11.04)%
|
5.23%
|
8.32%
|
4.39%
|
|
Russell Microcap® Index
|
(20.42)%
|
7.26%
|
10.09%
|
6.00%
|
|
(reflects no deduction for fees and expenses)
|
||||
|
Russell 2000® Index
|
(16.87)%
|
7.24%
|
10.06%
|
7.11%
|
|
(reflects no deduction for fees and expenses)
|
Performance data quoted represents past performance; past performance does not guarantee future results. The investment return and principal value of an investment will fluctuate so that an
investor’s shares, when redeemed, may be worth more or less than their original cost. Current performance of the Fund may be lower or higher than the performance quoted. Performance data current to the most recent month end is available by
calling 800-331-8936.
|
*
|
The performance data quoted does not reflect the deduction of taxes that a shareholder would pay on the Fund’s distributions or the 2% redemption or exchange fee for shares held 90 days or
less. If reflected, total return would be reduced.
|
The Fund’s gross expense ratio is 2.42% and is as of the most recent prospectus dated February 28, 2022. Please see the Fund’s Financial Highlights in this report for the most recent expense ratio.
Russell Microcap Index is a capitalization weighted index of 2,000 small cap and micro-cap stocks that captures the smallest 1,000 companies in the Russell 2000, plus 1,000 smaller U.S.-based listed
stocks.
Russell 2000 Index is a small-cap stock market index that makes up the smallest 2,000 stocks in the Russell 3000 Index.
15
Perritt Ultra MicroCap Fund
|
Ten Largest Common Stock Holdings (Unaudited)
|
DLH Holdings Corp. (DLHC) provides healthcare and social services in the United States. It offers defense and veterans’ health solutions, including case management, physical and
behavioral health examinations, and medical administration and logistics services.
Hudson Global, Inc. (HSON) provides talent solutions for mid-to-large-cap multinational companies and government agencies under the Hudson RPO brand in the Americas, the Asia
Pacific, and Europe. It offers recruitment process outsourcing (RPO) services.
Immucell Corp. (ICCC) an animal health company, acquires, develops, manufactures, and sells products that enhance the health and productivity of dairy and beef cattle in the
United States and international.
A-Mark Precious Metals, Inc. (AMRK) together with its subsidiaries, operates as a precious metals trading company. It operates in three segments: Wholesale Sales & Ancillary
Services, Secured Lending, and Direct-to-Consumer.
Quest Resource Holding Corp. (QRHC) through its subsidiaries, provides solutions for the reuse, recycling, and disposal of various waste streams and recyclables in the United
States.
UFP Technologies, Inc. (UFPT) designs and custom manufactures components, subassemblies, products, and packaging utilizing specialized foams, films, and plastics primarily for
the medical market.
Napco Security Technologies, Inc. (NSSC) develops, manufactures, and sells electronic security products in the United States and internationally. The company offers access
control systems, door-locking products, intrusion and fire alarm systems, and video surveillance systems.
Galaxy Gaming, Inc. (GLXZ) is a gaming company that designs, develops, manufactures, markets, acquires, and licenses proprietary casino table games and associated technology,
platforms, and systems for the gaming industry.
ProPhase Labs, Inc. (PRPH) engages in the research, development, manufacture, distribution, marketing, and sale of over the counter (OTC) consumer healthcare products and dietary
supplements in the United States.
DHI Group, Inc. (DHX) provides data, insights, and employment connections through specialized services for technology professionals in the United States, the United Kingdom and
the rest of Europe, the Middle East, Africa, the Asia Pacific, and internationally.
Fund holdings and/or sector allocations are subject to change at any time and
are not recommendations to buy or sell any security.
Please refer to the Schedule of Investments in this report for a complete list of Fund holdings.
16
Perritt Ultra MicroCap Fund
|
Allocation of Portfolio Investments (Unaudited)
|
April 30, 2022
|

The sector classifications represented in the graph above and industry classifications represented in
the Schedule of Investments are in accordance with Global Industry Classification Standard
(GICS®), which was developed by and/or is the exclusive property of MSCI, Inc. and Standard &
Poor Financial Services LLC. Percentages are based on total investments, at value.
|
Note:
|
For presentation purposes, the Fund has grouped some of the industry categories. For purposes of
categorizing securities for compliance with section 8(b)(1) of the Investment Company Act of 1940, the Fund uses more specific industry classifications.
|
17
Perritt MicroCap Opportunities Fund
|
Schedule of Investments
|
April 30, 2022 (Unaudited)
|
|
Shares
|
COMMON STOCKS – 98.97%
|
Value
|
|||||
|
Administrative and
|
|||||||
|
Support Services – 3.14%
|
|||||||
|
39,500
|
BGSF, Inc.
|
$
|
482,295
|
||||
|
40,000
|
Hudson Global, Inc.(a)
|
1,318,800
|
|||||
|
1,801,095
|
|||||||
|
Auto Parts & Equipment – 3.92%
|
|||||||
|
65,000
|
Commercial Vehicle
|
||||||
|
Group, Inc.(a)
|
466,700
|
||||||
|
43,800
|
Miller Industries, Inc.
|
1,174,278
|
|||||
|
40,000
|
Motorcar Parts of
|
||||||
|
America, Inc.(a)
|
608,400
|
||||||
|
2,249,378
|
|||||||
|
Biotechnology – 0.77%
|
|||||||
|
22,000
|
Opiant Pharmaceuticals,
|
||||||
|
Inc.(a)
|
439,120
|
||||||
|
439,120
|
|||||||
|
Building Materials – 1.95%
|
|||||||
|
9,000
|
BlueLinx
|
||||||
|
Holdings, Inc.(a)
|
600,030
|
||||||
|
29,000
|
PGT Innovations, Inc.(a)
|
515,330
|
|||||
|
1,115,360
|
|||||||
|
Business Services – 6.52%
|
|||||||
|
165,000
|
DLH Holdings Corp.(a)
|
2,491,500
|
|||||
|
80,000
|
Information Services
|
||||||
|
Group, Inc.
|
501,600
|
||||||
|
83,000
|
Intrusion, Inc.(a)
|
177,620
|
|||||
|
50,000
|
PFSweb, Inc.(a)
|
567,500
|
|||||
|
3,738,220
|
|||||||
|
Chemical & Related Products – 4.42%
|
|||||||
|
218,829
|
Northern Technologies
|
||||||
|
International Corp.
|
2,531,852
|
||||||
|
2,531,852
|
|||||||
|
Chemical Manufacturing – 2.76%
|
|||||||
|
275,000
|
Assertio
|
||||||
|
Holdings, Inc.(a)
|
580,250
|
||||||
|
135,000
|
ProPhase Labs, Inc.
|
1,001,700
|
|||||
|
1,581,950
|
|||||||
|
Computer and Electronic
|
|||||||
|
Product Manufacturing – 2.87%
|
|||||||
|
84,223
|
Coda Octopus
|
||||||
|
Group, Inc.(a)
|
480,913
|
||||||
|
50,000
|
Gilat Satellite Networks
|
||||||
|
Ltd. – ADR(a)(b)
|
367,500
|
||||||
|
40,000
|
Powerfleet, Inc.(a)
|
105,600
|
|||||
|
60,000
|
Quipt Home Medical
|
||||||
|
Corp. – ADR(a)(b)
|
274,200
|
||||||
|
1,050,000
|
Singing Machine
|
||||||
|
Co., Inc.(a)
|
157,500
|
||||||
|
39,000
|
TransAct Technologies,
|
||||||
|
Inc.(a)
|
257,400
|
||||||
|
1,643,113
|
|||||||
|
Construction & Engineering – 1.49%
|
|||||||
|
44,721
|
Gencor
|
||||||
|
Industries, Inc.(a)
|
448,105
|
||||||
|
13,925
|
IES Holdings, Inc.(a)
|
408,002
|
|||||
|
856,107
|
|||||||
|
Consumer Goods – 0.99%
|
|||||||
|
34,000
|
Turtle Beach Corp.(a)
|
565,760
|
|||||
|
565,760
|
|||||||
|
Consumer Products –
|
|||||||
|
Manufacturing – 2.04%
|
|||||||
|
14,000
|
Delta Apparel, Inc.(a)
|
405,720
|
|||||
|
22,000
|
Superior Group
|
||||||
|
of Cos., Inc.
|
349,800
|
||||||
|
55,000
|
VOXX International
|
||||||
|
Corp.(a)
|
416,350
|
||||||
|
1,171,870
|
|||||||
|
Consumer Services – 1.01%
|
|||||||
|
103,800
|
DHI Group, Inc.(a)
|
577,128
|
|||||
|
577,128
|
|||||||
|
Credit Intermediation
|
|||||||
|
and Related Activities – 1.12%
|
|||||||
|
300,000
|
CSI Compressco LP
|
426,000
|
|||||
|
75,000
|
Usio, Inc.(a)
|
213,750
|
|||||
|
639,750
|
|||||||
|
Data Processing, Hosting
|
|||||||
|
and Related Services – 0.56%
|
|||||||
|
25,000
|
Ooma, Inc.(a)
|
321,000
|
|||||
|
321,000
|
|||||||
|
Educational Services – 2.84%
|
|||||||
|
90,000
|
Lincoln Educational
|
||||||
|
Services Corp.(a)
|
643,500
|
||||||
|
95,000
|
Universal Technical
|
||||||
|
Institute, Inc.(a)
|
984,200
|
||||||
|
1,627,700
|
|||||||
The accompanying notes to financial statements are an integral part of this schedule.
18
Perritt MicroCap Opportunities Fund
|
Schedule of Investments (Continued)
|
April 30, 2022 (Unaudited)
|
|
Shares
|
Value
|
||||||
|
Electronic Equipment
|
|||||||
|
& Instruments – 1.44%
|
|||||||
|
26,000
|
Bel Fuse, Inc. – Class B
|
$
|
424,060
|
||||
|
33,000
|
Identiv, Inc.(a)
|
402,270
|
|||||
|
826,330
|
|||||||
|
Engineering & Construction – 1.40%
|
|||||||
|
86,000
|
Infrastructure & Energy
|
||||||
|
Alternatives, Inc.(a)
|
804,100
|
||||||
|
804,100
|
|||||||
|
Environmental Services – 1.43%
|
|||||||
|
150,000
|
Quest Resource
|
||||||
|
Holding Corp.(a)
|
822,000
|
||||||
|
822,000
|
|||||||
|
Financial Services – 13.27%
|
|||||||
|
25,000
|
First Internet Bancorp
|
962,250
|
|||||
|
15,000
|
Hennessy Advisors, Inc.
|
149,250
|
|||||
|
210,000
|
Silvercrest Asset
|
||||||
|
Management Group,
|
|||||||
|
Inc. – Class A
|
4,363,800
|
||||||
|
406,600
|
U.S. Global Investors,
|
||||||
|
Inc. – Class A
|
2,134,650
|
||||||
|
7,609,950
|
|||||||
|
Food Manufacturing – 0.53%
|
|||||||
|
175,000
|
MamaMancini’s
|
||||||
|
Holdings, Inc.(a)
|
306,250
|
||||||
|
306,250
|
|||||||
|
Gold – 1.80%
|
|||||||
|
365,000
|
Gold Resource Corp.
|
667,950
|
|||||
|
545,000
|
McEwen Mining, Inc.(a)
|
365,259
|
|||||
|
1,033,209
|
|||||||
|
Healthcare Services – 0.55%
|
|||||||
|
40,000
|
InfuSystem
|
||||||
|
Holdings, Inc.(a)
|
317,200
|
||||||
|
317,200
|
|||||||
|
Home Builder – 0.96%
|
|||||||
|
28,000
|
Green Brick
|
||||||
|
Partners, Inc.(a)
|
551,600
|
||||||
|
551,600
|
|||||||
|
Housing – 2.80%
|
|||||||
|
91,500
|
Legacy Housing
|
||||||
|
Corp.(a)
|
1,603,080
|
||||||
|
1,603,080
|
|||||||
|
Leisure – 2.20%
|
|||||||
|
84,000
|
Century Casinos, Inc.(a)
|
879,480
|
|||||
|
90,000
|
Galaxy Gaming, Inc.(a)
|
382,500
|
|||||
|
1,261,980
|
|||||||
|
Machinery Manufacturing – 1.02%
|
|||||||
|
25,000
|
Mayville Engineering
|
||||||
|
Co, Inc.(a)
|
207,000
|
||||||
|
245,400
|
TechPrecision Corp.(a)
|
380,370
|
|||||
|
587,370
|
|||||||
|
Medical Supplies & Services – 0.86%
|
|||||||
|
3,000
|
Addus HomeCare
|
||||||
|
Corp.(a)
|
252,840
|
||||||
|
15,000
|
Lakeland Industries,
|
||||||
|
Inc.(a)
|
242,700
|
||||||
|
495,540
|
|||||||
|
Merchant Wholesalers,
|
|||||||
|
Durable Goods – 2.20%
|
|||||||
|
16,000
|
A-Mark Precious
|
||||||
|
Metals, Inc.
|
1,260,800
|
||||||
|
1,260,800
|
|||||||
|
Merchant Wholesalers,
|
|||||||
|
Nondurable Goods – 0.21%
|
|||||||
|
20,000
|
GrowGeneration
|
||||||
|
Corp.(a)
|
118,200
|
||||||
|
118,200
|
|||||||
|
Mining (except Oil and Gas) – 0.59%
|
|||||||
|
50,110
|
Fortitude Gold Corp.
|
339,746
|
|||||
|
339,746
|
|||||||
|
Miscellaneous Manufacturing – 0.79%
|
|||||||
|
125,000
|
iCAD, Inc.(a)
|
450,000
|
|||||
|
450,000
|
|||||||
|
Motion Pictures and Sound
|
|||||||
|
Recording Industries – 1.35%
|
|||||||
|
352,605
|
WildBrain Ltd.(a)(b)
|
775,731
|
|||||
|
775,731
|
|||||||
|
Oil & Gas – 1.84%
|
|||||||
|
167,367
|
Evolution
|
||||||
|
Petroleum Corp.
|
1,056,085
|
||||||
|
1,056,085
|
|||||||
|
Oil & Gas Services – 0.84%
|
|||||||
|
354,495
|
Profire Energy, Inc.(a)
|
478,568
|
|||||
|
478,568
|
|||||||
The accompanying notes to financial statements are an integral part of this schedule.
19
Perritt MicroCap Opportunities Fund
|
Schedule of Investments (Continued)
|
April 30, 2022 (Unaudited)
|
|
Shares
|
Value
|
||||||
|
Primary Metal Manufacturing – 1.01%
|
|||||||
|
103,104
|
Ampco-Pittsburgh
|
||||||
|
Corp.(a)
|
$
|
578,414
|
|||||
|
578,414
|
|||||||
|
Professional, Scientific,
|
|||||||
|
and Technical Services – 3.62%
|
|||||||
|
45,703
|
Bowman Consulting
|
||||||
|
Group Ltd.(a)
|
762,783
|
||||||
|
5,000
|
CRA International, Inc.
|
411,850
|
|||||
|
253,000
|
Heritage Global, Inc.(a)
|
270,710
|
|||||
|
328,400
|
Research
|
||||||
|
Solutions, Inc.(a)
|
627,244
|
||||||
|
2,072,587
|
|||||||
|
Publishing Industries
|
|||||||
|
(except Internet) – 0.89%
|
|||||||
|
40,000
|
eGain Corp.(a)
|
414,000
|
|||||
|
5,000
|
SWK Holdings Corp.(a)
|
98,000
|
|||||
|
512,000
|
|||||||
|
Real Estate Investment Trusts – 1.27%
|
|||||||
|
41,053
|
Chicago Atlantic Real
|
||||||
|
Estate Finance, Inc.
|
730,333
|
||||||
|
730,333
|
|||||||
|
Semiconductor Related Products – 1.66%
|
|||||||
|
60,000
|
AXT, Inc.(a)
|
354,000
|
|||||
|
40,000
|
Photronics, Inc.(a)
|
599,600
|
|||||
|
953,600
|
|||||||
|
Software – 2.76%
|
|||||||
|
21,720
|
American Software,
|
||||||
|
Inc. – Class A
|
371,412
|
||||||
|
100,000
|
Asure Software, Inc.(a)
|
606,000
|
|||||
|
130,000
|
Immersion Corp.(a)
|
607,100
|
|||||
|
1,584,512
|
|||||||
|
Specialty Manufacturing – 2.51%
|
|||||||
|
20,000
|
LB Foster Co. –
|
||||||
|
Class A(a)
|
284,000
|
||||||
|
67,000
|
LSI Industries, Inc.
|
481,730
|
|||||
|
25,223
|
Northwest Pipe Co.(a)
|
673,706
|
|||||
|
1,439,436
|
|||||||
|
Support Activities for Mining – 0.57%
|
|||||||
|
300,000
|
Alexco Resource
|
||||||
|
Corp.(a)(b)
|
327,000
|
||||||
|
327,000
|
|||||||
|
Telecommunications – 2.68%
|
|||||||
|
150,000
|
Ceragon Networks,
|
||||||
|
Ltd. – ADR(a)(b)
|
286,500
|
||||||
|
34,000
|
Digi International,
|
||||||
|
Inc.(a)
|
643,280
|
||||||
|
142,000
|
PC-Tel, Inc.
|
604,920
|
|||||
|
1,534,700
|
|||||||
|
Transportation – 3.76%
|
|||||||
|
373,000
|
Radiant Logistics,
|
||||||
|
Inc.(a)
|
2,152,210
|
||||||
|
2,152,210
|
|||||||
|
Transportation Equipment
|
|||||||
|
Manufacturing – 2.26%
|
|||||||
|
40,000
|
The Shyft Group, Inc.
|
1,018,800
|
|||||
|
7,792
|
Strattec Security
|
||||||
|
Corp.(a)
|
276,226
|
||||||
|
1,295,026
|
|||||||
|
Utilities – 0.88%
|
|||||||
|
48,000
|
Pure Cycle Corp.(a)
|
501,600
|
|||||
|
501,600
|
|||||||
|
Waste Management &
|
|||||||
|
Remediation Services – 1.57%
|
|||||||
|
120,711
|
Perma-Fix Environmental
|
||||||
|
Services, Inc.(a)
|
686,846
|
||||||
|
50,000
|
Sharps Compliance
|
||||||
|
Corp.(a)
|
216,000
|
||||||
|
902,846
|
|||||||
|
Water Transportation – 1.05%
|
|||||||
|
25,000
|
Euroseas Ltd.(a)(b)
|
603,750
|
|||||
|
603,750
|
|||||||
|
TOTAL COMMON
|
|||||||
|
STOCKS
|
|||||||
|
(Cost $40,432,653)
|
$
|
56,745,156
|
|||||
The accompanying notes to financial statements are an integral part of this schedule.
20
Perritt MicroCap Opportunities Fund
|
Schedule of Investments (Continued)
|
April 30, 2022 (Unaudited)
|
|
Contracts
|
WARRANTS – 0.02%
|
Value
|
|||||
|
Engineering & Construction – 0.02%
|
|||||||
|
5,000
|
Infrastructure & Energy
|
||||||
|
Alternatives, Inc.
|
|||||||
|
Expiration : 03/26/2023,
|
|||||||
|
Exercise Price
$11.50(a)(d)
|
|||||||
|
$
|
9,400
|
||||||
|
Computer & Electronic Product
|
|||||||
|
Manufacturing – 0.00%
|
|||||||
|
1,000,000
|
Singing Machine Co., Inc.
|
||||||
|
Expiration : 08/06/2026,
|
|||||||
|
Exercise Price
$0.35(a)(d)(e)(f)
|
|||||||
|
0
|
|||||||
|
TOTAL WARRANTS
|
|||||||
|
(Cost $8,100)
|
$
|
9,400
|
|||||
|
Shares
|
SHORT-TERM
|
|
|||||
|
INVESTMENTS – 1.44%
|
|||||||
|
Money Market Funds – 1.44%
|
|||||||
|
823,489
|
First American Government
|
||||||
|
Obligations Fund,
Class X, 0.22%(c)
|
|||||||
| $ |
823,489
|
||||||
|
TOTAL SHORT-TERM
|
|||||||
|
INVESTMENTS
|
|||||||
|
(Cost $823,489)
|
$
|
823,489
|
|||||
|
Total Investments
|
|||||||
|
(Cost $41,264,242) –
100.43%
|
|||||||
|
$
|
57,578,045
|
||||||
|
Liabilities in Excess
|
|||||||
|
of Other Assets –
|
|||||||
|
(0.43)%
|
(247,720
|
)
|
|||||
|
TOTAL NET ASSETS –
|
|||||||
|
100.00%
|
$
|
57,330,325
|
|||||
Percentages are stated as a percent of net assets.
ADR – American Depositary Receipt
|
(a)
|
Non-income producing security.
|
|
(b)
|
Foreign issued security.
|
|
(c)
|
The rate shown is the seven-day yield as of April 30, 2022.
|
|
(d)
|
These securities are deemed to be illiquid. These securities represent $9,400 of value or 0.02% of net assets.
|
|
(e)
|
Security was purchased in a transaction exempt from registration in the U.S. under the Securities Act of 1933 (the “Act”) and, unless registered under the Act, may only be sold pursuant to
exemption from registration and, in the case of a Rule 144A offering under the Act, may only be sold to “qualified institutional buyers.” The value of this security is $0 or 0.00% of the Fund’s net assets.
|
|
(f)
|
The prices for these securities were derived from estimates of fair value using methods approved by the Fund’s Board of Directors. These securities represent $0 of value or 0.00% of net
assets.
|
The accompanying notes to financial statements are an integral part of this schedule.
21
Perritt Ultra MicroCap Fund
|
Schedule of Investments
|
April 30, 2022 (Unaudited)
|
|
Shares
|
COMMON STOCKS – 97.83%
|
Value
|
|||||
|
Administrative and
|
|||||||
|
Support Services – 3.61%
|
|||||||
|
10,000
|
BGSF, Inc.
|
$
|
122,100
|
||||
|
11,250
|
Hudson Global, Inc.(a)
|
370,913
|
|||||
|
493,013
|
|||||||
|
Auto Parts & Equipment – 1.18%
|
|||||||
|
22,500
|
Commercial Vehicle
|
||||||
|
Group, Inc.(a)
|
161,550
|
||||||
|
161,550
|
|||||||
|
Biotechnology – 1.24%
|
|||||||
|
8,500
|
Opiant Pharmaceuticals,
|
||||||
|
Inc.(a)
|
169,660
|
||||||
|
169,660
|
|||||||
|
Business Services – 10.18%
|
|||||||
|
37,000
|
DLH Holdings Corp.(a)
|
558,700
|
|||||
|
20,000
|
Information Services
|
||||||
|
Group, Inc.
|
125,400
|
||||||
|
10,000
|
Intrusion, Inc.(a)
|
21,400
|
|||||
|
10,133
|
Issuer Direct Corp.(a)
|
241,875
|
|||||
|
110,000
|
Medicine Man
|
||||||
|
Technologies, Inc.(a)
|
185,900
|
||||||
|
3,500
|
Transcat, Inc.(a)
|
255,500
|
|||||
|
1,388,775
|
|||||||
|
Chemical & Related Products – 2.46%
|
|||||||
|
37,000
|
Flexible Solutions
|
||||||
|
International, Inc. –
|
|||||||
|
ADR(a)(d)
|
103,970
|
||||||
|
20,000
|
Northern Technologies
|
||||||
|
International Corp.
|
231,400
|
||||||
|
335,370
|
|||||||
|
Chemical Manufacturing – 4.04%
|
|||||||
|
60,000
|
AgroFresh
|
||||||
|
Solutions, Inc.(a)
|
111,600
|
||||||
|
20,000
|
Alimera Sciences, Inc.(a)
|
112,600
|
|||||
|
24,000
|
Aridis Pharmaceuticals,
|
||||||
|
Inc.(a)
|
30,000
|
||||||
|
40,000
|
ProPhase Labs, Inc.
|
296,800
|
|||||
|
551,000
|
|||||||
|
Computer & Electronic Product
|
|||||||
|
Manufacturing – 11.04%
|
|||||||
|
20,000
|
Airgain, Inc.(a)
|
169,400
|
|||||
|
75,000
|
BK Technologies Corp.
|
173,250
|
|||||
|
200,000
|
Dynatronics Corp.(a)
|
137,140
|
|||||
|
22,500
|
Luna Innovations, Inc.(a)
|
124,200
|
|||||
|
55,000
|
One Stop
|
||||||
|
Systems, Inc.(a)
|
258,500
|
||||||
|
65,000
|
Orbital Energy
|
||||||
|
Group, Inc.(a)
|
77,350
|
||||||
|
50,000
|
PC-Tel, Inc.
|
213,000
|
|||||
|
27,000
|
Quipt Home Medical
|
||||||
|
Corp. – ADR(a)(d)
|
123,390
|
||||||
|
700,000
|
Singing Machine
|
||||||
|
Co., Inc.(a)
|
105,000
|
||||||
|
19,000
|
TransAct Technologies,
|
||||||
|
Inc.(a)
|
125,400
|
||||||
|
1,506,630
|
|||||||
|
Computers & Electronics – 2.18%
|
|||||||
|
17,000
|
Napco Security
|
||||||
|
Technologies, Inc.(a)
|
297,500
|
||||||
|
297,500
|
|||||||
|
Construction & Engineering – 1.10%
|
|||||||
|
15,000
|
Gencor Industries,
|
||||||
|
Inc.(a)
|
150,300
|
||||||
|
150,300
|
|||||||
|
Consumer Goods – 1.68%
|
|||||||
|
20,000
|
Jerash Holdings
|
||||||
|
US, Inc.
|
111,800
|
||||||
|
12,000
|
Natural Alternatives
|
||||||
|
International, Inc.(a)
|
117,480
|
||||||
|
229,280
|
|||||||
|
Consumer Services – 2.13%
|
|||||||
|
52,400
|
DHI Group, Inc.(a)
|
291,344
|
|||||
|
291,344
|
|||||||
|
Credit Intermediation and
|
|||||||
|
Related Activities – 0.73%
|
|||||||
|
35,000
|
Usio, Inc.(a)
|
99,750
|
|||||
|
99,750
|
|||||||
|
Educational Services – 1.84%
|
|||||||
|
45,000
|
VirTra, Inc.(a)
|
251,550
|
|||||
|
251,550
|
|||||||
|
Electrical Equipment, Appliance,
|
|||||||
|
and Component Manufacturing – 0.79%
|
|||||||
|
30,000
|
Expion360, Inc.(a)
|
107,700
|
|||||
|
107,700
|
|||||||
The accompanying notes to financial statements are an integral part of this schedule.
22
Perritt Ultra MicroCap Fund
|
Schedule of Investments (Continued)
|
April 30, 2022 (Unaudited)
|
|
Shares
|
Value
|
||||||
|
Electronic Equipment
|
|||||||
|
& Instruments – 2.00%
|
|||||||
|
16,000
|
Identiv, Inc.(a)
|
$
|
195,040
|
||||
|
30,000
|
Iteris, Inc.(a)
|
77,400
|
|||||
|
272,440
|
|||||||
|
Environmental Services – 2.41%
|
|||||||
|
60,000
|
Quest Resource
|
||||||
|
Holding Corp.(a)
|
328,800
|
||||||
|
328,800
|
|||||||
|
Fabricated Metal Product
|
|||||||
|
Manufacturing – 1.61%
|
|||||||
|
9,500
|
The Eastern Co.
|
219,450
|
|||||
|
219,450
|
|||||||
|
Financial Services – 2.33%
|
|||||||
|
9,000
|
Hennessy Advisors, Inc.
|
89,550
|
|||||
|
11,000
|
Silvercrest Asset
|
||||||
|
Management Group,
|
|||||||
|
Inc. – Class A
|
228,580
|
||||||
|
318,130
|
|||||||
|
Leisure – 3.71%
|
|||||||
|
20,000
|
Century Casinos,
|
||||||
|
Inc.(a)
|
209,400
|
||||||
|
70,000
|
Galaxy Gaming, Inc.(a)
|
297,500
|
|||||
|
506,900
|
|||||||
|
Machinery Manufacturing – 1.28%
|
|||||||
|
15,000
|
Cantaloupe, Inc.(a)
|
82,050
|
|||||
|
60,000
|
TechPrecision Corp.(a)
|
93,000
|
|||||
|
175,050
|
|||||||
|
Medical Supplies & Services – 4.18%
|
|||||||
|
30,000
|
Biomerica, Inc.(a)
|
117,900
|
|||||
|
120,000
|
Check Cap, Ltd. –
|
||||||
|
ADR(a)(d)
|
43,320
|
||||||
|
7,500
|
Lakeland
|
||||||
|
Industries, Inc.(a)
|
121,350
|
||||||
|
19,987
|
Sensus
|
||||||
|
Healthcare, Inc.(a)
|
141,108
|
||||||
|
16,211
|
Taylor Devices, Inc.(a)
|
146,872
|
|||||
|
570,550
|
|||||||
|
Merchant Wholesalers,
|
|||||||
|
Durable Goods – 2.60%
|
|||||||
|
4,500
|
A-Mark Precious
|
||||||
|
Metals, Inc.
|
354,600
|
||||||
|
354,600
|
|||||||
|
Merchant Wholesalers,
|
|||||||
|
Nondurable Goods – 0.48%
|
|||||||
|
10,000
|
Educational
|
||||||
|
Development Corp.
|
65,500
|
||||||
|
65,500
|
|||||||
|
Miscellaneous Manufacturing – 1.52%
|
|||||||
|
78,125
|
INVO BioScience, Inc.(a)
|
117,969
|
|||||
|
30,000
|
Myomo, Inc.(a)
|
89,400
|
|||||
|
207,369
|
|||||||
|
Miscellaneous Store Retailers – 0.79%
|
|||||||
|
50,000
|
Better Choice Co, Inc.(a)
|
108,000
|
|||||
|
108,000
|
|||||||
|
Motor Vehicle and Parts Dealers – 0.81%
|
|||||||
|
25,000
|
Vision Marine
|
||||||
|
Technologies, Inc.(a)(d)
|
110,000
|
||||||
|
110,000
|
|||||||
|
Oil & Gas Services – 1.39%
|
|||||||
|
140,010
|
Profire Energy, Inc.(a)
|
189,013
|
|||||
|
189,013
|
|||||||
|
Pharmaceuticals – 2.60%
|
|||||||
|
36,494
|
ImmuCell Corp.(a)
|
355,451
|
|||||
|
355,451
|
|||||||
|
Primary Metal Manufacturing – 1.56%
|
|||||||
|
38,000
|
Ampco-Pittsburgh
|
||||||
|
Corp.(a)
|
213,180
|
||||||
|
213,180
|
|||||||
|
Professional, Scientific, and
|
|||||||
|
Technical Services – 4.69%
|
|||||||
|
14,635
|
Bowman Consulting
|
||||||
|
Group Ltd.(a)
|
244,258
|
||||||
|
12,000
|
Perion Network Ltd. –
|
||||||
|
ADR(a)(d)
|
252,960
|
||||||
|
75,000
|
Research Solutions,
|
||||||
|
Inc.(a)
|
143,250
|
||||||
|
640,468
|
|||||||
|
Publishing Industries
|
|||||||
|
(except Internet) – 0.51%
|
|||||||
|
60,000
|
FalconStor
|
||||||
|
Software, Inc.(a)(f)
|
69,000
|
||||||
|
69,000
|
|||||||
The accompanying notes to financial statements are an integral part of this schedule.
23
Perritt Ultra MicroCap Fund
|
Schedule of Investments (Continued)
|
April 30, 2022 (Unaudited)
|
|
Shares
|
Value
|
||||||
|
Real Estate – 0.71%
|
|||||||
|
13,000
|
Fathom Holdings,
|
||||||
|
Inc.(a)
|
$
|
96,460
|
|||||
|
96,460
|
|||||||
|
Real Estate Investment Trusts – 4.58%
|
|||||||
|
10,950
|
Chicago Atlantic Real
|
||||||
|
Estate Finance, Inc.
|
194,800
|
||||||
|
45,000
|
Global Self Storage, Inc.
|
273,600
|
|||||
|
32,500
|
Sachem Capital Corp.
|
156,650
|
|||||
|
625,050
|
|||||||
|
Semiconductor Related Products – 2.13%
|
|||||||
|
22,500
|
AXT, Inc.(a)
|
132,750
|
|||||
|
20,000
|
inTEST Corp.(a)
|
158,600
|
|||||
|
291,350
|
|||||||
|
Software – 2.45%
|
|||||||
|
30,000
|
Asure Software, Inc.(a)
|
181,800
|
|||||
|
40,500
|
NetSol Technologies,
|
||||||
|
Inc.(a)
|
153,090
|
||||||
|
334,890
|
|||||||
|
Specialty Manufacturing – 4.15%
|
|||||||
|
44,899
|
Data I/O Corp.(a)
|
149,963
|
|||||
|
29,000
|
Gulf Island
|
||||||
|
Fabrication, Inc.(a)
|
107,880
|
||||||
|
4,500
|
UFP Technologies, Inc.(a)
|
309,015
|
|||||
|
566,858
|
|||||||
|
Telecommunications – 1.03%
|
|||||||
|
50,000
|
Data Storage Corp.(a)
|
140,000
|
|||||
|
140,000
|
|||||||
|
Textile Product Mills – 0.81%
|
|||||||
|
40,000
|
The Dixie Group Inc(a)
|
110,400
|
|||||
|
110,400
|
|||||||
|
Utilities – 1.89%
|
|||||||
|
18,000
|
Global Water
|
||||||
|
Resources, Inc.
|
257,760
|
||||||
|
257,760
|
|||||||
|
Wholesale Electronic Markets
|
|||||||
|
and Agents and Brokers – 1.41%
|
|||||||
|
49,430
|
DecisionPoint
|
||||||
|
Systems, Inc.(a)
|
192,775
|
||||||
|
192,775
|
|||||||
|
TOTAL COMMON
|
|||||||
|
STOCKS
|
|||||||
|
(Cost $11,492,635)
|
$
|
13,352,866
|
|||||
|
Contracts
|
WARRANTS – 0.09%
|
||||||
|
Medical Supplies & Services – 0.00%
|
|||||||
|
250,000
|
Titan Medical, Inc.
|
||||||
|
Expiration: 08/10/2023,
|
|||||||
|
Exercise Price
|
|||||||
|
$3.20(a)(b)(e)(f)
|
$
|
0
|
|||||
|
Primary Metal Manufacturing – 0.09%
|
|||||||
|
15,000
|
Ampco-Pittsburgh Corp.
|
||||||
|
Expiration: 08/01/2025,
|
|||||||
|
Exercise Price
|
|||||||
|
$5.75(a)(b)
|
12,148
|
||||||
|
TOTAL WARRANTS
|
|||||||
|
(Cost $85,000)
|
$
|
12,148
|
|||||
The accompanying notes to financial statements are an integral part of this schedule.
24
Perritt Ultra MicroCap Fund
|
Schedule of Investments (Continued)
|
April 30, 2022 (Unaudited)
|
|
Shares
|
SHORT-TERM
|
Value
|
|||||
|
INVESTMENTS – 2.44%
|
|||||||
|
Money Market Funds – 2.44%
|
|||||||
|
332,715
|
First American Government
|
||||||
|
Obligations Fund,
Class X, 0.22%(c)
|
|||||||
|
$
|
332,715
|
||||||
|
TOTAL SHORT-TERM
|
|||||||
|
INVESTMENTS
|
|||||||
|
(Cost 332,715)
|
$
|
332,715
|
|||||
|
Total Investments
|
|||||||
|
(Cost $11,910,350) –
100.36%
|
|||||||
|
$
|
13,697,729
|
||||||
|
Liabilities in Excess
|
|||||||
|
of Other Assets –
(0.36)%
|
|||||||
|
(48,984
|
)
|
||||||
|
TOTAL NET ASSETS –
100.00%
|
|||||||
|
$
|
13,648,745
|
||||||
Percentages are stated as a percent of net assets.
ADR – American Depositary Receipt
|
(a)
|
Non-income producing security.
|
|
(b)
|
These securities are deemed to be illiquid. These securities represent $12,148 of value or 0.09% of net assets.
|
|
(c)
|
The rate shown is the seven-day yield as of April 30, 2022.
|
|
(d)
|
Foreign issued security.
|
|
(e)
|
Security was purchased in a transaction exempt from registration in the U.S. under the Securities Act of 1933 (the “Act”) and, unless registered under the Act, may only be sold pursuant to
exemption from registration and, in the case of a Rule 144A offering under the Act, may only be sold to “qualified institutional buyers.” The value of this security is $0 or 0.00% of the Fund’s net assets.
|
|
(f)
|
The prices for these securities were derived from estimates of fair value using methods approved by the Fund’s Board of Directors. These securities represent $69,000 of value or 0.51% of net
assets.
|
The accompanying notes to financial statements are an integral part of this schedule.
25
Perritt Funds, Inc.
|
Statements of Assets and Liabilities
|
April 30, 2022 (Unaudited)
|
Perritt MicroCap
|
Perritt Ultra
|
|||||||
|
Opportunities Fund
|
MicroCap Fund
|
|||||||
|
Assets:
|
||||||||
|
Investments at value
|
$
|
57,578,045
|
$
|
13,697,729
|
||||
|
Receivable for investments sold
|
112,412
|
—
|
||||||
|
Dividends and interest receivable
|
4,969
|
2,317
|
||||||
|
Prepaid expenses
|
7,319
|
1,751
|
||||||
|
Total Assets
|
57,702,745
|
13,701,797
|
||||||
|
Liabilities:
|
||||||||
|
Payable for investments purchased
|
262,549
|
—
|
||||||
|
Payable for fund shares purchased
|
3,630
|
500
|
||||||
|
Payable to Advisor
|
50,125
|
15,045
|
||||||
|
Payable to Officer & Directors
|
1,731
|
229
|
||||||
|
Accrued accounting expense
|
9,352
|
2,414
|
||||||
|
Accrued administration expense
|
5,131
|
770
|
||||||
|
Accrued audit expense
|
8,639
|
8,639
|
||||||
|
Accrued federal and state registration expense
|
3,194
|
9,130
|
||||||
|
Accrued legal expense
|
9,478
|
7,749
|
||||||
|
Accrued printing & mailing expense
|
11,825
|
3,898
|
||||||
|
Accrued transfer agent expense
|
3,816
|
3,866
|
||||||
|
Other accrued expenses & liabilities
|
2,950
|
812
|
||||||
|
Total Liabilities
|
372,420
|
53,052
|
||||||
|
Net Assets
|
$
|
57,330,325
|
$
|
13,648,745
|
||||
|
Net Assets Consist of:
|
||||||||
|
Capital Stock
|
$
|
36,340,895
|
$
|
9,945,131
|
||||
|
Total Distributable Earnings
|
20,989,430
|
3,703,614
|
||||||
|
Total Net Assets
|
$
|
57,330,325
|
$
|
13,648,745
|
||||
|
Capital Stock, $0.0001 par value
|
||||||||
|
Authorized
|
100,000,000
|
100,000,000
|
||||||
|
Outstanding
|
2,365,117
|
826,394
|
||||||
|
Net Assets
|
$
|
57,330,325
|
$
|
13,648,745
|
||||
|
Net asset value and offering price per share
|
$
|
24.24
|
$
|
16.52
|
||||
|
Cost of Investments
|
$
|
41,264,242
|
$
|
11,910,350
|
||||
The accompanying notes to financial statements are an integral part of these statements.
26
Perritt Funds, Inc.
|
Statements of Operations
|
For the Period Ended April 30, 2022 (Unaudited)
|
Perritt MicroCap
|
Perritt Ultra
|
|||||||
|
Opportunities Fund
|
MicroCap Fund
|
|||||||
|
Investment Income:
|
||||||||
|
Dividend Income (net of $375, $0 foreign
|
||||||||
|
withholding tax and issuance fees)
|
$
|
275,503
|
$
|
58,890
|
||||
|
Interest income
|
270
|
157
|
||||||
|
Total investment income
|
275,773
|
59,047
|
||||||
|
Expenses:
|
||||||||
|
Investment advisory fee
|
329,691
|
108,513
|
||||||
|
Shareholder servicing
|
48,401
|
14,741
|
||||||
|
Officer & directors’ fees & expenses
|
24,682
|
23,284
|
||||||
|
Administration fee
|
23,770
|
13,936
|
||||||
|
Federal & state registration fees
|
17,576
|
18,743
|
||||||
|
Professional fees
|
16,791
|
19,496
|
||||||
|
Fund accounting expenses
|
11,001
|
4,938
|
||||||
|
Other expense
|
7,868
|
5,392
|
||||||
|
Printing & mailing fees
|
5,017
|
1,274
|
||||||
|
Custodian fees
|
2,681
|
1,220
|
||||||
|
Total expenses
|
487,478
|
211,537
|
||||||
|
Net investment loss
|
(211,705
|
)
|
(152,490
|
)
|
||||
|
Realized and Unrealized Gain (Loss) on Investments:
|
||||||||
|
Net realized gain on investments
|
4,932,663
|
2,361,266
|
||||||
|
Change in unrealized depreciation on investments
|
(13,282,919
|
)
|
(5,814,492
|
)
|
||||
|
Net realized and unrealized loss on investments
|
(8,350,256
|
)
|
(3,453,226
|
)
|
||||
|
Net decrease in net assets resulting from operations
|
$
|
(8,561,961
|
)
|
$
|
(3,605,716
|
)
|
||
The accompanying notes to financial statements are an integral part of these statements.
27
Perritt MicroCap Opportunities Fund
|
Statements of Changes in Net Assets
|
|
For the
|
||||||||
|
Period Ended
|
For the
|
|||||||
|
April 30, 2022
|
Year Ended
|
|||||||
|
(Unaudited)
|
October 31, 2021
|
|||||||
|
Operations:
|
||||||||
|
Net investment loss
|
$
|
(211,705
|
)
|
$
|
(365,688
|
)
|
||
|
Net realized gain on investments
|
4,932,663
|
11,475,458
|
||||||
|
Net change in unrealized appreciation/(depreciation)
|
||||||||
|
on investments
|
(13,282,919
|
)
|
20,589,785
|
|||||
|
Net increase/(decrease) in net
|
||||||||
|
assets resulting from operations
|
(8,561,961
|
)
|
31,699,555
|
|||||
|
Dividends and Distributions to Shareholders:
|
||||||||
|
Distributable Earnings
|
(9,677,972
|
)
|
—
|
|||||
|
Total dividends and distributions
|
(9,677,972
|
)
|
—
|
|||||
|
Capital Share Transactions:
|
||||||||
|
Proceeds from shares issued
|
1,037,765
|
1,840,135
|
||||||
|
Reinvestment of distributions
|
9,339,345
|
—
|
||||||
|
Cost of shares redeemed
|
(7,303,563
|
)
|
(13,801,023
|
)
|
||||
|
Redemption fees
|
851
|
1,544
|
||||||
|
Net increase/ (decrease) in net assets
|
||||||||
|
from capital share transactions
|
3,074,398
|
(11,959,344
|
)
|
|||||
|
Total Increase/(Decrease) in Net Assets
|
(15,165,535
|
)
|
19,740,211
|
|||||
|
Net Assets
|
||||||||
|
Beginning of the period/year
|
72,495,860
|
52,755,649
|
||||||
|
End of the period/year
|
$
|
57,330,325
|
$
|
72,495,860
|
||||
|
Capital Share Transactions:
|
||||||||
|
Shares sold
|
37,641
|
63,095
|
||||||
|
Shares issued on reinvestment of distributions
|
325,278
|
—
|
||||||
|
Shares redeemed
|
(261,734
|
)
|
(503,819
|
)
|
||||
|
Net decrease from capital share transactions
|
101,185
|
(440,724
|
)
|
|||||
The accompanying notes to financial statements are an integral part of this statement.
28
Perritt Ultra MicroCap Fund
|
Statements of Changes in Net Assets
|
|
For the
|
||||||||
|
Period Ended
|
For the
|
|||||||
|
April 30, 2022
|
Year Ended
|
|||||||
|
(Unaudited)
|
October 31, 2021
|
|||||||
|
Operations:
|
||||||||
|
Net investment loss
|
$
|
(152,490
|
)
|
$
|
(342,512
|
)
|
||
|
Net realized gain on investments
|
2,361,266
|
2,836,726
|
||||||
|
Net change in unrealized appreciation/(depreciation)
|
||||||||
|
on investments
|
(5,814,492
|
)
|
7,565,696
|
|||||
|
Net increase/(decrease) in net
|
||||||||
|
assets resulting from operations
|
(3,605,716
|
)
|
10,059,910
|
|||||
|
Dividends and Distributions to Shareholders:
|
||||||||
|
Distributable Earnings
|
(1,199,255
|
)
|
—
|
|||||
|
Total dividends and distributions
|
(1,199,255
|
)
|
—
|
|||||
|
Capital Share Transactions:
|
||||||||
|
Proceeds from shares issued
|
721,610
|
5,130,104
|
||||||
|
Reinvestment of distributions
|
1,141,483
|
—
|
||||||
|
Cost of shares redeemed
|
(5,460,977
|
)
|
(4,741,542
|
)
|
||||
|
Redemption fees
|
2,343
|
19,111
|
||||||
|
Net increase/ (decrease) in net assets
|
||||||||
|
from capital share transactions
|
(3,595,541
|
)
|
407,673
|
|||||
|
Total Increase/(Decrease) in Net Assets
|
(8,400,512
|
)
|
10,467,583
|
|||||
|
Net Assets
|
||||||||
|
Beginning of the period/year
|
22,049,257
|
11,581,674
|
||||||
|
End of the period/year
|
$
|
13,648,745
|
$
|
22,049,257
|
||||
|
Capital Share Transactions:
|
||||||||
|
Shares sold
|
34,221
|
251,322
|
||||||
|
Shares issued on reinvestment of distributions
|
55,278
|
—
|
||||||
|
Shares redeemed
|
(262,577
|
)
|
(255,221
|
)
|
||||
|
Net decrease from capital share transactions
|
(173,078
|
)
|
(3,899
|
)
|
||||
The accompanying notes to financial statements are an integral part of this statement.
29
Perritt MicroCap Opportunities Fund
|
Financial Highlights
|
For a Fund share outstanding throughout the period/year
|
For the Six
|
||||||||||||||||||||||||
|
Months Ended
|
For the Years Ended October 31,
|
|||||||||||||||||||||||
|
April 30,
|
||||||||||||||||||||||||
|
2022
|
2021
|
2020
|
2019
|
2018
|
2017
|
|||||||||||||||||||
|
(Unaudited)
|
||||||||||||||||||||||||
|
Net asset value,
|
||||||||||||||||||||||||
|
beginning of period/year
|
$
|
32.02
|
$
|
19.51
|
$
|
23.12
|
$
|
28.17
|
$
|
38.59
|
$
|
34.18
|
||||||||||||
|
Income/(loss) from investment operations:
|
||||||||||||||||||||||||
|
Net investment loss2
|
(0.09
|
)
|
(0.15
|
)
|
(0.15
|
)
|
(0.11
|
)
|
(0.20
|
)
|
(0.15
|
)
|
||||||||||||
|
Net realized and unrealized
|
||||||||||||||||||||||||
|
gain (loss) on investments
|
(3.41
|
)
|
12.66
|
(2.66
|
)
|
(1.74
|
)
|
(1.83
|
)
|
7.94
|
||||||||||||||
|
Total from investment operations
|
(3.50
|
)
|
12.51
|
(2.81
|
(1.85
|
)
|
(2.03
|
)
|
7.79
|
|||||||||||||||
|
Less dividends and distributions:
|
||||||||||||||||||||||||
|
From net investment income
|
—
|
—
|
—
|
—
|
—
|
(0.09
|
)
|
|||||||||||||||||
|
From net realized gains
|
(4.28
|
)
|
—
|
(0.80
|
)
|
(3.20
|
)
|
(8.39
|
)
|
(3.29
|
)
|
|||||||||||||
|
Total dividends and distributions
|
(4.28
|
)
|
—
|
(0.80
|
)
|
(3.20
|
)
|
(8.39
|
)
|
(3.38
|
)
|
|||||||||||||
|
Redemption fees2,3
|
0.00
|
0.00
|
0.00
|
0.00
|
0.00
|
0.00
|
||||||||||||||||||
|
Net asset value, end of period/year
|
$
|
24.24
|
$
|
32.02
|
$
|
19.51
|
$
|
23.12
|
$
|
28.17
|
$
|
38.59
|
||||||||||||
|
Total return1
|
(12.94
|
%)5
|
64.12
|
%
|
(12.46
|
%)
|
(6.80
|
%)
|
(5.89
|
%)
|
24.20
|
%
|
||||||||||||
|
Supplemental data and ratios:
|
||||||||||||||||||||||||
|
Net assets, end of period/year
|
||||||||||||||||||||||||
|
(in thousands)
|
$
|
57,330
|
$
|
72,496
|
$
|
52,756
|
$
|
107,875
|
$
|
160,698
|
$
|
225,445
|
||||||||||||
|
Ratio of net expenses
|
||||||||||||||||||||||||
|
to average net assets
|
1.48
|
%4
|
1.56
|
%
|
1.64
|
%
|
1.38
|
%
|
1.28
|
%
|
1.23
|
%
|
||||||||||||
|
Ratio of net investment loss
|
||||||||||||||||||||||||
|
to average net assets
|
(0.64
|
%)4
|
(0.53
|
%)
|
(0.73
|
%)
|
(0.48
|
%)
|
(0.63
|
%)
|
(0.41
|
%)
|
||||||||||||
|
Portfolio turnover rate
|
11.2
|
%5
|
23.5
|
%
|
19.1
|
%
|
22.1
|
%
|
14.0
|
%
|
18.0
|
%
|
||||||||||||
|
1
|
Total return reflects reinvested dividends but does not reflect the impact of taxes.
|
|
2
|
Net investment income (loss) and redemption fees per share has been calculated based on average shares outstanding during the period/year.
|
|
3
|
Amount is less than $0.01 per share.
|
|
4
|
Annualized for periods less than one year.
|
|
5
|
Not annualized for periods less than one year.
|
The accompanying notes to financial statements are an integral part of this schedule.
30
Perritt Ultra MicroCap Fund
|
Financial Highlights
|
For a Fund share outstanding throughout the period/year
|
For the Six
|
||||||||||||||||||||||||
|
Months Ended
|
For the Years Ended October 31,
|
|||||||||||||||||||||||
|
April 30,
|
||||||||||||||||||||||||
|
2022
|
2021
|
2020
|
2019
|
2018
|
2017
|
|||||||||||||||||||
|
(Unaudited)
|
||||||||||||||||||||||||
|
Net asset value,
|
||||||||||||||||||||||||
|
beginning of period/ year
|
$
|
22.06
|
$
|
11.54
|
$
|
12.81
|
$
|
15.62
|
$
|
18.49
|
$
|
15.46
|
||||||||||||
|
Income/(loss) from investment operations:
|
||||||||||||||||||||||||
|
Net investment loss2
|
(0.17
|
)
|
(0.36
|
)
|
(0.11
|
)
|
(0.12
|
)
|
(0.17
|
)
|
(0.18
|
)
|
||||||||||||
|
Net realized and unrealized
|
||||||||||||||||||||||||
|
gain (loss) on investments
|
(4.00
|
)
|
10.86
|
(1.14
|
)
|
(1.60
|
)
|
(0.77
|
)
|
3.94
|
||||||||||||||
|
Total from investment operations
|
(4.17
|
)
|
10.50
|
(1.25
|
)
|
(1.72
|
)
|
(0.94
|
)
|
3.76
|
||||||||||||||
|
Less dividends and distributions:
|
||||||||||||||||||||||||
|
From net realized gains
|
(1.37
|
)
|
—
|
(0.01
|
)
|
(1.09
|
)
|
(1.93
|
)
|
(0.73
|
)
|
|||||||||||||
|
From return of capital
|
—
|
—
|
(0.01
|
)
|
—
|
—
|
—
|
|||||||||||||||||
|
Total dividends and distributions
|
(1.37
|
)
|
—
|
(0.02
|
)
|
(1.09
|
)
|
(1.93
|
)
|
(0.73
|
)
|
|||||||||||||
|
Redemption fees2
|
0.00
|
3
|
0.02
|
0.00
|
3
|
0.00
|
3
|
0.00
|
3
|
0.00
|
3
|
|||||||||||||
|
Net asset value, end of period/year
|
$
|
16.52
|
$
|
22.06
|
$
|
11.54
|
$
|
12.81
|
$
|
15.62
|
$
|
18.49
|
||||||||||||
|
Total return1
|
(20.15
|
%)5
|
91.16
|
%
|
(9.75
|
)%
|
(11.54
|
%)
|
(5.73
|
%)
|
25.27
|
%
|
||||||||||||
|
Supplemental data and ratios:
|
||||||||||||||||||||||||
|
Net assets, end of period/year
|
||||||||||||||||||||||||
|
(in thousands)
|
$
|
13,649
|
$
|
22,049
|
$
|
11,582
|
$
|
34,154
|
$
|
61,042
|
$
|
69,636
|
||||||||||||
|
Ratio of net expenses
|
||||||||||||||||||||||||
|
to average net assets
|
2.44
|
%4
|
2.42
|
%
|
2.68
|
%
|
1.83
|
%
|
1.71
|
%
|
1.70
|
%
|
||||||||||||
|
Ratio of net investment loss
|
||||||||||||||||||||||||
|
to average net assets
|
(1.76
|
%)4
|
(1.85
|
)%
|
(0.92
|
%)
|
(0.85
|
%)
|
(0.99
|
%)
|
(1.07
|
%)
|
||||||||||||
|
Portfolio turnover rate
|
9.0
|
%5
|
25.7
|
%
|
14.3
|
%
|
13.3
|
%
|
28.4
|
%
|
43.0
|
%
|
||||||||||||
|
1
|
Total return reflects reinvested dividends but does not reflect the impact of taxes.
|
|
2
|
Net investment income (loss) and redemption fees per share has been calculated based on average shares outstanding during the period/year.
|
|
3
|
Amount is less than $0.01 per share.
|
|
4
|
Annualized for periods less than one year.
|
|
5
|
Not annualized for periods less than one year.
|
The accompanying notes to financial statements are an integral part of this schedule.
31
Perritt Funds, Inc.
|
Notes to Financial Statements
|
April 30, 2022 (Unaudited)
|
1.
|
Organization
|
|
Perritt Funds, Inc. (the “Corporation”) was organized on March 19, 2004 as a Maryland corporation and is registered under the Investment Company Act of 1940, as amended (the “1940 Act”), as an open-end
investment company, with each series below being a diversified fund. The Corporation currently consists of the following series: Perritt MicroCap Opportunities Fund (“MicroCap Fund”) and Perritt Ultra MicroCap Fund (“Ultra MicroCap Fund”)
(each, a “Fund,” and collectively, the “Funds”). Perritt MicroCap Opportunities Fund, Inc., the predecessor to the MicroCap Fund, commenced operations on April 11, 1988. As part of a plan of reorganization, on February 28, 2013, Perritt
MicroCap Opportunities Fund, Inc. merged into the MicroCap Fund, a series within the Corporation. The Ultra MicroCap Fund commenced operations on August 30, 2004. The MicroCap Fund’s investment objective is to seek long-term capital
appreciation by investing in mainly common stocks of companies with market capitalizations that are below $500 million at the time of the initial purchase. The Ultra MicroCap Fund’s investment objective is to seek long-term capital
appreciation by investing in mainly common stocks of companies with market capitalizations that are below $300 million at the time of the initial purchase. The Funds are each an investment company and accordingly follow the investment
company accounting and reporting guidance of the Financial Accounting Standards Board (“FASB”) Accounting Standards Codification Topic 946 “Financial Services – Investment Companies.”
|
|
|
2.
|
Summary of Significant Accounting Policies
|
|
a.
|
Exchange-listed securities are generally valued at the last sales price reported by the principal security exchange on which the security is traded, or if no sale is reported, the mean between the latest bid and
ask price unless the Funds’ investment advisor believes that the mean does not represent a fair value, in which case the securities are fair valued as set forth below. Securities listed on NASDAQ are valued at the NASDAQ Official Closing
Price. Demand notes, commercial paper, U.S. Treasury Bills and warrants are stated at fair value using market prices if available, or a pricing service when such prices are believed to reflect fair value. Money Market Funds are valued at
amortized cost. Securities for which market quotations are not readily available are valued at their fair value as determined in good faith by the Funds’ investment advisor under procedures established by and under the supervision of the
Board of Directors of the Funds. The Funds’ fair value procedures allow for the use of certain methods performed by the Funds’ investment advisor to value those securities for which market quotations are not readily available, at a price
that a Fund might reasonably expect to receive upon a sale of such securities. For example, these methods may be based on a multiple of earnings, or a discount from market of a similar freely traded security, or a yield to maturity with
respect to debt issues, or a combination of these and other methods.
|
|
|
b.
|
Net realized gains and losses on securities are computed using the first-in, first-out method.
|
|
|
c.
|
Dividend income is recognized on the ex-dividend date, and interest income is recognized on the accrual basis. Withholding taxes on foreign dividends and capital
|
32
Perritt Funds, Inc.
|
Notes to Financial Statements (Continued)
|
|
gains, which are included as a component of net investment income and realized gain (loss) on investments, respectively, have been provided for in accordance with the Funds’ understanding of the applicable
country’s tax rules and rates. Discounts and premiums on securities purchased are amortized over the life of the respective securities using the interest method. Distributions received from real estate investment trusts (“REITs”) are
classified as investment income or realized gains based on the U.S. income tax characteristics of the distribution. Return of capital distributions received from REIT securities and partnerships are recorded as an adjustment to the cost
of the security and thus may impact unrealized or realized gains or losses on the security. Investment and shareholder transactions are recorded on the trade date.
|
||
|
d.
|
Each Fund is charged for those expenses that are directly attributable to it. Expenses that are not readily identifiable to a specific Fund are generally allocated among the Funds in proportion to the relative
net assets of the Funds.
|
|
|
e.
|
Provision has not been made for federal income tax since the Funds have each elected to be taxed as a “regulated investment company” and intend to distribute substantially all income to their shareholders and
otherwise comply with the provisions of the Internal Revenue Code applicable to regulated investment companies.
|
|
|
f.
|
The preparation of financial statements in conformity with accounting principles generally accepted in the United States of America (“GAAP”) requires management to make estimates and assumptions that affect the
reported amounts of assets and liabilities and disclosure of contingent assets and liabilities at the date of the financial statements and reported amounts of increases and decreases in net assets from operations during the reporting
period. Actual results could differ from those estimates.
|
|
|
In preparing these financial statements, the Funds have evaluated events and transactions for potential recognition or disclosure through the date the financial statements were issued.
|
||
|
g.
|
Dividends from net investment income and net realized capital gains, if any, are declared and paid annually. Distributions to shareholders are recorded on the ex-dividend date. Each Fund may utilize earnings and
profit distributed to shareholders on redemption of shares as part of the dividends paid deduction. The Funds may periodically make reclassifications among certain of their capital accounts as a result of the timing and characterization
of certain income and realized gain distributions, including reclassifying net operating loss, as determined annually in accordance with federal tax regulations which may differ from GAAP. The MicroCap Fund has reclassified the components
of its capital accounts for the year ended October 31, 2021 by increasing paid-in capital by $769,229 and decreasing distributable earnings/(losses) by $769,229. The Ultra Microcap Fund has reclassified the components of its capital
accounts for the year ended October 31, 2021 by decreasing paid-in capital by $12,069 and increasing distributable earnings/(losses) by $12,069. These adjustments were primarily due to the utilization of earnings and profits distributed
to shareholders on redemptions of shares and the write off of net operating losses.
|
|
|
h.
|
As of and during the six months ended April 30, 2022, the Funds did not have a liability for any unrecognized tax benefits. The Funds recognize interest and penalties, if any, related to unrecognized tax
benefits as income tax expense on the Statements of
|
33
Perritt Funds, Inc.
|
Notes to Financial Statements (Continued)
|
|
Operations. During the six months ended April 30, 2022, the Funds did not incur any interest or penalties. The Funds are not subject to examination by U.S. federal tax authorities for any tax years before 2018.
|
|
3.
|
Security Valuation
|
|
GAAP establishes an authoritative definition of fair value and sets out a hierarchy for measuring fair value. GAAP also requires additional disclosures about the various inputs used to develop the measurements
of fair value. These inputs are summarized in the three broad levels listed below:
|
|
• Level 1 –
|
Quoted prices in active markets for identical securities that the Funds have the ability to access.
|
|
|
• Level 2 –
|
Other significant observable inputs (including quoted prices for similar securities or the identical security on an inactive market, interest rates, prepayment speeds, credit risk, etc.).
|
|
|
• Level 3 –
|
Significant unobservable inputs (including the Funds’ own assumptions in determining the fair value of investments).
|
|
The inputs or methodology used for valuing securities are not necessarily an indication of the risk associated with investing in those securities. The following is a summary of the inputs used to value the
Funds’ net assets as of April 30, 2022:
|
|
|
Perritt Microcap Opportunities Fund
|
|
Description
|
Level 1
|
Level 2
|
Level 3
|
Total
|
|||||||||||||
|
Investments in Securities
|
|||||||||||||||||
|
Common Stocks
|
|||||||||||||||||
|
Communication Services
|
$
|
1,673,859
|
$
|
—
|
$
|
—
|
$
|
1,673,859
|
|||||||||
|
Consumer Discretionary
|
7,619,256
|
—
|
—
|
7,619,256
|
|||||||||||||
|
Consumer Staples
|
306,250
|
—
|
—
|
306,250
|
|||||||||||||
|
Energy
|
1,960,654
|
—
|
—
|
1,960,654
|
|||||||||||||
|
Financial
|
9,969,793
|
—
|
—
|
9,969,793
|
|||||||||||||
|
Health Care
|
3,531,310
|
—
|
—
|
3,531,310
|
|||||||||||||
|
Industrials
|
17,194,185
|
—
|
—
|
17,194,185
|
|||||||||||||
|
Information Technology
|
9,178,029
|
—
|
—
|
9,178,029
|
|||||||||||||
|
Materials
|
4,810,220
|
—
|
—
|
4,810,220
|
|||||||||||||
|
Utilities
|
501,600
|
—
|
—
|
501,600
|
|||||||||||||
|
Total Common Stocks
|
56,745,156
|
—
|
—
|
56,745,156
|
|||||||||||||
|
Warrants
|
|||||||||||||||||
|
Consumer Discretionary
|
9,400
|
—
|
0
|
9,400
|
|||||||||||||
|
Total Warrants
|
9,400
|
—
|
0
|
9,400
|
|||||||||||||
|
Short-Term Investments
|
823,489
|
—
|
—
|
823,489
|
|||||||||||||
|
Total Investments in Securities
|
$
|
57,578,045
|
$
|
—
|
$
|
0
|
$
|
57,578,045
|
|||||||||
34
Perritt Funds, Inc.
|
Notes to Financial Statements (Continued)
|
|
Below is a reconciliation of Level 3 assets for which significant unobservable inputs were used to determine fair value:
|
|
Description
|
Warrants
|
||||
|
Balance as of November 1, 2021
|
$
|
—
|
|||
|
Purchases
|
—
|
||||
|
Sales proceeds and paydowns
|
—
|
||||
|
Accreted discounts, net
|
—
|
||||
|
Corporate Actions
|
—
|
||||
|
Realized gain (loss)
|
—
|
||||
|
Change in unrealized appreciation (depreciation)
|
—
|
||||
|
Transfers into/(out of) Level 3
|
0
|
||||
|
Balance as of April 30, 2022
|
$
|
0
|
|||
|
Change in unrealized appreciation (depreciation)
|
|||||
|
during the period for Level 3 investments held at April 30, 2022.
|
$
|
—
|
|||
|
Perritt Ultra MicroCap Fund
|
|||||||||||||||||
|
Description
|
Level 1
|
Level 2
|
Level 3
|
Total
|
|||||||||||||
|
Investments in Securities
|
|||||||||||||||||
|
Common Stocks
|
|||||||||||||||||
|
Communication Services
|
$
|
544,304
|
$
|
—
|
$
|
—
|
$
|
544,304
|
|||||||||
|
Consumer Discretionary
|
1,130,950
|
—
|
—
|
1,130,950
|
|||||||||||||
|
Consumer Staples
|
225,480
|
—
|
—
|
225,480
|
|||||||||||||
|
Energy
|
296,894
|
—
|
—
|
296,894
|
|||||||||||||
|
Financial
|
1,024,180
|
—
|
—
|
1,024,180
|
|||||||||||||
|
Health Care
|
2,229,654
|
—
|
—
|
2,229,654
|
|||||||||||||
|
Industrials
|
3,088,042
|
—
|
—
|
3,088,042
|
|||||||||||||
|
Information Technology
|
3,456,392
|
—
|
69,000
|
3,525,392
|
|||||||||||||
|
Materials
|
660,150
|
—
|
—
|
660,150
|
|||||||||||||
|
Real Estate Investment Trusts
|
370,060
|
—
|
—
|
370,060
|
|||||||||||||
|
Utilities
|
257,760
|
—
|
—
|
257,760
|
|||||||||||||
|
Total Common Stocks
|
13,283,866
|
—
|
69,000
|
13,352,866
|
|||||||||||||
|
Warrants
|
|||||||||||||||||
|
Health Care
|
12,148
|
—
|
0
|
12,148
|
|||||||||||||
|
Total Warrants
|
12,148
|
—
|
0
|
12,148
|
|||||||||||||
|
Short-Term Investments
|
332,715
|
—
|
—
|
332,715
|
|||||||||||||
|
Total Investments in Securities
|
$
|
13,628,729
|
$
|
—
|
$
|
69,000
|
$
|
13,697,729
|
|||||||||
35
Perritt Funds, Inc.
|
Notes to Financial Statements (Continued)
|
|
Common
|
|||||||||
|
Description
|
Stocks
|
Warrants
|
|||||||
|
Balance as of November 1, 2021
|
$
|
—
|
$
|
—
|
|||||
|
Purchases
|
—
|
—
|
|||||||
|
Sales proceeds and paydowns
|
—
|
—
|
|||||||
|
Accreted discounts, net
|
—
|
—
|
|||||||
|
Corporate Actions
|
—
|
—
|
|||||||
|
Realized gain (loss)
|
—
|
—
|
|||||||
|
Change in unrealized appreciation (depreciation)
|
—
|
—
|
|||||||
|
Transfers into/(out of) Level 3
|
69,000
|
0
|
|||||||
|
Balance as of April 30, 2022
|
$
|
69,000
|
$
|
0
|
|||||
|
Change in unrealized appreciation (depreciation)
|
|||||||||
|
during the period for Level 3
|
|||||||||
|
investments held at April 30, 2022.
|
$
|
(111,000
|
)
|
$
|
—
|
||||
|
Please refer to the Schedule of Investments for additional information regarding the composition of the amounts listed above.
|
|
|
4.
|
Investment Advisory Agreement
|
|
For each Fund, the Corporation entered into an investment advisory agreement (collectively, the “Agreements”) with Perritt Capital Management, Inc. (the “Advisor”), with whom certain officers and directors of
the Corporation are affiliated, to furnish investment advisory services to the Funds. Under the terms of the Agreements, the MicroCap Fund pays the Advisor a monthly fee at the annual rate of 1.00% of the Fund’s daily average net assets,
and the Ultra MicroCap Fund pays the Advisor a monthly fee equal to 1.25% of its daily average net assets less than or equal to $100 million; 1.00% with respect to daily average net assets in excess of $100 million and less than or equal
to $200 million; and 0.50% with respect to daily average net assets in excess of $200 million. At April 30, 2022, the MicroCap Fund and Ultra MicroCap Fund had fees due to the Advisor of $50,125 and $15,045, respectively. For the six
months ended April 30, 2022, the MicroCap Fund and Ultra MicroCap Fund had incurred advisory fees of $329,691 and $108,513, respectively.
|
|
|
The Advisor manages the Funds’ investments subject to the supervision of the Funds’ Board of Directors. The Advisor is responsible for investment decisions and supplies investment research and portfolio
management. Under the Agreements, the Advisor, at its own expense and without reimbursement from the Funds, will furnish office space and all necessary office facilities, equipment and personnel for making the investment decisions
necessary for managing the Funds and maintaining their organization, will pay the salaries and fees of all officers and directors of the Funds (except the Chief Compliance Officer’s salary and the fees paid to disinterested directors) and
will bear all sales and promotional expenses of the Funds.
|
|
|
The officers of the Funds are affiliated with the Advisor. Such officers, with the exception of the Chief Compliance Officer, receive no compensation from the Funds or the Advisor for serving their respective
roles. The Funds pay the salary associated with the office of the Chief Compliance Officer. Such fees are included on the Statements of Operations within officer & directors’ fees & expenses.
|
36
Perritt Funds, Inc.
|
Notes to Financial Statements (Continued)
|
|
The Funds reimbursed the Advisor for fees paid to financial intermediaries such as banks, broker-dealers, financial advisors or other financial institutions for sub-transfer agency, sub-administration and other
services that the financial intermediaries provided to their clients, who are beneficial owners of shares of the Funds. The financial intermediaries are the record owners of the Funds on the Funds’ records through omnibus accounts, other
group accounts, retirement plans or accounts traded through registered securities clearing agents. These fees are fees that the Funds are obligated to pay to such intermediaries, and the fees may vary based on, for example, the nature of
services provided. The fees paid to such intermediaries by the Funds are only a portion of the full fee that is paid to the intermediaries, and the Advisor is obligated to pay the remaining amount. In determining the portion of the fees
paid to the intermediaries that the Funds are obligated to pay, the Funds have used the “avoided cost” method, which is one of several permissible methods to determine the fees are reasonable. Based on this method, the Funds’ Board of
Directors determines a fee per sub-account that it believes approximates the transfer agency fee that would otherwise have been payable by the Funds if such intermediaries did not maintain the sub-account. These amounts are included
within shareholder servicing fees on the Statements of Operations.
|
|
|
5.
|
Investment Transactions
|
|
Purchases and sales of securities, excluding short-term investments, for the six months ended April 30, 2022, were as follows:
|
|
Purchases
|
Sales
|
||||||||||||||||
|
U.S.
|
U.S.
|
||||||||||||||||
|
Governments
|
Other
|
Governments
|
Other
|
||||||||||||||
|
MicroCap Fund
|
$
|
—
|
$
|
7,271,847
|
$
|
—
|
$
|
13,660,227
|
|||||||||
|
Ultra MicroCap Fund
|
$
|
—
|
$
|
1,518,712
|
$
|
—
|
$
|
5,297,292
|
|||||||||
|
6.
|
Federal Income Tax Matters
|
|
As of October 31, 2021, the components of distributable earnings on a tax basis were as follows:
|
|
MicroCap
|
Ultra MicroCap
|
||||||||
|
Fund
|
Fund
|
||||||||
|
Cost of investments for tax purposes
|
$
|
43,104,749
|
$
|
14,589,543
|
|||||
|
Gross tax unrealized appreciation
|
31,695,795
|
8,929,006
|
|||||||
|
Gross tax unrealized depreciation
|
(2,144,405
|
)
|
(1,327,135
|
)
|
|||||
|
Net unrealized appreciation on investments
|
29,551,390
|
7,601,871
|
|||||||
|
Distributable ordinary income
|
384,459
|
—
|
|||||||
|
Distributable long-term capital gains
|
9,293,514
|
1,199,251
|
|||||||
|
Other accumulated losses
|
—
|
(292,537
|
)
|
||||||
|
Total Distributable Earnings/(Losses)
|
$
|
39,229,363
|
$
|
8,508,585
|
|||||
|
The difference between book and tax basis distributable earnings is primarily related to the deferral of losses on wash sales.
|
|
|
A regulated investment company may elect for any taxable year to treat any portion of any qualified late year loss as arising on the first day of the next taxable year. Qualified
|
37
Perritt Funds, Inc.
|
Notes to Financial Statements (Continued)
|
|
late year losses are ordinary losses which occur during the portion of the Funds’ taxable year subsequent to December 31.
|
|
|
At October 31, 2021, the Ultra MicroCap Fund deferred, on a tax basis, late year ordinary losses of $292,537. During the year ended October 31, 2021, the MicroCap Fund utilized $1,716 and the Ultra MicroCap Fund
utilized $1,141,286 capital loss carryforwards. The Funds had no capital loss carryforward for the year ended October 31,2021.
|
|
|
The tax composition of distributions paid during the periods ended October 31, 2021 and 2020 were as follows:
|
|
Ordinary
|
Return of
|
||||||||||||||||||||||||
|
Income
|
Long-term Capital Gains
|
Capital
|
|||||||||||||||||||||||
|
2021
|
2020
|
2021
|
2020
|
2021
|
2020
|
||||||||||||||||||||
|
MicroCap Fund
|
$
|
—
|
$
|
—
|
$
|
—
|
$
|
3,593,867
|
$
|
—
|
$
|
—
|
|||||||||||||
|
Ultra MicroCap Fund
|
—
|
—
|
—
|
17,594
|
—
|
34,626
|
|||||||||||||||||||
|
The Funds designated as long-term capital gain dividend, pursuant to Internal Revenue Code Section 852(b)(3), the amount necessary to reduce the earnings and profits of the Funds related to net capital gain to
zero for the tax year ended October 31, 2021.
|
|
|
7.
|
Restricted Securities
|
|
The Funds may own investment securities which are unregistered and thus restricted as to resale. These securities are valued by each Fund after giving due consideration to pertinent factors including recent
private sales, market conditions and the issuer’s financial performance. Where future disposition of these securities requires registration under the Securities Act of 1933, each Fund has the right to include these securities in such
registration, generally without cost to the Fund. The Funds have no right to require registration of the unregistered securities they hold. As of April 30, 2022, the MicroCap Fund held a restricted security with an aggregate value of $0,
which accounted for 0.00% of the Fund’s net assets. As of April 30, 2022, the Ultra MicroCap Fund held a restricted security with an aggregate value of $0, which accounted for 0.00% of the Fund’s net assets.
|
|
|
8.
|
Guarantees and Indemnifications
|
|
Under the Funds’ organizational documents, their officers and directors are indemnified by the Funds against certain liabilities arising out of the performance of their duties to the Funds. Additionally, in the
normal course of business, the Funds enter into contracts with service providers that contain general indemnification clauses. The Funds’ maximum exposure under these arrangements is unknown as this would involve future claims that may be
made against the Funds that have not yet occurred. Currently, the Funds expect the risk of loss to be remote.
|
|
|
9.
|
Line of Credit Arrangement
|
|
The MicroCap Fund and Ultra MicroCap Fund are each party to uncommitted line of credit arrangements with U.S. Bank, N.A. with an expiration date of December 6, 2022, under which the MicroCap Fund may borrow up
to $2,500,000 and the Ultra MicroCap Fund may borrow up to $2,000,000, subject to certain restrictions and covenants. Interest is charged on borrowings at the prevailing Prime Rate which was 3.50% as of April 30, 2022. The Funds have
borrowed under these arrangements from time to time to increase the efficiency
|
38
Perritt Funds, Inc.
|
Notes to Financial Statements (Continued)
|
|
of cash flow management. For the six months ended April 30, 2022, the MicroCap Fund did not borrow on the line of credit. The Ultra MicroCap Fund had average borrowings of $80,250 and the weighted average
interest rate on the line of credit borrowings was 3.25%. From November 26, 2021 through November 28, 2021, the Ultra MicroCap Fund had borrowings of $96,000, which represent the largest borrowing amounts during the six months ended April
30, 2022. As of April 30, 2022, the MicroCap Fund and Ultra MicroCap Fund had no outstanding borrowings on the lines of credit. Interest charged on the borrowings is recorded as other expense in the Statements of Operations.
|
|
|
10.
|
Redemption Fee
|
|
The Funds charge a 2.00% redemption fee to those who buy and sell shares within 90 calendar days or less. The redemption fee is retained for the benefit of long-term shareholders, and recorded as additional
capital in the Statements of Changes in Net Assets.
|
|
|
11.
|
Transactions with Affiliates
|
|
During the six months ended April 30, 2022, MicroCap Fund and Ultra MicroCap Fund did not hold any securities that were considered affiliated.
|
|
|
The Funds are permitted to purchase or sell securities from or to each other under specified conditions outlined in procedures adopted by the Board of Directors. The procedures have been designed to ensure that
any purchase or sale of securities by a Fund from or to another Fund complies with Rule 17a-7 of the 1940 Act. For the six months ended April 30, 2022, the MicroCap Fund and Ultra MicroCap Fund engaged in 0 securities transactions
pursuant to Rule 17a-7 of the 1940 Act.
|
|
|
12.
|
Beneficial Ownership
|
|
The beneficial ownership, either directly or indirectly, of more than 25% of voting securities of a fund creates a presumption of control of that fund, under Section 2(a)(9) of the 1940 Act. As of April 30,
2022, the Funds had omnibus shareholder accounts (comprised of a group of individual shareholders), which amounted to more than 25% of the total shares outstanding of the respective Fund. There were no individual shareholders of record
who owned more than 5% of the outstanding shares of beneficial interest of a Fund or Class of shares of a Fund. Shareholders with a controlling interest could affect the outcome of proxy voting or direction of management of a Fund.
|
|
|
13.
|
Recent Market Conditions
|
|
General economic, political and public health conditions may have a significant adverse effect on the Funds’ investment operations and profitability. For example, the global outbreak of COVID-19 (commonly
referred to as “coronavirus”) has disrupted economic markets worldwide, as well as the economies of individual countries. The economic fallout from COVID-19, and the long-term impact on economies, markets, industries and individual
issuers, are not known. The operational and financial performance of the issuers of securities in which the Funds invest depends on future developments, including the duration and spread of COVID-19, and such uncertainty may in turn
adversely affect the value and liquidity of the Funds’ investments, impair the Funds’ ability to satisfy redemption requests, and negatively impact the Funds’ performance. Additionally, on February 24, 2022, Russia commenced a military
attack on Ukraine
|
39
Perritt Funds, Inc.
|
Notes to Financial Statements (Continued)
|
|
which has led to various countries, including the US, imposing economic sanctions on certain Russian individuals and entities. The current political and financial uncertainty regarding the Russia-Ukraine
conflict may have adverse effects on market volatility and global economic growth as well as the markets for certain securities and commodities, such as oil and natural gas, among other sectors. The duration of the conflict, potential for
escalation and ultimate effects on the Funds cannot currently be predicted. For a complete description of all of the principal risks the Funds are subject to, please refer to the Funds’ Prospectus and SAI.
|
40
Perritt Funds, Inc.
|
Expense Example (Unaudited)
|
April 30, 2022
|
As a shareholder of the Funds, you incur two types of costs: (1) transaction costs, including redemption fees (the Funds impose a 2.00% redemption fee on shares held for 90 calendar days or less after purchase); and (2)
ongoing costs, including management fees; distribution and/or service fees; and other Fund expenses. This example is intended to help you understand your ongoing costs (in dollars) of investing in the Fund and to compare these costs with the
ongoing costs of investing in other mutual funds. The example is based on an investment of $1,000 invested at the beginning of the period and held for the entire period (November 1, 2021 – April 30, 2022).
Actual Expenses
The first line of the table below provides information about actual account values and actual expenses. Although the Funds charge no sales load or transaction fees (other than a 2.00% redemption fee for shares held for
90 calendar days or less after purchase), you will be assessed fees for outgoing wire transfers, returned checks and stop payment orders at prevailing rates charged by U.S. Bancorp Fund Services, LLC, the Funds transfer agent. If you request that
a redemption be made by wire transfer, currently a $15.00 fee is charged by the Funds transfer agent. You will be charged a transaction fee equal to 2.00% of the net amount of the redemption if you redeem your shares within 90 calendar days of
purchase. IRA accounts will be charged a $15.00 annual maintenance fee. There is a $25 IRA distribution and transfer out fee, unless set up automatically. Please see IRA Account Agreement for additional fees related to IRA accounts. To the extent
the Fund invests in shares of other investment companies as part of its investment strategy, you will indirectly bear your proportionate share of any fees and expenses charged by the underlying funds in which the Fund invests in addition to the
expenses of the Fund. Actual expenses of the underlying funds are expected to vary among the various underlying funds. These expenses are not included in the example below. The example below includes, but is not limited to, management fees,
shareholder servicing fees, fund accounting, custody and transfer agent fees. However, the example below does not include portfolio trading commissions and related expenses, interest expense and other extraordinary expenses as determined under
accounting principles generally accepted in the United States of America. You may use the information in this line, together with the amount you invested, to estimate the expenses that you paid over the period. Simply divide your account value by
$1,000 (for example, an $8,600 account value divided by $1,000 = 8.6), then multiply the result by the number in the first line under the heading entitled “Expenses Paid During Period” to estimate the expenses you paid on your account during this
period.
Hypothetical Example for Comparison Purposes
The second line of the table below provides information about hypothetical account values and hypothetical expenses based on the Fund’s actual expense ratio and an assumed rate of return of 5% per year before expenses,
which is not the Fund’s actual return. The hypothetical account values and expenses may not be used to estimate the actual ending account balance or expenses you paid for the period. You may use this information to compare the ongoing costs of
investing in the Fund and other funds. To do so, compare this 5% hypothetical example with the 5% hypothetical examples that appear in the shareholder reports of the other funds.
41
Perritt Funds, Inc.
|
Expense Example (Unaudited) (Continued)
|
April 30, 2022
|
Please note that the expenses shown in the table are meant to highlight your ongoing costs only and do not reflect any transactional costs, such as redemption fees. Therefore, the second line of the
table is useful in comparing ongoing costs only, and will not help you determine the relative total costs of owning different funds. In addition, if these transactional costs were included, your costs would have been higher.
|
Beginning
|
Ending
|
Expenses Paid
|
|
|
Account Value
|
Account Value
|
During Period
|
|
|
11/1/21
|
4/30/22
|
11/1/21 – 4/30/221
|
|
|
Actual
|
|||
|
Perritt MicroCap Opportunities
|
$1,000.00
|
$ 870.60
|
$ 6.86
|
|
Perritt Ultra MicroCap Fund
|
$1,000.00
|
$ 798.50
|
$10.88
|
|
Hypothetical
|
|||
|
Perritt MicroCap Opportunities
|
$1,000.00
|
$1,017.46
|
$ 7.40
|
|
Perritt Ultra MicroCap Fund
|
$1,000.00
|
$1,012.69
|
$12.18
|
|
1
|
Expenses are equal to the Fund’s annualized expense ratio of 1.48% for the MicroCap Opportunities Fund and 2.44% for the Ultra MicroCap Fund for the six-month period, multiplied by the
average account value over the period, multiplied by 181/365 (to reflect the one-half year period).
|
42
Perritt Funds, Inc.
|
Advisory Agreement Renewal (Unaudited)
|
On December 21, 2021, the Board of Directors of Perritt Funds, Inc. (the “Board” or “Directors”) approved the continuation of the investment advisory agreements for the Perritt MicroCap Opportunities Fund (the “MicroCap
Fund”) and the Perritt Ultra MicroCap Fund (the “Ultra Fund”) (collectively the “Funds”, or the, “Fund”) with the investment advisor to the Funds, Perritt Capital Management, Inc. (the “Advisor”). As part of the process of approving the
continuation of the advisory agreements, the Directors reviewed the fiduciary duties of the Directors with respect to approving the advisory agreements and the relevant factors for the Directors to consider, and the members of the Board of
Directors who are not deemed “interested persons” (as that term is defined by the Investment Company Act of 1940) of the Funds (the “Independent Directors”) met in executive session to discuss the approval of the advisory agreements.
In advance of the meeting, the Advisor sent detailed information to the Directors to assist them in their evaluation of the advisory agreements. This information included, but was not limited to, a memorandum from Fund
counsel that summarized the legal standards applicable to the Directors’ consideration of the advisory agreements; comparative information relating to the Funds’ management fees and other expenses of the Funds; information regarding fees paid and
other payments; information on the Advisor’s profitability; information about brokerage commissions; comparative information relating to the Funds’ performance; information about sales and redemptions of the Funds; information about the Funds’
compliance program; and other information the Directors believed was useful in evaluating the approval of advisory agreements.
All of the factors discussed by the Directors were considered as a whole, and were considered separately by the Independent Directors, meeting in executive session. The factors were viewed in their totality by the
Directors, with no single factor being the principal or determinative factor in the Directors’ determination of whether to approve the continuation of the advisory agreements. The Directors recognized that the management and fee arrangements for
the Funds are the result of years of review and discussion between the Independent Directors and the Advisor, that certain aspects of such arrangements may receive greater scrutiny in some years than in others and that the Directors’ conclusions
may be based, in part, on their consideration of these same arrangements and information received during the course of the year and in prior years.
Prior to approving the continuation of the advisory agreements, the Directors and the Independent Directors in executive session considered, among other items:
|
•
|
The nature and quality of the investment advisory services provided by the Advisor.
|
|
•
|
A comparison of the fees and expenses of the Funds to other similar funds.
|
|
•
|
A comparison of the fee structures of other accounts managed by the Advisor.
|
|
•
|
Whether economies of scale are recognized by the Funds.
|
|
•
|
The costs and profitability of the Funds to the Advisor.
|
|
•
|
The performance of the Funds.
|
|
•
|
The other benefits to the Advisor from serving as investment advisor to the Funds (in addition to the advisory fee).
|
43
Perritt Funds, Inc.
|
Advisory Agreement Renewal (Unaudited) (Continued)
|
The material considerations and determinations of the Board, including all of the Independent Directors, are as follows:
Nature and Quality of Investment Advisory Services
The Directors noted that the Advisor supervises the investment portfolios of the Funds, directing the day-to-day management of the Funds’ portfolios, including the purchase and sale of investment securities, and that
the Advisor employs a research intensive investment process. They concluded that the Advisor dedicates significant resources to managing the investments of the Funds.
The Directors then discussed staffing at the Advisor and concluded that the Advisor is well staffed to conduct the research needed to meet the investment objectives of the Funds.
The Directors also considered the background and experience of the Advisor’s senior management and expertise of, and the amount of attention given to, the Funds by investment personnel of the Advisor. In addition, the
Directors considered the quality of the material service providers to the Funds, who provide administrative and distribution services on behalf of the Funds and are overseen by the Advisor, and the overall reputation and capabilities of the
Advisor. Based on this review, the Directors determined that the Advisor provides high quality services to the Funds. The Directors also concluded that they were satisfied with the nature, extent and quality of the investment advisory services
provided to the Funds by the Advisor, and that the nature and extent of the services provided by the Advisor are appropriate to assure that each Fund’s operations are conducted in compliance with applicable laws, rules and regulations.
Comparative Fees and Expenses
The Directors then discussed with management the variables, in addition to the advisory fees, such as administrative and transaction fees, that impact costs to the shareholders of the Funds. Management reviewed with
the Directors the comparison of the Funds’ expense ratios to other similar funds. As part of the discussion with management, the Directors ensured that they understood and were comfortable with the criteria used by the Advisor to determine the
mutual funds that make up the peer group for purposes of the materials.
Following review and discussion, the Board determined that the above median total expenses of the Funds appear to result from a low level of assets under management, which caused certain non-management expenses to be
above average as compared to the peer group. The Directors concluded that the Funds’ fees are reasonable given the asset sizes of the Funds, and they concluded that the Advisor is actively working to keep the fees down.
Comparison of Fee Structures of Other Accounts
The Directors then inquired of management regarding the distinction between the services performed by the Advisor for separate accounts and those performed by the Advisor for the Funds. The Advisor noted that the
management of the Funds involves more comprehensive and substantive duties than the management of separate accounts. The Directors determined that the following items, among others, support the fact that the services performed by the Advisor for
the Funds require a higher level of service
44
Perritt Funds, Inc.
|
Advisory Agreement Renewal (Unaudited) (Continued)
|
and oversight than the services performed by the Advisor for separate accounts:
|
•
|
The Advisor provides tailored investment advisory services to the Funds in order to accommodate the cash flow volatility presented by the purchases and redemptions of shareholders.
|
|
•
|
With regard to the Funds, the Advisor attempts to serve the needs of thousands of accounts, ranging from direct accounts holding a few thousand dollars to the large omnibus accounts of intermediaries who in turn
service thousands of large and small accounts.
|
|
•
|
The Advisor coordinates with the Funds’ Chief Compliance Officer and other service providers to insure compliance with regulatory regimens imposed by federal law and the Internal Revenue Code.
|
|
•
|
Separate accounts do not require the same level of services and oversight, nor do they present the same compliance obligations.
|
Following this discussion, the Directors concluded that the services performed by the Advisor for the Funds require a higher level of service and oversight than the services performed by the Advisor for separate
accounts, and that the services performed by the Advisor for the Funds represent a greater demand on the Advisor’s resources to meet the increased compliance obligations of the Funds. Based on this determination, the Directors determined that
the differential in advisory fees between the Funds and the separate accounts are reasonable, and concluded that the fee rates charged to the Funds in comparison to those charged to the Advisor’s other clients are reasonable.
Performance
The Directors reviewed the Advisor’s quality of investment management, management history and ability to successfully market the Funds. They then discussed the performance of the Funds versus their indices and their
peer group median. They were pleased that the most recently reported performance of the MicroCap Fund showed the Fund’s performance ahead of the median. The Directors then noted that the most recently reported performance of the Ultra Fund
showed the Fund’s performance below the median and discussed the Ultra Fund’s performance with the Advisor, and the steps the Advisor is taking to improve the performance, and concluded the Advisor is taking appropriate steps. The Directors then
noted that while recent performance has not been as good as desired, the Funds have generally performed well over the long-term, particularly on a risk-adjusted basis.
Following their discussion, the Directors concluded that the performance of the Funds, adjusting for risk, has been satisfactory. They continue to believe that the Advisor’s discipline should lead to favorable results
in the long-term, and concluded that renewal of the existing advisory agreements was in the best interest of the Funds’ shareholders.
Costs and Profitability
The Directors considered the cost of services provided and the profits realized by the Advisor, by reviewing reports provided by the Funds’ administrator that compared the Funds’ advisory fees to those of other
comparable mutual funds. They also considered the Funds’ total expenses compared to peer group funds. The Directors noted that the total expenses of the MicroCap Fund are below the median, and concluded that this supports their
45
Perritt Funds, Inc.
|
Advisory Agreement Renewal (Unaudited) (Continued)
|
belief that the total expenses of the Fund are reasonable. On the other hand, they noted that the Ultra Fund’s total expenses are higher than the median, and discussed with the Advisor the reasons for the higher
expenses. The Directors concluded that the Ultra Fund’s low average assets under management contribute significantly to the Fund’s higher total expenses, and that the total expenses of the Fund remain within a reasonable range of its peers.
The Directors discussed in detail the profitability of the Advisor as it relates to the Funds, and they discussed the impact of the intermediary service fees on the profitability. The Directors also considered the
resources and revenues that the Advisor has put into managing and distributing the Funds, and concluded that the level of profitability realized by the Advisor from its provision of services to the Funds is reasonable, and that the overall
expense ratios and advisory fees were fair and within the range of industry averages.
Economies of Scale
The Directors then discussed with management whether economies of scale are recognized by the Funds. They noted that as Fund assets grow, certain fixed costs are spread over the larger asset base, which may lead to
some economies of scale. On the other hand, the Directors noted that many of the Funds’ expense are subject to diseconomies of scale. For example, the intermediary service fees increase as the Funds’ assets grow. Given the size of the Funds,
the Directors determined that the Funds are not realizing economies of scale, and that the existing advisory fees are acceptable.
Fall-Out Benefits
The Directors then considered other benefits to the Advisor from serving as Advisor to the Funds (in addition to the advisory fee). The Directors noted that the Advisor derives ancillary benefits from its association
with the Funds in the form of proprietary and third party research products and services received from broker dealers that execute portfolio trades for the Funds. The Directors determined such products and services have been used for legitimate
purposes relating to the Funds by providing assistance in the investment decision-making process. They concluded that the other benefits realized by the Advisor from its relationship with the Funds were reasonable.
Conclusion
After reviewing the materials and management’s presentation, as well as other information regularly provided at the Board’s quarterly meetings throughout the year regarding the quality of services provided by the
Advisor, the performance of the Funds, expense information, regulatory compliance issues, trading information and related matters and other factors deemed relevant by the Board, the Directors, including all of the Independent Directors, approved
the continuation of the advisory agreements for an additional one-year term.
The Directors noted that all of the factors above were considered by the Board as a whole, and separately by the Independent Directors meeting in executive session. The factors were viewed in their totality by the
Directors, with no single factor being the principal or determinative factor in the Board’s determination of whether to approve the continuation of the advisory agreements.
46
Perritt Funds, Inc.
|
Directors and Officers (Unaudited)
|
The Fund’s Board of Directors is responsible for the overall management of the Funds. This includes establishing the Funds’ policies, approval of all significant agreements between the Funds and persons or companies
providing services to the Funds, and the general supervision and review of the Funds’ investment activities. As a Maryland corporation, the day-to-day operations of the Funds are delegated to the officers of the Funds, subject to the investment
objectives and policies of the Funds and to general supervision by the Board.
Management Information
The name, age, address, principal occupations during the past five years, and other information with respect to each of the Directors are set forth in the following tables, along with information for the officers of the
Funds. The information is provided as of the date of the Funds’ current SAI.
|
Position(s) Held
|
||||
|
with Funds and
|
Other
|
|||
|
Number of
|
Directorships
|
|||
|
Portfolios in
|
Held by
|
|||
|
Name,
|
Fund Complex
|
Term of Office
|
Principal
|
Director
|
|
Address,
|
Overseen
|
and Length of
|
Occupation(s)
|
during the
|
|
and Age
|
by Director
|
Time Served
|
during Past 5 Years
|
Past 5 Years
|
|
“Disinterested” Directors of the Funds
|
||||
|
Dianne C. Click
|
Director
|
Indefinite, until
|
Ms. Click is a licensed Real
|
None.
|
|
Age: 59
|
successor
|
Estate Broker in the State
|
||
|
300 South
|
Portfolios in
|
elected
|
of Montana. She has been
|
|
|
Wacker Drive,
|
Fund Complex
|
a partner and a principal
|
||
|
Suite 600
|
Overseen: 2
|
Director
|
owner of a real estate sales
|
|
|
Chicago, IL
|
since 2004
|
company, Bozeman Brokers,
|
||
|
60606
|
since 2004. She has been
|
|||
|
licensed in the state of
|
||||
|
Montana since 1995.
|
||||
|
David S. Maglich
|
Director
|
Indefinite, until
|
Mr. Maglich is a Shareholder
|
None.
|
|
Age: 65
|
successor
|
with the law firm of Fergeson,
|
||
|
300 South
|
Portfolios in
|
elected
|
Skipper, P.A. in Sarasota,
|
|
|
Wacker Drive,
|
Fund Complex
|
Florida and has been
|
||
|
Suite 600
|
Overseen: 2
|
Director
|
employed with such firm
|
|
|
Chicago, IL
|
since 2004
|
since 1989.
|
||
|
60606
|
||||
47
Perritt Funds, Inc.
|
Directors and Officers (Unaudited) (Continued)
|
|
Position(s) Held
|
||||
|
with Funds and
|
Other
|
|||
|
Number of
|
Directorships
|
|||
|
Portfolios in
|
Held by
|
|||
|
Name,
|
Fund Complex
|
Term of Office
|
Principal
|
Director
|
|
Address,
|
Overseen
|
and Length of
|
Occupation(s)
|
during the
|
|
and Age
|
by Director
|
Time Served
|
during Past 5 Years
|
Past 5 Years
|
|
“Interested” Director of the Funds
|
||||
|
Michael J.
|
President
|
One-year term
|
Mr. Corbett was President
|
None.
|
|
Corbett(1)
|
as President
|
of the Perritt MicroCap
|
||
|
Age: 56
|
Portfolios in
|
Opportunities Fund, Inc.
|
||
|
300 South
|
Fund Complex
|
As Director,
|
(1999–2013) and President
|
|
|
Wacker Drive,
|
Overseen: 2
|
indefinite,
|
of the Perritt Funds, Inc.
|
|
|
Suite 600
|
until successor
|
since 2004. He has served
|
||
|
Chicago, IL
|
elected
|
as President of the Adviser
|
||
|
60606
|
since 2010, and previously
|
|||
|
Director
|
served as Vice President of
|
|||
|
since 2010
|
the Adviser from 1997 until
|
|||
|
2010. Mr. Corbett began his
|
||||
|
President
|
tenure with Perritt Capital
|
|||
|
since 2004
|
Management in 1990 as a
|
|||
|
research analyst. He assumed
|
||||
|
portfolio management
|
||||
|
responsibilities in 1996 and
|
||||
|
now serves as portfolio
|
||||
|
manager for the Funds.
|
||||
____________
|
(1)
|
Mr. Corbett is an interested person of the Funds based upon his position with the Advisor.
|
48
Perritt Funds, Inc.
|
Directors and Officers (Unaudited) (Continued)
|
|
Position(s) Held
|
||||
|
with Funds and
|
Other
|
|||
|
Number of
|
Directorships
|
|||
|
Portfolios in
|
Held by
|
|||
|
Name,
|
Fund Complex
|
Term of Office
|
Principal
|
Director
|
|
Address,
|
Overseen
|
and Length of
|
Occupation(s)
|
during the
|
|
and Age
|
by Director
|
Time Served
|
during Past 5 Years
|
Past 5 Years
|
|
Officers of the Funds Other Than Mr. Corbett
|
||||
|
Mark Buh
|
Vice President
|
One-year term
|
Mr. Buh has been Vice
|
N/A
|
|
Age: 60
|
and Treasurer
|
Since 2012
|
President and Treasurer of
|
|
|
300 South
|
the Funds and Chief Financial
|
|||
|
Wacker Drive,
|
Officer of the Adviser since
|
|||
|
Suite 600
|
2012. He has over 25 years
|
|||
|
Chicago, IL
|
of experience in corporate
|
|||
|
60606
|
accounting, administration,
|
|||
|
planning and business
|
||||
|
development. His previous
|
||||
|
experience includes tenures
|
||||
|
at Ernst and Young and
|
||||
|
CenturyLink
|
||||
|
Communications.
|
||||
|
Lynn E.
|
Vice President,
|
One-year term
|
Mrs. Burmeister has been
|
N/A
|
|
Burmeister
|
Chief
|
the Chief Compliance
|
||
|
Age: 63
|
Compliance
|
Chief
|
Officer since May 1, 2010,
|
|
|
300 South
|
Officer and
|
Compliance
|
and oversees all compliance
|
|
|
Wacker Drive,
|
Secretary
|
Officer
|
matters for the Funds and the
|
|
|
Suite 600
|
Since 2010
|
Advisor. She also coordinates
|
||
|
Chicago, IL
|
the administration of the
|
|||
|
60606
|
Secretary
|
Funds and is a liaison with
|
||
|
Since 2015
|
the firm’s corporate counsel.
|
|||
|
Mrs. Burmeister has worked
|
||||
|
in the financial industry
|
||||
|
since 1980. Her previous
|
||||
|
experience includes work at
|
||||
|
Harris Associates, Gofen &
|
||||
|
Glossberg and Optimum
|
||||
|
Investments.
|
||||
49
Perritt Funds
The Statement of Additional Information (SAI) includes additional information about the Funds’ directors and is available, without charge, upon request, by calling 1-800-331-8936.
The Funds file their complete schedule of portfolio holdings with the Commission for the first and third quarters of each fiscal year as an exhibit to its reports on Form N-PORT. The Funds’ Form N-PORT reports are
available on the Commission’s website at http://www.sec.gov
A description of the policies and procedures that the Funds use to determine how to vote proxies relating to portfolio securities is available without charge, upon request, by calling the Advisor at 1-800-331-8936 and
on the Commission’s website at http://www.sec.gov.
Information regarding how the Funds voted proxies relating to portfolio securities during the most recent 12-month period ended June 30 is available without charge, upon request, by calling 1-800-331-8936 and on the
Commission’s website at http://www.sec.gov.
Household Delivery of Shareholder Documents: To reduce expenses, the Funds may mail only one copy of the Funds’ prospectus, SAI and each annual and semi-annual report to those addresses shared by two or more accounts.
If you wish to receive individual copies of these documents, please call the Funds at 1-800-331-8936 or contact your financial institution. You will begin receiving individual copies thirty days after receiving your request.
Electronic Delivery of Shareholder Documents: You may choose to receive the Funds’ prospectus and annual and semi-annual reports electronically. To sign up for electronic delivery, visit www.icsdelivery.com and select
the first letter of your brokerage firm’s name. Then, select your brokerage institution from the list that follows, fill out the appropriate information and provide an e-mail address where you would like your information sent. If your brokerage
firm is not listed, electronic delivery may not be available. Please contact your brokerage firm or financial advisor.
50
Privacy Policy
We collect the following nonpublic personal information about you:
|
•
|
Information we receive from you on or in applications or other forms, including but not limited to, your name, address, phone number, and social security number; and
|
|
|
•
|
Information about your transactions with us, our affiliates or others, including but not limited to, your account number and balance, parties to transactions, cost basis information and other financial
information.
|
We do not disclose any nonpublic personal information about our current or former shareholders to nonaffiliated third parties, except as permitted by law. For example, we are permitted by law to disclose all the
information we collect to our transfer agent to process your transactions. Furthermore, we restrict access to your nonpublic personal information to those persons who require such information to provide products or services to you. We maintain
physical, electronic, and procedural safeguards through our transfer agent, U.S. Bank Global Fund Services, that comply with federal standards to guard your nonpublic personal information.
In the event that you hold shares of the Funds through a financial intermediary, including, but not limited to, a broker-dealer, bank or trust company, the privacy policy of your financial intermediary would govern how
your nonpublic personal information would be shared with nonaffiliated third parties.
51
(This Page Intentionally Left Blank.)
Investment Advisor
Perritt Capital Management, Inc.
300 South Wacker Drive, Suite 600
Chicago, IL 60606-6703
800-331-8936
Independent Registered
Public Accounting Firm
Cohen & Company, Ltd.
151 North Franklin Street, Suite 575
Chicago, IL 60606
Legal Counsel
Foley & Lardner LLP
777 East Wisconsin Avenue
Milwaukee, WI 53202
Custodian
U.S. Bank, NA
1555 North River Center Drive, Suite 302
Milwaukee, WI 53212
Transfer Agent
and Dividend Disbursing Agent
U.S. Bancorp Fund Services, LLC,
doing business as U.S. Bank Global Fund Services
P.O. Box 701
Milwaukee, WI 53201-0701
Distributor
Quasar Distributors, LLC
111 East Kilbourn Avenue, Suite 2200
Milwaukee, WI 53202
For assistance with your existing account, call our
Shareholder Service Center at 1-800-332-3133.
MicroCap Opportunities Fund – PRCGX
Ultra MicroCap Fund – PREOX
Minimum Initial Investment $1,000
IRA Minimum Initial Investment $250
Dividend Reinvestment Plan
Systematic Withdrawal Plan
Automatic Investment Plan
Retirement Plans Including:
|
•
|
IRA
|
•
|
Roth IRA
|
|
•
|
SEP-IRA
|
•
|
Coverdell Education
|
|
•
|
Simple IRA
|
Savings Account
|
2% redemption fee imposed for shares
held ninety (90) calendar days or less.
This report is authorized for distribution
only to shareholders and others who have
received a copy of the prospectus of the
Perritt MicroCap Opportunities Fund
and/or the Perritt Ultra MicroCap Fund.
300 S. Wacker Drive • Suite 600 • Chicago, IL 60606-6703
Tel 312-669-1650 • 800-331-8936 • Fax: 312-669-1235
E-mail: [email protected]
Web Site: www.perrittcap.com
|
(b)
|
Not applicable for this Registrant
|
Item 2. Code of Ethics.
Not applicable for semi-annual reports.
Item 3. Audit Committee Financial Expert.
Not applicable for semi-annual reports.
Item 4. Principal Accountant Fees and Services.
Not applicable for semi-annual reports.
Item 5. Audit Committee of Listed Registrants.
Not applicable to registrants who are not listed issuers (as defined in Rule 10A-3 under the Securities Exchange Act of 1934).
Item 6. Investments.
(a). Schedule of Investments is included as part of the report to shareholders filed under Item 1 of this Form.
(b). Not applicable.
Item 7. Disclosure of Proxy Voting Policies and Procedures for Closed-End Management Investment Companies.
Not applicable to open-end investment companies.
Item 8. Portfolio Managers of Closed-End Management Investment Companies.
Not applicable to open-end investment companies.
Item 9. Purchases of Equity Securities by Closed‑End Management Investment Company and Affiliated Purchasers.
Not applicable to open-end investment companies.
Item 10. Submission of Matters to a Vote of Security Holders.
There have been no material changes to the procedures by which shareholders may recommend nominees to the registrant’s board of directors.
Item 11. Controls and Procedures.
|
(a)
|
The Registrant’s President/Principal Executive Officer and Treasurer/Principal Financial Officer have reviewed the Registrant's disclosure controls and procedures (as defined in Rule 30a-3(c) under the Investment Company Act of
1940 (the “Act”)) as of a date within 90 days of the filing of this report, as required by Rule 30a-3(b) under the Act and Rules 13a-15(b) or 15d‑15(b) under the Securities Exchange Act of 1934. Based on their review, such officers
have concluded that the disclosure controls and procedures are effective in ensuring that information required to be disclosed in this report is appropriately recorded, processed, summarized and reported and made known to them by
others within the Registrant and by the Registrant’s service provider.
|
|
(b)
|
There were no changes in the Registrant's internal control over financial reporting (as defined in Rule 30a-3(d) under the Act) that occurred during the period covered by this report that has materially affected, or is reasonably
likely to materially affect, the Registrant's internal control over financial reporting.
|
Item 12. Disclosure of Securities Lending Activities for Closed-End Management Investment Companies
Not applicable to open-end investment companies.
Item 13. Exhibits.
|
(a)
|
(1) Any code of ethics or amendment thereto, that is the subject of the disclosure required by Item 2, to the extent that the registrant intends to satisfy Item 2 requirements through filing an
exhibit. Incorporated by reference to the registrant’s Form N-CSR filed January 8, 2010.
|
(3) Any written solicitation to purchase securities under Rule 23c‑1 under the Act sent or given during the period covered by the report by or on behalf of the registrant to 10 or
more persons. Not applicable to open-end investment companies.
(4) Change in the registrant’s independent public accountant. There was no change in the registrant’s independent public accountant for the period covered by this report.
SIGNATURES
Pursuant to the requirements of the Securities Exchange Act of 1934 and the Investment Company Act of 1940, the registrant has duly caused this report to be signed on its behalf by the undersigned, thereunto duly
authorized.
(Registrant) Perritt Funds, Inc.
By (Signature and Title)* /s/ Michael J. Corbett
Michael J. Corbett, President
Date 7/1/2022
Pursuant to the requirements of the Securities Exchange Act of 1934 and the Investment Company Act of 1940, this report has been signed below by the following persons on behalf of the registrant and in the
capacities and on the dates indicated.
By (Signature and Title)* /s/ Michael J Corbett
Michael J. Corbett, President
Date 7/1/2022
By (Signature and Title)* /s/ Mark J. Buh
Mark J. Buh, Treasurer/Principal Financial Officer
Date 7/1/2022
* Print the name and title of each signing officer under his or her signature.
CERTIFICATIONS
I, Michael J. Corbett, certify that:
|
1.
|
I have reviewed this report on Form N-CSR of Perritt Funds, Inc.;
|
|
2.
|
Based on my knowledge, this report does not contain any untrue statement of a material fact or omit to state a material fact necessary to make the
statements made, in light of the circumstances under which such statements were made, not misleading with respect to the period covered by this report;
|
|
3.
|
Based on my knowledge, the financial statements, and other financial information included in this report, fairly present in all material respects
the financial condition, results of operations, changes in net assets, and cash flows (if the financial statements are required to include a statement of cash flows) of the registrant as of, and for, the periods presented in this report;
|
|
4.
|
The registrant’s other certifying officer(s) and I are responsible for establishing and maintaining disclosure controls and procedures (as defined
in Rule 30a-3(c) under the Investment Company Act of 1940) and internal control over financial reporting (as defined in Rule 30a-3(d) under the Investment Company Act of 1940) for the registrant and have:
|
|
(a)
|
Designed such disclosure controls and procedures, or caused such disclosure controls and procedures to be designed under our supervision, to ensure
that material information relating to the registrant, including its consolidated subsidiaries, is made known to us by others within those entities, particularly during the period in which this report is being prepared;
|
|
(b)
|
Designed such internal control over financial reporting, or caused such internal control over financial reporting to be designed under our
supervision, to provide reasonable assurance regarding the reliability of financial reporting and the preparation of financial statements for external purposes in accordance with generally accepted accounting principles;
|
|
(c)
|
Evaluated the effectiveness of the registrant's disclosure controls and procedures and presented in this report our conclusions about the
effectiveness of the disclosure controls and procedures, as of a date within 90 days prior to the filing date of this report based on such evaluation; and
|
|
(d)
|
Disclosed in this report any change in the registrant’s internal control over financial reporting that occurred during the period covered by this
report that has materially affected, or is reasonably likely to materially affect, the registrant’s internal control over financial reporting; and
|
|
5.
|
The registrant’s other certifying officer(s) and I have disclosed to the registrant’s auditors and the audit committee of the registrant’s board of
directors (or persons performing the equivalent functions):
|
|
(a)
|
All significant deficiencies and material weaknesses in the design or operation of internal control over financial reporting which are reasonably
likely to adversely affect the registrant’s ability to record, process, summarize, and report financial information; and
|
|
(b)
|
Any fraud, whether or not material, that involves management or other employees who have a significant role in the registrant’s internal control
over financial reporting.
|
|
Date: 7/1/2022
|
/s/ Michael J. Corbett
Michael J. Corbett President |
CERTIFICATIONS
I, Mark J. Buh, certify that:
|
1.
|
I have reviewed this report on Form N-CSR of Perritt Funds, Inc.;
|
|
2.
|
Based on my knowledge, this report does not contain any untrue statement of a material fact or omit to state a material fact necessary to make the
statements made, in light of the circumstances under which such statements were made, not misleading with respect to the period covered by this report;
|
|
3.
|
Based on my knowledge, the financial statements, and other financial information included in this report, fairly present in all material respects
the financial condition, results of operations, changes in net assets, and cash flows (if the financial statements are required to include a statement of cash flows) of the registrant as of, and for, the periods presented in this report;
|
|
4.
|
The registrant’s other certifying officer(s) and I are responsible for establishing and maintaining disclosure controls and procedures (as defined
in Rule 30a-3(c) under the Investment Company Act of 1940) and internal control over financial reporting (as defined in Rule 30a-3(d) under the Investment Company Act of 1940) for the registrant and have:
|
|
(a)
|
Designed such disclosure controls and procedures, or caused such disclosure controls and procedures to be designed under our supervision, to ensure
that material information relating to the registrant, including its consolidated subsidiaries, is made known to us by others within those entities, particularly during the period in which this report is being prepared;
|
|
(b)
|
Designed such internal control over financial reporting, or caused such internal control over financial reporting to be designed under our
supervision, to provide reasonable assurance regarding the reliability of financial reporting and the preparation of financial statements for external purposes in accordance with generally accepted accounting principles;
|
|
(c)
|
Evaluated the effectiveness of the registrant’s disclosure controls and procedures and presented in this report our conclusions about the
effectiveness of the disclosure controls and procedures, as of a date within 90 days prior to the filing date of this report based on such evaluation; and
|
|
(d)
|
Disclosed in this report any change in the registrant’s internal control over financial reporting that occurred during the period covered by this
report that has materially affected, or is reasonably likely to materially affect, the registrant’s internal control over financial reporting; and
|
|
5.
|
The registrant’s other certifying officer(s) and I have disclosed to the registrant’s auditors and the audit committee of the registrant’s board of
directors (or persons performing the equivalent functions):
|
|
(a)
|
All significant deficiencies and material weaknesses in the design or operation of internal control over financial reporting which are reasonably
likely to adversely affect the registrant’s ability to record, process, summarize, and report financial information; and
|
|
(b)
|
Any fraud, whether or not material, that involves management or other employees who have a significant role in the registrant’s internal control
over financial reporting.
|
|
Date: 7/1/2022
|
/s/ Mark J. Buh
Mark J. Buh Treasurer/Principal Financial Officer |
Certification Pursuant to Section 906 of the Sarbanes-Oxley Act
Pursuant to Section 906 of the Sarbanes-Oxley Act of 2002, each of the undersigned officers of the Perritt Funds, Inc., does hereby
certify, to such officer’s knowledge, that the report on Form N-CSR of the Perritt Funds, Inc. for the period ended April 30, 2022 fully complies with the requirements of Section 13(a) or 15(d) of the Securities Exchange Act of 1934, as applicable,
and that the information contained in the Form N-CSR fairly presents, in all material respects, the financial condition and results of operations of the Perritt Funds, Inc. for the stated period.
|
/s/ Michael J. Corbett
Michael J. Corbett
President, Perritt Funds, Inc.
|
/s/ Mark J. Buh
Mark J. Buh
Treasurer/Principal Financial Officer,
Perritt Funds, Inc.
|
|
Dated: 7/1/2022
|
Dated: 7/1/2022
|
This statement accompanies this report on Form N-CSR pursuant to Section 906 of the Sarbanes-Oxley Act of 2002 and shall not be deemed as filed by Perritt
Funds, Inc. for purposes of Section 18 of the Securities Exchange Act of 1934.
Serious News for Serious Traders! Try StreetInsider.com Premium Free!
You May Also Be Interested In
- INVESTIGATION ALERT: The Schall Law Firm Announces it is Investigating Claims Against FiscalNote Holdings, Inc. and Encourages Investors to Contact the Firm
- LINCOLN ALERT: Bragar Eagel & Squire, P.C. Announces that a Class Action Lawsuit Has Been Filed Against Lincoln National Corporation and Encourages Investors to Contact the Firm
- ROSEN, NATIONAL TRIAL LAWYERS, Encourages Northern Genesis Acquisition Corp. n/k/a The Lion Electric Company Investors to Secure Counsel Before Important Deadline in Securities Class Action – NGA
Create E-mail Alert Related Categories
SEC FilingsSign up for StreetInsider Free!
Receive full access to all new and archived articles, unlimited portfolio tracking, e-mail alerts, custom newswires and RSS feeds - and more!
